the Creative Commons Attribution 4.0 License.
the Creative Commons Attribution 4.0 License.
 | 21 Oct 2025
The role of the tropical carbon balance in determining the large atmospheric CO2 growth rate in 2023
Liang Feng
Luke Smallman
Jingfeng Xiao
Paolo Cristofanelli
Ove Hermansen
John Lee
Casper Labuschagne
Simonetta Montaguti
Steffen M. Noe
Stephen M. Platt
Xinrong Ren
Martin Steinbacher
Irène Xueref-Remy
The global annual mean atmospheric CO2 growth rate in 2023 was one of the highest since records began in 1958, comparable to values recorded during previous major El Niño events. We do not fully understand this anomalous growth rate, although a recent study highlighted the role of boreal North American forest fires. We use a Bayesian inverse method to interpret global-scale atmospheric CO2 data from NASA's Orbiting Carbon Observatory (OCO-2). The resulting a posteriori CO2 flux estimates reveal that from 2022 to 2023, the biggest changes in CO2 fluxes of net biosphere exchange (NBE) – for which positive values denote a flux to the atmosphere – were over the land tropics. We find that the largest NBE increase is over eastern Brazil, with small increases over southern Africa and Southeast Asia. We also find significant increases over southeastern Australia, Alaska, and western Russia. A large NBE increase over boreal North America, due to fires, is driven by our a priori inventory, informed by independent data. The largest NBE reductions are over western Europe, the USA, and central Canada. Our NBE estimates are consistent with gross primary production estimates inferred from satellite observations of solar-induced fluorescence and from satellite observations of vegetation greenness. We find that warmer temperatures in 2023 explain most of the NBE change over eastern Brazil, with hydrological changes more important elsewhere across the tropics. Our results suggest that the ongoing environmental degradation of the Amazon is now playing a substantial role in increasing the global atmospheric CO2 growth rate.
- Article
(8521 KB) - Full-text XML
- BibTeX
- EndNote


The annual mean growth rate of atmospheric carbon dioxide (CO2) is widely used as a zeroth-order metric to determine the health of our planet. Even from the first few years' worth of data collected at Mauna Loa in the late 1950s, it was plain to see that a) land vegetation imposed a large seasonal cycle on atmospheric CO2 via photosynthesis and respiration and b) the combustion of fossil fuels led to a planetary-scale impact on the atmosphere (Keeling, 1960; Keeling et al., 1976). Changes in the annual accumulation of atmospheric CO2 (growth rate), the magnitude and phase of the seasonal cycle, and how they vary geographically provide important clues about economic activity and the health of the land biosphere (Keeling et al., 1996; Graven et al., 2013; Barlow et al., 2015). These changes are inextricably linked, e.g. an elevated uptake by the land biosphere will influence the annual growth rate as well as the seasonal cycle (e.g. Ainsworth and Rogers, 2007). On a global scale, using mass balance arguments, we know that only about 44 % of fossil fuel emissions of CO2 remain in the atmosphere (the airborne fraction) (Bennett et al., 2024), with the land biosphere and oceans absorbing the other 56 %, approximately equally but with substantial year-to-year changes (Friedlingstein et al., 2023). The quasi-stability of the airborne fraction suggests that the land biosphere and oceans absorb a progressively larger absolute amount of CO2 from the atmosphere. We have an incomplete understanding of where this carbon is being absorbed and the stability of the resulting accumulated terrestrial carbon reservoirs against future changes in climate (e.g. Armstrong McKay et al., 2022). Consequently, years in which there are anomalously large annual mean CO2 growth rates prompt concern from the scientific community. This concern grows when state-of-the-art process-based land biosphere models cannot forecast or explain these anomalies (Kondo et al., 2020).
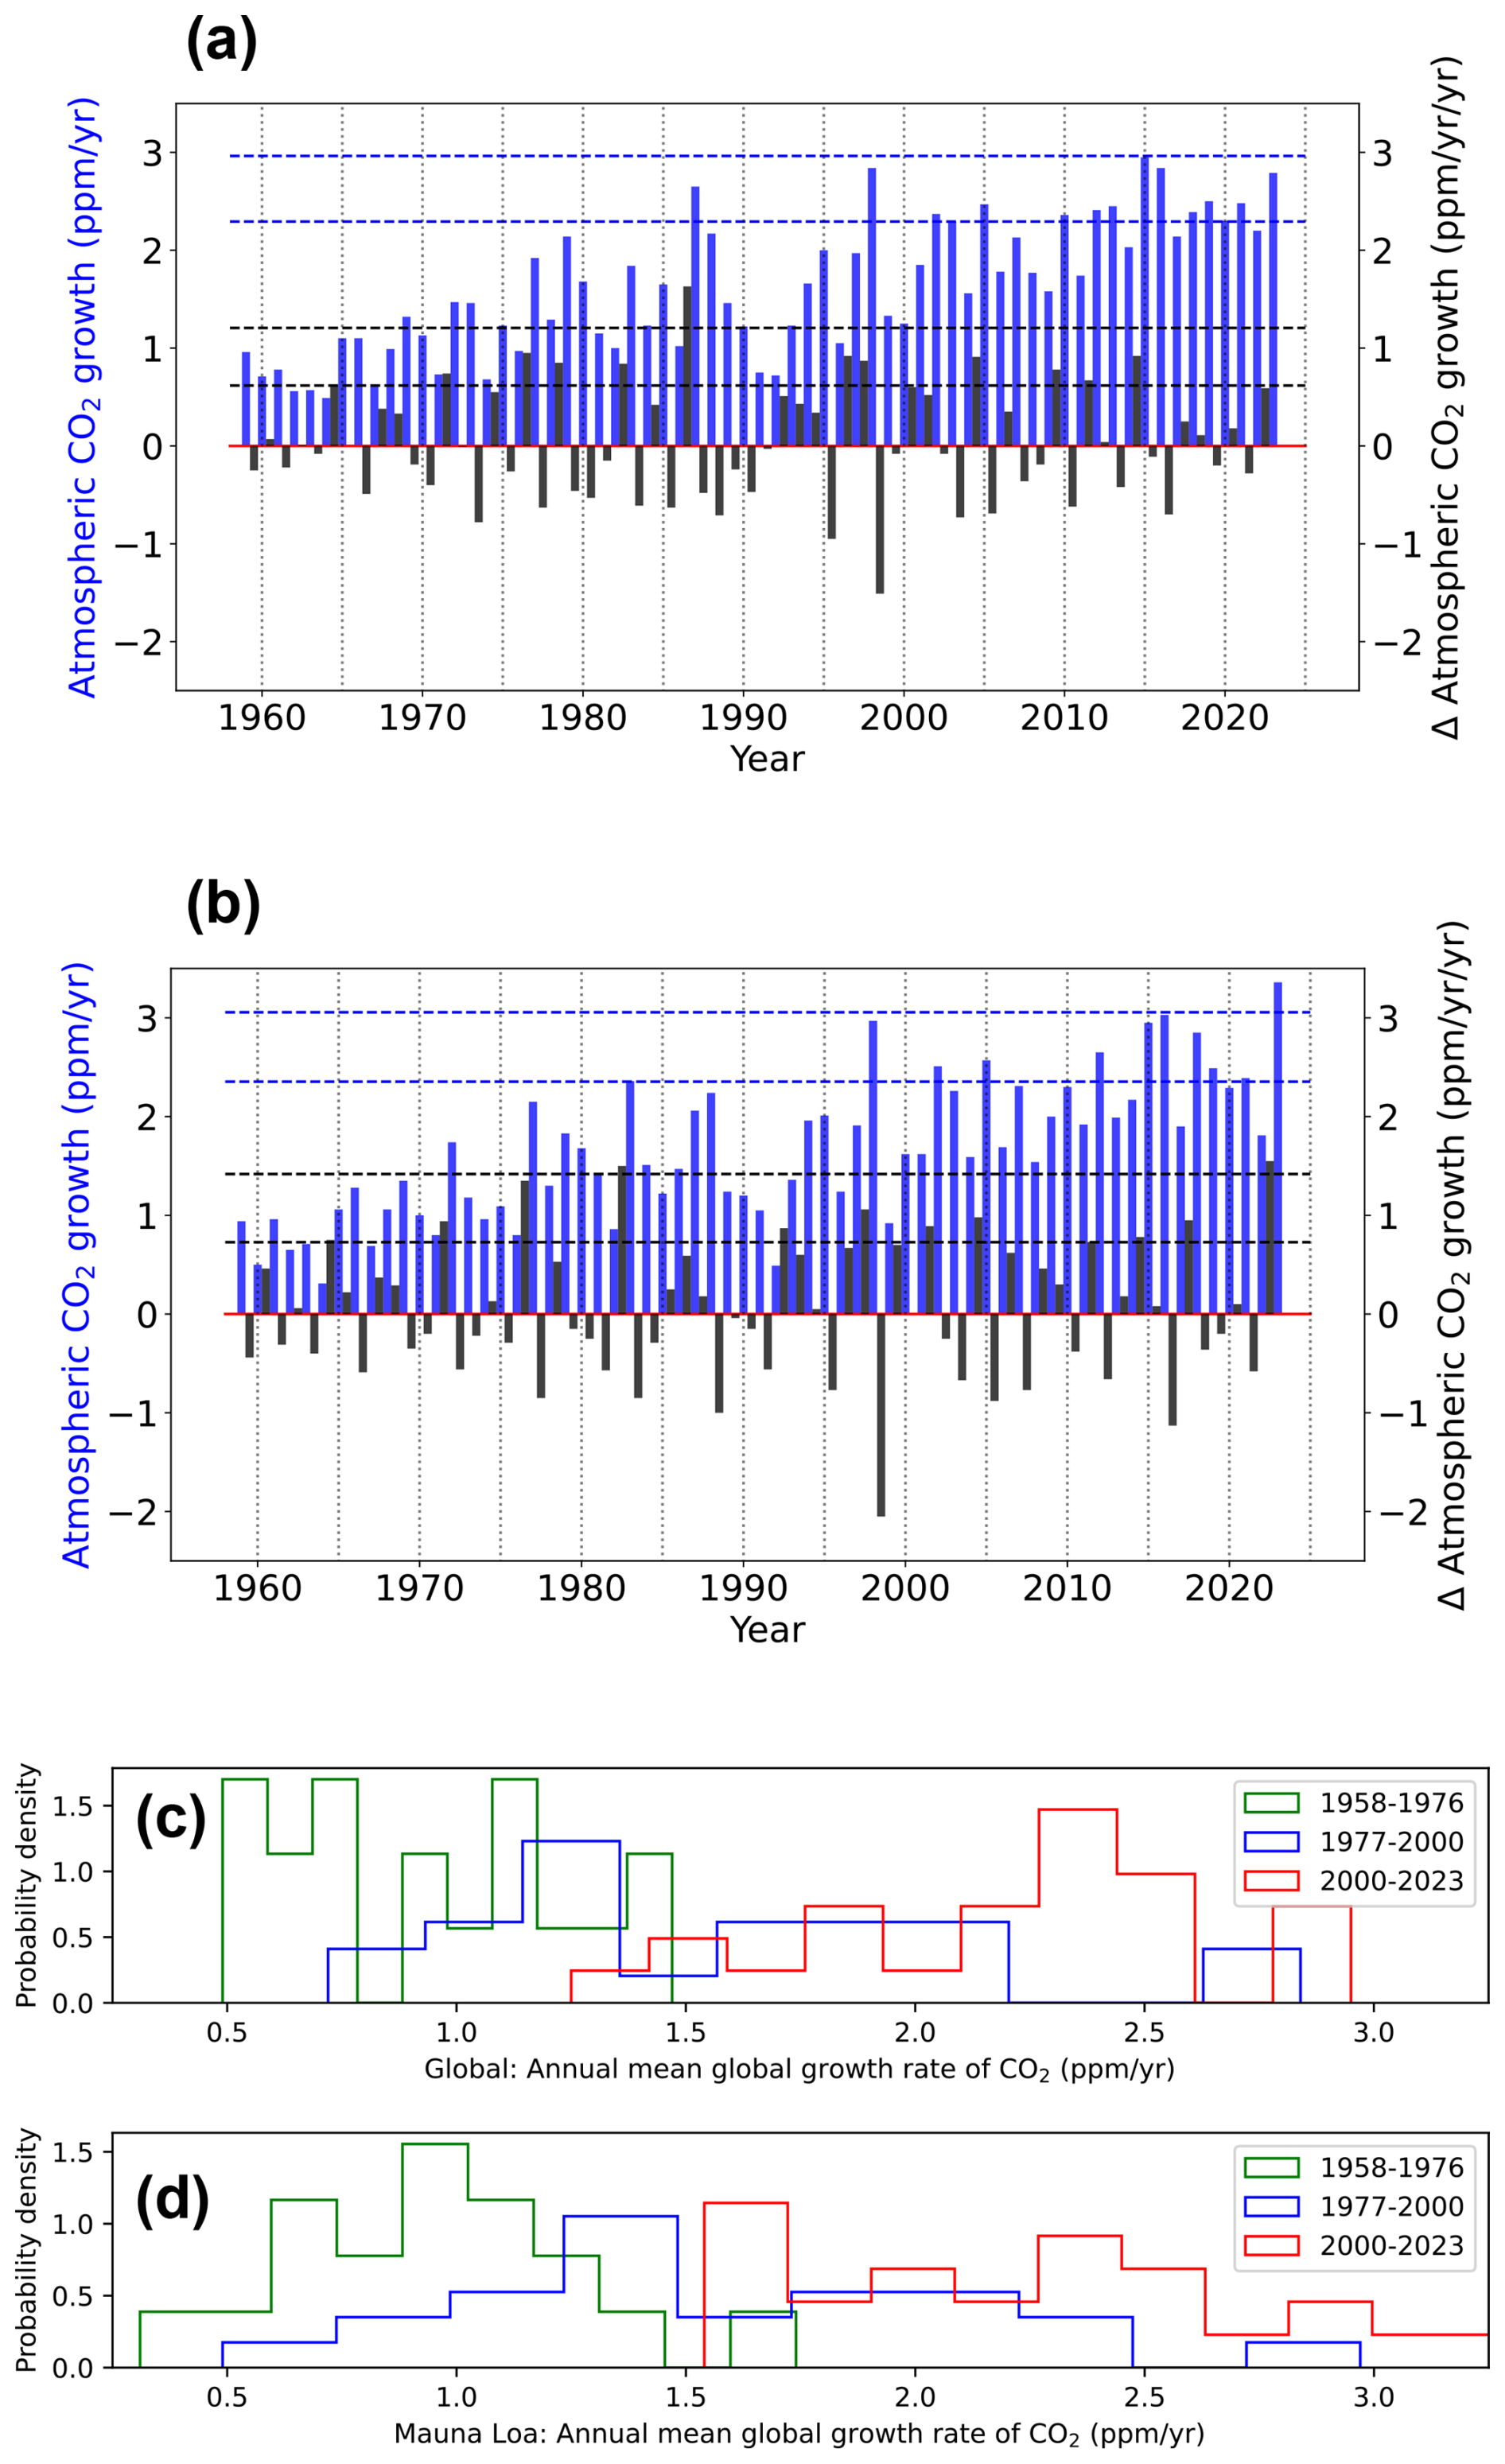
Figure 1Atmospheric growth rates of CO2 (blue) and their annual change (black). (a) Global mean values. (b) Values determined from the Mauna Loa, Hawaii CO2 mole fraction data. Data collected by the NOAA and available at https://gml.noaa.gov/ccgg/trends/gl_gr.html (last access: 16 June 2024). (c) Multi-decadal changes in the probability density of global mean annual mean growth rates and (d) as panel (c) but using data from Mauna Loa. Blue and black dashed horizontal lines denote the 1σ and 2σ values for the annual atmospheric CO2 growth and its annual change, respectively.
Figure 1 shows the annual mean CO2 growth rates reported by the National Oceanic and Atmospheric Administration (NOAA) on a global scale, determined by combining data collected at sites across the globe and from Mauna Loa in Hawaii (19.5° N, 155.6° W), USA, a site typically assumed to be representative of changes in the Northern Hemisphere carbon cycle (Buermann et al., 2007). The global picture shows that 2023 (Fig. 1a) had one of the largest CO2 growth rates on record, typically associated with the El Niño phase of ENSO, e.g. 1986, 1997/1998, and 2015/2016. What is also evident is a progressive increase in the annual growth rates from the 1950s (Fig. 1c). Even anomalous values recorded in the last quarter of the 20th century are close to the median value from the 21st century (Fig. 1c). The corresponding data collected at Mauna Loa show a slightly different picture for the annual CO2 growth rate (Fig. 1b). At this site, the growth rate in 2023 was the largest on record, exceeding the past peak growth during the 1997/1998 El Niño – attributed to the extensive burning of peat over Southeast Asia (Page et al., 2002) – and the 2015/2016 El Niño (Liu et al., 2017). At Mauna Loa, progressive changes in the growth rates are slightly more exaggerated than global mean values (Fig. 1b and d), suggesting a larger role for tropical latitudes.
Data-driven top–down flux inversions allow us to attribute these observed changes in the atmospheric CO2 growth rate to regional changes in surface carbon fluxes. Estimating regional carbon fluxes from atmospheric data requires an atmospheric transport model that describes the physical relationship between surface CO2 fluxes and the resulting atmospheric distribution of CO2, a priori estimates of the distribution and magnitude of fluxes, and a Bayesian inference method that fits this model to the data, accounting for model and data uncertainties (Tans et al., 1990; Baker et al., 2006; Gurney et al., 2002, 2004). Using an atmospheric transport model introduces additional errors (Schuh et al., 2019; Oda et al., 2023), but it remains an essential tool for interpreting the atmospheric data. Satellite observations of atmospheric CO2 have challenged our current understanding of the carbon cycle (Liu et al., 2017; Chatterjee et al., 2017; Patra et al., 2017; Palmer et al., 2019; Wang et al., 2020; Basso et al., 2023; Hugelius et al., 2024; O'Sullivan et al., 2024; Liu et al., 2024). These observations have primarily achieved this by collecting data over geographical regions that are not well covered by ground-based networks, particularly over the land tropics. These datasets are typically available with a time lag of only a few months, enabling us to explain the reasons behind anomalous annual CO2 growth rates within a year of them happening.
To interpret recent annual changes in the CO2 growth rate, we use the global 3-D GEOS-Chem atmospheric transport model and an ensemble Kalman filter to adjust our a priori distribution of CO2 flux estimates to fit in situ and satellite observations of atmospheric CO2. These methods and data are described in the next section. We report our results in Sect. 3 and conclude our study in Sect. 4.
Here, we describe the modelling framework we use to infer the a posteriori spatial distributions of CO2 fluxes, 2014–2023, from atmospheric data and a priori inventory flux estimates, and we use the auxiliary atmospheric and land surface to evaluate the resulting a posteriori flux estimates.
2.1 Inversion framework
We use the GEOS-Chem global 3-D atmospheric chemistry transport model version 13.4 to provide the relationship between the surface fluxes and changes in atmospheric CO2. For the experiments we report, we run the model at a horizontal resolution of 2° (latitude) × 2.5° (longitude), driven by Modern-Era Retrospective Analysis for Research and Applications version 2 (MERRA2) meteorological reanalyses from the Global Modeling and Assimilation Office (GMAO) based at the NASA Goddard Space Flight Center (GSFC).
We use a priori CO2 flux inventories, which include year-specific monthly biomass burning emissions (GFEDv4.1; Randerson et al., 2017), and year-specific monthly anthropogenic emissions (OmDIAC; Oda et al., 2018; Oda and Maksyutov, 2021). The anthropogenic emission estimates were extended to 2023 under the assumption that these emissions from the Southern Hemisphere remained stable between 2022 and 2023 but increased by 1.4 % over the Northern Hemisphere based on data reported in the 2024 Statistical Review of World Energy by the Energy Institute. We use year-specific terrestrial biosphere fluxes with a temporal resolution of 3 h (the Carnegie–Ames–Stanford Approach (CASA); Olsen and Randerson, 2004) up to the end of 2018 and repeat values for 2018 in subsequent years. We use monthly climatological ocean fluxes (Takahashi et al., 2009), which we scale uniformly to a global annual uptake of 2.5 Pg C yr−1, 2014–2024, inclusively, following Nassar et al. (2010).
We use an established EnKF framework to estimate surface CO2 fluxes, 2014–2023, inclusively, from atmospheric CO2 data collected by OCO-2 and the NOAA in situ ground-based observation network, 2014–2023, inclusively. For brevity, we provide a summary of the approach and refer the reader to other papers for further details (Feng et al., 2009, 2017; Palmer et al., 2019).
Adopting a widely used approach, we assume that the fossil fuel emissions are well known and estimate monthly a posteriori natural CO2 fluxes, including fire emissions and terrestrial and ocean biospheric CO2 fluxes, which are approximated by Feng et al. (2017):
where fa(x,t) and f0(x,t) describe the a posteriori and a priori CO2 flux estimates at location x and time t, respectively. The pulse-like basis functions BFi(x,t) represent the sum of natural fluxes used to represent their overall spatial pattern over each predefined subregion. The coefficients ci form the state vector to be estimated by optimally fitting the model to the data.
We define our land subregions by further dividing each of the 11 TransCom-3 land regions (Gurney et al., 2002) into 30 nearly equal subregions, with the exception of temperate Eurasia, which has been divided into 56 subregions due to its large landmass. We divide the 11 TransCom-3 ocean regions into 132 subregions. Our state vector includes monthly scaling factors for 488 regional pulse-like basis functions that describe natural CO2 fluxes, including 356 land regions and 132 oceanic regions (Fig. A1). We determine these coefficients by optimally fitting the corresponding atmospheric model concentrations with in situ and OCO-2 data (Feng et al., 2017):
where ca and cf denote the a posteriori and a priori state vectors, respectively; y denotes satellite and in situ CO2 observations; and H describes the observation operator that relates surface fluxes (i.e. the coefficients) to the observations. Here we sample the 3-D GEOS-Chem model CO2 fields at the time and location of each observation. For comparison with OCO-2 XCO2 retrievals, we further convolve the resulting model profiles with scene-dependent OCO-2 averaging kernels. In our EnKF framework, we introduce a flux perturbation (coefficients) ensemble ΔC to represent the a priori error covariance and calculate the Kalman gain matrix K in Eq. (2) by using
where R is the observation error covariance, and ΔY=H(ΔC) represents the projection of the flux perturbation ensemble to observation space, which is based on the same GEOS-Chem model run at the same horizontal resolution of 2° (latitude) × 2.5° (longitude) as our a priori simulations. We use a 5-month moving lag window to reduce the computational costs for projecting the flux perturbation ensemble into the observation space long after their emissions (in this case, longer than 4 months), beyond which time it is difficult to distinguish between the emitted signal from variations in the ambient background atmosphere (Feng et al., 2017). To calculate sequentially the a posteriori estimate and the associated uncertainty via Eqs. (2) and (3), we use an efficient numerical LU solver (Feng et al., 2017).
For simplicity, we assume a fixed uncertainty of 40 % for coefficients corresponding to a priori CO2 fluxes over each subregion. We assume that a priori errors are correlated with a spatial correlation length of 500 km over land and 800 km over oceans, with a temporal correlation of 1 month. Our experiments show that our results, such as the estimated changes in a posteriori CO2 fluxes between 2022 and 2023 and between 2022 and 2024 are largely insensitive to different assumptions about a priori uncertainties (± 10 %) and correlation length scales (± 100 km).
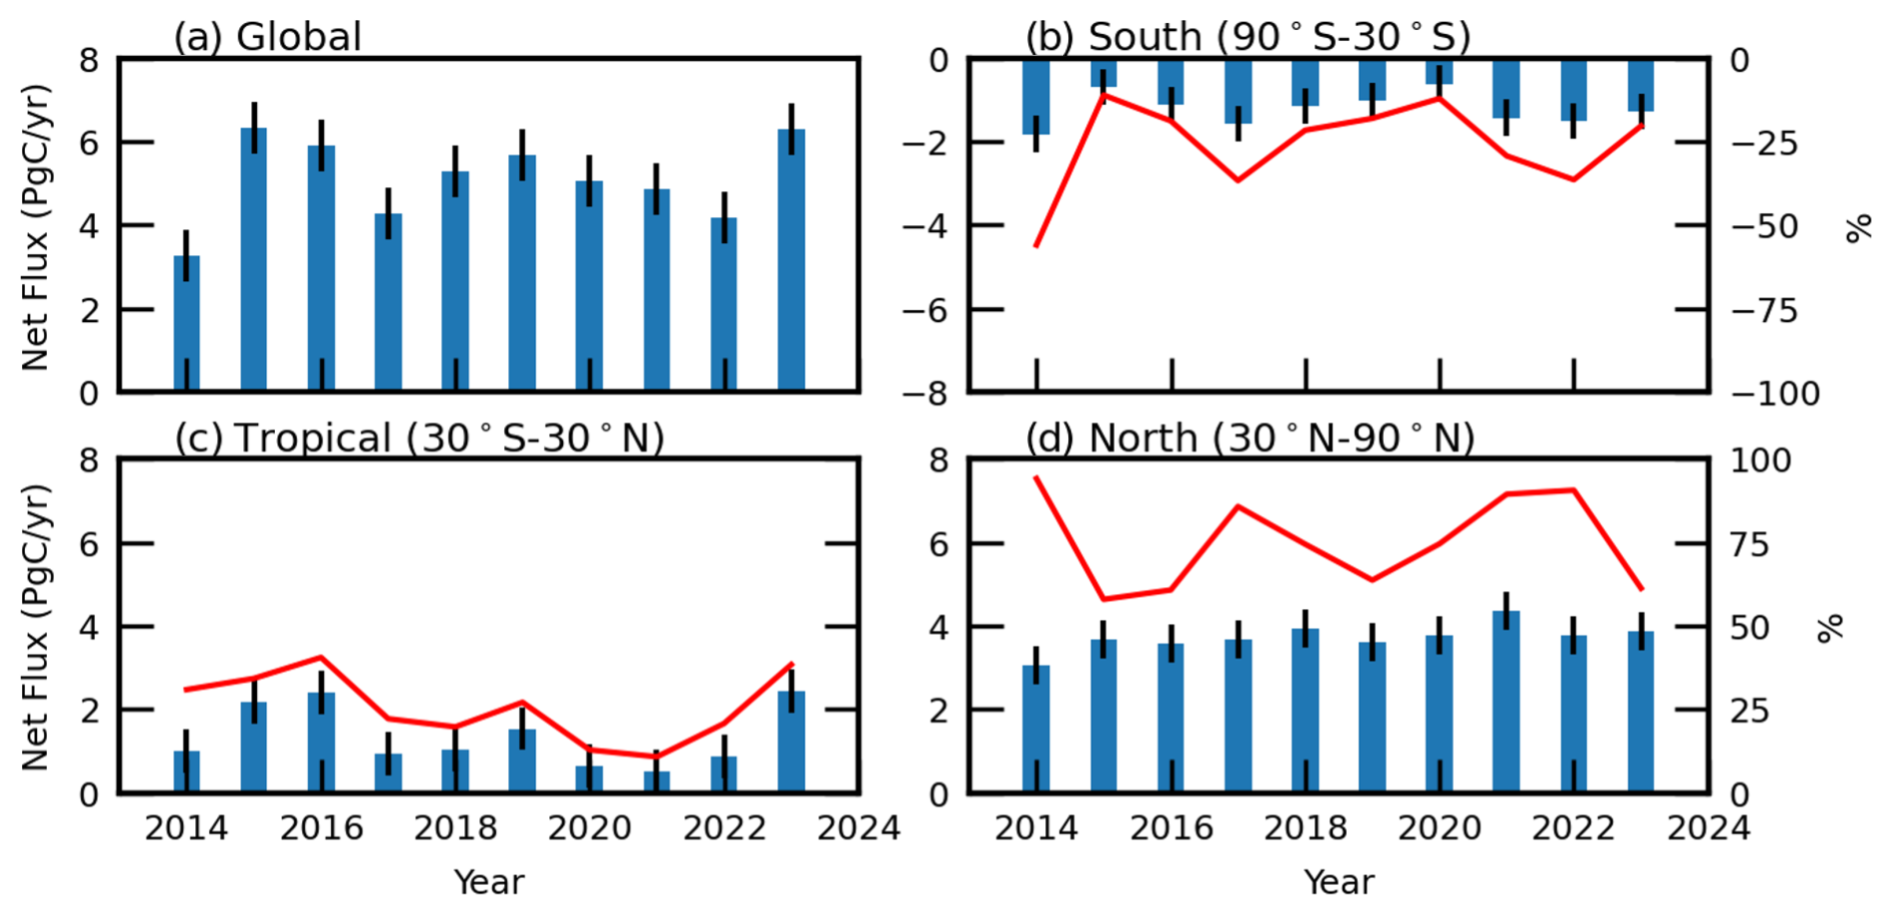
Figure 2Annual mean a posteriori CO2 flux estimates inferred from OCO-2 data for the globe, the southern extratropics, the tropics, and the northern extratropics. The thin black vertical lines denote the 1σ values about the annual mean values. The red lines in panels (b)–(d) denote the percentage contribution to the global net fluxes.
2.2 In situ and OCO-2 atmospheric CO2 data
We use version v11r of OCO-2 retrievals of column-averaged dry air mole fraction (XCO2) from NASA's Jet Propulsion Laboratory (JPL) Atmospheric CO2 Observation from Space (ACOS) team (Taylor et al., 2023). We only assimilate the nadir and glint observations over land, considering possible bias between the land and ocean XCO2 data. The consequent poor observational coverage over the ocean could result in the disaggregation of the land and ocean CO2 fluxes being more sensitive to the a priori ocean flux inventory. Through sensitivity studies, we find that our land CO2 flux anomalies are not significantly sensitive to the a priori ocean flux inventory (not shown) or to the absence of OCO-2 glint data (Fig. A2). To reduce the computational costs and error correlations, we thinned the OCO-2 observations to ensure a minimal time interval of 10 s.
We also assimilate in situ measurements of CO2 mole fraction data from a subset of 113 sites (Fig. A1) included in the NOAA GLOBALVIEWplus data product (Schuldt et al., 2024), incorporating data from the Integrated Carbon Observation System (ICOS RI et al., 2024).
2.3 GOSIF gross primary productivity (GPP)
We use a global GPP product that is based on OCO-2 solar-induced fluorescence (GOSIF) and linear relationships between solar-induced fluorescence (SIF) and GPP (Li and Xiao, 2019). We chose this data product, available globally at a spatial resolution of 0.05° and a temporal resolution of 8 d, because it is close to the median of observation-derived GPP estimates (Li and Xiao, 2019) and is available over our study period. The mean annual global total for CO2 (2000–2023) is 135.5 ± 8.8 Pg C yr−1, with a significant upward trend over the Northern Hemisphere. Comparisons show that this GPP data product is highly correlated (R2 = 0.74) with GPP measurements collected at 91 eddy covariance flux sites across the globe. Here, we use the monthly mean dataset and re-grid it to a regular 1° grid to compare it with other variables, including our a posteriori CO2 flux estimates.
2.4 Gravity Recovery and Climate Experiment (GRACE) data
The GRACE space mission was jointly developed by NASA and DLR (German Space Agency) and launched into space in 2002. It measures temporal variations of the Earth's gravity field by tracking, using a K-band ranging system, the inter-satellite range and range rate between two co-planar low-altitude satellites (Tapley et al., 2004). The GRACE Science Data System uses these measurements, along with ancillary data, to estimate monthly (or sub-monthly) time series of the global Earth's gravity fields (Bettadpur, 2012; Flechtner, 2007). Here, we use the NASA GRCTellus GRACE land product (RL06.2) for monthly total water storage (liquid water equivalent depth) at 1° × 1° global grids from January 2014 to March 2024 (http://grace.jpl.nasa.gov/, last access: 12 November 2024). We have used these data in our previous studies (e.g. Feng et al., 2022, 2023).
2.5 NASA meteorological reanalyses
We use surface temperature (TS), specific humidity (SH), and soil moisture in the top 0–10 cm (ground wetness, WET) datasets from MERRA2, developed by the GMAO at the NASA GSFC, to study environmental changes from 2010 to 2023. We calculate the vapour pressure deficit (VPD) from the 10 m MERRA2 temperature and specific humidity following Fang et al. (2022). We have used these reanalyses data previously to study a posteriori CO2 fluxes (Palmer et al., 2019) and methane emissions (Feng et al., 2022, 2023).
In Appendix B, to examine the robustness of the results reported from our control run (described above), we report the results from three sensitivity inversions that use different meteorological reanalyses, a priori inventories, and additional ocean sun-glint data collected by OCO-2. These sensitivity calculations provide confidence that the result we report in this study is robust.
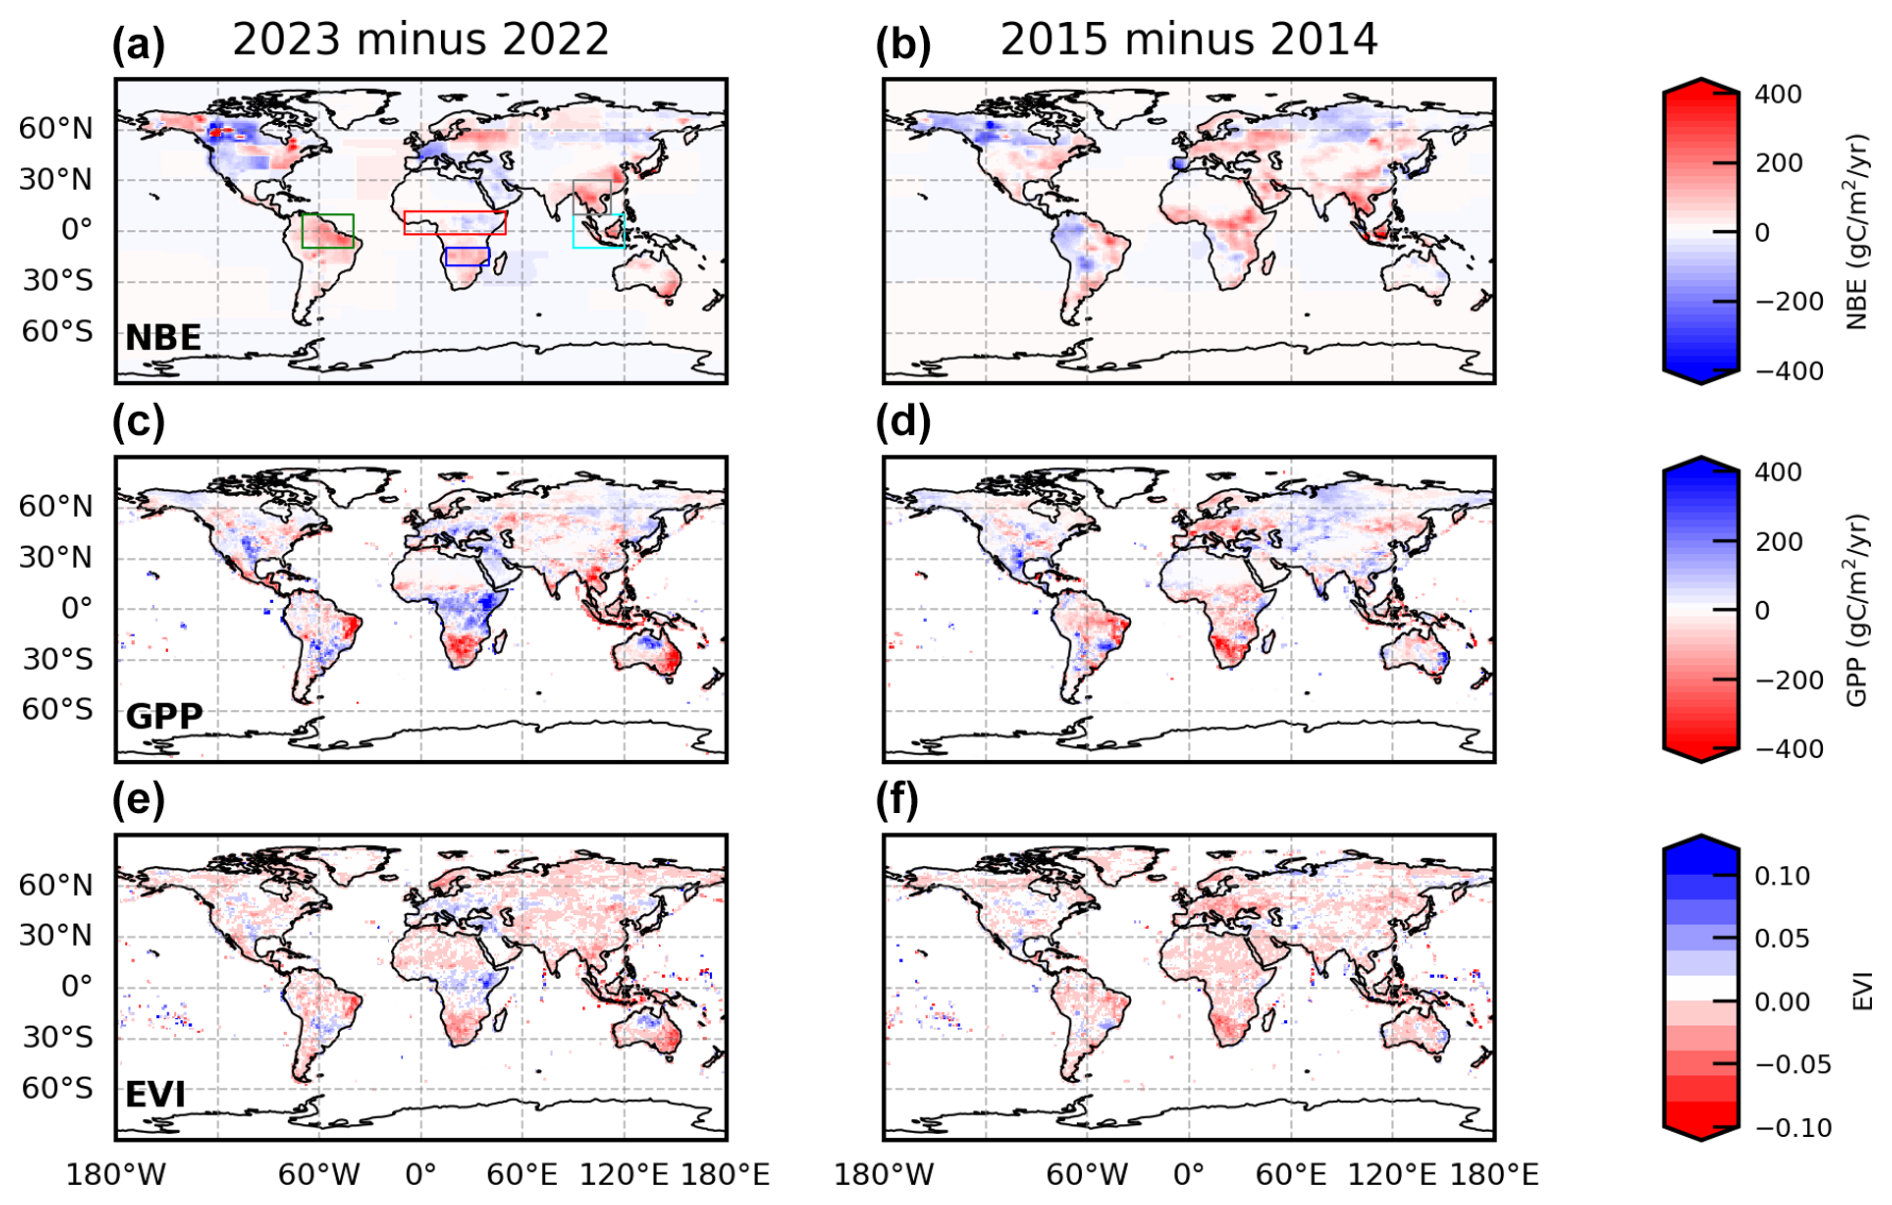
Figure 3Differences in a posteriori CO2 flux estimates inferred from OCO-2 data (a, b), gross primary production (GPP) estimated from OCO-2 SIF data (c, d), and enhanced vegetation indices (EVIs) inferred from Moderate Resolution Imaging Spectroradiometer (MODIS) data (e, f) for 2022–2023 (left panels, a, c, and e) and 2014–2015 (right panels, b, d, and f). Rectangles shown in panel (a) describe the geographical regions we focus on for our multivariate fits.
Figure 2 shows a posteriori net fluxes of CO2 on a global scale and across southern, tropical, and northern latitudes to provide some broad geographical context. These values are broadly consistent with annual values for the atmospheric CO2 growth rates – an important zeroth-order assessment of our a posteriori net fluxes. Our value for 2023, inferred from OCO-2 data, is 3.0 ppm yr−1, about 0.2 ppm yr−1 higher than the value inferred from NOAA CO2 mole fraction data. We acknowledge that CO2 growth rate estimates inferred from NOAA data can depart from the true value based on whole-atmosphere CO2 changes (Pandey et al., 2024). Building on our ongoing model evaluation, e.g. Deng et al. (2024) and Friedlingstein et al. (2025), we find that the a posteriori CO2 concentrations for 2023 are generally within 0.5 ppm of data collected by spectrometers from the Total Carbon Column Observing Network (TCCON) (Wunch et al., 2011), with a standard deviation smaller than 1.2 ppm.
As expected, the largest contribution of the global net flux originates from the Northern Hemisphere (Fig. 2d), where there is a superposition of boreal and mid-latitude ecosystems that contribute to the global uptake of CO2, strong anthropogenic sources such as large cities, and other emission hotspots. At these latitudes, the year-to-year variations are comparatively small, limited to ≪ 1 PgC. In the last 2 years since the 2021 peak, there has been a small decrease in net emissions to pre-pandemic values (3.38–3.96 Pg C yr−1, 2014–2020). During our study, these changes have typically represented 62 %–92 % of the global budget, with the smallest values typically occurring during the El Niño years when the tropics play a larger role. The tropics show large year-to-year changes over our study period (Fig. 2c), with a large peak in emissions that we have not observed since the 2015/2016 El Niño. We find the large increase in net CO2 fluxes predominately originates from the tropics, representing 21 % in 2022 and 38 % in 2023. Our calculations suggest that this anomalous increase in tropical CO2 flux in 2023 is explained mainly by an increased CO2 flux over the eastern Amazon (Fig. A3). The net uptake in the Southern Hemisphere (Fig. 2b) also shows a similar but small year-to-year change with the highest uptake in the last years, consequently compensating for emissions elsewhere on the globe. The 16 % decrease in net uptake in 2023 reduced the influence of this region on the global net flux, reinforcing the role of the tropics on the global scale.
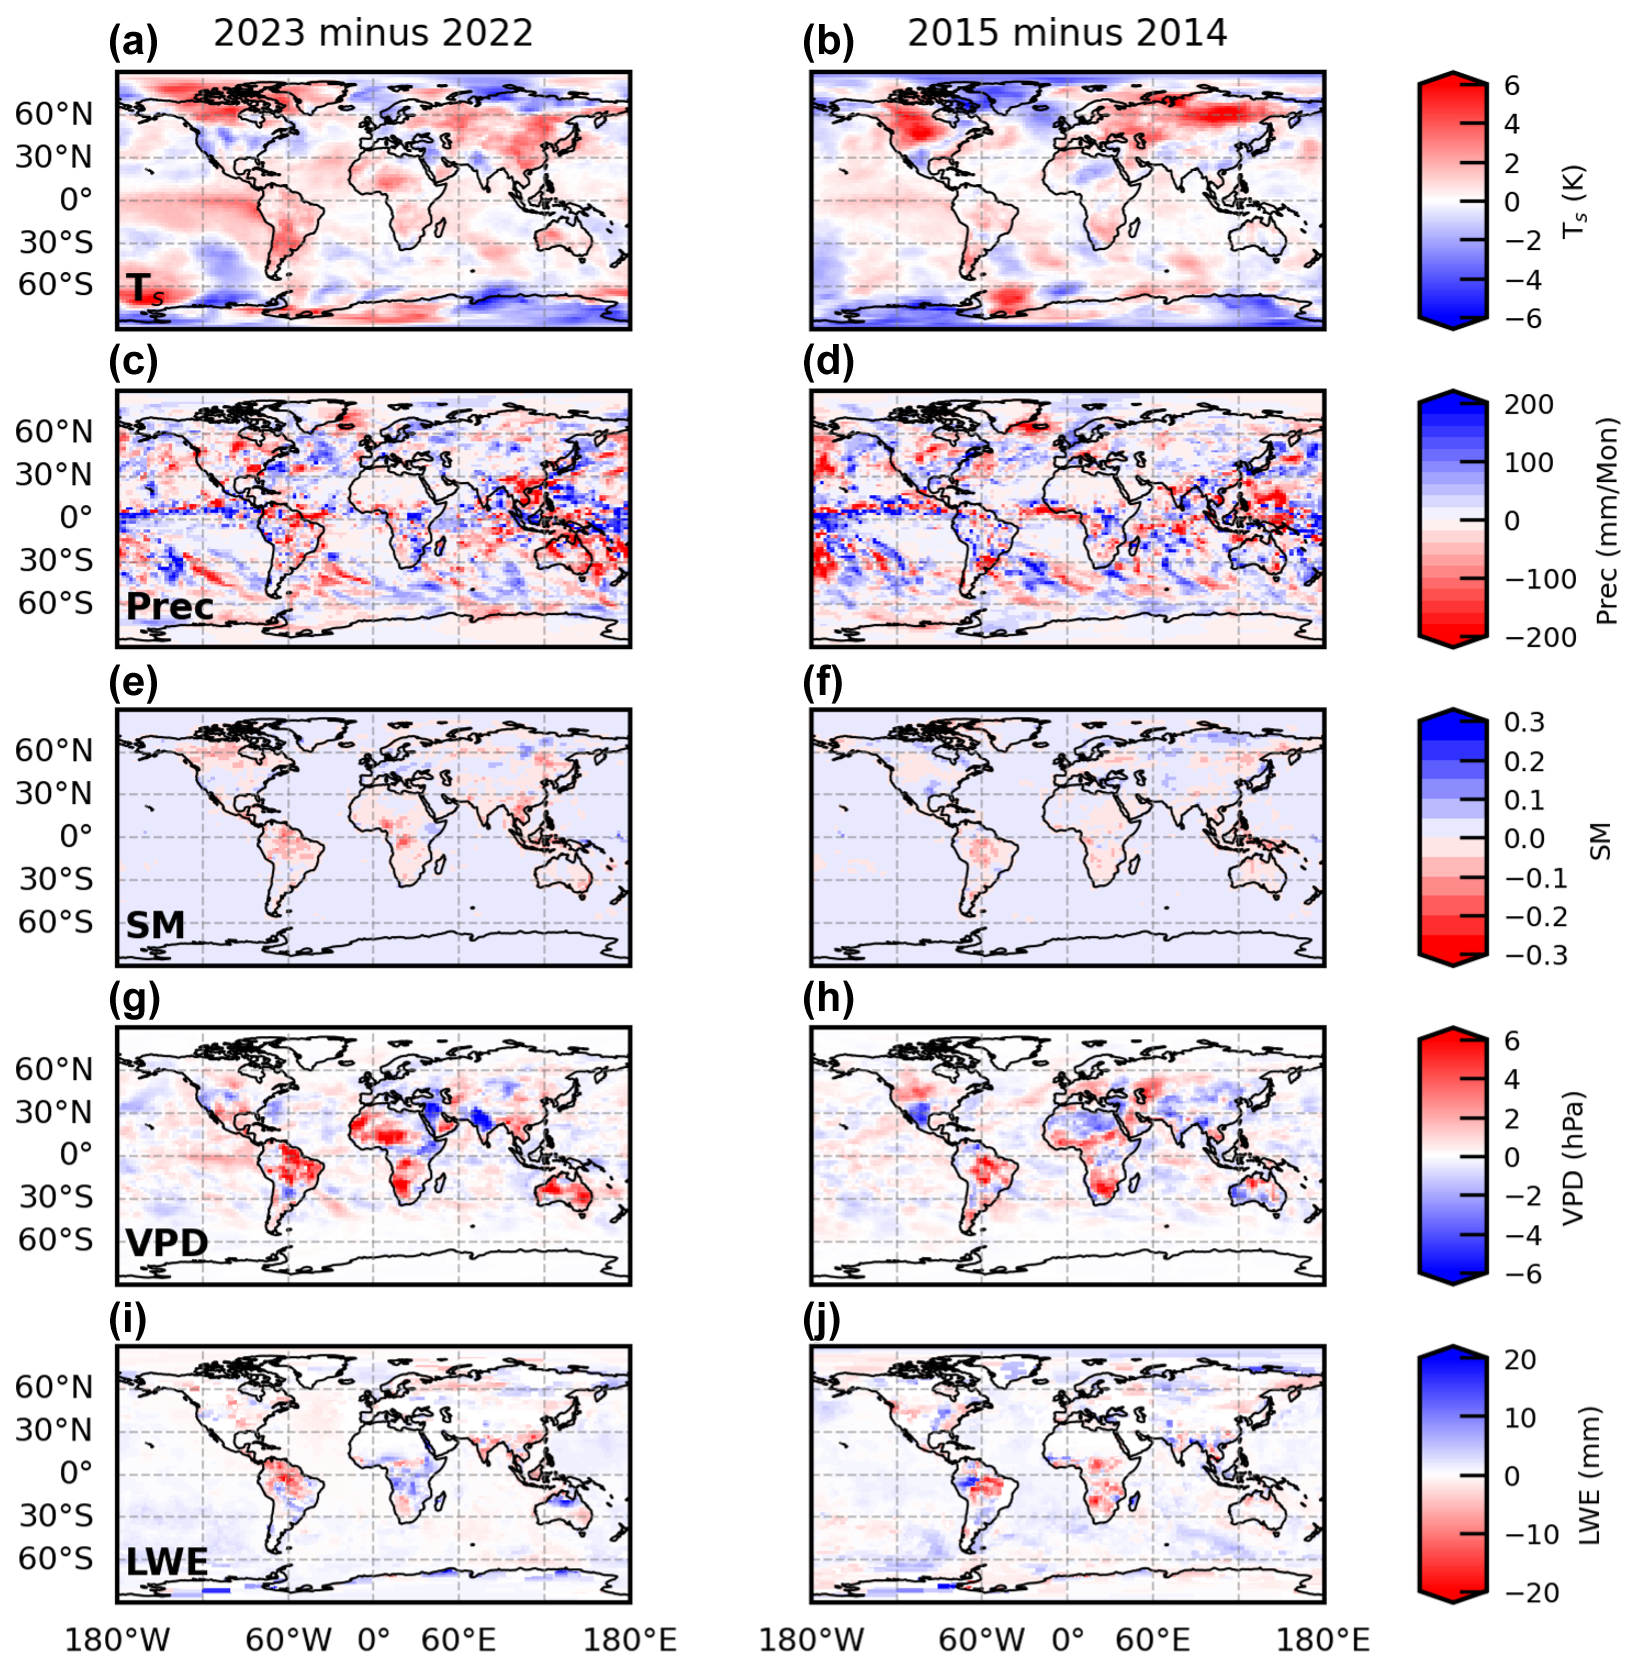
Figure 4Differences in surface temperature (Temp; a and b), precipitation (Prec; c and d), soil moisture (SM; e and f), vapour pressure deficit (VPD; g and h), derived from soil moisture (based on MERRA2 reanalyses data products from the NASA GSFC GMAO); and the liquid water equivalent (LWE; i and j) from the GRACE satellites for 2023 minus 2022 (left panels, a, c, e, g and i) and 2015 minus 2014 (right panels, b, d, f, h and j).
Figure 3 shows the annual spatial distributions of the annual change in the net biosphere exchange (NBE) – the net CO2 flux minus the a priori fossil fuel emissions removed – from 2022 to 2023 and as a comparison from 2014 to 2015 when there was the comparably largest change in the growth rate associated with the 2015/2016 El Niño. This widely used subtraction approach to determine NBE implicitly assumes perfect knowledge of the fossil fuel combustion of CO2, but we acknowledge that making that assumption has implications for NBE estimates, although this is minimal over the tropics where anthropogenic emissions are comparatively small (Oda et al., 2023). A positive annual change in NBE represents a larger net amount of CO2 to the atmosphere. We find that the largest positive increases in NBE are found across the tropics, with peak values over eastern Brazil, southern Africa, eastern and southern China, mainland and maritime Southeast Asia, and southeastern Australia. The emission hotspot over western Canada is from wildfires (Byrne et al., 2024), but our a posteriori feature is almost exclusively from the a priori inventory, determined by independent satellite data, because large aerosol optical depths occur over and downwind of these extensive fires, which makes OCO-2 data unreliable. Byrne et al. (2024) inferred carbon emissions from these fires using satellite observations of carbon monoxide. We also find large positive increases in NBE over Alaska and Russia. Regions with an elevated uptake in 2023 are limited to the USA, central Canada, and mainland Europe, with weaker uptake over Siberia, Türkiye, and some parts of East Africa. In comparison, the tropics in 2015 show regions with positive and negative changes in NBE over tropical South America and a large increase over East and Central Africa (Palmer et al., 2019), with some of the largest increases over mainland and maritime Southeast Asia, as we also found in 2023. Elevated uptake was mainly confined to boreal latitudes. These changes in a posteriori fluxes are broadly consistent with independent estimates of GPP changes inferred from the OCO-2 SIF data product and from vegetation greenness, providing us with some confidence that our estimated fluxes are physically plausible. The annual mean budgets for individual geographical regions, where we see the largest changes in NBE (rectangles in Fig. 3a), show that the eastern Amazon is almost exclusively responsible for the large increase in pan-tropical CO2 flux in 2023, with a smaller contribution from Southeast Asia.
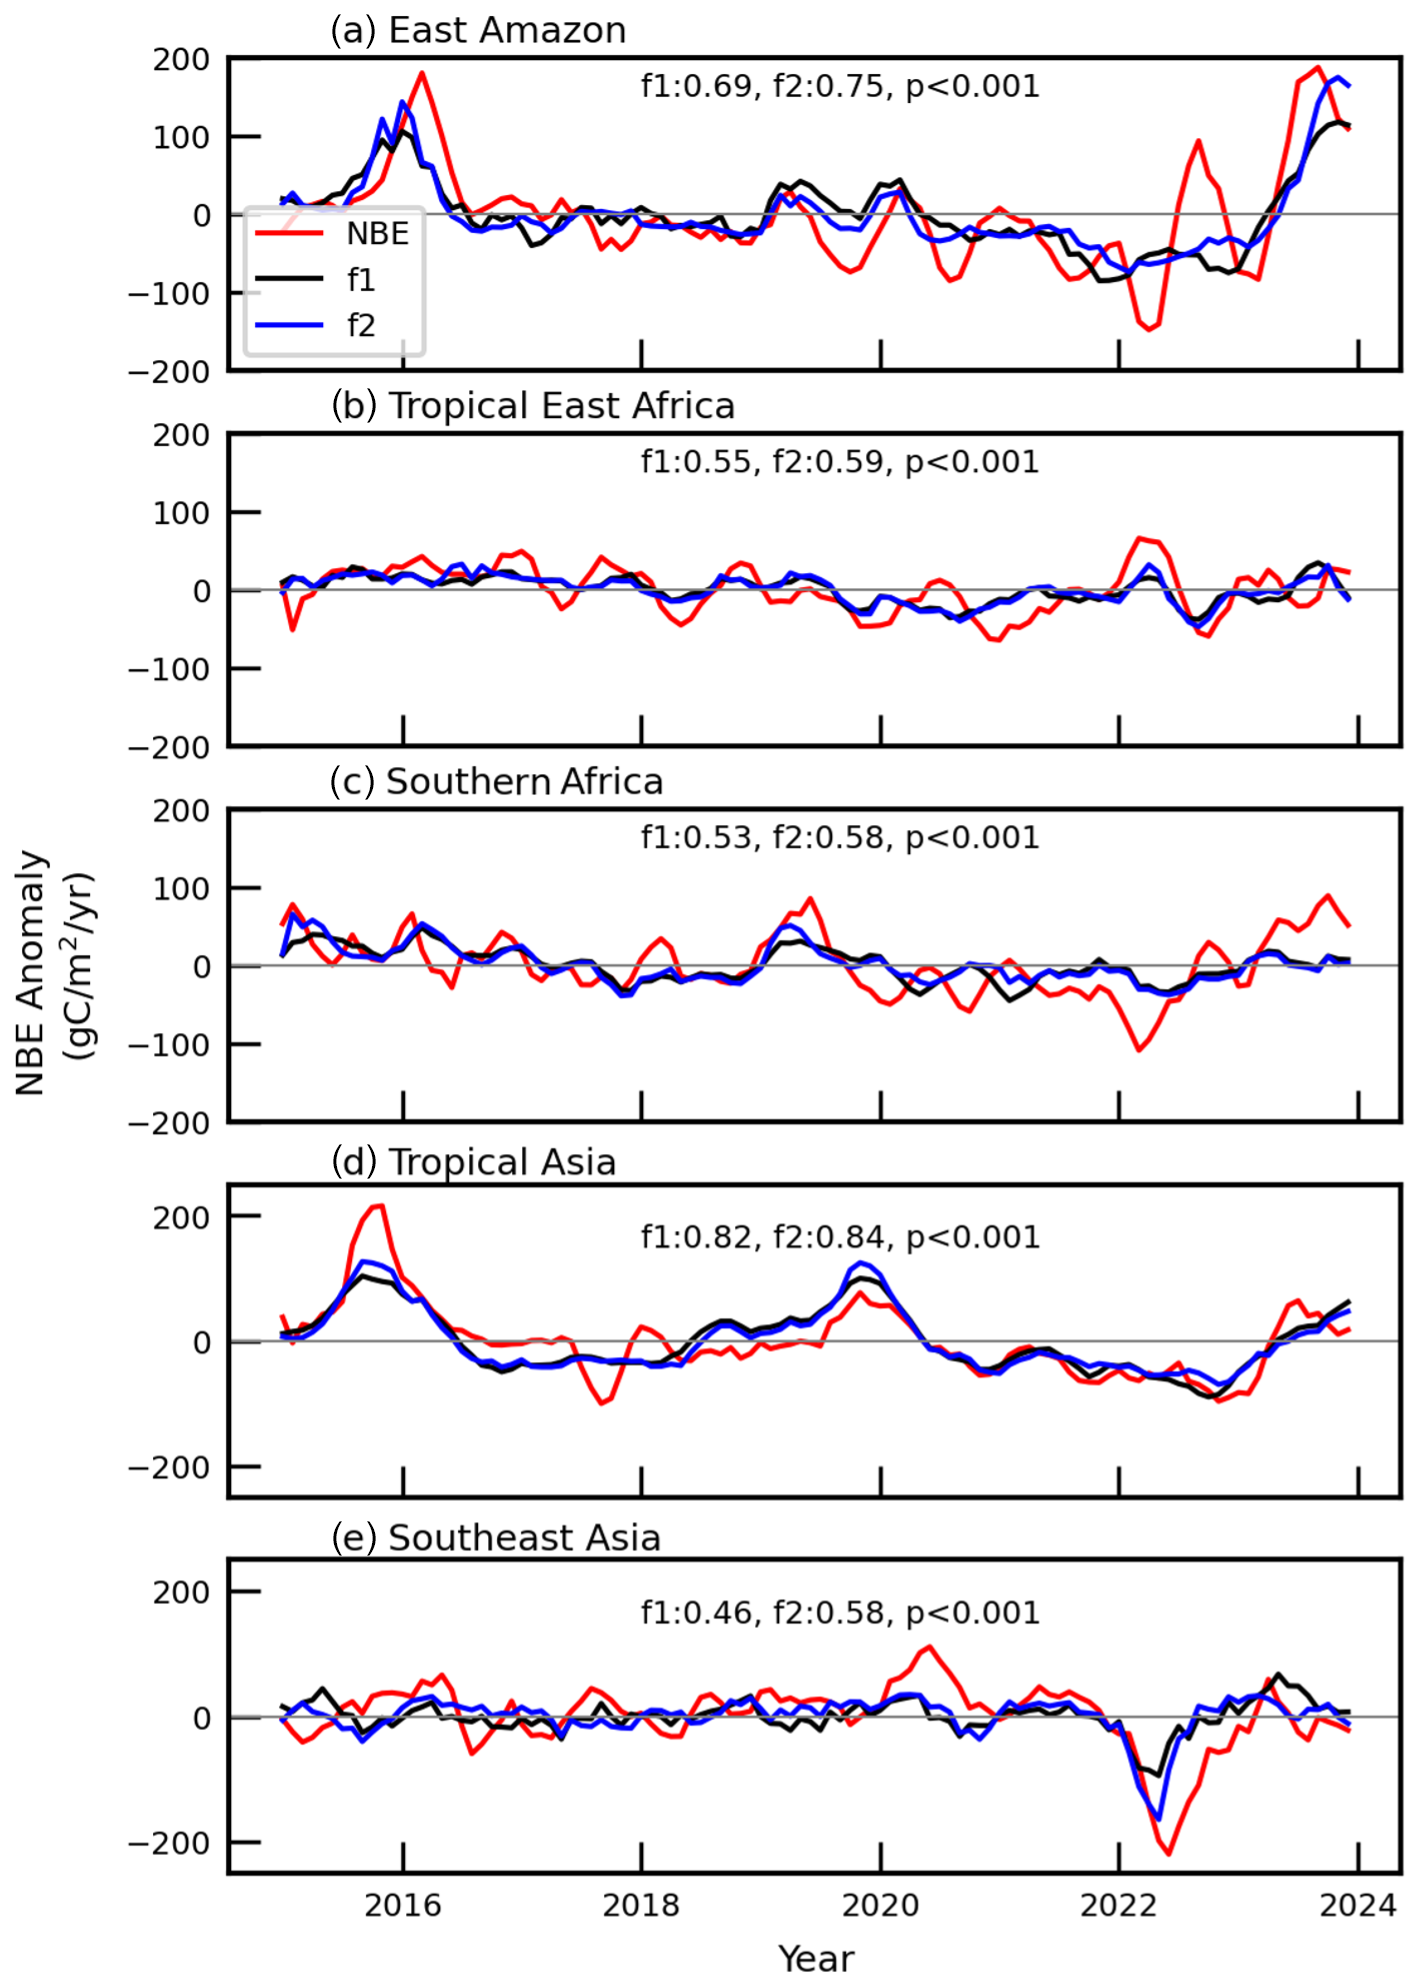
Figure 5Regional linear (black) and quadratic (blue) multivariate fits of NBE anomalies (red) inferred from OCO-2 data using independent estimates of rainfall, surface temperature, and soil moisture from MERRA reanalyses data products from the NASA GSFC GMAO. Regional definitions, defined in panel (a) of Fig. 3, include the eastern Amazon, tropical East Africa, southern Africa, tropical Asia, and Southeast Asia. Inset numbers shown in each panel indicate the Pearson correlation coefficient for each fit and the p value that corresponds to both fits.
Figure 4 shows the geographical distribution of changes in parameters that describe large-scale CO2 flux changes – temperature and water availability. Geographical locations where we report the largest increases in NBE (and largest reductions in GPP) in 2023 – e.g. Brazil, southern Africa, and southeastern Australia – are coincident with locations where we saw some of the largest increases in temperature and VPD and the largest reductions in LWE. Where we reported the largest decreases in NBE (and the largest increases in GPP), e.g. parts of the contiguous USA and central Canada, we saw cooler temperatures and lower VPDs and small increases in LWE. We find a similar level of consistency between the data products and meteorological reanalyses in 2015. Recent work using an ensemble of dynamic global vegetation models highlighted the detrimental impact of warming on tropical ecosystems (Sitch et al., 2024), consistent with our results.
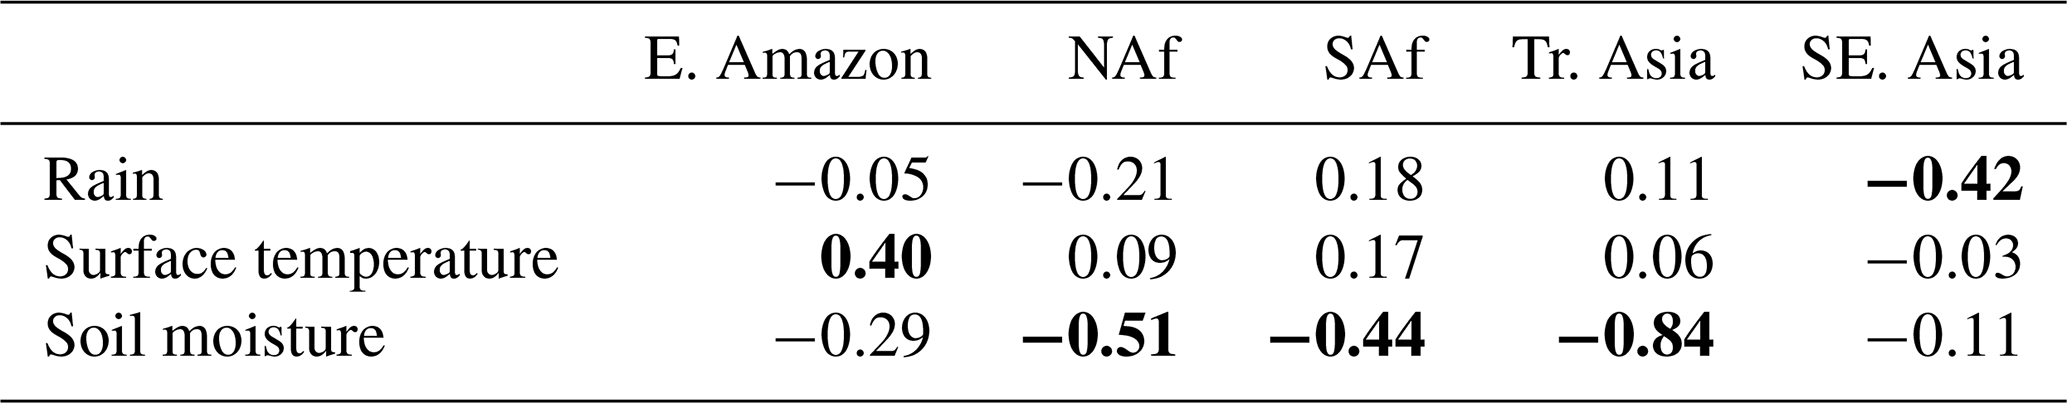
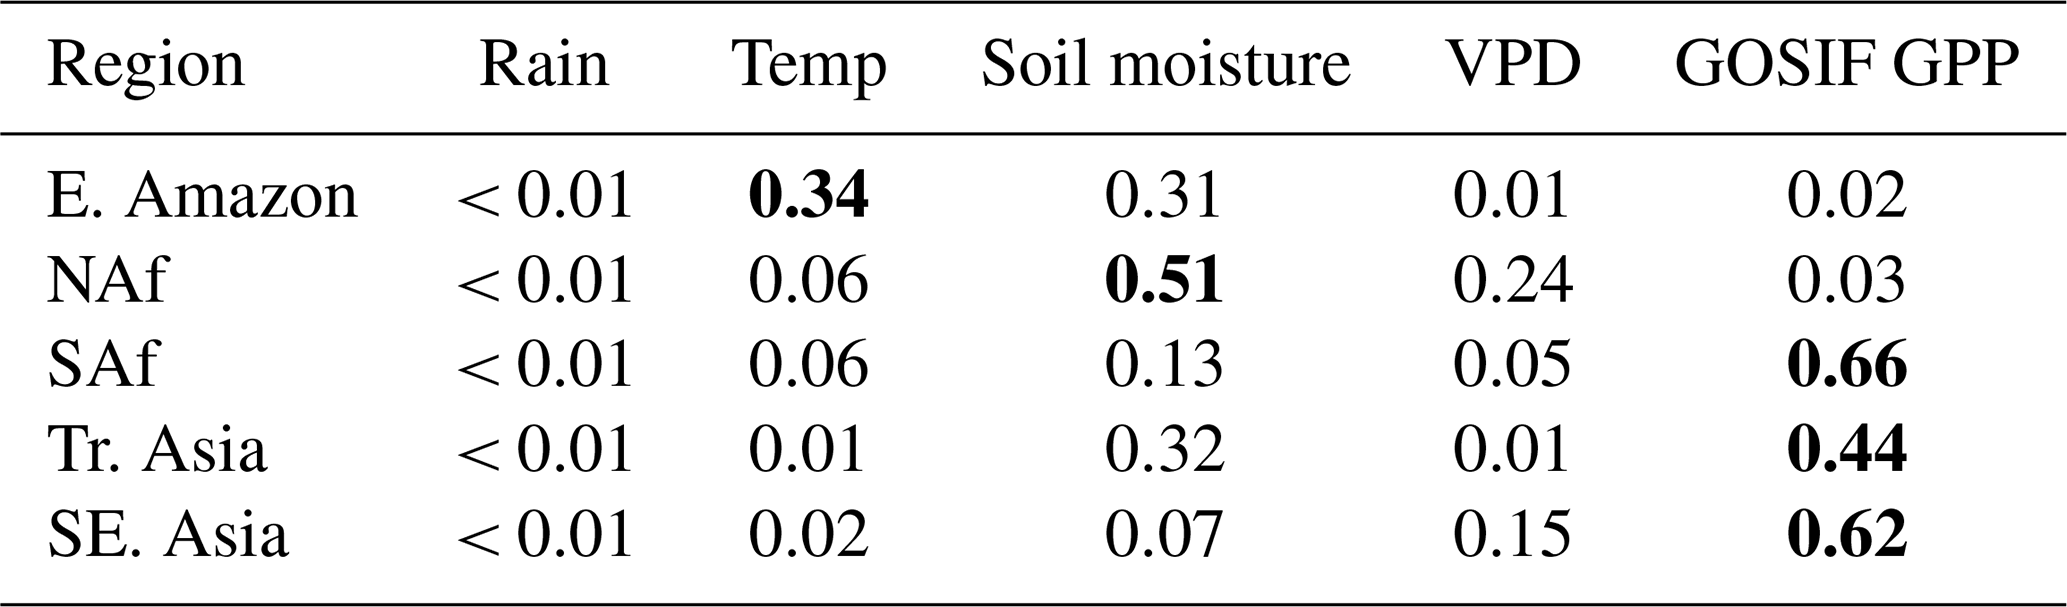
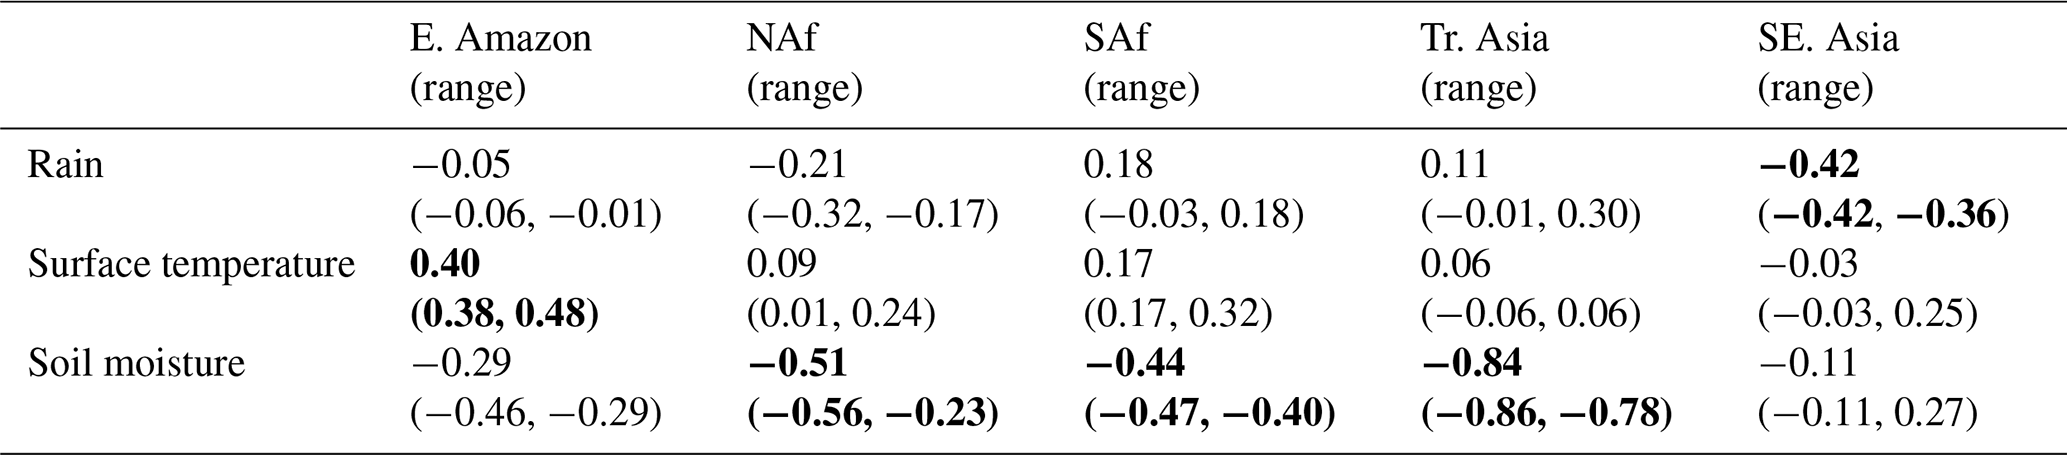
Figure 5 describes these relationships more quantitatively by using linear and quadratic multivariate fits of MERRA2 rainfall, temperature, and soil moisture anomalies to our a posteriori NBE anomalies, 2014–2023, inclusively, over the geographical regions highlighted in Fig. 3a. For the linear fits (f1), we assume that the a posteriori NBE anomalies are a linear function of the MERRA2 rainfall (R), surface temperature (TS), and soil moisture (SM) anomalies: ΔNBE = , where Δ denotes an anomaly, αx denotes the regression coefficient for a particular variable x, and Δ0 denotes the fitting residual. We scale these anomalies by their respective standard deviations and smooth them by applying a 4-month moving window to reduce the noises and to (partially) account for the time lag between flux and environmental drivers. We use a least-squares method to estimate the four regression coefficients, which we report in Table A1, with results from our sensitivity tests shown in Table B2. We also consider a quadratic regression model (f2) to explain the NBE anomalies, including linear and quadratic terms for the same three quantities used in the linear model but without cross terms; we found that this only marginally outperforms the linear model. Both models are statistically significant, with p values < 0.001, so for simplicity of interpretation we use the linear fit. In sensitivity calculations, we find that changes in VPD or LWE do not improve the fits to the NBE anomalies. The models capture most of the NBE changes, with the notable exception of mid-2022 when our NBE fluxes show a sharp increase that is not explained by temperature or water. Based on the normalized linear-fitting coefficients, we find for these fits that changes in temperature explain most of the NBE changes we observe over the eastern Amazon (Table A1 and Fig. B3), but soil moisture changes are more important over northern tropical Africa, southern Africa, and tropical Asia (Table A1 and Fig. B3). Rainfall changes are more important over Southeast Asia. Independent GOSIF GPP estimates determined from satellite SIF observations (Li and Xiao, 2019) show a significant decrease from 2022 to 2023 over tropical regions, particularly over the eastern Amazon, southern Africa, tropical Asia, and Southeast Asia (Fig. A4), consistent with the increase we report for our a posteriori NBE estimates (Fig. 5). More generally, we find that changes in GOSIF GPP are better than other individual predictors at describing our a posteriori CO2 flux anomalies over tropical Asia, Southeast Asia, and southern Africa. Table A2 shows the permutation importance of individual predictors in our multivariate linear models.
We reported regional changes in the net biospheric exchange (NBE) of CO2 inferred from OCO-2 retrievals of XCO2 from 2022 and 2023 to examine the origin of the large atmospheric growth rate reported for that period. Positive values of NBE denote net CO2 fluxes to the atmosphere. We find that most of the increase in atmospheric CO2 in 2023 is due to increased NBE over the land tropics, supported by a modest reduction in uptake in the southern extratropics, in agreement with a recent study (Gui et al., 2024). Further examination of our results revealed increased NBE over eastern Brazil, southern Africa, eastern and southern China, mainland and maritime Southeast Asia, and southeastern Australia. Extensive wildfires over western Canada during the boreal summer months also substantially contributed to the atmospheric CO2 growth rate in 2023 (Byrne et al., 2024), but in terms of atmospheric CO2, this information is exclusively from the a priori inventory that is determined by independent satellite data. We also find increased uptake (lower NBE values) over the USA, central Canada, and mainland Europe, with weaker uptake over Siberia, Türkiye, and some parts of eastern Africa. These large-scale patterns of NBE are consistent with data-driven estimates of gross primary production and vegetation greenness and with changes in surface temperature, rainfall, and surface water (Figs. 4 and B3). We find that warmer temperatures in 2023 explain most of the change in NBE over eastern Brazil, with changes in hydrological quantities – rainfall or soil moisture – more important elsewhere across the tropics. Additional knowledge is needed to help reconcile CO2 flux estimates from models based on land biosphere processes with those inferred from inversions (Kondo et al., 2020). Our quantitative exploration of the relationships between our a posteriori NBE anomalies and changes in environmental parameters (Fig. 5) helps to interpret observed changes in atmospheric CO2 but can also help to evaluate and improve process-based land biosphere models.
Our main analysis has focused on 2023, but it is important to put this one year into a broader historical context, at least in the past decade when we have seen a marked increase in atmospheric growth rates of atmospheric CO2 (Fig. 1). Some of this increase can be explained by changes in fossil fuel combustion and other forms of human activity, but the largest spikes in atmospheric CO2 growth rates coincide with years when there is a strong El Niño event (Fig. 1), primarily associated with large-scale perturbations in the hydrological cycle that impact tropical ecosystems. In strong El Niño years, such as 2015/2016, widespread droughts reported across the tropics (Jiménez-Muñoz et al., 2016) resulted in a notable increase in fires (Liu et al., 2017) and can in some ecosystems lead to a widespread loss of tree density and a change in the floristic composition (Prestes et al., 2024).
In 2023, the multivariate El Niño Southern Oscillation Index, indicative of El Niño and La Niña strength, was approximately half the value of recent El Niño events, such as 2015/2016. There are distinct differences in the spatial patterns of rainfall, atmospheric aridity (given by the vapour pressure deficit), and soil moisture over the tropics (Fig. 4). However, the loss of carbon sequestration in 2023 and 2015/2016 was comparable. Our findings highlight the complex response of the tropical biosphere to environmental change, reflecting differences in the sensitivity and vulnerability of plants to localized droughts and increasing surface temperature (Table A1). Further quantifying these different sensitivities using independent in situ ecological observations will significantly improve our ability to model important biospheric processes in terms of atmospheric–biosphere carbon exchange (e.g. Liu et al., 2024).
We have extended our analysis to 2024, which is reported in Appendix C. We find that the reduced carbon uptake continues into 2024. Uptake by the Amazon basin in 2024 remains weaker than in 2022. There is also weakened uptake over southern tropical Africa (south of 20° S) and over tropical Asia. There is a small increase in uptake over temperate North America in 2024 compared to 2023. The resulting global net emission estimate for 2024 is 6.84 ± 0.80 PgC, corresponding to a global CO2 growth rate of 3.28 ± 0.30 ppm yr−1.
Our interpretation of the OCO-2 column data suggests that the reduced uptake of CO2 from tropical ecosystems played a key role in determining the anomalously large atmospheric CO2 growth rates in 2023 and in 2024 (Appendix C). Our work is largely consistent with a recent independent study (Gui et al., 2024) that used the same OCO-2 data but interpreted them with an independent atmospheric transport model, driven by different fossil fuel inventories and by AI-based dynamic global vegetation models. They also used a different inverse method approach. However, our results and those reported by Gui et al. (2024) are inconsistent with another independent study (Ke et al., 2024), based on a set of land biosphere models and an inversion experiment from the Copernicus Atmosphere Monitoring Service (CAMS). They significantly differ in the spatial patterns of carbon release and uptake. Resolving these discrepancies is beyond the scope of this work, but ultimately they do need to be resolved if we are to use these models to predict how global ecosystems will respond to a warming climate and an accelerated hydrological cycle and the subsequent impacts on the carbon cycle (Armstrong McKay et al., 2022). If our main result is accurate – a moderate El Niño event, in the context of exceptional drought attributed to climate change (Clarke et al., 2024), has led to a significant reduction in carbon uptake by the tropical land biosphere – we might be observing the beginning of a decline in the ability of tropical ecosystems to absorb carbon. The long-term nature of this situation is unclear without further data, although the estimate of the 2024 atmospheric CO2 growth rate of 3.73 ± 0.09 ppm yr−1 is unprecedented since these records began in the late 1950s (https://gml.noaa.gov/ccgg/trends/gl_gr.html; last access: 1 October 2025). A coordinated measurement campaign is urgently needed to document how tropical ecosystems are changing, whether these changes compromise the future ability to absorb and store carbon, and whether prolonged drought will substantially delay any ecosystem recovery.
Regularly reporting regional CO2 fluxes with minimal delay, and interpreting them using auxiliary data, e.g. related to fire (such as the extensive North American boreal forest fires in 2023) and hydrology, are enabled by massive-scale international investment in satellite instruments that complement the detailed information provided by ground-based measurement networks. Collectively, these efforts provide vast volumes of information about the state of the planet at a time when we are observing unprecedented environmental changes. These data and the analysis tools needed to infer CO2 fluxes collectively represent an invaluable scientific resource that must be used to deliver frequent actionable information for policymakers. The agreement and divergence between our results and those from other independent studies underscore the efficacy and the shortcomings of the prevailing frameworks.
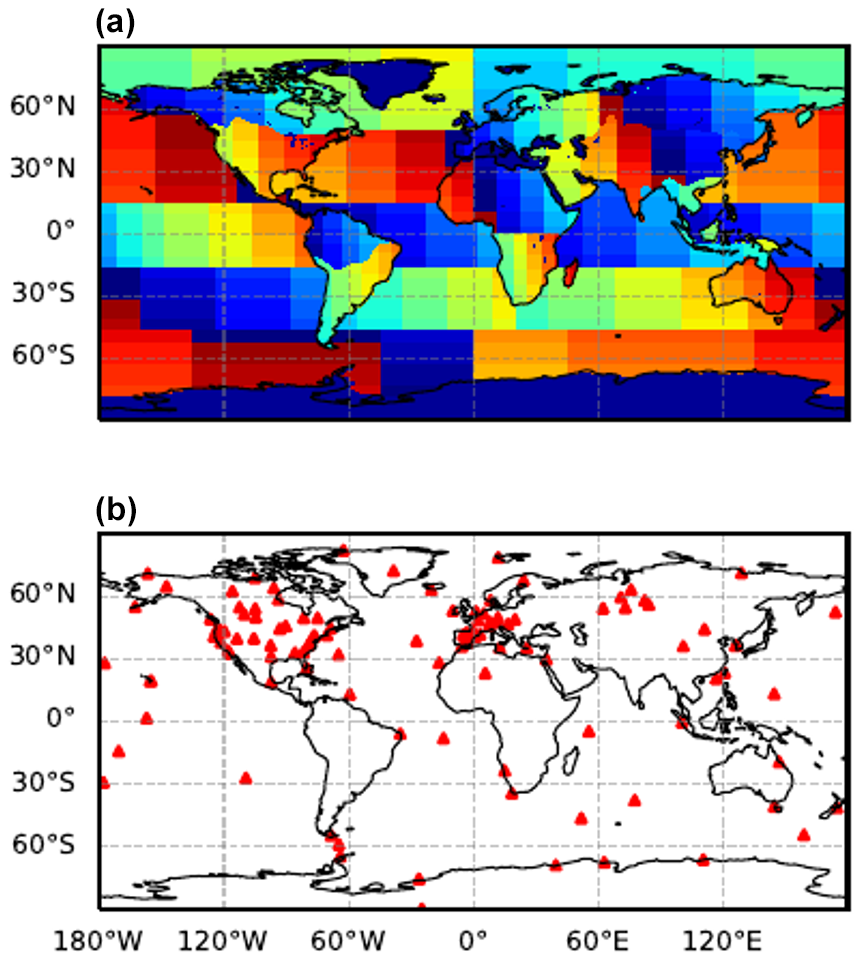
Figure A1(a) The distribution of 488 subregions – including 356 land regions and 132 oceanic regions – for which we report monthly a posteriori CO2 flux estimates inferred from OCO-2 data. (b) The geographical locations of the ground-based measurements of the CO2 mole fraction.
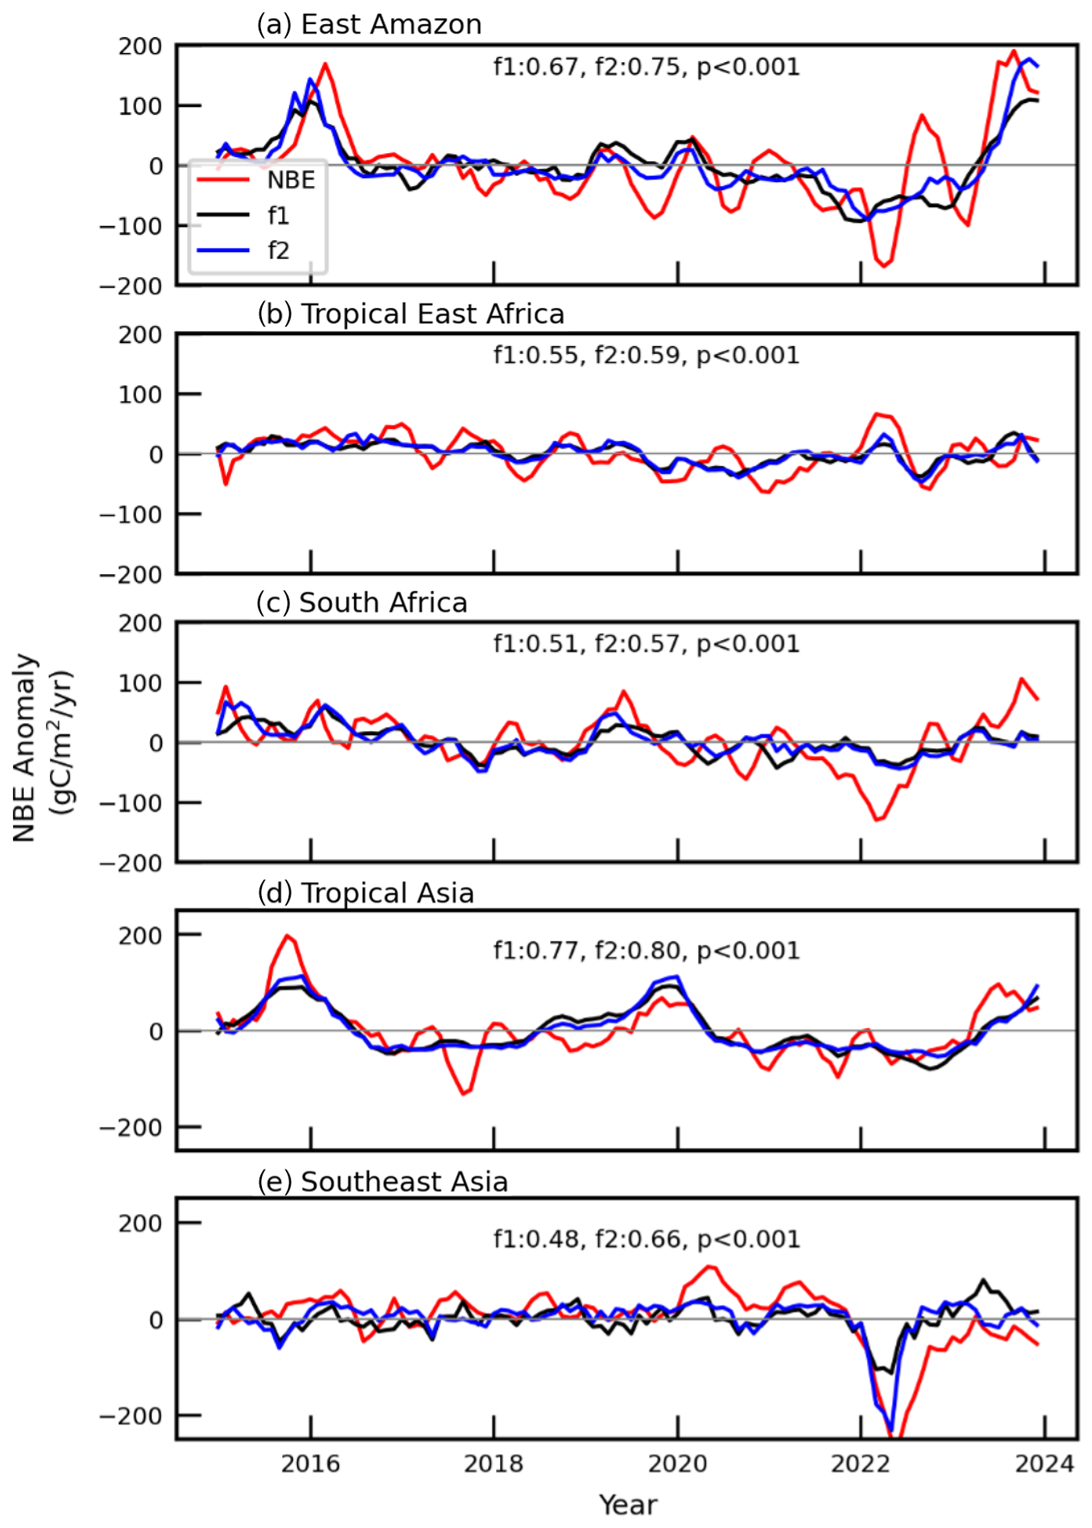
Figure A2As Fig. 5 but for NBE anomalies inferred using OCO-2 land nadir, land glint, and ocean glint data, and in situ data (LNLGOGIS).
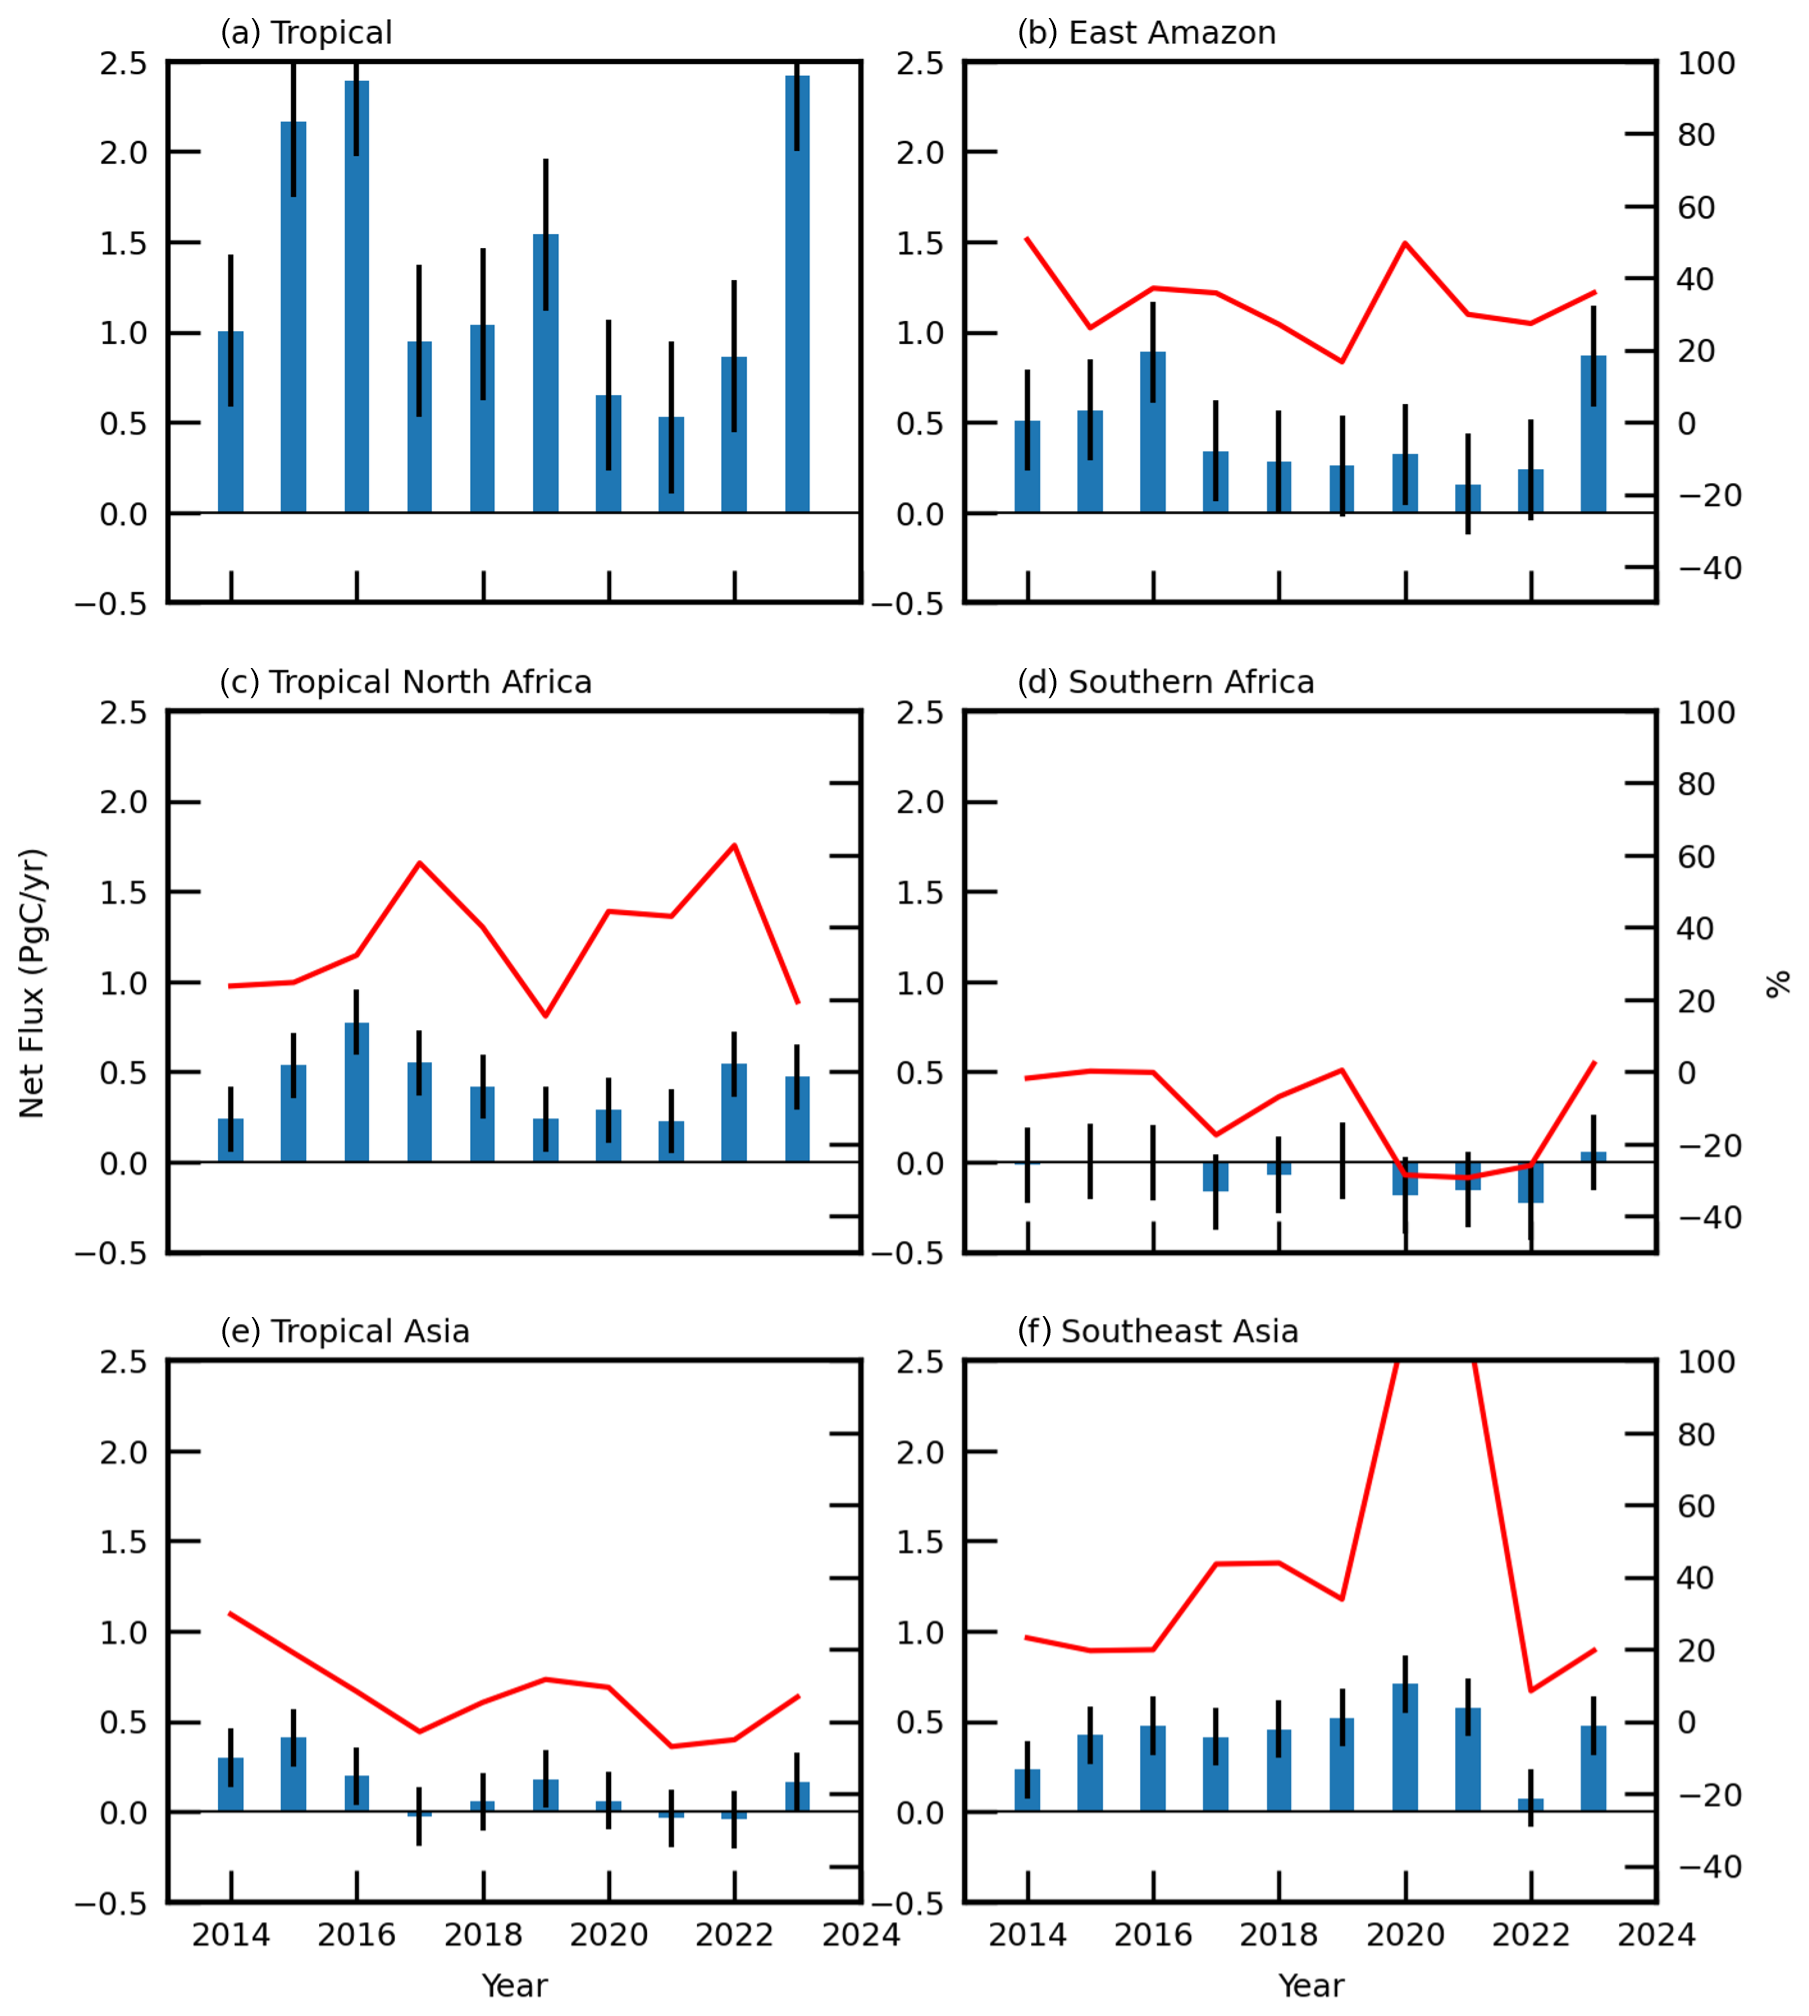
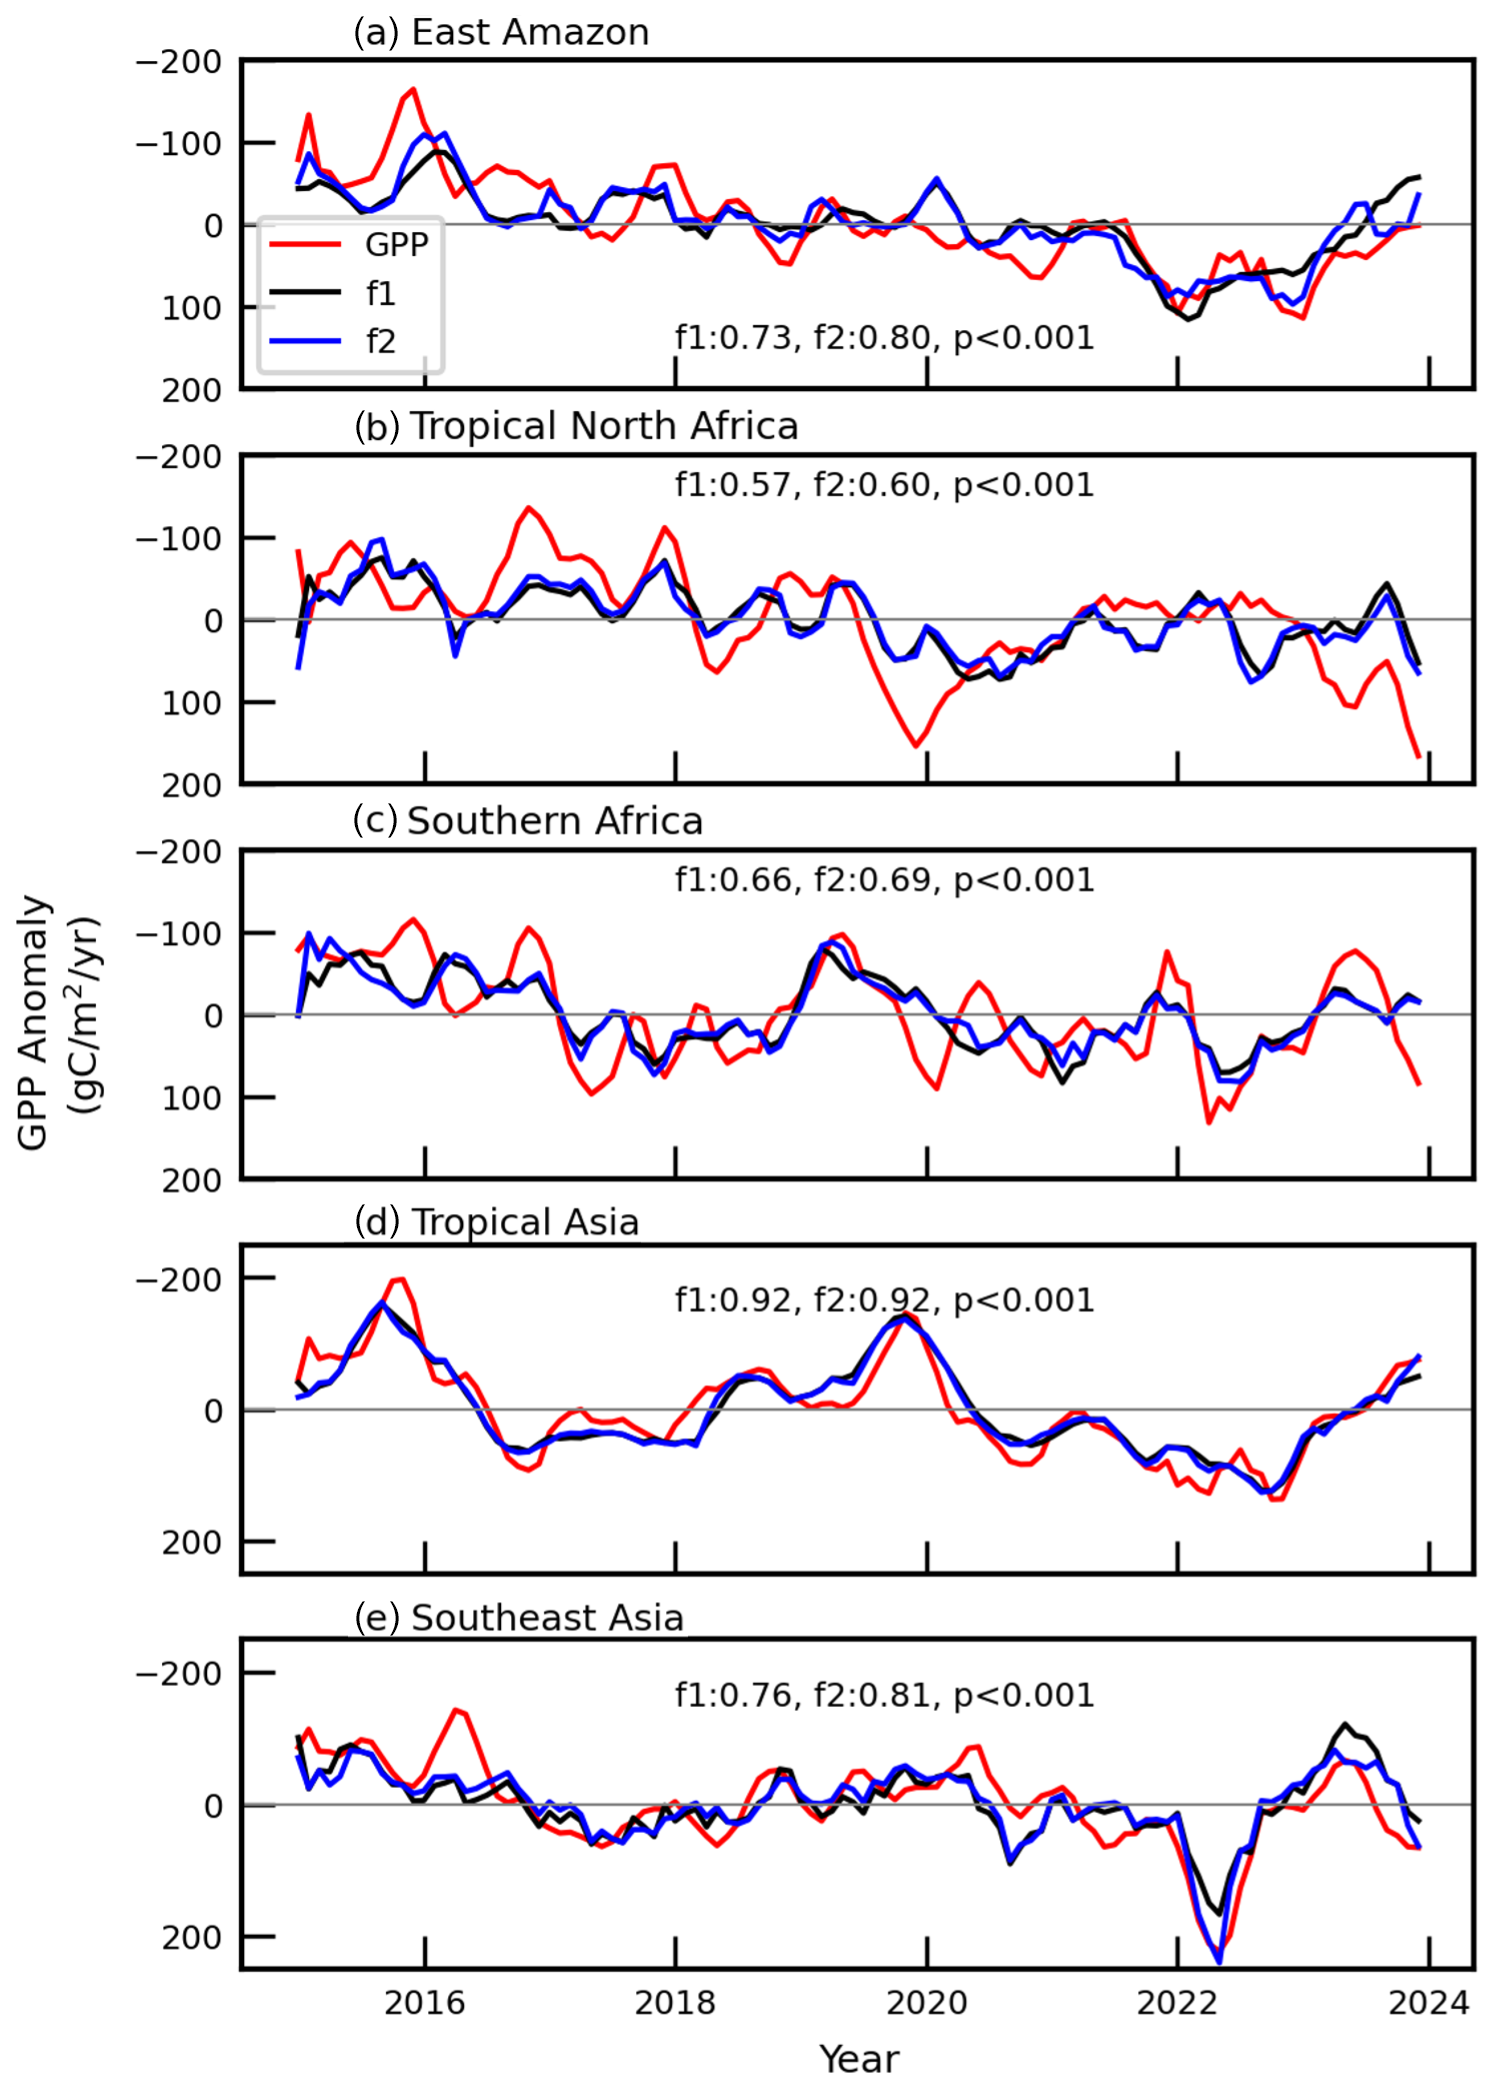
Table A1Normalized linear-fitting coefficients for the independent variables of the MERRA2 rain, surface temperature, and soil moisture used to fit the NBE anomalies (Fig. 5) for the regions defined in Fig. 3a, 2014–2023, inclusively. The largest coefficient for each region is highlighted in bold.
Sensitivity experiments
To test the robustness of our results, we report the results from other calculations in which we alter one aspect of the inversion. The experiments are described in Table B1. Text in bold denotes the change from our control run (CTRL).
The GEOSFP inversion is driven by GMAO Goddard Earth Observing System Forward Processing (GEOS-FP) meteorological analyses, based on a convection scheme that is different from the one used in the MERRA2 reanalysis, which we use in our control experiment (CNTRL). For the inversion using OCO-2 land nadir, land glint, and ocean glint data, and in situ data (LNLGOGIS) inversion, we use additional OCO-2 XCO2 sun-glint retrievals collected over the oceans. The SIB3-JENA inversion includes alternative a priori estimates for sea–air CO2 fluxes based on CO2 observations (Rödenbeck et al., 2022) and for biosphere–atmosphere fluxes from the SiB3 model simulation (Baker et al., 2009).
Figure B1 compares the monthly a posteriori net CO2 flux estimates, 2014–2024, from our control and the three sensitivity experiments over four TransCom-3 regions, representative of three different latitude ranges: tropical South America, tropical Asia, temperate Eurasia, and southern Africa. The a posteriori estimates are very similar but we find significant regional differences for some months. For example, GEOSFP results in smaller emissions from temperate Eurasia during the winter months (Fig. B1c), and including OCO-2 oceanic glint data results in larger seasonal cycles over tropical South America (Fig. B2d). As a result, the two inversions that use ocean data (LNLGOGIS and SIB3-Jena) show net annual emissions from tropical South America that are 0.1–0.22 Pg C yr−1 lower than the control run.
Table B1Configurations of our control run and three sensitivity experiments. Text in bold denotes the change from our control run (CTRL).
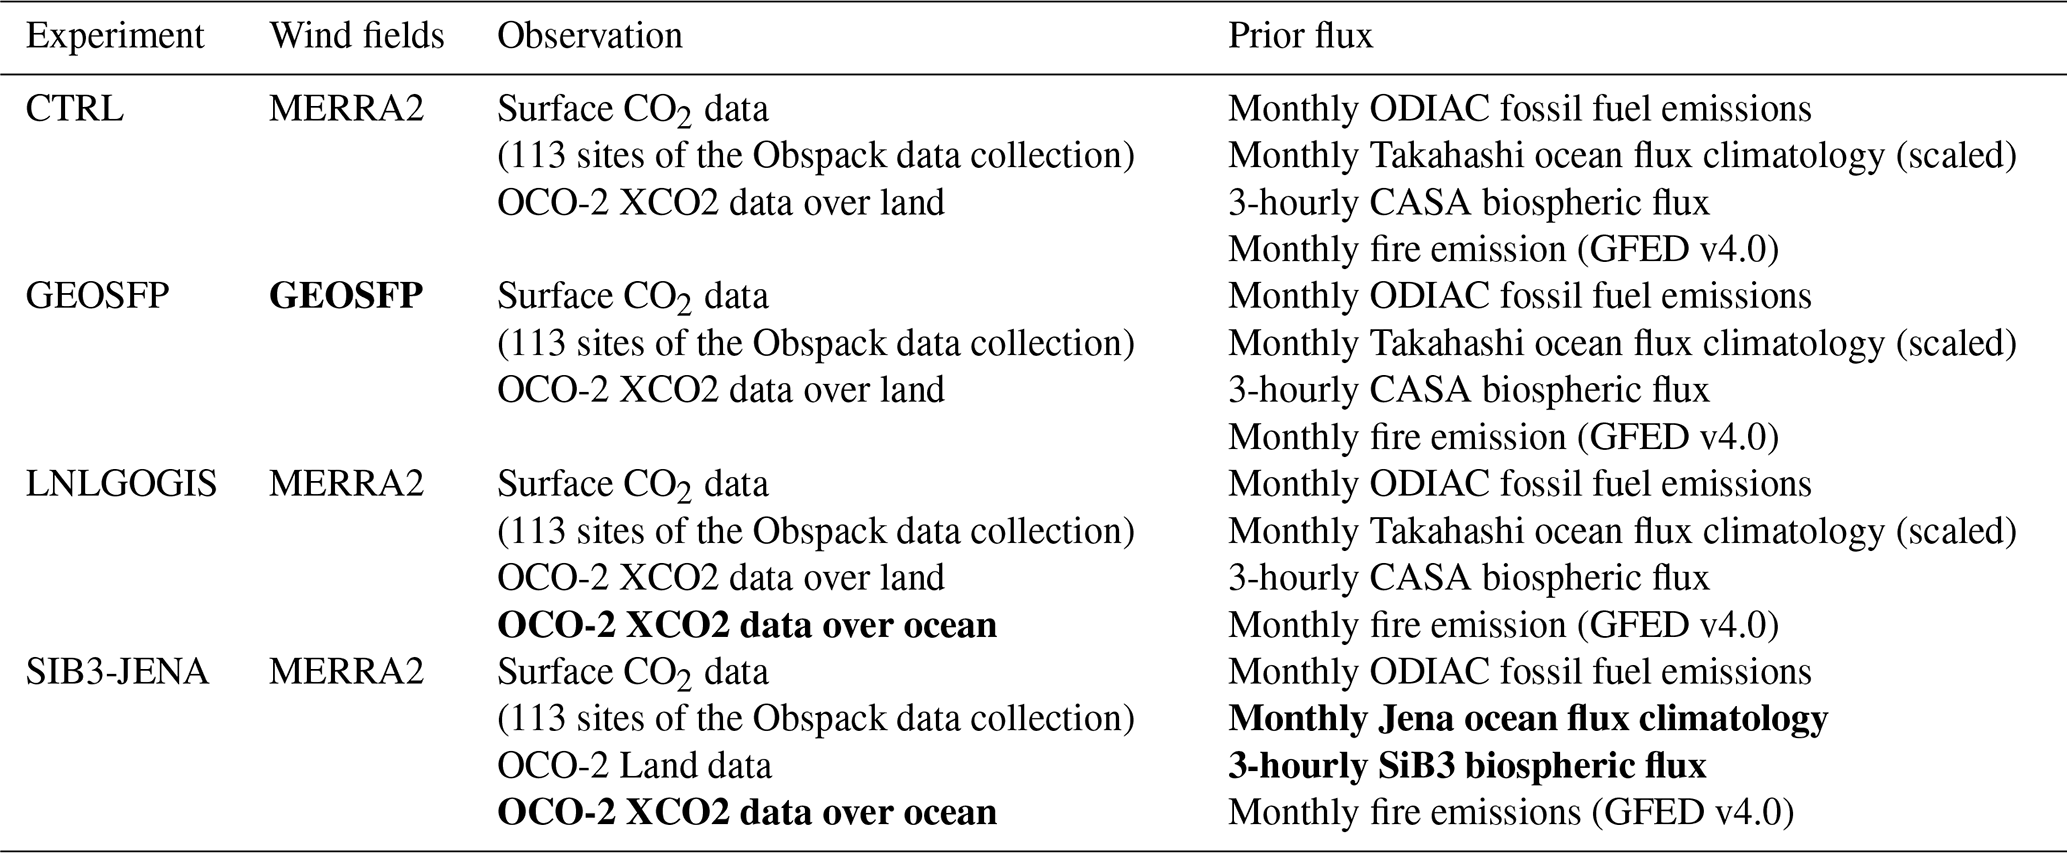
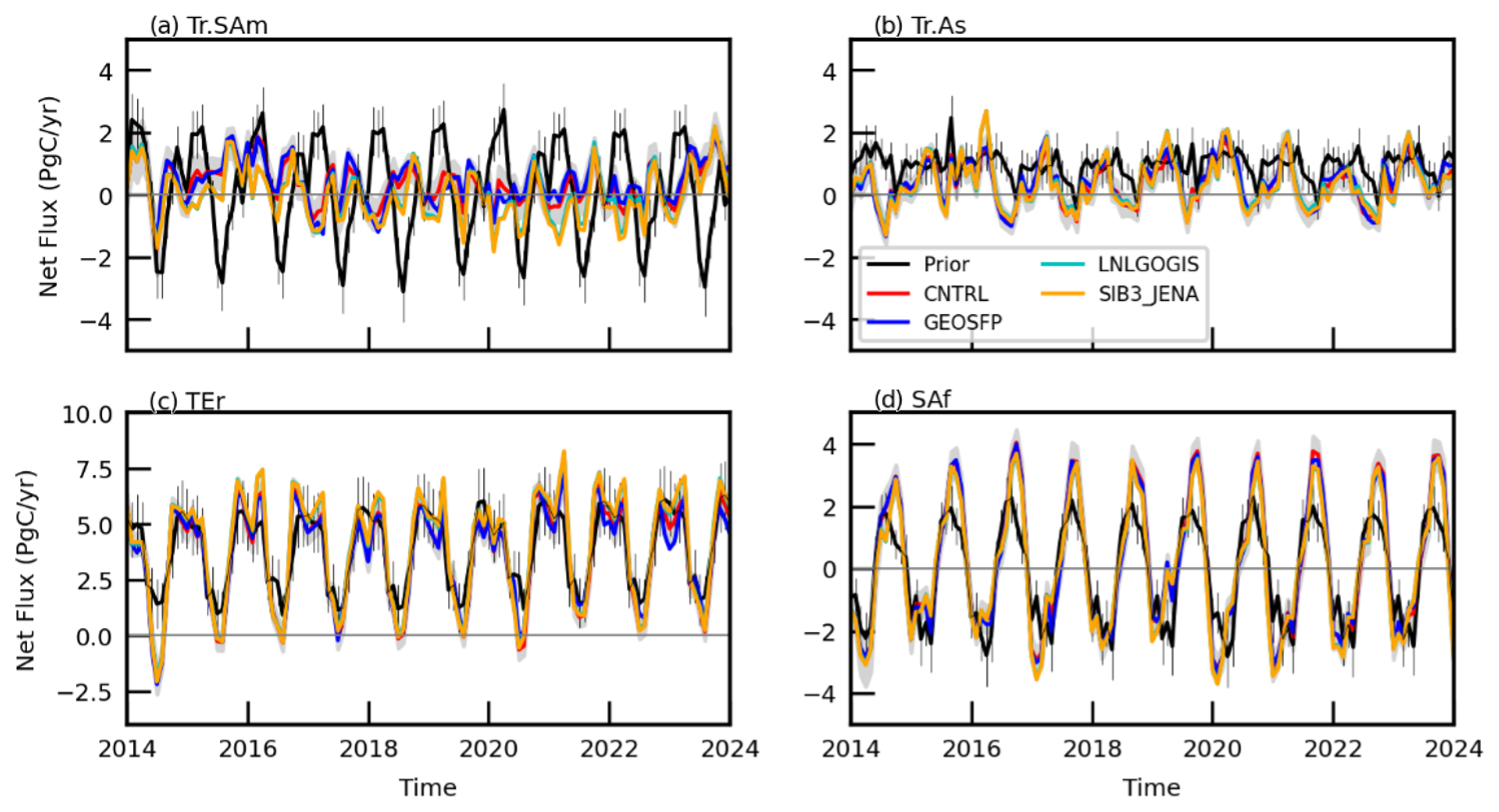
Figure B1Monthly regional flux estimates by four inversion experiments (CNTRL, GEOSFP, LNLGOGIS, and SIB3-JENA) over four TransCom-3 regions: (a) Tr.SAm (tropical South America), (b) Tr.As (tropical Asia), (c) TEr (temperate Eurasia), and (e) Saf (southern Africa). The uncertainties for a priori and a posteriori estimates from the inversions are denoted by vertical lines and shaded envelopes, respectively.
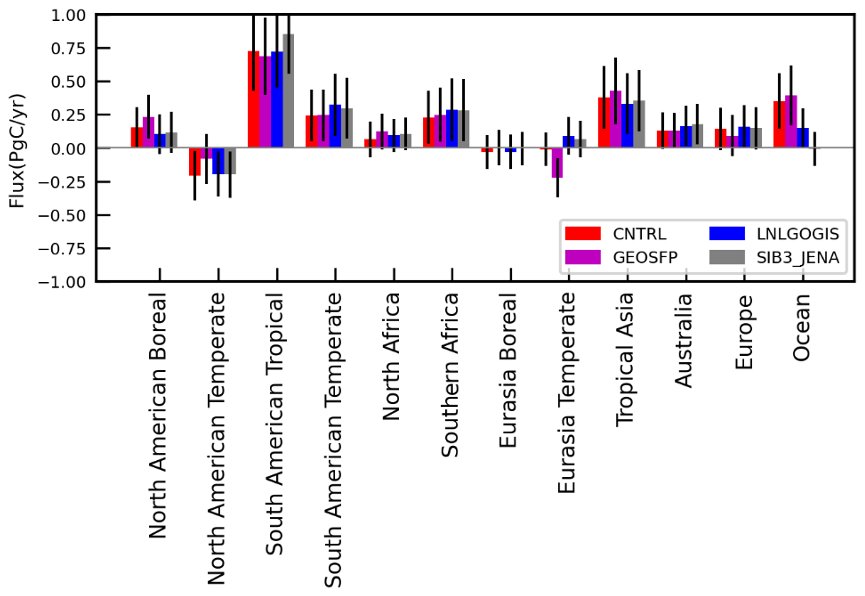
Figure B2Changes in a posteriori net biosphere exchange flux estimates (2023 minus 2022) over the TransCom-3 regions, estimated by four experiments (Table B1). Vertical lines denote a posteriori uncertainties.
Figure B2 shows that the corresponding year-to-year changes in the natural flux changes between 2022 and 2023, associated with our main conclusion, are remarkably similar over almost every TranCom-3 land region. The ocean estimates appear to depend on using the ocean glint measurements. The two inversions that assimilate only OCO-2 land data (CNTRL and GEOSFP) absorbed 0.4–0.45 Pg C yr−1 less carbon between 2022 and 2023, while the two inversions that also use the sun-glint measurements (LNLGOGIS and SIB3-JENA) and use a different ocean a priori show little change in the ocean net flux between the two years.
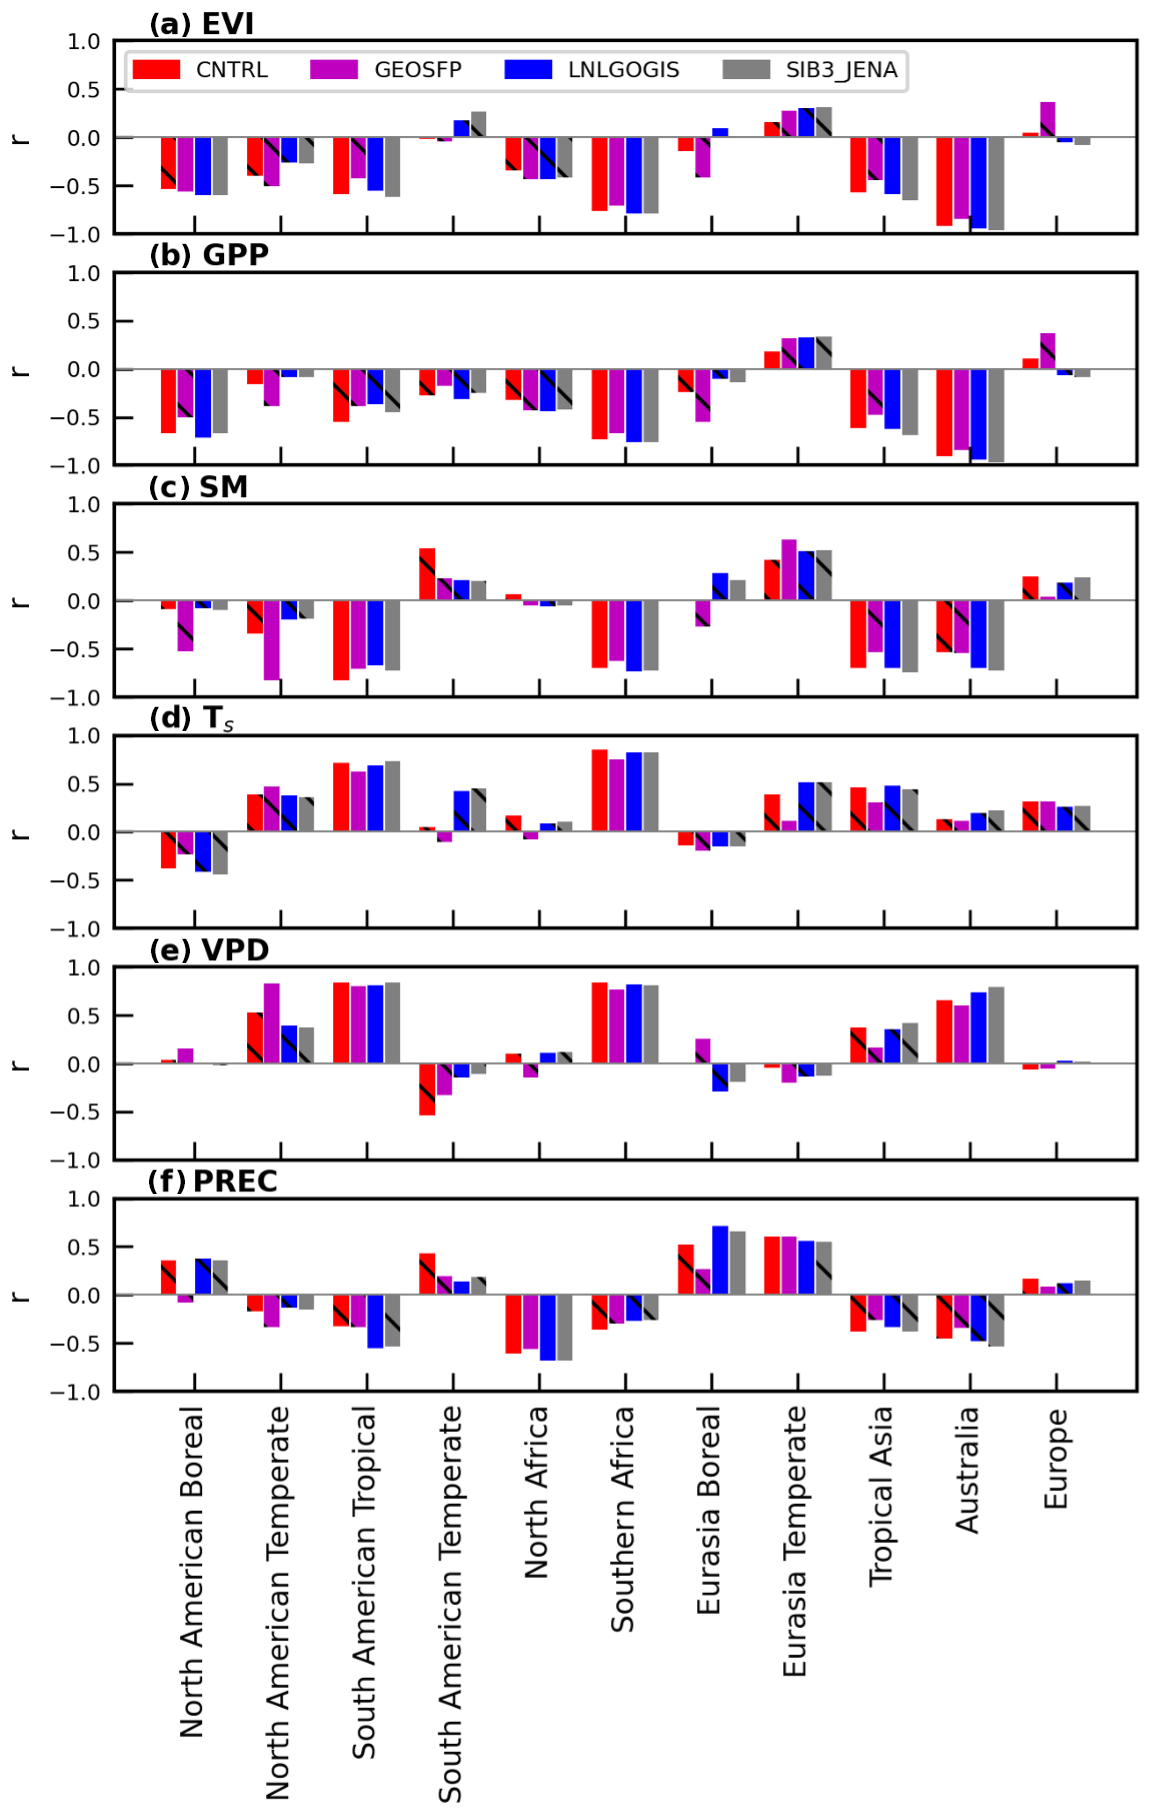
Figure B3Pearson correlation coefficients r between regional a posteriori estimates of net biosphere CO2 exchange anomalies and anomalies of environmental variables, including (a) MODIS EVI, (b) GOSIF GPP, (c) MERRA2 soil moisture, (d) MERRA2 surface temperature, (e) MERRA2 VPD, and (f) MERRA2 precipitation. Correlations with a p value > 0.1 (less significant) are denoted by the black hatching line.
Figure B3 compares the correlations between regional CO2 NBE flux anomalies and anomalies in environment variables between 2014 and 2023. The NBE flux anomalies for tropical South America for our control and the three sensitivity calculations (Table B1) show strong correlations (> 0.5 and a p value < 0.1) with temperature and soil moisture change. The NBE flux anomalies are also strongly correlated with changes in the enhanced vegetation index (EVI) from the NASA MODIS and GOSIF GPP anomalies. NBE flux anomalies for tropical Asia have similarly strong correlations with MODIS EVI, GOSIF GPP, and soil moisture but comparatively lower correlations with surface temperature anomalies. Australian NBE flux anomalies show a strong correlation with EVI, GPP, VPD, and precipitation anomalies, but temperature anomalies are much less important. Generally, we find that all four inversions show consistent results, with differences in correlation coefficient typically within 0.1. A numerical summary of these results is reported in Table B2. Clearly, our focus has been on sub-continental scales, and we acknowledge that this will mask heterogenous responses on smaller scales. These smaller scales are better examined with in situ data.
Table B2As Table A1 but with values reported as a range from the control and the three sensitivity inversions.
A posteriori net biosphere CO2 flux estimates for 2024
We extend our control inversion experiment to the end of 2024. Figure C1 shows the difference of a posteriori NBE CO2 flux estimates between 2024 and our baseline year of 2022 alongside the difference between 2023 and 2022. Figure C2 shows the same data but broken down into TransCom-3 regions. We find that tropical land absorbed less carbon in 2024 than during 2022, primarily over South America, Africa, and (to a lesser extent) Southeast Asia.
Our calculations correspond to a net global annual CO2 emission of 6.84 ± 0.80 Pg C yr−1, equivalent to a global CO2 growth rate of 3.28 ± 0.30 ppm for 2024. During 2023 and 2025, we estimate from the OCO-2 data that atmospheric levels of CO2 increased by 6.36 (3.09 + 3.28) ppm compared to 6.48 (2.76 + +3.72) ppm, inferred from the NOAA surface network.
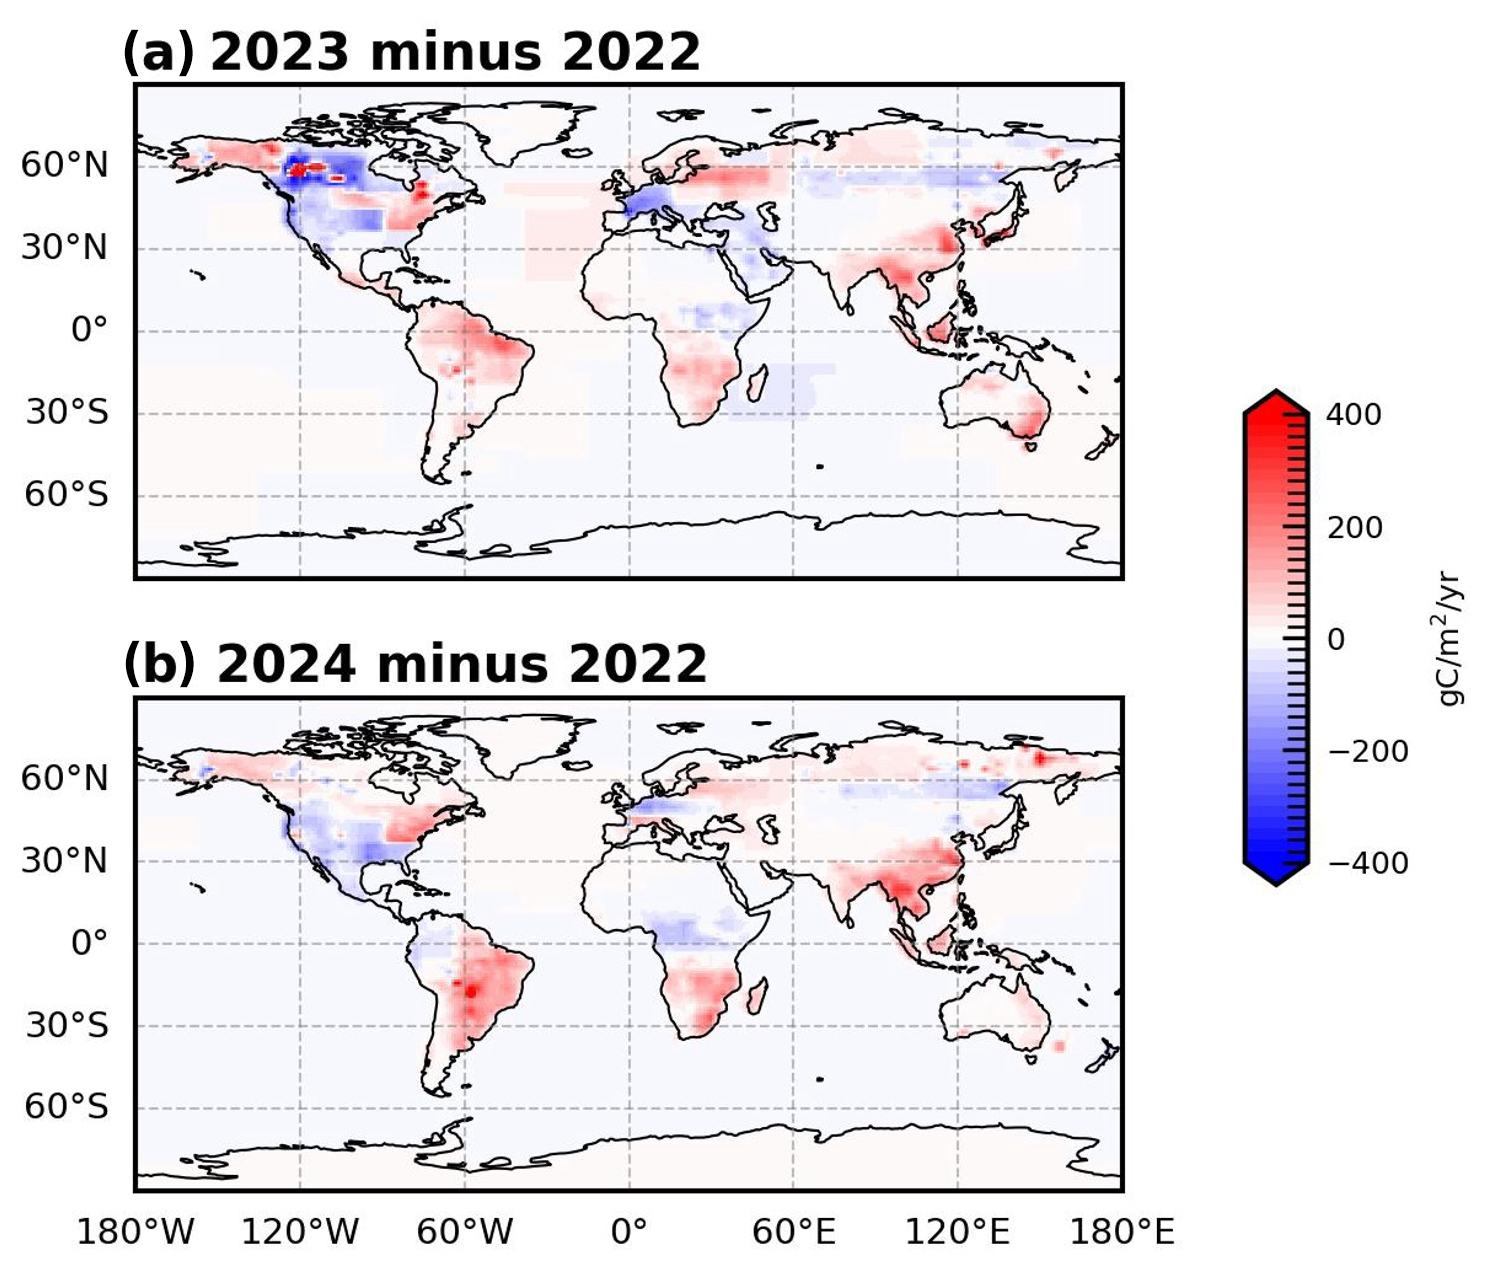
Figure C1Changes in annual mean a posteriori NBE flux estimates from our control inversion between (a) 2022 and 2023 and between (b) 2022 and 2024.
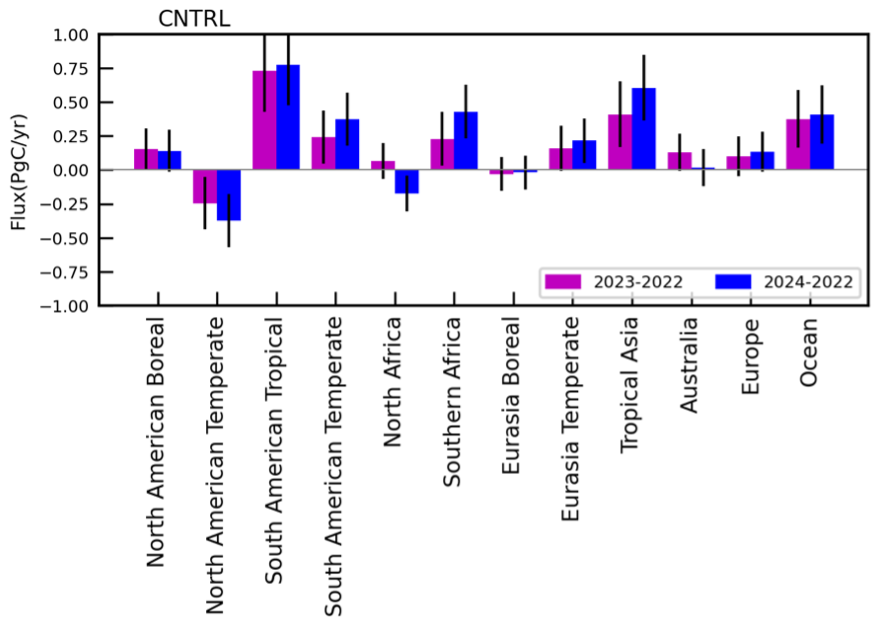
Figure C2Changes in annual mean a posteriori NBE flux estimates from our control inversion between 2022 and 2023 and between 2022 and 2024 for the TransCom-3 regions. Vertical lines denote a posteriori uncertainties.
The community-led GEOS-Chem model of atmospheric chemistry and transport is maintained centrally by Harvard University (https://geoschem.github.io/, last access: 5 May 2025) and is available on request. The ensemble Kalman filter code is publicly available as PyOSSE (https://www.nceo.ac.uk/data-facilities/datasets-tools/?dataset_type=tools, NCEO, last access: 5 May 2025).
The L2 column carbon dioxide data from OCO-2 and OCO-3 are available from the Goddard Earth Sciences Data and Information Services Center (https://doi.org/10.5067/70K2B2W8MNGY, OCO-2/OCO-3 Science Team (2024). The MODIS EVI of version v06.1 is available at https://doi.org/10.5067/MODIS/MYD13A3.061 (Didan, 2021).
LF and PIP designed the research, with contributions from LS. LF prepared the calculations. PIP and LF wrote the paper. JX, PC, AL, OH, RK, SM, SMP, XR, and MS provided the data and the comments on the paper.
The contact author has declared that none of the authors has any competing interests.
Publisher's note: Copernicus Publications remains neutral with regard to jurisdictional claims made in the text, published maps, institutional affiliations, or any other geographical representation in this paper. While Copernicus Publications makes every effort to include appropriate place names, the final responsibility lies with the authors.
We gratefully acknowledge the science teams of the NASA Orbiting Carbon Observatory. We also thank the GEOS-Chem community, particularly the team at Harvard University who helped to maintain the GEOS-Chem model and the NASA Global Modeling and Assimilation Office (GMAO) that provided the MERRA2 data product. Paul I. Palmer would like to acknowledge Chris O'Dell and Tommy Taylor (CSU) for their insights into OCO-2 data processing.
Paul I. Palmer and Liang Feng were supported by the National Centre for Earth Observation (grant no. NE/R016518/1) and the UK Space Agency (grant no. MicroCarb pre-launch science preparation). Jingfeng Xiao was supported by the National Science Foundation (Macrosystem Biology & NEON-Enabled Science program: DEB-2017870) and the Iola Hubbard Climate Change Endowment. Xinrong Ren is funded by the National Institute of Standards and Technology, USA (grant no. 70NANB18H16). ICOS activities at CMN are supported by the JRU-ICOS Italy and by Project ITINERIS – Italian Integrated Environmental Research Infrastructures System (project code IR0000032) within PIANO NAZIONALE DI RIPRESA E RESILIENZA, MISSIONE 4, COMPONENTE 2, INVESTIMENTO 3.1 “Fondo per la realizzazione di un sistema integrato di infrastrutture di ricerca e innovazione”, which also supports Simonetta Montaguti's position. Measurements at Jungfraujoch were supported by ICOS Switzerland (SNF grant no. 20F120_198227).
This paper was edited by Farahnaz Khosrawi and reviewed by two anonymous referees.
Ainsworth, E. A. and Rogers, A.: The response of photosynthesis and stomatal conductance to rising [CO2]: mechanisms and environmental interactions, Plant Cell & Environment, 30, 258–270, https://doi.org/10.1111/j.1365-3040.2007.01641.x, 2007.
Armstrong McKay, D. I., Staal, A., Abrams, J. F., Winkelmann, R., Sakschewski, B., Loriani, S., Fetzer, I., Cornell, S. E., Rockström, J., and Lenton, T. M.: Exceeding 1.5 °C global warming could trigger multiple climate tipping points, Science, 377, eabn7950, https://doi.org/10.1126/science.abn7950, 2022.
Baker, D. F., Law, R. M., Gurney, K. R., Rayner, P., Peylin, P., Denning, A. S., Bousquet, P., Bruhwiler, L., Chen, Y. -H., Ciais, P., Fung, I. Y., Heimann, M., John, J., Maki, T., Maksyutov, S., Masarie, K., Prather, M., Pak, B., Taguchi, S., and Zhu, Z.: TransCom 3 inversion intercomparison: Impact of transport model errors on the interannual variability of regional CO2 fluxes, 1988–2003, Global Biogeochemical Cycles, 20, 2004GB002439, https://doi.org/10.1029/2004GB002439, 2006.
Baker, I. T., Denning, A. S., Prihodko, L., Schaefer, K., Berry, J. A., Collatz, G. J., Suits, N. S., Stocki, R., Philpott, A., and Leonard, O.: SiB3 Modeled Global 1-degree Hourly Biosphere-Atmosphere Carbon Flux, 1998–2006 (Version 1), ORNL Distributed Active Archive Center, https://doi.org/10.3334/ORNLDAAC/909, 2009.
Barlow, J. M., Palmer, P. I., Bruhwiler, L. M., and Tans, P.: Analysis of CO2 mole fraction data: first evidence of large-scale changes in CO2 uptake at high northern latitudes, Atmos. Chem. Phys., 15, 13739–13758, https://doi.org/10.5194/acp-15-13739-2015, 2015.
Basso, L. S., Wilson, C., Chipperfield, M. P., Tejada, G., Cassol, H. L. G., Arai, E., Williams, M., Smallman, T. L., Peters, W., Naus, S., Miller, J. B., and Gloor, M.: Atmospheric CO2 inversion reveals the Amazon as a minor carbon source caused by fire emissions, with forest uptake offsetting about half of these emissions, Atmos. Chem. Phys., 23, 9685–9723, https://doi.org/10.5194/acp-23-9685-2023, 2023.
Bennett, B. F., Salawitch, R. J., McBride, L. A., Hope, A. P., and Tribett, W. R.: Quantification of the Airborne Fraction of Atmospheric CO2 Reveals Stability in Global Carbon Sinks Over the Past Six Decades, J. Geophys. Res.-Biogeosciences, 129, e2023JG007760, https://doi.org/10.1029/2023JG007760, 2024.
Bettadpur, S.: CSR Level-2 Processing Standards Document for Product Release 04, GRACE (Rev. 4.0), Center for Space Research, University of Texas at Austin, 3925 W. Braker Lane, Suite 200 Austin, Texas 78759-5321, USA, https://icgem.gfz-potsdam.de/docs/L2-CSR0005_ProcStd_v4.0.pdf (last access: 10 October 2025), 2012.
Buermann, W., Lintner, B. R., Koven, C. D., Angert, A., Pinzon, J. E., Tucker, C. J., and Fung, I. Y.: The changing carbon cycle at Mauna Loa Observatory, P. Natl. Acad. Sci. USA, 104, 4249–4254, https://doi.org/10.1073/pnas.0611224104, 2007.
Byrne, B., Liu, J., Bowman, K. W., Pascolini-Campbell, M., Chatterjee, A., Pandey, S., Miyazaki, K., Van Der Werf, G. R., Wunch, D., Wennberg, P. O., Roehl, C. M., and Sinha, S.: Carbon emissions from the 2023 Canadian wildfires, Nature, 633, 835–839, https://doi.org/10.1038/s41586-024-07878-z, 2024.
Chatterjee, A., Gierach, M. M., Sutton, A. J., Feely, R. A., Crisp, D., Eldering, A., Gunson, M. R., O'Dell, C. W., Stephens, B. B., and Schimel, D. S.: Influence of El Niño on atmospheric CO2 over the tropical Pacific Ocean: Findings from NASA's OCO-2 mission, Science, 358, eaam5776, https://doi.org/10.1126/science.aam5776, 2017.
Clarke, B., Barnes, C., Rodrigues, R., Zachariah, M., Stewart, S., Raju, E., Baumgart, N., Heinrich, D., Libonati, R., Santos, D., Albuquerque, R., Alves, L. M., Pinto, I., Otto, F., Kimutai, J., Philip, S., Kew, S., and Bazo, J.: Climate change, not El Niño, main driver of extreme drought in highly vulnerable Amazon River Basin, Centre for Environmental Policy, Imperial College, London SW7 1NE, UK, https://doi.org/10.25561/108761, 2024.
Deng, Z., Ciais, P., Hu, L., Martinez, A., Saunois, M., Thompson, R. L., Tibrewal, K., Peters, W., Byrne, B., Grassi, G., Palmer, P. I., Luijkx, I. T., Liu, Z., Liu, J., Fang, X., Wang, T., Tian, H., Tanaka, K., Bastos, A., Sitch, S., Poulter, B., Albergel, C., Tsuruta, A., Maksyutov, S., Janardanan, R., Niwa, Y., Zheng, B., Thanwerdas, J., Belikov, D., Segers, A., and Chevallier, F.: Global greenhouse gas reconciliation 2022, Earth Syst. Sci. Data, 17, 1121–1152, https://doi.org/10.5194/essd-17-1121-2025, 2025.
Didan, K.: MODIS/Aqua Vegetation Indices Monthly L3 Global 1km SIN Grid V061, NASA Land Processes Distributed Active Archive Center [data set], https://doi.org/10.5067/MODIS/MYD13A3.061, 2021.
Fang, Z., Zhang, W., Brandt, M., Abdi, A. M., and Fensholt, R.: Globally Increasing Atmospheric Aridity Over the 21st Century, Earths Future, 10, e2022EF003019, https://doi.org/10.1029/2022EF003019, 2022.
Feng, L., Palmer, P. I., Bösch, H., and Dance, S.: Estimating surface CO2 fluxes from space-borne CO2 dry air mole fraction observations using an ensemble Kalman Filter, Atmos. Chem. Phys., 9, 2619–2633, https://doi.org/10.5194/acp-9-2619-2009, 2009.
Feng, L., Palmer, P. I., Bösch, H., Parker, R. J., Webb, A. J., Correia, C. S. C., Deutscher, N. M., Domingues, L. G., Feist, D. G., Gatti, L. V., Gloor, E., Hase, F., Kivi, R., Liu, Y., Miller, J. B., Morino, I., Sussmann, R., Strong, K., Uchino, O., Wang, J., and Zahn, A.: Consistent regional fluxes of CH4 and CO2 inferred from GOSAT proxy XCH4 : XCO2 retrievals, 2010–2014, Atmos. Chem. Phys., 17, 4781–4797, https://doi.org/10.5194/acp-17-4781-2017, 2017.
Feng, L., Palmer, P. I., Zhu, S., Parker, R. J., and Liu, Y.: Tropical methane emissions explain large fraction of recent changes in global atmospheric methane growth rate, Nature Communications, 13, 1378, https://doi.org/10.1038/s41467-022-28989-z, 2022.
Feng, L., Palmer, P. I., Parker, R. J., Lunt, M. F., and Bösch, H.: Methane emissions are predominantly responsible for record-breaking atmospheric methane growth rates in 2020 and 2021, Atmos. Chem. Phys., 23, 4863–4880, https://doi.org/10.5194/acp-23-4863-2023, 2023.
Flechtner, F.: Gravity Recovery and Climate Experiment AOD1B Product Description Document for Product Releases 01 to 04, GeoForschungszentrum Potsdam, Germany, 2007.
Friedlingstein, P., O'Sullivan, M., Jones, M. W., Andrew, R. M., Bakker, D. C. E., Hauck, J., Landschützer, P., Le Quéré, C., Luijkx, I. T., Peters, G. P., Peters, W., Pongratz, J., Schwingshackl, C., Sitch, S., Canadell, J. G., Ciais, P., Jackson, R. B., Alin, S. R., Anthoni, P., Barbero, L., Bates, N. R., Becker, M., Bellouin, N., Decharme, B., Bopp, L., Brasika, I. B. M., Cadule, P., Chamberlain, M. A., Chandra, N., Chau, T.-T.-T., Chevallier, F., Chini, L. P., Cronin, M., Dou, X., Enyo, K., Evans, W., Falk, S., Feely, R. A., Feng, L., Ford, D. J., Gasser, T., Ghattas, J., Gkritzalis, T., Grassi, G., Gregor, L., Gruber, N., Gürses, Ö., Harris, I., Hefner, M., Heinke, J., Houghton, R. A., Hurtt, G. C., Iida, Y., Ilyina, T., Jacobson, A. R., Jain, A., Jarníková, T., Jersild, A., Jiang, F., Jin, Z., Joos, F., Kato, E., Keeling, R. F., Kennedy, D., Klein Goldewijk, K., Knauer, J., Korsbakken, J. I., Körtzinger, A., Lan, X., Lefèvre, N., Li, H., Liu, J., Liu, Z., Ma, L., Marland, G., Mayot, N., McGuire, P. C., McKinley, G. A., Meyer, G., Morgan, E. J., Munro, D. R., Nakaoka, S.-I., Niwa, Y., O'Brien, K. M., Olsen, A., Omar, A. M., Ono, T., Paulsen, M., Pierrot, D., Pocock, K., Poulter, B., Powis, C. M., Rehder, G., Resplandy, L., Robertson, E., Rödenbeck, C., Rosan, T. M., Schwinger, J., Séférian, R., Smallman, T. L., Smith, S. M., Sospedra-Alfonso, R., Sun, Q., Sutton, A. J., Sweeney, C., Takao, S., Tans, P. P., Tian, H., Tilbrook, B., Tsujino, H., Tubiello, F., van der Werf, G. R., van Ooijen, E., Wanninkhof, R., Watanabe, M., Wimart-Rousseau, C., Yang, D., Yang, X., Yuan, W., Yue, X., Zaehle, S., Zeng, J., and Zheng, B.: Global Carbon Budget 2023, Earth Syst. Sci. Data, 15, 5301–5369, https://doi.org/10.5194/essd-15-5301-2023, 2023.
Friedlingstein, P., O'Sullivan, M., Jones, M. W., Andrew, R. M., Hauck, J., Landschützer, P., Le Quéré, C., Li, H., Luijkx, I. T., Olsen, A., Peters, G. P., Peters, W., Pongratz, J., Schwingshackl, C., Sitch, S., Canadell, J. G., Ciais, P., Jackson, R. B., Alin, S. R., Arneth, A., Arora, V., Bates, N. R., Becker, M., Bellouin, N., Berghoff, C. F., Bittig, H. C., Bopp, L., Cadule, P., Campbell, K., Chamberlain, M. A., Chandra, N., Chevallier, F., Chini, L. P., Colligan, T., Decayeux, J., Djeutchouang, L. M., Dou, X., Duran Rojas, C., Enyo, K., Evans, W., Fay, A. R., Feely, R. A., Ford, D. J., Foster, A., Gasser, T., Gehlen, M., Gkritzalis, T., Grassi, G., Gregor, L., Gruber, N., Gürses, Ö., Harris, I., Hefner, M., Heinke, J., Hurtt, G. C., Iida, Y., Ilyina, T., Jacobson, A. R., Jain, A. K., Jarníková, T., Jersild, A., Jiang, F., Jin, Z., Kato, E., Keeling, R. F., Klein Goldewijk, K., Knauer, J., Korsbakken, J. I., Lan, X., Lauvset, S. K., Lefèvre, N., Liu, Z., Liu, J., Ma, L., Maksyutov, S., Marland, G., Mayot, N., McGuire, P. C., Metzl, N., Monacci, N. M., Morgan, E. J., Nakaoka, S.-I., Neill, C., Niwa, Y., Nützel, T., Olivier, L., Ono, T., Palmer, P. I., Pierrot, D., Qin, Z., Resplandy, L., Roobaert, A., Rosan, T. M., Rödenbeck, C., Schwinger, J., Smallman, T. L., Smith, S. M., Sospedra-Alfonso, R., Steinhoff, T., Sun, Q., Sutton, A. J., Séférian, R., Takao, S., Tatebe, H., Tian, H., Tilbrook, B., Torres, O., Tourigny, E., Tsujino, H., Tubiello, F., van der Werf, G., Wanninkhof, R., Wang, X., Yang, D., Yang, X., Yu, Z., Yuan, W., Yue, X., Zaehle, S., Zeng, N., and Zeng, J.: Global Carbon Budget 2024, Earth Syst. Sci. Data, 17, 965–1039, https://doi.org/10.5194/essd-17-965-2025, 2025.
Graven, H. D., Keeling, R. F., Piper, S. C., Patra, P. K., Stephens, B. B., Wofsy, S. C., Welp, L. R., Sweeney, C., Tans, P. P., Kelley, J. J., Daube, B. C., Kort, E. A., Santoni, G. W., and Bent, J. D.: Enhanced Seasonal Exchange of CO2 by Northern Ecosystems Since 1960, Science, 341, 1085–1089, https://doi.org/10.1126/science.1239207, 2013.
Gui, Y., Wang, K., Jin, Z., Wang, H., Deng, H., Li, X., Tian, X., Wang, T., Chen, W., Wang, T., and Piao, S.: The decline in tropical land carbon sink drove high atmospheric CO2 growth rate in 2023, National Science Review, 11, nwae365, https://doi.org/10.1093/nsr/nwae365, 2024.
Gurney, K. R., Law, R. M., Denning, A. S., Rayner, P. J., Baker, D., Bousquet, P., Bruhwiler, L., Chen, Y.-H., Ciais, P., Fan, S., Fung, I. Y., Gloor, M., Heimann, M., Higuchi, K., John, J., Maki, T., Maksyutov, S., Masarie, K., Peylin, P., Prather, M., Pak, B. C., Randerson, J., Sarmiento, J., Taguchi, S., Takahashi, T., and Yuen, C.-W.: Towards robust regional estimates of CO2 sources and sinks using atmospheric transport models, Nature, 415, 626–630, https://doi.org/10.1038/415626a, 2002.
Gurney, K. R., Law, R. M., Denning, A. S., Rayner, P. J., Pak, B. C., Baker, D., Bousquet, P., Bruhwiler, L., Chen, Y.-H., Ciais, P., and others: Transcom 3 inversion intercomparison: Model mean results for the estimation of seasonal carbon sources and sinks, Global Biogeochemical Cycles, 18, GB1010, https://doi.org/10.1029/2003GB002111, 2004.
Hugelius, G., Ramage, J., Burke, E., Chatterjee, A., Smallman, T. L., Aalto, T., Bastos, A., Biasi, C., Canadell, J. G., Chandra, N., Chevallier, F., Ciais, P., Chang, J., Feng, L., Jones, M. W., Kleinen, T., Kuhn, M., Lauerwald, R., Liu, J., López-Blanco, E., Luijkx, I. T., Marushchak, M. E., Natali, S. M., Niwa, Y., Olefeldt, D., Palmer, P. I., Patra, P. K., Peters, W., Potter, S., Poulter, B., Rogers, B. M., Riley, W. J., Saunois, M., Schuur, E. A. G., Thompson, R. L., Treat, C., Tsuruta, A., Turetsky, M. R., Virkkala, A. -M., Voigt, C., Watts, J., Zhu, Q., and Zheng, B.: Permafrost Region Greenhouse Gas Budgets Suggest a Weak CO2 Sink and CH4 and N2 O Sources, But Magnitudes Differ Between Top-Down and Bottom-Up Methods, Global Biogeochemical Cycles, 38, e2023GB007969, https://doi.org/10.1029/2023GB007969, 2024.
ICOS RI, Apadula, F., Biermann, T., Colomb, A., Conil, S., Couret, C., Cristofanelli, P., De Mazière, M., Delmotte, M., Di Lorio, T., Emmenegger, L., Forster, G., Frumau, A., Haszpra, L., Hatakka, J., Heliasz, M., Hensen, A., Hermansen, O., Hoheisel, A., Kneuer, T., Komínková, K., Kubistin, D., Larmanou, E., Laurent, O., Laurila, T., Lehner, I., Lehtinen, K., Leskinen, A., Leuenberger, M., Lindauer, M., Lopez, M., Lund Myhre, C., Lunder, C., Mammarella, I., Manca, G., Manning, A., Marek, M. V., Marklund, P., Meinhardt, F., Molnár, M., Müller-Williams, J., O'Doherty, S., Piacentino, S., Pichon, J.-M., Pitt, J., Platt, S. M., Plaß-Dülmer, C., Ramonet, M., Rivas-Soriano, P., Roulet, Y.-A., Scheeren, B., Schmidt, M., Sferlazzo, D., Sha, M. K., Stanley, K., Steinbacher, M., Sørensen, L. L., Trisolino, P., Vítková, G., Yver-Kwok, C., Zazzeri, G., di Sarra, A., ICOS ATC-Laboratoires des Sciences du Climat et de L'Environnement (LSCE), France, and ICOS Flask And Calibration Laboratory (FCL), Germany: ICOS Atmosphere 2024.3 FastTrack release of Level 1.5 Greenhouse Gas Mole Fractions of CO2, CH4, N2O, CO and meteorology, ICOS ERIC – Carbon Portal, https://doi.org/10.18160/S9BD-H5YY, 9 October 2024.
Jiménez-Muñoz, J. C., Mattar, C., Barichivich, J., Santamaría-Artigas, A., Takahashi, K., Malhi, Y., Sobrino, J. A., and Schrier, G. V. D.: Record-breaking warming and extreme drought in the Amazon rainforest during the course of El Niño 2015–2016, Sci. Rep.-UK, 6, 33130, https://doi.org/10.1038/srep33130, 2016.
Ke, P., Ciais, P., Sitch, S., Li, W., Bastos, A., Liu, Z., Xu, Y., Gui, X., Bian, J., Goll, D. S., Xi, Y., Li, W., O'Sullivan, M., Goncalves De Souza, J., Friedlingstein, P., and Chevallier, F.: Low latency carbon budget analysis reveals a large decline of the land carbon sink in 2023, National Science Review, 11, nwae367, https://doi.org/10.1093/nsr/nwae367, 2024.
Keeling, C. D.: The Concentration and Isotopic Abundances of Carbon Dioxide in the Atmosphere, Tellus, 12, 200–203, https://doi.org/10.1111/j.2153-3490.1960.tb01300.x, 1960.
Keeling, C. D., Bacastow, R. B., Bainbridge, A. E., Ekdahl, C. A., Guenther, P. R., Waterman, L. S., and Chin, J. F. S.: Atmospheric carbon dioxide variations at Mauna Loa Observatory, Hawaii, Tellus A: Dynamic Meteorology and Oceanography, 28, 538, https://doi.org/10.3402/tellusa.v28i6.11322, 1976.
Keeling, C. D., Chin, J. F. S., and Whorf, T. P.: Increased activity of northern vegetation inferred from atmospheric CO2 measurements, Nature, 382, 146–149, https://doi.org/10.1038/382146a0, 1996.
Kondo, M., Patra, P. K., Sitch, S., Friedlingstein, P., Poulter, B., Chevallier, F., Ciais, P., Canadell, J. G., Bastos, A., Lauerwald, R., Calle, L., Ichii, K., Anthoni, P., Arneth, A., Haverd, V., Jain, A. K., Kato, E., Kautz, M., Law, R. M., Lienert, S., Lombardozzi, D., Maki, T., Nakamura, T., Peylin, P., Rödenbeck, C., Zhuravlev, R., Saeki, T., Tian, H., Zhu, D., and Ziehn, T.: State of the science in reconciling top-down and bottom-up approaches for terrestrial CO2 budget, Global Change Biology, 26, 1068–1084, https://doi.org/10.1111/gcb.14917, 2020.
Li, X. and Xiao, J.: Mapping Photosynthesis Solely from Solar-Induced Chlorophyll Fluorescence: A Global, Fine-Resolution Dataset of Gross Primary Production Derived from OCO-2, Remote Sensing-Basel, 11, 2563, https://doi.org/10.3390/rs11212563, 2019.
Liu, J., Bowman, K. W., Schimel, D. S., Parazoo, N. C., Jiang, Z., Lee, M., Bloom, A. A., Wunch, D., Frankenberg, C., Sun, Y., O'Dell, C. W., Gurney, K. R., Menemenlis, D., Gierach, M., Crisp, D., and Eldering, A.: Contrasting carbon cycle responses of the tropical continents to the 2015-2016 El Niño, Science, 358, https://doi.org/10.1126/science.aam5690, 2017.
Liu, J., Bowman, K., Palmer, P. I., Joiner, J., Levine, P., Bloom, A. A., Feng, L., Saatchi, S., Keller, M., Longo, M., Schimel, D., and Wennberg, P. O.: Enhanced Carbon Flux Response to Atmospheric Aridity and Water Storage Deficit During the 2015–2016 El Niño Compromised Carbon Balance Recovery in Tropical South America, AGU Advances, 5, e2024AV001187, https://doi.org/10.1029/2024AV001187, 2024.
Nassar, R., Jones, D. B. A., Suntharalingam, P., Chen, J. M., Andres, R. J., Wecht, K. J., Yantosca, R. M., Kulawik, S. S., Bowman, K. W., Worden, J. R., Machida, T., and Matsueda, H.: Modeling global atmospheric CO2 with improved emission inventories and CO2 production from the oxidation of other carbon species, Geosci. Model Dev., 3, 689–716, https://doi.org/10.5194/gmd-3-689-2010, 2010.
OCO-2/OCO-3 Science Team, Payne, V. and Chatterjee, A.: OCO-2 Level 2 bias-corrected XCO2 and other select fields from the full-physics retrieval aggregated as daily files, Retrospective processing V11.2r, Greenbelt, MD, USA, Goddard Earth Sciences Data and Information Services Center (GES DISC) [data set], https://doi.org/10.5067/70K2B2W8MNGY, 2024.
Oda, T. and Maksyutov, S.: ODIAC Fossil Fuel CO2 Emissions Dataset (Version name: ODIAC2020b), National Institute for Environmental Studies (NIES) 16-2 Onogawa, Tsukuba-shi, Ibaraki 305-8506, Japan, https://doi.org/10.17595/20170411.001, 2021.
Oda, T., Maksyutov, S., and Andres, R. J.: The Open-source Data Inventory for Anthropogenic CO2, version 2016 (ODIAC2016): a global monthly fossil fuel CO2 gridded emissions data product for tracer transport simulations and surface flux inversions, Earth Syst. Sci. Data, 10, 87–107, https://doi.org/10.5194/essd-10-87-2018, 2018.
Oda, T., Feng, L., Palmer, P. I., Baker, D. F., and Ott, L. E.: Assumptions about prior fossil fuel inventories impact our ability to estimate posterior net CO2 fluxes that are needed for verifying national inventories, Environ. Res. Lett., 18, 124030, https://doi.org/10.1088/1748-9326/ad059b, 2023.
Olsen, S. C. and Randerson, J. T.: Differences between surface and column atmospheric CO2 and implications for carbon cycle research, J. Geophys. Res., 109, 2003JD003968, https://doi.org/10.1029/2003JD003968, 2004.
O'Sullivan, M., Sitch, S., Friedlingstein, P., Luijkx, I. T., Peters, W., Rosan, T. M., Arneth, A., Arora, V. K., Chandra, N., Chevallier, F., Ciais, P., Falk, S., Feng, L., Gasser, T., Houghton, R. A., Jain, A. K., Kato, E., Kennedy, D., Knauer, J., McGrath, M. J., Niwa, Y., Palmer, P. I., Patra, P. K., Pongratz, J., Poulter, B., Rödenbeck, C., Schwingshackl, C., Sun, Q., Tian, H., Walker, A. P., Yang, D., Yuan, W., Yue, X., and Zaehle, S.: The key role of forest disturbance in reconciling estimates of the northern carbon sink, Commun. Earth Environ., 5, 705, https://doi.org/10.1038/s43247-024-01827-4, 2024.
Page, S. E., Siegert, F., Rieley, J. O., Boehm, H.-D. V., Jaya, A., and Limin, S.: The amount of carbon released from peat and forest fires in Indonesia during 1997, Nature, 420, 61–65, https://doi.org/10.1038/nature01131, 2002.
Palmer, P. I., Feng, L., Baker, D., Chevallier, F., Bösch, H., and Somkuti, P.: Net carbon emissions from African biosphere dominate pan-tropical atmospheric CO2 signal, Nature Communications, 10, 3344–3344, https://doi.org/10.1038/s41467-019-11097-w, 2019.
Pandey, S., Miller, J. B., Basu, S., Liu, J., Weir, B., Byrne, B., Chevallier, F., Bowman, K. W., Liu, Z., Deng, F., O'Dell, C. W., and Chatterjee, A.: Toward Low-Latency Estimation of Atmospheric CO2 Growth Rates Using Satellite Observations: Evaluating Sampling Errors of Satellite and In Situ Observing Approaches, AGU Advances, 5, https://doi.org/10.1029/2023av001145, 2024.
Patra, P. K., Crisp, D., Kaiser, J. W., Wunch, D., Saeki, T., Ichii, K., Sekiya, T., Wennberg, P. O., Feist, D. G., Pollard, D. F., Griffith, D. W. T., Velazco, V. A., De Maziere, M., Sha, M. K., Roehl, C., Chatterjee, A., and Ishijima, K.: The Orbiting Carbon Observatory (OCO-2) tracks 2–3 peta-gram increase in carbon release to the atmosphere during the 2014–2016 El Niño, Sci. Rep.-UK, 7, 13567, https://doi.org/10.1038/s41598-017-13459-0, 2017.
Prestes, N. C. C. S., Marimon, B. S., Morandi, P. S., Reis, S. M., Junior, B. H. M., Cruz, W. J. A., Oliveira, E. A., Mariano, L. H., Elias, F., Santos, D. M., Esquivel-Muelbert, A., and Phillips, O. L.: Impact of the extreme 2015-16 El Niño climate event on forest and savanna tree species of the Amazonia-Cerrado transition, Flora, 319, 152597, https://doi.org/10.1016/j.flora.2024.152597, 2024.
Randerson, J. T., Van der Werf, G. R., Giglio, L., Collatz, G. J., and Kasibhatla, P. S.: Global Fire Emissions Database, Version 4.1 (GFEDv4), ORNL Distributed Active Archive Center, https://doi.org/10.3334/ORNLDAAC/1293, 2017.
Rödenbeck, C., DeVries, T., Hauck, J., Le Quéré, C., and Keeling, R. F.: Data-based estimates of interannual sea–air CO2 flux variations 1957–2020 and their relation to environmental drivers, Biogeosciences, 19, 2627–2652, https://doi.org/10.5194/bg-19-2627-2022, 2022.
Schuh, A. E., Jacobson, A. R., Basu, S., Weir, B., Baker, D., Bowman, K., Chevallier, F., Crowell, S., Davis, K. J., Deng, F., Denning, S., Feng, L., Jones, D., Liu, J., and Palmer, P. I.: Quantifying the Impact of Atmospheric Transport Uncertainty on CO2 Surface Flux Estimates, Global Biogeochemical Cycles, 33, 484–500, https://doi.org/10.1029/2018GB006086, 2019.
Schuldt, K. N., Mund, J., Aalto, T., Abshire, J. B., Aikin, K., Allen, G., Andrade, M., Andrews, A., Apadula, F., Arnold, S., Baier, B., Bakwin, P., Bartyzel, J., Bentz, G., Bergamaschi, P., Beyersdorf, A., Biermann, T., Biraud, S. C., Blanc, P.-E., Boenisch, H., Bowling, D., Brailsford, G., Brand, W. A., Brunner, D., Bui, T. P., Burban, B., Bäni, L., Calzolari, F., Chang, C. S., Chen, H., Chen, G., Chmura, L., Clark, S., Climadat, S., Colomb, A., Commane, R., Condori, L., Conen, F., Conil, S., Couret, C., Cristofanelli, P., Cuevas, E., Curcoll, R., Daube, B., Davis, K. J., De Mazière, M., De Wekker, S., Dean-Day, J. M., Coletta, J. D., Delmotte, M., Di Iorio, T., DiGangi, E., DiGangi, J. P., Dickerson, R., Elsasser, M., Emmenegger, L., Fang, S., Forster, G., France, J., Frumau, A., Fuente-Lastra, M., Galkowski, M., Gatti, L. V., Gehrlein, T., Gerbig, C., Gheusi, F., Gloor, E., Goto, D., Griffis, T., Hammer, S., Hanisco, T. F., Hanson, C., Haszpra, L., Hatakka, J., Heimann, M., Heliasz, M., Heltai, D., Henne, S., Hensen, A., Hermans, C., Hermansen, O., Hintsa, E., Hoheisel, A., Holst, J., Iraci, L. T., Ivakhov, V., Jaffe, D. A., Jordan, A., Joubert, W., Kang, H.-Y., Karion, A., Kawa, S. R., Kazan, V., Keeling, R. F., Keronen, P., Kim, J., Klausen, J., Kneuer, T., Ko, M.-Y., Kolari, P., Kominkova, K., Kort, E., Kozlova, E., Krummel, P. B., Kubistin, D., Kulawik, S. S., Kumps, N., Labuschagne, C., Lam, D. H., Lan, X., Langenfelds, R. L., Lanza, A., Laurent, O., Laurila, T., Lauvaux, T., Lavric, J., Law, B. E., Lee, C.-H., Lee, J., Lehner, I., Lehtinen, K., Leppert, R., Leskinen, A., Leuenberger, M., Leung, W. H., Levin, I., Levula, J., Lin, J., Lindauer, M., Lindroth, A., Loh, Z. M., Lopez, M., Lunder, C. R., Löfvenius, M. O., Machida, T., Mammarella, I., Manca, G., Manning, A., Manning, A., Marek, M. V., Marklund, P., Marrero, J. E., Martin, M. Y., Martin, D., Martins, G. A., Matsueda, H., McKain, K., Meijer, H., Meinhardt, F., Merchant, L., Metzger, J.-M., Mihalopoulos, N., Miles, N. L., Miller, C. E., Miller, J. B., Mitchell, L., Monteiro, V., Montzka, S., Moossen, H., Moreno, C., Morgan, E., Morgui, J.-A., Morimoto, S., Munger, J. W., Munro, D., Mutuku, M., Myhre, C. L., Mölder, M., Müller-Williams, J., Nakaoka, S.-I., Necki, J., Newman, S., Nichol, S., Nisbet, E., Niwa, Y., Njiru, D. M., Noe, S. M., Nojiri, Y., O'Doherty, S., Obersteiner, F., Paplawsky, B., Parworth, C. L., Peischl, J., Peltola, O., Peters, W., Philippon, C., Piacentino, S., Pichon, J. M., Pickers, P., Piper, S., Pitt, J., Plass-Dülmer, C., Platt, S. M., Prinzivalli, S., Ramonet, M., Ramos, R., Ren, X., Reyes-Sanchez, E., Richardson, S. J., Rigouleau, L.-J., Riris, H., Rivas, P. P., Rothe, M., Roulet, Y.-A., Ryerson, T., Ryoo, J.-M., Sargent, M., Sasakawa, M., Schaefer, H., Scheeren, B., Schmidt, M., Schuck, T., Schumacher, M., Seibel, J., Seifert, T., Sha, M. K., Shepson, P., Shin, D., Shook, M., Sloop, C. D., Smale, D., Smith, P. D., Spain, G., St. Clair, J. M., Steger, D., Steinbacher, M., Stephens, B., Sweeney, C., Sørensen, L. L., Taipale, R., Takatsuji, S., Tans, P., Thoning, K., Timas, H., Torn, M., Trisolino, P., Turnbull, J., Vermeulen, A., Viner, B., Vitkova, G., Walker, S., Watson, A., Weiss, R., Weyrauch, D., Wofsy, S. C., Worsey, J., Worthy, D., Xueref-Remy, I., Yates, E. L., Young, D., Yver-Kwok, C., Zaehle, S., Zahn, A., Zellweger, C., Zimnoch, M., de Souza, R. A., di Sarra, A. G., van Dinther, D., and van den Bulk, P.: Multi-laboratory compilation of atmospheric carbon dioxide data for the period 1957-2023, obspack_co2_1_test_GLOBALVIEWplus_v10.1_2024-11-13, NOAA Earth System Research Laboratory, Global Monitoring Laboratory, https://doi.org/10.25925/20241101, 2024.
Sitch, S., O'Sullivan, M., Robertson, E., Friedlingstein, P., Albergel, C., Anthoni, P., Arneth, A., Arora, V. K., Bastos, A., Bastrikov, V., Bellouin, N., Canadell, J. G., Chini, L., Ciais, P., Falk, S., Harris, I., Hurtt, G., Ito, A., Jain, A. K., Jones, M. W., Joos, F., Kato, E., Kennedy, D., Klein Goldewijk, K., Kluzek, E., Knauer, J., Lawrence, P. J., Lombardozzi, D., Melton, J. R., Nabel, J. E. M. S., Pan, N., Peylin, P., Pongratz, J., Poulter, B., Rosan, T. M., Sun, Q., Tian, H., Walker, A. P., Weber, U., Yuan, W., Yue, X., and Zaehle, S.: Trends and Drivers of Terrestrial Sources and Sinks of Carbon Dioxide: An Overview of the TRENDY Project, Global Biogeochemical Cycles, 38, https://doi.org/10.1029/2024gb008102, 2024.
Takahashi, T., Sutherland, S. C., Wanninkhof, R., Sweeney, C., Feely, R. A., Chipman, D. W., Hales, B., Friederich, G., Chavez, F., Sabine, C., Watson, A., Bakker, D. C. E., Schuster, U., Metzl, N., Yoshikawa-Inoue, H., Ishii, M., Midorikawa, T., Nojiri, Y., Körtzinger, A., Steinhoff, T., Hoppema, M., Olafsson, J., Arnarson, T. S., Tilbrook, B., Johannessen, T., Olsen, A., Bellerby, R., Wong, C. S., Delille, B., Bates, N. R., and de Baar, H. J. W.: Climatological mean and decadal change in surface ocean pCO2, and net sea-air CO2 flux over the global oceans, Deep-Sea Research Part II: Topical Studies in Oceanography, 56, https://doi.org/10.1016/j.dsr2.2008.12.009, 2009.
Tans, P. P., Fung, I. Y., and Takahashi, T.: Observational Constraints on the Global Atmospheric CO2 Budget, Science, 247, 1431–1438, https://doi.org/10.1126/science.247.4949.1431, 1990.
Tapley, B. D., Bettadpur, S., Watkins, M., and Reigber, C.: The Gravity Recovery And Climate Experiment: Mission overview and early results, Geophysical Research Letters, 31, https://doi.org/10.1029/2004GL019920, 2004.
Taylor, T. E., O'Dell, C. W., Baker, D., Bruegge, C., Chang, A., Chapsky, L., Chatterjee, A., Cheng, C., Chevallier, F., Crisp, D., Dang, L., Drouin, B., Eldering, A., Feng, L., Fisher, B., Fu, D., Gunson, M., Haemmerle, V., Keller, G. R., Kiel, M., Kuai, L., Kurosu, T., Lambert, A., Laughner, J., Lee, R., Liu, J., Mandrake, L., Marchetti, Y., McGarragh, G., Merrelli, A., Nelson, R. R., Osterman, G., Oyafuso, F., Palmer, P. I., Payne, V. H., Rosenberg, R., Somkuti, P., Spiers, G., To, C., Weir, B., Wennberg, P. O., Yu, S., and Zong, J.: Evaluating the consistency between OCO-2 and OCO-3 XCO2 estimates derived from the NASA ACOS version 10 retrieval algorithm, Atmos. Meas. Tech., 16, 3173–3209, https://doi.org/10.5194/amt-16-3173-2023, 2023.
Wang, J., Feng, L., Palmer, P. I., Liu, Y., Fang, S., Bösch, H., O'Dell, C. W., Tang, X., Yang, D., Liu, L., and Xia, C.: Large Chinese land carbon sink estimated from atmospheric carbon dioxide data, Nature, 586, 720–723, https://doi.org/10.1038/s41586-020-2849-9, 2020.
Wunch, D., Toon, G. C., Blavier, J.-F. L., Washenfelder, R. A., Notholt, J., Connor, B. J., Griffith, D. W. T., Sherlock, V., and Wennberg, P. O.: The Total Carbon Column Observing Network, Philos. T. R. Soc. A, 369, 2087–2112, https://doi.org/10.1098/rsta.2010.0240, 2011.