the Creative Commons Attribution 4.0 License.
the Creative Commons Attribution 4.0 License.
 | 08 Oct 2025
Modulation of tropical stratospheric gravity wave activity and the ITCZ position by modes of climate variability using radio occultation and reanalysis data
Toyese Tunde Ayorinde
Cristiano Max Wrasse
Hisao Takahashi
Luiz Fernando Sapucci
Mohamadou A. Diallo
Cosme Alexandre Oliveira Barros Figueiredo
Diego Barros
Ligia Alves da Silva
Patrick Essien
Anderson Vestena Bilibio
The Intertropical Convergence Zone (ITCZ) is a dominant feature of tropical climate characterized by intense convection that influences global atmospheric circulation and serves as a primary source of stratospheric gravity waves (GWs), which transport energy and momentum vertically through the atmosphere. This study investigates the modulation of the tropical ITCZ position and stratospheric gravity wave activity by the El Niño–Southern Oscillation (ENSO), the Madden–Julian Oscillation (MJO), and the Quasi-Biennial Oscillation (QBO) using 11 years (2011–2021) of radio occultation and reanalysis data. ITCZ latitude (from 850 hPa refractivity) and gravity wave potential energy maxima (from stratospheric temperatures) were identified via Gaussian fitting. Both ITCZ and gravity wave potential energy maxima exhibit coherent seasonal migration (∼10 and ∼5° latitudinal shifts, respectively), with potential energy maxima typically equatorward of the ITCZ. ENSO is the primary modulator: El Niño conditions shift the ITCZ northward in the American sector but southward in the African and Asian sectors. For gravity wave potential energy maxima, El Niño induces southward shifts in the American sector but northward shifts in the Asian sector, while enhancing overall GW activity. The MJO prompts regionally complex southward shifts in the ITCZ/potential energy maxima. The QBO predominantly influences gravity wave potential energy, with westerly phases associated with southward shifts in the potential energy maxima in the African and Asian sectors. While long-term latitudinal trends are weak, climate modes significantly impact ITCZ/GW peak values. The radio occultation data captured finer-scale features than reanalysis products, highlighting the importance of observational constraints in understanding troposphere–stratosphere coupling mechanisms.
- Article
(11602 KB) - Full-text XML
- BibTeX
- EndNote


The tropical atmosphere is characterized by complex interactions between convective processes, large-scale circulation patterns, and wave dynamics that collectively influence global weather and climate. At the heart of this system lies the Intertropical Convergence Zone (ITCZ), a narrow band of intense convection and precipitation that forms where the northeast and southeast trade winds converge near the Equator (Schneider et al., 2014). The ITCZ not only serves as a key component of the global circulation system but also acts as a significant source of atmospheric gravity waves (GWs) that transport energy and momentum vertically through the atmosphere (Pfister et al., 1993; Pfenninger et al., 1999; Alexander et al., 2004; Dias and Pauluis, 2009; Kerns and Chen, 2018).
GWs are small-scale atmospheric oscillations that play a crucial role in connecting different atmospheric layers (Fritts and Alexander, 2003; Alexander et al., 2010). In the tropics, these waves, mainly generated by deep convection and flow over topography (Alexander and Vincent, 2000; Alexander et al., 2000; Smith et al., 2020), propagate into the stratosphere and beyond, influencing circulation patterns such as the Brewer–Dobson circulation and the Quasi-Biennial Oscillation (QBO) (Baldwin et al., 2001; Ern et al., 2014). The potential energy (Ep) of these waves serves as a valuable proxy for GW activity (Tsuda et al., 2000; Ayorinde et al., 2023).
Three major modes of climate variability significantly influence the tropical atmosphere: the Madden–Julian Oscillation (MJO), the El Niño–Southern Oscillation (ENSO), and the QBO. These modes modulate both the position and intensity of the ITCZ (Münnich and Neelin, 2005; Kerns and Chen, 2018; Jin et al., 2023; Adam et al., 2016; Mamalakis et al., 2021) and affect the generation and propagation of stratospheric GWs through various mechanisms. Characterized by eastward-propagating convective anomalies with a 30–90 d periodicity, the MJO can enhance GW activity through increased convection (Zhang, 2005; Alexander et al., 2018; Wei et al., 2024; Moss et al., 2016; Kang et al., 2020). ENSO alters the Walker circulation (an east–west atmospheric circulation along the Equator, with rising air over the warm western Pacific and sinking air over the cooler eastern Pacific) and shifts the regions of maximum convection in the tropical Pacific (Wang et al., 2016), affecting GW generation and propagation through changes in background winds and temperatures (Konopka et al., 2016; Diallo et al., 2019; Geller et al., 2016; Yang et al., 2020). With its alternating easterly and westerly wind regimes in the equatorial stratosphere, the QBO directly influences the vertical propagation of GWs through critical-level filtering and wave–mean flow interactions (Diallo et al., 2019, 2021; Ern et al., 2014; Alexander et al., 2018). Recent research has also revealed a relationship between the QBO and MJO amplitude during boreal winter (Klotzbach et al., 2019), further highlighting the interconnected nature of these climate modes.
The ITCZ position varies seasonally, typically following the region of maximum solar heating with a delay of 1–2 months, moving north during boreal summer and south during boreal winter (Waliser and Gautier, 1993; Bain et al., 2011). Several methods have been developed to identify and track the ITCZ, including those based on precipitation maxima (Waliser and Gautier, 1993), outgoing long-wave radiation (OLR) minima (Waliser and Gautier, 1993; Bain et al., 2011), surface wind convergence (Zheng et al., 2013), and specific humidity distributions (Läderach and Raible, 2013). More recently, Basha et al. (2015) demonstrated that atmospheric refractivity derived from measurements of radio occultation (RO) of the Global Navigation Satellite System (GNSS) provides an effective means to locate the ITCZ. RO is a limb-sounding technique that provides high-vertical-resolution profiles of atmospheric parameters with global coverage and all-weather capability (Kursinski et al., 1997; Anthes et al., 2008). The technique measures the bending of the GNSS signals as they pass through the atmosphere, from which vertical profiles of refractivity can be derived. In the lower troposphere, refractivity is primarily sensitive to water vapour, making it an excellent tracer for moisture-related features such as the ITCZ. In the stratosphere, temperature profiles derived from RO measurements can be used to study GW activity through the calculation of potential energy (Tsuda et al., 2000; Schmidt et al., 2008).
Although numerous studies have examined the relationship between tropical convection and stratospheric GW activity (Ratnam et al., 2004; Alexander et al., 2008) and the influence of climate modes on GWs (Ern et al., 2014; Moss et al., 2016; Liu et al., 2017; Godoi et al., 2020; Diallo et al., 2021), fewer have explicitly linked the detailed structure and variability in the ITCZ with stratospheric GW activity and their joint modulation by climate modes. This study addresses this gap using RO data – from the first and second Constellation Observing System for Meteorology, Ionosphere, and Climate (COSMIC-1 and COSMIC-2) and Meteorological Operational Satellite (MetOp) satellites – and ERA5 and NCEP reanalysis data to investigate the relationship between the ITCZ and stratospheric GWs, as well as the influence of climate variability modes on both phenomena. The objectives of our study are aimed at addressing the following research questions:
-
How do the positions of the ITCZ and stratospheric GW Ep maxima vary seasonally and interannually between different geographical regions?
-
What is the spatial relationship between the ITCZ and stratospheric GW activity in the tropics?
-
How do climate variability modes (MJO, ENSO, and QBO) modulate the ITCZ position and stratospheric GW activity?
-
Are there regional differences in how these aforementioned climate modes influence the ITCZ and stratospheric GWs?
To address these questions, we employ a Gaussian fitting method to identify the latitudinal positions of the ITCZ and GW Ep maxima, and we use multilinear regression to analyse the effects of MJO, ENSO, and QBO on these parameters. Our approach allows us to quantify the specific contributions of each climate mode to the variability in the ITCZ and GW Ep characteristics.
The paper is organized as follows: Sect. 2 describes the data sources and methodology, including the calculation of atmospheric refractivity, GW Ep, the identification of the ITCZ and Ep maxima, and the regression analysis approach; Sect. 3 presents the results, focusing on climatology, seasonal and interannual variations, and modulation by climate modes; Sect. 4 discusses the physical interpretation of the findings and compares them with previous work; and, finally, Sect. 5 summarizes the key conclusions and suggests directions for future research.
2.1 Data sources
This study utilizes reprocessed dry temperature profiles from COSMIC-1 and COSMIC-2, which are satellite missions that use RO to provide high-precision atmospheric data, and MetOp (a, b, c) satellite measurements (hereafter collectively referred to as RO data) for the period from January 2011 to December 2021. COSMIC-1 was launched in 2006 with six microsatellites providing approximately 1500 RO profiles per day. COSMIC-2 GNSS RO system generates approximately 5000–7000 RO profiles per day, providing extensive global coverage for atmospheric analysis with high precision and vertical resolution. MetOp (a, b, c) are European polar-orbiting weather satellites operated by the European Organization for the Exploitation of Meteorological Satellites. Launched in 2006, 2012, and 2018, respectively, they provide high-resolution data for weather forecasting, climate monitoring, and atmospheric research.
The level-2 atmospheric profile data (atmPrf) of the RO dataset are processed operationally in near-real time without moisture information. Each atmPrf file contains high-resolution profiles of physical parameters including dry pressure, dry temperature, refractivity, bending angle, impact parameters, and geometric height above mean sea level. All RO data were retrieved from the COSMIC Data Analysis and Archive Center (CDAAC) website (http://cdaac-www.cosmic.ucar.edu/cdaac/products.html, last access: 10 August 2023).
Figure 1 presents the total number of temperature profiles (atmPrf) and refractivity profiles (wetPrf) per year used in this study. The number of profiles exceeded 2 million in 2020 and 2021, primarily due to the launch of COSMIC-2 in June 2019, which resulted in a daily average of more than 5000 profiles. COSMIC-2 provides significantly more profiles than COSMIC-1 because it consists of six satellites, compared to COSMIC-1's single satellite, and uses improved receiver technology that allows for more frequent and reliable occultation measurements. The inclusion of data from 2020 and 2021 substantially increases the dataset size, which presumably enhances the statistical robustness of our findings, although a formal sensitivity analysis was not conducted. The RO data have a vertical resolution of approximately 100 m in the lower troposphere to about 1 km in the stratosphere, with an accuracy of 0.1–0.2 K for temperature measurements in the upper troposphere and lower stratosphere (Kursinski et al., 1997).
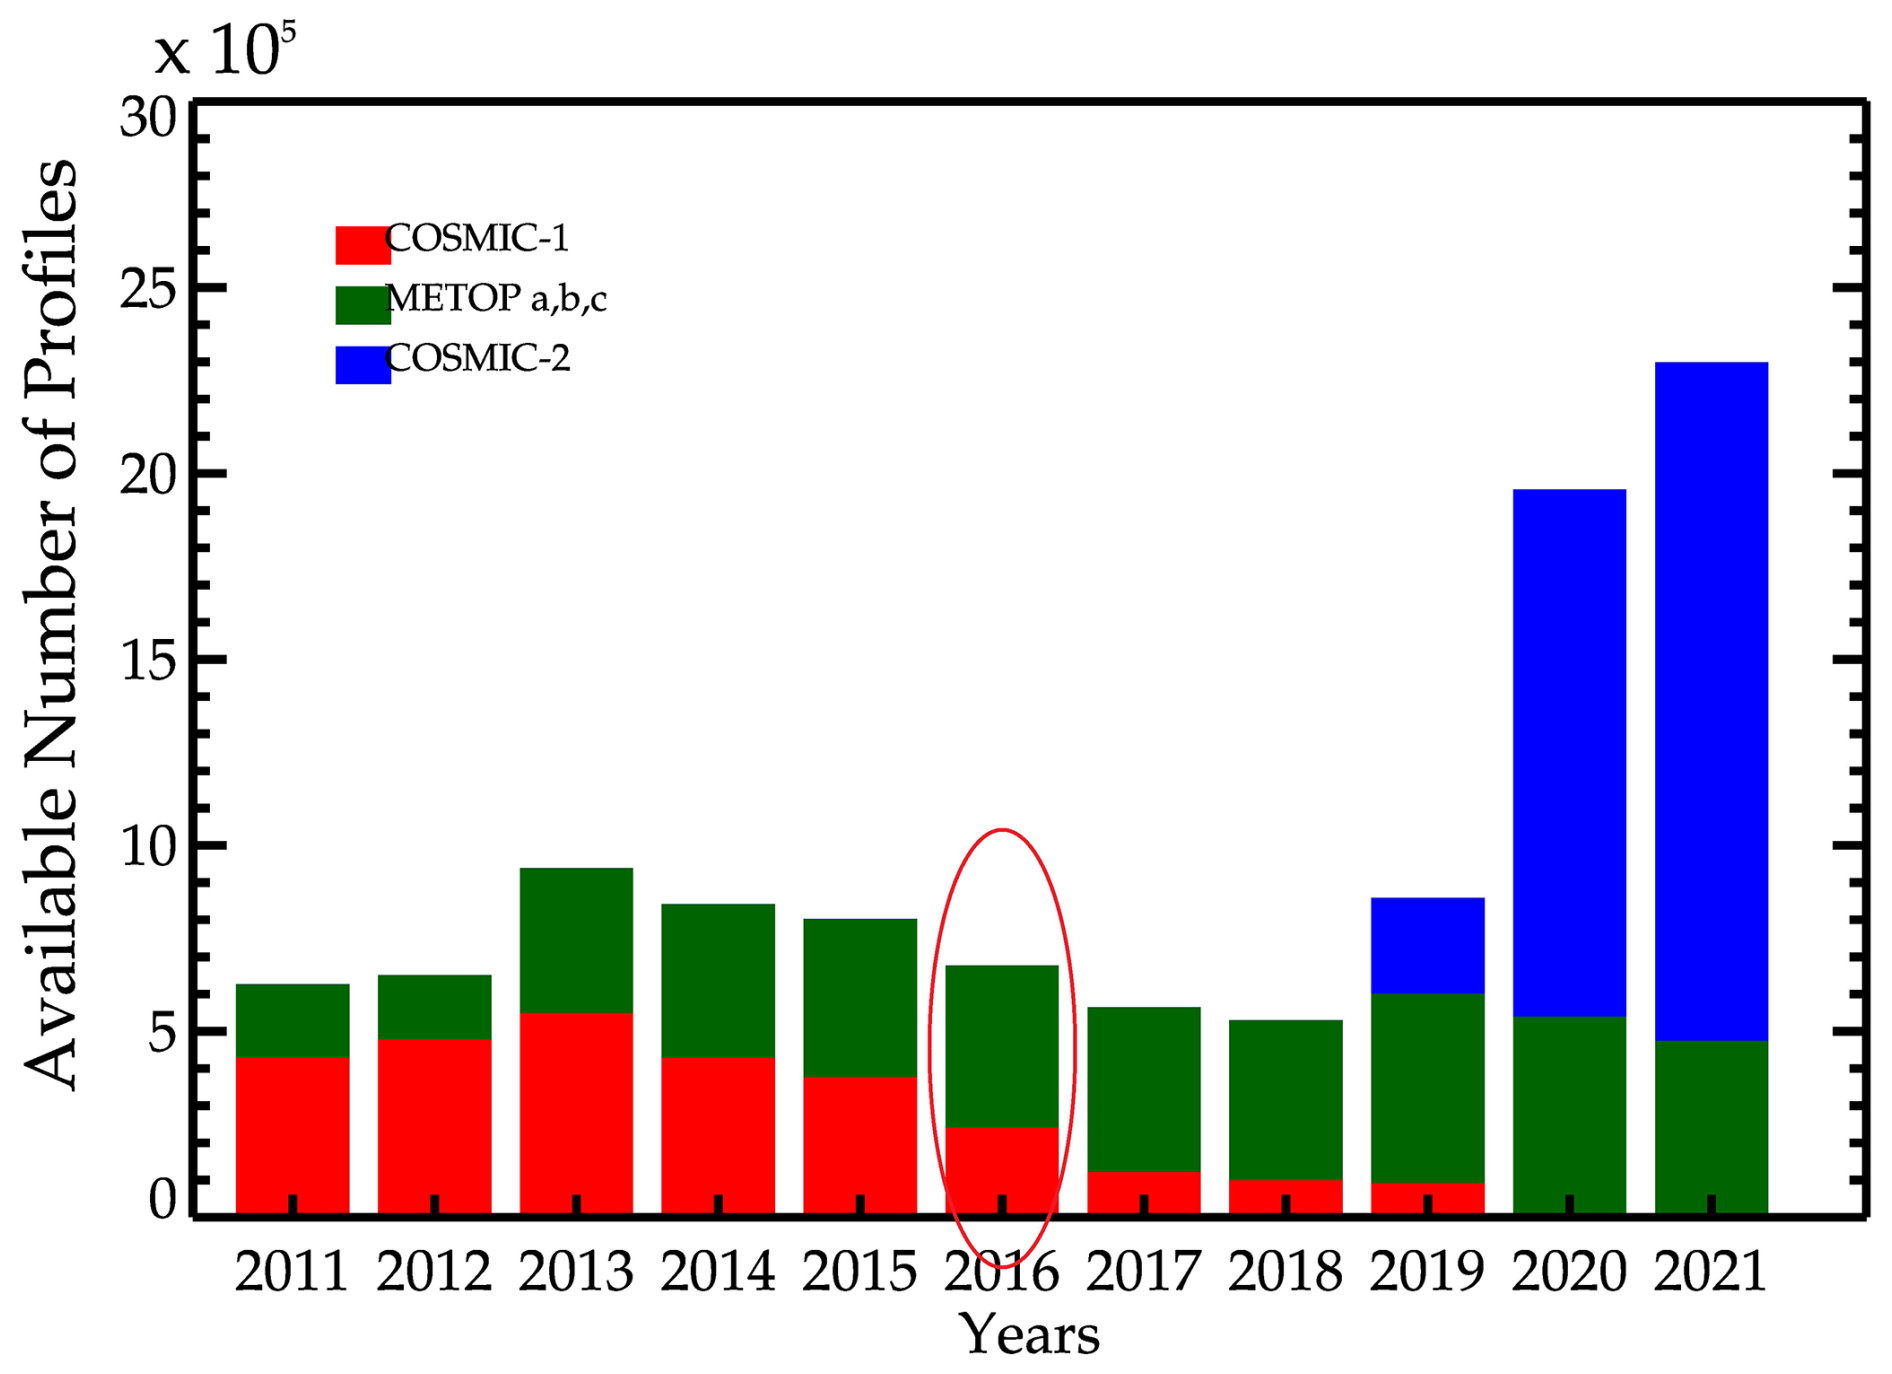
Figure 1Annual statistics of available COSMIC-1, COSMIC-2, and MetOp temperature and refractivity profiles between 2011 and 2021. COSMIC-1 profiles are shown in red, MetOp profiles in green, and COSMIC-2 profiles in blue. The profiles highlighted in the red oval were randomly selected to generate the example analyses in Fig. 2.
To validate the RO data and provide additional context for our analysis, we also used temperature and relative humidity data from two reanalysis products:
-
ECMWF Reanalysis v5 (ERA5) (https://www.ecmwf.int/en/forecasts/dataset/ecmwf-reanalysis-v5, last access: 12 July 2024). ERA5 is the latest climate reanalysis produced by ECMWF, providing hourly data on atmospheric, land-surface, and sea-state parameters with uncertainty estimates. It uses a latitude–longitude grid with a spatial resolution of 0.25°×0.25° and 137 vertical levels from the surface to 0.01 hPa. For this study, we used data on the 37 standard pressure levels available in the public dataset (Hersbach et al., 2020).
-
Reanalysis data of the National Centers for Environmental Prediction/National Center for Atmospheric Research (NCEP/NCAR) Reanalysis (https://psl.noaa.gov/data/reanalysis/reanalysis.shtml, last access: 12 July 2024). This dataset combines historical observations with numerical simulations of weather models to provide 6-hourly and daily data from January 1948 to the present. It has a spatial resolution of 2.5°×2.5° with 17 pressure levels (Kalnay et al., 2018).
Furthermore, specific humidity, OLR, and vertical velocity data were obtained from the NOAA Physical Sciences Laboratory website (https://psl.noaa.gov/data/gridded/data.ncep.reanalysis.html, last access: 12 July 2024) to provide context for ITCZ identification.
2.2 Atmospheric refractivity as an ITCZ proxy
Atmospheric refractivity (N) in a neutral atmosphere is defined as , where n is the refractive index. It depends on pressure (P, hPa), temperature (T, K), and water vapour pressure (e, hPa) (Smith and Weintraub, 1953):
where is the partial pressure of dry air and k1,k2, and k3 are constants. The simplified form on the right is commonly used, combining dry and wet terms. In the lower troposphere (e.g. 850 hPa), the wet term involving e dominates the variability in N, making refractivity a good proxy for moisture content and, thus, the convective activity associated with the ITCZ (Basha et al., 2015). We used N derived directly from RO “wetPrf” profiles at 850 hPa. For ERA5 and NCEP, we calculate N at 850 hPa using their respective temperature, pressure (implicitly through the 850 hPa level), and humidity data via Eq. (1). Using refractivity allows for a consistent proxy across RO and reanalysis, leveraging RO's sensitivity to moisture.
2.3 Calculation of gravity wave potential energy
To quantify GW activity in the stratosphere, we calculate the potential energy (Ep) per unit mass from RO temperature profiles. This approach follows established methodologies (Tsuda et al., 2000; Schmidt et al., 2008; Ayorinde et al., 2023) and provides a robust measure of GW activity. The potential energy is calculated as follows:
where g is the acceleration due to gravity (9.8 m s−2), N is the Brunt–Väisälä frequency, T′ is the temperature perturbation associated with GW, and is the background temperature profile. The temperature perturbation is calculated by subtracting the background temperature from the observed temperature:
The Brunt–Väisälä frequency, which characterizes the stability of the atmosphere, is given by the following:
where z is the altitude and Cp is the specific heat capacity of the dry air at constant pressure (1004 ).
A critical challenge in calculating Ep is the accurate separation of GW-induced temperature perturbations (T′) from the background temperature field (). Traditional methods such as polynomial fitting, running means, or simple band-pass filtering have significant limitations: they can introduce artificial perturbations at the edges of filtering windows, can fail to adapt to varying atmospheric conditions, and may not effectively distinguish GWs from other types of waves (Scherllin-Pirscher et al., 2021).
To address these limitations, we implement a more sophisticated approach using the continuous wavelet transform (CWT) (Torrence and Compo, 1998; Moss et al., 2016). Our procedure consists of the following steps: we first interpolate the raw temperature profiles from RO measurements into a regular vertical grid with 100 m intervals from 10 to 50 km altitude. The profiles are grouped into spatial cells of 20°×10° (longitude × latitude), and the mean temperature profile is calculated for each cell. This spatial averaging helps reduce noise and provides more robust estimates of the background state. We apply a CWT with a Morlet wavelet to each mean temperature profile. The CWT decomposes the temperature profile into components on a spectrum of vertical scales. The background temperature () is reconstructed by including only components with vertical wavelengths longer than 10 km, effectively separating the large-scale background structure from smaller-scale wave perturbations. This background temperature is then interpolated back to the positions of the original temperature profiles and subtracted from the raw temperature profile using Eq. (3) to obtain the temperature perturbations (T′). Finally, Ep is calculated using Eq. (2) at various altitudes, with our analysis focusing mainly on 20 km altitude, where the quality of RO data is high and the influence of tropospheric water vapour is negligible.
A significant methodological consideration is the potential interference in GW signals from other wave types, particularly equatorial Kelvin waves, which can have vertical wavelengths that overlap with the GW spectrum (typically 2–10 km for GW vs. 5–15 km for Kelvin waves) (Alexander et al., 2010; Wheeler and Kiladis, 1999). To minimize this interference, we implement an additional filtering step that targets the characteristic properties of Kelvin waves: eastward propagation, zonal wavenumbers 1–3, and periods of 4–23 d (Alexander et al., 2008). This approach enables the isolation of GW disturbances from other types of waves. However, a certain amount of residual interference near the Equator cannot be entirely ruled out by analysing the 1D profile alone.
Our CWT-based method offers several advantages over simpler filtering techniques. First, it adapts to varying atmospheric conditions rather than applying fixed cutoffs. Second, it minimizes edge effects that can introduce artificial perturbations. Third, it provides better separation of wave types based on their scale characteristics. These advantages are particularly important when analysing GW activity across different seasons and geographical regions, where background conditions and wave properties can vary significantly. The resulting Ep values represent the energy density associated with GWs and serve as our primary metric for GW activity in the stratosphere. This approach can resolve GWs with vertical wavelengths greater than approximately 2 km (twice the vertical resolution of the interpolated profiles) and less than 10 km (the cutoff used to separate background and perturbation components). This range captures most stratospheric GWs while also minimizing contamination from larger-scale waves and smaller-scale noise. The results are shown primarily for 20 km altitude. Using temperature profiles for Ep calculation is a standard practice for the stratospheric GW analysis of RO data (e.g. Alexander et al., 2008; Namboothiri et al., 2008).
2.4 Method for identifying the ITCZ and maximum Ep locations
To objectively determine the latitudinal positions of the ITCZ and stratospheric GW potential energy maxima, we applied a Gaussian fitting approach similar to that employed by Läderach and Raible (2013). This method identifies the peak positions in the meridional distributions of refractivity for the ITCZ and Ep for GW activity. We first gridded the RO and reanalysis data at a global 2°×2° (longitude × latitude) resolution. To minimize the effects of orography and irregular boundary layers, we calculated mean values for both refractivity and Ep at each 10° longitude band across all latitudes. This preprocessing was applied to monthly averages of refractivity at 850 hPa (serving as our ITCZ proxy) and Ep at 20 km altitude (representing stratospheric GW activity).
For each longitude λ and month t, we fit a Gaussian function to the latitudinal distribution of refractivity or Ep between 30° S and 30° N. The fitting function takes the following form:
where ϕ is latitude, ϕmax(λ,t) represents the latitudinal position of the peak ITCZ or Ep maximum, A(λ,t) is the amplitude indicating the strength of the feature, σ(λ,t) is the width parameter representing the meridional extent, and B(λ,t) is the background value.
To perform the Gaussian fitting using a nonlinear least-squares method with several constraints to ensure physically meaningful results, the following steps were taken. First, the fit was restricted to the tropical latitude band (30° S–30° N) to focus on the primary ITCZ and GW activity regions. Second, a minimum coefficient of determination (R2) value of 0.7 was required for a valid fit, ensuring that the Gaussian model adequately represented the data, and the standard deviation of the Gaussian (σ) was restricted to be between 5 and 15° to exclude unrealistically narrow or wide distributions.
The method is particularly effective for identifying the ITCZ in regions where it forms a well-defined band, such as over the open oceans. However, it may be less reliable in regions with complex convective patterns, such as over the Maritime Continent, or in areas with double-ITCZ structures. In such cases, the fit identifies the dominant peak, which typically corresponds to the stronger convective zone. By applying this consistent methodology to the refractivity and Ep distributions, we can directly compare the latitudinal positions and characteristics of the ITCZ and stratospheric GW activity, allowing analysis of their spatial relationships and temporal covariability.
To illustrate this approach, Fig. 2 shows the application of our method for a specific longitude (76° W) in 2016, showing the latitudinal distributions of refractivity and Ep during December–January–February (DJF) and June–July–August (JJA), together with their respective Gaussian fits.
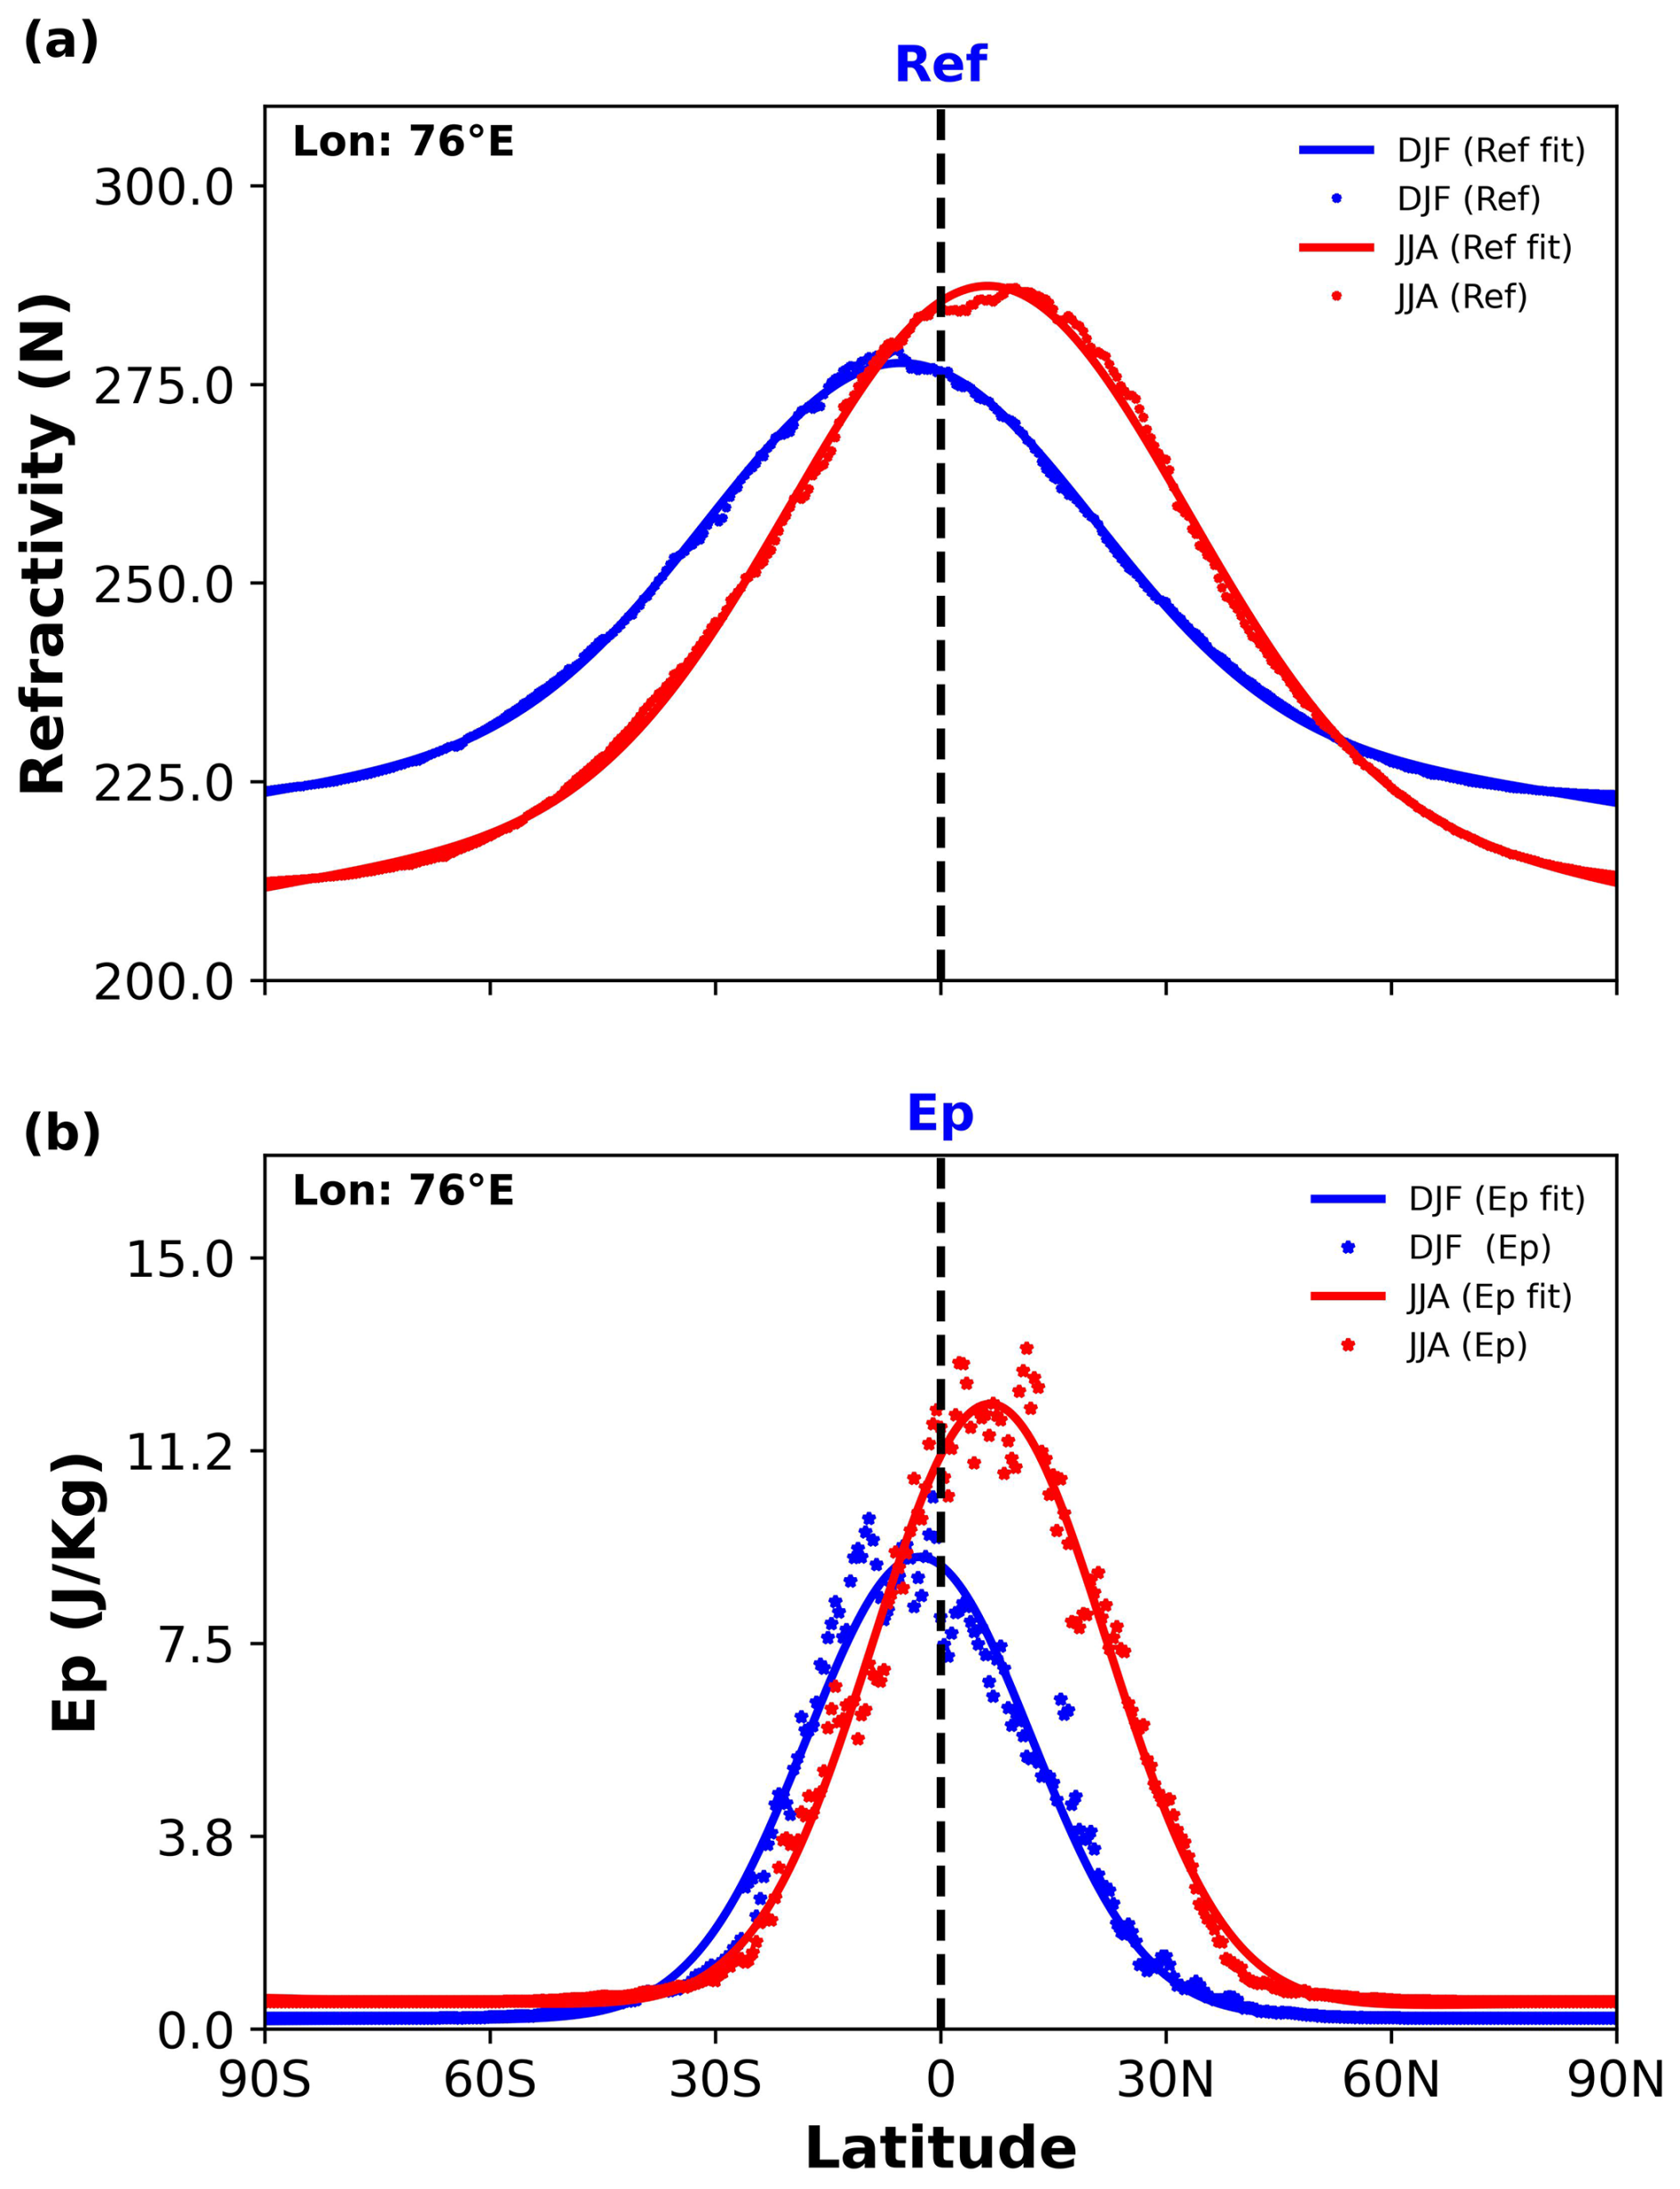
Figure 2Latitudinal distribution of (a) refractivity (N) and (b) gravity wave potential energy (Ep, J kg−1) at 76° W during December–January–February (DJF, blue) and June–July–August (JJA, red) in 2016. Thick lines show the Gaussian fits used to determine the latitudinal positions of the ITCZ and Ep maxima.
Both refractivity and Ep show similar latitudinal distributions, with peaks near the Equator during DJF and a northward shift to approximately 15° N during JJA. This seasonal migration is consistent with the expected movement of the ITCZ following the region of maximum solar heating. The close correspondence between refractivity and Ep distributions suggests that the ITCZ and stratospheric GW activity are closely linked, with GWs likely generated by deep convection within the ITCZ.
2.5 Trend analysis method
To investigate the modulation by climate variability modes, we use the following standard indices: the multivariate ENSO index version 2 (MEI.v2), shown in Fig. 3a, obtained from the NOAA Physical Sciences Laboratory (https://psl.noaa.gov/enso/mei/, last access: 12 July 2024). We use monthly values derived from the bimonthly index (Wolter and Timlin, 2011). Positive values indicate El Niño conditions, whereas negative values indicate La Niña conditions. The real-time multivariate MJO (RMM) index is shown in Fig. 3b (Wheeler and Hendon, 2004). We used the monthly amplitude, calculated as , obtained from the Australian Bureau of Meteorology (http://www.bom.gov.au/climate/mjo/graphics/rmm.74toRealtime.txt, last access: 12 July 2024). Higher amplitude indicates stronger MJO activity. For the QBO, we used the monthly mean zonal winds at 30 hPa (∼24 km) and 50 hPa (∼21 km) from radiosonde observations over Singapore, as illustrated in Fig. 3c. These data were obtained from the Karlsruhe Institute of Technology's Atmosphere and Climate Data Hub (https://www.atmohub.kit.edu/english/807.php, last access: 8 August 2025). To remove regression uncertainty, the QBO zonal wind data at 30 and 50 mbar were normalized. These modes of climate variability are presented in Fig. 3, which shows the reference time series used in the regression analyses.
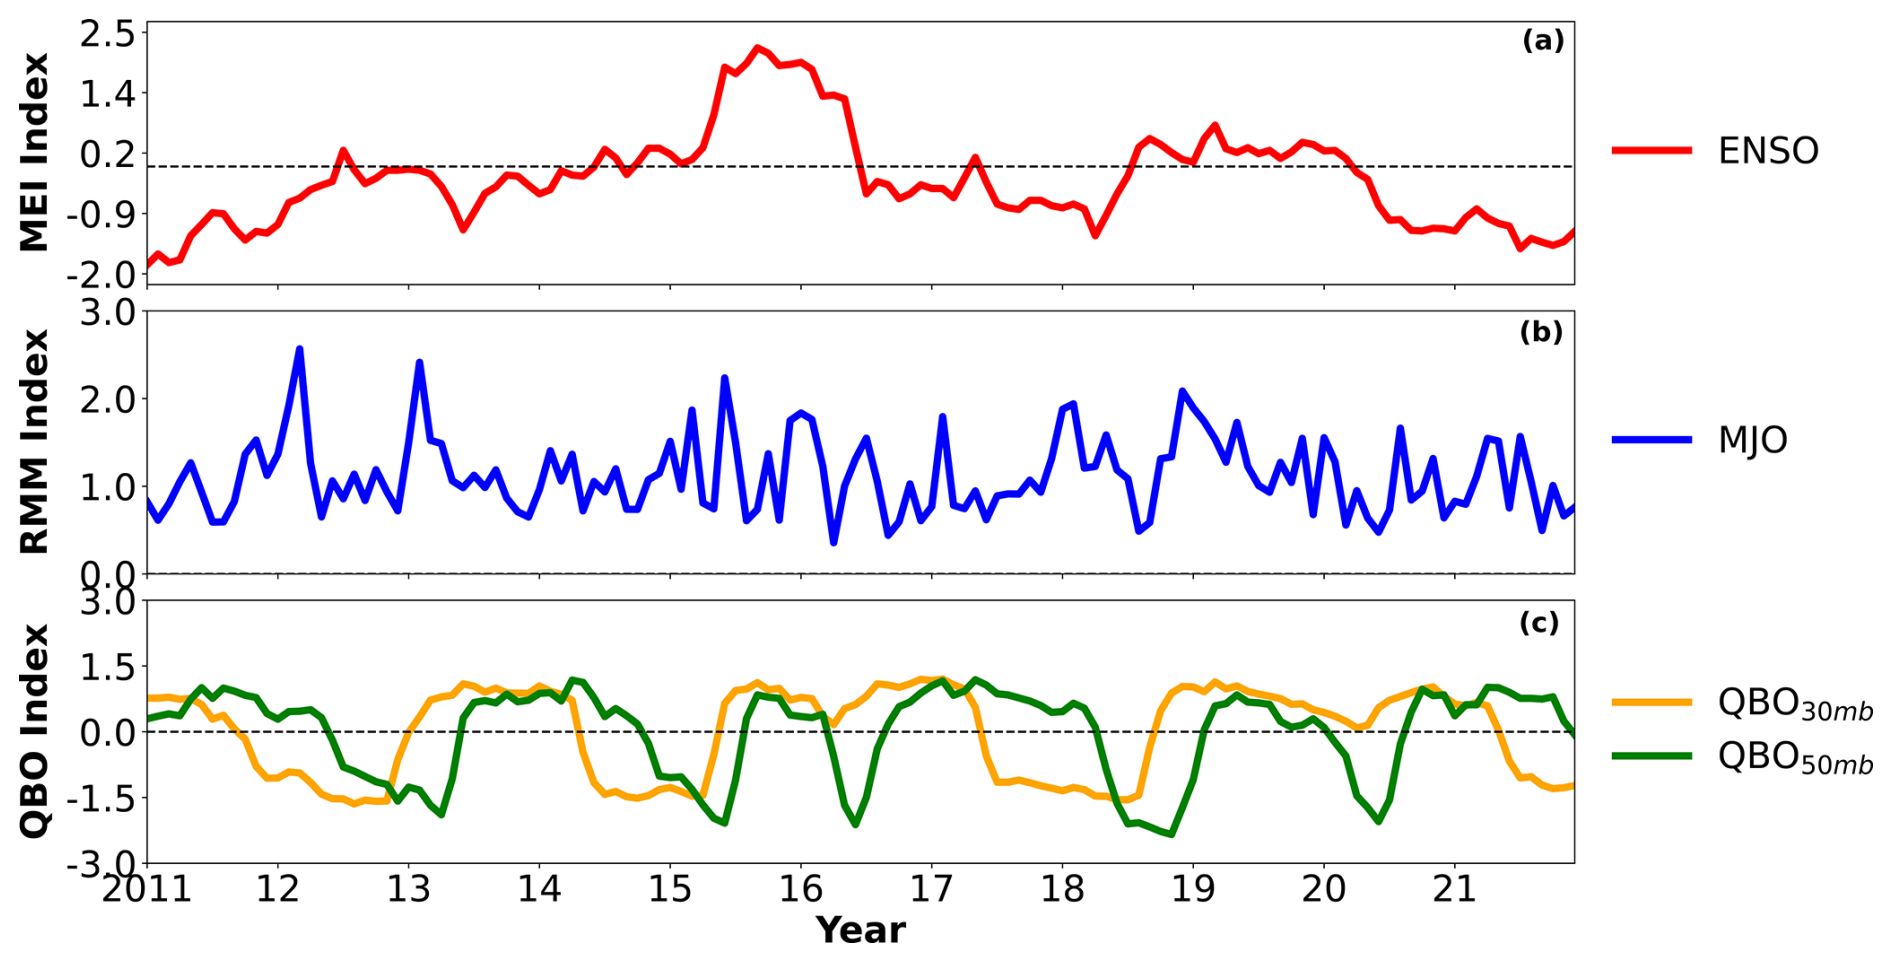
Figure 3Reference time series from 2011 to 2021 used for the regression analyses: (a) multivariate ENSO index (MEI) characterizing the ENSO signal (red), (b) amplitude of real-time multivariate MJO indices (RMM) 1 and 2 characterizing the MJO signal (blue), and (c) normalized zonal winds at 30 hPa (24 km, orange) and 50 hPa (21 km, green) over the Equator characterizing the QBO.
To analyse trends in the ITCZ position and GW activity and their relationships with climate variability modes, we employed a multivariate linear regression (MLR) approach (Wolter and Timlin, 2011; Li et al., 2013; Ayorinde et al., 2024). This method allows us to determine the relationship between a dependent variable (e.g. ITCZ position or Ep) and multiple independent variables (e.g. time, ENSO, MJO, and QBO indices). The MLR equation is formulated as follows:
where Ψ represents the monthly zonal mean value of the parameter of interest (ITCZ position, Ep maxima position, refractivity value, or Ep value); ti,j denotes the time in months (where i is the year and j is the month); μ represents a constant term; α0 represents the linear trend over time; and α1 through α4 represent the regression coefficients for the normalized QBO at 30 hPa, normalized QBO at 50 hPa, MJO, and ENSO indices, respectively. The residual term represents the unexplained variance in the regression model. The standard deviation and p value for each coefficient were estimated using the variance–covariance matrix and Student's t test (Kutner et al., 2004; Mitchell et al., 2015). A p value threshold of 0.05 was used to determine statistical significance.
3.1 Climatology and seasonal variability in the ITCZ and GW Ep
First, we examine the mean spatial distribution and seasonal variation in the ITCZ proxy (refractivity at 850 hPa) and stratospheric GW activity (Ep at 20 km). Figure 4 shows the global distribution of refractivity values at 850 hPa from RO, ERA5, and NCEP data for 2021, integrated over a 2°×2° (longitude × latitude) grid. All three datasets effectively capture the ITCZ as a band of enhanced refractivity near the Equator, which shifts seasonally between hemispheres. Consistent with known climatology, the ITCZ is located predominantly in the Southern Hemisphere (SH) during DJF (Fig. 4a, c, and e) and shifts significantly into the Northern Hemisphere (NH) during JJA (Fig. 4b, d, and f). Maximum refractivity values are typically found over tropical landmasses (South America, Africa, and the Maritime Continent) and warm ocean pools (western Pacific).
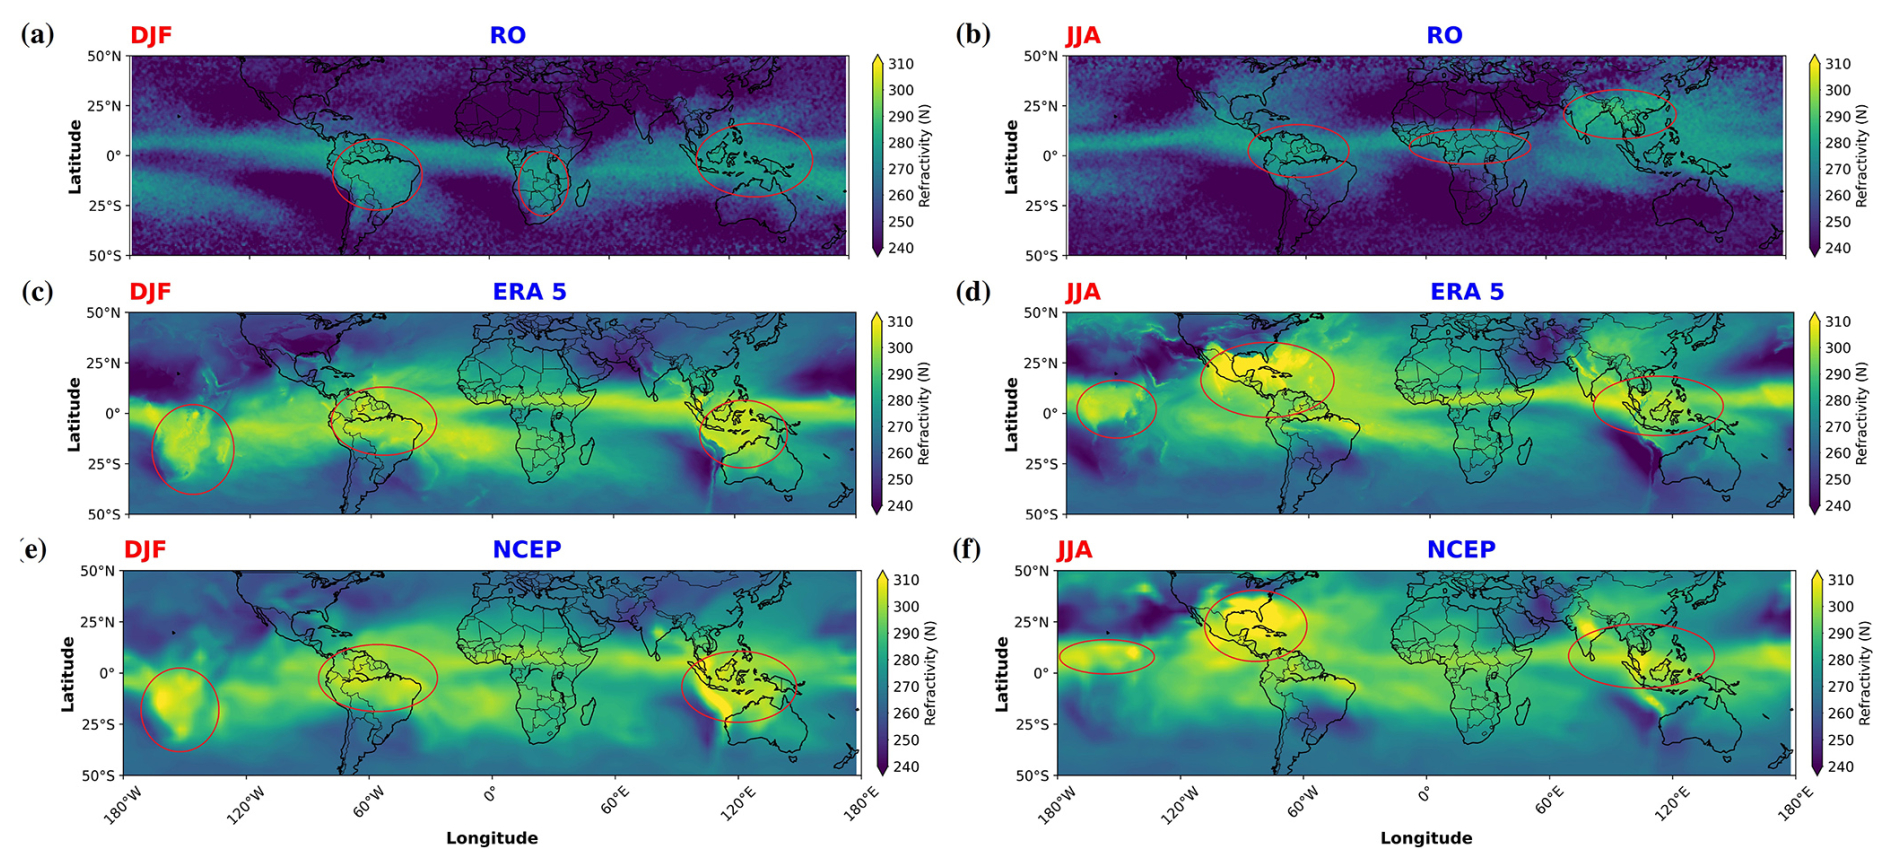
Figure 4Global distribution of refractivity (N) at 850 hPa during December–January–February (DJF; left column: a, c, e) and June–July–August (JJA; right column: b, d, f) in 2021. Data are derived from RO (a, b), ERA5 (c, d), and NCEP (e, f). Circled regions highlight areas of high refractivity concentration associated with the ITCZ and monsoon systems. Note the seasonal shift in the high-refractivity band between hemispheres.
Although the overall patterns are similar, RO-derived refractivity (Fig. 4a and b) generally shows slightly lower peak values (range ∼260–290 N) compared to ERA5 and NCEP (range ∼240–310 N), particularly noticeable in the reanalysis maxima (circled regions). These differences likely result from variations in spatial resolution, observational coverage, and data assimilation techniques between satellite-based RO measurements and model-based reanalysis products. The RO data show finer-scale structures and stronger gradients compared to the reanalyses, particularly in regions with complex topography or limited conventional observations.
Figure 5 presents the global distribution of the GW potential energy (Ep) at 20 km altitude for DJF and JJA in 2021, derived from RO temperature profiles. Elevated Ep values (∼5–15 J kg−1) are concentrated in the tropics and subtropics, broadly overlapping with the regions of high convective activity suggested by the refractivity maps. The Ep field shows distinct seasonal patterns with several key features. First, there is an equatorial band of enhanced Ep that shifts seasonally between hemispheres, broadly following the ITCZ. During DJF (Fig. 5a), high Ep values are observed in equatorial South America, Africa, and the western Pacific. During JJA (Fig. 5b), the regions of enhanced Ep shift northward, with pronounced features over Central America, the Sahel region, and South Asia. Second, there are strong Ep values in the winter hemisphere middle to high latitudes, particularly in the Northern Hemisphere during DJF. This feature is associated with the polar night jet, which allows more efficient vertical propagation of GWs generated by various sources, including orography and jet streams. Third, there are localized Ep enhancements on major mountain ranges, such as the Andes, Rockies, and Himalayas, which are persistent sources of orographic GWs. Distinct features of JJA are the high Ep values over the southern Andes (30–50° S), which diminish eastward, likely associated with orographic mountain waves generated by the north–south orientation of the Andes and the strong westerly jet in this region (Alexander et al., 2010). Lastly, there is a notable equatorial maximum over the western Pacific was observed during both seasons, which is likely associated with persistent deep convection in this region.
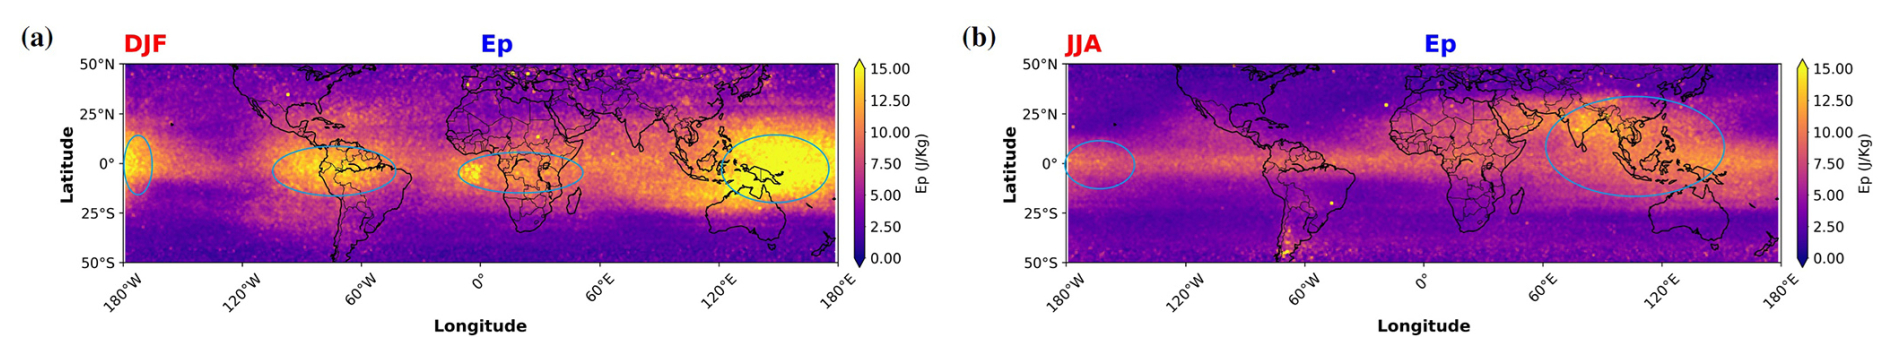
Figure 5Global distribution of gravity wave potential energy (Ep, J kg−1) at 20 km altitude during (a) December–January–February (DJF) and (b) June–July–August (JJA) in 2021, derived from RO temperature profiles. Circled regions highlight areas of high Ep concentration, often associated with deep convection or orography (e.g. the Andes in JJA).
The spatial patterns in Fig. 5 are broadly consistent with previous global GW climatologies derived from RO (e.g. Tsuda et al., 2000; Ratnam et al., 2004; Schmidt et al., 2016). The spatial correlation between tropical Ep maxima and the high-refractivity regions associated with the ITCZ (Fig. 4) suggests a direct link between tropospheric convection and stratospheric GW activity. However, the Ep distribution also shows features that are not directly related to the ITCZ, indicating the importance of other GW sources and propagation conditions.
To quantitatively analyse the relationship between the ITCZ and stratospheric GW activity, we applied the Gaussian fitting method described in Sect. 2.4 to identify the latitudinal positions of the ITCZ (using refractivity) and the maximum GW potential energy. Figure 6 shows the longitudinal variation in these peak locations averaged over the 11-year period (2011–2021) for DJF and JJA. The mean position of the ITCZ (Fig. 6a) clearly shows the seasonal shift: located around 5–10° S during DJF (green lines) and shifting to 5–15° N during JJA (red lines). The magnitude of the shift varies with longitude, being largest over Africa and the Indian Ocean (approximately 15–20° latitudinal shift). RO (solid lines), ERA5 (dashed), and NCEP (dotted lines) generally show good agreement with respect to the mean position of the ITCZ, although there are some regional differences, particularly the somewhat smoother structure of the NCEP, due to its coarser resolution.
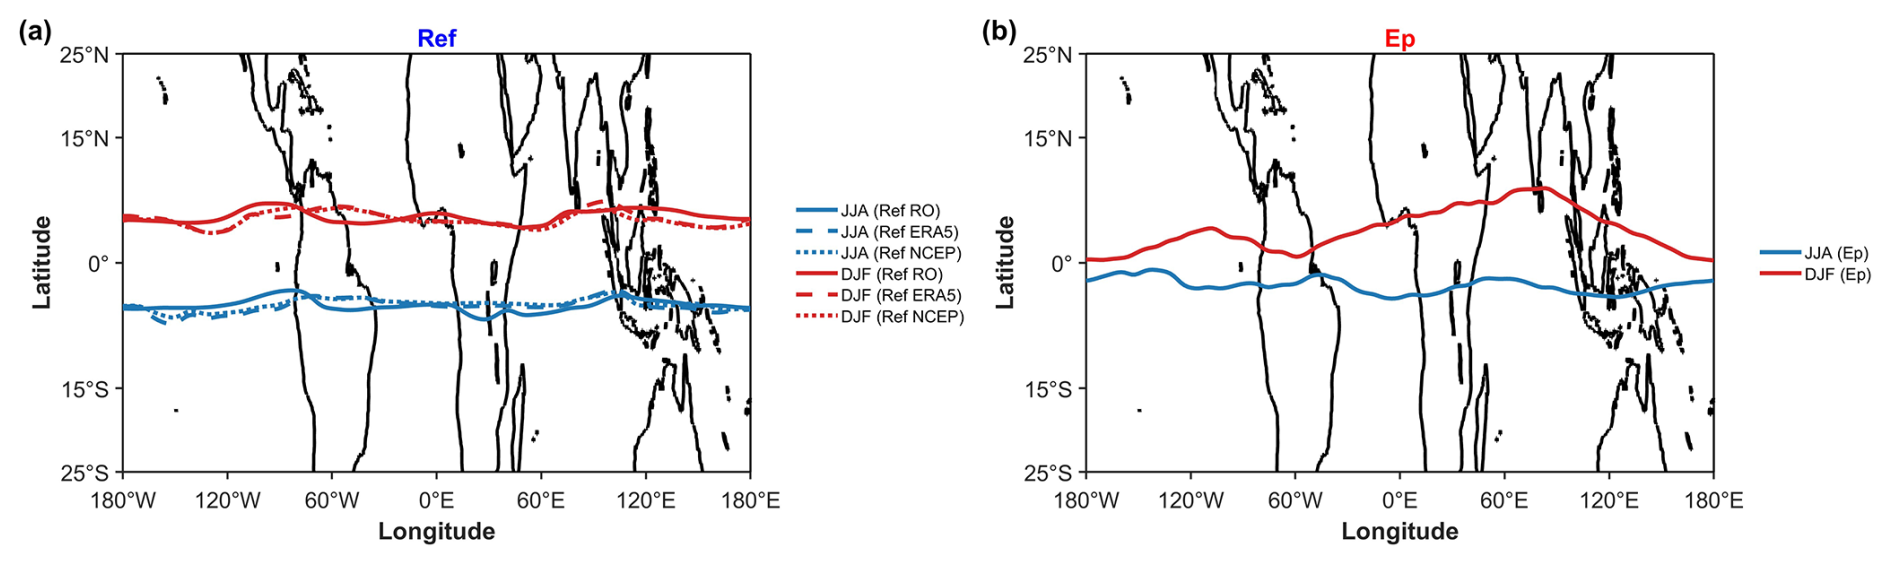
Figure 6Longitudinal variation in the 11-year (2011–2021) mean latitudinal location (ϕmax) of maxima derived from Gaussian fits. (a) The mean ITCZ location derived from refractivity at 850 hPa for DJF (green lines) and JJA (red lines). Solid lines are from RO, dashed lines are from ERA5, and dotted lines are from NCEP. (b) The mean GW Ep maximum location derived from RO temperature at 20 km for DJF (solid green line) and JJA (solid red line). Note the consistent seasonal migration in both the ITCZ and Ep maxima.
The mean location of the stratospheric Ep maximum (Fig. 6b) also shows a clear seasonal migration, generally following the ITCZ shift but with some notable differences. The peak Ep (solid green/red lines) tends to stay closer to the Equator compared to the ITCZ proxy, especially during JJA over the Atlantic and Africa. The latitudinal separation between the DJF and JJA Ep peaks is typically smaller (∼5–10°) than the ITCZ shift (∼10–20°). This suggests that, while convection associated with the ITCZ is a primary source, the observed stratospheric GW maximum is also influenced by propagation effects (including horizontal propagation) and potentially filtering by stratospheric winds, leading to a peak location that does not perfectly mirror the tropospheric source region (Alexander et al., 2010).
To further explore the relationship between the ITCZ, Ep, and other meteorological fields often associated with convection, Fig. 7 compares the mean ITCZ and Ep maxima locations with specific humidity, vertical velocity, and OLR. The high specific humidity (Fig. 7a and b) aligns well with the ITCZ location derived from refractivity (cyan line), confirming the moisture-based proxy. The ITCZ position generally aligns well with regions of maximum specific humidity, particularly over the oceans, consistent with the ITCZ's characteristic as a zone of convergence. Regions of strong upward motion (negative vertical velocity; Fig. 7c and d) and low OLR (contours in Fig. 7a, b, e, and f), both indicative of deep convection, also generally coincide with ITCZ.
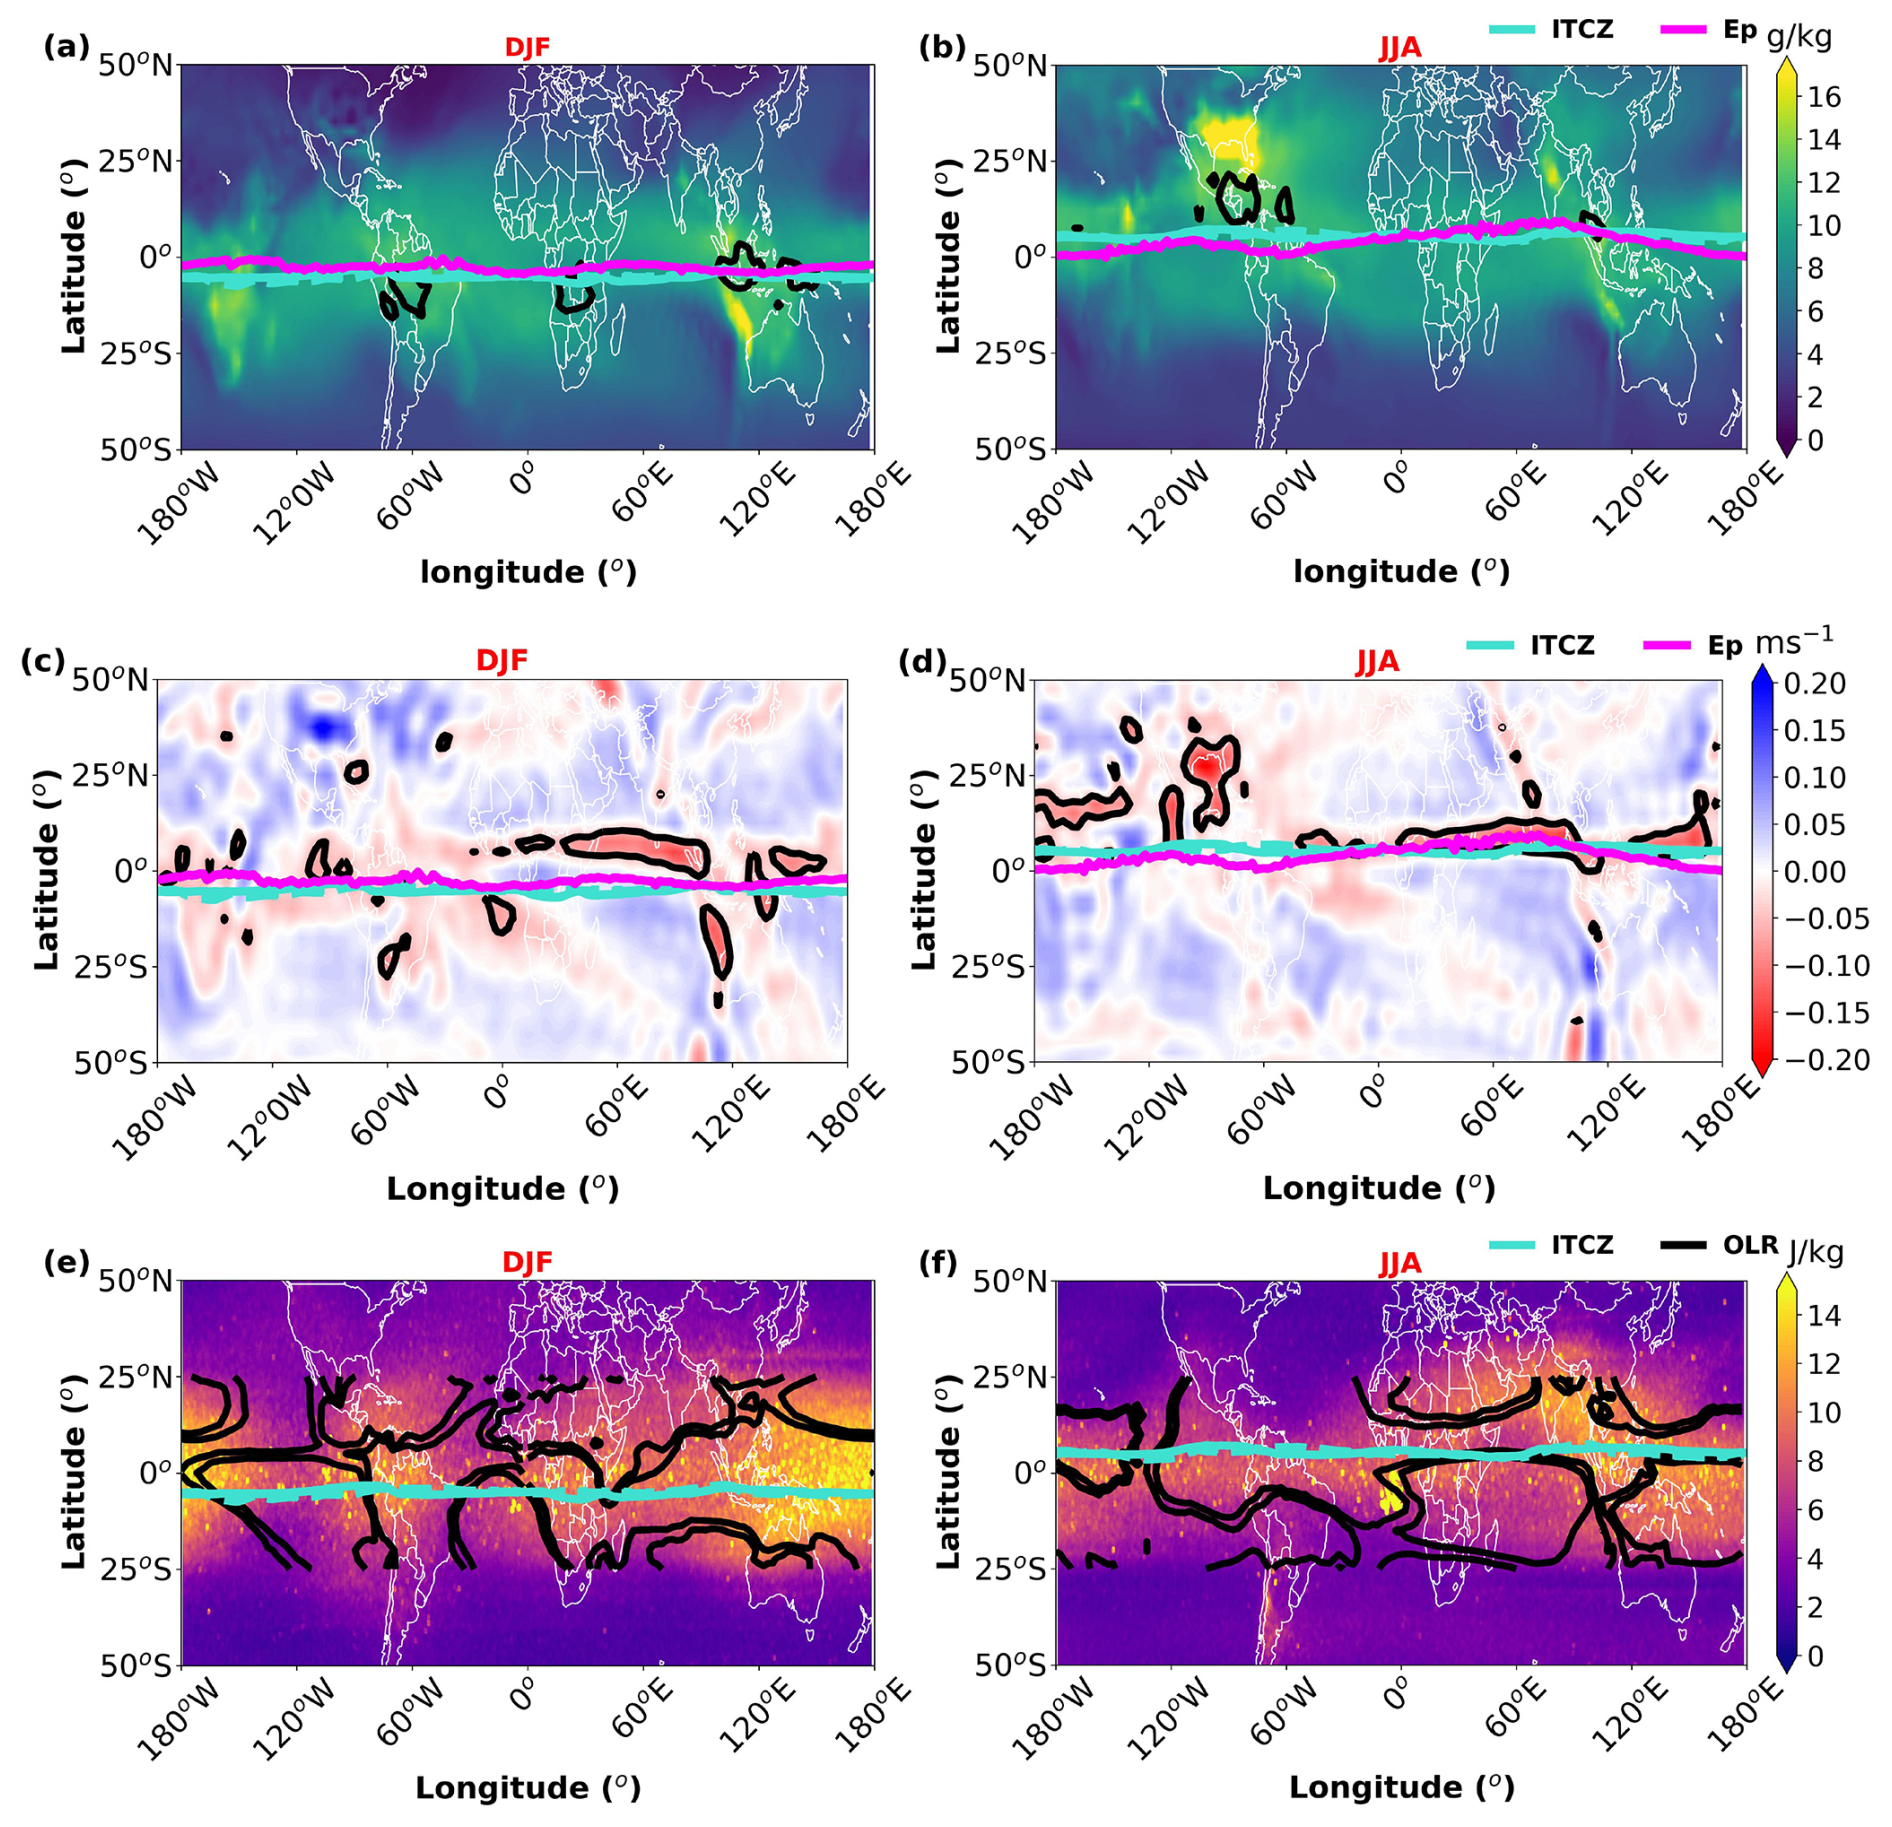
Figure 7Mean fields (2011–2021) for DJF (left column: a, c, e) and JJA (right column: b, d, f). The solid cyan line shows the mean ITCZ location (from RO refractivity at 850 hPa), whereas the solid magenta line shows the mean Ep maximum location (from RO Ep at 20 km). (a, b) Mean specific humidity (g kg−1, coloured shading) at 800 hPa. Black contours show OLR between 200 and 250 W m−2. (c, d) Mean vertical velocity (ω, m s−1, negative values indicate ascent; coloured shading) at 800 hPa. The black contour is the zero-vertical-velocity line. (e, f) Mean Ep (J kg−1, coloured shading) at 20 km. Black contours show OLR (200–250 W m−2).
The mean Ep maximum location (magenta line) is often located equatorward or slightly poleward of the peak convective indicators, again highlighting the role of propagation and potentially wave filtering. For example, in South America in JJA (Fig. 7d and f), the Ep maximum appears somewhat south of the main ITCZ/convection band. Interestingly, the Ep maxima position shows an even closer alignment with the zero-vertical-velocity contour, particularly over the Pacific and Atlantic oceans. This suggests that GW activity may be enhanced not only by deep convection but also by the vertical wind shear associated with the boundaries of convective regions.
The Ep distribution (Fig. 7e and f) exhibits clear seasonal patterns, with high values concentrated in four main regions during DJF: equatorial South America, Africa, the Maritime Continent, and the western Pacific. During JJA, the regions of enhanced Ep shift northward, with notable concentrations over the eastern part of Africa, the Asian monsoon region, and the Indian and Pacific oceans. These maps visually confirm the linkage between the ITCZ's convective activity and enhanced stratospheric GW Ep, while also hinting at complexities beyond a simple one-to-one mapping.
3.2 Interannual variability and longitudinal structure of trends
Beyond the seasonal cycle, we investigate the interannual variability and long-term trends in the ITCZ and Ep maxima locations and their peak values over the 11-year period. Figure 8 (top panels) shows the year-to-year variations in the peak locations for DJF and JJA. The ITCZ location (Fig. 8a) exhibits interannual shifts of approximately 5–15° N and S during the 11-year period, but the overall seasonal migration pattern remains dominant. The Ep maximum location (Fig. 8b) shows similar interannual variability, generally tracking the ITCZ shifts but sometimes exhibiting independent variations, especially noticeable over the Pacific Ocean (120° E–120° W), which is strongly influenced by ENSO.
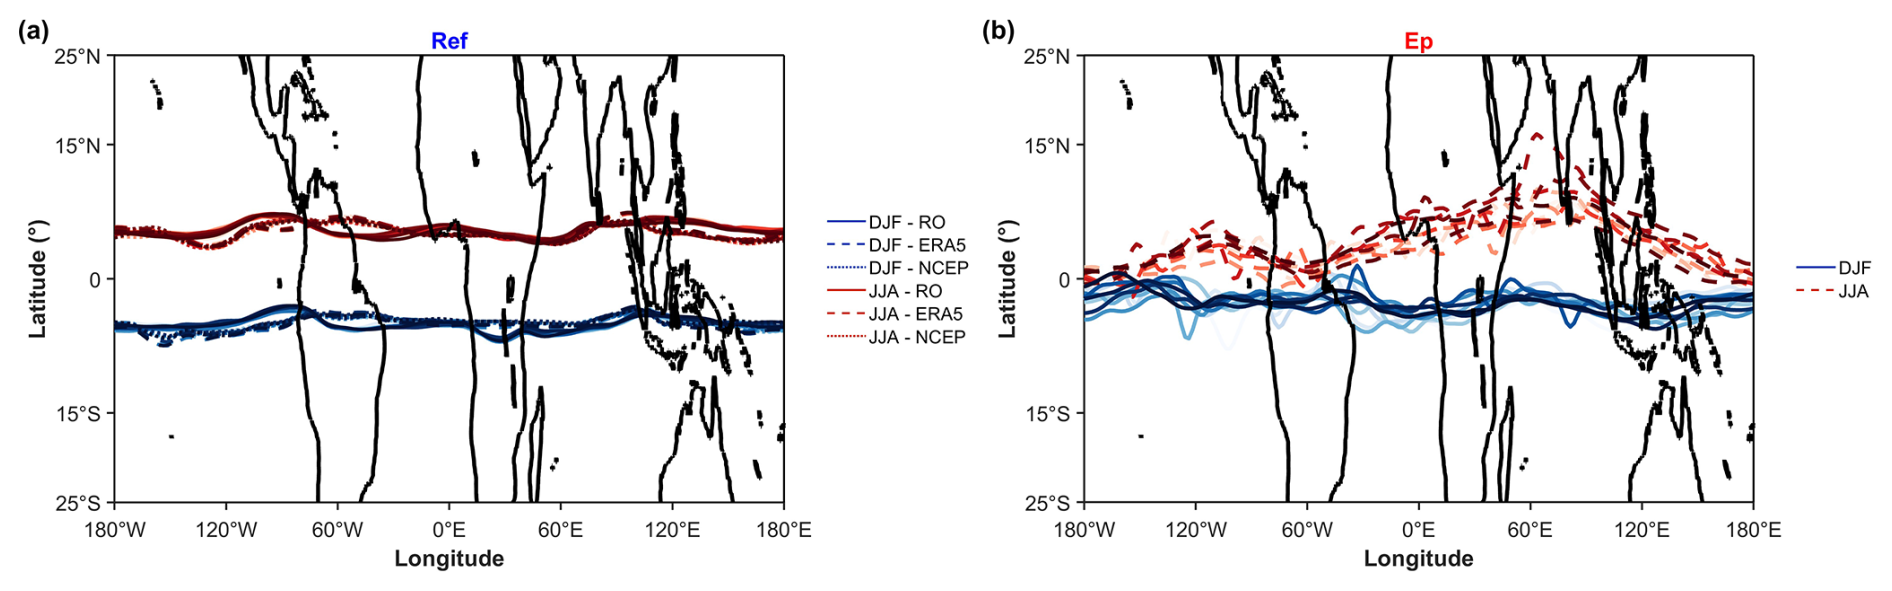
Figure 8Longitudinal variation in the latitudinal location (ϕmax) of maxima derived from Gaussian fits, showing interannual variability from 2011 to 2021. (a) Interannual variability in the ITCZ locations for DJF (blue lines) and JJA (purple lines) derived from RO (solid), ERA5 (dashed), and NCEP (dotted) data for each year. (b) Interannual variability in the Ep maxima locations (from RO) for DJF and JJA (multicoloured solid lines for individual years), compared with the 11-year mean ITCZ locations for DJF (dashed blue) and JJA (dashed purple) for reference.
To quantify linear changes over the 11-year period, we applied the multilinear regression method described in Sect. 2.5 to calculate the trend coefficient (α0) for the latitudinal position (ϕmax) of the ITCZ and Ep maxima at each longitude (Fig. 9). The longitudinal variation in the ITCZ position trend (Fig. 9a) fluctuates around zero for RO, ERA5, and NCEP, suggesting no globally coherent, statistically significant linear trend in the mean ITCZ latitude over this specific period of 11 years. Trends vary across different longitudinal regions, with generally positive values (0.060–0.130° latitude per year) indicating a northward shift in the ITCZ over the 11-year period in some regions. Some regional variations exist, with slight positive (northward) tendencies in parts of the American sector and slight negative (southward) tendencies over parts of the African sector in the ERA5 data, although confidence intervals are wide.
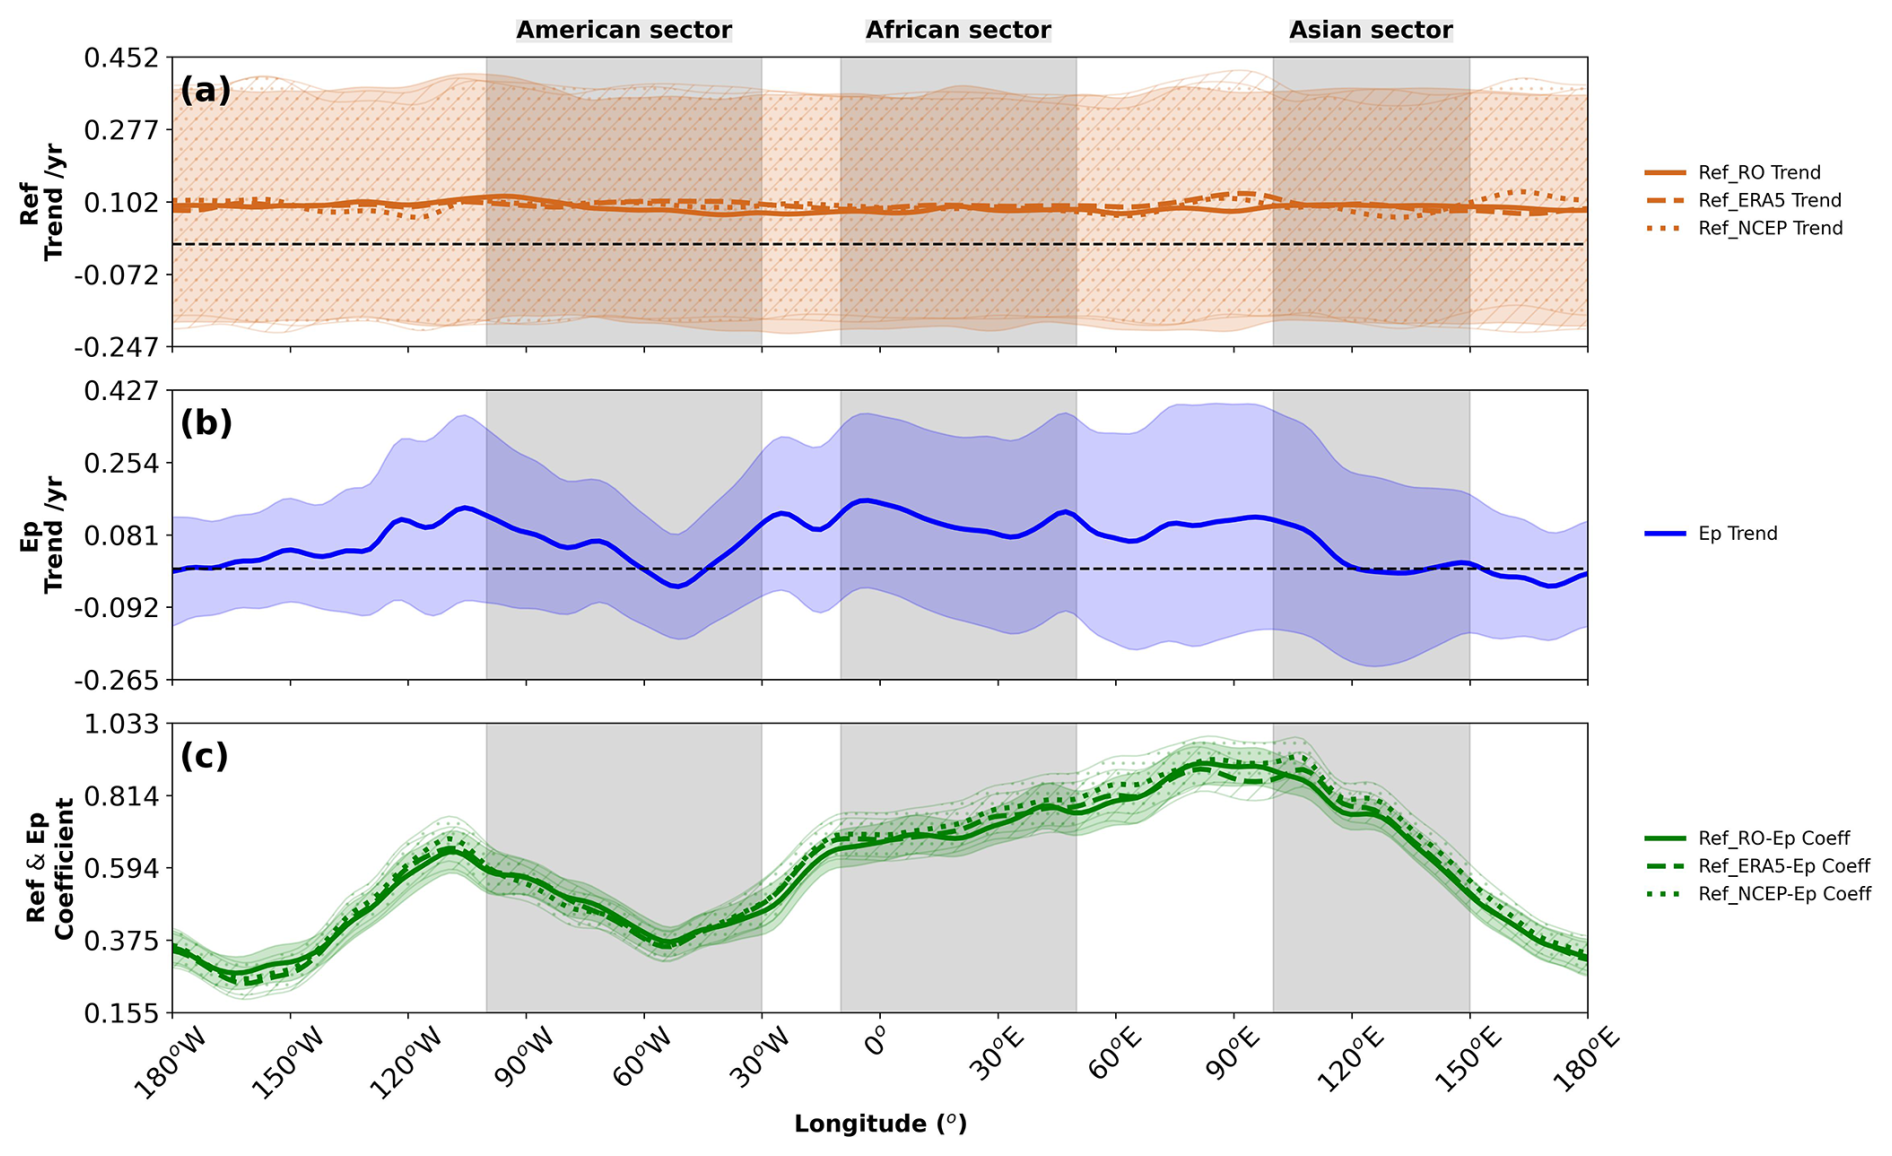
Figure 9Longitudinal structure of linear trends and correlations for the ITCZ and Ep maximum latitudinal locations (ϕmax) over 2011–2021. (a) Linear trend in the ITCZ latitude (degrees per year) derived from RO (solid red), ERA5 (dashed red), and NCEP (dotted red) refractivity. (b) Linear trend in the Ep maximum latitude (degrees per year) derived from RO (solid blue). (c) Correlation coefficient between the monthly ITCZ latitude (RO: solid green; ERA5: dashed green; NCEP: dotted green) and monthly Ep maximum latitude (RO). Vertical shaded regions highlight the American (100–30° W), African (10° W–50° E), and Asian (100–150° E) sectors. The dashed black line indicates zero. Shaded areas are 95 % confidence intervals.
The longitudinal variation in the Ep maximum position trend (Fig. 9b) also shows fluctuations around zero, although with a tendency towards positive trends in the African (∼0.072–0.170° latitude per year) and Asian sectors (∼0.012–0.010° latitude per year), indicating a northward shift in GW activity. However, negative trends (° latitude per year) are observed in the American sector around 60° W and in the eastern Pacific, suggesting a southward shift in GW activity in these regions. This regional variability in Ep trends may reflect differences in how climate variability modes affect GW generation and propagation in different geographical areas. However, these trends are generally not statistically significant (from the error margin) in large longitudinal bands (approximately 0–160° E) within the 11-year record.
Figure 9c shows the correlation coefficient between the monthly time series of the ITCZ position (ϕmax,N) and the Ep position () at each longitude. Positive correlations dominate globally, with particularly strong values in the African and Asian sectors (up to ∼0.60), indicating that interannual shifts in the ITCZ location are often mirrored by shifts in the stratospheric maximum Ep. The correlation is particularly strong (above 0.60) in the Asian monsoon region, which is consistent with the prevalence of mesoscale convective systems that are a significant source of gravity waves (GWs) (Liu et al., 2017). In contrast, correlations are markedly weaker over the eastern Pacific and Atlantic oceans. This is physically consistent with the climatological conditions in these areas, particularly the eastern Pacific, which is known as a region of large-scale atmospheric subsidence due to the descending branch of the Walker circulation. This downwelling suppresses the deep convection necessary for strong GW generation. Therefore, even when the ITCZ is present, the relative lack of powerful convective sources weakens the coupling between its position and the resulting stratospheric GW activity. The lower correlations observed from eastern South America to the western Pacific may also be related to the influence of climate variability modes that modulate both the ITCZ and regional GW activity.
Next, we examine the trends in the peak values (Qpeak) of refractivity and Ep obtained from Gaussian fits. Figure 10 shows the 11-year seasonal mean zonal profiles of these peak values. The peak refractivity values (Fig. 10b) show pronounced longitudinal variations, with the highest values over the western Pacific, the Maritime Continent, and South Asia during JJA and over the Amazon, Central Africa, and the western Pacific during DJF. These patterns reflect the regions of the most intense convection and convergence. The JJA values are generally higher than the DJF values, particularly in the Asian monsoon region (60–120° E), indicating stronger convergence during the summer of the Northern Hemisphere. The American sector shows higher refractivity values during JJA for all datasets, likely due to stronger winds in this region.
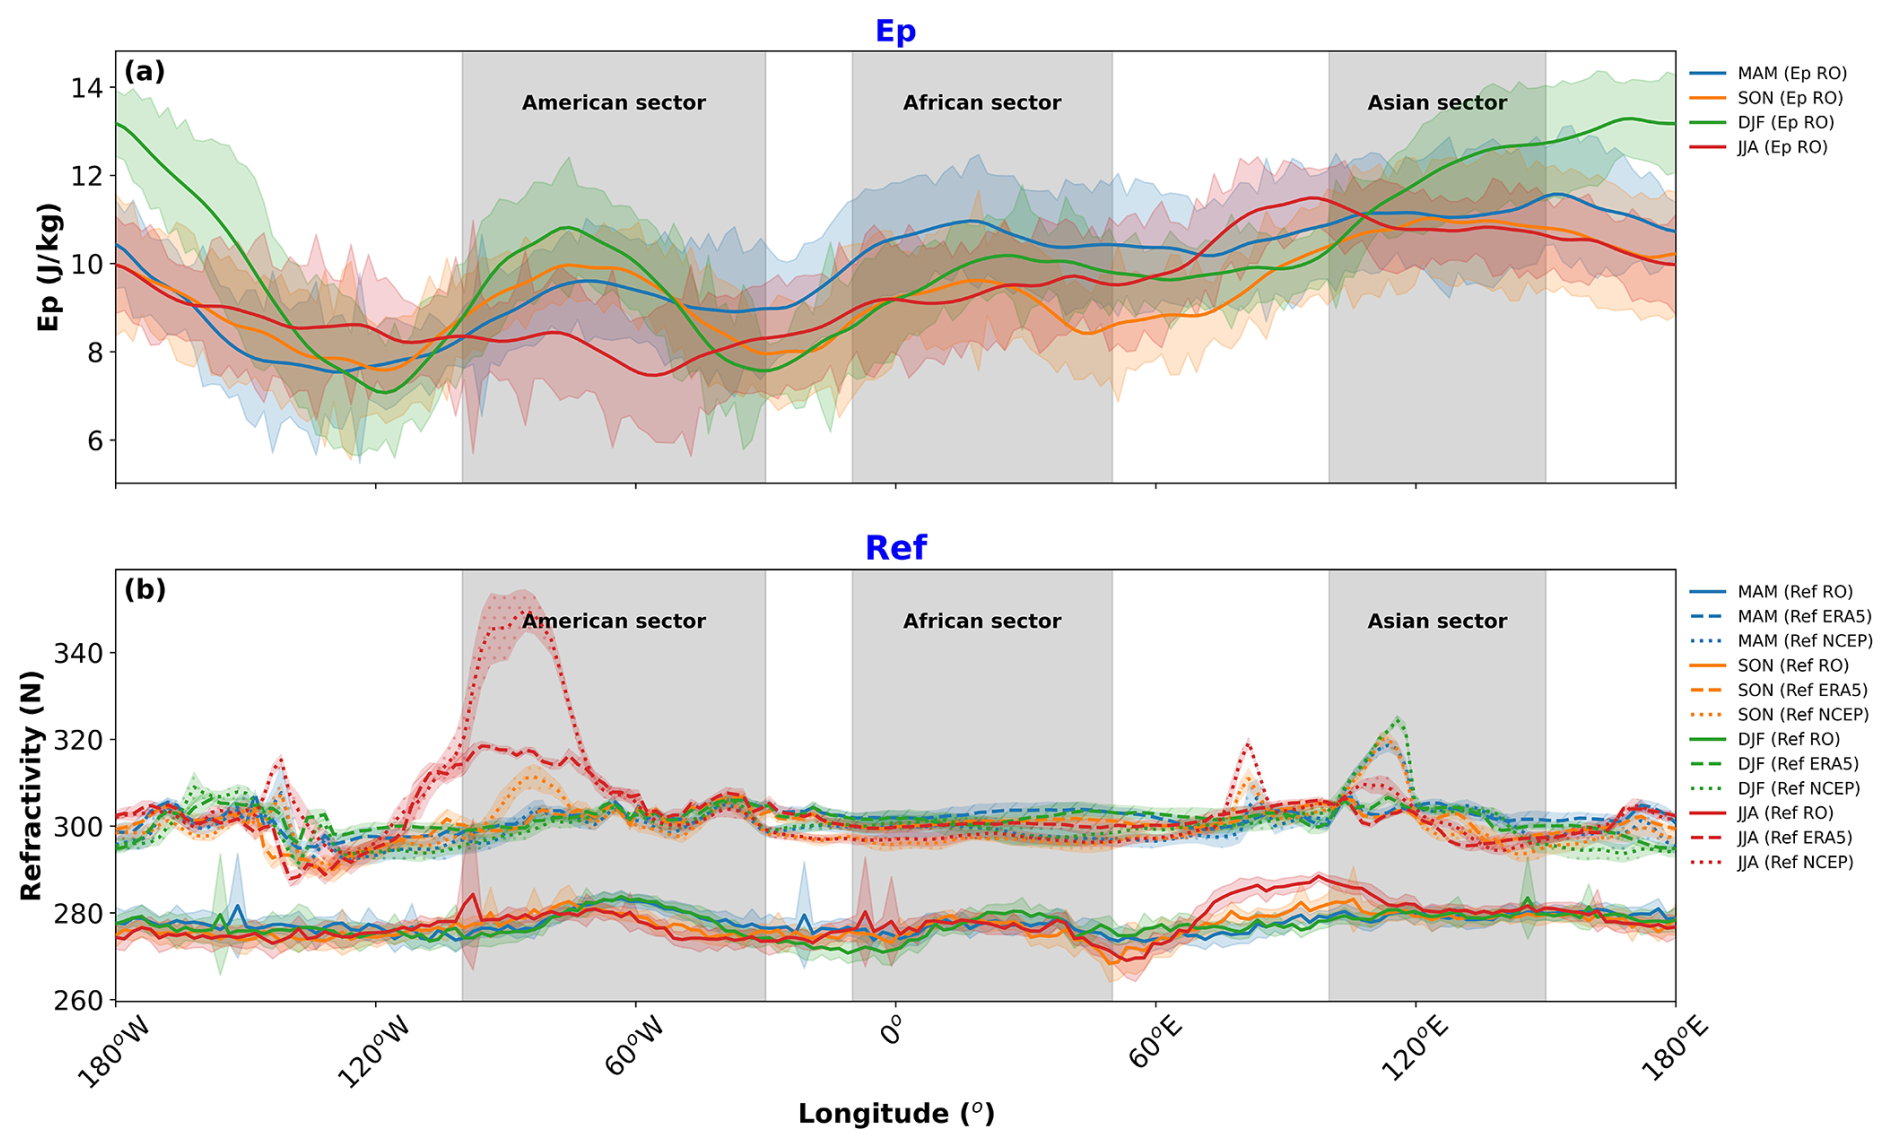
Figure 10Longitudinal profiles of 11-year seasonal mean peak values derived from Gaussian fits. (a) Seasonal mean Ep peak values (, J kg−1) from RO for DJF (green), MAM (blue), JJA (red), and SON (orange). (b) Seasonal mean refractivity peak values (Qpeak,N, N) from RO (solid lines), ERA5 (dashed lines), and NCEP (dotted lines) for DJF (green), MAM (blue), JJA (red), and SON (orange). Shading represents the standard deviation associated with the seasonal mean values.
The peak Ep values (Fig. 10a) also show significant longitudinal variations, but with patterns that do not always match those of refractivity. The highest Ep values occur over the western Pacific and the Maritime Continent in both seasons, with secondary maxima over the Amazon and Central Africa. Unlike refractivity, the DJF Ep values are generally higher than the JJA values in the western hemisphere (120–0° W), while the opposite is true in the eastern hemisphere (0–120° E). This seasonal asymmetry may reflect differences in the efficiency of GW generation, propagation conditions, or the influence of other GW sources. Higher Ep values in the African and Asian sectors during DJF and MAM may be related to increased convective activity in these regions, leading to the enhanced generation of GWs.
The interannual variability, indicated by the shaded areas (1 standard deviation), is substantial for both variables, particularly in regions strongly affected by ENSO (120° E–120° W). This variability motivates our regression analysis to quantify the influence of climate modes.
The linear trends in these peak values are shown in Fig. 11. The trend in peak refractivity (Fig. 11a) fluctuates near zero in most longitudes for all datasets, indicating that there is no significant trend in the intensity of the ITCZ peak during this period. The American sector exhibits a slight positive trend for RO and ERA5, with more significant variations in NCEP. The African sector shows a slight positive trend for NCEP, while RO and ERA5 remain near zero. Over the oceans, the trends are relatively small and stable in the Pacific and Atlantic but more variable in the Indian Ocean, possibly due to regional factors such as precipitation patterns.
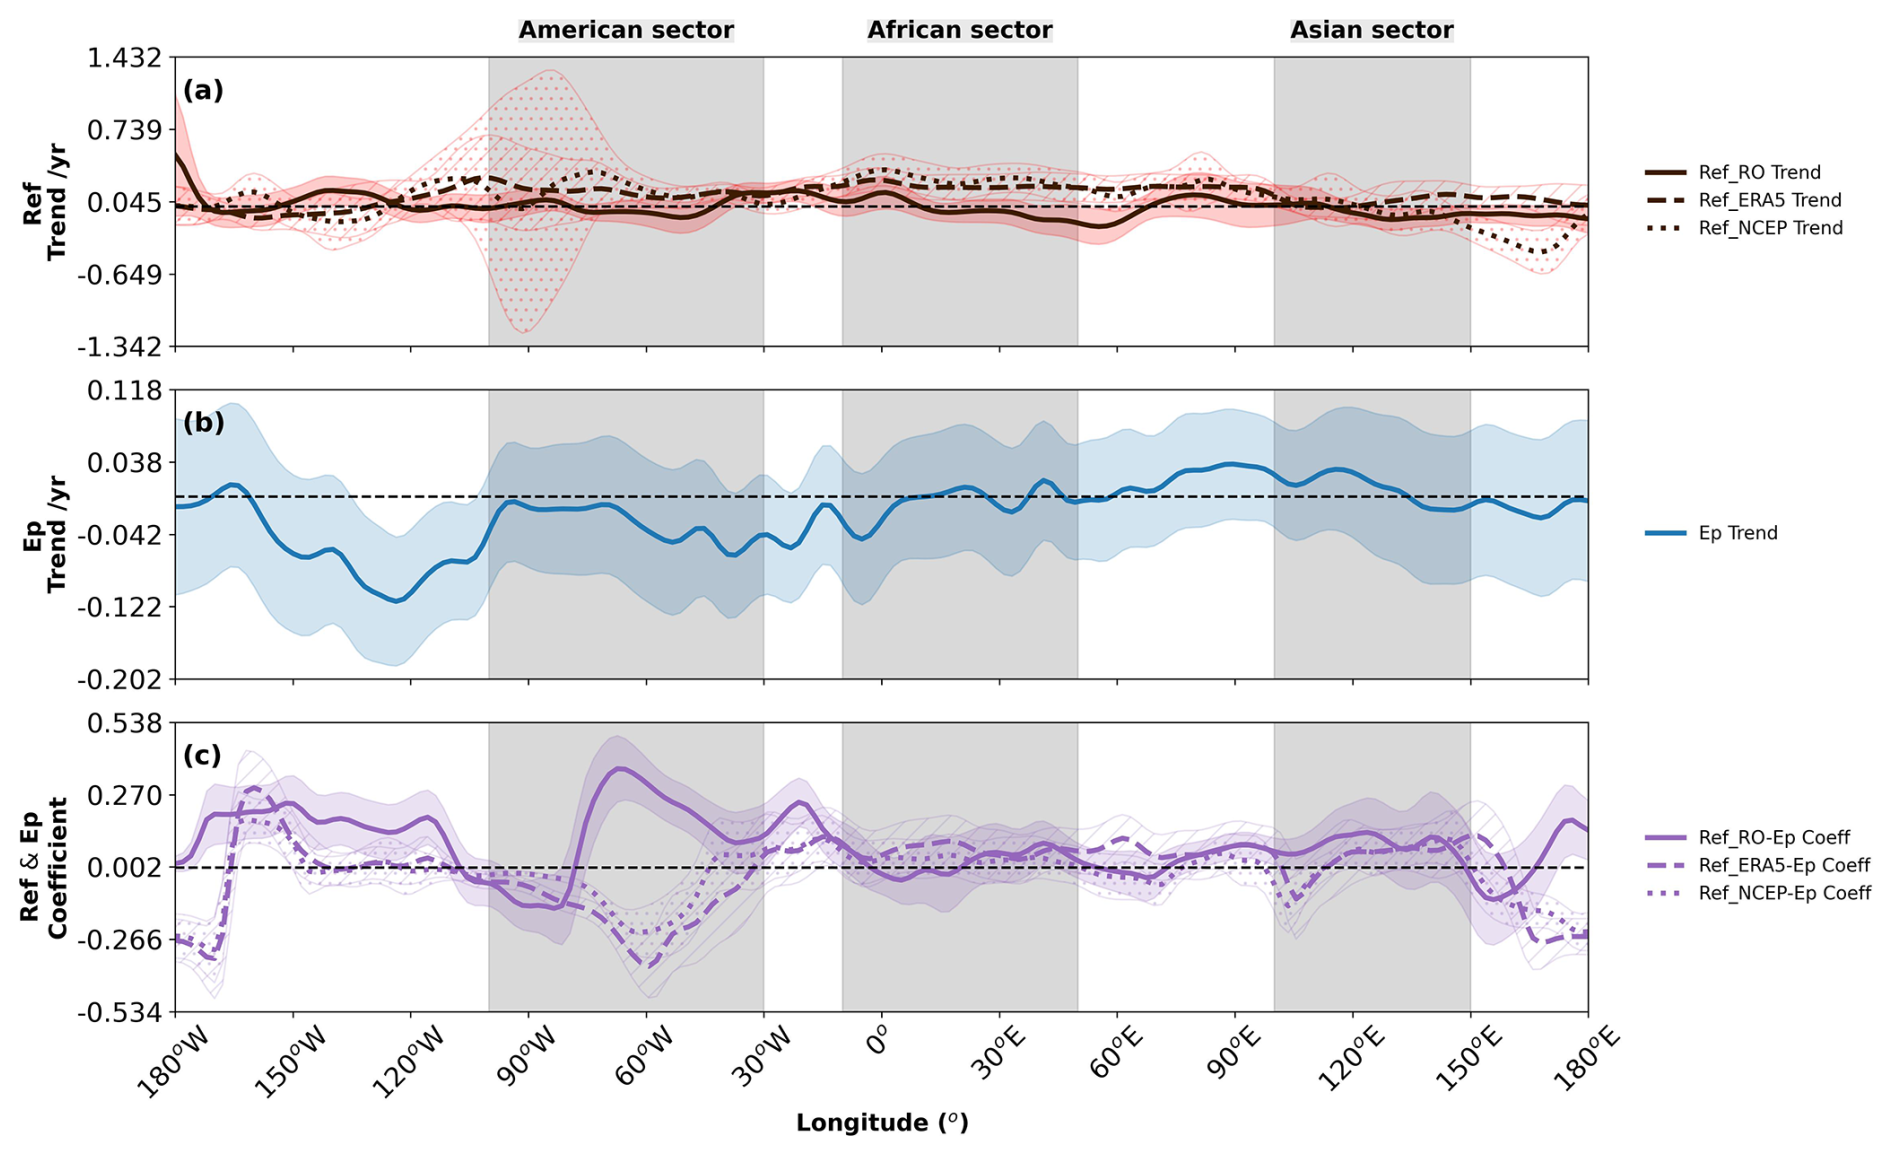
Figure 11Longitudinal structure of linear trends and correlations for ITCZ refractivity peak values (Qpeak,N) and Ep peak values () over 2011–2021. (a) Linear trend in peak refractivity (N yr−1) derived from RO (solid red), ERA5 (dashed red), and NCEP (dotted red). (b) Linear trend in peak Ep () derived from RO (solid blue). (c) Correlation coefficient between monthly peak refractivity (RO: solid purple; ERA5: dashed purple; NCEP: dotted purple) and monthly peak Ep (RO). The dashed black line indicates the zero point along the y axis. Vertical shaded regions and lines are the same as in Fig. 9.
In contrast, the trend at the peak Ep (Fig. 11b) exhibits a predominantly negative trend at most longitudes, suggesting a potential decrease in stratospheric GW activity at the peak over 2011–2021, although the trend is weak and the confidence intervals often overlap zero. The negative trend is particularly pronounced in the African and Asian sectors, indicating a more significant reduction in GW activity in these regions. This general decrease in GW activity over the 11-year period may be related to changes in convective activity or background atmospheric conditions.
The correlation between monthly peak refractivity and peak Ep values (Fig. 11c) is generally positive, particularly over the American sector and parts of the Pacific, suggesting that stronger ITCZ peaks are often associated with higher stratospheric GW activity. However, the correlation is weaker or more variable in the African and Asian sectors. In the Pacific Ocean, the coefficients are generally positive, probably influenced by large-scale ocean–atmosphere interactions such as ENSO. The Atlantic Ocean shows coefficients close to zero, indicating a weak correlation, while the Indian Ocean exhibits a positive but variable correlation.
3.3 Modulation by climate variability modes
We analyse the regression coefficients (α1, α2, α3, and α4 in Eq. 6) associated with ENSO (MEI.v2), the amplitude of MJO, and QBO (at 30 and 50 hPa), respectively. Figure 12 shows these coefficients for the latitudinal positions of the ITCZ and Ep maxima.
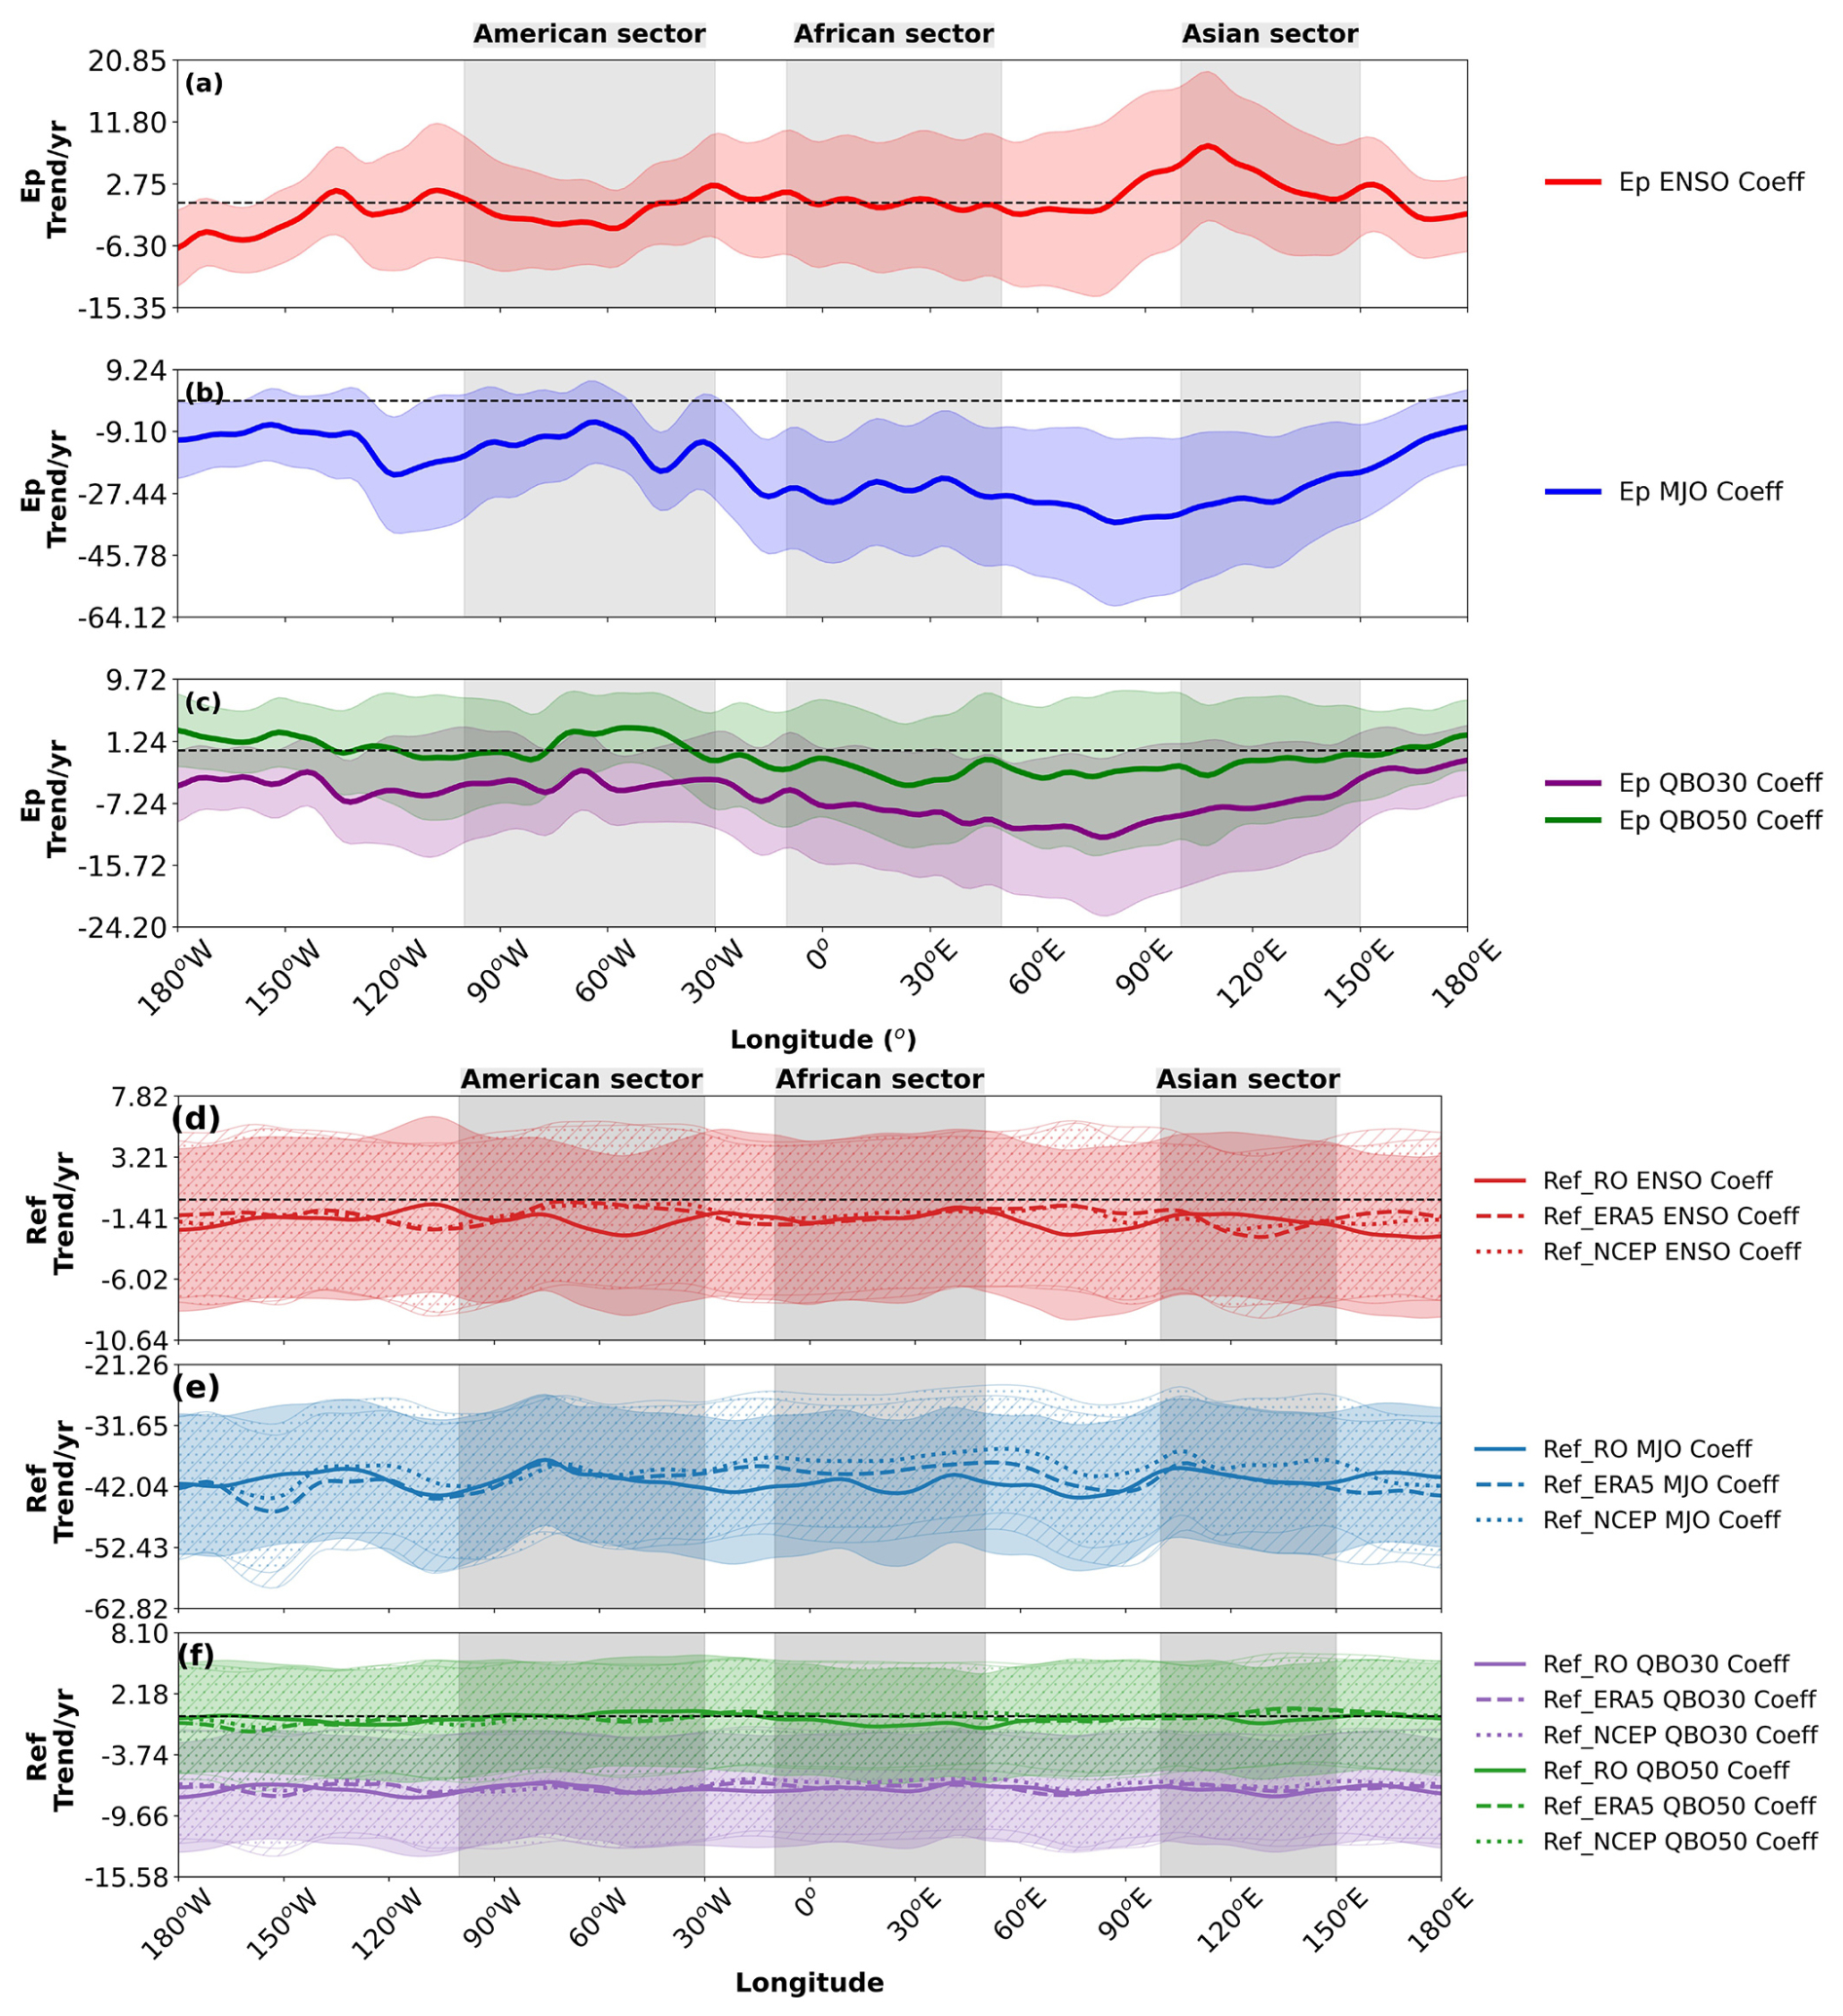
Figure 12Longitudinal structure of regression coefficients relating climate variability modes to the ITCZ and Ep maximum latitudinal positions (ϕmax) over 2011–2021. (a–c) Regression coefficients for the ITCZ position from RO (solid), ERA5 (dashed), and NCEP (dotted) with (a) ENSO (MEI.v2, red), (b) MJO amplitude (blue), and (c) QBO at 30 (purple) and 50 hPa (green). (d–f) Regression coefficients for the Ep maximum position with (d) ENSO (red), (e) MJO amplitude (blue), and (f) QBO at 30 (purple) and 50 hPa (green). Units are degrees latitude per index unit. Vertical shaded regions and lines are the same as in Fig. 9.
The ENSO coefficients (Fig. 12a and d) show the strongest and most coherent signal among the climate modes. For the ITCZ position (Fig. 12a), positive MEI.v2 values (El Niño conditions) are associated with a northward shift in the American sector (approximately 0.5° latitude per unit ENSO index) and a southward shift in the African and Asian sectors (approximately −0.3 to −0.5° latitude per unit ENSO index). This pattern is consistent across all three datasets, although ERA5 and NCEP show more variability than RO, particularly in the African and Asian sectors. This pattern reflects the well-known ENSO-induced changes in the Walker circulation, with enhanced convection in the central and eastern Pacific and suppressed convection over the Maritime Continent during El Niño events.
The ENSO influence on the Ep maximum position (Fig. 12d) shows similar regional patterns, albeit with some differences in magnitude and spatial structure. The coefficients vary longitudinally, with positive values (up to 0.5° latitude per unit ENSO index) in parts of the Asian sector and negative values (approximately −0.3 to −0.5° latitude per unit ENSO index) in the American sector and parts of the African sector. This indicates that during positive ENSO phases (El Niño), the Ep maxima shift northward in much of the Asian sector but southward in the American sector. These differences may reflect the complex interaction between ENSO-induced changes in convection and stratospheric circulation, which affects GW propagation.
The MJO coefficients (Fig. 12b and e) show more localized and generally weaker influences than ENSO. For the ITCZ position (Fig. 12b), the MJO coefficients indicate a predominantly negative effect across most longitudes, with the strongest signals in the African and Asian sectors. This suggests that during active MJO periods (higher amplitude), the ITCZ tends to shift southward in these regions by approximately −0.2 to −0.4° latitude per unit MJO index. The pattern shows some variability across datasets, with RO data exhibiting more pronounced negative coefficients in the African sector compared to reanalysis products. The Maritime Continent and western Pacific (90–150° E) show particularly strong MJO effects, where an increased MJO amplitude is associated with equatorward shifts. This pattern is consistent with the enhanced equatorial convection during active MJO phases.
For the Ep maximum position (Fig. 12e), the MJO coefficients show a more complex longitudinal pattern, with both positive and negative values. The coefficients are predominantly negative in the African and Asian sectors (approximately −0.2 to −0.4° latitude per unit MJO index), but they show more variability in the American sector (with some positive values). This suggests that during active MJO periods, the Ep maxima generally shift southward in the eastern hemisphere but may shift northward in parts of the western hemisphere. This regional variation likely reflects the complex interaction between MJO-related convective activity and atmospheric wave dynamics, which can vary significantly with longitude due to differences in land–sea distribution and background atmospheric conditions.
The QBO coefficients (Fig. 12c and f) show the weakest influence on the ITCZ position (Fig. 12c), which is expected given that QBO is primarily a stratospheric phenomenon. The coefficients show minor but generally negative values across most longitudes, particularly for the QBO at 50 hPa. The influence is most pronounced in the African sector, with coefficients around −0.1 to −0.2° latitude per unit QBO index, and shows relatively small differences between datasets. This suggests that during the westerly phase of the QBO, the ITCZ tends to shift slightly southward, although the effect is small compared to ENSO and MJO.
For the Ep maximum position (Fig. 12f), the QBO shows a more significant influence, with a distinct longitudinal pattern. The coefficients for both 30 hPa and 50 hPa QBO are near zero or slightly positive in parts of the American sector but become negative in the African and Asian sectors (approximately −0.1 to −0.3° latitude per unit QBO index). This indicates a southward shift in the Ep maxima during the westerly phase of the QBO in these regions. The QBO at 30 hPa generally shows stronger effects than at 50 hPa, particularly in the Pacific region. This more pronounced effect on Ep compared to the ITCZ reflects the direct influence of the QBO on stratospheric wave propagation through critical-level filtering and changes in background wind conditions.
Figure 13 shows the regression coefficients for the peak values of refractivity and Ep with the modes of climate variability. The ENSO coefficients for Ep peak values (Fig. 13a) show a distinct longitudinal pattern, with predominantly positive values in the American sector (approximately 0.5–1.0 J kg−1 per unit ENSO index) and more variable values in the African and Asian sectors. This indicates that during positive ENSO phases (El Niño), GW activity tends to increase significantly in the American sector and parts of the Pacific region. This enhancement is likely related to increased convective activity during El Niño events, which generates more GWs, particularly in regions where ENSO has a strong influence on tropical convection.
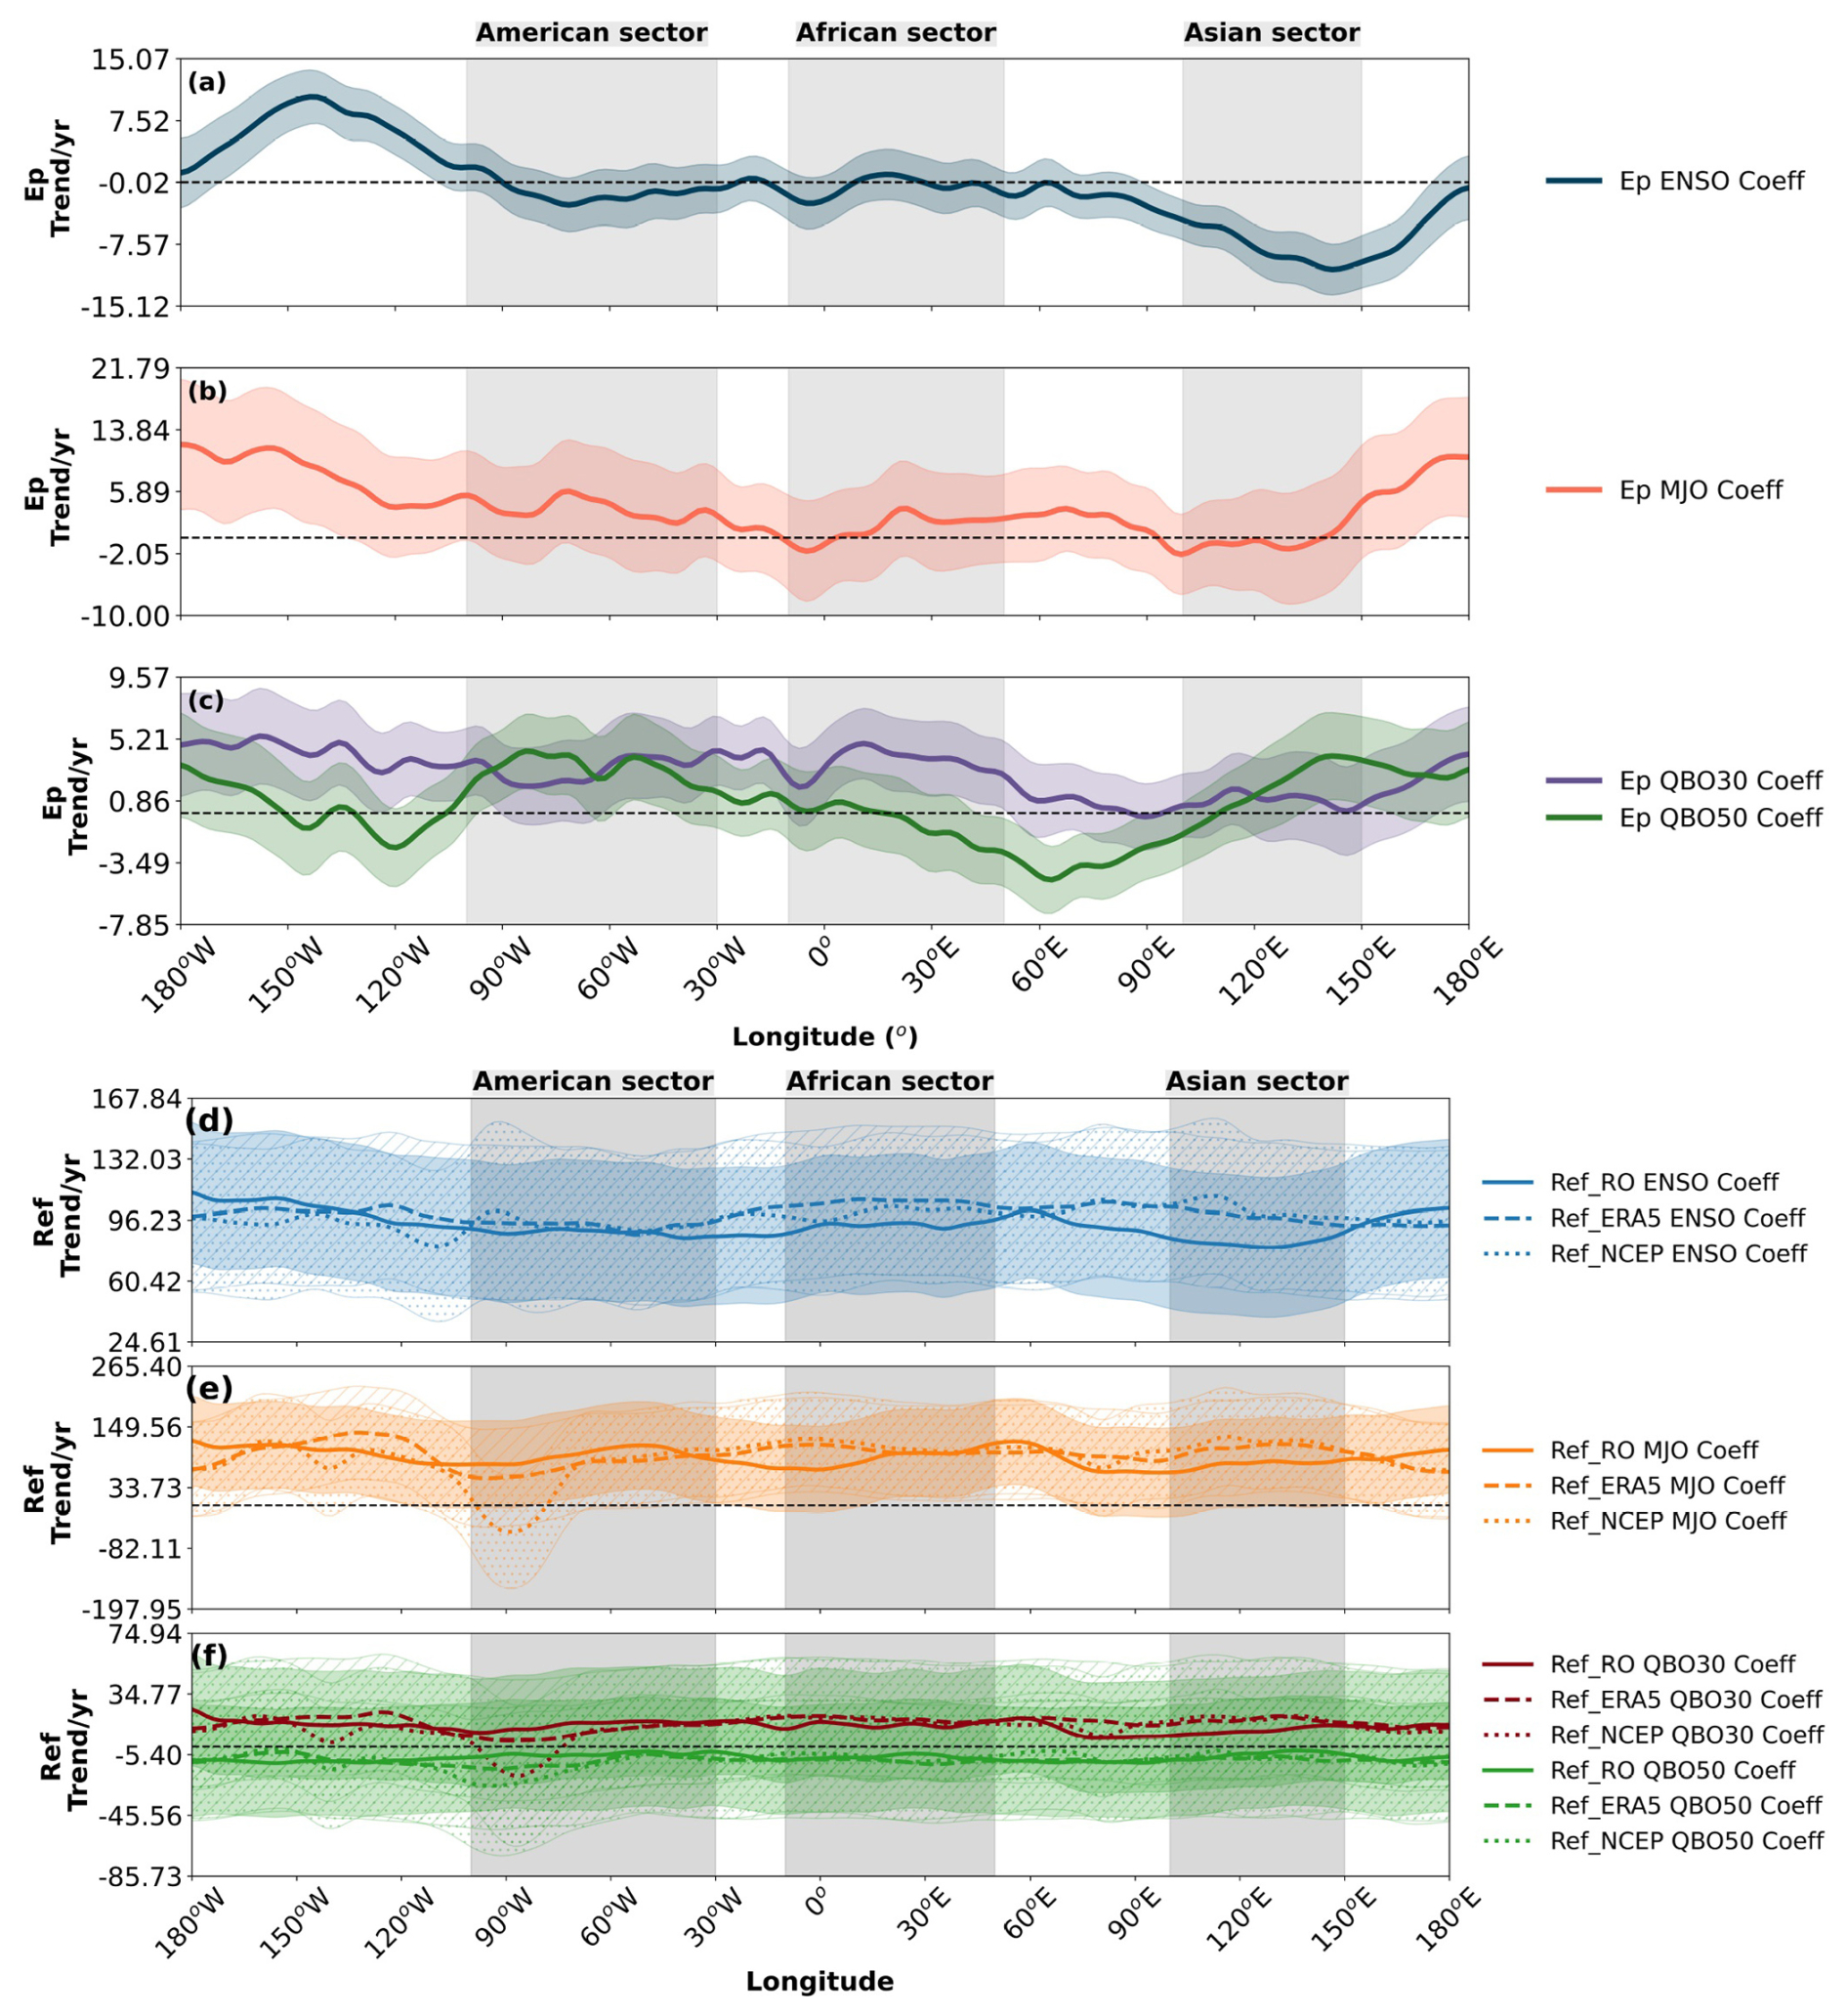
Figure 13Longitudinal structure of regression coefficients relating climate variability modes to refractivity and Ep peak values (Qpeak) over 2011–2021. (a–c) Regression coefficients for Ep peak values with (a) ENSO (red), (b) MJO amplitude (blue), and (c) QBO at 30 (purple) and 50 hPa (green). (d–f) Regression coefficients for refractivity peak values from RO (solid), ERA5 (dashed), and NCEP (dotted) with (d) ENSO (red), (e) MJO amplitude (blue), and (f) QBO at 30 (purple) and 50 hPa (green). Units are N or J kg−1 per index unit. Vertical shaded regions and lines are the same as in Fig. 9.
For refractivity peak values (Fig. 13d), the ENSO coefficients show significant longitudinal variability across all datasets. The RO data (solid red line) show predominantly positive coefficients across most longitudes, with the strongest signals in the American sector (approximately 2–4 N per unit ENSO index) and parts of the Asian sector. ERA5 and NCEP data show similar patterns but with some differences in magnitude and regional detail. This suggests a direct relationship between ENSO and refractivity in these regions, with El Niño conditions generally associated with higher refractivity values, indicating enhanced moisture convergence in the lower troposphere.
The MJO coefficients for the peak values of Ep (Fig. 13b) exhibit a complex longitudinal pattern, with alternating positive and negative values. Positive coefficients (approximately 0.2–0.5 J kg−1 per unit MJO index) are observed in parts of the Asian sector (particularly between 120 and 150° E) and in limited regions of the American sector, while negative coefficients dominate in the African sector and parts of the Pacific. This pattern suggests that the MJO has a regionally variable influence on GW activity, likely reflecting the eastward propagation of MJO-related convective anomalies, which enhance GW generation in some regions, while suppressing it in others.
For the peak refractivity values (Fig. 13e), the MJO coefficients show significant longitudinal variability across all datasets. The RO data (solid blue line) exhibit both positive and negative values, with notable differences from the reanalysis products in some regions. The coefficients are generally negative in the Pacific and Atlantic regions, particularly in the NCEP data, suggesting that increased MJO activity tends to reduce refractivity in these areas. This complex pattern likely reflects the regional variations in how MJO affects tropical convection and moisture distribution as well as differences in how these processes are represented in observational and reanalysis datasets.
The QBO coefficients for Ep peak values (Fig. 13c) are generally smaller in magnitude compared to ENSO and MJO coefficients, indicating a less pronounced but still detectable effect on GW activity. The QBO at 30 hPa (purple line) shows predominantly negative values in the American sector (approximately −0.1 to per unit QBO index) and more variable values in other regions. The QBO at 50 hPa (green line) exhibits a more oscillatory pattern with alternating positive and negative values across different longitudes, including some positive coefficients in the Asian sector. This longitudinal variability suggests that the QBO's influence on GW activity depends on regional factors such as the background wind structure and the dominant sources of GWs.
For refractivity peak values (Fig. 13f), the QBO coefficients have the smallest magnitudes among the three climate modes, consistent with the QBO being primarily a stratospheric phenomenon with limited direct influence on tropospheric processes. The coefficients show slight positive and negative variations around the globe, with values generally within ±1 N-unit per unit QBO index. Over oceanic regions, particularly in the Pacific and Atlantic, most QBO trends remain close to zero, indicating minimal effect on lower-tropospheric moisture convergence. The small but non-zero coefficients may reflect indirect influences of the QBO on tropospheric circulation through stratosphere–troposphere coupling mechanisms.
These results highlight the different sensitivities of the American, African, and Asian regions to MJO and QBO, with the American and Asian regions showing more pronounced responses to ENSO, especially in the RO data. The effects of ENSO are most significant in oceanic regions, particularly the Pacific Ocean, indicating a strong correlation between sea-surface temperature anomalies and atmospheric refractivity. The MJO shows distinct effects over the oceans, especially the Pacific, while the QBO exhibits a smaller effect in oceanic regions. The RO data often show stronger trends compared to the reanalysis datasets, possibly because of the higher resolution and sensitivity of the GNSS RO measurements.
In general, our regression analysis demonstrates that climate variability modes significantly modulate both the positions and intensities of the ITCZ and stratospheric GW activity, with distinct regional signatures. ENSO exerts the strongest influence, followed by the MJO, while the QBO primarily affects the stratospheric GW characteristics rather than the tropospheric ITCZ. These findings highlight the complex interactions between the modes of climate variability and the ITCZ and stratospheric GW activity, with important implications for understanding and predicting tropical atmospheric dynamics.
This study investigated the relationship between the ITCZ and stratospheric GW activity in the tropics and how this relationship is modulated by major climate variability modes. Using RO refractivity as a proxy for the ITCZ and RO temperature profiles to calculate the GW potential energy (Ep), we have demonstrated a clear spatial and temporal correspondence between these phenomena over the 11-year period (2011–2021).
Our analysis confirms that the ITCZ, identified by refractivity measurements, shows a clear seasonal migration between the hemispheres, shifting approximately 10° in latitude between DJF and JJA. This seasonal movement follows the region of maximum solar heating and is consistent with previous studies (Gu and Zhang, 2002; Hu et al., 2007; Läderach and Raible, 2013; Byrne et al., 2018; Schneider et al., 2014). The stratospheric GW activity, as indicated by the Ep maxima, exhibits similar seasonal patterns but with some notable differences. The latitudinal separation between the DJF and JJA Ep maxima (approximately 5°) is consistently smaller than that of the ITCZ (approximately 10°), suggesting that while the generation of GWs is linked to the ITCZ, their propagation and stratospheric distribution are influenced by additional factors, most notably the filtering effects of the background winds, such as the QBO, stratospheric jets, and sudden stratospheric warming (SSW) events.
The GW Ep maximum is typically located slightly equatorward of the ITCZ, particularly during JJA. This offset probably reflects the influence of stratospheric winds on GW propagation. During JJA, stratospheric easterlies in the summer hemisphere (Northern Hemisphere) tend to filter out eastward-propagating GWs, while allowing westward-propagating waves to reach higher altitudes (Alexander et al., 2010). This filtering effect, combined with the meridional propagation of GWs away from their sources, can shift the region of maximum GW activity relative to the convective source region.
The convergence of Ep maxima over the South American Amazon and the equatorial Pacific, where the seasonal positions nearly coincide, is a particularly interesting feature. These regions are characterized by persistent deep convection (Garcia and Kayano, 2010; Boers et al., 2013; Rojas et al., 2016) and, in the case of the Pacific, by the presence of a double ITCZ (Hwang and Frierson, 2013; Zhang et al., 2019; Tian and Dong, 2020). The convergence suggests that these areas maintain relatively constant GW activity throughout the year, despite seasonal changes in the ITCZ position.
The spatial relationship between the ITCZ and GW activity is further supported by the correspondence between regions of high refractivity, low OLR (indicating deep convection), upward vertical motion, and enhanced Ep values. This relationship is particularly strong over land areas, such as South America, Africa, and the Asian monsoon region, where deep convective systems are more intense and frequent. The positive correlation found between ITCZ position shifts and Ep position shifts, as well as between peak refractivity values and peak Ep values across many longitudes, reinforces the physical link between the ITCZ convective strength/location and the resulting stratospheric GW activity.
However, some discrepancies are observed, particularly over western and equatorial South America during JJA, where GW activity decreases despite the presence of the ITCZ. This suggests that factors other than the ITCZ, such as changes in background wind conditions or ENSO-related drying, can modulate GW activity in certain regions and seasons. The complex interplay between convective sources, background atmospheric conditions, and wave propagation processes highlights the need for a comprehensive approach to understanding the generation of GWs in the tropics.
Our multilinear regression analysis reveals significant influences of climate variability modes on both the ITCZ and stratospheric GW activity, with distinct regional patterns and varying magnitudes of impact. ENSO emerged as the dominant mode of variability. During El Niño conditions, the ITCZ position tends to shift northward in the American sector but southward in the African and Asian sectors. The Ep maximum position under El Niño shifts northward in the Asian sector but southward in the American sector. These patterns are consistent with ENSO's large-scale alterations of tropical circulation (e.g. Walker circulation) and convective centres (Xie et al., 2018; Adam et al., 2016; Mamalakis et al., 2021). Furthermore, El Niño generally enhances peak GW activity (Ep values), particularly in the American sector and over the Pacific, and also tends to increase peak refractivity values, likely due to intensified or reorganized convection (Zhou et al., 2024). The differences in ENSO's impact on the Ep maximum position vs. the ITCZ position suggest that ENSO affects GW activity not only by modulating convective sources but also by altering stratospheric conditions influencing wave propagation, such as changes in subtropical jets and the Brewer–Dobson circulation (Calvo et al., 2010).
The MJO's influence is characterized by a fairly consistent southward shift in both the ITCZ position and the Ep maximum position during active MJO periods (higher amplitude), with the strongest effects on the ITCZ position over the Maritime Continent/western Pacific and for the Ep position in the African and Asian sectors. The impact of the MJO on peak Ep values and peak refractivity values is more variable longitudinally, showing alternating positive and negative regression coefficients. This variability may reflect the eastward propagation of MJO convective anomalies and its complex interaction with background conditions (Moss et al., 2016; Alexander et al., 2018; Kalisch et al., 2018). The monthly mean data used here might smooth some MJO intraseasonal signals.
The QBO's influence is weaker on the tropospheric ITCZ compared to stratospheric GWs. Westerly QBO phases are associated with small southward shifts in the ITCZ position and more noticeable southward shifts in the Ep maximum position, particularly in the African and Asian sectors. The QBO's impact on peak Ep values and peak refractivity values is generally subtle. This is consistent with the QBO primarily modulating GWs through critical-level filtering and altering stratospheric wave propagation conditions rather than directly forcing tropospheric convective strength (Baldwin et al., 2001; Alexander et al., 2018; Diallo et al., 2019, 2021).
Regarding long-term trends over 2011–2021, our analysis indicates that the ITCZ latitudinal position shows weak and regionally varying trends, with some tendency towards northward shifts in certain areas, although they often may not be statistically significant (using the error margins) over large bands. Similarly, the Ep maximum position trend also fluctuates regionally, with northward tendencies in the African/Asian sectors and southward in parts of the American sector, again with wide confidence intervals. These findings are broadly consistent with other studies suggesting complex regional responses rather than a uniform global shift over similar timescales (Byrne et al., 2018).
In contrast to the latitudinal positions, trends in the peak values show different behaviours. Peak refractivity values at the ITCZ show little consistent change over the 11-year period, fluctuating near zero across most longitudes. This suggests that while the ITCZ position might undergo subtle shifts, its peak intensity (as measured by refractivity) has remained relatively stable over this period. However, peak Ep values show a predominantly negative trend across most longitudes, indicating a potential general decrease in peak stratospheric GW activity. This decrease is particularly visible in the African and Asian sectors. The contrasting trends between the ITCZ peak intensity and GW peak activity suggest that factors beyond just the peak convective strength within the ITCZ, such as changes in the broader convective characteristics, background atmospheric conditions (temperature gradients, wind shears affecting wave generation or propagation), or an increase in wave filtering, might be influencing the observed GW activity. A negative trend in GW activity could have implications for the momentum budget of the middle atmosphere and the driving of large-scale circulations.
Our study demonstrates the utility of RO data for investigating both tropospheric and stratospheric processes. The high vertical resolution of RO measurements makes them particularly valuable for detecting GWs with short vertical wavelengths, which are often poorly resolved in reanalysis models. The global coverage and all-weather capability of RO observations also provide advantages over other remote-sensing techniques, particularly in remote oceanic regions where conventional observations are sparse. The use of refractivity as an ITCZ proxy proved effective, and our refractivity-derived ITCZ positions showed good agreement with traditional indicators such as specific humidity, vertical velocity, and OLR. This approach leverages the sensitivity of RO refractivity to water vapour in the lower troposphere, providing a physically based method for tracking the ITCZ that is consistent with its definition as a zone of convergence.
Several limitations of our study should be acknowledged. First, the 11-year period (2011–2021) is relatively short to detect robust climate trends, and observed trends may be influenced by natural variability rather than long-term climate change. Longer time series would provide more confidence in the trend estimates and allow for better separation of different timescales of variability. Second, our analysis focused on monthly mean data, which may smooth out important sub-monthly variations, particularly for phenomena like the MJO. Future studies using higher-frequency data could provide more detailed information on the intraseasonal modulation of the ITCZ–GW relationship. Third, while our regression model accounts for the linear influences of climate modes, it does not capture potential nonlinear interactions between different modes or lagged relationships. More sophisticated statistical techniques, such as nonlinear regression or machine learning approaches, could potentially reveal more complex patterns of climate-mode influences. Fourth, our study was limited to a single altitude level (20 km) for GW analysis. Extending the analysis to multiple levels would provide a more complete picture of GW propagation and dissipation throughout the stratosphere and mesosphere. Finally, while our observational approach provides valuable insight into the ITCZ–GW relationship and its modulation by climate modes, it does not directly address the underlying physical mechanisms.
This study investigated the relationship between the ITCZ and stratospheric GW activity and its modulation by major climate variability modes using GNSS RO data from COSMIC-1, COSMIC-2, and MetOp satellites (2011–2021), compared with ERA5 and NCEP reanalyses. We used refractivity at 850 hPa as an ITCZ proxy and temperature profiles around 20 km for GW potential energy (Ep) calculation, employing Gaussian fitting to identify latitudinal peaks and multivariate regression to quantify climate-mode modulation. Our key findings are summarized as follows:
-
The ITCZ and stratospheric GW Ep maxima exhibit coherent seasonal migrations, shifting approximately 10° in latitude between DJF and JJA, generally following solar heating. The stratospheric Ep maximum is typically located slightly equatorward of the ITCZ, particularly during JJA, with a smaller seasonal latitudinal separation (∼5°) compared to the ITCZ (∼10°), indicating the seasonal correspondence in the concentration of stratospheric GW Ep and the ITCZ.
-
A strong spatial relationship exists between the ITCZ and enhanced GW activity, especially over landmasses like South America, Africa, and the Asian monsoon region. This is supported by the alignment of the ITCZ and Ep maxima with high specific humidity, low OLR, and upward vertical motion, confirming deep convection as a primary GW source. Both features display significant longitudinal variations in their positions, peak values, and trends, reflecting regional geographical and circulation influences.
-
ENSO exerts the most substantial modulation on both ITCZ and GW Ep characteristics, with distinct regional patterns. El Niño conditions correlate with northward ITCZ shifts in the American sector and southward shifts in the African and Asian sectors. For GW Ep maxima, El Niño leads to northward shifts in the Asian sector but southward shifts in the American sector. ENSO generally enhances GW activity (peak Ep values) and peak ITCZ refractivity, as particularly evident in RO data.
-
MJO consistently induces a southward shift in both the ITCZ and Ep maxima positions across many longitudes during active phases, with the strongest impact on the ITCZ position over the Maritime Continent/western Pacific and on Ep position in the African and Asian sectors. Its influence on GW and refractivity peak values shows zonal variations linked to the MJO's eastward propagation.
-
The QBO shows a weaker but detectable influence, primarily on stratospheric GW Ep, with minor effects on the tropospheric ITCZ. Westerly QBO phases are generally associated with southward shifts in Ep maxima, especially in the African and Asian sectors, and subtle changes in wave amplitudes due to altered propagation conditions.
-
Over the 2011–2021 period, the ITCZ latitudinal position shows weak and regionally varying trends, while the Ep maxima position also exhibits regional variability without a strong global trend. In contrast, peak refractivity at the ITCZ shows little consistent change, whereas peak Ep values display a predominantly negative trend across most longitudes, suggesting a potential decrease in peak stratospheric GW activity. Interannual variations in the ITCZ and Ep positions and strengths are positively correlated in many regions, further supporting their physical connection.
-
RO, ERA5, and NCEP generally agree with respect to the mean ITCZ structure and broad modulation patterns, but RO data often reveal stronger responses and trends, likely due to their higher resolution and direct sensitivity to atmospheric properties, highlighting the value of RO observations for studying atmospheric wave dynamics.
Complementary modelling studies, ideally using high-resolution models that can explicitly resolve GWs, would help to characterize the causal pathways linking climate variability, convection, and wave dynamics.
CDAAC, ECMWF, and NOAA exclusively provided the data used in this study; the datasets were obtained from http://cdaac-www.cosmic.ucar.edu/cdaac (last access: 10 August 2023), https://www.ecmwf.int/en/forecasts/dataset/ecmwf-reanalysis-v5 (last access: 12 July 2023), and https://psl.noaa.gov/data/gridded/data.ncep.reanalysis.html (last access: 12 July 2023), respectively.
Conceptualization: TTA, CMW, and HT; methodology: TTA; software: TTA; validation: CMW, HT, and LFS; formal analysis: TTA; investigation: TTA; data curation: TTA; writing – original draft preparation: TTA; writing – review and editing: TTA, CMW, HT, LFS, MAD, CAOBF, and LAdS; visualization: DB, AVB, and PE; supervision: CMW, MAD, and HT; project administration: TTA; funding acquisition: CMW.
The contact author has declared that none of the authors has any competing interests.
Publisher's note: Copernicus Publications remains neutral with regard to jurisdictional claims made in the text, published maps, institutional affiliations, or any other geographical representation in this paper. While Copernicus Publications makes every effort to include appropriate place names, the final responsibility lies with the authors.
The authors acknowledge CDAAC, ECMWF, and NOAA for providing the data used in this study.
This research has been supported by the Brazilian Ministry of Science, Technology, and Innovation (MCTI) and the Brazilian Space Agency (AEB) under grant no. 20VB.0009; the Conselho Nacional de Desenvolvimento Científico e Tecnológico (CNPq) under grant nos. 141373/2019-9 and 303871/2023-7; the Fundação de Apoio à Pesquisa do Estado da Paraíba (FAPESQ) under grant no. 2021/04696-6; and the Fundação de Apoio à Pesquisa do Estado de São Paulo (FAPESP).
This paper was edited by Farahnaz Khosrawi and reviewed by two anonymous referees.
Adam, O., Bischoff, T., and Schneider, T.: Seasonal and interannual variations of the energy flux equator and ITCZ. Part I: Zonally averaged ITCZ position, J. Climate, 29, 3219–3230, https://doi.org/10.1175/JCLI-D-15-0512.1, 2016. a, b
Alexander, M., Grimsdell, A., Stephan, C. C., and Hoffmann, L.: MJO-related intraseasonal variation in the stratosphere: Gravity waves and zonal winds, J. Geophys. Res.-Atmos., 123, 775–788, https://doi.org/10.1002/2017JD027620, 2018. a, b, c, d
Alexander, M. J. and Vincent, R. A.: Gravity waves in the tropical lower stratosphere: a model study of seasonal and interannual variability, J. Geophys. Res.-Atmos., 105, https://doi.org/10.1029/2000JD900197, 2000. a
Alexander, M. J., Beres, J. H., and Pfister, L.: Tropical stratospheric gravity wave activity and relationships to clouds, J. Geophys. Res.-Atmos., 105, 22299–22309, https://doi.org/10.1029/2000JD900326, 2000. a
Alexander, M. J., May, P. T., and Beres, J. H.: Gravity waves generated by convection in the Darwin area during the Darwin Area Wave Experiment, J. Geophys. Res.-Atmos., 109, https://doi.org/10.1029/2004JD004729, 2004. a
Alexander, P., de la Torre, A., and Llamedo, P.: Interpretation of gravity wave signatures in GPS radio occultations, J. Geophys. Res.-Atmos., 113, 22299–22309, https://doi.org/10.1029/2007JD009390, 2008. a, b, c
Alexander, P., Luna, D., Llamedo, P., and de la Torre, A.: A gravity waves study close to the Andes mountains in Patagonia and Antarctica with GPS radio occultation observations, Ann. Geophys., 28, 587–595, https://doi.org/10.5194/angeo-28-587-2010, 2010. a, b, c, d, e
Anthes, R. A., Bernhardt, P. A., Chen, Y., Cucurull, L., Dymond, K. F., Ector, D., Healy, S. B., Ho, S.-P., Hunt, D. C., Kuo, Y.-H., Liu, H., Manning, K., McCormick, C., Meehan, T. K., Randel, W. J., Rocken, C., Schreiner, W. S., Sokolovskiy, S. V., Syndergaard, S., Thompson, D. C., Trenberth, K. E., Wee, T.-K., Yen, N. L., and Zeng, Z.: The COSMIC/FORMOSAT-3 mission: Early results, B. Am. Meteorol. Soc., 89, 313–334, https://doi.org/10.1175/BAMS-89-3-313, 2008. a
Ayorinde, T. T., Wrasse, C. M., Takahashi, H., da Silva Barros, D., Figueiredo, C. A. O. B., Lomotey, S. O., Essien, P., and Bilibio, A. V.: Stratospheric gravity wave potential energy and tropospheric parameters relationships over South America: a study using COSMIC-2 and METOP radio occultation measurements, Earth Planets Space, 75, https://doi.org/10.1186/s40623-023-01891-8, 2023. a, b
Ayorinde, T. T., Wrasse, C. M., Takahashi, H., Barros, D., Figueiredo, C. A. O. B., da silva, L. A., and Bilibio, A. V.: Investigation of the long-term variation of gravity waves over South America using empirical orthogonal function analysis, Earth Planets Space, 76, 105, https://doi.org/10.1186/s40623-024-02045-0, 2024. a
Bain, C. L., De Paz, J., Kramer, J., Magnusdottir, G., Smyth, P., Stern, H., and Wang, C.-C.: Detecting the ITCZ in instantaneous satellite data using spatiotemporal statistical modeling: ITCZ climatology in the east Pacific, J. Climate, 24, 216–230, https://doi.org/10.1175/2010JCLI3716.1, 2011. a, b
Baldwin, M. P., Gray, L. J., Dunkerton, T. J., Hamilton, K., Haynes, P. H., Randel, W. J., Holton, J. R., Alexander, M. J., Hirota, I., Horinouchi, T., Jones, D. B. A., Kinnersley, J. S., Marquardt, C., Sato, K., and Takahashi, M.: The quasi-biennial oscillation, Rev. Geophys., 39, 179–229, https://doi.org/10.1029/1999RG000073, 2001. a, b
Basha, G., Kishore, P., Ratnam, M. V., Ouarda, T. B., Velicogna, I., and Sutterley, T.: Vertical and latitudinal variation of the intertropical convergence zone derived using GPS radio occultation measurements, Remote Sens. Environ., 163, 262–269, https://doi.org/10.1016/j.rse.2015.03.024, 2015. a, b
Boers, N., Bookhagen, B., Marwan, N., Kurths, J., and Marengo, J.: Complex networks identify spatial patterns of extreme rainfall events of the South American Monsoon System, Geophys. Res. Lett., 40, 4386–4392, https://doi.org/10.1002/grl.50681, 2013. a
Byrne, M. P., Pendergrass, A. G., Rapp, A. D., and Wodzicki, K. R.: Response of the intertropical convergence zone to climate change: Location, width, and strength, Current Climate Change Reports, 4, 355–370, https://doi.org/10.1007/s40641-018-0110-5, 2018. a, b
Calvo, N., Garcia, R., Randel, W., and Marsh, D.: Dynamical mechanism for the increase in tropical upwelling in the lowermost tropical stratosphere during warm ENSO events, J. Atmos. Sci., 67, 3018–3038, https://doi.org/10.1175/2010JAS3433.1, 2010. a
Diallo, M., Konopka, P., Santee, M. L., Müller, R., Tao, M., Walker, K. A., Legras, B., Riese, M., Ern, M., and Ploeger, F.: Structural changes in the shallow and transition branch of the Brewer–Dobson circulation induced by El Niño, Atmos. Chem. Phys., 19, 425–446, https://doi.org/10.5194/acp-19-425-2019, 2019. a, b, c
Diallo, M., Ern, M., and Ploeger, F.: The advective Brewer–Dobson circulation in the ERA5 reanalysis: climatology, variability, and trends, Atmos. Chem. Phys., 21, 7515–7544, https://doi.org/10.5194/acp-21-7515-2021, 2021. a, b, c
Dias, J. and Pauluis, O.: Convectively coupled waves propagating along an equatorial ITCZ, J. Atmos. Sci., 66, 2237–2255, https://doi.org/10.1175/2009JAS3020.1, 2009. a
Ern, M., Ploeger, F., Preusse, P., Gille, J., Gray, L., Kalisch, S., Mlynczak, M., Russell III, J., and Riese, M.: Interaction of gravity waves with the QBO: A satellite perspective, J. Geophys. Res.-Atmos., 119, 2329–2355, https://doi.org/10.1002/2016GL068498, 2014. a, b, c
Fritts, D. C. and Alexander, M. J.: Gravity wave dynamics and effects in the middle atmosphere, Rev. Geophys., 41, https://doi.org/10.1029/2001RG000106, 2003. a
Garcia, S. R. and Kayano, M. T.: Some evidence on the relationship between the South American monsoon and the Atlantic ITCZ, Theoretical and Applied Climatology, 99, 29–38, https://doi.org/10.1007/s00704-009-0107-z, 2010. a
Geller, M. A., Zhou, T., and Yuan, W.: The QBO, gravity waves forced by tropical convection, and ENSO, J. Geophys. Res.-Atmos., 121, 8886–8895, https://doi.org/10.1002/2015JD024125, 2016. a
Godoi, V. A., de Andrade, F. M., Durrant, T. H., and Torres Júnior, A. R.: What happens to the ocean surface gravity waves when ENSO and MJO phases combine during the extended boreal winter?, Clim. Dynam., 54, 1407–1424, https://doi.org/10.1007/s00382-019-05065-9, 2020. a
Gu, G. and Zhang, C.: Cloud components of the intertropical convergence zone, J. Geophys. Res.-Atmos., 107, ACL–4, https://doi.org/10.1029/2002JD002089, 2002. a
Hersbach, H., Bell, B., Berrisford, P., Hirahara, S., Horányi, A., Muñoz-Sabater, J., Nicolas, J., Peubey, C., Radu, R., Schepers, D., Simmons, A., Soci, C., Abdalla, S., Abellan, X., Balsamo, G., Bechtold, P., Biavati, G., Bidlot, J., Bonavita, M., De Chiara, G., Dahlgren, P., Dee, D., Diamantakis, M., Dragani, R., Flemming, J., Forbes, R., Fuentes, M., Geer, A., Haimberger, L., Healy, S., Hogan, R. J., Hólm, E., Janisková, M., Keeley, S., Laloyaux, P., Lopez, P., Lupu, C., Radnoti, G., de Rosnay, P., Rozum, I., Vamborg, F., Villaume, S., and Thépaut, J.-N.: The ERA5 global reanalysis, Q. J. Roy. Meteor. Soc., 146, 1999–2049, https://doi.org/10.1002/qj.3803, 2020. a
Hu, Y., Li, D., and Liu, J.: Abrupt seasonal variation of the ITCZ and the Hadley circulation, Geophys. Res. Lett., 34, https://doi.org/10.1029/2007GL030950, 2007. a
Hwang, Y.-T. and Frierson, D. M.: Link between the double-Intertropical Convergence Zone problem and cloud biases over the Southern Ocean, P. Natl. Acad. Sci. USA, 110, 4935–4940, https://doi.org/10.1073/pnas.1213302110, 2013. a
Jin, D., Kim, D., Son, S.-W., and Oreopoulos, L.: QBO deepens MJO convection, Nature Communications, 14, 4088, https://doi.org/10.1038/s41467-023-39465-7, 2023. a
Kalnay, E., Kanamitsu, M., Kistler, R., Collins, W., Deaven, D., Gandin, L., Iredell, M., Saha, S., White, G., Woollen, J., Zhu, Y., Chelliah, M., Ebisuzaki, W., Higgins, W., Janowiak, J., Mo, K. C., Ropelewski, C., Wang, J., Leetmaa, A., Reynolds, R., Jenne, R., and Joseph, D.: The NCEP/NCAR 40-year reanalysis project, in: Renewable energy, Routledge, 146–194, ISBN 9781315793245, https://doi.org/10.4324/9781315793245, 2018. a
Kang, M.-J., Chun, H.-Y., and Garcia, R. R.: Role of equatorial waves and convective gravity waves in the 2015/16 quasi-biennial oscillation disruption, Atmos. Chem. Phys., 20, 14669–14693, https://doi.org/10.5194/acp-20-14669-2020, 2020. a
Kerns, B. W. and Chen, S. S.: Diurnal cycle of precipitation and cloud clusters in the MJO and ITCZ over the Indian Ocean, J. Geophys. Res.-Atmos., 123, 10–140, https://doi.org/10.1029/2018JD028589, 2018. a, b
Kalisch, S., Kang, M. J. and Chun, H. Y.: Impact of Convective Gravity Waves on the Tropical Middle Atmosphere During the Madden‐Julian Oscillation, Journal of Geophysical Research: Atmospheres, 123, 8975–8992, https://doi.org/10.1029/2017JD028221, 2018.
Klotzbach, P., Abhik, S., Hendon, H., Bell, M., Lucas, C., G. Marshall, A., and Oliver, E.: On the emerging relationship between the stratospheric Quasi-Biennial oscillation and the Madden-Julian oscillation, Sci. Rep., 9, 2981, https://doi.org/10.1038/s41598-019-40034-6, 2019. a
Konopka, P., Ploeger, F., Tao, M., and Riese, M.: Zonally resolved impact of ENSO on the stratospheric circulation and water vapor entry values, J. Geophys. Res.-Atmos., 121, 11–486, https://doi.org/10.1002/2015JD024698, 2016. a
Kursinski, E. R., Hajj, G. A., Schofield, J. T., Linfield, R. P., and Hardy, K. R.: Observing Earth's atmosphere with radio occultation measurements using the Global Positioning System, J. Geophys. Res.-Atmos., 102, 23429–23465, https://doi.org/10.1029/97JD01569, 1997. a, b
Kutner, M. H., Nachtsheim, C. J., Neter, J., and Wasserman, W.: Applied linear regression models, 4th edn., McGraw-Hill/Irwin, New York, https://doi.org/10.1080/00401706.1997.10485142, 2004. a
Läderach, A. and Raible, C. C.: Lower-tropospheric humidity: climatology, trends and the relation to the ITCZ, Tellus A, 65, 20413, https://doi.org/10.3402/tellusa.v65i0.20413, 2013. a, b, c
Li, T., Calvo, N., Yue, J., Dou, X., Russell Iii, J., Mlynczak, M., She, C.-Y., and Xue, X.: Influence of El Niño-Southern Oscillation in the mesosphere, Geophys. Res. Lett., 40, 3292–3296, https://doi.org/10.1002/grl.50598, 2013. a
Liu, X., Yue, J., Xu, J., Garcia, R. R., Russell III, J. M., Mlynczak, M., Wu, D. L., and Nakamura, T.: Variations of global gravity waves derived from 14 years of SABER temperature observations, J. Geophys. Res.-Atmos., 122, 6231–6249, https://doi.org/10.1002/2017JD026604, 2017. a, b
Mamalakis, A., Randerson, J. T., Yu, J.-Y., Pritchard, M. S., Magnusdottir, G., Smyth, P., Levine, P. A., Yu, S., and Foufoula-Georgiou, E.: Zonally contrasting shifts of the tropical rain belt in response to climate change, Nature Climate Change, 11, 143–151, https://doi.org/10.1038/s41558-020-00963-x, 2021. a, b
Mitchell, D. M., Gray, L. J., Fujiwara, M., Hibino, T., Anstey, J. A., Ebisuzaki, W., Harada, Y., Long, C., Misios, S., Stott, P. A., and Tan, D.: Signatures of naturally induced variability in the atmosphere using multiple reanalysis datasets, Q. J. Roy. Meteor. Soc., 141, 2011–2031, https://doi.org/10.1002/qj.2492, 2015. a
Moss, A. C., Wright, C. J., and Mitchell, N. J.: Does the Madden-Julian Oscillation modulate stratospheric gravity waves?, Geophys. Res. Lett., 43, 3973–3981, https://doi.org/10.1002/2016GL068498, 2016. a, b, c, d
Münnich, M. and Neelin, J. D.: Seasonal influence of ENSO on the Atlantic ITCZ and equatorial South America, Geophys. Res. Lett., 32, https://doi.org/10.1029/2005GL023900, 2005. a
Namboothiri, S., Jiang, J., Kishore, P., Igarashi, K., Ao, C., and Romans, L.: CHAMP observations of global gravity wave fields in the troposphere and stratosphere, J. Geophys. Res.-Atmos., 113, https://doi.org/10.1029/2007JD008912, 2008. a
Pfenninger, M., Liu, A. Z., Papen, G. C., and Gardner, C. S.: Gravity wave characteristics in the lower atmosphere at South Pole, J. Geophys. Res.-Atmos., 104, 5963–5984, https://doi.org/10.1029/98JD02705, 1999. a
Pfister, L., Chan, K., Bui, T., Bowen, S., Legg, M., Gary, B., Kelly, K., Proffitt, M., and Starr, W.: Gravity waves generated by a tropical cyclone during the STEP tropical field program: A case study, J. Geophys. Res.-Atmos., 98, 8611–8638, https://doi.org/10.1029/92JD01679, 1993. a
Ratnam, M. V., Tetzlaff, G., and Jacobi, C.: Global and seasonal variations of stratospheric gravity wave activity deduced from the CHAMP/GPS satellite, J. Atmos. Sci., 61, 1610–1620, https://doi.org/10.1175/1520-0469(2004)061<1610:GASVOS>2.0.CO;2, 2004. a, b
Rojas, M., Arias, P. A., Flores-Aqueveque, V., Seth, A., and Vuille, M.: The South American monsoon variability over the last millennium in climate models, Clim. Past, 12, 1681–1691, https://doi.org/10.5194/cp-12-1681-2016, 2016. a
Scherllin-Pirscher, B., Steiner, A. K., Anthes, R. A., Alexander, M. J., Alexander, S. P., Biondi, R., Birner, T., Kim, J., Randel, W. J., Son, S.-W., Tsuda, T., and Zeng, Z.: Tropical temperature variability in the UTLS: New insights from GPS radio occultation observations, J. Climate, 34, 2813–2838, https://doi.org/10.1175/JCLI-D-20-0385.1, 2021. a
Schmidt, T., De La Torre, A., and Wickert, J.: Global gravity wave activity in the tropopause region from CHAMP radio occultation data, Geophys. Res. Lett., 35, https://doi.org/10.1029/2008GL034986, 2008. a, b
Schmidt, T., Alexander, P., and De la Torre, A.: Stratospheric gravity wave momentum flux from radio occultations, J. Geophys. Res.-Atmos., 121, 4443–4467, https://doi.org/10.1017/CBO9780511608285, 2016. a
Schneider, T., Bischoff, T., and Haug, G. H.: Migrations and dynamics of the intertropical convergence zone, Nature, 513, 45–53, https://doi.org/10.1038/nature13636, 2014. a, b
Smith, E. K. and Weintraub, S.: The constants in the equation for atmospheric refractive index at radio frequencies, Proceedings of the IRE, 41, 1035–1037, https://doi.org/10.1109/JRPROC.1953.274297, 1953. a
Smith, S. M., Setvák, M., Beletsky, Y., Baumgardner, J., and Mendillo, M.: Mesospheric Gravity Wave Momentum Flux Associated With a Large Thunderstorm Complex, J. Geophys. Res.-Atmos., 125, e2020JD033381, https://doi.org/10.1029/2020JD033381, 2020. a
Tian, B. and Dong, X.: The double-ITCZ bias in CMIP3, CMIP5, and CMIP6 models based on annual mean precipitation, Geophys. Res. Lett., 47, e2020GL087232, https://doi.org/10.1029/2020GL087232, 2020. a
Torrence, C. and Compo, G. P.: A practical guide to wavelet analysis, B. Am. Meteorol. Soc., 79, 61–78, https://doi.org/10.1175/1520-0477(1998)079<0061:APGTWA>2.0.CO;2, 1998. a
Tsuda, T., Nishida, M., Rocken, C., and Ware, R. H.: A global morphology of gravity wave activity in the stratosphere revealed by the GPS occultation data (GPS/MET), J. Geophys. Res.-Atmos., 105, 7257–7273, https://doi.org/10.1029/2009GL039777, 2000. a, b, c, d
Waliser, D. E. and Gautier, C.: A satellite-derived climatology of the ITCZ, J. Climate, 6, 2162–2174, 1993. a, b, c
Wang, W., Matthes, K., Omrani, N.-E., and Latif, M.: Decadal variability of tropical tropopause temperature and its relationship to the Pacific Decadal Oscillation, Sci. Rep., 6, 29537, https://doi.org/10.1038/srep29537, 2016. a
Wei, Y., Ren, H.-L., Duan, W., and Sun, G.: MJO-equatorial Rossby wave interferences in the tropical intraseasonal oscillation, Clim. Dynam., 1–20, https://doi.org/10.1007/s00382-024-07380-2, 2024. a
Wheeler, M. and Kiladis, G. N.: Convectively coupled equatorial waves: Analysis of clouds and temperature in the wavenumber–frequency domain, J. Atmos. Sci., 56, 374–399, https://doi.org/10.1175/1520-0469(1999)056<0374:CCEWAO>2.0.CO;2, 1999. a
Wheeler, M. C. and Hendon, H. H.: An All-Season Real-Time Multivariate MJO Index: Development of an Index for Monitoring and Prediction, Mon. Weather Rev., 132, 1917–1932, https://doi.org/10.1175/1520-0493(2004)132<1917:AARMMI>2.0.CO;2, 2004. a
Wolter, K. and Timlin, M. S.: El Niño/Southern Oscillation behaviour since 1871 as diagnosed in an extended multivariate ENSO index (MEI. ext), Int. J. Climatol., 31, 1074–1087, https://doi.org/10.1002/joc.2336, 2011. a, b
Xie, S.-P., Peng, Q., Kamae, Y., Zheng, X.-T., Tokinaga, H., and Wang, D.: Eastern Pacific ITCZ dipole and ENSO diversity, J. Climate, 31, 4449–4462, https://doi.org/10.1175/JCLI-D-17-0905.1, 2018. a
Yang, C., Smith, A. K., Li, T., Kinnison, D. E., Li, J., and Dou, X.: Can the Madden-Julian Oscillation Affect the Antarctic Total Column Ozone?, Geophys. Res. Lett., 47, e2020GL088886, https://doi.org/10.1029/2020GL088886, 2020. a
Zhang, C.: Madden-julian oscillation, Rev. Geophys., 43, https://doi.org/10.1029/2004RG000158, 2005. a
Zhang, G. J., Song, X., and Wang, Y.: The double ITCZ syndrome in GCMs: A coupled feedback problem among convection, clouds, atmospheric and ocean circulations, Atmos. Res., 229, 255–268, https://doi.org/10.1016/j.atmosres.2019.06.023, 2019. a
Zheng, Y., Bourassa, M. A., and Hughes, P.: Influences of sea surface temperature gradients and surface roughness changes on the motion of surface oil: A simple idealized study, Journal of Applied Meteorology and Climatology, 52, 1561–1575, https://doi.org/10.1175/JAMC-D-12-0211.1, 2013. a
Zhou, T., DallaSanta, K. J., Orbe, C., Rind, D. H., Jonas, J. A., Nazarenko, L., Schmidt, G. A., and Russell, G.: Exploring the ENSO modulation of the QBO periods with GISS E2.2 models, Atmos. Chem. Phys., 24, 509–532, https://doi.org/10.5194/acp-24-509-2024, 2024. a