the Creative Commons Attribution 4.0 License.
the Creative Commons Attribution 4.0 License.
 | 07 Oct 2025
Influence of biogenic NO emissions from soil on atmospheric chemistry over Africa: a regional modelling study
Eric Martial Yao
Fabien Solmon
Marcellin Adon
Claire Delon
Corinne Galy-Lacaux
Graziano Giuliani
Bastien Sauvage
Véronique Yoboue
In the context of climate change and increasing anthropogenic pressures in Africa, understanding the interactions between atmospheric chemistry, regional climate, and biogeochemical cycles is critical. This study investigates the potential role of biogenic nitric oxide emissions from African soils (BioNO), particularly in arid and semi-arid ecosystems, as major contributors to atmospheric nitrogen dioxide (NO2) concentrations and regional atmospheric chemistry. To this end, we rely on a modelling approach based on the RegCM5 regional climate model, including an updated atmospheric chemistry module and, amongst other, a specific parametrization for BioNO emissions. Throughout the paper, the performances of the model are evaluated against various datasets, including in-situ observations from the INDAAF network and chemical reanalyses. Sensitivity studies demonstrate that integrating BioNO emissions into the model enhances the accuracy of simulated NO2, nitric acid (HNO3), and ozone (O3) seasonal cycles and surface concentrations, and reduces simulated biases compared to ground based observations. Despite these improvements, notable discrepancies still exist, in particular between simulated surface ozone concentrations and in-situ measurements. Similar biases are also observed in a chemical reanalysis model and in a state-of-the-art chemistry transport model used for comparison. In addition to highlighting the impact and added value of including BioNO fluxes in regional atmospheric chemistry models, our findings also highlight the suitability of the RegCM5 coupled system for studying regional climate, chemistry and nitrogen cycle interactions over Africa.
- Article
(5188 KB) - Full-text XML
-
Supplement
(1160 KB) - BibTeX
- EndNote


Tropical Africa is a major source of gaseous and particulate emissions, affecting the regional and global atmospheric chemistry and climate. In addition to large chemical sources linked to anthropogenic activities (biomass burning, megacities), there are also substantial biogenic emissions which can strongly interact with the regional tropospheric composition in the tropics (e.g., Aghedo et al., 2007).
Nitrogen emissions originating from soil microbial processes are an important component of these emissions (Fudjoe et al., 2023). Indeed, soil microbial processes, such as nitrification and denitrification involve the production of reactive gaseous compounds released to the atmosphere (Delmas et al., 1995; Medinets et al., 2015; Schreiber et al., 2012). Soil NO (referred to as BioNO) emissions dominate the global net nitrogen oxide exchange between ecosystems and the atmosphere (Ludwig et al., 2001), and above-canopy emission estimates ranging from 4.7–26.7 Tg N yr−1 (Davidson and Kingerlee, 1997; Ganzeveld et al., 2002; Hudman et al., 2012; Jaeglé et al., 2005; Müller, 1992; Steinkamp and Lawrence, 2011; Vinken et al., 2014; Yan et al., 2005; Yienger and Levy, 1995). BioNO emissions play a crucial role in the formation of particles and key atmospheric gaseous compounds, such as O3 and HNO3 (Liu et al., 2020; Mosier, 2001; Vinken et al., 2014; Williams et al., 2009). BioNO emissions are influenced by a variety of environmental and physical factors, including wind speed, floristic composition, nitrogen input (from organic and synthetic fertilization and atmospheric deposition), plant cover, soil temperature, soil moisture content, soil pH, and soil texture (Delon et al., 2007; Williams et al., 1992). Among these factors, soil moisture plays a dominant role in tropical regions, where seasonal rainfall patterns lead to marked fluctuations (particularly intense in Sahelian regions) in soil water content. This results in nitrogen accumulation during dry periods and important emission pulses following the onset of the rainy season (Austin et al., 2004; Meixner and Yang, 2006; Johansson et al., 1988; Yienger and Levy, 1995). Precipitation and soil moisture are recognized as key drivers of microbial processes that regulate NO fluxes (Liu et al., 2009; Li et al., 2022). While soil temperature and nitrogen content also influence NO fluxes, particularly in temperate zones, the pulse effect, which is driven by soil moisture, remains especially pronounced in tropical soils, where short but intense rainfall events can trigger sharp increases in NO emissions.
In tropical Africa, estimating BioNO emissions is challenging due to a lack of observational data (e.g., Jaeglé et al., 2004; Van Der A et al., 2008). Nevertheless, global and regional modelling approaches, have been proposed to quantify BioNO emissions (e.g., Hudman et al., 2012; Stohl et al., 1996; Stehfest and Bouwman, 2006; Yienger and Levy, 1995; Yan et al., 2005) and evaluate the potential impact on atmospheric chemistry. For instance, Williams et al. (2009) used an inventory of biogenic emissions derived from multi-annual simulations of the ORCHIDEE (Organising Carbon and Hydrology In Dynamic Ecosystems) vegetation model (Lathiere et al., 2006) to study the influence of BioNO and BVOC (Biogenic Volatile Organic Compound) emissions on Equatorial Africa's tropospheric composition. The global chemistry-transport model simulations revealed that NO emissions from soils in Africa contribute between 2 % and 45 % of tropospheric ozone production. Delon et al. (2008) used a neural network-based parameterization coupled with a mesoscale model to investigate the impact of BioNO emissions on NOx and O3 production in the lower troposphere over Equatorial Africa for a specific day (6 August 2006) during the AMMA (African Monsoon Multidisciplinary Analysis) campaign in the Sahel. Their findings indicate an increase in tropospheric O3 and NOx concentrations in the lowest few kilometres of the atmosphere when BioNO emissions are included. Steinkamp et al. (2009) used the ECHAM5/MESSy atmospheric chemistry model (EMAC) to examine the influence of BioNO on lower tropospheric NOx, O3, PAN, HNO3, OH, and the lifetime of CH4 (τCH4). Their results revealed that BioNO largely contributes to NOx levels, especially in the tropics. Moreover, BioNO notably raises OH concentrations, thereby increasing the global troposphere's oxidizing capacity and resulting in a 10 % decrease in τCH4.
Integrating interactive BioNO emissions into regional climate system models allows studying the impact of present and future climate change and variability, including temperature and precipitation patterns, on BioNO emissions. This understanding is crucial for predicting possible future emission trends, potential changes in the chemical environment, and developing effective mitigation strategies. BioNO emissions can also affect the formation of ozone and other secondary pollutants, which has implications for air quality as well as climate forcing and responses. These knock-on effects can be calculated using coupled climate-chemistry systems. In addition to being able to include BioNO emissions and the consequent effects on secondary pollutants, the regional climate modelling approach adopted in this paper can also be used to study regional environmental disturbances such as land use and agricultural changes. Furthermore, since climatic and land use gradients are particularly important in west and central Africa, the dynamical downscaling capabilities offered by the regional climate modelling approach are also of particular interest for capturing regional contrasts in emissions and processes at play.
One goal of the present study is to evaluate and extend such a system based on the International Centre for Theoretical Physics Regional Climate Model version 5 (ICTP RegCM5) (Giorgi et al., 2023). A second goal is to estimate and analyse the regional impact of BioNO emissions (from soils and vegetation) on key tropospheric species relevant to the atmospheric nitrogen cycle. The latter plays an important role in the chemistry of the atmosphere as well as the functioning of aquatic and terrestrial ecosystems and agrosystems (McNeill and Unkovich, 2007; Vitousek et al., 1997). This N cycle is markedly disrupted by anthropogenic activities (agriculture, fossil fuel combustion, and biofuels) (Galloway et al., 2008). This issue is particularly concerning in tropical regions like Africa, where rapid population growth and seasonal cycles from natural and anthropogenic sources strongly contribute to changes in N emissions (Adon et al., 2010). We focus on NO2, HNO3, and O3 because these species are tightly interconnected and are involved in a range of environmental and health impacts. NO2, a key reactive nitrogen species, contributes to the formation of HNO3 and O3. HNO3 is formed when NO2 reacts with other substances in the atmosphere, and is an important contributor of rainfall acidity deposition and nitrogen supply to ecosystems. O3, a powerful oxidant, is influenced by the presence of NO2 and plays a crucial role in HNO3 formation. It also contributes to a range of environmental and health impacts, including reduced crop yields due to its phytotoxic effects and influences on ecosystem functioning (e.g., Ainsworth et al., 2012). Understanding the concentrations and fluxes of these species is essential for assessing nitrogen management and potential risks in Africa.
The study is structured as follows: Sects. 2 and 3 provide a description of the modelling context and developments, as well as the measurement sites and relevant databases used. Section 4 focuses on evaluating model performance in simulating key regional climatic features affecting emissions and tropospheric chemistry. Section 5 provides a more detailed analysis of simulated BioNO. Section 6 addresses the model results and limitations regarding the impact of BioNO on key atmospheric chemistry components.
2.1 The regional climate-chemistry model RegCM5
The International Centre for Theoretical Physics (ICTP) Regional Climate Model version 5 (RegCM5, discussed in detail in Giorgi et al., 2023) is the latest version of a long-standing regional modeling system originally developed at the National Center for Atmospheric Research (NCAR) and maintained by the ICTP (Dickinson et al., 1989; Giorgi and Bates, 1989; Giorgi et al., 2012). RegCM has been widely applied for regional-scale climate and atmospheric composition studies across various regions (Giorgi and Mearns, 1999; Pal and Coauthors, 2007; Shalaby et al., 2012). Compared to previous versions, a key development has been the inclusion of the MOdello LOCale in H coordinate (MOLOCH) non-hydrostatic dynamical core (Davolio et al., 2020). This has improved model efficiency, notably with regard to climate convection-permitting (CP) simulations (e.g., Ban et al., 2021; Coppola et al., 2020; Lucas-Picher et al., 2021; Pichelli et al., 2021; Prein et al., 2015).
This development is also important for atmospheric chemistry, which uses a large number of tracers,as it reduces the numerical cost of advection in the context of long-term simulations. As for previous model versions, several options are available for the model physics. In the present study we run successive tests (not discussed further here) to retain a model configuration based on the RRTM (Rapid Radiative Transfer Model) for shortwave and longwave radiation, the University of Washington turbulence scheme (UW, Bretherton et al., 2004), the Nogherotto et al. (2016) bulk microphysics scheme and the Tiedtke convection scheme (Tiedtke, 1989). Continental surface processes are treated by the Community Land Model, version 4.5 (CLM4.5, Oleson et al., 2013) which also provides important coupling variables used in the atmospheric chemistry interface, such as surface resistances, soil humidity and temperature. The meteorological boundary conditions are provided every six hours, from the ERA5 reanalysis (the fifth-generation ECMWF global atmospheric reanalysis; Hersbach et al., 2020). The sea surface temperature data is provided by the Optimal Interpolated Weekly (OI_WK) dataset.
Atmospheric chemistry processes used in this study are based on approaches initially developed in Solmon et al. (2006) and Solmon et al. (2021) for aerosols, and Shalaby et al. (2012) and Ciarlo et al. (2021) for gas phases. The chemical reaction solver is based on the CBM-Z photochemical mechanism module (Shalaby et al., 2012; Zaveri and Peters, 1999). It allows a comprehensive coverage of regionally and globally relevant species as well as the reactions involved in photo oxidant chemistry, while maintaining a good precision and numerical efficiency. CBM-Z notably includes key prognostic species such as O3, NOx, CO, VOCs. CBM-Z builds upon the widely used CBM-IV mechanism (Gery et al., 1989) and incorporates additional processes that enhance its applicability from urban air quality modeling to regional and global scales (Shalaby et al., 2012). It improves the representation of key chemical pathways by explicitly treating methane and ethane, refining parameterizations for higher alkanes, and incorporating a more detailed isoprene chemistry (Zaveri and Peters, 1999). Additionally, CBM-Z accounts for peroxy radical interactions and nighttime NO3 chemistry, which are relevant in NOx-limited environments. However, as with most reduced chemical mechanisms, CBM-Z uses a lumped VOC representation, which may oversimplify NOx-VOC interactions, potentially affecting the formation of secondary species such as HNO3 and O3 (Carter, 2010). While these simplifications can introduce uncertainties, CBM-Z remains widely used due to its computational efficiency and its ability to capture key atmospheric trends (Shalaby et al., 2012; Zaveri and Peters, 1999; Gery et al., 1989; Yarwood et al., 2010). The mechanism employs the Radical Balance Method (RBM), ensuring a stable and efficient numerical integration of chemical equations. Although more explicit mechanisms exist, their computational cost remains prohibitive for long-term regional climate simulations (Cao et al., 2021), making CBM-Z a suitable compromise between accuracy and efficiency for this study. Recent developments, such as CBM-6 (Cao et al., 2021) and CBM-7 (Yarwood and Tuite, 2024), offer improved treatments of VOCs and radical chemistry, including better representation of oxygenated VOCs and updated kinetic data. However, these mechanisms remain more computationally demanding and are not yet widely implemented in regional climate models. It is also worth noting that biogenic and anthropogenic VOC emissions are potentially affected by potentially large uncertainties over Africa (Marais et al., 2014), and these uncertainties should be taken into account when considering the potential added value of a more complex chemical scheme.
Gas-aerosol partitioning is calculated using the ISORROPIA-II thermodynamic equilibrium model (Fountoukis and Nenes, 2007; Nenes et al., 1998), which determines the partitioning of semi-volatile inorganic species and the composition of sulfate–nitrate–ammonium aerosols.
Dry deposition processes and fluxes are parameterized according to Zhang et al. (2003), for 31 gas phase species in the model. Key inputs for the Zhang deposition scheme include biophysical and physiological parameters, which are provided to the model using pre-defined land use categories and mapping (Dickinson, 1986; Zhang et al., 2002). Some parameters, such as LAI (Leaf Area Index), roughness length, wind, surface temperature, etc. are provided through the CLM4.5 interface. In the present study, slight modifications have been made in the deposition scheme to account for African regional specificities:
- a.
Default ground resistance (Rg) values for ozone, based on Zhang et al. (2003), are used. For the oceanic domain, the Rg value for ozone was reduced from 2000 to 1000 s m−1 to obtain dry deposition velocities more consistent with those reported in the literature (e.g., Charusombat et al., 2010; Wu et al., 2011; Zhang et al., 2002). The default resistance led to values that underestimated ozone deposition and caused an overestimation of surface ozone concentrations over oceans. This adjustment better reflects the higher reactivity and solubility of ozone in oceanic surfaces, improving the accuracy of simulated concentrations.
- b.
The friction velocity (u*) is a crucial parameter for calculating aerodynamic resistance (ra). According to Padro et al. (1991), the equation used to calculate ra requires that the Richardson number (Rib) be maintained below 0.21 under stable conditions. This is particularly important in tropical forested areas with weak mean winds, where both u* and deposition velocity are often lower than those reported in the literature (e.g. Adon et al., 2013; Zhang et al., 2003). For our simulation, we recalculated u* from interactive u* provided by the CLM4.5 scheme, to ensure compliance with this criterion, imposing minimum thresholds of 0.4 m s−1 in forests and 0.1 m s−1 in savannas, based on statistical analysis, showing that Rib > 0.21 for u* below these values, consistent with Adon et al. (2013). While the 0.4 m s−1 threshold may seem high compared to other studies, such as temperate forest studies (e.g., Flechard et al., 2011), tropical African forests typically experience weaker winds and higher atmospheric stability, justifying a higher threshold in this region. Moreover, at the spatial resolution of RegCM and with parameterized convection, modeled wind speeds and u* are uncertain since intermittent subgrid thermal gusts are not resolved, which can lead to an underestimation of the effective u*. Hence, these minimum thresholds represent a pragmatic correction applied only within the dry deposition calculations to avoid unrealistic aerodynamic resistances and associated biases in deposition velocities. This correction does not affect u* used elsewhere in the model.
The wet deposition flux is initially parameterized following the approach developed in the MOZART chemistry transport model (Emmons et al., 2010; Horowitz et al., 2003). 26 CBM-Z tracers are considered for wet removal through large-scale and convective precipitation processes. Compared to Shalaby et al. (2012) and Ciarlo et al. (2021), we substantially improve the wet deposition parameterizations by developing a new interface which directly uses cloud to rainwater production and precipitation rate terms taken from both the Nogherotto et al. (2016) stratiform and the Tiedtke (1989) convective rain rates. This enhances the interaction between atmospheric chemistry and convective precipitation processes in African tropical rainy seasons, yielding wet deposition estimates closer to literature values (e.g., Delon et al., 2010; Ossohou et al., 2021).
Anthropogenic and biomass burning emissions are treated using a preprocessing interface designed for the regional interpolation and chemical aggregation of different possible inventories. In this study, the monthly, 0.1 degree resolution emission inventories from the Copernicus Atmosphere Monitoring Service (CAMS, version 6.2) are used for non-biomass burning emissions (Soulie et al., 2024). For biomass burning, we use daily emissions from GFED4 (Global Fire Emissions Data, version 4) with a 0.25° spatial resolution (Randerson et al., 2018). For both inventories, the lumping of emitted VOC species to effective CBMZ species has been performed following a method similar to Huijnen et al. (2019). The biogenic VOC emissions are calculated on-line as part of CLM45 using the embedded MEGAN (Model of Emissions of Gases and Aerosols from Nature; Guenther et al., 2006) scheme. Only isoprene fluxes are passed to the atmospheric chemistry and transport interfaces (Strada et al., 2023).
Finally, an important development compared to Shalaby et al. (2012) and Ciarlo et al. (2021) concerns the chemical initial and lateral boundary conditions. We replace the standard monthly climatology approach by a new interface using six-hourly CAMS chemical reanalysis (Inness et al., 2019; Wagner et al., 2021), consistent with the ERA5 dynamical forcing. For important chemical and aerosol species, this allows us to more explicitly represent the influence and variability of long range chemical transport events that may affect the domain via the boundaries.
2.2 The BioNO emission parameterization
Interactive BioNO emissions are included following the empirical approach developed in Delon et al. (2007) (D2007), which is based on an Artificial Neural Network (ANN) supervised learning algorithm applied to several databases. In some regions, such as Africa, few in situ measurements of BioNO are available, leading to inaccurate estimates of BioNO emissions, which in turn affects the estimation of species concentrations in the lower troposphere (Jaeglé et al., 2005). The main advantage in using the ANN algorithm is that it is linked to varying environmental parameters of specific regions of interest (such as African tropical regions), providing effective BioNO emissions whatever the type of soil and/or climate (Delon et al., 2007). This enhances responsiveness compared to traditional inventories (Delon et al., 2008). For now, this ANN algorithm has been used only in Tropical African climates (Delon et al., 2007, 2012, 2015). NO emissions are largely influenced by microbial activity, determined by the physical properties of the soil (porosity, soil texture, soil moisture etc.) which also govern substrate diffusion and oxygen supply (Skopp et al., 1990). D2007's parameterization includes seven explicative variables, including wind speed, fertilisation rate, surface temperature, sand percentage, soil moisture, soil pH, and soil temperature at depth (20–30 cm). Wind speed is used as an indicator of varying atmospheric conditions. Soil temperature at depth relates to oxygen diffusion and nitrogen mineralization in the soil (Butterbach-Bahl et al., 2004). The sand percentage impacts water diffusion (Roelle et al., 2001). pH is a crucial factor due to its impact on chemical or biological mechanisms (Serca et al., 1994), can also influence NO emissions through chemo-denitrification process (low pH) or biological activity (higher pH) (e.g., Ormeci et al., 1999; Serca et al., 1994). Finally, the fertilisation rate is key for including the amount of externally introduced nitrogen (Sanhueza et al., 1990). The pH and fertilisation rates are determined using external databases: soil pH data are obtained from IGBP-DIS (International Geosphere Biosphere Programme-Data and Information System; Igbp-Dis, 1998), and fertilisation rates, including N fertilizer and N manure, are sourced from Potter et al. (2010). The other variables are integrated on-line within the model.
The final NO fluxes are calculated at each model time step, using the following equations:
with
NOfluxnorm represents the normalised NO flux (in g N ha−1 d−1) and the seven inputs mentioned above are represented by x1 to x7: surface Water-Filled Pore Space (WFPS, in %), surface soil temperature (0–5 cm, in °C), soil temperature at depth (20–30 cm, in °C), fertilisation rate (in g N ha−1 d−1), sand percentage (%) and pH (unitless) integrated over the topsoil layer (upper 30 cm), and wind speed (10 m a.g.l. – above ground level, m s−1), respectively. Each input xi is associated with a weight wi, which represents the strength or influence of that input in determining the final NO flux.
The weights wi in the ANN equations are determined using a supervised learning process. Initially, small random weights are assigned to prevent any input variable from dominating. The network is trained using a backpropagation algorithm, which iteratively adjusts these weights to minimize the error between predicted and observed NO fluxes. In each iteration, the error is calculated, propagated backward, and the weights are updated accordingly. This process continues until the error is minimized, ensuring final weights accurately reflect the influence of each input variable on NO emissions. In this study, we use the ANN structure from Delon et al. (2007), but apply the updated weights provided in Delon et al. (2008), a better representation of the emission pulses in semi arid ecosystems due to strong dry-wet seasonality whereas this feature is less obvious in wet savannas and forests. These revised weights have also been used in subsequent applications of the model (e.g., Delon et al., 2010, 2012, 2015).
The tanh (hyperbolic tangent) function is used as the activation function, introducing non-linearity essential for capturing complex interactions between environmental variables and NO emissions. It normalizes intermediate outputs to a range between −1 and 1, stabilizing learning and preventing extreme values.
The sub-equations (S1, S2, S3) structure the network into distinct layers, each capturing different aspects of the relationships between the environmental variables and NO emissions. While all sub-equations use the same input variables (x1 to x7), they apply different weights, allowing the network to explore multiple combinations and better capture non-linear dependencies. Each sub-equation acts as a filter, highlighting specific patterns or interactions, and their outputs are combined using the tanh function to produce the final normalized NO flux.
It should be noted that although the ANN formulation was originally calibrated over semi-arid ecosystems, it is here applied to a broad range of ecosystems, including dense forested areas. Its performance may therefore be less reliable in humid tropical forests, where the controlling factors of NO emissions (e.g. soil moisture, canopy shielding) differ from the calibration environments. This limitation is further discussed in Sect. 5.
2.3 Model experiments
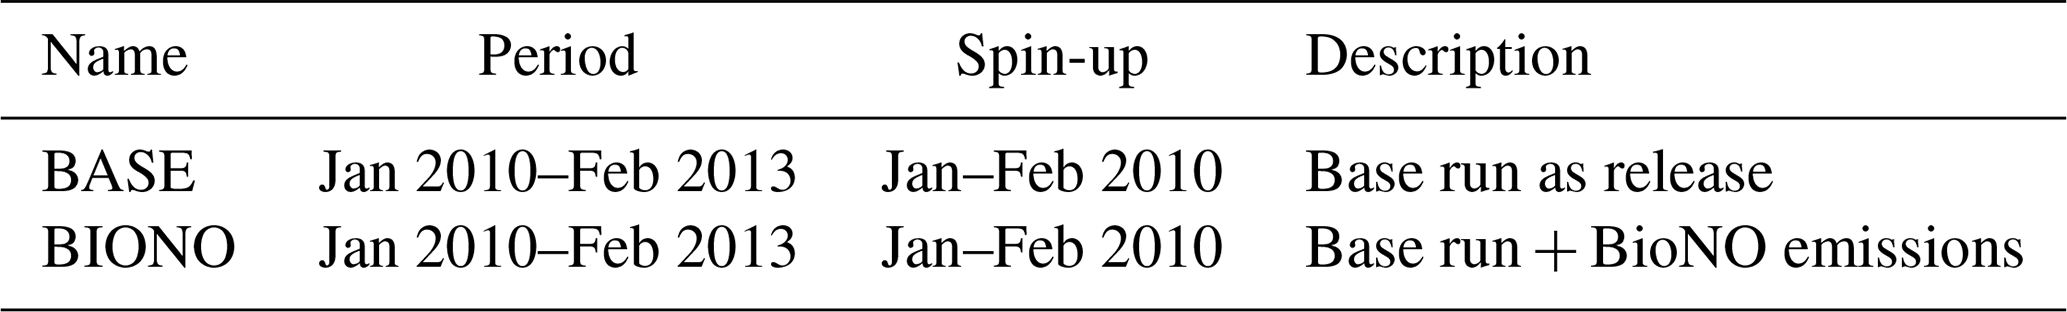
To test the ability of RegCM5 to simulate the African climate, BioNO emissions and to evaluate the effect of BioNO emissions on atmospheric chemistry, we conducted two different simulations which are listed in Table 1. The simulations cover the period from January 2010 to February 2013, which includes a variety of climatic conditions and seasonal variations. The first two months are used as spin-up time for both experiments and are not considered in the analysis of the results.
- a.
BASE run: with biomass burning and anthropogenic emissions, without BioNO emissions.
- b.
BIONO run: with biomass burning, anthropogenic emissions and BioNO emissions.
The model has a spatial resolution of 30 km × 30 km, with 35 vertical levels from the surface to 3.6 hPa. The model time step is 210 s.
Table 1Summary of simulations performed for the analysis of regional climate and trace gas in this article.
The model domain extends from 19.35° S to 35.48° N in latitude and from 24.98° W to 41.65° E in longitude, covering a large portion of the African continent. This domain was carefully selected to encompass key climatic and atmospheric processes relevant to the study, including the West African Monsoon, the Saharan Heat Low, and regions strongly influenced by biomass burning and anthropogenic emissions. While it does not cover the entire continent, the domain focuses on the most active regions for BioNO emissions and includes all of the INDAAF (International Network to study Depositions and Atmospheric chemistry in AFrica) measurement sites used for model evaluation. Figure 1 shows the model domain and the locations of the INDAAF measurement sites.
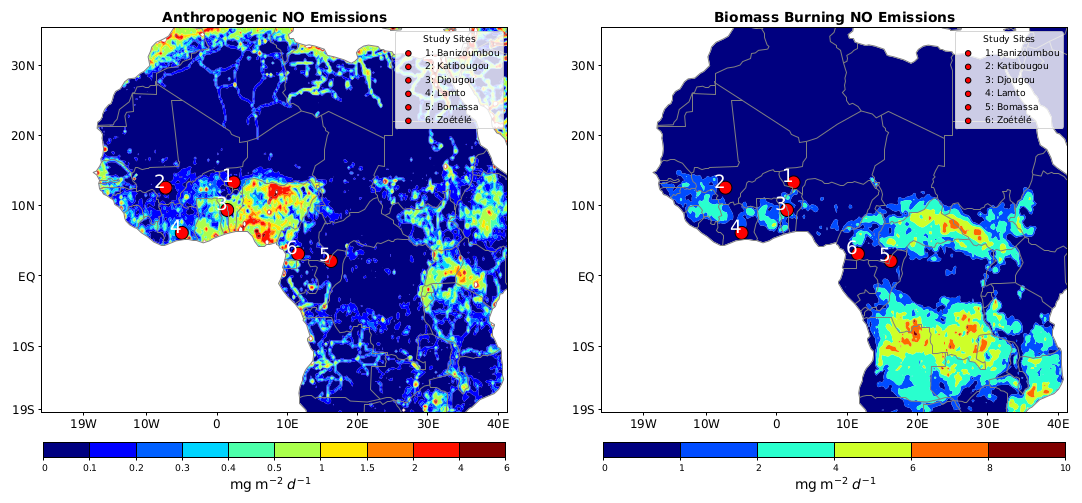
Figure 1Annual anthropogenic and biomass burning NO emissions (averaged over 2010–2013) and INDAAF measurement site locations, showing the full extent of the model domain used in the simulations. Measurement sites include Banizoumbou (Ba), Katibougou (Ka), Djougou (Dj), Lamto (Lam), Bomassa (Bom), and Zoétélé (Zoe).
3.1 Study sites and ground-based observation of pollutants
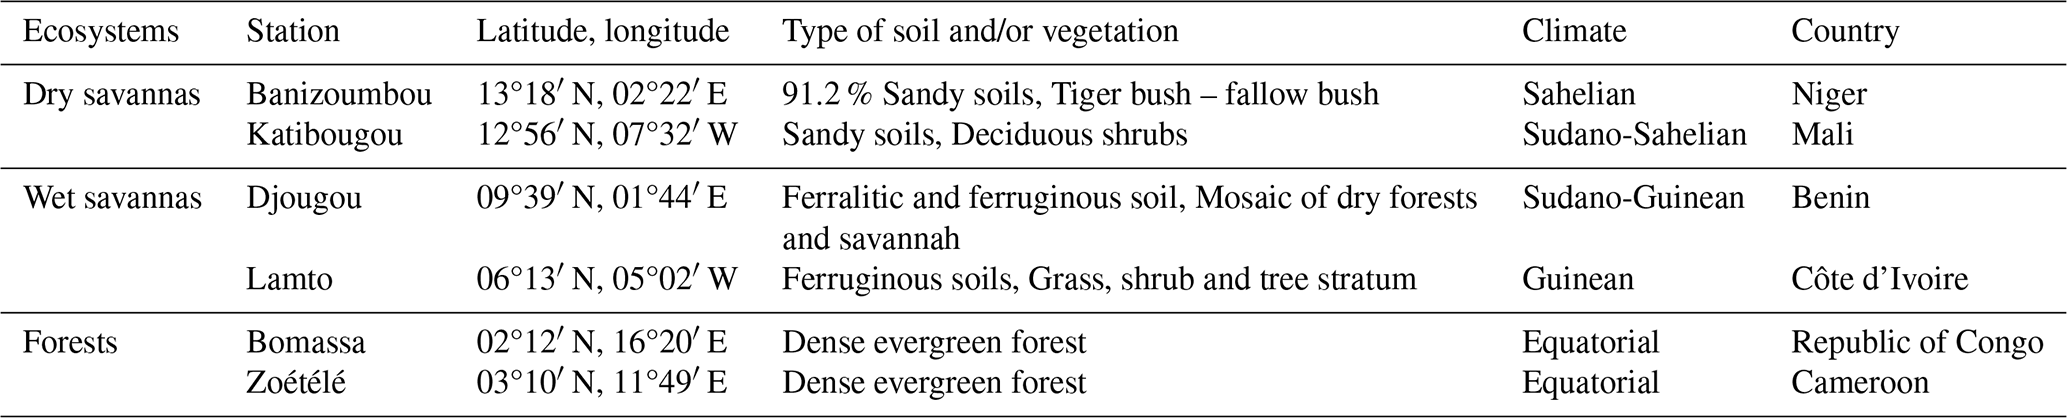
O3, NO2 and HNO3 concentrations are measured in the framework of the INDAAF long-term monitoring project. INDAAF, which is part of the Aerosol Cloud and Trace gases Infrastructure (ACTRIS-Fr), is a long term monitoring service to study the evolution of the atmospheric chemical composition and deposition in Africa. Gaseous concentrations are measured monthly at different sites in West and Central Africa and are publicly available (INDAAF, 2021). Datasets are referenced for each site: Banizoumbou (Laouali et al., 2023), Katibougou (Galy-Lacaux et al., 2023a), Djougou (Akpo et al., 2023), Lamto (Galy-Lacaux et al., 2023e), Bomassa (Galy-Lacaux et al., 2023f) and Zoétélé (Ouafo-Leumbe et al., 2023). We use observations from six sites representative of the main african ecosystems (Fig. 1, Table 2): Dry savannas (Banizoumbou, Katibougou), Wet savannas (Lamto, Djougou) and equatorial Forests (Bomassa, Zoétélé). Monitoring at Banizoumbou, Katibougou, Lamto, Bomassa and Zoétélé started in 1998, with the Djougou site joining in 2005. Atmospheric gas concentrations (NO2, HNO3, O3) are performed using passive sampling techniques based on the methodology outlined by Ferm et al. (1994). Developed by the Laboratory of Aerologie (LAERO) in Toulouse within the framework of the INDAAF project, these passive samplers have undergone rigorous testing across a range of tropical and subtropical regions (Adon et al., 2010; Carmichael et al., 2003; Ferm and Rodhe, 1997). Continuous measurements are ongoing at all INDAAF sites, and measurements were performed throughout the entire study period. Although there are some missing data for certain months in specific ecosystems, the overall dataset provides a comprehensive overview and is used as a reference dataset for model evaluation.
Table 2Site coordinates and location information. Dry savannas (ws: June–September, ds: October–May), Wet savannas (ws: April–October, ds: November–March), Forests (ws: March–November, ds: December–February). ws: wet season, ds: dry season.
A detailed description and evaluation of the INDAAF passive samplers can be found in previous African studies, encompassing both rural and urban sites (Adon et al., 2010; Bahino et al., 2018; Carmichael et al., 2003; Ferm and Rodhe, 1997; Galy-Lacaux et al., 2009; Galy-Lacaux and Modi, 1998; Ossohou et al., 2019, 2023). At each INDAAF site, two passive samplers are exposed simultaneously to ensure reproducibility, and the monthly concentrations are calculated as the average of these duplicate samples (Ossohou et al., 2023). Upon completion of the exposure period, all samplers, including field blanks, undergo laboratory analysis using ionic chromatography. LAERO has participated in the bi-annualy WMO-GAW (World Meteorological Organization – Global Atmosphere Watch) quality assurance program since 1996, which evaluates the precision of ionic chromatography measurements for trace compounds. Results, accessible under reference number 700 106 (QA/SAC – Americas, 2025), consistently demonstrate analytical precision of 5 % or better for all ions. Additionally, the measurement accuracy of passive samplers, assessed through covariance with duplicates, was estimated at 9.8 % for NO2, 20 % for HNO3, and 10 % for O3 (Adon et al., 2010). Detection limits, determined using the exposure period and field blanks for the studied duration, are reported as 0.2±0.1 ppb for NO2, 0.07±0.03 ppb for HNO3, and 0.1±0.1 ppb for O3.
3.2 Climatic and chemical evaluation datasets
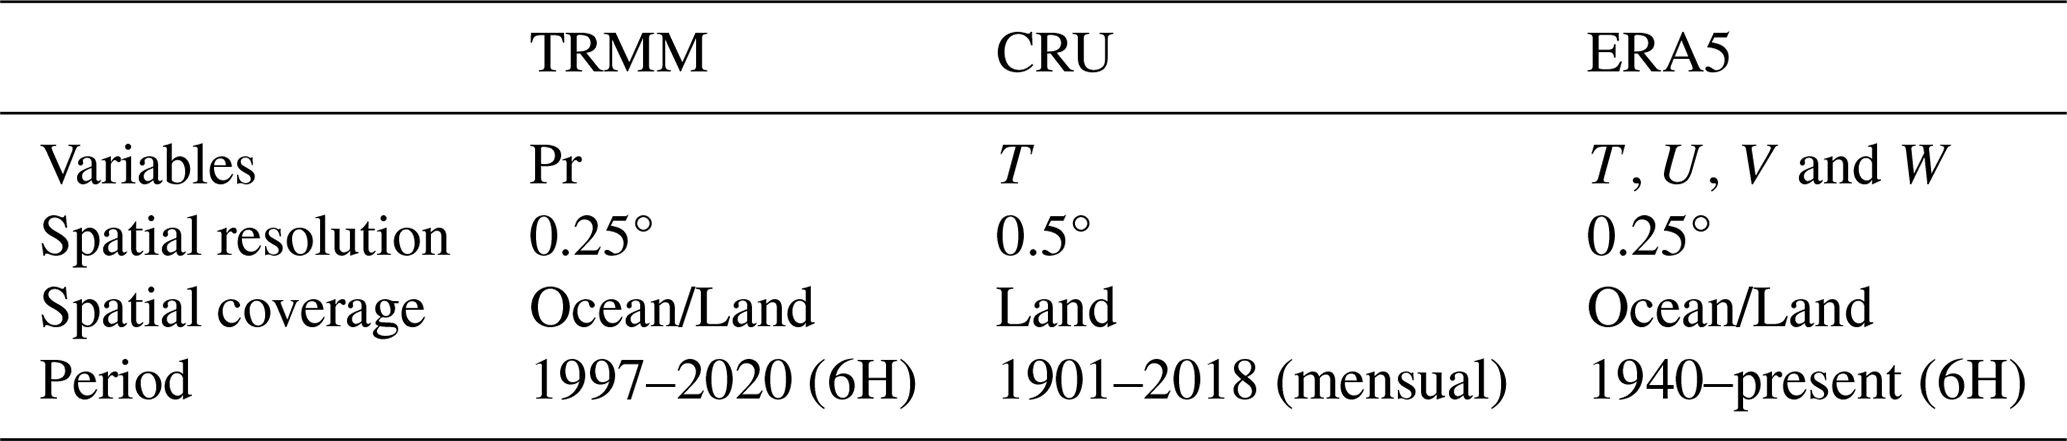
For further model evaluation, we use a variety of sources, including data from meteorological stations and satellites, as well as reanalysis products. Table 3 summarises information about the meteorological variables used from each database. Precipitation data are obtained from the Tropical Rainfall Measuring Mission 3B42-version 7 (TRMM; Huffman et al., 2007). Temperature data are sourced from the Climatic Research Unit version TS4.03 (CRU; Harris et al., 2020). For circulation dynamics, we use ERA5 data (Hersbach et al., 2020). CRU data is exclusively based on in situ observations, while TRMM data originates from satellite observations. As mentioned above, ERA5 reanalysis data is derived from a combination of in situ measurements and satellite observations assimilated in a Numerical Weather Prediction model simulation. By using multiple sources of observational data (in situ and satellite) as well as reanalysis estimates, we are able to quantify and account for uncertainties in parameter estimates – precipitation (Pr), wind field (U, V, and W), and 2 m surface temperature (T). This is particularly relevant for Africa due to the limited availability of in situ measurements and the complexity of the regional climate.
For the chemical evaluation, model outputs are compared with the INDAAF in-situ measurement database. To complement this local evaluation we also compare model outputs to CAMS chemical reanalysis data (Inness et al., 2019; Wagner et al., 2021), to outputs from the state-of-the-art chemistry transport model GEOS-Chem (Goddard Earth Observing System-Chemistry; GEOS-Chem, 2020), to ground-level NO2 concentrations derived from OMI and TROPOMI satellite NO2 observations (Cooper et al., 2022) and to the OMI/Aura-derived tropospheric NO2 columns dataset (Lamsal et al., 2021) over the period 2010–2013.
GEOS-Chem is a global 3D Chemical Transport Model (CTM) driven by assimilated meteorological observations from NASA's Goddard Earth Observing System (GEOS). It models the atmospheric chemical composition at both local to global scales.
CAMS provides chemical reanalysis data by assimilating diverse observational sources, including satellite and in-situ measurements, which improves the accuracy of the simulated chemical species.
The ground-level NO2 concentrations are derived from OMI (Ozone Monitoring Instrument) and TROPOMI (TROPOspheric Monitoring Instrument) satellite observations, following the methodology of Cooper et al. (2020b, 2022). In this approach, tropospheric NO2 column densities are first retrieved using OMI, then downscaled to a finer resolution using TROPOMI data, and finally converted to surface NO2 concentrations using the GEOS-Chem chemical transport model. The latter is constrained using ground-based monitoring data to improve surface-level estimates. The resulting dataset provides annual mean NO2 concentrations at a resolution of approximately 1 km × 1 km.
OMI/Aura-derived tropospheric NO2 columns data come from the Level-3 daily global gridded 0.25×0.25° OMI NO2 product (OMNO2d), which provides total and tropospheric NO2 columns for all atmospheric conditions and is cloud-screened for sky conditions where cloud cover is less than 30 %. With its high spatial resolution (0.25°×0.25°), this dataset is well-suited for studying large-scale NO2 distributions in the troposphere.
Both CAMS and GEOS-Chem are subject to model uncertainties, however CAMS includes an additional observational constraint which reduces uncertainty compared to the GEOS-Chem model. The calculation of the TROPOMI-derived NO2 data also introduces uncertainty, particularly in the conversion from column density to surface concentration. These include potential errors in satellite retrievals and air mass factor calculations, which can introduce biases in the estimated surface NO2. For example, Cooper et al. (2020a) report a mean fractional bias of 13 % between TROPOMI-derived and OMI-derived surface NO2 concentrations, highlighting the influence of vertical mixing assumptions and spatial resolution on retrieval accuracy.
The ability of the RegCM5 model to accurately simulate the African climate is evaluated in terms of seasonal and daily means over the period of 3 years. An exhaustive analysis of climate simulations is out of the scope of this paper. We report here model performance in terms of temperature, precipitation and monsoon circulation, which are key features of the African climate and strongly impact atmospheric chemistry.
Figure 2 compares the ERA5 reanalysis to simulated mean wind at 850 hPa i.e. in the monsoon layer. RegCM5 manages to reproduce the main features of the monsoon circulation with a mean characteristic southwesterly flow of up to 17° N, and Harmattan-like circulation over northern Africa. However, the model tends to underestimate the intensity of the mean monsoon flow from the Gulf of Guinea to the Sahel. The monsoon front and the Saharan Heat Low (SHL) are also reasonably captured by the RegCM5 model, although the SHL amplitude is underestimated (Fig. 2). This could explain or contribute to the weaker Monsoon flux and the underestimation of sahelian precipitation discussed later (Fig. 3c), which is consistent with the connections described in Peyrillé et al. (2007), Lavaysse et al. (2009), Chauvin et al. (2010), Lavaysse et al. (2010) and Evan et al. (2015). Outside of the monsoon domain, the minimum central-equatorial African wind is consistently captured, compared to the ERA5 data.
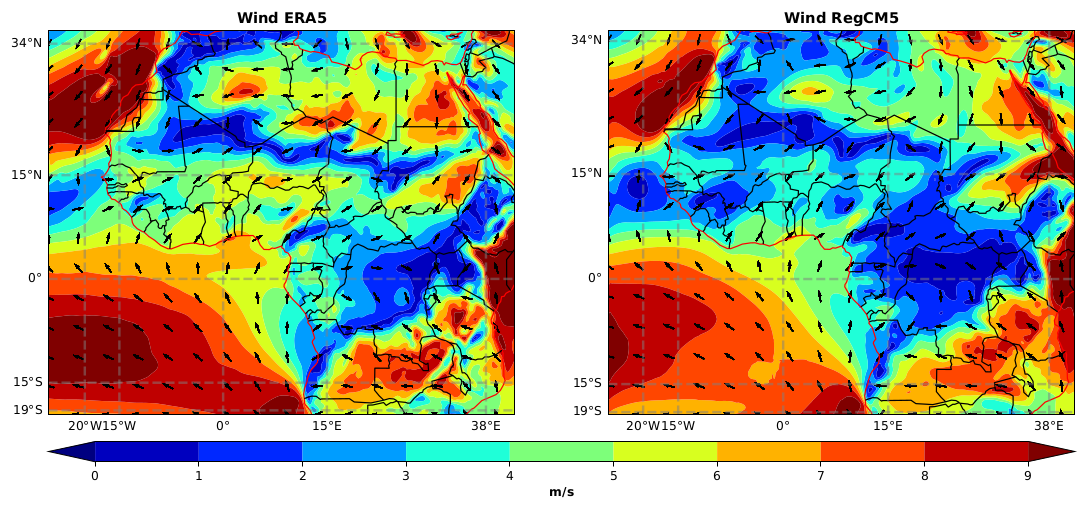
Figure 2JJA (June–July–August) Monsoon wind speed at 875 hPa for ERA5 reanalysis and RegCM5 simulation.
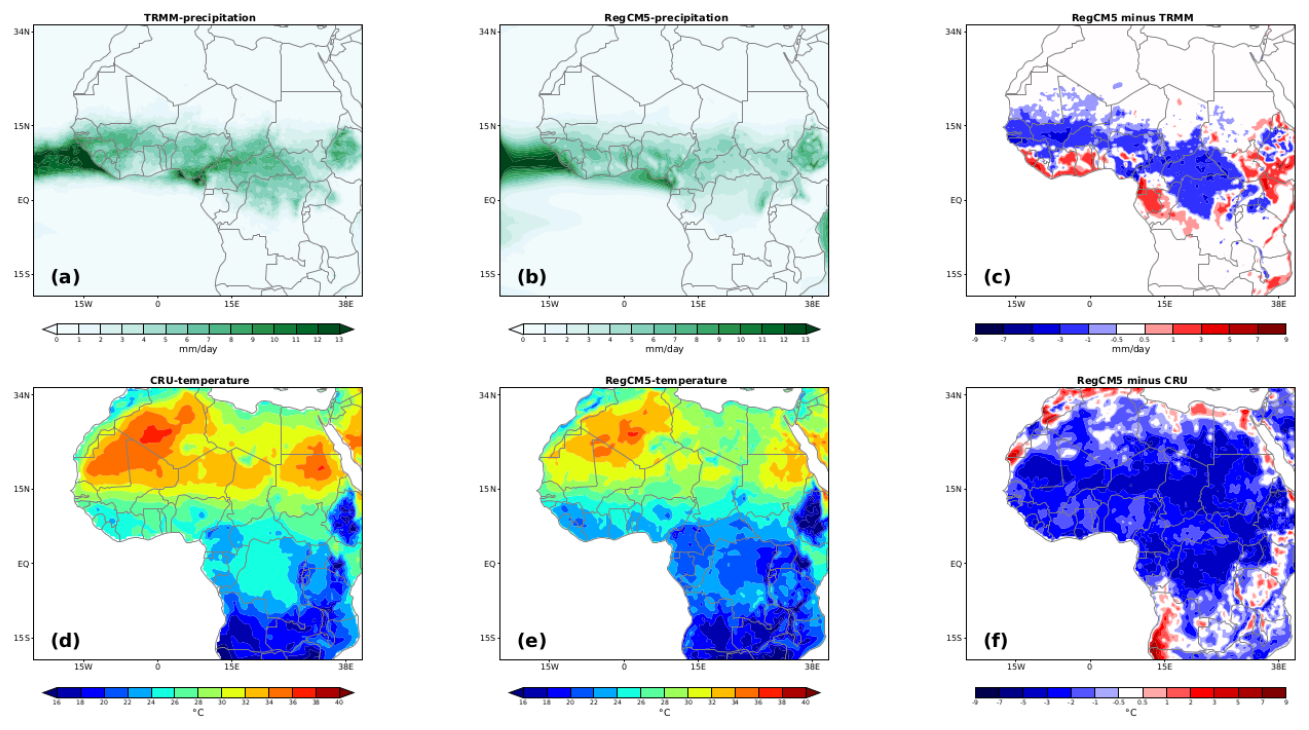
Figure 3Summer (JJA) means Precipitation and Surface Temperature Biases (TRMM and CRU vs. RegCM5). Units: Precipitation in mm d−1, Temperature in °C.
RegCM5 mostly captures the patterns and spatial gradients of the 2 m surface temperature from hot Sahara regions to colder tropical forests, however, there is a cold bias over the northern Sahel/Southern Sahara (ranging from −5 to −1 °C) during the monsoon season (JJA: June–July–August) (Fig. 3f). Attributing surface temperature bias to a specific cause is difficult due to surface-atmosphere interactions and feedbacks (Sylla et al., 2012; Tadross et al., 2006). For the Sahelian and Sahara regions, RegCM5 shows a negative bias which is likely linked to a bias in the surface radiative budget, which in turn depends on simulated surface Shortwave (SW) and Longwave (LW) net radiation (related to surface radiative parameters. It may also be a result of possible excessive high level cloudiness (e.g., Sylla et al., 2012; Zittis et al., 2016) or/and aerosol estimations (e.g., Lavaysse et al., 2011; Wang et al., 2015). In the SHL region, this cold bias is consistent with a weaker monsoon flux and lower precipitation in the Sahel. In contrast, in the equatorial region the temperature bias could be linked, to excessive cooling induced by overestimated precipitations values. Sylla et al. (2012) showed that cold bias in surface temperature is generally consistent with positive rainfall bias. Locally, the overestimation of surface temperature over coastal central Africa has also been observed by Mbienda et al. (2023). This bias in Central Africa might stem from inadequate modelling of the low-level cloud cover that is typical of this area (Philippon et al., 2019). For precipitation, simulated values vary from 0 to more than 13 mm d−1 over the study region, with a spatial and seasonnl patterns of precipitation consistent with TRMM observations (Fig. 3a and b). In summary, the most predominant biases in our simulation are an underestimation of precipitation values in the Sahel and Central Africa, and an overestimation closer to equatorial regions (from −5 to −0.5 in Sahel/Central Africa and from 1 to 5 mm d−1 in the Cameroon Highlands). The RegCM5 model successfully reproduces the rain belt over the Sahelian region, associated with the InterTropical Convergence Zone (ITCZ), stretching from the mountains of Darfur in East Africa to the Guinea Highlands and downstream into the Atlantic. In some subregions, observational data sets do not fully agree. For instance, in comparison to GPCP data, which is consistent with gauge-based precipitation datasets in Africa (Sylla et al., 2013), TRMM data shows weaker precipitation values over East Africa, the Guinea Highlands, and the Cameroon Highlands (Nikulin et al., 2011, 2012). This variability amongst observations should be kept in mind when evaluating the model's results. Model precipitation is extremely sensitive to the choice of parameter combinations used in the physics configurations, such as convection, land surface scheme, boundary layer, etc. The number of parameter combinations is large and model optimization is a complex and often time-consuming task (e.g., KhayatianYazdi et al., 2021). Using the parameterization evaluated above, the precipitation and temperature biases remain reasonable, especially considering the range of bias shown by state-of-the-art CMIP6 (Coupled Model Intercomparison Project phase 6) Global Climate Models and CORDEX (COrdinated Regional Downscaling EXperiments) RCMs for African climate simulations (e.g., Bucchignani et al., 2018; Zittis et al., 2016).
For the west African region, Fig. 4 shows a time-latitude Hovmoeller diagram of precipitation averaged within zones between 10° W and 10° E for the RegCM5 model and TRMM observational data. The three characteristic phases of the African monsoon (Hourdin et al., 2010; Koné et al., 2022; Sultan et al., 2003) can be observed in both the simulated results and the observational data. For TRMM, the onset of the rainy season occurs in mid-April and extends until mid-June, as evidenced by the core of the rainfall band along the Guinea coast between approximately 4 and 7° N, while the simulations show a delayed onset from mid-May to June with lower intensity rainfall. In TRMM observations, the monsoon phase itself is characterised by a shift of the rainfall maximum band, between July and September, reaching 15° N. For this phase, the simulations show a consistent northward precipitation shift, but the maximum does not penetrate as far north as in the observations, consistent with the underestimation of Sahelian precipitation values pointed out earlier. The monsoon withdrawal is observed with precipitation gradually shifting towards the coast. The late season rainfall is more intense in our simulations compared to TRMM. These characteristic seasonal patterns are adequately captured by the RegCM5 model compared to state-of-the-art climate models.
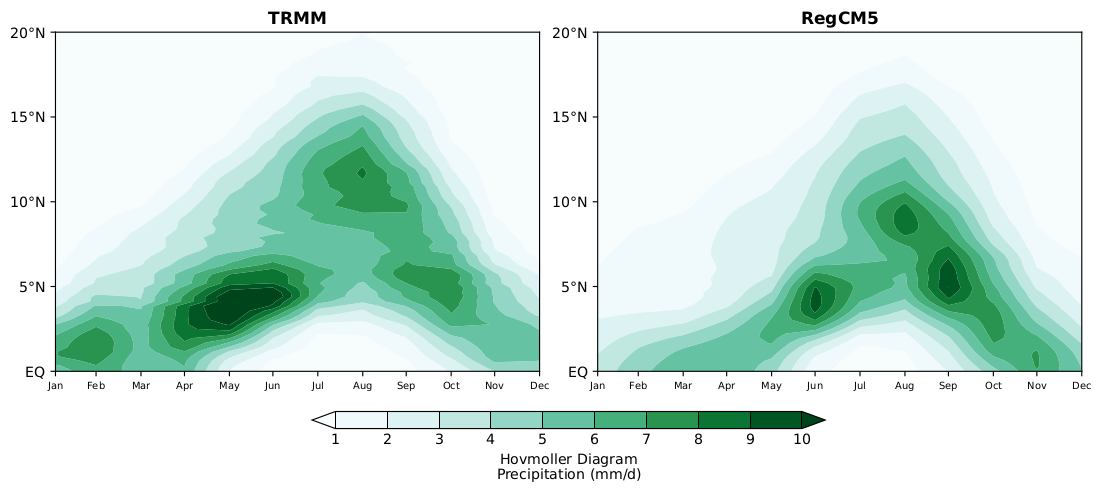
Figure 4JJA Hovmoller diagram of monthly precipitation (mm d−1) averaged between longitudes 10° W and 10° E of the study period.
Additional details on the distribution of daily temperature and precipitation intensities over the Sahel region are provided in the Supplementary Information (Fig. S2), using Probability Density Functions (PDFs) compared to ERA5 and TRMM respectively. These support the model’s reasonable performance on daily-scale variability.
After the evaluations discussed above, we consider that the performance of the simulation model is sufficiently good to support further analysis focusing on atmospheric chemistry.
Since soil moisture is an important driver of microbial activity and BioNO emissions (Skopp et al., 1990), we evaluate simulated soil moisture by comparing it to the Famine Early Warning Systems Network Land Data Assimilation System FLDAS (McNally et al., 2017; McNally, 2018) (Fig. 5). As shown in the figure, JJA soil moisture is greatest in subregions dominated by dense vegetation (forest regions: −7 to 4° N) and in regions where precipitation events are more intense. Despite the overall slight underestimation of simulated soil moisture compared to FLDAS observed data, especially in Saharan regions, RegCM5 captures the spatial distribution of soil moisture both in DJF (December–January–February) and JJA. FLDAS integrates various observational datasets and uses advanced modelling techniques to provide soil moisture data, but its accuracy in arid regions like the Sahara is uncertain due to sparse in-situ data and the extreme dryness of the environment. Soil moisture data in such regions are often derived from remote sensing sources like microwave satellites, which can struggle with accuracy in arid zones where ground measurements are extremely rare (Rao et al., 2022). The spatial distribution of BioNO emissions reflects the influence of the different explicative variables considered in the D2007 ANN. In both seasons, weak BioNO emissions in Saharan regions (above 16° N), are associated with low N content, no N input, low soil moisture and sandy soils. A high percentage of sand in the soil leads to increased evaporation and drainage rates (Delon et al., 2008), which prevents the soil from retaining enough water to support the microbial processes responsible for NO emissions. Between 8 and 16° N (Sahel), locations with high BioNO emission result from a combination of large soil moisture, latitudinal distribution of soil pH, and important nitrogen input (shown in Potter et al., 2010). The seasonal variability of Sahelian emission hot spots is mostly driven by soil humidity, as illustrated in Fig. 5. There is also a substantial canopy inhibition factor in the region of large LAI which, for example, reduces forest emissions to the atmosphere. As outlined in Delon et al. (2008), the Artificial Neural Network (ANN) algorithm used in this study tends to be more suitable for the Sahel region compared to forested region because it is primarily trained on data from semi-arid regions and temperate zones. In forested areas, factors such as dense canopy cover (affecting soil temperature and moisture), higher organic matter content (affecting nitrogen cycling dynamics), and different microbial communities influence soil processes and NO emissions (Davidson et al., 2000; Pilegaard, 2013) differently compared to semi-arid and temperate zones. This discrepancy highlights the need for further region-specific training data to improve the model's accuracy in diverse ecosystems.
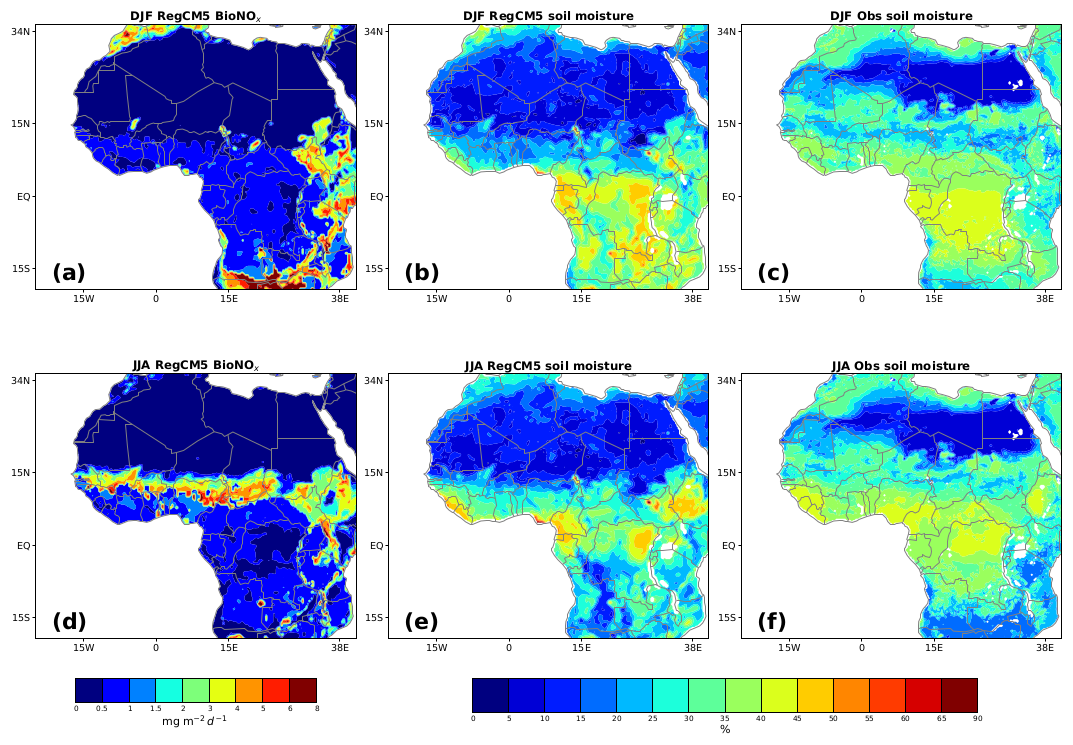
Figure 5Simulated BioNO emissions (in mg m−2 d−1) and Soil Moisture Comparison for DJF and JJA Seasons: Analysis Using FLDAS Noah Land Surface Model L4 for 10–40 cm Soil Depth (in %).
The limited flux measurements for BioNO emissions in Africa make a systematic evaluation of the model challenging. In this study, simulated BioNO emissions range from 0.02 to 7 mg m−2 d−1, corresponding to seasonally averaged flux values ranging from 0.1 to 37.52 ng N m−2 s−1. This is within the range found by both Delon et al. (2008) (from 0.43 to 6.52 mg m−2 d−1) and Davidson and Kingerlee (1997) (from 0.5 to 28 ng N m−2 s−1). The simulated BioNO values are also consistent with measured values from the flight B227 observed data of the British Aerospace 146 (BAe-146) under the Facility for Airborne Atmospheric Measurements (FAAM) program: 0.8 to 35 ng N m−2 s−1, but remain greater than estimations from Ganzeveld et al. (2002) for the Sahel region: 2.32 to 11.6 ng N m−2 s−1. Our simulated BioNO are in good agreement with NO fluxes from soil emissions measured during the DACCIWA field campaign West Africa) in June and July 2016, which ranged from 0 to 48.39 ng N m−2 s−1 (Pacifico et al., 2019). Feig et al. (2008) also obtained NO flux fields in the range of 4.7 to 27.01 ng N m−2 s1, but for South Africa. A summary of these estimates is presented in Table 4. Additional measurements of BioNO emissions from wet African savannas can be found in Table 7 of Delon et al. (2012).
Delon et al. (2008)Ganzeveld et al. (2002)(*FAAM, 2018)Pacifico et al. (2019)Feig et al. (2008)Delon et al. (2017)Table 4Summary of some BioNO emissions estimates from literature.
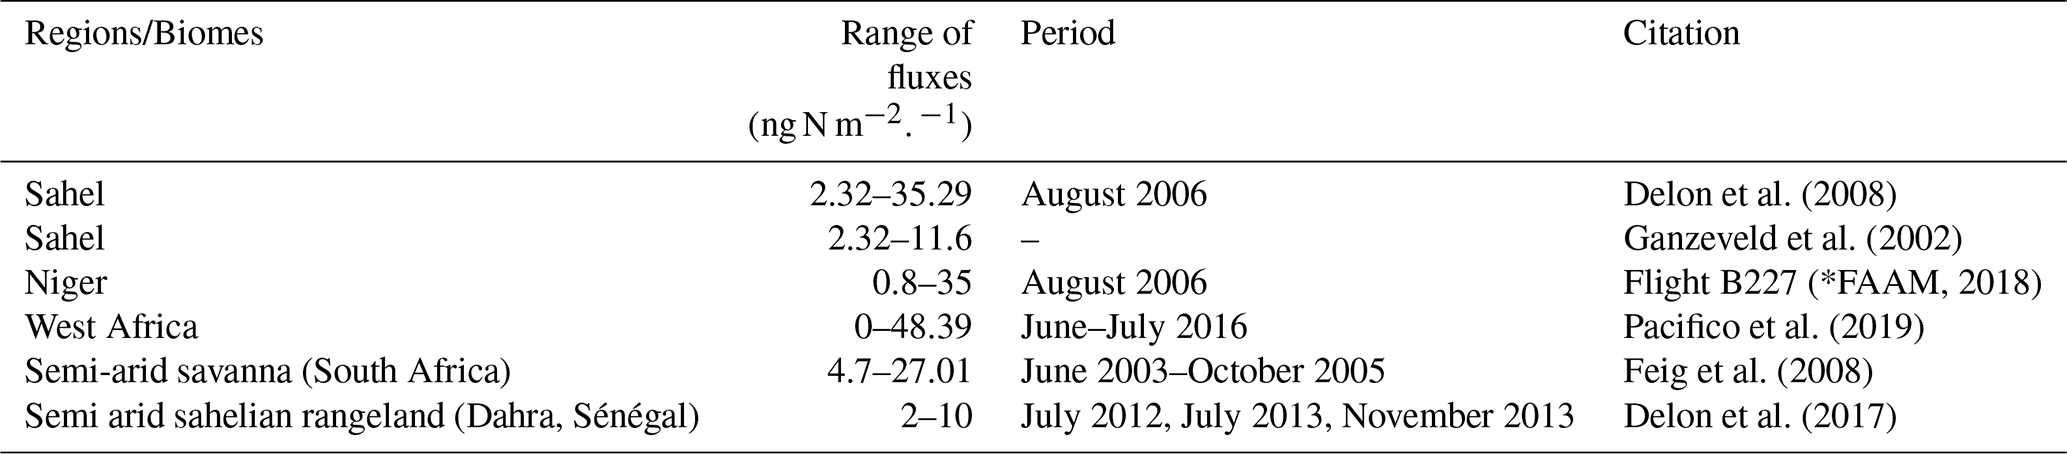
* FAAM: Facility for Airborne Atmospheric Measurements.
Over the whole simulation domain, the total amount of nitrogen emitted due to BioNO emissions range between 0.01 and 4.4 Tg N per month. If we downscale for the Sahel region (10° W–10° E, 10–20° N, corresponding to an area of 2.3×10⁶ km2) as done in Stewart et al. (2008), the simulated emissions range from 0.0006 to 0.23 Tg N per month. This value is consistent with both Stewart et al. (2008)'s estimates of 0.03 to 0.3 Tg N for 2 months (July and August) and Yan et al. (2005)'s estimates of 1.373 Tg N yr−1 for all of Africa. Delon et al. (2010) calculated an annual estimate of 0.35 Tg N yr−1 over the Sahel region. Over the same region (the Sahel), Vinken et al. (2014) estimated total annual BioNO emissions to be 0.52 Tg N yr−1, using a top-down soil NOx emission inventory for 2005 based on retrieved tropospheric NO2 column from the Ozone Monitoring Instrument (OMI).
Our total estimate is also consistent with Williams et al. (2009), who estimated BioNO emissions for the same Sahel region (0.575 Tg N yr−1) based on biogenic emission inventories provided by Granier et al. (2000) and Lathiere et al. (2006). It is worth noting that our estimated emission fluxes, particularly in the Sahel region, are higher than those reported by Simpson and Darras (2021), which were calculated in the framework of the CAMS project using the EMEP MSC-W model (Meteorological Synthesising Centre – West of the European Monitoring and Evaluation Programme, EMEP). Their estimates ranged from 0 to 3.5 mg m−2 d−1 over the study period and region. In our study, the ANN algorithm incorporates additional surface controlling parameters, which may explain why our model yields higher emission estimates.
6.1 Regional and local nitrogen
6.1.1 NO2 concentration
We first analyse the simulated seasonal surface nitrogen (NO2 and HNO3) concentrations for the BASE run over the domain, in comparison with the CAMS reanalysis (Inness et al., 2019; Wagner et al., 2021) and outputs from the GEOS-Chem model. The variability of simulated NO2 concentration over the domain of interest is primarily driven by regional biomass burning emissions (see Fig. 1). We hence observe consistent spatial and seasonal patterns between RegCM5 simulations, CAMS and the GEOS-Chem model (Fig. 6) reflecting the general spatial agreement between the different biomass burning emission inventories considered in these models. However, sub-regional details, for instance over west Africa, can be clearly distinguished in the higher resolution models (RegCM5 and CAMS) but not in the coarser GEOS-Chem model. Compared to the CAMS reanalysis and to GEOS-Chem, the RegCM5-BASE estimates lower surface NO2 concentrations (about 0.7–0.9 ppb less), especially in the Sahel regions during the summer. In the Biomass burning regions (see Fig. 1), these differences are less visible. The biomass burning regions, which are primarily located in the central (in DJF) and southern (in JJA) parts of Africa, are areas where extensive burning occurs.
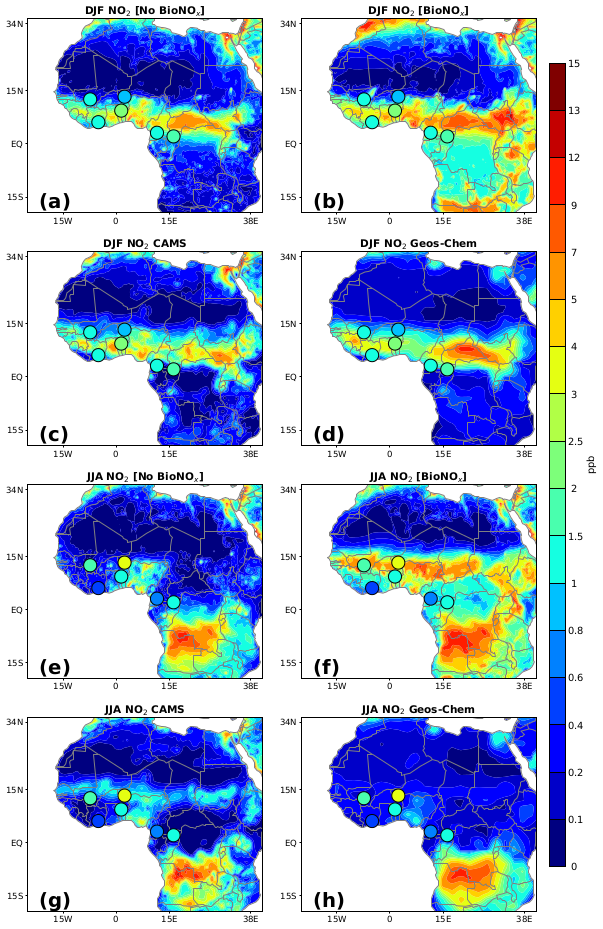
Figure 6Comparison of BASE and BioNO simulations of surface NO2 against the CAMS reanalysis and the GEOS-Chem model for DJF and JJA seasons. The INDAAF measurement values are overplotted and represented by small circles on the map.
This difference in NO2 concentration can be attributed to differences in NO emissions (biomass burning, anthropogenic inventories and BioNO) as BioNO emissions were not accounted for in the BASE simulation (cf. Sect. .3). Indeed, CAMS includes BioNO emissions from a fixed climatology based on the Precursors of Ozone and their Effects in the Troposphere (POET) database for 2000 (Granier et al., 2005) inventory, while GEOS-Chem parameterizes soil NO emissions dynamically using the Hudman et al. (2012) scheme. Differences in biomass burning injection heights and nitrogen fluxes considered in RegCM5 versus CAMS and GEOS-Chem could also explain differences in surface concentrations. The introduction of BioNO fills this gap to some extent, by increasing surface NO2 concentrations, bringing them closer to, and sometimes exceeding CAMS values (Fig. 6b and f). This is especially apparent in transitional ecosystems such as savannas and grasslands (see Fig. S1 in the Supplement). To assess the potential importance and to quantify the impact of BioNO emissions on lower troposphere NO2, we considere the difference between the BioNO and the BASE simulations (Fig. 7). The plots are shown for a vertical cross section averaged between −10 and 10° E, from 4 to 21° N.
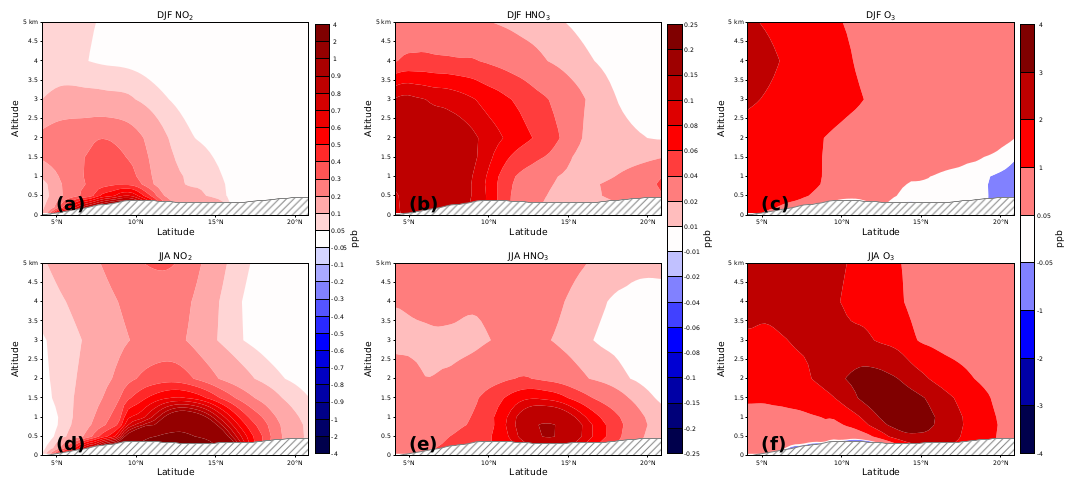
Figure 7DJF and JJA differences (BIONO – BASE) in NO2 (a, d), HNO3 (b, e) and O3 (c, f) concentrations, on the transect 4–21° N averaged between 10° W–10° E. Units are in ppb.
The comparison between RegCM5 simulations and satellite-derived NO2 data highlights both the strengths and limitations of the model (Figs. 8 and 9). The model simulation is evaluated against two observational datasets: the surface-level NO2 concentrations derived from OMI/TROPOMI and the tropospheric NO2 columns from OMI/Aura datasets, both of which are detailed in Section 3.2. The RegCM5 model simulation captures the general spatial distribution of NO2 across the region. Model results and satellite data both show high concentrations of NO2 in areas such as Sahel and forested regions, where biomass burning plays a preponderant role (see Fig. 1). However, the model overestimates NO2 levels compared to both TROPOMI-derived surface NO2 and OMI-derived tropospheric NO2 columns, particularly when BioNO emissions are included. This overestimation could be due to several factors, including the way in which biogenic and biomass burning emissions are represented in the model, and the inherent uncertainties in the satellite-derived data. The use of ground-monitoring data to constrain models may introduce biases, particularly in regions with sparse monitoring data. On the other hand, as detailed by Cooper et al. (2022), uncertainties in the conversion of satellite-observed NO2 column densities into surface concentrations can lead to errors. These uncertainties include potential errors of around 10 % in the retrieval of slant columns from satellite radiances and errors ranging from 23 % to 37 % in the calculation of air mass factors. Thus, the apparent overestimation of NO2 by RegCM5 compared to TROPOMI (Fig. 8) may not only result from model biases but also from the uncertainties in the processing of satellite data. In addition, a spatial correlation analysis shows moderate agreement between the RegCM5 simulations and the OMI/Aura-derived tropospheric NO2 columns (Fig. 9). Specifically, the Pearson Correlation Coefficient (PCC) indicates a correlation of 0.41 when excluding BioNO emissions (BASE run) and a correlation of 0.37 when BioNO emissions are included in the simulation. This suggests that the addition of BioNO emissions reduces the overall correlation with the OMI observations. One potential explanation for this reduction could be that OMI measures the entire tropospheric column, while the model's representation of NO2 distribution may be influenced by uncertainties in vertical mixing and emission sources. In particular, diffuse biogenic emissions or localized sources (e.g., Ossohou et al., 2019) may not be fully captured in the satellite retrievals, potentially affecting the correlation. Despite some discrepancies in specific regions, the spatial correlation suggests a reasonable alignment of NO2 patterns between the model and the satellite observations, particularly in regions where biomass burning and other large-scale processes dominate.
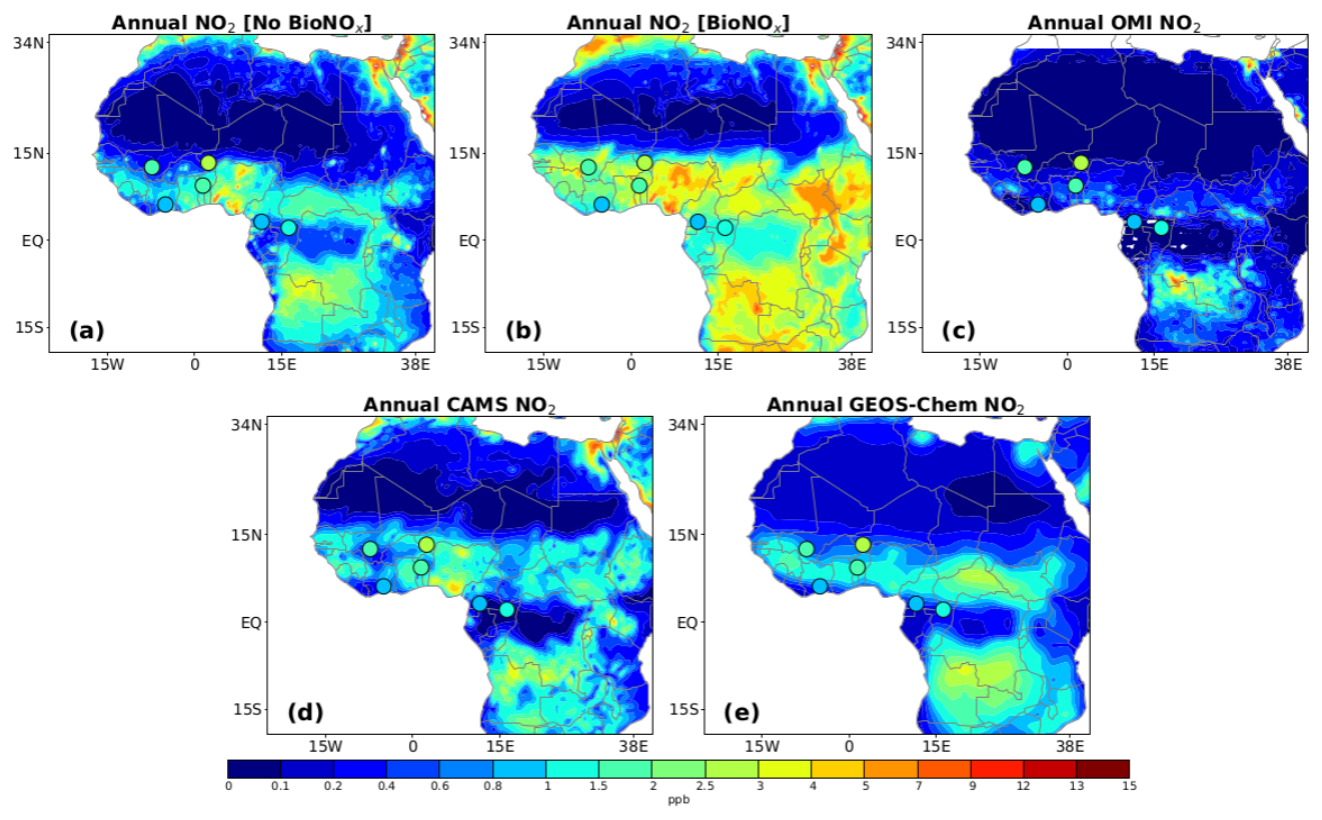
Figure 8Comparison of BASE and BioNO simulations of annual mean surface NO2 concentrations (ppb) against OMI and TROPOMI-derived surface-level concentrations over 2010–2013, the CAMS reanalysis and the GEOS-Chem model. The INDAAF measurement values are overplotted and represented by small circles on the map.
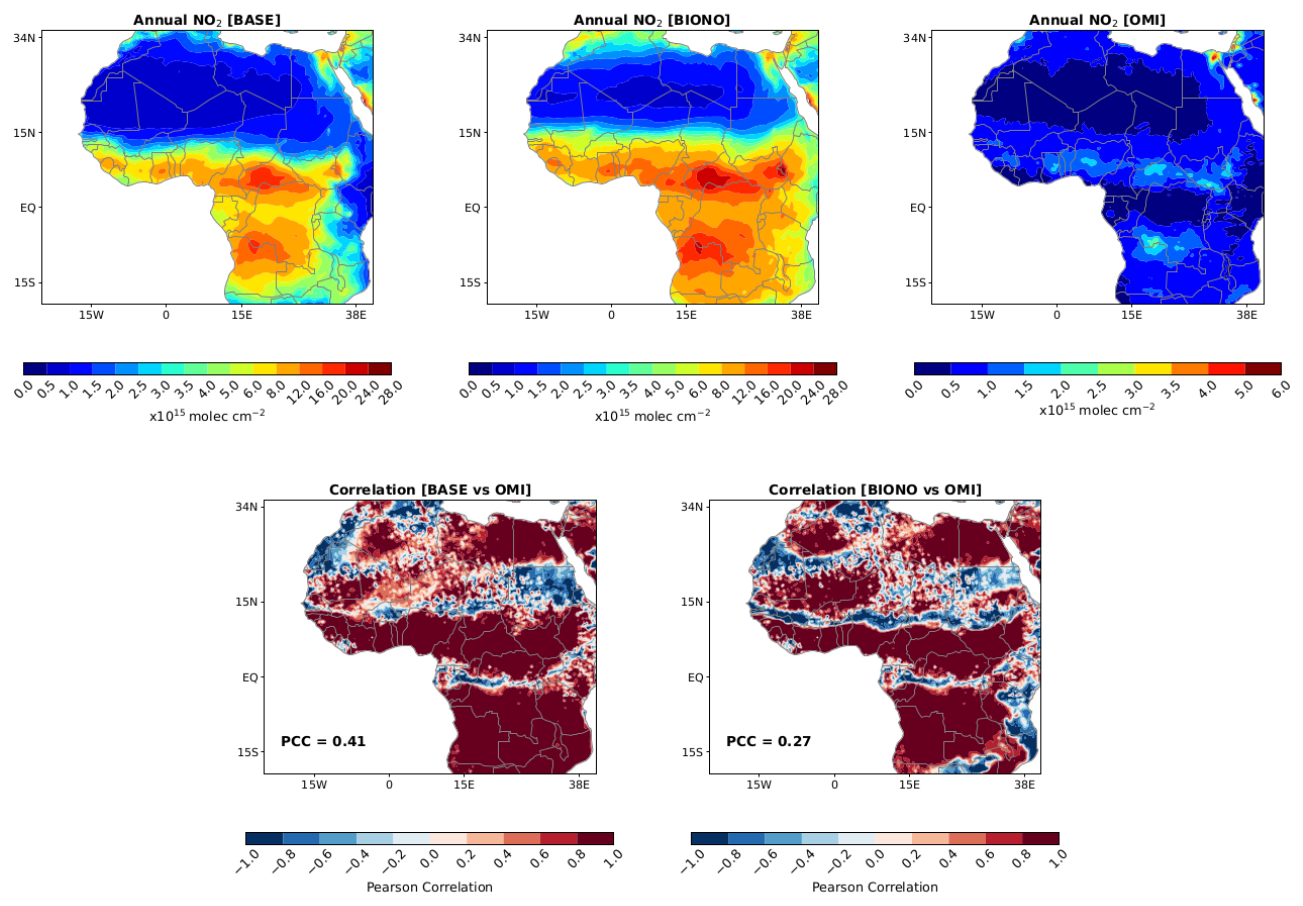
Figure 9Comparison between BASE and BIONO simulations, and OMI/Aura-derived tropospheric NO2 columns over 2010–2013, and associated Pearson spatial correlation.
At the regional scale, the effect of incorporating BioNO emissions using the ANN algorithm, leads to an overall increase in NO2 seasonal mean concentrations ranging from 0 to 2–4 ppb. This increase also appears in the lower troposphere, as illustrated in Fig. 7. The maximum increase occurs over the Sahel region (especially 10–21° N) and can reach up to 3 ppb in JJA, consistent with increased BioNO fluxes in this region. We note a general positive correlation between the BioNO emissions (Fig. 5a and d) and the difference between the BIONO and BASE simulations at the surface level (Fig. 16a and d). This increase in surface NO2 concentrations over the domain is consistent with Delon et al. (2008), who report a local BioNO induced NO2 increase by up to 0.9 ppb at 4° E and between 7–21° N for August. Based on global simulations, Steinkamp et al. (2009) found an increase in global NOx mean mixing ratio in the lower troposphere reaching 7 % and 17 % for DJF and JJA respectively.
To further examine the simulated NO2 concentrations, we compare the simulated results with monthly average surface concentrations from INDAAF stations. Simulated outputs at the lower model level (around 40 m a.g.l.) are interpolated to the site locations for the simulated period. BIONO and BASE biases (based on the 3-years monthly-averaged mass concentration) (Table 5) and correlation with observations (Fig. 11) were calculated for NO2 at the corresponding stations.
Table 5BASE, BIONO, CAMS and GEOS-Chem Biases (ppb) for NO2. The Reduced/Increased (Red/Inc) biases given by BIONO run is in %. Ba: Banizoumbou, Ka: Katibougou, La: Lamto, Dj: Djougou, Bo: Bomassa, Zoétélé: Zo.
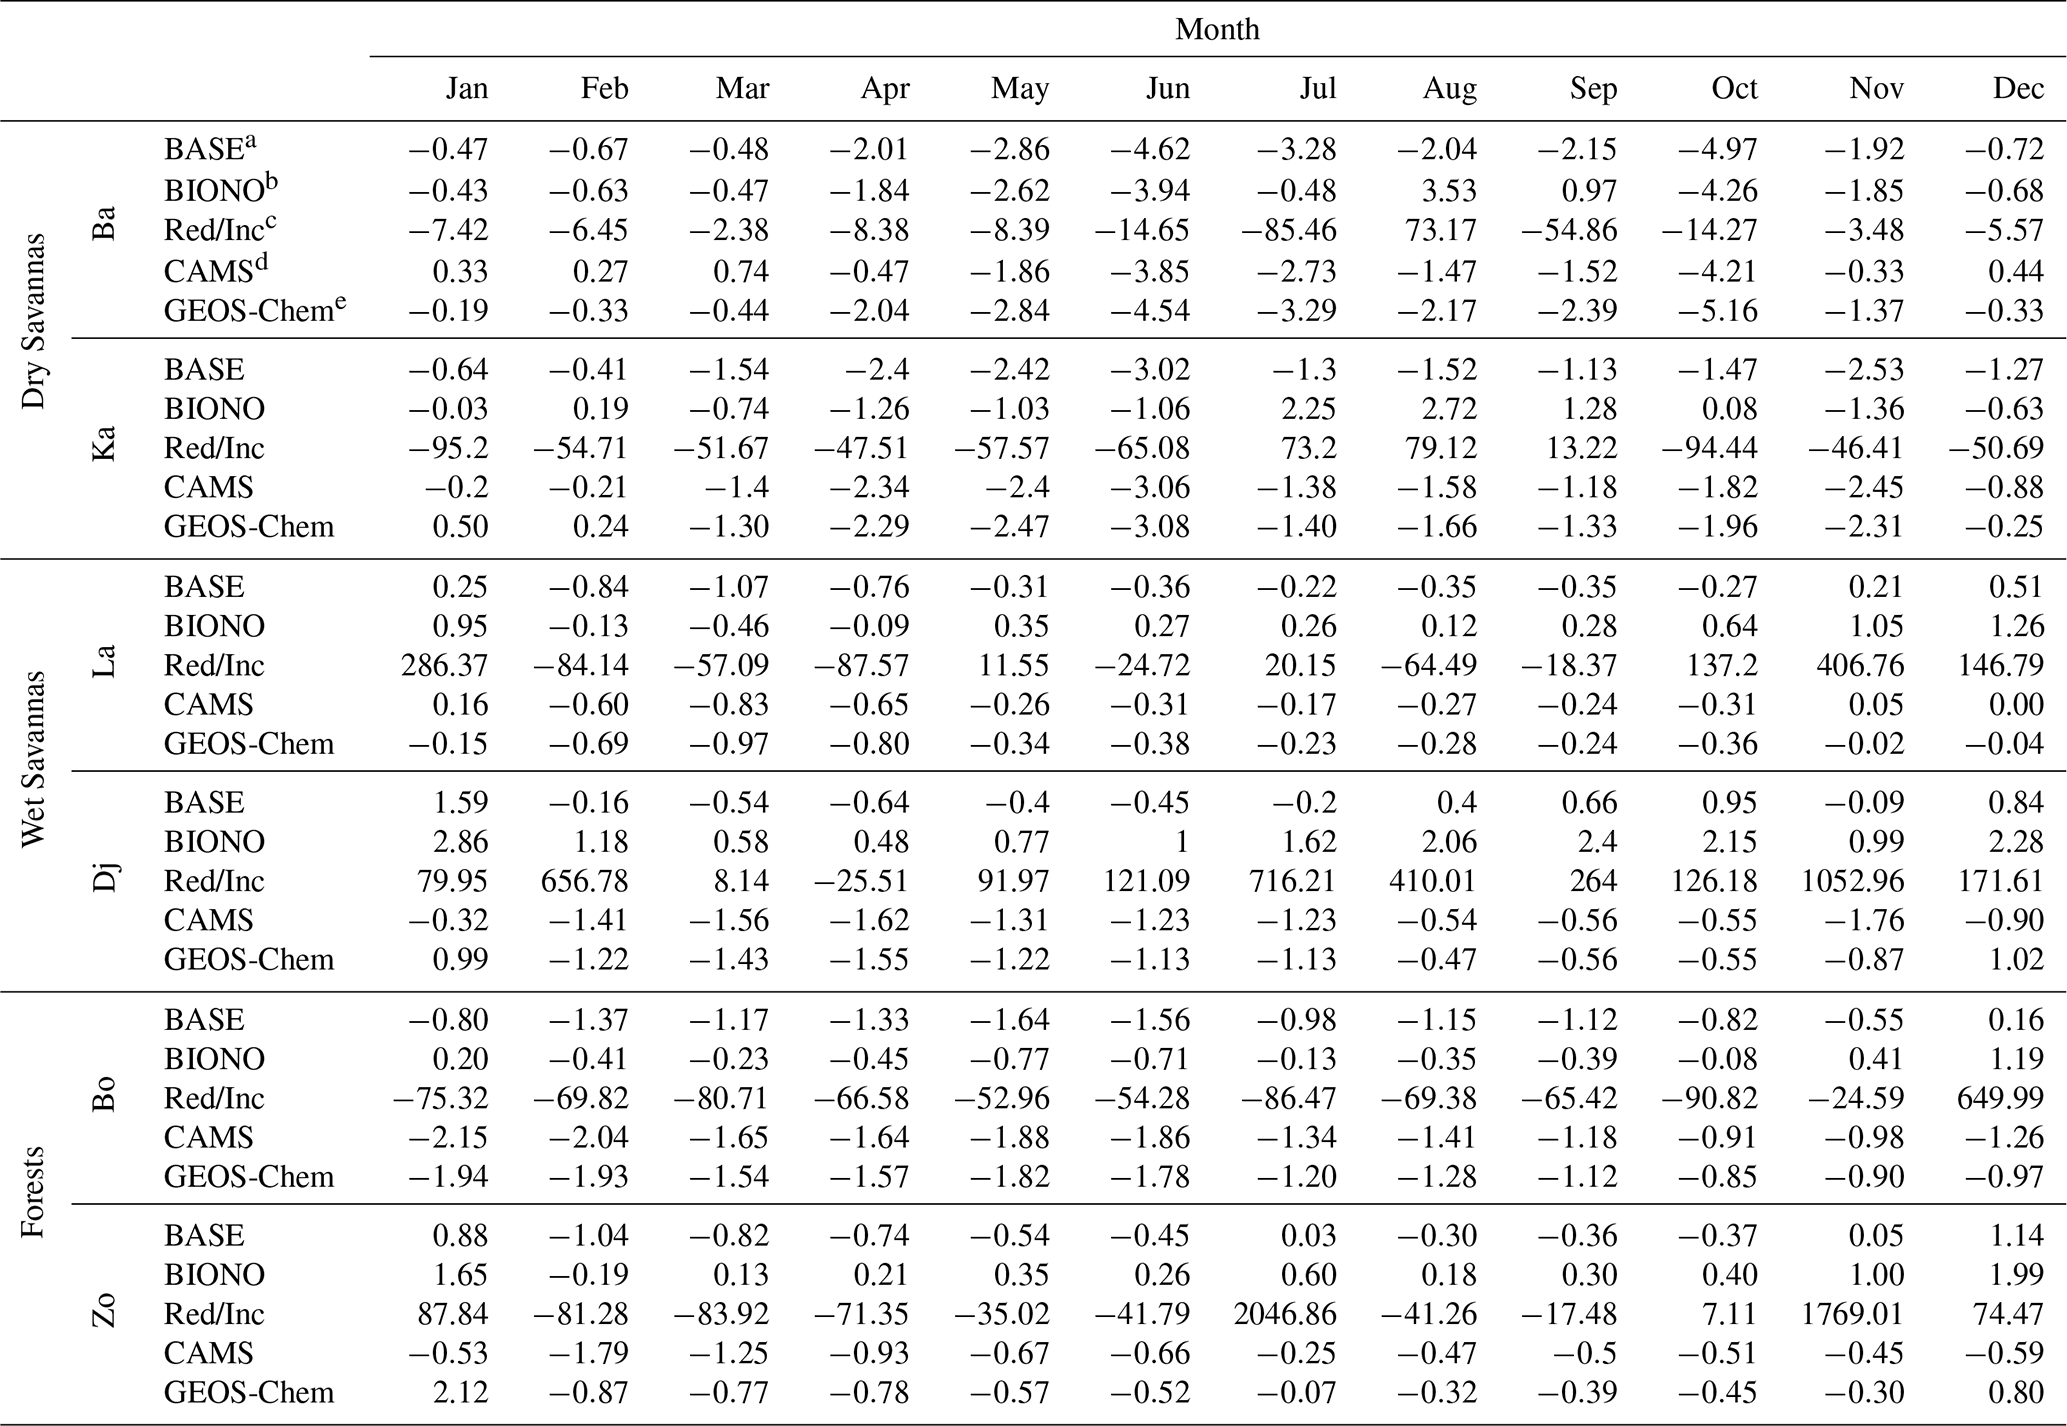
a Bias with BASE simulation. b Bias with BIONO simulation,. c Reduction/Increase Bias by BioNO emissions. d Bias with CAMS reanalysis. e Bias with GEOS-Chem model.
Figures 10 and 11 show that the BASE model simulation tends to underestimate NO2 concentrations except for december-january in wet savannas (Lamto, Djougou). This is also the case for the CAMS reanalysis (Fig. 10). RegCM5-BASE NO2 concentrations are especially underestimated over dry savannas (Banizoumbou, Katibougou) in the wet season, where the maximum negative bias recorded is ppb in June and October at the Banizoumbou site. Mostafa et al. (2019) used the RegCM4 model and also showed that the model mostly underestimates, compared to the Greater Cairo observation data (Egypt), the monthly averages of NO2 concentrations at four representative sites, with maximal underestimation in April. Taking into account BioNO emissions has a very considerable impact on reducing the dry savanna's wet season bias, as illustrated in Figs. 10 and 11. Figure 10 suggests that this reduction can reduce the model's maximum negative bias to ppb when BioNO are accounted for, vs. −4.62 ppb in the BASE run, in June at Banizoumbou. Even though this reduction lowers the bias, it remains high and is also observed in the CAMS reanalysis (−3.85 ppb) and the state-of-the-art model (GEOS-Chem: −4.54 ppb) for the same month and site (see Table 5). We can observe in Fig. 10 that the model (BIONO run) tends to produce maximum concentrations in the middle of the rainy season, while the observations show that maximum NO2 concentrations occur at the beginning and end of the wet season (in a sort of bi-modal pattern). This could be due to a nitrogen pool limitation not accounted for by the ANN approach, which reacts only to environmental conditions. Indeed, soil N content in the Sahel shows a maximum at the end of the rainy season when senescent herbaceous biomass begins to decompose, leading to increased BioNO fluxes (not represented in the model). The temporal distribution of rain events might also be at play, with emission peaks occurring for rainfall events consecutive to a dry period, which are more likely at the beginning and end of the rainy season (Gasche and Papen, 1999; Hickman et al., 2018; Johansson et al., 1988; Jaeglé et al., 2005; Yienger and Levy, 1995).
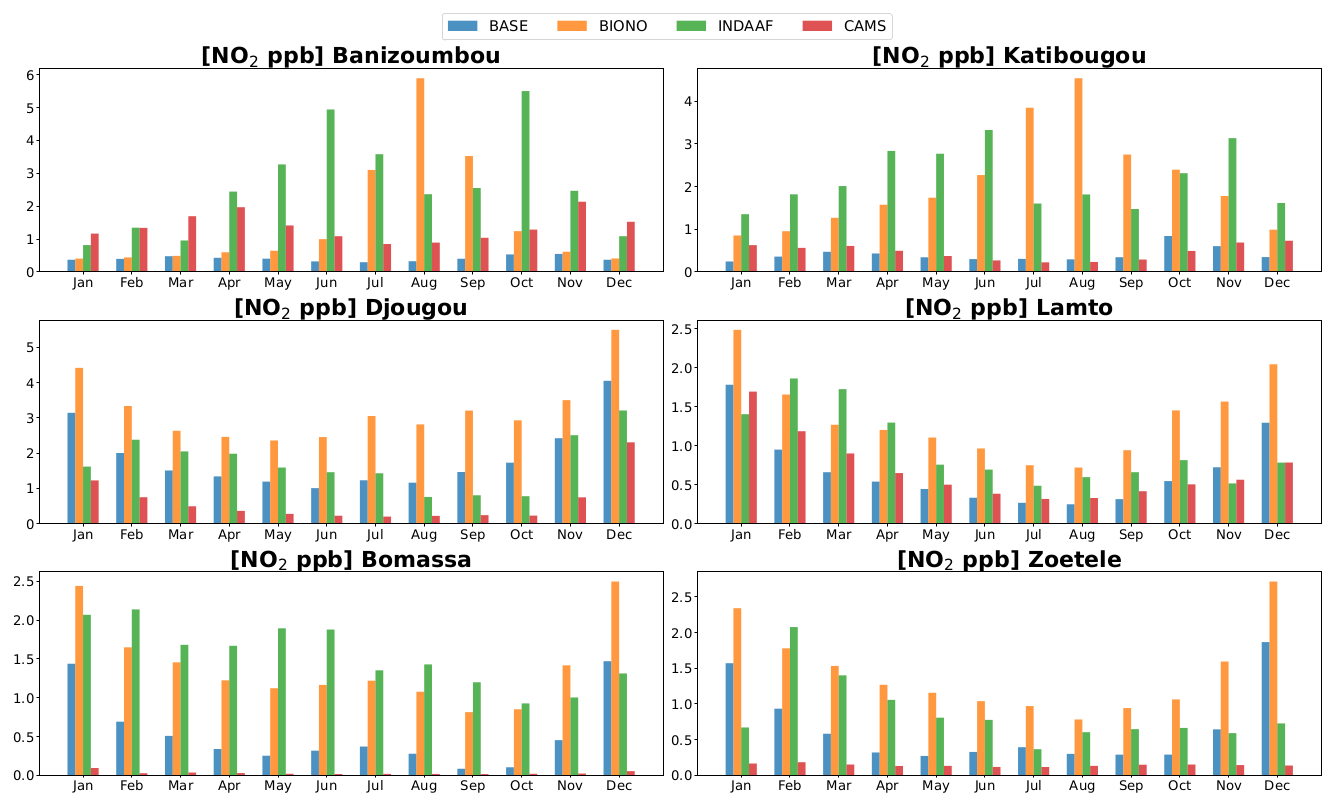
Figure 10Simulated monthly-averaged concentrations of NO2 by BASE, BIONO runs and the CAMS reanalysis in comparison with INDAAF observation at representative remote sites.
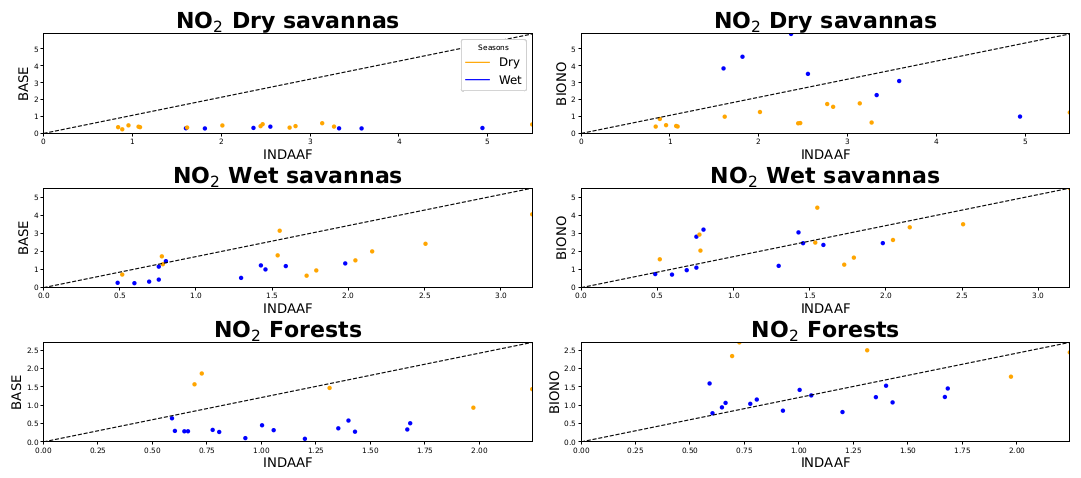
Figure 11Surface observed NO2 concentrations (INDAAF) vs. simulated with RegCM5. BioNO emissions are considered in the right panel.
For wet savannas, the model is consistent with observed measurements for the BASE simulation. During the dry season, positive biases are present in the BASE run for wet savannas (unlike dry savannas), and range between 0.2 and 1.6 ppb. The highest NO2 surface concentrations in the dry season are linked to biomass burning emissions (Oppenheimer et al., 2004; van Marle et al., 2017). Moreover, Ossohou et al. (2019) suggest that NO2 concentrations in the dry season could be due to the intensity of biomass burning sources in all of the six sites except Banizoumbou and Katibougou. This helps to explain the observed positive biases, which may be enhanced by including BioNO emissions in the model. While including BioNO emissions leads to a small improvement in simulation results, especially for the Lamto station, they tend to worsen biases at wet savanna sites. For instance, the maximum positive bias is increased by ∼1.2 ppb in January at the Djougou site (∼79.9 % increase in bias). The BioNO emissions are possibly overestimated due to a larger and excessive response of the ANN to soil moisture in wet savanna compared to dry savanna in both seasons (Fig. 5), and which may be accentuated by a smaller canopy reduction factor when compared to forested regions. Similarly, GEOS-Chem model also displays positive biases in the dry season of wet savannas, particularly in Djougou, where the bias reaches 0.99 ppb in January. This suggests that the overestimation could be a systematic issue across models, potentially due to uncertainties in emissions or local photochemistry.
For tropical/transition forest ecosystems, both the BASE simulation and CAMS reanalysis show a notable NO2 underestimation compared to INDAAF measurements. The discrepancies observed in the BASE and CAMS simulations could be due to several factors, including the representation of NOx sources, such as anthropogenic emissions, near the surface and regional chemical processes. GEOS-Chem also underestimates NO2 concentrations in these sites, with biases reaching −1.94 ppb in January at Bomassa, which are comparable to the BASE (−0.80 ppb) and CAMS (−2.15 ppb) biases. Furthermore, INDAAF stations are often located in areas with strong simulated NO2 gradients (Fig. 6b and f), particularly in DJF, where even slight spatial discrepancies could lead to notable differences between simulated and observed levels (this is the challenge of regional representativity of the INDAAF stations). The inclusion of BioNO emissions in the simulation helps to reduce these discrepancies by increasing NOx concentrations, which in turn brings the simulated ozone levels closer to observed levels (Figs. 10 and 11).
Overall, our results from Fig. 10 show that the inclusion of BioNO emissions leads to a noticeable improvement in modeled surface NO2 concentrations at specific INDAAF stations, especially in semi-arid locations. This indicates that the ANN-based parameterization reasonably captures local soil NO emissions where soil and climatic conditions align with the training data. However, we emphasize that these local-scale improvements do not straightforwardly translate into a reliable representation at the regional or continental scale. Indeed, the relatively large increase in NO2 concentrations observed in some regions when adding BioNO reflects the episodic and spatially heterogeneous nature of soil NO pulses, especially in semi-arid areas following soil wetting events. Thus, these increases do not imply that total BioNO emissions systematically exceed anthropogenic or BB emissions at the continental scale. Rather, the large relative impact observed locally reflects the high sensitivity of NO2 concentrations to episodic BioNO pulses.
Furthermore, our parameterization currently excludes other major natural NOx sources: the lightning NOx emissions, which contribute substantially to tropical tropospheric NOx (Jaeglé et al., 2005). Their omission likely leads to an underestimation of total natural NOx and may cause an artificial amplification of BioNO's relative impact in our model results. Similarly, BB emissions from the GFED4 inventory, while widely used, are known to have uncertainties and likely underestimations over Africa (e.g., van Wees and van der Werf, 2019; Giglio et al., 2013). Moreover, since BB and BioNO emissions may be seasonally correlated, part of the improvement observed when including BioNO might compensate for underrepresented BB or unrepresented lightning NOx emissions.
Extrapolating the ANN-based BioNO parameterization to regions with land cover and meteorological conditions not well represented in the training data, such as dense tropical forests, also introduces further uncertainty in the regional-scale simulations. Finally, recent TROPOMI-based inversion studies (Opacka et al., 2025) independently suggest that current bottom-up inventories underestimate natural NOx sources in Africa. Their findings indicate that soil NO emissions should be increased by approximately 26 %, while lightning NOx emissions may be underestimated by a factor of 4. These conclusions align with our results and support the importance of improving natural NOx source representations, including process-based BioNO emissions, to better simulate atmospheric NO2 over Africa.
6.1.2 HNO3 concentration
Simulations exhibit a consistent representation of HNO3 spatial distributions between the different models (Fig. 12). While RegCM5 concentrations are quite close to CAMS in magnitude, both are substantially smaller than GEOS-Chem, in relation to the O3 fields as discussed later.
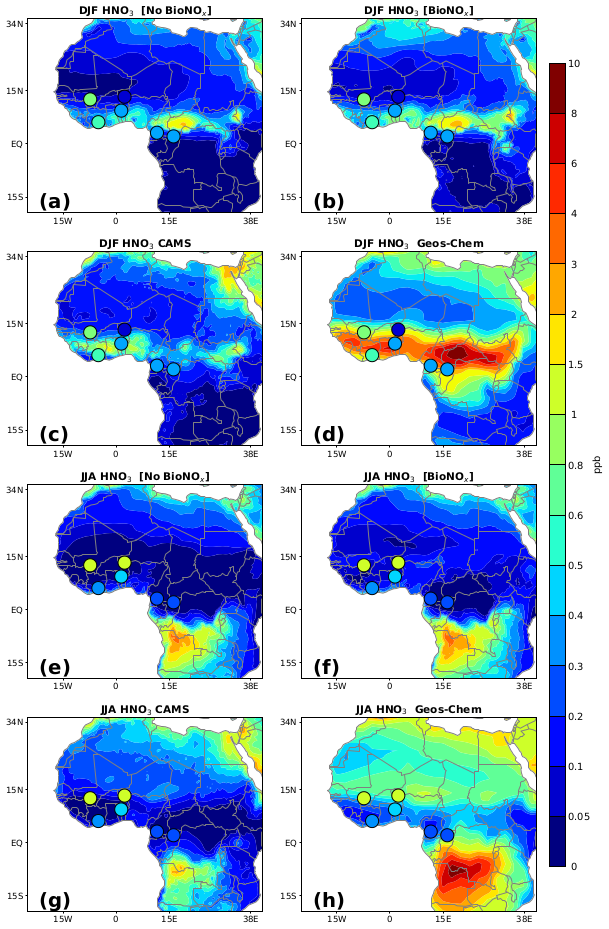
Figure 12Comparison of BASE and BioNO simulations of surface HNO3 concentrations (in ppb) against the CAMS reanalysis and the model GEOS-Chem for DJF and JJA season. The INDAAF measurement values are overplotted and represented by small circles on the map.
Over the Sahel, the lower simulated HNO3 concentrations for JJA (BASE run) are likely associated with the previously discussed underestimation of modelled NO2 in the regions (5–20° N), since HNO3 is a product of NO2 oxidation. In general, including BioNO emissions results in increased spatial concentrations of HNO3, bringing RegCM5 simulation results closer to CAMS and GEOS-Chem (Fig. 12).
When BioNO emissions are included in the model, the lower troposphere HNO3 values increase by up to 0.3 ppb (Fig. 7), and are correlated with large BioNO emissions (Fig. 5a and d), as for NO2. The effect of BioNO on HNO3 is smaller compared to NO2. This sensitivity difference is likely due to chemical controls occurring through OH and O3 formation (Steinkamp et al., 2009). HNO3 formation pathways from NO2 involve the presence of oxidants such as OH and O3, which are controlled by regional photo-oxidant chemistry and emissions. As a result, the impact of BioNO on simulated HNO3 is not as straightforward as for NO2.
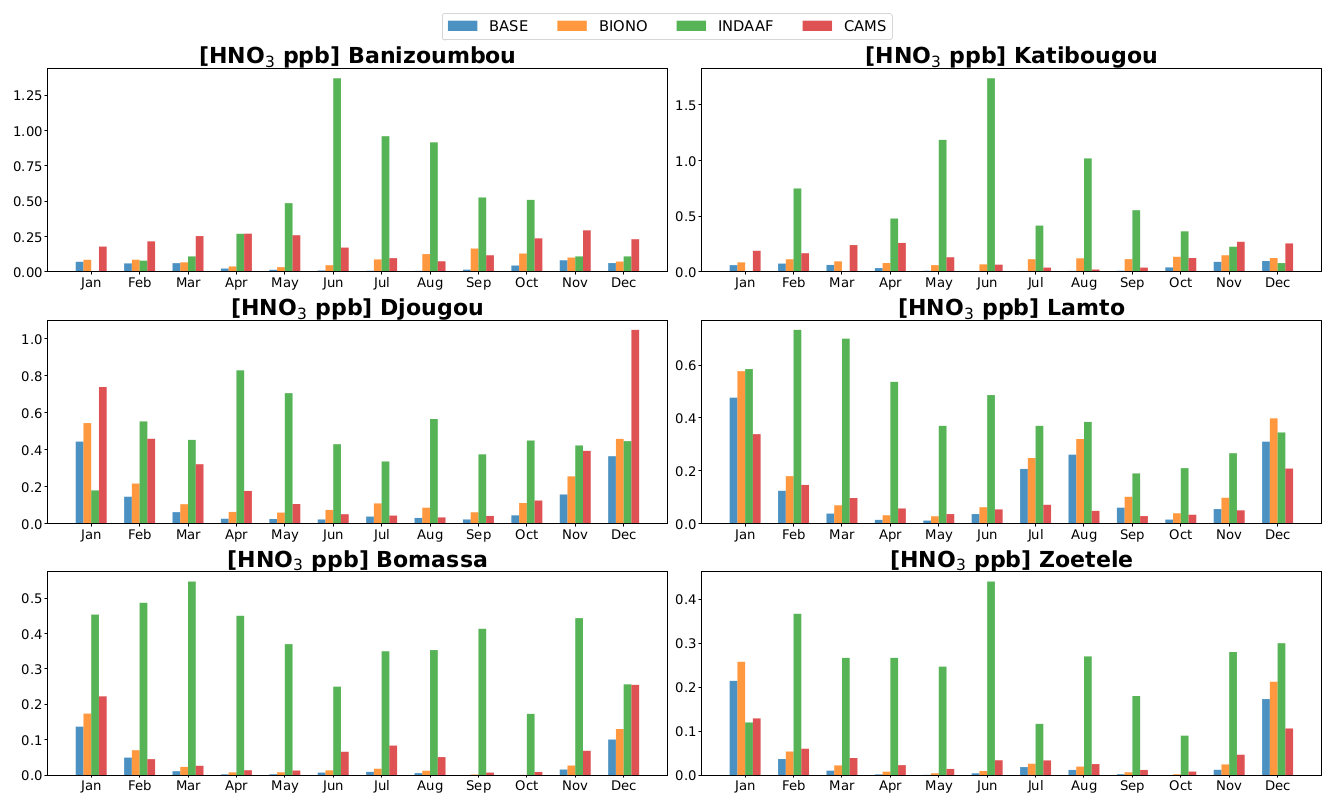
Figure 13Simulated monthly-averaged concentrations of HNO3 by BASE, BIONO runs and the CAMS reanalysis in comparison with INDAAF observation at its representative remote sites.
As for NO2, both RegCM5 and CAMS show an overall large underestimation of HNO3 concentrations compared to available measurements for nearly all INDAAF stations (Fig. 13). The corresponding biases are large in the wet season and small in the dry season, when the contribution of biomass burning is more important relative to BioNO emissions (Fig. 13/Table 6). The maximum bias, also obtaining in late June for wet season over dry savannas, is likely due, at least in part, to the same reasons discussed previously for the monthly-averaged NO2 concentrations. Lin et al. (2013) argue that enhanced soil emissions and higher NOx oxidation rates under warm conditions can generate high atmospheric HNO3. Despite the remaining large underestimation, due to smaller changes improvement across all ecosystems, the addition of BioNO emissions in RegCM5 helps reduce the biases and brings the model results closer to the observed data (Fig. 13). Figure 13 indicates an overall increase at all study sites and a reduction in negative bias: a maximum of −1.67 ppb vs. −1.73 ppb in June (3.51 % reduction in negative bias) in dry savannas. This underestimation is also observed in CAMS and GEOS-Chem models, particularly for June, where CAMS and GEOS-Chem biases reach −1.67 and −1.11 ppb, respectively, in Katibougou. In wet savannas, we obtain a maximum negative bias of −0.77 ppb vs. −0.8 ppb in April (4.56 % reduction in negative bias), and a 2.27% reduction in negative bias over forests.
Table 6BASE, BIONO, CAMS and GEOS-Chem Biases (ppb) for HNO3. The Reduced/Increased (Red/Inc) biases given by BIONO run is in %. Ba: Banizoumbou, Ka: Katibougou, La: Lamto, Dj: Djougou, Bo: Bomassa, Zoétélé: Zo.
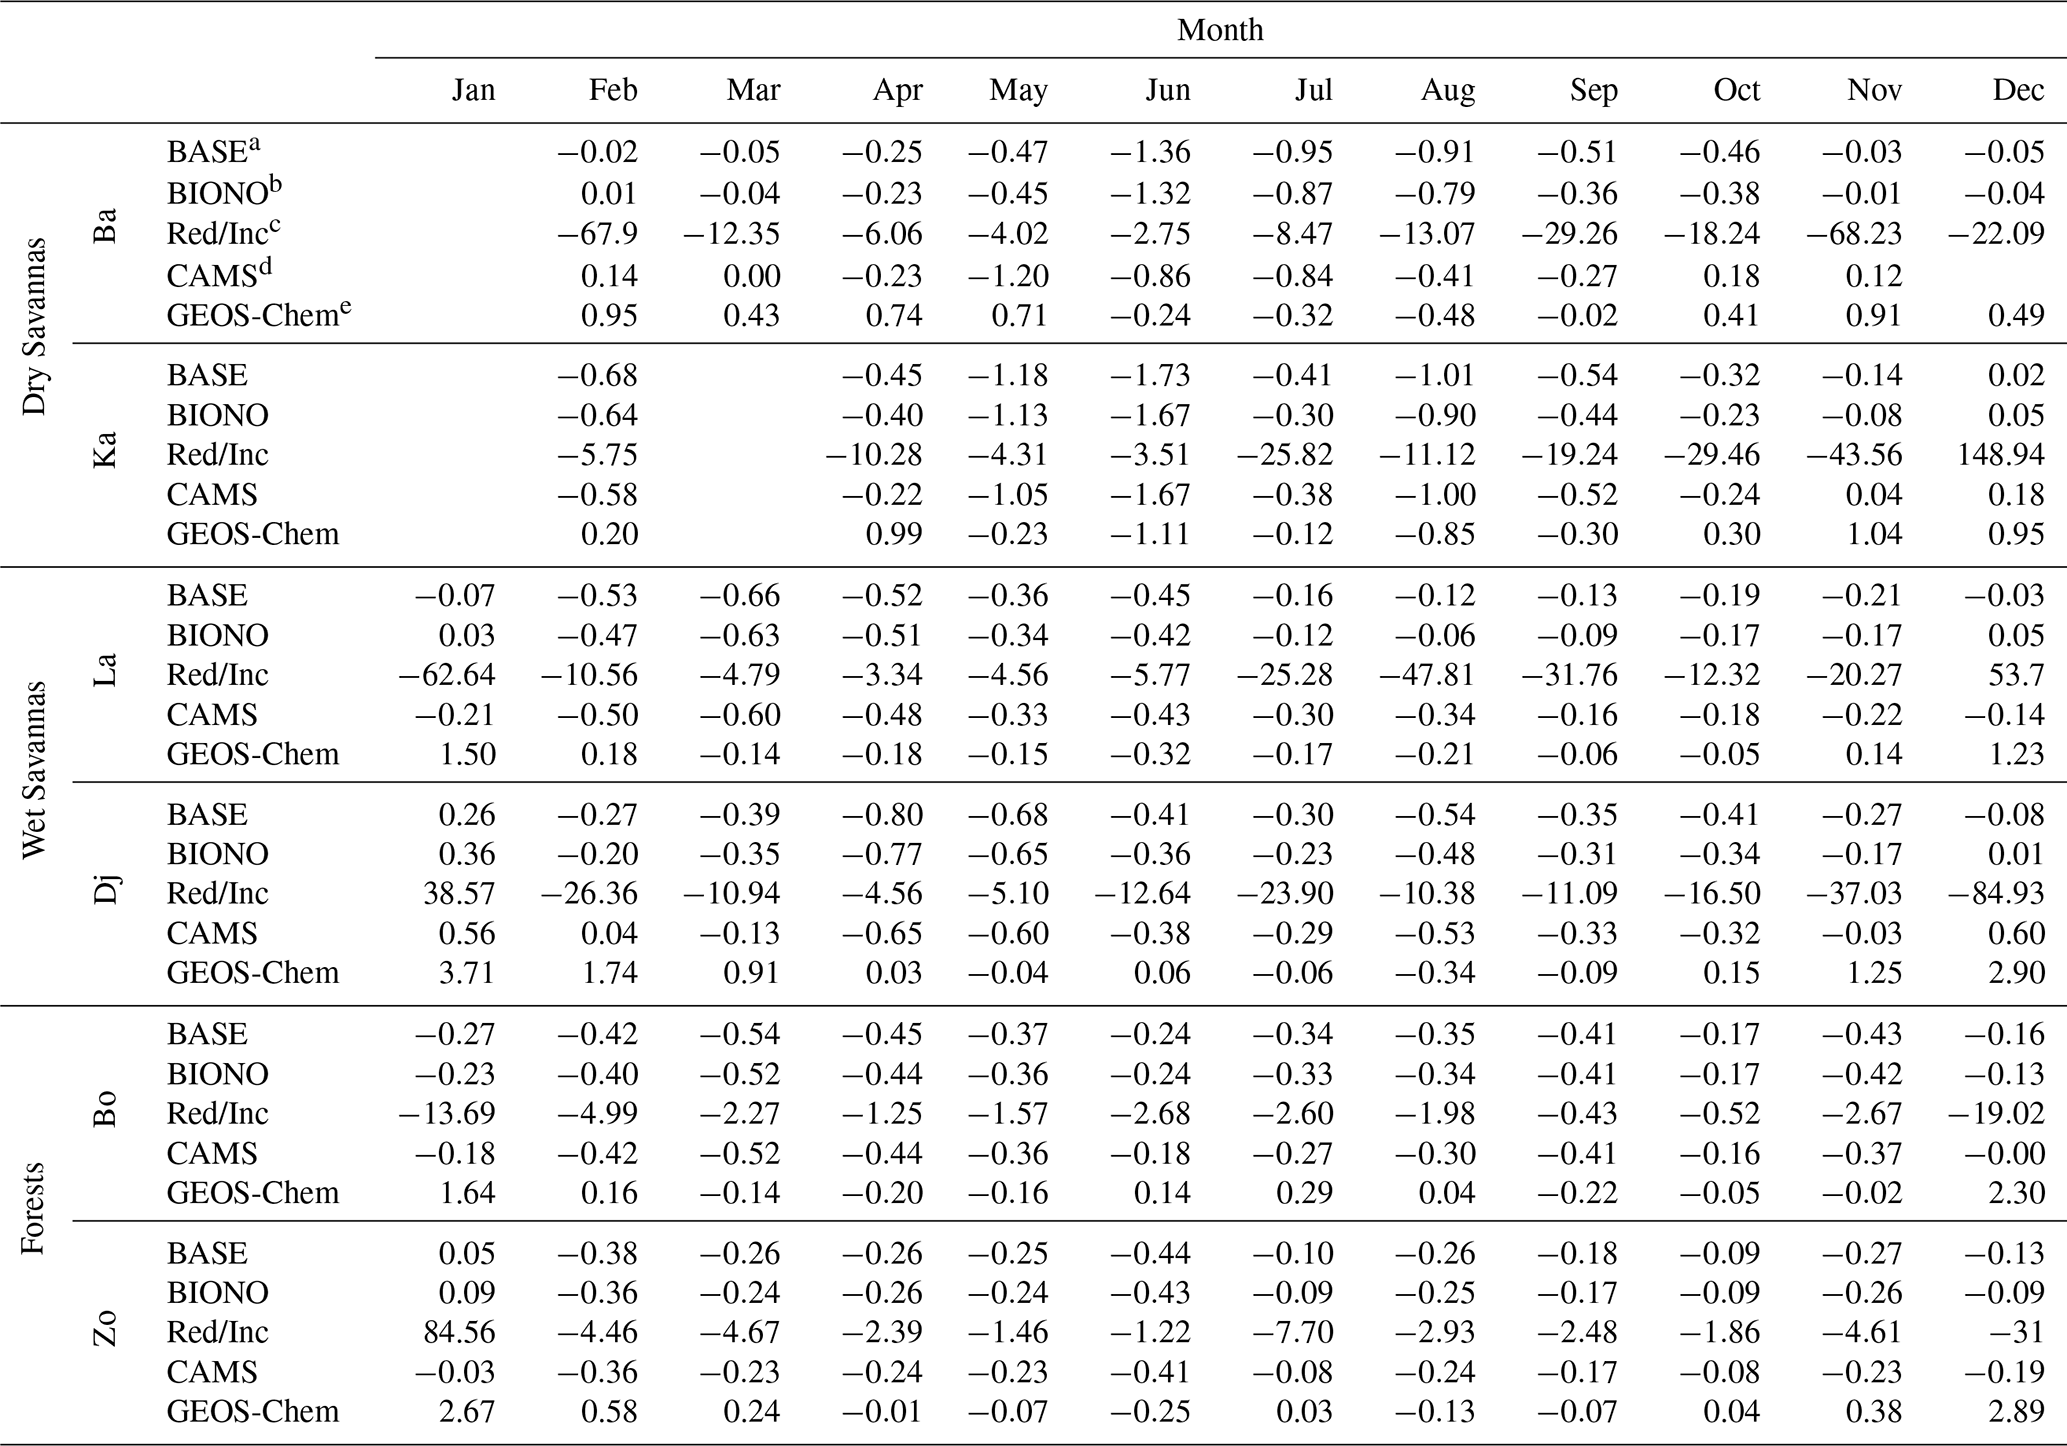
a Bias with BASE simulation. b Bias with BIONO simulation. c Reduction/Increase Bias by BioNO emissions. d Bias with CAMS reanalysis. e Bias with GEOS-Chem model.
In addition to improving the magnitude of surface concentrations at the six remote sites and across the region, the introduction of ANN on-line emissions also improves the spatial correlation between the simulated (RegCM5) and observed (INDAAF) concentrations. The BioNO induced enhancement is also associated with a more realistic seasonal evolution of NO2 and HNO3 surface levels when compared to INDAAF observations (Figs. 11 and 14).
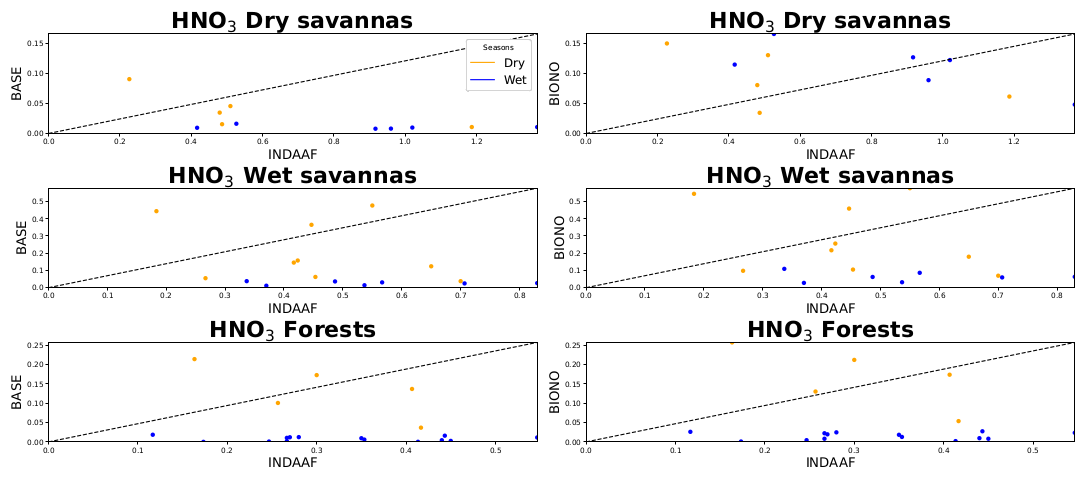
Figure 14Surface observed HNO3 concentrations (INDAAF) vs. simulated with RegCM5. BioNO emissions are considered in the right panel.
6.2 Regional and local ozone
Together with transport, emission and deposition processes, ozone photo-chemistry regulates the content of nitrogen compounds in the atmosphere. Tropospheric Ozone simulation is very challenging due to numerous sources of variability and uncertainty (Young et al., 2018). Such simulations involve complex and interrelated factors, including precursor emissions, meteorological variability, ozone photochemical production and loss, surface deposition, long-range transport influence and stratosphere-troposphere exchange (Lelieveld and Dentener, 2000). In this section we discuss the ability of the model to represent regional ozone and the subsequent impact of BioNO emissions on regional ozone production. Figure 15 displays the regional surface ozone simulated by RegCM5 for BASE and BioNO runs, compared to the CAMS chemical reanalysis and the GEOS-Chem model.
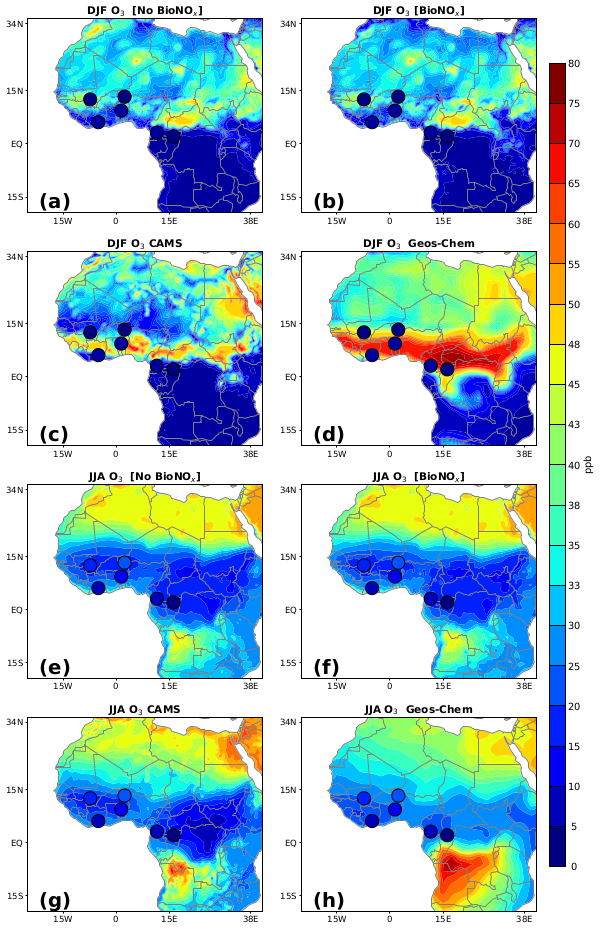
Figure 15Comparison of BASE and BioNO simulations of surface O3 concentrations (in ppb) against the CAMS reanalysis and the model GEOS-Chem for DJF and JJA season. The INDAAF measurement values are overplotted and represented by small circles on the map.
A strong seasonality of surface ozone concentrations (winter vs. summer) can be observed (Fig. 15). In the DJF season, strong ozone production occurs between 5 and 15° N as a result of biomass burning activities (Fig. 1). RegCM5 shows spatial patterns consistent with CAMS and GEOS-Chem in terms of simulated surface concentrations, but with lower values in the source zones (with GEOS-Chem showing the largest concentrations among them). In areas where local chemical production is low, such as over the Sahara, long range and vertical ozone transport primarily determines the background ozone level (e.g., Sauvage et al., 2005). We can outline here the added value of improved chemical boundary conditions, which set up more realistic and climatically relevant seasonal ozone background when benchmarked against the default approach, and also better account for long range transport events at shorter time scale.
During summer months (JJA), we also observe consistency between the continental-scale surface ozone gradients simulated by RegCM5 and those from CAMS and GEOS-Chem. In northern Africa, there is a slight overestimation of ozone, which can be attributed to greater vertical transport and mixing during the African monsoon. It can also be linked to the south-to-north transport being more effective during JJA (Sauvage et al., 2007), potentially combined with an overrepresentation of stratosphere-troposphere exchange and local photochemical production under strong solar radiation (Li et al., 2019). However, in the southern biomass burning regions, where ozone “hot-spots” are found (Sauvage et al., 2007), RegCM5 tends to simulate lower surface ozone concentrations compared to CAMS and more noticeably, to GEOS-Chem.
Focusing on surface concentration offers a limited view of actual model to model differences, and a deeper tropospheric ozone budget assessment would be required for a more systematic quantitative analysis, but this is beyond the scope of this paper. Studies have shown that discrepancies in model ozone simulations tend to be large in tropical regions. For example, a comprehensive comparison between GEOS-Chem and CAM-chem (Community Atmosphere Model-chemistry) (e.g., Lin et al., 2024) highlighted important differences in ozone budgets and vertical profiles due to variations in photolysis schemes, aerosol interactions, and convective transport processes. These differences can lead to variations in how ozone is transported vertically, impacting surface concentrations (e.g., Li et al., 2019). Recent comparative studies focusing on tropospheric ozone in various tropical regions, including Africa, confirm that such discrepancies are common and often linked to model-specific handling of emissions, injection heights and vertical dynamics (Huijnen et al., 2020; Lin et al., 2024). Tsivlidou et al. (2023) argue that it is essential to consider the combination of injection height of ozone precursors and the strong vertical mixing in the tropics which largely determine the surface ozone values. These factors, together with non-linear interactions between NOx and VOCs, including uncertain biogenic emissions, must be carefully analysed when assessing model outputs.
Figure 16c and f illustrates the influence of BioNO emissions on the RegCM5 simulated surface O3 field. The consecutive production or depletion of O3 is not solely dependent on NOx concentrations but also on the NOx VOCs ratio, which determines the ozone chemical regime in different subregions of the domain. At the regional to continental scale, and for both seasons, the introduction of BioNO leads to both an increase and a decrease in surface ozone production, with a predominantly increasing effect in the lower troposphere (Figs. 7c, f and 16c, f). In regions coinciding with large BioNO emissions, for both seasons there is, however, a notable negative impact on surface O3. This reduction in ozone levels, which can reach up to ∼2 ppb, is likely due to ozone titration processes, characteristic of VOC-limited conditions. In areas with large NOx emissions (here BioNO source areas), O3 formation can be VOC-limited or may shift between chemical regimes depending on, for example, the time of the day (Kleinman, 1994; Sillman and He, 2002).
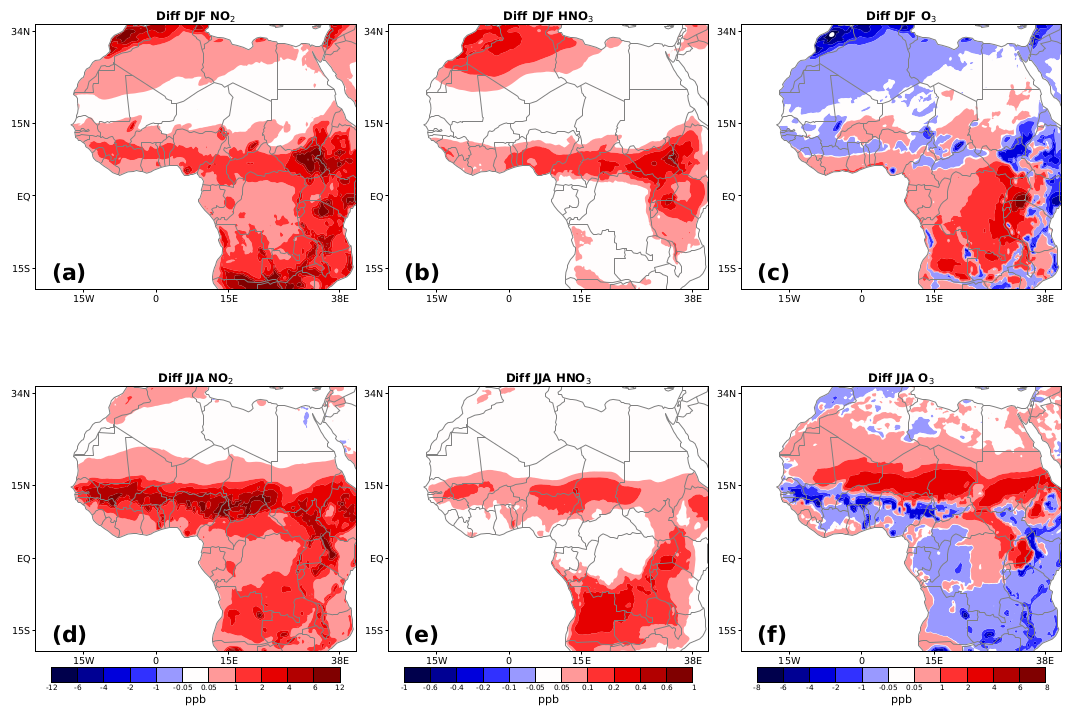
Figure 16DJA and JJA differences (BIONO – BASE) in surface NO2 (a, d), HNO3 (b, e) and O3 (c, f) concentrations. Units are in ppb.
As one moves away from these intense sources of NOx, the average ozone response shifts to being positive, reflecting the classical change in chemical regime downwind of the sources. An illustration of this process can be seen in JJA in the vertical wind (wa) monsoon region where intense Sahelian BioNO sources locally decrease surface ozone but contribute to an increase in downwind surface ozone in northern Sahel/southern Sahara (dipole pattern on Fig. 16f). For this situation, the NOx VOC ratio decreases and the chemical regime becomes more NOx-limited (Delon et al., 2008; Stewart et al., 2008). In DJF, the increase in surface ozone can reach up to 4 ppb in the southern part of the domain, while in JJA, we observe increases of up to 3 ppb over the Sahel region and in eastern Africa. Over West Africa, the effects of the NOx-limited extend to the lower troposphere, where an average increase in ozone concentration of up to 4 ppb is noted (Fig. 7c and f). This pattern agrees with findings by Delon et al. (2008), who observed that a moderate increase in NOx concentrations leads to a small increase in simulated ozone across all altitudes (0–15 km), characteristic of a NOx-limited regime. Several studies have shown that throughout much of the troposphere in a variety of tropical regions, including Africa, O3 formation is predominantly NOx-limited (e.g., Li et al., 2021; Tadic et al., 2021).
A comparison with INDAAF ground measurements shows that the inclusion of BioNO emissions results in very little improvement in simulated ozone concentrations at the local scale, in contrast to the better performance observed for other species (see Sect. 6.1) (Fig. 17). However, a general reduction in bias, leading to better alignment between simulated and observed values, is observed for nearly all of the sites during the period from June to August. For example, in dry savannas the maximum negative bias is reduced by 83.38 % in June in Banizoumbou (Table 7). Nevertheless, BioNO emissions in some cases lead to an increased positive bias, for example +2.4 % in March at Banizoumbou. For the JJA period, in wet savannas and equatorial forests we observe an overall slight decrease in O3 concentrations when BioNO is included, corresponding to a very slight improvement in the simulated results. Over tropical forests, surface ozone concentrations are influenced by regional transport from burning areas, as well as local vertical exchanges between the surface and the lower troposphere. A comparison with CAMS and GEOS-Chem shows that both models also struggle to accurately capture the observed ozone concentrations at INDAAF sites. For instance, in January over Zoétélé, CAMS and GEOS-Chem exhibit biases of 24.77 and 49.95 ppb, respectively, which are noticeably high despite the models' advanced chemistry and assimilation techniques. This suggests that the discrepancies could be the result of broader model limitations in representing regional ozone dynamics. Comparing model O3 results to on-site measurements is straight-forward due to the presence of an important tree canopy on measurement sites which can potentially affect both local dynamics and chemistry (e.g., Bryan and Steiner, 2013). Big leaf dry deposition schemes for ozone over tropical forests can only roughly represent deposition processes, and other chemical sinks within the canopy layer are not properly parametrized (Ganzeveld and Lelieveld, 2004; Sun et al., 2022). These deposition and chemical processes in the canopy should ideally be accounted for to better explain the discrepancy between the simulations and the in situ observations, in particular the fact that ozone observations are systematically much lower than model results (Figs. 17 and 18).
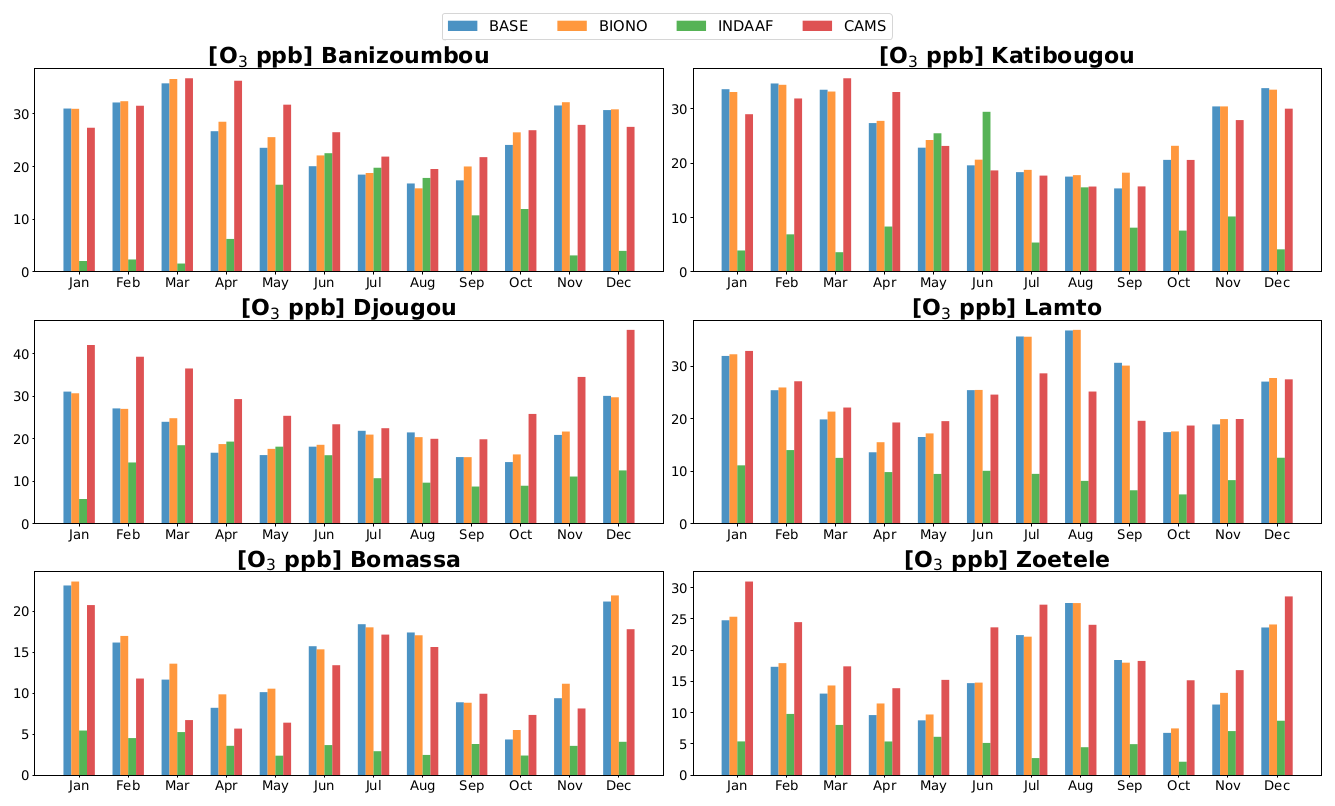
Figure 17Simulated monthly-averaged concentrations of O3 by BASE, BIONO runs and the CAMS reanalysis in comparison with INDAAF observation at its representative remote sites.
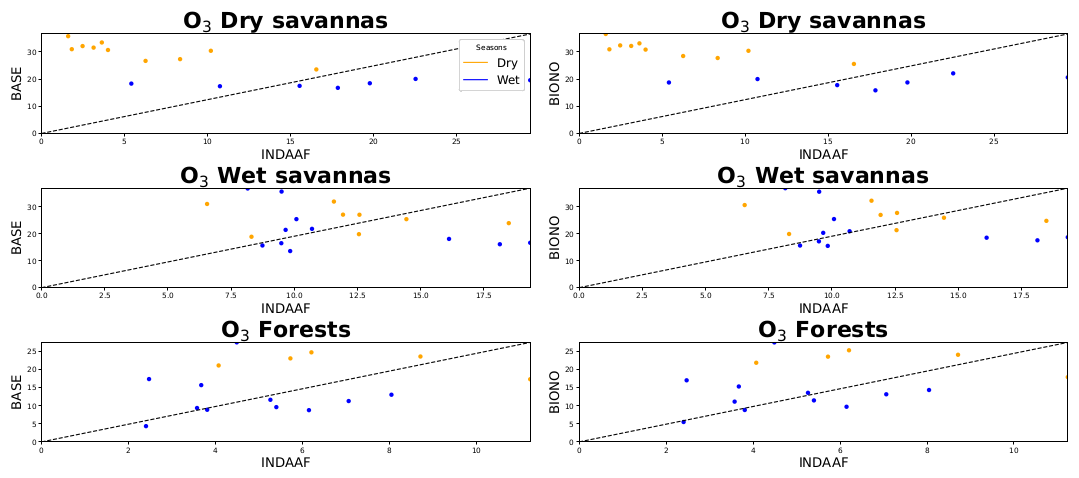
Figure 18Surface observed O3 concentrations (INDAAF) vs. simulated with RegCM5. BioNO emissions are considered in the right panel.
Table 7BASE, BIONO, CAMS and GEOS-Chem Biases (ppb) for O3. The Reduced/Increased (Red/Inc) biases given by BIONO run is in %. Ba: Banizoumbou, Ka: Katibougou, La: Lamto, Dj: Djougou, Bo: Bomassa, Zoétélé: Zo.
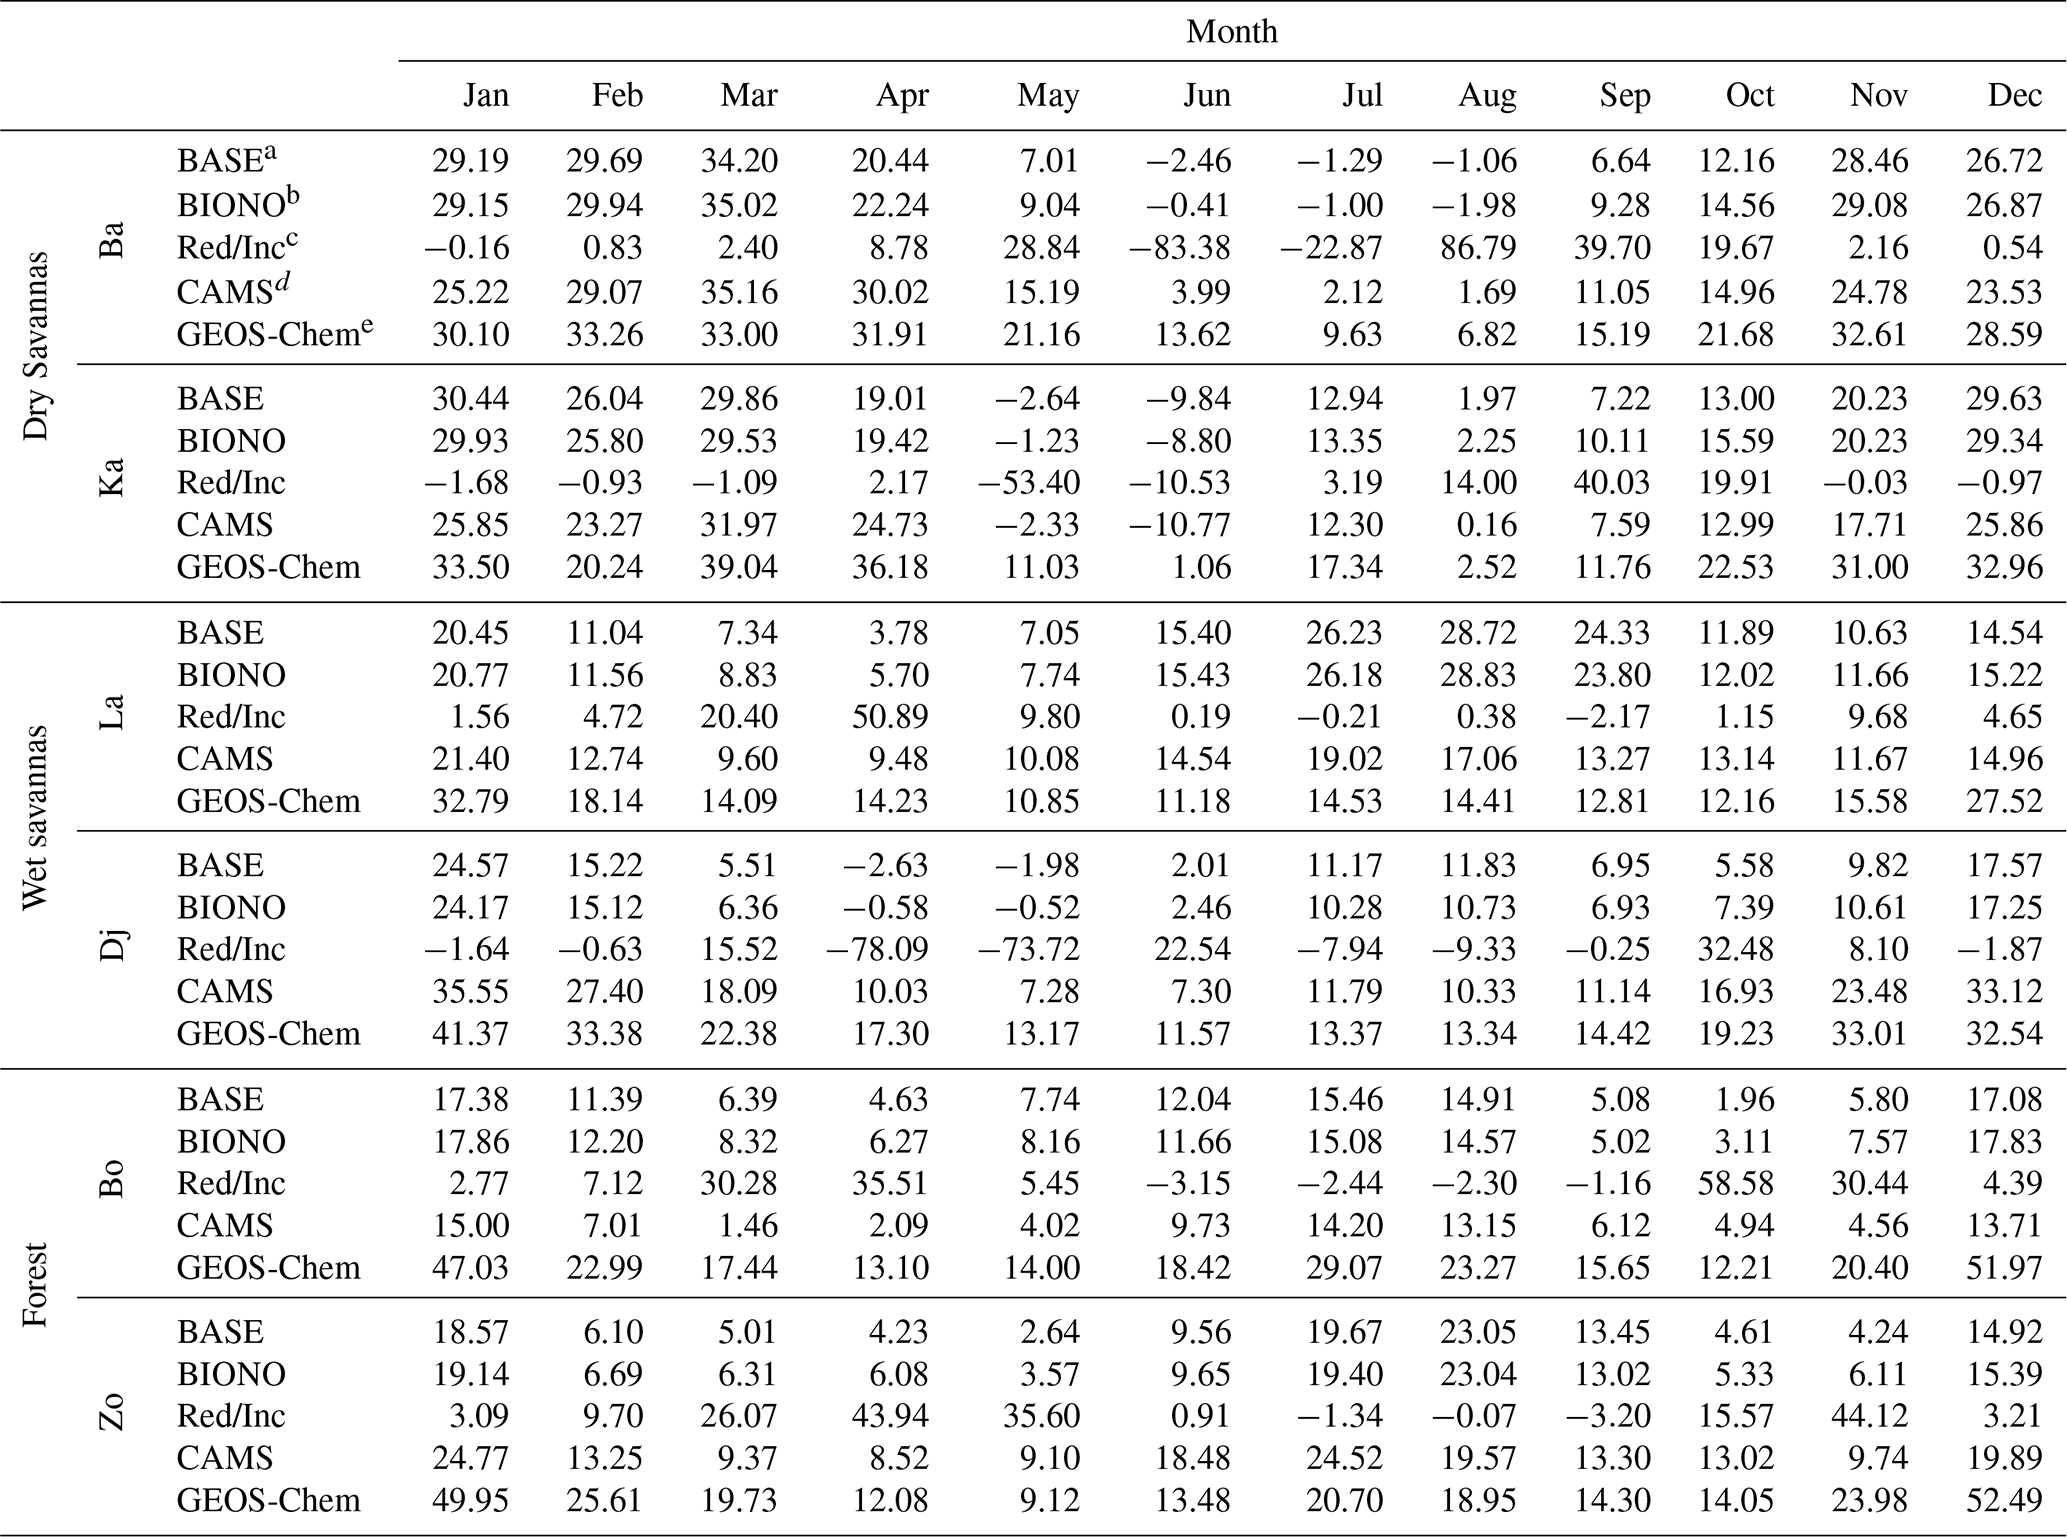
a Bias with BASE simulation. b Bias with BIONO simulation, c Reduction/Increase Bias by BioNO emissions. d Bias with CAMS reanalysis. e Bias with GEOS-Chem model.
RegCM5 is the latest released version of the ICTP regional climate model designed to conduct high-resolution regional climate simulations. In the broader context of on-going programs targeting the regional nitrogen cycle over Africa, we more specifically use and assess the related atmospheric chemistry module (RegCM5), which has been substantially updated relative to previous versions. We also conduct a specific study targeting the impact of BioNO emissions on regional chemistry over Africa. This comparative study consists of simulating a coupled climate-chemistry model, with and without BioNO emissions. The simulation model is parameterized using an original method based on ANN and is run over a three year period. The model performance is evaluated by comparing the simulation outputs to various data, including satellite observations for climate, ground-based observations, reanalysis and alternative state-of-the-art model outputs for key atmospheric compounds.
The results obtained show evidence that RegCM5 can capture the main features of the regional climate over the region considered, for example the seasonal and daily mean temperature, precipitation and wind circulation relevant for regional atmospheric chemistry and emission processes.
Simulated NO2, HNO3 and O3 values show consistency with CAMS reanalysis and GEOS-Chem simulations in terms of spatio-temporal distribution and gradients. Local comparison with surface concentrations measured over the six INDAAF sites indicates that the coupled chemistry-climate model can reproduce the seasonal cycle of all species over all sites. However, these comparisons strikingly show an systematic overestimation of simulated O3 and, to a lesser extent, an underestimation of NO2 and HNO3, especially in the wet season over dry savanna stations. These large biases are present not only in RegCM5 simulations but also in CAMS reanalysis, and GEOS-Chem outputs. In the BASE simulation, the O3 biases range from −2.64 to 34.2 ppb (dry savannas), −2.63 to 28.72 ppb (wet savannas) and 1.96 to 23.05 ppb (forests) while for NO2, we obtained biases from −4.97 to −0.41 ppb (dry savannas), −0.84 to 1.59 ppb (wet savannas), −1.64 to 1.14 ppb (forests), and −1.73 to 0.02 ppb (dry savannas), −0.8 to 0.26 ppb (wet savannas) and −0.54 to 0.05 ppb (forests) for HNO3. These differences are attributed to potential deficiencies in chemical emissions and mechanisms, deposition, boundary layer dynamics and transport from the upper layer, which are particularly challenging to reproduce for tropical regions. It is well known that regional models often struggle to accurately capture local-scale emissions and processes due to the coarse resolution (Valari and Menut, 2008; Wang et al., 2023) of their grids (in this case, 30 km × 30 km), which can lead to discrepancies when comparing with point measurements. Nevertheless, despite room for improvement, our conclusion is that in regards to regional photo-oxidant chemistry, RegCM5 performance is consistent with both state-of-the-art chemical reanalysis and chemistry transport model.
When integrating BioNO emissions, we estimate that seasonal averaged BioNO fluxes range from 0.02 to 7 mg m−2 y−1, and that the total amount of nitrogen emitted from BioNO ranges between 0.01 and 4.4 Tg N per month, over the domain. The regional distribution of BioNO emissions is determined primarily from the environmental predictors considered in the ANN based parameterization, with soil moisture variability playing a particulary important role. Incorporating BioNO emissions leads to increased concentration levels of surface NO2 (ranging from 0.05 to 4 ppb) and HNO3 (from 0.05 to 0.3). A surface ozone decrease of up to 2 ppb is also observed over the Sahel, likely due to NO-induced titration in the surface layer. Meanwhile, the O3 concentrations show a relative increase in altitude, downwind from BioNO sources, and towards the regional scale (up to 4 ppb).
When comparing model performance to observations from INDAAF sites, the inclusion of BioNO emissions improves the representation of O3, NO2, and HNO3 seasonal cycles and concentration values, and reduces biases in some cases. However, in certain conditions, it can also lead to an increase in biases, highlighting the complex interactions at play across different regions and ecosystems.
Overall, our study highlights an added value of including interactive BioNO emission representations, especially over the dry savannas of northern Sahel, since atmospheric nitrogen cycle and nitrogen deposition are particularly important for these ecosystems where N content is low and sentitive to small variations in deposition rates. These results also highlight the importance of accounting for surface processes such as biogenic soil NO emissions in coupled surface–atmosphere modeling frameworks. At the same time, they also emphasize the need to better constrain other natural sources, including biomass burning and lightning NOx, to avoid misattribution or compensating biases in model evaluation. One limitation of the ANN approach is that it does not account for limitations in the nitrogen pool ready to be emitted, which could be an important factor in dry and unfertilized ecosystems. A deeper look at such limitations is anticipated, for example by using constraints from explicit soil nitrogen modules.
Perspectives of this work also include improving the representation of atmospheric chemistry processes important for the regional nitrogen budgets, such as lightning NOx emissions and relevant heterogeneous chemistry processes (e.g. dust – HNO3). This is likely to have a notable impact on deposition processes, while maintaining the numerical efficiency required for a climate scale simulation. In addition, future work should assess the uncertainties and limitations in other natural source inventories, particularly biomass burning and lightning NOx emissions. Their seasonal co-variation with BioNO and known underrepresentation in current inventories may influence the interpretation of model-observation comparisons and should be better constrained in future studies. It is also anticipated to perform multi-decadal simulations in order to investigate the impacts of regional climate variability and direct anthropogenic perturbations on the regional nitrogen cycle over Africa, which may provide deeper insight into future trends of these processes in Africa.
The RegCM5 model code can be accessed at the web site: https://zenodo.org/record/7548172#.Y8gVV7TM-KUk. INDAAF measurement network data is available at https://indaaf.obs-mip.fr (last access: 13 June 2024). OMI TROPOMI-inferred ground-level NO2 concentrations from 2010 to 2013 used in this study are available at https://doi.org/10.5281/zenodo.5424752 (Cooper, 2022). The GEOS-Chem model version 12.9.3 used in this work is available at https://doi.org/10.5281/zenodo.3974569 (GEOS-Chem, 2020). The newly released V4.0 dataset of OMI/Aura-derived tropospheric NO2 columns and detailed explanatory documentation is publicly accessible through the NASA Goddard Earth Sciences Data and Information Services Center at https://disc.gsfc.nasa.gov/datasets/OMNO2_V003/summary/ (last access: 26 September 2024). Data from these simulations can be freely shared upon request via email to fabien.solmon@univ-tlse3.fr.
The supplement related to this article is available online at https://doi.org/10.5194/acp-25-12101-2025-supplement.
EMY designed and conducted the research under the supervision of FS and MA with CD, CGL, BS and GG acting as advisors. Methodology and original draft preparation were handled by EMY and FS. Writing, review, and editing were completed by MA, CD, CGL, BS and VY.
The contact author has declared that none of the authors has any competing interests.
Publisher's note: Copernicus Publications remains neutral with regard to jurisdictional claims made in the text, published maps, institutional affiliations, or any other geographical representation in this paper. While Copernicus Publications makes every effort to include appropriate place names, the final responsibility lies with the authors. Also, please note that this paper has not received English language copy-editing. Views expressed in the text are those of the authors and do not necessarily reflect the views of the publisher.
The authors would like to acknowledge the INDAAF project (International Network to study Deposition and Atmospheric chemistry in Africa) supported by the INSU (Institut National des Sciences de l'Univers) /CNRS (Centre National de la Recherche Scientifique), IRD (Institut de Recherche pour le Développement) and the research infrastructure ACTRIS-FR registered on the Roadmap of the French Ministry of Research. We also express our gratitude to all INDAAF local technicians for their maintenance and sampling work. We also acknowledge the use of the CALMIP (CALcul du Midi-Pyrénées) computing resources, supported by CNRS, Toulouse INP, INSA Toulouse, ISAE Supaero, and UT3 Paul Sabatier (UAR 3667; https://www.calmip.univ-toulouse.fr/node/1. last access: 4 February 2024) for performing the numerical calculations presented in this paper.
This research has been supported by the European Horizon 2020 poject “Marie Sklodowska-Curie Actions Research and Innovation Staff Exchange Integrated Nitrogen Studies in Africa” (H2020 MSCA-RISE INSA, grant no. 871944).
This paper was edited by Maria Kanakidou and reviewed by three anonymous referees.
Adon, M., Galy-Lacaux, C., Yoboué, V., Delon, C., Lacaux, J. P., Castera, P., Gardrat, E., Pienaar, J., Al Ourabi, H., Laouali, D., Diop, B., Sigha-Nkamdjou, L., Akpo, A., Tathy, J. P., Lavenu, F., and Mougin, E.: Long term measurements of sulfur dioxide, nitrogen dioxide, ammonia, nitric acid and ozone in Africa using passive samplers, Atmos. Chem. Phys., 10, 7467–7487, https://doi.org/10.5194/acp-10-7467-2010, 2010. a, b, c, d
Adon, M., Galy-Lacaux, C., Delon, C., Yoboue, V., Solmon, F., and Kaptue Tchuente, A.: Dry deposition of nitrogen compounds (NO2, HNO3, NH3), sulfur dioxide and ozone in west and central African ecosystems using the inferential method, Atmos. Chem. Phys., 13, 11351–11374, https://doi.org/10.5194/acp-13-11351-2013, 2013. a, b
Aghedo, A. M., Schultz, M. G., and Rast, S.: The influence of African air pollution on regional and global tropospheric ozone, Atmos. Chem. Phys., 7, 1193–1212, https://doi.org/10.5194/acp-7-1193-2007, 2007. a
Ainsworth, E. A., Yendrek, C. R., Sitch, S., Collins, W. J., and Emberson, L. D.: The Effects of Tropospheric Ozone on Net Primary Productivity and Implications for Climate Change, Annu. Rev. Plant Biol., 63, 637–661, https://doi.org/10.1146/annurev-arplant-042110-103829, 2012. a
Akpo, A., Galy-Lacaux, C., Delon, C., Gardrat, E., Dias Alves, M., Lenoir, O., Halisson, J., Darakpa, C., and Darakpa, D.: Trace gases, Djougou, Benin, Aeris [data set], https://doi.org/10.25326/605, 2023. a
Austin, A. T., Yahdjian, L., Stark, J. M., Belnap, J., Porporato, A., Norton, U., Ravetta, D. A., and Schaeffer, S. M.: Water pulses and biogeochemical cycles in arid and semiarid ecosystems, Oecologia, 141, 221–235, https://doi.org/10.1007/s00442-004-1519-1, 2004. a
Bahino, J., Yoboué, V., Galy-Lacaux, C., Adon, M., Akpo, A., Keita, S., Liousse, C., Gardrat, E., Chiron, C., Ossohou, M., Gnamien, S., and Djossou, J.: A pilot study of gaseous pollutants' measurement (NO2, SO2, NH3, HNO3 and O3) in Abidjan, Côte d'Ivoire: contribution to an overview of gaseous pollution in African cities, Atmos. Chem. Phys., 18, 5173–5198, https://doi.org/10.5194/acp-18-5173-2018, 2018. a
Ban, N., Caillaud, C., Coppola, E., Pichelli, E., Sobolowski, S., Adinolfi, M., Ahrens, B., Alias, A., Anders, I., Bastin, S., Belušić, D., Berthou, S., Brisson, E., Cardoso, R. M., Chan, S. C., Christensen, O. B., Fernández, J., Fita, L., Frisius, T., Gašparac, G., Giorgi, F., Goergen, K., Haugen, J. E., Hodnebrog, Ø., Kartsios, S., Katragkou, E., Kendon, E. J., Keuler, K., Lavin-Gullon, A., Lenderink, G., Leutwyler, D., Lorenz, T., Maraun, D., Mercogliano, P., Milovac, J., Panitz, H.-J., Raffa, M., Reca Remedio, A., Schär, C., Soares, P. M. M., Srnec, L., Steensen, B. M., Stocchi, P., Tölle, M. H., Truhetz, H., Vergara-Temprado, J., de Vries, H., Warrach-Sagi, K., Wulfmeyer, V., and Zander, M. J.: The first multi-model ensemble of regional climate simulations at kilometer-scale resolution, part I: evaluation of precipitation, Clim. Dynam., 57, 275–302, https://doi.org/10.1007/s00382-021-05708-w, 2021. a
Bretherton, C. S., McCaa, J. R., and Grenier, H.: A new parameterization for shallow cumulus convection and its application to marine subtropical cloud-topped boundary layers. Part I: Description and 1D results, Mon. Weather Rev., 132, 864–882, https://doi.org/10.1175/1520-0493(2004)132<0864:ANPFSC>2.0.CO;2, 2004. a
Bryan, A. M. and Steiner, A. L.: Canopy controls on the forest-atmosphere exchange of biogenic ozone and aerosol precursors, Michigan J. Sustainabil., 1, https://doi.org/10.3998/mjs.12333712.0001.005, 2013. a
Bucchignani, E., Mercogliano, P., Panitz, H.-J., and Montesarchio, M.: Climate change projections for the Middle East–North Africa domain with COSMO-CLM at different spatial resolutions, Adv. Climate Change Res., 9, 66–80, https://doi.org/10.1016/j.accre.2018.01.004, 2018. a
Butterbach-Bahl, K., Kock, M., Willibald, G., Hewett, B., Buhagiar, S., Papen, H., and Kiese, R.: Temporal variations of fluxes of NO, NO2, N2O, CO2, and CH4 in a tropical rain forest ecosystem, Global Biogeochem. Cy., 18, https://doi.org/10.1029/2004GB002243, 2004. a
Cao, L., Li, S., and Sun, L.: Study of different Carbon Bond 6 (CB6) mechanisms by using a concentration sensitivity analysis, Atmos. Chem. Phys., 21, 12687–12701, https://doi.org/10.5194/acp-21-12687-2021, 2021. a, b
Carmichael, G. R., Ferm, M., Thongboonchoo, N., Woo, J.-H., Chan, L., Murano, K., Viet, P. H., Mossberg, C., Bala, R., Boonjawat, J., Upatum, P., Mohan, M., Adhikary, S. P., Shrestha, A. B., Pienaar, J. J., Brunke, E. B., Chen, T., Jie, T., Guoan, D., Peng, L. C., Dhiharto, S., Harjanto, H., Jose, A. M., Kimani, W., Kirouane, A., Lacaux, J.-P., Richard, S., Barturen, O., Cerda, J. C., Athayde, A., Tavares, T., Cotrina, J. S., and Bilici, E.: Measurements of sulfur dioxide, ozone and ammonia concentrations in Asia, Africa, and South America using passive samplers, Atmos. Environ., 37, 1293–1308, https://doi.org/10.1016/S1352-2310(02)01009-9, 2003. a, b
Carter, W. P. L.: Development of the SAPRC-07 chemical mechanism, Atmos. Environ., 44, 5324–5335, https://doi.org/10.1016/j.atmosenv.2010.01.026, 2010. a
Charusombat, U., Niyogi, D., Kumar, A., Wang, X., Chen, F., Guenther, A., Turnipseed, A., and Alapaty, K.: Evaluating a new deposition velocity module in the Noah land-surface model, Bound.-Lay. Meteorol., 137, 271–290, https://doi.org/10.1007/s10546-010-9531-y, 2010. a
Chauvin, F., Roehrig, R., and Lafore, J.-P.: Intraseasonal variability of the Saharan heat low and its link with midlatitudes, J. Climate, 23, 2544–2561, https://doi.org/10.1175/2010JCLI3093.1, 2010. a
Ciarlo, J., Aquilina, N., Strada, S., Shalaby, A., and Solmon, F.: A modified gas-phase scheme for advanced regional climate modelling with RegCM4, Clim. Dynam., 57, 489–502, https://doi.org/10.1007/s00382-021-05722-y, 2021. a, b, c
Cooper, M.: Satellite-derived ground level NO2 concentrations, 2005-2019, Zenodo [code], https://doi.org/10.5281/zenodo.5424752 (last access: 24 September 2024), 2022. a
Cooper, M. J., Martin, R. V., McLinden, C. A., and Brook, J. R.: Inferring ground-level nitrogen dioxide concentrations at fine spatial resolution applied to the TROPOMI satellite instrument, Environ. Res. Lett., 15, 104013, https://doi.org/10.1088/1748-9326/aba3a5, 2020a. a
Cooper, M. J., Martin, R. V., McLinden, C. A., and Brook, J. R.: Inferring ground-level nitrogen dioxide concentrations at fine spatial resolution applied to the TROPOMI satellite instrument, Environ. Res. Lett., 15, 104013, https://doi.org/10.1088/1748-9326/aba3a5, 2020b. a
Cooper, M. J., Martin, R. V., Hammer, M. S., Levelt, P. F., Veefkind, P., Lamsal, L. N., Krotkov, N. A., Brook, J. R., and McLinden, C. A.: Global fine-scale changes in ambient NO2 during COVID-19 lockdowns, Nature, 601, 380–387, https://doi.org/10.1038/s41586-021-04229-0, 2022. a, b, c
Coppola, E., Sobolowski, S., Pichelli, E., Raffaele, F., Ahrens, B., Anders, I., Ban, N., Bastin, S., Belda, M., Belusic, D., Caldas-Alvarez, A., Cardoso, R. M., Davolio, S., Dobler, A., Fernández, J., Fita, L., Fumière, Q., Giorgi, F., Goergen, K., Güttler, I., Halenka, T., Heinzeller, D., Hodnebrog, Ø., Jacob, D., Kartsios, S., Katragkou, E., Kendon, E., Khodayar, S., Kunstmann, H., Knist, S., Lavín-Gullón, A., Lind, P., Lorenz, T., Maraun, D., Marelle, L., Van Meijgaard, E., Milovac, J., Myhre, G., Panitz, H.-J., Piazza, M., Raffa, M., Raub, T., Rockel, B., Schär, C., Sieck, K., Soares, P. M. M., Somot, S., Srnec, L., Stocchi, P., Tölle, M. H., Truhetz, H., Vautard, R., De Vries, H., and Warrach-Sagi, K.: A first-of-its-kind multi-model convection permitting ensemble for investigating convective phenomena over Europe and the Mediterranean, Clim. Dynam., 55, 3–34, https://doi.org/10.1007/s00382-018-4521-8, 2020. a
Davidson, E. A. and Kingerlee, W.: A global inventory of nitric oxide emissions from soils, Nutr. Cycl. Agroecosyst., 48, 37–50, https://doi.org/10.1023/A:1009738715891, 1997. a, b
Davidson, E. A., Keller, M., Erickson, H. E., Verchot, L. V., and Veldkamp, E.: Testing a conceptual model of soil emissions of nitrous and nitric oxides: using two functions based on soil nitrogen availability and soil water content, the hole-in-the-pipe model characterizes a large fraction of the observed variation of nitric oxide and nitrous oxide emissions from soils, Bioscience, 50, 667–680, https://doi.org/10.1641/0006-3568(2000)050[0667:TACMOS]2.0.CO;2, 2000. a
Davolio, S., Malguzzi, P., Drofa, O., Mastrangelo, D., and Buzzi, A.: The Piedmont flood of November 1994: A testbed of forecasting capabilities of the CNR-ISAC meteorological model suite, Bull. Atmos. Sci. Technol., 1, 263–282, 2020. a
Delmas, R., Peuch, V.-H., Mégie, G., and Brasseur, G. P.: Emissions anthropiques et naturelles et dépôts, in: Physique et chimie de l'atmosphère, chap. 5, Belin, ISBN 2-7011-3700-4, 1995. a
Delon, C., Serca, D., Boissard, C., Dupont, R., Dutot, A., Laville, P., De Rosnay, P., and Delmas, R.: Soil NO emissions modelling using artificial neural network, Tellus B 59, 502–513, https://doi.org/10.1111/j.1600-0889.2007.00254.x, 2007. a, b, c, d, e
Delon, C., Reeves, C., Stewart, D., Serça, D., Dupont, R., Mari, C., Chaboureau, J.-P., and Tulet, P.: Biogenic nitrogen oxide emissions from soils–impact on NOx and ozone over West Africa during AMMA (African Monsoon Multidisciplinary Experiment): modelling study, Atmos. Chem. Phys., 8, 2351–2363, https://doi.org/10.5194/acp-8-2351-2008, 2008. a, b, c, d, e, f, g, h, i, j
Delon, C., Galy-Lacaux, C., Boone, A., Liousse, C., Serça, D., Adon, M., Diop, B., Akpo, A., Lavenu, F., Mougin, E., and Timouk, F.: Atmospheric nitrogen budget in Sahelian dry savannas, Atmos. Chem. Phys., 10, 2691–2708, https://doi.org/10.5194/acp-10-2691-2010, 2010. a, b, c
Delon, C., Galy-Lacaux, C., Adon, M., Liousse, C., Serça, D., Diop, B., and Akpo, A.: Nitrogen compounds emission and deposition in West African ecosystems: comparison between wet and dry savanna, Biogeosciences, 9, 385–402, https://doi.org/10.5194/bg-9-385-2012, 2012. a, b, c
Delon, C., Mougin, E., Serça, D., Grippa, M., Hiernaux, P., Diawara, M., Galy-Lacaux, C., and Kergoat, L.: Modelling the effect of soil moisture and organic matter degradation on biogenic NO emissions from soils in Sahel rangeland (Mali), Biogeosciences, 12, 3253–3272, https://doi.org/10.5194/bg-12-3253-2015, 2015. a, b
Delon, C., Galy-Lacaux, C., Serça, D., Loubet, B., Camara, N., Gardrat, E., Saneh, I., Fensholt, R., Tagesson, T., Le Dantec, V., Sambou, B., Diop, C., and Mougin, E.: Soil and vegetation-atmosphere exchange of NO, NH3, and N2O from field measurements in a semi arid grazed ecosystem in Senegal, Atmos. Environ., 156, 36–51, https://doi.org/10.1016/j.atmosenv.2017.02.024, 2017. a
Dickinson, R. E.: Biosphere/atmosphere transfer scheme (BATS) for the NCAR community climate model, Technical report, National Center for Research, https://cir.nii.ac.jp/crid/1574231873842566272 (last access: 23 November 2023), 1986. a
Dickinson, R. E., Errico, R. M., Giorgi, F., and Bates, G. T.: A regional climate model for the Western United States, Climate Change, 15, 383–422, https://doi.org/10.1007/bf00240465, 1989. a
Emmons, L. K., Walters, S., Hess, P. G., Lamarque, J.-F., Pfister, G. G., Fillmore, D., Granier, C., Guenther, A., Kinnison, D., Laepple, T., Orlando, J., Tie, X., Tyndall, G., Wiedinmyer, C., Baughcum, S. L., and Kloster, S.: Description and evaluation of the Model for Ozone and Related chemical Tracers, version 4 (MOZART-4), Geosci. Model Dev., 3, 43–67, https://doi.org/10.5194/gmd-3-43-2010, 2010. a
Evan, A. T., Flamant, C., Lavaysse, C., Kocha, C., and Saci, A.: Water vapor–forced greenhouse warming over the Sahara Desert and the recent recovery from the Sahelian drought, J. Climate, 28, 108–123, https://doi.org/10.1175/JCLI-D-14-00039.1, 2015. a
*FAAM: FAAM Airborne Laboratory, https://www.faam.ac.uk (last access: 26 February 2025), 2018. a
Feig, G., Mamtimin, B., and Meixner, F.: Soil biogenic emissions of nitric oxide from a semi-arid savanna in South Africa, Biogeosciences, 5, 1723–1738, https://doi.org/10.5194/bg-5-1723-2008, 2008. a, b
Ferm, M. and Rodhe, H.: Measurements of air concentrations of SO2, NO2 and NH3 at rural and remote sites in Asia, J. Atmos. Chem., 27, 17–29, https://doi.org/10.1023/A:1005816621522, 1997. a, b
Ferm, M., Lindskog, A., Svanberg, P., and Boström, C.: New measurement technique for air pollutants, Kemisk Tidskrift, 1, 30–32, 1994. a
Flechard, C. R., Simpson, D., Skjøth, C. A., Rees, R. M., Erisman, J. W., Nemitz, E., Milford, C., Sutton, M. A., Hertel, O., Hensen, A., Fowler, D., Fagerli, H., Dore, A. J., Davidson, E. A., Butterbach-Bahl, K., Amman, C., and Agrawal, M.: Dry deposition of reactive nitrogen to European ecosystems: a comparison of inferential models across the NitroEurope network, Atmos. Chem. Phys., 11, 2703–2728, https://doi.org/10.5194/acp-11-2703-2011, 2011. a
Fountoukis, C. and Nenes, A.: ISORROPIA II: a computationally efficient thermodynamic equilibrium model for K+–Ca2+–Mg2+–NH4+–Na+–SO–NO–Cl−–H2O aerosols, Atmos. Chem. Phys., 7, 4639–4659, https://doi.org/10.5194/acp-7-4639-2007, 2007. a
Fudjoe, S. K., Li, L., Anwar, S., Shi, S., Xie, J., Wang, L., Xie, L., and Yongjie, Z.: Nitrogen fertilization promoted microbial growth and N2O emissions by increasing the abundance of nirS and nosZ denitrifiers in semiarid maize field, Front. Microbiol., 14, 1265562, https://doi.org/10.3389/fmicb.2023.1265562, 2023. a
Galloway, J. N., Townsend, A. R., Erisman, J. W., Bekunda, M., Cai, Z., Freney, J. R., Martinelli, L. A., Seitzinger, S. P., and Sutton, M. A.: Transformation of the nitrogen cycle: recent trends, questions, and potential solutions, Science, 320, 889–892, https://doi.org/10.1126/science.113667, 2008. a
Galy-Lacaux, C. and Modi, A.: Precipitation chemistry in the Sahelian savanna of Niger, Africa, J. Atmos. Chem., 30, 319–343, https://doi.org/10.1023/A:1006027730377, 1998. a
Galy-Lacaux, C., Laouali, D., Descroix, L., Gobron, N., and Liousse, C.: Long term precipitation chemistry and wet deposition in a remote dry savanna site in Africa (Niger), Atmos. Chem. Phys., 9, 1579–1595, https://doi.org/10.5194/acp-9-1579-2009, 2009. a
Galy-Lacaux, C., Diop, B., Orange, D., Sanogo, S., Soumaguel, N., Kanouté, C., Gardrat, E., Dias Alves, M., Lenoir, O., Ossohou, M., Adon, M., and Al-Ourabi, H.: Trace gases, Katibougou, Mali, Aeris [data set], https://doi.org/10.25326/604, 2023a. a
Galy-Lacaux, C., Yoboué, V., Ossohou, M., Gardrat, E., Dias Alves, M., Lenoir, O., Konaté, I., Ki, A., Ouattara, A., Adon, M., Al-Ourabi, H., and Zouzou, R.: Trace gases, Lamto, Côte d'Ivoire, Aeris [data set], https://doi.org/10.25326/275, 2023e. a
Galy-Lacaux, C., Tathy, J.-P., Opepa, C., Brncic, T., Gardrat, E., Dias Alves, M., and Lenoir, O.: Trace gases, Bomassa, Congo, Aeris [data set], https://doi.org/10.25326/607, 2023f. a
Ganzeveld, L. and Lelieveld, J.: Impact of Amazonian deforestation on atmospheric chemistry, Geophys. Res. Lett., 31, https://doi.org/10.1029/2003GL019205, 2004. a
Ganzeveld, L., Lelieveld, J., Dentener, F., Krol, M., Bouwman, A., and Roelofs, G.-J.: Global soil-biogenic NOx emissions and the role of canopy processes, J. Geophys. Res.-Atmos., 107, ACH-9, https://doi.org/10.1029/2001JD000684, 2002. a, b, c
Gasche, R. and Papen, H.: A 3-year continuous record of nitrogen trace gas fluxes from untreated and limed soil of a N-saturated spruce and beech forest ecosystem in Germany: 2. NO and NO2 fluxes, J. Geophys. Res.-Atmos., 104, 18505–18520, https://doi.org/10.1029/1999JD900294, 1999. a
GEOS-Chem: GEOS-Chem 12.9.3, Zenodo [code], https://doi.org/10.5281/zenodo.3974569, 2020. a, b
Gery, M. W., Whitten, G. Z., Killus, J. P., and Dodge, M. C.: A photochemical kinetics mechanism for urban and regional scale computer modeling, J. Geophys. Res.-Atmos., 94, 12925–12956, https://doi.org/10.1029/JD094iD10p12925, 1989. a, b
Giglio, L., Randerson, J. T., and van der Werf, G. R.: Analysis of daily, monthly, and annual burned area using the fourth-generation global fire emissions database (GFED4), J. Geophys. Res.-Biogeo., 118, 317–328, https://doi.org/10.1002/jgrg.20042, 2013. a
Giorgi, F. and Bates, G. T.: The climatological skill of a regional model over complex terrain, Mon. Weather Rev., 117, 2325–2347, https://doi.org/10.1175/1520-0493(1989)117<2325:tcsoar>2.0.co;2, 1989. a
Giorgi, F. and Mearns, L. O.: Introduction to special section: Regional climate modeling revisited, J. Geophys. Res., 104, 6335–6352, https://doi.org/10.1029/98jd02072, 1999. a
Giorgi, F., Coppola, E., Solmon, F., Mariotti, L., Sylla, M., Bi, X., Elguindi, N., Diro, G. T., Nair, V., Giuliani, G., Turuncoglu, U. U., Cozzini, S., Güttler, I., O'Brien, T. A., Tawfik, A. B., Shalaby, A., Zakey, A. S., Steiner, A. L., Stordal, F., Sloan, L. C., and Brankovic, C.: RegCM4: Model description and preliminary tests over multiple CORDEX domains, Clim. Res., 52, 31–48, https://doi.org/10.3354/cr01018, 2012. a
Giorgi, F., Coppola, E., Giuliani, G., Ciarlo, J. M., Pichelli, E., Nogherotto, R., Raffaele, F., Malguzzi, P., Davolio, S., Stocchi, P., and Drofa, O.: The fifth generation regional climate modeling system, RegCM5: Description and illustrative examples at parameterized convection and convection-permitting resolutions, J. Geophys. Res.-Atmos., 128, e2022JD038199, https://doi.org/10.1029/2022JD038199, 2023. a, b
Granier, C., Pétron, G., Müller, J.-F., and Brasseur, G.: The impact of natural and anthropogenic hydrocarbons on the tropospheric budget of carbon monoxide, Atmos. Environ., 34, 5255–5270, https://doi.org/10.1016/S1352-2310(00)00299-5, 2000. a
Granier, C., Guenther, A., Lamarque, J. F., Mieville, A., Muller, J. F., Olivier, J., Orlando, J., Peters, J., Petron, G., Tyndall, G., and Wallens, S.: POET, a database of surface emissions of ozone precursors, http://www.aero.jussieu.fr/projet/ACCENT/POET.php (last access: 25 March 2025), 2005. a
Guenther, A., Karl, T., Harley, P., Wiedinmyer, C., Palmer, P. I., and Geron, C.: Estimates of global terrestrial isoprene emissions using MEGAN (Model of Emissions of Gases and Aerosols from Nature), Atmos. Chem. Phys., 6, 3181–3210, https://doi.org/10.5194/acp-6-3181-2006, 2006. a
Harris, I., Osborn, T. J., Jones, P., and Lister, D.: Version 4 of the CRU TS monthly high-resolution gridded multivariate climate dataset, Sci. Data, 7, 109, https://doi.org/10.1038/s41597-020-0453-3, 2020. a
Hersbach, H., Bell, B., Berrisford, P., Hirahara, S., Horányi, A., Muñoz-Sabater, J., Nicolas, J., Peubey, C., Radu, R., Schepers, D., Simmons, A., Soci, C., Abdalla, S., Abellan, X., Balsamo, G., Bechtold, P., Biavati, G., Bidlot, J., Bonavita, M., De Chiara, G., Dahlgren, P., Dee, D., Diamantakis, M., Dragani, R., Flemming, J., Forbes, R., Fuentes, M., Geer, A., Haimberger, L., Healy, S., Hogan, R. J., Hólm, E., Janisková, M., Keeley, S., Laloyaux, P., Lopez, P., Lupu, C., Radnoti, G., De Rosnay, P., Rozum, I., Vamborg, F., Villaume, S., and Thépaut, J.-N.: The ERA5 global reanalysis, Q. J. Roy. Meteorol. Soc., 146, 1999–2049, https://doi.org/10.1002/qj.3803, 2020. a, b
Hickman, J. E., Dammers, E., Galy-Lacaux, C., and Van der Werf, G. R.: Satellite evidence of substantial rain-induced soil emissions of ammonia across the Sahel, Atmos. Chem. Phys., 18, 16713–16727, https://doi.org/10.5194/acp-18-16713-2018, 2018. a
Horowitz, L. W., Walters, S., Mauzerall, D. L., Emmons, L. K., Rasch, P. J., Granier, C., Tie, X., Lamarque, J.-F., Schultz, M. G., Tyndall, G. S., Orlando, J. J., and Brasseur, G. P.: A global simulation of tropospheric ozone and related tracers: Description and evaluation of MOZART, version 2, J. Geophys. Res.-Atmos., 108, https://doi.org/10.1029/2002JD002853, 2003. a
Hourdin, F., Musat, I., Guichard, F. S., Ruti, P. M., Favot, F., Filiberti, M.-A., Pham, M., Grandpeix, J.-Y., Polcher, J., Marquet, P., Boone, A., Lafore, J.-P., Redelsperger, J.-L., Dell'Aquila, A., Doval, T. L., Traore, A. K., and Gallée, H.: AMMA-model intercomparison project, B. Am. Meteorol. Soc., 91, 95–104, https://doi.org/10.1175/2009BAMS2791.1, 2010. a
Hudman, R., Moore, N., Mebust, A., Martin, R., Russell, A., Valin, L., and Cohen, R.: Steps towards a mechanistic model of global soil nitric oxide emissions: implementation and space based-constraints, Atmos. Chem. Phys., 12, 7779–7795, https://doi.org/10.5194/acp-12-7779-2012, 2012. a, b, c
Huffman, G. J., Bolvin, D. T., Nelkin, E. J., Wolff, D. B., Adler, R. F., Gu, G., Hong, Y., Bowman, K. P., and Stocker, E. F.: The TRMM multisatellite precipitation analysis (TMPA): Quasi-global, multiyear, combined-sensor precipitation estimates at fine scales, J. Hydrometeorol., 8, 38–55, https://doi.org/10.1175/JHM560.1, 2007. a
Huijnen, V., Pozzer, A., Arteta, J., Brasseur, G., Bouarar, I., Chabrillat, S., Christophe, Y., Doumbia, T., Flemming, J., Guth, J., Josse, B., Karydis, V. A., Marécal, V., and Pelletier, S.: Quantifying uncertainties due to chemistry modelling – evaluation of tropospheric composition simulations in the CAMS model (cycle 43R1), Geosci. Model Dev., 12, 1725–1752, https://doi.org/10.5194/gmd-12-1725-2019, 2019. a
Huijnen, V., Miyazaki, K., Flemming, J., Inness, A., Sekiya, T., and Schultz, M. G.: An intercomparison of tropospheric ozone reanalysis products from CAMS, CAMS interim, TCR-1, and TCR-2, Geosci. Model Dev., 13, 1513–1544, https://doi.org/10.5194/gmd-13-1513-2020, 2020. a
Igbp-Dis: A program for creating global soil-property databases, IGBP Global Soils Data Task, France, https://sage.nelson.wisc.edu/data-and-models/atlas-of-the-biosphere/mapping-the-biosphere/land-use/soil-ph/ (last access: 23 November 2023), 1998. a
INDAAF: International Network to study Deposition and Atmospheric chemistry in Africa, https://indaaf.obs-mip.fr (last access: 26 February 2025), 2021. a
Inness, A., Ades, M., Agustí-Panareda, A., Barré, J., Benedictow, A., Blechschmidt, A.-M., Dominguez, J. J., Engelen, R., Eskes, H., Flemming, J., Huijnen, V., Jones, L., Kipling, Z., Massart, S., Parrington, M., Peuch, V.-H., Razinger, M., Remy, S., Schulz, M., and Suttie, M.: The CAMS reanalysis of atmospheric composition, Atmos. Chem. Phys., 19, 3515–3556, https://doi.org/10.5194/acp-19-3515-2019, 2019. a, b, c
Jaeglé, L., Martin, R. V., Chance, K., Steinberger, L., Kurosu, T. P., Jacob, D. J., Modi, A., Yoboué, V., Sigha-Nkamdjou, L., and Galy-Lacaux, C.: Satellite mapping of rain-induced nitric oxide emissions from soils, J. Geophys. Res.-Atmos., 109, https://doi.org/10.1029/2004JD004787, 2004. a
Jaeglé, L., Steinberger, L., Martin, R. V., and Chance, K.: Global partitioning of NOx sources using satellite observations: Relative roles of fossil fuel combustion, biomass burning and soil emissions, Faraday Discuss., 130, 407–423, https://doi.org/10.1039/B502128F, 2005. a, b, c, d
Johansson, C., Rodhe, H., and Sanhueza, E.: Emission of NO in a tropical savanna and a cloud forest during the dry season, J. Geophys. Res.-Atmos., 93, 7180–7192, https://doi.org/10.1029/JD093iD06p07180, 1988. a, b
KhayatianYazdi, F., Kamali, G., Mirrokni, S. M., and Memarian, M. H.: Sensitivity evaluation of the different physical parameterizations schemes in regional climate model RegCM4. 5 for simulation of air temperature and precipitation over North and West of Iran, Dynam. Atmos. Oceans, 93, 101199, https://doi.org/10.1016/j.dynatmoce.2020.101199, 2021. a
Kleinman, L. I.: Low and high NOx tropospheric photochemistry, J. Geophys. Res.-Atmos., 99, 16831–16838, https://doi.org/10.1029/94JD01028, 1994. a
Koné, B., Diedhiou, A., Diawara, A., Anquetin, S., Touré, N. E., Bamba, A., and Kobea, A. T.: Influence of initial soil moisture in a regional climate model study over West Africa – Part 2: Impact on the climate extremes, Hydrol. Earth Syst. Sci., 26, 731–754, https://doi.org/10.5194/hess-26-731-2022, 2022. a
Lamsal, L. N., Krotkov, N. A., Vasilkov, A., Marchenko, S., Qin, W., Yang, E.-S., Fasnacht, Z., Joiner, J., Choi, S., Haffner, D., Swartz, W. H., Fisher, B., and Bucsela, E.: Ozone Monitoring Instrument (OMI) Aura nitrogen dioxide standard product version 4.0 with improved surface and cloud treatments, Atmos. Meas. Tech., 14, 455–479, https://doi.org/10.5194/amt-14-455-2021, 2021. a
Laouali, D., Galy-Lacaux, C., Gardrat, E., Dias Alves, M., Lenoir, O., Zakou, A., Ossohou, M., Adon, M., and Al-Ourabi, H.: Trace gases, Banizoumbou, Niger, Aeris [data set], https://doi.org/10.25326/608, 2023. a
Lathiere, J., Hauglustaine, D., Friend, A., De Noblet-Ducoudré, N., Viovy, N., and Folberth, G.: Impact of climate variability and land use changes on global biogenic volatile organic compound emissions, Atmos. Chem. Phys., 6, 2129–2146, https://doi.org/10.5194/acp-6-2129-2006, 2006. a, b
Lavaysse, C., Flamant, C., Janicot, S., Parker, D. J., Lafore, J.-P., Sultan, B., and Pelon, J.: Seasonal evolution of the West African heat low: a climatological perspective, Clim. Dynam., 33, 313–330, https://doi.org/10.1007/s00382-009-0553-4, 2009. a
Lavaysse, C., Flamant, C., and Janicot, S.: Regional-scale convection patterns during strong and weak phases of the Saharan heat low, Atmos. Sci. Lett., 11, 255–264, https://doi.org/10.1002/asl.284, 2010. a
Lavaysse, C., Chaboureau, J.-P., and Flamant, C.: Dust impact on the West African heat low in summertime, Q. J. Roy. Meteorol. Soc., 137, 1227–1240, https://doi.org/10.1002/qj.844, 2011. a
Lelieveld, J. and Dentener, F. J.: What controls tropospheric ozone?, J. Geophys. Res.-Atmos., 105, 3531–3551, https://doi.org/10.1029/1999JD901011, 2000. a
Li, J., Nagashima, T., Kong, L., Ge, B., Yamaji, K., Fu, J. S., Wang, X., Fan, Q., Itahashi, S., Lee, H.-J., Kim, C.-H., Lin, C.-Y., Zhang, M., Tao, Z., Kajino, M., Liao, H., Li, M., Woo, J.-H., Kurokawa, J., Wang, Z., Wu, Q., Akimoto, H., Carmichael, G. R., and Wang, Z.: Model evaluation and intercomparison of surface-level ozone and relevant species in East Asia in the context of MICS-Asia Phase III – Part 1: Overview, Atmos. Chem. Phys., 19, 12993–13015, https://doi.org/10.5194/acp-19-12993-2019, 2019. a, b
Li, R., Xu, M., Li, M., Chen, Z., Zhao, N., Gao, B., and Yao, Q.: Identifying the spatiotemporal variations in ozone formation regimes across China from 2005 to 2019 based on polynomial simulation and causality analysis, Atmos. Chem. Phys., 21, 15631–15646, https://doi.org/10.5194/acp-21-15631-2021, 2021. a
Li, X., Yan, Y., Lu, X., Fu, L., and Liu, Y.: Responses of soil bacterial communities to precipitation change in the semi-arid alpine grassland of Northern Tibet, Front. Plant Sci., 13, 1036369, https://doi.org/10.3389/fpls.2022.1036369, 2022. a
Lin, H., Emmons, L. K., Lundgren, E. W., Yang, L. H., Feng, X., Dang, R., Zhai, S., Tang, Y., Kelp, M. M., Colombi, N. K., Eastham, S. D., Fritz, T. M., and Jacob, D. J.: Intercomparison of GEOS-Chem and CAM-chem tropospheric oxidant chemistry within the Community Earth System Model version 2 (CESM2), Atmos. Chem. Phys., 24, 8607–8624, https://doi.org/10.5194/acp-24-8607-2024, 2024. a, b
Lin, W., Xu, X., Yu, X., Zhang, X., and Huang, J.: Observed levels and trends of gaseous SO2 and HNO3 at Mt. Waliguan, China: Results from 1997 to 2009, J. Environ. Sci., 25, 726–734, https://doi.org/10.1016/S1001-0742(12)60143-0, 2013. a
Liu, W., Zhang, Z., and Wan, S.: Predominant role of water in regulating soil and microbial respiration and their responses to climate change in a semiarid grassland, Global Change Biol., 15, 184–195, https://doi.org/10.1111/j.1365-2486.2008.01728.x, 2009. a
Liu, X., Xu, W., Du, E., Tang, A., Zhang, Y., Zhang, Y., Wen, Z., Hao, T., Pan, Y., Zhang, L., Gu, B. J., Zhao, Y., Shen, J. L., Zhou, F., Gao, Z. L., Feng, Z. Z., Chang, Y. H., Goulding, K., Collett Jr, J. L., Vitousek, P. M., and Zhang, F. S.: Environmental impacts of nitrogen emissions in China and the role of policies in emission reduction, Philos. T. Roy. Soc. A, 378, 20190324, https://doi.org/10.1098/rsta.2019.0324, 2020. a
Lucas-Picher, P., Argüeso, D., Brisson, E., Tramblay, Y., Berg, P., Lemonsu, A., Kotlarski, S., and Caillaud, C.: Convection-permitting modeling with regional climate models: Latest developments and next steps, Wiley Interdisciplin. Rev.: Clim. Change, 12, e731, https://doi.org/10.1002/wcc.731, 2021. a
Ludwig, J., Meixner, F. X., Vogel, B., and Förstner, J.: Soil-air exchange of nitric oxide: An overview of processes, environmental factors, and modeling studies, Biogeochemistry, 52, 225–257, https://doi.org/10.1023/A:1006424330555, 2001. a
Marais, E. A., Jacob, D. J., Guenther, A., Chance, K., Kurosu, T. P., Murphy, J. G., Reeves, C. E., and Pye, H. O. T.: Improved model of isoprene emissions in Africa using Ozone Monitoring Instrument (OMI) satellite observations of formaldehyde: implications for oxidants and particulate matter, Atmos. Chem. Phys., 14, 7693–7703, https://doi.org/10.5194/acp-14-7693-2014, 2014. a
Mbienda, A. K., Guenang, G., Kaissassou, S., Tanessong, R., Choumbou, P., and Giorgi, F.: Enhancement of RegCM4.7-CLM precipitation and temperature by improved bias correction methods over Central Africa, Meteorol. Appl., 30, e2116, https://doi.org/10.1002/met.2116, 2023. a
McNally, A., Arsenault, K., Kumar, S., Shukla, S., Peterson, P., Wang, S., Funk, C., Peters-Lidard, C. D., and Verdin, J. P.: A land data assimilation system for sub-Saharan Africa food and water security applications, Sci. Data, 4, 1–19, https://doi.org/10.1038/sdata.2017.12, 2017. a
McNally, A.: FLDAS noah land surface model L4 global monthly 0.1×0.1 degree (MERRA-2 and CHIRPS), Atmos. Compos. Water Energy Cycles Clim. Var., https://doi.org/10.5067/5NHC22T9375G, 2018. a
McNeill, A. and Unkovich, M.: The nitrogen cycle in terrestrial ecosystems, in: Nutrient cycling in terrestrial ecosystems, Springer, 37–64, https://doi.org/10.1007/978-3-540-68027-7_2, 2007. a
Medinets, S., Skiba, U., Rennenberg, H., and Butterbach-Bahl, K.: A review of soil NO transformation: associated processes and possible physiological significance on organisms, Soil Biol. Biochem., 80, 92–117, https://doi.org/10.1016/j.soilbio.2014.09.025, 2015. a
Meixner, F. X. and Yang, W. X.: Biogenic emissions of nitric oxide and nitrous oxide from arid and semi-arid land, Dryland Ecohydrol., 233–255, https://doi.org/10.1007/1-4020-4260-4_14, 2006. a
Mosier, A. R.: Exchange of gaseous nitrogen compounds between agricultural systems and the atmosphere, Plant Soil, 228, 17–27, https://doi.org/10.1023/A:1004821205442, 2001. a
Mostafa, A. N., Zakey, A. S., Alfaro, S. C., Wheida, A. A., Monem, S. A., and Abdul Wahab, M. M.: Validation of RegCM-CHEM4 model by comparison with surface measurements in the Greater Cairo (Egypt) megacity, Environ. Sci. Pollut. Res., 26, 23524–23541, https://doi.org/10.1007/s11356-019-05370-0, 2019. a
Müller, J.-F.: Geographical distribution and seasonal variation of surface emissions and deposition velocities of atmospheric trace gases, J. Geophys. Res.-Atmos., 97, 3787–3804, https://doi.org/10.1029/91JD02757, 1992. a
Nenes, A., Pandis, S. N., and Pilinis, C.: ISORROPIA: A new thermodynamic equilibrium model for multiphase multicomponent inorganic aerosols, Aquat. Geochem., 4, 123–152, https://doi.org/10.1023/A:1009604003981, 1998. a
Nikulin, G., Kjellström, E., Hansson, U., Strandberg, G., and Ullerstig, A.: Evaluation and future projections of temperature, precipitation and wind extremes over Europe in an ensemble of regional climate simulations, Tellus A, 63, 41–55, https://doi.org/10.1111/j.1600-0870.2010.00466.x, 2011. a
Nikulin, G., Jones, C., Giorgi, F., Asrar, G., Büchner, M., Cerezo-Mota, R., Christensen, O. B., Déqué, M., Fernandez, J., Hänsler, A., van Meijgaard, E., Samuelsson, P., Sylla, M. B., and Sushama, L.: Precipitation climatology in an ensemble of CORDEX-Africa regional climate simulations, J. Climate, 25, 6057–6078, https://doi.org/10.1175/JCLI-D-11-00375.1, 2012. a
Nogherotto, R., Tompkins, A. M., Giuliani, G., Coppola, E., and Giorgi, F.: Numerical framework and performance of the new multiple-phase cloud microphysics scheme in RegCM4.5: precipitation, cloud microphysics, and cloud radiative effects, Geosci. Model Dev., 9, 2533–2547, https://doi.org/10.5194/gmd-9-2533-2016, 2016. a, b
Oleson, K. W., Lawrence, D. M., Bonan, G. B., Fisher, R. A., and Lawrence, P. J.: Technical description of version 4.5 of the Community Land Model (CLM), Tech. rep., Technical description of version 4.5 of the Community Land Model (CLM) (2013) NCAR/TN-503+STR, https://doi.org/10.5065/D6RR1W7M, 2013. a
Opacka, B., Stavrakou, T., Müller, J. F., Smedt, I. D., van Geffen, J., Marais, E. A., Horner, R. P., Millet, D. B., Wells, K. C., and Guenther, A. B.: Natural emissions of VOC and NOx over Africa constrained by TROPOMI HCHO and NO2 data using the MAGRITTEv1.1 model, Atmos. Chem. Phys., 25, 2863–2894, https://doi.org/10.5194/acp-25-2863-2025, 2025. a
Oppenheimer, C., Tsanev, V. I., Allen, A. G., McGonigle, A. J., Cardoso, A. A., Wiatr, A., Paterlini, W., and de Mello Dias, C.: NO2 emissions from agricultural burning in Sao Paulo, Brazil, Environ. Sci. Technol., 38, 4557–4561, https://doi.org/10.1021/es0496219, 2004. a
Ormeci, B., Sanin, S. L., and Peirce, J. J.: Laboratory study of NO flux from agricultural soil: Effects of soil moisture, pH, and temperature, J. Geophys. Res.-Atmos., 104, 1621–1629, https://doi.org/10.1029/98JD02834, 1999. a
Ossohou, M., Galy-Lacaux, C., Yoboué, V., Hickman, J., Gardrat, E., Adon, M., Darras, S., Laouali, D., Akpo, A., Ouafo, M., Diop, B., and Opepa, C.: Trends and seasonal variability of atmospheric NO2 and HNO3 concentrations across three major African biomes inferred from long-term series of ground-based and satellite measurements, Atmos. Environ., 207, 148–166, https://doi.org/10.1016/j.atmosenv.2019.03.027, 2019. a, b, c
Ossohou, M., Galy-Lacaux, C., Yoboué, V., Adon, M., Delon, C., Gardrat, E., Konaté, I., Ki, A., and Zouzou, R.: Long-term atmospheric inorganic nitrogen deposition in West African savanna over 16 year period (Lamto, Côte d'Ivoire), Environ. Res. Lett., 16, 015004, https://doi.org/10.1088/1748-9326/abd065, 2021. a
Ossohou, M., Hickman, J. E., Clarisse, L., Coheur, P.-F., Van Damme, M., Adon, M., Yoboué, V., Gardrat, E., Alvès, M. D., and Galy-Lacaux, C.: Trends and seasonal variability in ammonia across major biomes in western and central Africa inferred from long-term series of ground-based and satellite measurements, Atmos. Chem. Phys., 23, 9473–9494, https://doi.org/10.5194/acp-23-9473-2023, 2023. a, b
Ouafo-Leumbe, M.-R., Galy-Lacaux, C., Sigha-Nkamdjou, L., Gardrat, E., Dias Alves, M., Lenoir, O., Meka, M., and Amougou, M.: Trace gases, Zoétélé, Cameroon, Aeris [data set], https://doi.org/10.25326/603, 2023. a
Pacifico, F., Delon, C., Jambert, C., Durand, P., Morris, E., Evans, M. J., Lohou, F., Derrien, S., Donnou, V. H. E., Houeto, A. V., Reinares Martínez, I., and Brilouet, P.-E.: Measurements of nitric oxide and ammonia soil fluxes from a wet savanna ecosystem site in West Africa during the DACCIWA field campaign, Atmos. Chem. Phys., 19, 2299–2325, https://doi.org/10.5194/acp-19-2299-2019, 2019. a, b
Padro, J., Den Hartog, G., and Neumann, H.: An investigation of the ADOM dry deposition module using summertime O3 measurements above a deciduous forest, Atmos. Environ. A, 25, 1689–1704, https://doi.org/10.1016/0960-1686(91)90027-5, 1991. a
Pal, J. S. and Coauthors: The ICTP RegCM3 and RegCNET: Regional climate modeling for the developing World, B. Am. Meteorol. Soc., 88, 1395–1409, 2007. a
Peyrillé, P., Lafore, J.-P., and Redelsperger, J.-L.: An idealized two-dimensional framework to study the West African monsoon. Part I: Validation and key controlling factors, J. Atmos. Sci., 64, 2765–2782, https://doi.org/10.1175/JAS3919.1, 2007. a
Philippon, N., Cornu, G., Monteil, L., Gond, V., Moron, V., Pergaud, J., Sèze, G., Bigot, S., Camberlin, P., Doumenge, C., Fayolle, A., and Ngomanda, A.: The light-deficient climates of western Central African evergreen forests, Environ. Res. Lett., 14, 034007, https://doi.org/10.1088/1748-9326/aaf5d8, 2019. a
Pichelli, E., Coppola, E., Sobolowski, S., Ban, N., Giorgi, F., Stocchi, P., Alias, A., Belušić, D., Berthou, S., Caillaud, C., Cardoso, R. M., Chan, S., Christensen, O. B., Dobler, A., de Vries, H., Goergen, K., Kendon, E. J., Keuler, K., Lenderink, G., Lorenz, T., Mishra, A. N., Panitz, H.-J., Schär, C., Soares, P. M. M., Truhetz, H., and Vergara-Temprado, J.: The first multi-model ensemble of regional climate simulations at kilometer-scale resolution part 2: historical and future simulations of precipitation, Clim. Dynam., 56, 3581–3602, https://doi.org/10.1007/s00382-021-05657-4, 2021. a
Pilegaard, K.: Processes regulating nitric oxide emissions from soils, Philos. T. Roy. Soc. B, 368, 20130126, https://doi.org/10.1098/rstb.2013.0126, 2013. a
Potter, P., Ramankutty, N., Bennett, E. M., and Donner, S. D.: Characterizing the spatial patterns of global fertilizer application and manure production, Earth Interact., 14, 1–22, https://doi.org/10.1175/2009EI288.1, 2010. a, b
Prein, A. F., Langhans, W., Fosser, G., Ferrone, A., Ban, N., Goergen, K., Keller, M., Tölle, M., Gutjahr, O., Feser, F., Brisson, E., Kollet, S., Schmidli, J., Van Lipzig, N. P. M., and Leung, R.: A review on regional convection-permitting climate modeling: Demonstrations, prospects, and challenges, Rev. Geophys., 53, 323–361, https://doi.org/10.1002/2014RG000475, 2015. a
QA/SAC – Americas: Quality Assurance/Science Activity Centre – Americas (QA/SAC-Americas), https://qasac-americas.org (last access: 26 February 2025), 2025. a
Randerson, J., Van Der Werf, G., Giglio, L., Collatz, G., and Kasibhatla, P.: Global Fire Emissions Database, Version 4.1 (GFEDv4), ORNL DAAC, Oak Ridge, Tennessee, USA, https://doi.org/10.3334/ORNLDAAC/1293, 2018. a
Rao, P., Wang, Y., Wang, F., Liu, Y., Wang, X., and Wang, Z.: Daily soil moisture mapping at 1 km resolution based on SMAP data for desertification areas in northern China, Earth Syst. Sci. Data, 14, 3053–3073, https://doi.org/10.5194/essd-14-3053-2022, 2022. a
Roelle, P. A., Aneja, V. P., Gay, B., Geron, C., and Pierce, T.: Biogenic nitric oxide emissions from cropland soils, Atmos. Environ., 35, 115–124, https://doi.org/10.1016/S1352-2310(00)00279-X, 2001. a
Sanhueza, E., Hao, W. M., Scharffe, D., Donoso, L., and Crutzen, P. J.: N2O and NO emissions from soils of the northern part of the Guayana Shield, Venezuela, J. Geophys. Res.-Atmos., 95, 22481–22488, https://doi.org/10.1029/JD095iD13p22481, 1990. a
Sauvage, B., Thouret, V., Cammas, J.-P., Gheusi, F., Athier, G., and Nédélec, P.: Tropospheric ozone over Equatorial Africa: regional aspects from the MOZAIC data, Atmos. Chem. Phys., 5, 311–335, https://doi.org/10.5194/acp-5-311-2005, 2005. a
Sauvage, B., Martin, R. V., Van Donkelaar, A., and Ziemke, J.: Quantification of the factors controlling tropical tropospheric ozone and the South Atlantic maximum, J. Geophys. Res.-Atmos., 112, https://doi.org/10.1029/2006JD008008, 2007. a, b
Schreiber, F., Wunderlin, P., Udert, K. M., and Wells, G. F.: Nitric oxide and nitrous oxide turnover in natural and engineered microbial communities: biological pathways, chemical reactions, and novel technologies, Front. Microbiol., 3, 372, https://doi.org/10.3389/fmicb.2012.00372, 2012. a
Serca, D., Delmas, R., Jambert, C., and Labroue, L.: Emissions of nitrogen oxides from equatorial rain forest in central Africa, Tellus B, 46, 243–254, https://doi.org/10.3402/tellusb.v46i4.15795, 1994. a, b
Shalaby, A., Zakey, A., Tawfik, A., Solmon, F., Giorgi, F., Stordal, F., Sillman, S., Zaveri, R. A., and Steiner, A.: Implementation and evaluation of online gas-phase chemistry within a regional climate model (RegCM-CHEM4), Geosci. Model Dev., 5, 741–760, https://doi.org/10.5194/gmd-5-741-2012, 2012. a, b, c, d, e, f, g
Sillman, S. and He, D.: Some theoretical results concerning O3-NOx-VOC chemistry and NOx-VOC indicators, J. Geophys. Res. Atmos., 107, ACH-26, https://doi.org/10.1029/2001JD001123, 2002. a
Simpson, D. and Darras, S.: Global soil NO emissions for Atmospheric Chemical Transport Modelling: CAMS-GLOB-SOIL v2.2, Earth Syst. Sci. Data Discuss. [preprint], https://doi.org/10.5194/essd-2021-221, 2021. a
Skopp, J., Jawson, M., and Doran, J.: Steady-state aerobic microbial activity as a function of soil water content, Soil Sci. Soc. Am. J., 54, 1619–1625, https://doi.org/10.2136/sssaj1990.03615995005400060018x, 1990. a, b
Solmon, F., Giorgi, F., and Liousse, C.: Aerosol modelling for regional climate studies: application to anthropogenic particles and evaluation over a European/African domain, Tellus B, 58, 51–72, https://doi.org/10.1111/j.1600-0889.2005.00155.x, 2006. a
Solmon, F., Elguindi, N., Mallet, M., Flamant, C., and Formenti, P.: West African monsoon precipitation impacted by the South Eastern Atlantic biomass burning aerosol outflow, npj Clim. Atmos. Sci., 4, 54, https://doi.org/10.1038/s41612-021-00210-w, 2021. a
Soulie, A., Granier, C., Darras, S., Zilbermann, N., Doumbia, T., Guevara, M., Jalkanen, J.-P., Keita, S., Liousse, C., Crippa, M., Guizzardi, D., Hoesly, R., and Smith, S. J.: Global anthropogenic emissions (CAMS-GLOB-ANT) for the Copernicus Atmosphere Monitoring Service simulations of air quality forecasts and reanalyses, Earth Syst. Sci. Data, 16, 2261–2279, https://doi.org/10.5194/essd-16-2261-2024, 2024. a
Stehfest, E. and Bouwman, L.: N 2 O and NO emission from agricultural fields and soils under natural vegetation: summarizing available measurement data and modeling of global annual emissions, Nutr. Cycl. Agroecosyst., 74, 207–228, https://doi.org/10.1007/s10705-006-9000-7, 2006. a
Steinkamp, J. and Lawrence, M. G.: Improvement and evaluation of simulated global biogenic soil NO emissions in an AC-GCM, Atmos. Chem. Phys., 11, 6063–6082, https://doi.org/10.5194/acp-11-6063-2011, 2011. a
Steinkamp, J., Ganzeveld, L., Wilcke, W., and Lawrence, M.: Influence of modelled soil biogenic NO emissions on related trace gases and the atmospheric oxidizing efficiency, Atmos. Chem. Phys., 9, 2663–2677, https://doi.org/10.5194/acp-9-2663-2009, 2009. a, b, c
Stewart, D., Taylor, C., Reeves, C., and McQuaid, J.: Biogenic nitrogen oxide emissions from soils: impact on NOx and ozone over west Africa during AMMA (African Monsoon Multidisciplinary Analysis): observational study, Atmos. Chem. Phys., 8, 2285–2297, https://doi.org/10.5194/acp-8-2285-2008, 2008. a, b, c
Stohl, A., Williams, E., Wotawa, G., and Kromp-Kolb, H.: A European inventory of soil nitric oxide emissions and the effect of these emissions on the photochemical formation of ozone, Atmosp. Environ., 30, 3741–3755, https://doi.org/10.1016/1352-2310(96)00104-5, 1996. a
Strada, S., Pozzer, A., Giuliani, G., Coppola, E., Solmon, F., Jiang, X., Guenther, A., Bourtsoukidis, E., Serça, D., Williams, J., and Giorgi, F.: Assessment of isoprene and near-surface ozone sensitivities to water stress over the Euro-Mediterranean region, Atmos. Chem. Phys., 23, 13301–13327, https://doi.org/10.5194/acp-23-13301-2023, 2023. a
Sultan, B., Janicot, S., and Diedhiou, A.: The West African monsoon dynamics. Part I: Documentation of intraseasonal variability, J. Climate, 16, 3389–3406, https://doi.org/10.1175/1520-0442(2003)016<3389:TWAMDP>2.0.CO;2, 2003. a
Sun, S., Tai, A. P., Yung, D. H., Wong, A. Y., Ducker, J. A., and Holmes, C. D.: Influence of plant ecophysiology on ozone dry deposition: comparing between multiplicative and photosynthesis-based dry deposition schemes and their responses to rising CO2 level, Biogeosciences, 19, 1753–1776, https://doi.org/10.5194/bg-19-1753-2022, 2022. a
Sylla, M., Giorgi, F., and Stordal, F.: Large-scale origins of rainfall and temperature bias in high-resolution simulations over southern Africa, Clim. Res., 52, 193–211, https://doi.org/10.3354/cr01044, 2012. a, b, c
Sylla, M., Diallo, I., and Pal, J.: West African monsoon in state-of the-art regional climate models, INTECH, https://doi.org/10.5772/55140, 2013. a
Tadic, I., Nussbaumer, C. M., Bohn, B., Harder, H., Marno, D., Martinez, M., Obersteiner, F., Parchatka, U., Pozzer, A., Rohloff, R., Zöger, M., Lelieveld, J., and Fischer, H.: Central role of nitric oxide in ozone production in the upper tropical troposphere over the Atlantic Ocean and western Africa, Atmos. Chem. Phys., 21, 8195–8211, https://doi.org/10.5194/acp-21-8195-2021, 2021. a
Tadross, M., Gutowski, W., Hewitson, B., Jack, C., and New, M.: MM5 simulations of interannual change and the diurnal cycle of southern African regional climate, Theor. Appl. Climatol., 86, 63–80, https://doi.org/10.1007/s00704-005-0208-2, 2006. a
Tiedtke, M.: A comprehensive mass flux scheme for cumulus parameterization in large-scale models, Mon. Weather Rev., 117, 1779–1800, https://doi.org/10.1175/1520-0493(1989)117<1779:ACMFSF>2.0.CO;2, 1989. a, b
Tsivlidou, M., Sauvage, B., Bennouna, Y., Blot, R., Boulanger, D., Clark, H., Le Flochmoën, E., Nédélec, P., Thouret, V., Wolff, P., and Barret, B.: Tropical tropospheric ozone and carbon monoxide distributions: characteristics, origins, and control factors, as seen by IAGOS and IASI, Atmos. Chem. Phys., 23, 14039–14063, https://doi.org/10.5194/acp-23-14039-2023, 2023. a
Valari, M. and Menut, L.: Does an increase in air quality models' resolution bring surface ozone concentrations closer to reality?, J. Atmos. Ocean. Tech., 25, 1955–1968, https://doi.org/10.1175/2008JTECHA1123.1, 2008. a
Van Der A, R., Eskes, H., Boersma, K., Van Noije, T., Van Roozendael, M., De Smedt, I., Peters, D., and Meijer, E.: Trends, seasonal variability and dominant NOx source derived from a ten year record of NO2 measured from space, J. Geophys. Res.-Atmos., 113, https://doi.org/10.1029/2007JD009021, 2008. a
van Marle, M. J. E., Kloster, S., Magi, B. I., Marlon, J. R., Daniau, A.-L., Field, R. D., Arneth, A., Forrest, M., Hantson, S., Kehrwald, N. M., Knorr, W., Lasslop, G., Li, F., Mangeon, S., Yue, C., Kaiser, J. W., and van der Werf, G. R.: Historic global biomass burning emissions for CMIP6 (BB4CMIP) based on merging satellite observations with proxies and fire models (1750–2015), Geosci. Model Dev., 10, 3329–3357, https://doi.org/10.5194/gmd-10-3329-2017, 2017. a
van Wees, D. and van der Werf, G. R.: Modelling biomass burning emissions and the effect of spatial resolution: a case study for Africa based on the Global Fire Emissions Database (GFED), Geosci. Model Dev., 12, 4681–4703, https://doi.org/10.5194/gmd-12-4681-2019, 2019. a
Vinken, G., Boersma, K., Maasakkers, J., Adon, M., and Martin, R.: Worldwide biogenic soil NOx emissions inferred from OMI NO2 observations, Atmos. Chem. Phys., 14, 10363–10381, https://doi.org/10.5194/acp-14-10363-2014, 2014. a, b, c
Vitousek, P. M., Aber, J. D., Howarth, R. W., Likens, G. E., Matson, P. A., Schindler, D. W., Schlesinger, W. H., and Tilman, D. G.: Human alteration of the global nitrogen cycle: sources and consequences, Ecol. Appl., 7, 737–750, https://doi.org/10.1890/1051-0761(1997)007[0737:HAOTGN]2.0.CO;2, 1997. a
Wagner, A., Bennouna, Y., Blechschmidt, A.-M., Brasseur, G., Chabrillat, S., Christophe, Y., Errera, Q., Eskes, H., Flemming, J., Hansen, K., Inness, A., Kapsomenakis, J., Langerock, B., Richter, A., Sudarchikova, N., Thouret, V., and Zerefos, C.: Comprehensive evaluation of the Copernicus Atmosphere Monitoring Service (CAMS) reanalysis against independent observations: Reactive gases, Elem. Sci. Anth., 9, 00171, https://doi.org/10.1525/elementa.2020.00171, 2021. a, b, c
Wang, W., Sheng, L., Jin, H., and Han, Y.: Dust aerosol effects on cirrus and altocumulus clouds in Northwest China, J. Meteorol. Res., 29, 793–805, https://doi.org/10.1007/s13351-015-4116-9, 2015. a
Wang, Y., Ma, Y.-F., Muñoz-Esparza, D., Dai, J., Li, C. W. Y., Lichtig, P., Tsang, R. C.-W., Liu, C.-H., Wang, T., and Brasseur, G. P.: Coupled mesoscale–microscale modeling of air quality in a polluted city using WRF-LES-Chem, Atmos. Chem. Phys., 23, 5905–5927, https://doi.org/10.5194/acp-23-5905-2023, 2023. a
Williams, E., Guenther, A., and Fehsenfeldi, F.: An inventory of nitric oxide emissions from soils in the United States, J. Geophys. Res.-Atmos., 97, 7511–7519, https://doi.org/10.1029/92JD00412, 1992. a
Williams, J., Scheele, M., van Velthoven, P., Cammas, J.-P., Thouret, V., Galy-Lacaux, C., and Volz-Thomas, A.: The influence of biogenic emissions from Africa on tropical tropospheric ozone during 2006: a global modeling study, Atmos. Chem. Phys., 9, 5729–5749, https://doi.org/10.5194/acp-9-5729-2009, 2009. a, b, c
Wu, Z., Wang, X., Chen, F., Turnipseed, A. A., Guenther, A. B., Niyogi, D., Charusombat, U., Xia, B., Munger, J. W., and Alapaty, K.: Evaluating the calculated dry deposition velocities of reactive nitrogen oxides and ozone from two community models over a temperate deciduous forest, Atmosp. Environ., 45, 2663–2674, https://doi.org/10.1016/j.atmosenv.2011.02.063, 2011. a
Yan, X., Ohara, T., and Akimoto, H.: Statistical modeling of global soil NOx emissions, Global Biogeochem. Cy., 19, https://doi.org/10.1029/2004GB002276, 2005. a, b, c
Yarwood, G. and Tuite, K.: Representing Ozone Formation from Volatile Chemical Products (VCP) in Carbon Bond (CB) Chemical Mechanisms, Atmosphere, 15, 178, https://doi.org/10.3390/atmos15020178, 2024. a
Yarwood, G., Jung, J., Whitten, G. Z., Heo, G., Mellberg, J., and Estes, M.: Updates to the Carbon Bond Mechanism for Version 6 (CB6), in: 9th Annual CMAS Conference, Chapel Hill, NC, 11–13 October 2010, 1–4, 2010. a
Yienger, J. and Levy, H.: Empirical model of global soil-biogenic NOχ emissions, J. Geophys. Res.-Atmos., 100, 11447–11464, https://doi.org/10.1029/95JD00370, 1995. a, b, c, d
Young, P. J., Naik, V., Fiore, A. M., Gaudel, A., Guo, J., Lin, M., Neu, J., Parrish, D., Rieder, H., Schnell, J. L., Tilmes, S., Wild, O., Zhang, L., Ziemke, J., Brandt, J., Delcloo, A., Doherty, R. M., Geels, C., Hegglin, M. I., Hu, L., Im, U., Kumar, R., Luhar, A., Murray, L., Plummer, D., Rodriguez, J., Saiz-Lopez, A., Schultz, M. G., Woodhouse, M. T., and Zeng, G.: Tropospheric Ozone Assessment Report: Assessment of global-scale model performance for global and regional ozone distributions, variability, and trends, Elem. Sci. Anth., 6, 10, https://doi.org/10.1525/elementa.265, 2018. a
Zaveri, R. A. and Peters, L. K.: A new lumped structure photochemical mechanism for large-scale applications, J. Geophys. Res.-Atmos., 104, 30387–30415, https://doi.org/10.1029/1999JD900876, 1999. a, b, c
Zhang, L., Moran, M. D., Makar, P. A., Brook, J. R., and Gong, S.: Modelling gaseous dry deposition in AURAMS: a unified regional air-quality modelling system, Atmos. Environ., 36, 537–560, https://doi.org/10.1016/S1352-2310(01)00447-2, 2002. a, b
Zhang, L., Brook, J. R., and Vet, R.: A revised parameterization for gaseous dry deposition in air-quality models, Atmos. Chem. Phys., 3, 2067–2082, https://doi.org/10.5194/acp-3-2067-2003, 2003. a, b, c
Zittis, G., Hadjinicolaou, P., Fnais, M., and Lelieveld, J.: Projected changes in heat wave characteristics in the eastern Mediterranean and the Middle East, Reg. Environ. Change, 16, 1863–1876, https://doi.org/10.1007/s10113-014-0753-2, 2016. a, b
- Abstract
- Introduction
- Model description
- Data and study sites
- Regional climate validation
- BioNO fluxes
- RegCM5 simulations and the impact of BioNO emissions
- Conclusion
- Code and data availability
- Author contributions
- Competing interests
- Disclaimer
- Acknowledgements
- Financial support
- Review statement
- References
- Supplement