the Creative Commons Attribution 4.0 License.
the Creative Commons Attribution 4.0 License.
 | 30 Sep 2025
Surface and tropospheric ozone over East Asia and Southeast Asia from observations: distributions, trends, and variability
Rong Tan
Wenhao Qiao
Taegyung Lee
Yufen Wang
Danyuting Zhang
Minglong Tang
Wenqing Zhao
Yixuan Gu
Shaojia Fan
Jinqiang Zhang
Xiaopu Lyu
Likun Xue
Jianming Xu
Zhiqiang Ma
Mohd Talib Latif
Teerachai Amnuaylojaroen
Junsu Gil
Mee-Hye Lee
Juseon Bak
Joowan Kim
Hong Liao
Yugo Kanaya
Tatsuya Nagashima
The high level of ozone throughout the troposphere is an emerging concern for East Asia and Southeast Asia. Here, we analyze available surface ozone measurements from the past two decades (2005–2021) over eight countries, with 10 ozonesonde and aircraft measurements within this region. At the surface, the seasonal mean ozone over 2017–2021 varies from 30 nmol mol−1 (i.e., 30 ppb) in Southeast Asia to 75 nmol mol−1 in summer in northern China. The metric of seasonal 95th percentile ozone can identify the multiple hot spots of ozone pollution of over 85 nmol mol−1 in Southeast Asia. The new World Health Organization (WHO) peak-season ozone standard indicates that both East Asia and Southeast Asia face a widespread risk of long-term exposure. The surface ozone increase in South Korea and Southeast Asia from 2005 was leveling off or even decreasing in the past decade, while the ozone increase in the 2000s over China has amplified since 2013. Surface ozone trends in Japan and Mongolia were flat in the past decade. In the troposphere, the available measurements show an overall increasing tendency at different altitudes from a three-decade perspective, although the trend in the past decade remains unclear due to data availability. The difference in the tropospheric ozone level between East Asia and Southeast Asia is likely due to the high background ozone from the stratospheric intrusion over Northeast Asia. In terms of ozone controls, our results suggest that anthropogenic emissions determine the occurrence of high ozone levels, but the underappreciated strong ozone climate penalty, particularly over Southeast Asia, will make ozone controls harder under a warmer climate.
- Article
(11204 KB) - Full-text XML
- Companion paper
-
Supplement
(23574 KB) - BibTeX
- EndNote


Tropospheric ozone has been a long-lasting threat to public health, crop yield, and climate warming (Chang et al., 2017; DeLang et al., 2021; Lyu et al., 2023). Its importance in dampening the carbon sink of forests by reducing productivity is also increasingly recognized in recent years (Cheesman et al., 2024; Zhou et al., 2024). Tropospheric ozone is mainly produced from the photochemical reactions between nitrogen oxides (NOx) and volatile organic compounds (VOCs) in the presence of sunlight; stratosphere–troposphere exchange (STE) can also transport ozone into the troposphere (Neu et al., 2014) and even reach up to the surface under conducive weather conditions (Chen et al., 2024). In particular, the high level of tropospheric ozone over East Asia and Southeast Asia is of great concern. For example, the estimated cardiovascular premature mortality attributable to surface ozone is 277 800 (142 900–421 900) in 2019 over East Asia and Southeast Asia, accounting for ∼ 50 % of its global health burden (Sun et al., 2024). The current ozone exposure can reduce the annual crop yield in China, South Korea, and Japan by 60×106 , 60×106 , and 20×106 t for wheat, rice, and maize, respectively (Feng et al., 2022). As a result, it is important to elucidate the spatiotemporal distributions of observed ozone from the surface to the troposphere over East Asia and Southeast Asia.
Surface ozone concentrations have been measured by nation-level networks for more than a decade in many countries. In Japan, since the 1970s, the surface network has revealed a gradual increase in ozone (Nagashima et al., 2017; Kawano et al., 2022) until the past decade when Japanese sites experienced an ozone decrease of −0.8 ± 0.5 nmol mol−1 yr−1 (Wang et al., 2024). In South Korea, surface ozone has been increasing over the past two decades, leading to the maximum daily 8 h average (MDA8) ozone often exceeding 80 nmol mol−1 in summer in the Seoul metropolitan area (Kim et al., 2023; Colombi et al., 2023). In China, a national surface network was established in 2013, and the widespread rising surface ozone in the past decade has positioned China to be one of countries with the highest ozone levels worldwide (Lu et al., 2018; Li et al., 2021; Wang et al., 2024). In contrast, Hong Kong, located on China's southern coast, exhibited an overall increase in the surface ozone level of 0.35 nmol mol−1 yr−1 over 1994–2018, but the trend tended to level off in recent years (Wang et al., 2019).
In Southeast Asia, surface ozone levels are much lower than those in East Asia due to the lower anthropogenic emissions and frequent marine air inflow (Ahamad et al., 2020; Sukkhum et al., 2022; Wang et al., 2022a). The previously published analyses of long-term ozone trends in Southeast Asia are scarce, mainly focused on Malaysia and Thailand before 2016. In Malaysia, there was an observed ozone increase of 0.09–0.21 nmol mol−1 yr−1 over Peninsular Malaysia during 1997–2016, but Borneo Malaysia recorded small or insignificant ozone trends (Ahamad et al., 2020; Wang et al., 2022a). In Thailand, the observed surface ozone experienced a significant increase of 0.7–1.2 nmol mol−1 yr−1 during the dry season from 2005 to 2016 (Wang et al., 2022a). In Indonesia, there was no significant ozone trend in Bukit Kototabang (a suburban site) from 2005 to 2016 (Wang et al., 2022a). In the Philippines, Salvador et al. (2022) reported an increase of 0.41 nmol mol−1 yr−1 in surface ozone during 2014–2020, based on air quality measurements in Butuan (an urban site), southern Philippines. Long-term ozone measurements in other Southeast Asia countries are not well documented.
Tropospheric ozone profiles and columns over East Asia and Southeast Asia have been measured by multiple platforms, including ozonesonde, aircraft, and satellite. By using long-term ozonesonde measurements, previous studies have extensively explored tropospheric ozone profiles in Beijing (Zeng et al., 2023) and Hong Kong (Liao et al., 2021) in China and in Pohang in South Korea (Bak et al., 2022). However, these ozonesonde-based analyses mainly focused on the spatiotemporal variability and source contributions of tropospheric ozone at the individual site. By using the In-service Aircraft for a Global Observing System (IAGOS) aircraft ozone observations, Gaudel et al. (2020) show that the tropospheric ozone level increases with latitude from Malaysia/Indonesia to northeastern China/South Korea. More importantly, these authors reported a rapid tropospheric ozone increase during 1994–2016 over East Asia and Southeast Asia, consistent with satellite tropospheric ozone column trends (Gopikrishnan and Kuttippurath, 2024), which has been attributed to the rising anthropogenic emissions both locally and remotely (Wang et al., 2022a, b; Li et al., 2023b). Considering that East Asia and Southeast Asia have been identified as a global hot spot, with the fastest increase in observed tropospheric ozone after the 1990s by the Intergovernmental Panel on Climate Change (IPCC) Sixth Assessment Report (AR6), a comprehensive assessment of tropospheric ozone over this region by using these available measurements is strongly needed.
Under the framework of the Tropospheric Ozone Assessment Report (TOAR), the TOAR documents comprehensively estimate the global ozone pollution and its historical trends. The first-phase TOAR includes only limited ground observation data over East Asian and Southeast Asian countries before 2014 (Chang et al., 2017). In the context of TOAR Phase II (TOAR II), the established East Asia Focus Working Group (EAWG) aims to advance ozone research over East Asia and Southeast Asia, with a focus on observed ozone trends and their attributions. Our effort is to include ozone measurements (or post-calculated ozone metrics) from the surface to the tropopause, collected from the TOAR database and individual institutions from East Asia and Southeast Asia. Please also see the accompanying paper for ozone trend attributions (Lu et al., 2025).
This paper will present the most comprehensive view of ozone distributions and evolution over East Asia and Southeast Asia across different spatiotemporal scales in the past two decades. The structure of this paper is as follows: Sect. 2 introduces the multiple ozone measurements and calculation of different ozone metrics, Sect. 3 describes the present-day surface ozone levels with different metrics and long-term surface ozone trends in the past two decades, Sect. 4 describes the three-dimensional present-day distribution and long-term trends in tropospheric ozone, Sect. 5 discusses the important implications for future ozone pollution controls, and the Conclusions are given in Sect. 6.
2.1 Surface ozone observations
The TOAR data portal archives a global comprehensive and freely accessible data collection of surface ozone observations (https://igacproject.org/activities/TOAR/TOAR-II, last access: 19 September 2025), which supports TOAR's assessment report of global ozone distributions and trends from the surface to the tropopause. The TOAR database is updated to include all recent observations since 2014. To give an up-to-date assessment of tropospheric ozone over East Asia and Southeast Asia, here we take advantage of the TOAR database to examine ozone levels in different countries within the same time frame.
In this study, we used surface ozone measurements from the national networks of China (2013–2021), Japan (2005–2021), South Korea (2005–2021), Malaysia (2005–2021), and Thailand (2005–2021) that were collected from the TOAR II database or provided by our EAWG members. In addition to the national network records, individual ozone measurements in Ulaanbaatar of Mongolia, Phnom Penh of Cambodia, and Bandung of Indonesia from the Acid Deposition Monitoring Network in East Asia (EANET) were also included. To assess the long-term ozone trend in China before 2013, we also collected 11 ozone measurements from previously published literature with updates from our EAWG members. As shown in Table S1 in the Supplement, it includes one global baseline station (Mt. Waliguan), four regional background stations (Akedala, Longfengshan, Xianggelila, and Lin'an), and one rural station (Gucheng) from Xu et al. (2020); one regional background station (Mt. Tai) from Sun et al. (2016); one regional background station (Shangdianzi) from Ma et al. (2016); one urban station from Gu et al. (2020); and one urban station (Guangzhou) and one suburban station (Hong Kong) from Zhang et al. (2011).
To ensure data quality, the daily and monthly means were calculated using the hourly data when there are over 75 % valid data for each day and month. To fully assess ozone distributions, we adopted the following ozone metrics in this study. (1) Seasonal mean ozone: seasonal MDA8 concentrations are calculated for the four seasons (December–January–February, DJF; March–April–May, MAM; June–July–August, JJA; September–October–November, SON). (2) Ozone exceedance: the national ambient ozone air quality standard varies greatly among countries in East Asia and Southeast Asia (Table S2). The threshold for MDA8 ozone ranges from 60 µg m−3 in the Philippines to 160 µg m−3 in China. For the maximum daily 1 h average (MDA1), the ozone ranges from 120 µg m−3 in Japan to 235 µg m−3 in Indonesia. Under standard conditions, this is (1013 hPa, 273 K), 1 nmol mol µg m−3. In this study, we adopted the thresholds of 60 and 47 nmol mol−1 (World Health Organization (WHO) standard) for MDA8 ozone to determine the exceedance days. (3) Peak-season ozone: in 2021, the WHO introduced a new standard for the peak-season (6-month mean) ozone limit of 60 µg m−3 to save more people suffering from its long-term exposure. We used this threshold to assess the peak-season ozone levels.
2.2 Tropospheric ozone observations
In this part, we report our results from an analysis of the vertical ozone profile, mostly based on the ozonesonde measurements and some aircraft measurements. There are a number of ozonesonde measurement sites, but here, we only consider 10 sites (Table S3), which have at least 10 continuous measurement years for finding reliable trends by considering the lesson from Chang et al. (2025). If a certain site does not satisfy this standard, we suggest only the mean pattern of the ozone vertical profile for that site in order to show as many of the existing data as we can. This approach enables us to compare with recent results produced from other ozonesonde data analyses (Gaudel et al., 2024; Stauffer et al., 2024). Data at nine sites were obtained from the World Ozone and Ultraviolet Radiation Data Centre (WOUDC) and the Southern Hemisphere ADditional OZonesondes (SHADOZ) data archive. Data at the Beijing site, which were utilized in a previous study (Zhang et al., 2021), were directly provided from the measurement team.
We also used the altitudinal ozone measurements that have been collected from the In-service Aircraft for a Global Observing System (IAGOS). While the IAGOS mission has continued since the 1990s and is still available, ozone data in East Asia are somewhat limited. Here we utilized only the IAGOS ozone data from 1995 to 2022 – the period having a sufficient number of measurements for two defined regions such as Northeast and Southeast Asia. The locations of all ozonesonde sites and the IAGOS region are detailed in Sect. 4.1, and the number of all ozonesondes and the IAGOS data used in this study are shown in Fig. S1 in the Supplement.
2.3 Ozone trend calculation
Noticeable outliers are not detected in our dataset for surface ozone, ozonesonde, and the IAGOS datasets. In terms of ozone distributions, we present the present-day ozone maps averaged over 2017–2021. We required there to be at least 3 out of 5 years of data available in the calculation. In terms of ozone trends, the time frame of 2013–2021 was adopted to represent the past decade trend; the time frame of 2005–2021 was adopted to represent the 21st century trend – the time series should begin at least in the range of 2005–2010 and end in the range of 2017–2021; and the time frame of 1995–2021 was adopted to represent the late 20th century trend – the time series should begin at least in the range of 1995–1999 and end in the range of 2017–2021.
Following the TOAR II guideline, to determine the ozone trend, we first derived the monthly anomalies of ozone concentrations that are calculated as the difference between the individual monthly means and the monthly climatology. Then, a quantile regression method as recommended by the TOAR II statistical guidance was employed to estimate the linear trend in surface ozone, and a 50th quantile regression slope was reported in consideration of the length of ozone records.
3.1 Distribution of present-day surface ozone over 2017–2021
3.1.1 Seasonal mean MDA8 ozone
Figure 1 shows the seasonal mean MDA8 ozone concentrations averaged over 2017–2021. In winter, the seasonal mean ozone level is almost below 50 nmol mol−1 due to the weak photochemistry. In many Chinese cities, ozone concentration is even decreased to 20–30 nmol mol−1, and this is because the high NOx emissions in the urban environment (e.g., the North China Plain) make ozone strongly titrated, often dropping to below the Northern Hemisphere background ozone (Vingarzan, 2004). High ozone values of 55–60 nmol mol−1 in northern Thailand and 60–65 nmol mol−1 in Bangkok (Thailand) are notable. In spring, seasonal mean ozone concentrations are doubled in northern China (north of 30° N) and are increased by 10–20 nmol mol−1 from wintertime in South Korea and Japan. High ozone of over 60 nmol mol−1 in Thailand still holds in spring, and the ozone concentration is enhanced by up to 20 nmol mol−1 in Yunnan Province (China), reflecting a possible concentration from spring fire emissions over Southeast Asia (Xue et al., 2021). In summer, the highest ozone levels of over 75 nmol mol−1 are found in northern China, and western China exhibits ozone concentrations of 60–65 nmol mol−1. In southern China, the ozone level is decreased to 30–55 nmol mol−1 because of the active summer monsoon rainfall (Zhou et al., 2022). The hot spot of summer ozone pollution is found in Seoul (South Korea), where the seasonal mean ozone is also over 75 nmol mol−1, followed by 55–60 nmol mol−1 in Tokyo (Japan), 40–50 nmol mol−1 in Kuala Lumpur (Malaysia), and 30–40 nmol mol−1 in Bangkok (Thailand). In autumn, ozone concentrations are decreased strongly from their summer levels north of 30° N over East Asia but are increased remarkably in the Pearl River Delta (PRD) region of China where the seasonal mean MDA8 ozone of up to 65 nmol mol−1 is the highest level in East Asia and Southeast Asia.
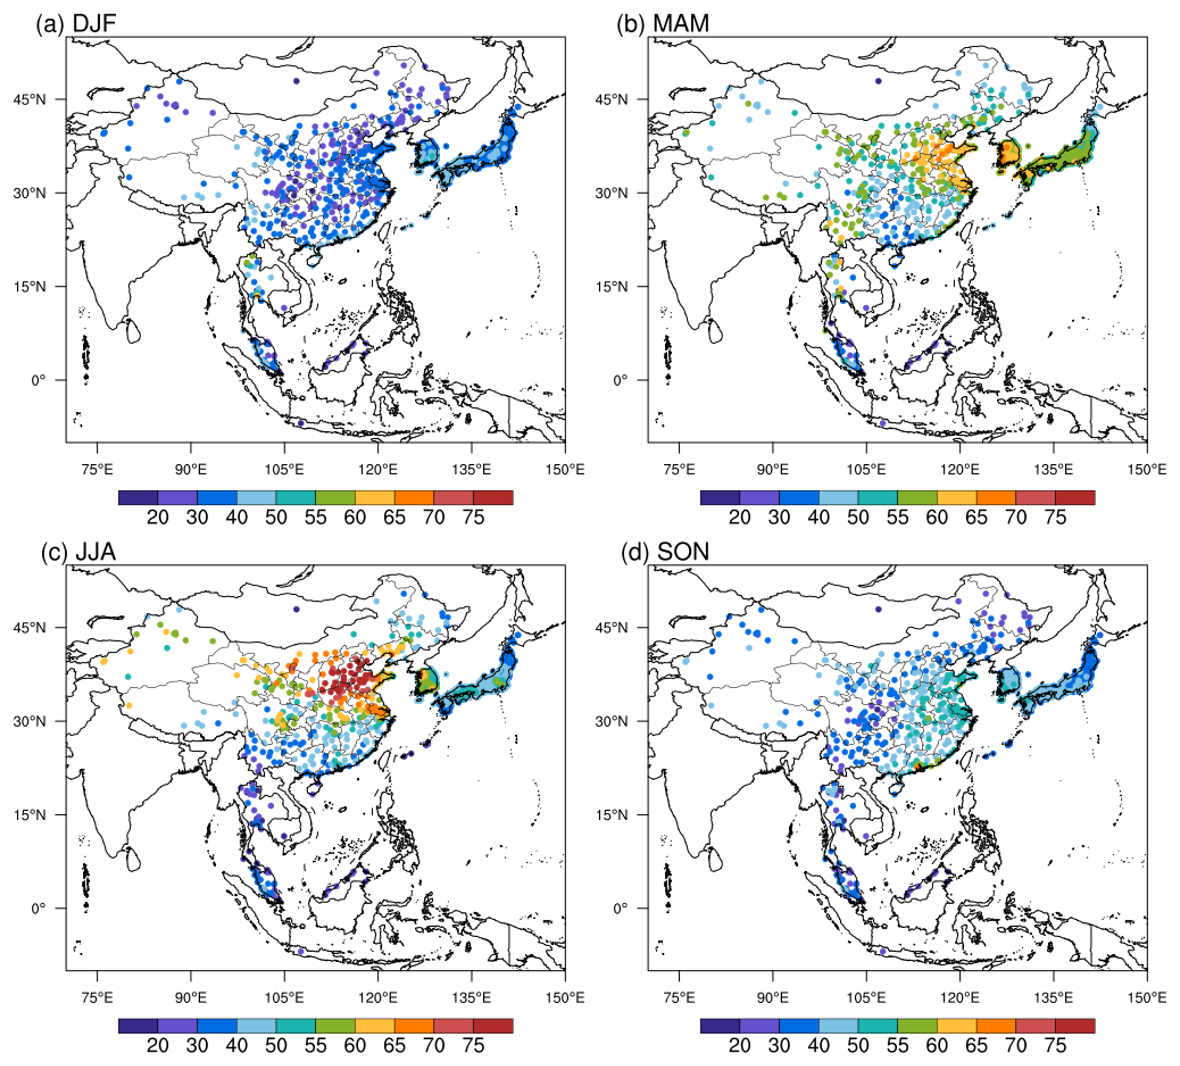
Figure 1The observed seasonal mean MDA8 ozone (nmol mol−1) in (a) DJF, (b) MAM, (c) JJA, and (d) SON averaged over 2017–2021 in East Asia and Southeast Asia. There are eight countries with surface ozone measurements, including Cambodia (one site), China (360 sites), Indonesia (one site), Japan (1187 sites), Malaysia (66 sites), Mongolia (one site), South Korea (473 sites), and Thailand (25 sites).
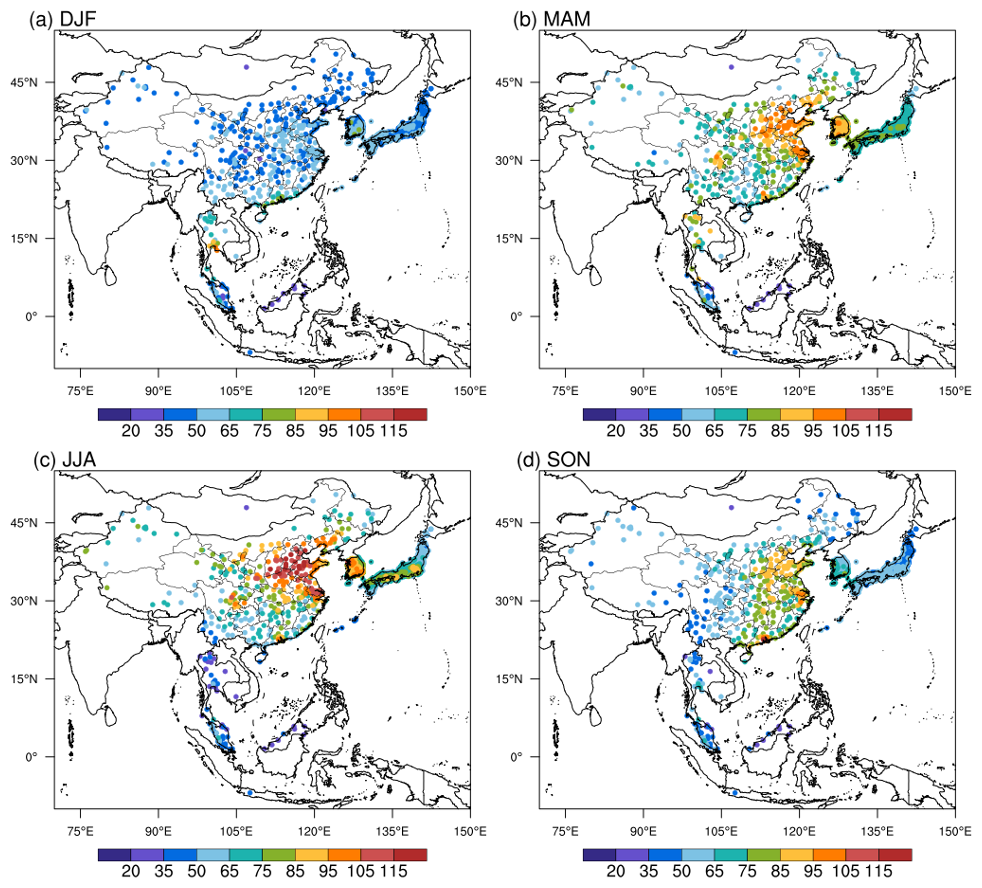
Figure 2Same as for Fig. 1 but for the seasonal 95th percentile MDA8 ozone (nmol mol−1) averaged over 2017–2021. This metric represents the extremely high ozone values that are related to short-term ozone exposure.
In addition to the mean ozone level, Fig. 2 shows the seasonal 95th percentile ozone concentrations averaged over 2017–2021. The ozone metric is almost the fifth-highest value in each season, representing the high ozone values of great concern in air quality management. Although the seasonality of the 95th percentile ozone resembles the mean ozone evolution, the occurrence of the very high 95th percentile ozone values highlights the severity of ozone pollution over East Asia and Southeast Asia. In winter, a high ozone level of 85–95 nmol mol−1 occurs over southern Thailand, and some cities in the PRD region can suffer from an ozone level of over 75 nmol mol−1. In spring in East Asia, the 95th percentile ozone can reach over 95 nmol mol−1 over major city clusters in China and Seoul, and in Southeast Asia the ozone level of over 75 nmol mol−1 occurs in many stations in Thailand and Peninsular Malaysia. In summer, high levels of the 95th percentile ozone appear exclusively over East Asia. Here, there are ozone concentrations of over 115 nmol mol−1 in the North China Plain (NCP); over 105 nmol mol−1 in the Yangtze River Delta (YRD); and over 95 nmol mol−1 in PRD, Sichuan Basin (SCB), Seoul, and Busan. In addition, some cities (e.g., Tokyo, Osaka) in Japan also have ozone levels of over 85 nmol mol−1. In autumn, the high ozone levels only concentrate in the PRD and YRD regions, with a 95th percentile ozone of over 115 nmol mol−1 in PRD and over 95 nmol mol−1 in YRD. However, Borneo Malaysia and Indonesia still record a 95th percentile ozone of lower than 50 nmol mol−1, suggesting the important role of fresh marine air inflow.
3.1.2 Number of days of ozone exceedance
Figure 3 shows that the national ozone air quality standard varies greatly in different countries in East Asia and Southeast Asia. For example, the MDA8 and MDA1 ozone thresholds in China are 160 and 200 µg m−3, respectively, which lie at the high end of the adopted standards. There is a lower standard of MDA8 of 140 µg m−3 in Thailand and of 120 µg m−3 in Vietnam, South Korea, and Singapore. Meanwhile, Laos, Myanmar, and the Philippines adopt a standard consistent with or lower than the WHO guidance. In terms of MDA1, most of the countries adopt a threshold of around 200 µg m−3. As a result, for the sake of health impact assessments, here we adopted the uniform threshold of 60 nmol mol−1 and the WHO guideline to estimate the annual ozone exceedance.
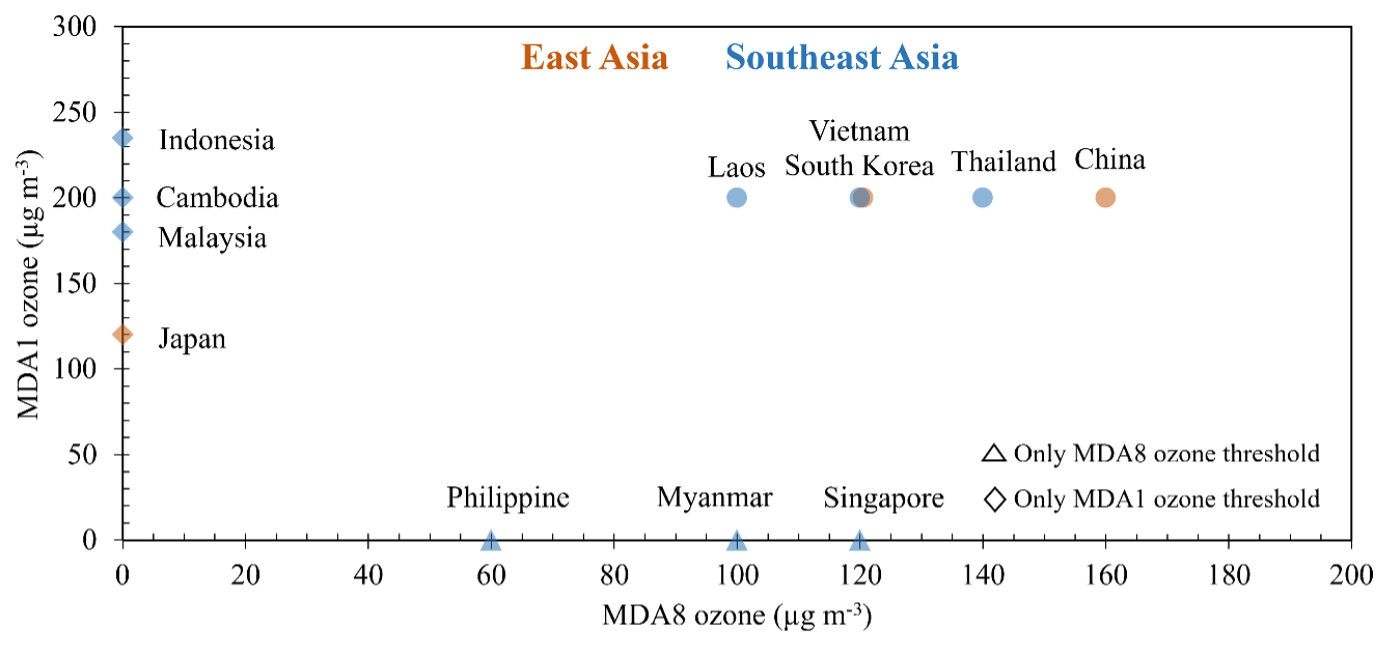
Figure 3The national ambient ozone air quality standard in East Asia and Southeast Asia. The maximum daily 8 h average (MDA8) and/or maximum daily 1 h average (MDA1) ozone thresholds are routinely adopted but vary greatly in different countries. The sources for these thresholds are given in Table S2. Under standard conditions (1013 hPa, 273 K), 1 nmol mol−1 = 2.14 µg m−3.
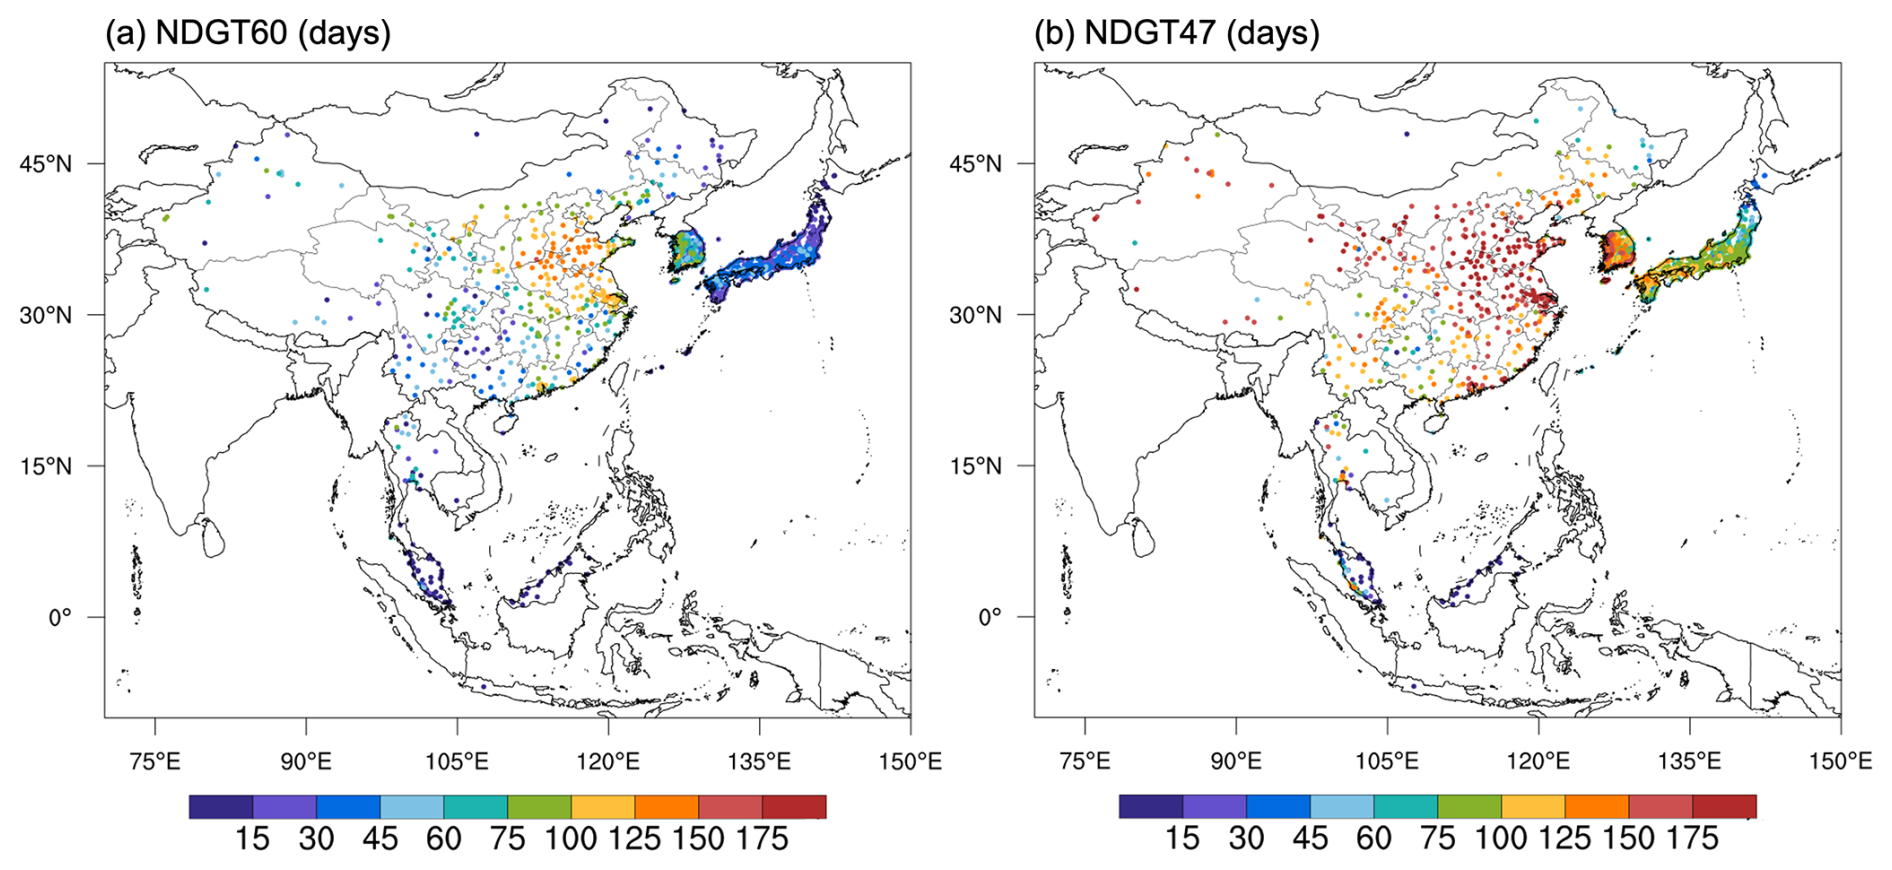
Figure 4Annual number of days with daily MDA8 ozone greater than 60 nmol mol−1 (NDGT60) and greater than the WHO standard of 100 µg m−3 (NDGT47) averaged over 2017–2021. Under standard conditions (1013 hPa, 273 K), 1 nmol mol µg m−3.
Figure 4 shows the annual number of days with an MDA8 ozone concentration greater than 60 nmol mol−1 (NDGT60) and with an MDA8 ozone concentration greater than 47 nmol mol−1 (NDGT47). In terms of NDGT60, most of the NCP cities in China have ozone exceedance of over 125 d, followed by around 100 d in YRD, PRD, and northwestern China. In South Korea, most of the stations experience 60–100 d yr−1 with a daily MDA8 ozone of over 60 nmol mol−1, while in Japan it is almost less than 45 d except for a few cities. In Southeast Asia, NDGT60 is almost less than 75 d, and Malaysia, Cambodia, and Indonesia have an NDGT60 of less than 15 d, which is consistent with the very low 95th percentile ozone (Fig. 2). If the WHO standard is applied, most of the cities in eastern China will have more than 150 d of MDA8 ozone exceedance, and this is also the case for western China. This suggests the pressing challenge to mitigate ozone pollution due to the large-scale high emissions in China. In South Korea, the NDGT47 is over 100 d for most of the stations, which is consistent with the high background ozone issue as reported by Colombi et al. (2023). Ozone exceedance of over 100 d for NDGT47 can be also found in major cities in Japan, Thailand, and Malaysia.
3.1.3 Peak-season ozone levels
In this study, we apply the new WHO standard for peak-season ozone that was introduced in September 2021 to assess the risks of long-term ozone exposure over East Asia and Southeast Asia, which has not been examined in previous studies. Figure 5 shows the estimated peak-season ozone concentration averaged over 2017–2021 and its ratio relative to the WHO standard. In China, the NCP region holds the highest peak-season ozone of over 70 nmol mol−1, which is about 2.5 times the WHO threshold, followed by 65 nmol mol−1 in YRD and 55 nmol mol−1 in PRD, SCB, and some cities in northwestern China. More importantly, the lowest peak-season ozone in China is still higher than the WHO standard, suggesting difficulty in mitigating long-term ozone exposure in China. In South Korea, the peak-season ozone is well above 55 nmol mol−1 and even higher than 60 nmol mol−1, again reflecting the important role of background ozone in South Korea. In Japan, the peak season is mainly in the range of 40 to 55 nmol mol−1, amounting to 1.5–2 times the WHO standard. In Ulaanbaatar of Mongolia, the peak-season ozone is below 20 nmol mol−1. In Southeast Asia, Thailand has the highest peak-season ozone of over 60 nmol mol−1 around Bangkok, and high values of 55–60 nmol mol−1 are also found in northern Thailand and southern coastal Thailand. In Malaysia, Peninsular Malaysia has peak-season ozone of 30–50 nmol mol−1, higher than the WHO standard. However, similar to the low seasonal mean values, Borneo Malaysia, Cambodia, and Indonesia record peak-season ozone lower than the WHO standard. Overall, the estimated peak-season ozone level shows that 98 % of stations in East Asia and Southeast Asia are above the WHO standard and suggests the urgent need to reduce long-term ozone exposure risks.
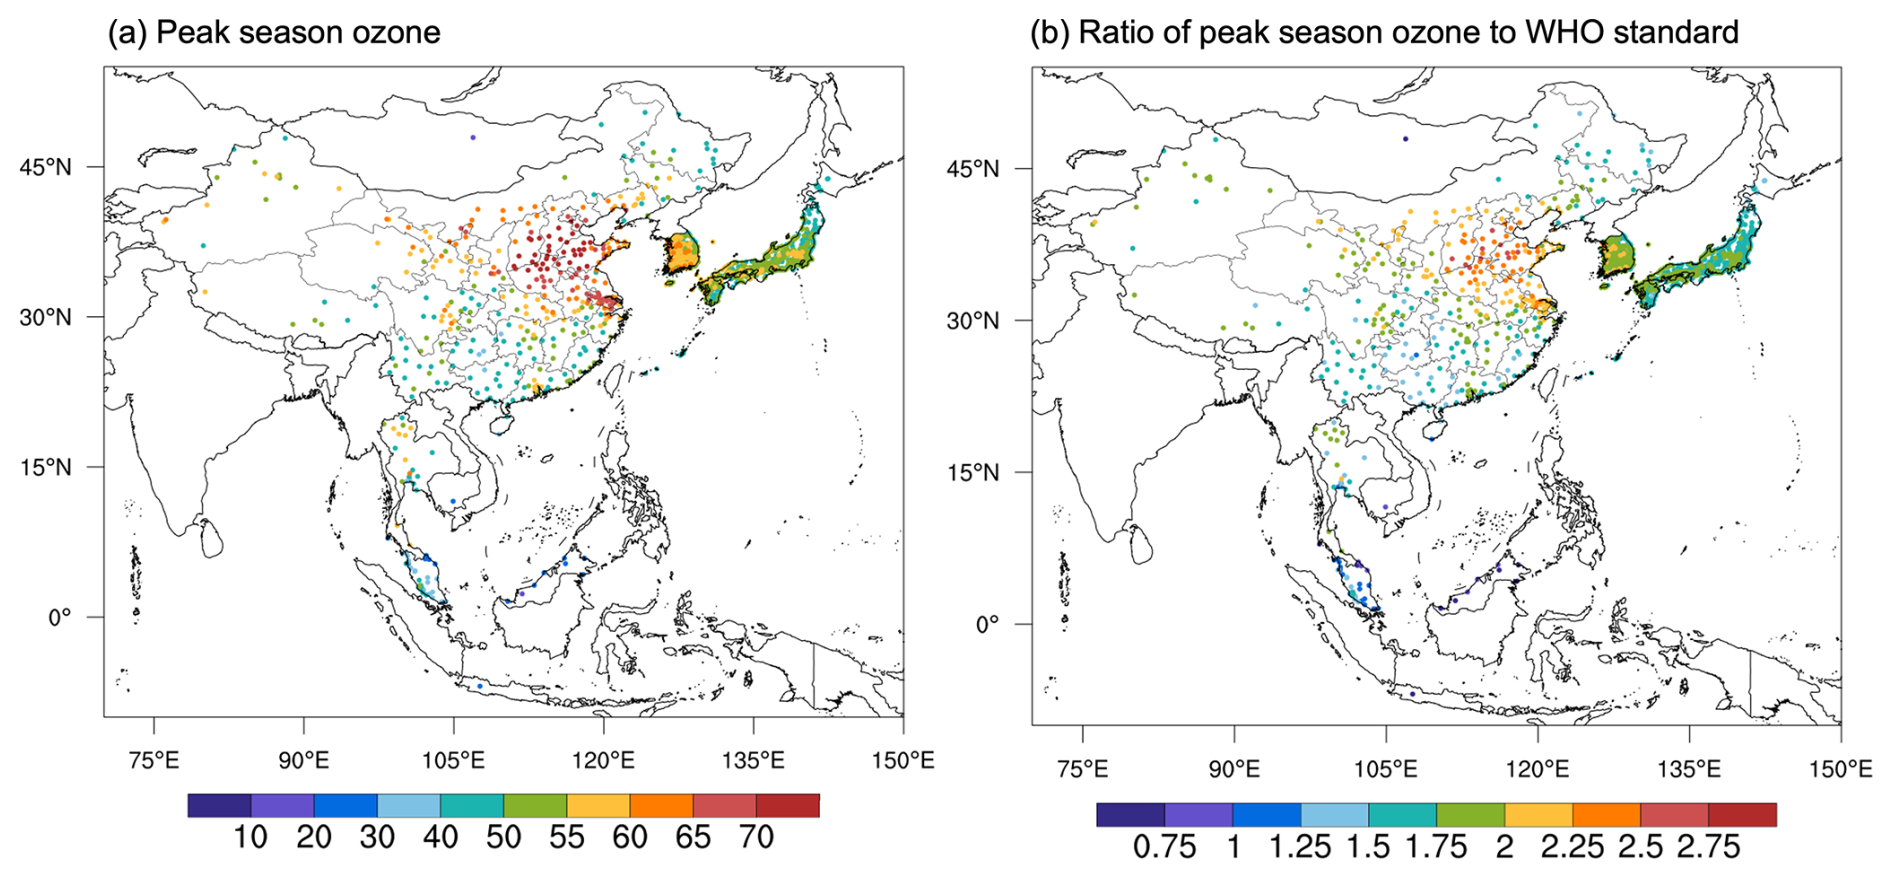
Figure 5Annual mean peak-season ozone (nmol mol−1) averaged over 2017–2021 (a) and the ratio of the observed peak-season ozone to the WHO standard of 60 µg m−3 (b). As introduced by the WHO, the concentration of peak-season ozone is calculated by using the average monthly MDA8 ozone concentration in the 6 consecutive months with the highest 6-month running-average ozone concentration. This new metric represents the long-term ozone exposure.
3.1.4 Ozone climate penalty
In addition to surface ozone distributions, the metric of ozone climate penalty is also very important for understanding ozone levels under a warming climate. Figure 6 shows the observed 50th percentile regression slope between MDA8 ozone and temperature in different seasons averaged over 2017–2021. In East Asia, the locations of a high ozone–temperature slope of 3–5 nmol mol−1 °C−1 in different seasons are consistent with the observed high level of surface ozone. The highest slope of over 5–8 nmol mol−1 °C−1 is found in PRD and the Sichuan Basin in summer. In contrast, a low ozone–temperature slope of less than 1 nmol mol−1 °C−1 across different seasons can be also found in some sites in Japan and the Tibetan Plateau of China, suggesting a minimal role of local ozone photochemical formation in these remote sites. In Southeast Asia, however, we find a widespread high ozone–temperature slope. In Thailand, the ozone–temperature slope of over 3 nmol mol−1 ° C−1 can be found throughout the year except for summer. In Malaysia, a strong slope of 4–8 nmol mol−1 °C−1 persists all year round, consistent with the 10-year analysis in Kuala Lumpur by Ashfold et al. (2024). More importantly, the observed 95th percentile regression shows a notably increased ozone–temperature slope over Southeast Asia (Fig. S2), suggesting a stronger ozone climate penalty under extreme conditions. In contrast, the IPCC AR6 identified only East Asia and India as the hotspot of ozone climate penalty (Zanis et al., 2022). Our observation-based results highlight the strongly underestimated ozone climate penalty over Southeast Asia.
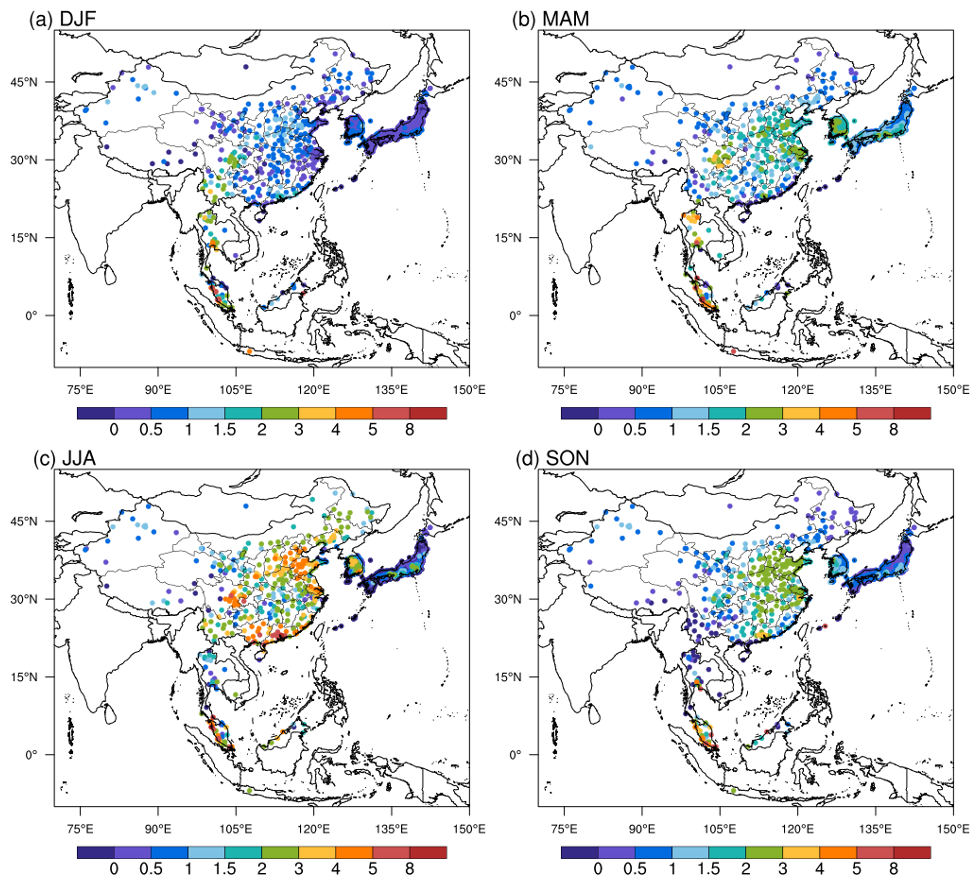
Figure 6The observed 50th percentile regression slope (nmol mol−1 °C−1) between daily surface MDA8 ozone and daily maximum 2 m air temperature in (a) DJF, (b) MAM, (c) JJA, and (d) SON averaged over 2017–2021.
Considering that the meteorological features may be quite different in different latitudes, we conducted an additional analysis on the relationship between ozone and other meteorological features (Figs. S3–S7). The widespread positive (negative) correlation between ozone and temperature (relative humidity) reflects the known conductive condition for ozone photochemistry. However, the synoptic patterns that are important for ozone transport varied greatly at a regional scale. For example, in Fig. S6, summertime southerly winds are conducive to ozone pollution over northern China by transporting ozone precursors and warmer air but would decrease ozone over southern China by carrying cleaner marine inflow. As a result, identifying the key synoptic pattern will also be necessary for understanding local ozone variations under climate change. This also deserves further study of cluster analysis of the ozone origin by transport or by precursors by taking advantage of these considerable ozone data records.
3.2 Surface ozone trends in the past two decades
3.2.1 2005–2021 ozone trends
Figure 7 shows the observed ozone trends in different seasons over the period of 2005–2021. Due to the availability of long-term surface measurements, we only present ozone trends over South Korea, Japan, Thailand, and Malaysia. In South Korea, increasing ozone trends with high certainty are notable across different seasons, ranging from 0.48 nmol mol−1 yr−1 in winter to 0.96 nmol mol−1 yr−1 in summer. In Japan, observed ozone shows a decreasing tendency from 2005 to 2021 in summer but an extensive ozone increase of 0.28 nmol mol−1 yr−1 in wintertime. In Thailand, there is an overall increasing trend in surface ozone but with spatial heterogeneity during 2005–2021. Specifically, a significant ozone increase mainly occurs over northern Thailand and southern coastal Thailand, while an ozone increase around Bangkok is much smaller or insignificant. In Malaysia, there is a wintertime ozone increase of 0.2 nmol mol−1 yr−1, particularly in three sites in Peninsular Malaysia and in five sites in Borneo Malaysia, while in other seasons the observed ozone trends during 2005–2021 are small and statistically insignificant. The estimated increasing tendency in surface ozone since 2005 is in agreement with Kim et al. (2023) for the 2001–2021 ozone increase in South Korea and with Wang et al. (2022) for the 2005–2016 ozone increase in Southeast Asia.
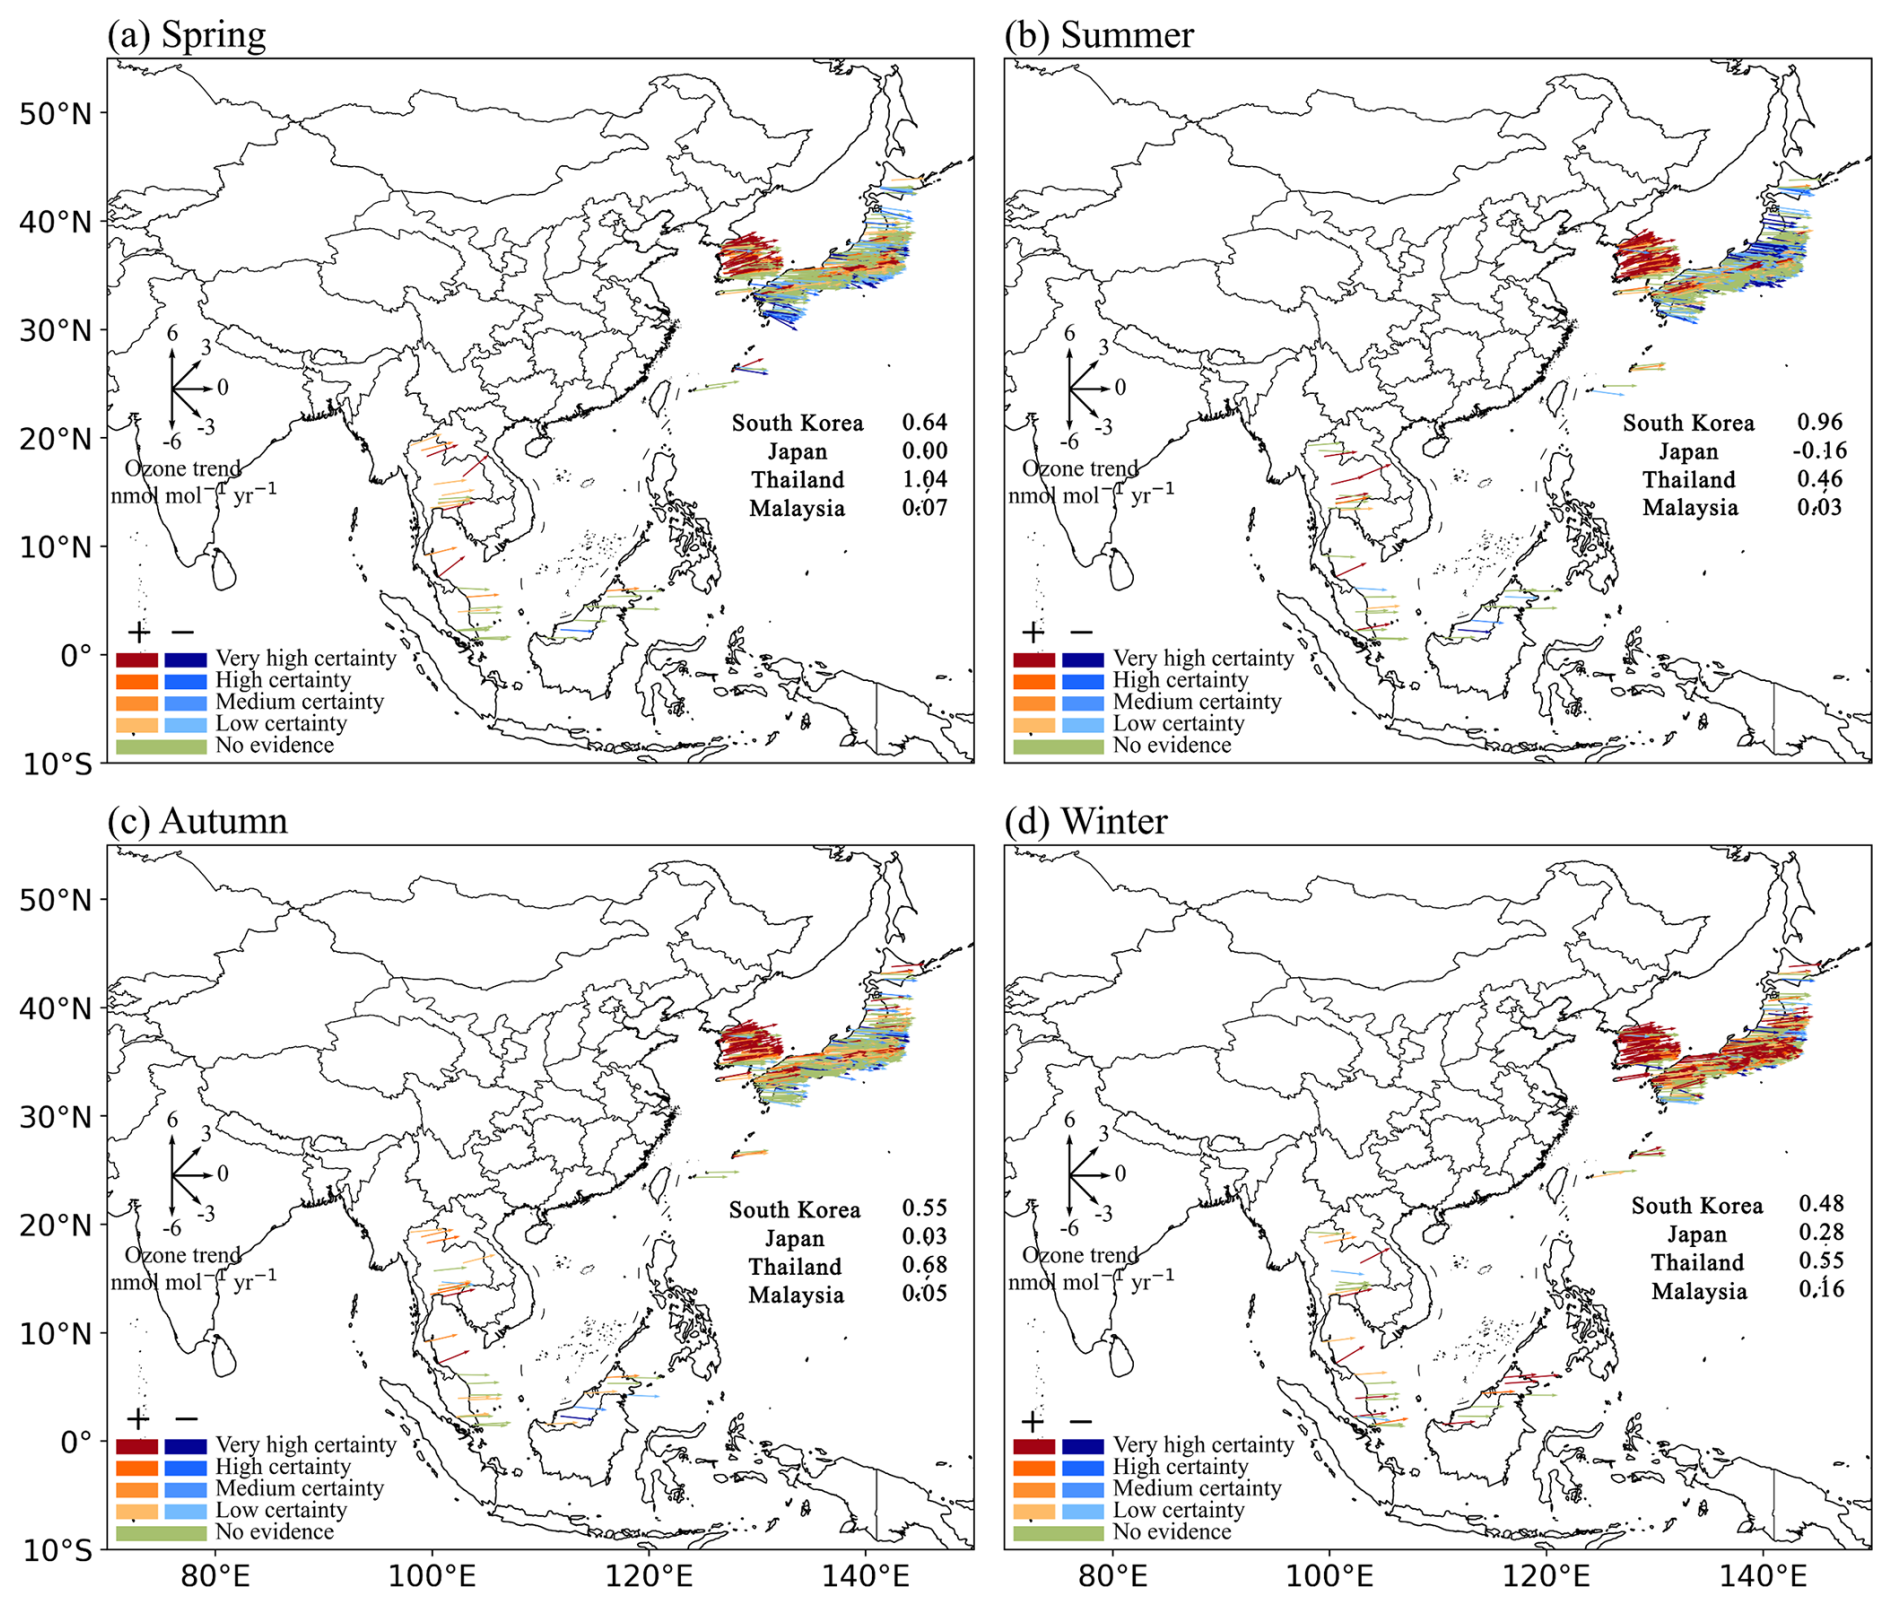
Figure 7The observed 2005–2021 ozone trends (nmol mol−1 yr−1) during (a) spring, (b) summer, (c) autumn, and (d) winter over East Asia and Southeast Asia. Here, it only includes ozone measurements from Malaysia (19 sites), Japan (946 sites), South Korea (226 sites), and Thailand (13 sites). National surface ozone data in China are not available before 2013 and are therefore not shown in this figure. To follow the trend reliability scale recommended by TOAR II, here we use “very high certainty” to denote p≤0.01, “high certainty” to denote 0.05 ≥ p>0.01, and “medium certainty” to denote ; positive trends are in red, and negative trends are in blue.
Due to the lack of national network measurements before 2013 in China, we also compiled 11 individual ozone measurements (eight background/rural sites and three urban sites) that are available from around 2005 (see “Data and methods”). Figure 8 and Table S1 in the Supplement show the estimated seasonal ozone trends in these 11 stations by using the metrics of the MDA8 ozone and 24 h mean ozone. Mt. Waliguan, a global baseline station of the World Meteorological Organization/Global Atmosphere Watch (Xu et al., 2020), shows a statistically significant ozone increase of 0.56 nmol mol−1 yr−1 in spring. However, at the multiple regional background stations located on the western boundary (Xianggelila, Akedala) and the eastern boundary of China (Lin'an, Longfengshan), there is no such consistent ozone increase but instead large variability across different seasons, suggesting the important role of regional emission change and climate variability (Zhang et al., 2023; Ye et al., 2024). In NCP, one of the regions with the highest present-day ozone level, the observed ozone after 2005 at the regional background sites (Shangdianzi, Mt. Tai) and the rural site (Gucheng) experienced a consistently increasing trend in the spring and summer seasons. In Shangdianzi, the MDA8 ozone trend during 2005–2019 is 0.85 nmol mol−1 yr−1 (p<0.1) in spring and 0.73 nmol mol−1 yr−1 (p=0.12) in summer. The similar seasonal trends are also shown in Gucheng (a rural site close to Shangdianzi) and Mt. Tai (located in the center of NCP). It is noted that summer ozone trends in Mt. Tai during 2005–2019 also have strong intraseasonal variability, with a much faster ozone increase in July and August (Sun et al., 2016). In addition to the background/rural sites, urban sites in YRD (Xujiahui) and PRD (Guangzhou, Hong Kong) record the urban ozone increase after 2005 that has been attributed to anthropogenic emissions and circulation patterns in previous studies (Wang et al., 2019; Gu et al., 2020; Cao et al., 2024).
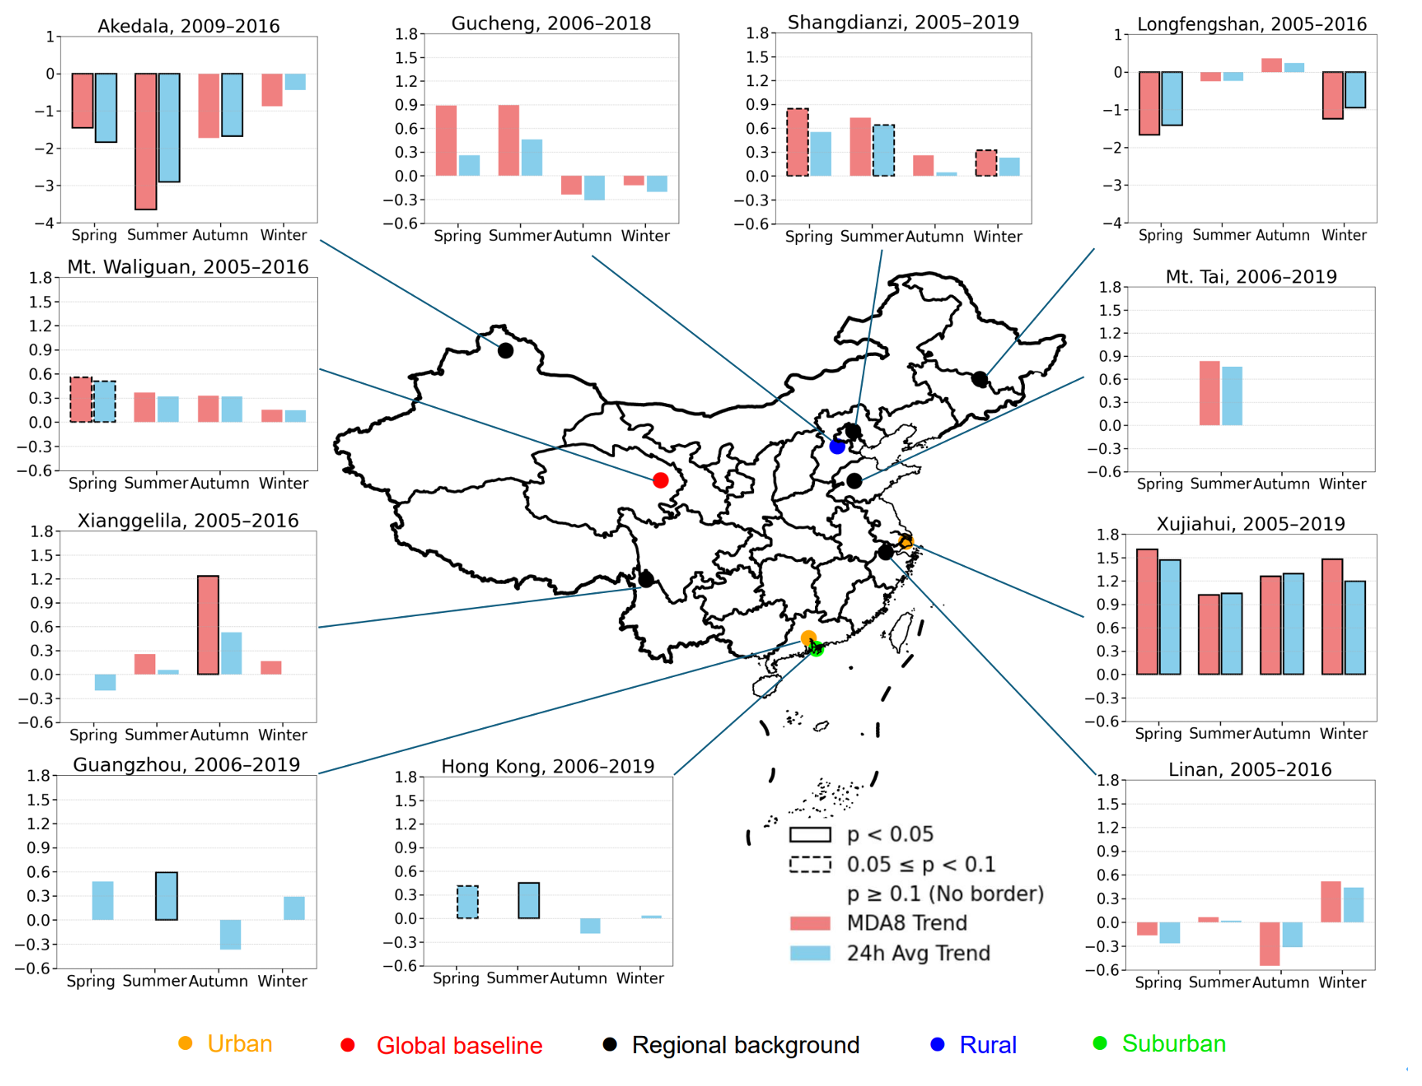
Figure 8The observed long-term ozone trends (nmol mol−1 yr−1) after 2005 in 11 measurement sites over China. There was a total of one global baseline station, five regional background stations, one rural station, one suburban station, and two urban stations. Due to data availability, we use the MDA8 ozone and/or 24 h mean ozone in the calculation of ozone trends. The p value for estimated ozone trends is also highlighted by rectangles.
3.2.2 2013–2021 ozone trends
Figure 9 shows the observed ozone trends in different seasons over the period of 2013–2021. Here we include ozone trends over China, Mongolia, Japan, South Korea, Malaysia, and Thailand. In China, there is a widespread ozone increase throughout the year, with a mean ozone increase of 1.0–1.2 nmol mol−1 yr−1 in different seasons, which is only half of the ozone increase during 2013–2019 in China (Lu et al., 2020; Li et al., 2020). Spatially, the ozone increase mainly occurs in northern and western China. Seasonally, there is a fast ozone increase in winter over the NCP region, suggesting the urgency of wintertime ozone regulation (Li et al., 2021). In South Korea, the 2005–2021 ozone rise is strongly mitigated during 2013–2021 when the summer ozone trend is only 0.45 nmol mol−1 yr−1. In Mongolia, there is a notable spring ozone increase but with low certainty. In Southeast Asia, however, the observed ozone in Malaysia and Thailand shows a decreasing tendency in most of the sites, which is contrary to the overall ozone increase from 2005 to 2021. Overall, except for the rapid ozone increase over China in the past decade, there is a leveling off or decrease in the surface ozone trend over other countries in the meantime.
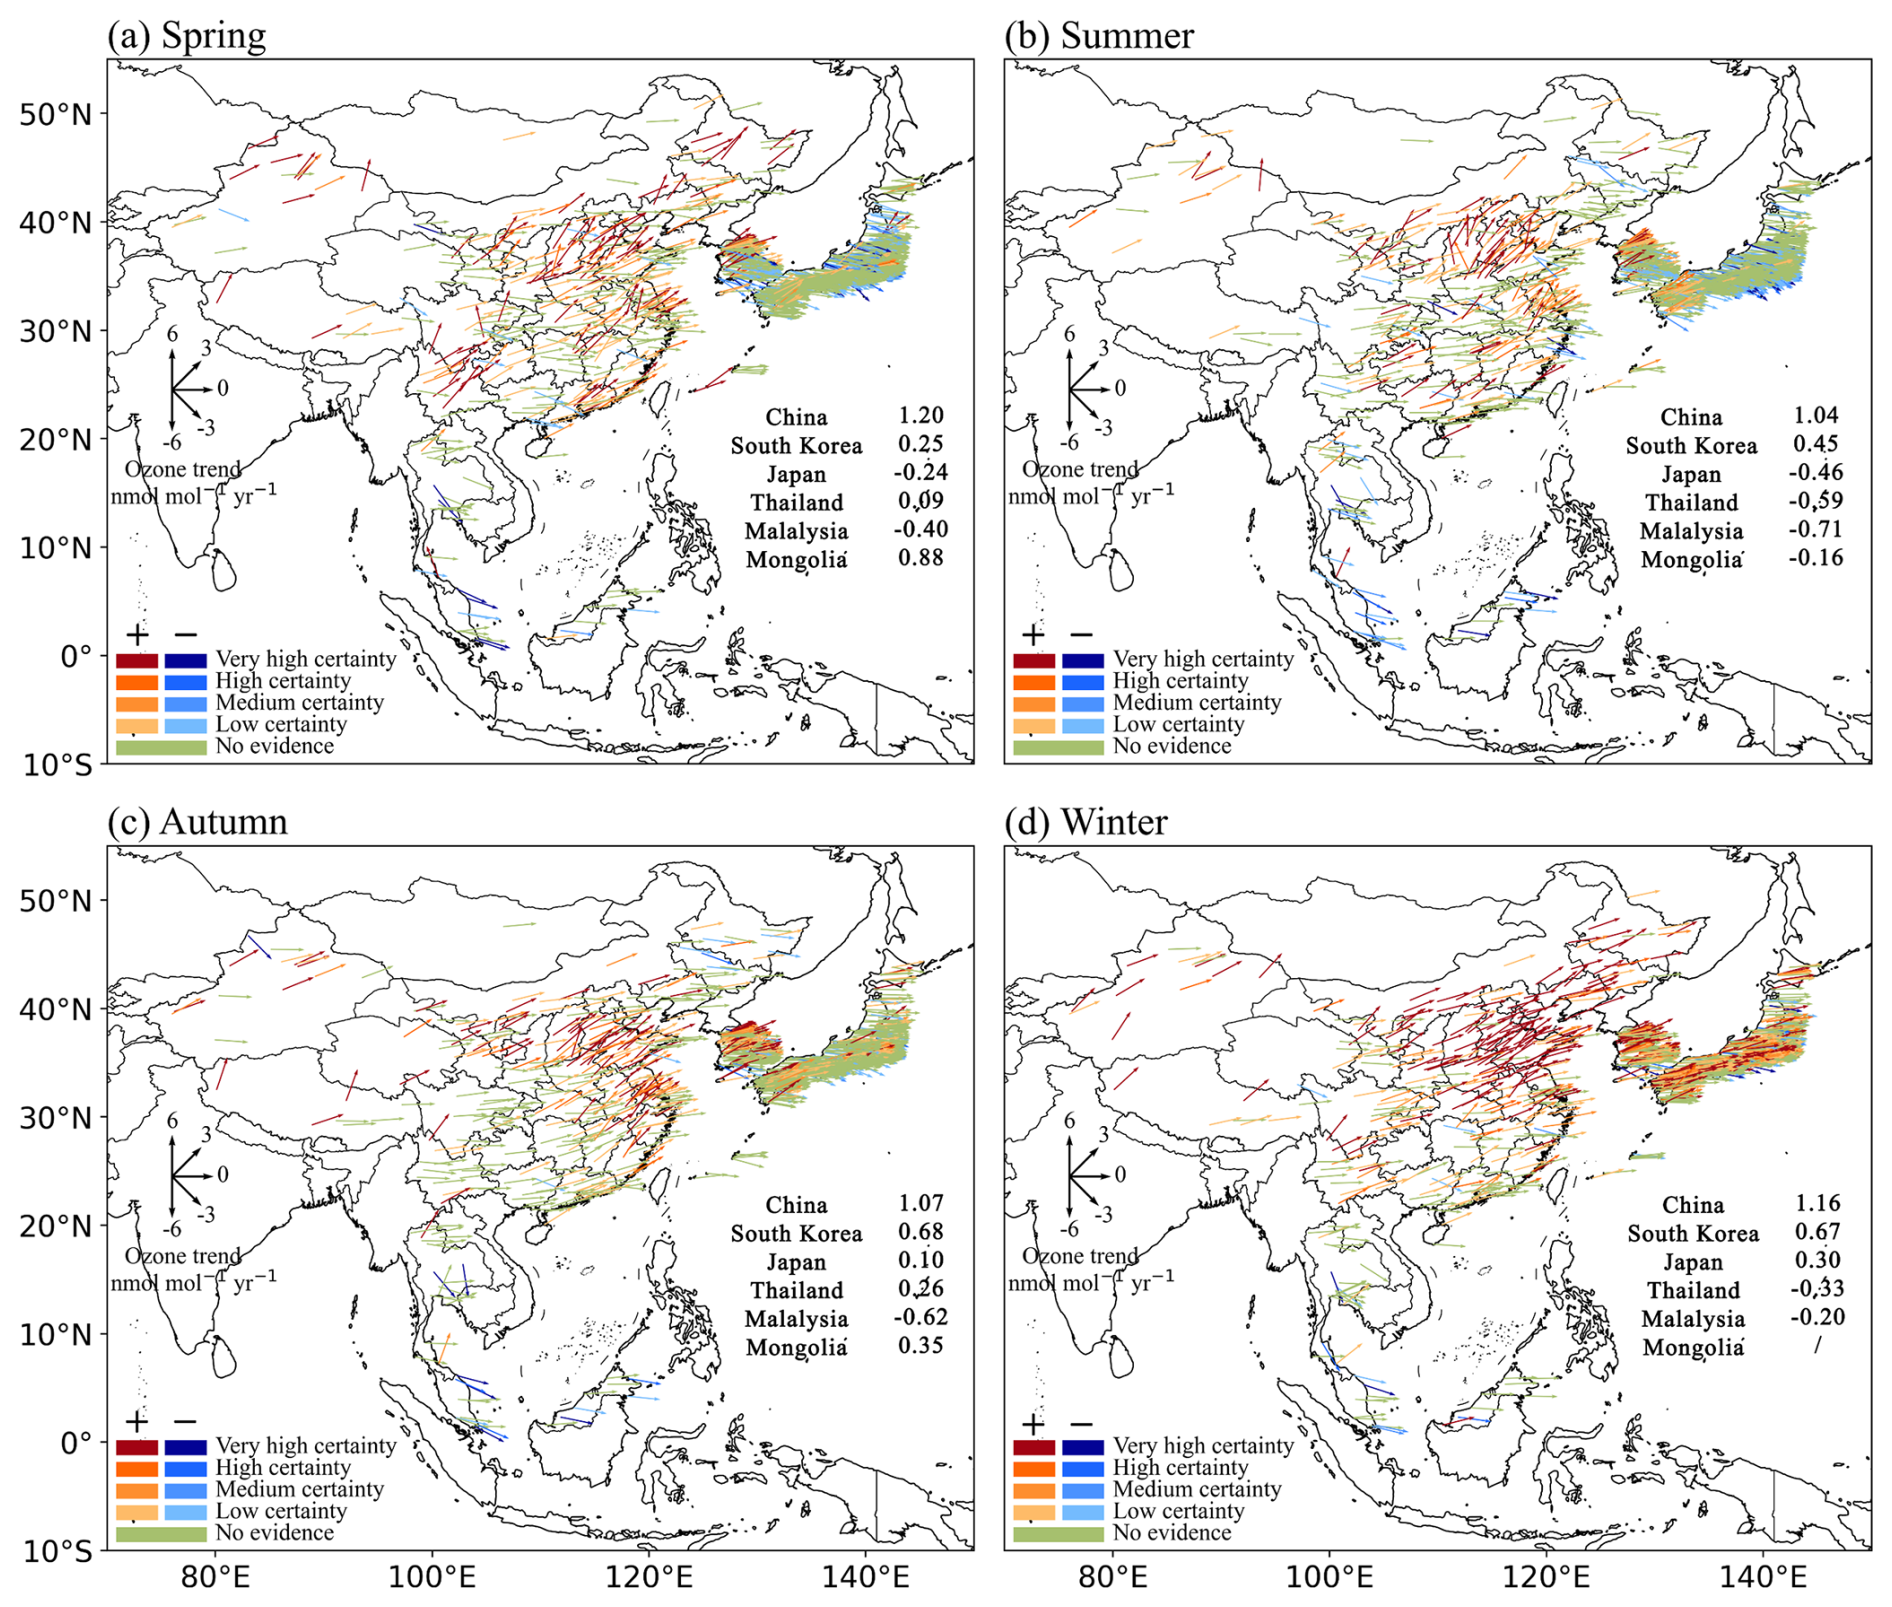
Figure 9Same as for Fig. 7 but for the observed 2013–2021 ozone trends (nmol mol−1 yr−1) over East Asia and Southeast Asia. Here, it includes ozone measurements from China (335 sites), Malaysia (19 sites), Mongolia (one site), Japan (1130 sites), South Korea (270 sites), and Thailand (22 sites). To follow the trend reliability scale recommended by TOAR II, here we use “very high certainty” to denote p≤0.01, “high certainty” to denote , and “medium certainty” to denote ; positive trends are in red, and negative trends are in blue.
To further examine the long-term ozone variability, we also show the time series of observed national MDA8 ozone concentrations during warm seasons from 2005 to 2021 in Fig. 10. In South Korea, there is a flat trend in ozone during 2017–2021 after a sustained ozone increase since 2005, and there is no clear trend in warm-season ozone in Japan due to the limited data availability. In Southeast Asia, after 2013, surface ozone in Malaysia starts to decline and the ozone trend in Thailand levels off. This is also demonstrated in the warm-season ozone trend in Fig. S8. In addition, we also find the large interannual variability in observed ozone concentration that deserves further investigation. For example, in 2017, there is a strong surface ozone enhancement relative to 2016 in China, Japan, and South Korea, while surface ozone consistently decreased in Mongolia, Thailand, and Malaysia. Previous studies have linked the changes in large-scale circulations to these extensive ozone anomalies (e.g., Yin et al., 2019, 2024; Jiang et al., 2021).
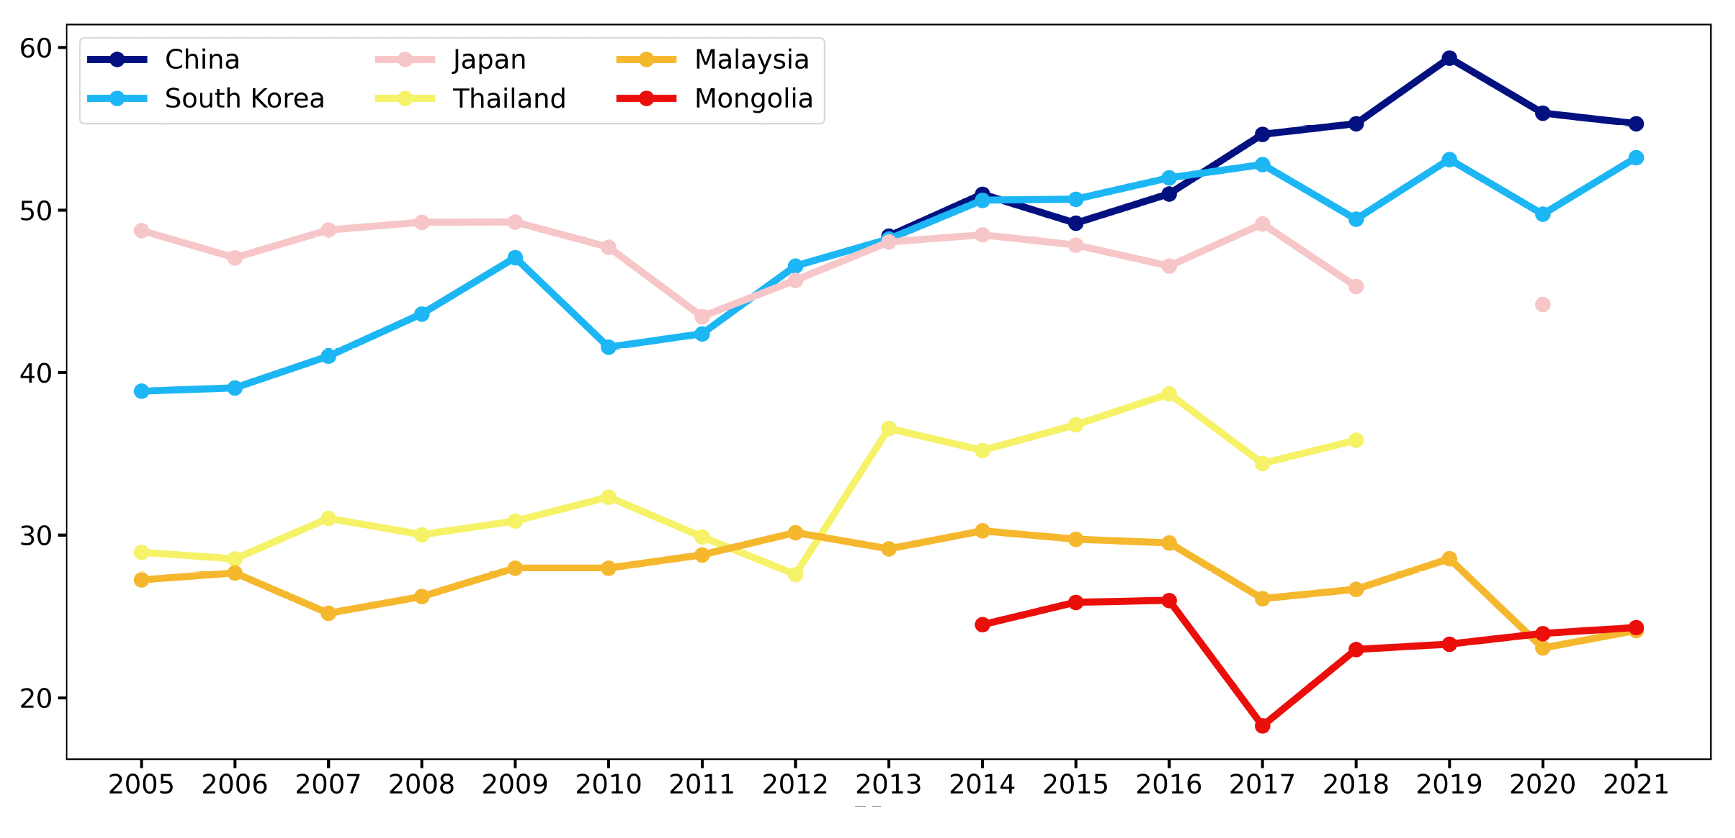
Figure 10The observed national mean MDA8 ozone (nmol mol−1) during warm seasons (April to September) from 2005 to 2021 in East Asia and Southeast Asia.
4.1 Three-dimensional distribution of present-day tropospheric ozone
First, we compared the climatological mean vertical ozone profile (from the surface to 10 km altitude) using the ozonesonde data (Fig. 11). The Beijing site in China shows the highest and the Kuala Lumpur site in Malaysia shows the lowest ozone mean values through the troposphere. In general, the ozone values in East Asia (Beijing in China, Pohang in South Korea, and Tsukuba in Japan) are higher than those in Southeast Asia (Kuala Lumpur in Malaysia and Watukosek in Indonesia). This pattern is also found when we compared average ozone values at 1, 3, 5, and 7 km altitudes (Fig. 12). While some sites show the higher ozone values in the boundary layer (e.g., Watukosek), generally free tropospheric (above 1–2 km height) ozone values are higher. In particular, the Beijing, Pohang, Sapporo, and Tsukuba sites show a large enhancement of ozone above 8 km altitude (Fig. 12a), implying that the stratospheric ozone is strongly intruding into the troposphere. In fact, the ozone values in these four sites are highest at 3, 5, and 7 km altitudes, indicating the effect of stratospheric ozone on the enhancement of the upper tropospheric ozone. These four sites are located over Japan and the Korean Peninsula (Fig. 11) where the sudden increase in ozone usually occurs below the tropopause (Park et al., 2012).
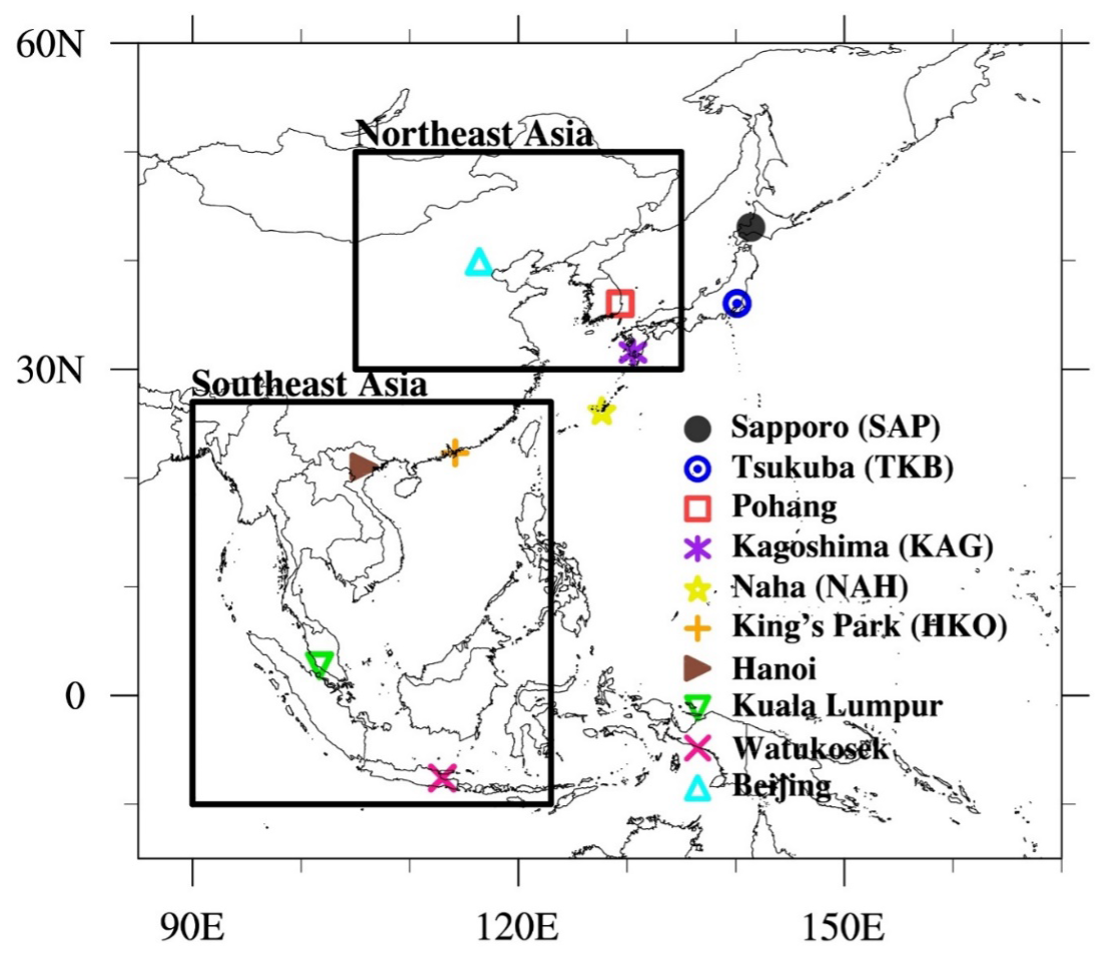
Figure 11Map showing the location of the ozonesonde sites (symbols) and the coverage of the IAGOS measurements (black boxes) considered in this study.
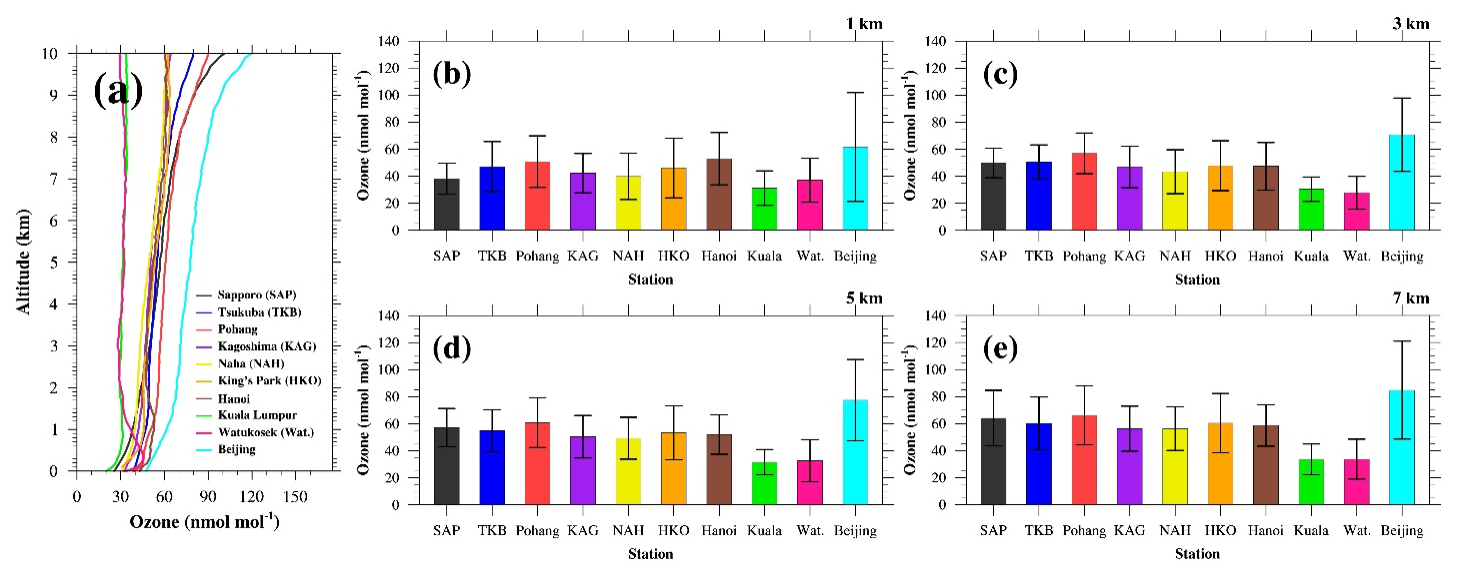
Figure 12(a) Climatological mean vertical ozone profiles of 10 ozonesonde sites in the troposphere (from 0 to 10 km altitude) are compared. Also, the mean ozone mixing ratio values of 10 ozonesonde sites at (b) 1 km, (c) 3 km, (d) 5 km, and (e) 7 km altitude are compared. The error bar shows the 1σ standard deviation range.
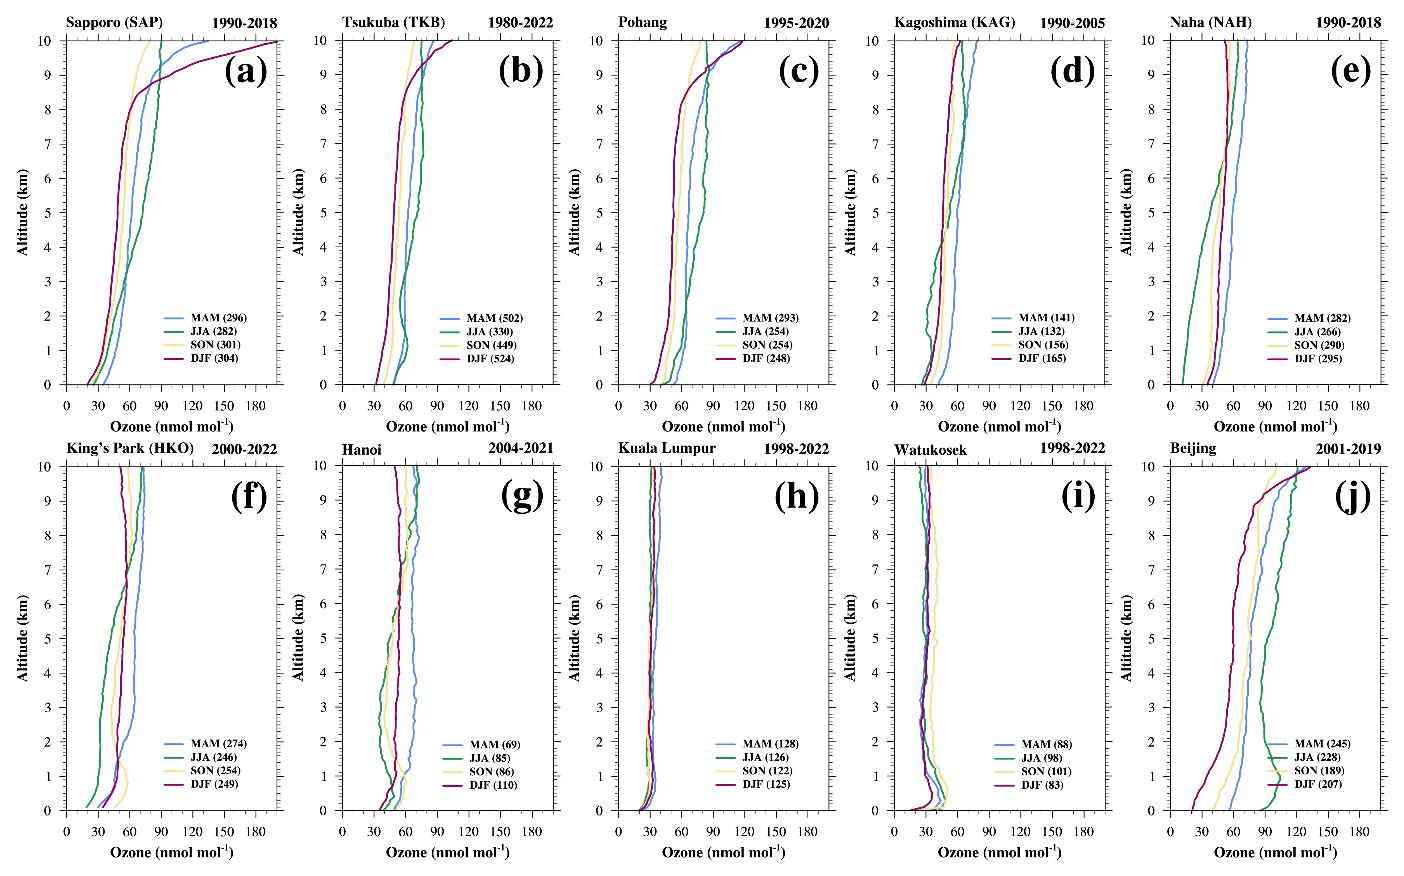
Figure 13Seasonal mean vertical ozone profiles at the (a) Sapporo, (b) Tsukuba, (c) Pohang, (d) Kagoshima, (e) Naha, (f) King's Park, (g) Hanoi, (h) Kuala Lumpur, (i) Watukosek, and (j) Beijing sites: March–April–May (MAM, blue), June–July–August (JJA, green), September–October–November (SON, orange), and December–January–February (DJF, red). The number in the parentheses of each panel indicates the number of data used for each season.
The seasonal pattern of the vertical ozone profile was continually investigated (Fig. 13). The tropospheric ozone values at the Beijing, Pohang, Sapporo, and Tsukuba sites, where strong stratospheric ozone intrusion occurs, are generally high in spring (MAM) and summer (JJA). This pattern can be explained by the frequent intrusion of stratospheric ozone in spring (Park et al., 2012) and strong photochemical ozone production that is typically characteristic of summer. In several sites (e.g., Beijing and Tsukuba), photochemical ozone production in summer makes the boundary layer ozone much higher than free tropospheric ozone. Stratospheric ozone intrusion in these four sites also looks strong in winter but does not result in high ozone in the boundary layer due to weak photochemistry in winter. However, boundary layer ozone values at Kagoshima (Japan), Naha (Japan), King's Park (Hong Kong), and Hanoi (Vietnam) that are located below 30° N are lowest in summer. Considering that these sites are easily affected by the inflow of a maritime air mass under the trade wind influence, this low summertime ozone can be explained by the transport of a humid and ozone-poor air mass from the ocean due to the monsoon system (Zhao and Wang, 2017; Jiang et al., 2021). Sites in the equatorial region (i.e., Kuala Lumpur and Watukosek) do not have a large seasonal difference in tropospheric ozone.
We repeated the same analysis using the IAGOS data (Fig. 14). The IAGOS ozone profiles over Northeast Asia also reveal the highest tropospheric ozone in summer (June) and the lowest in winter (December). We can also see a large enhancement of summertime ozone in the boundary layer associated with strong photochemistry and high ozone in winter (DJF) and spring (MAM) above 8 km altitude, implying the intrusion effect of stratospheric ozone. The monthly variation of ozone at multiple heights (Fig. 13b) illustrates a sharp drop in ozone from June to July, depicting the wash-out effect due to the rainy season, called Jangma (South Korea) or Maiyu (China). Overall, the ozone profile pattern in Northeast Asia from long-term aircraft monitoring is similar to the findings based on ozonesonde measurements. Among them, we would highlight the fact that the sites showing high tropospheric ozone (e.g., Beijing in China, Pohang in South Korea, Sapporo in Japan), which are located in Northeast Asia and latitudes higher than 35° N (Table S3), relate to the strong intrusion of stratospheric ozone. Considering recent studies addressing background ozone in Northeast Asia being unexpectedly high (Lee and Park, 2022; Colombi et al., 2023), we need to put more weight on the study of the contribution of stratospheric air masses to the Northeast Asian background ozone.
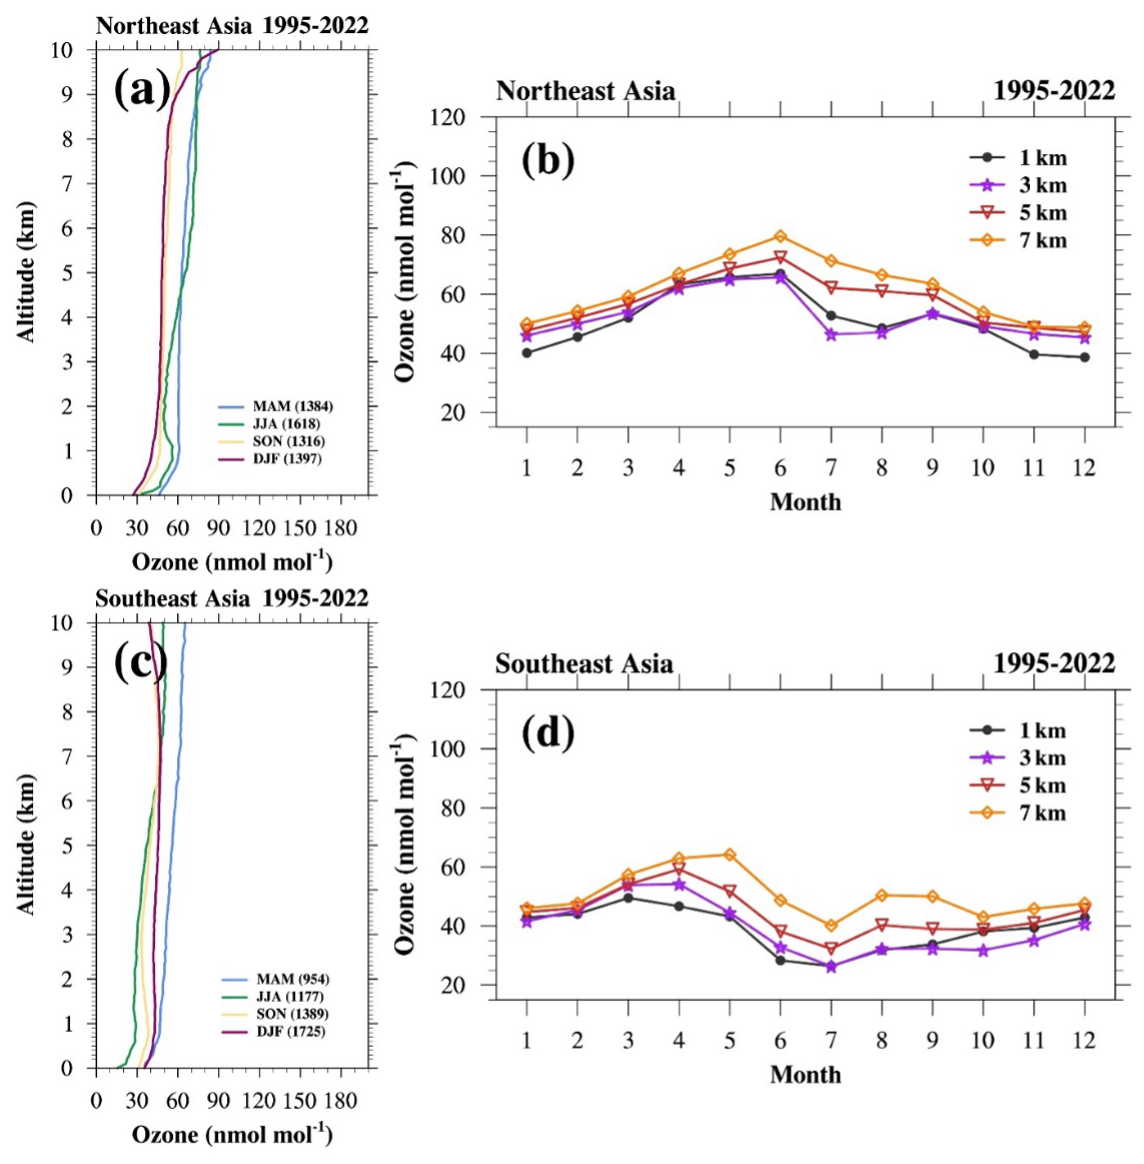
Figure 14Analysis of the IAGOS measurements: (a) seasonal mean vertical ozone profiles in Northeast Asia during March–April–May (MAM, blue), June–July–August (JJA, green), September–October–November (SON, orange), and December–January–February (DJF, red); and (b) monthly mean ozone variation of 1 km (black), 3 km (purple), 5 km (red), and 7 km (orange) altitudes in Northeast Asia. (c) The same seasonal mean vertical ozone profiles but in Southeast Asia and (d) the same monthly mean ozone variation but in Southeast Asia. The number in the parentheses in panels (a) and (c) indicates the number of data used for each season.
We also added analyzed results using the IAGOS measurements in Southeast Asia (Fig. 14). These are similar in that ozone in spring (MAM) is the highest. However, ozone in winter (DJF) is not the lowest – ozone in summer (JJA) is the lowest in Southeast Asia, probably due to the relatively stronger precipitation in summer and warmer temperature in winter compared to the atmospheric conditions in Northeast Asia. Similar to the case in Northeast Asia mentioned above, some previous studies have reported cases of tropospheric ozone enhancement in southern China being affected by the influence of typhoons (Zhan and Xie, 2022; Li et al., 2023a), which are typically explained based on the stratospheric ozone intrusion driven by the deep convection (Chen et al., 2022). However, while those reported cases look significant, our results in sites typically affected by typhoons (e.g., Naha, King's Park) reveal that this may not contribute to a significant increase in summertime mean tropospheric ozone.
As stated in Sect. 2.2, there are additional ozonesonde sites in East Asia, but these sites do not have long-term measurements. While we cannot provide the long-term trend values for these sites, at least the seasonal mean pattern can be suggested in spite of the short history of measurements. For this purpose, we added one more result showing the seasonal mean pattern of the ozone vertical profile at an additional six sites not having ozonesonde measurements for a continuous 10 years (Fig. S9): five sites in South Korea (Yongin, Osan, Seosan, Anmyeon, and Cheju) and one site in Taiwan (Taipei), obtained from the experiment team (Kang et al., 2024) or from the WOUDC data archive. Owing to its short-term nature, we cannot generalize this result as the typical seasonal average. However, it seems that this information will be a good reference when the vertical ozone distribution is needed in further studies on East Asian tropospheric ozone.
4.2 Altitudinal long-term trends of tropospheric ozone
In addition to the spatial distribution of tropospheric ozone, we investigated the long-term trend of ozone values in a vertical scale using the ozonesonde measurements. We confirmed the time series analysis at each altitude (Fig. S10) and performed the quantile regression. Finally, we estimated the long-term ozone trend in the troposphere (from the surface to 10 km altitude) per 100 m vertical interval with the certainty information (using the median and p value). These results are shown in Fig. 15.
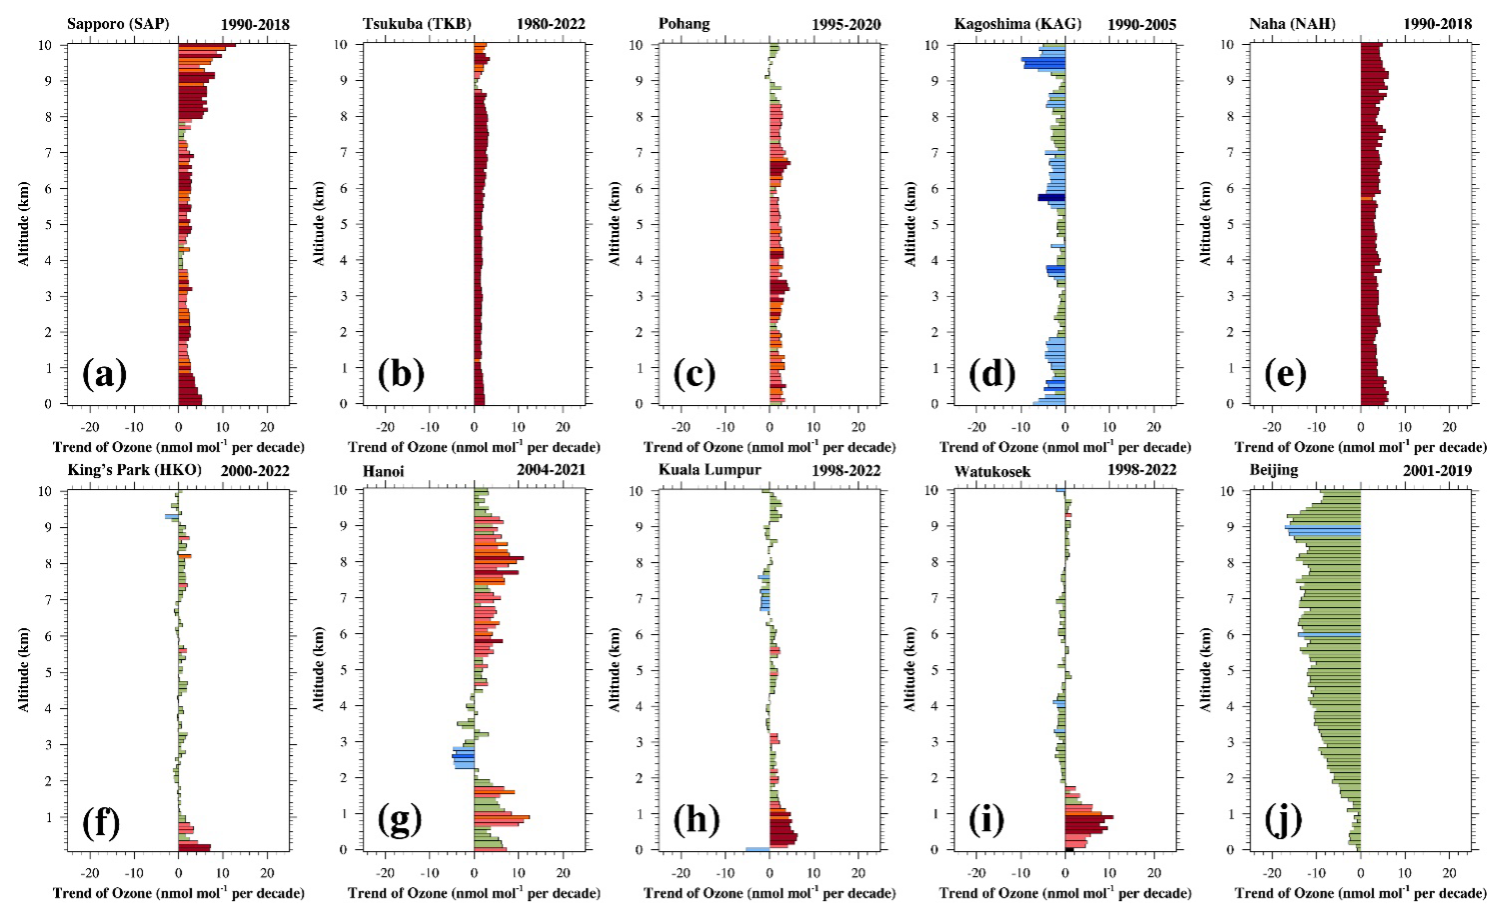
Figure 15Long-term trends of annual median ozone per 100 m range from 0 to 10 km altitude at the (a) Sapporo, (b) Tsukuba, (c) Pohang, (d) Kagoshima, (e) Naha, (f) King's Park, (g) Hanoi, (h) Kuala Lumpur, (i) Watukosek, and (j) Beijing sites. The dark-red color means positive trend values with p≤0.05 (high certainty), the orange color means positive trend values with 0.10 (medium certainty), the light-orange color means positive trend values with (low certainty), the light-olive-green color means positive/negative trend values with p>0.33 (no evidence), the light-blue color means negative trend values with (low certainty), the median-blue color means negative trend values with (medium certainty), and the dark-blue color means negative trend values with p≤0.05 (high certainty).
At first, we can see an increasing trend in tropospheric ozone in most East Asian sites that we examined, based on the annual median value. Increasing trends of ozone values at Sapporo, Tsukuba, and Naha have a high certainty through the whole troposphere (Fig. 15a, b, and e), and those at Pohang also look to have a partially high certainty. The ozone at Hanoi mostly shows increasing trends but with a low certainty. The ozone values in King's Park, Kuala Lumpur, and Watukosek are only increasing in the boundary layer (below ∼ 2–3 km) but reveal almost no evident long-term trend in the free troposphere. The Kagoshima and Beijing sites are totally the opposite, with decreasing trends through the whole troposphere. The ozone decrease at Kagoshima mostly looks to have a low certainty, but at Beijing this does not look clearly evident. In brief, we can classify three types of long-term trends in tropospheric ozone in East Asia: (1) an increase through the whole troposphere, (2) an increase in only the boundary layer and no evident trend in the free troposphere, and (3) a decrease through the whole troposphere.
We also examined trends using the seasonal mean ozone values: spring (MAM) in Fig. S11, summer (JJA) in Fig. S12, autumn (SON) in Fig. S13, and winter (DJF) in Fig. S14. The ozone increase in the Sapporo, Tsukuba, and Naha regions, showing increasing trends in annual median ozone with high certainty, is also a high certainty in summer but less of a certainty in other seasons. The ozone trends at Pohang are seasonally different: an increase in summer and autumn (Figs. S12c and S13c) but a decrease in the wintertime upper troposphere (Fig. S14c). The ozone trends at Hanoi are generally increasing in terms of annual median value, but these almost become not evident in the seasonal analysis. The ozone values in King's Park, Kuala Lumpur, and Watukosek, similar to the annual median analysis, are increasing, with medium certainty in the boundary layer, particularly in spring and summer. In other seasons, however, the ozone trends at Hanoi are not evident.
Ozone trends at Kagoshima and Beijing are different from other sites, as shown in the annual median analysis in Fig. 15. They are also decreasing consistently in whole seasons. These decreasing trends at Kagoshima and Beijing are not usually accompanied by high certainty, but decreasing trends at Kagoshima in spring are highly certain (Fig. S11d). Although trend values are not largely evident, a tropospheric ozone decrease at Beijing is quite consistent in all seasons. Zhang et al. (2021) also analyzed the variation of ozonesonde measurements at Beijing, and it looks like the stratospheric ozone intrusion is strong from 2006 to 2012 but not in other years, which may be related to the ozone trend at Beijing. At this present moment, these decreasing trends were not well explained through our knowledge. Nonetheless, we report these trends because this can be motivation for further research.
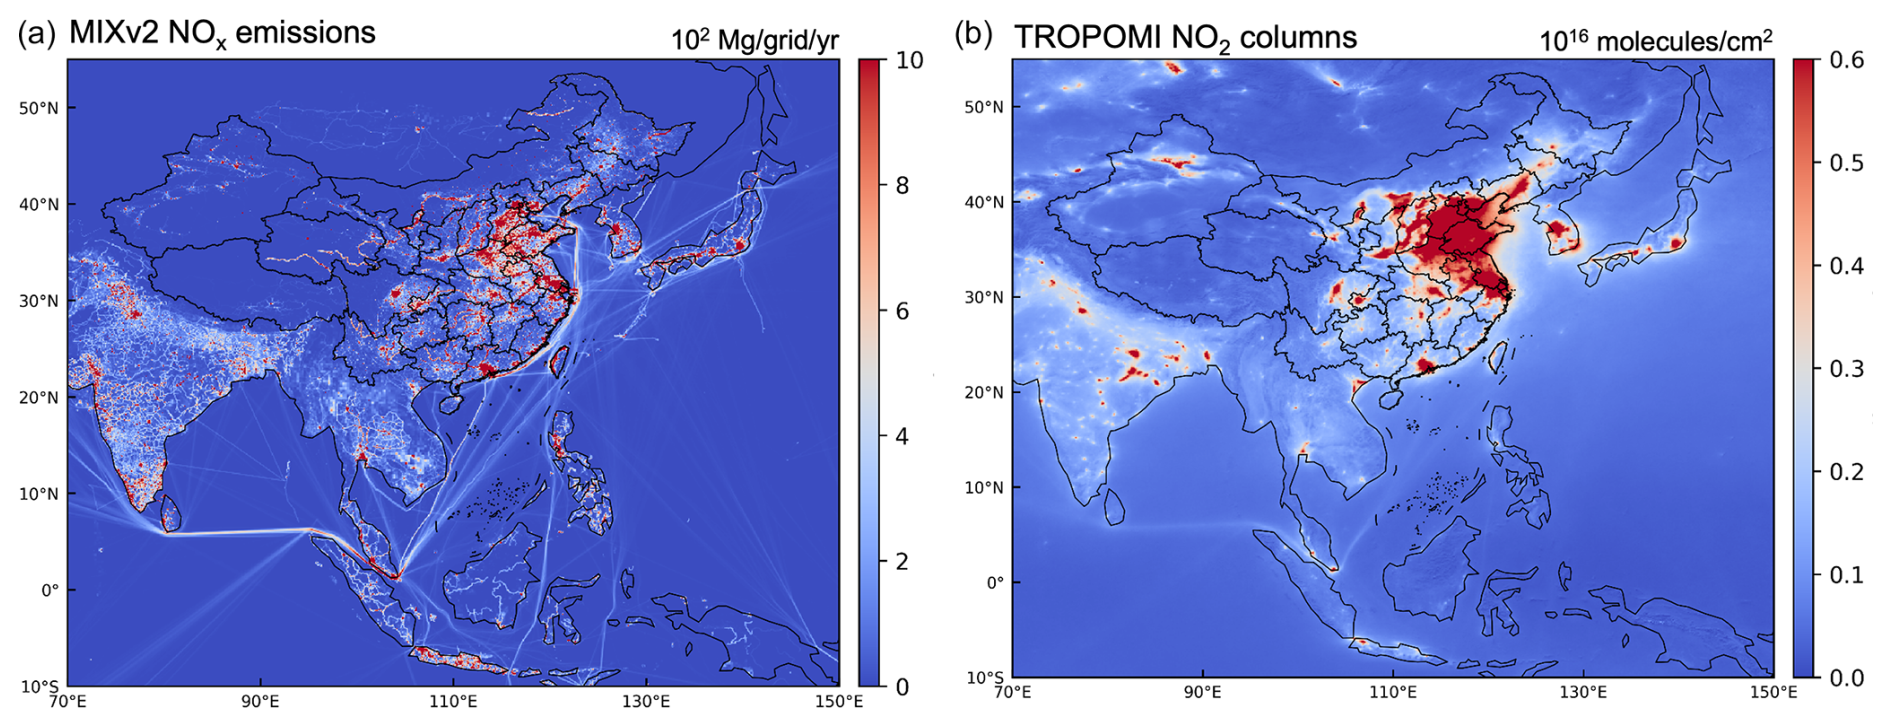
Figure 16The spatial distribution of bottom-up NOx emissions from the MIXv2 inventory (a) and the TROPOMI-satellite-derived NO2 columns (b). Due to data availability, emission data for the year 2017 and satellite data for the year 2019 are used to represent the present-day level (2017–2021).
Finally, we estimated the long-term trend of tropospheric ozone in East Asia using the IAGOS aircraft measurements: Northeast and Southeast Asia (separately) and analyses based on the annual and seasonal median pattern (Figs. S15 and S16). Data are available from 1995 to 2022; therefore the recent situation of this decade (i.e., the outbreak of Coronavirus disease 2019) probably affects the trend result. In spite of this condition, generally we can see increasing trends of tropospheric ozone in East Asia, consistent with previous reports (Wang et al., 2019; Lee et al., 2021; Li et al., 2023b). Compared to trends in Northeast Asia, it seems that the increasing trend in Southeast Asia looks more evident. In particular, the ozone trends in Southeast Asia consistently show high certainty from the surface to ∼ 8 km (Fig. S16). In contrast to the continuous ozone increase in Northeast Asia, however, it seems that the ozone increase in Southeast Asia has become weaker recently (Fig. S17), requiring us to keep our eyes constantly on the future. The seasonal median trends are usually similar to the annual trends except for winter (DJF). The wintertime trends in Northeast Asia are partly negative in the upper troposphere (different from consistent increasing trends in other seasons) and not evident near the surface (different from increasing trends with high and medium certainty in other seasons). In Southeast Asia, the wintertime ozone trends are still increasing but are mostly not evident – different from increasing trends with high certainty in other seasons.
Our results reveal significant spatial and seasonal ozone variations over East Asia and Southeast Asia. Spatially, ozone levels are closely associated with anthropogenic emissions (e.g., NOx emissions) (Li et al., 2024), with high ozone concentrations aligning well with the estimated NOx emission patterns. Figure 16 shows the bottom-up NOx emissions and the satellite-derived NO2 columns over East Asia and Southeast Asia. Seasonally, ozone variations are primarily influenced by meteorological conditions and biomass-burning emissions in Southeast Asia. For example, ozone peaks usually occur in northern China during summer, in the Pearl River Delta during autumn, and in Southeast Asia during spring. Relative to East Asia, although the health risks in Southeast Asia tend to be low under short-term ozone exposure metrics (e.g., 95th percentile MDA8 ozone), ozone exceedance days are still notable if the WHO standard is applied. The diverse short-term ozone air quality standards in Southeast Asian countries (Fig. 3) suggest a great challenge in calling for regional joint ozone control. Moreover, the WHO's newly introduced peak-season ozone concentration standard indicates that both East Asia and Southeast Asia are faced with the widespread risk of long-term ozone exposure, with the vast majority of the region exceeding the WHO standard. In addition to health impacts, the pervasive ozone pollution in East Asia and Southeast Asia is also threatening global food security by accounting for over 60 % of global rice yield (Feng et al., 2022; Yuan et al., 2022). For example, the year-around mean MDA8 ozone of over 40 nmol mol−1 over Southeast Asia suggests high ozone exposure over a threshold of 40 nmol mol−1 (AOT40), which is commonly used to investigate ozone effects on vegetation yield (Feng et al., 2022).
The long-term trend of surface ozone indicates that, based on the available data, high-emission regions in South Korea, Southeast Asia, and China have generally experienced an increase in ozone levels since 2005. However, since 2013, the increase in ozone levels in China has significantly accelerated, while the ozone trends in Thailand and Malaysia in Southeast Asia show no significant changes. Therefore, it is still urgent to elucidate the varying ozone trends in East Asia and Southeast Asia across different seasons over the past decade (Li et al., 2019).
In the troposphere, the available ozonesonde and IAGOS measurements not only demonstrate the high background ozone in warm seasons over Northeast Asia but also show an overall increasing tendency in the past three decades. While the increase in tropospheric ozone can be largely attributed to the increased anthropogenic emissions, as demonstrated in our companion paper (Lu et al., 2025), the origin of high seasonal background ozone in Northeast Asia remains unclear. Recent studies provide some observational and modeling evidence of a stratospheric intrusion (Chen et al., 2024; Colombi et al., 2023) to explain this high background ozone, but a quantitative assessment is urgently needed. In particular, the recent ASIA-AQ campaign (https://espo.nasa.gov/asia-aq, last access: 19 September 2025) conducted across Asian counties would be important to understand the high-tropospheric-ozone issue over East Asia and Southeast Asia.
Under the framework of TOAR II, which aims to estimate global and regional tropospheric ozone pollution and its historical trend, in this study we present the most comprehensive review of ozone distributions and evolution over East Asia and Southeast Asia across different spatiotemporal scales in the past two decades. This is done by taking advantage of the available surface ozone measurements in the past two decades (2005–2021) over eight countries, with 10 ozonesonde and in-service aircraft measurements within this region. The key conclusions are as follows:
First, there are significant spatial and seasonal ozone variations at the present-day level. In summer, seasonal mean MDA8 ozone averaged over 2017–2021 varies from 30 nmol mol−1 in Southeast Asia to over 75 nmol mol−1 in summer in northern China and Seoul. Southeast Asia in winter and spring has a high mean ozone of 60 nmol mol−1 (in Thailand). The seasonality of the 95th percentile ozone resembles the mean ozone evolution, but the widespread occurrence of the very high 95th percentile ozone of over 85 nmol mol−1 highlights the severity of ozone pollution. If the WHO standard is applied for short-term exposure, a large fraction of the sites will have more than 100 d of MDA8 ozone exceedance. In terms of long-term exposure, the WHO's newly introduced peak-season ozone standard indicates that both East Asia and Southeast Asia are faced with a widespread risk of long-term ozone exposure.
Second, the surface ozone increase in the past two decades is widespread. In particular, South Korea has a national ozone increase with high certainty across different seasons. In Thailand, there is an overall increasing trend in surface ozone but with spatial heterogeneity over 2005–2021. In China, the compiled 11 individual measurements show an overall ozone increase in high-emission regions and at a global baseline station. However, the observed national surface ozone increase in South Korea and Southeast Asia from 2005 is leveling off or has even decreased in the past decade (2013–2021), while the ozone increase in the 2000s over China has amplified since 2013. Surface ozone trends in Japan and Mongolia have been generally flat in the past decade.
Third, in the troposphere, the high ozone levels in spring and summer at the Beijing, Pohang, Sapporo, and Tsukuba sites are driven by strong photochemical ozone production and stratospheric ozone intrusion, supported by both the ozonesonde and IAGOS measurements. The difference in the tropospheric ozone level between East Asia and Southeast Asia is likely due to the high background ozone from the stratospheric intrusion over Northeast Asia. In terms of ozone trends, from a three-decade perspective, the available ozonesonde and aircraft measurements show an overall increasing tendency at different altitudes but feature strong site-by-site differences. Due to measurement availability, the ozone trend in the past decade is still unquantified.
Fourth, the significant spatial ozone variations over East Asia and Southeast Asia are closely associated with anthropogenic emissions, supported by ground-based and satellite measurements. Our study also shows that there is a very high ozone climate penalty over East Asia and Southeast Asia, and the widespread high ozone–temperature slope of 3–8 nmol mol−1 ° C−1 persists all year round in Southeast Asia. More importantly, the observed 95th percentile regression shows a notably increased ozone–temperature slope over Southeast Asia, suggesting a critical issue in future ozone controls.
The sources for all data used in this study, including the observations, meteorological reanalysis and emission data, can be accessed by contacting the corresponding authors.
The supplement related to this article is available online at https://doi.org/10.5194/acp-25-11575-2025-supplement.
KL and JHK led and organized the project, working as the co-leads of the East Asia Working Group of Tropospheric Ozone Assessment Report Phase II (TOAR II) with XL and TN. SJF, JQZ, XPL, LKX, JMX, YXG, ZQM, MTL, TA, JG, MHL, JB, JK, JHK, XL, and TN assisted in the preparation of observational data. KL, RT, WHQ, and JHK conducted the analysis and prepared the figures. TL, YFW, DYTZ, MLT, and WQZ contributed to preparing the figures. KL and JHK led the writing of the paper. All authors contributed to improving the paper.
At least one of the (co-)authors is a member of the editorial board of Atmospheric Chemistry and Physics. The peer-review process was guided by an independent editor, and the authors also have no other competing interests to declare.
Publisher’s note: Copernicus Publications remains neutral with regard to jurisdictional claims made in the text, published maps, institutional affiliations, or any other geographical representation in this paper. While Copernicus Publications makes every effort to include appropriate place names, the final responsibility lies with the authors.
This article is part of the special issue “Tropospheric Ozone Assessment Report Phase II (TOAR II) Community Special Issue (ACP/AMT/BG/GMD inter-journal SI)”. It is the result of the Tropospheric Ozone Assessment Report Phase II (TOAR II, 2020–2024).
We greatly thank the China Ministry of Ecology and Environment, Korean Ministry of Environment, National Institute for Environmental Studies, Malaysia Department of Environment, Thailand Pollution Control Department, Acid Deposition Monitoring Network in East Asia (EANET), World Ozone and Ultraviolet Radiation Data Centre (WOUDC), and In-service Aircraft for a Global Observing System (IAGOS) for running the ozone observation networks. MOZAIC/CARIBIC/IAGOS data were created with support from the European Commission; national agencies in Germany (BMBF), France (MESR), and the UK (NERC); and the IAGOS member institutions (http://www.iagos.org/partners, last access: 19 September 2025). The participating airlines (Lufthansa, Air France, Austrian Airlines, China Airlines, Hawaiian Airlines, Air Canada, Iberia, Eurowings Discover, Cathay Pacific, Air Namibia, and Sabena) have supported IAGOS by carrying the measurement equipment free of charge since 1994. The data are available at http://www.iagos.fr (last access: 19 September 2025), thanks to additional support from AERIS. We also thank the previous and current TOAR Steering Committee members (Owen Cooper, Lin Zhang, and Keding Lu) for their tireless support in guiding the East Asia Working Group of Tropospheric Ozone Assessment Report Phase II (TOAR II), and the SHADOZ team (Anne M. Thompson, Ryan M. Stauffer, and Debra E. Kollonige) for their remarkable contribution to the database of long-term ozone profile measurements.
This research was supported by the National Natural Science Foundation of China (grant nos 42293323, 42205114, and 42293321) and the Natural Science Foundation of Jiangsu Province (BK20240035). This work was also supported by a National Research Foundation of Korea (NRF) grant, funded by the South Korean government (MSIT) (RS-2023-00219830).
This paper was edited by Jayanarayanan Kuttippurath and reviewed by I. Pérez and one anonymous referee.
Ahamad, F., Griffiths, P. T., Latif, M. T., Juneng, L., and Xiang, C. J.: Ozone Trends from Two Decades of Ground Level Observation in Malaysia, Atmosphere, 11, https://doi.org/10.3390/atmos11070755, 2020.
Ashfold, M. J., Latif, M. T., Mokhtar, A. M., Samah, A. A., Mead, M. I., and Harris, N.: The Relationship between Ozone and Temperature in Greater Kuala Lumpur, Malaysia, Aerosol Air Qual. Res., 24, 240072, https://doi.org/10.4209/aaqr.240072, 2024.
Bak, J., Song, E.-J., Lee, H.-J., Liu, X., Koo, J.-H., Kim, J., Jeon, W., Kim, J.-H., and Kim, C.-H.: Temporal variability of tropospheric ozone and ozone profiles in the Korean Peninsula during the East Asian summer monsoon: insights from multiple measurements and reanalysis datasets, Atmos. Chem. Phys., 22, 14177–14187, https://doi.org/10.5194/acp-22-14177-2022, 2022.
Cao, T. H., Wang, H. C., Li, L., Lu, X., Liu, Y. M., and Fan, S. J.: Fast spreading of surface ozone in both temporal and spatial scale in Pearl River Delta, J. Environ. Sci., 137, 540–552, https://doi.org/10.1016/j.jes.2023.02.025, 2024.
Chang, K.-L., McDonald, B. C., Harkins, C., and Cooper, O. R.: Surface ozone trend variability across the United States and the impact of heat waves (1990–2023), Atmos. Chem. Phys., 25, 5101–5132, https://doi.org/10.5194/acp-25-5101-2025, 2025.
Chang, K. L., Petropavlovskikh, I., Cooper, O. R., Schultz, M. G., and Wang, T.: Regional trend analysis of surface ozone observations from monitoring networks in eastern North America, Europe and East Asia, Elementa, 5, https://doi.org/10.1525/elementa.243, 2017.
Cheesman, A. W., Brown, F., Artaxo, P., Farha, M. N., Folberth, G. A., Hayes, F. J., Heinrich, V. H. A., Hill, T. C., Mercado, L. M., Oliver, R. J., O' Sullivan, M., Uddling, J., Cernusak, L. A., and Sitch, S.: Reduced productivity and carbon drawdown of tropical forests from ground-level ozone exposure, Nat. Geosci., 17, https://doi.org/10.1038/s41561-024-01530-1, 2024.
Chen, Z., Liu, J., Qie, X., Cheng, X., Shen, Y., Yang, M., Jiang, R., and Liu, X.: Transport of substantial stratospheric ozone to the surface by a dying typhoon and shallow convection, Atmos. Chem. Phys., 22, 8221–8240, https://doi.org/10.5194/acp-22-8221-2022, 2022.
Chen, Z. X., Liu, J. N., Qie, X. S., Cheng, X. G., Yang, M. M., Shu, L., and Zang, Z.: Stratospheric influence on surface ozone pollution in China, Nat. Commun., 15, https://doi.org/10.1038/s41467-024-48406-x, 2024.
Colombi, N. K., Jacob, D. J., Yang, L. H., Zhai, S., Shah, V., Grange, S. K., Yantosca, R. M., Kim, S., and Liao, H.: Why is ozone in South Korea and the Seoul metropolitan area so high and increasing?, Atmos. Chem. Phys., 23, 4031–4044, https://doi.org/10.5194/acp-23-4031-2023, 2023.
DeLang, M. N., Becker, J. S., Chang, K. L., Serre, M. L., Cooper, O. R., Schultz, M. G., Schröder, S., Lu, X., Zhang, L., Deushi, M., and Josse, B.: Mapping yearly fine resolution global surface ozone through the Bayesian maximum entropy data fusion of observations and model output for 1990–2017, Environ. Sci. Technol., 55, 4389–4398, 2021.
Feng, Z. Z., Xu, Y. S., Kobayashi, K., Dai, L. L., Zhang, T. Y., Agathokleous, E., Calatayud, V., Paoletti, E., Mukherjee, A., Agrawal, M., Park, R. J., Oak, Y. J., and Yue, X.: Ozone pollution threatens the production of major staple crops in East Asia, Nat. Food, 3, https://doi.org/10.1038/s43016-021-00422-6, 2022.
Gaudel, A., Bourgeois, I., Li, M., Chang, K.-L., Ziemke, J., Sauvage, B., Stauffer, R. M., Thompson, A. M., Kollonige, D. E., Smith, N., Hubert, D., Keppens, A., Cuesta, J., Heue, K.-P., Veefkind, P., Aikin, K., Peischl, J., Thompson, C. R., Ryerson, T. B., Frost, G. J., McDonald, B. C., and Cooper, O. R.: Tropical tropospheric ozone distribution and trends from in situ and satellite data, Atmos. Chem. Phys., 24, 9975–10000, https://doi.org/10.5194/acp-24-9975-2024, 2024.
Gaudel, A., Cooper, O. R., Chang, K. L., Bourgeois, I., Ziemke, J. R., Strode, S. A., Oman, L. D., Sellitto, P., Nédélec, P., Blot, R. and Thouret, V.: Aircraft observations since the 1990s reveal increases of tropospheric ozone at multiple locations across the Northern Hemisphere, Sci. Adv., 6, https://doi.org/10.1126/sciadv.aba8272, 2020.
Gopikrishnan, G. S. and Kuttippurath, J.: Global tropical and extra-tropical tropospheric ozone trends and radiative forcing deduced from satellite and ozonesonde measurements for the period 2005–2020, Environ. Pollut., 361, 124869, https://doi.org/10.1016/j.envpol.2024.124869, 2024.
Gu, Y. X., Li, K., Xu, J. M., Liao, H., and Zhou, G. Q.: Observed dependence of surface ozone on increasing temperature in Shanghai, China, Atmos. Environ., 221, https://doi.org/10.1016/j.atmosenv.2019.117108, 2020.
Jiang, Z., Li, J., Lu, X., Gong, C., Zhang, L., and Liao, H.: Impact of western Pacific subtropical high on ozone pollution over eastern China, Atmos. Chem. Phys., 21, 2601–2613, https://doi.org/10.5194/acp-21-2601-2021, 2021.
Kang, H., Kim, H.-G., Kim, J., Lee, T., Koo, J.-H., Park, S.-S., Choi, Y., Lee, W.-J., Shin, S. A., and Park, J.: Atmospheric and Ozone Profiling Data Measured with Ozonesonde from 2021 to 2024, GEO DATA, 6, 561–577, https://doi.org/10.22761/GD.2024.0041, 2024 (in Korean).
Kawano, N., Nagashima, T., and Sugata, S.: Changes in seasonal cycle of surface ozone over Japan during 1980–2015, Atmos. Environ., 279, https://doi.org/10.1016/j.atmosenv.2022.119108, 2022.
Kim, S.-W., Kim, K.-M., Jeong, Y., Seo, S., Park, Y., and Kim, J.: Changes in surface ozone in South Korea on diurnal to decadal timescales for the period of 2001–2021, Atmos. Chem. Phys., 23, 12867–12886, https://doi.org/10.5194/acp-23-12867-2023, 2023.
Lee, H. J., Chang, L. S., Jaffe, D. A., Bak, J., Liu, X., Abad, G. G., Jo, H. Y., Jo, Y. J., Lee, J. B., and Kim, C. H.: Ozone Continues to Increase in East Asia Despite Decreasing NO2: Causes and Abatements, Remote Sens., 13, https://doi.org/10.3390/rs13112177, 2021.
Lee, H. M. and Park, R. J.: Factors determining the seasonal variation of ozone air quality in South Korea: Regional background versus domestic emission contributions, Environ. Pollut., 308, https://doi.org/10.1016/j.envpol.2022.119645, 2022.
Li, F., Zheng, Q. P., Jiang, Y. C., Xun, A. P., Zhang, J. R., Zheng, H., and Wang, H.: Impact analysis of super Typhoon 2114 “Chanthu” on the air quality of coastal cities in southeast China based on multi-source measurements, Atmosphere, 14, https://doi.org/10.3390/atmos14020380, 2023a.
Li, K., Jacob, D. J., Liao, H., Shen, L., Zhang, Q., and Bates, K. H.: Anthropogenic drivers of 2013–2017 trends in summer surface ozone in China, P. Natl. Acad. Sci. USA, 116, 422–427, https://doi.org/10.1073/pnas.1812168116, 2019.
Li, K., Jacob, D. J., Liao, H., Qiu, Y. L., Shen, L., Zhai, S. X., Bates, K. H., Sulprizio, M. P., Song, S. J., Lu, X., Zhang, Q., Zheng, B., Zhang, Y. L., Zhang, J. Q., Lee, H. C., and Kuk, S. K.: Ozone pollution in the North China Plain spreading into the late-winter haze season, P. Natl. Acad. Sci. USA, 118, https://doi.org/10.1073/pnas.2015797118, 2021.
Li, K., Jacob, D. J., Shen, L., Lu, X., De Smedt, I., and Liao, H.: Increases in surface ozone pollution in China from 2013 to 2019: anthropogenic and meteorological influences, Atmos. Chem. Phys., 20, 11423–11433, https://doi.org/10.5194/acp-20-11423-2020, 2020.
Li, M., Kurokawa, J., Zhang, Q., Woo, J.-H., Morikawa, T., Chatani, S., Lu, Z., Song, Y., Geng, G., Hu, H., Kim, J., Cooper, O. R., and McDonald, B. C.: MIXv2: a long-term mosaic emission inventory for Asia (2010–2017), Atmos. Chem. Phys., 24, 3925–3952, https://doi.org/10.5194/acp-24-3925-2024, 2024.
Li, S., Yang, Y., Wang, H. L., Li, P. W., Li, K., Ren, L. L., Wang, P. Y., Li, B. J., Mao, Y. H., and Liao, H.: Rapid increase in tropospheric ozone over Southeast Asia attributed to changes in precursor emission source regions and sectors, Atmos. Environ., 304, https://doi.org/10.1016/j.atmosenv.2023.119776, 2023b.
Liao, Z. H., Ling, Z. H., Gao, M., Sun, J. R., Zhao, W., Ma, P. K., Quan, J. N., and Fan, S. J.: Tropospheric Ozone Variability Over Hong Kong Based on Recent 20 years (2000–2019) Ozonesonde Observation, J. Geophys. Res.-Atmos., 126, https://doi.org/10.1029/2020jd033054, 2021.
Lu, X., Hong, J. Y., Zhang, L., Cooper, O. R., Schultz, M. G., Xu, X. B., Wang, T., Gao, M., Zhao, Y. H., and Zhang, Y. H.: Severe Surface Ozone Pollution in China: A Global Perspective, Environ. Sci. Tech. Let., 5, 487–494, https://doi.org/10.1021/acs.estlett.8b00366, 2018.
Lu, X., Zhang, L., Wang, X. L., Gao, M., Li, K., Zhang, Y. Z., Yue, X., and Zhang, Y. H.: Rapid Increases in Warm-Season Surface Ozone and Resulting Health Impact in China Since 2013, Environ. Sci. Tech. Let., 7, 240–247, https://doi.org/10.1021/acs.estlett.0c00171, 2020.
Lu, X., Liu, Y., Su, J., Weng, X., Ansari, T., Zhang, Y., He, G., Zhu, Y., Wang, H., Zeng, G., Li, J., He, C., Li, S., Amnuaylojaroen, T., Butler, T., Fan, Q., Fan, S., Forster, G. L., Gao, M., Hu, J., Kanaya, Y., Latif, M. T., Lu, K., Nédélec, P., Nowack, P., Sauvage, B., Xu, X., Zhang, L., Li, K., Koo, J.-H., and Nagashima, T.: Tropospheric ozone trends and attributions over East and Southeast Asia in 1995–2019: an integrated assessment using statistical methods, machine learning models, and multiple chemical transport models, Atmos. Chem. Phys., 25, 7991–8028, https://doi.org/10.5194/acp-25-7991-2025, 2025.
Lyu, X., Li, K., Guo, H., Morawska, L., Zhou, B. N., Zeren, Y., Jiang, F., Chen, C. H., Goldstein, A. H., Xu, X. B., Wang, T., Lu, X., Zhu, T., Querol, X., Chatani, S., Latif, M. T., Schuch, D., Sinha, V., Kumar, P., Mullins, B., Seguel, R., Shao, M., Xue, L. K., Wang, N., Chen, J. M., Gao, J., Chai, F. H., Simpson, I., Sinha, B., and Blake, D. R.: A synergistic ozone-climate control to address emerging ozone pollution challenges, One Earth, 6, 964–977, https://doi.org/10.1016/j.oneear.2023.07.004, 2023.
Ma, Z., Xu, J., Quan, W., Zhang, Z., Lin, W., and Xu, X.: Significant increase of surface ozone at a rural site, north of eastern China, Atmos. Chem. Phys., 16, 3969–3977, https://doi.org/10.5194/acp-16-3969-2016, 2016.
Nagashima, T., Sudo, K., Akimoto, H., Kurokawa, J., and Ohara, T.: Long-term change in the source contribution to surface ozone over Japan, Atmos. Chem. Phys., 17, 8231–8246, https://doi.org/10.5194/acp-17-8231-2017, 2017.
Neu, J. L., Flury, T., Manney, G. L., Santee, M. L., Livesey, N. J., and Worden, J.: Tropospheric ozone variations governed by changes in stratospheric circulation. Nat. Geosci., 7, 340–344, 2014.
Park, S. S., Kim, J., Cho, H. K., Lee, H., Lee, Y., and Miyagawa, K.: Sudden increase in the total ozone density due to secondary ozone peaks and its effect on total ozone trends over Korea, Atmos. Environ., 47, 226–235, https://doi.org/10.1016/j.atmosenv.2011.11.011, 2012.
Salvador, C. M. G., Alindajao, A. D., Burdeos, K. B., Lavapiez, M. A. M., Yee, J. R., Bautista, A. T., Pabroa, P. C. B., and Capangpangan, R. Y.: Assessment of Impact of Meteorology and Precursor in Long-term Trends of PM and Ozone in a Tropical City, Aerosol Air Qual. Res., 22, https://doi.org/10.4209/aaqr.210269, 2022.
Stauffer, R. M., Thompson, A. M., Kollonige, D. E., Komala, N., Al-Ghazali, H. K., Risdianto, D. Y., Dindang, A., Fairudz bin Jamaluddin, A., Sammathuria, M. K., Zakaria, N. B., Johnson, B. J., and Cullis, P. D.: Dynamical drivers of free-tropospheric ozone increases over equatorial Southeast Asia, Atmos. Chem. Phys., 24, 5221–5234, https://doi.org/10.5194/acp-24-5221-2024, 2024.
Sukkhum, S., Lim, A., Ingviya, T., and Saelim, R.: Seasonal Patterns and Trends of Air Pollution in the Upper Northern Thailand from 2004 to 2018, Aerosol Air Qual. Res., 22, https://doi.org/10.4209/aaqr.210318, 2022.
Sun, H. Z., van Daalen, K. R., Morawska, L., Guillas, S., Giorio, C., Di, Q., Kan, H., Loo, E. X.-L., Shek, L. P., Watts, N., Guo, Y., and Archibald, A. T.: An estimate of global cardiovascular mortality burden attributable to ambient ozone exposure reveals urban-rural environmental injustice, One Earth, 7, 1803–1819, https://doi.org/10.1016/j.oneear.2024.08.018, 2024.
Sun, L., Xue, L., Wang, T., Gao, J., Ding, A., Cooper, O. R., Lin, M., Xu, P., Wang, Z., Wang, X., Wen, L., Zhu, Y., Chen, T., Yang, L., Wang, Y., Chen, J., and Wang, W.: Significant increase of summertime ozone at Mount Tai in Central Eastern China, Atmos. Chem. Phys., 16, 10637–10650, https://doi.org/10.5194/acp-16-10637-2016, 2016.
Vingarzan, R.: A review of surface ozone background levels and trends, Atmos. Environ., 38, 3431–3442, 2004.
Wang, H., Lu, X., Jacob, D. J., Cooper, O. R., Chang, K.-L., Li, K., Gao, M., Liu, Y., Sheng, B., Wu, K., Wu, T., Zhang, J., Sauvage, B., Nédélec, P., Blot, R., and Fan, S.: Global tropospheric ozone trends, attributions, and radiative impacts in 1995–2017: an integrated analysis using aircraft (IAGOS) observations, ozonesonde, and multi-decadal chemical model simulations, Atmos. Chem. Phys., 22, 13753–13782, https://doi.org/10.5194/acp-22-13753-2022, 2022b.
Wang, H., Lu, X., Palmer, P. I., Zhang, L., Lu, K., Li, K., Nagashima, T., Koo, J.-H., Tanimoto, H., Wang, H., Gao, M., He, C., Wu, K., Fan, S., and Zhang, Y.: Deciphering decadal urban ozone trends from historical records since 1980, Natl. Sci. Rev., 11, https://doi.org/10.1093/nsr/nwae369, 2024.
Wang, T., Dai, J. N., Lam, K. S., Nan Poon, C., and Brasseur, G. P.: Twenty-Five Years of Lower Tropospheric Ozone Observations in Tropical East Asia: The Influence of Emissions and Weather Patterns, Geophys. Res. Lett., 46, 11463–11470, https://doi.org/10.1029/2019gl084459, 2019.
Wang, X. L., Fu, T. M., Zhang, L., Lu, X., Liu, X., Amnuaylojaroen, T., Latif, M. T., Ma, Y. P., Zhang, L. J., Feng, X., Zhu, L., Shen, H. Z., and Yang, X.: Rapidly Changing Emissions Drove Substantial Surface and Tropospheric Ozone Increases Over Southeast Asia, Geophys. Res. Lett., 49, https://doi.org/10.1029/2022gl100223, 2022a.
Xu, X. B., Lin, W. L., Xu, W. Y., Jin, J. L., Wang, Y., Zhang, G., Zhang, X. C., Ma, Z. Q., Dong, Y. Z., Ma, Q. L., Yu, D. J., Li, Z., Wang, D. D., and Zhao, H. R.: Long-term changes of regional ozone in China: implications for human health and ecosystem impacts, Elementa, 8, https://doi.org/10.1525/elementa.409, 2020.
Xue, L., Ding, A., Cooper, O., Huang, X., Wang, W., Zhou, D., Wu, Z., McClure-Begley, A., Petropavlovskikh, I., Andreae, M.O. and Fu, C.: ENSO and Southeast Asian biomass burning modulate subtropical trans-Pacific ozone transport, Natl. Sci. Rev., 8, nwaa132, https://doi.org/10.1093/nsr/nwaa132, 2021.
Ye, X. P., Zhang, L., Wang, X. L., Lu, X., Jiang, Z. J., Lu, N., Li, D. Y., and Xu, J. Y.: Spatial and temporal variations of surface background ozone in China analyzed with the grid-stretching capability of GEOS-Chem High Performance, Sci. Total Environ., 914, https://doi.org/10.1016/j.scitotenv.2024.169909, 2024.
Yin, Z. C., Song, X. L., Zhou, B. T., Jiang, W. H., Chen, H. P., and Wang, H. J.: Traditional Meiyu-Baiu has been suspended by global warming, Natl. Sci. Rev., 11, nwae166, https://doi.org/10.1093/nsr/nwae166, 2024.
Yin, Z., Wang, H., Li, Y., Ma, X., and Zhang, X.: Links of climate variability in Arctic sea ice, Eurasian teleconnection pattern and summer surface ozone pollution in North China, Atmos. Chem. Phys., 19, 3857–3871, https://doi.org/10.5194/acp-19-3857-2019, 2019.
Yuan, S., Stuart, A. M., Laborte, A. G., Rattalino Edreira, J. I., Dobermann, A., Kien, L. V. N., Thúy, L. T., Paothong, K., Traesang, P., Tint, K. M. and San, S. S.: Southeast Asia must narrow down the yield gap to continue to be a major rice bowl. Nat. Food, 3, 217–226, 2022.
Zanis, P., Akritidis, D., Turnock, S., Naik, V., Szopa, S., Georgoulias, A. K., Bauer, S. E., Deushi, M., Horowitz, L. W., Keeble, J., and Le Sager, P.: Climate change penalty and benefit on surface ozone: a global perspective based on CMIP6 earth system models. Environ. Res. Lett., 17, 024014, https://doi.org/10.1088/1748-9326/ac4a34, 2022.
Zeng, Y. S., Zhang, J. Q., Li, D., Liao, Z. H., Bian, J. C., Bai, Z. X., Shi, H. R., Xuan, Y. J., Yao, Z. D., and Chen, H. B.: Vertical distribution of tropospheric ozone and its sources of precursors over Beijing: Results from ∼ 20 years of ozonesonde measurements based on clustering analysis, Atmos. Res., 284, https://doi.org/10.1016/j.atmosres.2023.106610, 2023.
Zhan, C. C. and Xie, M.: Exploring the link between ozone pollution and stratospheric intrusion under the influence of tropical cyclone Ampil, Sci. Total Environ., 828, https://doi.org/10.1016/j.scitotenv.2022.154261, 2022.
Zhang, J., Li, D., Bian, J., Xuan, Y., Chen, H., Bai, Z., Wan, X., Zheng, X., Xia, X., and Lü, D.: Long-term ozone variability in the vertical structure and integrated column over the North China Plain: results based on ozonesonde and Dobson measurements during 2001–2019, Environ. Res. Lett., 16, 074053, https://doi.org/10.1088/1748-9326/ac109f, 2021.
Zhang, X. Y., Xu, W. Y., Zhang, G., Lin, W. L., Zhao, H. R., Ren, S. X., Zhou, G. S., Chen, J. M., and Xu, X. B.: First long-term surface ozone variations at an agricultural site in the North China Plain: Evolution under changing meteorology and emissions, Sci. Total Environ., 860, https://doi.org/10.1016/j.scitotenv.2022.160520, 2023.
Zhang, Y. N., Xiang, Y. R., Chan, L. Y., Chan, C. Y., Sang, X. F., Wang, R., and Fu, H. X.: Procuring the regional urbanization and industrialization effect on ozone pollution in Pearl River Delta of Guangdong, China, Atmos. Environ., 45, 4898–4906, 2011.
Zhao, Z. J. and Wang, Y. X.: Influence of the West Pacific subtropical high on surface ozone daily variability in summertime over eastern China, Atmos. Environ., 170, 197–204, https://doi.org/10.1016/j.atmosenv.2017.09.024, 2017.
Zhou, H., Yue, X., Dai, H., Geng, G., Yuan, W., Chen, J., Shen, G., Zhang, T., Zhu, J., and Liao, H.: Recovery of ecosystem productivity in China due to the Clean Air Action plan, Nat. Geosci., 17, 1233–1239, https://doi.org/10.1038/s41561-024-01586-z, 2024.
Zhou, Y., Yang, Y., Wang, H., Wang, J., Li, M., Li, H., Wang, P., Zhu, J., Li, K. and Liao, H.: Summer ozone pollution in China affected by the intensity of Asian monsoon systems. Sci. Total Environ., 849, 157785, https://doi.org/10.1016/j.scitotenv.2022.157785, 2022.
- Abstract
- Introduction
- Data and methods
- Present-day distribution and long-term trends in surface ozone
- Present-day distribution and long-term trends in tropospheric ozone profiles
- Implications for ozone control
- Conclusions
- Data availability
- Author contributions
- Competing interests
- Disclaimer
- Special issue statement
- Acknowledgements
- Financial support
- Review statement
- References
- Supplement