the Creative Commons Attribution 4.0 License.
the Creative Commons Attribution 4.0 License.
 | 29 Sep 2025
Seasonal differences in observed versus modelled new particle formation at two European boreal stations
Carl Svenhag
Pontus Roldin
Tinja Olenius
Robin Wollesen de Jonge
Sara M. Blichner
Daniel Yazgi
Moa K. Sporre
Realistic representation of atmospheric aerosol size distribution dynamics in large-scale climate models is important for developing accurate descriptions of aerosol–cloud interactions. Despite the dynamic nature of the distributions, which have large seasonal and diurnal changes, model evaluations often focus on the annual median size distribution. Using more comprehensive monthly and diurnal model illustrations can be crucial for evaluating model performance and potential aerosol effects for short-term variations. In this study, we assess the impact of a molecular model scheme for NH3–H2SO4 nucleation integrated in the Earth System Model (ESM) EC-Earth3, across different seasons, months, and days within the boreal climate during the year 2018. Measured number size distributions from two in situ boreal stations are used to evaluate and study particle formation and growth representation in EC-Earth3 over 2018. Additionally, we utilize results from the ADCHEM model, a state-of-the-art 1-D Lagrangian aerosol chemistry model. This allows us to compare EC-Earth3 against results from highly detailed model descriptions of aerosol formation and growth at the boreal stations. When comparing diurnal EC-Earth3 model results with in situ observations at an hourly temporal resolution, we establish that using solely organic–H2SO4 nucleation parameterization will underestimate the aerosol number concentrations. The newly added NH3–H2SO4 nucleation parameterization in this study improves the resulting aerosol number concentrations and the reproduction of particle formation events with EC-Earth3. However, from March to October, EC-Earth3 still underestimates particle formation and growth.
- Article
(12099 KB) - Full-text XML
- BibTeX
- EndNote


Aerosol particles suspended in the atmosphere are constantly forming and growing around us. Secondary aerosols consist of particulate matter formed in the atmosphere from precursor gases, either by the condensation of vapours onto existing particles or by the nucleation of new particles. Secondary aerosols have been shown to significantly impact the global climate and human health (Szopa et al., 2021; Nault et al., 2021; Pye et al., 2021). New particle formation (NPF) occurs when particles are formed from the clustering and condensation of various gases. The gases can originate from both natural and anthropogenic sources. A major gas compound driving new particle formation is sulfuric acid (H2SO4). Atmospheric H2SO4 is formed in the gas phase when SO2 is oxidized by OH radicals and when dimethyl sulfate (DMS) is oxidized by OH, Cl, and BrO radicals (see e.g. Wollesen de Jonge et al., 2021). Sulfur dioxide is predominantly emitted from anthropogenic sources and volcanoes, while DMS is mainly emitted by phytoplankton in the surface ocean. Secondary aerosols involving organic compounds (SOAs) are produced from volatile organic compounds (VOCs) in the atmosphere; 85 % of the VOCs are estimated to originate from natural sources (Lamarque et al., 2010; Guenther et al., 2012) and are labelled biogenic volatile organic compounds (BVOCs). The abundance of these natural gas compounds can have strong fluctuations over the year, in relation to the growing season. Furthermore, gas-phase ammonia (NH3(g)) has been shown to be a key species in the NPF processes by recent model and experimental studies (Dunne et al., 2016; Roldin et al., 2019). Atmospheric NH3 is mainly a by-product emission from agricultural and industrial activities. Including NH3 in the NPF parameterization has not yet been well established in most large-scale climate models, so evaluating the impact of the recently introduced NH3-enhanced formation mechanism is a key focus of this study.
Quantification of aerosol formation mechanisms has advanced significantly in the past decades with the development of computational atmospheric chemistry models. The essential prerequisite for achieving reasonable modelling of aerosols and NPF is to define an accurate representation of the aerosols' physical and chemical processes. However, the price for increasing the complexity in models has to be balanced with the model's computational capacity. All models are restricted to within limited computational process time. Generally, the complexity of model chemistry and physics is limited by the size of the spatial and temporal scale to be covered. Therefore, it is more common for global Earth system models (ESMs) to have more crude parameterization for aerosols and chemistry compared with, e.g., a 1-D model. Nonetheless, improving the representation of aerosols in Earth system models is crucial for reducing the large uncertainties associated with aerosols regarding global climate forcing (Forster et al., 2021).
Atmospheric aerosols tend to contribute to a net cooling of the global climate by scattering incoming short-wave solar radiation, here referred to as the direct radiative effect (DRE) given in units of watts per square metre. Higher aerosol concentrations can also increase the number of cloud condensation nuclei (CCNs), which can promote clouds to have higher cloud droplet number concentrations (CDNCs) and cloud albedo. This will increase the cloud's ability to effectively scatter short-wave radiation, which promotes cooling of the climate as a consequence (Twomey, 1974; Albrecht, 1989). The changes in cloud radiative effect (CRE) from aerosols are also mainly promoting net negative (cooling) climate forcings. The aerosol–cloud effect is considered to produce a stronger net forcing than the direct scattering from aerosols (Forster et al., 2021). Nevertheless, aerosol–cloud climate effects hold some of the highest uncertainty of our known climate forcers. It is worth mentioning that recent studies also suggest that increased NPF production can significantly decrease the CRE outcome. This can occur when a large portion of the available vapours are consumed by strong NPF events, limiting the availability of vapours for existing particles to grow into CCN sizes (Sullivan et al., 2018; Roldin et al., 2019; Blichner et al., 2021; Patoulias et al., 2024).
Results from Svenhag et al. (2024) showed that the cloud radiative effect (CRE) in the Earth System Model (ESM) EC-Earth3 exhibits high sensitivity to changes in the new particle formation scheme. Similarly, Sporre et al. (2020) showed that the input SOA yields and VOC precursors in EC-Earth3-AerChem resulted in high sensitivity in the CRE. The Sporre et al. (2020) study also showed that different ESMs can produce opposite CRE outcomes if a VOC precursor is removed from the models. This further implies that the modelled NPF and sub-100 nm aerosol dynamics have a strong effect on the CRE, which can vary significantly between Earth system models. Furthermore, evaluation of ESMs and radiative effects commonly uses temporal averaging to monthly mean or median outputs from the model (Mann et al., 2014; Sporre et al., 2020; Svenhag et al., 2024) and this could discount shorter extreme NPF events, which could have a large impact on the environment and CRE locally.
The current default NPF parameterization scheme in EC-Earth3-AerChem includes two nucleation pathways, from H2SO4 with water (relative humidity) and H2SO4 with extremely low-volatility organic compounds (ELVOCs) (Vehkamäki, 2002; Riccobono et al., 2014; Bergman et al., 2022). Using our new molecular clustering model scheme, here referred to as CLUST, incorporated through a look-up table in EC-Earth3-AerChem, we introduce the H2SO4–NH3 NPF mechanism in the EC-Earth3 aerosol module M7. The look-up table uses H2SO4, NH3, temperature, ion production, and cluster scavenging sink processes to derive the nucleation rate (Svenhag et al., 2024). A recent extensive study by Zhao et al. (2024) indicated the importance of including various NPF mechanisms in global models. Zhao et al. (2024) modelled and discussed how implementing 11 unique pathways had a significant effect on the vertical and horizontal aerosol size distributions.
A difficult task for all global model studies is to accurately validate the model, especially for aerosol formation and growth of sub-100 nm aerosols. This is partly due to the lack of available aerosol measurements globally. The global distribution of measurement stations is scarce, aerosol sizes below 10 nm in diameter are rarely measured, and observations of vertical profiles of aerosol distributions are lacking. Some aeronautical measurement campaigns from e.g. ATom (Brock et al., 2019) and CAFE-Brazil (Curtius et al., 2024) at various locations have made efforts to capture this but they are not evaluated in this study. The coarse spatial resolution in the large-scale models also makes extrapolating single spatial points like the ground station measurement to a 2° × 3° (latitude×longitude) grid box likely non-representative. The modal aerosol size distribution representation in EC-Earth3, which is typical in ESMs, also hinders us from comparing growth rates similar to those seen in measured observations. Additionally, satellite instrumentation cannot confidently measure aerosols in the sub-100 nm diameter sizes and aerial campaign measurements for vertical distributions are not sufficient yet.
For this study, we chose to compare and validate our EC-Earth simulations against two rural boreal stations in Sweden and Finland. The surrounding area is primarily spruce forest, with some anthropogenic and agricultural influences, particularly near the southern part of the station. This makes the extrapolation of the station observations to the model EC-Earth grid more accurate, as the areas are expected to share a more homogeneous air mass (Nieminen et al., 2014). At the Swedish site, we would expect higher NH3 and H2SO4 levels, compared with the Finnish site, due to its proximity to more agricultural and urban regions.
The focus of this study is to determine the model's ability to predict NPF events and to investigate the timing of these events in the model. In addition to comparing the results with observations, we also compare EC-Earth simulations with results from the detailed chemistry process model ADCHEM. ADCHEM is operated as a Lagrangian 1-D column model along air mass trajectories, with similar nucleation and growth schemes to EC-Earth but including detailed aerosol size distribution dynamics and gas-phase and aerosol chemistry. This enables evaluation of the more simplified approaches used in ESMs against detailed modelling, which is essential for understanding the ESM performance. Comparisons with only field measurements of NPF do not give full information on the reasons for the differences between the model and observations, for example, whether they originate from missing chemical components or from inadequate approximations used for included components. They also do not guarantee that a model is right for the right reasons. Therefore, we apply ADCHEM results to benchmark and understand the aerosol formation representation in EC-Earth. This might reveal missing model features in EC-Earth3 that can be addressed in future development.
2.1 EC-Earth3.4.0
The Earth system model configuration used in this study is the EC-Earth3-AerChem (version EC-Earth3.4.0). This contains the global circulation model Integrated Forecast System (IFS) cycle 36r4, which is coupled to the atmospheric chemistry model Tracer Model 5 (TM5) version 1.2 with the carbon bond 5 (CB05) setting (Krol et al., 2005; van Noije et al., 2014). EC-Earth3 uses the model coupler OASIS3-MCT version 3.0 (Craig et al., 2017), where the information exchange between IFS and TM5-MP is made every 6 h, model time. The IFS model, with a time step of 45 min, is set to generate output every 3 h on a 0.7° spectral truncation grid. TM5 uses hourly time steps and is set to produce hourly model output with 2° × 3° (latitude×longitude) resolution. The model is run as atmosphere-only, where EC-Earth3 is fed fixed sea-surface temperatures (SSTs) and sea-ice content from the AMIP reader (van Noije et al., 2021). The vertical resolution in TM5 is represented by 34 hybrid sigma pressure levels, and the IFS has the same hybrid pressure levels, but extrapolated to 91 layers.
2.1.1 Aerosol module M7
The size-resolved aerosol micro-physics module M7 (Vignati et al., 2004), here used in TM5, has been developed for use in large-scale transport models (e.g. Earth system models). Application of M7 within ESMs is motivated by the modal-based size distribution that increases their computational efficiency. The size distribution in M7 is described by seven log-normal modes with fixed standard deviation. This way, the model solely has to track the aerosol mass and the aerosol number of each mode for every time step. This is generally much more computationally efficient, compared with a sectional scheme, which requires significantly more tracers (Vignati et al., 2004). M7 uses four water-soluble (S) and three insoluble (I) size modes with restricted diameter ranges: nucleation mode (NUS) for d<10 nm, Aitken modes (AIS, AII) for nm, accumulation modes (ASC, ASI) for nm, and coarse modes (COS, COI) for d>1000 nm. However, this modal system in M7 limits the size distribution appearance to fall within specific log-normal modes at fixed sizes, and the transfer of aerosol mass and number between modes has some assumptions that are considered unrealistic (Vignati et al., 2004). M7 includes six aerosol species: sea salt (SS), dust (DU), black carbon (BC), sulfate (SO4), primary organic aerosol (POA), and secondary organic aerosols (SOAs).
2.1.2 New particle formation and growth
The formation of new particles in M7 is modelled by calculating a rate (J) of newly formed 5 nm diameter aerosols every time step, in the units per second per cubic centimetre. The default nucleation rate parameterization (Riccobono et al., 2014) in M7 used for EC-Earth3-AerChem is
The equation includes a constant empirical factor ( cm6 s−1) with the gas concentrations of H2SO4 and ELVOC. The parameter JRiccobono in the default TM5–M7 parameterization is summed with the nucleation rate for binary homogeneous nucleation (BHN) of H2SO4 and water (described by specific humidity), based on a classical nucleation theory approach (Vehkamäki, 2002). The nucleation rate J corresponds to particles of ca. 1 nm in diameter and the growth to 5 nm is described using the Kerminen and Kulmala (KK) equation (Kerminen and Kulmala, 2002). The KK function in M7 determines the particle formation rate using available gas-phase ELVOCs and H2SO4 concentrations for estimated particle survival through condensational growth. Only after this growth to 5 nm are the aerosols introduced into the modal size distribution (Bergman et al., 2022). The H2SO4, ELVOCs, and semi-volatile organic compounds (SVOCs) can grow particles in the modal system through condensation. For the soluble accumulation mode, additional reactions of ammonia and nitric acid (HNO3) can form particulate ammonium nitrate (NH4NO3); also, methane sulfonic acid (MSA) can condense on existing ASC-mode particles (van Noije et al., 2014).
2.2 Detailed H2SO4–NH3 nucleation scheme
In accordance with Svenhag et al. (2024), this study also uses the implementation of a new approach for sulfuric acid and ammonia nucleation. Here, nucleation rates are obtained by molecular modelling and stored in look-up tables. The tables are generated and interpolated by the J-GAIN tool (Yazgi and Olenius, 2023b). The rates are calculated by applying high-level benchmarked quantum chemistry data to a molecular kinetics model, where the kinetic equations are solved by the state-of-the-art Aerosol Cluster and Dynamics Code (ACDC) (Olenius, 2021). The look-up table implemented in M7 gives the nucleation rate (J) as a function of the five variables (1) gas-phase H2SO4, (2) gas-phase NH3, (3) temperature, (4) atmospheric ion production rate (IPR), and (5) cluster scavenging sink (Olenius et al., 2013). The look-up table contains nucleation rates for all combinations of the five variables that define the rate; rates at specific conditions are determined by multivariate interpolation. This approach ensures accurate rates, avoiding the typical problem of nucleation rate parameterizations, namely that the rate may not be reproduced under all different conditions of the parameter space. The molecular cluster scavenging sink in CLUST is calculated from the sulfuric acid condensation sink, which is scaled for different cluster sizes (Yazgi and Olenius, 2023b; Lehtinen et al., 2007). In the present EC-Earth3 setup, the total condensation sink of sulfuric acid input to CLUST is calculated from all seven aerosol modes at every model time step. We test two H2SO4–NH3 schemes, created by different quantum chemistry input data: an older data-set (computed using the RICC method) and a newer data-set (computed using the DLPNO method), referred to as CLUST-High and CLUST-Low, respectively. The RICC2 (CLUST-High) version method is based on Olenius et al. (2013) and the newer DLPNO (CLUST-Low) version is based on Besel et al. (2020b). Further details of the EC-Earth3 implemented look-up table are described in Svenhag et al. (2024). We study the ranges produced from the CLUST-High and CLUST-Low inputs, to assess the model sensitivity to ammonia. An IPR look-up table with global coverage of galactic cosmic rays and soil radon is used (Yu et al., 2019). It reads model pressure (203 altitude levels), magnetic latitude (91 bands), and the model grid land cover fraction (for 222Rn) to generate the ion production rates, analogous to the implementation in Svenhag et al. (2024).
2.3 EC-Earth3.4.0 simulations and emissions
We include five separate “atmosphere-only” simulations for EC-Earth3.4.0-AerChem over the year 2018 with a 3-month spin-up period (i.e. from 1 October to 31 December 2017). Each simulation differs only in terms of the NPF parameterization. The five different simulation setup cases are shown in Table 1, as in Svenhag et al. (2024) but with an additional “no-NPF” case. All EC-Earth3 simulations have nudged meteorology from ERA-Interim for the IFS model (every 6 h) for surface pressure, wind divergence, and vorticity to obtain more homogeneous synoptic weather between cases.
(Riccobono et al., 2014)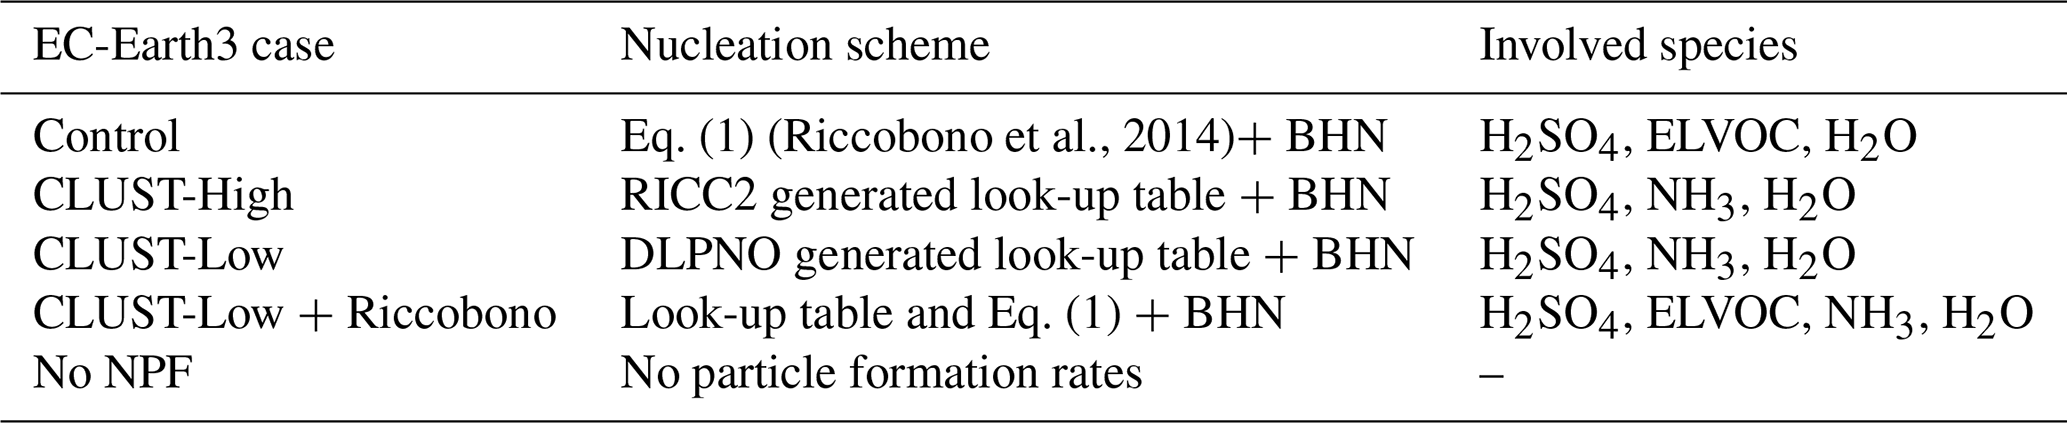
All simulations are run with emissions in accordance with CMIP6 scenario SSP3-7.0, which includes monthly varying emissions for SO2, BVOCs, and NH3 from 2015 to 2100. ELVOC and SVOC production is derived from monoterpene and isoprene reactions with OH and O3, with specific rates and yields (Atkinson et al., 2006; Jokinen et al., 2015). Further descriptions for BVOCs in TM5 are stated in Bergman et al. (2022). The isoprene and monoterpene emissions are based on the MEGAN-MACC inventory (Sindelarova et al., 2014b). The SO2 and NH3 anthropogenic primary emission sources include: agriculture, energy production, industrial, transportation, “residential-commercial-other”, solvent production and application, waste, international shipping, air, and open burning (Lamarque et al., 2010). The biogenic NH3 emissions are from ocean and land with natural vegetation (Bouwman et al., 1997); natural sources of SO2 include volcanic emissions and oceanic dimethyl sulfide (DMS) that is oxidized by OH and NO3. Further descriptions of emissions for EC-Earth3-AerChem are given in van Noije et al. (2021).
2.4 ADCHEM simulations and emissions
The process-based chemistry transport model ADCHEM was used to provide detailed modelling of gas and aerosol species and NPF for comparison with EC-Earth3 and field measurements obtained at the Hyytiälä and Hyltemossa research field stations during the year 2018 (Hari and Kulmala, 2005; Neefjes et al., 2022). ADCHEM was operated as a one-dimensional Lagrangian column model, running along air mass back-trajectories generated by the Hybrid Single Particle Lagrangian Integrated Trajectory (HYSPLIT) model with input data on meteorology from the Global Data Assimilation System (GDAS) (Stein et al., 2015; Rolph et al., 2017). Back-trajectories were simulated 7 days backwards in time using the HYSPLIT default output interval of 1 h for the Hyytiälä and Hyltemossa field stations. The trajectory coordinates were then linearly interpolated at a temporal resolution of 10 min when calculating the emissions of gases and particles from the urban areas, oceans, and forested regions surrounding the stations. In this version of ADCHEM, the one-dimensional column model consists of 20 vertical layers spaced logarithmically, starting from the 1st layer, which represents the lowest 10 m, up to the 20th layer, which represents the atmospheric layer between 1900 and 2100 m above ground level. The emissions from these sources were obtained from the Copernicus Atmosphere Monitoring Service (CAMS), including emissions from the global ocean inventory (Lennartz et al., 2017; Ziska et al., 2013; Nightingale et al., 2000; Lana et al., 2011), the global anthropogenic inventory (Granier et al., 2019), and the global biogenic inventory (Sindelarova et al., 2014a). ADCHEM used a main model time step of 60 s when solving the atmospheric chemistry, aerosol dynamics, and vertical mixing.
New particle formation, represented by an explicit coupling of molecular cluster and aerosol dynamics, was obtained via the molecular cluster plugin ClusterIn (Olenius and Roldin, 2022). ClusterIn considered the ion-induced and neutral clustering of H2SO4–NH3 and H2SO4–dimetylamin (DMA), along with neutral clustering of HIO3–HIO2 and HIO3–DMA. Data-sets for the H2SO4–NH3 and H2SO4–DMA mechanisms were computed at the DLPNO-CCSD(T)/aug-cc-pVTZ//ωB97X-D/6-31++G(d,p) quantum chemical level of theory. The HIO3–HIO2 data-set was calculated using the DLPNO-CCSD(T)//M06-2X method, as detailed by Zhang et al. (2022). The HIO3–DMA data were calculated by applying the older RICC2 method (RI-CC2//ωB97X-D) and can thus be considered a likely upper estimate for the pathway (Ning et al., 2022; Besel et al., 2020a; Myllys et al., 2019). The subsequent growth of these particles was described by considering the condensation, dissolution, and evaporation of 873 organic and inorganic gas-phase species to and from the aerosol particle population. Particles and gases were mixed by use of the GDAS meteorology throughout the 20 horizontal layers spaced logarithmically and spanning 2100 m into the atmosphere. For the gases, the model simulates the gas-phase and aqueous-phase chemistry of 5005 species via 13 062 reactions. Strong inorganic acids (H2SO4, HNO3, HCl, HIO3), ammonia, and organic oxidation products with a pure liquid saturation vapour pressure less than 10−2 Pa at 293 K (in total, 873 species) were treated as potentially condensable vapours and represent the particle-size-dependent condensation and evaporation dynamics. Other water-soluble gases, such as SO2 and the DMS oxidation product methanesulfinic acid (MSIA), are further oxidized in the aerosol and cloud droplet aqueous phase, forming lower volatility products like sulfate and MSA that likewise help to grow the particles.
The model solves the atmospheric diffusion equation in the vertical direction. The vertical diffusion coefficient (Kz) is calculated based on a slightly modified Grisogono scheme (Jeričević et al., 2010; Öström et al., 2017), where Kz depends on the height above ground, the friction velocity, and the height of the atmospheric boundary layer, which is sourced from the GDAS meteorology. GDAS meteorology is used in ADCHEM since the trajectory model HYSPLIT, which calculates back-trajectories for the model, is based on GDAS meteorology. The ADCHEM model thereby attempts to reproduce the concentration of gases and particles at different heights in accordance with the surface measurements made at both the Hyytiälä and Hyltemossa field stations. A more detailed description of the model, along with specific cases in which the model has been used, can be found in Roldin et al. (2019) and Wollesen de Jonge et al. (2024). The ADCHEM simulation for Hyytiälä was only generated for May to August 2018.
2.5 Hyltemossa and Hyytiälä stations
The 2018 measurement data-sets for aerosol particle number size distribution (PNSD) at the two forest stations are produced from differential mobility particle sizer (DMPS) instruments and retrieved from the online EBAS inventory (Tørseth et al., 2012). The instruments measure aerosol diameters down to ≈3 nm, but with increasing uncertainty towards the lowest diameters (Wiedensohler et al., 2012). Uncertainties in observational data-sets obtained with the DMPS can arise from other factors, including calibration and environmental influences, combined with diffusion and electrostatic losses for the smallest diameter aerosols. These uncertainties can affect our interpretation of the PNSD at sub-100 nm. Each ramp (size distribution measurement) takes approximately 10 min with the DMPS. The sampled aerosol numbers are distributed into 52 (Hyytiälä) and 37 (Hyltemossa) size-bins and averaged to 1 h arithmetic means with percentiles. Hyytiälä is the area and nearest small village where the SMEAR II station is located; the coordinates are tabulated in Table 2.
Table 2Station descriptions for the measurements used in this study (Tørseth et al., 2012).

2.6 Model post-processing methods
The ADCHEM and measured DMPS data-sets of PNSD are presented in sectional bins. For EC-Earth3 TM5's hourly output, the modal aerosol distribution is redistributed to 100 sectional bins, from 1 nm to ≈25 µm diameter, for each 1 h time step. Applying this modal-to-sectional conversion for every 1 h output (the same as the TM5 time step) prevents the size distribution from being unrepresentative when using longer temporal averages, as can occur when the median modal-radius output from M7 for each mode is averaged over longer time periods. ADCHEM is run along individual air mass trajectories that arrive at the stations every third hour. As EC-Earth3 and the DMPS measurements are 1-hourly values, data for occurrences when the measured DMPS is missing over more than two time steps within a single 3 h step for ADCHEM are removed from the analysis.
The differences between the modelled and measured PNSDs are presented in this section, categorized by seasonal and weekly periods for the year 2018. The seasonal median PNSDs for the observations and models at the two stations are shown in Fig. 1. The measured PNSDs at the two stations, Hyytiälä and Hyltemossa, display a comparable seasonal variability, with lower aerosol number concentrations during winter and peak concentrations in summer. At both stations, the five EC-Earth3 cases and ADCHEM underestimate aerosol number concentrations in summer (June to August) and overestimate them in winter (December to February). When comparing the seasonal PNSDs from EC-Earth3 and ADCHEM with the measurements, the ADCHEM model shows substantially better performance. EC-Earth3's median aerosol number concentrations for winter, which are driven by primary aerosol emissions, are highly overestimated at both stations (shown in Fig. 1), as is also clear based on the overestimation in the no-NPF simulation. Peculiarly, the overestimation by EC-Earth during winter is much stronger at Hyytiälä than at Hyltemossa. In springtime, at both stations, the EC-Earth3 simulations have the highest disparity between model runs for the different NPF schemes. At such boreal conditions, springtime is favourable to nucleation, as the period is photochemically active but temperatures are not too high. The default ELVOC–H2SO4 (Riccobono) nucleation depends on biogenic emission from vegetation and the NPF is significantly lower in the control case during spring before the initiated growing season. Conversely, agricultural NH3 emissions peak in spring, due to the application of fertilizers. The inclusion of NH3–H2SO4 nucleation in spring, as modelled by the CLUST scheme cases, improves the agreement between the model and observations during this period. Shown in the hourly distributions and the seasonal median (Figs. 1 and 3), the model’s ability to capture NPF days is improved, and the results show more accurate magnitudes of the nucleation events and subsequent Aitken-mode number concentrations.
The total aerosol concentrations during summer (June–August) are underestimated in EC-Earth3, as shown for all model cases in Fig. 1, and similarly in hour-to-hour comparisons during August and July, as shown in Fig. 4. This insufficiency in NPF and growth could be attributed to the low availability of condensable vapours or a limitation in the model growth mechanisms in EC-Earth3, since ADCHEM can produce higher levels for similar nucleation schemes. The highest levels of available ELVOCs occur in summer; for these months, the default ELVOC–H2SO4 will produce higher surface particle formation rates at the model surface level, compared with the CLUST-High and CLUST-Low cases (Fig. 4). However, the CLUST cases still have greater Aitken-mode aerosol number concentrations at the surface, due to transport, as CLUST cases have substantially greater aerosol formation rates in the overlying grids (or possibly in neighbouring grids) and these additional aerosols can then descend (or move laterally) to the surface grid representing the station.
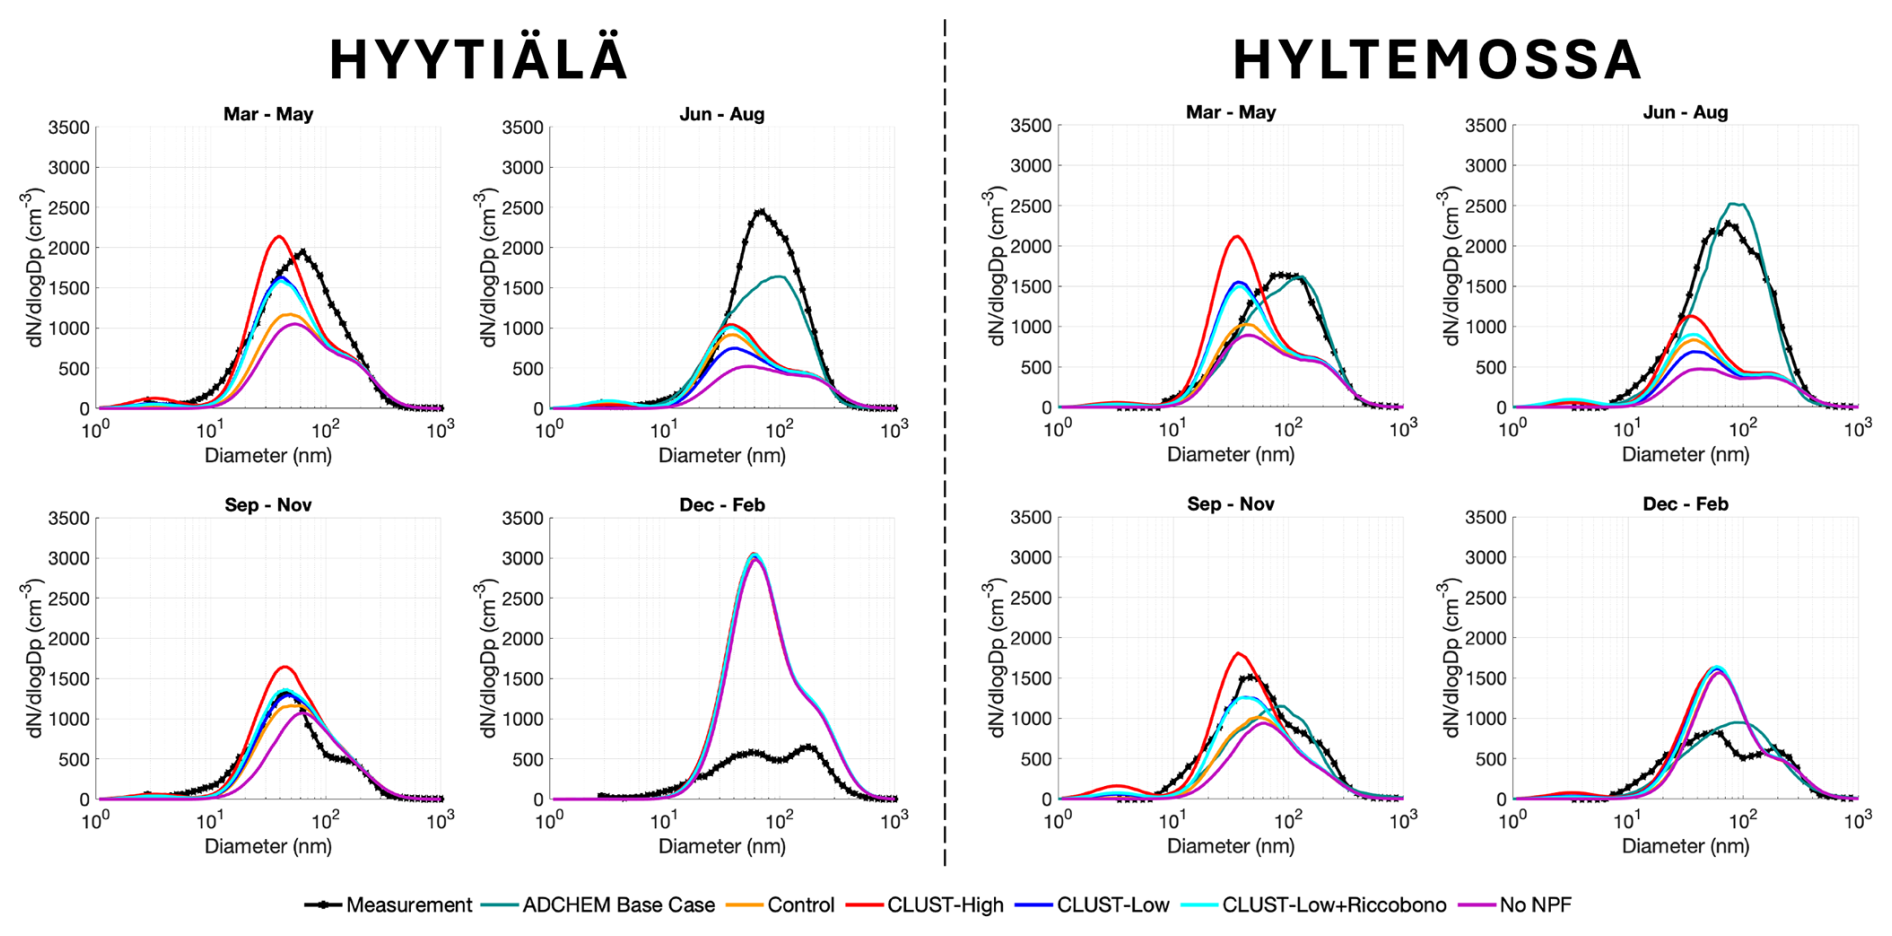
Figure 1Seasonal median size distribution for the five EC-Earth3 variants, the ADCHEM simulations, and the observations. Note: the ADCHEM model only generated output from May to August for Hyytiälä and thus data are only shown for June–August.
3.1 Vertical distribution
For the five EC-Earth3 model variant cases, there is a great difference in the vertical particle formation rate profiles from the second model layer upward (approximately at 900 hPa and above) when comparing the control case (ELVOC–H2SO4) and CLUST case (NH3–H2SO4) simulated rates, as shown in Fig. 2d. This occurs up to ≈400 hPa; then the water–H2SO4 (BHN) nucleation prevails in the upper troposphere, similarly for all cases. The cause of this model difference is related to the available precursor gases at different altitudes, as shown in Fig. 2a–c. The decline in particle formation rates in the control case is explained by the available modelled ELVOC gas concentration rapidly declining with altitude; consequently, the ELVOC–H2SO4 nucleation is limited to only near-surface NPF in the boundary layer. In contrast, the CLUST nucleation rate remains approximately unaffected by altitude because of compensating effects, as its formation is governed by temperature, ionization, and cluster scavenging sinks. Higher altitudes often offer more favourable conditions for these processes, supporting consistent nucleation rates (Svenhag et al., 2024). However, this advantage is probably counterbalanced by the decreasing NH3 concentrations with altitude, which is why the formation rate remains fairly unchanged vertically. In Fig. A1d, the differences in gas concentrations and particle formation rates are shown at a lower altitude interval (800–1000 hPa). The particle formation rate for the four EC-Earth3 cases, as represented over the seasons (as a daily mean) at Hyytiälä, is shown in Fig. A2. The largest case differences here between CLUST and the control case are found at altitudes between 800 and 400 hPa. There are occasions when the formation rates for the control case occur at altitudes between 800 and 400 hPa but these rates are almost entirely produced by the model from only BHN of water–H2SO4. During summer, nucleation throughout the troposphere seems to substantially decrease for all cases. The evaluated weekly cases for each season are made to additionally highlight the variations in EC-Earth3 between model level 1 (surface) and level 2 (∼100 m) for aerosol formation rates, as well as ELVOC, H2SO4, and NH3 concentrations (as presented in the following section).
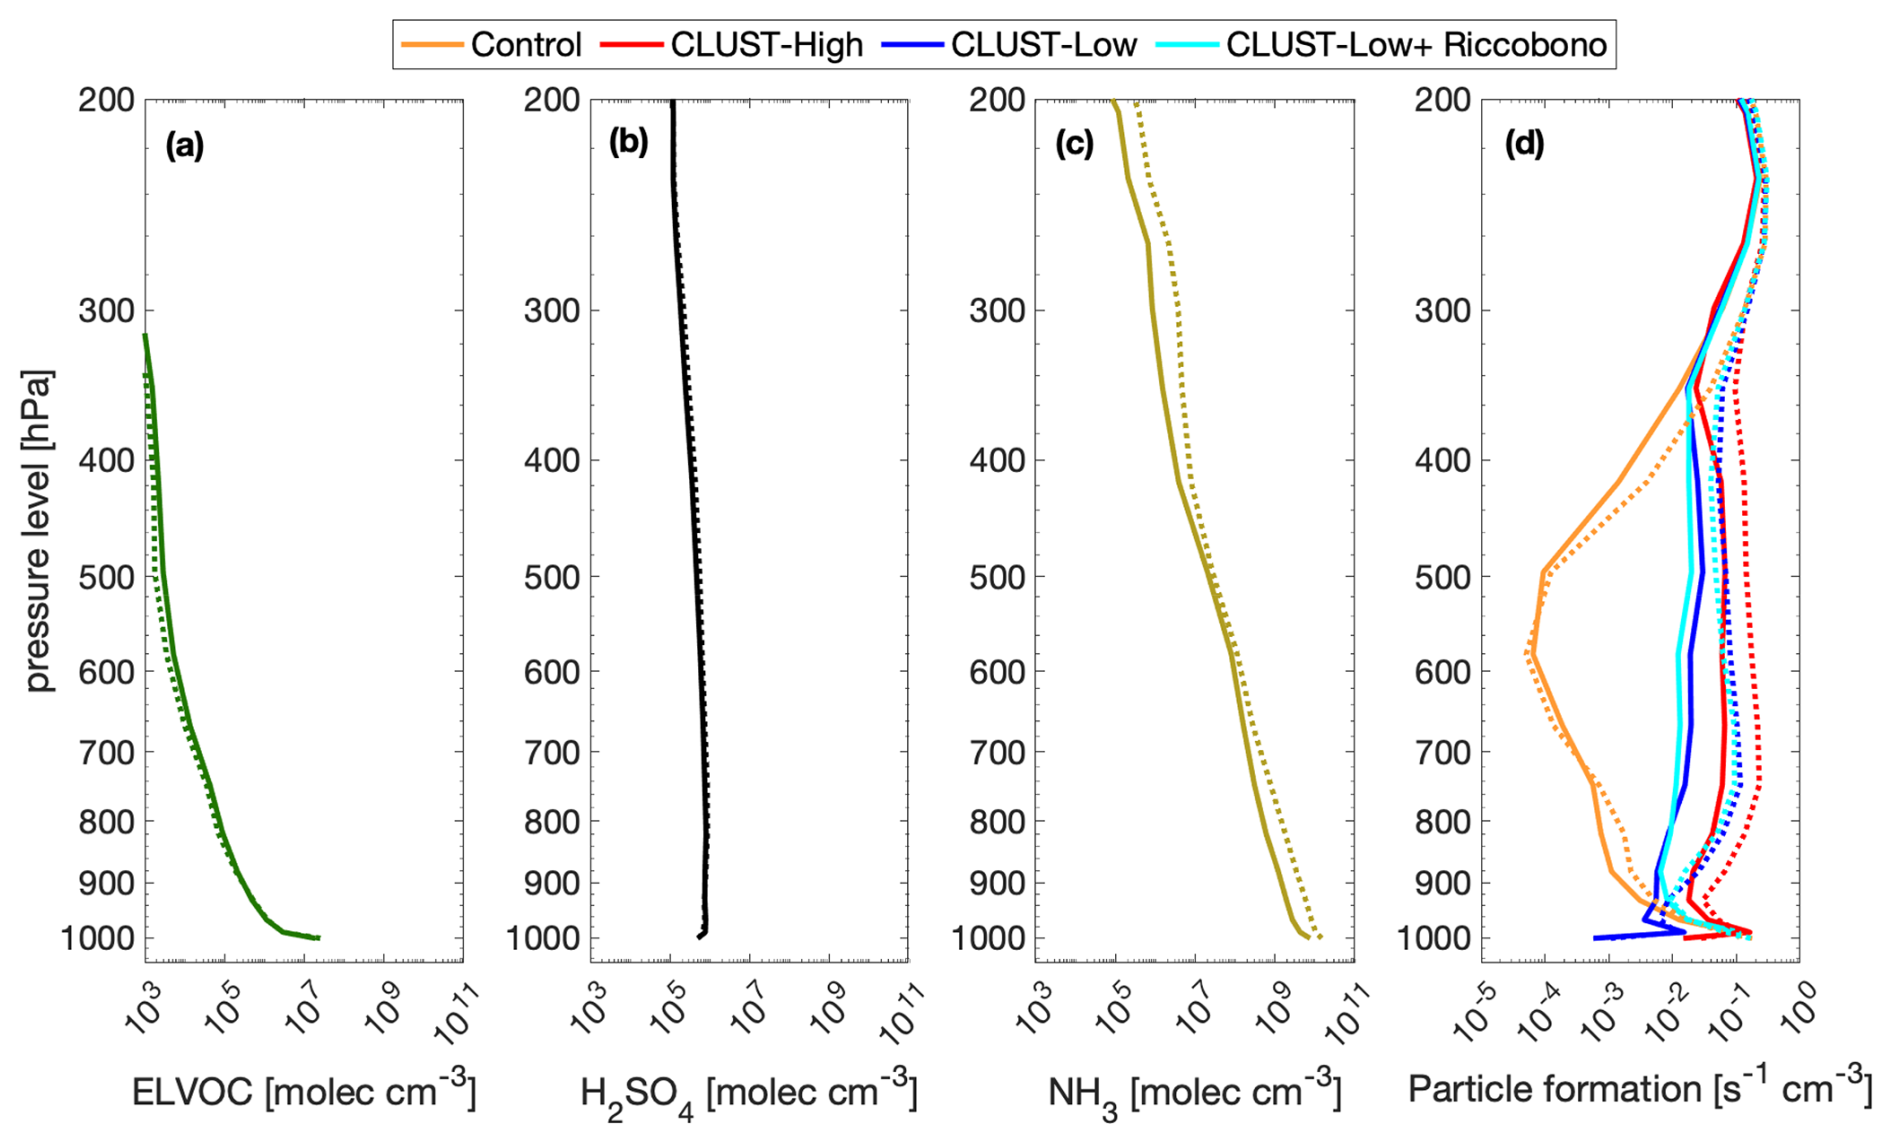
Figure 2EC-Earth3's modelled annual mean vertical precursor: (a) ELVOC, (b) H2SO4, and (c) NH3 concentrations; (d) 95th percentile of particle formation rate for 2018. The bold line represents Hyytiälä station and the dotted line represents Hyltemossa station. The gas concentrations in (a)–(c) are from the no-NPF case; the median differences between EC-Earth3 model cases would not be visible in this figure.
3.2 Seasonal new particle formation
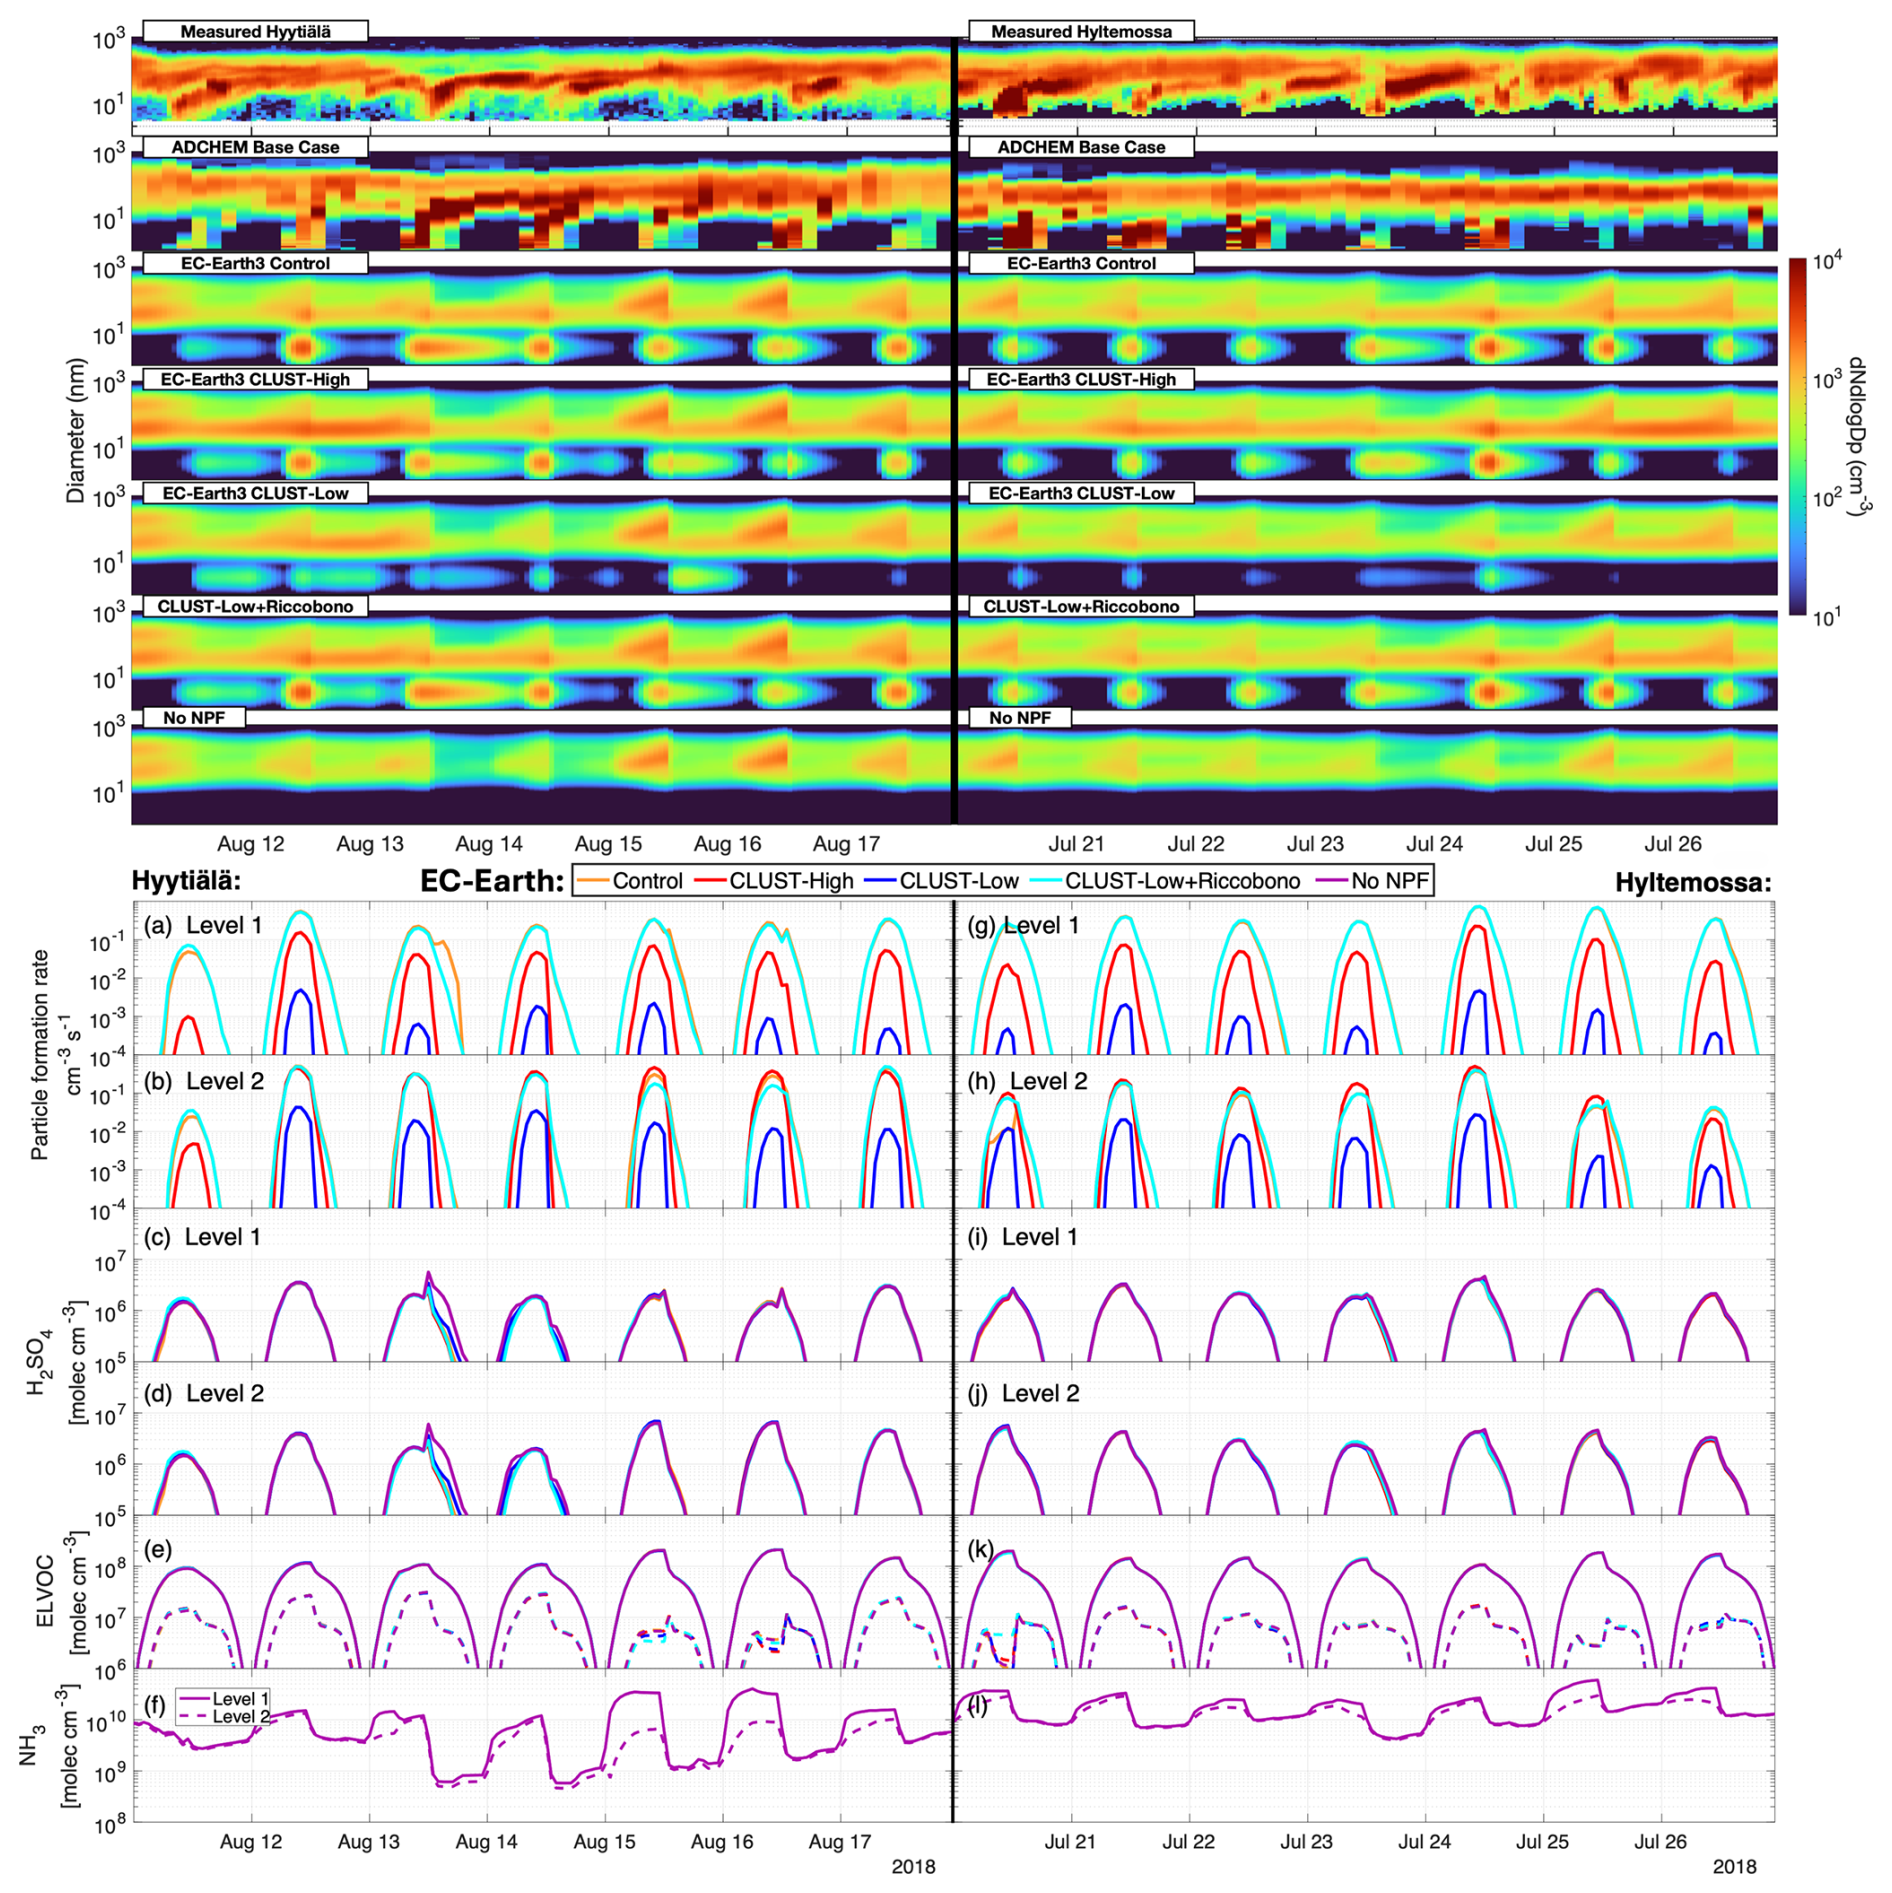
In this section, we evaluate hourly model output over separate weeks with observed NPF events from March to October, with most focus on the springtime. Firstly, two weekly spring cases in March and April are shown for the modelled aerosol size distributions and observed springtime new particle formation events measured by the DMPS at the two stations (Fig. 3). As expected, the more detailed chemistry and sectional aerosol scheme in ADCHEM captures and reproduces these example events with better resemblance to observations, compared with the EC-Earth3 model cases. In Fig. 3 (left panel), both observed and modelled NPF at Hyytiälä are initially (12–13 March) probably suppressed by a high concentration of background Aitken and accumulation mode aerosols. EC-Earth3's mechanisms halt NPF on these days from the sinks produced by the larger mode aerosols, since the concentrations of precursor gases are at similar levels to the following days, when NPF is occurring, as shown in Fig. 3. Afterwards, four exemplary NPF and growth (banana-shaped) events at Hyytiälä are measured in the succeeding days, of 14 to 17 March. These four NPF events modelled by EC-Earth3 cannot be physically replicated (with a banana shape) due to the limitations of how aerosols grow and move between the modes. Nonetheless, regarding the resulting total concentration, the nucleation and Aitken mode agree better with observations when using the CLUST scheme, compared with using only the default ELVOC−H2SO4 nucleation. Comparing the modelled “no-NPF” case with the control case for Hyytiälä in Fig. 3 (left panel), the weak visible nucleation in the control case gives almost no growth to the Aitken mode; the two cases have the same number size distributions, as shown in Fig. A8a.
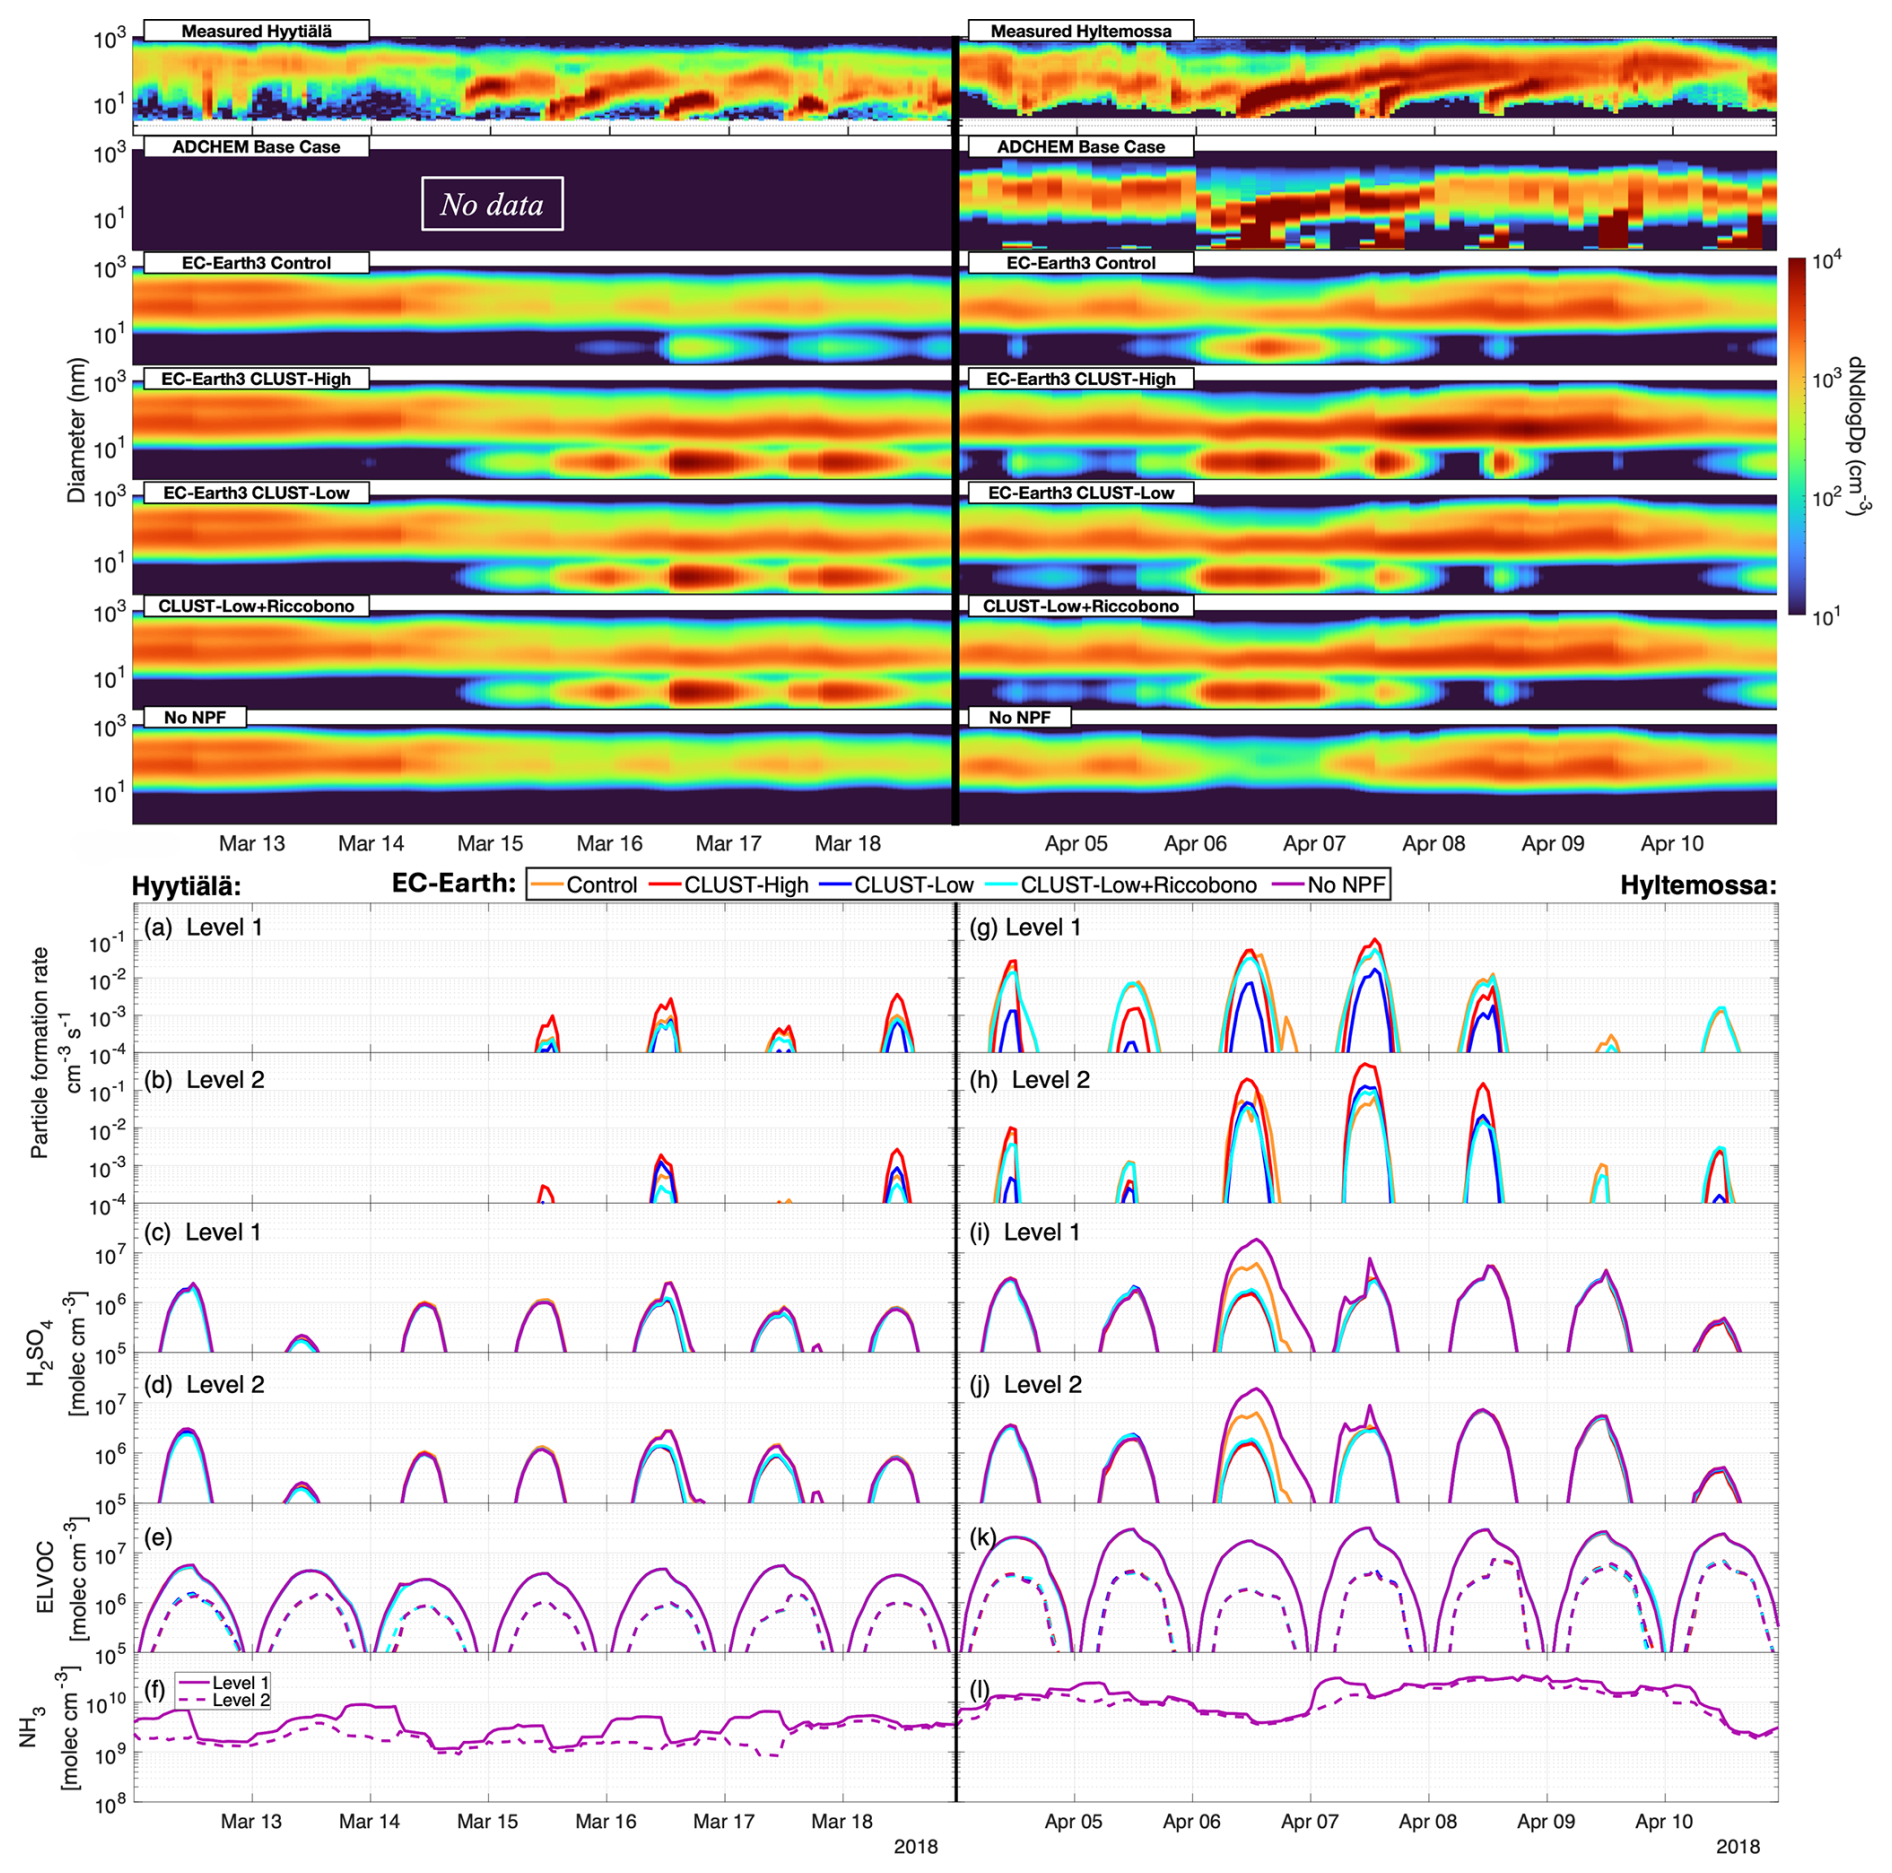
Figure 3The top two figures show the surface aerosol number size distribution over the springtime for the five modelled EC-Earth3 cases, with the DMPS measured aerosols at Hyytiälä and Hyltemossa. ADCHEM simulations have no available hourly data outside the summer months for Hyytiälä. The bottom section shows EC-Earth3 modelled layer 1 and layer 2 Hyytiälä and Hyltemossa springtime cases: (a, b, g, h) daily maximum particle formation rate, (c, d, i, j) H2SO4, (e, k) ELVOC, (f, l) NH3 gas concentration. The concentrations for ELVOC and NH3 level 2 are shown as dotted lines in (e, f, k, l). The missing particle formation rates below 10−4 in (a, b, g, h) are considered to be practically zero.
Figure 3 (right-side panels) shows the modelled Hyltemossa station during 7 days in April; it presents three measured typical nucleation (banana) events, which are also captured differently by the model cases on 6–8 April. The ADCHEM model captures these three events fairly well but still shows some deficiencies. From EC-Earth3, the resulting events are more irregular. The three events on 6–8 April are captured, but underestimated in intensity and growth, with a continuously high NUS concentration throughout the day during 6 April. The EC-Earth3 CLUST cases give aerosol number concentrations closer to the measured concentrations for the events on the 6th–8th compared with the default control case. This strong event on 6 April, shown in Fig. 3i and j, results in large differences for H2SO4 gas-phase concentrations between EC-Earth3 cases. Significantly more H2SO4 is consumed on this day in the CLUST scheme cases. The ELVOC concentrations are lower at this earlier period of spring, shown in Fig. A6. A similarly strong NPF event is captured by EC-Earth3 at Hyltemossa on the 24 October, where the resulting aerosol and H2SO4 concentrations again vary between cases (shown in Fig. A7).
In this section, we include model results from the second model height-level in TM5 to highlight the significant changes in formation rates and gas concentrations between model layers 1 and 2, with the differences for the nucleation schemes. Figure 3 demonstrates the differences in the scheme's nucleation rates and gas concentrations for the same spring week as in Fig. 3. In the studied weekly cases, there are days when the different nucleation scheme experiment cases are diverging in the H2SO4 concentrations. The difference from the “no-NPF” case shows how the different nucleation schemes are consuming H2SO4 to form and grow new particles, e.g. as shown in Fig. 3i and j on 6 April. On average, the H2SO4 concentrations are higher in the second model layer, compared with the surface layer, as shown in Fig. A1b. The ELVOC concentrations decrease by a factor of approximately 10 between levels 1 and 2 (Fig. 3e and k), a pattern also observed for the SVOC concentrations (not shown). The springtime modelled ELVOC abundance at Hyltemossa, compared with the (more northern) Hyytiälä location, drops by a factor of 10 at Hyytiälä, while contrarily, the measured total aerosol concentrations are slightly higher at Hyytiälä. This further suggests that we are lacking some model emissions or chemistry in EC-Earth3 around the station. Yet, underestimated summer PNSD at Hyytiälä is shown for both ADCHEM and EC-Earth3, indicating that some parameterizations and/or emissions for SOA might be missing at Hyytiälä in both models.
We evaluate an additional 2 weeks for the summer period at Hyltemossa and Hyytiälä (Fig. 4). This shows large underestimations in EC-Earth3 (all cases) for NPF magnitude and growth. The control case with ELVOC–H2SO4 results in higher particle formation rates (compared with CLUST) at the surface during this period at both locations, as shown in Fig. 4a and g. Despite the higher surface formation rates for ELVOC–H2SO4 nucleation during these days, this case still yields a lower total surface aerosol number concentration, compared with the CLUST-High case, as shown in Fig. A8b and e. The particles produced in overlying and neighbouring grids for CLUST-High are probably responsible for the resulting higher median summer surface concentrations here. Similar to the hourly results in Fig. 3, the CLUST annual median particle formation rates given in Fig. A1 show significantly higher particle production in the second model layer, compared with the surface layer.
3.3 Further discussion
Expanding on the vertical particle formation rates, the detailed ADCHEM model results suggest that the particle formation rate between the surface and 2000 m (800 hPa), shown in Fig. A3, exceeds what EC-Earth3's ELVOC–H2SO4 and water–H2SO4 nucleation (control case) produce (<10−3 ). These results further support the inclusion of NH3–H2SO4 NPF (like the CLUST table) as a nucleation pathway for the lower troposphere. Zhao et al. (2024, Figure 4) also shows NH3–H2SO4 nucleation (neutral and ion-induced) as a key contributing pathway to particle formation in the upper and lower troposphere. However, while the newly implemented ion-dependent NH3–H2SO4 mechanism is an important NPF pathway, other mechanisms and species may also contribute. Studies have suggested the potential importance of amine- and iodine-enhanced nucleation (Wollesen de Jonge et al., 2024; Zhao et al., 2024), which are pathways not included in the EC-Earth3 model. Further, our current CLUST scheme does not include the effects of, e.g., hydration or nitric acid (HNO3) on NH3–H2SO4 driven NPF, due to the lack of complete molecular data-sets for calculating the formation rates, and testing these effects could be beneficial (Zhao et al., 2024). Additionally, validating TM5's very low vertical distribution for the BVOC concentrations above the surface model layer could improve the boreal (and global) representation of aerosol in EC-Earth3. Further improvements could be achieved by incorporating detailed model comparisons to refine the fixed ELVOC and SVOC yields beyond the two categorical species currently used in TM5. Such enhancements could better capture VOC abundance and thereby improve predictions of particle formation rates and growth. The inclusion of some detailed chemical processes, as represented in the ADCHEM model, may yield results of sufficient relevance to climate impacts to justify the associated increase in computational expense when coupled with EC-Earth3.
It should also be noted that the scheme for organic–H2SO4 nucleation is simple, with no dependencies on temperature, scavenging sink, or IPR (Eq. 1). Because of this, the modelled nucleation rate for this pathway does not fully correspond and/or respond to the ambient conditions and their changes. Additional uncertainties in the EC-Earth3 aerosol chemistry can also arise from the simplifications in modelling organic oxidation yields (from e.g. Jokinen et al., 2015) and growth processes. However, the incorporation of more complex chemical mechanisms is often constrained by the computational costs associated with most Earth system models.
Comparing the modelled mass concentrations in ADCHEM versus the EC-Earth3 versions revealed that the surface organic aerosol mass is significantly higher for ADCHEM, especially during the month of July, as shown in Fig. A4. This disparity in organic aerosol mass could be due to a combination of the factors mentioned previously, e.g. the models' emission inventories, parameterization for SOA formation, and/or chemistry of the organic precursors. Note that the ADCHEM trajectories show that the prevailing air masses are coming from continental areas with high organic emissions during this period (Wollesen de Jonge et al., 2024). Evaluating and refining the available condensable organic (and inorganic) vapour for secondary aerosol formation and growth in EC-Earth3 is crucial for future studies, as the current nucleation and growth schemes lead to significant underestimations of summer Aitken and accumulation mode concentrations at boreal stations. The overestimation by EC-Earth3 in winter might be due to the coarse resolution of EC-Earth3, which means that anthropogenic emissions that are quite far from the station are still emitted within the same grid box. There are also some differences in the emission inventories used by ADCHEM and EC-Earth3. However, these discrepancies are unlikely to be the primary source of emission-related differences observed at the two stations. A more significant factor is the spatial resolution at which each model reads the emissions. EC-Earth3 uses areal mean emissions from the CMIP6 inventory, interpolated over a coarse 2° × 3° (longitude×latitude) grid. In contrast, ADCHEM utilizes the CAMS inventory at a much finer resolution, of 0.1°×0.1°, extracting emission values directly from individual grid cells.
A significant model uncertainty produced by TM5 is revealed in the hourly representations of near-surface aerosol concentrations. This is visible in Fig. 4 at 12:00 UTC, and occurs due to TM5's 6-hourly meteorological dynamics retrievals from IFS. The IFS dynamics control the boundary layer height and consequential vertical mixing, and will maintain the 06:00 UTC conditions up until new values are retrieved at 12:00 UTC, causing an abrupt change in surface gas and aerosol concentrations following this time step. At the two stations, this effect is most prominent at noon in summer, when the boundary layer experiences its maximum fluctuation during the day. Similarly, at 24:00 UTC, the surface aerosol concentration starts accumulating much faster, as the boundary layer height is drastically decreased when TM5 retrieves the new IFS variables (from previous 18:00 UTC conditions). The NH3(g) concentrations (and probably many gas compounds) are also dramatically influenced by these shifts at noon and midnight, as shown in Fig. 4. The unrealistic dynamics produced by TM5, resulting from this model assumption, introduce greater uncertainty in direct comparisons with hour-to-hour NPF events and aerosol populations in this study. This artefact may also introduce uncertainty regarding the influence of near-surface aerosols on cloud–aerosol interactions in EC-Earth3 within the 6 h coupling window.
The new CLUST implementation of H2SO4–NH3 nucleation accounts for more spring and autumn NPF in the boreal regions, where the default EC-Earth3 case is underestimating aerosol numbers. Comparing the CLUST cases versus the control run, the total 2018 aerosol number concentration at Hyytiälä increased by 53 % for CLUST-High, 12 % for CLUST-Low, and 22 % for CLUST-Low+Riccobono. At Hyltemossa it increased by 91 % for CLUST-High, 28 % for CLUST-Low, and 34 % for CLUST-Low+Riccobono. From the resulting aerosol PNSD during spring, summer, and autumn, we suggest the use of the CLUST-Low+Riccobono version with H2SO4–NH3 and H2SO4–organic pathways as a default option in future EC-Earth3 studies to account (in principle) for both nucleation mechanisms in EC-Earth3. ADCHEM uses the same chemistry data for the H2SO4–NH3 pathway as implemented in the CLUST-Low scheme. The CLUST-Low scheme applies the most recent quantum chemistry methods for the H2SO4–NH3 nucleation rate and is considered to have more realistic sensitivity to ammonia, compared with the previous scheme (CLUST-High).
Furthermore, the ADCHEM model results and the global NPF modelled by Zhao et al. (2024) suggest that the mean atmospheric new particle formation rate is higher than 10−2 between the second model layer in TM5 (∼100 m) and the upper troposphere. Our new CLUST nucleation mechanism accounts for higher NPF rates in these regions for the two boreal European mid-latitude stations, which has better agreement with detailed modelling in ADCHEM and NPF rates presented in Zhao et al. (2024). The increase in Aitken-mode particles may also be attributed to more nucleation occurring at higher altitudes. This further suggests the inclusion of the H2SO4–NH3 NPF pathway in Earth system modelling to cover nucleation and production of particles in low-ELVOC environments and at higher altitudes, which have significant influence on model clouds properties and radiative effects (Svenhag et al., 2024).
This study further underscores the potential for misrepresentation when relying solely on annual median values to evaluate the performance of EC-Earth3 (and other ESMs), due to pronounced seasonal variability. An annual average of the two modelled stations in this study would merge the model's significant underestimates of summer aerosol concentrations with its substantial overestimate in winter, resulting in a balanced median value. As the climate forcing from aerosols has large seasonal variation (Carslaw et al., 2013; Forster et al., 2021), it would be crucial to have a representative seasonal model depiction of aerosol formation and growth. The underestimated aerosol concentrations for EC-Earth3 in the summer could have a significant impact on the radiative outcome with regard to the high sensitivity between CRE and sub-100 nm aerosols in EC-Earth3 (Svenhag et al., 2024). The observed mechanisms in these regional environments are not necessarily transferable to different environments, which makes comparisons towards modelled NPF effects on a global scale challenging. Another challenge is introduced by the uncertainty from the TM5's 6-hourly exchange of meteorological dynamics from the IFS model, which alters the aerosol and precursor gas concentrations and conditions significantly near the surface at noon and midnight.
We have demonstrated that the detailed evaluation of seasonal boreal new particle formation in the EC-Earth ESM can be accomplished by both representative field observations and detailed aerosol simulations (ADCHEM). This combination aims to recognize the factors affecting the ability of the ESM to capture NPF trends. Such analysis can be applied (1) to assess seasonal trends and possible reasons for season-wise biases and (2) to separate different error sources stemming from fundamental model schemes, e.g. inclusion/exclusion of given NPF mechanisms, and from ESM approximations for, e.g., aerosol size distribution.
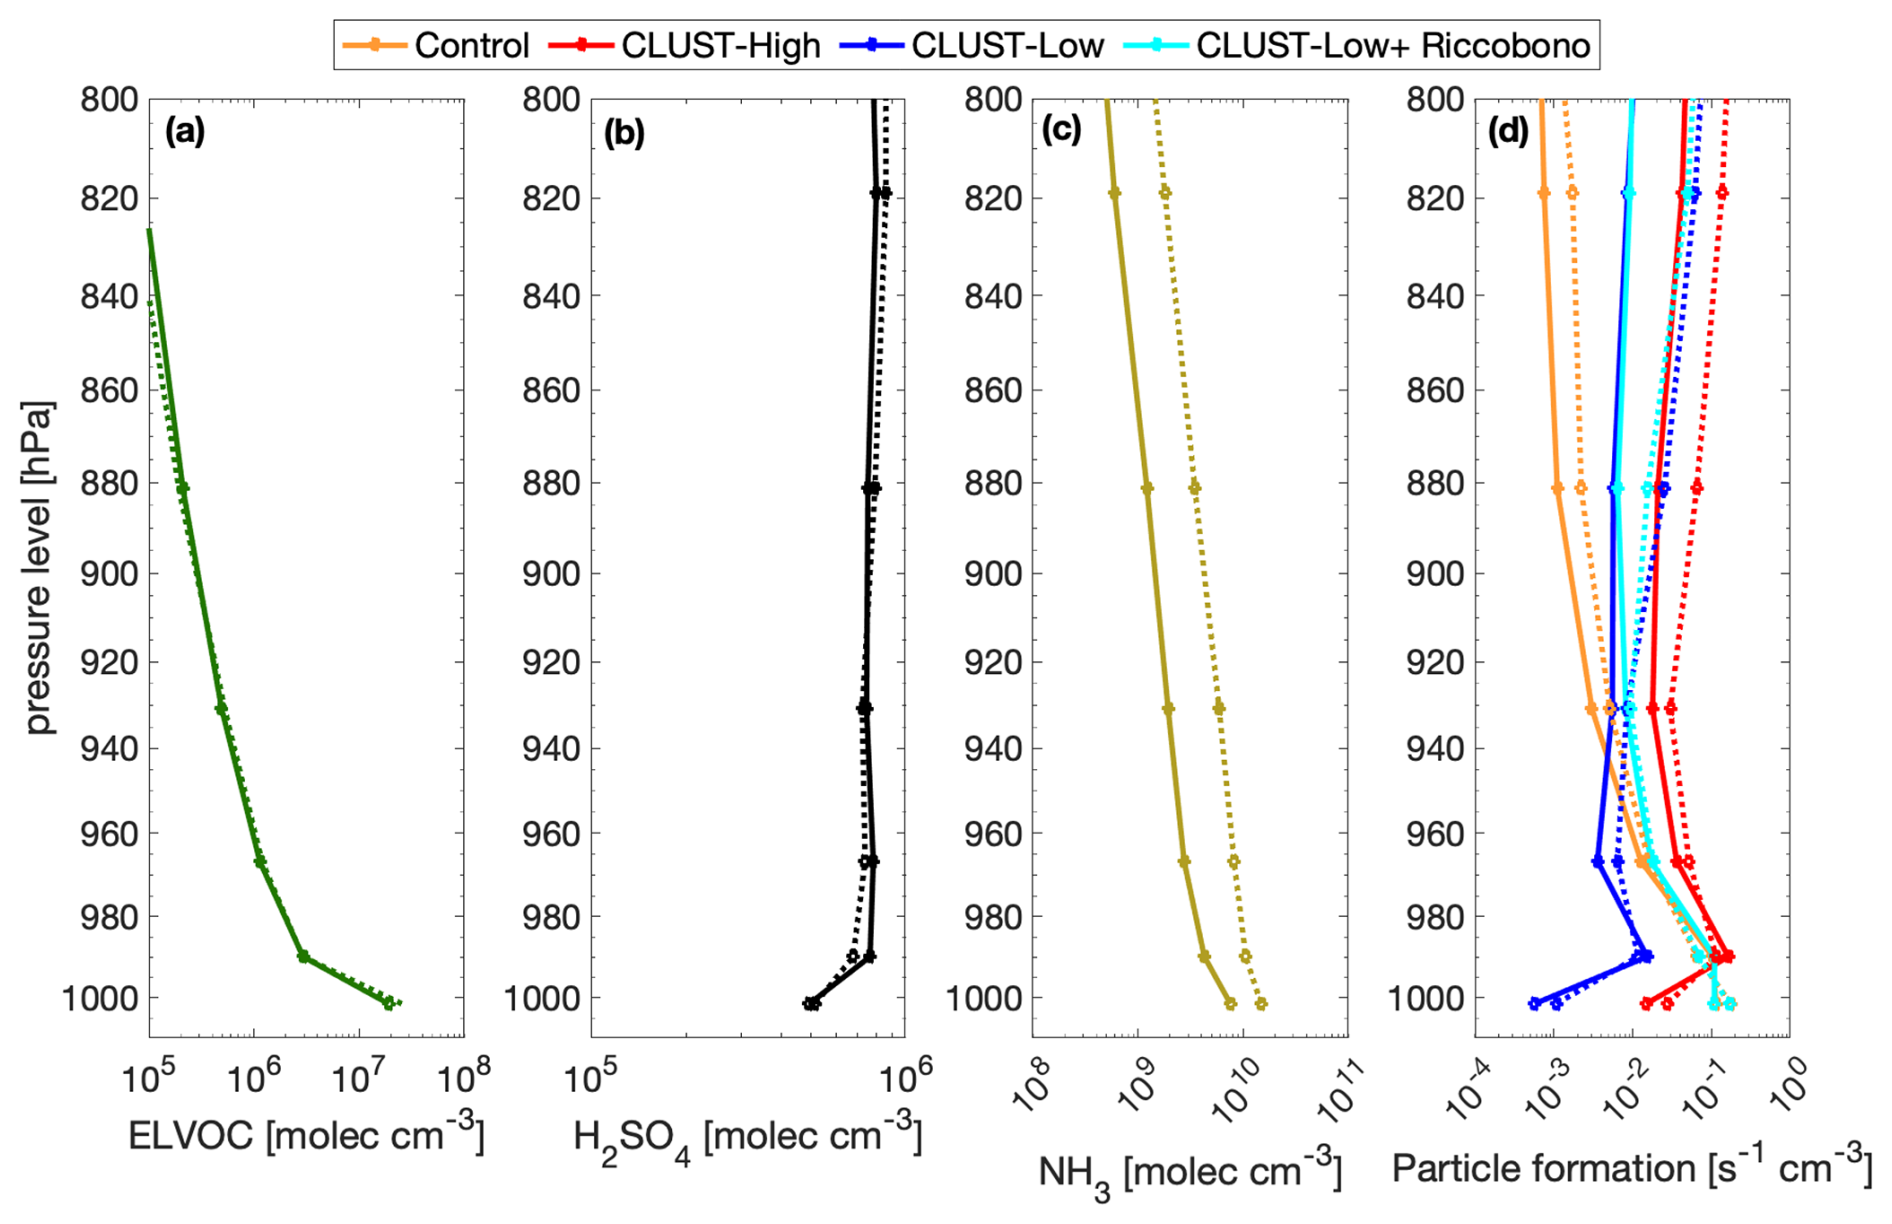
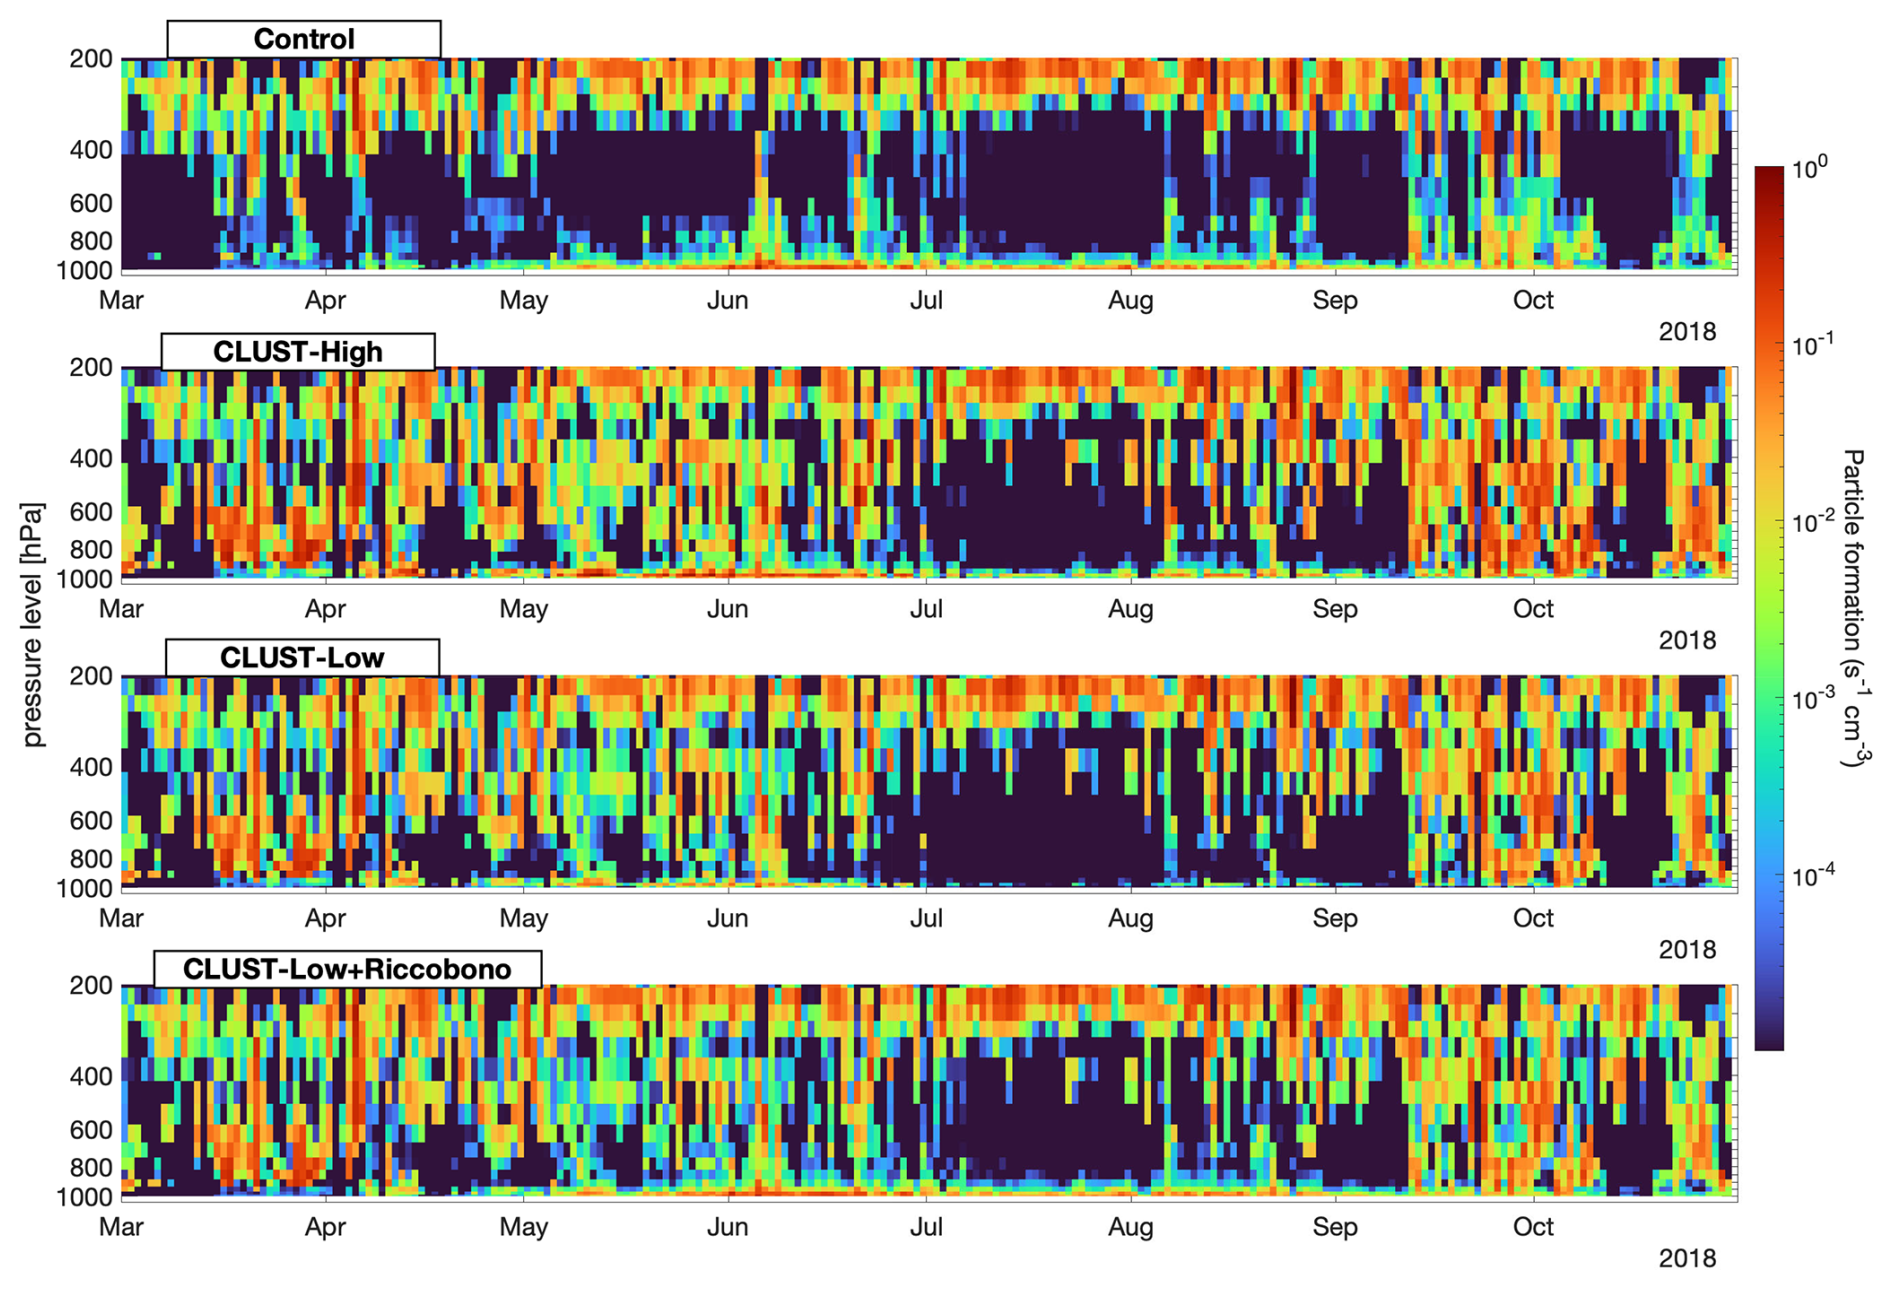
Figure A2Vertical distribution of daily mean particle formation rates in the four EC-Earth3 cases at Hyytiälä for 2018, March to October.
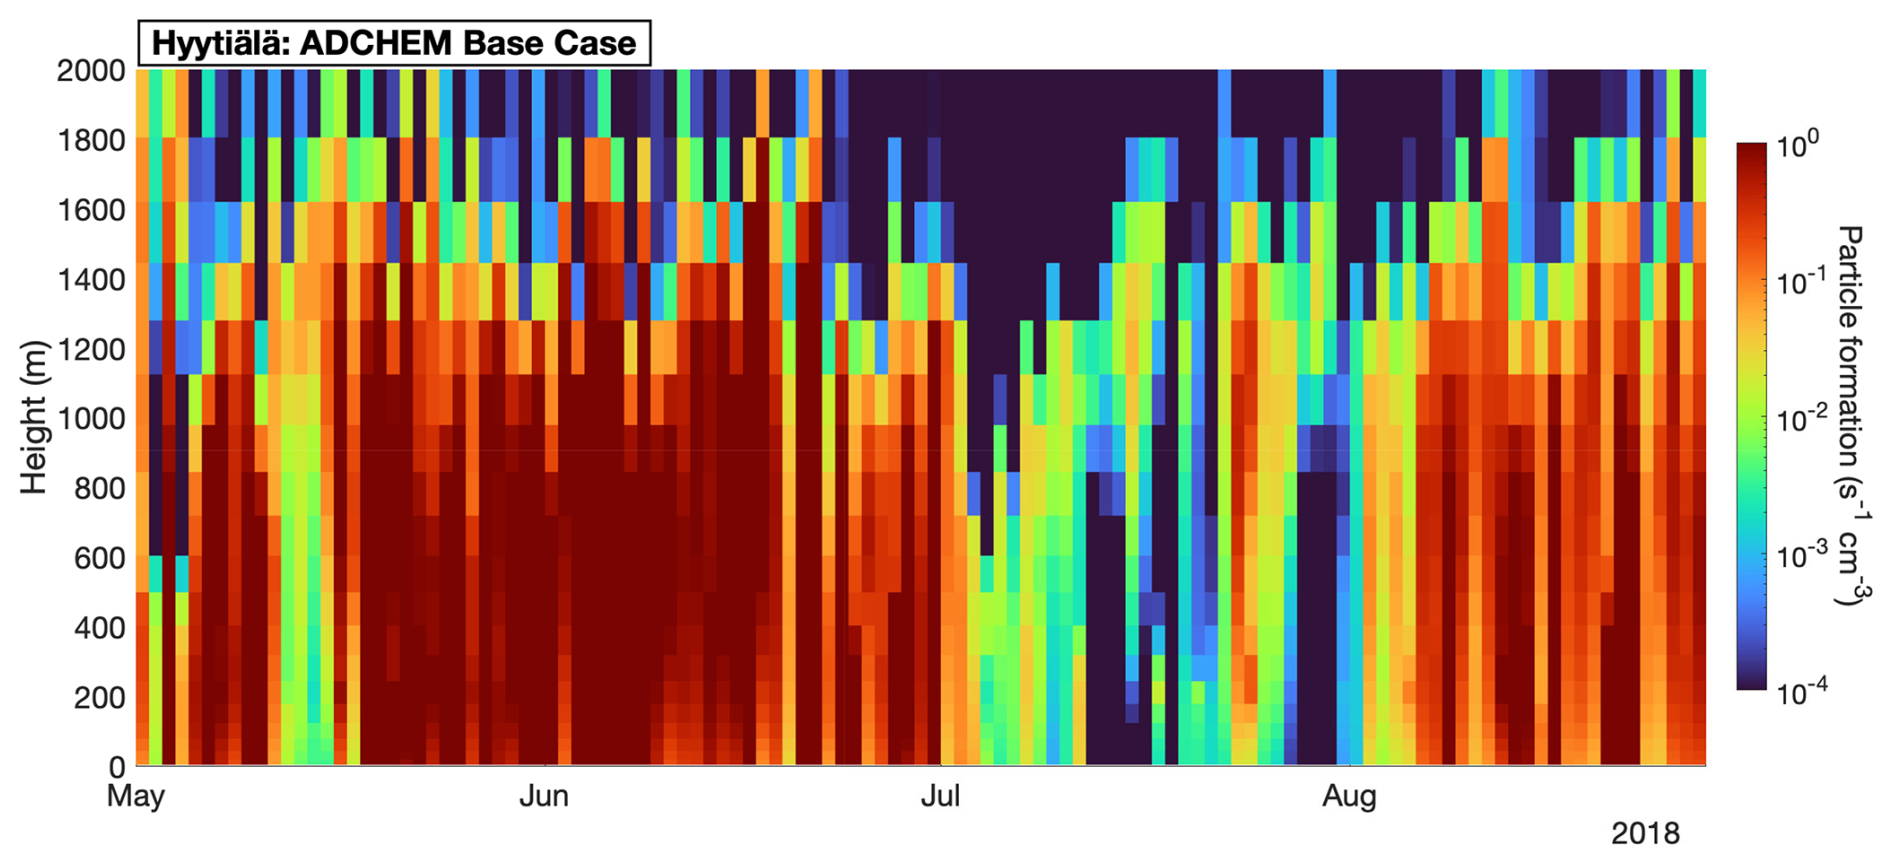
Figure A3Vertical distribution of daily mean particle formation rates in ADCHEM Base Case at Hyytiälä 2018, May to August.
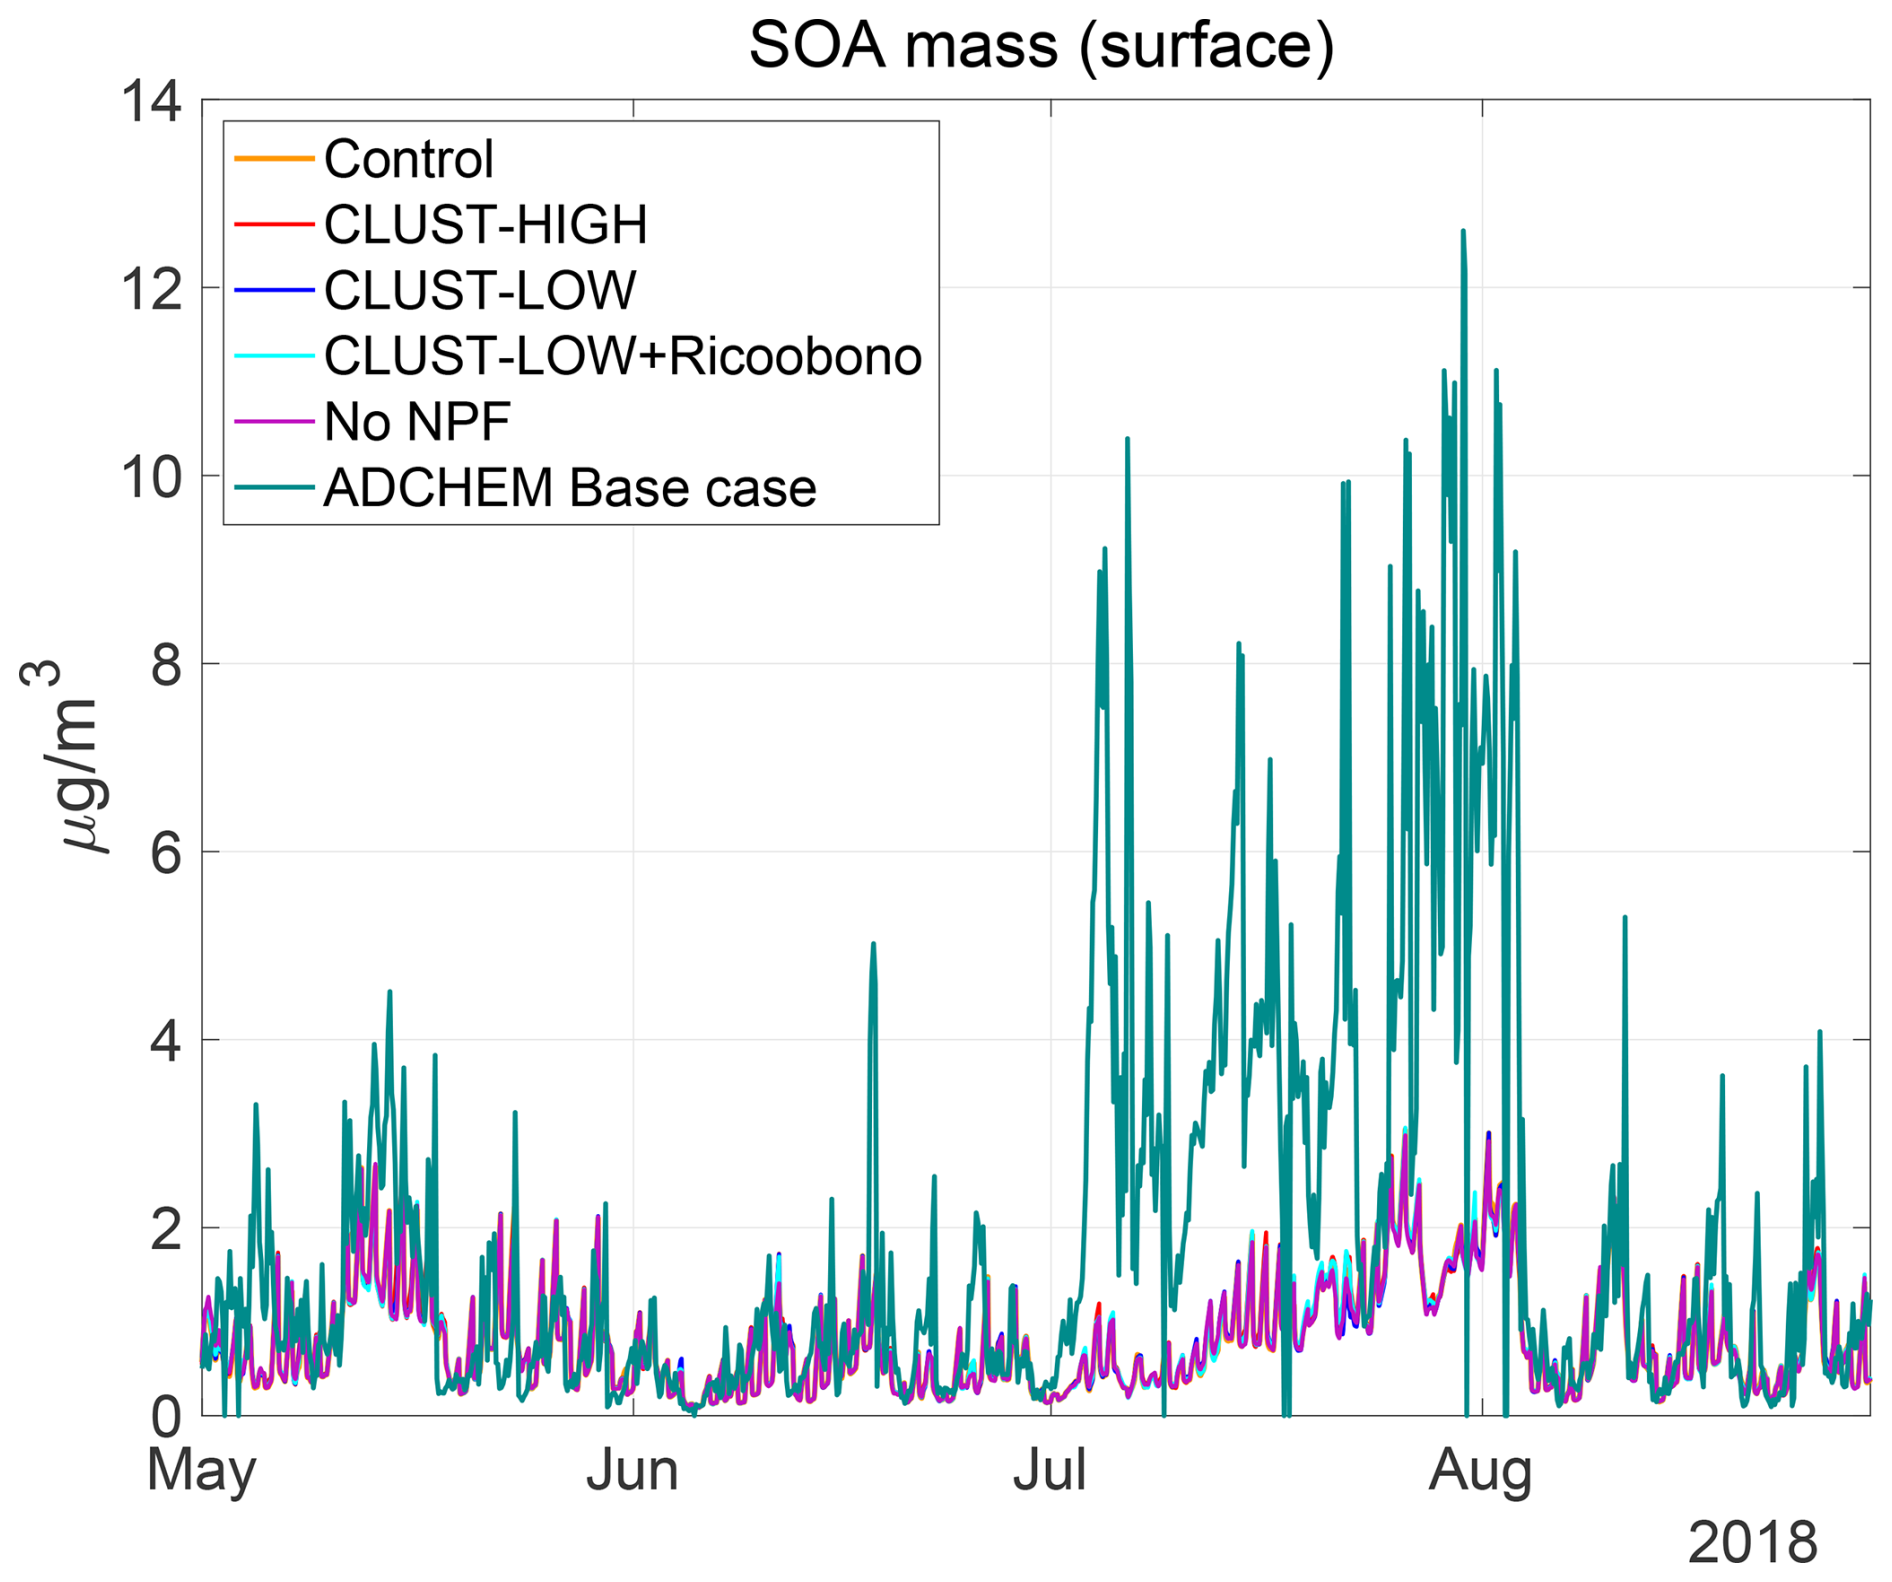
Figure A4Modelled mass concentration of particulate organic matter (SOA) for EC-Earth3 cases and ADCHEM at Hyytiälä 2018, May to August.
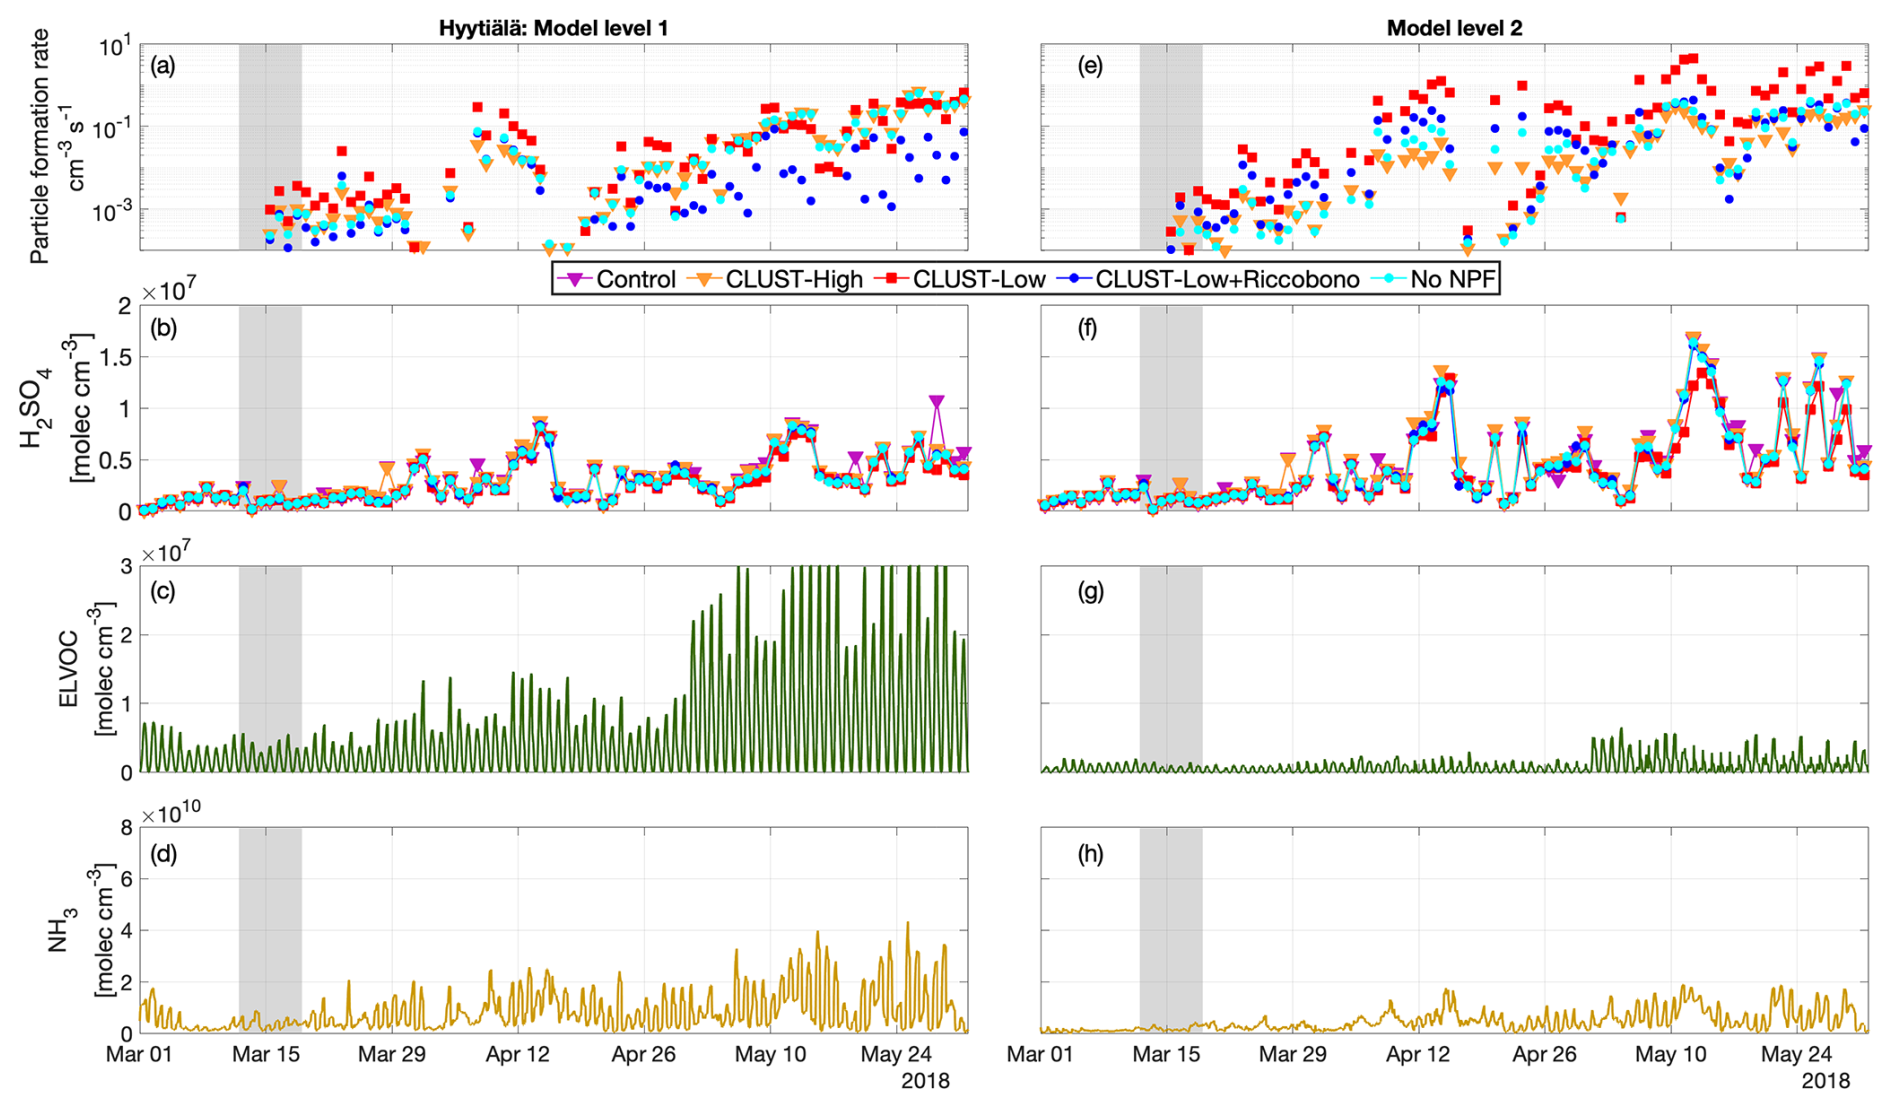
Figure A5EC-Earth3 modelled layer 1 and layer 2 Hyytiälä springtime: (a) daily maximum particle formation rate, (b) H2SO4, (c) no-NPF case for ELVOC, (d) no-NPF case for NH3 gas concentration. Shaded areas represent the studied weekly cases.
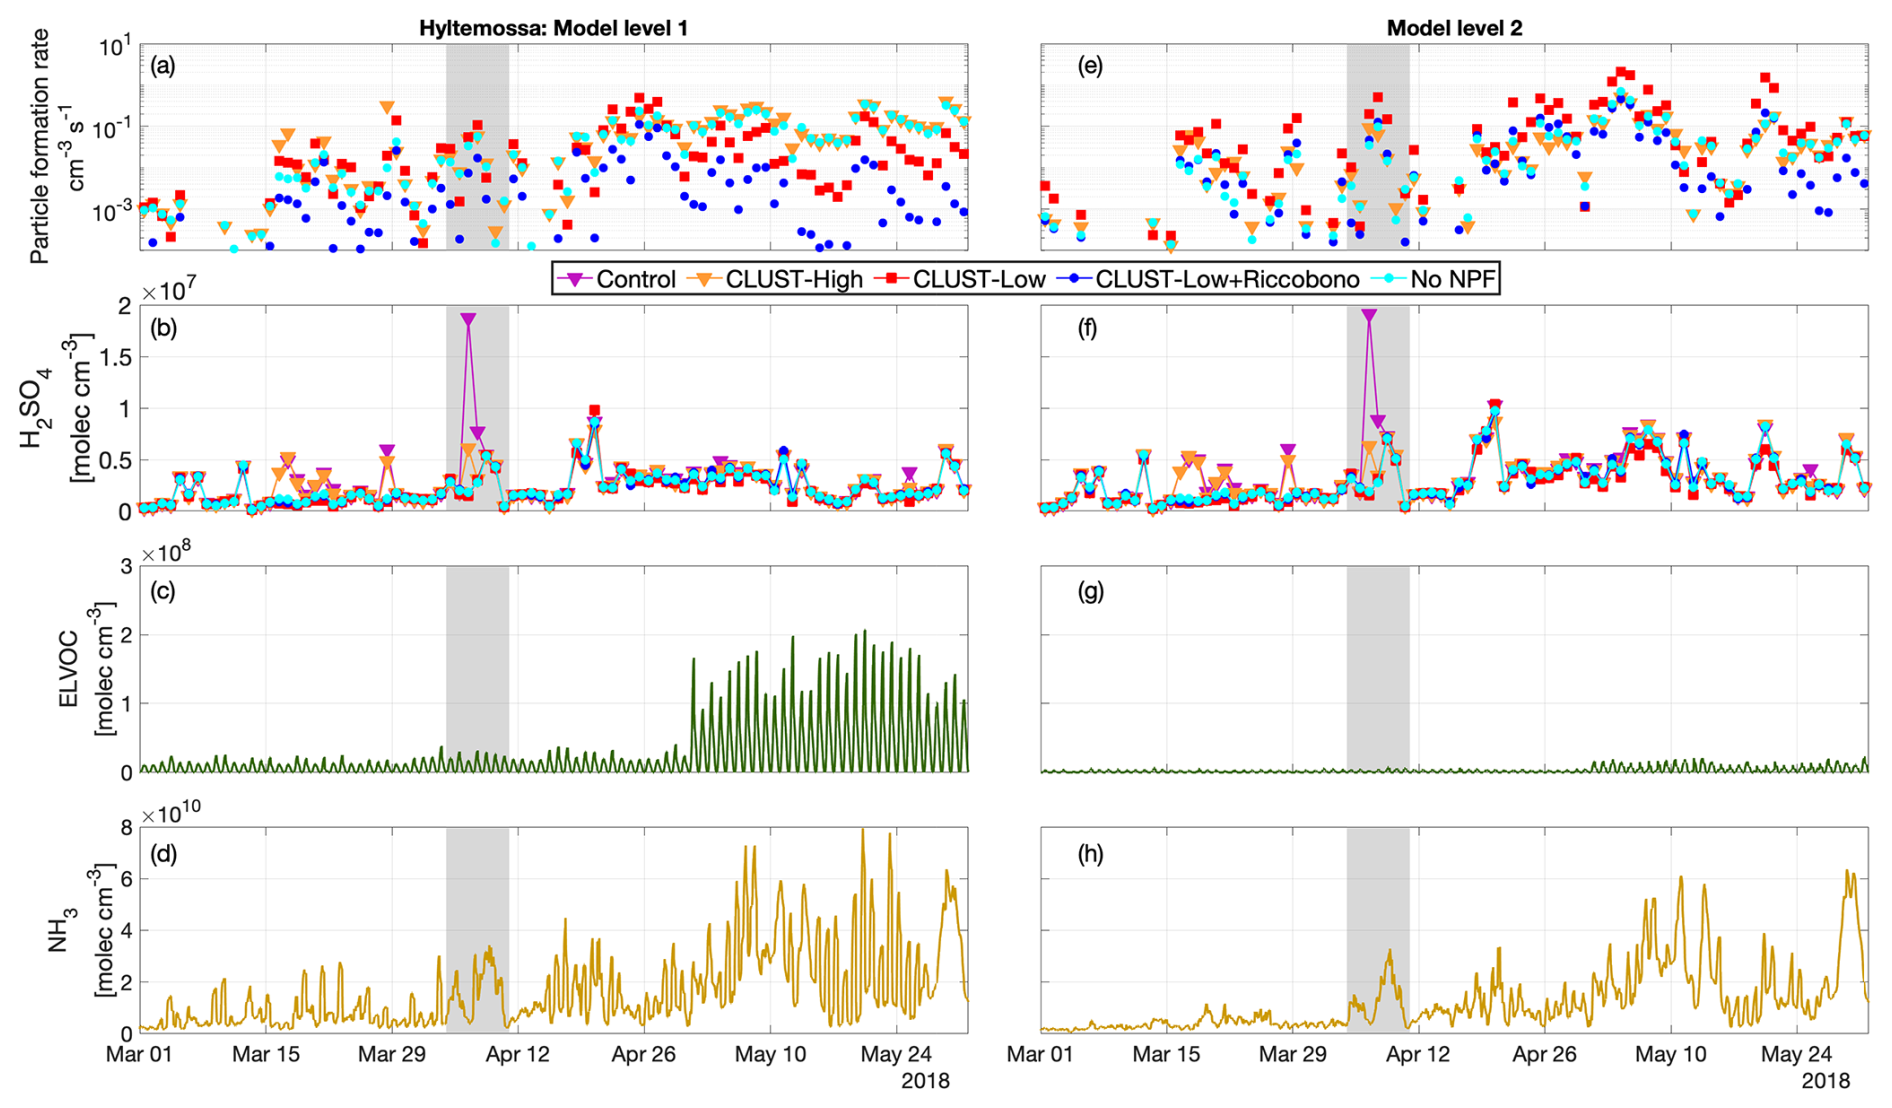
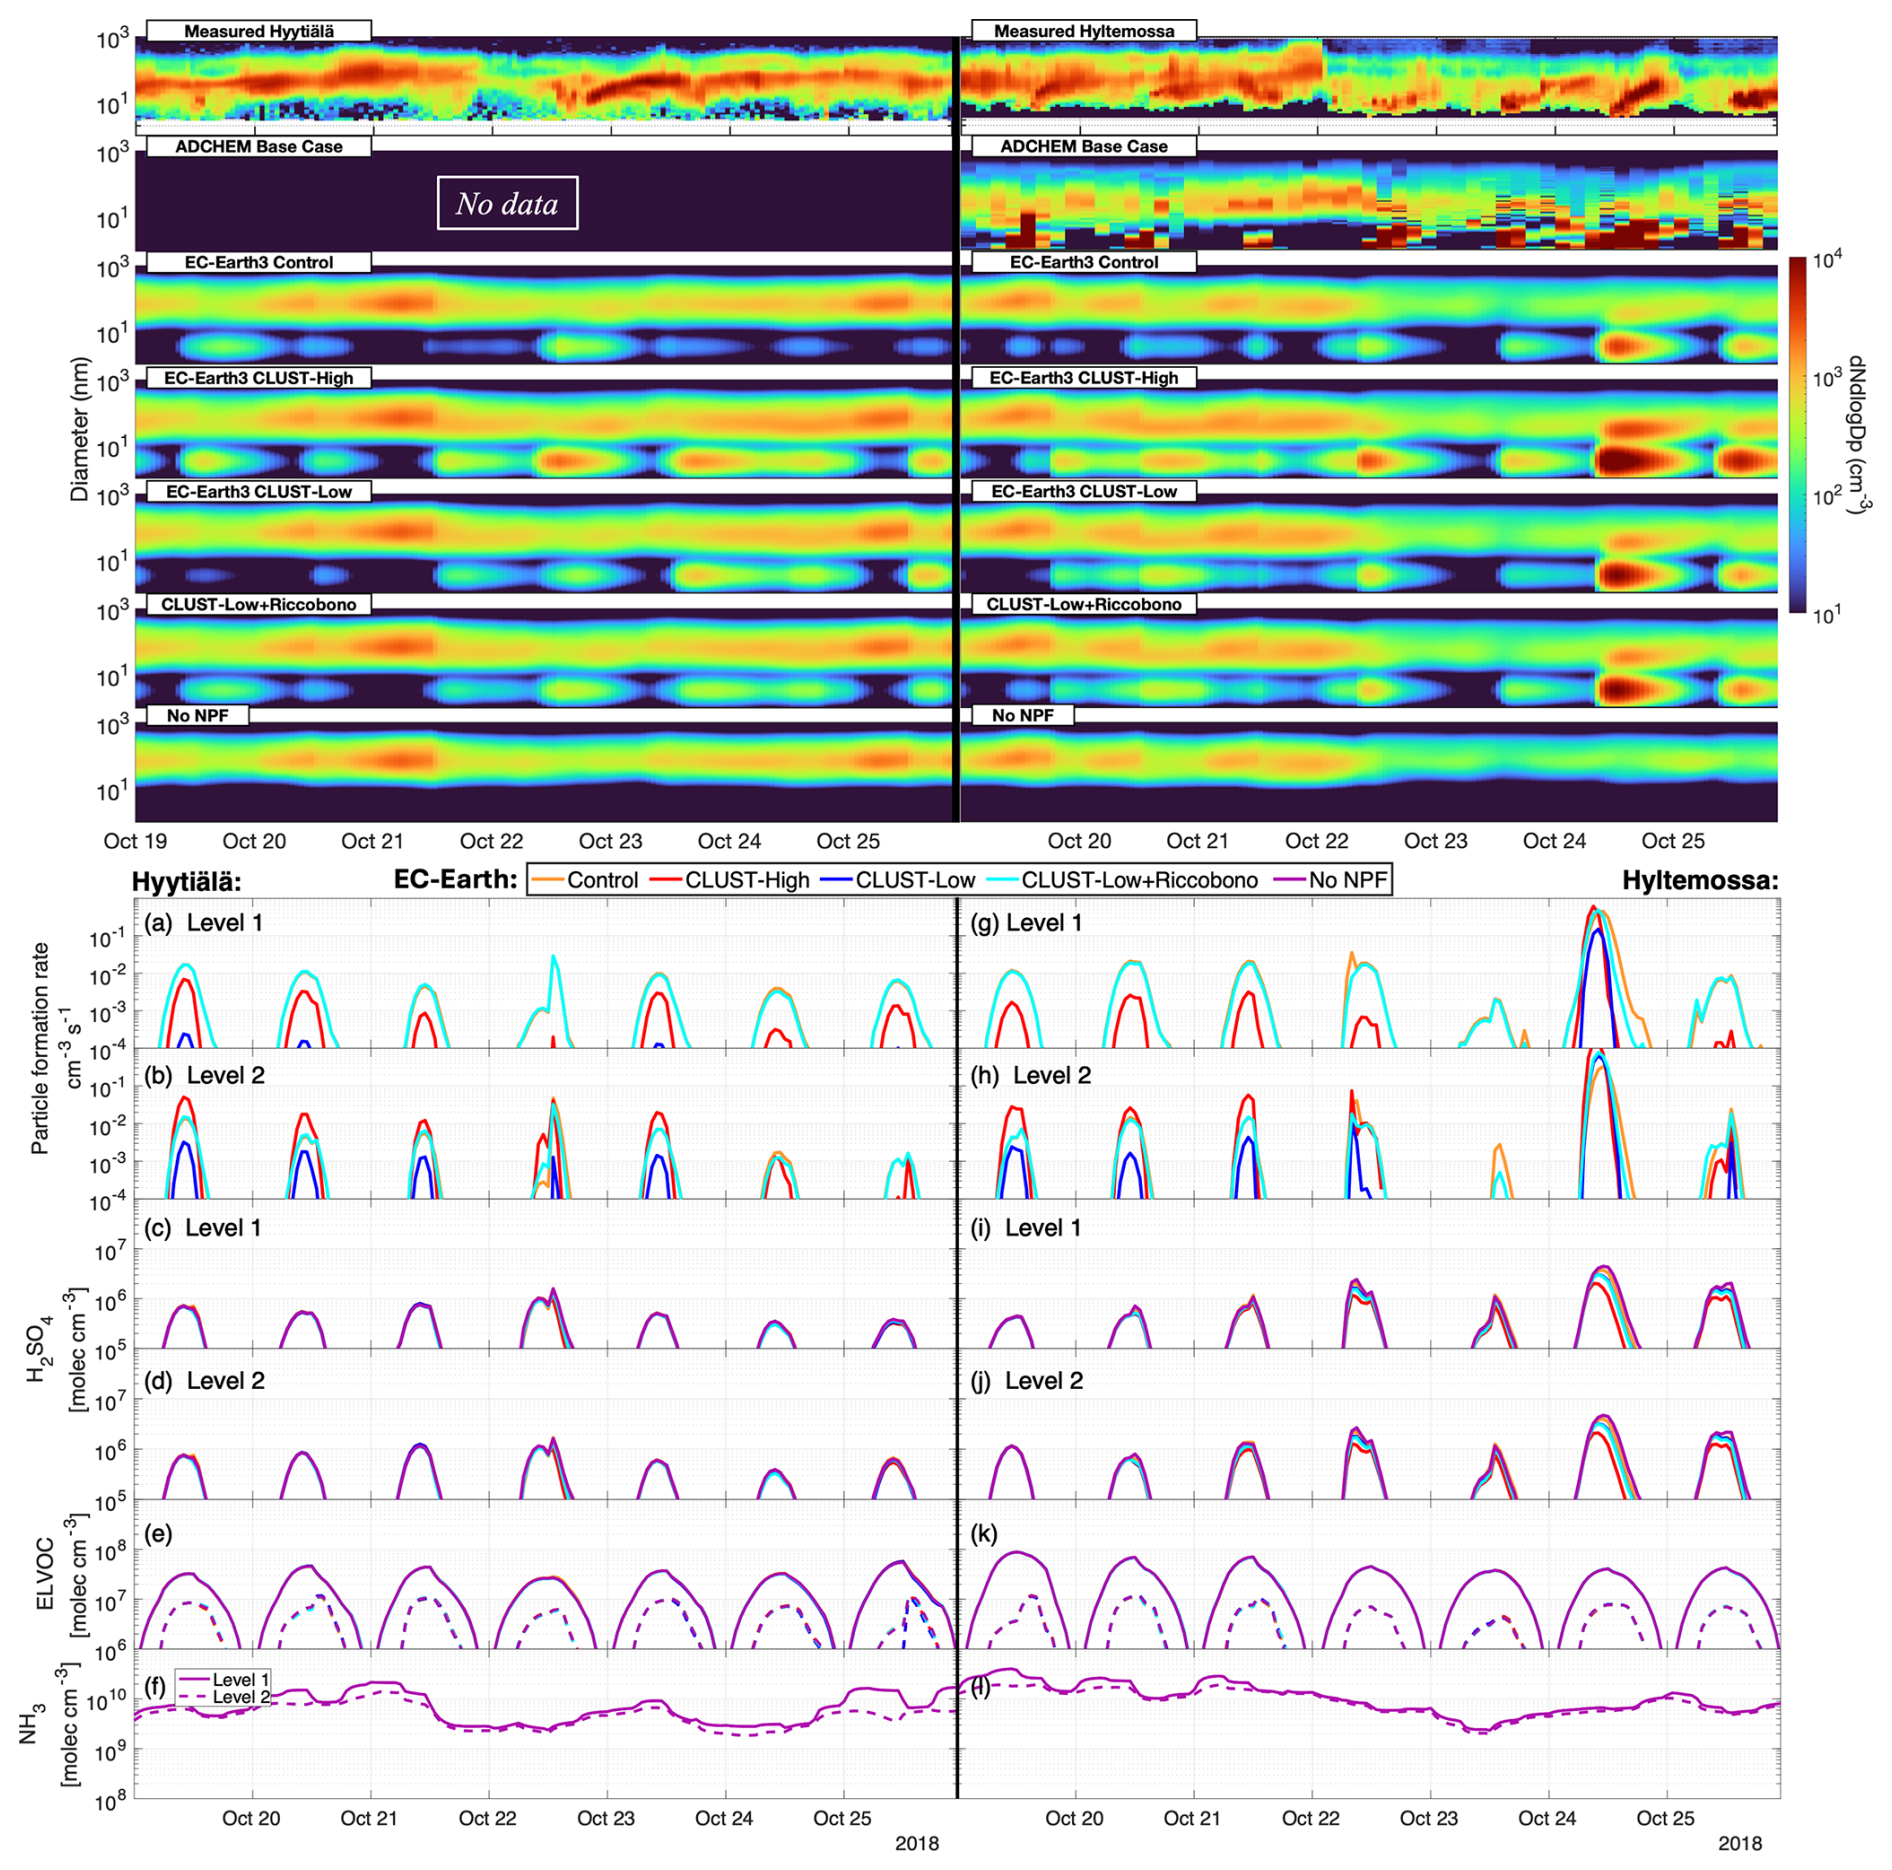
Figure A7The top two figures show the surface aerosol number size distribution over the autumn period for the five modelled EC-Earth3 cases, with the DMPS measured aerosols at Hyytiälä and Hyltemossa. ADCHEM simulations have no available hourly data outside the autumn months for Hyytiälä. The bottom section shows EC-Earth3 modelled layer 1 and layer 2 Hyytiälä and Hyltemossa autumn cases: (a, b, g, h) daily maximum particle formation rate, (c, d, i, j) H2SO4, (e, k) ELVOC, (f, l), NH3 gas concentration. The concentrations for ELVOC and NH3 level 2 are shown as dotted lines in (e, f, k, l). The missing particle formation rates below 10−4 in (a, b, g, h) are considered to be practically zero.
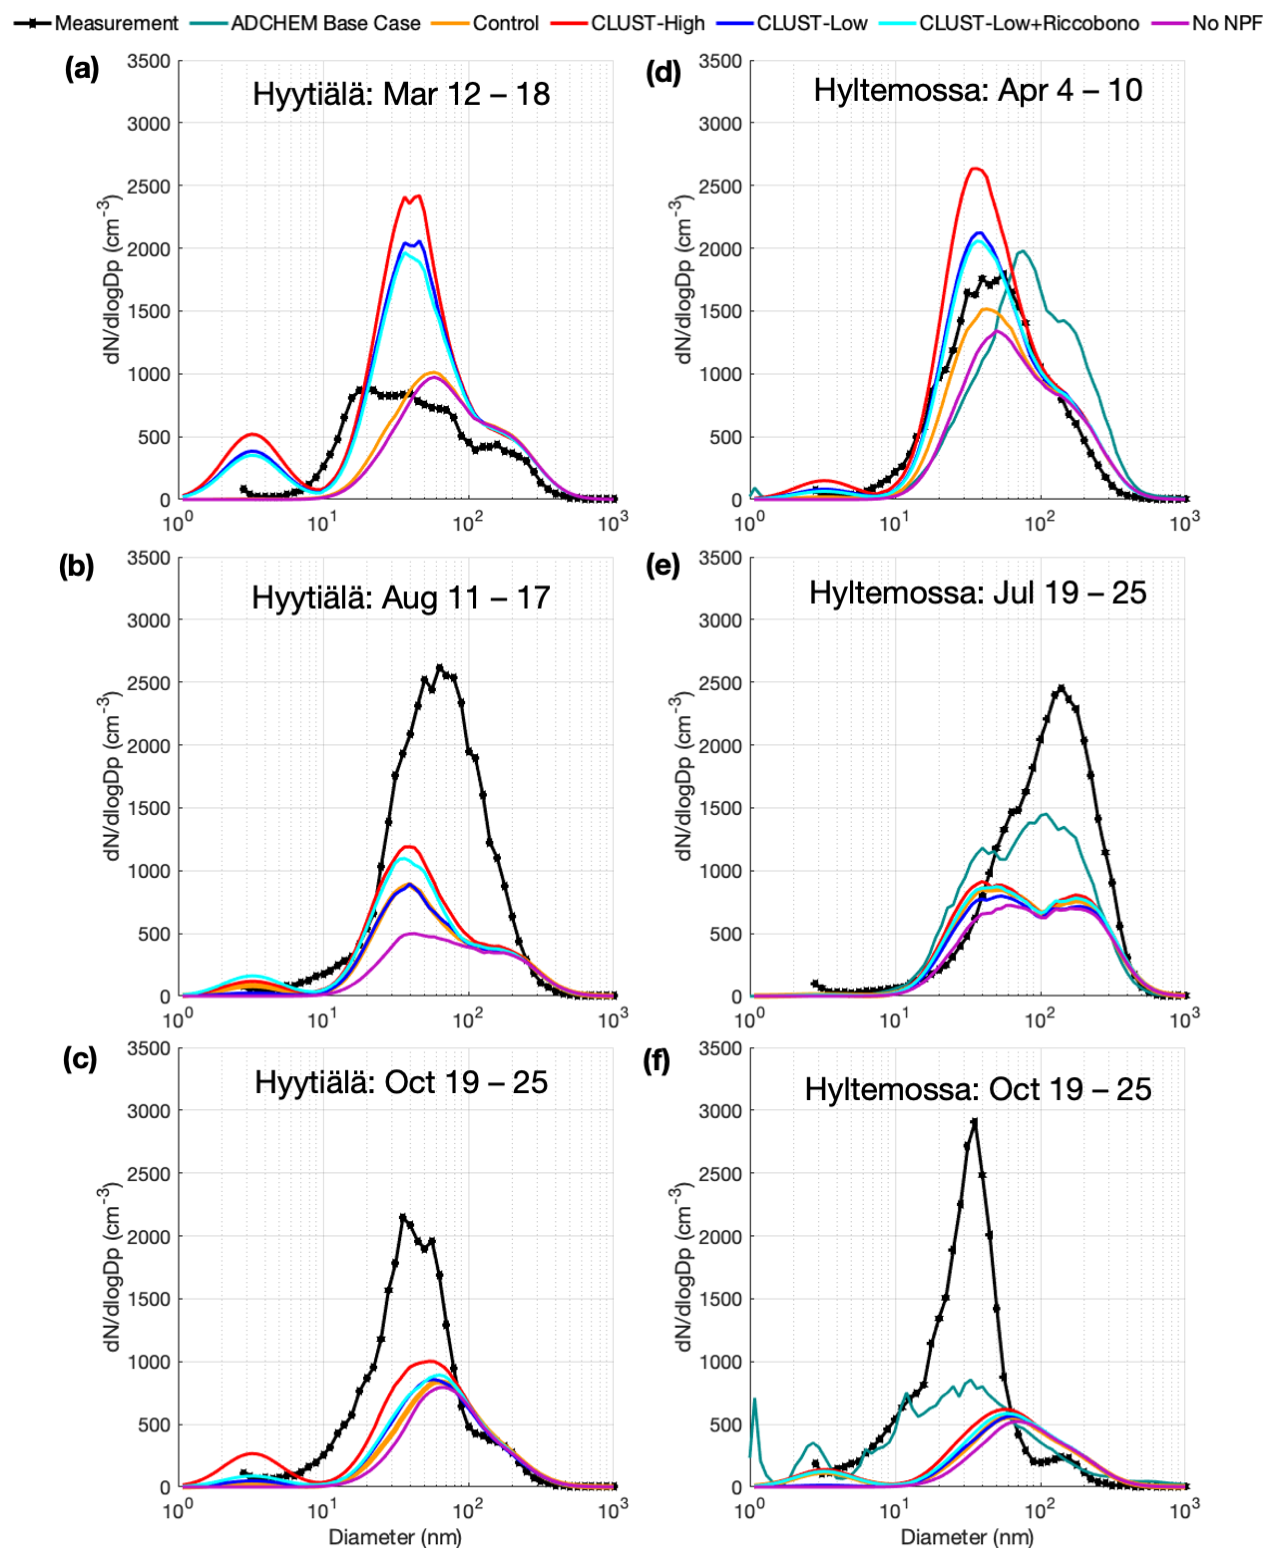
Figure A8Surface median particle number size distribution of studied seasonal weeks for spring, summer, and autumn, showing the five EC-Earth3 cases, ADCHEM, and the station measurements.
The model code for TM5-MP version 1.2 with implemented CLUST look-up table can be found at https://doi.org/10.5281/zenodo.10517639 (Svenhag, 2024a). The model output data-sets are to be found in https://doi.org/10.5281/zenodo.14039147 (Svenhag, 2024b); post-process scripts are located in https://doi.org/10.5281/zenodo.10512456 (Svenhag, 2024c). Codes for the J-GAIN v1.0 generator and the interpolator used for the CLUST look-up table in the experiments can be found at https://doi.org/10.5281/zenodo.8220223 (Yazgi and Olenius, 2023a). Resources for the IPR look-up table can be found in https://doi.org/10.5281/zenodo.3483797 (Yu, 2019). The DMPS measurement products at the stations are available for download at https://ebas-data.nilu.no/Default.aspx (last access: 18 December 2024; Tørseth et al., 2012).
CS, MKS, and PR designed the research idea. CS performed the EC-Earth3 simulations and post-process handling. RWdJ and PR provided ADCHEM base case data and their model description. TO and DY developed the CLUST model and CS performed the EC-Earth3 implementations of CLUST. SMB contributed with discussions for the analysis.
The contact author has declared that none of the authors has any competing interests.
Publisher’s note: Copernicus Publications remains neutral with regard to jurisdictional claims made in the text, published maps, institutional affiliations, or any other geographical representation in this paper. While Copernicus Publications makes every effort to include appropriate place names, the final responsibility lies with the authors.
The computations and data handling were enabled by resources provided by the National Academic Infrastructure for Supercomputing in Sweden (NAISS) and the Swedish National Infrastructure for Computing (SNIC) at Tetralith, partially funded by the Swedish Research Council through grant agreement nos. 2022-06725 and 2018-05973. The authors thank the Centre for Scientific and Technical Computing at Lund University (LUNARC), partially funded by the Swedish Research Council through grant agreement nos. 2022-06725 and 2018-05973.
The authors thank Markku Kulmala and Pasi Aalto for DMPS measurements obtained at SMEARII and Adam Kristensson for DMPS measurements obtained at Hyltemossa station. Thanks are given for the work of the technical staff and scientists in guaranteeing that the quality of the data is recognized from the ACTRIS programme. This work is supported by the Strategic Research Area “Modelling the Regional and Global Earth system”, MERGE, funded by the Swedish government.
This project was funded by the Swedish Research Council for Sustainable Development, Formas (project no. 2018-01745-COBACCA, grant no. 2018-01745). This research has also been supported by Formas grant 2019-01433, the Swedish Research Council (Vetenskapsrådet, grant nos. 2019-05006, 2019-04853, and 2022-02836), the EU Horizon Europe project AVENGERS (grant no. 101081322), the Crafoord Foundation (grant no. 20210969), the EU Horizon project PAREMPI (grant no. 101096133), the European Union’s Horizon 2020 research and innovation programme (project FORCeS under grant agreement no. 821205), the European Research Council (consolidator grant INTERGRATE no. 865799), and the Knut and Alice Wallenberg Foundation (Wallenberg Academy Fellowship project AtmoRemove, grant no. 2015.0162).
The publication of this article was funded by the Swedish Research Council, Forte, Formas, and Vinnova.
This paper was edited by Ann Fridlind and reviewed by Christina Williamson and two anonymous referees.
Albrecht, B. A.: Aerosols, cloud microphysics, and fractional cloudiness, Science, 245, 1227–1230, https://doi.org/10.1126/science.245.4923.1227, 1989. a
Atkinson, R., Baulch, D. L., Cox, R. A., Crowley, J. N., Hampson, R. F., Hynes, R. G., Jenkin, M. E., Rossi, M. J., Troe, J., and IUPAC Subcommittee: Evaluated kinetic and photochemical data for atmospheric chemistry: Volume II – gas phase reactions of organic species, Atmos. Chem. Phys., 6, 3625–4055, https://doi.org/10.5194/acp-6-3625-2006, 2006. a
Bergman, T., Makkonen, R., Schrödner, R., Swietlicki, E., Phillips, V. T. J., Le Sager, P., and van Noije, T.: Description and evaluation of a secondary organic aerosol and new particle formation scheme within TM5-MP v1.2, Geosci. Model Dev., 15, 683–713, https://doi.org/10.5194/gmd-15-683-2022, 2022. a, b, c
Besel, V., Kubečka, J., Kurtén, T., and Vehkamäki, H.: Impact of Quantum Chemistry Parameter Choices and Cluster Distribution Model Settings on Modeled Atmospheric Particle Formation Rates, J. Phys. Chem. A, 124, 5931–5943, https://doi.org/10.1021/acs.jpca.0c03984, 2020a. a
Besel, V., Kubečka, J., Kurtén, T., and Vehkamäki, H.: Impact of quantum chemistry parameter choices and cluster distribution model settings on modeled atmospheric particle formation rates, J. Phys. Chem. A, 124, 5931–5943, https://doi.org/10.1021/acs.jpca.0c03984, 2020b. a
Blichner, S. M., Sporre, M. K., and Berntsen, T. K.: Reduced effective radiative forcing from cloud–aerosol interactions (ERFaci) with improved treatment of early aerosol growth in an Earth system model, Atmos. Chem. Phys., 21, 17243–17265, https://doi.org/10.5194/acp-21-17243-2021, 2021. a
Bouwman, A. F., Lee, D. S., Asman, W. A. H., Dentener, F. J., Van Der Hoek, K. W., and Olivier, J. G. J.: A global high-resolution emission inventory for ammonia, Global Biogeochem. Cy., 11, 561–587, https://doi.org/10.1029/97GB02266, 1997. a
Brock, C. A., Williamson, C., Kupc, A., Froyd, K. D., Erdesz, F., Wagner, N., Richardson, M., Schwarz, J. P., Gao, R.-S., Katich, J. M., Campuzano-Jost, P., Nault, B. A., Schroder, J. C., Jimenez, J. L., Weinzierl, B., Dollner, M., Bui, T., and Murphy, D. M.: Aerosol size distributions during the Atmospheric Tomography Mission (ATom): methods, uncertainties, and data products, Atmos. Meas. Tech., 12, 3081–3099, https://doi.org/10.5194/amt-12-3081-2019, 2019. a
Carslaw, K., Lee, L., Reddington, C., Pringle, K., Rap, A., Forster, P., Mann, G., Spracklen, D., Woodhouse, M., Regayre, L., and Pierce, J.: Large contribution of natural aerosols to uncertainty in indirect forcing, Nature, 503, 67–71, https://doi.org/10.1038/nature12674, 2013. a
Craig, A., Valcke, S., and Coquart, L.: Development and performance of a new version of the OASIS coupler, OASIS3-MCT_3.0, Geosci. Model Dev., 10, 3297–3308, https://doi.org/10.5194/gmd-10-3297-2017, 2017. a
Curtius, J., Heinritzi, M., Beck, L. J., Pöhlker, M. L., Tripathi, N., Krumm, B. E., Holzbeck, P., Nussbaumer, C. M., Hernández Pardo, L., Klimach, T., Barmpounis, K., Andersen, S. T., Bardakov, R., Bohn, B., Cecchini, M. A., Chaboureau, J.-P., Dauhut, T., Dienhart, D., Dörich, R., Edtbauer, A., Giez, A., Hartmann, A., Holanda, B. A., Joppe, P., Kaiser, K., Keber, T., Klebach, H., Krüger, O. O., Kürten, A., Mallaun, C., Marno, D., Martinez, M., Monteiro, C., Nelson, C., Ort, L., Raj, S. S., Richter, S., Ringsdorf, A., Rocha, F., Simon, M., Sreekumar, S., Tsokankunku, A., Unfer, G. R., Valenti, I. D., Wang, N., Zahn, A., Zauner-Wieczorek, M., Albrecht, R. I., Andreae, M. O., Artaxo, P., Crowley, J. N., Fischer, H., Harder, H., Herdies, D. L., Machado, L. A. T., Pöhlker, C., Pöschl, U., Possner, A., Pozzer, A., Schneider, J., Williams, J., and Lelieveld, J.: Isoprene nitrates drive new particle formation in Amazon’s upper troposphere, Nature, 636, 124–130, https://doi.org/10.1038/s41586-024-08192-4, 2024. a
Dunne, E. M., Gordon, H., Kürten, A., Almeida, J., Duplissy, J., Williamson, C., Ortega, I. K., Pringle, K. J., Adamov, A., Baltensperger, U., Barmet, P., Benduhn, F., Bianchi, F., Breitenlechner, M., Clarke, A., Curtius, J., Dommen, J., Donahue, N. M., Ehrhart, S., Flagan, R. C., Franchin, A., Guida, R., Hakala, J., Hansel, A., Heinritzi, M., Jokinen, T., Kangasluoma, J., Kirkby, J., Kulmala, M., Kupc, A., Lawler, M. J., Lehtipalo, K., Makhmutov, V., Mann, G., Mathot, S., Merikanto, J., Miettinen, P., Nenes, A., Onnela, A., Rap, A., Reddington, C. L. S., Riccobono, F., Richards, N. A. D., Rissanen, M. P., Rondo, L., Sarnela, N., Schobesberger, S., Sengupta, K., Simon, M., Sipilä, M., Smith, J. N., Stozkhov, Y., Tomé, A., Tröstl, J., Wagner, P. E., Wimmer, D., Winkler, P. M., Worsnop, D. R., and Carslaw, K. S.: Global atmospheric particle formation from CERN CLOUD measurements, Science, 354, 1119–1124, https://doi.org/10.1126/science.aaf2649, 2016. a
Forster, P., Storelvmo, T., Armour, K., Collins, W., Dufresne, J.-L., Frame, D., Lunt, D., Mauritsen, T., Palmer, M., Watanabe, M., Wild, M., and Zhang, H.: The Earth’s Energy Budget, Climate Feedbacks, and Climate Sensitivity, Cambridge University Press, Cambridge, United Kingdom and New York, NY, USA, 923–1054, https://doi.org/10.1017/9781009157896.009, 2021. a, b, c
Granier, C., S., Darras, H., Denier van der Gon, J., Doubalova, N., Elguindi, B., Galle, M., Gauss, M., Guevara, J., Jalkanen, J., Kuenen, C., Liousse, B., Quack, D., Simpson, K., and Sindelarova: The Copernicus Atmosphere Monitoring Service global and regional emissions (April 2019 version), Tech. rep., Copernicus Atmosphere Monitoring Service, https://doi.org/10.24380/d0bn-kx16, 2019. a
Guenther, A. B., Jiang, X., Heald, C. L., Sakulyanontvittaya, T., Duhl, T., Emmons, L. K., and Wang, X.: The Model of Emissions of Gases and Aerosols from Nature version 2.1 (MEGAN2.1): an extended and updated framework for modeling biogenic emissions, Geosci. Model Dev., 5, 1471–1492, https://doi.org/10.5194/gmd-5-1471-2012, 2012. a
Hari, P. and Kulmala, M.: Station for Measuring Ecosystem-Atmosphere Relations (SMEAR II), Boreal Environ Res,, 10, 315–322, 2005. a
Jeričević, A., Kraljević, L., Grisogono, B., Fagerli, H., and Večenaj, Ž.: Parameterization of vertical diffusion and the atmospheric boundary layer height determination in the EMEP model, Atmos. Chem. Phys., 10, 341–364, https://doi.org/10.5194/acp-10-341-2010, 2010. a
Jokinen, T., Berndt, T., Makkonen, R., Kerminen, V.-M., Junninen, H., Paasonen, P., Stratmann, F., Herrmann, H., Guenther, A. B., Worsnop, D. R., Kulmala, M., Ehn, M., and Sipilä, M.: Production of extremely low volatile organic compounds from biogenic emissions: Measured yields and atmospheric implications, P. Natl. Acad. Sci. USA, 112, 7123–7128, https://doi.org/10.1073/pnas.1423977112, 2015. a, b
Kerminen, V.-M. and Kulmala, M.: Analytical formulae connecting the “real” and the “apparent” nucleation rate and the nuclei number concentration for atmospheric nucleation events, J. Aerosol Sci., 33, 609–622, https://doi.org/10.1016/s0021-8502(01)00194-x, 2002. a
Krol, M., Houweling, S., Bregman, B., van den Broek, M., Segers, A., van Velthoven, P., Peters, W., Dentener, F., and Bergamaschi, P.: The two-way nested global chemistry-transport zoom model TM5: algorithm and applications, Atmos. Chem. Phys., 5, 417–432, https://doi.org/10.5194/acp-5-417-2005, 2005. a
Lamarque, J.-F., Bond, T. C., Eyring, V., Granier, C., Heil, A., Klimont, Z., Lee, D., Liousse, C., Mieville, A., Owen, B., Schultz, M. G., Shindell, D., Smith, S. J., Stehfest, E., Van Aardenne, J., Cooper, O. R., Kainuma, M., Mahowald, N., McConnell, J. R., Naik, V., Riahi, K., and van Vuuren, D. P.: Historical (1850–2000) gridded anthropogenic and biomass burning emissions of reactive gases and aerosols: methodology and application, Atmos. Chem. Phys., 10, 7017–7039, https://doi.org/10.5194/acp-10-7017-2010, 2010. a, b
Lana, A., Bell, T. G., Simó, R., Vallina, S. M., Ballabrera-Poy, J., Kettle, A. J., Dachs, J., Bopp, L., Saltzman, E. S., Stefels, J., Johnson, J. E., and Liss, P. S.: An updated climatology of surface dimethlysulfide concentrations and emission fluxes in the global ocean, Global Biogeochem. Cy., 25, 886, https://doi.org/10.1029/2010GB003850, 2011. a
Lehtinen, K. E., Dal Maso, M., Kulmala, M., and Kerminen, V.-M.: Estimating nucleation rates from apparent particle formation rates and vice versa: Revised formulation of the Kerminen–Kulmala equation, J. Aerosol Sci., 38, 988–994, https://doi.org/10.1016/j.jaerosci.2007.06.009, 2007. a
Lennartz, S. T., Marandino, C. A., von Hobe, M., Cortes, P., Quack, B., Simo, R., Booge, D., Pozzer, A., Steinhoff, T., Arevalo-Martinez, D. L., Kloss, C., Bracher, A., Röttgers, R., Atlas, E., and Krüger, K.: Direct oceanic emissions unlikely to account for the missing source of atmospheric carbonyl sulfide, Atmos. Chem. Phys., 17, 385–402, https://doi.org/10.5194/acp-17-385-2017, 2017. a
Mann, G. W., Carslaw, K. S., Reddington, C. L., Pringle, K. J., Schulz, M., Asmi, A., Spracklen, D. V., Ridley, D. A., Woodhouse, M. T., Lee, L. A., Zhang, K., Ghan, S. J., Easter, R. C., Liu, X., Stier, P., Lee, Y. H., Adams, P. J., Tost, H., Lelieveld, J., Bauer, S. E., Tsigaridis, K., van Noije, T. P. C., Strunk, A., Vignati, E., Bellouin, N., Dalvi, M., Johnson, C. E., Bergman, T., Kokkola, H., von Salzen, K., Yu, F., Luo, G., Petzold, A., Heintzenberg, J., Clarke, A., Ogren, J. A., Gras, J., Baltensperger, U., Kaminski, U., Jennings, S. G., O'Dowd, C. D., Harrison, R. M., Beddows, D. C. S., Kulmala, M., Viisanen, Y., Ulevicius, V., Mihalopoulos, N., Zdimal, V., Fiebig, M., Hansson, H.-C., Swietlicki, E., and Henzing, J. S.: Intercomparison and evaluation of global aerosol microphysical properties among AeroCom models of a range of complexity, Atmos. Chem. Phys., 14, 4679–4713, https://doi.org/10.5194/acp-14-4679-2014, 2014. a
Myllys, N., Kubečka, J., Besel, V., Alfaouri, D., Olenius, T., Smith, J. N., and Passananti, M.: Role of base strength, cluster structure and charge in sulfuric-acid-driven particle formation, Atmos. Chem. Phys., 19, 9753–9768, https://doi.org/10.5194/acp-19-9753-2019, 2019. a
Nault, B. A., Jo, D. S., McDonald, B. C., Campuzano-Jost, P., Day, D. A., Hu, W., Schroder, J. C., Allan, J., Blake, D. R., Canagaratna, M. R., Coe, H., Coggon, M. M., DeCarlo, P. F., Diskin, G. S., Dunmore, R., Flocke, F., Fried, A., Gilman, J. B., Gkatzelis, G., Hamilton, J. F., Hanisco, T. F., Hayes, P. L., Henze, D. K., Hodzic, A., Hopkins, J., Hu, M., Huey, L. G., Jobson, B. T., Kuster, W. C., Lewis, A., Li, M., Liao, J., Nawaz, M. O., Pollack, I. B., Peischl, J., Rappenglück, B., Reeves, C. E., Richter, D., Roberts, J. M., Ryerson, T. B., Shao, M., Sommers, J. M., Walega, J., Warneke, C., Weibring, P., Wolfe, G. M., Young, D. E., Yuan, B., Zhang, Q., de Gouw, J. A., and Jimenez, J. L.: Secondary organic aerosols from anthropogenic volatile organic compounds contribute substantially to air pollution mortality, Atmos. Chem. Phys., 21, 11201–11224, https://doi.org/10.5194/acp-21-11201-2021, 2021. a
Neefjes, I., Laapas, M., Liu, Y., Médus, E., Miettunen, E., Ahonen, L., Quéléver, L., Aalto, J., Bäck, J., Kerminen, V.-M., Lamplahti, J., Luoma, K., Maki, M., Mammarella, I., Petäjä, T., Räty, M., Sarnela, N., Ylivinkka, I., Hakala, S., and Lintunen, A.: 25 years of atmospheric and ecosystem measurements in a boreal forest – Seasonal variation and responses to warm and dry years, Boreal Environ. Res., 27, 1–31, 2022. a
Nieminen, T., Asmi, A., Dal Maso, M., Aalto, P., Keronen, P., Petäjä, T., Kulmala, M., and Kerminen, V.-M.: Trends in atmospheric new-particle formation: 16 years of observations in a boreal-forest environment, Boreal Environ. Res., 19, 191–214, 2014. a
Nightingale, P. D., Malin, G., Law, C. S., Watson, A. J., Liss, P. S., Liddicoat, M. I., Boutin, J., and Upstill-Goddard, R. C.: In situ evaluation of air-sea gas exchange parameterizations using novel conservative and volatile tracers, Global Biogeochem. Cy., 14, 373–387, https://doi.org/10.1029/1999GB900091, 2000. a
Ning, A., Liu, L., Zhang, S., Yu, F., Du, L., Ge, M., and Zhang, X.: The critical role of dimethylamine in the rapid formation of iodic acid particles in marine areas, npj Clim. Atmos. Sci., 5, 92, https://doi.org/10.1038/s41612-022-00316-9, 2022. a
Olenius, T.: Atmospheric Cluster Dynamics Code Github Repository, Github [code], https://github.com/tolenius/ACDC (last access: 26 September 2022), 2021. a
Olenius, T. and Roldin, P.: Role of gas–molecular cluster–aerosol dynamics in atmospheric new-particle formation, Sci. Rep., 12, 10135, https://doi.org/10.1038/s41598-022-14525-y, 2022. a
Olenius, T., Kupiainen-Määttä, O., Ortega, I. K., Kurtén, T., and Vehkamäki, H.: Free energy barrier in the growth of sulfuric acid–ammonia and sulfuric acid–dimethylamine clusters, J. Chem. Phys., 139, 084312, https://doi.org/10.1063/1.4819024, 2013. a, b
Öström, E., Putian, Z., Schurgers, G., Mishurov, M., Kivekäs, N., Lihavainen, H., Ehn, M., Rissanen, M. P., Kurtén, T., Boy, M., Swietlicki, E., and Roldin, P.: Modeling the role of highly oxidized multifunctional organic molecules for the growth of new particles over the boreal forest region, Atmos. Chem. Phys., 17, 8887–8901, https://doi.org/10.5194/acp-17-8887-2017, 2017. a
Patoulias, D., Florou, K., Pandis, S. N., and Nenes, A.: New Particle Formation Events Can Reduce Cloud Droplets in Boundary Layer Clouds at the Continental Scale, Geophys. Res. Lett., 51, e2023GL106182, https://doi.org/10.1029/2023GL106182, 2024. a
Pye, H. O. T., Ward-Caviness, C. K., Murphy, B. N., Appel, K. W., and Seltzer, K. M.: Secondary organic aerosol association with cardiorespiratory disease mortality in the United States, Nat. Commun., 12, 7215, https://doi.org/10.1038/s41467-021-27484-1, 2021. a
Riccobono, F., Schobesberger, S., Scott, C. E., Dommen, J., Ortega, I. K., Rondo, L., Almeida, J., Amorim, A., Bianchi, F., Breitenlechner, M., David, A., Downard, A., Dunne, E. M., Duplissy, J., Ehrhart, S., Flagan, R. C., Franchin, A., Hansel, A., Junninen, H., Kajos, M., Keskinen, H., Kupc, A., Kürten, A., Kvashin, A. N., Laaksonen, A., Lehtipalo, K., Makhmutov, V., Mathot, S., Nieminen, T., Onnela, A., Petäjä, T., Praplan, A. P., Santos, F. D., Schallhart, S., Seinfeld, J. H., Sipilä, M., Spracklen, D. V., Stozhkov, Y., Stratmann, F., Tomé, A., Tsagkogeorgas, G., Vaattovaara, P., Viisanen, Y., Vrtala, A., Wagner, P. E., Weingartner, E., Wex, H., Wimmer, D., Carslaw, K. S., Curtius, J., Donahue, N. M., Kirkby, J., Kulmala, M., Worsnop, D. R., and Baltensperger, U.: Oxidation products of biogenic emissions contribute to nucleation of atmospheric particles, Science, 344, 717–721, https://doi.org/10.1126/science.1243527, 2014. a, b, c
Roldin, P., Ehn, M., Kurtén, T., Olenius, T., Rissanen, M. P., Sarnela, N., Elm, J., Rantala, P., Hao, L., Hyttinen, N., Heikkinen, L., Worsnop, D., Pichelstorfer, L., Xavier, C., Clusius, P., Öström, E., Petäjä, T., Kulmala, M., Vehkamäki, H., and Boy, M.: The role of highly oxygenated organic molecules in the boreal aerosol-cloud-climate system, Nat. Commun., 10, 4370, https://doi.org/10.1038/s41467-019-12338-8, 2019. a, b, c
Rolph, G., Stein, A., and Stunder, B.: Real-time Environmental Applications and Display sYstem: READY, Environ. Model. Softw., 95, 210–228, https://doi.org/10.1016/j.envsoft.2017.06.025, 2017. a
Sindelarova, K., Granier, C., Bouarar, I., Guenther, A., Tilmes, S., Stavrakou, T., Müller, J.-F., Kuhn, U., Stefani, P., and Knorr, W.: Global data set of biogenic VOC emissions calculated by the MEGAN model over the last 30 years, Atmos. Chem. Phys., 14, 9317–9341, https://doi.org/10.5194/acp-14-9317-2014, 2014a. a
Sindelarova, K., Granier, C., Bouarar, I., Guenther, A., Tilmes, S., Stavrakou, T., Müller, J.-F., Kuhn, U., Stefani, P., and Knorr, W.: Global data set of biogenic VOC emissions calculated by the MEGAN model over the last 30 years, Atmos. Chem. Phys., 14, 9317–9341, https://doi.org/10.5194/acp-14-9317-2014, 2014b. a
Sporre, M. K., Blichner, S. M., Schrödner, R., Karset, I. H. H., Berntsen, T. K., van Noije, T., Bergman, T., O'Donnell, D., and Makkonen, R.: Large difference in aerosol radiative effects from BVOC-SOA treatment in three Earth system models, Atmos. Chem. Phys., 20, 8953–8973, https://doi.org/10.5194/acp-20-8953-2020, 2020. a, b, c
Stein, A. F., Draxler, R. R., Rolph, G. D., Stunder, B. J. B., Cohen, M. D., and Ngan, F.: NOAA’s HYSPLIT Atmospheric Transport and Dispersion Modeling System, B. Am. Meteorol. Soc., 96, 2059–2077, https://doi.org/10.1175/BAMS-D-14-00110.1, 2015. a
Sullivan, R., Crippa, P., Matsui, H., Leung, L., Zhao, C., Thota, A., and Pryor, S.: New particle formation leads to cloud dimming, npj Clim. Atmos. Sci., 1, 9, https://doi.org/10.1038/s41612-018-0019-7, 2018. a
Svenhag, C.: TM5-MP model version 1.2 code used in cb05_CLUST NPF project, Zenodo [code], https://doi.org/10.5281/zenodo.10517639, 2024a. a
Svenhag, C.: Data for: Modeling and observational analysis of new particle formation under boreal conditions by Earth system model and detailed aerosol simulations, Zenodo [data set], https://doi.org/10.5281/zenodo.14039147, 2024b. a
Svenhag, C.: Post-process handling scripts for publication: “Implementing detailed nucleation predictions in the Earth system model EC-Earth3.3.4: sulfuric acid-ammonia nucleation”, Zenodo [code], https://doi.org/10.5281/zenodo.10512456, 2024c. a
Svenhag, C., Sporre, M. K., Olenius, T., Yazgi, D., Blichner, S. M., Nieradzik, L. P., and Roldin, P.: Implementing detailed nucleation predictions in the Earth system model EC-Earth3.3.4: sulfuric acid–ammonia nucleation, Geosci. Model Dev., 17, 4923–4942, https://doi.org/10.5194/gmd-17-4923-2024, 2024. a, b, c, d, e, f, g, h, i, j
Szopa, S., Naik, V., Adhikary, B., Artaxo, P., Berntsen, T., Collins, W. D., Fuzzi, S., Gallardo, L., Kiendler-Scharr, A., Klimont, Z., Liao, H., Unger, N., and Zanis, P.: Short-Lived Climate Forcers, Cambridge University Press, Cambridge, United Kingdom and New York, NY, USA, 817–922, https://doi.org/10.1017/9781009157896.008, 2021. a
Twomey, S.: Pollution and the planetary albedo, Atmos. Environ., 8, 1251–1256, https://doi.org/10.1016/0004-6981(74)90004-3, 1974. a
Tørseth, K., Aas, W., Breivik, K., Fjæraa, A. M., Fiebig, M., Hjellbrekke, A. G., Lund Myhre, C., Solberg, S., and Yttri, K. E.: Introduction to the European Monitoring and Evaluation Programme (EMEP) and observed atmospheric composition change during 1972–2009, Atmos. Chem. Phys., 12, 5447–5481, https://doi.org/10.5194/acp-12-5447-2012, 2012. a, b, c
van Noije, T., Bergman, T., Le Sager, P., O'Donnell, D., Makkonen, R., Gonçalves-Ageitos, M., Döscher, R., Fladrich, U., von Hardenberg, J., Keskinen, J.-P., Korhonen, H., Laakso, A., Myriokefalitakis, S., Ollinaho, P., Pérez García-Pando, C., Reerink, T., Schrödner, R., Wyser, K., and Yang, S.: EC-Earth3-AerChem: a global climate model with interactive aerosols and atmospheric chemistry participating in CMIP6 , Geosci. Model Dev., 14, 5637–5668, https://doi.org/10.5194/gmd-14-5637-2021, 2021. a, b
van Noije, T. P. C., Le Sager, P., Segers, A. J., van Velthoven, P. F. J., Krol, M. C., Hazeleger, W., Williams, A. G., and Chambers, S. D.: Simulation of tropospheric chemistry and aerosols with the climate model EC-Earth, Geosci. Model Dev., 7, 2435–2475, https://doi.org/10.5194/gmd-7-2435-2014, 2014. a, b
Vehkamäki, H.: An improved parameterization for sulfuric acid–water nucleation rates for tropospheric and stratospheric conditions, J. Geophys. Res., 107, 4622, https://doi.org/10.1029/2002jd002184, 2002. a, b
Vignati, E., Wilson, J., and Stier, P.: M7: An efficient size-resolved aerosolournal of microphysics module for large-scale aerosol transport models, J. Geophys. Res.-Atmos., 109, D22202, https://doi.org/10.1029/2003jd004485, 2004. a, b, c
Wiedensohler, A., Birmili, W., Nowak, A., Sonntag, A., Weinhold, K., Merkel, M., Wehner, B., Tuch, T., Pfeifer, S., Fiebig, M., Fjäraa, A. M., Asmi, E., Sellegri, K., Depuy, R., Venzac, H., Villani, P., Laj, P., Aalto, P., Ogren, J. A., Swietlicki, E., Williams, P., Roldin, P., Quincey, P., Hüglin, C., Fierz-Schmidhauser, R., Gysel, M., Weingartner, E., Riccobono, F., Santos, S., Grüning, C., Faloon, K., Beddows, D., Harrison, R., Monahan, C., Jennings, S. G., O'Dowd, C. D., Marinoni, A., Horn, H.-G., Keck, L., Jiang, J., Scheckman, J., McMurry, P. H., Deng, Z., Zhao, C. S., Moerman, M., Henzing, B., de Leeuw, G., Löschau, G., and Bastian, S.: Mobility particle size spectrometers: harmonization of technical standards and data structure to facilitate high quality long-term observations of atmospheric particle number size distributions, Atmos. Meas. Tech., 5, 657–685, https://doi.org/10.5194/amt-5-657-2012, 2012. a
Wollesen de Jonge, R., Elm, J., Rosati, B., Christiansen, S., Hyttinen, N., Lüdemann, D., Bilde, M., and Roldin, P.: Secondary aerosol formation from dimethyl sulfide – improved mechanistic understanding based on smog chamber experiments and modelling, Atmos. Chem. Phys., 21, 9955–9976, https://doi.org/10.5194/acp-21-9955-2021, 2021. a
Wollesen de Jonge, R., Xavier, C., Olenius, T., Elm, J., Svenhag, C., Hyttinen, N., Nieradzik, L., Sarnela, N., Kristensson, A., Petäjä, T., Ehn, M., and Roldin, P.: Natural Marine Precursors Boost Continental New Particle Formation and Production of Cloud Condensation Nuclei, Environ. Sci. Technol., 58, 10956–10968, https://doi.org/10.1021/acs.est.4c01891, 2024. a, b, c
Yazgi, D. and Olenius, T.: J-GAIN V1.1.0, Zenodo [code], https://doi.org/10.5281/zenodo.8220223, 2023a. a
Yazgi, D. and Olenius, T.: J-GAIN v1.1: a flexible tool to incorporate aerosol formation rates obtained by molecular models into large-scale models, Geosci. Model Dev., 16, 5237–5249, https://doi.org/10.5194/gmd-16-5237-2023, 2023b. a, b
Yu, F.: Lookup tables for H2SO4-H2O binary and H2SO4-H2O-NH3 ternary homogeneous and ion-mediated nucleation, Zenodo [code], https://doi.org/10.5281/zenodo.3483797, 2019. a
Yu, F., Nadykto, A. B., Luo, G., and Herb, J.: H2SO4–H2O binary and H2SO4–H2O–NH3 ternary homogeneous and ion-mediated nucleation: lookup tables version 1.0 for 3-D modeling application, Geosci. Model Dev., 13, 2663–2670, https://doi.org/10.5194/gmd-13-2663-2020, 2020. a
Zhang, R., Xie, H.-B., Ma, F., Chen, J., Iyer, S., Simon, M., Heinritzi, M., Shen, J., Tham, Y. J., Kurtén, T., Worsnop, D. R., Kirkby, J., Curtius, J., Sipilä, M., Kulmala, M., and He, X.-C.: Critical Role of Iodous Acid in Neutral Iodine Oxoacid Nucleation, Environ. Sci. Technol., 56, 14166–14177, https://doi.org/10.1021/acs.est.2c04328, 2022. a
Zhao, B., Donahue, N. M., Zhang, K., Mao, L., Shrivastava, M., Ma, P.-L., Shen, J., Wang, S., Sun, J., Gordon, H., Tang, S., Fast, J., Wang, M., Gao, Y., Yan, C., Singh, B., Li, Z., Huang, L., Lou, S., and Wang, L.: Global variability in atmospheric new particle formation mechanisms, Nature, 631, 98–105, https://doi.org/10.1038/s41586-024-07547-1, 2024. a, b, c, d, e, f, g
Ziska, F., Quack, B., Abrahamsson, K., Archer, S. D., Atlas, E., Bell, T., Butler, J. H., Carpenter, L. J., Jones, C. E., Harris, N. R. P., Hepach, H., Heumann, K. G., Hughes, C., Kuss, J., Krüger, K., Liss, P., Moore, R. M., Orlikowska, A., Raimund, S., Reeves, C. E., Reifenhäuser, W., Robinson, A. D., Schall, C., Tanhua, T., Tegtmeier, S., Turner, S., Wang, L., Wallace, D., Williams, J., Yamamoto, H., Yvon-Lewis, S., and Yokouchi, Y.: Global sea-to-air flux climatology for bromoform, dibromomethane and methyl iodide, Atmos. Chem. Phys., 13, 8915–8934, https://doi.org/10.5194/acp-13-8915-2013, 2013. a