the Creative Commons Attribution 4.0 License.
the Creative Commons Attribution 4.0 License.
 | 29 Sep 2025
Banked CFC-11 contributes to an unforeseen emission rise and sets back progress towards carbon neutrality
Heping Liu
Huabo Duan
Ning Zhang
Ruichang Mao
Travis Reed Miller
Ming Xu
Jiakuan Yang
Yin Ma
An unexpected rise of trichlorofluoromethane (CFC-11) emissions has undermined the efforts behind the Montreal Protocol. However, the sources of these increased emissions, from CFC-11 banks to unreported production, remain contentious. Here, we enhanced the bottom-up dynamic material flow analysis model to characterize the stocks and flows of CFC-11, retrospectively and prospectively from 1950 to 2100. We find that dynamic changes in bank-related emissions could have led to an increased CFC-11 emissions from 2014 to 2018, implying an overestimation of unreported production. Under Scenario 2 (mid-range unreported production levels), long-term emission of banked CFC-11 will accumulate to 980 (600–1500) kilotons (kt), equivalent to 4.7 (2.9–7.1) gigatons (Gt) CO2, between 2025 and 2100. Scenario analysis highlights the potential to reduce up to 50 % of emissions through optimized end-of-life (EoL) management strategies. Our results call for further investigation into the lifespan and EoL processes of products containing ozone-depleting substances (ODSs) to reconcile emission estimates derived from bottom-up and top-down modeling approaches. The modeling approach could also be applied to estimate and project the bank-related emissions and impacts of other ODSs.
- Article
(1709 KB) - Full-text XML
-
Supplement
(1310 KB) - BibTeX
- EndNote


Chlorofluorocarbons (CFCs) are major contributors to ozone depletion and potent greenhouse gases, which trap heat approximately 4750–13 900 times more effectively than carbon dioxide over a 100-year horizon (Duan et al., 2018; Liu et al., 2024). The Montreal Protocol on Substances that Deplete the Ozone Layer has been a key global effort in phasing out ozone-depleting substances (ODSs), including trichlorofluoromethane (CFC-11; Chipperfield et al., 2020; Pyle et al., 2022; Young et al., 2021). The successful elimination of CFC-11 production has led to a decreasing of its atmospheric concentrations (Lickley et al., 2022; WMO, 2023). However, despite the complete global phaseout of CFC-11 by 2010, emissions unexpectedly increased during 2014–2018 (Montzka et al., 2018; Rigby et al., 2019). It is estimated that 40 %–60 % of this rise could be attributed to China, but the limited number of monitoring stations hindered the ability to trace the remainder to other regions (Rigby et al., 2019). Furthermore, several developed regions have exhibited elevated CFC-11 emissions after the complete phase-out of production and consumption, with no evidence of unreported production, raising unresolved questions about their sources (Dunse et al., 2019; Redington et al., 2023; Table S1 in the Supplement). Clarifying these sources is therefore critical for addressing the emission increase and for projecting future CFC-11 emissions and their impacts on ozone depletion and climate change.
To date, studies have employed top-down and bottom-up material flow analysis (MFA) models to estimate CFC-11 emissions (Table S1). Top-down models rely on atmospheric measurements to infer emissions, though regional emission estimates are limited due to the sparsity of the monitoring networks (Montzka et al., 2021; Park et al., 2021; WMO, 2021). By contrast, bottom-up models rely on reported CFC production and consumption data, and use emission factors (EFs) associated with various CFC-containing products' life stages to estimate emissions (Flerlage et al., 2021; TEAP, 2019; 2021) . These models have large uncertainties, due to uncertainties in the completeness of CFC-11 production and consumption reporting, the lifespans of the host products, EFs in various life stages, and end-of-life (EoL) management (TEAP, 2019, 2021). The Montreal Protocol's Technology and Economic Assessment Panel (TEAP) highlighted the major uncertainties in a bottom-up model by evaluating of the variations in production levels, EFs and static lifespans (TEAP, 2019, 2021). Nonetheless, this analysis did not adequately consider the variabilities in lifespans of foam products and their EoL management. For instance, polyurethane rigid (PUR) boardstock and panel foams for building and construction applications, which used CFC-11 as a blowing agent, were typically assigned lifespan estimates of 25 years (McCulloch et al., 2001; IPCC, 2006), 50 years (Ashford et al., 2004; UNEP, 2002), or 75 years (TEAP, 2021; Table S2). These default values may be obtained from simple assumptions or relevant structural calculation specifications. However, surveys reveal significant temporal and spatial variability in the actual lifespans of buildings (Aktas and Bilec, 2012; Liu et al., 2019; Tsutsumi and Komatsu, 2004; Table S3). Furthermore, high levels of uncertainty persist regarding CFC-11 emissions associated with EoL handling of foam products (McCulloch et al., 2001; TEAP, 2021; Table S4). These factors can significantly influence the trends in the release of blowing agents from obsoleted foam products (Liu et al., 2024), a point often overlooked in bottom-up estimates. These gaps necessitate a reassessment of the timing and magnitude of bank-related CFC-11 emissions and their time-lagged impact.
Here, we propose a dynamic MFA (D-MFA) model to characterize CFC-11 emissions from 1950 to 2100 to address these gaps. We incorporate a wide range of uncertainty in product lifespans, EoL handling processes and associated emission factors, and temporal and spatial evolution. This model aims to estimate bank-related emissions and explain the unexpected emission rise observed between 2014 and 2018. Products that were produced in the past and still contain CFC-11 are said to be banks of potential future emissions. By considering both banks and unreported production, we project time-lagged CFC-11 emissions and their climate impacts across different sectors, regions, and lifecycle stages. Finally, we discuss the potential mitigation measures to prevent future emissions.
2.1 Dynamic material flow analysis model
The end-use applications of CFC-11 are in non-hermetic refrigeration systems, closed-cell foams (CCFs), and prompt emissive uses, such as aerosol propellants, open-cell foams, solvents, and others (TEAP, 2019, 2021). CFC-11-containing CCF products had been applied across a range of insulation applications, mainly including polyurethane rigid (PUR) boardstock, panel, spray, appliance and other insulation products. PUR boardstock foams have been used extensively in residential and commercial roof insulation and walls of metal buildings and agricultural buildings, and PUR panel foams have been used in industrial settings, such as refrigerated warehouses (Sect. S1.2). The investigated lifespan of these foam products in building contexts exhibits notable spatiotemporal variability (Table S3).
A D-MFA model is used for each end-use application. In this model, the calculation process for CFC-11 emissions is methodically divided into distinct stages, which represent different phases of products containing CFC-11 throughout their lifecycle, from manufacture, use to EoL handling. The first stage involves the quantification of first-fill emissions during the manufacturing stage. Subsequently, emissions during product use are evaluated. The final stage pertains to the release of emissions from the EoL handling of obsolete products, which may involve recovery, recycling, and disposal processes of CFC-11 contained within them.
End-use products, such as insulation foams for household refrigerator appliances or constructions, exhibit durability and long lifespans. In this study, the Weibull distribution, which had been widely used in previous research (Liu et al., 2019, 2024; TEAP, 2021), is introduced to simulate the survival rate curves for new products with long lifespans (Eq. 1, Fig. S13).
where f(y, t) refers to the remaining rate of the sales of new products in year y; t indicates the product age; β corresponds to the shape parameter (β > 0); u is the scale parameter (u > 0). Parameter estimates for foam products and refrigeration equipment across different geographical regions were derived from our surveys (Duan et al., 2018; Liu et al., 2024) and an extensive literature review (e.g., McCulloch et al., 2001; UNEP, 2002; IPCC, 2006; TEAP, 2021). The quantity of CFC-11 mass in use or at EoL in each end-use application within each geographical region can be determined using Eqs. (2)–(5):
where Y represents the counted year of CFC-11 emissions; y indicates the sales year of new product containing CFC-11; qnew(y, 0) refers to the sales data of CFC-11 in new products in year y; quse(y, t) denotes the quantity of in-use CFC-11 in the product in year y with age t; qEoL(y,t) stands for the quantity of CFC-11 in the product sold in year y with age t entering into the EoL stage; Quse(Y) means the total quantity of in-use CFC-11 at year Y;QEoL(Y) corresponds to the total quantity of CFC-11 in EoL products in year Y.
The emission mass is derived based on the annual mass of products containing CFC-11 during the first fill (manufacturing), use, and EoL stages. Following the Tier 2a method of the Intergovernmental Panel on Climate Change Guidelines for National Greenhouse Gas Inventories (IPCC, 2006, 2019) , the historical and future emissions of CFC-11 from refrigeration systems can be estimated and projected using Eq. (6).
where Eref(Y) refers to the total emissions of CFC-11 from refrigeration systems in year Y; Eman(Y), Euse(Y), and EEoL(Y) correspond to the mass emissions of CFC-11 from the manufacturing (first fill), use, and EoL stages of refrigeration equipment, respectively, at year Y;Qnew(Y) represents the sales of CFC-11 in new equipment in year Y and equals qnew(y,0) in Eq. (2) when Y equals y. Efman(Y) and Efuse(Y) denote the EFs of CFC-11 during the life cycle stages of equipment manufacturing and use, respectively; γEoL(Y) indicates the recovery efficiency of CFC-11 during EoL handling for obsolete equipment.
Similarly, the release of CFC-11 from CCF can occur throughout various life cycle stages, including manufacture, use, EoL handling, and post-life, such as landfilling disposal. Equations (1)–(5) are used to calculate the CFC-11 bank and EoL flow from CCF. Equation (7) is used to aggregate emissions across various life cycle stages originating from CCF.
where Eccf(Y) indicates the total emissions of CFC-11 from an end-use application of CCF in year Y; Eman(Y), Euse(Y), EEoL(Y), and Epost(Y) denote the mass emissions of CFC-11 from the manufacture, use, EoL handling, and post-life stages of CCFs, respectively, at year Y. Qnew(Y), Quse(Y), and QEoL(Y) refer to the same representation as in Eqs. (2)–(6); Efman(Y), Efuse(Y), EfEoL(Y), and Efpost(Y) are the EFs of CFC-11 during the life cycle stages of CCF manufacture, use, EoL handling, and landfilling, respectively; lEoL(Y) means the landfilling proportion of CFC-11 during the EoL handling of CCF, represented as (100 %-EfEoL(Y)).
The prompt emissive use category includes applications that use CFC-11 in processes that result in immediate or relatively rapid release into the atmosphere (TEAP, 2019, 2021). A 6-month delay after sale is conventionally assumed in the case of aerosol and solvent uses, which results in half of the CFC-11 being released in the year of sale and the remaining half being released in the following year on average (McCulloch et al., 2001). The emission calculations are performed using Eq. (8).
where Eemi(Y) denotes the total emissions of CFC-11 from prompt emissive uses in year Y; Qemi(Y) refers to the sales quantity of CFC-11 in prompt emissive uses; p is the release fraction. In this study, p is set to 0.5 to simplify the calculations. Given the global phaseout of CFCs since 2010, variations in the p value will not affect the overall emission calculations beyond this point.
2.2 Bottom-up aggregated emissions
In addition to previously mentioned CFC-11 release from products, emissions of CFC-11 can occur during its production and packaging processes. A comprehensive literature review reveals that fugitive emissions resulting from the production of CFC-11 and its supply chain can contribute an additional 1.5 %–5 % to the overall production emission (TEAP, 2019; 2021; Eq. 9).
where Epro(Y) denotes the emissions from the CFC-11 production process in year Y; Qpro(Y) indicates the production quantity of CFC-11 in year Y; r refers to the release rate of CFC-11 resulting from its production and supply chain. TEAP's multi-scenario assessments indicate that production-stage release rates have minimal overall impact on total emissions (TEAP, 2019, 2021). Therefore, in this study, the value of r is set at 3 %, except for unreported production, which is set at 5 %.
The emission profiles of each end-use category and its subdivision are characterized using a distinct set of parameters. We integrate these parameters into D-MFA model to estimate and project temporal and spatial evolution of CFC-11 emissions in accordance with Eq. (10).
where Etotal(Y) represents the total emission mass of CFC-11; ∑Epro(Y), ∑Eemi(Y), ∑Eref(Y), and ∑Eccf(Y) indicate aggregated emission mass of CFC-11 from compound production and supply chain, prompt emissive uses, refrigeration systems, and CCF applications; ∑Eman(Y), ∑Euse(Y), ∑EEoL(Y), and ∑Epost(Y) denote the aggregated emission mass of CFC-11 brought about by the manufacture, use, EoL handling, and landfill stages of products in refrigeration systems or CCFs, respectively. ∑Epro(Y), ∑Eemi(Y), and ∑Eman(Y) can be classified as direct emissions; ∑Euse(Y), ∑EEoL(Y), and ∑Epost(Y) can be categorized as bank release (Lickley et al., 2022).
The global and regional database for CFC-11 can be found in Figs. S1–S12. We compiled comprehensive consumption data for each relevant end-use application. Global total production and consumption statistics were sourced from well-established references (AFEAS, 2003; McCulloch et al., 2001; UNEP, 2006; TEAP, 2021). Regional consumption across CCF subsectors, particularly historical polyurethane rigid (PUR) foam production, was quantified. For non-hermetic refrigeration, global demand was distributed according to regional consumption patterns. Finally, emissive uses of CFC-11 were derived by subtracting quantities allocated to CCFs and non-hermetic systems (including refill volumes) from total global consumption.
In the D-MFA model for estimating CFC-11 emissions, various parameters influence the estimates when consumption data for different end-use applications across regions are fixed. These parameters include EFs in various life cycle stages, and scale and shape parameters in Weibull distribution. The scale parameters of Weibull distribution typically represent the average lifespans of CFC-11-containing products. Uncertainty in the CFC-11 emission inventory was quantified through systematic Monte Carlo simulations. This approach propagates parameter uncertainties through the emission model, generating output distributions. The Weibull scale (u) and shape (β) parameters, manufacturing-stage EF (Efman(Y)) and use-stage EF (Efuse(Y)) were modeled as independent normal variables truncated at zero to preclude implausible negative values. These distributions were defined using regional and global mean values (Tables S7–S13), with standard deviations set to 25 % of the respective means. For instance, in the global boardstock subsector, the mean Weibull scale (u) and shape (β) parameters are 50 and 6, while the EFs for manufacturing (Efman(Y)) and use (Efuse(Y)) are 6 % and 1 %, respectively. Consequently, their standard deviations are thus set to 12.5 %, 1.5 %, 1.5 %, and 0.25 %. Following distribution definition for all parameters, 10 000 random sample sets (e.g., Fig. S14) were drawn per foam subsector. EoL and post-life EFs were treated as constant values due to poorly constrained ranges. Annual emissions were computed for each parameter combination, with 10 000 realizations aggregated to construct the emission probability distribution. Uncertainties are reported as the 0.5th–99.5th percentile range, corresponding to 99 % confidence interval. The dynamically varying ranges reflect physically plausible outcomes within the defined uncertainty bounds.
2.3 Atmospheric concentration modelling
Global CFC-11 emissions and atmospheric mole fractions (expressed as global mean mixing ratios) were derived using Eq. (11):
where Mix denotes global mean atmospheric mixing ratios in parts per trillion (ppt), with data through 2020 sourced from WMO (2023); τ denotes CFC-11 atmospheric lifetime (52 years; WMO, 2023); F (ppt t−1) is a constant conversion factor for transforming concentration units to emission units, obtained using Eq. (12).
where MCFC represents the molecular weight of CFC-11 in grams per mole (g mol−1), and the constant 1.07 relates the global mean surface mixing ratio to the global mean atmospheric mixing ratio.
2.4 Scenarios for unreported CFC-11 production
TEAP (2019, 2021) identified the most likely routes for unreported CFC-11 production: (a) large-scale carbon tetrachloride (CTC) conversion (≥50 kt yr−1 capacity), and (b) micro-scale operations (0.1–2 kt yr−1) producing low-grade CFC-11 for foam blowing. China's 2018 enforcement actions revealed no evidence of large-scale CFC-11 usage within the country (China MEE, 2019). During these actions, 177.6 metric tons of CFC-11 precursor materials and 29.9 t of illegally produced CFC-11 were seized. Among 1172 inspected polyether enterprises, 10 small-scale operations were found to have partially used CFC-11. Considering these findings, we developed three scenarios. Scenario 1 (S1) serves as a baseline, representing an extreme situation with no unreported production. Scenario 2 (S2) is designated as an intermediate scenario with mid-range unreported production levels. For S2, we assume microscale plants (0.1–2 kt yr−1) contributing 25 kt yr−1 of unreported production during 2014–2018 – half of the TEAP large-scale estimate – with 10 kt in 2013. This assumption would yield a 3–8 kt yr−1 increase in CFC-11 emissions, depending on its application in PUR appliance or spray insulation foam. Scenario 3 (S3) indicates an extreme worst case of unreported CFC-11 production, approximately 23 ± 7 kt yr−1 of emissions caused by the unreported production of CFC-11 during 2014–2018 (Lickley et al., 2021; TEAP, 2021). Given the diverse end uses of foam products, two subscenarios have been formulated under both S2 and S3. Subscenario 1 assumes unreported CFC-11 is used in spray insulation foams (_SIF), which exhibit a substantial release fraction during their manufacturing. Subscenario 2 involves unreported CFC-11 use in appliance insulation foams (_AIF), characterized by a lower release fraction during manufacture and a shorter product lifespan compared to construction spray foams.
2.5 Uncertainty and sensitivity analysis
This section explores the range of effects of influential factors on CFC-11 emission levels. The sensitivity analysis is structured as follows: (1) The scale parameters (u), shape parameters (β), and EFs associated with manufacturing (Efman(Y)) and usage (Efuse(Y)) are varied in turn based on their respective distributions, and other factors remain constant values as in Table S13; (2) adjustments in EFs pertinent to EoL are examined, with the assumption that either 100 % of CFC-11 is emitted during EoL handling or that only 20 % is released during this phase, with the remainder being landfilled and continuously emitted; (3) the quantity of CFC-11 used in CCF products is adjusted, scaled down to 90 % or up to 110 % of its baseline amount, and the discrepancy in CFC-11 consumption quantities generated is allocated for prompt emissive uses. Specifically, we first evaluated the individual impact of the scale parameter (u) through 10 000 Monte Carlo simulations. In these simulations, the value of u was randomly sampled from its respective distribution per foam subsector, while all other factors were fixed at their baseline/mean values. Annual emissions were aggregated to derive the global CFC-11 emission distribution, with uncertainty characterized by the 0.5th–99.5th percentile range, representing the 99 % confidence interval. Following the same approach, we sequentially performed single-parameter analyses for shape parameter (β), manufacturing-stage EFs (Efman(Y)) and use-stage EFs (Efuse(Y)). For factors lacking probabilistic distributions, specifically EoL EFs and CFC-11 allocation quantities, we implemented bounded analysis. Weibull parameters (u, β) and manufacturing/use-stage EFs (Efman(Y), Efuse(Y)) were independently sampled from subsector-specific distributions, while EoL EFs were set to either 20 % or 100 %, with other parameters held at baseline/mean values. Similarly, to assess the impact of CFC-11 quantities allocated to CCFs (i.e., 90 % or 110 % of the baseline value), we integrated simultaneous random sampling of parameters u, β, Efman(Y), Efuse(Y) with these allocation adjustments, while fixing other parameters at mean values. Emissions under the baseline scenario (S1) served as reference values for comparative assessment. Collectively, the emission levels falling within the range of uncertainty from the outlined cases are considered plausible, which reflects the complexity and variables inherent in the global CFC-11 emission landscape.
3.1 Estimates of banked CFC-11 emissions and implications
Figure 1a–b provide our bottom-up results for the temporal dynamics of global and China CFC-11 emissions in comparison with previous studies using top-down and combined approaches, under our baseline S1 without unreported production. These results can be calibrated to align with the 2014–2018 top-down emission trends by adjusting Weibull scale/shape parameters or EoL handling emission fractions. However, given the spatiotemporal fluctuations in these parameters (Tables S3–S4), we prioritized robust uncertainty quantification over strict calibration of annual emission trends. We estimate that annual global CFC-11 emissions reached 43 (26–56) kt during 2014–2018 under S1. The estimate from TEAP (2019), 31 (20–45) kt yr−1, is lower than ours because our model incorporates a more comprehensive treatment of uncertainties across the lifecycle of CCF products. The upper bound of 56 (±2) kt for 2014–2018 emissions in our analysis represents a plausible outcome, significantly narrowing the gap with the top-down estimates of 69 (±10) kt CFC-11 (Montzka et al., 2021).
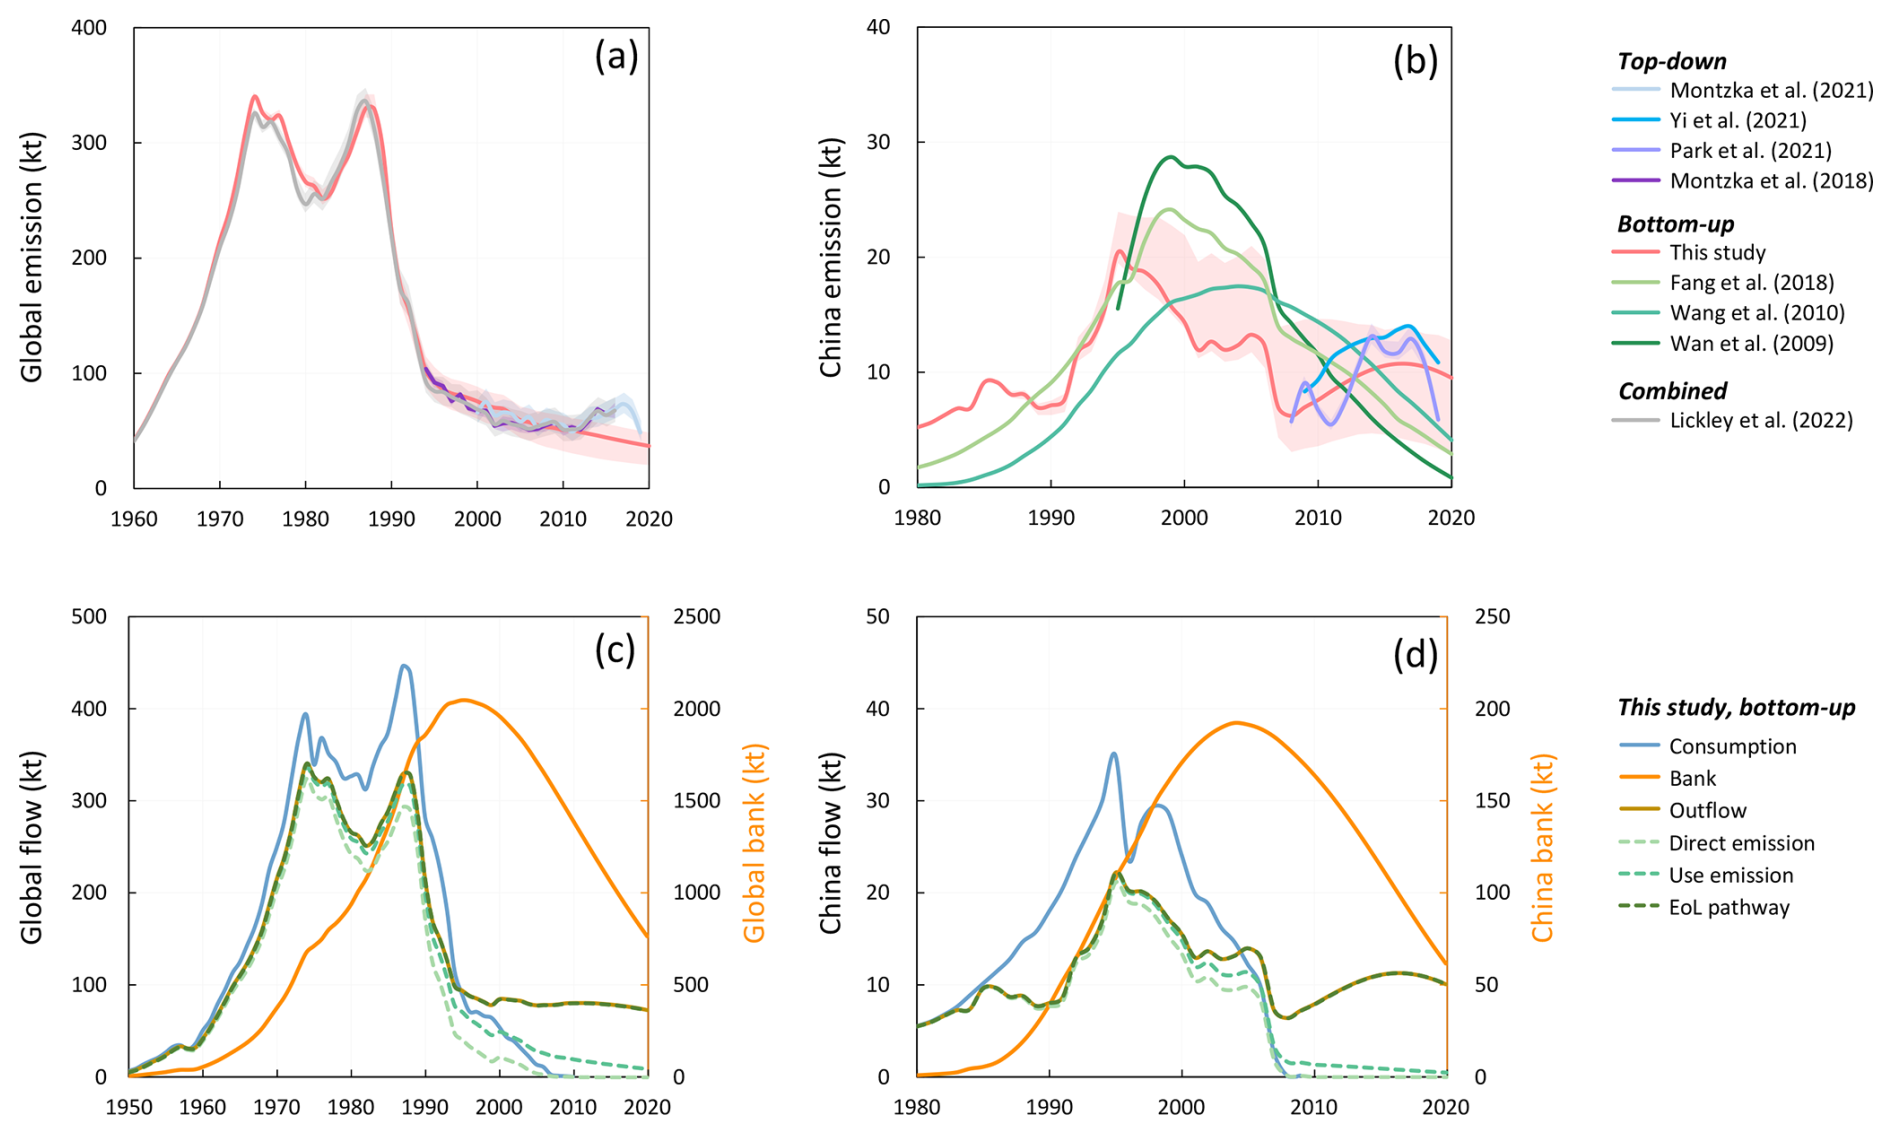
Figure 1CFC-11 emissions comparison through bottom-up, top-down, and combined methods. (a) Global emissions. (b) China's emissions. Red shading represents the 99 % confidence interval in this study. (c) Global and (d) China's CFC-11 flows: consumption, banks and outflows. Bank quantities (orange lines) correspond to the right-hand axis (orange scale). Annual outflows comprise direct emissions (chemical production/supply chain, emissive uses and end-use product manufacturing), use-stage emissions, and end-of-life (EoL) flows associated with obsolete products. These EoL flows may undergo atmospheric release (EoL emissions), landfilling (post-life release), or destruction/reclamation.
In China, the annual emissions of CFC-11 increased from 8 (4–13) kt yr−1 in 2008–2012 to 11 (5–13) kt yr−1 in 2014–2018 according to our bottom-up estimate (Fig. 1b). This upward trend, from 8 kt yr−1 (2008–2012) to 11 kt yr−1 (2014–2018), was derived using region-specific parameter combinations as detailed in Table S11. Our estimated emission trend over this period differs significantly from previous bottom-up estimates for China. Earlier models assumed that 10 % of CFC-11 contained within foams were released during manufacturing, and the remaining 90 % uniformly emitted over the subsequent two decades (Fang et al., 2018; Wan et al., 2009). Using top-down approaches, Park et al. (2021) estimated a 7 ± 4 kt yr−1 increase in emissions from eastern China during 2014–2017 compared to 2008–2012. Our national-scale bottom-up modelling aligns the upward trend reported by Park et al. (2021), albeit with a slightly smaller magnitude. Yi et al. (2021) reported a national trend that climbed from 8.3 ± 1.6 kt yr−1 in 2009 to a peak of 13.9 ± 2.4 kt yr−1 in 2017, followed by a decline to 10.9 ± 1.7 kt yr−1 in 2019. Our independent estimates of 7 (4–14), 11 (5–14), and 10 (4–13) kt yr−1 for the corresponding years are broadly consistent with these findings when considering overlapping uncertainties.
Figure 1c–d depicts our refined assessments of CFC-11 banks and flows at both global and China scales, incorporating a 38-year average lifespan for PUR boardstock and panel foams. This lifespan falls within the distribution range for such foams (Fig. S14). Our analysis yields 2014–2018 use-stage emissions averaging 13 ± 2 kt yr−1, while CFC-11 contained in obsolete products reaches up to 65 ± 1 kt yr−1. In developing countries, inadequate waste management systems may accelerate CFC-11 release from obsolete product (Gómez-Sanabria et al., 2022; Liu et al., 2024). In addition, the transboundary movement of used appliances (or e-waste) containing CFC-11 (excluded here due to data limitations) from developed to developing economies could redistribute EoL flows (Martínez et al., 2022). Substantial uncertainty surrounds EoL release fractions, with estimates ranging from 20 % (TEAP, 2021) to 100 % (McCulloch et al., 2001; Liu et al., 2024). Adopting a higher release fraction would bring our global bottom-up CFC-11 emissions into closer alignment with the top-down estimate of 69 ± 10 kt yr−1 (Montzka et al., 2018, 2021). As shown in Fig. 1d, CFC-11 associated with obsolete products in China rose from 5 kt in 2008 to 10 kt by 2014. Globally, CFC-11 banks peaked at 2000 kt (1600–2200 kt) circa 1995 (Fig.1c). This value is comparable with estimates by the UNEP (2006) and TEAP (2019) but slightly lower than those by Lickley et al. (2022). The discrepancy could be attributed to differing breakdowns of CFC-11 consumption across various end-use applications.
3.2 Banked CFC-11 emissions across regions
Under the Montreal Protocol, parties are classified into developing (Article 5, A5) and developed (non-Article 5, non-A5). In this work, A5 parties are split between China and other A5 parties, while non-A5 parties are divided into North America, non-A5 European parties, Japan, and other non-A5 parties (Table S5). Detailed comparisons of CFC-11 emissions from the U.S. and non-A5 European parties are shown in Fig. 2a–c and d–f, respectively. Our bottom-up model results indicate that annual CFC-11 emissions in the US have experienced a sharp decline from 40 (38–44) kt in 1990 to 14 (12–19) kt by 1996 (Fig. 2a). This reduction is primarily attributed to the phasing out of CFC-11 across the states. Subsequently, emissions originating from banks slightly decreased further to 9 (6–13) kt by 2018. However, with an increasing trend of foam products entering EoL stage, annual CFC-11 emissions are expected to remain around 9 (5–13) kt for several more years. The U.S. Environmental Protection Agency (EPA) has estimated national CFC-11 emissions on an annual basis using bottom-up approach which assigns a fixed value for lifespans; the year-to-year variabilities in these estimates are substantial (U.S. EPA, 2024). According to the latest report, annual CFC-11 emissions in the U.S. declined from 29 kt in 1990 to 5 kt in 2022. When considering the full range of maximum and minimum values from the series of U.S. EPA national estimates (U.S. EPA, 2024), our predicted values align well with their findings. Furthermore, if the lifespan of PUR boardstock and panel foam products changes, i.e., from 50 years (Fig. 2b) to 38 years (Fig. 2c), CFC-11 emissions are projected to remain a downward trajectory. This trend is consistent with top-down observations and falls within the estimated range of emissions (Hu et al., 2017).
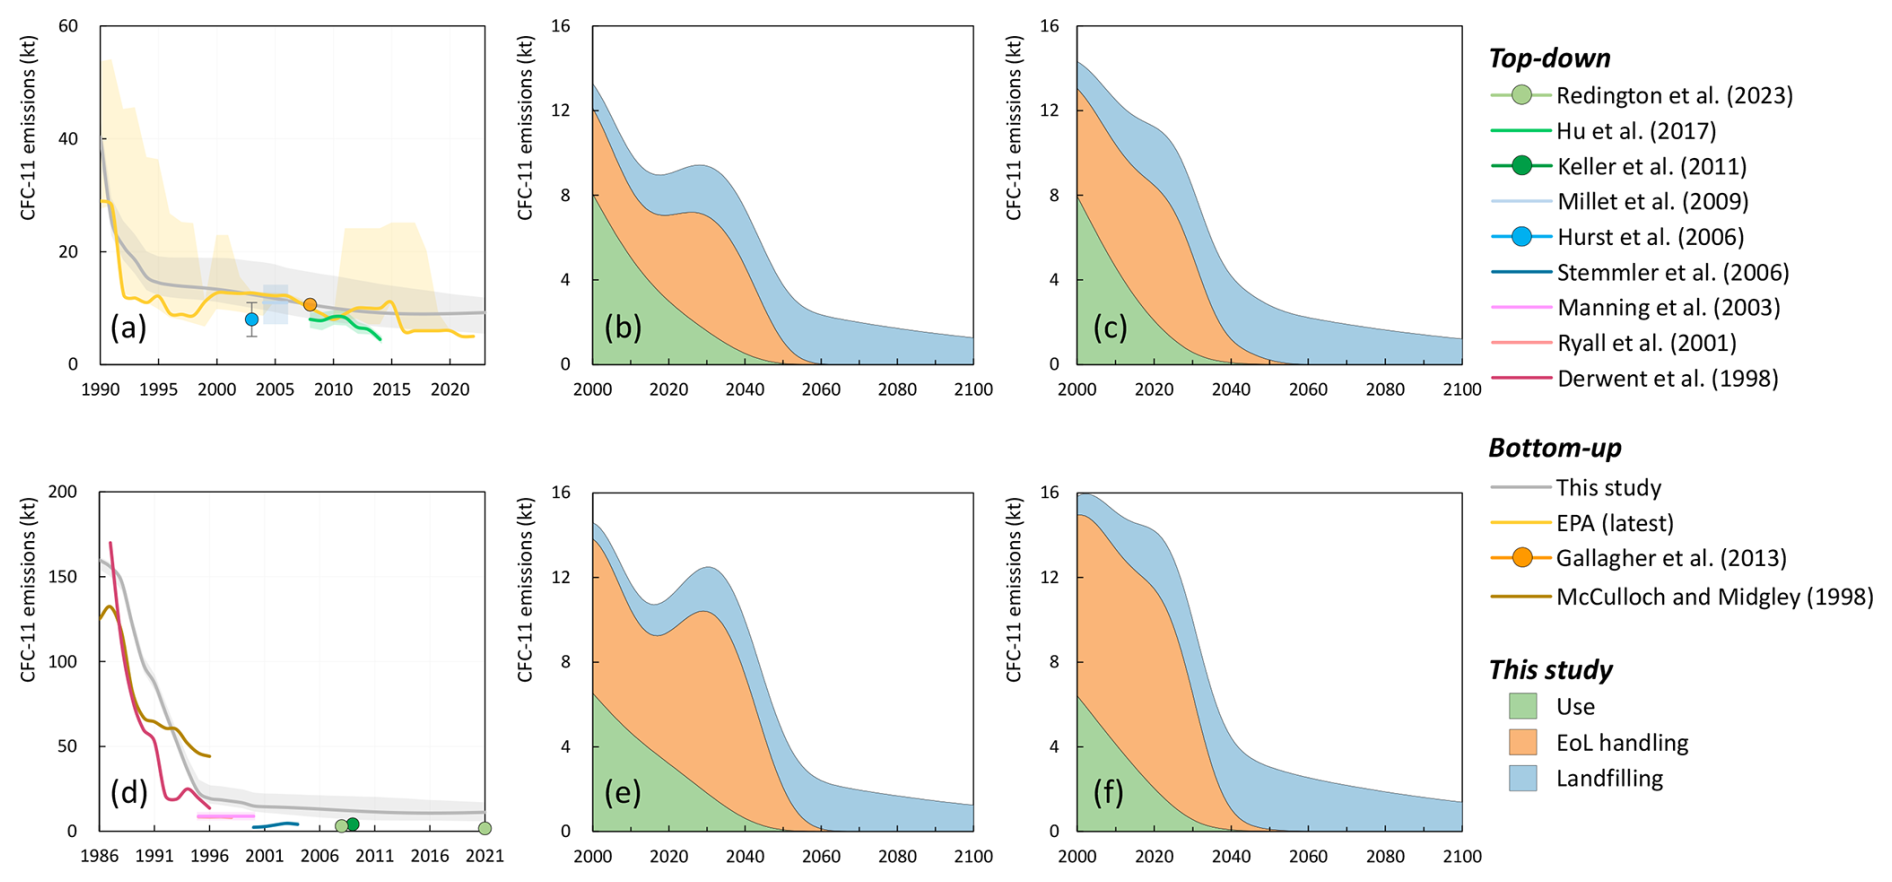
Figure 2Comparison of CFC-11 emission estimates in the US and non-A5 European parties. (a) CFC-11 emission comparison for the US based on bottom-up and top-down approaches in 1990–2022, respectively. The grey shaded regions indicate the 99 % confidence interval in this study. The yellow shaded regions represent the upper and lower bounds of CFC-11 emission estimates conducted by the U.S. EPA. (b) Estimated and projected CFC-11 emissions at various lifecycle stages in the US in 2000–2100. (c) same as (b) but considering the changes of lifespan from 58 to 38 years. (d–f), same as (a)–(c) but for non-A5 European parties.
Estimates of European CFC-11 emissions exhibit significant geographical variability (Table S1). For non-A5 European parties (Table S5), our analysis indicates emissions declined sharply from 160 (157–165) kt yr−1 in 1986 to 15 (11–21) kt yr−1 by 2000, consistent with regional phase-out commitments. This decreasing trend aligns with prior work (McCulloch and Midgley, 1998; Derwent et al., 1998), though emission discrepancies arise from geographical and methodological differences. For instance, McCulloch and Midgley (1998) applied bottom-up modeling to European Union (EU) emissions, assuming fixed release rates of 10 % during manufacturing and 90 % uniformly emitted over two decades. Our divergent estimates (Fig. 2d) stem from broader geographical coverage (non-A5 Europe versus EU) and dynamic emission modeling. Post-2000 emissions continued declining to 11 (6–18) kt yr−1 by 2011, stabilizing near 12 (5–16) kt yr−1 in subsequent years. Industry data suggest comparable historical CFC-11 usage levels in CCFs across the EU and North America during the 1970s–1980s (Hammitt et al., 1986; UNEP, 2002). Thus, our slightly higher estimates for non-A5 Europe versus the U.S. post-2000 are reasonable. In addition, according to estimates by SKM Enviros, the quantity of obsolete foam products containing CFCs within the EU decreased from 17 kt around 2000 to 12 kt by circa 2011 but subsequently increased again, reaching 15 kt over several years (SKM ENVIROS, 2012). Accordingly, annual CFC emissions remained steady by approximately 6–7 kt during this period. Considering diverse geographical coverage, our estimates align closely with those reported by SKM ENVIROS (2012). Moreover, based top-down method, Redington et al. (2023) indicated elevated emissions of CFC-11 over Belgium, the southern Netherlands, northern France and west Germany during 2013–2021. Our estimations, as depicted in Fig. 2e, reveal a similarly upward trend in CFC-11 emissions. However, these trends could change. As shown in Figs. 2c and f, persistent downward trends may occur due to shifts in the lifespan of PUR boardstock and panel foam products from 50 to 38 years.
China's distinct emission trajectory, relative to the U.S. and Europe, arises from region-specific factors. First, appliances dominate CFC-11 use in China PUR foams, whereas construction prevails in the U.S. and Europe (Fig. S3/S5 vs. Fig. S6). Second, appliances generally have shorter lifespans than construction materials. Third, China exhibits higher release fractions during waste management processes (Table S8 vs. Table S11). The synergistic interaction of shorter lifespans and elevated EoL release fractions amplified the magnitude of China's emission surge.
In addition, our estimates of banked CFC-11 emissions in Japan and other non-A5 parties also align with previous bottom-up and top-down findings (Fig. S15). In our estimates, banked CFC-11 emissions in Japan decreased from 1.7 (0.8–3.2) kt yr−1 in 2010 to 0.7 (0.4–1.0) kt yr−1 by 2022. These values are comparable with those reported in previous estimates (Fig. S15a). For example, the Japan Ministry of Economy, Trade and Industry (Japan METI, 2024), using a bottom-up modeling method, estimated the banked CFC-11 emissions in Japan from 1.3 kt yr−1 in 2010 to 0.7 kt yr−1 by 2022. In other non-A5 parties, such as Australia, the emissions of banked CFC-11 decreased from 0.8 (0.6–1.1) kt yr−1 in 1995 to 0.3 (0.2–0.5) kt yr−1 by 2022 (Fig. S15b) according to our estimate, which can coincide with the top-down emission level of 0.32 ± 0.04 kt yr−1 in Australia since 2010 (Dunse et al., 2019; Fraser et al., 2020).
To summarize, our analysis suggests that the trajectory of banked CFC-11 emissions can exhibit upward or downward trends, aligning with atmospheric observations recorded for the US, Europe, and some other non-A5 parties. These variabilities may be attributed to regional and temporal evolutions in product lifespans and EoL practices (Tables S3–S4). A bottom-up methodology necessitates more precise surveys on product lifespans, as well as EFs during EoL handling and landfill disposal.
3.3 CFC-11 emissions and mitigation potentials considering banks and unreported production
Although banked CFC-11 likely contributed to the unexpected increase in emissions during 2014–2018, direct emissions from unreported production of CFC-11 also occurred in this period. To assess future emissions and impacts, we developed three scenarios accounting for emissions from both banks and unreported production. Figure 3a–c present the banks, emissions, and global atmospheric concentrations of CFC-11 across these scenarios. Under S1, global CFC-11 banks declined from 1270 (1000–1500) kt in 2010 to 1040 (720–1250) kt in 2015, and further to 680 (350–950) kt in 2025, with projections indicating a continued decrease to 120 (10–300) kt by 2050. These estimates closely align with those reported by TEAP (2021) and are validated by TEAP's (2019) independent assessment using Ashford et al. (2005) methodology, to estimate 2015 banks at 1070–1292 kt. Cumulative time-lagged global emissions for 2025–2100 under S1 reach 890 (550–1350) kt by 2100, equivalent to 4.2 (2.6–6.4) Gt CO2.
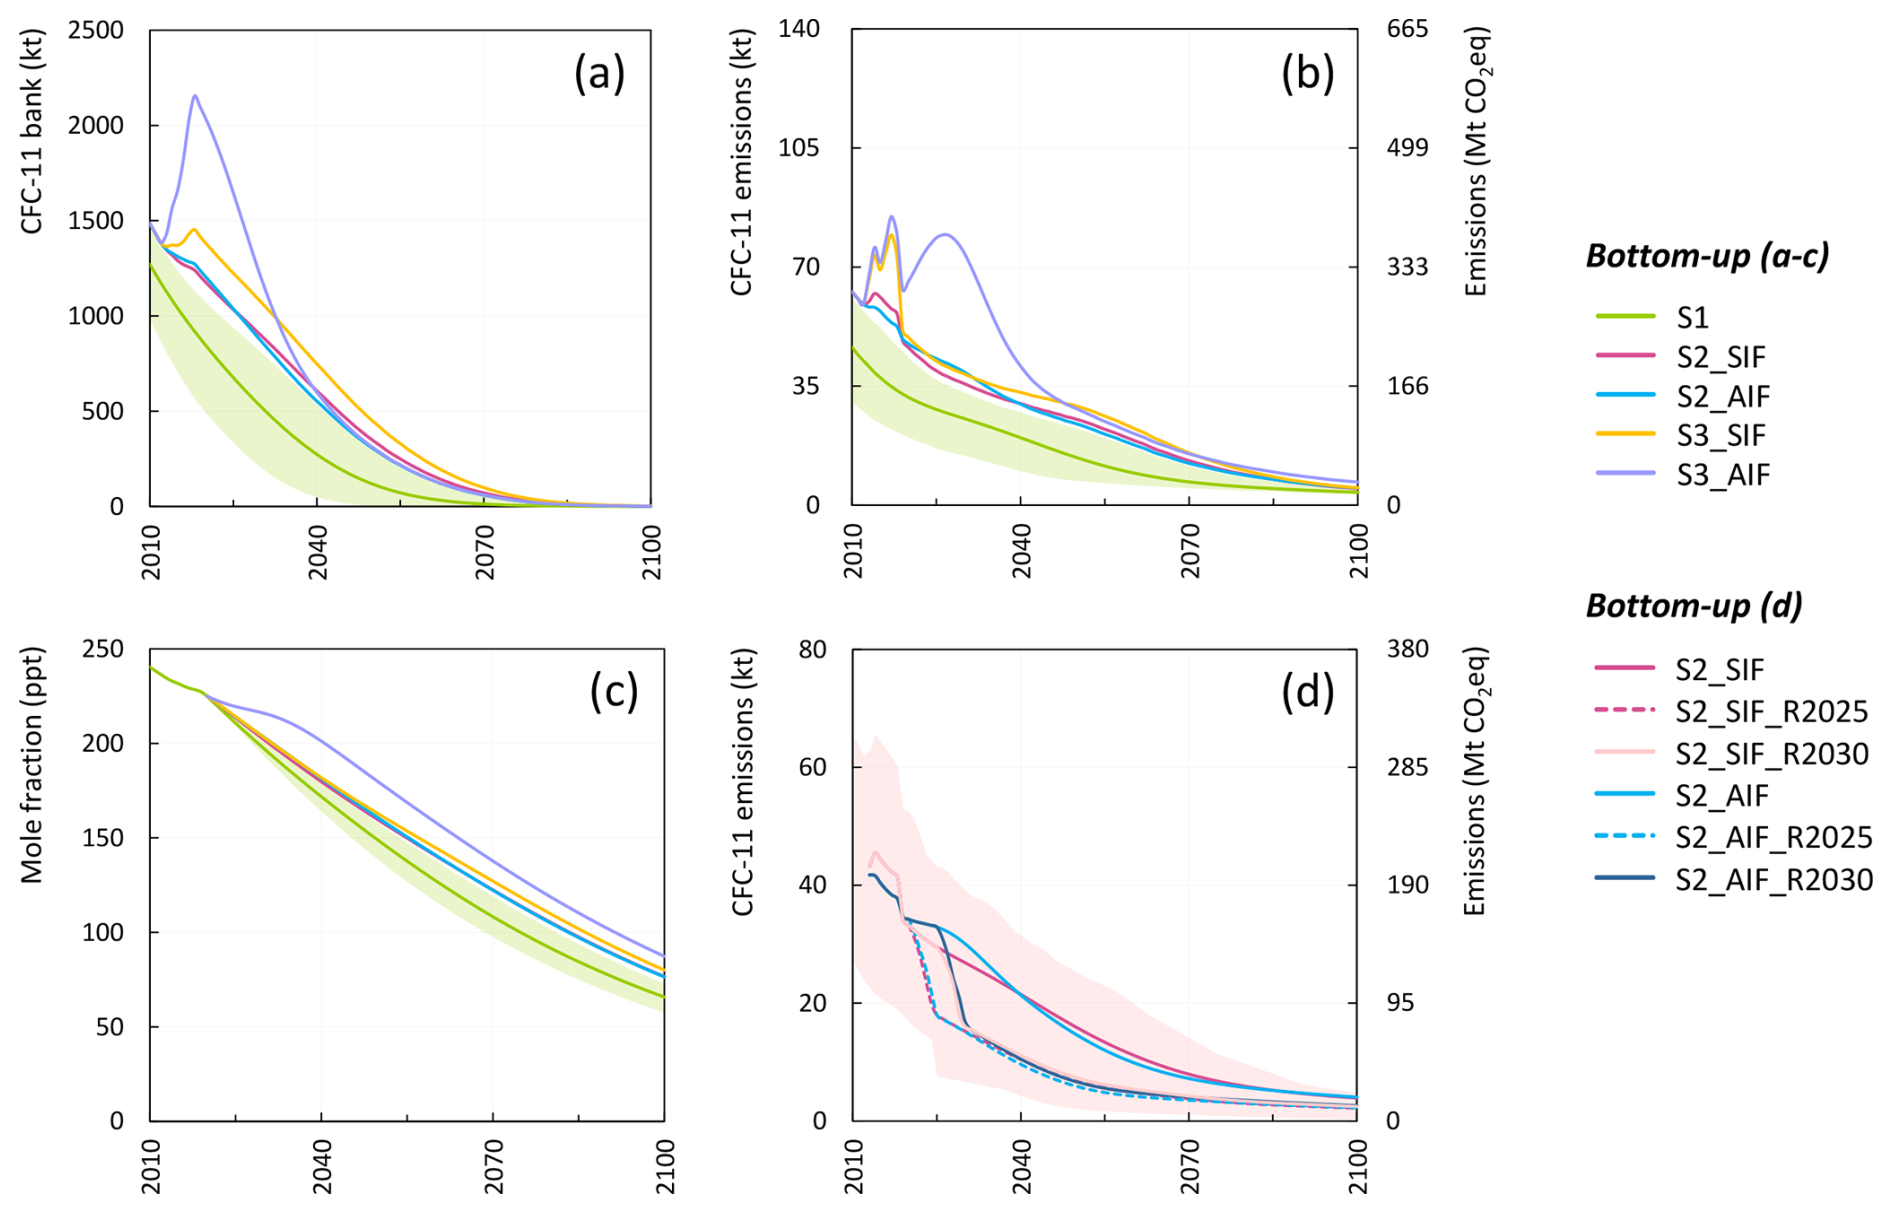
Figure 3CFC-11 banks, emissions and impacts considering unreported production and their mitigation potential. (a) CFC-11 banks based on scenario analysis. (b) CFC-11 emissions and corresponding CO2-equivalent (CO2-eq) emissions under various scenarios. (c) CFC-11 global mole fractions in part per trillion (ppt) under various scenarios. (d) Estimated mitigation potential of CFC-11 emissions and its CO2-eq emissions under scenario 2 (S2). The shaded regions represent the 99 % confidence interval for S1 in panels (a)–(c) and for S2 in panel (d).
Under S2, unreported production totaled 135 kt during 2013–2018, increasing the 2019 bank by up to 120 (70–130) kt (S2_SIF) and 90 (75–105) kt (S2_AIF). These values are slightly higher than estimated 75 (46–112) kt for China but lower than TEAP assessments of 320–700 kt (Park, et al., 2021; TEAP, 2021). By 2030, this bank increase declines to 75 (45–90) kt (S2_SIF) and 45 (0–105) kt (S2_AIF), falling further to 40 (0–75) kt and 1 (0–15) kt by 2050. Unreported production under S2_SIF may have increased emissions by 7 (4–13) kt during 2014–2018. Cumulative global emissions for 2025–2100 could reach 980 (600–1500) kt, equivalent to 4.7 (2.9–7.1) Gt CO2.
Under S3, cumulative unreported production (390–1100) kt moderately exceeds TEAP's (2021) upper estimate (320–700 kt), primarily due to differences in direct emission rates from foam manufacturing. For S3_AIF, this production increased the 2019 bank by 950 (700–1000) kt, causing a second peak of 1800 (1500–2100) kt following the 1995 maximum (Fig.3a). Unreported production may have increased emissions by 22 (12–38) kt (S3_SIF) and 26 (20–35) kt (S3_AIF) during 2014–2018. Emissions from unreported production under S3_AIF are projected to rise from 2020, peaking at 43 (22–67) kt by 2027 (Fig. 3b). Cumulative global CO2-equivalent (CO2-eq) emissions for 2025–2100 under S3_AIF could reach 7.5 (4.9–10.5) Gt, corresponding to 18 % (12 %–26 %) of global greenhouse gas emissions in 2023 (Friedlingstein et al., 2023). Based on surveys from China (China MEE, 2019) and investigations into illegal production capacity by the TEAP (2019, 2021), S3 is deemed less plausible, suggesting more optimistic outcomes for climate and the ozone recovery.
Using the method outlined in Lickley et al. (2020), polar equivalent effective stratospheric chlorine (EESC) under S1 is projected to return to pre-1980 levels around 2086. This projection is slightly earlier than WMO's estimate of 2087 (WMO, 2023). This discrepancy primarily arises from higher CFC-11 concentrations in WMO assessment, attributed to their larger bank and emission estimates derived using the Lickley approach (Lickley et al., 2022; WMO, 2023).
Currently, the proportion of emissions resulting from the EoL handling of obsolete CFC-11-containing products is higher than those emitted during the landfilling stage (Fig. 2b–c, and e–f). However, by approximately 2050, CFC-11 released from landfilling will become the dominant source. Proper management of EoL handling processes can efficiently reduce CFC-11 emissions. Three different management practices have been considered to evaluate future mitigation potentials: (i) a business-as-usual (BAU) scenario, which includes ongoing partial landfilling or recovery of CFC-11 associated with EoL handling; (ii) an advanced scenario in which obsolete products will be collected and properly treated, aiming to destroy 85 % of CFC-11 in obsolete foam products from 2025 onwards (EU, 2012); (iii) a similar scenario as ii but starting from 2030. These cases are aligned with previously defined scenarios S2_SIF and S2_AIF, resulting in a comprehensive matrix of 6 sub-scenarios denoted by unique identifiers.
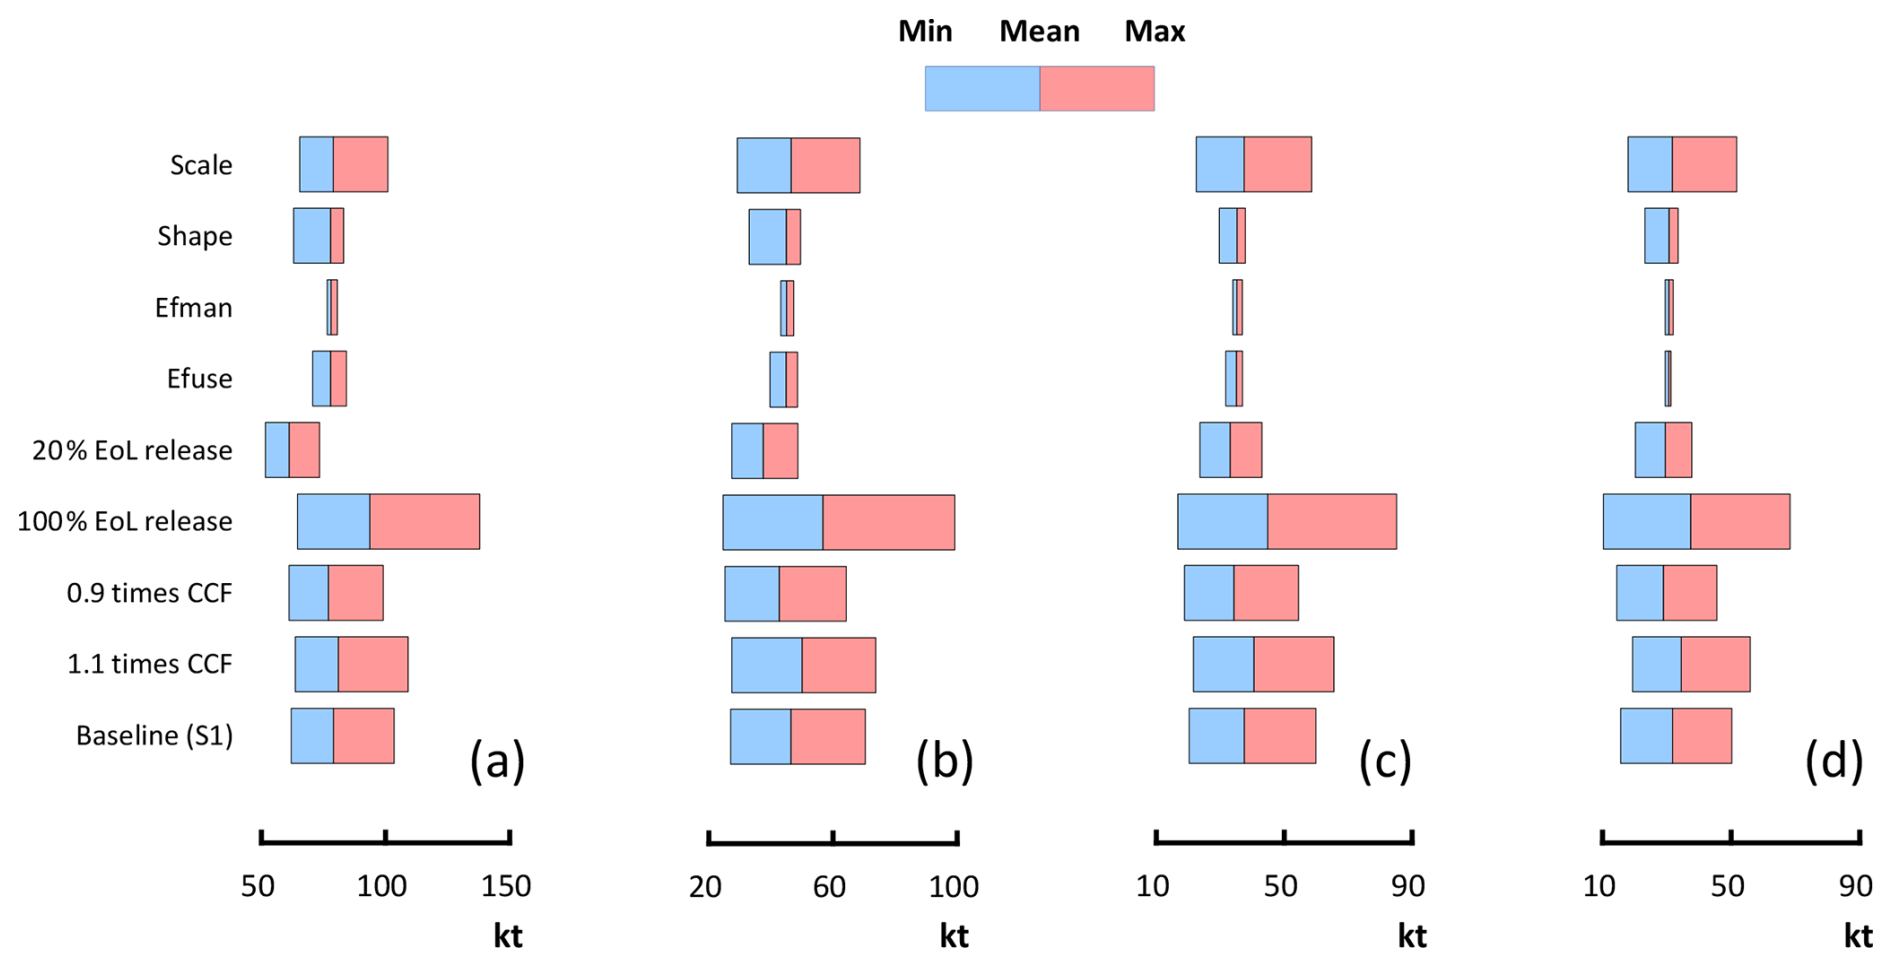
Figure 4Uncertainty and sensitivity analysis of CFC-11 emissions through bottom-up modeling. (a–d) Emission uncertainties induced by various parameters for the year 2000 (a), 2010 (b), 2015 (c) and 2020 (d), respectively. closed-cell foam (CCF).
Figure 3d illustrates the mitigation potential for CFC-11 and its CO2-eq emissions under different S2 scenarios. Implementing globally well-managed EoL handling starting in 2025 could reduce cumulative CFC-11 emissions by 50 %–52 % compared with the BAU scenario between 2025 and 2100. Delaying implementation until 2030 would yield only a 42 % reduction. Compared with CFC-11 in building insulation foams, CFC-11 in appliance insulation foams offers greater emission reduction potential through effective EoL handling. In addition, globally well-managed EoL handling from 2025 could reduce cumulative CO2-eq emissions by 2.3 Gt under S2_SIF_2025 and 2.4 Gt under S2_AIF_2025 compared with S2_SIF and S2_AIF, respectively. When comparing scenarios with well-managed EoL handling from 2030 to those from 2025, the latter could further reduce CO2-eq emissions by an additional 0.4–0.5 Gt, underscoring the importance of prompt action. However, this also indicates that advanced strategies will be required to mitigate approximately 2.2–2.7 Gt CO2-eq emissions from the landfilling of CFC-containing foam products.
3.4 Sensitivity analysis
Figure 4 presents the results of sensitivity analysis of the key factors that influence the bottom-up estimation of CFC-11 emissions in this work. According to the analysis, the changes of shape parameters of Weibull distribution and EFs during manufacture and use contribute to a narrow range of uncertainty. Prior research has investigated uncertainties associated with CFC-11 consumption across different end-use patterns. In this study, these uncertainties are assessed in connection with those of product lifespans. Our analysis reveals a large portion of these associated uncertainties attributable to the overall uncertainty in scale parameters of the Weibull distribution, which are highly sensitive to changes in average product lifespan. Moreover, the emissions during the EoL handling of obsolete products exhibit notable disparities. These discrepancies underscore the need for the refinement of the current understanding of emissions from EoL handling. As investigated, regions generating the highest amounts of waste quantities may have the lowest collection rates and the poorest management systems, and unsuitable management, such as dumpsite disposal or burning without air pollution controls, may exist (Gómez-Sanabria et al., 2022). The influence of these unsuitable EoL handling practices on the release of banked CFC-11 remains to be investigated.
In this study, a D-MFA model was developed to quantify CFC-11 banks and emissions at both global and regional scales from 1950 to 2100. Our results indicate that existing banks partially explain the unexpected surge in CFC-11 emissions observed during 2014–2018. By tracking emissions across product lifecycle stages, we further illustrate that the trajectory of bank-derived CFC-11 emissions may exhibit upward or downward trends, driven by uncertainties in foam product lifespans and EoL handling practices. Specifically, through the integration of probabilistic parameter distributions, our model yields an upper-bound emission estimate of 56 ± 2 kt yr−1 for the 2014–2018 period under the baseline scenario S1. At the regional scale, emissions from China increased moderately, rising from 8 (4–13) kt yr−1 (2008–2012) to 11 (5–13) kt yr−1 (2014–2018), primarily driven by EoL product management practices. For other regions, including the US, Japan and other non-A5 parties, our model results further support consistency with the regional top-down estimates.
Our findings highlight the important role of product lifespan and EoL handling EFs in estimating long-term trajectories of ODSs and hydrofluorocarbons (HFCs). Bottom-up modeling approaches involve multiple parameters and key processes, which collectively contribute to the overall uncertainty in emission estimates. Rigorous and systematic analyses, particularly those examining temporal and spatial variations in product lifespans and release patterns during EoL handling, are therefore essential to mitigating the inherent uncertainties linked to bottom-up modeling. While this study primarily focuses on CFC-11 emissions, the methodology developed here, which explicitly accounts for uncertainties from underexplored sources, offers broad applicability for estimating emissions of other ODSs and HFCs.
All data inputs, including regional production statistics, product lifespan datasets, emission factors and end-of-life handling metrics, are available in the Supplement.
The supplement related to this article is available online at https://doi.org/10.5194/acp-25-11469-2025-supplement.
HL, HD and YM conceptualized and designed the study, conceived the paper, developed the model. HL and YM collected the data and conducted the analysis. NZ drew the figures. HL, HD, NZ, TRM and MX contributed to the conceptual model development. RM, MX and JY enhanced scenario analysis discussions. HD, HL, NZ, RM, YM, TRM, MX and JY contributed to discussing the results and writing the paper.
The contact author has declared that none of the authors has any competing interests.
Publisher’s note: Copernicus Publications remains neutral with regard to jurisdictional claims made in the text, published maps, institutional affiliations, or any other geographical representation in this paper. While Copernicus Publications makes every effort to include appropriate place names, the final responsibility lies with the authors. Also, please note that this paper has not received English language copy-editing. Views expressed in the text are those of the authors and do not necessarily reflect the views of the publisher.
This work was funded by the National Natural Science Foundation of China (grant no. 52070131) and Projects of Talents Recruitment of Guangdong University of Petrochemical Technology (grant nos. 2019rc061, 2022rcyj2001).
This research has been supported by the National Natural Science Foundation of China (grant no. 52070131) and Projects of Talents Recruitment of Guangdong University of Petrochemical Technology (grant nos. 2019rc061, 2022rcyj2001).
This paper was edited by Tanja Schuck and reviewed by two anonymous referees.
AFEAS (Alternative Fluorocarbons Environmental Acceptability Study): AFEAS CFC-11 Production and atmospheric release, https://unfccc.int/files/methods/other_methodological_issues/interactions_with_ozone_layer/application/pdf/cfc1100.pdf (last access: 8 April 2025).
Aktas, C. and Bilec, M.: Impact of lifetime on U.S. residential building LCA results, Int. J. Life Cycle Assess., 17, 337–349, https://doi.org/10.1007/s11367-011-0363-x, 2012.
Ashford, P., Clodic, D., McCulloch, A., and Kuijpers, L.: Emission profiles from the foam and refrigeration sectors comparison with atmospheric concentrations, Int. J. Refrig., 27, 701–716, https://doi.org/10.1016/j.ijrefrig.2004.08.003, 2004.
Ashford, P., Ambrose, A., Jeffs, M., Johnson, B., Kocchi, S., Lee, S., Nott, D., Vodianitskaia, P., Wu, J., Maine, T., Mutton, J., Veenendaal, B., Valenzuela, J., and Singh, L.: Safeguarding the Ozone Layer and the Global Climate System: Issues Related to Hydrofluorocarbons and Perfluorocarbons, Chap. 7, Cambridge Univ. Press, Cambridge, ISBN 978-0-521-86336-0, 2005.
China MEE (Ministry of Ecology and Environment of the People's Republic of China): Transcript of the routine press conference held by the Ministry of Ecology and Environment in May 2019, https://www.mee.gov.cn/xxgk2018/xxgk/xxgk15/202006/t20200602_782341.html (last access: 25 March 2025), 2019 (in Chinese).
Chipperfield, M. P., Hossaini, R., Montzka, S. A., Reimann, S., Sherry, D., and Tegtmeier, S.: Renewed and emerging concerns over the production and emission of ozone-depleting substances, Nat. Rev. Earth Environ., 1, 251–263, https://doi.org/10.1038/s43017-020-0048-8, 2020.
Derwent, R. G., Simmonds, P. G., O'Doherty, S., and Ryall, D. B.: The impact of the Montreal Protocol on halocarbon concentration in Northern Hemisphere baseline and European air masses at Mace Head, Ireland over a ten year period from 1987–1996, Atmos. Environ., 32, 3689–3702, https://doi.org/10.1016/S1352-2310(98)00092-2, 1998.
Duan, H., Miller, T.R., Liu, G., Zeng, X., Yu, K., Huang, Q., Zuo, J., Qin, Y., and Li, J.: Chilling prospect: climate change effects of mismanaged refrigerants in China, Environ. Sci. Technol., 52, 6350–6356, https://doi.org/10.1021/acs.est.7b05987, 2018.
Dunse, B. L., Derek, N., Fraser, P. J., Krummel, P. B., and Steele, L. P.: Australian and Global Emissions of Ozone Depleting Substances: Report prepared for the Australian Government Department of the Environment and Energy, CSIRO Oceans and Atmosphere, Climate Science Centre, Aspendale, Australia, iv, 37 pp., https://www.dcceew.gov.au/environment/protection/ozone/publications/australian-global-emissions-ods (last access: 5 April 2024), 2019.
European Union (EU): Directive 2012/19/EU of the European Parliament and of the Council of 4 July 2012 on waste electrical and electronic equipment (WEEE), https://eur-lex.europa.eu/legal-content/EN/TXT/?uri=CELEX:02012L0019-20180704 (last access: 25 April 2025), 2012.
Fang, X., Ravishankara, A. R., Velders, G. J., Molina, M. J., Su, S., Zhang, J., Hu, J., and Prinn, R. G.: Changes in emissions of ozone-depleting substances from China due to implementation of the Montreal Protocol, Environ. Sci. Technol., 52, 11359–11366, https://doi.org/10.1021/acs.est.8b01280, 2018.
Flerlage, H., Velders, G. J., and de Boer, J.: A review of bottom-up and top-down emission estimates of hydrofluorocarbons (HFCs) in different parts of the world, Chemosphere, 283, 131208, https://doi.org/10.1016/j.chemosphere.2021.131208, 2021.
Fraser, P. J., Dunse, B. L., Krummel, P. B., Steele, L. P., Derek, N., Mitrevski, B., Allison, C. E., Loh, Z., Manning, A. J., Redington, A., and Rigby, M.: Australian chlorofluorocarbon (CFC) emissions: 1960–2017, Environ. Chem., 17, 525–544, https://doi.org/10.1071/EN19322, 2020.
Friedlingstein, P., O'Sullivan, M., Jones, M. W., Andrew, R. M., Bakker, D. C. E., Hauck, J., Landschützer, P., Le Quéré, C., Luijkx, I. T., Peters, G. P., Peters, W., Pongratz, J., Schwingshackl, C., Sitch, S., Canadell, J. G., Ciais, P., Jackson, R. B., Alin, S. R., Anthoni, P., Barbero, L., Bates, N. R., Becker, M., Bellouin, N., Decharme, B., Bopp, L., Brasika, I. B. M., Cadule, P., Chamberlain, M. A., Chandra, N., Chau, T.-T.-T., Chevallier, F., Chini, L. P., Cronin, M., Dou, X., Enyo, K., Evans, W., Falk, S., Feely, R. A., Feng, L., Ford, D. J., Gasser, T., Ghattas, J., Gkritzalis, T., Grassi, G., Gregor, L., Gruber, N., Gürses, Ö., Harris, I., Hefner, M., Heinke, J., Houghton, R. A., Hurtt, G. C., Iida, Y., Ilyina, T., Jacobson, A. R., Jain, A., Jarníková, T., Jersild, A., Jiang, F., Jin, Z., Joos, F., Kato, E., Keeling, R. F., Kennedy, D., Klein Goldewijk, K., Knauer, J., Korsbakken, J. I., Körtzinger, A., Lan, X., Lefèvre, N., Li, H., Liu, J., Liu, Z., Ma, L., Marland, G., Mayot, N., McGuire, P. C., McKinley, G. A., Meyer, G., Morgan, E. J., Munro, D. R., Nakaoka, S.-I., Niwa, Y., O'Brien, K. M., Olsen, A., Omar, A. M., Ono, T., Paulsen, M., Pierrot, D., Pocock, K., Poulter, B., Powis, C. M., Rehder, G., Resplandy, L., Robertson, E., Rödenbeck, C., Rosan, T. M., Schwinger, J., Séférian, R., Smallman, T. L., Smith, S. M., Sospedra-Alfonso, R., Sun, Q., Sutton, A. J., Sweeney, C., Takao, S., Tans, P. P., Tian, H., Tilbrook, B., Tsujino, H., Tubiello, F., van der Werf, G. R., van Ooijen, E., Wanninkhof, R., Watanabe, M., Wimart-Rousseau, C., Yang, D., Yang, X., Yuan, W., Yue, X., Zaehle, S., Zeng, J., and Zheng, B.: Global Carbon Budget 2023, Earth Syst. Sci. Data, 15, 5301–5369, https://doi.org/10.5194/essd-15-5301-2023, 2023.
Gómez-Sanabria, A., Kiesewetter, G., Klimont, Z., Schoepp, W., and Haberl, H.: Potential for future reductions of global GHG and air pollutants from circular waste management systems, Nat. Commun., 13, 1–12, https://doi.org/10.1038/s41467-021-27624-7, 2022.
Hammitt, J. K., Wolf, K. A., Camm, F., Mooz, W. E., Quinn, T. H., and Bamezai, A.: Product uses and market trends for potential ozone-depleting substances, 1985–2000, in: Rand Corporation series reports, prepared for the U.S. EPA, https://www.rand.org/pubs/reports/R3386.html (last access: 5 April 2024), 1986.
Hu, L., Montzka, S. A., Lehman, S. J., Godwin, D. S., Miller, B. R., Andrews, A. E., Thoning, K., Miller, J. B., Sweeney, C., Siso, C., Elkins, J. W., Hall, B. D., Mondeel, D. J., Nance, D., Nehrkorn, T., Mountain, M., Fischer, M. L., Biraud, S. C., Chen, H., and Tans, P. P.: Considerable contribution of the Montreal Protocol to declining greenhouse gas emissions from the United States, Geophys. Res. Lett., 44, https://doi.org/10.1002/2017GL074388, 2017.
IPCC: IPCC Guidelines for National Greenhouse Gas Inventories, vol. 3, Industrial Process and Product Use, https://www.ipcc-nggip.iges.or.jp/public/2006gl/vol3.html (last access: 25 April 2025), 2006.
IPCC: 2019 Refinement to the 2006 IPCC Guidelines for National Greenhouse Gas Inventories, vol. 3, Industrial Process and Product Use, https://www.ipcc-nggip.iges.or.jp/public/2019rf/vol3.html (last access: 25 April 2025), 2019.
Japan METI (Japan Ministry of Economy, Trade and Industry): Documents pertaining to methods for estimating discharge, https://www.meti.go.jp/policy/chemical_management/law/prtr/6.html (last access: 25 March 2025), 2024 (in Japanese).
Lickley, M., Solomon. S., Fletcher, S., Velders, G., Daniel, J., Rigby, M., Montzka, S.A., Kuijpers, L., Stone, K.: Quantifying contributions of chlorofluorocarbon banks to emissions and impacts on the ozone layer and climate, Nat. Commun., 11, 1380, https://doi.org/10.1038/s41467-020-15162-7, 2020.
Lickley, M., Fletcher, S., Rigby, M., and Solomon, S.: Joint inference of CFC lifetimes and banks suggests previously unidentified emissions, Nat. Commun., 12, 2920, https://doi.org/10.1038/s41467-021-23229-2, 2021.
Lickley, M. J., Daniel, J. S., Fleming, E. L., Reimann, S., and Solomon, S.: Bayesian assessment of chlorofluorocarbon (CFC), hydrochlorofluorocarbon (HCFC) and halon banks suggest large reservoirs still present in old equipment, Atmos. Chem. Phys., 22, 11125–11136, https://doi.org/10.5194/acp-22-11125-2022, 2022.
Liu, H., Yano, J., Kajiwara, N., and Sakai, S.: Dynamic stock, flow, and emissions of brominated flame retardants for vehicles in Japan, J. Clean. Prod., 232, 910–924, https://doi.org/10.1016/j.jclepro.2019.05.370, 2019.
Liu, H., Duan, H., Zhang, N., Ma, Y., Liu, G., Miller, T. R., Mao, R., Xu, M., Li, J., and Yang, J.: Rethinking time-lagged emissions and abatement potential of fluorocarbons in the post-Kigali Amendment era, Nat. Commun., 15, 6687, https://doi.org/10.1038/s41467-024-51113-2, 2024.
Martínez, J. H., Romero, S., Ramasco, J. J., and Estrada, E.: The world-wide waste web, Nat Commun., 13, 1615, https://doi.org/10.1038/s41467-022-28810-x, 2022.
McCulloch, A. and Midgley, M.: Estimated historic emissions of fluorocarbons from the European Union, Atmos. Environ., 32, 1571–1580, https://doi.org/10.1016/S1352-2310(97)00393-2, 1998.
McCulloch, A., Ashford, P., and Midgley, P. M.: Historic emissions of fluorotrichloromethane (CFC-11) based on a market survey, Atmos. Environ., 35, 4387–4397, https://doi.org/10.1016/S1352-2310(01)00249-7, 2001.
Montzka, S. A., Dutton, G. S., Yu, P., Ray, E., Portmann, R. W., Daniel, J. S., Kuijpers, L., Hall, B. D., Mondeel, D., Siso, C., Nance, J. D., Rigby, M., Manning, A. J., Hu, L., Moore, F., Miller, B. R., and Elkins, W.: An unexpected and persistent increase in global emissions of ozone-depleting CFC-11, Nature, 557, 413–417, https://doi.org/10.1038/s41586-018-0106-2, 2018.
Montzka, S. A., Dutton, G. S., Portmann, R. W., Chipperfield, M. P., Davis, S., Feng, W., Manning, A. J., Ray, E., Rigby, M., Hall, B. D., Siso, C., Nance, J. D., Krummel, P. B., Mühle, J., Young, D., O'Doherty, S., Salameh, P. K., Harth, C. M., Prinn, R. G., Weiss, R. F., Elkins, W., Terrinoni, H. W., and Theodoridi, C.: A decline in global CFC-11 emissions during 2018–2019, Nature, 590, 428–432, https://doi.org/10.1038/s41586-021-03260-5, 2021.
Park, S., Western, L. M., Saito, T., Redington, A. L., Henne, S., Fang, X., Prinn, R. G., Manning, A. J., Montzka, S. A., Fraser, P. J., Ganesan, A. L., Harth, C. M., Kim, J., Krummel, P. B., Liang, Q., Mühle, J., O'Doherty, S., Park, H., Park, M., Reimann, S., Salameh, P. K., Weiss, R. F., and Rigby, M.: A decline in emissions of CFC-11 and related chemicals from eastern China, Nature, 590, 433–437, https://doi.org/10.1038/s41586-021-03277-w, 2021.
Pyle, J. A., Keeble, J., Abraham, N. L., Chipperfield, M. P., and Griffiths, P. T.: Integrated ozone depletion as a metric for ozone recovery, Nature, 608, 719–723, https://doi.org/10.1038/s41586-022-04968-8, 2022.
Redington, A. L., Manning, A. J., Henne, S., Graziosi, F., Western, L. M., Arduini, J., Ganesan, A. L., Harth, C. M., Maione, M., Mühle, J., O'Doherty, S., Pitt, J., Reimann, S., Rigby, M., Salameh, P. K., Simmonds, P. G., Spain, T. G., Stanley, K., Vollmer, M. K., Weiss, R. F., and Young, D.: Western European emission estimates of CFC-11, CFC-12 and CCl4 derived from atmospheric measurements from 2008 to 2021, Atmos. Chem. Phys., 23, 7383–7398, https://doi.org/10.5194/acp-23-7383-2023, 2023.
Rigby, M., Park, S., Saito, T., Western, L. M., Redington, A. L., Fang, X., Henne, S., Manning, A. J., Prinn, R. G., Dutton, G. S., Fraser, P. J., Ganesan, A. L., Hall, B. D., Harth, C. M., Kim, J., Kim, K. R., Krummel, P. B., Lee, T., Li, S., Liang, Q., Lunt, M. F., Montzka, S. A., Mühle, J., O'Doherty, S., Park, M., Reimann, S., Salameh, P. K., Simmonds, P., Tunnicliffe, R. L., Weiss, R. F., Yokouchi, Y., and Young, D.: Increase in CFC-11 emissions from eastern China based on atmospheric observations, Nature, 569, 546–550, https://doi.org/10.1038/s41586-019-1193-4, 2019.
SKM ENVIROS: Further Assessment of Policy Options for the Management and Destruction of Banks of ODS and F-Gases in the EU: Prepared for the European Commission, Final report, https://climate.ec.europa.eu/document/download/89673572-7c70-4ed3-a9aa-de31f3e58fb8_en?filename=ods_ f-gas_destruction_report_2012_en.pdf (last access: 10 March 2025), 2012.
TEAP (Technology and Economic Assessment Panel): Volume 1: decision XXX/3 TEAP Task Force Report on Unexpected Emission of Trichlorofluoromethane (CFC-11), Final Report, https://ozone.unep.org/system/files/documents/TEAP-TF-DecXXX-3-unexpected_CFC11_ emissions-september2019.pdf (last access: 14 March 2025), 2019.
TEAP (Technology and Economic Assessment Panel): Volume 3: decision XXXI/3 TEAP Task Force Report on Unexpected Emissions of Trichlorofluoromethane (CFC-11), https://ozone.unep.org/system/files/documents/Final_TEAP-DecisionXXXI-3-TF-Unexpected-Emissions-of-CFC-11-may2021.pdf (last access: 14 March 2025), 2021.
Tsutsumi, H and Komatsu, Y.: Transition of the lifetime of wooden houses since 1980, J. Archit. Plann., 580, 169–174, 2004 (in Japanese).
UNEP (United Nations Environment Programme): Report of the Rigid and Flexible Foams Technical Options Committee (FTOC) 2002 assessment, https://ozone.unep.org/sites/default/files/2019-05/FTOC-2002-Assessment-Report.pdf (last access: 15 March 2025), 2002.
UNEP (United Nations Environment Programme): Technology and Economic Assessment Panel (TEAP): Task Force on Emissions Discrepancies Report, Nairobi, Kenya, https://ozone.unep.org/sites/default/files/2019-05/TEAP-Discrepancy-report.pdf (last access: 15 March 2025), 2006.
U.S. EPA (United States Environmental Protection Agency): Inventory of Greenhouse Gas Emissions and Sinks: 1990–2022, https://www.epa.gov/ghgemissions/inventory-us-greenhouse-gas-emissions-and-sinks-1990-2022 (last access: 8 March 2025), 2024.
Wan, D., Xu, J., Zhang, J., Tong, X., and Hu, J.: Historical and projected emissions of major halocarbons in China, Atmos. Environ., 43, 5822–5829, https://doi.org/10.1016/j.atmosenv.2009.07.052, 2009.
WMO (World Meteorological Organization): Report on the Unexpected Emissions of CFC-11, WMO-No. 1268, https://ozone.unep.org/system/files/documents/SAP-2021-report-on-the-unexpected-emissions-of-CFC-11-1268_en.pdf (last access: 2 March 2025), 2021.
WMO (World Meteorological Organization): Scientific Assessment of Ozone Depletion: 2022, Ozone Research and Monitoring – GAW Report No. 278, https://ozone.unep.org/system/files/documents/Scientific-Assessment-of-Ozone-Depletion-2022.pdf (last access: 5 March 2025), 2023.
Yi, L., Wu, J., An, M., Xu, W., Fang, X., Yao, B., Li, Y., Gao, D., Zhao, X., and Hu, J.: The atmospheric concentrations and emissions of major halocarbons in China during 2009–2019, Environ. Pollut., 284, 117190, https://doi.org/10.1016/j.envpol.2021.117190, 2021.
Young, P. J., Harper, A. B., Huntingford, C., Paul, N. D., Morgenstern, O., Newman, P. A., Oman, L. D., Madronich, S., and Garcia, R. R.: The Montreal Protocol protects the terrestrial carbon sink, Nature, 596, 384–388, https://doi.org/10.1038/s41586-021-03737-3, 2021.