the Creative Commons Attribution 4.0 License.
the Creative Commons Attribution 4.0 License.
 | 22 Sep 2025
Interdecadal shift in the impact of winter land–sea thermal contrasts on following spring transcontinental dust transport pathways in North Africa
Qi Wen
Yan Li
Mengying Du
Wenjun Song
Linbo Wei
Zhilan Wang
Xu Li
North Africa, the largest and most active dust source region globally, plays a critical role in the Earth's environment by dispersing dust over remote areas, especially in terms of circum-global transport that has occurred many times since the start of the 21st century. As a key indicator of the thermodynamic structure and dynamical circulation of the troposphere, the land–sea thermal contrast (LSC) can influence the variability in dust and subsequent large-scale propagation, but the extent of such influence is still unknown. This study reveals that in around the late 1990s, the influence of pre-winter LSC on the spring dust transport pathway was reversed in North Africa, which is attributed to the bridging effect of the North Atlantic Oscillation (NAO). Before 2000, the warm land–cold ocean (+WLCO) pattern in pre-winter was typically associated with the NAO+ mode, and the anomalous northeasterly and zonal circulation in the following spring facilitated the westward transport of dust from the lower troposphere in western North Africa towards the Atlantic. Since 2000, the reversed zonal temperature pattern (−WLCO) has led to the NAO− mode and enhanced mid-latitude westerlies in winter, which has persisted into the next spring. Under conditions of unusually dry soil and strong dry convection, dust has been mixed into the middle to upper troposphere and subsequently transported eastward globally, affecting regions including West Asia, northern China, the Pacific, and southeastern North America after 2000. This study underscores the critical role of sea–land–atmosphere interaction in circum-global dust propagation and offers new perspectives for investigating dust change mechanisms in the context of climate change.
- Article
(14021 KB) - Full-text XML
-
Supplement
(1600 KB) - BibTeX
- EndNote


North Africa is one of the major sources of dust in the world (Engelstaedter et al., 2006; Huneeus et al., 2011), and the long-range transport of dust has profound impacts on Atlantic hurricanes (Sun et al., 2008; Rousseau-Rizzi and Emanuel, 2022), global climate change (Westphal et al., 1987; Sassen et al., 2003; Kok et al., 2023), the carbon cycle (Keith et al., 2006; Swap et al., 1992; Guieu et al., 2002), and human health (Mallone et al., 2011; Brauer et al., 2012; Wang et al., 2020).
Under the amplified influence of global warming, North African dust activity has experienced significant modifications in recent decades. Pronounced alterations in large-scale atmospheric circulations, particularly the Hadley circulation and mid-latitude westerlies (Feng et al., 2018; Cheng et al., 2022; Toggweiler, 2009), have fundamentally reshaped dust transport patterns. Observational records from 1980 to 2020 reveal divergent trends in regional dust export: a decreasing flux towards the Atlantic (−0.29 ± 0.16 % per decade) contrasted by increasing Mediterranean transport (0.24 ± 0.18 % per decade), which is potentially associated with the Hadley cell's expansion (Adame et al., 2022). Correspondingly, emerging evidence points to increased frequency of extreme transcontinental dust events, exemplified by the June 2020 “Godzilla” dust storm that transported 24 ± 3.2 Tg of Saharan material circum-globally through an “express lane” – mid-latitude westerly wind (Bi et al., 2024; Francis et al., 2020; Asutosh et al., 2022). The dominant factors of significant decadal changes in the propagation of dust in North Africa deserve further exploration.
Global warming has exhibited significant temporal and spatial heterogeneity. The warming trend accelerated until the late 1990s, followed by a period of apparent stagnation (Fyfe et al., 2013). This warming pattern has been particularly evident in terrestrial regions compared to oceanic areas, a phenomenon known as terrestrial amplification (TA; Seltzer et al., 2023; Sutton et al., 2007; Byrne and O'Gorman, 2018). The TA effect alters the magnitude of the land–sea thermal contrast (LSC) (Joshi et al., 2008; Byrne and O'Gorman, 2013), which plays a critical role in regulating the climate system's energy balance and redistribution, thereby altering the planetary wave patterns throughout the entire troposphere (Held and Ting, 1990; Garfinkel et al., 2020). For instance, the strong land–sea temperature gradient between the eastern coasts of Asia and North America is a prominent source of baroclinicity, triggering eastward-extending storm tracks, which in turn, energetically support the jet streams (Hoskins and Valdes, 1990; Brayshaw et al., 2009). As global warming has intensified, changes in the LSC have substantially influenced key climate patterns, such as the intensity of monsoon systems (Torres-Alavez et al., 2014; Tao et al., 2016; Roxy et al., 2015), the frequency of tropical and Arctic cyclones (Tang et al., 2019; Day and Hodges, 2018), and perturbations in the westerly belt (He et al., 2014, 2018; Portal et al., 2022), all of which could exacerbate the frequency of extreme weather events.
In fact, mid-latitude LSC plays a crucial role in interannual to interdecadal atmospheric variability, potentially influencing North African dust transport pathways, particularly circum-global circulation processes. According to the thermal-equilibration theory, the asymmetry of the zonal surface temperature pattern can induce a global-scale wave-like thermal structure thereby triggering a resonance between the mid-latitude circulation and temperature structure, or a zonal flow pattern (Marshall and So, 1990; Mitchell and Derome, 1983). LSC variations, exemplified by the winter cold ocean–warm land (COWL) pattern, are often closely linked to the North Atlantic Oscillation (NAO) through tropospheric planetary wave modulation (Molteni et al., 2011). The alternating phases of the NAO significantly affect the emission and propagation of Saharan dust. Especially during the NAO+ (NAO−) phase, dust is typically transported westward (eastward) into the tropical Atlantic (eastern Mediterranean) by northeasterly (southwesterly) winds (Moulin et al., 1997; Chiapello et al., 1997; Ginoux et al., 2004; Riemer et al., 2006; Doherty et al., 2008; Kaskaoutis et al., 2019; Dai et al., 2022). Subsequently, the dominant easterly transport of mineral dust is further enhanced by the westerly jet stream, facilitating circum-global dust dispersion and significantly influencing downstream regions such as Asia (Pu and Ginoux, 2016; Liu et al., 2022; Awad and Mashat, 2014).
Reanalyzed data and model results have demonstrated that the LSC has induced significant modifications in planetary-scale atmospheric wave patterns (He et al., 2014, 2018), with the dominant airflow and dust transport pathways in North Africa being affected. However, has the LSC affected the decadal variation in dust in North Africa? And what is its impact mechanism? These issues have not been answered yet. We find that a regime shift in dust transport dynamics took place in around the late 1990s. It is shown that, during the pre-2000 epoch, the COWL pattern, driven by land warming in pre-winter, affected the westward transport path of North Africa dust during the subsequent spring. After this period, a reversed zonal temperature pattern (warm ocean and cold land, WOCL) continued to enhance the eastward dust transport, facilitating circum-global dispersion as far as southeastern North America. In addition, the mechanisms underlying the trans-seasonal effects of this large-scale dynamical precursor signal and its transport have been thoroughly elucidated.
2.1 Methods
2.1.1 SVD of extratropical surface air temperature (SAT) and North African dust
Surface thermal modes have a significant impact on the alternation of the two possible dynamic equilibria (wave or band components), which may affect North African dust activity. Singular value decomposition (SVD) analysis was conducted to initially explore this relationship by examining the covariance matrices of springtime North African dust concentration and pre-winter extratropical temperatures.
2.1.2 The land–sea contrast (LSC) index
Firstly, the anomaly pattern associated with the “traditional”, empirically based northern extratropical low-frequency variability is presented. This is characterized by an empirical orthogonal function (EOF) associated with the second principal component of the 500 hPa height (Z500) anomaly in the Northern Hemisphere extratropics (20–80° N), which displays a pronounced zonal asymmetry (Fig. 1). Molteni et al. (2011) defined the land–sea contrast as the band wave 2 component of the net surface heat flux, averaged over four sectors of 90° longitude each. Considering that latent heat is almost negligible during the winter months, it is sufficient to consider the difference in sensible heat between the land and ocean surfaces. Therefore, referring to the approach of He et al. (2014), the LSC index (LSCI) can thus be expressed in a straightforward manner as the land–ocean contrast of the SAT anomaly in the critical zone (east coast of North America and east coast of East Asia) with the following equation:
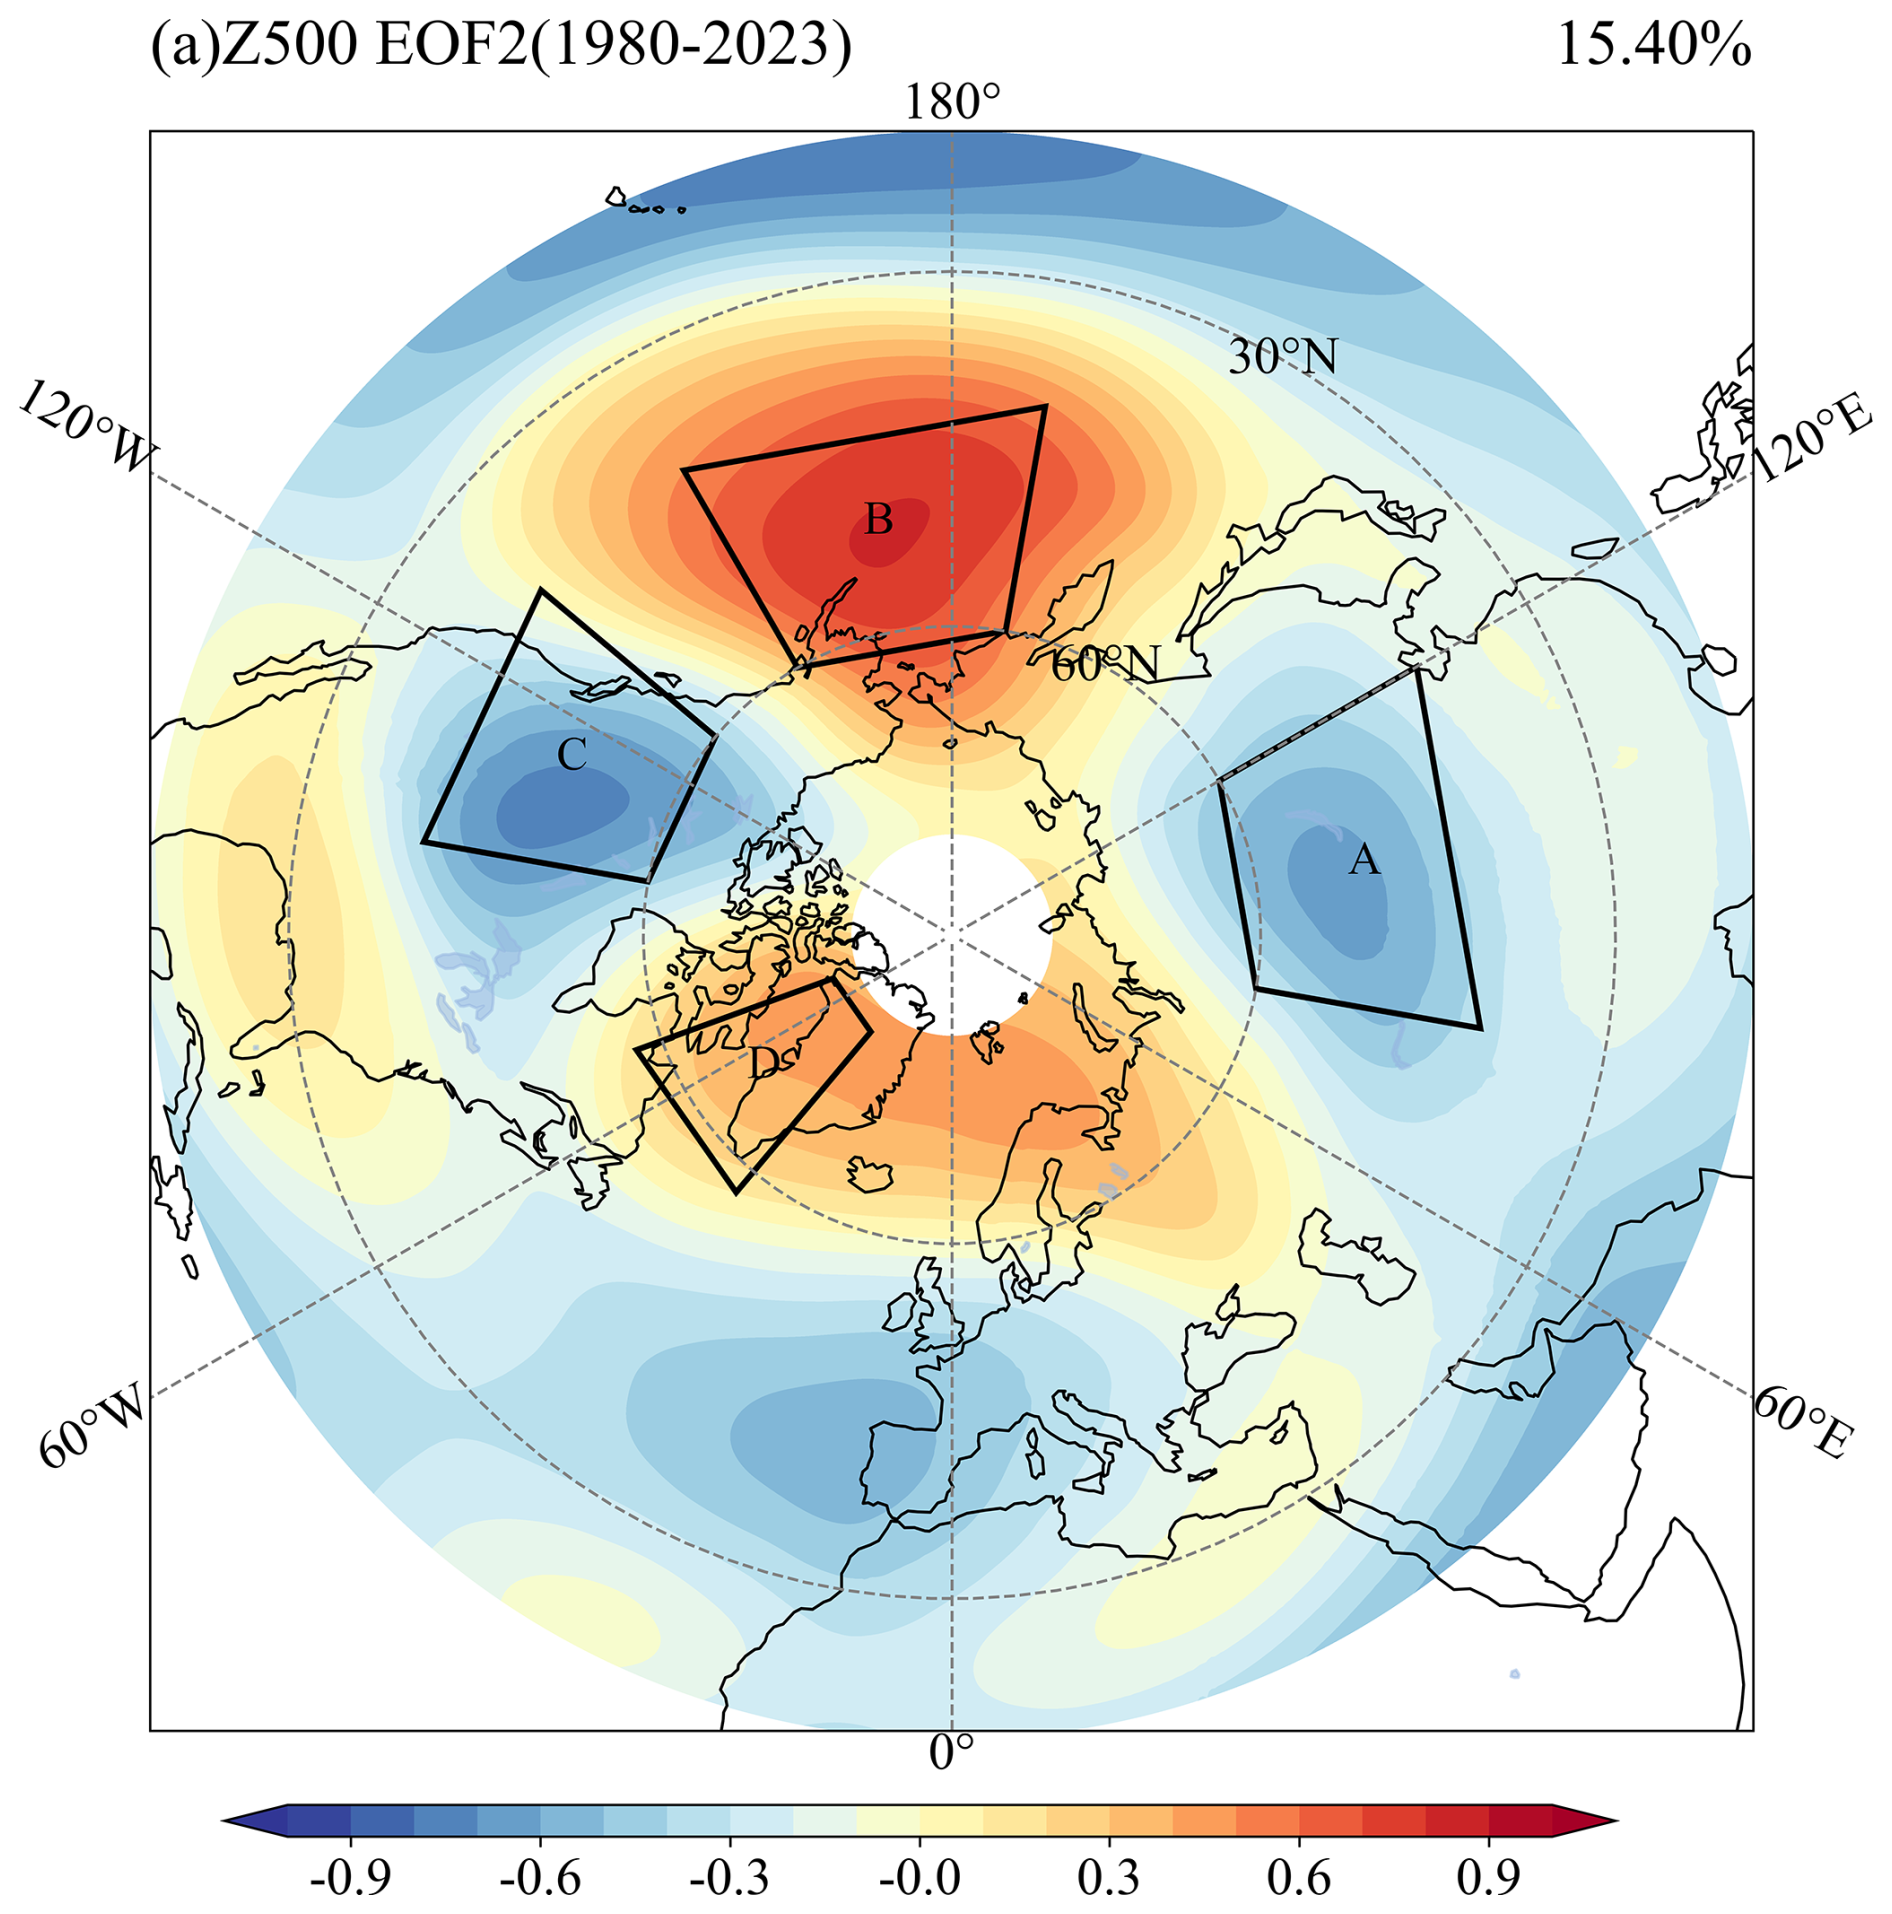
Figure 1The second EOF of DJF mean 500 hPa geopotential height (Z500) during 1980–2023, with reference to He et al. (2014). The regions A, B, C, and D represent East Asia (40–60° N, 80–120° E), the Pacific (40–60° N, 170° E–150° W), North America (40–60° N, 130–100° W) and the Greenland Sea (57.5–77.5° N, 70–40° W), respectively.
The heat capacity of the land is considerably less than that of the oceans, resulting in a significantly greater warming of the continents during winter compared to the oceans under global warming. Consequently, a positive LSC value indicates a warmer climate with a reduced temperature gradient between land and sea. During the winter months, the anomalous warming of the land results in a shift from a negative to a positive LSC, signifying a reduction in the temperature disparity between the land and the sea.
2.1.3 Selection of years for composite analysis in the two periods
In accordance with established climatological standards, normal values are typically calculated for a minimum of 30 consecutive years in order to obtain a meaningful mean. As our study is concerned with interdecadal climate change, an analysis of shorter periods may yield different trends than those observed for longer climatic periods. However, given that records of the MERRA-2 dust data only commence in 1980, a compromise was reached. This period division captures a clear climatological discontinuity, as evidenced by the sliding t test showing maximum statistical significance (p < 0.05) for regime shifts centered on 2000 (Fig. S1 in the Supplement), thus objectively delineating the two study periods (1980–2000 and 2001–2023).
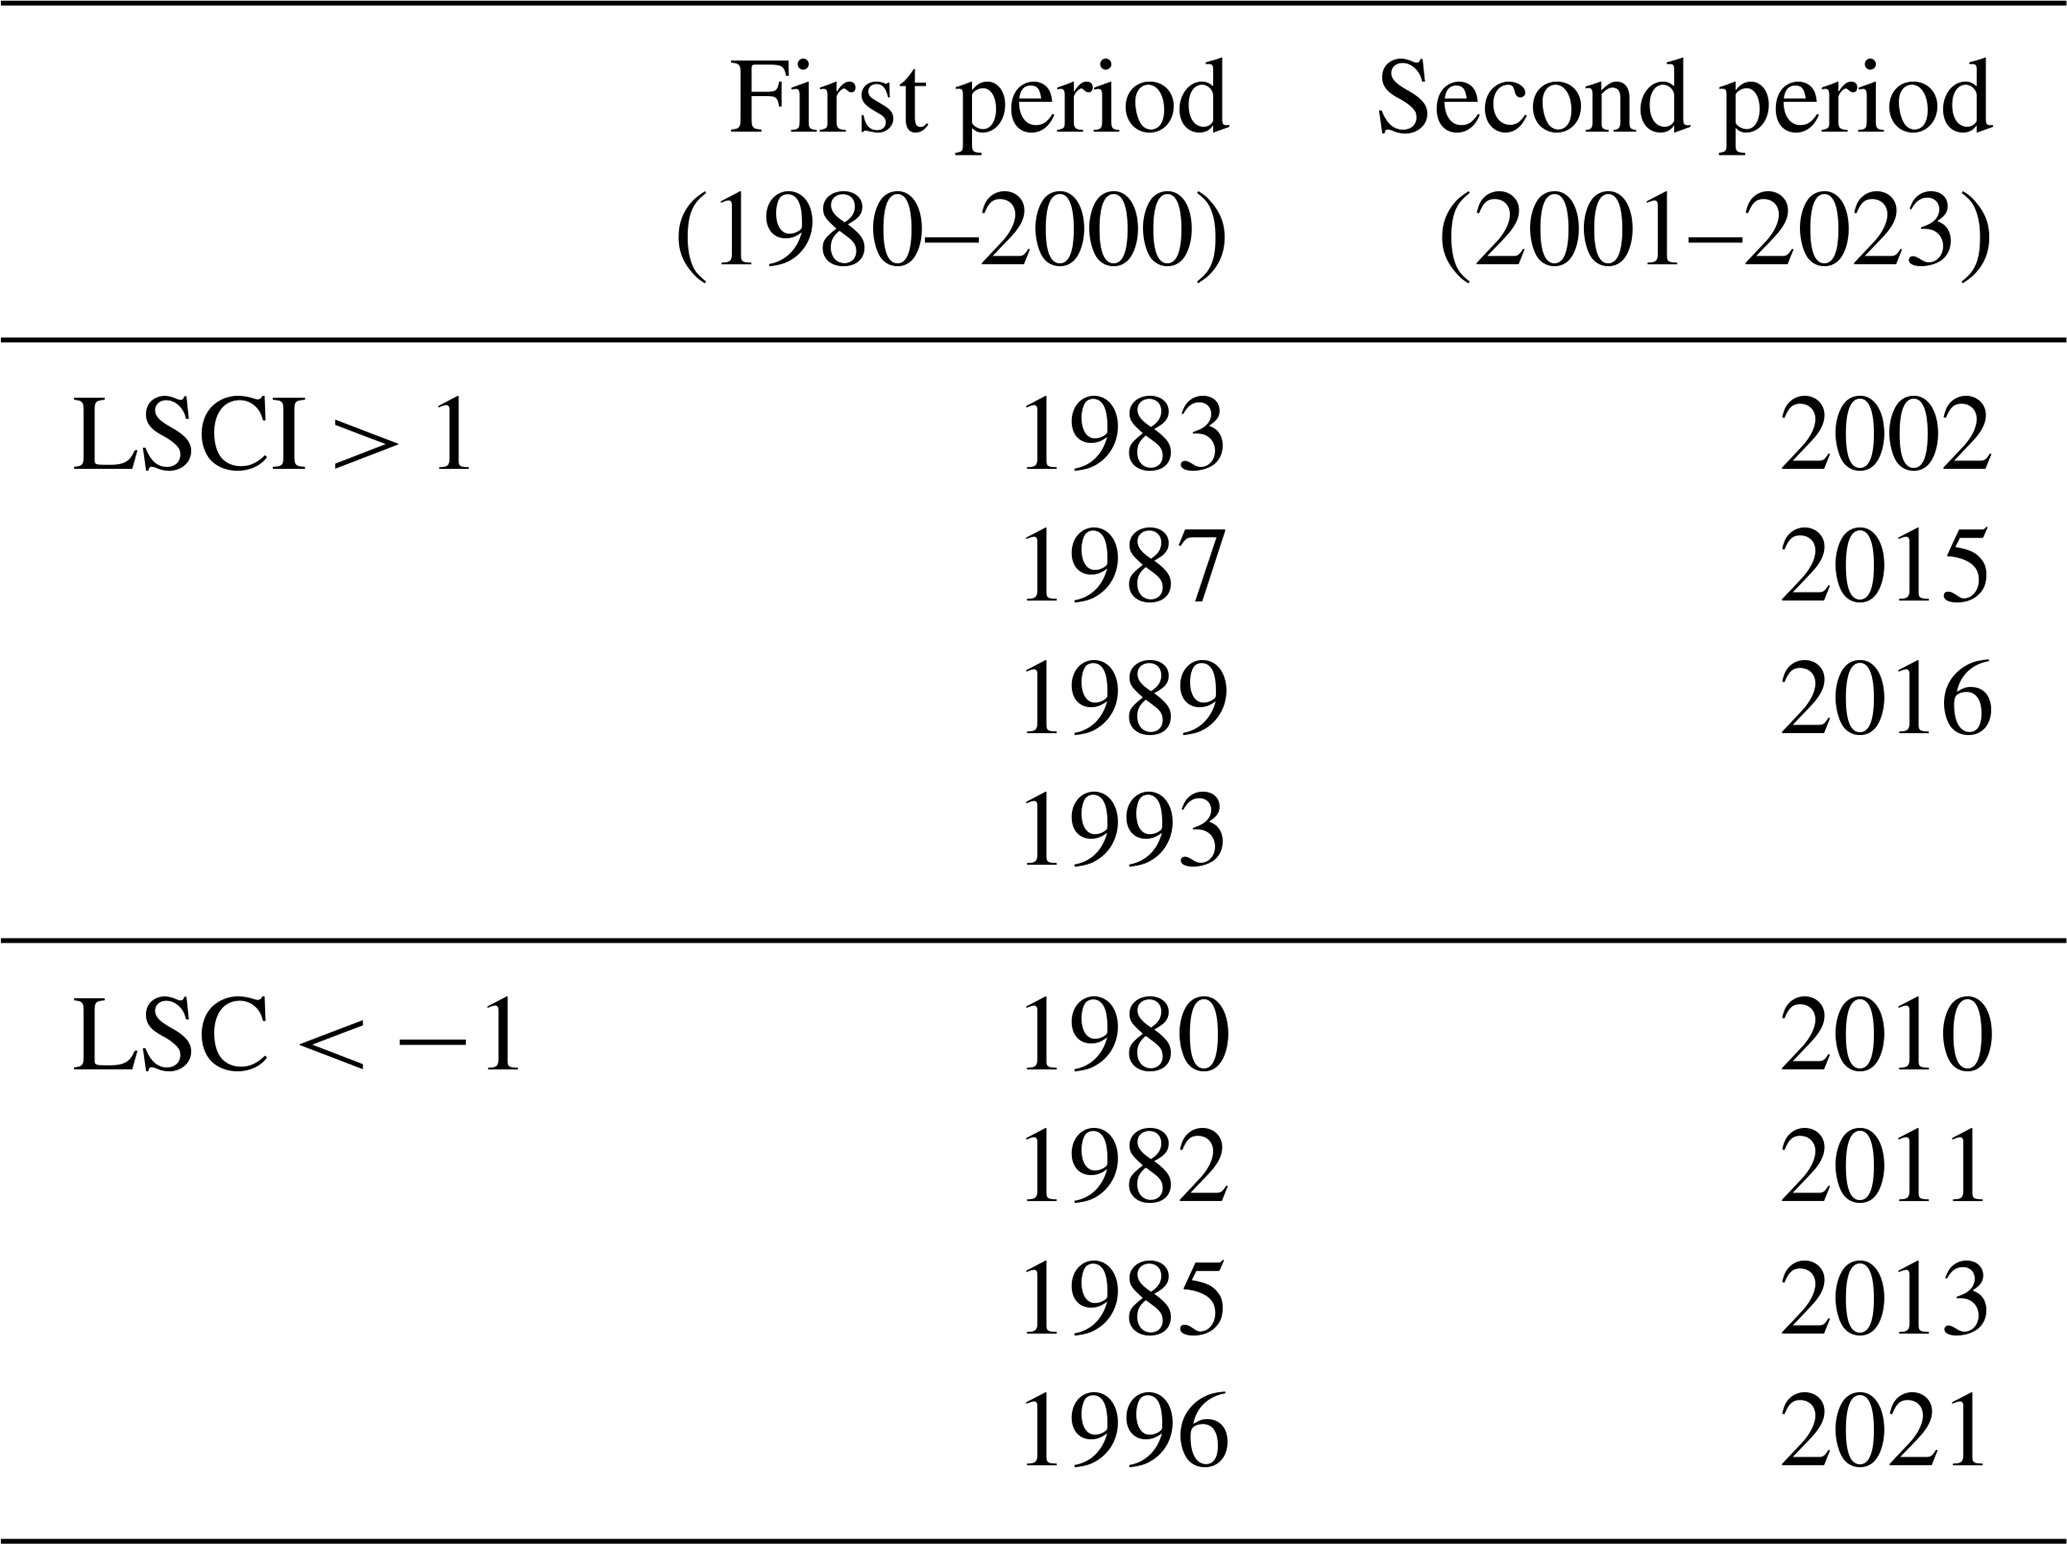
Further investigation into the LSC-related dust transport characteristics in North Africa during these two periods is conducted through composite analyses. The 1-fold standard deviations of the standardized LSCI serve as thresholds for selection, with the years corresponding to the positive and negative phases of the LSC (Table 1). Note that the composite analysis for the first period uses high-value years (LSCI > 1) minus low-value years (LSCI < −1), whereas the second period uses low-value years (LSCI < −1) minus high-value years (LSCI > 1), which is related to the interdecadal shift in the relationship between the winter LSC and spring dust in North Africa. The significance test is based on the two-sided Student's t test.
Table 1List of year selection for composite analysis in this study.
2.2 Data
The monthly SATs used to calculate the LSC index are derived from the Met Office Hadley Centre's observational dataset HadCRUT5. This is one of the main datasets used to monitor global and regional surface temperature variations and trends. In order to obtain the longest possible dust sequence for the study of relevant interdecadal variability, the MERRA-2 dust data are selected here. The MERRA-2 dataset is a reanalysis product developed using the Goddard Earth Observing System of Systems (GEOS-5.12.4) atmospheric model, which simulates global aerosol properties using the radiatively coupled Goddard Chemistry, Aerosol, Radiation, and Transport (GOCART) model. MERRA-2 directly assimilates aerosol optical depths derived from the AERONET and MISR instruments, as well as bias-corrected dust concentrations and aerosol data from the Advanced Very High-Resolution Radiometer (AVHRR) and Moderate Resolution Imaging Spectroradiometer (MODIS) instruments. In the present study, monthly dust properties are considered, namely dust column mass density and meteorological and land conditions related to dust activities – Z500, U200, UV500, potential vorticity (PV), UV10, T2M, soil moisture (SM), etc. – at a spatial resolution of 0.625° × 0.5°.
In order to investigate the impact of LSC on dust transport in North Africa, a comparison is made between historical simulations (1980–2014) from the 14 participating Coupled Model Intercomparison Project Phase 6 (CMIP6) models that contain both dust and meteorological information. The selected models are detailed in Table S1 in the Supplement. Monthly outputs from CMIP6 are employed to examine the response of dust aerosols and upper zonal winds to the land–sea contrast in the model since the 1980s.
3.1 Interdecadal LSC signal in pre-winter leads to change in the circum-global transport path of North Africa in the following spring
Utilizing the SVD analysis (see “Methods”), coherence is observed between pre-winter extratropical surface air temperature (SAT) in the Northern Hemisphere (NH) and spring dust mass column density (hereafter referred to as DUST) in North Africa. The first mode explains 43.15 % of the total variance, and substantial correlation of R = 0.64 (11-year filtered correlation, R = 0.86) is demonstrated by the time series of the two variables (PC1-DUST and PC1-SAT). The spatial pattern of the DUST field is revealed to follow a zonal tripole mode (Fig. 2a), with an interdecadal abrupt change around 2000 (Fig. 2c). The interdecadal variability characteristics of regional dust activity are consistent with previous research findings (Shi et al., 2021). On the other hand, the extratropical SAT field highlights the thermal contrast, with an opposite signal between Asia (Siberia) and the eastern Pacific and an even greater thermal contrast between North America and the Greenland Sea (Fig. 2b). This spatial temperature pattern, called the COWL, has also been found in previous studies (Wallace et al., 1996; Wu and Straus, 2004; He et al., 2014). Based on the east coast of North America and east coast of East Asia, LSCI is defined (see “Methods”), and it shows a significant correlation of 0.86 with the PC1-SAT. The interannual variation in the LSCI (Fig. 2d) is consistent with the two phases of warming (warming acceleration and warming stagnation). The subsequent study will use this index to further analyze decadal variability.
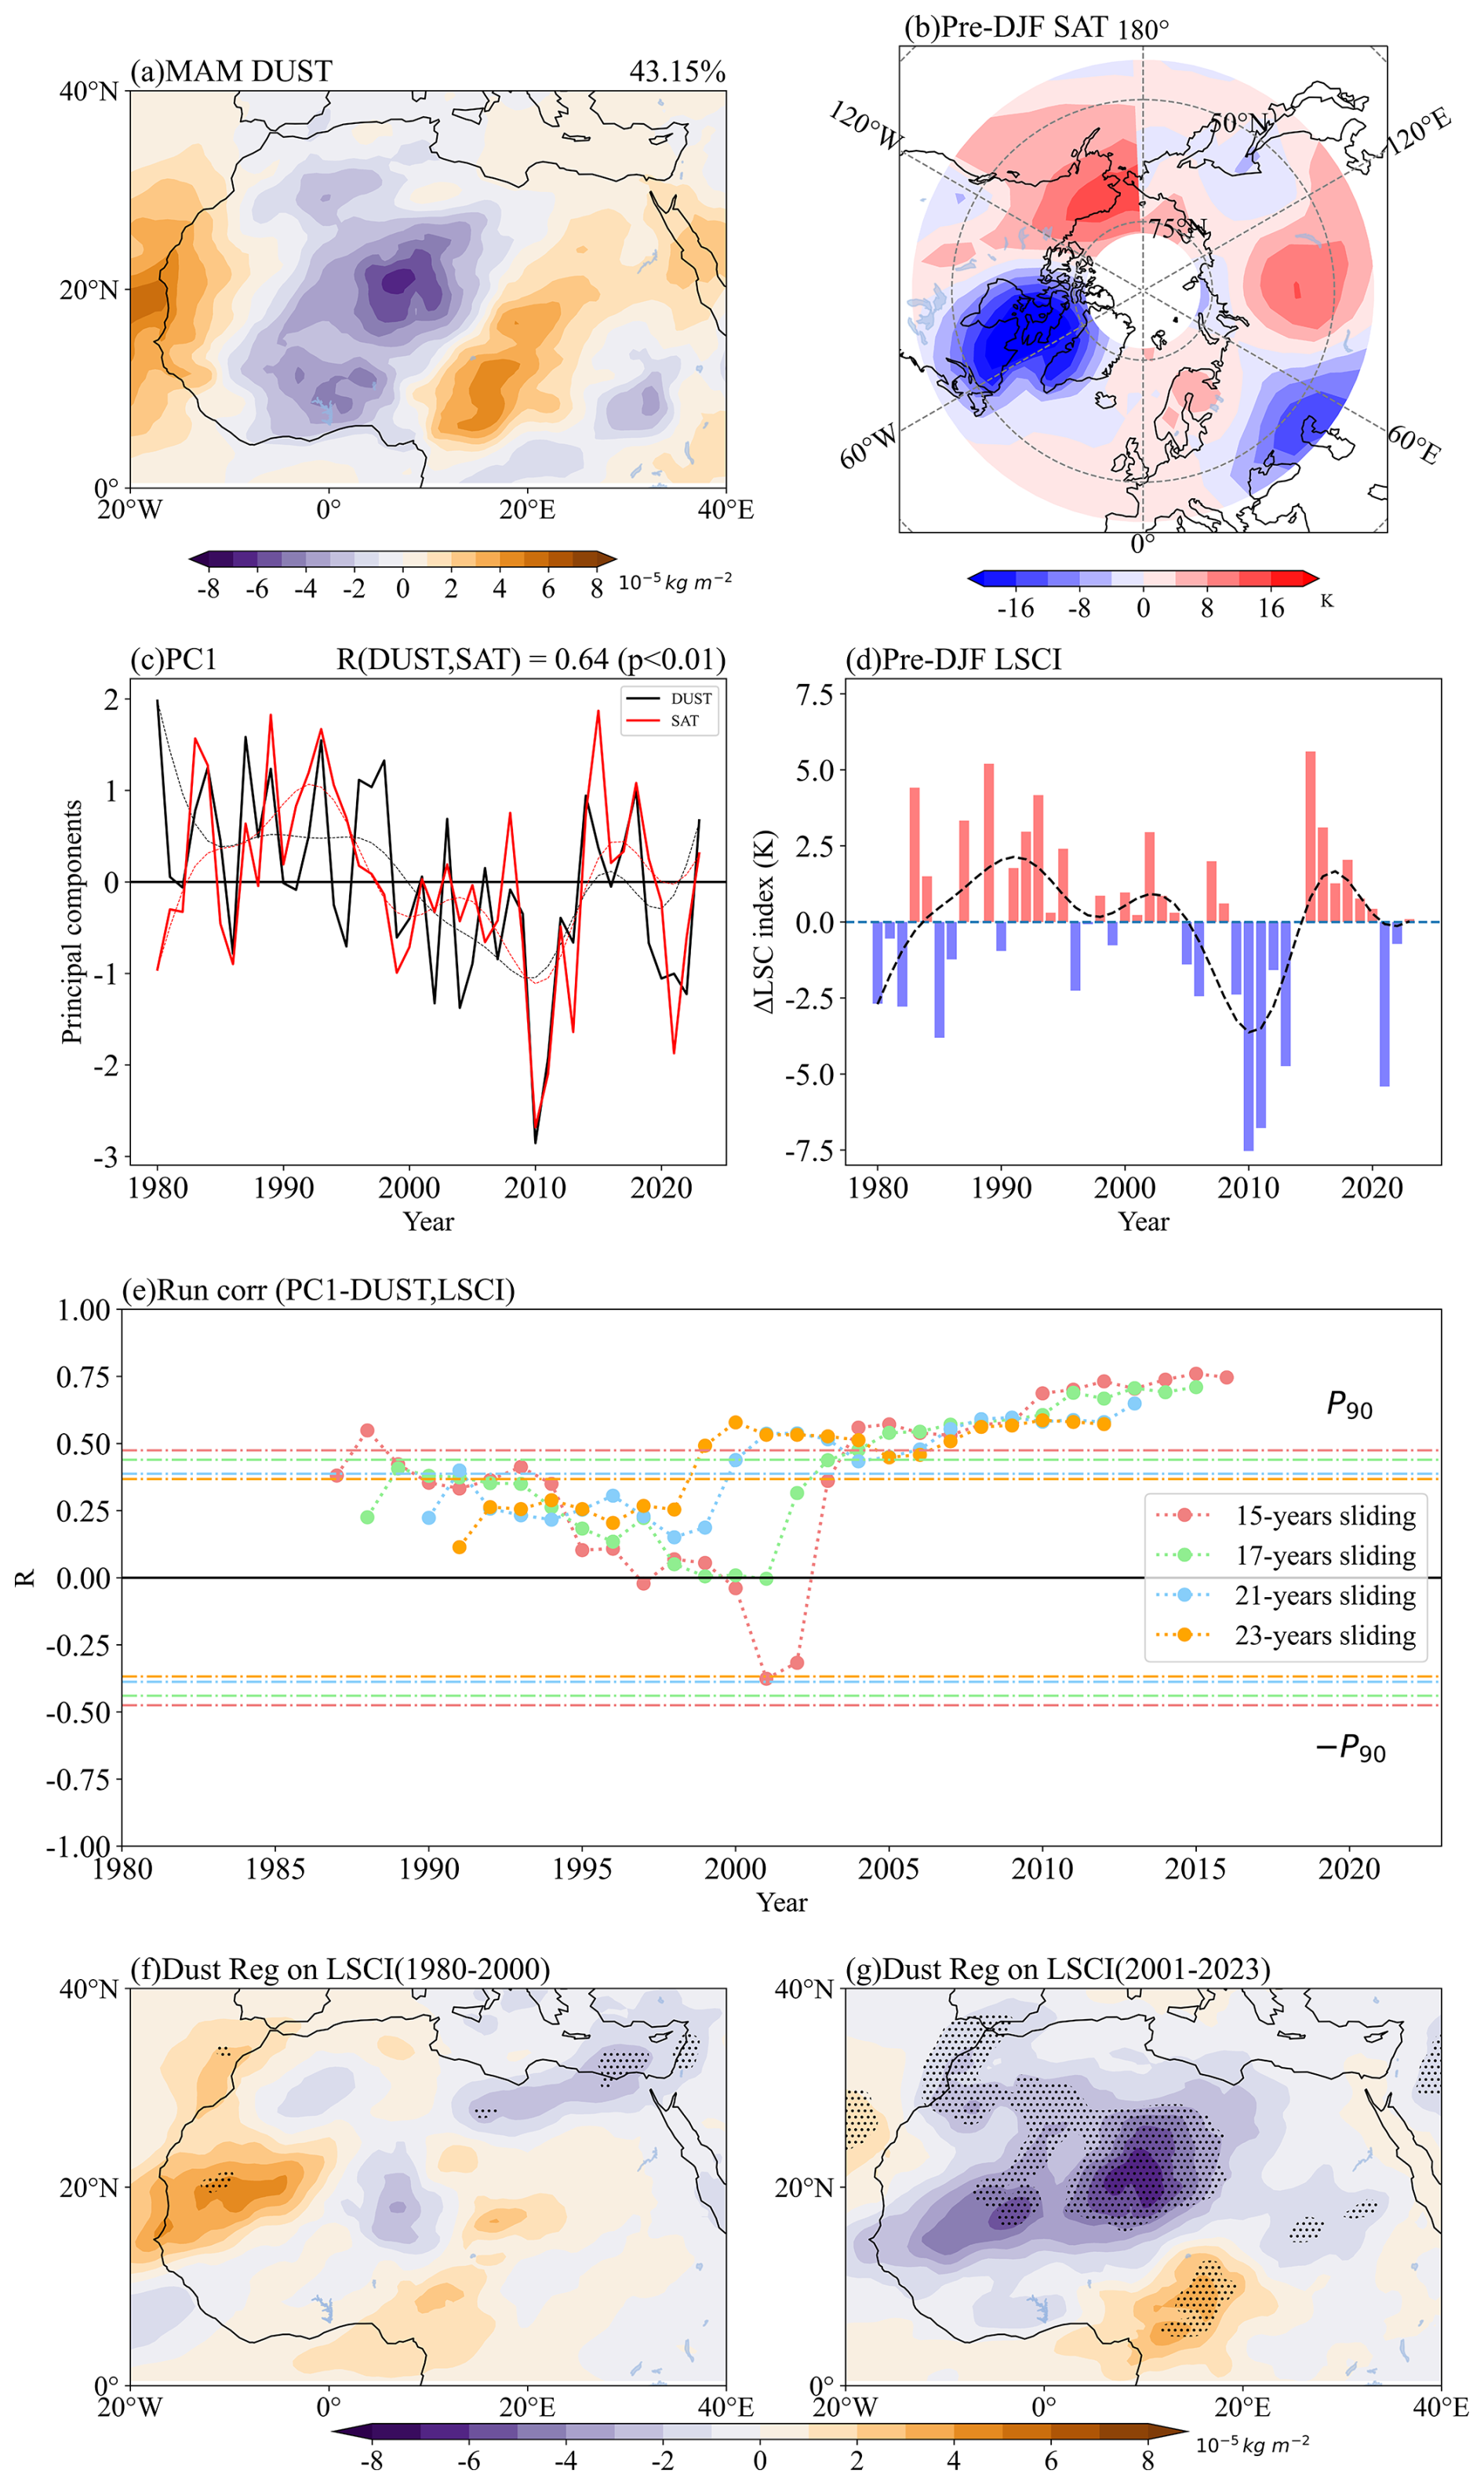
Figure 2The relationship between pre-winter land–sea thermal contrasts (LSCs) and spring North African dust. The SVD first mode between detrended spring (MAM) MERRA-2 dust mass column density (DUST) in North Africa (a) and pre-winter (DJF) surface air temperature (SAT) (b) from 1980 to 2023. (c) Time series (solid) and low-pass-filtered (dashed) SVD first-mode coefficients of the DUST (black line) and the extratropical SAT (red line). (d) LSC index time series and its corresponding low-pass filter (dashed black line; unit: K). (e) The sliding correlations between the DJF LSC index and PC1-DUST index under different moving windows (15, 17, 21, 23 years). The regression patterns of detrended DUST in relation to LSCI (standardization) during (f) 1980–2000 and (g) 2001–2023 (shading; 10−5 kg m−2). The black dots indicate that the correlation coefficients pass the 90 % confidence test.
The correlation between the pre-winter LSCI and the following spring PC1-DUST exhibits a stepwise change over time, with a stable and significant relationship between the two variables emerging only after the late 1990s (Fig. 2e). The dust–LSC correlation remains statistically significant regardless of window length selection (Fig. 2e), with particularly stable associations emerging after 2000. The sliding t test for PC1-DUST indicates a significant abrupt change in dust in the year 2000 (Fig. S1). To further analyze the decadal impact of LSC on North African dust, we examine the regression spatial field of spring dust with respect to the pre-winter LSCI during the two periods (1980–2000 and 2001–2023; see “Methods”). Prior to 2000, significant positive regression coefficients are found in a small region of West Africa, while the relationship in the central region is not significant (Fig. 2f). After 2000, distinct negative regression coefficients are observed in the central region (Fig. 2g).
In composite analysis, under warming in North America and East Asia alongside cooling along their eastern coasts (Fig. S2a), i.e., the LSC positive phase, positive dust anomalies over West Africa predominantly follow westward trajectories to the Atlantic Ocean for 1980–2000 (Fig. 3a). This westward transport pattern aligns with observations by Evan et al. (2016), who documented peak Atlantic dust export in the 1980s followed by a marked post-2000 decline. After 2000, dust related to the negative LSC phase exhibits preferential eastward transport to West Asia and northern China via the eastern Mediterranean, consistent with the intensification of eastward pathways since 1980 reported by Adame et al. (2022). Notably, a March 2003 North African dust event traversed continental scales, depositing 50 % of Japan's dust load within a week (Tanaka et al., 2005). Moreover, unlike the westward pathway, LSC-linked dust can be transported eastward across the North Pacific along a considerably longer path, reaching the southeastern region of North America in the second period (Fig. 3b and j). The regression analysis of dust aerosol optical depth (DOD) in relation to LSC reveals that 43 % (6 out of 14) of CMIP6 models reproduce the observed significant spatial correlations (p < 0.1) between LSC and dust variability. Notably, a robust positive LSC–DOD relationship persists along the Atlantic coast of West Africa (Fig. S2a), while significant negative correlations emerge post-1990s over North Africa, mid-latitude Asia, and southern North America (Fig. S3b). This multi-model consensus, despite CMIP6's known dust biases, underscores the interdecadal variability in dust distribution patterns associated with LSC.
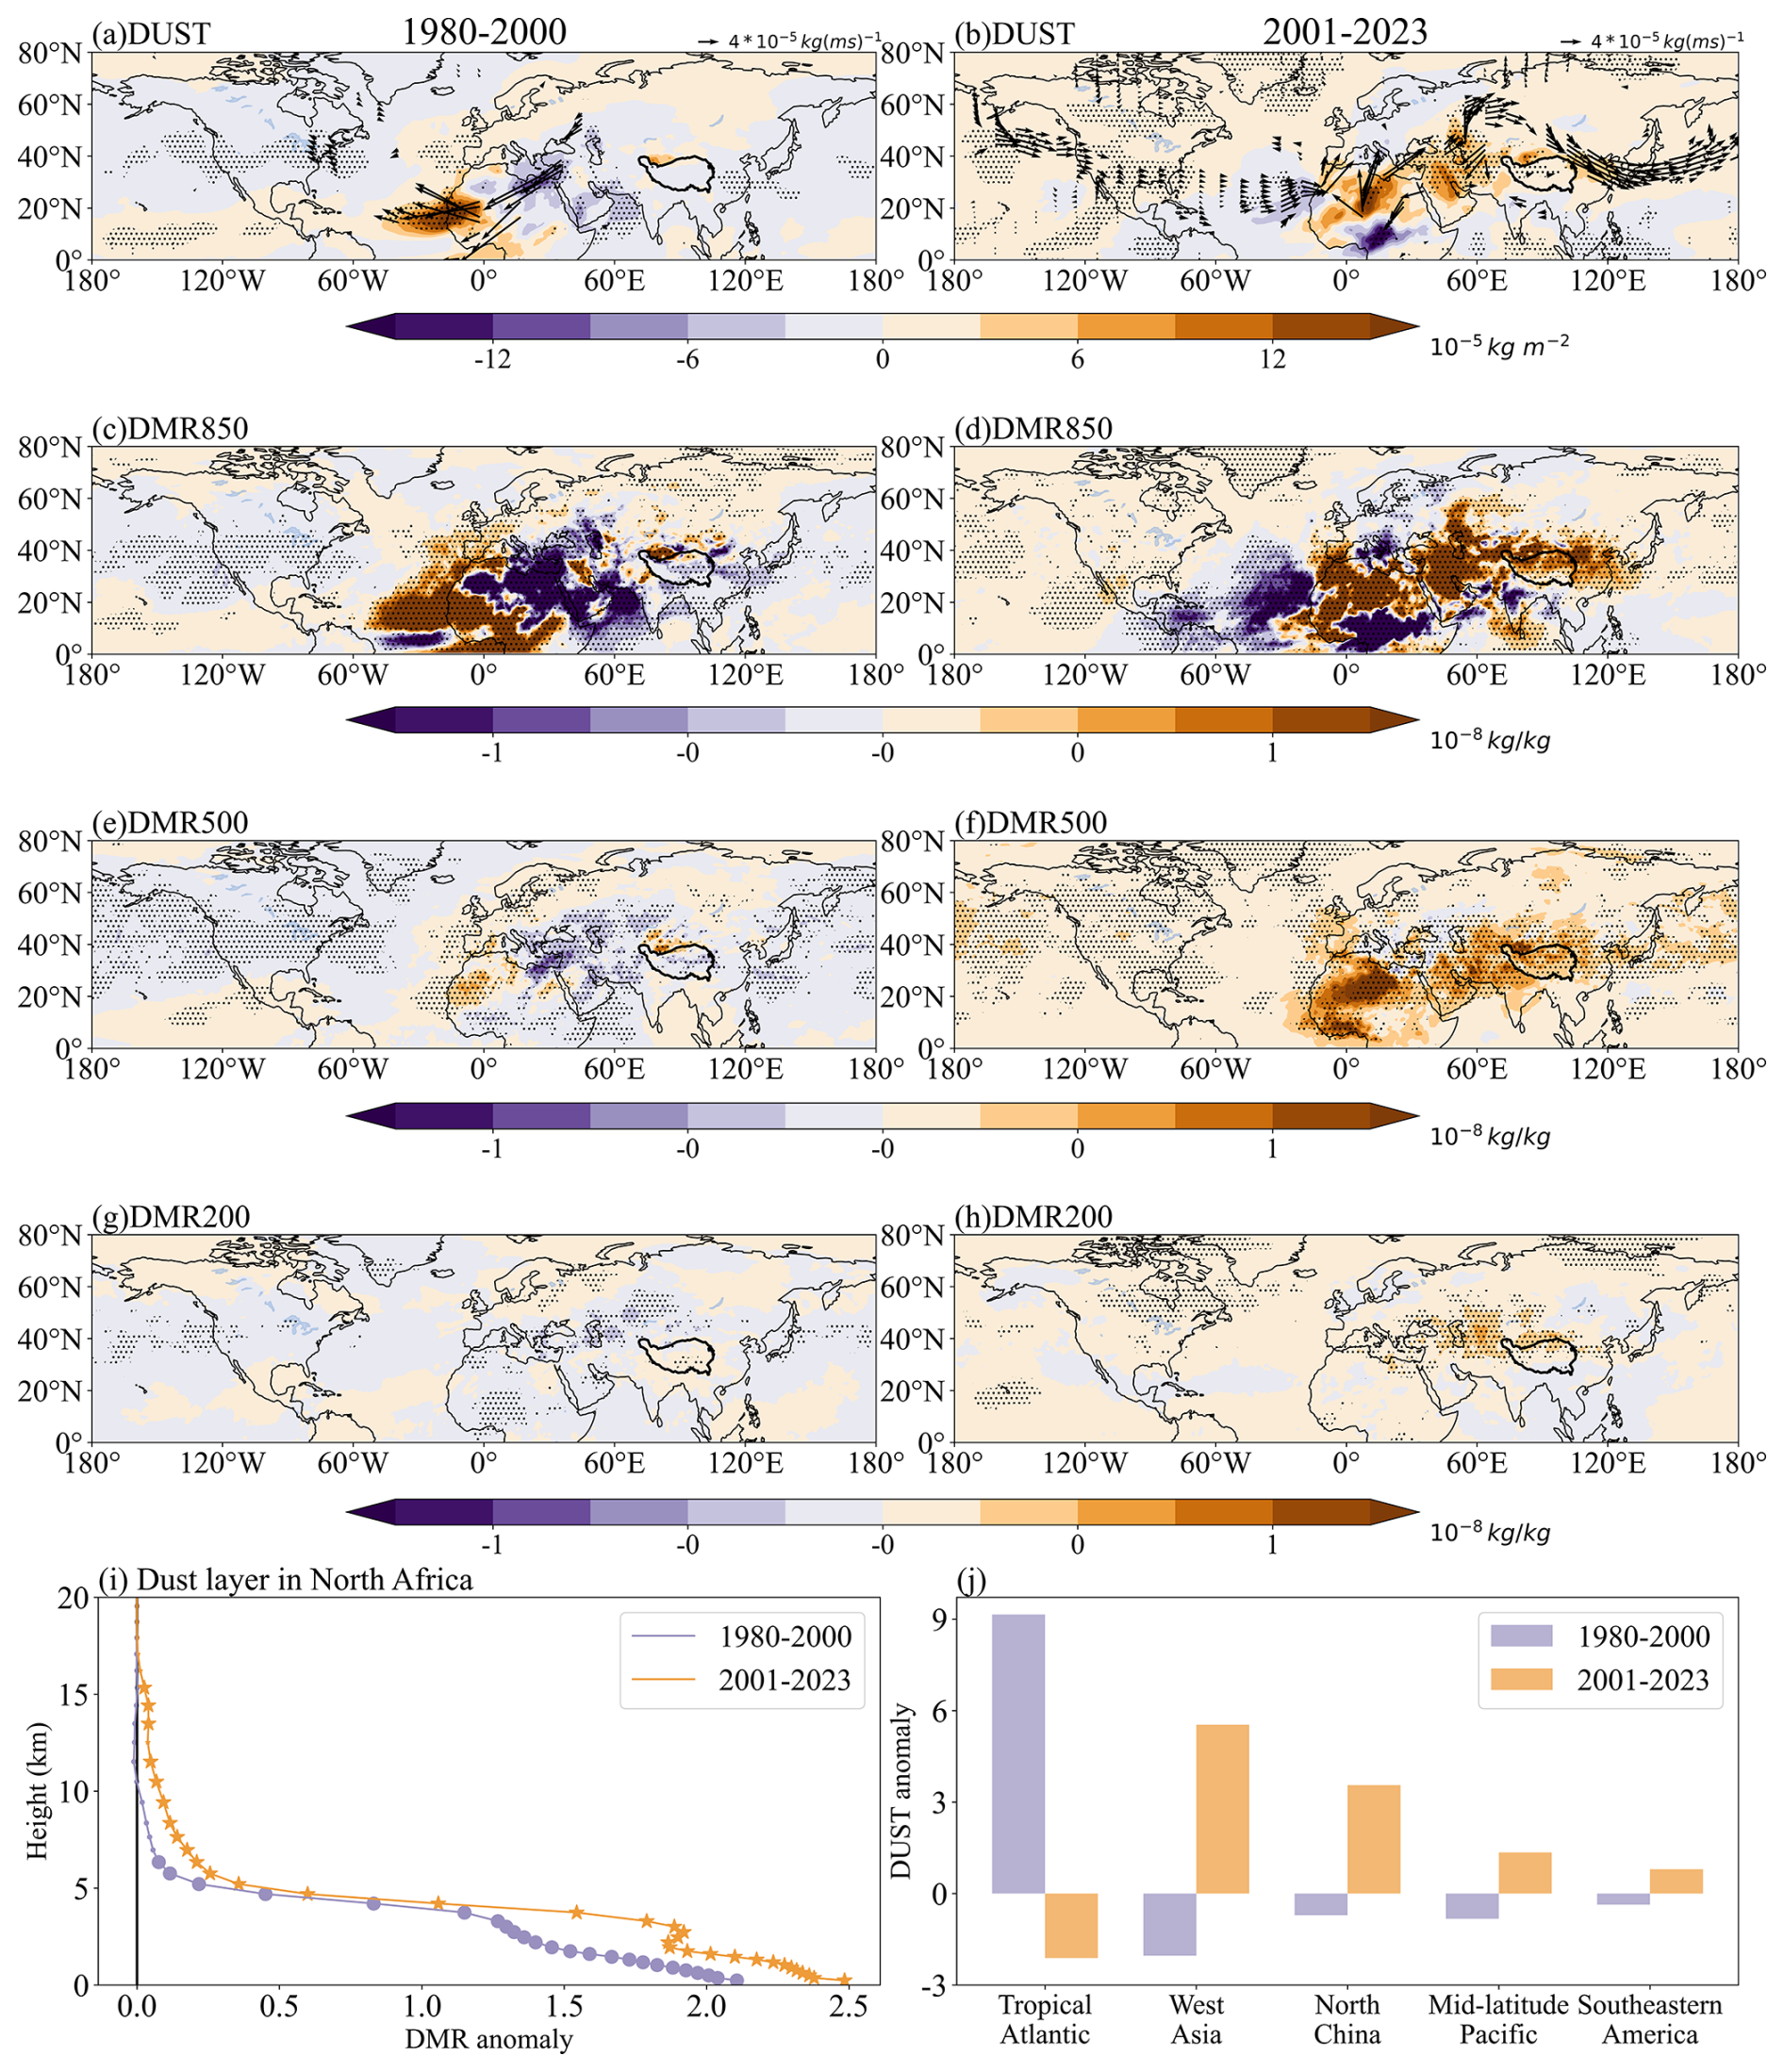
Figure 3Changes in the spring dust transport pathway and transport height in North Africa associated with pre-winter LSC of composite analysis during the two periods. Composite analysis of the DUST anomalies (shading; 10−5 kg m−2) and dust column UV-wind mass flux anomalies (vectors; 10−5 kg m−1) in (a) 1980–2000 (positive LSC minus negative LSC) and (b) 2001–2023 (negative LSC minus positive LSC). Spatial characteristics of dust mixing ratio (DMR) anomalies (shading; 10−8 kg kg−1) at (c) 850 hPa, (e) 500 hPa, and (g) 200 hPa in 1980–2000 for representative layers and at (d) 850 hPa, (f) 500 hPa, and (h) 850 hPa in 2001–2023. (i) Vertical structure of DMR anomalies at the North African sand source (5–30° N, 18° W–30° E) during the two periods. (j) The regional average of the DUST anomalies in five subregions (West Asia (35–40° N, 32–60° E), northern China (34–40° N, 95–120° E), mid-latitude Pacific (35–50° N, 180–150° W), and southeastern North America (25–40° N, 108° W–83° E)). The black dots (a–h) and vectors (a–b) indicate that the anomalies pass the 90 % confidence test.
During the first period, Atlantic-bound dust transport predominantly occurred within the low to middle troposphere (850–500 hPa) (Fig. 3c and e), as evidenced by vertical cross-sections of dust mixing ratios (DMRs) in the Sahara (Fig. 3i). The second period reveals an elevated dust layer extending to 10 km altitude (Fig. 3i), demonstrating sustained eastward transport – a pattern attributable to springtime North African dust emissions according to satellite-derived analyses (Yang et al., 2022). Significant positive DMR anomalies are observed at 500 hPa across nearly the entire zonal belt in the mid-latitudes (Fig. 3f), consistent with the findings of Uno et al. (2009). Their CALIOP observations and transport model simulations suggest that circum-global dust trajectories persist in the upper troposphere for multiple revolutions before deposition. Notably, our analysis identifies stronger DMR anomalies at 500 hPa than at 850 hPa over the North Pacific (Fig. 3d and f), highlighting mid-tropospheric dominance in trans-Pacific dust transport.
3.2 Mechanisms for the interdecadal shifts of impact of LSC on dust transport path
For the first period, the composite geopotential height anomalies at 500 hPa (Z500) are presented in Fig. 4a and c, illustrating the differences between the LSC positive and negative phases. During the pre-winter period, a general positive anomaly in Z500 is observed over the NH mid-latitudes, including North America, Eurasia, and the Atlantic Ocean, while a negative anomaly is evident in higher latitudes (Fig. 4a). The NAO+ mode is observed in the extratropical Atlantic region, accompanied by PV anomalies (Fig. 4a and g), which typically facilitate downstream Rossby wave breaking, as reported in previous studies (He et al., 2014; Molteni et al., 2011). In the following spring, the anomalous anticyclone over northwestern North Africa, triggered by the winter NAO+ mode, drives anomalous northeasterly winds, transporting dust from the Sahara to the Atlantic (Fig. 4c and h). The 10 m anomalous easterly wind probability in the tropical Atlantic is significantly higher in the 1980–2000 LSC positive phase compared to the 2000–2023 LSC negative phase (Fig. 4h; the short red line represents p < 0.1 for positive LSC). Long-duration, widespread dusty events are frequently associated with explosive anticyclones situated to the rear of the northern Sahara (Knippertz and Todd, 2012). In addition, during the positive LSC phase, weakened and poleward mid-latitude westerlies further amplify terrestrial warming through a positive feedback mechanism (He et al., 2014), which also enhances dust activity.
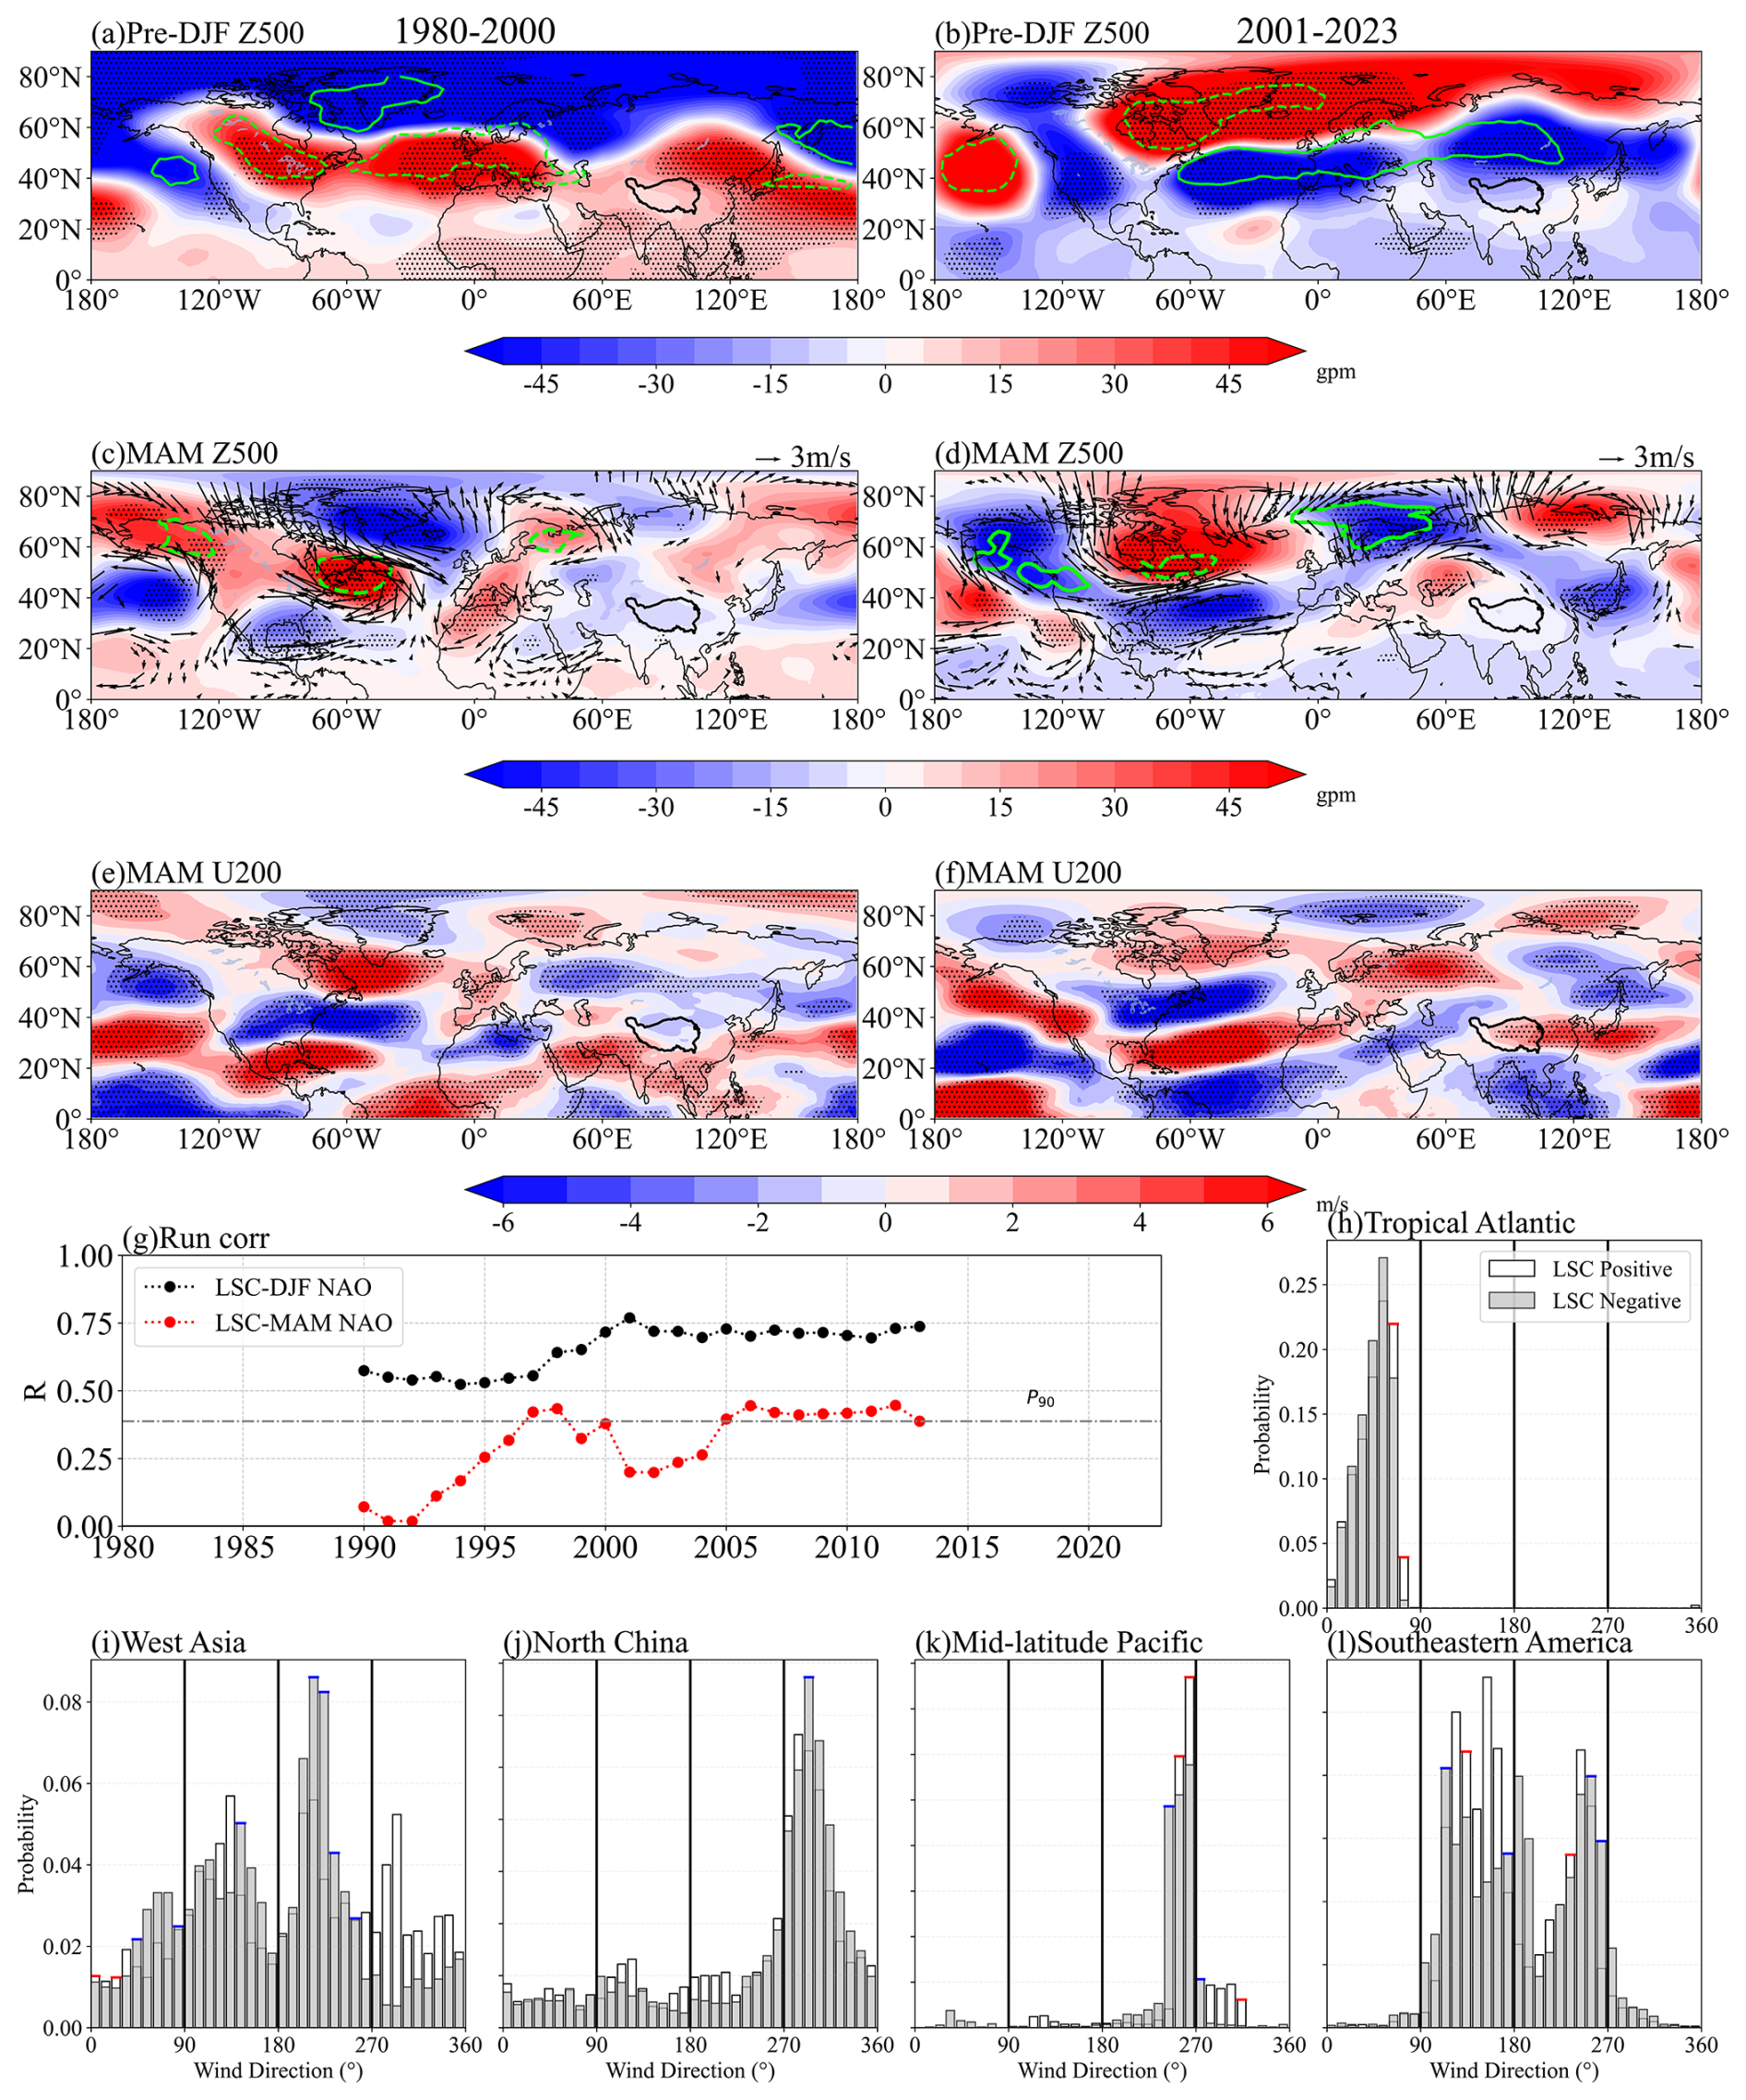
Figure 4Atmospheric anomalies in spring associated with pre-winter LSC of composite analysis during the two periods. Composite (a) pre-DJF 500 hPa geopotential height (Z500) anomalies (shading; gpm) with 320 K potential vorticity (PV320) anomalies (green contours; only absolute values > 0.3 are shown; solid lines represent positive and dashed lines represent negative phases; PVU), (c) MAM Z500 anomalies (shading; gpm) with PV320 and 500 hPa horizontal wind (UV500) anomalies (vectors; m s−1), and (e) 200 hPa U-wind (U200) anomalies (shading; m s−1) for 1980–2000 (positive LSC minus negative LSC). Composite (b) pre-DJF Z500 with PV320, (d) MAM500 with PV320 and UV500, and (f) U200, for 2001–2023 (negative LSC minus positive LSC). (g) The pre-DJF LSC associated with a 21-year sliding correlation with the NAO over the same period (black line) and in the following spring (red line). The significance at the 90 % (gray) levels is shown by the dash-dotted line. Histogram of surface wind directions at all grid points within (h) the tropical Atlantic during positive LSC (white bars) and during negative LSC (blue bars) in 1980–2000. For surface wind directions, “NE”, “SE”, “SW”, and “NW” indicate northeasterlies, southeasterlies, southwesterlies, and northwesterlies, respectively. Panels (i), (j), (k), and (l) represent West Asia, northern China, the mid-latitude Pacific, and southeastern North America, respectively, in 2001–2023. The boxes are marked on top in red and blue when positive LSC and negative LSC are statistically significant and pass the 90 % confidence test. The black dots indicate that the anomalies pass the 90 % confidence test.
From 2001 to 2023, the Z500 field pattern is the complete opposite of that of the first phase (Fig. 4b), which is considered the expected outcome of WOCL mode during winter. However, the lag effect of the pre-winter LSC signal in the subsequent spring differs from that in the first phase, likely due to interdecadal variability in heat retention in the ocean memory (Pan, 2005; Yu et al., 2024; Khatri et al., 2024; Han and Wu, 2025). Specifically, the strengthening of the tripolar pattern of the sea surface temperature anomaly (SSTA) from DJF to MAM (Fig. S4b and d) leads to the maintenance of the NAO− pattern into the spring (Fig. 4d and g). The anomalous cyclonic circulation in the Atlantic strengthens the southwesterly (Fig. 4d and i), which directs dust plumes towards the Eurasian border region. For example, the NAO− phase in March 2018 caused surface dust concentrations in the eastern Mediterranean to be approximately 200 µg m−3 higher than the climatological value, due to a strong southwesterly (Kaskaoutis et al., 2019). The prevailing stronger westerlies continue to transport dust eastward (Figs. 4f, S3d, and S5). Meanwhile, under the effect of downward momentum, the probability of there being westerlies near the surface in these regions increases (Fig. 4i–l; the short blue line represents p < 0.1 in negative LSC), leading to dust deposition in northern China, the Pacific, and the southeastern United States.
The composite analysis from 1980 to 2000 shows that anomalous northeasterly winds (maximum anomaly 1.4 m s−1, Fig. 4c) lead to significant positive anomalies of wind speed in the western and central regions of North Africa (Fig. 5a), which align with the spatial distribution of the second empirical orthogonal function (EOF) of 10 m wind speed (Evan et al., 2016). This wind speed anomaly facilitates dust emission south of 20° N (Fig. 5e), explaining 58 % of the variation in westward dust transport across North Africa (Evan et al., 2016). In contrast, soil conditions exert a smaller influence on dust emission (Fig. 5b). The cold northeasterly cools the eastern region, triggering anomalous zonal temperature gradients (Fig. 5c) and alterations in zonal circulation patterns (Fig. 5d). These changes further amplify the vertical uplift of dust, carrying it into the middle–lower troposphere of the Atlantic. Additionally, radiative heating effects in the source regions strengthen the upward motion of dust (Carlson and Benjamin, 1980).
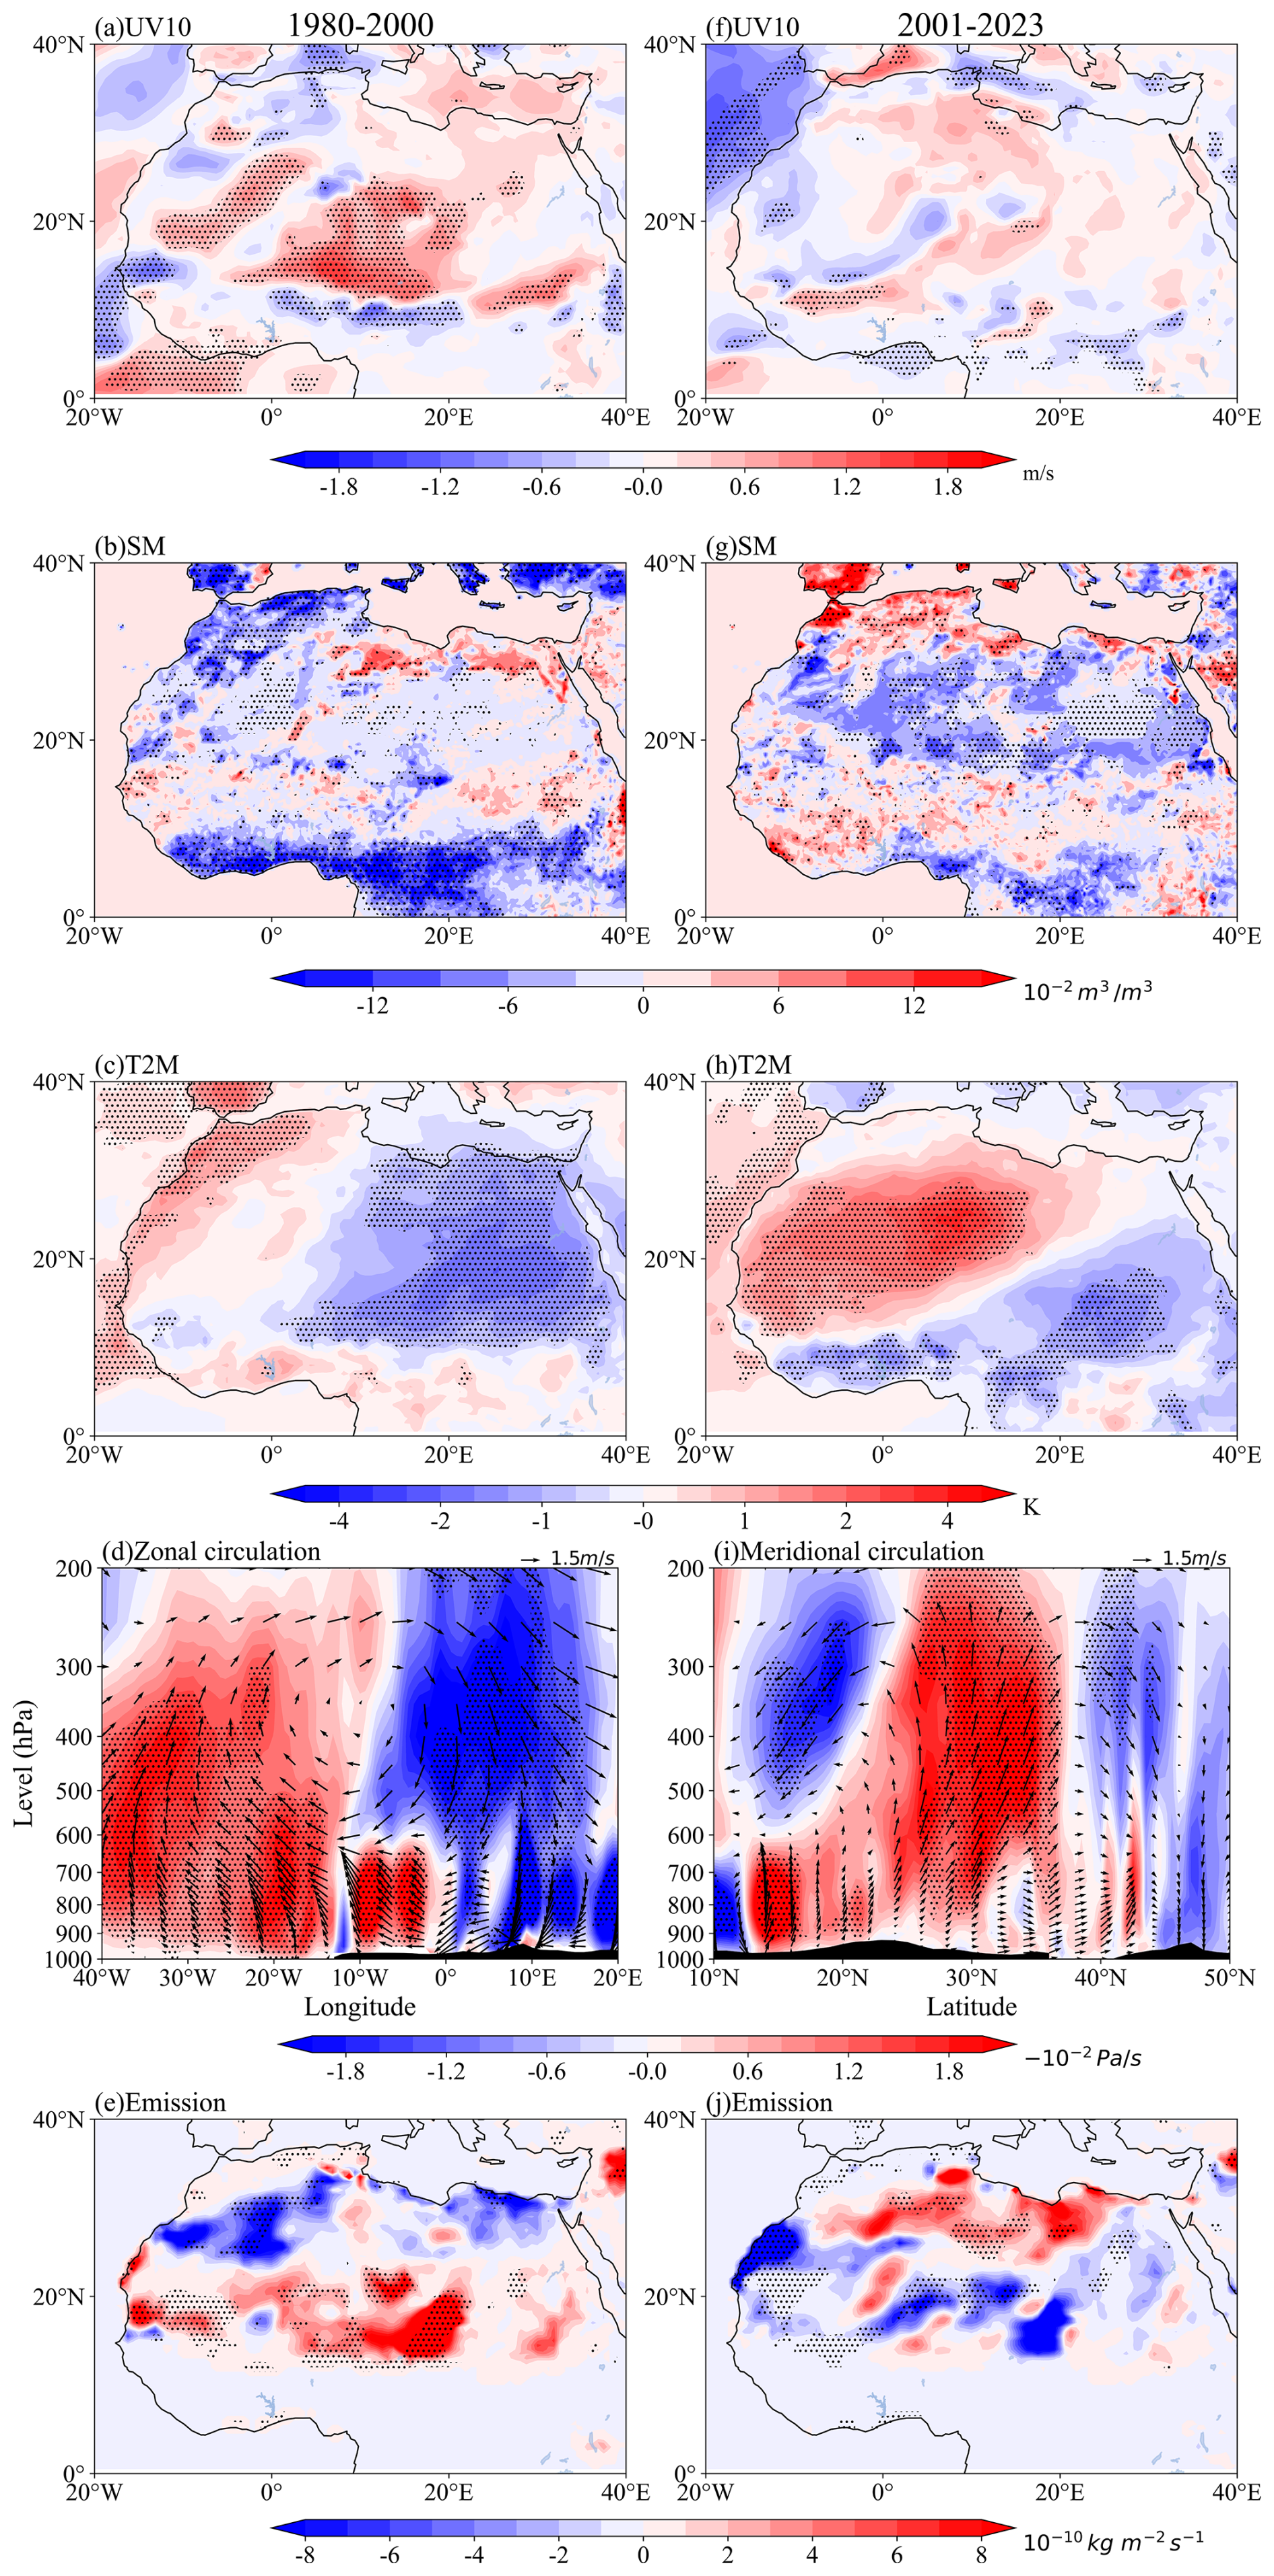
Figure 5Local meteorological conditions and dust emissions during spring in North Africa associated with pre-winter LSC of composite analysis during the two periods. The composite (positive LSC minus negative LSC) (a) 10 m wind speed (UV10) anomalies (shading; m s−1), (b) soil moisture (SM) anomalies (shading; 10−2 m3 m−3), (c) 2 m temperature (T2M) anomalies (shading; K), (d) mean cross-sections of zonal circulation (vectors; V wind in m s−1 and vertical velocity in Pa s−1) anomalies (latitude averaged over 10–20° N), and (e) dust emissions anomalies (shading; 10−10 ) in 1980–2000. (f–j) The composite (negative LSC minus positive LSC) for 2000–2023, where (i) represents the meridional profile averaged over longitudes 20° W–10° E. The shading in (d) and (i) represents the magnitude of the vertical velocity, which is multiplied by a factor of −150 to enhance the visual interpretation of wind vectors. The black dots indicate that the anomalies pass the 90 % confidence test.
From 2000 to 2023, anomalous southwesterly winds cause significant warming in the northwestern part of North Africa, with maximum anomalies capable of exceeding 4 K (Fig. 5h). This is due to the weakening of the subtropical high (Fig. 4d), which triggers strong westerly warm advection and enhances vertical mixing in the atmospheric boundary layer under the NAO− phase (Zhou et al., 2023). The warming of the surface has two major impacts. First, the LSC-induced soil moisture deficit, quantified through composite analysis in Fig. 5g (peak anomalies of 0.03 m3 m−3 at 25–30° N), significantly reduces soil cohesion, promoting dust emissions north of 25° N (Fig. 5j). Second, the intensified meridional temperature gradient (Fig. 5h) generates anomalous circulation patterns, with pronounced upward motion extending to 200 hPa (Fig. 5i), creating favorable conditions for long-range dust transport.
This study primarily reveals that the dust transport pathway from North Africa in the subsequent spring, influenced by the preceding winter LSC, shifted from a westward to a long-range eastward trajectory in the late 1990s. The schematic in Fig. 6 outlines the dynamical processes, ranging from large-scale to local-scale, that control dust emission, uplift, and subsequent transport. The 1980–2000 LSC+ phase (Fig. 6a) amplifies zonal temperature gradients between warming Eurasian/North American continents and cooling oceanic basins, driving the NAO+ mode that establishes intensified anticyclonic systems over northeastern North Africa. These synoptic configurations generate anomalous northeasterlies that enhance both dust emission and westward Atlantic transport, corroborated by the dominance of wind-driven emission mechanisms (Evan et al., 2016). Post-2000, the reversed LSC− phase (Fig. 6b) promotes NAO− persistence into spring, with anomalous southwesterly advection inducing Saharan soil desiccation and convective uplift. Mid-latitude westerly intensification enables circum-global dust transport extending to southeastern North America. Overall, the variation in the LSC-related dust transport directions along the westward and eastward pathways is closely related to the climatic variability determined by the phases of the NAO. The significant role of the second dry period in dust emissions, which is similar to findings for Gobi dust events (Zhu and Liu, 2024), highlights the significant influence of regional drought on dust emissions in the context of global warming, particularly as a consequence of intense heatwaves.
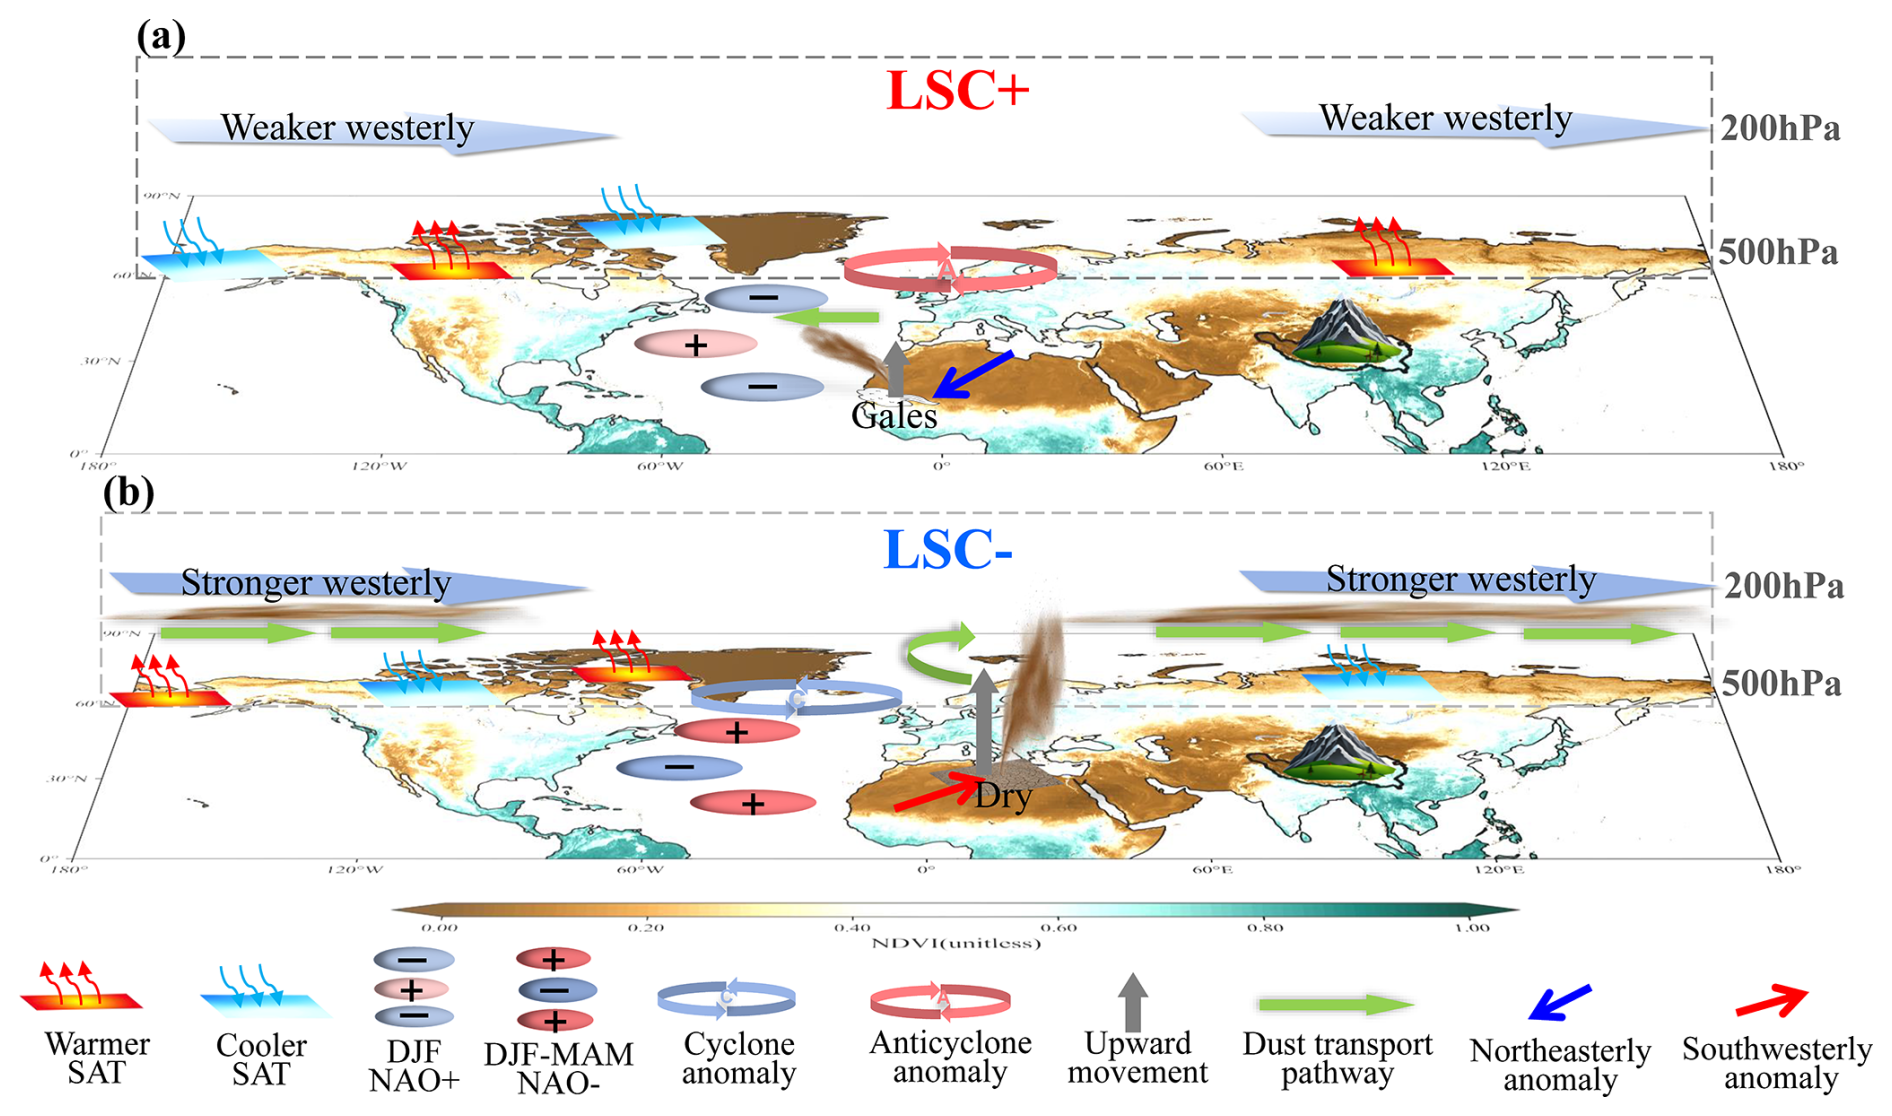
Figure 6A schematic diagram summarizing the spring dust activity in North African associated with pre-winter LSC over two periods including dust emission, uplift, transport, and deposition. (a) Associated with LSC+ in 1980–2000; (b) associated with LSC− in 2000–2023. Here, only the two periods related to positively anomalous dust in North Africa are shown, where dust activity is suppressed when the sign of the LSC in both periods is the opposite of that of the schematic diagram. Normalized difference vegetation index (NDVI) values for the bottom graph are from GIMMS ndvi3g (1982–2022).
This study is based on statistical and dynamical diagnostics, and its results can be validated through some other numerical simulations of land–ocean contrasts. Previous research into idealized atmospheric circulation simulations has demonstrated that continental warming (LSC+) induces planetary wave modes, with a dipole resembling NAO emerging as the dominant regional feature (Molteni et al., 2011). This is accompanied by anomalous dispersion of the tropospheric Eliassen–Palm fluxes in the mid-latitudes, which reduces the net meridional vortex heat flux into the stratosphere and weakens the westerlies (Portal et al., 2022). This, in turn, supports the conclusions of this paper regarding the eastward transport paths of the second LSC− phase. Additionally, the critical role of NAO-modulated land–atmosphere interactions receives further validation from Sahelian climate studies, where vegetation–precipitation feedbacks amplify dust emission sensitivity to circulation anomalies (Lu and Delworth, 2005; Folland et al., 1986). Our findings align with GOCART model simulations that quantitatively link NAO phases to North Atlantic dust load variability (Ginoux et al., 2004), though they extend this paradigm by revealing LSC effects on transcontinental transport efficiency. The use of only r1i1p1f1 ensemble members in our CMIP6 analysis prevents evaluation of intra-model variability, suggesting the need for future work with multi-member ensembles. Moreover, the global signal response is primarily driven by Asian warming across the zonal boundary region (Portal et al., 2022). This highlights the need for further investigation into the impact of subregional LSC variations on dust transport.
This study elucidates a novel mechanism whereby pre-winter LSC modulates spring dust transport via NAO phase shifts, providing a reference for improving the ability of sand and dust forecasting. The established LSC–NAO–dust pathway provides an operational framework to improve seasonal forecasts through winter LSC indicators and refine impact assessments via phase-dependent evaluation (pre-/post-2000 regimes), particularly for downwind regions like West Asia and North America that are now experiencing intensified dust impacts under the new transport paradigm. These findings have immediate applications for transcontinental dust early warning systems, climate model parameterizations, and the management of dust-sensitive sectors like aviation and renewable energy. However, the considerable nonlinearity inherent in these dynamics, particularly through complex LSC–NAO interactions (Molteni et al., 2011), atmospheric blocking linkages (Athanasiadis et al., 2020; Croci-Maspoli et al., 2007), and jet stream variability (He et al., 2014; Portal et al., 2022), introduces important uncertainties regarding future dust activity under changing climate conditions. High sensitivity to the land–ocean boundary response and to scenarios of future CO2 concentration pathways has been demonstrated in changes to climate patterns (Kamae et al., 2014). Although it has been predicted in many studies that the overall trend of global and regional dust may decrease in the future (Evan et al., 2016; Shao et al., 2013; An et al., 2018; Yang et al., 2020), the long-range transport of dust and its impacts on climate under the modulation of LSC and its associated nonlinear dynamical mechanisms remain a critical area requiring further urgent research.
The data were analyzed using Python. All relevant codes used in this study are available upon request from the corresponding author.
All datasets utilized in this study are publicly accessible from the following websites: the NASA MERRA-2 dataset for aerosol and meteorological products is at NASA MERRA 2 dataset for aerosol and meteorological products: https://doi.org/10.5067/RZIK2TV7PP38 (Global Modeling and Assimilation Office, 2015a), https://doi.org/10.5067/LTVB4GPCOTK2 (Global Modeling and Assimilation Office, 2015b), https://doi.org/10.5067/V92O8XZ30XBI (Global Modeling and Assimilation Office, 2015c) and https://doi.org/10.5067/5ESKGQTZG7FO (Global Modeling and Assimilation Office, 2015d), the Met Office HadCRUT5 dataset for land sea surface temperature: https://doi.org/10.1029/2019JD032361 (Morice et al., 2021) the monthly CMIP6 mode output for aerosol and meteorological products: https://aims2.llnl.gov/search/cmip6/ (last access: 18 September 2025), and the NOAA Global Inventory Monitoring and Modeling System (GIMMS) dataset (version number 3g.v1) for the vegetation product is at https://doi.org/10.3334/ORNLDAAC/2299 (Dubayah et al., 2023).
The supplement related to this article is available online at https://doi.org/10.5194/acp-25-10853-2025-supplement.
QW conceived the study and performed the analysis under the guidance of YL. YL acquired the funding. The first draft of the manuscript was written by QW, and all authors commented on the manuscript and contributed to the writing and revising of the paper. All authors read and approved the final paper.
The contact author has declared that none of the authors has any competing interests.
Publisher's note: Copernicus Publications remains neutral with regard to jurisdictional claims made in the text, published maps, institutional affiliations, or any other geographical representation in this paper. While Copernicus Publications makes every effort to include appropriate place names, the final responsibility lies with the authors. Views expressed in the text are those of the authors and do not necessarily reflect the views of the publisher.
The authors gratefully acknowledge the editor and three referees for their constructive comments. This research has been supported by the Supercomputing Center of Lanzhou University.
This research has been supported by the National Key Research and Development Program of China (grant no. 2019YFA0606801).
This paper was edited by Jianping Huang and reviewed by three anonymous referees.
Adame, J. A., Notario, A., Cuevas, C. A., and Saiz-Lopez, A.: Saharan air outflow variability in the 1980–2020 period, Sci. Total Environ., 839, 156268, https://doi.org/10.1016/j.scitotenv.2022.156268, 2022.
An, L. C., Che, H. Z., Xue, M., Zhang, T. H., Wang, H., Wang, Y. Q., Zhou, C. H., Zhao, H. J., Gui, K., Zheng, Y., Sun, T. Z., Liang, Y. X., Sun, E. W., Zhang, H. D., and Zhang, X. Y.: Temporal and spatial variations in sand and dust storm events in East Asia from 2007 to 2016: Relationships with surface conditions and climate change, Sci. Total Environ., 633, 452–462, https://doi.org/10.1016/j.scitotenv.2018.03.068, 2018.
Asutosh, A., Vinoj, V., Murukesh, N., Ramisetty, R., and Mittal, N.: Investigation of June 2020 giant Saharan dust storm using remote sensing observations and model reanalysis, Sci. Rep.-UK, 12, 6114, https://doi.org/10.1038/s41598-022-10017-1, 2022.
Athanasiadis, P. J., Yeager, S., Kwon, Y.-O., Bellucci, A., Smith, D. W., and Tibaldi, S.: Decadal predictability of North Atlantic blocking and the NAO, npj Clim. Atmos. Sci., 3, 20, https://doi.org/10.1038/s41612-020-0120-6, 2020.
Awad, A. M. and Mashat, A.-W. S.: Synoptic features associated with dust transition processes from North Africa to Asia, Arab. J. Geosci., 7, 2451–2467, https://doi.org/10.1007/s12517-013-0923-4, 2014.
Bi, H., Chen, S., Zhang, D., Wang, Y., Kang, L., Alam, K., Tang, M., Chen, Y., Zhang, Y., and Wang, D.: The circumglobal transport of massive African dust and its impacts on the regional circulation in remote atmosphere, B. Am. Meteorol. Soc., 105, E605–E622, https://doi.org/10.1175/bams-d-23-0072.1, 2024.
Brauer, M., Amann, M., Burnett, R. T., Cohen, A., Dentener, F., Ezzati, M., Henderson, S. B., Krzyzanowski, M., Martin, R. V., Van Dingenen, R., Van Donkelaar, A., and Thurston, G. D.: Exposure assessment for estimation of the global burden of disease attributable to outdoor air pollution, Environ. Sci. Technol., 46, 652–660, https://doi.org/10.1021/es2025752, 2012.
Brayshaw, D. J., Hoskins, B., and Blackburn, M.: The Basic ingredients of the North Atlantic Storm Track. Part I: Land–Sea Contrast and Orography, J. Atmos. Sci., 66, 2539–2558, https://doi.org/10.1175/2009jas3078.1, 2009.
Byrne, M. P. and O'Gorman, P. A.: Land–Ocean Warming Contrast over a Wide Range of Climates: Convective Quasi-Equilibrium Theory and Idealized Simulations, J. Climate, 26, 4000–4016, https://doi.org/10.1175/jcli-d-12-00262.1, 2013.
Byrne, M. P. and O'Gorman, P. A.: Trends in continental temperature and humidity directly linked to ocean warming, P. Natl. Acad. Sci. USA, 115, 4863–4868, https://doi.org/10.1073/pnas.1722312115, 2018.
Carlson, T. N. and Benjamin, S. G.: Radiative heating rates for Saharan dust, J. Atmos. Sci., 37, 193–213, https://doi.org/10.1175/1520-0469(1980)037<0193:RHRFSD>2.0.CO;2, 1980.
Cheng, W., MacMartin, D. G., Kravitz, B., Visioni, D., Bednarz, E. M., Xu, Y., Luo, Y., Huang, L., Hu, Y., Staten, P. W., Hitchcock, P., Moore, J. C., Guo, A., and Deng, X.: Changes in Hadley circulation and intertropical convergence zone under strategic stratospheric aerosol geoengineering, npj Clim. Atmos. Sci., 5, https://doi.org/10.1038/s41612-022-00254-6, 2022.
Chiapello, I., Bergametti, G., Chatenet, B., Bousquet, P., Dulac, F., and Soares, E. S.: Origins of African dust transported over the northeastern tropical Atlantic, J. Geophys. Res.-Atmos., 102, 13701–13709, https://doi.org/10.1029/97jd00259, 1997.
Croci-Maspoli, M., Schwierz, C., and Davies, H. C.: Atmospheric blocking: space-time links to the NAO and PNA, Clim. Dynam., 29, 713–725, https://doi.org/10.1007/s00382-007-0259-4, 2007.
Dai, Y., Hitchcock, P., Mahowald, N. M., Domeisen, D. I. V., Hamilton, D. S., Li, L., Marticorena, B., Kanakidou, M., Mihalopoulos, N., and Aboagye-Okyere, A.: Stratospheric impacts on dust transport and air pollution in West Africa and the Eastern Mediterranean, Nat. Commun., 13, 7744, https://doi.org/10.1038/s41467-022-35403-1, 2022.
Day, J. J. and Hodges, K. I.: Growing Land-Sea temperature contrast and the intensification of Arctic cyclones, Geophys. Res. Lett., 45, 3673–3681, https://doi.org/10.1029/2018gl077587, 2018.
Doherty, O. M., Riemer, N., and Hameed, S.: Saharan mineral dust transport into the Caribbean: Observed atmospheric controls and trends, J. Geophys. Res.-Atmos., 113, D07211, https://doi.org/10.1029/2007jd009171, 2008.
Dubayah, R. O., Armston, J., Healey, S. P., Yang, Z., Patterson, P. L., Saarela, S., Stahl, G., Duncanson, L., Kellner, J. R., Bruening, J., and Pascual, A.: GEDI L4B Gridded Aboveground Biomass Density, Version 2.1, ORNL DAAC, Oak Ridge, Tennessee, USA [data set], https://doi.org/10.3334/ORNLDAAC/2299, 2023.
Engelstaedter, S., Tegen, I., and Washington, R.: North African dust emissions and transport, Earth-Sci. Rev., 79, 73–100, https://doi.org/10.1016/j.earscirev.2006.06.004, 2006.
Evan, A. T., Flamant, C., Gaetani, M., and Guichard, F.: The past, present and future of African dust, Nature, 531, 493–495, https://doi.org/10.1038/nature17149, 2016.
Feng, J., Li, J., Jin, F., and Zheng, F.: A comparison of the response of the hadley circulation to different tropical SST Meridional structures during the equinox seasons, J. Geophys. Res.-Atmos., 123, 2591–2604, https://doi.org/10.1002/2017jd028219, 2018.
Folland, C. K., Palmer, T. N., and Parker, D. E.: Sahel rainfall and worldwide sea temperatures, 1901–85, Nature, 320, 602–607, https://doi.org/10.1038/320602a0, 1986.
Francis, D., Fonseca, R., Nelli, N., Cuesta, J., Weston, M., Evan, A., and Temimi, M.: The atmospheric drivers of the major Saharan dust storm in June 2020, Geophys. Res. Lett., 47, e2020GL090102, https://doi.org/10.1029/2020gl090102, 2020.
Fyfe, J. C., Gillett, N. P., and Zwiers, F. W.: Overestimated global warming over the past 20 years, Nat. Clim. Change, 3, 767–769, https://doi.org/10.1038/nclimate1972, 2013.
Garfinkel, C. I., White, I., Gerber, E. P., Jucker, M., and Erez, M.: The building blocks of Northern Hemisphere wintertime stationary waves, J. Climate, 33, 5611–5633, https://doi.org/10.1175/jcli-d-19-0181.1, 2020.
Ginoux, P., Prospero, J., Torres, O., and Chin, M.: Long-term simulation of global dust distribution with the GOCART model: correlation with North Atlantic Oscillation, Environ. Model. Softw., 19, 113–128, https://doi.org/10.1016/s1364-8152(03)00114-2, 2004.
Global Modeling and Assimilation Office (GMAO): MERRA-2 tavgM_2d_adg_Nx: 2d,Monthly mean,Time averaged,Single Level,Assimilation,Aerosol Diagnostics (extended) V5.12.4, Greenbelt, MD, USA, Goddard Earth Sciences Data and Information Services Center (GES DISC) [data set], https://doi.org/10.5067/RZIK2TV7PP38, 2015a.
Global Modeling and Assimilation Office (GMAO): MERRA-2 inst3_3d_aer_Nv: 3d,3 Hourly, Instantaneous, Model Level,Assimilation,Aerosol Mixing Ratio V5.12.4, Greenbelt, MD, USA, Goddard Earth Sciences Data and Information Services Center (GES DISC) [data set], https://doi.org/10.5067/LTVB4GPCOTK2, 2015b.
Global Modeling and Assimilation Office (GMAO): MERRA-2 instM_3d_ana_Np: 3d, Monthly mean, Instantaneous,Pressureus, Pressure–Level,Analysis,Analyzed Meteorological Fields V5.12.4, Level, Analysis, Analyzed Meteorological Fields V5.12.4, Greenbelt, MD, USA, Goddard Earth Sciences Data and Information Services Center (GES DISC) Greenbelt, MD, USA, Goddard Earth Sciences Data and Information Services Center (GES DISC) [data set], https://doi.org/10.5067/V92O8XZ30XBI, 2015c.
Global Modeling and Assimilation Office (GMAO): MERRA-2 2 instM_2d_asm_Nx: 2d,instM_2d_asm_Nx: 2d, Monthly mean,SingleMonthly mean,Single-Level,Assimilation,SingleLevel,Assimilation,Single–Level Diagnostics V5.12.4, Greenbelt, MD, USA, Level Diagnostics V5.12.4, Greenbelt, MD, USA, Goddard Earth Sciences Data and Information Services Center (GES DISC) [data set], https://doi.org/10.5067/5ESKGQTZG7FO, 2015d.
Guieu, C., Loÿe-Pilot, M.-D., Ridame, C., and Thomas, C.: Chemical characterization of the Saharan dust end-member: Some biogeochemical implications for the western Mediterranean Sea, J. Geophys. Res.-Atmos., 107, ACH 5, https://doi.org/10.1029/2001jd000582, 2002.
Han, S. and Wu, Z.: Interdecadal variability in ocean memory of the maritime continent and its effect on Asian–Australian monsoon prediction, Clim. Dynam., 63, 49, https://doi.org/10.1007/s00382-024-07487-6, 2025.
He, Y., Huang, J., and Ji, M.: Impact of land–sea thermal contrast on interdecadal variation in circulation and blocking, Clim. Dynam., 43, 3267–3279, https://doi.org/10.1007/s00382-014-2103-y, 2014.
He, Y., Huang, J., Li, D., Xie, Y., Zhang, G., Qi, Y., Wang, S., and Totz, S.: Comparison of the effect of land-sea thermal contrast on interdecadal variations in winter and summer blockings, Clim. Dynam., 51, 1275–1294, https://doi.org/10.1007/s00382-017-3954-9, 2018.
Held, I. M. and Ting, M.: Orographic versus Thermal Forcing of Stationary Waves: The Importance of the Mean Low-Level Wind, J. Atmos. Sci., 47, 495–500, https://doi.org/10.1175/1520-0469(1990)047<0495:OVTFOS>2.0.CO;2, 1990.
Hoskins, B. J. and Valdes, P. J.: On the Existence of Storm-Tracks, J. Atmos. Sci., 47, 1854–1864, https://doi.org/10.1175/1520-0469(1990)047<1854:OTEOST>2.0.CO;2, 1990.
Huneeus, N., Schulz, M., Balkanski, Y., Griesfeller, J., Prospero, J., Kinne, S., Bauer, S., Boucher, O., Chin, M., Dentener, F., Diehl, T., Easter, R., Fillmore, D., Ghan, S., Ginoux, P., Grini, A., Horowitz, L., Koch, D., Krol, M. C., Landing, W., Liu, X., Mahowald, N., Miller, R., Morcrette, J.-J., Myhre, G., Penner, J., Perlwitz, J., Stier, P., Takemura, T., and Zender, C. S.: Global dust model intercomparison in AeroCom phase I, Atmos. Chem. Phys., 11, 7781–7816, https://doi.org/10.5194/acp-11-7781-2011, 2011.
Joshi, M. M., Gregory, J. M., Webb, M. J., Sexton, D. M. H., and Johns, T. C.: Mechanisms for the land/sea warming contrast exhibited by simulations of climate change, Clim. Dynam., 30, 455–465, https://doi.org/10.1007/s00382-007-0306-1, 2008.
Kamae, Y., Watanabe, M., Kimoto, M., and Shiogama, H.: Summertime land–sea thermal contrast and atmospheric circulation over East Asia in a warming climate—Part I: Past changes and future projections, Clim. Dynam., 43, 2553–2568, https://doi.org/10.1007/s00382-014-2073-0, 2014.
Kaskaoutis, D. G., Rashki, A., Dumka, U. C., Mofidi, A., Kambezidis, H. D., Psiloglou, B. E., Karagiannis, D., Petrinoli, K., and Gavriil, A.: Atmospheric dynamics associated with exceptionally dusty conditions over the eastern Mediterranean and Greece in March 2018, Atmos. Res., 218, 269–284, https://doi.org/10.1016/j.atmosres.2018.12.009, 2019.
Keith, M. J., Doney, S. C., Lindsay, K., Mahowald, N., and Michaels, A. F.: Nitrogen fixation amplifies the ocean biogeochemical response to decadal timescale variations in mineral dust deposition, Tellus B, 58, 560, https://doi.org/10.1111/j.1600-0889.2006.00209.x, 2006.
Khatri, H., Williams, R. G., Woollings, T., and Smith, D. M.: An Ocean Memory Perspective: Disentangling atmospheric control of decadal variability in the North Atlantic Ocean, Geophys. Res. Lett., 51, e2024GL110333, https://doi.org/10.1029/2024gl110333, 2024.
Knippertz, P. and Todd, M. C.: Mineral dust aerosols over the Sahara: Meteorological controls on emission and transport and implications for modeling, Rev. Geophys., 50, RG1007, https://doi.org/10.1029/2011rg000362, 2012.
Kok, J. F., Storelvmo, T., Karydis, V. A., Adebiyi, A. A., Mahowald, N. M., Evan, A. T., He, C., and Leung, D. M.: Mineral dust aerosol impacts on global climate and climate change, Nat. Rev. Earth Environ., 4, 71–86, https://doi.org/10.1038/s43017-022-00379-5, 2023.
Liu, Q., Huang, Z., Hu, Z., Dong, Q., and Li, S.: Long-Range transport and evolution of Saharan dust over East Asia from 2007 to 2020, J. Geophys. Res.-Atmos., 127, e2022JD03694, https://doi.org/10.1029/2022jd036974, 2022.
Lu, J. and Delworth, T. L.: Oceanic forcing of the late 20th century Sahel drought, Geophys. Res. Lett., 32, L2206, https://doi.org/10.1029/2005gl023316, 2005.
Mallone, S., Stafoggia, M., Faustini, A., Gobbi, G. P., Marconi, A., and Forastiere, F.: Saharan Dust and Associations between Particulate Matter and Daily Mortality in Rome, Italy, Environ. Health Persp., 119, 1409–1414, https://doi.org/10.1289/ehp.1003026, 2011.
Marshall, J. and So, D. W. K.: Thermal equilibration of planetary waves, J. Atmos. Sci., 47, 963–978, https://doi.org/10.1175/1520-0469(1990)047, 1990.
Mitchell, H. L. and Derome, J.: Blocking-Like solutions of the potential vorticity equation: their stability at equilibrium and growth at resonance, J. Atmos. Sci., 40, 2522–2536, https://doi.org/10.1175/1520-0469(1983)040<2522:BLSOTP>2.0.CO;2, 1983.
Molteni, F., King, M. P., Kucharski, F., and Straus, D. M.: Planetary-scale variability in the northern winter and the impact of land–sea thermal contrast, Clim. Dynam., 37, 151–170, https://doi.org/10.1007/s00382-010-0906-z, 2011.
Morice, C. P., Kennedy, J. J., Rayner, N. A., Winn, J. P., Hogan, E., Killick, R. E., Dunn, R. J. H., Osborn, T. J., Jones, P. D., and Simpson, I. R.: An updated assessment of near surface temperature change from 1850: the HadCRUT5 data set, Journal of Geophysical Research: Atmospheres, https://doi.org/10.1029/2019JD032361, 2021.
Moulin, C., Lambert, C. E., Dulac, F., and Dayan, U.: Control of atmospheric export of dust from North Africa by the North Atlantic Oscillation, Nature, 387, 691–694, https://doi.org/10.1038/42679, 1997.
Pan, L.: Observed positive feedback between the NAO and the North Atlantic SSTA tripole, Geophys. Res. Lett., 32, L06707, https://doi.org/10.1029/2005gl022427, 2005.
Portal, A., Pasquero, C., D'Andrea, F., Davini, P., Hamouda, M. E., and Rivière, G.: Influence of reduced winter Land–Sea contrast on the midlatitude atmospheric circulation, J. Climate, 35, 6237–6251, https://doi.org/10.1175/jcli-d-21-0941.1, 2022.
Pu, B. and Ginoux, P.: The impact of the Pacific Decadal Oscillation on springtime dust activity in Syria, Atmos. Chem. Phys., 16, 13431–13448, https://doi.org/10.5194/acp-16-13431-2016, 2016.
Riemer, N., Doherty, O. M., and Hameed, S.: On the variability of African dust transport across the Atlantic, Geophys. Res. Lett., 33, L13814, https://doi.org/10.1029/2006gl026163, 2006. Drying of Indian subcontinent by rapid Indian Ocean warming and a weakening land-sea thermal gradient, Nat. Commun., 6, 7423, https://doi.org/10.1038/ncomms8423, 2015.
Rousseau-Rizzi, R. and Emanuel, K.: Natural and anthropogenic contributions to the hurricane drought of the 1970s–1980s, Nat. Commun., 13, 5074, https://doi.org/10.1038/s41467-022-32779-y, 2022.
Roxy, M. K., Ritika, K., Terray, P., Murtugudde, R., Ashok, K., and Goswami, B. N.:
Sassen, K., DeMott, P. J., Prospero, J. M., and Poellot, M. R.: Saharan dust storms and indirect aerosol effects on clouds: CRYSTAL-FACE results, Geophys. Res. Lett., 30, 1633, https://doi.org/10.1029/2003gl017371, 2003.
Seltzer, A. M., Blard, P.-H., Sherwood, S. C., and Kageyama, M.: Terrestrial amplification of past, present, and future climate change, Sci. Adv., 9, eadf8119, https://doi.org/10.1126/sciadv.adf8119, 2023.
Shao, Y., Klose, M., and Wyrwoll, K.: Recent global dust trend and connections to climate forcing, J. Geophys. Res.-Atmos., 118, 11107–1118, https://doi.org/10.1002/jgrd.50836, 2013.
Shi, L., Zhang, J., Yao, F., Zhang, D., and Guo, H.: Drivers to dust emissions over dust belt from 1980 to 2018 and their variation in two global warming phases, Sci. Total Environ., 767, 144860, https://doi.org/10.1016/j.scitotenv.2020.144860, 2021.
Sun, D., Lau, K. M., and Kafatos, M.: Contrasting the 2007 and 2005 hurricane seasons: Evidence of possible impacts of Saharan dry air and dust on tropical cyclone activity in the Atlantic basin, Geophys. Res. Lett., 35, L15405, https://doi.org/10.1029/2008gl034529, 2008.
Sutton, R. T., Dong, B., and Gregory, J. M.: Land/sea warming ratio in response to climate change: IPCC AR4 model results and comparison with observations, Geophys. Res. Lett., 34, L02701, https://doi.org/10.1029/2006gl028164, 2007.
Swap, R., Garstang, M., Greco, S., Talbot, R., and Kållberg, P.: Saharan dust in the Amazon Basin, Tellus B, 44, 133, https://doi.org/10.3402/tellusb.v44i2.15434, 1992.
Tanaka, T. Y., Kurosaki, Y., Chiba, M., Matsumura, T., Nagai, T., Yamazaki, A., Uchiyama, A., Tsunematsu, N., and Kai, K.: Possible transcontinental dust transport from North Africa and the Middle East to East Asia, Atmos. Environ., 39, 3901–3909, https://doi.org/10.1016/j.atmosenv.2005.03.034, 2005.
Tang, X., Cai, Q., Fang, J., and Tan, Z.: Land–Sea Contrast in the Diurnal Variation of Precipitation from Landfalling Tropical Cyclones, J. Geophys. Res.-Atmos., 124, 12010–12021, https://doi.org/10.1029/2019jd031454, 2019.
Toggweiler, J. R.: Shifting westerlies, Science, 323, 1434–1435, https://doi.org/10.1126/science.1169823, 2009.
Torres-Alavez, A., Cavazos, T., and Turrent, C.: Land–Sea Thermal Contrast and Intensity of the North American Monsoon under Climate Change Conditions, J. Climate, 27, 4566–4580, https://doi.org/10.1175/jcli-d-13-00557.1, 2014.
Uno, I., Eguchi, K., Yumimoto, K., Takemura, T., Shimizu, A., Uematsu, M., Liu, Z., Wang, Z., Hara, Y., and Sugimoto, N.: Asian dust transported one full circuit around the globe, Nat. Geosci., 2, 557–560, https://doi.org/10.1038/ngeo583, 2009.
Wallace, J. M., Zhang, Y., and Bajuk, L.: Interpretation of interdecadal trends in Northern Hemisphere surface air temperature, J. Climate, 9, 249–259, https://doi.org/10.1175/1520-0442(1996)009<0249:IOITIN>2.0.CO;2, 1996.
Wang, Q., Gu, J., and Wang, X.: The impact of Sahara dust on air quality and public health in European countries, Atmos. Environ., 241, 117771, https://doi.org/10.1016/j.atmosenv.2020.117771, 2020.
Westphal, D. L., Toon, O. B., and Carlson, T. N.: A two-dimensional numerical investigation of the dynamics and microphysics of Saharan dust storms, J. Geophys. Res.-Atmos., 92, 3027–3049, https://doi.org/10.1029/jd092id03p03027, 1987.
Wu, Q. and Straus, D. M.: AO, COWL, and observed climate trends, J. Climate, 17, 2139–2156, https://doi.org/10.1175/1520-0442(2004)017, 2004.
Yang, K., Wang, Z., Luo, T., Liu, X., and Wu, M.: Upper troposphere dust belt formation processes vary seasonally and spatially in the Northern Hemisphere, Commun. Earth Environ., 3, 24, https://doi.org/10.1038/s43247-022-00353-5, 2022.
Yang, Y., Lou, S., Wang, H., Wang, P., and Liao, H.: Trends and source apportionment of aerosols in Europe during 1980–2018, Atmos. Chem. Phys., 20, 2579–2590, https://doi.org/10.5194/acp-20-2579-2020, 2020.
Yu, H., Cheng, S., Huang, J., Hu, Z., Wu, H., and Wang, X.: Seasonal phase change of the North Atlantic Tripole Sea surface temperature predicted by air-sea coupling, npj Clim. Atmos. Sci., 7, 322, https://doi.org/10.1038/s41612-024-00882-0, 2024.
Zhou, L., Hua, W., Nicholson, S. E., and Clark, J. P.: Interannual teleconnections in the Sahara temperatures associated with the North Atlantic Oscillation (NAO) during boreal winter, Clim. Dynam., 62, 1123–1143, https://doi.org/10.1007/s00382-023-06962-w, 2023.
Zhu, Q. and Liu, Y.: The dominant factor in extreme dust events over the Gobi Desert is shifting from extreme winds to extreme droughts, npj Clim. Atmos. Sci., 7, 141, https://doi.org/10.1038/s41612-024-00689-z, 2024.