the Creative Commons Attribution 4.0 License.
the Creative Commons Attribution 4.0 License.
 | 19 Sep 2025
Saharan dust linked to European hail events
Killian P. Brennan
Lena Wilhelm
Saharan dust significantly influences hail occurrence in Europe. Using Copernicus Atmosphere Monitoring Service (CAMS) and reanalysis data, crowd-sourced hail reports, lightning data, and radar measurements, we find a strong correlation between elevated dust loading and hail events. Hail coverage exceeding 28 % of 1° × 1° grid cells only occurs when dust loading surpasses 2.4 mg m−2, while on hail days the median dust load is 1.82 times higher than on non-hail days (7σ difference). This effect is particularly strong along the Alpine crest, central France, eastern Germany, Austria, and Eastern Europe, where median dust loads more than double on hail days.
By grouping data according to synoptic weather patterns, we confirm that hail days consistently exhibit higher dust concentrations regardless of prevailing synoptic conditions, supporting the robust link between dust and hail. Peak hail activity occurs at 38 mg m−2 or a dust optical depth of 0.033, suggesting enhanced cloud and ice nucleation. Above this range, hail frequency declines, likely due to microphysical or radiative constraints.
Crowd-sourced reports show significantly more hail events on high-dust days, with up to 10 times more reports for hail >20 mm. Statistical hail models, including a logistic regression model (LRM) and a generalized additive model (GAM), rank dust as one of the top three predictors. Its inclusion increases the critical success index (CSI) by 5 % (LRM) and 12 % (GAM), and boosts explained variance in the GAM by 6 %. These findings identify Saharan dust as a key modulator of European hail activity, exerting both enhancing and inhibiting effects depending on dust concentration and the definition of hail events.
- Article
(3505 KB) - Full-text XML
- BibTeX
- EndNote


Hail is among the most damaging atmospheric phenomena in mid-latitudes, causing extensive harm to agriculture, infrastructure, and vehicles (Changnon, 1999; Crompton and McAneney, 2008). Understanding the processes leading to hail formation is crucial for improving predictions and mitigating severe weather impacts in Europe.
Saharan dust events, characterized by the transport of mineral dust from the Sahara Desert across the Mediterranean into Europe, are the predominant source of atmospheric dust loads in the region over the past 40 years (Moulin et al., 1997; Varga, 2020; Brunner et al., 2021). These dust plumes contribute significantly to European aerosol concentrations, affecting weather patterns and precipitation (Rodríguez et al., 2001; Masson et al., 2010). Subtropical anticyclones shifting to higher latitudes and amplified Rossby waves are associated with extreme Saharan dust events (Rodríguez and López-Darias, 2024). Saharan dust plays a crucial role in cloud formation by serving as both cloud condensation nuclei (CCN) and ice-nucleating particles (INP) (Meloni et al., 2008; Twohy et al., 2009; Boose et al., 2016).
CCNs influence cloud droplet concentrations and size distributions, affecting precipitation initiation and hail formation. Higher CCN concentrations lead to numerous smaller droplets, suppressing coalescence and delaying precipitation onset (Rosenfeld et al., 2008). This delay allows more supercooled liquid water to be carried aloft, enhancing hailstone growth through accretion (Khain et al., 2005). Increased CCN levels can also modify latent heat release within clouds, strengthening updrafts and potentially intensifying thunderstorm dynamics (Tao et al., 2012).
INPs promote ice formation at higher temperatures, facilitating the early initiation of ice processes within clouds (Boose et al., 2016). Variations in INP concentrations affect initiation of freezing, influencing hailstone size and distribution. Higher INP concentrations increase ice crystal numbers, leading to numerous smaller hailstones, while lower concentrations may result in fewer but larger hailstones due to more supercooled liquid water per nucleus (Cantrell and Heymsfield, 2005; DeMott et al., 2010; Michaud et al., 2014; Hill et al., 2014; Brennan et al., 2020).
Beyond their microphysical roles, Saharan dust particles impact the Earth’s radiation budget through radiative effects. Dust aerosols scatter and absorb solar and terrestrial radiation, modifying atmospheric heating rates and surface temperatures (Osborne et al., 2011). This atmospheric heating can alter stability profiles and affect thermal convection, potentially suppressing or enhancing it depending on environmental conditions (Perlwitz et al., 2001). The semi-direct effect, where absorbing aerosols heat the atmosphere and change relative humidity profiles, influences cloud development and lifetime (Hansen et al., 1997). This atmospheric heating can also inhibit convection initiation under certain conditions, particularly in strong Saharan dust scenarios, where increased atmospheric stability has been linked to a decline in convective activity and hail occurrence (Seifert et al., 2023; Fischer et al., 2025).
Observational studies have provided valuable insights into the role of aerosols in cloud behavior and precipitation processes. A study of shipping lane emissions demonstrated a 40 % decline in lightning linked to reduced aerosol pollution, highlighting the significant impact of aerosols on deep convective cloud behavior and aerosol–cloud–interactions (Wright et al., 2025). Similarly, recent research has identified Saharan dust as a significant factor influencing rainfall in tropical cyclones. Utilizing machine learning models with extensive meteorological data and satellite observations, Zhu et al. (2024) found that dust is a key predictor for tropical cyclone rainfall, revealing a nonlinear relationship where rainfall increases with dust concentration up to a certain point (dust optical depth of 0.06) before decreasing sharply at high dust levels. This finding underscores the complex role of Saharan dust in precipitation processes and the importance of accounting for nonlinear effects.
Building on these observations, modeling studies have explored how variations in CCN and INP concentrations affect cloud properties, precipitation outcomes, and hail characteristics. In single-cell convection events with low convective available potential energy (CAPE) and minimal wind shear, increased CCN concentrations tend to decrease total surface precipitation and peak updraft velocities (Seifert and Beheng, 2006; Lee et al., 2008a). Conversely, in multi-cell storms characterized by higher instability and shear, higher aerosol levels can enhance surface precipitation due to increased evaporation, stronger updrafts and downdrafts, stimulation of new convective cells, and improved convective organization (Khain et al., 2005; Lynn et al., 2005; Seifert and Beheng, 2006; Lee et al., 2008b). In Alpine environments, aerosol–cloud–precipitation interactions have been investigated through case studies that underscore the role of aerosol concentrations. Eirund et al. (2022) found that forecast models lacking aerosol perturbations underestimated heavy precipitation leading to flooding in northeastern Switzerland; sensitivity simulations showed that increased CCN and INP concentrations significantly impacted convective dynamics and precipitation patterns. Barthlott et al. (2024) observed that only high-resolution models with low CCN concentrations accurately captured certain thunderstorms, underscoring the significant role of aerosol concentrations in simulations. Loftus and Cotton (2014) indicate that increasing CCN concentrations generally result in larger and more numerous hailstones, even if overall storm dynamics remain largely unchanged. Hydrometeor responses and hail formation exhibit non-monotonic behavior with varying CCN levels, emphasizing the need for further research across different storm environments. For instance, Ilotoviz et al. (2018) examined the relationship between aerosols and hail two-dimensional cloud model with spectral bin microphysics, finding that high aerosol concentrations enhance supercooled cloud water content and promote wet hail growth, resulting in larger hailstones. However, the overall picture remains complex and partially inconsistent. Comprehensive reviews by Allen et al. (2020) and Raupach et al. (2021) emphasize that aerosol–cloud–precipitation interactions are not yet fully understood, with diverging findings depending on storm type, model setup, and environmental conditions.
Despite these findings, the specific influence of Saharan dust on hail occurrence in Europe remains underexplored. Given Saharan dust's significant role as a source of CCNs and INPs and its impact on atmospheric processes, our study aims to address the following research questions:
-
What effect do high and low aerosol dust mass concentrations have on the occurrence of hail in Europe?
-
Can aerosol dust loading be used as a predictor to improve statistical hail prediction models?
To answer these questions, we examine historical data from sources including the ECMWF CAMS model (Inness et al., 2019; Sect. 2.1), radar observations (Sect. 2.2.1) and (Sect. 2.2.2), lightning measurements (Sect. 2.3), crowd-sourced reports (Sect. 2.2.3), and ERA5 reanalysis data (Sect. 2.4). We aim to uncover patterns and correlations between dust events and hail formation across Europe (Sect. 3). Statistical models are utilized to quantify the statistical relationship between hail day occurrence and dust concentrations, enabling us to further infer the potential influence of dust on hail formation processes and to address research question 2 (Sect. 4). Conclusions are drawn and future research avenues are suggested in Sect. 5.
In this study, we combined reanalysis data, crowd-sourced reports, lightning, and radar measurements to investigate the influence of Saharan dust events on hail formation in Europe. In order to investigate the effect of altered dust loads on hail occurrence and not thunderstorm occurrence in general, only local days with lightning (hereafter coined thunderstorm days) were included in the analysis performed in this study (Sect. 2.3). Further, as most hail occurrences in Europe are constrained to the summer season, only the peak hail months of June, July, and August were considered in this analysis. With the exception of the analysis incorporating the crowd-sourced reports (Sect. 2.2.3) and the statistical models (Sect. 4) the analysis was conducted for the period 2013–2021 (828 d). The analysis was conducted on a 1° × 1° grid. Applying the hail area fraction (Sect. 2.2.1) and lightning density thresholds (Sect. 2.3), from the total 385 390 grid-point days, 86 900 are grid-point thunderstorm days of which 32 989 are local, grid-point hail days (38 % of grid-point thunderstorm days). The analysis presented herein was conducted from 10° W to 25° E and 35 to 53° N.
2.1 Dust data
To determine whether the target regions were influenced by Saharan dust, we used the total vertically integrated aerosol dust from the Copernicus Atmosphere Monitoring Service (CAMS, Inness et al., 2019). The CAMS reanalysis is a global aerosol dataset available from 2003 onwards with annual updates, produced by ECMWF. It assimilates satellite dust optical depth data using the Integrated Forecasting System, offering improved spatial resolution (80 km) and finer temporal resolution over previous versions. With reduced biases and enhanced consistency, it serves as a valuable resource for climatology, trend analysis, model evaluation, and providing boundary conditions for regional models. The dust data from CAMS provides a quantitative measure of the dust concentration in the atmosphere, allowing us to identify periods and areas affected by Saharan dust transport. Specifically, we used vertically integrated mass of dust aerosol in three size ranges 0.03–0.55, 0.55–9, and 9–20 µm. This dataset has a horizontal resolution of 1° × 1°, and all other data presented in the following will be brought onto this grid for analysis. We used daily 15:00 UTC timesteps for our analysis, as this represents the maximum in the hail diurnal cycle in Europe (Cui et al., 2025). In this text dust loading is used as a short form for “vertically integrated mass of dust aerosol”.
2.2 Hail observations
2.2.1 EURADHAIL
To determine hail events, we use the European radar hail climatology (EURADHAIL, Cui et al., 2025), which is based on OPERA (Huuskonen et al., 2014). Following Cui et al. (2025), a reflectivity threshold of 53 dBZ classifies hail in the EURADHAIL dataset. From this, high resolution (2 km) daily (06:00–06:00 UTC) binary fields of hail occurrence are calculated. Further, to reduce the spatial resolution of this dataset, the fraction of area covered by hail is computed for each 1° × 1° grid-point if OPERA data is available for at least 50 % of the grid-point area. This quantity is referred to as the hail area fraction and is available for 324 grid-points. A threshold of 0.01 for the hail area fraction was used to classify a given grid-point as a local hail day, this is equivalent to the threshold used in Barras et al. (2021), and Wilhelm et al. (2024). This dataset encompasses the period 2013–2021.
2.2.2 POH
For statistical models analyzing the effect of dust loading on hail day occurrence, we focus on northern Switzerland, using hail day data from the Probability of Hail (POH) radar product (Germann et al., 2022). POH is an empirical hail detection algorithm estimating ground-level hail probability (0 %–100 %) based on the vertical distance between the 45 dBZ echo top height and the freezing level height, following Waldvogel et al. (1979). This approach is more accurate in capturing hail events than EURADHAIL, since the latter does not include the freezing level.
Daily POH data from 2003 to 2022 were analyzed for the region north of the Swiss Alps and the foothills (see Wilhelm et al., 2024). Hail days were defined using thresholds adapted from Barras et al. (2021), with a day classified as a hail day if more than 580 km2 had POH >80 %.
2.2.3 Crowd-sourced hail reports
Swiss crowd-sourced hail reports as detailed in Barras et al. (2019) provide valuable, localized observations of hail events, contributing to the spatial and temporal mapping of hail occurrences across the target region. Since May 2015, more than 300 000 hail size reports have been gathered across Switzerland via the MeteoSwiss app, which allows users to report the time, location, and size of hailstones they observe. The discrete size categories range from “no hail” to “tennis ball” size, with users able to manually adjust the time and location of their reports. These reports undergo a multi-step plausibility check, including spatial and temporal validation against radar data, to filter out erroneous entries. The crowd-sourced data provides extensive spatial coverage and valuable ground truth for hail events, complementing radar-based measurements. In order to account for the growth in user base over time, the fraction of reports made on a given day in relation to the total reports in that year was calculated for each size bin. The crowd-sourced hail reports collected in the years 2015–2021 were used in this study.
2.3 Lightning measurements
Daily lightning data was retrieved from the World Wide Lightning Location Network (WWLLN) Global Lightning Climatology (Kaplan and Lau, 2022). The mean lightning density within each 1° × 1° grid-point was calculated, and for each grid-point, days with a mean lightning density greater than 0.0005 km−2 d−1 were considered to be thunderstorm days.
2.4 Reanalysis data
We further employ the ERA5 reanalysis dataset, the latest product from the European Centre for Medium-Range Weather Forecasts (ECMWF), representing the fifth generation of atmospheric reanalysis data (Hersbach et al., 2020). This dataset offers a spatial resolution of 31 km (spectral resolution T369) for data on single levels, pressure levels, and model levels (137 vertical levels) with data available at an hourly temporal resolution. For the synoptic clustering analysis the ERA5 geopotential height at 500 hPa pressure level 15:00 UTC was used. The environmental predictors for the statistical model were calculated from ERA5 model level, pressure level, and single-level data for a study region in northern Switzerland, spanning 2003–2022 in hourly resolution. A total of 75 convective parameters were calculated (see Wilhelm et al., 2024).
In this section, we investigate the local statistical dependencies between aerosol dust loading with the occurrence of hail.
Comparing thunderstorm days with the lowest and highest dust loading reveals that especially high hail area fraction values are predominantly found during periods of high dust loading and vice-versa (Fig. 1). Hail area fractions larger than 0.28 were found exclusively during periods with a dust loading larger than 2.4 mg m−2. This threshold falls onto the 30th percentile of the JJA climatological dust concentration across the EURADHAIL domain (see Fig. A1 in Appendix A for context).
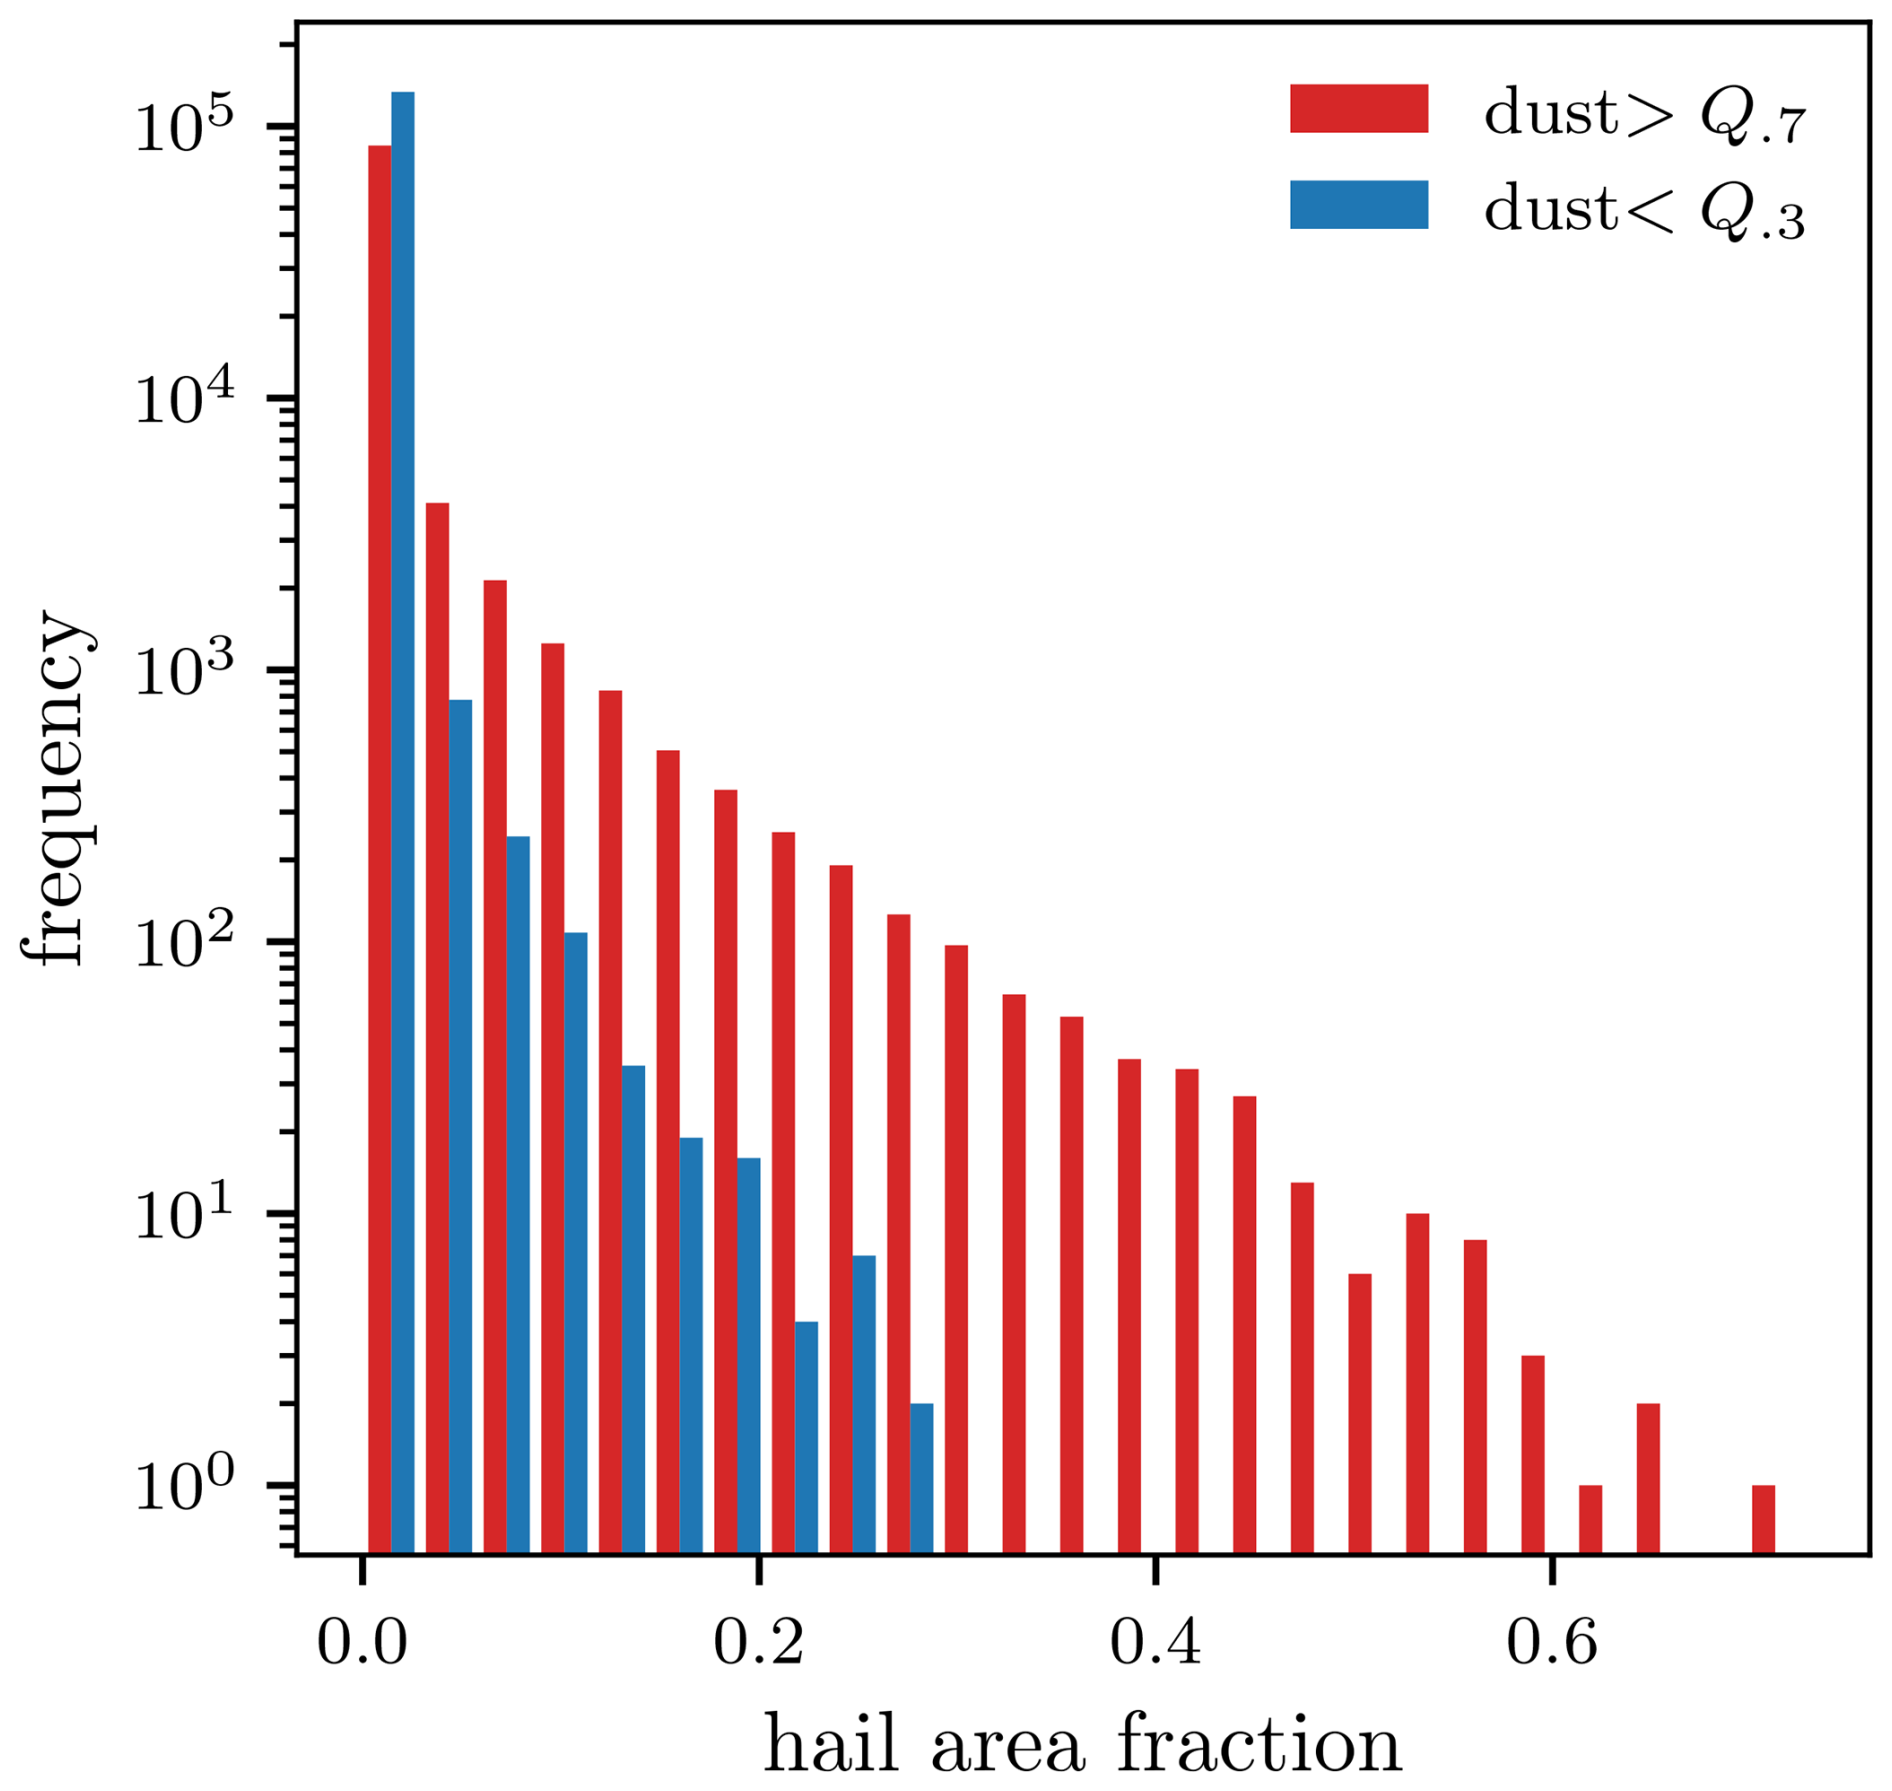
Figure 1Histogram of hail area fractions of thunderstorm days with lowest and highest 30 percentile (Q.3 and Q.7 respectively) vertically integrated mass of dust aerosol 0.03–20 µm (CAMS, 2.4 and 22 mg m−2, blue and red respectively).
In fact, the median dust load during local hail days is 1.82 times higher than during non-hail days1. The difference in mean dust loading between local hail days and non-hail days is highly significant (7σ, Welch's t-test) and valid (>3σ) for a wide range of local hail day area thresholds (0.006–0.42, as defined in Sect. 2.2.1). This relationship is present throughout Europe, however, most of the significant areas lie within the main Alpine crest, central France, eastern Germany, Austria, and much of eastern Europe with wide-spread areas where the median dust load during local hail days is more than twice as high than during non-hail days (Fig. 2).
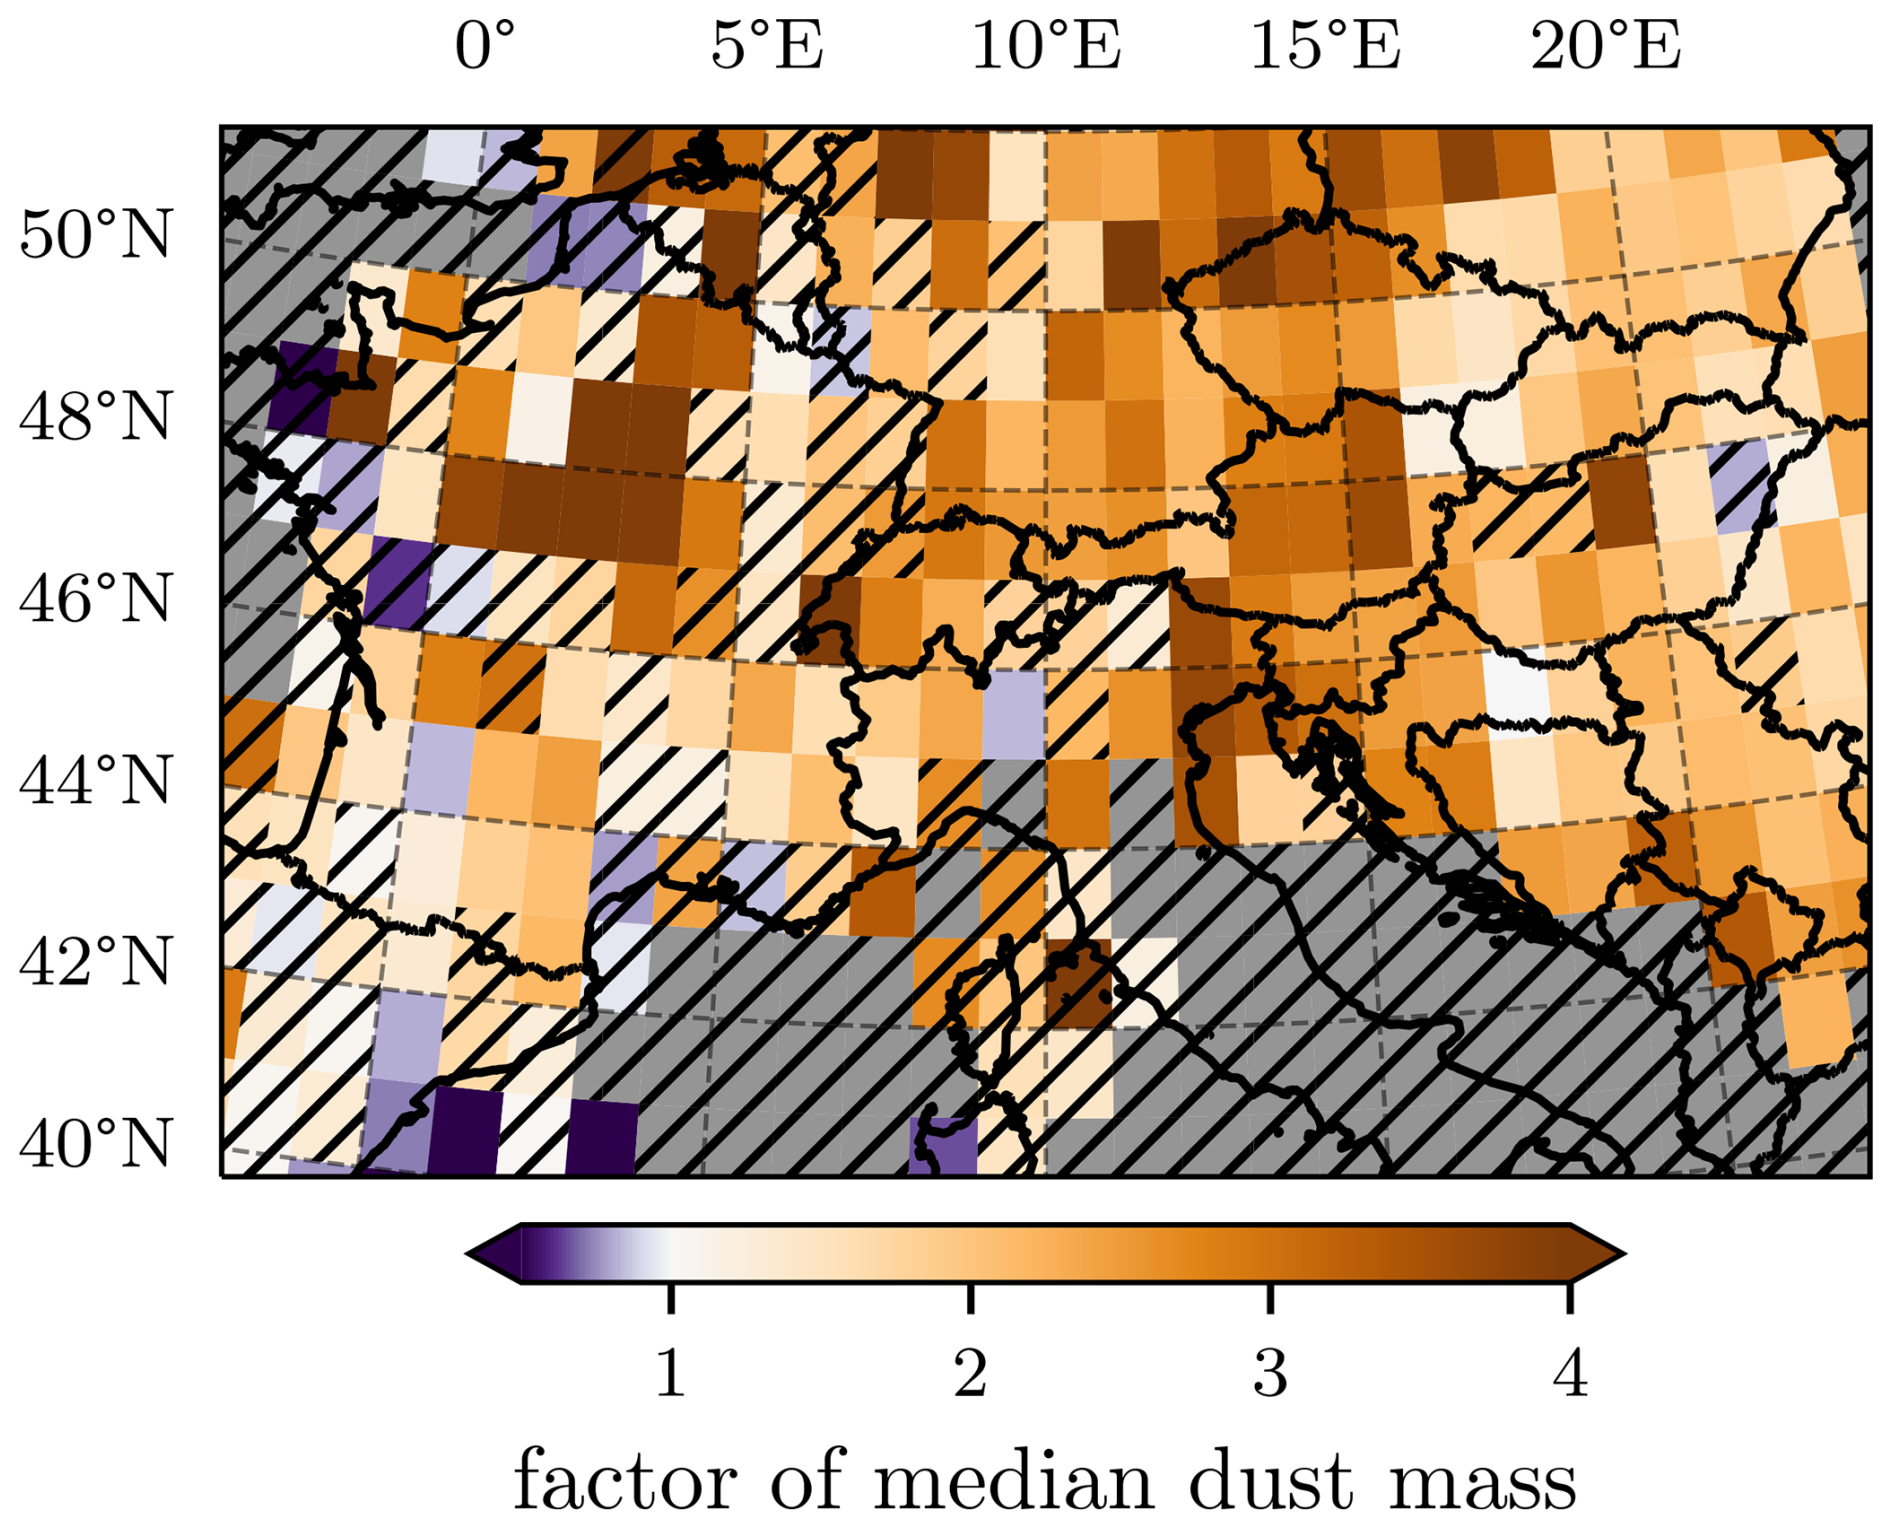
Figure 2Gridpoints colored by their factor of median vertically integrated mass of dust aerosol 0.03–20 µm (CAMS) during local hail days versus non-hail days (EURADHAIL). Grid-points with less than three hail days per year are greyed out, while areas with <1σ significance are hatched.
There exists a distinct maxima in the fraction of grid-point days with hail occurrence as a function of dust mass (Fig. 3). Depending on the dust size range considered and hail area fraction used to define local hail days (Sect. 2.2.1), this maxima occurs at 6.1, 13.8, and 25.4 mg m−2 for the aerosol size ranges 0.03–0.55, 0.55–9, and 9–20 µm respectively, and in the size range 0.03–20 µm at 28.1, 38.2 and 63.6 mg m−2 for the hail area fraction thresholds 0.002, 0.01 and 0.05 respectively. At concentrations lower than said peak, there is an exponential relationship between dust loading and local hail day fraction and a steep decline in local hail day fraction after the maximum. A similar nonlinear relationship between dust mass and tropical cyclone rainfall was discovered by Zhu et al. (2024), who also found a decrease in values beyond the peak response. The peak response at 38 mg m−2 likely hints towards a beneficiary microphysical effect of the aerosols at dust concentrations below 60 mg m−2 and a limiting effect due to other microphysical or radiative processes at dust concentrations higher than that. The peak of 38 mg m−2 falls on the 77th percentile of the JJA dust climatology (see Fig. A1 for context). To relate our findings with Zhu et al. (2024), who found an intermediate peak at a dust optical depth of 0.06, we can convert our vertically integrated aerosol dust mass numbers to dust optical depth by multiplying with a factor of 785 kg m−2 (correlation between vertically integrated aerosol dust mass 0.03–20 µm and dust optical depth is 0.997). Using this conversion, our intermediate maxima lies at 0.033, which was verified through another approach (Fig. B1 in Appendix B).
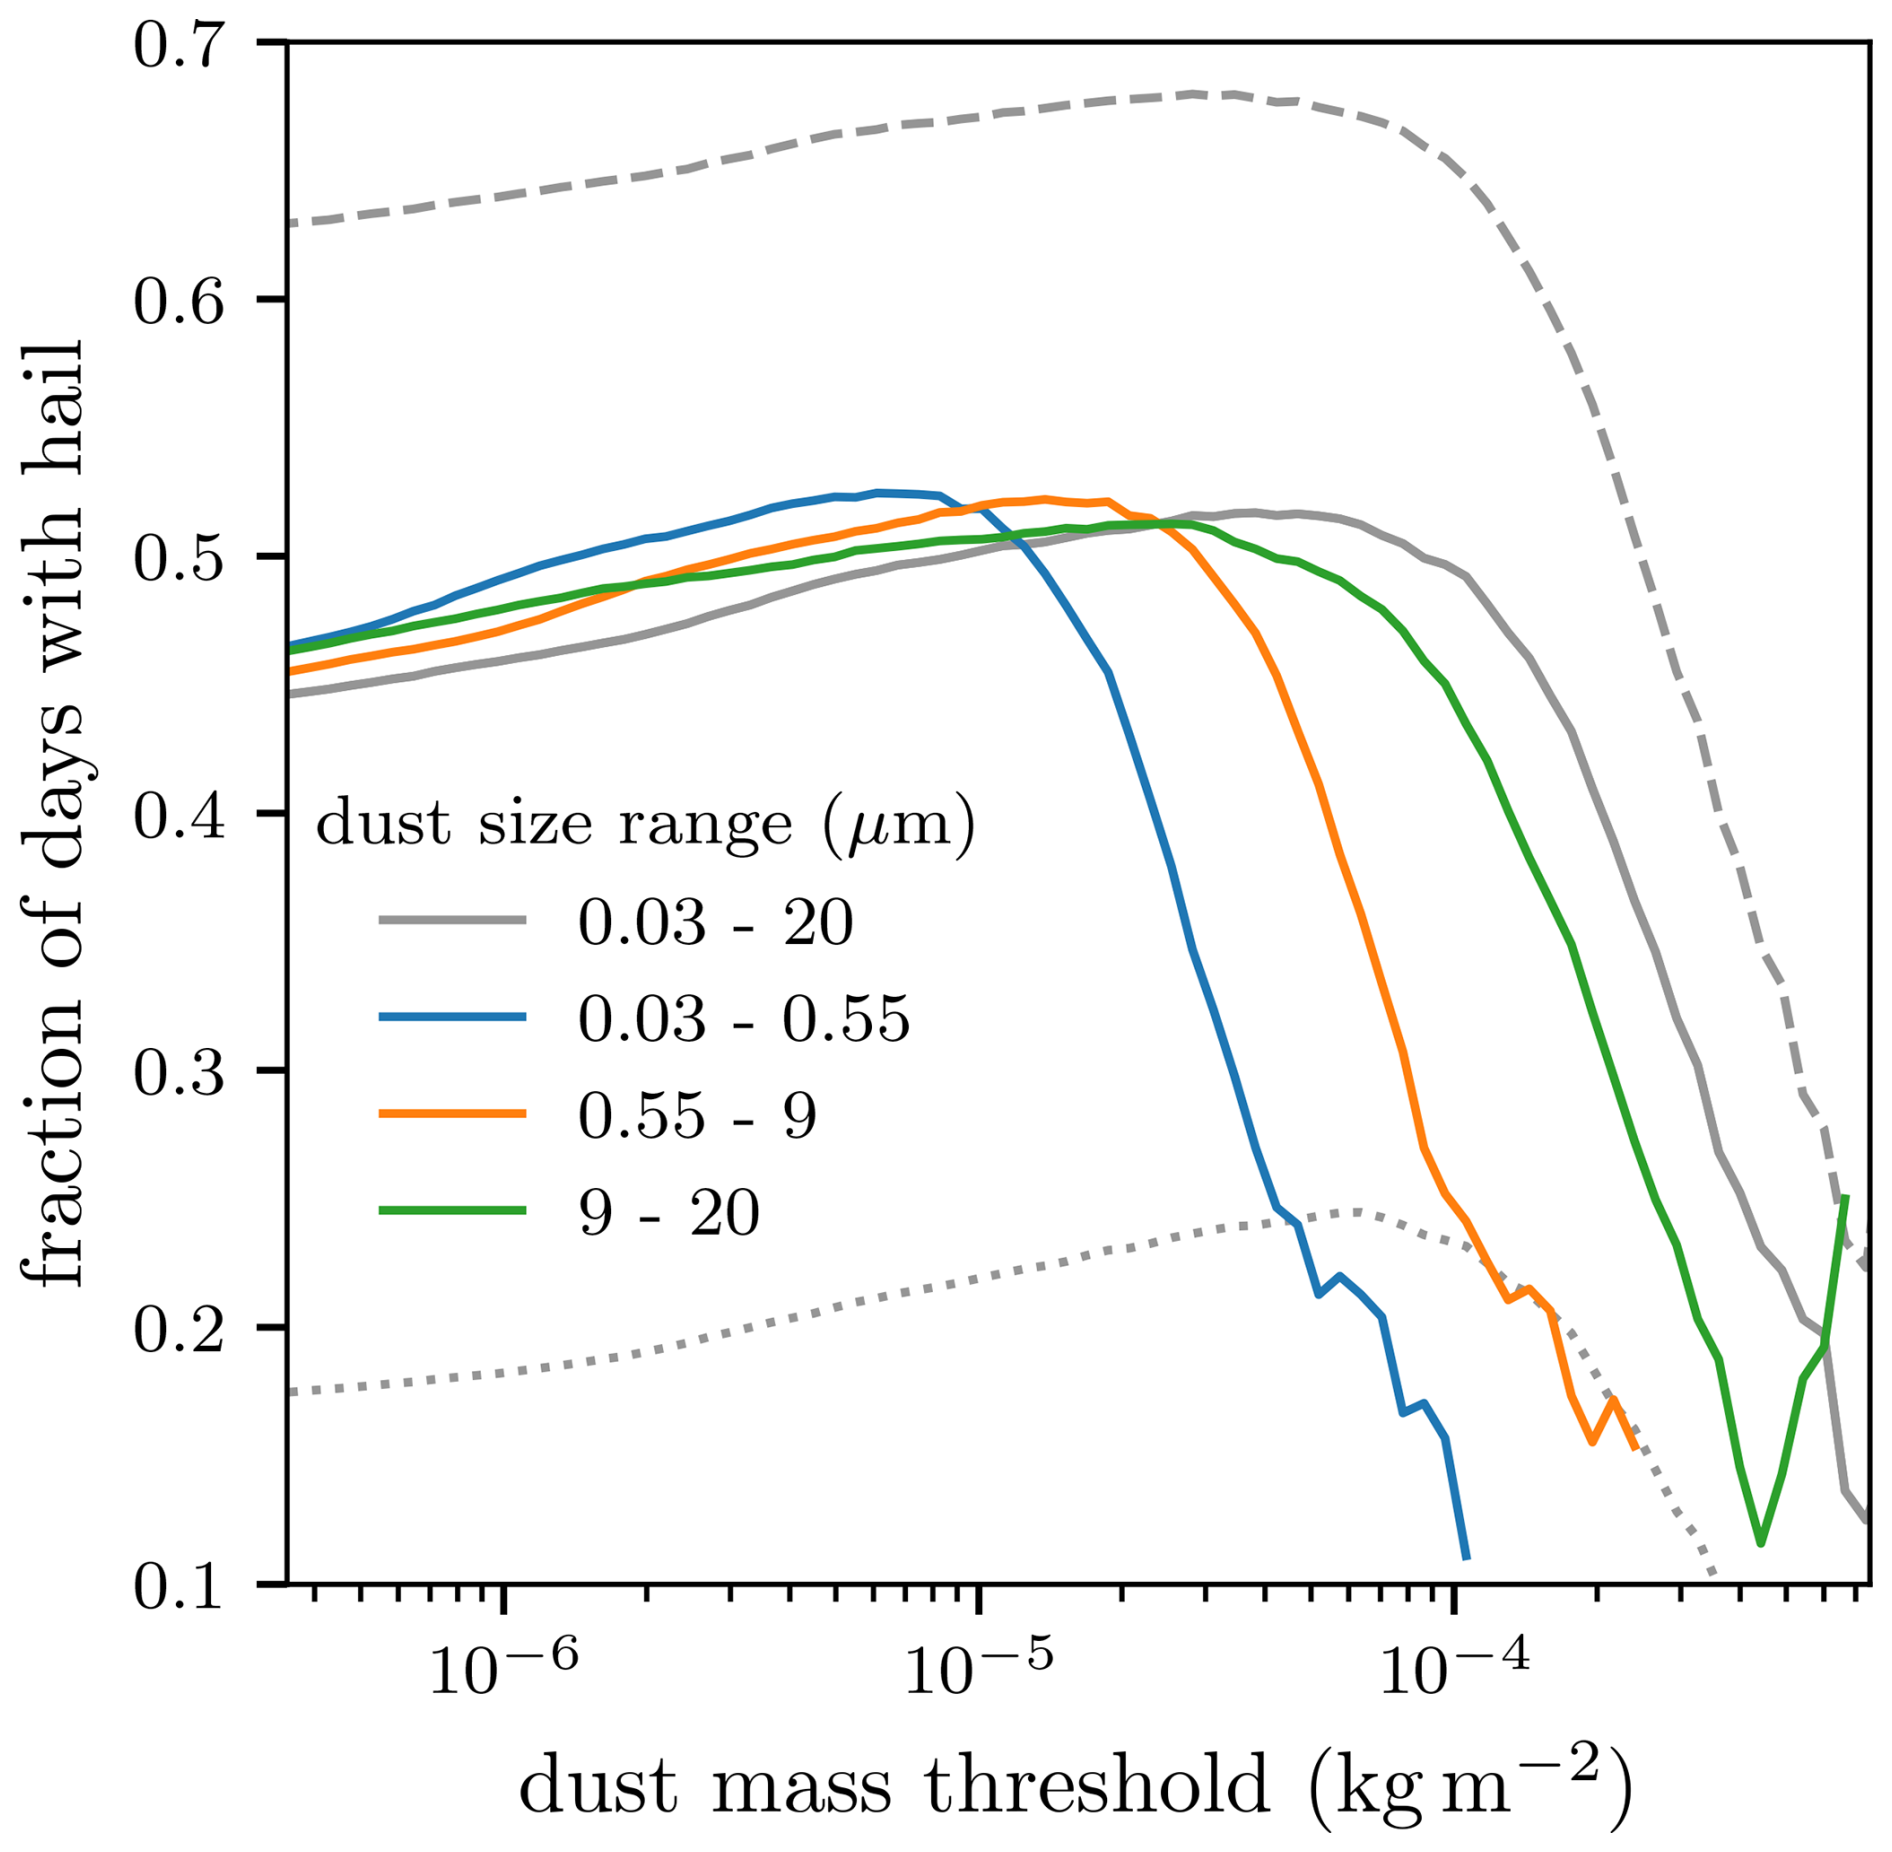
Figure 3Fraction of days with hail (EURADHAIL) as a function of vertically integrated mass of dust aerosol (CAMS) for different dust size bins (colors) and different hail area fraction thresholds (dotted, solid, and dashed lines represent 0.002, 0.01, and 0.05 area fractions respectively). Values for dust mass that occur on less than 10 grid-point days were omitted.
3.1 Effect on hail size
When comparing crowd-reported hail sizes in Switzerland during the lowest and highest dust load days, it is evident, that regardless of size category, significantly (>4σ) more hail reports are submitted during high dust days (Fig. 4). In fact, on average, 5.2, 9.8, 10.3, and 4.7 times more reports are submitted during high dust days (90th percentile, 85 mg m−2) versus low dust days (10th percentile, 2.6 mg m−2) for hail size categories of <15, 15–27, 27–37, and >37 mm respectively. With exception of the largest hail size category, the difference in the reports submitted during high vs low dust load days increases with larger hail sizes. The nonlinearity observed in the largest crowd-sourced hail size category could be associated to false reports. As discussed in Kopp et al. (2024) and references therein, the largest hail categories exhibit the highest number of false reports.
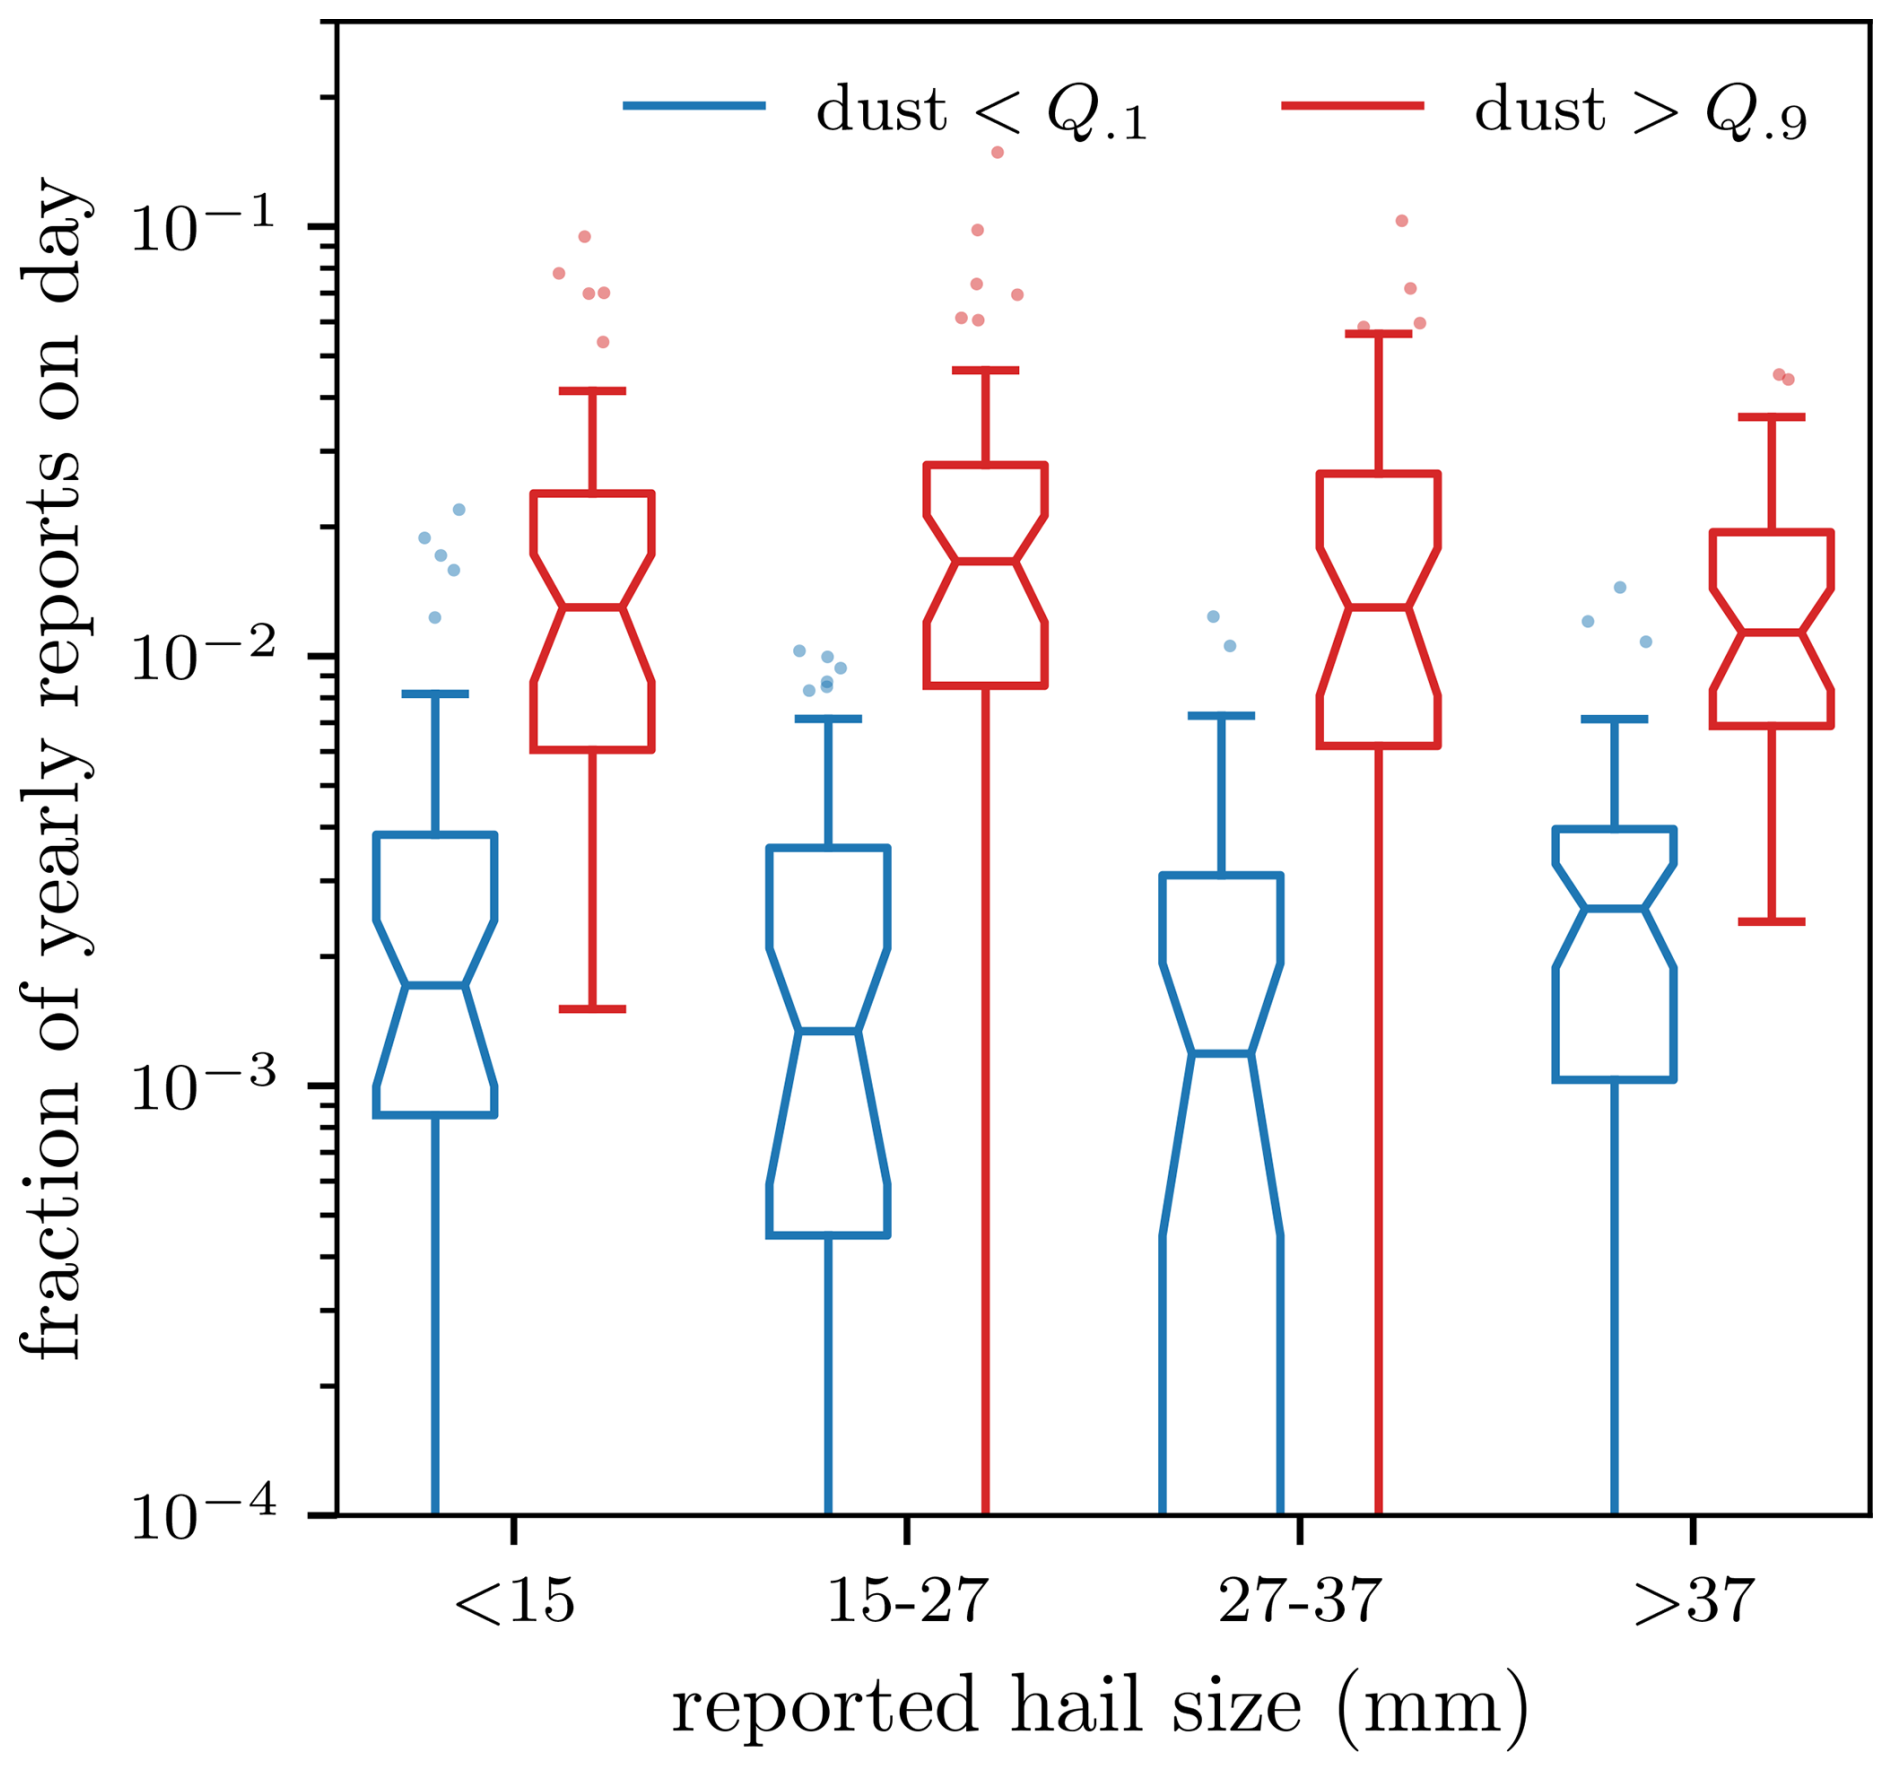
Figure 4Fraction of yearly crowd-sourced reports that were submitted in Switzerland on a given thunderstorm day for different reported hail size categories during the 10 % highest and 10 % lowest dust load days (CAMS mean vertically integrated mass of dust aerosol 0.03–20 µm in the area 5 to 11° E and 45 to 48° N, red and blue respectively). 43 d fall into each category. Only thunderstorm days with South to West flow are shown (mean 700 hPa flow >1 m s−2, ERA5 reanalysis (Hersbach et al., 2020). Horizontal line with notches shows the mean and confidence interval respectively, while the box covers the interquartile range (IQR) and the whiskers extend to the farthest data point lying within 1.5× the IQR from the box.
3.2 Isolating synoptic influence
In an attempt to further rule out synoptic effects as a hidden confounder in the relationship between hail and dust, we conducted the analysis presented in Sect. 3 on days with similar synoptic situations. To this end, using principal component analysis (PCA, Pedregosa et al., 2011) with the explained variance set to 1σ, yielding four dimensions, and K-means clustering (Krishna and Narasimha Murty, 1999) we grouped the 15:00 UTC geopotential height Z at p=500 hPa in a 14° × 20° box (coarsened to 7×7 pixels) centered on the target region north of the Alps (7 to 12° E and 47 49° N). In the selected target region, n=254 thunderstorm days were assigned to 11 clusters, the number of clusters was chosen based on the maximum Silhouette score (0.25) (Rousseeuw, 1987). Within each cluster, the dust load in each target gridpoint was compared between hail and non-hail days. It was found that the most populous cluster with n=44 had in the median, 1.86 times more dust during hail days (1.6σ), while the next three most populous clusters (n=30 to 34) yielded dust mass factors of 1.77 (1.5σ), 0.81 (0.13σ), and 5.46 (4.8σ). The mean dust factor across all clusters weighted by n was 3.20 (1.6σ).
This analysis was repeated for different sample target regions (13 to 16° E and 47 to 49° N: eastern Austria, 15 to 17° E and 44 to 46° N: Croatia, and 0 to 4° E and 47 to 49° N: central France) with n=272, n=263, and n=97 thunderstorm days respectively. In these target regions, 9, 10, and 13 clusters respectively performed best (Silhouette scores of 0.27, 0.28, and 0.27) and weighted mean dust mass factors of 2.70 (2.1σ), 3.27 (1.5σ), and 3.42 (1.1σ) were determined.
The geopotential height clustering analysis confirms the robustness of the observed relationship between dust and hail. By grouping days with similar synoptic conditions using PCA and K-means clustering, distinct clusters were identified, allowing for targeted comparisons of dust load between hail and non-hail days. Across all tested regions and clustering approaches, the weighted mean dust mass factor consistently exceeded 1, reinforcing the conclusion that increased dust concentrations are associated with hail days. The results remained stable across variations in clustering methods (such as self-organizing maps or hierarchical clustering) and parameters, further ruling out synoptic effects as a confounding factor.
Even within a given synoptic cluster, days may differ in thermodynamic structure, e.g., presence of elevated mixed layers advected from dust source regions (Schultz et al., 2025). This could lead to a spurious dust-hail link driven by lapse-rate changes rather than dust itself. Differences in the thermodynamic environments across the categories – lightning, hail, dust, hail with dust, and normal days – are detailed in the Appendix C.
Building on the observed positive relationship between hail days and high dust loading, this section investigates how statistical models capture and quantify the relationship between hail occurrence and dust loading and, more importantly, whether the inclusion of dust predictors enhances predictive performance.
To this end, we employed a logistic regression model (LRM) and a generalized additive model (GAM) to predict hail events in northern Switzerland, a hail hotspot in Europe. Logistic regression is widely used in atmospheric sciences to predict binary outcomes such as hail or thunderstorm occurrence (e.g., Battaglioli et al., 2023; Wilhelm et al., 2024). Here, we used it to estimate the probability p(x) of a hail day from POH (Sect. 2.2.2) based on environmental predictors from ERA5 (Sect. 2.4) and dust loading from CAMS (Sect. 2.1). The logistic regression model is expressed as:
where xi represent environmental predictors and βi are regression coefficients determined via maximum likelihood estimation using the glm package in R. To prevent overfitting, the dataset (2013–2022) was divided into training (60 %), testing (20 %) and validation (20 %) sets. Ten-fold cross-validation was used to evaluate model performance based on multiple metrics (Table 1).
Generalized additive models (GAMs) were implemented to account for potential nonlinear relationships between predictors and hail occurrence. GAMs extend logistic regression by incorporating spline-based smooth functions fi(xi):
enabling the capture of non-monotonic effects, such as those of dust loading. The GAMs were implemented using the mgcv package in R, with smoothing parameters optimized via generalized cross-validation.
The goal was to build a physically informed, ingredient-based model incorporating predictors relevant to hail formation: atmospheric instability, moisture, and wind shear. Unlike prior studies optimizing predictive performance (e.g., Battaglioli et al., 2023; Wilhelm et al., 2024), the focus here was on simple parameters to evaluate the impact of including dust as a predictor.
Predictors in both models included the sum of the vertically integrated mass of dust aerosol across three size ranges (0.03–0.55, 0.55–9, and 9–20 µm), the convective available potential energy (CAPE), capturing atmospheric instability, the wind shear magnitude from the surface to 500 hPa, important for storm organization, and the height of the freezing level which influences the depth of the hail growth zone. The variables capturing atmospheric moisture availability are the 2 m dewpoint temperature in the LRM and the mean relative humidity across 850–500 hPa in the GAM. Because of their differing model structures, GAMs benefited from using mid-level relative humidity, which provided better predictive performance than 2 m dewpoint temperature due to better capturing the complex role of moisture availability in hail formation. In both models, the dust predictor was highly significant, with GAMs showing high degrees of freedom, indicating a nonlinear relationship with hail occurrence.
CAPE was the most important predictor in both models, followed by dust and/or moisture in second and third place, depending on the model. This was determined from z-values in the LRM and χ2/SHAP values in the GAM. This highlights the relevance of dust-related predictors in statistical hail modeling, though their importance varies with model type, parameter tuning, choice of covariates and data resolution.
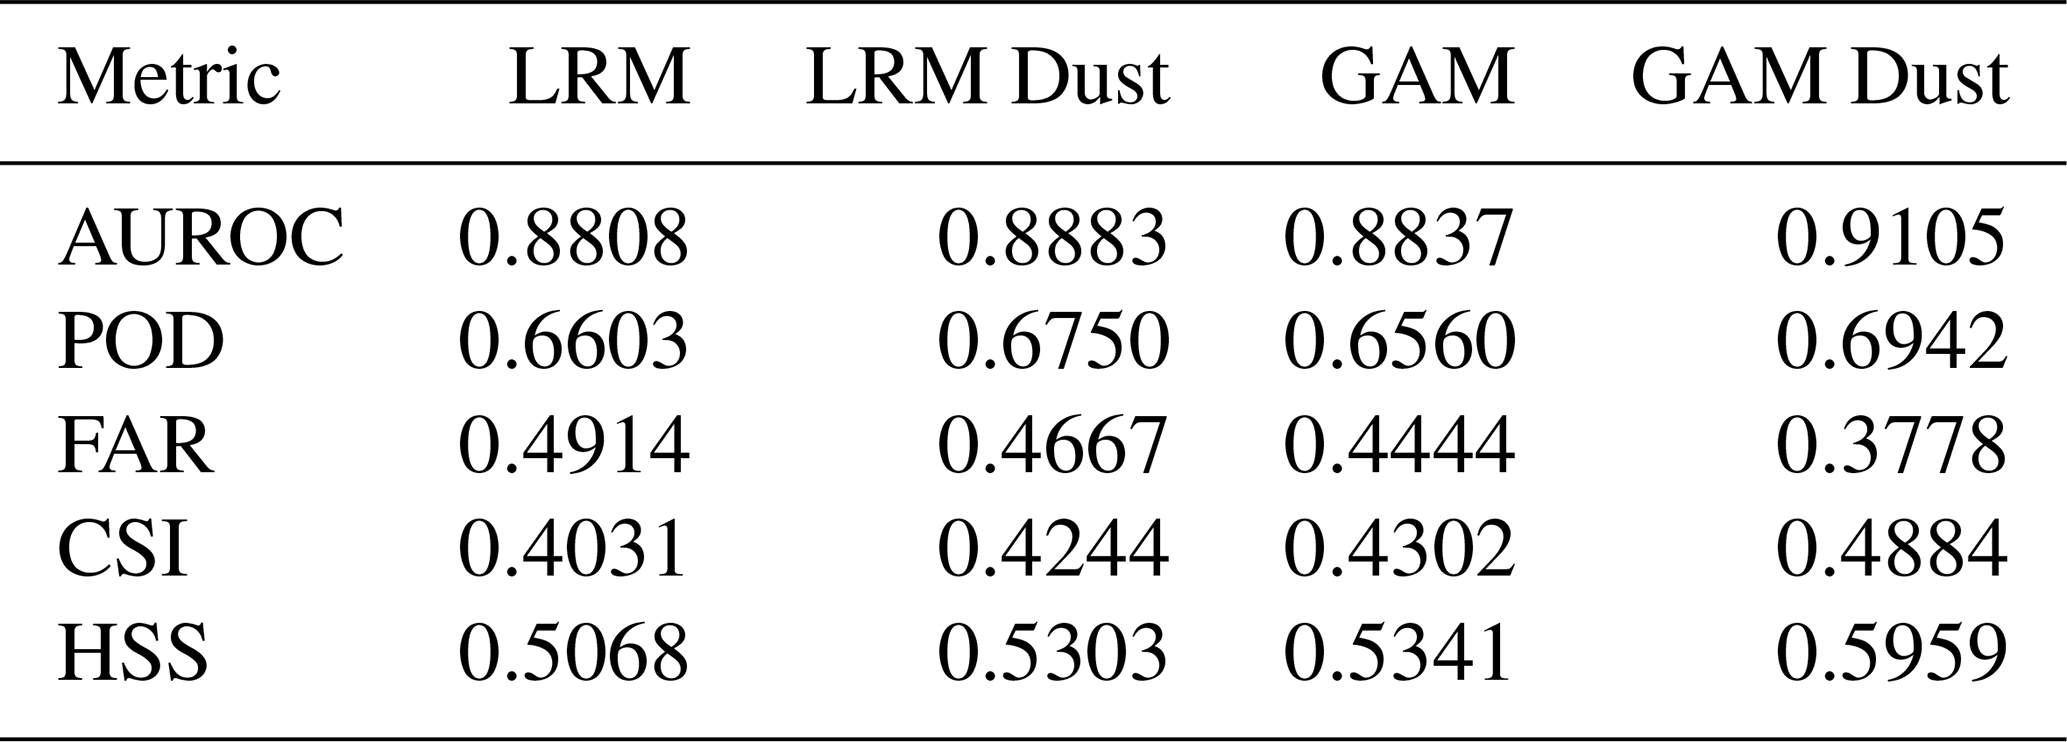
Both models performed well, achieving AUROCs of 0.88 (LRM) and 0.91 (GAM). However, high false alarm rates (FARs) of 0.49 (LRM) and 0.44 (GAM) were observed, a common issue in extreme event classification. Including dust loading as a predictor improved the predictive skill of both models, e.g. increasing the critical success index (CSI) by 5 % in the LRM and 12 % in the GAM (Table 1). In the GAM, explained variance rose by 6 % indicating that dust predictors contribute valuable additional information about hail day occurrence, although the overall variance explained remains low due to the complexity of hail dynamics.
Table 1Performance metrics for the logistic regression models (LRM) and generalized additive models (GAM) with and without dust as a predictor. For AUROC, POD, CSI, and HSS a value close to one is optimal, while for FAR zero is optimal.
The GAM reveals that hail days are more likely at intermediate dust concentrations, peaking around 12 mg m−2 and declining at very high dust loads at the end of the distribution (Fig. 5). Note that this value is smaller than what the analysis in Sect. 3 showed because the dust loading was averaged over the northern Swiss domain. This “boomerang” shape aligns well with findings from Zhu et al. (2024) and supports the concept of an optimal aerosol loading (Koren et al., 2008). These results suggest that Saharan dust does not inherently suppress hail formation; rather, its effects depend on the concentration. Moderate dust levels likely enhance microphysical processes such as ice nucleation or cloud droplet activation, while higher concentrations may inhibit hail formation through radiative or microphysical feedback. This aligns with the findings discussed in Sect. 3, reinforcing the earlier observation of dust's dual role in hail formation.
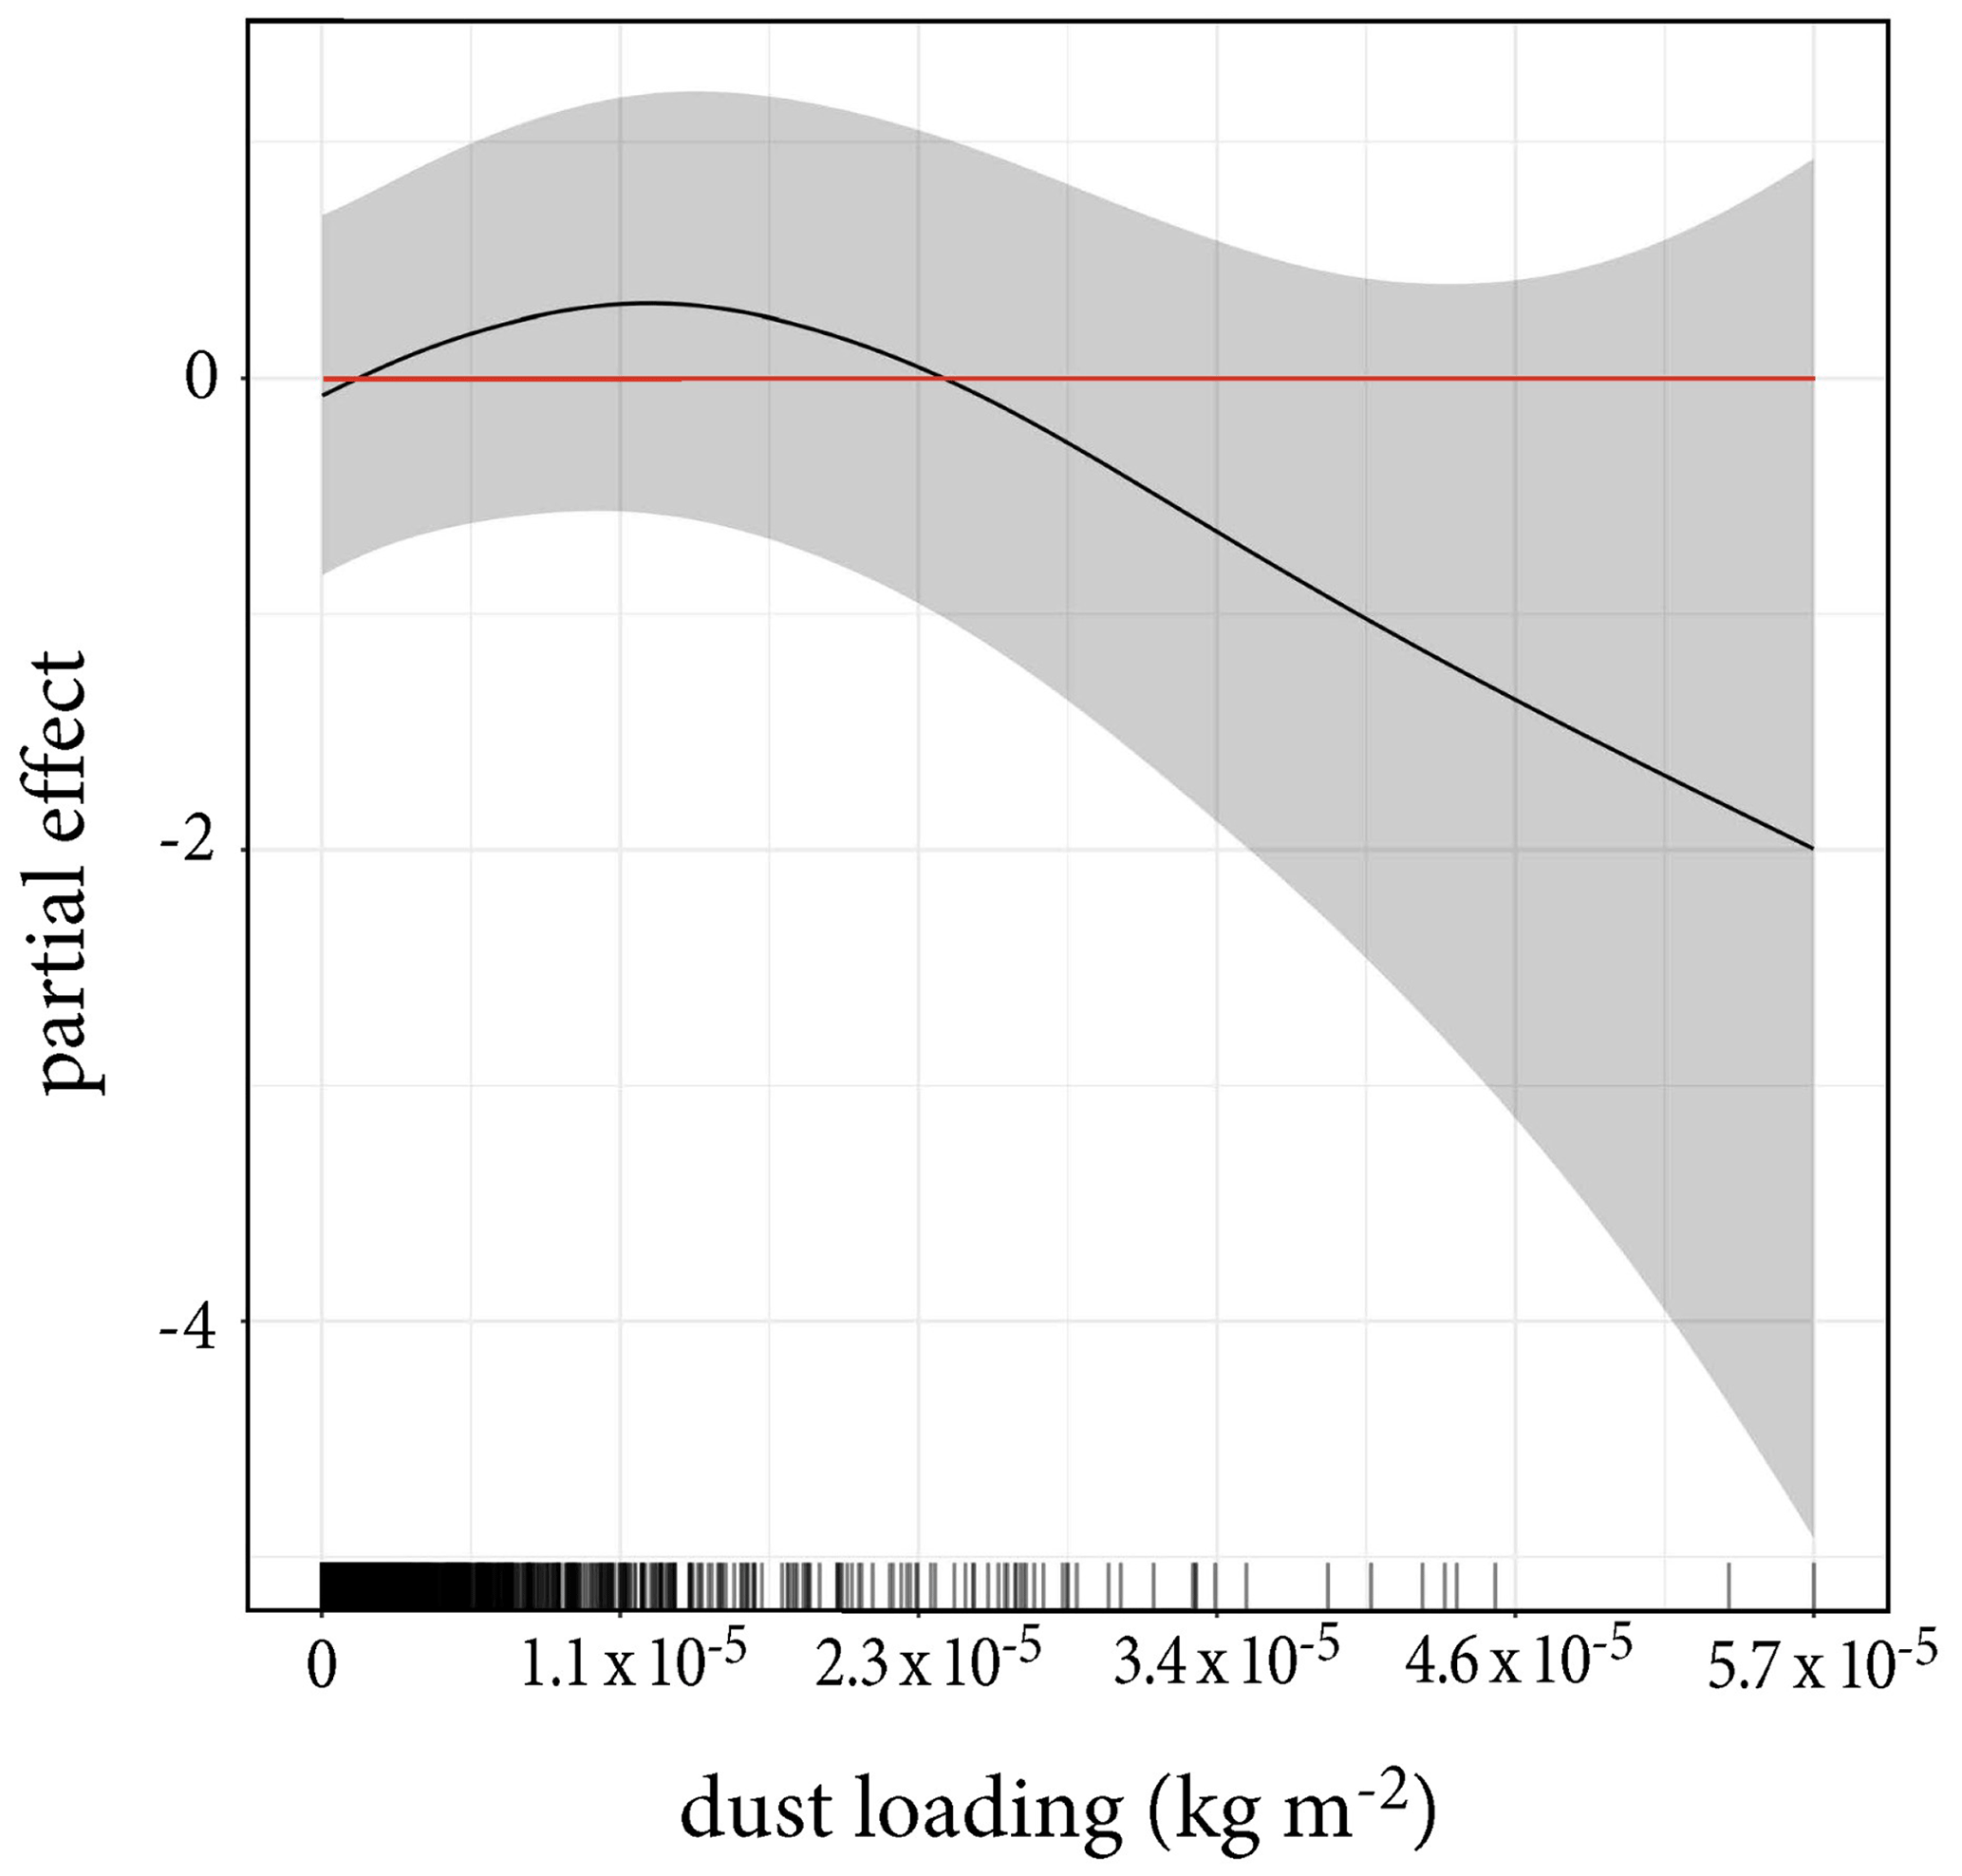
Figure 5Partial dependence plots for the dust loading covariate in the GAM. The solid black line and gray uncertainty range represent the modeled partial effect of the covariate on the response. The red horizontal line separates positive from negative effects. The short black vertical lines indicate the covariate distribution.
In this study, we investigated the relationship between aerosol dust loading and hail occurrence across the EURADHAIL domain. We found that periods of high dust loading are consistently associated with the most intense hail events (Sect. 3). Specifically, the median dust load on hail days was 1.82 times greater than on non-hail days, a robust and highly significant difference (7σ) observed across multiple hail area fraction thresholds. The most extensive hail events – those covering more than 28 % of 1° × 1° tiles – occur exclusively on days when dust loads exceed 2.4 mg m−2. We also identified a distinct maximum in hail occurrence at 38 mg m−2, corresponding to a dust optical depth of 0.033. Importantly, our analysis of subsets of days with similar synoptic conditions through a clustering approach using geopotential height at 500 hPa confirmed that these patterns persist even when accounting for large-scale weather patterns (Sect. 3.2). This greatly reduces the likelihood that synoptic variability alone drives the observed association between hail days and dust loading.
Our results contribute to the evolving understanding of aerosol–cloud–hail interactions and are consistent with theoretical frameworks that describe aerosol invigoration and optimal aerosol loading. Previous studies have shown that aerosol particles acting as CCN and INP can enhance convective development and influence precipitation formation (e.g., Rosenfeld et al., 2008). The “optimal aerosol loading” concept (Koren et al., 2008) suggests that intermediate aerosol concentrations can maximize convective intensity before additional loading begins to suppress convection through radiative and microphysical feedback. This aligns with our observation of a hail occurrence peak at intermediate dust loads. Further, our findings extend work by Zhu et al. (2024), who identified similar nonlinear aerosol–precipitation relationships in tropical cyclone rainfall, into the mid-latitude convective storm regime.
Contrary to some expectations drawn from microphysical competition pathways (e.g., Dennis, 1977), our crowd-sourced hail reports did not reveal a statistically significant effect of dust on hailstone size (Fig. 4). This suggests that while dust aerosols can enhance hail occurrence, their influence on hailstone growth processes may differ from earlier conjectures and is not hail-size dependent.
The integration of aerosol dust loading into logistic regression and GAM frameworks (Sect. 4) reveals two key findings: One, statistical modeling offers an effective approach to enhance our understanding of hail formation processes. And two, incorporating dust predictors significantly increases the predictive skill of proxy-based hail prediction models. In our simplified ingredients-based model, the dust predictor consistently emerged as a highly significant variable, ranking as the second or third most important feature. Its inclusion enhances model performance, increasing the critical success index (CSI) by 5 % in the LRM and 12 % in the GAM, while boosting explained variance in the GAM by 6 %. Incorporating aerosol variables may enable models to capture microphysical mechanisms that are typically inaccessible in large-scale environmental datasets like ERA5. Moreover, advancements in machine and deep learning offers opportunities to overcome limitations such as collinearity, allowing the use of a larger number of predictors. We recommend further investigation of dust predictors across diverse modeling frameworks. Initial experiments with random forest models and a European-scale model (not shown) have yielded promising results, demonstrating robust relationships and reliable performance when well tuned.
Incorporating aerosol variables from datasets like Inness et al. (2019) holds significant potential for improving hail forecasting models, supporting the integration of aerosol data into operational weather prediction systems. Moreover, regional weather simulations with sophisticated microphysical parameterizations (e.g., Seifert and Beheng, 2006; Noppel et al., 2010) might benefit from explicitly representing spatial and temporal variations in dust loading. While such detailed simulations are computationally demanding, dust-related parameters could also enhance post-processing algorithms, potentially improving hail forecasts even in simpler operational models with one-moment schemes (e.g., Brennan et al., 2025).
These findings also hold implications for hail suppression efforts. Previous work on hail prevention and cloud seeding has explored the introduction of artificial aerosols to reduce hail damage, though with limited conclusive outcomes (e.g., Atals, 1977; Federer et al., 1986; Rivera et al., 2020; Pirani et al., 2023). Our study suggests that, under certain atmospheric conditions, natural dust aerosols may actually enhance hail formation, raising the possibility that indiscriminate or poorly targeted seeding efforts could inadvertently increase hail occurrence. While caution is warranted in extrapolating these observational results directly to cloud seeding applications, our results underscore the complexity of aerosol–cloud interactions and the need for more targeted experimental and modeling investigations before relying on aerosol-based interventions for hail mitigation.
Naturally, our correlational approach cannot fully establish causation. Although we leverage lightning data to differentiate hail-producing from non-hail-producing storms and control for synoptic conditions via clustering analyses, other confounding factors such as boundary-layer moisture or vertical wind shear could still influence the dust–hail relationship. Nonetheless, our comprehensive use of all available data and robust analytical approaches provides strong evidence that variations in dust loading meaningfully relate to hail events. Regardless of the underlying mechanisms that lead to a link between hail and dust, the co-occurrence of hail and dust events revealed through our analysis rules out dust as a generalizable limiting factor for hail formation. Furthermore, the potential bias due to dust-enhanced precipitation intensity (e.g., Zhu et al., 2024) affecting radar reflectivity cannot be fully excluded, though the consistent signal observed in crowd-sourced hail reports (Sect. 3.1) supports a genuine hail-related effect of the findings presented throughout this study.
In conclusion, our study highlights a significant and robust association between aerosol dust loading and hail events across Europe. We identify a clear quantitative relationship – high hail area coverage occurs only above a dust load threshold of 2.4 mg m−2, and a pronounced maximum in hail occurrence emerges at moderate dust concentrations. Future studies should assess whether similar dust–hail relationships hold in other hail-prone regions globally, particularly those with different or limited aerosol sources, such as the central United States or South America. The complexity of these interactions, however, underscores the need for further research to clarify causal mechanisms and develop strategies that leverage aerosol information effectively.
To make it easier to compare our findings with existing literature (i.e., Zhu et al., 2024), we provide a subset of our findings using dust optical depth instead of vertically integrated dust aerosol mass (Fig. B1).
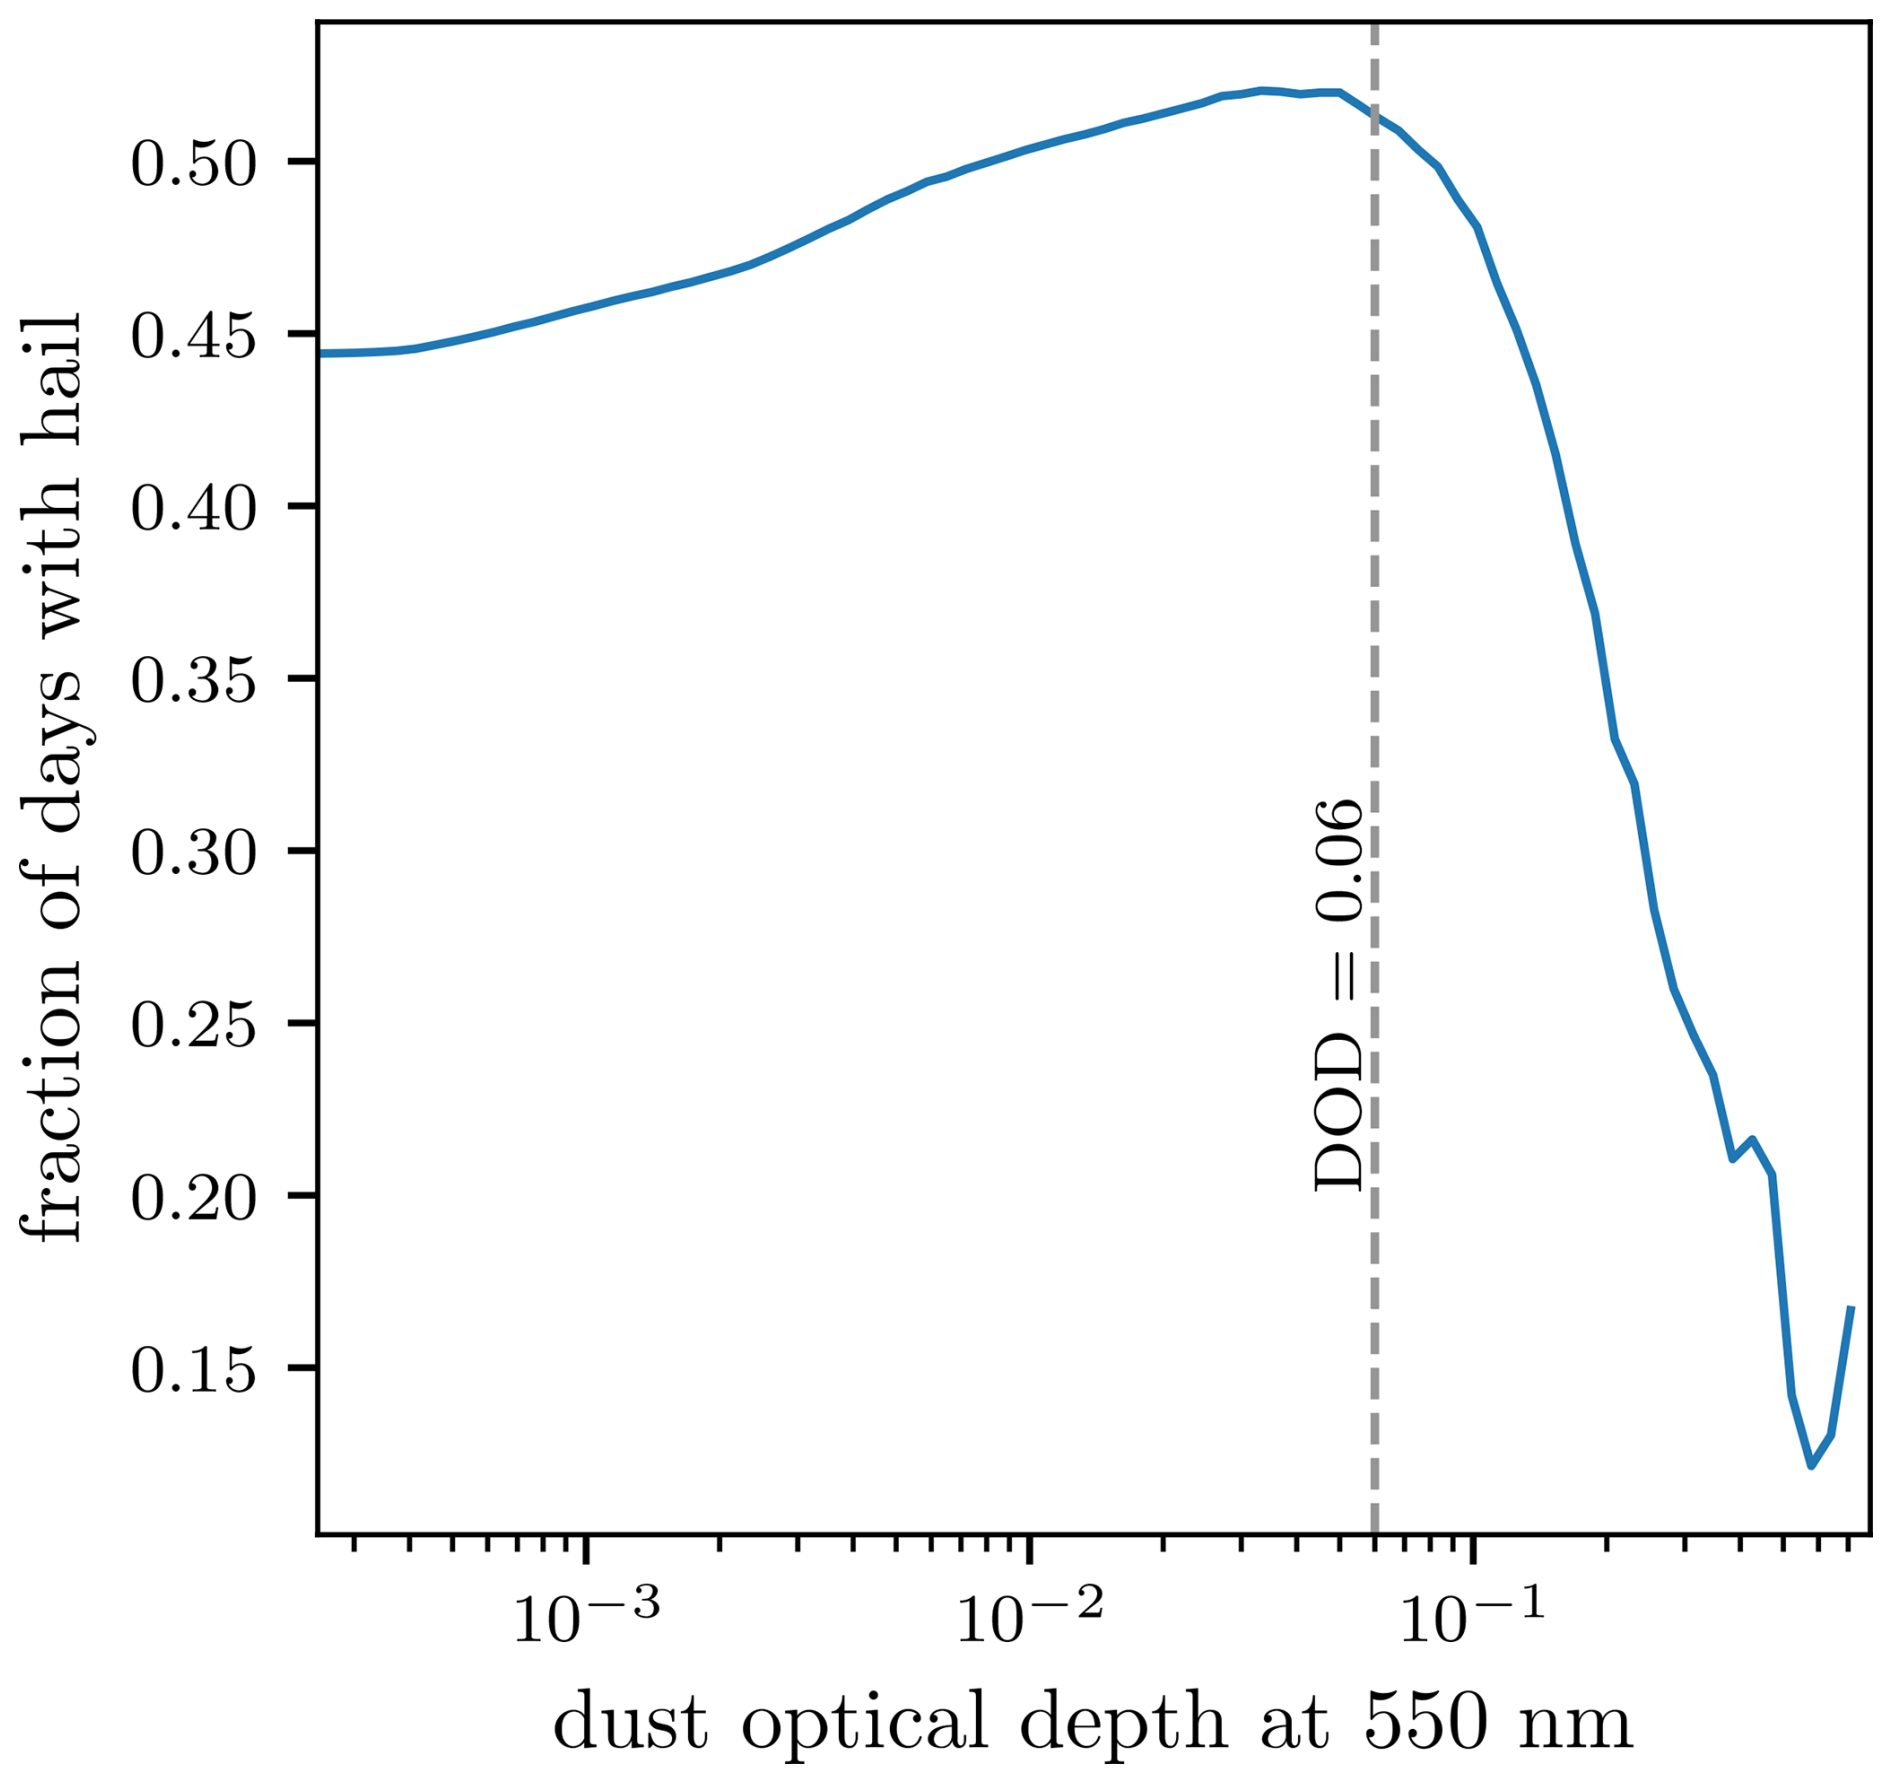
Figure B1Identical to Fig. 3, but only for the 0.01 area fraction and using dust optical depth instead of vertically integrated dust aerosol mass. The dust optical depth (DOD) value of maximum response found in Zhu et al. (2024) is indicated with a dashed vertical line.
Following the methodology devised in Zschenderlein and Wernli (2022), the position of thunderstorm, hail, and dust days in the distribution of respective environmental variables was determined. To this end, temperature and water vapor mixing ratio at inflow height (850 hPa), as well as CAPE was determined. This analysis reveals, that dust days lie predominantly at the upper end of the T850 hPa distribution of all days (Fig. C1a). In comparison, lightning and hail days follow the all days distribution more closely, while exhibiting less spread. Concerning low-level humidity, the pattern is flipped, where dust days are dryer compared to the distribution of all days, and lightning and hail days are at the moister end of the distribution (Fig. C1b). Next, distributions in vertical wind shear are similar between dust and hail days with dust and differ from the climatology (Fig. C1c). Finally, the distribution of CAPE found during dust days is skewed relative to the CAPE distribution of all days, with higher CAPE values being relatively more frequent during dust days. Surprisingly, the CAPE distribution for lightning and hail days follows more closely that of the all-day distribution (Fig. C1d).
Our analysis of the synoptic environment reveals that although local dust days fall on the warmer side of the low-level temperature distribution and exhibit a distribution of CAPE skewed towards higher values compared to hail days, dust days also have less low-level moisture than hail days.
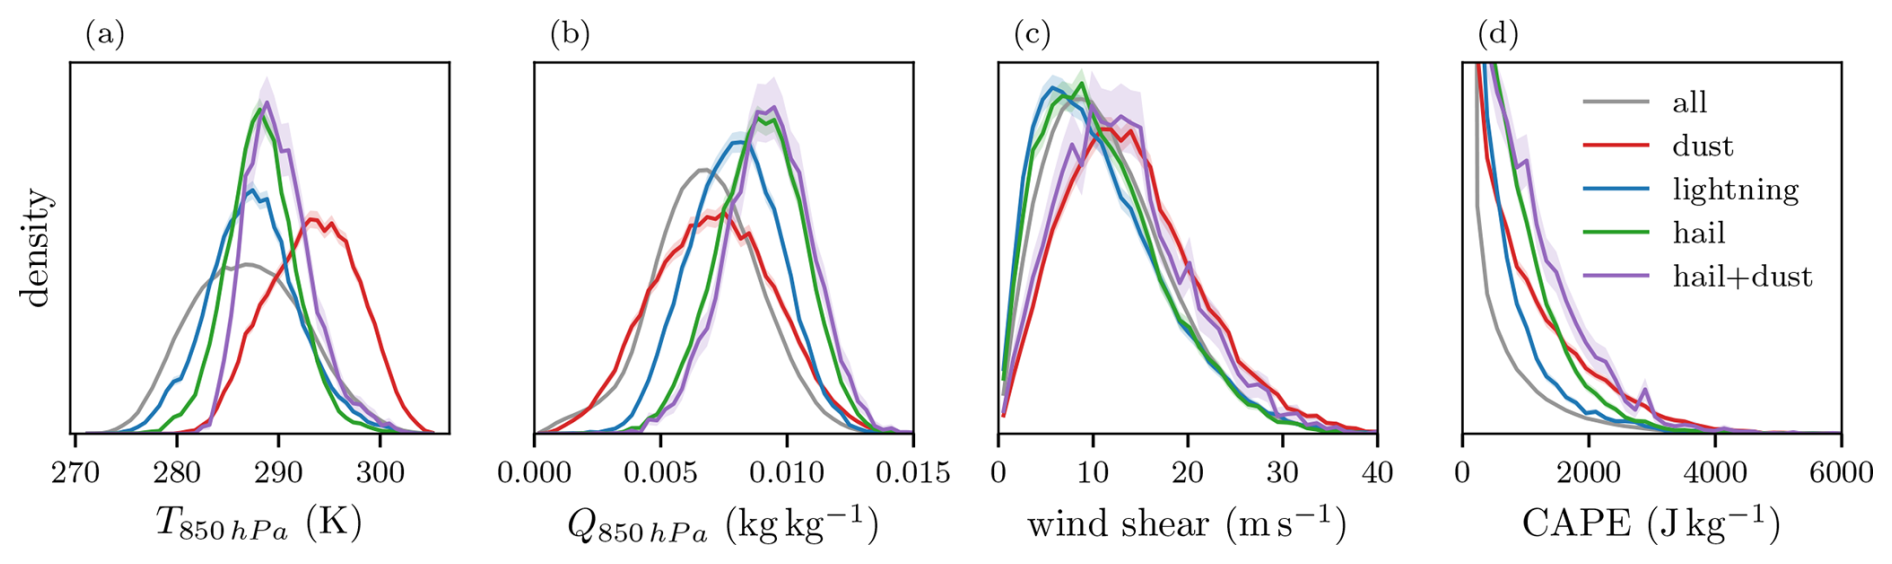
Figure C1Normalized probability density of local temperature (a), and specific humidity (b) at 850 hPa, (c) 10 m to 500 hPa vertical wind shear, and CAPE (d) at 15:00 UTC for each grid-point within the study domain, for all days (JJA, 2013–2023), dust days, thunderstorm days, hail days, and combined hail and dust days (ERA5). Solid lines show the distribution, while shaded areas indicate the 95 % confidence interval determined through bootstrapping (n=1000).
The datasets are described in Sect. 2. CAMS data are available from the Copernicus Atmosphere Data Store (ADS) https://doi.org/10.24381/d58bbf47 (Copernicus Atmosphere Monitoring Service, 2020; Inness et al., 2019). ERA5 data are available from the Copernicus Climate Change Service (C3S) Climate Data Store at https://doi.org/10.24381/cds.adbb2d47 (Hersbach et al., 2023, 2020). EURADHAIL data are available at https://doi.org/10.3929/ethz-b-000701924 (Cui and Thurnherr, 2024; Cui et al., 2025). WWLLN data are available at https://doi.org/10.5067/WWLLN/DATA101 (Katrina Virts, 2025; Kaplan and Lau, 2022). Additional code and data used in this study are available from the authors upon request.
KPB: Conceptualisation; investigation; visualisation; writing – original draft, review and editing. LW: Statistical modelling, visualisation; writing – original draft, review and editing.
The contact author has declared that neither of the authors has any competing interests.
Publisher's note: Copernicus Publications remains neutral with regard to jurisdictional claims made in the text, published maps, institutional affiliations, or any other geographical representation in this paper. While Copernicus Publications makes every effort to include appropriate place names, the final responsibility lies with the authors. Also, please note that this paper has not received English language copy-editing.
We thank Anna Miller, Heini Wernli, Marc Federer, and Emmanouil Flaounas for their valuable input. Further, we would like to express our sincere gratitude to our colleagues from ETH and the University of Bern and the entire scClim team (https://scclim.ethz.ch/, last access: 21 July 2025) for their invaluable insights and discussions. This study was funded by the Swiss National Science Foundation (SNSF) Sinergia grant CRSII5_201792. We acknowledge the use of OpenAI's GPT in assisting with language refinement in the preparation of this manuscript.
This research has been supported by the Schweizerischer Nationalfonds zur Förderung der Wissenschaftlichen Forschung (grant no. CRSII5_201792).
This paper was edited by Marco Gaetani and reviewed by three anonymous referees.
Allen, J. T., Giammanco, I. M., Kumjian, M. R., Jurgen Punge, H., Zhang, Q., Groenemeijer, P., Kunz, M., and Ortega, K.: Understanding hail in the earth system, Rev. Geophys., 58, https://doi.org/10.1029/2019RG000665, 2020. a
Atals, D.: The paradox of hail suppression: Under different circumstances, cloud seeding may result in either increased or decreased hail, Science, 195, 139–145, https://doi.org/10.1126/science.195.4274.139, 1977. a
Barras, H., Hering, A., Martynov, A., Noti, P.-A., Germann, U., and Martius, O.: Experiences with > 50,000 crowdsourced hail reports in Switzerland, B. Am. Meteorol. Soc., 100, 1429–1440, https://doi.org/10.1175/BAMS-D-18-0090.1, 2019. a
Barras, H., Martius, O., Nisi, L., Schroeer, K., Hering, A., and Germann, U.: Multi-day hail clusters and isolated hail days in Switzerland – large-scale flow conditions and precursors, Weather Clim. Dynam., 2, 1167–1185, https://doi.org/10.5194/wcd-2-1167-2021, 2021. a, b
Barthlott, C., Czajka, B., Kunz, M., Saathoff, H., Zhang, H., Böhmländer, A., Gasch, P., Handwerker, J., Kohler, M., Wilhelm, J., Wieser, A., and Hoose, C.: The impact of aerosols and model grid spacing on a supercell storm from Swabian MOSES 2021, Q. J. Roy. Meteor. Soc., 150, https://doi.org/10.1002/qj.4687, 2024. a
Battaglioli, F., Groenemeijer, P., Púčik, T., Taszarek, M., Ulbrich, U., and Rust, H.: Modeled multidecadal trends of lightning and (very) large hail in Europe and North America (1950–2021), J. Appl. Meteorol. Clim., 62, 1627–1653, https://doi.org/10.1175/JAMC-D-22-0195.1, 2023. a, b
Boose, Y., Kanji, Z. A., Kohn, M., Sierau, B., Zipori, A., Crawford, I., Lloyd, G., Bukowiecki, N., Herrmann, E., Kupiszewski, P., Steinbacher, M., and Lohmann, U.: Ice nucleating particle measurements at 241 K during winter months at 3580 m MSL in the Swiss Alps, J. Atmos. Sci., 73, 2203–2228, https://doi.org/10.1175/JAS-D-15-0236.1, 2016. a, b
Brennan, K. P., David, R. O., and Borduas-Dedekind, N.: Spatial and temporal variability in the ice-nucleating ability of alpine snowmelt and extension to frozen cloud fraction, Atmos. Chem. Phys., 20, 163–180, https://doi.org/10.5194/acp-20-163-2020, 2020. a
Brennan, K. P., Sprenger, M., Walser, A., Arpagaus, M., and Wernli, H.: An object-based and Lagrangian view on an intense hailstorm day in Switzerland as represented in COSMO-1E ensemble hindcast simulations, Weather Clim. Dynam., 6, 645–668, https://doi.org/10.5194/wcd-6-645-2025, 2025. a
Brunner, C., Brem, B. T., Collaud Coen, M., Conen, F., Hervo, M., Henne, S., Steinbacher, M., Gysel-Beer, M., and Kanji, Z. A.: The contribution of Saharan dust to the ice-nucleating particle concentrations at the High Altitude Station Jungfraujoch (3580 m a.s.l.), Switzerland, Atmos. Chem. Phys., 21, 18029–18053, https://doi.org/10.5194/acp-21-18029-2021, 2021. a
Cantrell, W. and Heymsfield, A.: Production of ice in tropospheric clouds: a review, Bull. Amer. Meteor. Soc., 86, 795–808, https://doi.org/10.1175/BAMS-86-6-795, 2005. a
Changnon, S. A.: Data and approaches for determining hail risk in the contiguous United States, J. Appl. Meteorol. Clim., 38, 1730–1739, https://doi.org/10.1175/1520-0450(1999)038<1730:DAAFDH>2.0.CO;2, 1999. a
Copernicus Atmosphere Monitoring Service: CAMS global reanalysis (EAC4), Copernicus Atmosphere Monitoring Service (CAMS) Atmosphere Data Store [data set], https://doi.org/10.24381/d58bbf47, 2020. a
Crompton, R. P. and McAneney, K. J.: Normalised Australian insured losses from meteorological hazards: 1967–2006, Environ. Sci. Policy, 11, 371–378, https://doi.org/10.1016/j.envsci.2008.01.005, 2008. a
Cui, R. and Thurnherr, I.: EURADHAIL: European-wide radar-based hail product from 2013-2021, ETH Zurich [data set], https://doi.org/10.3929/ethz-b-000701924, 2024. a
Cui, R., Thurnherr, I., Velasquez, P., Brennan, K., Leclair, M., Mazzoleni, A., Schmid, T., Wernli, H., and Schär, C.: A European Hail and Lightning Climatology From an 11-Year Kilometer-Scale Regional Climate Simulation, J. Geophys. Res. Atmos., 130, https://doi.org/10.1029/2024JD042828, 2025. a, b, c, d
DeMott, P. J., Prenni, A. J., Liu, X., Kreidenweis, S. M., Petters, M. D., Twohy, C. H., Richardson, M. S., Eidhammer, T., and Rogers, D. C.: Predicting global atmospheric ice nuclei distributions and their impacts on climate, Proc. Natl. Acad. Sci. U.S.A., 107, 11217–11222, https://doi.org/10.1073/pnas.0910818107, 2010. a
Dennis, A. S.: Hail suppression concepts and seeding methods, in: Hail: A review of hail science and hail suppression, edited by: Borland, S. W., Browning, K. A., Changnon, S. A., Cooper, W. A., Danielsen, E. F., Dennis, A. S., Federer, B., Flueck, J. A., Foote, G. B., Goyer, G. G., Hitschfeld, W. F., Jameson, A. R., List, R., Macklin, W. C., Marwitz, J. D., Maxwell, J. B., McGinley, J. A., Mielke, P. W., Miller, R. C., Morgan, G. M., Nicholas, T. R., Orville, H. D., Renick, J. H., Srivastava, R. C., Vali, G., Veal, D. L., Young, K. C., Foote, G. B., and Knight, C. A., 181–193, American Meteorological Society, Boston, MA, ISBN 978-1-935704-30-0, 1977. a
Eirund, G. K., Drossaart van Dusseldorp, S., Brem, B. T., Dedekind, Z., Karrer, Y., Stoll, M., and Lohmann, U.: Aerosol–cloud–precipitation interactions during a Saharan dust event – A summertime case-study from the Alps, Q. J. Roy. Meteor. Soc., 148, 943–961, https://doi.org/10.1002/qj.4240, 2022. a
Federer, B., Waldvogel, A., Schmid, W., Schiesser, H. H., Hampel, F., Schweingruber, M., Stahel, W., Bader, J., Mezeix, J. F., Doras, N., D'Aubigny, G., DerMegreditchian, G., and Vento, D.: Main results of Grossversuch IV, J. Climate Appl. Meteor., 25, 917–957, https://doi.org/10.1175/1520-0450(1986)025<0917:MROGI>2.0.CO;2, 1986. a
Fischer, J., Groenemeijer, P., Holzer, A., Feldmann, M., Schröer, K., Battaglioli, F., Schielicke, L., Púčik, T., Antonescu, B., Gatzen, C., and TIM Partners: Invited perspectives: Thunderstorm intensification from mountains to plains, Nat. Hazards Earth Syst. Sci., 25, 2629–2656, https://doi.org/10.5194/nhess-25-2629-2025, 2025. a
Germann, U., Boscacci, M., Clementi, L., Gabella, M., Hering, A., Sartori, M., Sideris, I. V., and Calpini, B.: Weather radar in complex orography, Remote Sensing, 14, 503, https://doi.org/10.3390/rs14030503, 2022. a
Hansen, J., Sato, M., and Ruedy, R.: Radiative forcing and climate response, J. Geophys. Res. Atmos., 102, 6831–6864, https://doi.org/10.1029/96JD03436, 1997. a
Hersbach, H., Bell, B., Berrisford, P., Hirahara, S., Horányi, A., Muñoz-Sabater, J., Nicolas, J., Peubey, C., Radu, R., Schepers, D., Simmons, A., Soci, C., Abdalla, S., Abellan, X., Balsamo, G., Bechtold, P., Biavati, G., Bidlot, J., Bonavita, M., De Chiara, G., Dahlgren, P., Dee, D., Diamantakis, M., Dragani, R., Flemming, J., Forbes, R., Fuentes, M., Geer, A., Haimberger, L., Healy, S., Hogan, R. J., Hólm, E., Janisková, M., Keeley, S., Laloyaux, P., Lopez, P., Lupu, C., Radnoti, G., de Rosnay, P., Rozum, I., Vamborg, F., Villaume, S., and Thépaut, J.-N.: The ERA5 global reanalysis, Q. J. Roy. Meteor. Soc., 146, 1999–2049, https://doi.org/10.1002/qj.3803, 2020. a, b, c
Hersbach, H., Bell, B., Berrisford, P., Biavati, G., Horányi, A., Muñoz Sabater, J., Nicolas, J., Peubey, C., Radu, R., Rozum, I., Schepers, D., Simmons, A., Soci, C., Dee, D., and Thépaut, J.-N.: ERA5 hourly data on single levels from 1940 to present. Copernicus Climate Change Service (C3S) Climate Data Store (CDS) [data set], https://doi.org/10.24381/cds.adbb2d47, 2023. a
Hill, T. C. J., Moffett, B. F., DeMott, P. J., Georgakopoulos, D. G., Stump, W. L., and Franc, G. D.: Measurement of ice nucleation-active bacteria on plants and in precipitation by quantitative PCR, Appl. Environ. Microbiol., 80, 1256–1267, https://doi.org/10.1128/AEM.02967-13, 2014. a
Huuskonen, A., Saltikoff, E., and Holleman, I.: The operational weather radar network in Europe, B. Am. Meteorol. Soc., 95, 897–907, https://doi.org/10.1175/BAMS-D-12-00216.1, 2014. a
Ilotoviz, E., Khain, A., Ryzhkov, A. V., and Snyder, J. C.: Relationship between aerosols, hail microphysics, and ZDR columns, J. Atmos. Sci., 75, 1755–1781, https://doi.org/10.1175/JAS-D-17-0127.1, 2018. a
Inness, A., Ades, M., Agustí-Panareda, A., Barré, J., Benedictow, A., Blechschmidt, A.-M., Dominguez, J. J., Engelen, R., Eskes, H., Flemming, J., Huijnen, V., Jones, L., Kipling, Z., Massart, S., Parrington, M., Peuch, V.-H., Razinger, M., Remy, S., Schulz, M., and Suttie, M.: The CAMS reanalysis of atmospheric composition, Atmos. Chem. Phys., 19, 3515–3556, https://doi.org/10.5194/acp-19-3515-2019, 2019. a, b, c, d
Katrina Virts, R. H.: World Wide Lightning Location Network (WWLLN) Monthly Thunder Hour Data, NASA Global Hydrometeorology Resource Center Distributed Active Archive Center [data set], https://doi.org/10.5067/WWLLN/DATA101, 2025. a
Kaplan, J. O. and Lau, K. H.-K.: World Wide Lightning Location Network (WWLLN) Global Lightning Climatology (WGLC) and time series, 2022 update, Earth Syst. Sci. Data, 14, 5665–5670, https://doi.org/10.5194/essd-14-5665-2022, 2022. a, b
Khain, A., Rosenfeld, D., and Pokrovsky, A.: Aerosol impact on the dynamics and microphysics of deep convective clouds, Q. J. Roy. Meteor. Soc., 131, 2639–2663, https://doi.org/10.1256/qj.04.62, 2005. a, b
Kopp, J., Hering, A., Germann, U., and Martius, O.: Verification of weather-radar-based hail metrics with crowdsourced observations from Switzerland, Atmos. Meas. Tech., 17, 4529–4552, https://doi.org/10.5194/amt-17-4529-2024, 2024. a
Koren, I., Martins, J. V., Remer, L. A., and Afargan, H.: Smoke invigoration versus inhibition of clouds over the Amazon, Science, 321, 946–949, https://doi.org/10.1126/science.1159185, 2008. a, b
Krishna, K. and Narasimha Murty, M.: Genetic K-means algorithm, IEEE T. Syst. Man Cy. B., 29, 433–439, https://doi.org/10.1109/3477.764879, 1999. a
Lee, S. S., Donner, L. J., Phillips, V. T. J., and Ming, Y.: The dependence of aerosol effects on clouds and precipitation on cloud-system organization, shear and stability, J. Geophys. Res. Atmos., 113, https://doi.org/10.1029/2007JD009224, 2008a. a
Lee, S. S., Donner, L. J., Phillips, V. T. J., and Ming, Y.: Examination of aerosol effects on precipitation in deep convective clouds during the 1997 ARM summer experiment, Q. J. Roy. Meteor. Soc., 134, 1201–1220, https://doi.org/10.1002/qj.287, 2008b. a
Loftus, A. M. and Cotton, W. R.: Examination of CCN impacts on hail in a simulated supercell storm with triple-moment hail bulk microphysics, Atmos. Res., 147–148, 183–204, https://doi.org/10.1016/j.atmosres.2014.04.017, 2014. a
Lynn, B., Khain, A., Dudhia, J., Rosenfeld, D., Pokrovsky, A., and Seifert, A.: Spectral (bin) microphysics coupled with a mesoscale model (MM5). Part II: Simulation of a CaPE rain event with a squall line, Mon. Weather Rev., 133, 59–71, https://doi.org/10.1175/MWR-2841.1, 2005. a
Masson, O., Piga, D., Gurriaran, R., and d'Amico, D.: Impact of an exceptional Saharan dust outbreak in France: PM10 and artificial radionuclides concentrations in air and in dust deposit, Atmos. Environ., 44, 2478–2486, https://doi.org/10.1016/j.atmosenv.2010.03.004, 2010. a
Meloni, D., di Sarra, A., Monteleone, F., Pace, G., Piacentino, S., and Sferlazzo, D. M.: Seasonal transport patterns of intense Saharan dust events at the Mediterranean island of Lampedusa, Atmos. Res., 88, 134–148, https://doi.org/10.1016/j.atmosres.2007.10.007, 2008. a
Michaud, A. B., Dore, J. E., Leslie, D., Berry, L. W., Sands, D. C., and Priscu, J. C.: Biological ice nucleation initiates hailstone formation, J. Geophys. Res. Atmos., 119, 12186–12197, https://doi.org/10.1002/2014JD022004, 2014. a
Moulin, C., Lambert, C. E., Dulac, F., and Dayan, U.: Control of atmospheric export of dust from North Africa by the North Atlantic Oscillation, Nature, 387, 691–694, https://doi.org/10.1038/42679, 1997. a
Noppel, H., Blahak, U., Seifert, A., and Beheng, K. D.: Simulations of a hailstorm and the impact of CCN using an advanced two-moment cloud microphysical scheme, Atmos. Res., 96, 286–301, https://doi.org/10.1016/j.atmosres.2009.09.008, 2010. a
Osborne, S. R., Baran, A. J., Johnson, B. T., Haywood, J. M., Hesse, E., and Newman, S.: Short-wave and long-wave radiative properties of Saharan dust aerosol, Q. J. Roy. Meteor. Soc., 137, 1149–1167, https://doi.org/10.1002/qj.771, 2011. a
Pedregosa, F., Varoquaux, G., Gramfort, A., Michel, V., Thirion, B., Grisel, O., Blondel, M., Prettenhofer, P., Weiss, R., Dubourg, V., Vanderplas, J., Passos, A., and Cournapeau, D.: Scikit-learn: machine learning in Python, J. Mach. Learn. Res., 12, 2825–2830, 2011. a
Perlwitz, J., Tegen, I., and Miller, R. L.: Interactive soil dust aerosol model in the GISS GCM: 1. Sensitivity of the soil dust cycle to radiative properties of soil dust aerosols, J. Geophys. Res. Atmos., 106, 18167–18192, https://doi.org/10.1029/2000JD900668, 2001. a
Pirani, F. J., Najafi, M. R., Joe, P., Brimelow, J., McBean, G., Rahimian, M., Stewart, R., and Kovacs, P.: A ten-year statistical radar analysis of an operational hail suppression program in Alberta, Atmos. Res., 295, 107035, https://doi.org/10.1016/j.atmosres.2023.107035, 2023. a
Raupach, T. H., Martius, O., Allen, J. T., Kunz, M., Lasher-Trapp, S., Mohr, S., Rasmussen, K. L., Trapp, R. J., and Zhang, Q.: The effects of climate change on hailstorms, Nat. Rev. Earth Environ., 2, 213–226, https://doi.org/10.1038/s43017-020-00133-9, 2021. a
Rivera, J. A., Otero, F., Naranjo Tamayo, E., and Silva, M.: Sixty years of hail suppression activities in Mendoza, Argentina: uncertainties, gaps in knowledge and future perspectives, Front. Environ. Sci., 8, 45, https://doi.org/10.3389/fenvs.2020.00045, 2020. a
Rodríguez, S. and López-Darias, J.: Extreme Saharan dust events expand northward over the Atlantic and Europe, prompting record-breaking PM10 and PM2.5 episodes, Atmos. Chem. Phys., 24, 12031–12053, https://doi.org/10.5194/acp-24-12031-2024, 2024. a
Rodríguez, S., Querol, X., Alastuey, A., Kallos, G., and Kakaliagou, O.: Saharan dust contributions to PM10 and TSP levels in southern and eastern Spain, Atmos. Environ., 35, 2433–2447, https://doi.org/10.1016/S1352-2310(00)00496-9, 2001. a
Rosenfeld, D., Lohmann, U., Raga, G. B., O'Dowd, C. D., Kulmala, M., Fuzzi, S., Reissell, A., and Andreae, M. O.: Flood or drought: How do aerosols affect precipitation?, Science, 321, 1309–1313, https://doi.org/10.1126/science.1160606, 2008. a, b
Rousseeuw, P. J.: Silhouettes: a graphical aid to the interpretation and validation of cluster analysis, J. Comput. Appl. Math., 20, 53–65, https://doi.org/10.1016/0377-0427(87)90125-7, 1987. a
Schultz, D. M., Young, M. V., and Kirshbaum, D. J.: The Spanish Plume Elevated Mixed Layer: A Review of Its Use and Misuse within the Scientific Literature, Monthly Weather Review, 153, 737–761, https://doi.org/10.1175/MWR-D-24-0139.1, 2025. a
Seifert, A. and Beheng, K. D.: A two-moment cloud microphysics parameterization for mixed-phase clouds. Part 1: Model description, Meteorol. Atmos. Phys., 92, 45–66, https://doi.org/10.1007/s00703-005-0112-4, 2006. a, b, c
Seifert, A., Bachmann, V., Filipitsch, F., Förstner, J., Grams, C. M., Hoshyaripour, G. A., Quinting, J., Rohde, A., Vogel, H., Wagner, A., and Vogel, B.: Aerosol–cloud–radiation interaction during Saharan dust episodes: the dusty cirrus puzzle, Atmos. Chem. Phys., 23, 6409–6430, https://doi.org/10.5194/acp-23-6409-2023, 2023. a
Tao, W.-K., Chen, J.-P., Li, Z., Wang, C., and Zhang, C.: Impact of aerosols on convective clouds and precipitation, Rev. Geophys., 50, RG2001, https://doi.org/10.1029/2011RG000369, 2012. a
Twohy, C. H., Kreidenweis, S. M., Eidhammer, T., Browell, E. V., Heymsfield, A. J., Bansemer, A. R., Anderson, B. E., Chen, G., Ismail, S., DeMott, P. J., and Van Den Heever, S. C.: Saharan dust particles nucleate droplets in eastern Atlantic clouds, Geophys. Res. Lett., 36, https://doi.org/10.1029/2008GL035846, 2009. a
Varga, G.: Changing nature of Saharan dust deposition in the Carpathian Basin (Central Europe): 40 years of identified North African dust events (1979–2018), Environ. Int., 139, 105712, https://doi.org/10.1016/j.envint.2020.105712, 2020. a
Waldvogel, A., Federer, B., and Grimm, P.: Criteria for the detection of hail cells, J. Appl. Meteorol. Clim., 18, 1521–1525, https://doi.org/10.1175/1520-0450(1979)018<1521:CFTDOH>2.0.CO;2, 1979. a
Wilhelm, L., Schwierz, C., Schröer, K., Taszarek, M., and Martius, O.: Reconstructing hail days in Switzerland with statistical models (1959–2022), Nat. Hazards Earth Syst. Sci., 24, 3869–3894, https://doi.org/10.5194/nhess-24-3869-2024, 2024. a, b, c, d, e
Wright, C. J., Thornton, J. A., Jaeglé, L., Cao, Y., Zhu, Y., Liu, J., Jones II, R., Holzworth, R., Rosenfeld, D., Wood, R., Blossey, P., and Kim, D.: Lightning declines over shipping lanes following regulation of fuel sulfur emissions, Atmos. Chem. Phys., 25, 2937–2946, https://doi.org/10.5194/acp-25-2937-2025, 2025. a
Zhu, L., Wang, Y., Chavas, D., Johncox, M., and Yung, Y. L.: Leading role of Saharan dust on tropical cyclone rainfall in the Atlantic Basin, Sci. Adv., 10, eadn6106, https://doi.org/10.1126/sciadv.adn6106, 2024. a, b, c, d, e, f, g, h
Zschenderlein, P. and Wernli, H.: How intense daily precipitation depends on temperature and the occurrence of specific weather systems – an investigation with ERA5 reanalyses in the extratropical Northern Hemisphere, Weather Clim. Dynam., 3, 391–411, https://doi.org/10.5194/wcd-3-391-2022, 2022. a
- Abstract
- Introduction
- Data and methods
- Co-occurrence of dust and hail
- Statistical model
- Summary and conclusions
- Appendix A: Dust climatology
- Appendix B: Optimal dust optical depth
- Appendix C: Storm environment
- Code and data availability
- Author contributions
- Competing interests
- Disclaimer
- Acknowledgements
- Financial support
- Review statement
- References