the Creative Commons Attribution 4.0 License.
the Creative Commons Attribution 4.0 License.
 | 16 Sep 2025
Dust pollution substantially weakens the impact of ammonia emission reduction on particulate nitrate formation
Hanrui Lang
Sheng Zhong
Yongcai Rao
Minfeng Zhou
Jian Qiu
Jingyi Li
Diwen Liu
Florian Couvidat
Olivier Favez
Didier Hauglustaine
Xinlei Ge
Dust emissions significantly influence air quality and contribute to nitrate aerosol pollution by altering aerosol acidity. Understanding how dust interacts with ammonia emission controls is crucial for managing particulate nitrate pollution, especially in urban environments. In this study, we conducted field measurements of aerosol chemical components and gases across three cities in eastern China during the spring of 2023. By combining an aerosol thermodynamic model with machine learning, we assessed the relative contribution of dust to aerosol pH and its impact on nitrate formation. Our results show that changes in ammonia, in both the gas and particle phases, were the main factors affecting aerosol pH, with dust particles contributing to about 7 % of the total pH variation. During dust events, high concentrations of non-volatile ions increased aerosol pH, leading to higher nitrate levels in the particle phase. Machine learning analysis revealed that extreme dust storms caused a significant change in aerosol pH, enhancing nitrate partitioning. Further simulations indicated that while reducing ammonia emissions is effective in lowering nitrate levels under normal conditions, this effect is significantly reduced in dust-affected environments. Dust particles act as a buffer, reducing the sensitivity of nitrate formation to ammonia emission reductions. These findings emphasize the need to consider dust pollution when designing strategies for controlling particulate nitrate levels and highlight the complex interactions between dust and anthropogenic emissions.
- Article
(2423 KB) - Full-text XML
-
Supplement
(2897 KB) - BibTeX
- EndNote


Airborne dust is a major component of atmospheric aerosols, accounting for approximately 75 % of the global aerosol mass load (Mahowald et al., 2006; Zhao et al., 2022; Chen et al., 2023c). Dust exerts multiple impacts on air quality (Jickells et al., 2005; Rosenfeld et al., 2001), climate (Huang et al., 2011), and human health (Zhang et al., 2025; Goudie, 2014). It can be broadly categorized into anthropogenic dust and natural dust based on sources and emission mechanisms (Chen et al., 2018, 2023a). Anthropogenic dust originates from human activities, such as construction, agricultural, and non-exhaust vehicular emissions (Liu et al., 2021). In contrast, natural dust mainly arises from bare surfaces in arid and semi-arid regions (Shao and Dong, 2006), which cover approximately 30 % of the global land area (Soussé Villa et al., 2025; Xin et al., 2023). Beyond anthropogenic influences, over 300 countries worldwide are affected by natural dust pollution (Kurokawa and Ohara, 2020; Notaro et al., 2015). Dust storms originating in arid regions can be transported over thousands of kilometers, significantly impacting downstream air quality and atmospheric chemistry (Tan et al., 2012; Milousis et al., 2025; Sun et al., 2001).
Dust emissions contain nonvolatile cations (NVCs), such as calcium and magnesium ions, which are alkaline substances that can neutralize acidic aerosol components, such as sulfates, thereby increasing aerosol pH (Wu et al., 2013; Ding et al., 2019). Dust particles also engage in heterogeneous reactions with gaseous nitric acid, buffering acidic species and modulating pH dynamics (Zhi et al., 2025). Aerosol pH is a critical factor in atmospheric chemical processes, influencing gas–particle partitioning of inorganic aerosols (Guo et al., 2018), secondary organic aerosol (SOA) formation (Xu et al., 2015; Zhang et al., 2017; Nguyen et al., 2014), and metal-catalyzed oxidation reactions (Fang et al., 2017). Regional variations in aerosol pH alter the chemical characteristics of atmospheric pollution, affecting pollutant lifetimes and deposition rates, which in turn have profound implications for ecosystems and public health (Guo et al., 2016). Despite the incorporation of aerosol pH modules in some atmospheric chemistry models, inaccuracies in dust emission inventories can lead to biases in estimated aerosol pH, thereby introducing systematic errors in simulating associated chemical processes, such as nitrate formation.
Nitrate has emerged as a dominant component of fine particulate matter (PM2.5) worldwide (e.g., China, Europe, the United States, and India), particularly as sulfate aerosol concentrations decline due to sustained SO2 emission reductions (Weber et al., 2016; Geng et al., 2017; Zhai et al., 2021; Hauglustaine et al., 2014; Beaudor et al., 2025). The reaction between gaseous nitric acid (HNO3) and ammonia (NH3) represents one of the primary pathways for the formation of fine-mode nitrate (Stelson and Seinfeld, 1982; Metzger et al., 2002). Nitrate formation plays a critical role in atmospheric chemistry and the global nitrogen cycle, including reactive nitrogen deposition (Song and Carmichael, 2001). The gas–particle partitioning of HNO3 and nitrate formation is strongly influenced by aerosol pH (Guo et al., 2018; Shi et al., 2019). When total ammonia (gaseous and particulate) or NVCs are insufficient to fully neutralize aerosol sulfate, HNO3 does not condense on aerosol due to low pH (Nenes et al., 2020; Guo et al., 2017b; Vasilakos et al., 2018; Ding et al., 2019). However, this conceptual framework may oversimplify the influence of aerosol acidity, as it fails to fully consider the substantial volatility differences between deliquescent aerosols containing sulfates or NVCs and those dominated by ammonium or nitrate, both of which are highly sensitive to aerosol pH (Nenes et al., 2020, 2021). In dust-polluted environments, however, the abundance of alkaline particles, such as calcium ions, can alter nitrate formation pathways (Seinfeld et al., 1998; Hrdina et al., 2021; Li et al., 2023). Quantitative insights into how urban dust influences nitrate formation and its regulation nevertheless remain limited.
East Asia, home to some of the world's major dust source regions, significantly contributes to global atmospheric dust pollution. Under the influence of Mongolian cyclones, dust particles originating from Mongolia are transported long distances, affecting air quality and atmospheric processes across East Asia (Fu et al., 2014; Sun et al., 2001; Wang et al., 2021; Xu et al., 2020). The Yangtze River Delta (YRD) is a densely urbanized region in eastern China, where air quality is influenced by both natural and local anthropogenic dust sources. This region provides an ideal atmospheric experiment to investigate the impact of dust pollution on urban aerosol acidity and nitrate chemistry. Under these contexts, this study examines changes in aerosol pH and nitrate gas–particle partitioning (defined as the gas–particle partitioning of HNO3 combined with its acid dissociation) under the influence of both anthropogenic and natural dust pollution in spring 2023, focusing on three representative cities (Xuzhou, Zhenjiang, and Suzhou) in the YRD. The contributions of chemical and meteorological components to aerosol pH and the effects of dust storms on are quantified. By integrating statistical analysis approaches, we further quantify the contribution of different factors to aerosol pH and . Sensitivity analyses are conducted to evaluate the effects of TNHx (), TNO3 (), and emission controls on nitrate partitioning across varying dust pollution levels, providing a scientific basis for formulating nitrate pollution control strategies during dust events.
2.1 Sampling site and instruments
This study selected three cities in the YRD region, China, that represent a gradient of dust transport effects: Xuzhou (32.18° N, 119.48° E), Zhenjiang (32.16° N, 119.49° E), and Suzhou (31.29° N, 120.61° E). These cities are distributed along the north-to-south dust transport pathway, enabling a systematic investigation of the impacts of dust transport, including gradient variations in particle chemical properties, aerosol acidity (pH), and gas–particle partitioning. The sampling sites comprehensively reflect the gradient effects of dust across different regions. These sampling sites are representative of typical urban environments and reflect the general atmospheric conditions within the region.
Water-soluble inorganic ions (e.g., , Na+, K+, Ca2+, Mg2+, , , Cl−) in PM2.5 and gaseous components (NH3, HNO3, HCl) were continuously monitored using a Monitor for AeRosols and Gases in ambient Air (MARGA) system (Trebs et al., 2004; Rumsey et al., 2014). The system exhibited high correlation between cation and anion measurements (Fig. S1 in the Supplement). Throughout the observation period, ambient air samples were drawn into the system, where aerosols and gaseous pollutants were separated. Water-soluble gases were removed using a wet rotating denuder, while aerosol particles with an aerodynamic diameter smaller than approximately 2.5 µm were collected using a steam jet aerosol collector (Rumsey et al., 2014; Trebs et al., 2004). Aerosol particles collected using a wet sampler were dissolved in water to form sample liquid and then analyzed via ion chromatography. For gaseous pollutants, air samples passed through a membrane filter to remove particles before entering a scrubbing tower, where gas-phase components were dissolved in water to form sample liquid for ion chromatographic analysis (Rumsey et al., 2014). The MARGA system is equipped with automatic calibration and cleaning functions, ensuring stability and accuracy during long-term operation. The entire process is controlled by dedicated software, enabling simultaneous monitoring of multiple components and real-time data output (Schaap et al., 2004).
Meteorological parameter data (air temperature and relative humidity) were obtained from corresponding observation stations, while additional meteorological parameters were sourced from the European Centre for Medium-Range Weather Forecasts (ECMWF) ERA5 reanalysis dataset (https://cds.climate.copernicus.eu/, last access: 21 November 2023). Regional PM10 data were retrieved from the China National Environmental Monitoring Centre (https://air.cnemc.cn:18007/, last access: 21 November 2023).
2.2 Aerosol pH estimation
Aerosol pH is a particle property that significantly influences aerosol formation, yet it is challenging to measure directly. Traditional methods, such as ion balance and molar ratio approaches, often fail to provide accurate evaluations of aerosol pH (Guo et al., 2016; Weber et al., 2016). Currently, the most widely used approaches include the E-AIM and ISORROPIA-II thermodynamic model (Fountoukis and Nenes, 2007), while recent studies have also begun to explore alternative methods for direct pH measurement (Li et al., 2025). In this study, we employed the ISORROPIA-II thermodynamic model to estimate aerosol pH (see Eq. 1) as well as the gas–particle partitioning of water-soluble ions, semi-volatile compounds, and water content. At low RH, aerosols are unlikely to be in a completely liquid state, and secondary organic aerosols (SOA) may affect the distribution of semi-volatile compounds due to reduced diffusion within the particles, thus influencing the predicted pH values. At high RH levels, such as RH>95 %, aerosols may deliquesce, and the exponential increase in water activity (Wi) can introduce significant uncertainty into the pH values (Guo et al., 2017b; Malm and Day, 2001). To improve the model's accuracy, we both applied the forward mode for metastable aerosols and excluded data with relative humidity (RH) below 35 % or above 95 % (Nah et al., 2018; Guo et al., 2015). The equation used to calculate aerosol pH in ISORROPIA-II is as follows (Liu et al., 2022):
In Eq. (1), represents the activity coefficient of hydrogen ions, which is generally set to 1 (Liu et al., 2022). denotes the hydrogen ion concentration in the aerosol aqueous phase, expressed in µg m−3. Wi refers to the water content of the aerosol phase output by ISORROPIA-II (in µg m−3). By incorporating these parameters, the ISORROPIA-II model provides a reliable framework for estimating aerosol pH, allowing for accurate analysis of its variation and impact under different environmental and pollution scenarios, including those influenced by dust events.
2.3 The gas–particle partitioning of nitrate
Nitrate, owing to its volatility, exists in the atmosphere in two primary forms. In the particulate phase, it predominantly appears as semi-volatile ammonium nitrate. However, where ammonia and NVCs fail to fully neutralize aerosol sulfate, the formation of semi-volatile ammonium nitrate is inhibited. Under such conditions, nitrate tends to remain in the gaseous phase as HNO3, which can subsequently transform into more stable coarse-mode salts, such as Ca(NO3)2, over time (Vasilakos et al., 2018; Hrdina et al., 2021). Gas–particle partitioning of nitrate [)] defined as the ratio between particle-phase nitrate over TNO3 serves as a key indicator of nitrate distribution between its gaseous and particulate phases. Changes in aerosol pH, influenced by varying meteorological conditions, significantly affect . This study employs Eq. (2) (Guo et al., 2018; Nenes et al., 2020) to calculate theoretical values of for each observational dataset. The results enable a detailed analysis of how variations in pH across different ranges influence the gas–particle partitioning of nitrate.
In the equation, () represents the product of Henry's law constant and the acid dissociation constant for HNO3. R is the ideal gas constant (), and T is the temperature in kelvin (K). The temperature dependence for and Kn1 can be found in Clegg et al. (1998). pH is calculated using Eq. (1). The factor is a unit conversion factor used to convert from atm and µg to SI units. and are the activity coefficients for and H+, respectively. Activity coefficients predicted by ISORROPIA-II are and (Guo et al., 2018, 2017a; Nah et al., 2018). In the standard S curve, pH varies within a specific range, and this relationship is influenced by the temperature dependence of Henry's law constant and the acid dissociation constant. This model allows for a more accurate estimation of nitrate aerosol behavior under varying environmental conditions. More detailed information about inputs and outputs for the ISORROPIA-II model can be found in Tables S1–S3 in the Supplement.
2.4 Multi-site concentration-weighted trajectory
The concentration-weighted trajectory (CWT) analysis is widely used to assess the potential origins and transport pathways of air pollutants observed at receptor sites. By integrating trajectory analysis, this approach provides insights into pollutant sources and their atmospheric transport dynamics. In this study, we employed the CWT model, coupled with backward trajectories and multi-site air quality monitoring data, to investigate the potential source regions and long-range transport of the spring 2023 dust storm event observed in Xuzhou, Zhenjiang, and Suzhou. When combined with data from multiple monitoring sites, the CWT model demonstrates enhanced robustness and reliability (Boichu et al., 2019). Briefly, multi-site CWT analysis integrates pollutant concentration data from several monitoring stations with the corresponding backward trajectories to estimate the likely origins of the observed pollutants. Air pollutant concentrations are spatially allocated to grid cells traversed by air masses, weighted by the residence time within each grid cell. Compared to single-site CWT analysis, the multi-site approach offers broader spatial coverage, minimizes site-specific biases, and increases the dataset size, thereby improving the accuracy and spatial resolution of source apportionment, particularly for complex transport patterns.
In this study, 48 h backward trajectories at 50 m above ground level were computed using meteorological data from the Global Data Assimilation System (GDAS). The CWT analysis was conducted using the Zefir toolkit implemented in Igor Pro (Petit et al., 2017). This methodology provided a comprehensive assessment of dust transport and source attribution, facilitating a deeper understanding of dust storm dynamics in the region.
In Eq. (3), CWTij represents the weighted concentration in the grid at the i row and j column, Cl is the pollutant concentration corresponding to the l trajectory, and τij,l is the residence time of the trajectory in the (i,j) grid. n denotes the total number of all trajectories.
2.5 Machine learning model
Aerosol pH and exhibit nonlinear responses to multiple influencing factors. In this study, we employed a machine learning approach to investigate the effects of extreme dust storm conditions on aerosol pH and . Specifically, we used the random forest (RF) algorithm to construct regression models tailored to aerosol pH and for each city under investigation. The dataset for the RF regression models was divided into a training set (80 %) and a test set (20 %). The training set was utilized to build the models, while the test set was used to validate their performance. The input predictive features for both aerosol pH and models included the water-soluble inorganic chemical composition of aerosols (Na+, , , , Cl−, Ca2+, K+, Mg2+), gaseous species (NH3 and HNO3), and meteorological parameters (T and RH). To evaluate the model performance, we applied 5-fold cross-validation for parameter tuning. Model performance was evaluated using seven statistical metrics: mean absolute error (MAE), root mean squared error (RMSE), normalized mean squared error (NMSE), mean bias (MB), normalized mean bias (NMB), index of agreement (IOA), and the correlation coefficient (R). Detailed definitions and calculations for these metrics are provided in Sect. S1 in the Supplement. This machine-learning-based approach enabled us to quantify the complex, nonlinear relationships between aerosol properties, chemical compositions, and meteorological conditions, offering deeper insights into the drivers of aerosol pH and under varying dust pollution scenarios.
In addition, SHapley Additive exPlanations (SHAP), a method derived from the Shapley value concept in game theory, provides an interpretable framework to explain the predictions of complex machine learning models. SHAP quantifies the contribution of each input variable to individual predictions, making it a powerful tool for understanding model behavior (Duan et al., 2024; Lundberg and Lee, 2017). In this study, SHAP values were employed to assess the influence of various factors on aerosol pH and under dust storm and local dust conditions. A positive SHAP value for a given factor indicates that it contributes positively to the prediction, whereas a negative SHAP value implies a suppressive or inhibitory impact. This analysis allowed us to disentangle the relative contributions of chemical composition, meteorological conditions, and other variables to the variations in aerosol properties under different dust scenarios.
3.1 Observational evidence of anthropogenic and natural dust pollution
Dust emissions can be classified into anthropogenic and natural sources, with Ca2+ and Mg2+ commonly used as tracers. Figure 1 shows the relationship between the concentrations of Ca2+ and Mg2+ during the observation period from March to April 2023 across the three cities (Xuzhou, Zhenjiang, and Suzhou). It is evident that the concentrations of Ca2+ and Mg2+ exhibit two distinctly different linear slopes, indicating that the different dust origins during this period were influenced by both long-range transport dust storms and local dust emissions. In particular, during the period from 11–13 April, a severe dust storm was transmitted from northern regions, first impacting Hohhot, and then southward to the southern cities of the YRD region. As shown in Fig. 2a, the PM10 concentrations in the cities along the transport path exhibited a distinct gradient, with peak values reaching approximately 1702 µg m−3 in Hohhot, 1614 µg m−3 in Xuzhou, 925 µg m−3 in Zhenjiang, and 576 µg m−3 in Suzhou, respectively. In Xuzhou, the average concentration of Ca2+ increased from 0.47 ± 0.36 µg m−3 during the local dust period to 2.00 ± 1.66 µg m−3 during the dust storm period, marking a 4-fold increase. Similarly, the average Ca2+ concentration rose from 0.30 ± 0.23 µg m−3 to 1.69 ± 1.41 µg m−3 in Zhenjiang, while the concentration increased from 0.35 ± 0.26 µg m−3 to 0.92 ± 0.52 µg m−3 in Suzhou.
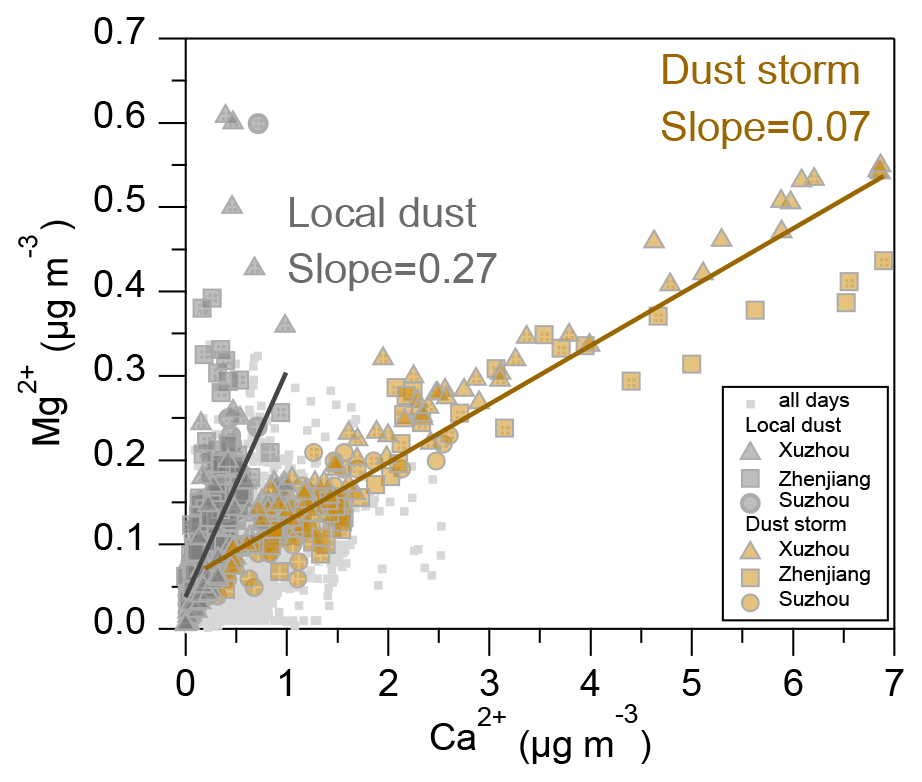
Figure 1Relationship between Ca2+ and Mg2+ concentrations in PM2.5 in Xuzhou (triangle), Zhenjiang (square), and Suzhou (circle). Dust types are distinguished based on the slope of the Ca2+ to Mg2+ concentration ratio, with local dust (gray) and dust storm (brown) periods indicated. Light-gray dots represent the concentrations of Ca2+ and Mg2+ observed in the three cities during March–April 2023.
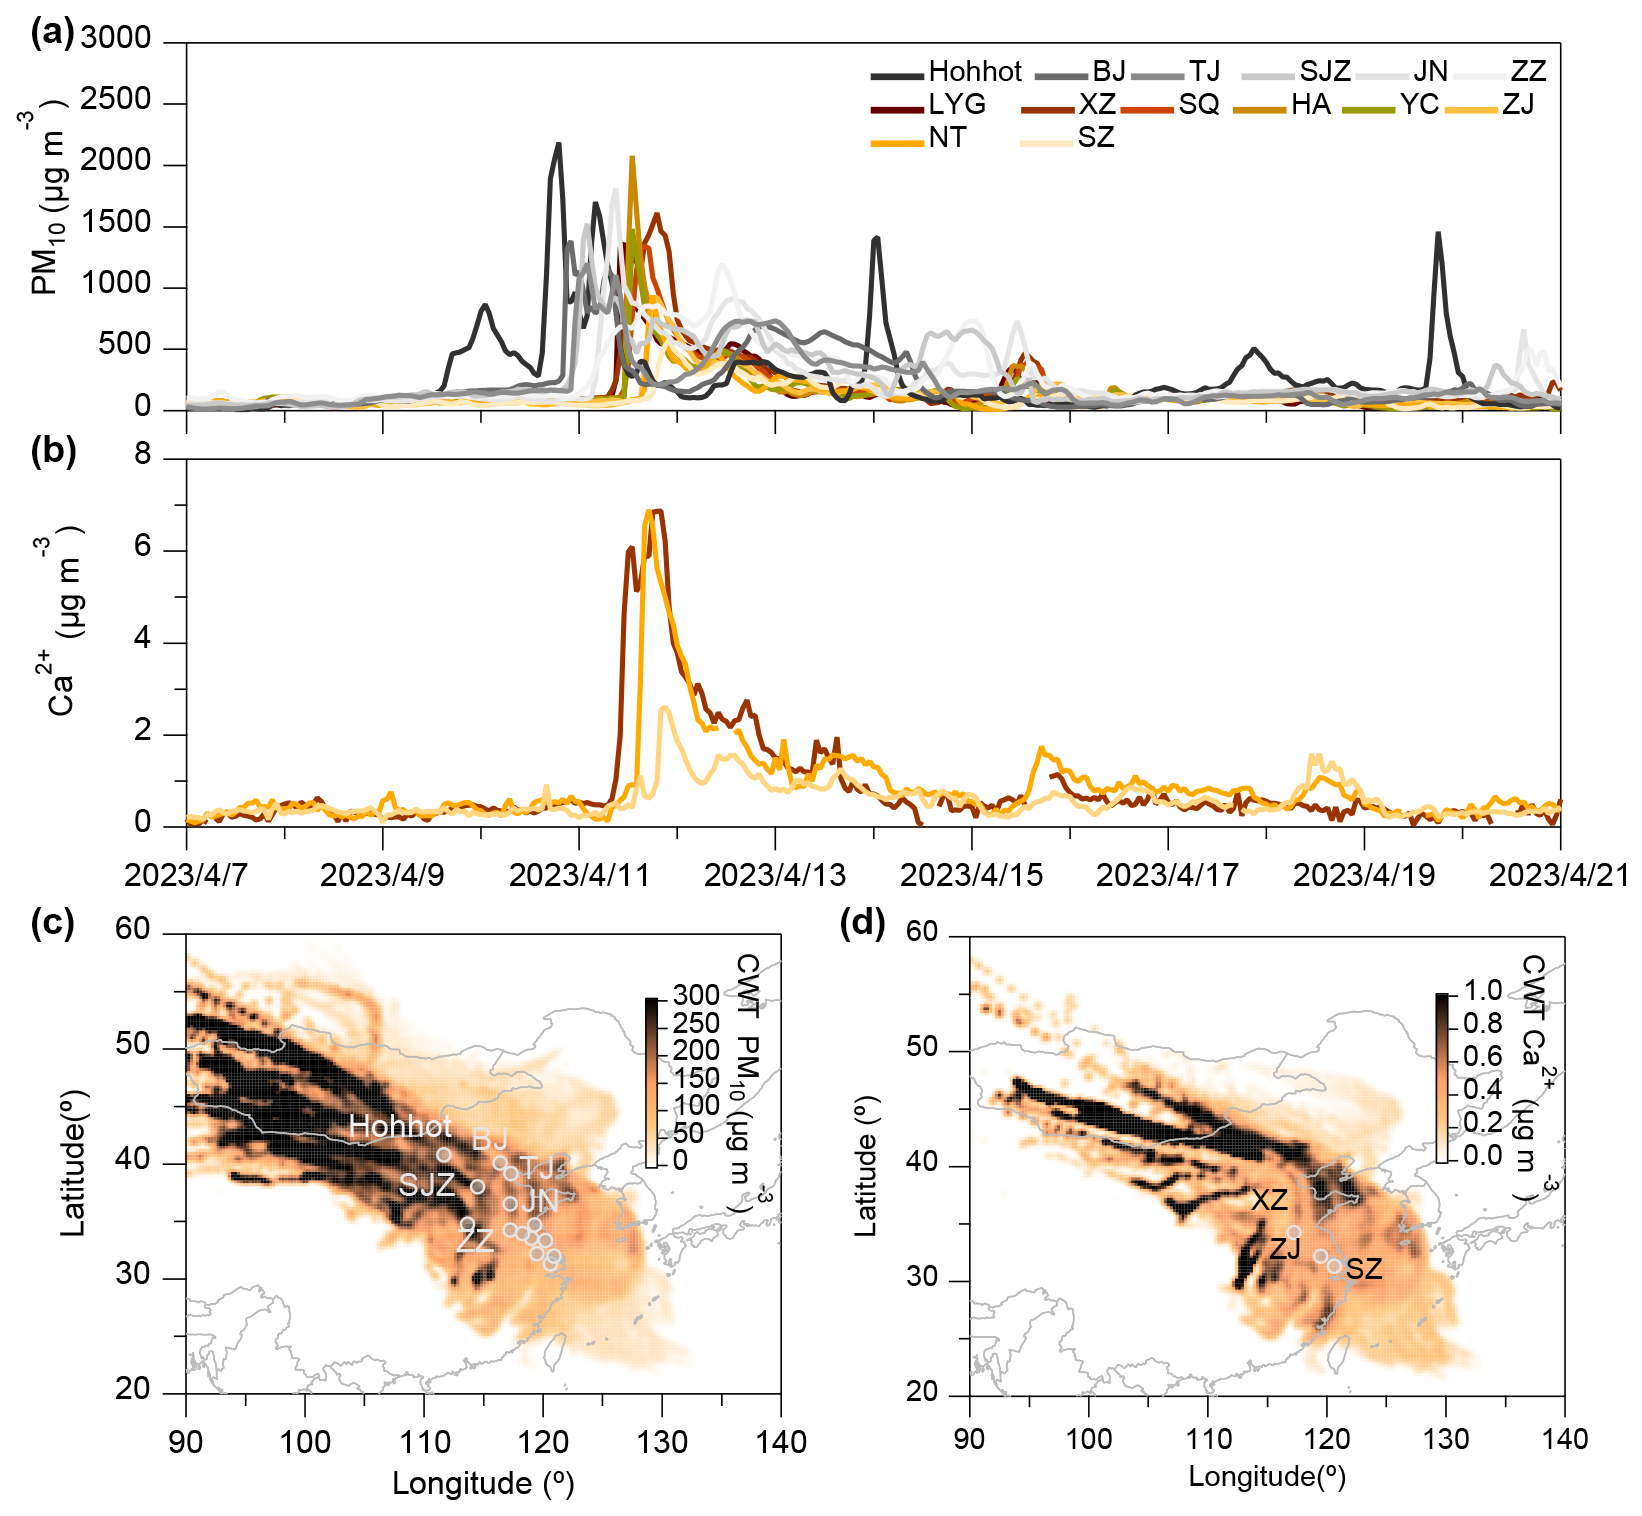
Figure 2Time series of PM10 and Ca2+ concentrations and their concentration-weighted trajectories for cities along the dust transport path. (a) Time series of PM10 in 14 cities along the BTH region and (b) time series of Ca2+ concentrations in Xuzhou, Zhenjiang, and Suzhou and the correlation of Ca2+ and PM10. (c) 48 h concentration-weighted spatial distribution of PM10 concentrations in 14 cities from 5 to 20 April and (d) 48 h concentration-weighted spatial distribution of Ca2+ concentrations in Xuzhou, Zhenjiang, and Suzhou (units: µg m−3).
Figure 2a and b illustrate the temporal evolution of PM10 and Ca2+ concentrations during the dust storm, showing an initial spike in Hohhot, followed by a gradual increase across the Beijing–Tianjin–Hebei (BTH) region, and eventual dispersion into several cities in Jiangsu Province. This progression is consistent with the concentration-weighted trajectory patterns shown in Fig. 2c and d, which delineate the transport pathways of the dust storm. The maps highlight significant contributions from Mongolia – the dust storm's origin – to regions including Hohhot, Beijing, Tianjin, Shijiazhuang, Jinan, Zhengzhou, and Jiangsu. This finding corroborates the results of Chen et al. (2023b), who attributed the dust storm to a strong, cold high-pressure system and cold front that transported substantial quantities of coarse dust aerosols southward into the YRD region. Southward-moving cold fronts play a critical role in the diffusion and transport of atmospheric pollutants. In arid and semi-arid regions, these storms mobilize large amounts of crustal elements, such as Ca2+, with high winds lifting dust from surface sources, including city streets, construction sites, and other exposed land areas (Ding et al., 2019).
Figure 3 presents the relative contributions of water-soluble inorganic species (WSIS) in PM2.5 during local dust and dust storm periods in Xuzhou, Zhenjiang, and Suzhou. Across all three cities, the combined contribution of sulfate, nitrate, and ammonium consistently accounted for over 80 % of WSIS, highlighting the important role of secondary inorganic aerosols in fine particulate pollution. Among these, nitrate was the most abundant species during both periods, particularly during local dust events, with an average contribution ranging from 49.3 % to 52.6 %. However, during dust storms, its relative contribution declined to 34.0 %–40.8 %. In contrast, the relative contribution of sulfate increased, with increments of 5.2 %, 5.0 %, and 6.7 % observed in Xuzhou, Zhenjiang, and Suzhou, respectively. Similar trends in the relative increase of sulfate and reduction of nitrate during dust events have also been widely reported in previous studies (e.g., Song et al., 2023; Zhu et al., 2022). This shift in WSIS composition was likely influenced by both meteorological conditions and chemical processes associated with dust. To evaluate this hypothesis, we constructed separate random forest regression models for nitrate and sulfate concentrations, using meteorological parameters (Table S4 in the Supplement) as input predictors. SHAP analysis was then applied to quantify the aggregated contributions of dispersion-related variables, such as winds and planetary boundary layer height. As shown in Fig. S2 in the Supplement, nitrate exhibited a stronger response to dispersion and dilution effects than sulfate, indicating its higher sensitivity to meteorological variability during the dust storm. In addition to meteorological effects, heterogeneous reactions involving mineral dust also likely influence the observed variations in WSIS. For instance, Ca(NO3)2 and Mg(NO3)2 coatings could tend to form preferentially on aged mineral particles rich in calcite and dolomite. Previous studies have shown that the abundance of such nitrate-coated particles increases with dust transport distance due to their relatively low deliquescence relative humidities (DRH>11 %), which facilitate nitric acid uptake under humid conditions (Li and Shao, 2009; Tobo et al., 2010; Laskin et al., 2005). Given the widespread presence of calcite and dolomite in Asian dust, long-range-transported particles during dust storms provide abundant alkaline surfaces for heterogeneous nitrate formation. Consistent with this, our results showed an average increase of approximately 10 % in the relative contributions of Ca2+ and Mg2+ during the dust storm period across all three cities compared to local dust events. This enhancement in alkaline mineral content suggests more effective neutralization of acidic species such as HNO3 and H2SO4, thereby promoting the formation of particulate nitrates and sulfates during regional dust transport. While secondary chemical formation was possible, meteorological dispersion and dilution appear to be the dominant factors leading to the observed concentration decreases.
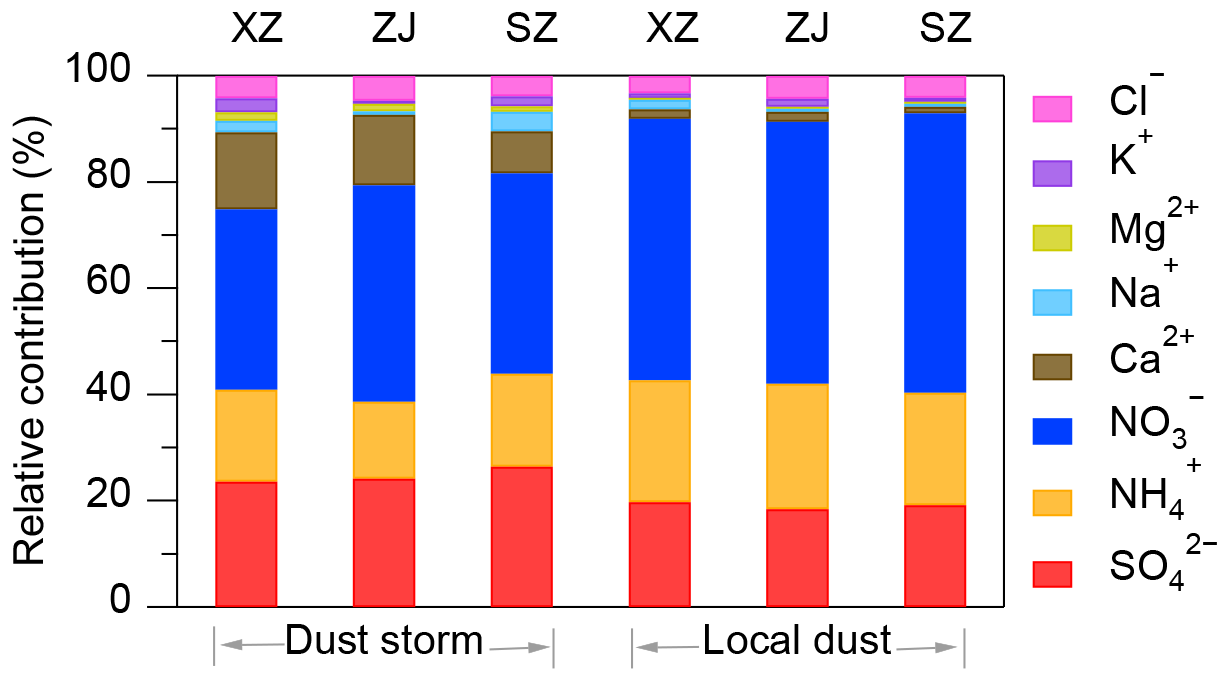
Figure 3Relative contributions of water-soluble inorganics (, , , Ca2+, Na+, Mg2+, K+, and Cl−) within the PM2.5 fraction in Xuzhou, Zhenjiang, and Suzhou during dust storm and local dust pollution periods, respectively.
3.2 Driving factors of aerosol pH
Aerosol pH plays a crucial role in influencing aerosol formation and chemical composition. By regulating the partitioning of semi-volatile compounds between the gas and particle phases, aerosol pH directly affects the distribution of particulate matter in the atmosphere (Guo et al., 2017a). To examine the factors influencing aerosol pH, we utilized the ISORROPIA-II thermodynamic model and sensitivity analysis to quantify the relative contributions of chemical and meteorological factors, such as T and RH, in Xuzhou, Zhenjiang, and Suzhou. The correlation between simulated and observed concentrations of NH3 and particulate is presented in Fig. 4. Across all three cities, the simulated values exhibit strong agreement with measurements (R2=0.94–0.99). Additionally, Fig. S3 in the Supplement shows high correlations (R2=0.90–0.97) for particle-phase ammonium and chloride between ISORROPIA-II predictions and observations, confirming the robust performance of the thermodynamic model in this study.
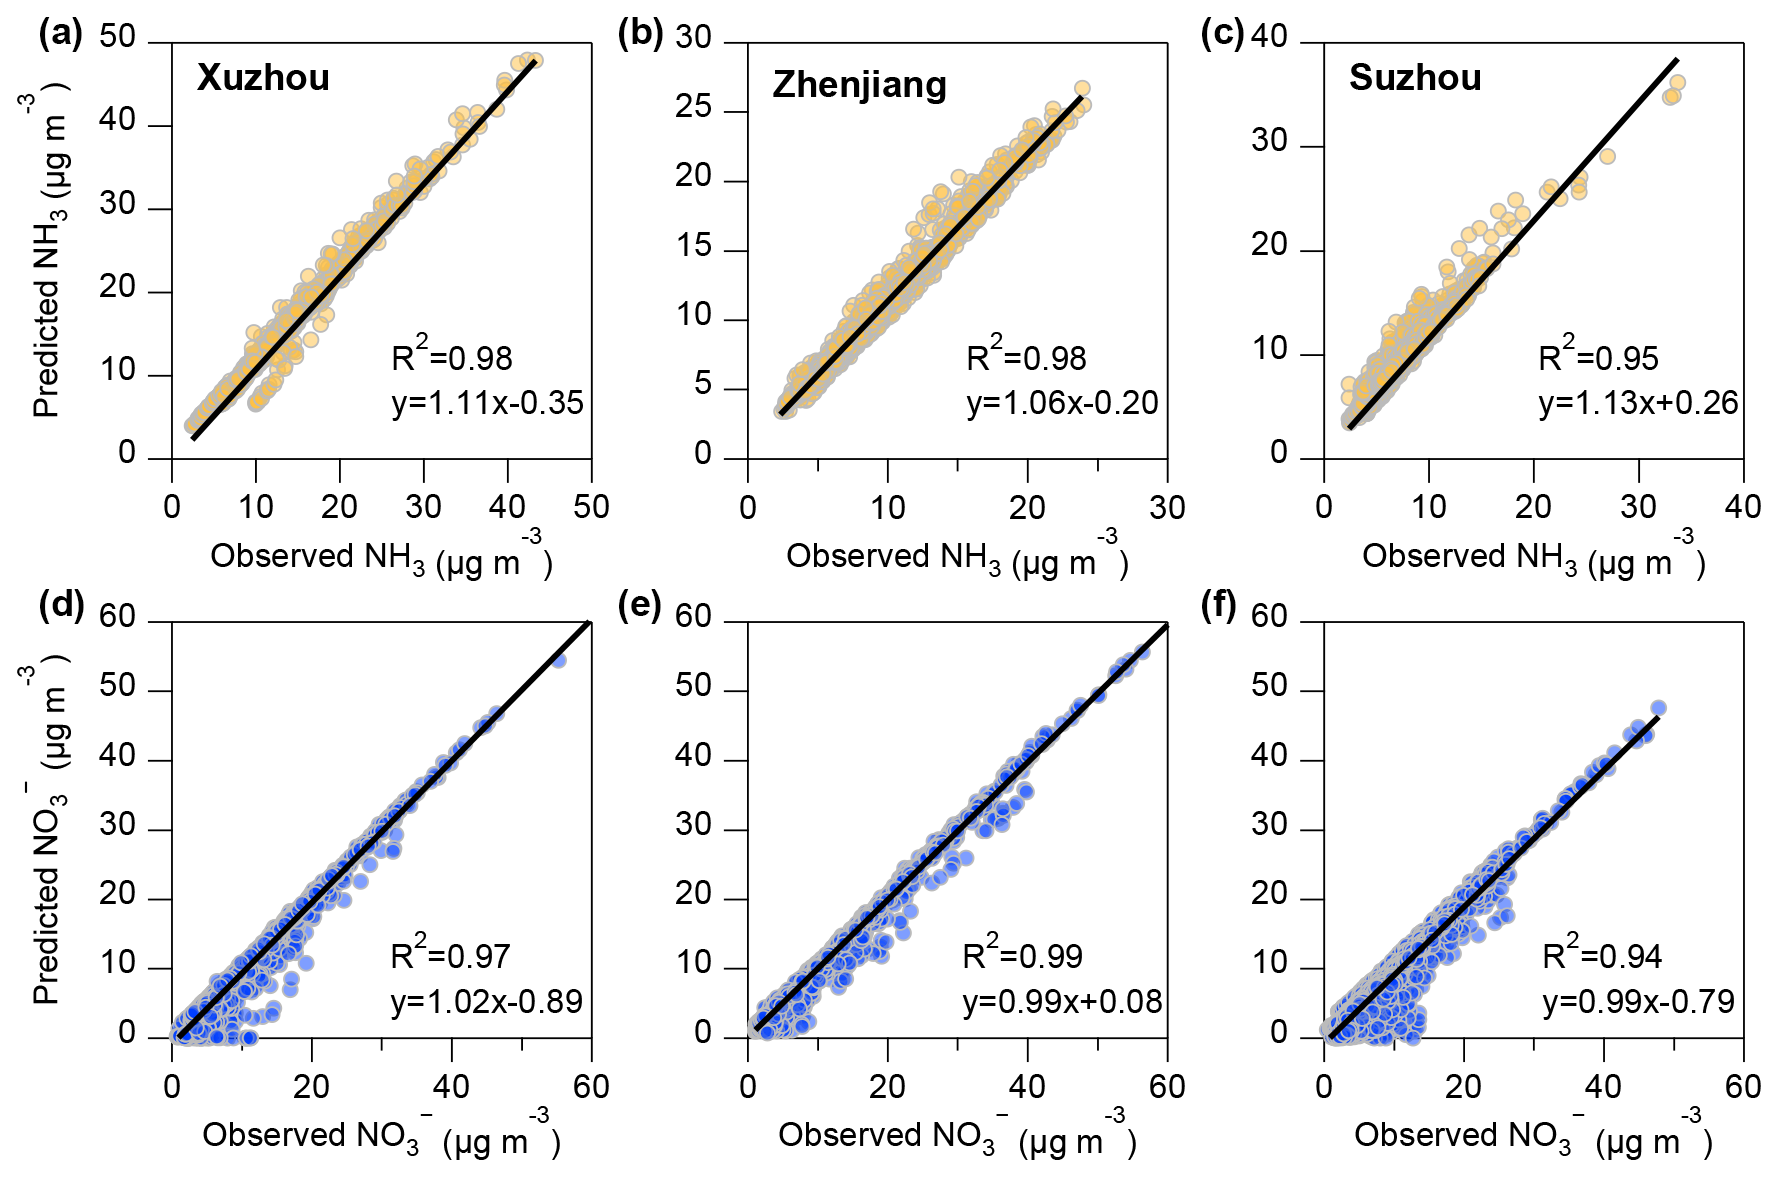
Figure 4Correlation between ISORROPIA-II simulated and observed values of NH3 and in three cities. Panels (a)–(c) show the correlation between NH3 predictions and observations, while panels (d)–(f) show the correlation between predictions and observations. The first column represents Xuzhou, the second column represents Zhenjiang, and the third column represents Suzhou.
To assess the impact of individual factors (TNO3, TNHx, Ca2+, , T, and RH) on aerosol pH, we estimated their relative contributions using methods like those proposed by Zheng et al. (2020) and Zheng et al. (2022). First, we calculated the monthly average values for each factor in March and April, referred to as and , respectively. Here, pHi represents the influence of factor i on pH, with the numbers in parentheses indicating the respective months. For example, for the analysis of a specific factor, we used the March average value of that factor while holding the other variables at their average levels for April. This yielded the aerosol pH value, denoted as . Similarly, when using the April average value of the factor and maintaining the other variables at their March average levels, we recorded the resulting pH as . The relative change in pH, denoted as and was calculated as the mean difference between and , and between and , respectively (see Eqs. 4 and 5). Finally, the overall impact of each factor on aerosol pH could be estimated (see Eq. 6).
The impact of each factor could be positive or negative, which is detailed in Fig. S4 in the Supplement. As shown in Fig. 5, atmospheric total ammonia emerged as the most significant driver of aerosol pH changes in all three cities, contributing 42 %, 57 %, and 43 % of the observed pH in Xuzhou, Zhenjiang, and Suzhou, respectively. Total ammonia led to increases of 0.6, 1.3, and 0.5 units in these cities during spring 2023. For Zhenjiang, T and Ca2+ were the next most influential factors, contributing 0.6 and 0.15 units to ΔpHT and , respectively. Sulfate exhibited the smallest influence on aerosol pH, where a concentration change of 0.3 µg m−3 corresponded to a of approximately 0.05 units. These results align with the findings of Weber et al. (2016), which suggest that aerosol pH is less sensitive to changes in sulfate concentrations compared to ammonia levels.
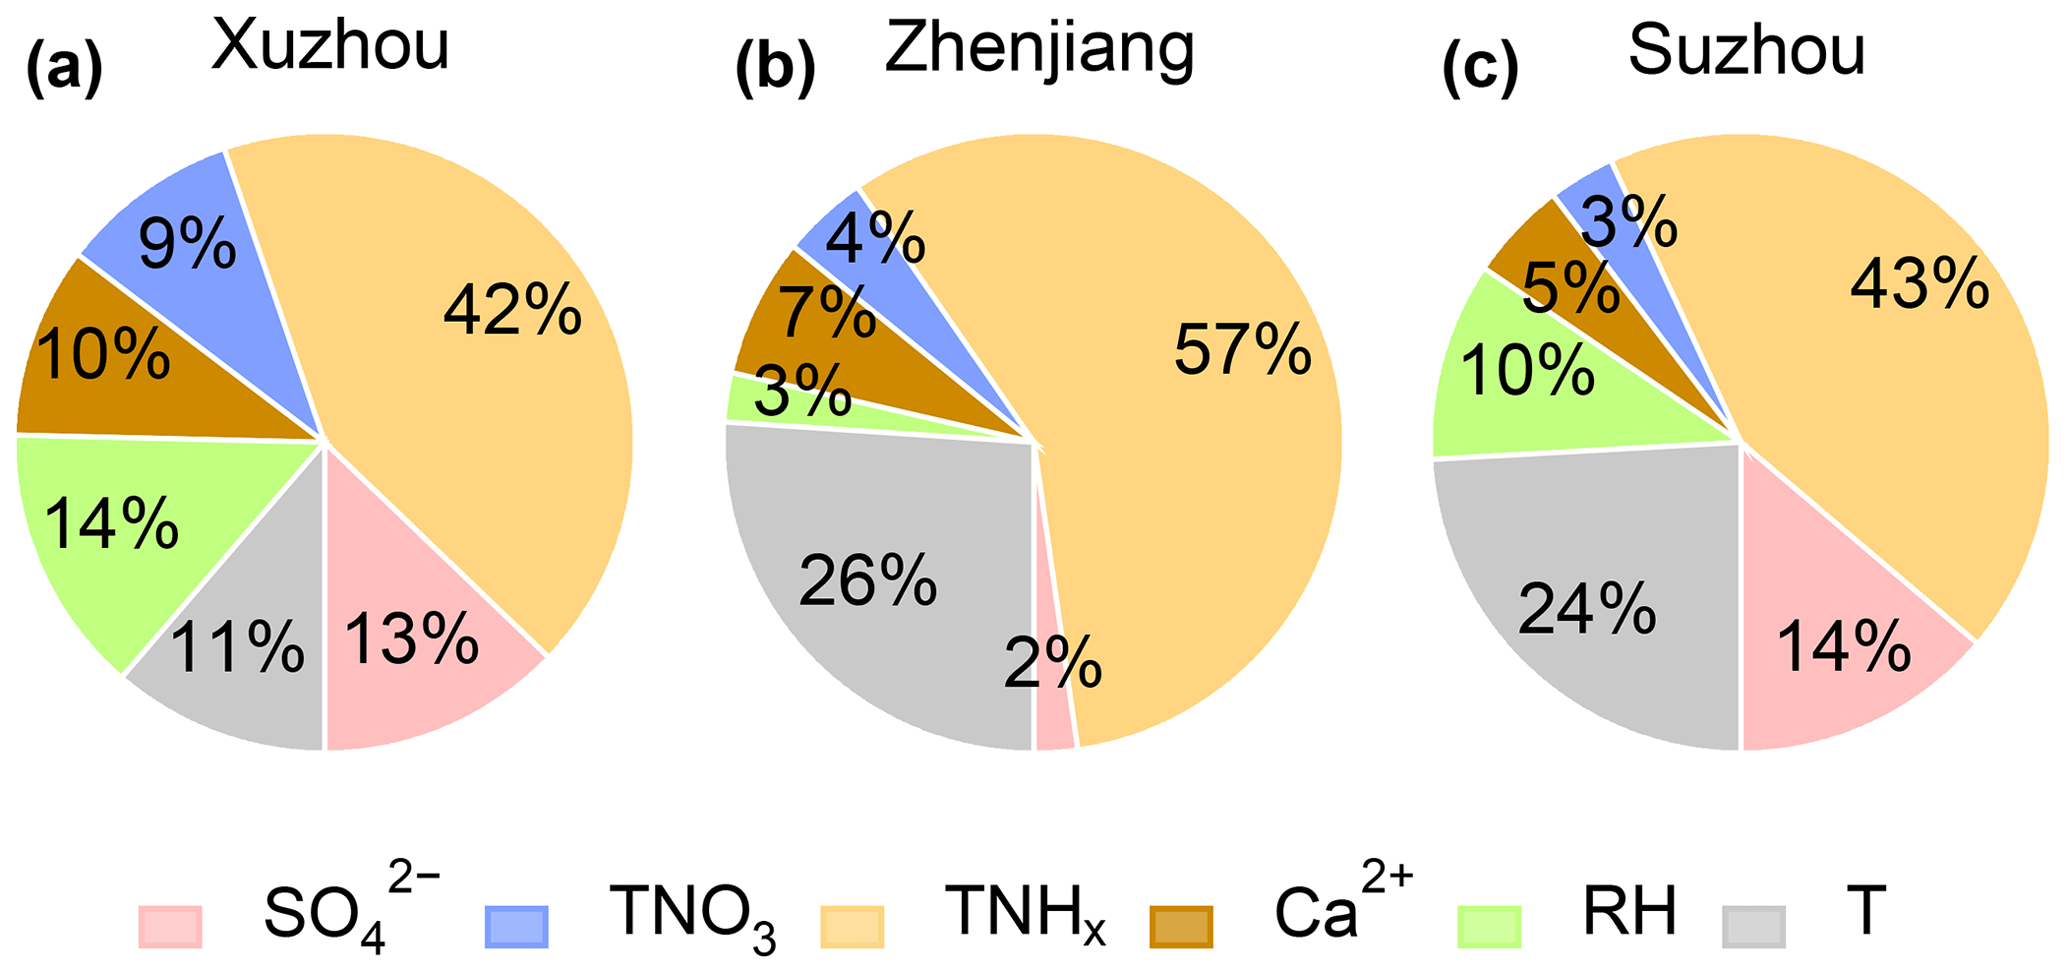
Figure 5Relative contribution of different factors, including , , Ca2+, , RH, and T, to aerosol pH during the entire observation period in (a) Xuzhou, (b) Zhenjiang, and (c) Suzhou.
To further explore the response of aerosol pH to variations in and NH3 concentrations under different dust conditions (non-dust, local dust, and extremely dust storm), we conducted sensitivity simulations constrained by observations from Zhenjiang as a case study. As illustrated in Fig. 6a–c, we extended the NH3 and concentration ranges beyond their observed values to encompass potential variations across the YRD region. The input concentrations of Na+, , total chloride (), K+, and Mg2+ were fixed at the average levels observed in Zhenjiang during the study period (see Table S2). Simulations were carried out under three distinct Ca2+ concentration scenarios: (1) non-dust ( µg m−3), (2) local dust ( µg m−3), and (3) extremely dust storm ( µg m−3). In these simulations, total ammonia () and total nitrate () concentrations were independently changed and input into the ISORROPIA-II model. Under non-dust conditions ( µg m−3), the model predicted lower aerosol pH values. As shown in Fig. 6a and b, a 5–10-fold increase in NH3 concentration led to a pH increase of approximately 1 unit, whereas aerosol pH demonstrated limited sensitivity to concentration changes. This finding is consistent with previous studies (Zheng et al., 2022; Weber et al., 2016; Xie et al., 2020). However, under high Ca2+ concentration conditions, such as during extremely dust storm events, the influence of NH3 on aerosol pH was notably mitigated (Fig. 6c). At relatively low concentrations (i.e., below approximately 8 µg m−3, as indicated in Fig. 6c), aerosol pH exhibited diminished sensitivity to levels, while showing greater responsiveness to variations in NH3. This behavior is modulated by the buffering capacity of Ca2+, which preferentially reacts with before interacting with NH3 (Vasilakos et al., 2018), thereby limiting sulfate's ability to regulate aerosol acidity. These findings highlight that Ca2+, a prominent component of mineral dust, plays a critical buffering role in mitigating the influence of NH3 and on aerosol acidity under dust-influenced atmospheric environments.
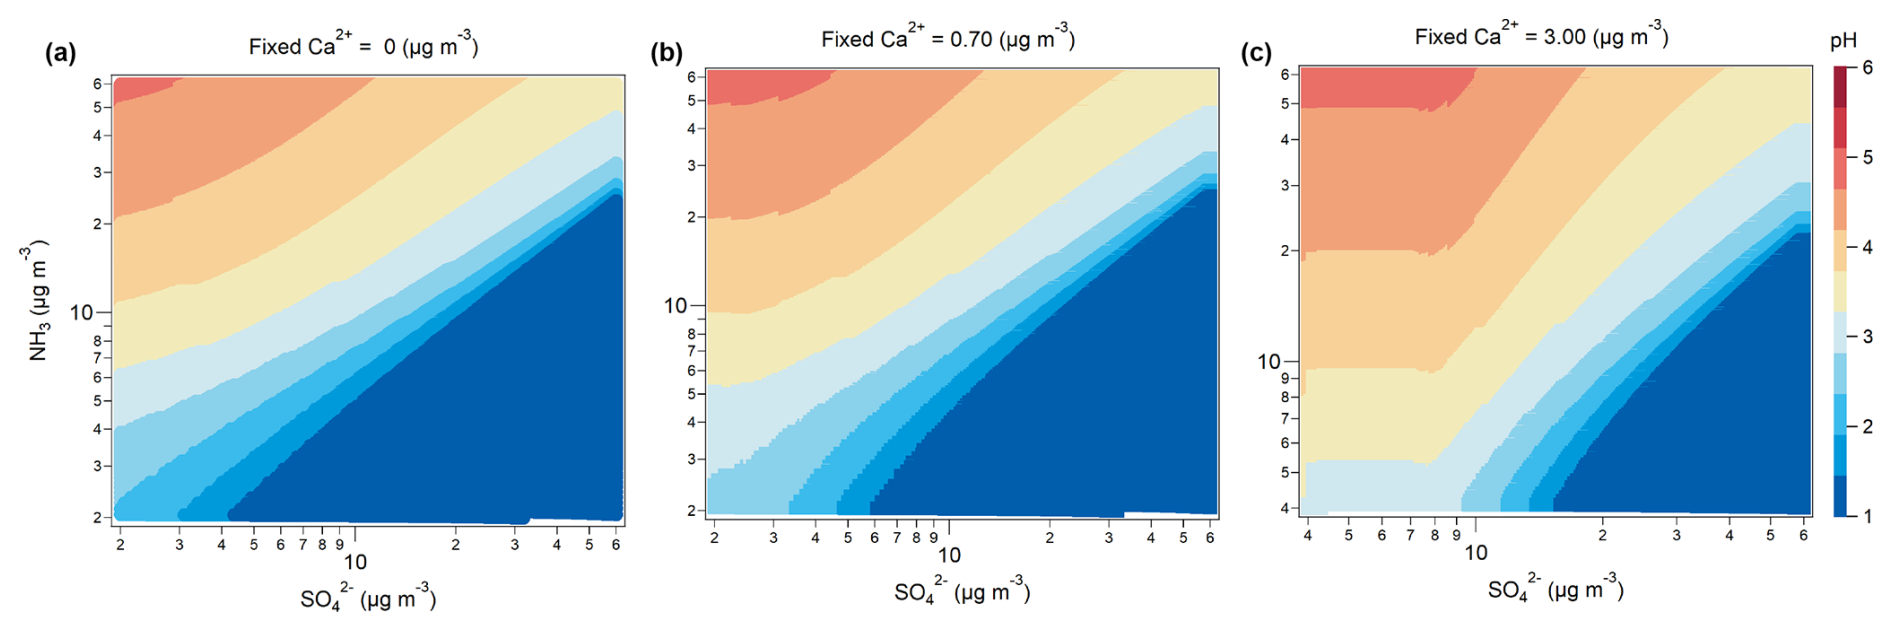
Figure 6Sensitivity of the pH to ammonia (NH3) and sulfate () concentrations based on ISORROPIA-II model predictions under different Ca2+ concentration conditions: (a) 0 µg m−3, (b) 0.70 µg m−3, and (c) 3.00 µg m−3.
3.3 Impact of aerosol pH on the partitioning of nitric acid
In eastern China, nitrate has become a key component of PM2.5, instead of sulfate (Xu et al., 2023; Gao et al., 2023). As a semi-volatile compound, nitrate is strongly influenced by the gas–particle partitioning process in the atmosphere. Aerosol pH not only determines the stability of nitrate but also governs whether it exists in the particulate phase or volatilizes as HNO3 in the gas phase (Guo et al., 2018). At higher pH, nitrate tends to exist in the particle phase due to the oxidation of NOx, while under lower pH conditions, nitrate is more likely to volatilize into the gas phase as HNO3 (Nenes et al., 2020). Using Eq. (2), we analyzed the relationship between the nitrate particle-phase fraction () and aerosol pH for three cities – Xuzhou, Zhenjiang, and Suzhou – under dust storm and local dust conditions. Figure 7 shows the S-shaped curve representing this relationship, calculated based on the average T and aerosol Wi during dust storm and local dust conditions, assuming ideal solution behavior (activity coefficient ). This curve visually demonstrates the regulation of nitrate phase partitioning by aerosol pH under these conditions and provides a theoretical basis for controlling the effect of ammonia on particulate nitrate formation by adjusting aerosol pH (Guo et al., 2018).
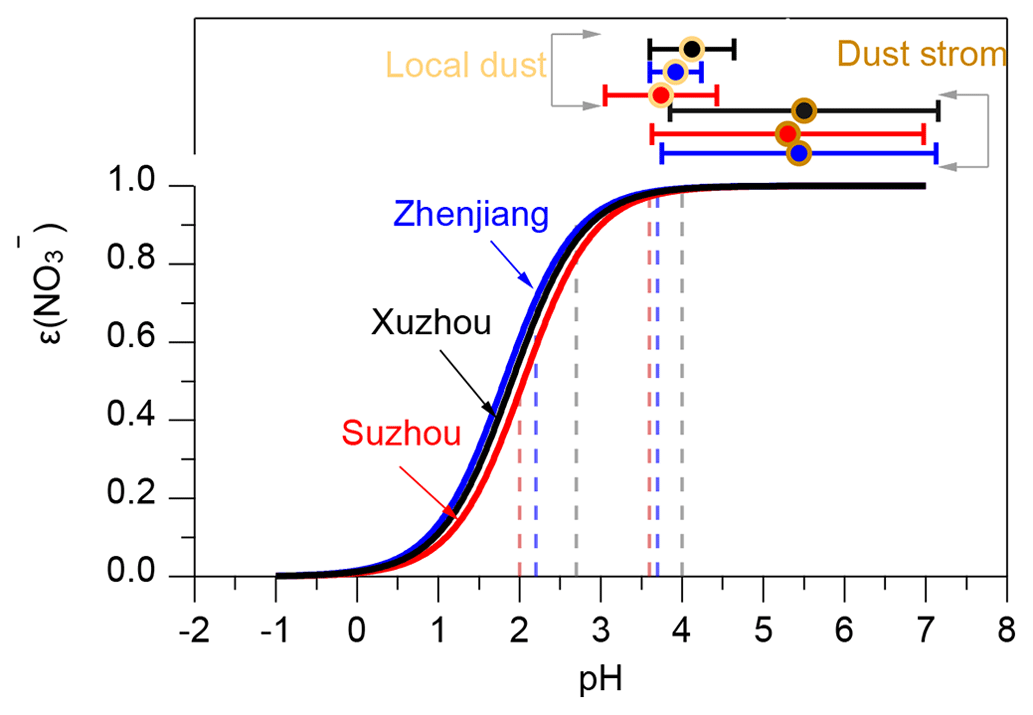
Figure 7S-curve distributions for under the conditions from different cities. Based on Eq. (2), the relationship between and pH was calculated using the average T and Wi during dust storm, local dust, and non-dust periods (assuming , ). The vertical dashed lines represent the minimum (left side) and maximum (right side) pH values under local-dust conditions calculated using ISORROPIA-II for the three cities. Error bars indicate the sample standard deviation of aerosol pH during local dust and dust storm events.
As cities along the dust storm transport path, Xuzhou, Zhenjiang, and Suzhou experience varying degrees of dust influence, leading to significant differences in aerosol pH. On average, aerosol pH is elevated during dust storms compared to local dust conditions. During non-dust periods, aerosol pH values in the three cities were significantly lower than during dust events (Xuzhou: 2.7–4.0, Zhenjiang: 2.2–3.7, Suzhou: 2.0–3.6). This lower pH corresponds to a marked decrease in , indicating a shift toward gaseous HNO3, especially in Suzhou, where dropped to approximately 40 % under the lowest pH conditions. During dust storms, the mean aerosol pH values were 5.50 ± 1.65 in Xuzhou, 5.44 ± 1.69 in Zhenjiang, and 5.30 ± 1.67 in Suzhou. Under local dust conditions, these values were lower, at 4.12 ± 0.52, 3.92 ± 0.32, and 3.74 ± 0.69 respectively. Xuzhou, situated at the northern edge of the dust storm transport path, exhibited the highest aerosol pH during both periods, reflecting the substantial impact of transported dust pollution. The S-shaped curve in Fig. 7 demonstrates that under both dust storm and local dust conditions, the average aerosol pH aligns with nitrate particle-phase fractions exceeding 99 %, indicating that nitrate predominantly resides in the particle phase. This finding highlights the promoting effect of dust pollution on the gas–particle transformation of nitrate.
When aerosol pH drops below 3, however, decreases sharply, signifying the onset of nitrate volatilization into the gas phase. Notably, when aerosol pH lies in the range of 1 to 3, exhibits heightened sensitivity to aerosol pH changes. This trend was consistently observed across all three cities. Reducing NH3 concentrations is particularly effective in influencing nitrate gas–particle partitioning when aerosol pH is within this sensitive range, offering a promising strategy to mitigate regional particulate nitrate pollution. However, environments with dust pollution may disrupt this theoretical relationship. NVCs (such as Ca2+) in dust can neutralize acidic aerosol components, maintaining aerosol pH at relatively high levels (e.g., pH > approximately 3.5) (Fig. 7). This neutralization effect limits the ability to lower particulate nitrate concentrations solely by reducing NH3 emissions, necessitating alternative approaches to address nitrate-driven air quality challenges in dust-influenced regions.
To further quantify the impact of dust storms on aerosol pH and , we utilized the RF model combined with SHAP values for both prediction and sensitivity analysis. The correlation between the observed and predicted results from the RF model is shown in Fig. S5 in the Supplement. The index of agreement (IOA) values ranged from 0.93 to 0.97, indicating a high level of model agreement. Meanwhile, the correlation coefficients (R) varied between 0.78 and 0.90, further validating the model's predictive accuracy. For aerosol pH predictions, five evaluation metrics were used: MAE, RMSE, NMSE, MB, and NMB. The values for MAE ranged from 0.13 to 0.18, while RMSE values were between 0.26 and 0.29. For NMSE, the values ranged from 0.10 to 0.12, and the biases (MB and NMB) varied from −0.01 to −0.006 and 0.004 to 0.007, respectively. In comparison, the corresponding evaluation metrics for were as follows: MAE ranged from 0.01 to 0.02, RMSE from 0.03 to 0.04, and NMSE from 0.10 to 0.21. The bias values for ranged from −0.00006 to 0.004 for MB and from 0.003 to 0.007 for NMB. These statistical results demonstrate the reliability and robustness of the RF model in predicting aerosol pH and nitrate partitioning.
Figure 8 illustrates the impact of dust storms and local dust conditions on aerosol pH and . The ΔSHAP values represent the difference between the average SHAP values of all variables during dust storm periods and the average SHAP values for all variables during the non-dust storm period. During dust storm conditions, ΔSHAP significantly increased in Xuzhou, Zhenjiang, and Suzhou, with aerosol pH values rising by Δ1.2, Δ1.5, and Δ1.5 units, respectively (Fig. 8a–c). This result is consistent with our previous conclusion that dust storms contribute to an increase in aerosol pH, confirming the positive impact of dust storms on the random forest model's predictions of aerosol pH. Similarly, Fig. 8d–f show the changes in for the three cities under different weather conditions. It is evident that the effect of dust storms on is 10 to 20 times greater than the impact of local non-dust storm conditions, likely due to differences in aerosol composition and enhanced alkaline inputs such as Ca2+. This indicates that dust storm conditions have a significantly stronger positive contribution to the particle-phase fraction of nitrate. The presence of dust particles facilitates the conversion of nitrate to the particulate phase, highlighting the significant influence of dust storms on nitrate partitioning in the atmosphere.
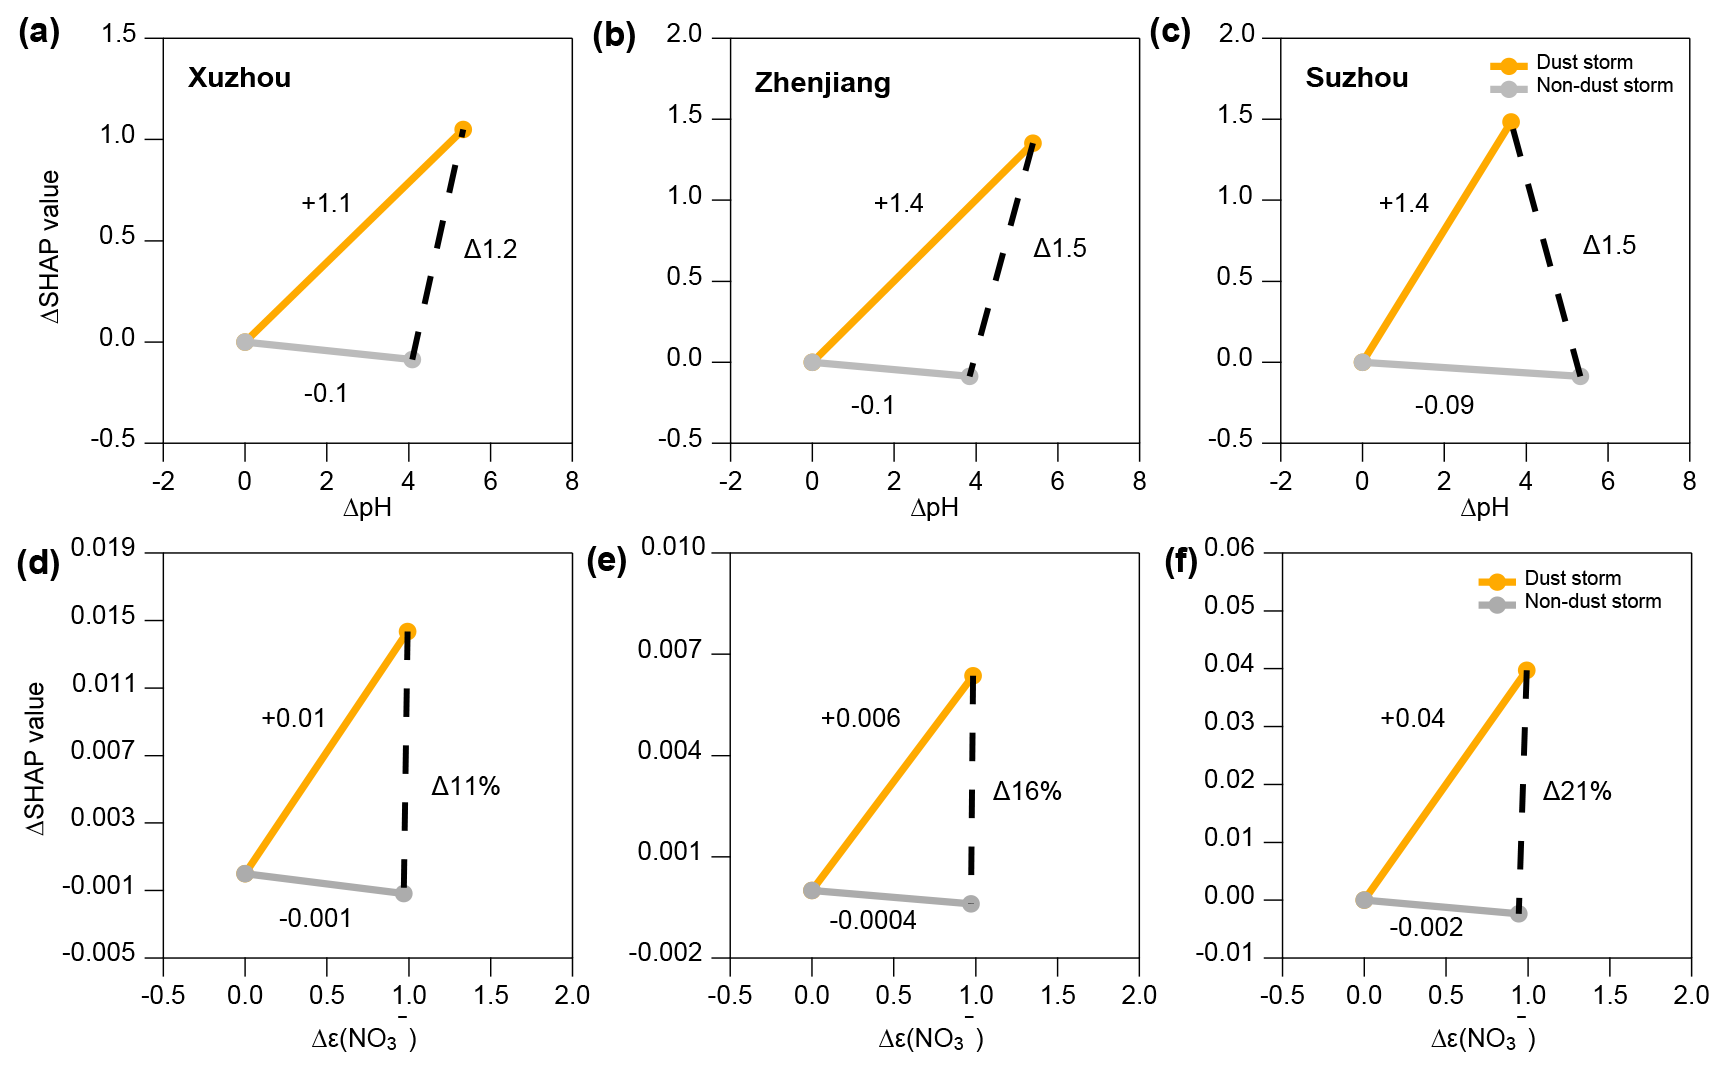
Figure 8ΔSHAP values for (a–c) aerosol pH and (d–f) . The orange solid line represents the impact of dust storms, the gray solid line represents the non-dust scenario, and the black dashed line shows the difference between the two scenarios.
3.4 Effectiveness of emission reduction on particulate nitrate under dust pollution
To explore the impact of emission reductions of TNHx, TNO3, and on during different dust storm conditions, we conducted a sensitivity analysis based on the thermodynamic model ISORROPIA-II, using the average pollutant concentrations observed in Zhenjiang during the spring of 2023. The results, shown in Fig. 9, demonstrate a nonlinear response of both and the total ammonium-nitrate concentration () to reductions in TNHx, TNO3, and , respectively. We simulated the effects of progressively reducing TNHx, TNO3, and by 0 % to 50 % under different Ca2+ concentration conditions, which include different dust pollution scenarios. For the simulation, Ca2+ concentration was set to 0.1 to 0.7 µg m−3 for local dust conditions and ranged from 1.0 to 3.0 µg m−3 for dust storm conditions. When the Ca2+ concentration exceeded 3 µg m−3, further reductions in the other variables had negligible effects on the output, with emission reductions having little to no impact on .
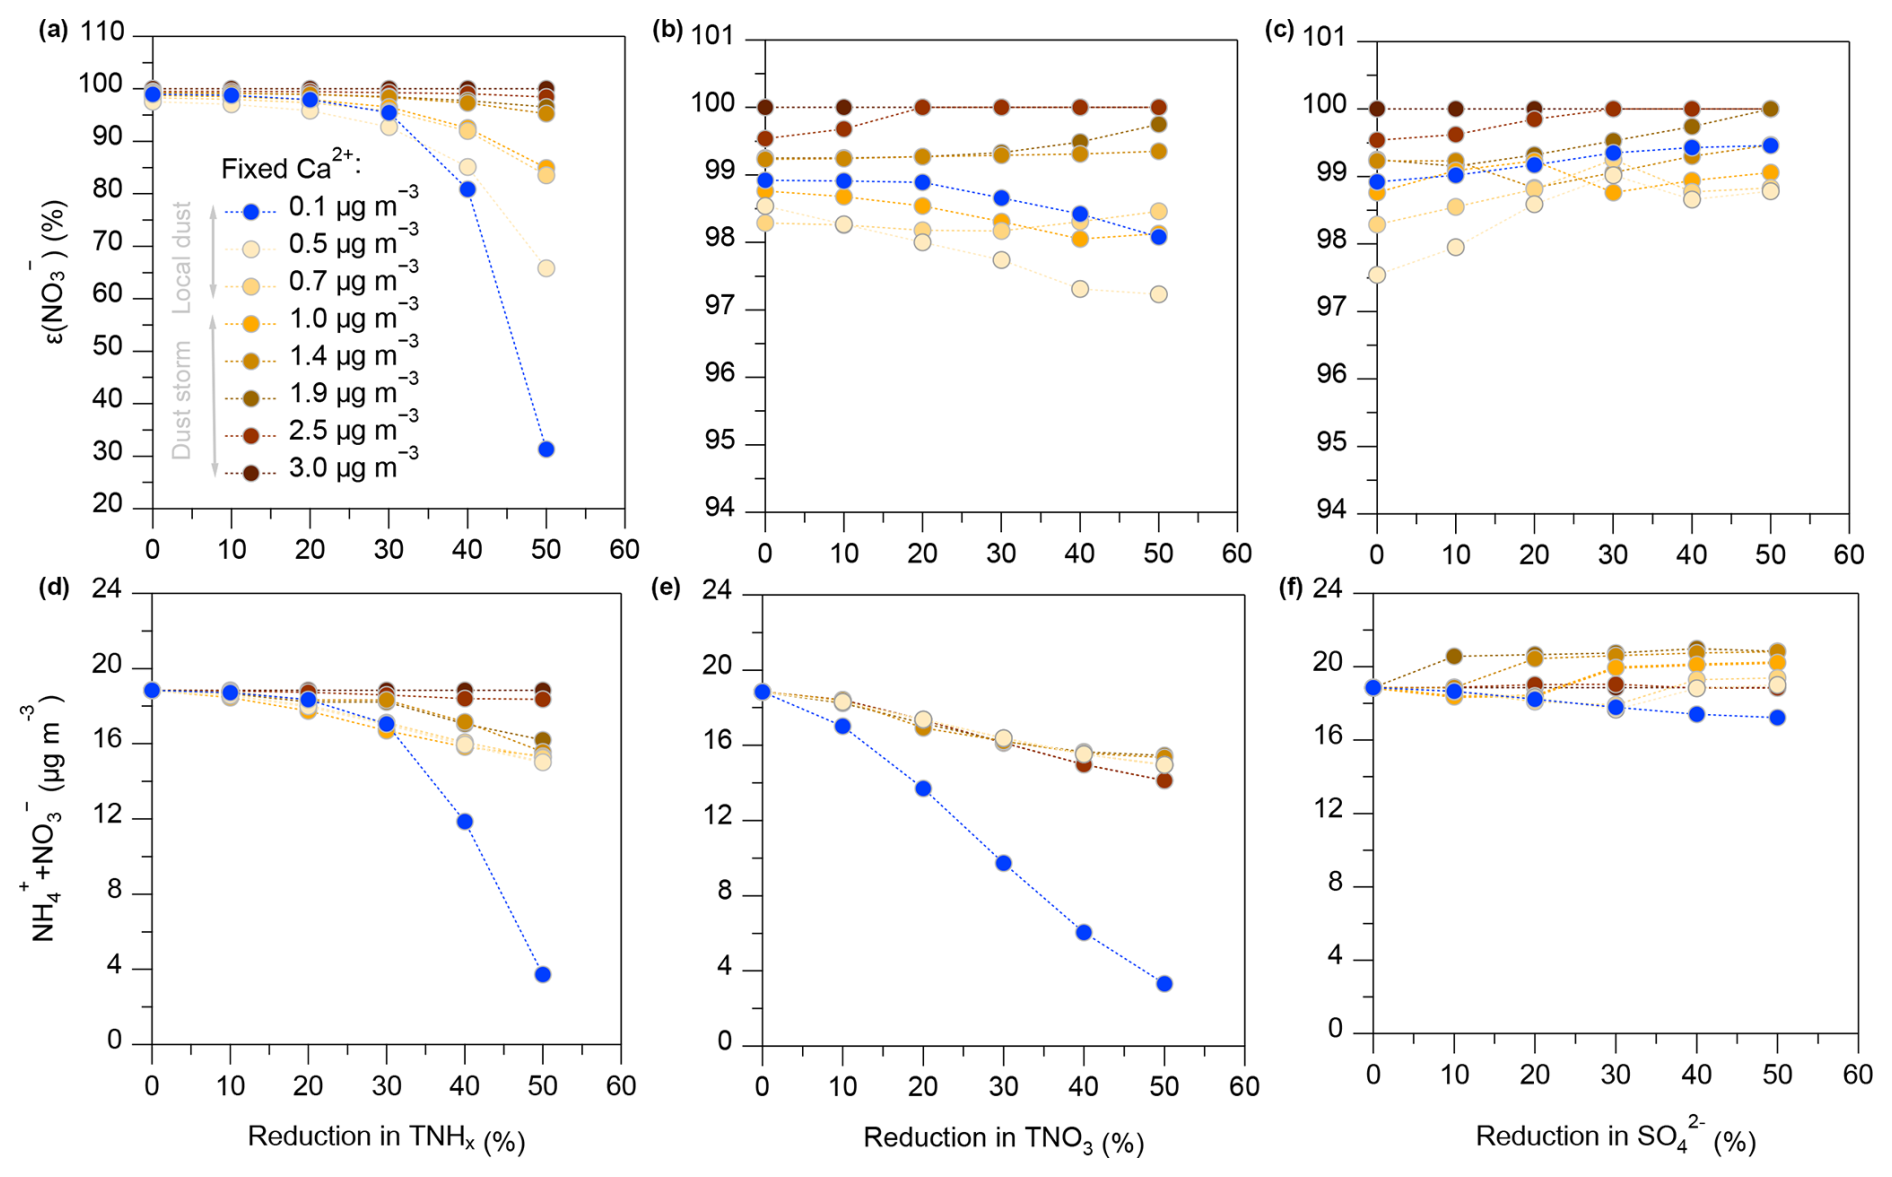
Figure 9Sensitivity analysis based on the thermodynamic model ISORROPIA-II simulated the impact of reducing TNHx (), TNO3 (), and by 0 %–50 % during dust events of varying intensities on and .
As shown in Fig. 9a, it is evident that during local dust conditions, remained relatively constant until TNHx emissions were reduced by 30 %. At this point, rapidly dropped from 99 %, signaling the onset of a significant shift in the gas–particle partitioning of nitrate. When TNHx reductions reached 50 %, fell sharply to approximately 30 %, indicating that nitrate transitioned predominantly into its gas-phase form. This simulation result is consistent with the sensitivity analysis of NH3 concentrations in Sect. 3.2, which also showed a significant response in nitrate partitioning as NH3 concentrations decreased. Thus, in the Zhenjiang region, a 30 % reduction in TNHx emissions is necessary to effectively reduce the mass of () during spring (Fig. 9d). In contrast, during dust storm conditions (Fig. 9a), the reduction in TNHx had a much more subdued effect on , especially at higher Ca2+ concentrations (above 2.5 µg m−3), where the reduction had almost no impact on .
For TNO3 reductions, as shown in Fig. 9b, the changes in were minimal, regardless of the Ca2+ concentration. However, during local dust conditions (Fig. 9e), the reduction of TNO3 led to a significant decrease in () concentrations, indicating that TNO3 reduction was particularly effective under local dust conditions. Lastly, reductions in emissions (Fig. 9c and f) had a smaller impact on both and () concentrations. Interestingly, at very low dust concentrations, reductions could even lead to a slight increase (by up to 0.5 %) in ), indicating that sulfate reduction alone is not an effective strategy for controlling nitrate partitioning.
This study explores the impact of dust pollution on aerosol pH and nitrate gas–particle partitioning in three cities across the YRD region of eastern China. By combining field observations, thermodynamic modeling, and machine learning techniques, we provide a comprehensive analysis of how different dust scenarios affect urban aerosol pH and gas–particle partitioning chemistry of nitrate. Our analysis of a dust storm event that originated in Mongolia and was transported over long distances to the YRD region in the spring of 2023 revealed a significant increase in PM10 concentrations; the average PM10 concentration in three cities along the route exceeds 400 µg m−3, approximately 4 times higher than during local dust events. Thermodynamic simulations using the ISORROPIA model showed that both ammonia and calcium ion concentrations strongly influenced aerosol pH, with average contributions of 47 % and 7 % respectively. Random forest model simulations further indicated that the presence of high NVCs during dust storms significantly contributed to changes in aerosol pH (1.2–1.5 units). Sensitivity analysis of pH responses to sulfate and NH3 concentrations under different dust conditions (non-dust, local dust, and extremely dust storm) revealed that a 5–10-fold increase in NH3 led to a 1-unit change in aerosol pH. Machine learning analysis showed that extreme dust storm events contributed approximately 1.4 units to the increase in aerosol pH, with a corresponding increase in nitrate partitioning (16 %). This suggests that under high aerosol pH conditions during dust pollution periods, nitrate is predominantly in the particulate phase, indicating that dust significantly inhibits the partitioning of nitrate into the gaseous phase. In addition, our sensitivity analyses also showed that ammonia reduction had the most significant effect on reducing nitrate aerosols under dust-free conditions. However, the effectiveness of ammonia reductions in lowering nitrate aerosol concentrations was significantly reduced due to the influence of NVCs on nitrate partitioning under dust pollution scenarios. These findings suggest that dust pollution can substantially weaken the impact of ammonia reductions on nitrate aerosol formation, highlighting the need for targeted control strategies during dust storm events. Dust emission remains a significant air pollution concern worldwide, while urban nitrate aerosol pollution is a pressing issue in many cities, particularly in East Asia, where the frequency of natural dust events has increased in recent years. These dust storms, along with anthropogenic dust, can substantially alter aerosol chemistry by modifying aerosol pH and nitrate partitioning. Therefore, effective dust control strategies are critical for mitigating the adverse effects of aerosol acidity on nitrate aerosol formation and improving air quality in dust-prone regions.
Additional meteorological parameters can be accessed from the European Centre for Medium-Range Weather Forecasts (ECMWF) ERA5 reanalysis dataset: https://doi.org/10.24381/cds.bd0915c6 (Hersbach et al., 2023). Regional PM10 data can be accessed at the China National Environmental Monitoring Centre (https://air.cnemc.cn:18007/, last access: 21 November 2023). Additional data will be made available upon request (yjzhang@nuist.edu.cn).
The supplement related to this article is available online at https://doi.org/10.5194/acp-25-10587-2025-supplement.
YZ conceived and designed the study. HL and YZ conducted the simulations and data analysis. HL, YZ, SZ, YR, JQ, and MZ carried out field measurements and validated the data. HL and YZ wrote the original manuscript, while DL, FC, OF, HD, and XG provided critical feedback and contributed to the manuscript revisions.
The contact author has declared that none of the authors has any competing interests.
Publisher's note: Copernicus Publications remains neutral with regard to jurisdictional claims made in the text, published maps, institutional affiliations, or any other geographical representation in this paper. While Copernicus Publications makes every effort to include appropriate place names, the final responsibility lies with the authors.
This study was supported by the National Natural Science Foundation of China (grant no. 42207124) and the Natural Science Foundation of Jiangsu Province (grant no. BK20210663).
This research has been supported by the National Natural Science Foundation of China (grant no. 42207124) and the Natural Science Foundation of Jiangsu Province (grant no. BK20210663).
This paper was edited by Hang Su and reviewed by two anonymous referees.
Beaudor, M., Hauglustaine, D., Lathière, J., Van Damme, M., Clarisse, L., and Vuichard, N.: Evaluating present-day and future impacts of agricultural ammonia emissions on atmospheric chemistry and climate, Atmos. Chem. Phys., 25, 2017–2046, https://doi.org/10.5194/acp-25-2017-2025, 2025.
Boichu, M., Favez, O., Riffault, V., Petit, J.-E., Zhang, Y., Brogniez, C., Sciare, J., Chiapello, I., Clarisse, L., Zhang, S., Pujol-Söhne, N., Tison, E., Delbarre, H., and Goloub, P.: Large-scale particulate air pollution and chemical fingerprint of volcanic sulfate aerosols from the 2014–2015 Holuhraun flood lava eruption of Bárðarbunga volcano (Iceland), Atmos. Chem. Phys., 19, 14253–14287, https://doi.org/10.5194/acp-19-14253-2019, 2019.
Chen, S., Jiang, N., Huang, J., Xu, X., Zhang, H., Zang, Z., Huang, K., Xu, X., Wei, Y., Guan, X., Zhang, X., Luo, Y., Hu, Z., and Feng, T.: Quantifying contributions of natural and anthropogenic dust emission from different climatic regions, Atmos. Environ., 191, 94–104, https://doi.org/10.1016/j.atmosenv.2018.07.043, 2018.
Chen, S., Chen, J., Zhang, Y., Lin, J., Bi, H., Song, H., Chen, Y., Lian, L., Liu, C., and Zhang, R.: Anthropogenic dust: sources, characteristics and emissions, Environ. Res. Lett., 18, 103002, https://doi.org/10.1088/1748-9326/acf479, 2023a.
Chen, S., Zhao, D., Huang, J., He, J., Chen, Y., Chen, J., Bi, H., Lou, G., Du, S., Zhang, Y., and Yang, F.: Mongolia Contributed More than 42 % of the Dust Concentrations in Northern China in March and April 2023, Adv. Atmos. Sci., 40, 1549–1557, https://doi.org/10.1007/s00376-023-3062-1, 2023b.
Chen, Y., Chen, S., Zhou, J., Zhao, D., Bi, H., Zhang, Y., Alam, K., Yu, H., Yang, Y., and Chen, J.: A super dust storm enhanced by radiative feedback, npj Clim. Atmos. Sci., 6, 90, https://doi.org/10.1038/s41612-023-00418-y, 2023c.
Clegg, S. L., Brimblecombe, P., and Wexler, A. S.: Thermodynamic Model of the System H+----H2O at Tropospheric Temperatures, J. Phys. Chem. A, 102, 2137–2154, https://doi.org/10.1021/jp973042r, 1998.
Ding, J., Zhao, P., Su, J., Dong, Q., Du, X., and Zhang, Y.: Aerosol pH and its driving factors in Beijing, Atmos. Chem. Phys., 19, 7939–7954, https://doi.org/10.5194/acp-19-7939-2019, 2019.
Duan, J., Huang, R.-J., Wang, Y., Xu, W., Zhong, H., Lin, C., Huang, W., Gu, Y., Ovadnevaite, J., Ceburnis, D., and O'Dowd, C.: Measurement report: Size-resolved secondary organic aerosol formation modulated by aerosol water uptake in wintertime haze, Atmos. Chem. Phys., 24, 7687–7698, https://doi.org/10.5194/acp-24-7687-2024, 2024.
Fang, T., Guo, H., Zeng, L., Verma, V., Nenes, A., and Weber, R. J.: Highly Acidic Ambient Particles, Soluble Metals, and Oxidative Potential: A Link between Sulfate and Aerosol Toxicity, Environ. Sci. Technol., 51, 2611–2620, https://doi.org/10.1021/acs.est.6b06151, 2017.
Fountoukis, C. and Nenes, A.: ISORROPIA II: a computationally efficient thermodynamic equilibrium model for K+–Ca2+–Mg2+––Na+–––Cl−–H2O aerosols, Atmos. Chem. Phys., 7, 4639–4659, https://doi.org/10.5194/acp-7-4639-2007, 2007.
Fu, X., Wang, S. X., Cheng, Z., Xing, J., Zhao, B., Wang, J. D., and Hao, J. M.: Source, transport and impacts of a heavy dust event in the Yangtze River Delta, China, in 2011, Atmos. Chem. Phys., 14, 1239–1254, https://doi.org/10.5194/acp-14-1239-2014, 2014.
Gao, D., Zhao, B., Wang, S., Wang, Y., Gaudet, B., Zhu, Y., Wang, X., Shen, J., Li, S., He, Y., Yin, D., and Dong, Z.: Increased importance of aerosol–cloud interactions for surface PM2.5 pollution relative to aerosol–radiation interactions in China with the anthropogenic emission reductions, Atmos. Chem. Phys., 23, 14359–14373, https://doi.org/10.5194/acp-23-14359-2023, 2023.
Geng, G., Zhang, Q., Tong, D., Li, M., Zheng, Y., Wang, S., and He, K.: Chemical composition of ambient PM2.5 over China and relationship to precursor emissions during 2005–2012, Atmos. Chem. Phys., 17, 9187–9203, https://doi.org/10.5194/acp-17-9187-2017, 2017.
Goudie, A. S.: Desert dust and human health disorders, Environ. Int., 63, 101–113, https://doi.org/10.1016/j.envint.2013.10.011, 2014.
Guo, H., Xu, L., Bougiatioti, A., Cerully, K. M., Capps, S. L., Hite Jr., J. R., Carlton, A. G., Lee, S.-H., Bergin, M. H., Ng, N. L., Nenes, A., and Weber, R. J.: Fine-particle water and pH in the southeastern United States, Atmos. Chem. Phys., 15, 5211–5228, https://doi.org/10.5194/acp-15-5211-2015, 2015.
Guo, H., Sullivan, A. P., Campuzano-Jost, P., Schroder, J. C., Lopez-Hilfiker, F. D., Dibb, J. E., Jimenez, J. L., Thornton, J. A., Brown, S. S., Nenes, A., and Weber, R. J.: Fine particle pH and the partitioning of nitric acid during winter in the northeastern United States, J. Geophys. Res.-Atmos., 121, 10355–10376, https://doi.org/10.1002/2016JD025311, 2016.
Guo, H., Liu, J., Froyd, K. D., Roberts, J. M., Veres, P. R., Hayes, P. L., Jimenez, J. L., Nenes, A., and Weber, R. J.: Fine particle pH and gas–particle phase partitioning of inorganic species in Pasadena, California, during the 2010 CalNex campaign, Atmos. Chem. Phys., 17, 5703–5719, https://doi.org/10.5194/acp-17-5703-2017, 2017a.
Guo, H., Weber, R. J., and Nenes, A.: High levels of ammonia do not raise fine particle pH sufficiently to yield nitrogen oxide-dominated sulfate production, Sci. Rep.-UK, 7, 12109, https://doi.org/10.1038/s41598-017-11704-0, 2017b.
Guo, H., Otjes, R., Schlag, P., Kiendler-Scharr, A., Nenes, A., and Weber, R. J.: Effectiveness of ammonia reduction on control of fine particle nitrate, Atmos. Chem. Phys., 18, 12241–12256, https://doi.org/10.5194/acp-18-12241-2018, 2018.
Hauglustaine, D. A., Balkanski, Y., and Schulz, M.: A global model simulation of present and future nitrate aerosols and their direct radiative forcing of climate, Atmos. Chem. Phys., 14, 11031–11063, https://doi.org/10.5194/acp-14-11031-2014, 2014.
Hersbach, H., Bell, B., Berrisford, P., Biavati, G., Horányi, A., Muñoz Sabater, J., Nicolas, J., Peubey, C., Radu, R., Rozum, I., Schepers, D., Simmons, A., Soci, C., Dee, D., and Thépaut, J.-N.: ERA5 hourly data on pressure levels from 1940 to present, Copernicus Climate Change Service (C3S) Climate Data Store (CDS) [data set], https://doi.org/10.24381/cds.bd0915c6, 2023.
Hrdina, A., Murphy, J. G., Hallar, A. G., Lin, J. C., Moravek, A., Bares, R., Petersen, R. C., Franchin, A., Middlebrook, A. M., Goldberger, L., Lee, B. H., Baasandorj, M., and Brown, S. S.: The role of coarse aerosol particles as a sink of HNO3 in wintertime pollution events in the Salt Lake Valley, Atmos. Chem. Phys., 21, 8111–8126, https://doi.org/10.5194/acp-21-8111-2021, 2021.
Huang, J., Fu, Q., Zhang, W., Wang, X., Zhang, R., Ye, H., and Warren, S. G.: Dust and Black Carbon in Seasonal Snow Across Northern China, B. Am. Meteorol. Soc., 92, 175–181, https://doi.org/10.1175/2010BAMS3064.1, 2011.
Jickells, T. D., An, Z. S., Andersen, K. K., Baker, A. R., Bergametti, G., Brooks, N., Cao, J. J., Boyd, P. W., Duce, R. A., Hunter, K. A., Kawahata, H., Kubilay, N., laRoche, J., Liss, P. S., Mahowald, N., Prospero, J. M., Ridgwell, A. J., Tegen, I., and Torres, R.: Global Iron Connections Between Desert Dust, Ocean Biogeochemistry, and Climate, Science, 308, 67–71, https://doi.org/10.1126/science.1105959, 2005.
Kurokawa, J. and Ohara, T.: Long-term historical trends in air pollutant emissions in Asia: Regional Emission inventory in ASia (REAS) version 3, Atmos. Chem. Phys., 20, 12761–12793, https://doi.org/10.5194/acp-20-12761-2020, 2020.
Laskin, A., Wietsma, T. W., Krueger, B. J., and Grassian, V. H.: Heterogeneous chemistry of individual mineral dust particles with nitric acid: A combined CCSEM/EDX, ESEM, and ICP-MS study, J. Geophys. Res.-Atmos., 110, https://doi.org/10.1029/2004JD005206, 2005.
Li, G., Su, H., Zheng, G., Zhou, M., Han, W., Zhang, Y., Ma, N., Wang, H., Klimach, T., and Cheng, Y.: Novel Device for in Situ and Real-Time Detection of the Acidity of Ambient Aerosols: Laboratory Characterization and Ambient Measurements, Environ. Sci. Technol., 59, 659–667, https://doi.org/10.1021/acs.est.4c09221, 2025.
Li, J., Zhang, N., Tian, P., Zhang, M., Shi, J., Chang, Y., Zhang, L., Liu, Z., and Wang, Y.: Significant roles of aged dust aerosols on rapid nitrate formation under dry conditions in a semi-arid city, Environ. Pollut., 336, 122395, https://doi.org/10.1016/j.envpol.2023.122395, 2023.
Li, W. J. and Shao, L. Y.: Observation of nitrate coatings on atmospheric mineral dust particles, Atmos. Chem. Phys., 9, 1863–1871, https://doi.org/10.5194/acp-9-1863-2009, 2009.
Liu, X., Song, H., Lei, T., Liu, P., Xu, C., Wang, D., Yang, Z., Xia, H., Wang, T., and Zhao, H.: Effects of natural and anthropogenic factors and their interactions on dust events in Northern China, Catena, 196, 104919, https://doi.org/10.1016/j.catena.2020.104919, 2021.
Liu, Y., Zhan, J., Zheng, F., Song, B., Zhang, Y., Ma, W., Hua, C., Xie, J., Bao, X., Yan, C., Bianchi, F., Petäjä, T., Ding, A., Song, Y., He, H., and Kulmala, M.: Dust emission reduction enhanced gas-to-particle conversion of ammonia in the North China Plain, Nat. Commun., 13, 6887, https://doi.org/10.1038/s41467-022-34733-4, 2022.
Lundberg, S. M. and Lee, S.-I.: A unified approach to in terpreting model predictions, arXiv., 30, https://doi.org/10.48550/arXiv.1705.07874, 2017.
Mahowald, N. M., Muhs, D. R., Levis, S., Rasch, P. J., Yoshioka, M., Zender, C. S., and Luo, C.: Change in atmospheric mineral aerosols in response to climate: Last glacial period, preindustrial, modern, and doubled carbon dioxide climates, J. Geophys. Res.-Atmos., 111, https://doi.org/10.1029/2005JD006653, 2006.
Malm, W. C. and Day, D. E.: Estimates of aerosol species scattering characteristics as a function of relative humidity, Atmos. Environ., 35, 2845–2860, https://doi.org/10.1016/S1352-2310(01)00077-2, 2001.
Metzger, S., Dentener, F., Pandis, S., and Lelieveld, J.: Gas/aerosol partitioning: 1. A computationally efficient model, J. Geophys. Res.-Atmos., 107, https://doi.org/10.1029/2001JD001102, 2002.
Milousis, A., Klingmüller, K., Tsimpidi, A. P., Kok, J. F., Kanakidou, M., Nenes, A., and Karydis, V. A.: Impact of mineral dust on the global nitrate aerosol direct and indirect radiative effect, Atmos. Chem. Phys., 25, 1333–1351, https://doi.org/10.5194/acp-25-1333-2025, 2025.
Nah, T., Guo, H., Sullivan, A. P., Chen, Y., Tanner, D. J., Nenes, A., Russell, A., Ng, N. L., Huey, L. G., and Weber, R. J.: Characterization of aerosol composition, aerosol acidity, and organic acid partitioning at an agriculturally intensive rural southeastern US site, Atmos. Chem. Phys., 18, 11471–11491, https://doi.org/10.5194/acp-18-11471-2018, 2018.
Nenes, A., Pandis, S. N., Weber, R. J., and Russell, A.: Aerosol pH and liquid water content determine when particulate matter is sensitive to ammonia and nitrate availability, Atmos. Chem. Phys., 20, 3249–3258, https://doi.org/10.5194/acp-20-3249-2020, 2020.
Nenes, A., Pandis, S. N., Kanakidou, M., Russell, A. G., Song, S., Vasilakos, P., and Weber, R. J.: Aerosol acidity and liquid water content regulate the dry deposition of inorganic reactive nitrogen, Atmos. Chem. Phys., 21, 6023–6033, https://doi.org/10.5194/acp-21-6023-2021, 2021.
Nguyen, T. B., Coggon, M. M., Bates, K. H., Zhang, X., Schwantes, R. H., Schilling, K. A., Loza, C. L., Flagan, R. C., Wennberg, P. O., and Seinfeld, J. H.: Organic aerosol formation from the reactive uptake of isoprene epoxydiols (IEPOX) onto non-acidified inorganic seeds, Atmos. Chem. Phys., 14, 3497–3510, https://doi.org/10.5194/acp-14-3497-2014, 2014.
Notaro, M., Yu, Y., and Kalashnikova, O. V.: Regime shift in 25 Arabian dust activity, triggered by persistent Fertile Crescent drought, J. Geophys. Res.-Atmos., 120, 2015JD023855, https://doi.org/10.1002/2015JD023855, 2015.
Petit, J.-E., Favez, O., Albinet, A., and Canonaco, F.: A user-friendly tool for comprehensive evaluation of the geographical origins of atmospheric pollution: Wind and trajectory analyses, Environ. Modell. Softw., 88, 183–187, https://doi.org/10.1016/j.envsoft.2016.11.022, 2017.
Rosenfeld, D., Rudich, Y., and Lahav, R.: Desert dust suppressing precipitation: A possible desertification feedback loop, P. Natl. Acad. Sci. USA, 98, 5975–5980, https://doi.org/10.1073/pnas.101122798, 2001.
Rumsey, I. C., Cowen, K. A., Walker, J. T., Kelly, T. J., Hanft, E. A., Mishoe, K., Rogers, C., Proost, R., Beachley, G. M., Lear, G., Frelink, T., and Otjes, R. P.: An assessment of the performance of the Monitor for AeRosols and GAses in ambient air (MARGA): a semi-continuous method for soluble compounds, Atmos. Chem. Phys., 14, 5639–5658, https://doi.org/10.5194/acp-14-5639-2014, 2014.
Schaap, M., Spindler, G., Schulz, M., Acker, K., Maenhaut, W., Berner, A., Wieprecht, W., Streit, N., Müller, K., Brüggemann, E., Chi, X., Putaud, J. P., Hitzenberger, R., Puxbaum, H., Baltensperger, U., and ten Brink, H.: Artefacts in the sampling of nitrate studied in the “INTERCOMP” campaigns of EUROTRAC-AEROSOL, Atmos. Environ., 38, 6487–6496, https://doi.org/10.1016/j.atmosenv.2004.08.026, 2004.
Seinfeld, J. H., Pandis, S. N., and Noone, K. J.: Atmospheric Chemistry and Physics: From Air Pollution to Climate Change, Phys. Today, 51, 88–90, 1998.
Shao, Y. and Dong, C. H.: A review on East Asian dust storm climate, modelling and monitoring, Global Planet. Change, 52, 1–22, https://doi.org/10.1016/j.gloplacha.2006.02.011, 2006.
Shi, X., Nenes, A., Xiao, Z., Song, S., Yu, H., Shi, G., Zhao, Q., Chen, K., Feng, Y., and Russell, A. G.: High-Resolution Data Sets Unravel the Effects of Sources and Meteorological Conditions on Nitrate and Its Gas-Particle Partitioning, Environ. Sci. Technol., 53, 3048–3057, https://doi.org/10.1021/acs.est.8b06524, 2019.
Song, C. H. and Carmichael, G. R.: Gas-Particle Partitioning of Nitric Acid Modulated by Alkaline Aerosol, J. Atmos. Chem., 40, 1–22, https://doi.org/10.1023/A:1010657929716, 2001.
Song, X., Wang, Y., Huang, X., Wang, Y., Li, Z., Zhu, B., Ren, R., An, J., Yan, J., Zhang, R., Shang, Y., and Zhan, P.: The Impacts of Dust Storms With Different Transport Pathways on Aerosol Chemical Compositions and Optical Hygroscopicity of Fine Particles in the Yangtze River Delta, J. Geophys. Res.-Atmos., 128, https://doi.org/10.1029/2023jd039679, 2023.
Soussé Villa, R., Jorba, O., Gonçalves Ageitos, M., Bowdalo, D., Guevara, M., and Pérez García-Pando, C.: A comprehensive global modeling assessment of nitrate heterogeneous formation on desert dust, Atmos. Chem. Phys., 25, 4719–4753, https://doi.org/10.5194/acp-25-4719-2025, 2025.
Stelson, A. W. and Seinfeld, J. H.: Relative humidity and temperature dependence of the ammonium nitrate dissociation constant, Atmos. Environ., 16, 983–992, https://doi.org/10.1016/0004-6981(82)90184-6, 1982.
Sun, J., Zhang, M., and Liu, T.: Spatial and temporal characteristics of dust storms in China and its surrounding regions, 1960–1999: Relations to source area and climate, J. Geophys. Res.-Atmos., 106, 10325–10333, https://doi.org/10.1029/2000JD900665, 2001.
Tan, S.-C., Shi, G.-Y., and Wang, H.: Long-range transport of spring dust storms in Inner Mongolia and impact on the China seas, Atmos. Environ., 46, 299–308, https://doi.org/10.1016/j.atmosenv.2011.09.058, 2012.
Tobo, Y., Zhang, D., Matsuki, A., and Iwasaka, Y.: Asian dust particles converted into aqueous droplets under remote marine atmospheric conditions, P. Natl. Acad. Sci. USA, 107, 17905–17910, https://doi.org/10.1073/pnas.1008235107, 2010.
Trebs, I., Meixner, F. X., Slanina, J., Otjes, R., Jongejan, P., and Andreae, M. O.: Real-time measurements of ammonia, acidic trace gases and water-soluble inorganic aerosol species at a rural site in the Amazon Basin, Atmos. Chem. Phys., 4, 967–987, https://doi.org/10.5194/acp-4-967-2004, 2004.
Vasilakos, P., Russell, A., Weber, R., and Nenes, A.: Understanding nitrate formation in a world with less sulfate, Atmos. Chem. Phys., 18, 12765–12775, https://doi.org/10.5194/acp-18-12765-2018, 2018.
Wang, J., Gui, H., An, L., Hua, C., Zhang, T., and Zhang, B.: Modeling for the source apportionments of PM10 during sand and dust storms over East Asia in 2020, Atmos. Environ., 267, 118768, https://doi.org/10.1016/j.atmosenv.2021.118768, 2021.
Weber, R. J., Guo, H., Russell, A. G., and Nenes, A.: High aerosol acidity despite declining atmospheric sulfate concentrations over the past 15 years, Nat. Geosci., 9, 282–285, https://doi.org/10.1038/ngeo2665, 2016.
Wu, D., Wang, S., Xia, J., Meng, X., Shang, K., Xie, Y., and Wang, R.: The influence of dust events on precipitation acidity in China, Atmos. Environ., 79, 138–146, https://doi.org/10.1016/j.atmosenv.2013.06.016, 2013.
Xie, Y., Wang, G., Wang, X., Chen, J., Chen, Y., Tang, G., Wang, L., Ge, S., Xue, G., Wang, Y., and Gao, J.: Nitrate-dominated PM2.5 and elevation of particle pH observed in urban Beijing during the winter of 2017, Atmos. Chem. Phys., 20, 5019–5033, https://doi.org/10.5194/acp-20-5019-2020, 2020.
Xin, K., Chen, J., and Tseren-Ochir, S.-E.: Formation mechanism and source apportionment of nitrate in atmospheric aerosols, APN Sci. Bull., 13, 102–111, https://doi.org/10.30852/sb.2023.2225, 2023.
Xu, J.-W., Lin, J., Luo, G., Adeniran, J., and Kong, H.: Foreign emissions exacerbate PM2.5 pollution in China through nitrate chemistry, Atmos. Chem. Phys., 23, 4149–4163, https://doi.org/10.5194/acp-23-4149-2023, 2023.
Xu, L., Guo, H., Boyd, C. M., Klein, M., Bougiatioti, A., Cerully, K. M., Hite, J. R., Isaacman-VanWertz, G., Kreisberg, N. M., Knote, C., Olson, K., Koss, A., Goldstein, A. H., Hering, S. V., de Gouw, J., Baumann, K., Lee, S.-H., Nenes, A., Weber, R. J., and Ng, N. L.: Effects of anthropogenic emissions on aerosol formation from isoprene and monoterpenes in the southeastern United States, P. Natl. Acad. Sci. USA, 112, 37–42, https://doi.org/10.1073/pnas.1417609112, 2015.
Xu, L., Fukushima, S., Sobanska, S., Murata, K., Naganuma, A., Liu, L., Wang, Y., Niu, H., Shi, Z., Kojima, T., Zhang, D., and Li, W.: Tracing the evolution of morphology and mixing state of soot particles along with the movement of an Asian dust storm, Atmos. Chem. Phys., 20, 14321–14332, https://doi.org/10.5194/acp-20-14321-2020, 2020.
Zhai, S., Jacob, D. J., Wang, X., Liu, Z., Wen, T., Shah, V., Li, K., Moch, J. M., Bates, K. H., Song, S., Shen, L., Zhang, Y., Luo, G., Yu, F., Sun, Y., Wang, L., Qi, M., Tao, J., Gui, K., Xu, H., Zhang, Q., Zhao, T., Wang, Y., Lee, H. C., Choi, H., and Liao, H.: Control of particulate nitrate air pollution in China, Nat. Geosci., 14, 389–395, https://doi.org/10.1038/s41561-021-00726-z, 2021.
Zhang, Y., Li, N., Tang, K., Wang, M., Li, H., Li, K., Zheng, B., Zhang, Q., Gao, M., Fang, J., Zhang, H., Cui, S., Wang, J., Chen, M., Liao, H., Ge, X., Hauglustaine, D., Balkanski, Y., Ciais, P., and Jiang, G.: Widespread surface ozone reduction triggered by dust storm disturbance on ozone production and destruction chemistry, Sci. Adv., 11, 2375–2548, https://doi.org/10.1126/sciadv.adr4297, 2025.
Zhang, Y., Tang, L., Sun, Y., Favez, O., Canonaco, F., Albinet, A., Couvidat, F., Liu, D., Jayne, J. T., Wang, Z., Croteau, P. L., Canagaratna, M. R., Zhou, H.-C., Prévôt, A. S. H., and Worsnop, D. R.: Limited formation of isoprene epoxydiols-derived secondary organic aerosol under NOx-rich environments in Eastern China, Geophys. Res. Lett., 44, 2035–2043, https://doi.org/10.1002/2016GL072368, 2017.
Zhao, X., Huang, K., Fu, J. S., and Abdullaev, S. F.: Long-range transport of Asian dust to the Arctic: identification of transport pathways, evolution of aerosol optical properties, and impact assessment on surface albedo changes, Atmos. Chem. Phys., 22, 10389–10407, https://doi.org/10.5194/acp-22-10389-2022, 2022.
Zheng, G., Su, H., Wang, S., Andreae, M. O., Pöschl, U., and Cheng, Y.: Multiphase buffer theory explains contrasts in atmospheric aerosol acidity, Science, 369, 1374–1377, https://doi.org/10.1126/science.aba3719, 2020.
Zheng, M., Xu, K., Yuan, L., Chen, N., and Cao, M.: Fine Particle pH and its Impact on PM2.5 Control in a Megacity of Central China, Aerosol Air Qual. Res., 22, https://doi.org/10.4209/aaqr.210394, 2022.
Zhi, M., Wang, G., Xu, L., Li, K., Nie, W., Niu, H., Shao, L., Liu, Z., Yi, Z., Wang, Y., Shi, Z., Ito, A., Zhai, S., and Li, W.: How Acid Iron Dissolution in Aged Dust Particles Responds to the Buffering Capacity of Carbonate Minerals during Asian Dust Storms, Environ. Sci. Technol., https://doi.org/10.1021/acs.est.4c12370, 2025.
Zhu, W., Qi, Y., Tao, H., Zhang, H., Li, W., Qu, W., Shi, J., Liu, Y., Sheng, L., Wang, W., Wu, G., Zhao, Y., Zhang, Y., Yao, X., Wang, X., Yi, L., Ma, Y., and Zhou, Y.: Investigation of a haze-to-dust and dust swing process at a coastal city in northern China part I: Chemical composition and contributions of anthropogenic and natural sources, Sci. Total Environ., 851, 158270, https://doi.org/10.1016/j.scitotenv.2022.158270, 2022.