the Creative Commons Attribution 4.0 License.
the Creative Commons Attribution 4.0 License.
 | 09 Sep 2025
The contribution of fires to PM2.5 and population exposure in the Asia Pacific region
Hua Lu
Bojun Liu
Jinyue Jiang
Bingliang Zhuang
Ying Zhang
Meixuan Wu
Jianfeng Yang
Kunqin Lv
Danyang Ma
Forest and vegetation fires are major sources of air pollution and have triggered air quality issues in many regions of Asia. Measures to reduce fires may be a significant yet under-recognized option for efficiently improving air quality and preventing related premature deaths. Here we isolate fire-specific fine particulate matter (PM2.5) from monitoring concentrations using an observation-driven approach in the region. Fire-specific PM2.5 concentrations average 2–15 µg m−3 during the fire season, with higher values in Southeast Asia (SEA), Northeast Asia (NEA), and northern India. The total PM2.5 in the Asia Pacific region exhibits a rapid declining trend from 2014 to 2021, while fire-specific PM2.5 decreases in early years but begins to reverse in SEA and NEA. The proportions of fire-specific PM2.5 increase in NEA from 0.2 to 0.3 during the fire season and increase in SEA from 0.2 in 2018 to 0.4 in 2021. Fire-specific PM2.5 exposure caused 58 000 (95 % confidence interval (CI) of 32 600–82 600), 90 000 (95 % CI of 63 700–106 000), 157 000 (95 % CI of 110 000–186 000), and 29 300 (95 % CI of 18 000–39 700) premature deaths annually in SEA, East Asia (EA), Central Asia (CA), and NEA, respectively, accounting for 40.9 % (95 % CI of 22.8 %–57.7 %), 14.9 % (95 % CI of 10.5 %–17.6 %), 19.4 % (95 % CI of 13.5 %–24.5 %), and 24.1 % (95 % CI of 14.8 %–32.5 %) of the numbers caused by the total PM2.5. Analysis of infant mortality rate data and PM2.5 exposure indicates that the total PM2.5 exposure had a greater impact in richer areas, while fire-specific PM2.5 exposure affected more populations in poorer regions. Based on the positive correlation between vapor pressure deficit and fire-specific PM2.5, this study suggests that, without further regulation and policy intervention, the emerging growth trend of fire-specific PM2.5 in the Asia Pacific region is likely to continue under the influence of future climate change.
- Article
(10381 KB) - Full-text XML
-
Supplement
(715 KB) - BibTeX
- EndNote


Fine particulate matter (PM2.5) is a complex mixture of anthropogenic and natural sources and has been the world's leading environmental health risk factor (McDuffie et al., 2021). Observations show that emissions from forest and vegetation fires are major sources of PM and have triggered air quality issues in many regions (Reddington et al., 2021; Romanov et al., 2022; Xie et al., 2022). Influenced by climate change, fires are becoming increasingly frequent and destructive, and fire-specific PM2.5 has begun to dominate the average annual PM2.5 trends in some areas (Burke et al., 2023; Wei et al., 2023). Compared with the direct exposure to flames and the heat of fires, exposure to fire smoke can affect much larger populations and pose significant public health risks (Xu et al., 2023). The most severe public health impact of fire smoke on air pollution comes from the generation of toxic PM. Recent studies suggest that fire-specific PM2.5 may be more influential than equal doses of ambient PM2.5 (Xue et al., 2021; Aguilera et al., 2023; Wei et al., 2023). Exposure to fire-specific PM2.5 can exacerbate a range of health problems, such as premature mortality and cardiovascular, respiratory, and other health issues (Aguilera et al., 2021; Chen et al., 2021).
Studies have analyzed changes in fire-specific PM2.5 concentrations and their health impacts using chemical transport models, which are valuable for assessing conditions across different locations and times (Reddington et al., 2021; Xue et al., 2021; Xu et al., 2023). Some studies focus on individual fire events, defining fire influence by threshold values of biomass burning tracers (e.g., PM2.5 or CO) to identify fire-influenced measurements (Bytnerowicz et al., 2016; Landis et al., 2018). Others use backward-trajectory simulations to confirm fire influences but often overlook smaller-scale fire emissions, which are harder to attribute. Accurately measuring fire-specific PM2.5 exposure is vital for assessing health and economic impacts, yet empirical challenges persist. Recently, some studies have combined PM2.5 observational data with fire smoke observations to determine fire effects on air quality, i.e., using the trajectory–fire interception method (TFIM) (Schneider et al., 2021, 2024). The TFIM extracts unaffected time and spatial points, employing statistical or machine learning techniques to estimate pollutant concentrations. This data-driven approach does not depend on the fire emission databases that carry significant uncertainties related to fuel type and location (Wiedinmyer et al., 2006, 2011, 2023) and enhances reliability and timeliness, conserving computational resources while isolating fire-specific air pollution (Aguilera et al., 2021, 2023).
Asia Pacific is one of the most densely populated regions in the world and faces severe air pollution challenges (CCAC, 2024). Among the health risks associated with air pollution, Asia Pacific has accounted for over 70 % of global deaths attributed to air pollution (Lelieveld et al., 2015, 2020; Giannadaki et al., 2018). Fire actively in the Northeast Asia (NEA) region has recently become more extensive and is expected to continue escalating in the future due to climate change (Huang et al., 2024; Gui et al., 2024). Fires in equatorial Southeast Asia (SEA) are severely impacted by droughts induced by the El Niño–Southern Oscillation (Yin, 2020; Zheng et al., 2023). South Asia is among the most vulnerable areas globally due to the impacts of climate change, which have increased the incidence of fire in Central Asia (CA). In addition to climate and natural factors, the frequencies and sizes of fires are also largely human-influenced through land management practices in Asia Pacific. In East Asia (EA) and SEA, fires are used as agricultural management tools, such as to remove agricultural residues and weeds, as well as for forest clearance for agricultural purposes (Biswas et al., 2015; Phairuang et al., 2017). Fire activity in Asia Pacific may release large amounts of smoke and harmful gases, leading to elevated concentrations of air pollutants and negatively affecting human health and the environment (Reddington et al., 2021). The fire-specific air pollution in Asia Pacific not only poses a threat to the health of local residents but can also influence neighboring areas and even more distant locations through atmospheric transport (Zhu et al., 2016; Qin et al., 2024; Du et al., 2024).
However, large disparities in geographic patterns exist in fire-specific air pollution and population exposure studies, with related studies most centralized in high-income economies like North America and Europe (Aguilera et al., 2021; Tornevi et al., 2021; Korsiak et al., 2022; Wei et al., 2023). In contrast, the world's most widely burned regions, including Asia Pacific, remain underrepresented in the literature due to resource inequality and inadequate funding (Petersen, 2021; Lin et al., 2024). On the one hand, a major challenge in conducting studies on fire-related PM2.5 pollution and population exposure is how to isolate the fire-specific PM2.5 from observed background levels. More than 70 % of studies on fire-related datasets are concentrated in North America and Europe, using various approaches such as chemical transport models, satellite-based fire smoke plume analysis, and statistical approaches to quantify fire-specific PM2.5 (Aguilera et al., 2021; Schneider et al., 2021; Korsiak et al., 2022; Wei et al., 2023; Lin et al., 2024). However, there is still a lack of fire-specific PM2.5 in many other regions, including Asia Pacific, which accounts for 7.4 % of the global burned area and 27 % of the global cropland fires (Xu et al., 2023). On the other hand, associated with socioeconomic factors, increasing evidence highlights the unequal distribution of exposure to and impacts of air pollution, attributed to the disparities in the implementation of measures, effectiveness of regulations, adoption of clean energy technologies, and differences in infrastructure and healthcare conditions (Tessum et al., 2019; Jbaily et al., 2022; Kodros et al., 2022; Southerland et al., 2022; Rentschler and Leonova, 2023). However, few studies have focused on how fire-specific PM2.5 exposure manifests along lines of inequality, thereby exacerbating health disparities. Notably, there is a lack of research focusing on contributions of fire activities to PM2.5 in Asia Pacific as well as the health and socioeconomic impacts of fire-specific PM2.5.
This study utilized a TFIM and spatiotemporal interpolations through a machine learning algorithm to isolate fire-specific PM2.5 from monitoring observations in Asia Pacific. With the fire-specific PM2.5, variations in the contributions of fire activities to PM2.5 in Asia Pacific are analyzed. The health impacts caused by fire-specific PM2.5 and the relationship between poverty levels and fire-specific PM2.5 exposure in Asia Pacific were also examined. Based on the climate factors related to fire activities, this study aims to demonstrate whether the changing trends of fire-specific PM2.5 will continue due to climate change.
2.1 Data
2.1.1 Air quality data
The continuous air quality observation data were obtained from the OpenAQ website (http://openaq.org/, last access: 15 January 2025), while data for the China region primarily came from the Chinese National Environmental Monitoring Center (http://www.cnemc.cn/en/, last access: 15 January 2025). The total PM2.5 between 2014 and 2020 was measured using observation data from 1810 monitoring stations (Fig. 1) located throughout Asia Pacific (5–55° N, 65–133° E). Additionally, the CO measurements from these monitoring stations were utilized to validate the definition of fire influence using TFIM.
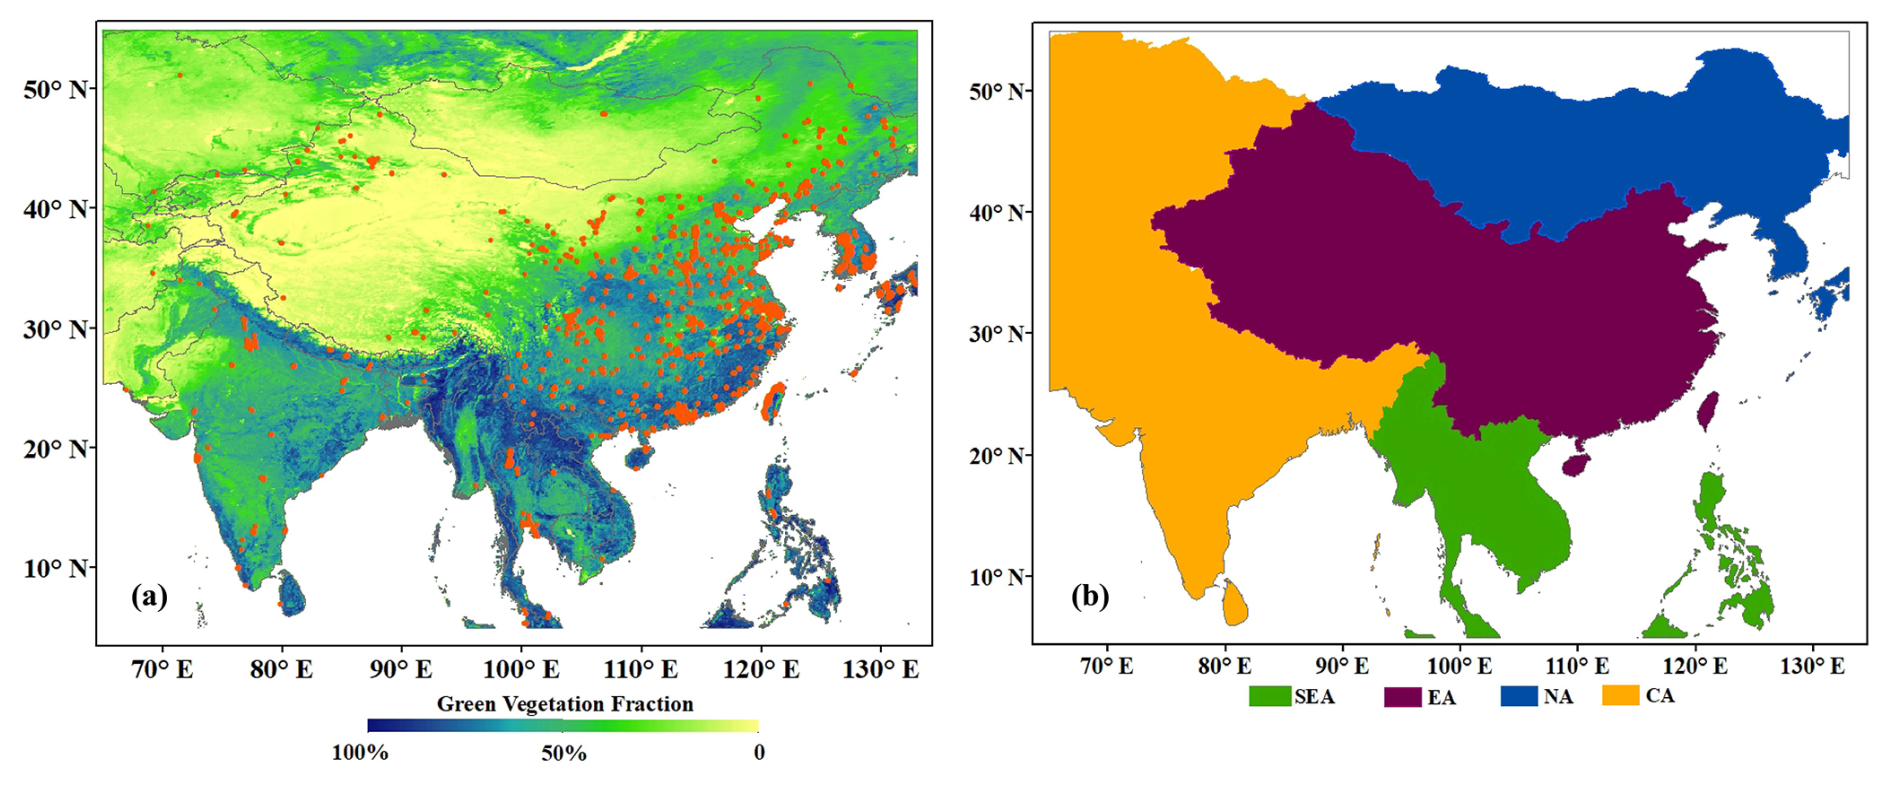
Figure 1(a) Distribution of air quality monitoring stations in Asia Pacific, with the shading color in the background indicating the green vegetation fraction. (b) The specific areas of the subregions include Southeast Asia (SEA), East Asia (EA), Northeast Asia (NEA), and Central Asia (CA).
2.1.2 Fire point data
The locations of fires were obtained from the Fire Information for Resource Management System (FIRMS). Archived fire pixels from the Moderate Resolution Imaging Spectroradiometer (MODIS) on the Aqua and Terra satellites for Asia Pacific from 2010 to 2021 were downloaded. The standard fire products with a resolution of 1 km × 1 km for each fire pixel were utilized. More information about the MODIS measurements can be found in Giglio et al. (2003) and Justice et al. (2011).
2.1.3 Additional variables
To estimate fire-specific PM2.5 concentrations, the study firstly used a spatiotemporal interpolation approach to calculate counterfactual PM2.5 in the absence of fire smoke. The spatiotemporal interpolation approach was realized based on machine learning methods with multiple potential explanatory variables, including aerosol optical depth (AOD) data, meteorological data, land use data, and other auxiliary information.
For AOD data, the reliability of the MODIS products on board the US Terra and Aqua satellites has been validated extensively (Lyapustin et al., 2018; Mhawish et al., 2019; Choi et al., 2019; Huang et al., 2020; Jin et al., 2023). The high-resolution AOD product, with a resolution of 1 km, is derived using the Multi-Angle Implementation of Atmospheric Correction (MAIAC) algorithm, which enhances the accuracy and spatial resolution of the AOD product (Lyapustin et al., 2018). The MAIAC AOD data were recently widely applied to retrieve ground-level PM2.5 concentrations (He et al., 2020; Li et al., 2020; Wei et al., 2023).
Satellite remote sensing offers uniform coverage, but satellite data are only feasible under clear-sky conditions. The MAIAC AOD contains large data gaps due to the ubiquitous presence of clouds. To fill spatiotemporal gaps of the MAIAC AOD, this study also supplemented MERRA-2 AOD products. MERRA-2 is the first global reanalysis dataset of the satellite era, provided by NASA's Modeling and Assimilation Data and Information Services Center. It assimilates ground-based aerosol observations, with a horizontal resolution of 0.625° × 0.5° and a temporal resolution of 1 h (Gelaro et al., 2017). Studies have used MERRA-2 aerosol products to conduct in-depth studies on atmospheric environmental issues in Asia (Jia et al., 2019; Feng et al., 2020). Additionally, MERRA-2 provides 50 aerosol products, including AOD, surface black carbon mass concentration, surface organic carbon mass concentration, and surface dust mass concentration. This study utilizes MERRA-2 reanalysis aerosol products as input data to construct the AOD PM2.5 model.
Meteorological variables affect air pollution, and therefore meteorological data provided by ERA5 data serve as input factors for estimating the PM2.5 in the absence of fire smoke. ERA5 data come from ECMWF and assimilate observational data as comprehensively as possible (including ground observations, soundings, aircraft data, and satellite observations). They are widely used in weather and climate-related research, with a horizontal resolution of 0.25° × 0.25°, and are divided into 37 vertical layers, with resolutions of 25 hPa from 750 to 1000 hPa and 50 hPa from 750 to 250 hPa, together with a temporal resolution of 1 h. The data used in the study included surface air pressure, 10 m U and V wind fields, 2 m temperature and dew point temperature, and specific humidity and temperature at 500 and 850 hPa.
Land use variables are proxies for emissions and background PM2.5. In this study, the land use coverage types collected from the MCD12Q1 Version 6 products and the 16 d composite Normalized Difference Vegetation Index (NDVI) derived from MODIS were utilized as input factors for PM2.5 estimation. In addition, the population counts obtained from LandScan were included to represent the impact of human activities on air pollution. The gross domestic product (GDP) data are obtained from Wang and Sun (2023), measured in PPP 2005 international dollars.
Table 1The original input features used in the construction of the machine learning method estimating fire-specific PM2.5.
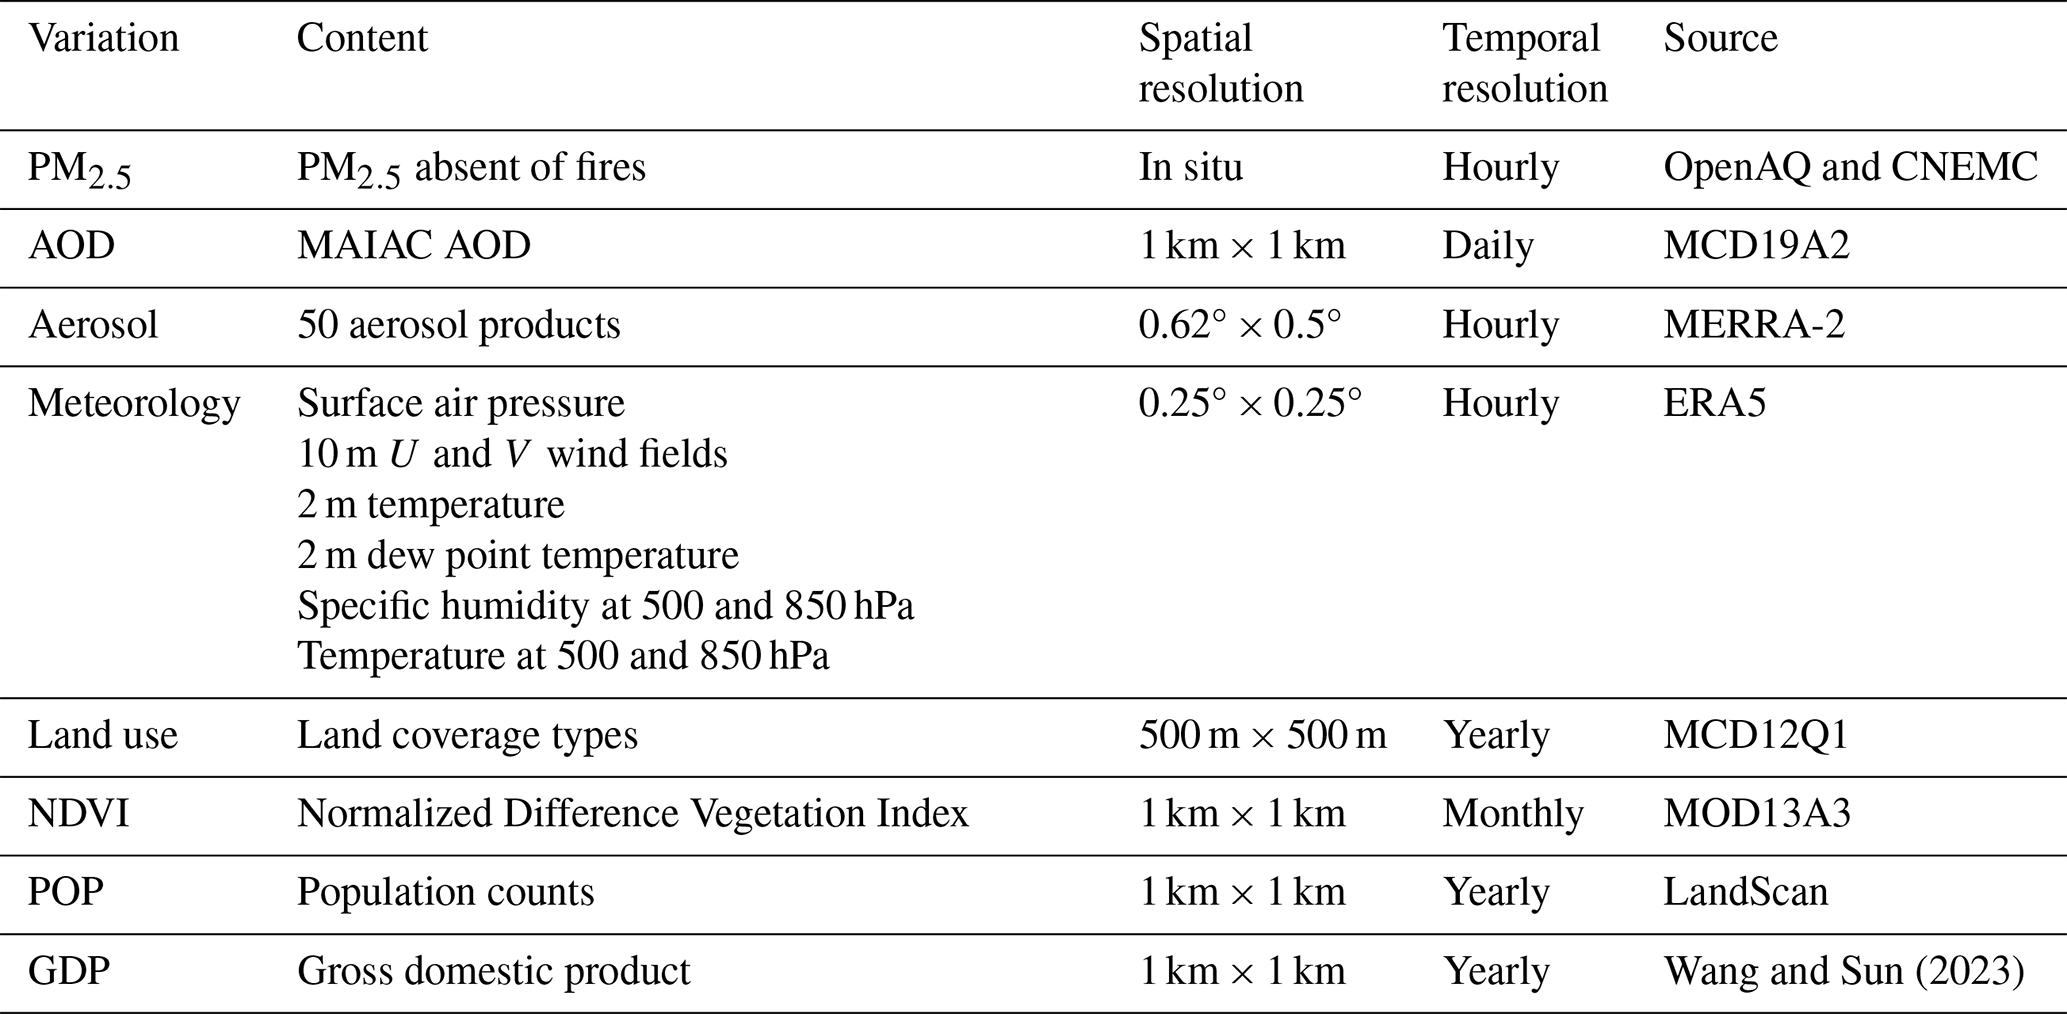
Table 1 summarizes the original input features used in the construction of machine learning methods estimating fire-specific PM2.5. Although the resolutions of the different datasets in the machine learning method are quite distinct, the target data are spatially and temporally dispersed points. Therefore, the construction of the machine learning method is essentially point to point. The input and output datasets are matched based on their relative positions, meaning that the input data are temporally and spatially closest to the output data.
2.1.4 Health data
To estimate the health impacts at a specific ambient PM2.5 exposure, population data from LandScan and mortality rate data from the online Global Burden of Disease (GBD) database (http://ghdx.healthdata.org/gbd-results-tool, last access: 8 February 2025) covering Asia Pacific from 2014 to 2020 were collected and used. The GBD database provides baseline mortality data for male and female populations across 5-year age groups. This study considers health endpoints for four diseases: stroke (STROKE), chronic obstructive pulmonary disease (COPD), ischemic heart disease (IHD), and lung cancer (LC).
2.1.5 Infant mortality rates
The infant mortality rate (IMR) dataset from the NASA Socioeconomic Data and Applications Center was used as a proxy for population poverty levels in this study. The IMR is defined as the number of children who die before their first birthday for every 1000 live births in a given year (Barbier and Hochard, 2019; Reddington et al., 2021). The IMR dataset has been widely used as a poverty indicator, with specific thresholds to assess and categorize poverty levels (Barlow et al., 2016; Barbier and Hochard, 2019). This study defines populations with IMR ≤ 40 as being relatively not poor, 41 ≤ IMZ ≤ 60 as being moderately poor, and IMR ≥ 61 as being relatively poor, which is similar to the definition in Barbier and Hochard (2019).
2.1.6 The Coupled Model Intercomparison Project Phase 6 data
Referring to previous studies, a positive relationship may exist between the vapor pressure deficit (VPD) and the fire-specific PM2.5 (Abatzoglou and Williams, 2016; Burke et al., 2023). To validate this relationship and quantify the future trend of the fire-specific PM2.5 in Asia Pacific, VPD was calculated using the projected temperature and relative humidity data from global climate model (GCM) ensembles in various emission scenarios. The study examined VPD changes in three commonly used climate scenarios (SSP1-2.6, SSP2-4.5, and SSP3-7.0), based on monthly data provided by 34 GCMs. To minimize uncertainty and to account for internal variability, the average VPD values for different regions in Asia Pacific were computed for each GCM and emission scenario.
2.2 Methods
2.2.1 Fire influence definition
To understand how fire impacts air quality, whether or not an ambient PM2.5 measurement has been influenced by fire should be determined. Following the TFIM proposed as by Schneider et al. (2021), this study calculated the backward trajectories for monitoring stations over a 72 h period. The FLEXPART model (version 10.4), a Lagrangian particle dispersion model developed by the Norwegian Institute for Air Research, was used for back-trajectory calculation. FLEXPART v10.4 was driven using ERA5 data at a temporal interval of 1 h. These trajectories were then spatially and temporally matched with fire hotspot data reported by FIRMS. If the distance between the two was within 0.5°, an interception was considered to occur. If a trajectory was more than the interception threshold, the PM2.5 measurement at that time was deemed to be influenced by fire. A schematic of the TFIM is shown in Fig. 2.
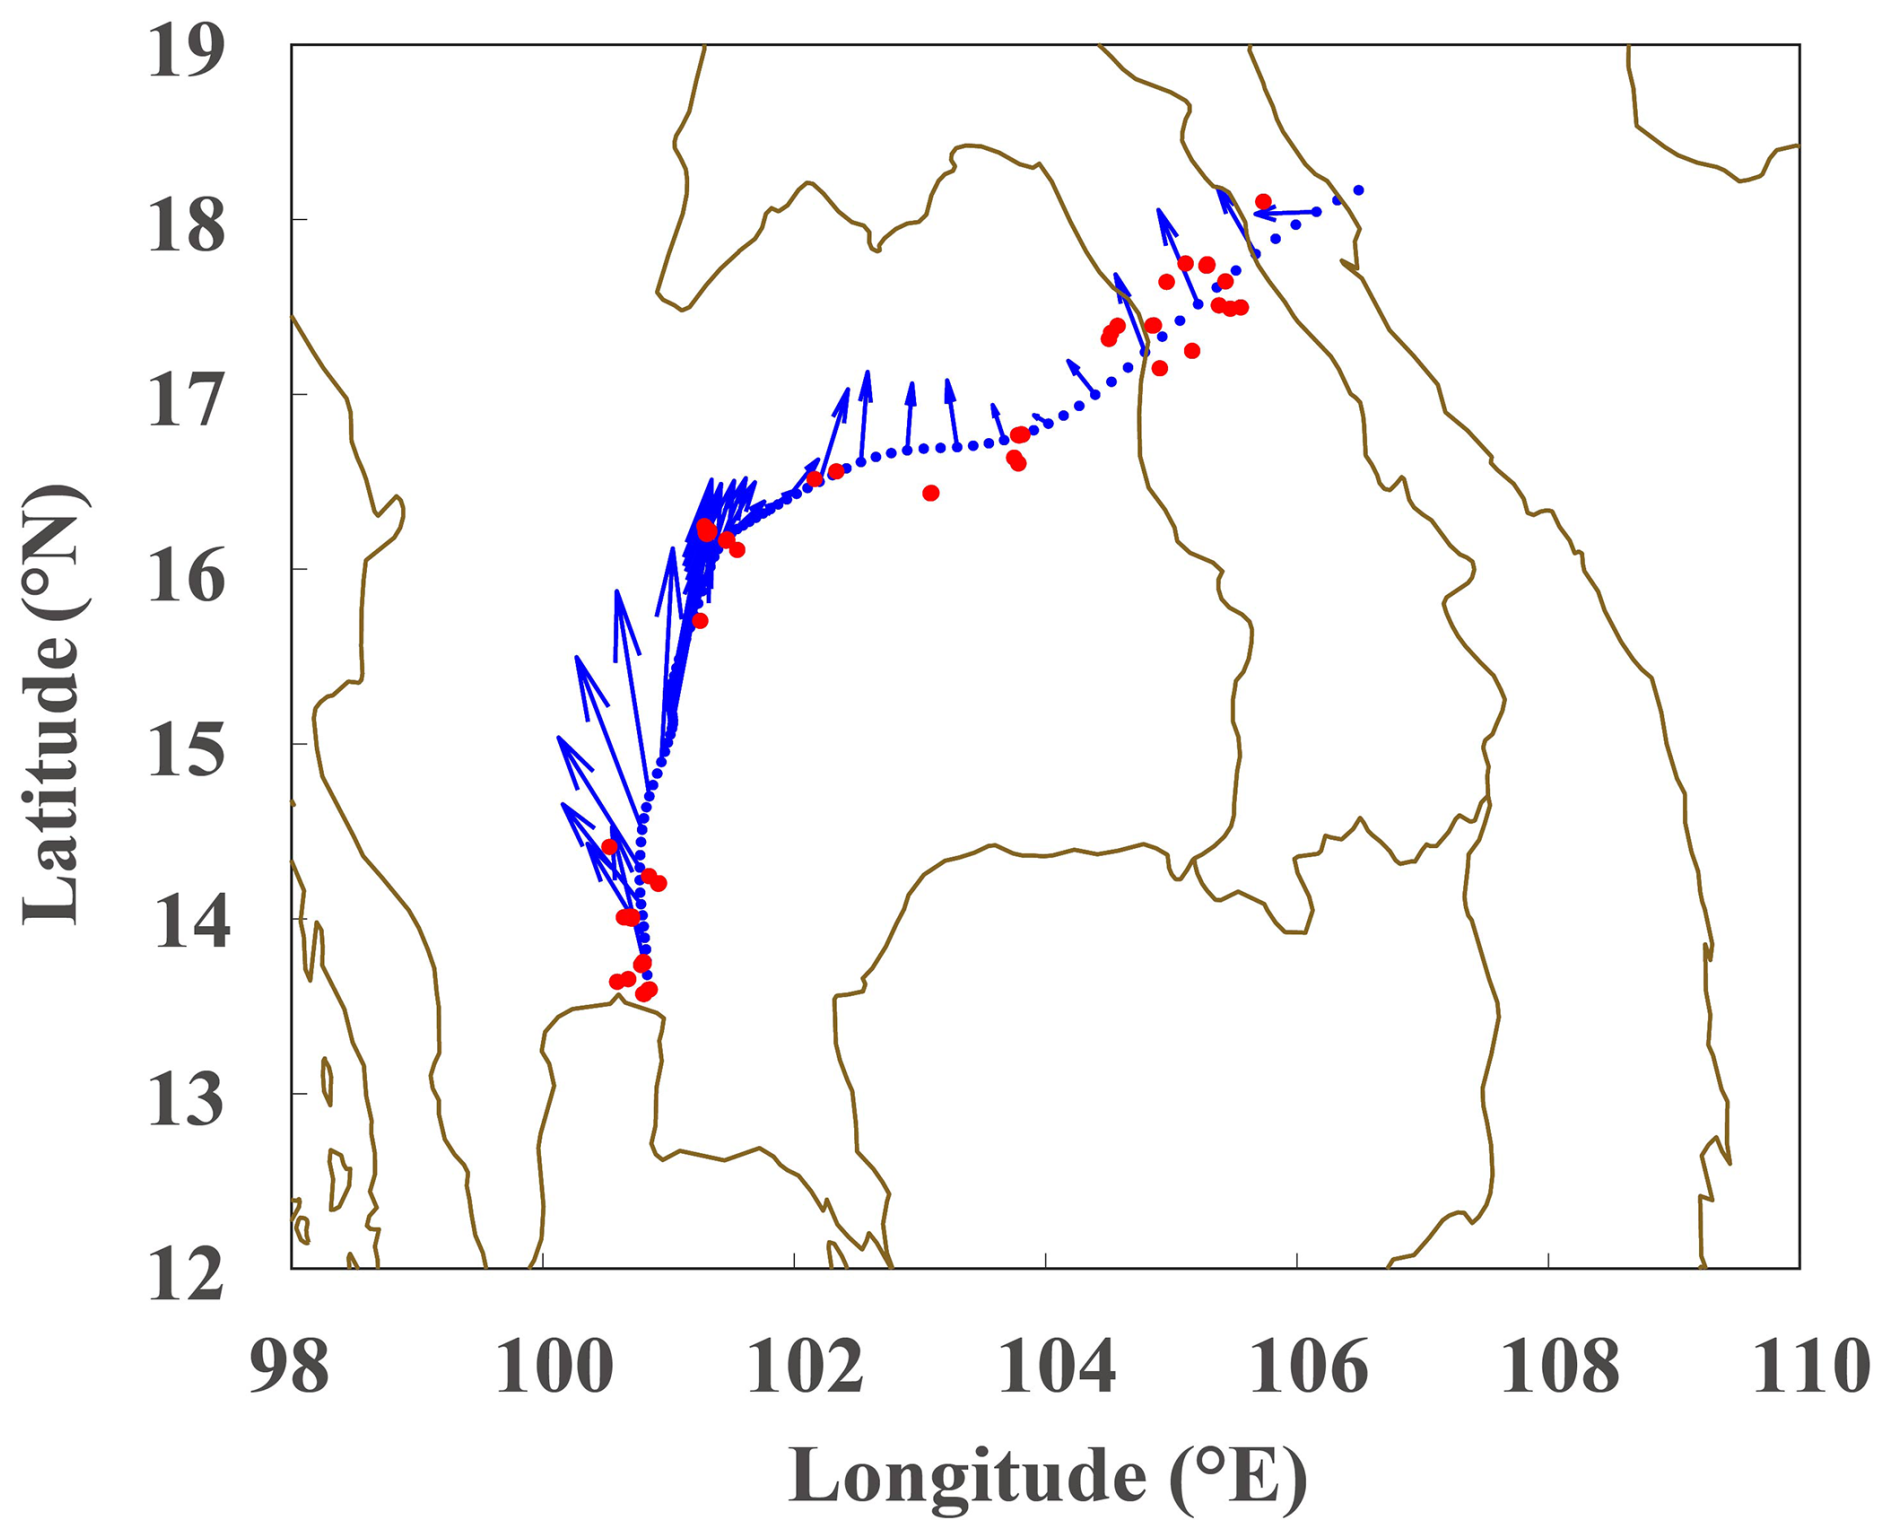
Figure 2The schematic of the trajectory–fire interception method (TFIM), where the blue lines represent the backward trajectories and the red points indicate the fire hotspots.
2.2.2 Fire-specific PM2.5 estimation
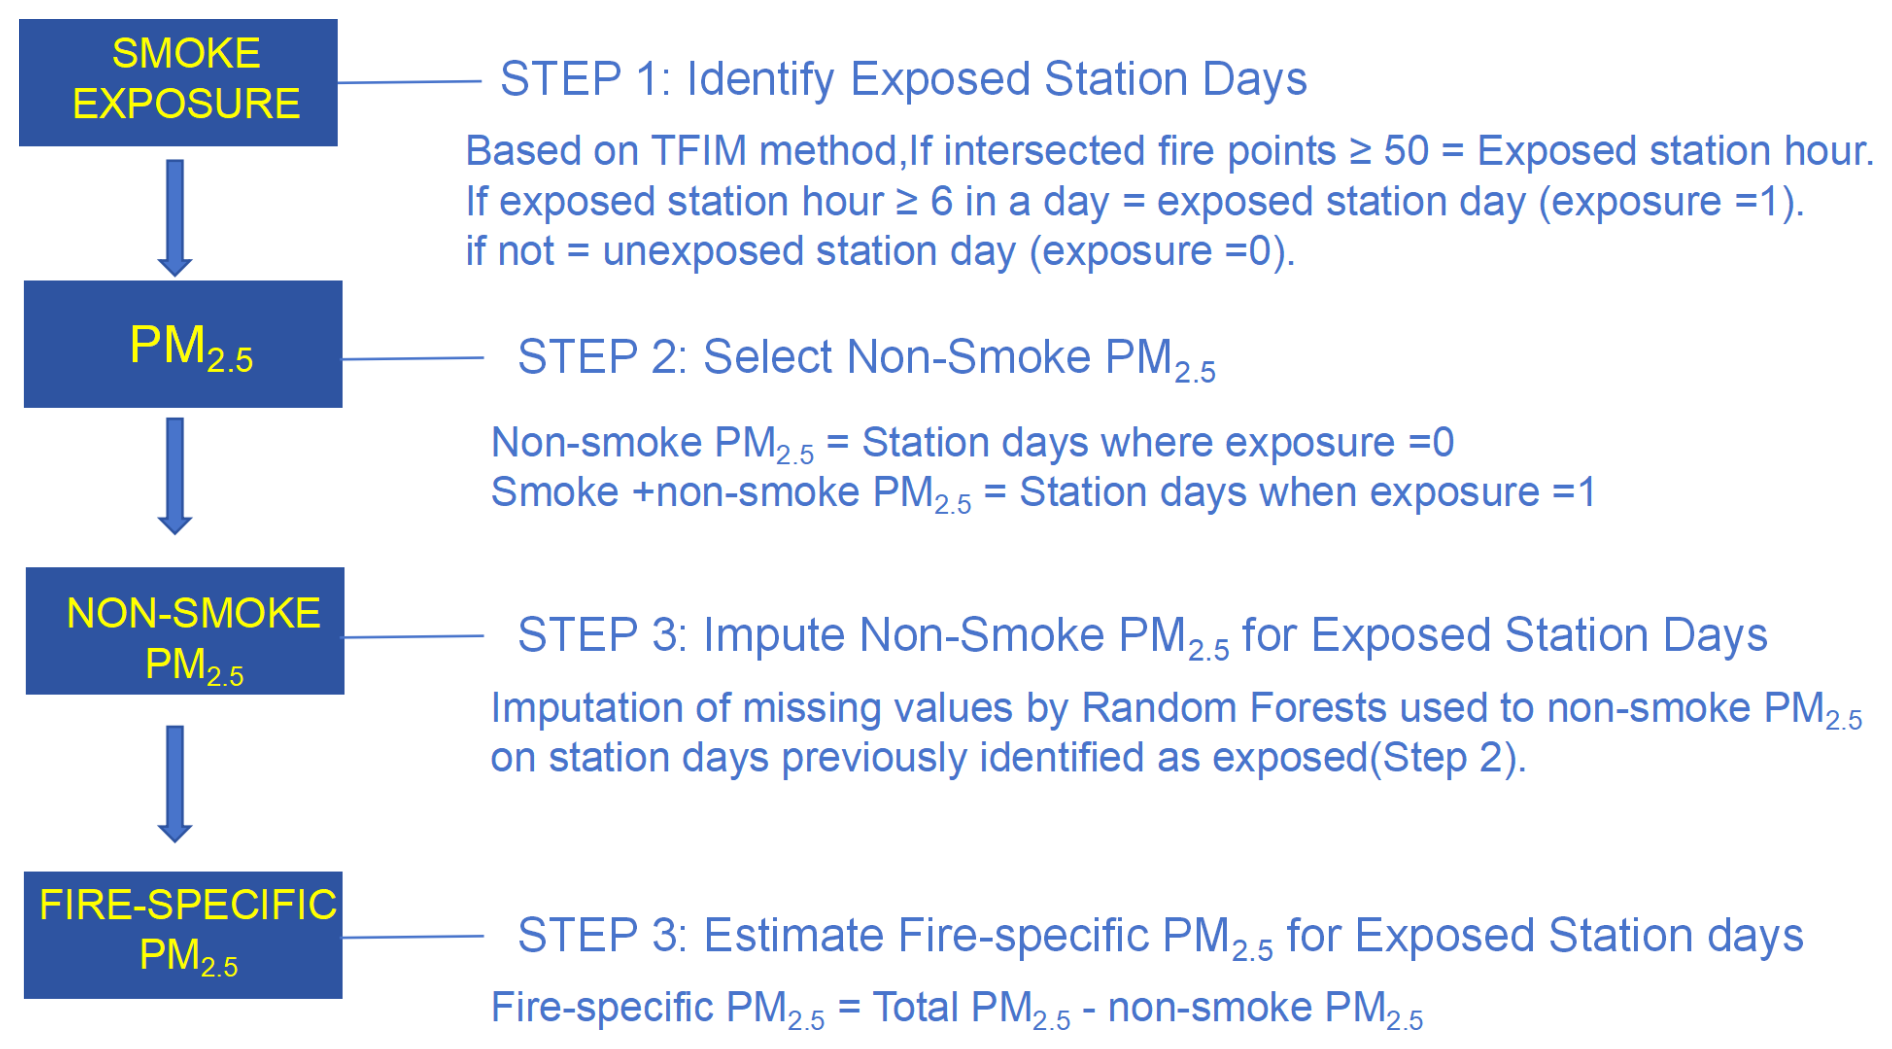
To estimate the fire-specific PM2.5 covering Asia Pacific from 2014 to 2020, the counterfactual PM2.5 unaffected by fire was interpolated through the machine learning method and then compared with the ambient PM2.5 measurement to get the fire-specific PM2.5. The specific steps in Fig. 3 were followed. Since there are no direct fire smoke observation data over Asia Pacific, the TFIM as described in Sect. 2.2.1 was used as a substitute. First, using the TFIM, the fire influence periods for a given monitoring station time were determined. If a station experienced over 6 h of fire influence in a day, it was considered to be exposed to fire smoke on that day. Based on the exposure definition, the station days exposed to fire were temporarily removed. Next, the random forest method was employed to interpolate non-fire-affected PM2.5 for all station days categorized as fire-affected. Random forests are a combination of tree predictors, such that each tree depends on the values of a random vector sampled independently and with the same distribution for all trees in the forest (Breiman, 2001). Since it is relatively robust to noise, random forests are not prone to overfitting, so that this is carried over into various fields of data mining (Lu et al., 2021). In this study, we utilize random forest to estimate PM2.5, which lacks fire with multiple input features. The algorithm provides insights into feature importance, allowing us to understand which variables contribute most significantly to predictions. In our study, the feature importance of the 60 original input datasets (Table 1) was calculated based on random forest, and then PM2.5 absent of fire was estimated with the algorithm. This step provided a background PM2.5 estimation unrelated to fire contributions. The PM2.5 from non-fire-affected station days was used as the training, testing, and validation datasets to build the model, and interpolation estimation was performed for the background PM2.5 for fire-affected station days. Finally, by subtracting the non-fire-affected part from the ambient PM2.5 measurement, the fire-specific PM2.5 was estimated.
2.2.3 PM2.5 health impact assessment
The disease burden attributable to PM2.5 exposure was assessed using the health impact function (HIF). The expression for this function is as follows:
where ΔMort denotes the premature death due to PM2.5 exposure for health endpoint i, Bi represents the mortality rate for endpoint i, POP is the exposed population, and RRi is the relative risk associated with PM2.5 exposure for health endpoint i.
With the advancement of epidemiological research, an integrated exposure–response (IER) equation integrates available RR (relative risk) information from multiple exposure–response functions, including air pollution, active smoking, passive secondhand smoke exposure, and indoor cooking fuel combustion scenarios. The IER equation combines findings from studies on both low- and high-exposure concentrations to consider four major health endpoints (STROKE, COPD, IHD, and LC). The expression for the IER has the following form:
where C represents the PM2.5 concentration; C0 is the concentration threshold below which health risks are negligible; and the parameters α, γ, and δ represent the fitted parameters for health endpoint i to describe the relative risk curve. The values for the parameters can be found in studies by Burnett et al. (2014) and Song et al. (2017). The values of these key parameters and their 95 % CIs used in this study are also provided in Table S1 in the Supplement.
3.1 Estimating fire-specific PM2.5
Fire hotspot numbers derived from the FIRMS products in Asia Pacific peaked during February to April (with daily counts exceeding 1000). Therefore, we defined this period as the fire season in this study (Fig. 4). In terms of spatial distribution, the fire hotspot number in SEA is more than double that of the other three regions during the fire season. Fires in SEA mainly occur during the pre-monsoon period (roughly February to April) due to widespread forest fires and agricultural residue burning in preparation for planting before the arrival of the Asian summer monsoon (Huang et al., 2017; Phairuang et al., 2017). The increase in fire activity coincides with the establishment of stable temperature inversions over large areas of Thailand, Vietnam, Laos, and southern China, while northern Thailand experiences hot, dry, and calm conditions that facilitate the formation of haze (Reddington et al., 2021). Fire activities significantly decrease after the onset of summer monsoon rainfall (in late April) and remain low until the beginning of the dry season (in November). The fire occurrences in this region exhibit a certain degree of interannual variability (Fig. 4c and d) that is related to changes in atmospheric circulation patterns, such as the India–Burma trough (Huang et al., 2017). In addition to climatic influences, local fire management policies also play a role; for example, the implementation of stricter agricultural burning policies in the SEA mainland between 2016 and 2017 was associated with a significant reduction in fire point counts. However, after 2018, the number of fire points once again showed an upward trend.
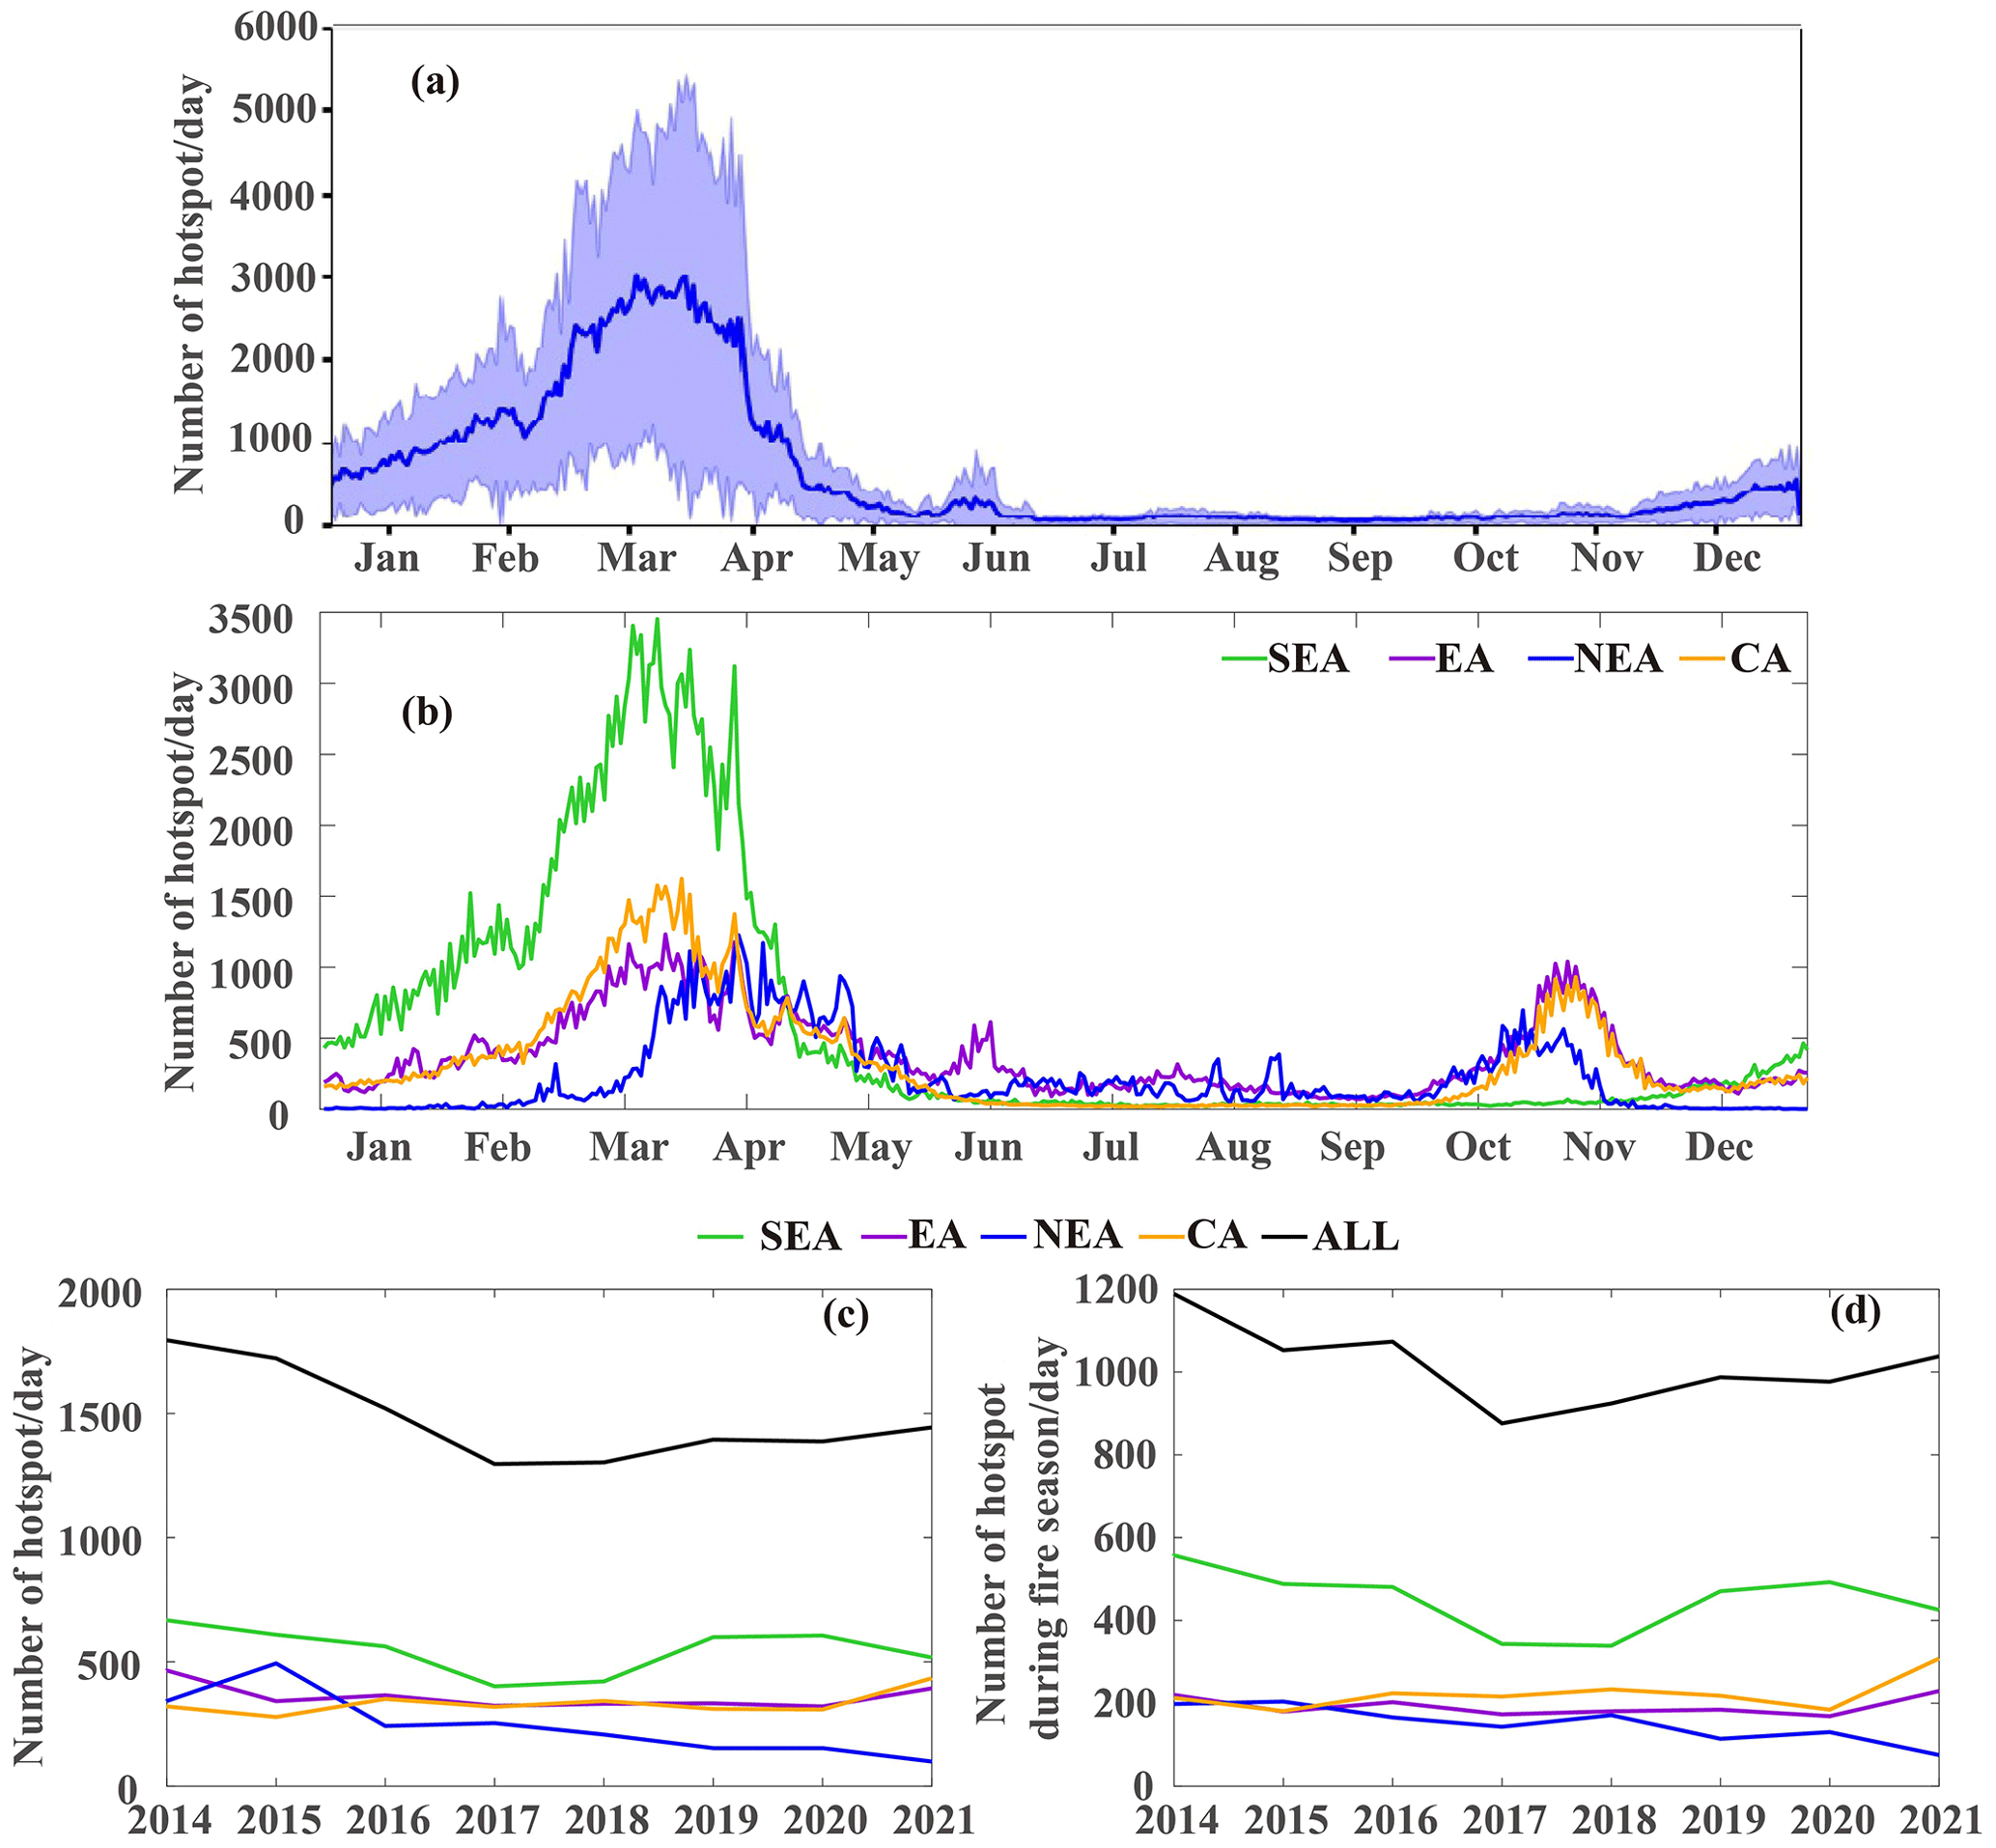
Figure 4The variations from 2014 to 2021 of (a) day-to-day fire hotspots in Asia Pacific, (b) day-to-day fire hotspots in the four subregions, (c) annual averaged fire hotspots, and (d) averaged fire hotspots during the fire season in the different regions.
The fire hotspot number in CA is slightly higher than that in EA during the fire season (Fig. 4b and d). The dry and hot conditions before the monsoon in CA create favorable conditions for forest fires in the dense vegetation of the Indian subcontinent. Additionally, the dry winter climate in CA can also contribute to fire occurrences (Barik and Baidya, 2023). As a result, the peak fire point counts in CA primarily occur in March–April and October–November. The climate conditions in EA are complex. During spring and fall, northern China and southwestern China experience clear weather, low precipitation, and dry vegetation, making them prone to forest fires, especially under windy conditions. In the western Xinjiang region, the peak period for forest fires is concentrated in the summer, particularly for fires caused by lightning, with a significant number occurring in July–August. The NEA region is located relatively further north, with the start of the growing season lagging behind the other three regions, while the end of the growing season occurs earlier than in the other regions. As a result, the peak fire point period in NEA is delayed in spring (March–May) compared to the other three regions but is slightly advanced in fall. The average daily number of fire points in CA, EA, and NEA shows a slow increasing trend from 2014 to 2021.
To isolate the fire-specific PM2.5 based on TFIM, we should firstly justify the usability of TFIM in Asia Pacific and then set a suitable threshold of fire hotspot interception for the region. In this study, we select PM2.5 as the fire emission tracer, as it is well known that PM2.5 can be emitted by fires. CO can also serve as a tracer for fire influence. CO can be produced from incomplete combustion and has a long atmospheric lifetime. However, the range of CO is not as large as it is for PM2.5. The variations in PM2.5 during high-influence fires can be over 100 µg m−3, which is more than double that of the clean period, while CO varies much less. In addition, the much more widespread PM2.5 measurements compared to CO in Asia Pacific are another reason why PM2.5 is chosen as the tracer for fire emissions. We then compared the number of interception fire hotspots with the measured PM2.5 in Fig. 5. In Fig. 5a, the correlation between the interception number and PM2.5 is not strong, indicating that identifying fire influence based on trajectory interception of a single fire hotspot is not effective. When we set the interception threshold to 50, the correlation improves significantly. This improvement may be due to larger and more fires generating more PM2.5. Figure 5c illustrates how the correlations vary as the interception threshold changes. The correlation reaches its maximum at a threshold of 50. Therefore we set the interception threshold to 50 when measuring the fire influence on PM2.5 in Asia Pacific. Compared to the threshold of 20 in North America proposed by Schneider et al. (2021), the interception threshold in Asia Pacific is higher, because the study area is much larger and the scale of the fires is relatively smaller. This method eliminates fire hotspots that contribute minimally to PM2.5 variations while including as many measurements as possible.
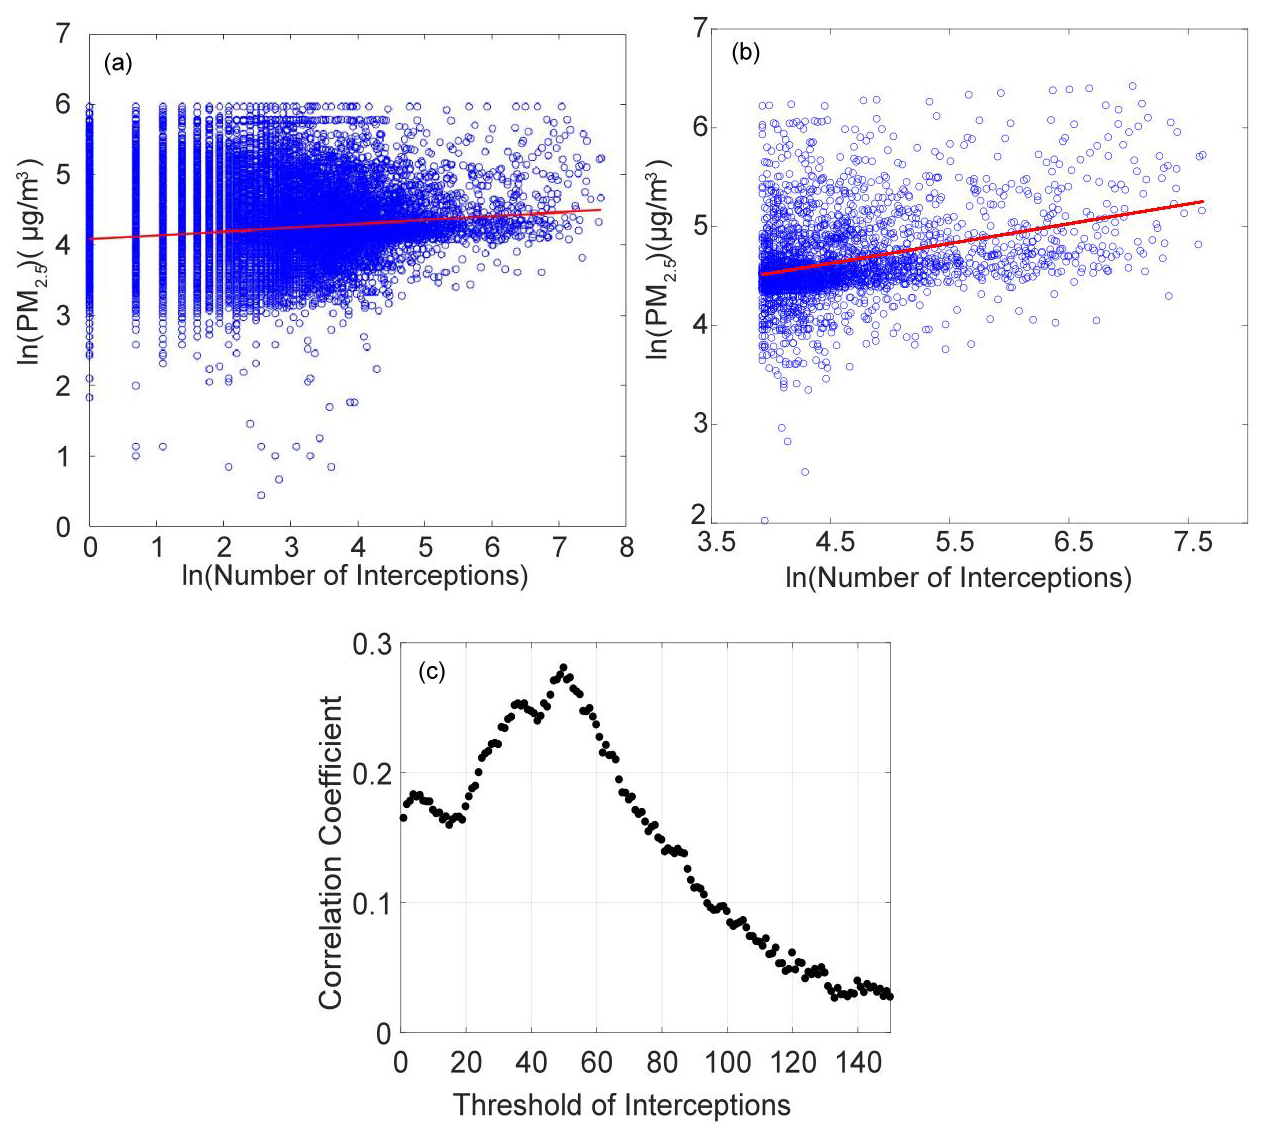
Figure 5(a, b) Scatter distributions of PM2.5 concentrations against the number of fire hotspots when the interception threshold is set to 1 and 50, respectively. (c) Correlation coefficient between PM2.5 and the number of fire hotspots as a function of the interception threshold.
Using TFIM, we isolate the station days influenced by fires. To estimate the fire-specific PM2.5, we employed a random forest model for interpolation to estimate the counterfactual PM2.5 that lacks fire influence and then compare the PM2.5 observation with the counterfactual PM2.5 to get the fire-specific PM2.5.
With multisource data of station days that lack fires, we generate the datasets for machine learning model construction. There are in total 60 initial input variations, including 50 aerosol variables from MERRA-2, MAIAC AOD, meteorological factors, land use, and the NDVI and GDP data. We ranked the importance of these variables using random forest, with the 15 most influential variables in Fig. 6a. The most influential variables for PM2.5 that lack fire are the surface black carbon mass (BCSMASS from MERRA-2) followed by the surface mass concentrations of various PM2.5 components like organic carbon and dust. Meteorological factors contribute to explaining variations in background PM2.5. Temperature, pressure, and humidity near the ground can affect the formation of particles by influencing chemical actions between precursors, while large-scale weather circulations also impact pollutant transport and accumulation through high-level meteorological factors. In addition, other variations such as GDP and NDVI play a role in calculating the background PM2.5. GDP is expected to reflect the economic conditions and background anthropogenic emissions in the various regions, while NDVI represents the vegetation cover status, which not only reflects the vegetation emissions but also indicates the interception and deposition of PM2.5 by vegetation. It is indeed important to acknowledge the significant role of anthropogenic emissions in ambient PM2.5 concentrations across Asian countries. To comprehensively account for anthropogenic aerosols in this study, we considered not only indirect reflection features such as GDP and population during the construction of the machine learning model but also various aerosol data that directly reflect anthropogenic sources. This includes black carbon, organic carbon, and SO2 surface mass concentrations. These data are derived from the MERRA-2 reanalysis, which assimilates multiple aerosol remote sensing, emission, and meteorological datasets using the Goddard Earth Observing System Model. With these advances, MERRA-2 aerosol products can provide reliable anthropogenic and natural aerosols (like dust). We then established an estimation model using random forest with the 15 most influential input data to calculate the PM2.5 that lacks fire. The background PM2.5 estimates derived from the model were compared with observations, with an estimated R2 of 0.8958 and a RMSE of 0.3370 µg m−3 (Fig. 6b). A low underestimation of the background PM2.5 shows that the estimation has been highly correlated with observations compared with similar studies (Aguilera et al., 2021, 2023; Wei et al., 2023).
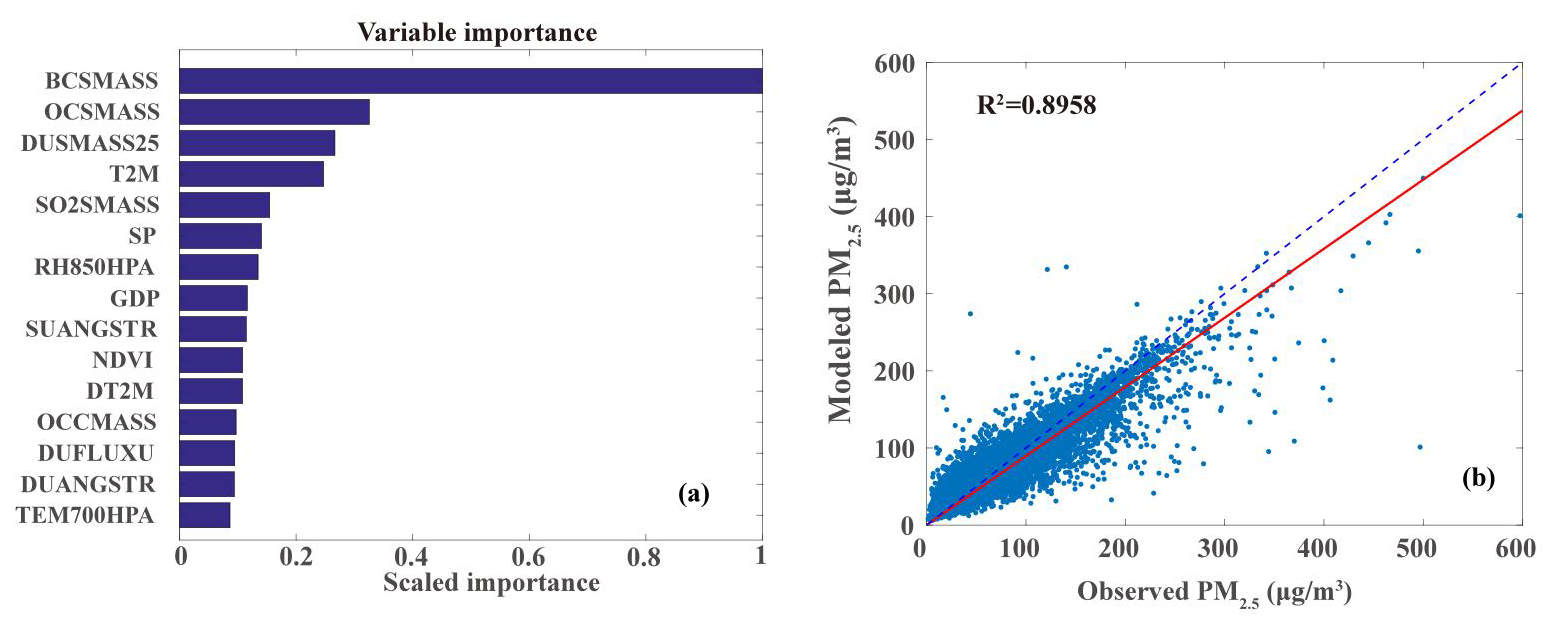
Figure 6(a) Variation importance for the top 15 variables in estimating the background PM2.5. (b) Scatter distribution between the modeled and observed PM2.5 that lacks fire. The dashed blue line represents the reference, and the red line is the linear model fit.
3.2 The spatial and temporal distributions of PM2.5 and the fire-specific PM2.5
The fire-specific PM2.5 was then estimated by subtracting the background PM2.5 that lacks fire from the monitoring PM2.5. Figure 7a and b show spatial distributions of the 8-year mean total PM2.5 and fire-specific PM2.5 in Asia Pacific. PM2.5 in Asia Pacific has mostly exceeded the health concentration standards for PM2.5 set by the World Health Organization (WHO) (annual average not exceeding 10 µg m−3). The highest mean concentrations for the total PM2.5 are observed in northern India and Pakistan, followed by northeastern China, the Indochina Peninsula, Mongolia, and central India. To improve air quality, various measurements and particulate matter environmental standards have been implemented in countries of Asia Pacific, such as China's Air Pollution Prevention and Control Action Plan since 2013, South Korea's enacting of the special act on the reduction and management of fine dust in 2018, India's launch of the National Clean Air Programme in 2019, and Thailand's amendment of the Enhancement and Conservation of National Environmental Quality Act in 2018. From 2014 to 2021, observed PM2.5 concentrations saw a substantial decrease in various regions of Asia Pacific (Fig. 9). The highest PM2.5 was monitored in EA during the early period, but from 2018 PM2.5 in CA began to exceed that of EA. In contrast, NEA and SEA have experienced lower annual average PM2.5 concentrations.
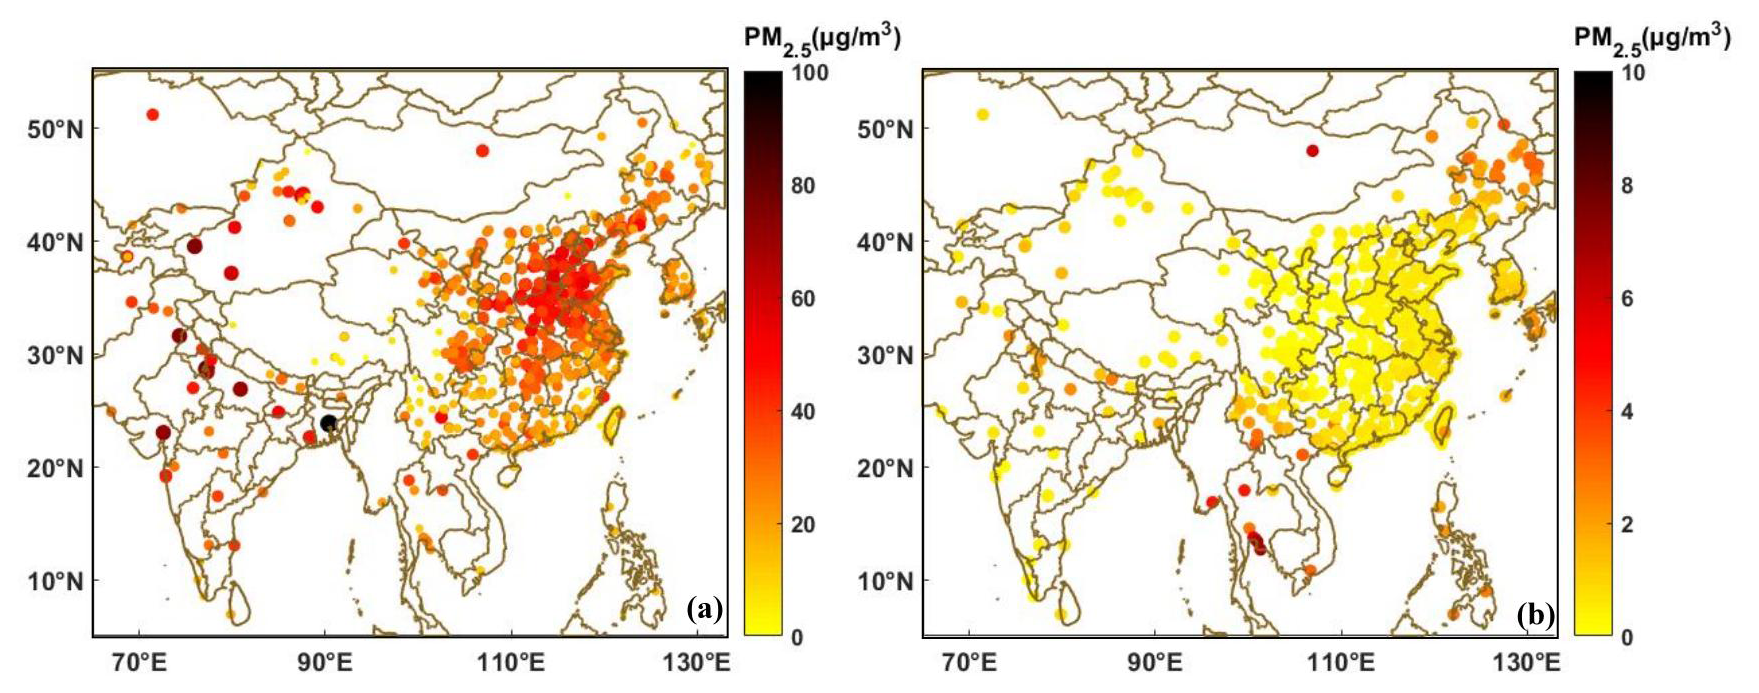
Figure 7Distributions of (a) the mean PM2.5 from all sources and (b) the mean fire-specific PM2.5.
The spatial distribution of fire-specific PM2.5 is quite different with the total PM2.5, with the highest concentrations appearing in SEA and Mongolia. As shown in Fig. 4, the fire hotspot number in SEA is more than twice that in the other regions, which may partly explain the higher fire-specific PM2.5 in this region. Mongolia has a large area of semi-arid forests with grass understories. Forests located in mid- to high-latitude areas and dominated by a few coniferous tree species are prone to a series of fire behaviors during droughts. Due to limited funding, firefighting efforts for forest fires in Mongolia are somewhat limited, leading to large-scale, long-duration forest and grassland fires during the dry season. Climate change, especially droughts, has intensified fire activities in southern Siberia (including Mongolia), leading to a notable increase in fire numbers and shorter fire intervals (Hessl et al., 2016; Huang et al., 2024; Gui et al., 2024). As a result, higher fire-specific PM2.5 can be found in the Asia Pacific region. In addition, northern India is susceptible to fires before the monsoon and during the dry winter season, and northeastern China and southwestern China are prone to forest fires in spring and fall.
The annual average concentration of fire-specific PM2.5 ranges from 2 to 8 µg m−3, surging to between 2 and 15 µg m−3 during the fire season. Areas where the concentration of fire-specific PM2.5 surpasses 10 µg m−3 encompass northern India, northeastern and southwestern China, and several countries across SEA during the fire seasons, as depicted in Figs. 7 and 8. The values for each region in Fig. 8 are derived from the average values for sites within the region. In areas with few stations (like Mongolia and the Tibetan Plateau in Fig. 1), while the calculation results may not accurately reflect the fine spatial distribution within the region, using these averages to represent the regional mean is still relatively reasonable. In contrast to the distribution of the total PM2.5, fire-specific PM2.5 is notably higher in NEA and SEA in terms of both annual average and fire season. In addition, fire-specific PM2.5 saw increasing trends in NEA since 2016 and in SEA since 2018, with this trend being more pronounced during the fire season. In contrast, the fire-specific PM2.5 in EA and CA shows a slow decline. The total PM2.5 has seen a significant decline thanks to efforts in controlling anthropogenic emissions from industry and transportation. However, fire-specific PM2.5 decreases more slowly or even rebounds, leading to a gradual increase in the proportion of fire-specific PM2.5 within the total concentrations. In NEA, the proportion during the fire season grew from 0.2 to 0.3, while in SEA it rose from 0.2 in 2018 to 0.4 in 2021. Proportions of the fire-specific PM2.5 in Malaysia, Cambodia, and Brunei even exceeded 0.5 during the fire season (Fig. 8). The proportions in EA and CA also display gradual upward trends.
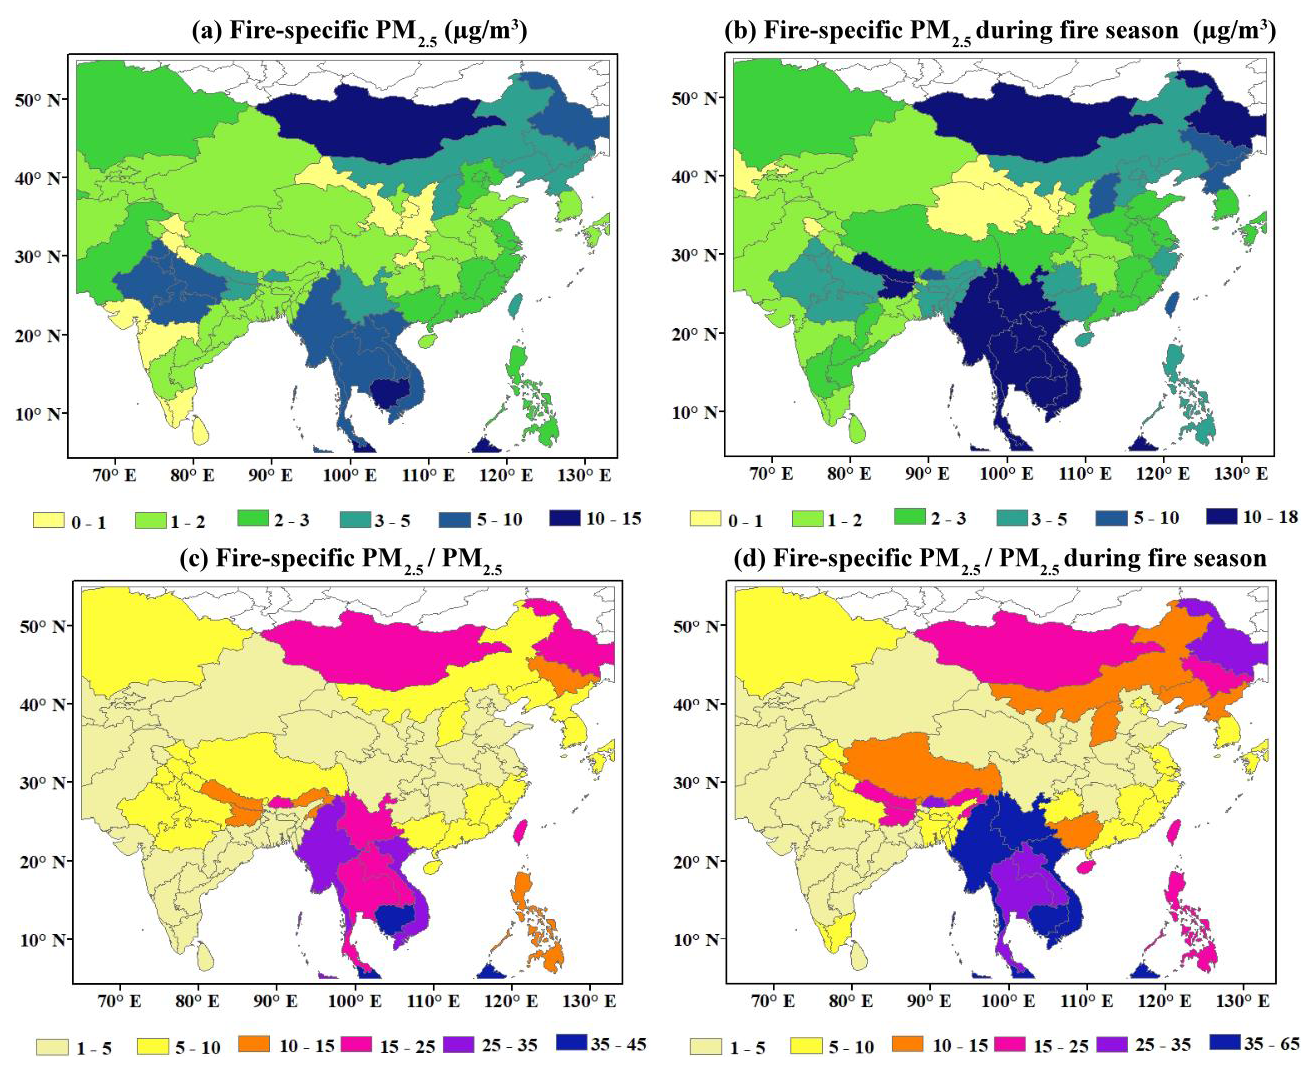
Figure 8Regional averaged distributions of (a) annual mean and (b) fire season mean fire-specific PM2.5. Proportion of (c) annual mean and (d) fire season mean fire-specific PM2.5 in the total PM2.5. The values for each region in Fig. 8 are derived from the average values for sites within the region.
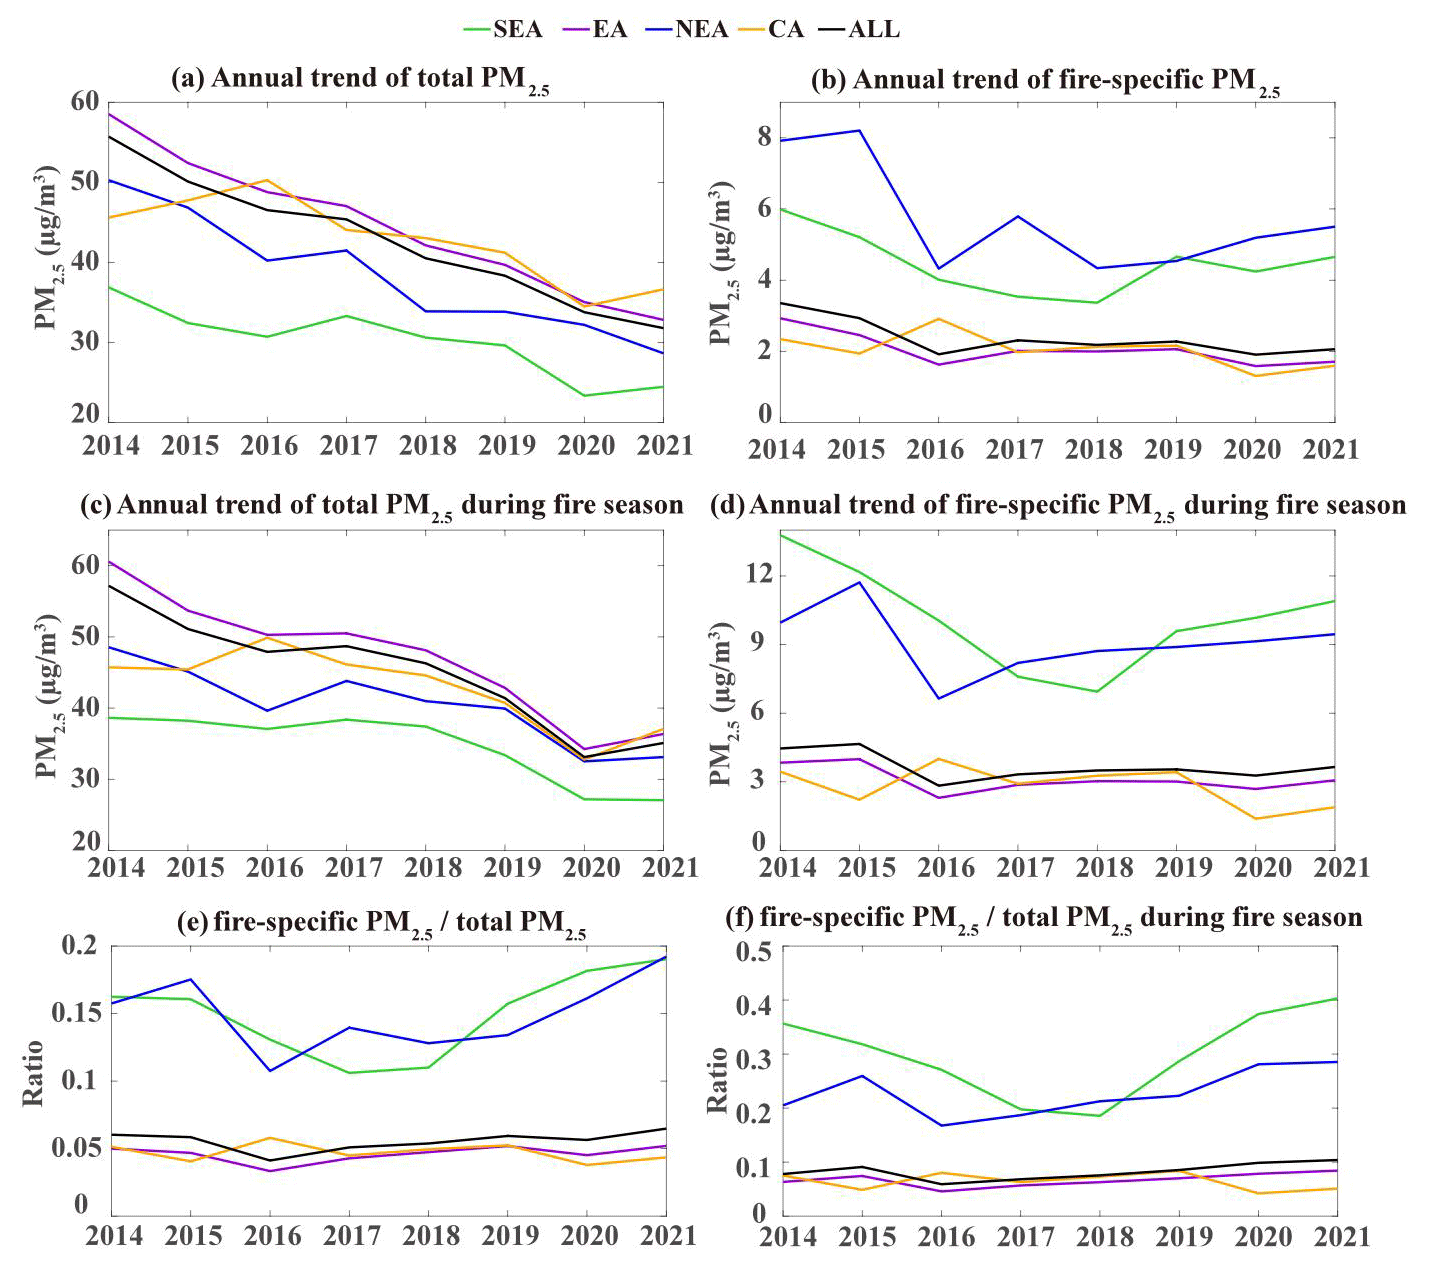
Figure 9Temporal variations of (a) annual mean PM2.5 and (b) fire season mean PM2.5 in different regions. Panels (c) and (d) are similar to panels (a) and (b) but for fire-specific PM2.5. Panels (e) and (f) are similar to panels (a) and (b) but for proportions of fire-specific PM2.5 to the total PM2.5.
3.3 The fire-specific PM2.5 exposure and health impact
To illustrate the population exposure, we then calculated the population-weighted PM2.5 and fire-specific PM2.5 from 2014 to 2021 (Fig. S1). Population-weighted PM2.5 in different regions saw a significant decline during the 8 years, with reductions of 30.5 % in SEA, 41.1 % in EA, 31.4 % in NEA, and 7.9 % in CA, amounting to an overall decrease of 39.9 % for the entire region. PM2.5 concentrations are high in densely populated areas of CA, such as northern India, Bangladesh, and Pakistan (Fig. S2), resulting in a higher population-weighted PM2.5. This indicates that the population in CA is more likely to be exposed to PM2.5. In EA, population-weighted PM2.5 concentrations are higher in the east and lower in the west, which is consistent with the distribution of population density in the region. The distributions of the population-weighted PM2.5 in SEA and NEA are similar to their averaged PM2.5. During the fire seasons, distributions of population exposure to PM2.5 differ from those of the total PM2.5. Population-weighted fire-specific PM2.5 in SEA is higher than the mean PM2.5, indicating that populations in SEA are more vulnerable to fire-specific PM2.5 exposure. However, the population-weighted PM2.5 in CA is slightly lower than the mean PM2.5.
We then estimated the prevented premature deaths due to changes in exposure to PM2.5 by eliminating fire emissions. Eliminating fire-specific PM2.5 can prevent approximately 58 000 (95 % confidence interval – CI – of 32 600–82 600) premature deaths annually in SEA, 90 000 (95 % CI of 63 700–106 000) in EA, 157 000 (95 % CI of 110 000–186 000) in CA, and 29 300 (95 % CI of 18 000–39 700) in NEA. These account for about 40.9 % (95 % CI of 22.8 %–57.7 %), 14.9 % (95 % CI of 10.5 %–17.6 %), 19.4 % (95 % CI of 13.5 %–24.5 %), and 24.1 % (95 % CI of 14.8 %–32.5 %) of the total annual premature deaths attributed to PM2.5. During the fire season, these proportions can rise to 57.7 % (95 % CI of 27.3 %–81.6 %), 19.5 % (95 % CI of 12.3 %–24.6 %), 21.6 % (95 % CI of 14.8 %–27.4 %), and 31.6 % (95 % CI of 17.2 %–44.4 %). Distributions of premature deaths due to PM2.5 in CA and NEA (Fig. 10) are closely aligned with the population distribution (Fig. S2), because in these regions areas with higher population densities tend to be exposed to higher PM2.5. The highest number of premature deaths attributed to fire-specific PM2.5 occurred in Myanmar, Vietnam, northern India, and Pakistan, with notable increases during the fire season in Thailand and southwestern China. Distributions of premature deaths attributed to PM2.5 relative to regional population proportions closely resemble the PM2.5 distribution, with areas exceeding 50 per 100 000 mainly located in regions where the annual mean PM2.5 exceeds 40 µg m−3. Similarly, the distribution of premature deaths caused by fire-specific PM2.5 aligns closely with the PM2.5 distribution (Fig. 10d), with areas exceeding 20 per 100 000 predominantly found in the fire-prone Southeast Asian Peninsula, Mongolia, and northeastern China. The number of annual premature deaths due to fire-specific PM2.5 in the whole study region is around 1.7 million, accounting for 47.2 per 100 000 of the total population.
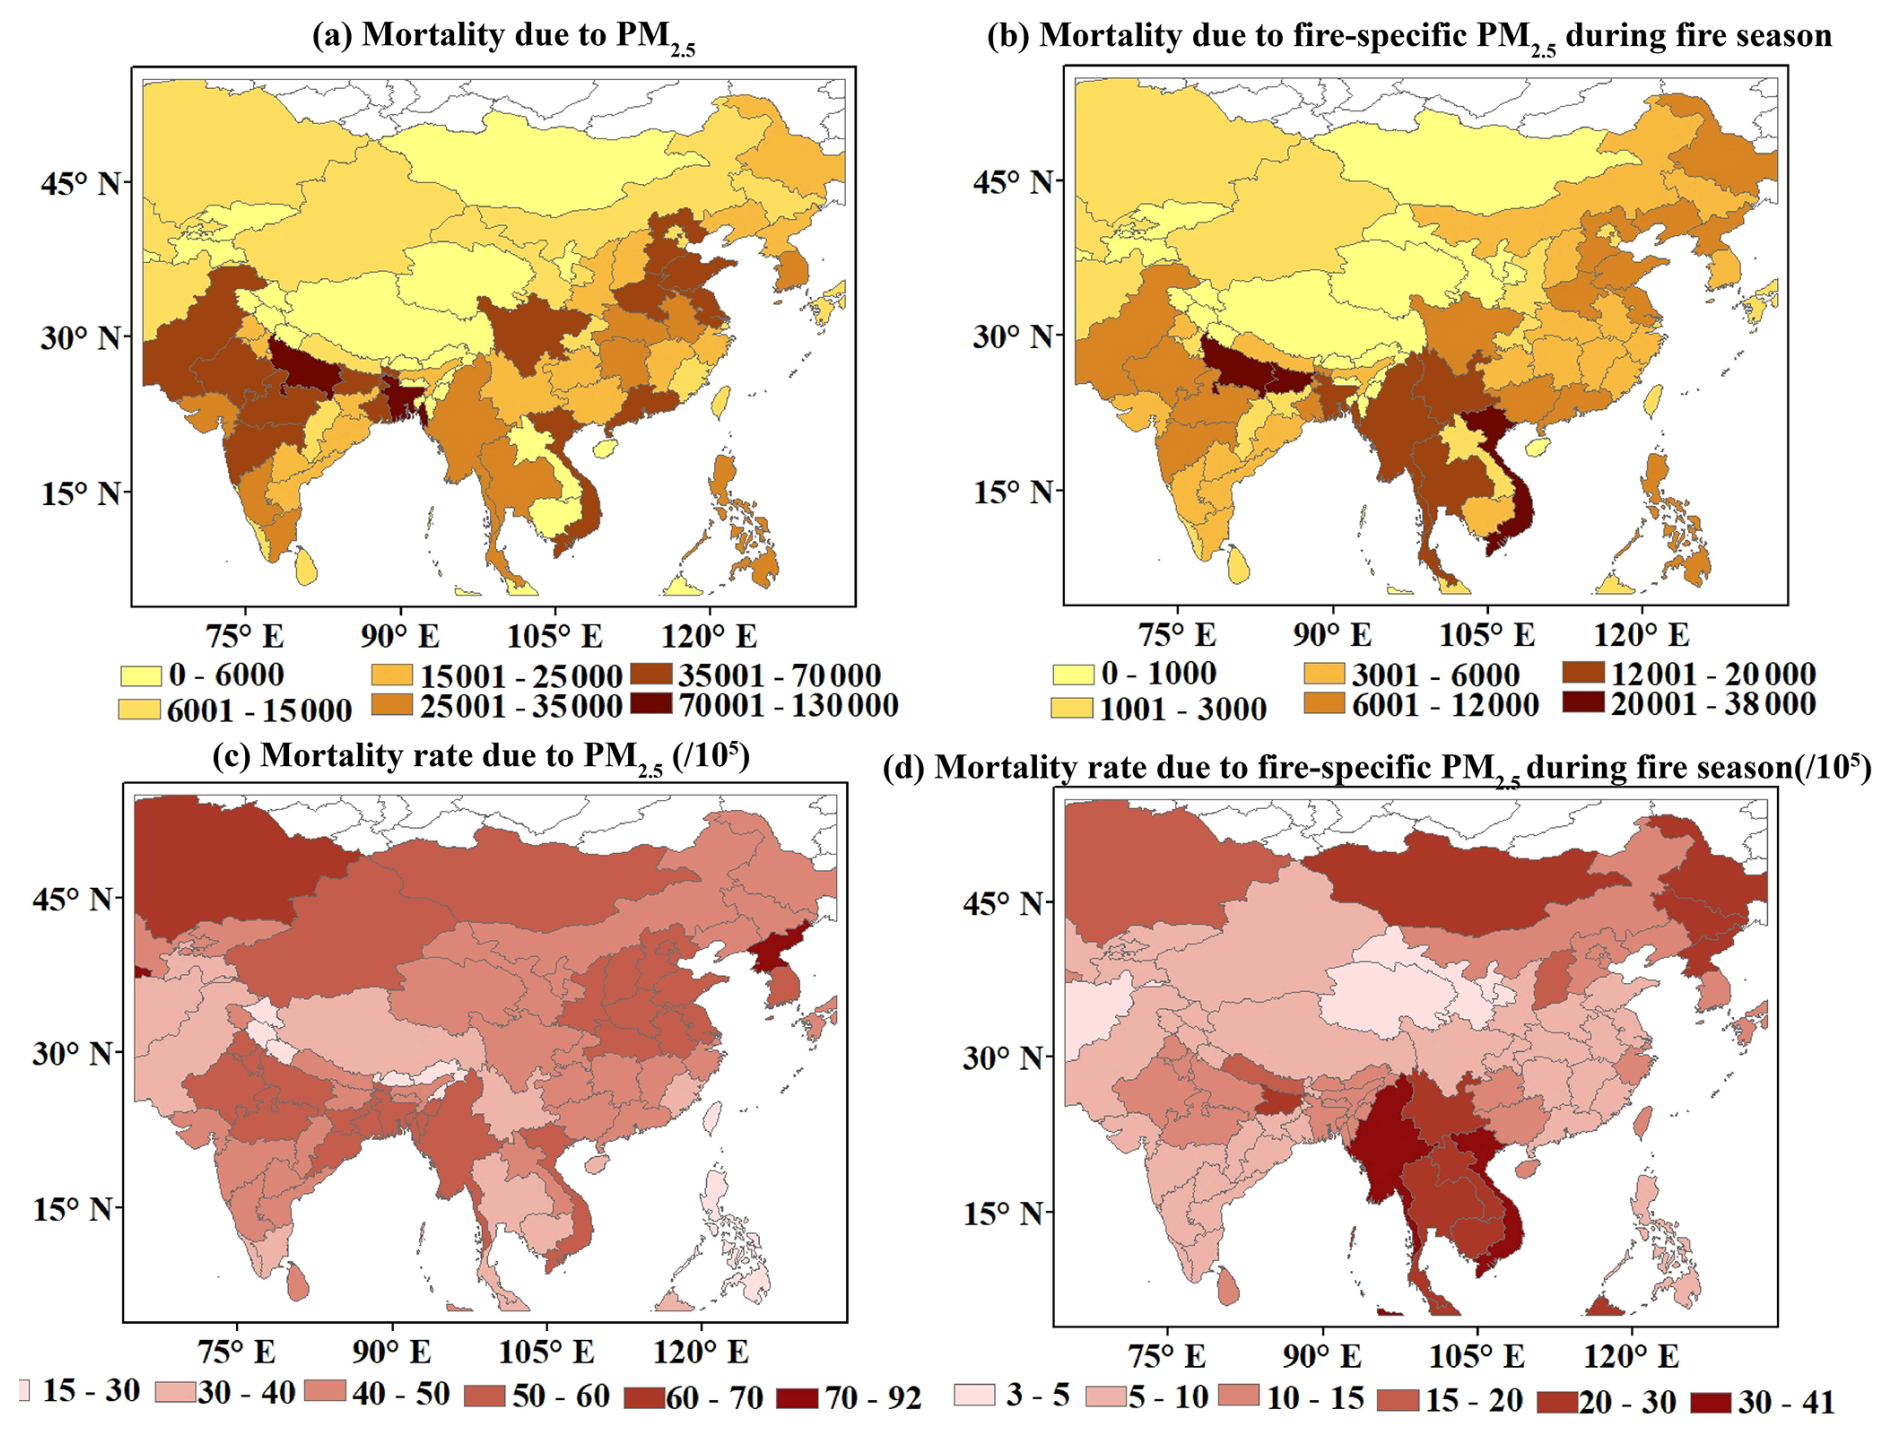
Figure 10Distribution of premature death numbers due to (a) PM2.5 and (b) fire-specific PM2.5, together with the proportion of premature deaths relative to the local populations due to (c) PM2.5 and (d) fire-specific PM2.5.
We further examined the poverty levels of Asia Pacific's population exposed to PM2.5. Figure 11 illustrates the total PM2.5 and fire-specific PM2.5 plotted against poverty proxy (IMR) data in Asia Pacific. For the total PM2.5, regions with IMR ≤ 60 show a gradual decrease in PM2.5 exposure levels as IMR values increase. In low-IMR areas (IMR ≤ 10), the average PM2.5 (44.2 µg m−3) is significantly higher than that in regions with relatively higher IMR values (41 ≤ IMR ≤ 60), where the PM2.5 average is 28.3 µg m−3. In high-IMR areas (IMR ≥ 61), the PM2.5 exposure level increases again to 37.0 µg m−3, while for fire-specific PM2.5 the trend is reversed, with higher-IMR regions (IMR ≥ 40) exposed to higher PM2.5 and lower-IMR regions (IMR < 40) experiencing relatively lower PM2.5. During the fire season, populations in regions with IMR ≥ 41 and ≤ 60 are exposed to the highest fire-specific PM2.5.
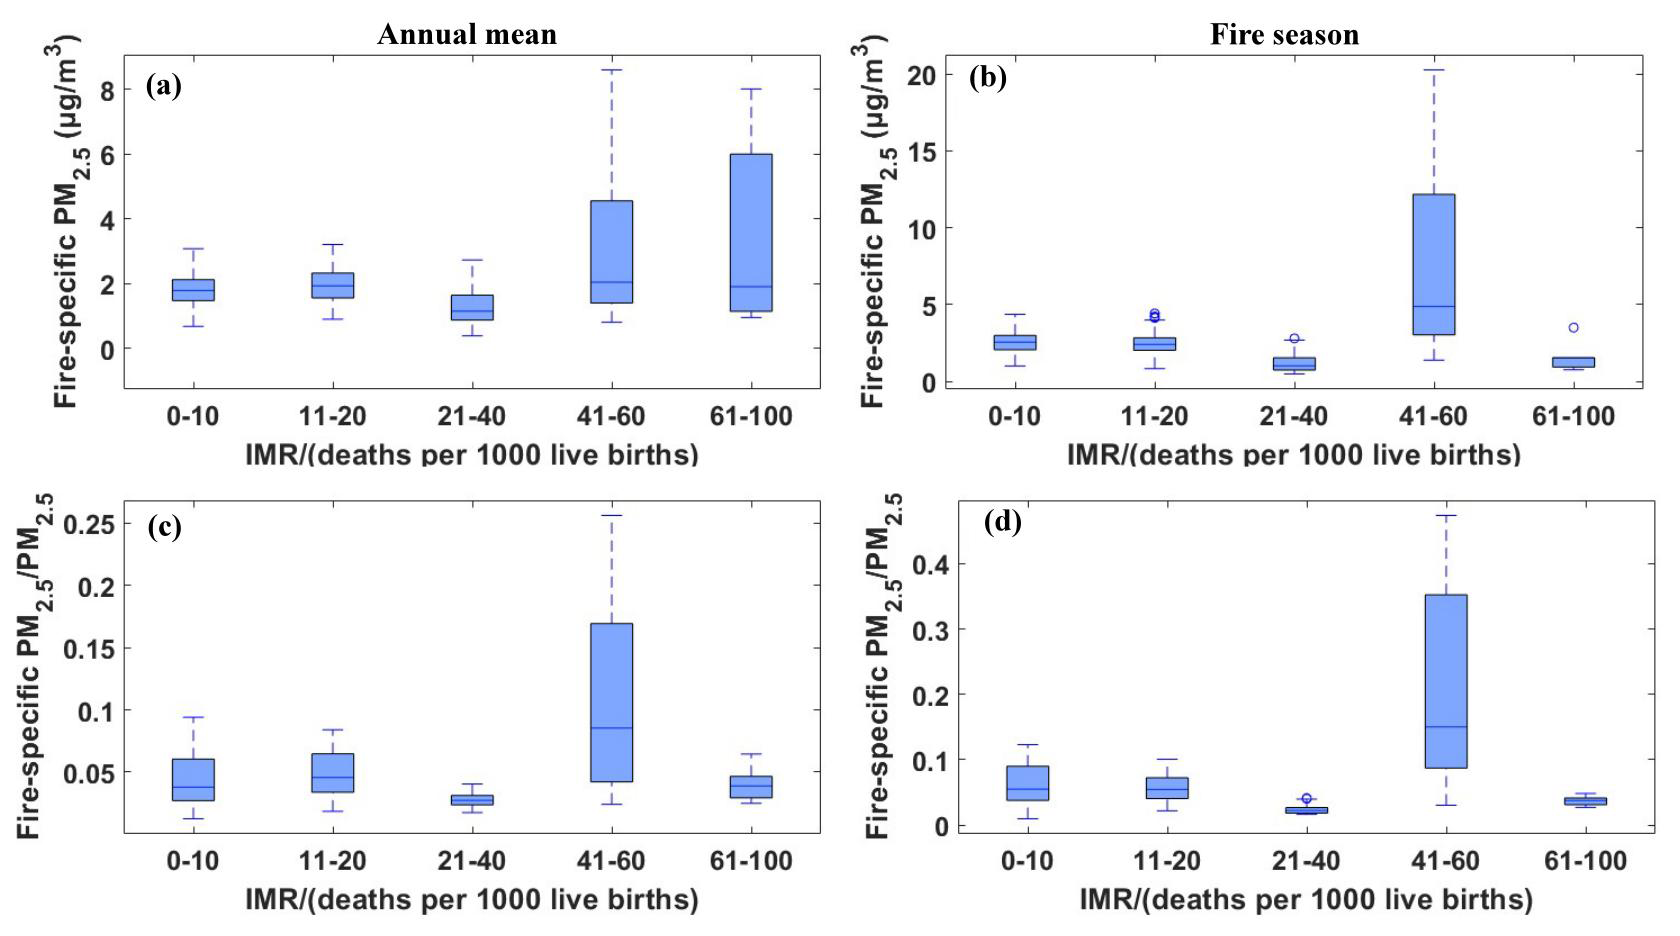
Figure 11Annual mean (a) total PM2.5 and (c) fire-specific PM2.5 versus binned infant mortality rate (IMR) values across Asia Pacific. Panels (b) and (d) are similar to panels (a) and (c) but for the fire season mean.
We found that populations in “not poor” areas (IMR < 40) are exposed to a higher mean PM2.5 from all sources but a lower fire-specific PM2.5. This indicates that PM2.5 pollution during the study period is primarily driven by economic and urban development. Conversely, “moderately poor” populations (41 ≤ IMR ≤ 60) experience lower total PM2.5 exposure but higher fire-specific PM2.5 exposure. In “very poor” areas (IMR ≥ 61), both the total PM2.5 and the fire-specific PM2.5 are high, making populations in these areas more susceptible to the health impact of PM2.5.
3.4 Future trends of fire-specific PM2.5 under climate change
Previous analysis indicates that fire-specific PM2.5 in different regions has rebounded to some extent, with a more significant increase in SEA and NEA. Whether this trend will continue or be altered by occasional climate conditions is uncertain. Many studies have attempted to understand the climate drivers of increased fire activities and how these factors may change in the future (Abatzoglou and Williams, 2016; Xie et al., 2022; Barik and Baidya, 2023; Burke et al., 2023; Gui et al., 2024). These studies provide strong evidence that interannual variations in climate factors are drivers of fire activities and changes in fire-specific PM2.5. Based on future changes in these climate drivers predicted by GCMs, assuming no intervention, fire activities may increase with global warming. With numerical model simulation, studies reveal that fire-specific PM2.5 will see a rise in the future. To corroborate the future changes in the fire-specific PM2.5 of Asia Pacific, we calculated the mean VPD during the fire season for different regions and related these values to the fire-specific PM2.5. It is obvious that VPD is positively related to the log of the fire-specific PM2.5 (Fig. 12a). Climate drivers can explain 35 % of fire-specific PM2.5 variations in Asia Pacific, with variations in CA being most sensitive to VPD (65 %). The multimodel ensemble mean of 34 GCM projections indicates a future increasing trend in VPD with a pronounced rise in SEA, followed by EA and CA, while the increase is weaker in NEA. These results suggest that the emerging growth trend of fire-specific PM2.5 in Asia Pacific is likely to continue under the influence of future climate change. For more dynamic and spatially detailed characteristics, more data will have to be integrated into modeling calculations to better understand the evolution of fire occurrences and pollutant release under future climate impacts.
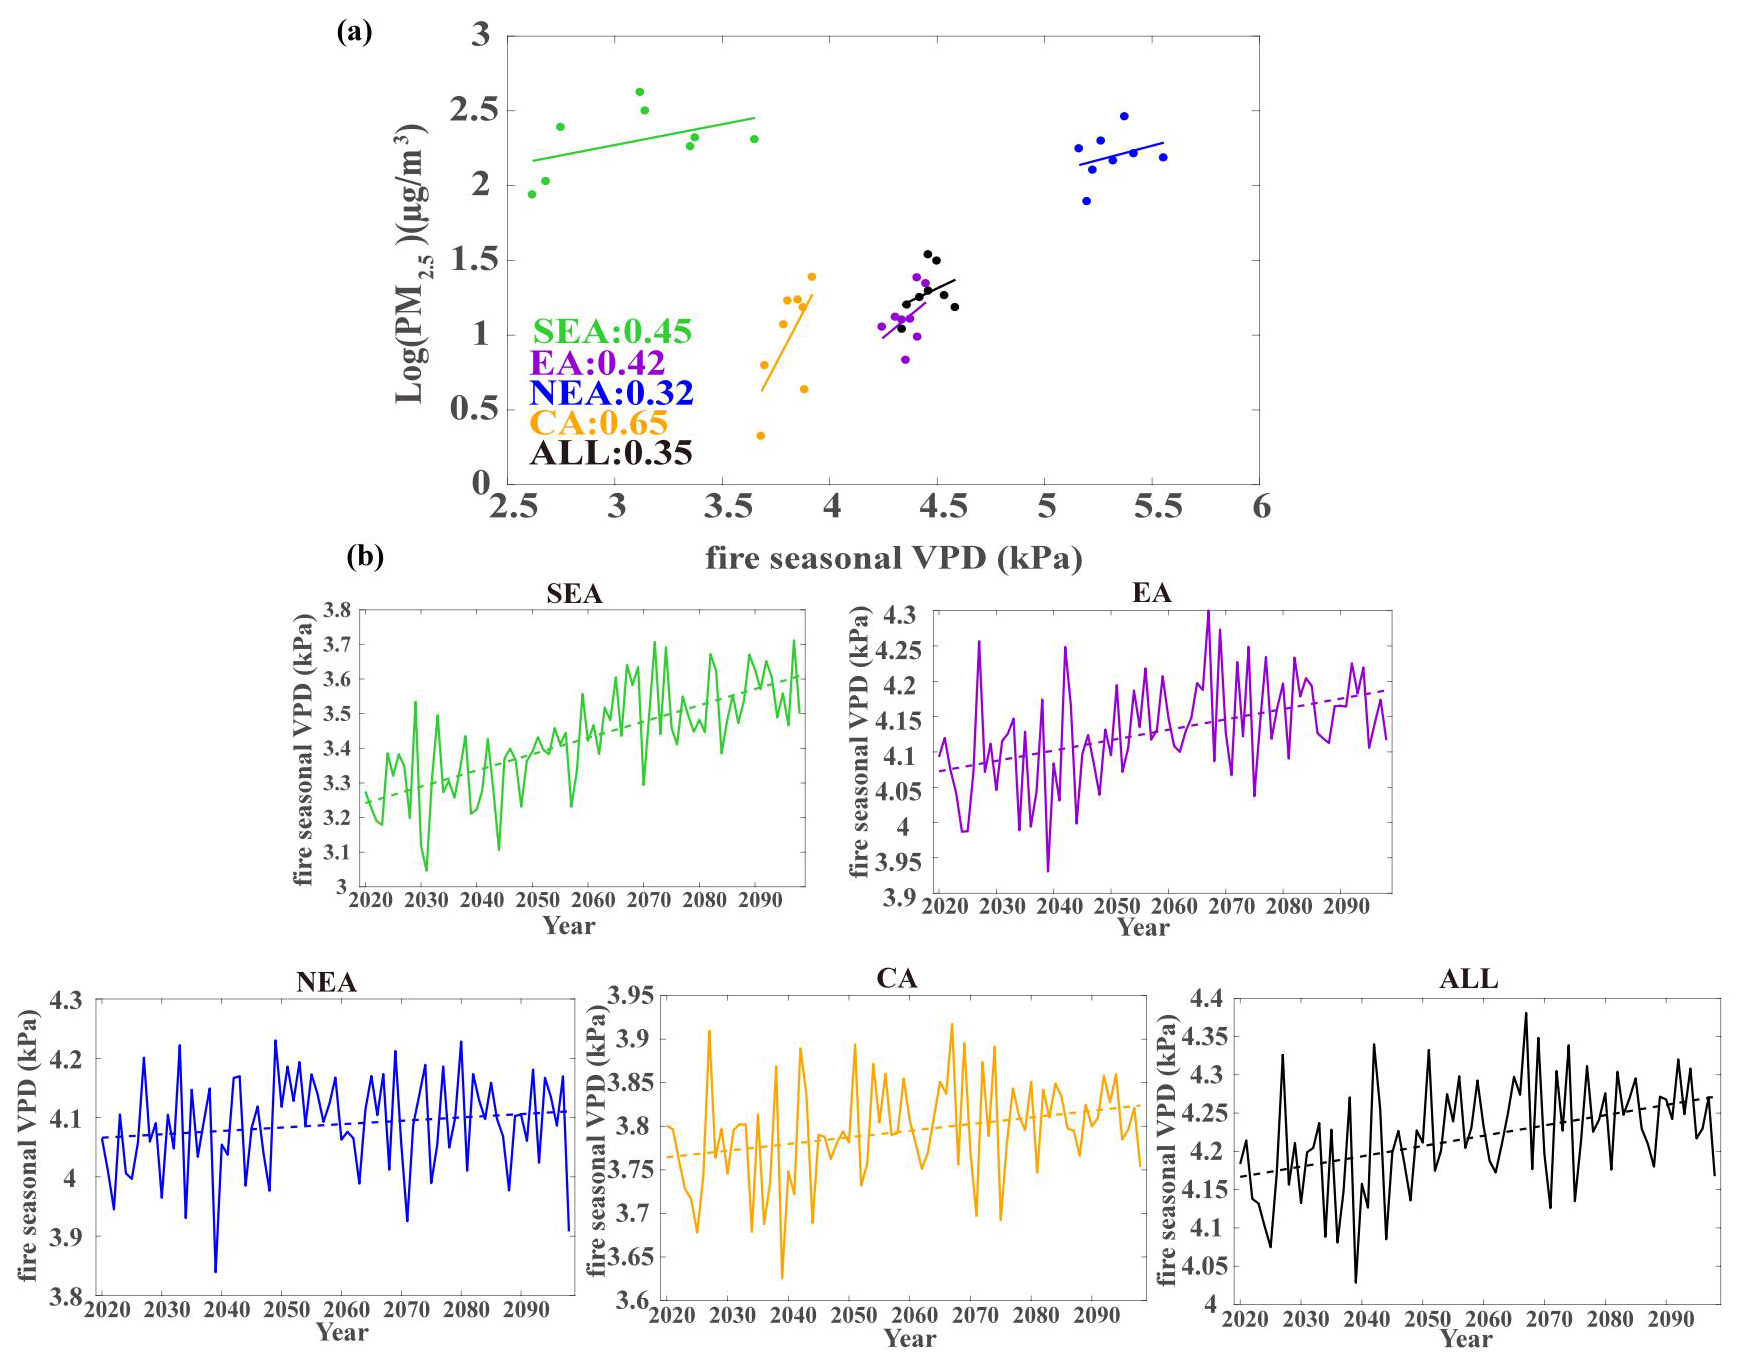
Figure 12(a) Interannual variations of vapor pressure deficit (VPD) versus the log of the averaged fire-specific PM2.5 during the fire season. (b) Future VPD derived from a multimodel ensemble mean of 34 GCM projections.
In this study, we explored the contribution of forest and vegetation fires to air quality and public health across Asia Pacific. We isolate fire-specific PM2.5 from the monitoring data for Asia Pacific using TFIM and spatiotemporal interpolation in this study. One advantage of this dataset is that it is driven by monitoring concentrations rather than relying on emission databases, which may ignore contributions of pollutants from smaller-scale fire emissions and carry considerable uncertainty, especially with the evident underestimation of agricultural fire emissions. Moreover, this method offers reliability and timeliness, effectively saving computational resources and storage space for isolating fire-related air pollution.
Our analysis reveals geographical disparities in population exposure to PM2.5 and fire-related air pollution in Asia Pacific. Thanks to the establishment of PM2.5 air quality standards and pollution control measurement by countries, PM2.5 population exposure saw an obvious declining trend from 2014 to 2021 in Asia Pacific, with population-weighted PM2.5 in 2021 reduced by 39.9 % compared to 2014. High PM2.5 concentrations are observed in EA and CA, concentrated in densely populated areas, leading to substantially higher population-weighted concentrations than the mean PM2.5. In contrast, fire-specific PM2.5 decreased in the early years but began to reverse recently in Asia Pacific. SEA and NEA experienced the most obvious increase in fire-specific PM2.5 in recent years, while EA and CA saw a slight increase. As a result, a gradual increase in the proportion of fire-specific PM2.5 within the total concentrations can be observed.
We found that fire-related PM2.5 could pose a significant public health threat in Asia Pacific, contributing to approximately 334 300 (95 % CI of 224 000–414 000) premature deaths each year. The annual disease burden due to PM2.5 exposure can be reduced by 40.9 % (95 % CI of 22.8 %–57.7 %), 14.9 % (95 % CI of 10.5 %–17.6 %), 19.4 % (95 % CI of 13.5 %–24.5 %), and 24.1 % (95 % CI of 14.8 %–32.5 %) in SEA, EA, CA, and NEA, respectively, preventing 58 000 (95 % CI of 32 600–82 600), 90 000 (95 % CI of 63 700–106 000), 157 000 (95 % CI of 110 000–186 000), and 29 300 (95 % CI of 18 000–39 700) premature deaths. It is important to note that our calculations do not account for the potentially higher toxicity of fire-specific PM2.5 compared to other sources, which could lead to an even greater number of premature deaths and related illnesses. Using infant mortality rates as a poverty proxy, we found that populations in Asia Pacific are disproportionately exposed to PM2.5. Populations in “not poor” areas (IMR ≤ 40) are exposed to higher total PM2.5, while poor populations are more vulnerable to the health impacts of fire-specific PM2.5. Our study indicates that the fire-related air pollution is also a serious issue in many poverty areas, yet it receives less attention. This situation warrants further investigation to explore the underlying causes and characteristics, ultimately providing more scientific evidence for effective management strategies. Based on the positive correlation between VPD and fire-specific PM2.5, the study suggests that, without further regulatory and policy intervention, the emerging growth trend in fire-specific PM2.5 in Asia Pacific is likely to continue under the influence of future climate change.
Interestingly, the increasing trend in fire-specific PM2.5 appears to be inconsistent with the declining trend in the number of fire points in Asia Pacific. In earlier years, vegetation fires in the region were dominated by agricultural fires characterized by smaller-scale burning areas but more fire point numbers. Countries have implemented various policies to reduce agricultural fires, such as China's measures to minimize straw burning and Thailand's alternative energy development plans, like a zero-burning policy. The enforcement of these policies has, to some extent, reduced fire point numbers and emissions from agricultural fires in Asia Pacific (Kumar et al., 2020; Panda and Yamano, 2023). However, fire emissions in the region are also influenced by wildfire emissions related to climate change. Wildfires usually occur in natural vegetation and are characterized by larger-scale burning areas that are more challenging to extinguish (Gui et al., 2024; Huang et al., 2024). As a result, the emissions per unit of biomass burned in wildfires far exceed those from agricultural fires (Reddington et al., 2021; Jones et al., 2024). In this study, we analyzed historical data and found a positive relationship between VPD and fire-specific PM2.5 across different regions of Asia Pacific. Based on this, we can roughly infer future trends in fire-specific PM2.5 by examining the VPD's future trends, assuming that the relationship between the future VPD and fire-specific PM2.5 will continue to exist. Of course, studying the future trends of fire-specific PM2.5 will require integration of more data and methods for a more precise analysis, which is a direction for our future research. To explain the inconsistent changes in fire point numbers and emissions, we propose that increasing emissions from natural wildfires driven by climate change have contributed to the rise in fire-specific PM2.5 in Asia Pacific, although fewer fire points have been found. This hypothesis may be verified further in future studies.
This study indicates that the contributions of fire-specific PM2.5 to air quality and health impacts are becoming increasingly significant and deserve more attention when developing air pollution standards and control measurements in Asia Pacific. These variations suggest that the decreases in pollutant concentrations from traffic and industrial sources and the associated health benefits may be offset by increases in pollutant concentrations from fires. Measures to reduce fires may be a significant yet under-recognized option for efficiently improving air quality and preventing related premature deaths.
The air quality observation data can be acquired from http://openaq.org/ (Hasenkopf et al., 2015) and https://www.cnemc.cn/en/ (CNEMC 2025). The ERA5 data can be downloaded from https://doi.org/10.24381/cds.bd0915c6 (Hersbach et al., 2023). The fire point data are available at https://doi.org/10.5067/MODIS/MYD14A1.061 (Giglio and Justice, 2021) from https://earthdata.nasa.gov/firm (last access: 15 January 2025). The health data can be accessed from http://ghdx.healthdata.org/gbd-results-tool, last access: 8 February 2025 (IHME, 2025). The infant mortality rate data can be found at https://search.earthdata.nasa.gov/search/granules?p=C3540908956-ESDIS&pg[0][v]=f&pg[0][qt]=2014-01-01T00:00:00.000Z,2021-12-31T23:59:59.999Z&pg[0][gsk]=-start_date&tl=435795200!3!! (NASA, 2025). The Coupled Model Intercomparison Project Phase6 data can be obtained from https://aims2.llnl.gov/search/cmip6/ (Eyring et al., 2016) The MAIAC aerosol optical depth data are available at https://www.earthdata.nasa.gov/data/catalog/lancemodis-mcd19a2n-6.1nrt, (Lyapustin et al., 2018), while the MERRA-2 reanalysis aerosol products can be acquried from https://disc.gsfc.nasa.gov/datasets ?project=MERRA-2, (Gelaro et al., 2017). The land use data can be accessed from https://doi.org/10.5067/MODIS/MCD12Q1.006 (Friedl and Sulla-Menashe, 2019). The population data can be found at https://doi.org/0.48690/1524209 (Bright et al., 2015) from https://landscan.ornl.gov/ (last access: 8 February 2025). The GDP data can be acquired from https://doi.org/10.5281/zenodo.7898409 (Wang and Sun, 2023).
The supplement related to this article is available online at https://doi.org/10.5194/acp-25-10141-2025-supplement.
HL, MX, and NW conceived the study, designed the experiments, conducted the data isolation, and prepared the initial draft manuscript. JJ, JY, and KL collected the data and assessed the health impacts of air pollution. HL, BL, and BZ performed the analysis, engaged in constructive discussions, and reviewed and edited the manuscript. HL, MX, and BL secured the financial support for the project leading to this publication. DM, MX, YZ, and MW provided additional manuscript reviews.
The contact author has declared that none of the authors has any competing interests.
Publisher's note: Copernicus Publications remains neutral with regard to jurisdictional claims made in the text, published maps, institutional affiliations, or any other geographical representation in this paper. While Copernicus Publications makes every effort to include appropriate place names, the final responsibility lies with the authors.
We would like to express our gratitude to the China National Environmental Monitoring Centre and the OpenAQ website for providing the monitoring data.
This research has been supported by the National Natural Science Foundation of China (grant nos. 42205186, 42575120 and 42275102), the open fund of the Chengdu Plain Urban Meteorology and Environment Observation and Research Station of Sichuan Province (grant no. CPUME202405), the Chongqing Natural Science Foundation (grant nos. cstc2021jcyj-msxmX1007 and (2024NSCQ-KJFZMSX0258), the Special Science and Technology Innovation Program for Carbon Peak and Carbon Neutralization of Jiangsu Province (grant no. BE2022612), and the research start-up fund for the talented person recruitment of Nanjing Normal University (grant no. 184080H201B57).
This paper was edited by Manish Shrivastava and reviewed by four anonymous referees.
Abatzoglou, J. T. and Williams, A. P.: Impact of anthropogenic climate change on wildfire across western US forests, P. Natl. Acad. Sci. USA, 113, 11770–11775, https://doi.org/10.1073/pnas.1607171113, 2016.
Aguilera, R., Corringham, T., Gershunov, A., and Benmarhnia, T.: Wildfire smoke impacts respiratory health more than fine particles from other sources: observational evidence from Southern California, Nat. Commun., 12, 1493, https://doi.org/10.1038/s41467-021-21708-0, 2021.
Aguilera, R., Luo, N., Basu, R., Wu, J., Clemesha, R., Gershunov, A., and Benmarhnia, T.: A novel ensemble-based statistical approach to estimate daily wildfire-specific PM2.5 in California (2006–2020), Environ. Int., 171, 107719, https://doi.org/10.1016/j.envint.2022.107719, 2023.
Barbier, E. B. and Hochard, J. P.: Poverty-Environment Traps, Environ. Resour. Econ., 74, 1239–1271, https://doi.org/10.1007/s10640-019-00366-3, 2019.
Barik, A. and Baidya Roy, S.: Climate change strongly affects future fire weather danger in Indian forests, Commun. Earth Environ., 4, 452, https://doi.org/10.1038/s43247-023-01112-w, 2023.
Barlow, M., Zaitchik, B., Paz, S., Black, E., Evans, J., and Hoell, A.: A Review of Drought in the Middle East and Southwest Asia, J. Climate, 29, 8547–8574, https://doi.org/10.1175/JCLI-D-13-00692.1, 2016.
Biswas, S., Vadrevu, K. P., Lwin, Z. M., Lasko, K., and Justice, C. O.: Factors Controlling Vegetation Fires in Protected and Non-Protected Areas of Myanmar, PLOS ONE, 10, e0124346, https://doi.org/10.1371/journal.pone.0124346, 2015.
Breiman, L.: Random Forests, Mach. Learn., 45, 5–32, https://doi.org/10.1023/A:1010933404324, 2001.
Bright, E., Rose, A., and Urban, M.: LandScan Global 2014, Oak Ridge National Laboratory [data set], https://doi.org/10.48690/1524209, 2015.
Burke, M., Childs, M. L., de la Cuesta, B., Qiu, M., Li, J., Gould, C. F., Heft-Neal, S., and Wara, M.: The contribution of wildfire to PM2.5 trends in the USA, Nature, 622, 761–766, https://doi.org/10.1038/s41586-023-06522-6, 2023.
Burnett, R., Pope, C., Ezzati, M., Olives, C., Lim, S., Mehta, S., Shin, H., Singh, G., Hubbell, B., Brauer, M., Anderson, H., Smith, K., Balmes, J., Bruce, N., Kan, H., Laden, F., Prüss-Ustün, A., Turner, M., Gapstur, S., and Cohen, A.: An Integrated Risk Function for Estimating the Global Burden of Disease Attributable to Ambient Fine Particulate Matter Exposure, Environ. Health Persp., 122, https://doi.org/10.1289/ehp.1307049, 2014.
Bytnerowicz, A., Hsu, Y. M., Percy, K., Legge, A., Fenn, M. E., Schilling, S., Frączek, W., and Alexander, D.: Ground-level air pollution changes during a boreal wildland mega-fire, Sci. Total Environ., 572, 755–769, https://doi.org/10.1016/j.scitotenv.2016.07.052, 2016.
Chen, G., Guo, Y., Yue, X., Tong, S., Gasparrini, A., Bell, M. L., Armstrong, B., Schwartz, J., Jaakkola, J. J. K., Zanobetti, A., Lavigne, E., Nascimento Saldiva, P. H., Kan, H., Royé, D., Milojevic, A., Overcenco, A., Urban, A., Schneider, A., Entezari, A., Vicedo-Cabrera, A. M., Zeka, A., Tobias, A., Nunes, B., Alahmad, B., Forsberg, B., Pan, S.-C., Íñiguez, C., Ameling, C., De la Cruz Valencia, C., Åström, C., Houthuijs, D., Van Dung, D., Samoli, E., Mayvaneh, F., Sera, F., Carrasco-Escobar, G., Lei, Y., Orru, H., Kim, H., Holobaca, I.-H., Kyselý, J., Teixeira, J. P., Madureira, J., Katsouyanni, K., Hurtado-Díaz, M., Maasikmets, M., Ragettli, M. S., Hashizume, M., Stafoggia, M., Pascal, M., Scortichini, M., de Sousa Zanotti Stagliorio Coêlho, M., Valdés Ortega, N., Ryti, N. R. I., Scovronick, N., Matus, P., Goodman, P., Garland, R. M., Abrutzky, R., Garcia, S. O., Rao, S., Fratianni, S., Dang, T. N., Colistro, V., Huber, V., Lee, W., Seposo, X., Honda, Y., Guo, Y. L., Ye, T., Yu, W., Abramson, M. J., Samet, J. M., and Li, S.: Mortality risk attributable to wildfire-related PM2.5 pollution: a global time series study in 749 locations, The Lancet Planetary Health, 5, e579–e587, https://doi.org/10.1016/S2542-5196(21)00200-X, 2021.
Choi, M., Lim, H., Kim, J., Lee, S., Eck, T. F., Holben, B. N., Garay, M. J., Hyer, E. J., Saide, P. E., and Liu, H.: Validation, comparison, and integration of GOCI, AHI, MODIS, MISR, and VIIRS aerosol optical depth over East Asia during the 2016 KORUS-AQ campaign, Atmos. Meas. Tech., 12, 4619–4641, https://doi.org/10.5194/amt-12-4619-2019, 2019.
Climate & Clean Air Coalition (CCAC): Air pollution measures for Asia and the Pacific, Climate & Clean Air Coalition (CCAC), https://www.ccacoalition.org/content/air-pollution-measures-asia-and-pacific, last access: 25 November 2024.
CNEMC (China National Environmental Monitoring Centre): https://www.cnemc.cn/en/, last access: 15 January 2025.
Du, X., Chen, R., and Kan, H.: Challenges of Air Pollution and Health in East Asia, Current Environmental Health Reports, 11, 89–101, https://doi.org/10.1007/s40572-024-00433-y, 2024.
Eyring, V., Bony, S., Meehl, G. A., Senior, C. A., Stevens, B., Stouffer, R. J., and Taylor, K. E.: Overview of the Coupled Model Intercomparison Project Phase 6 (CMIP6) experimental design and organization, Geosci. Model Dev., 9, 1937–1958, https://doi.org/10.5194/gmd-9-1937-2016 (data available at: https://aims2.llnl.gov/search/cmip6/, last access: 24 August 2025), 2016.
Feng, X., Mao, R., Gong, D., Zhao, C., wu, C., Zhao, C., Wu, G., Lin, Z., Liu, X., Wang, K., and Sun, Y.: Increased Dust Aerosols in the High Troposphere Over the Tibetan Plateau From 1990s to 2000s, J. Geophys. Res.-Atmos., 125, https://doi.org/10.1029/2020JD032807, 2020.
Friedl, M. and Sulla-Menashe, D.: MCD12Q1 MODIS/Terra+Aqua Land Cover Type Yearly L3 Global 500m SIN Grid V006, NASA Land Processes Distributed Active Archive Center [data set], https://doi.org/10.5067/MODIS/MCD12Q1.006, 2019.
Gelaro, R., McCarty, W., Suárez, M., Todling, R., Molod, A., Takacs, L., Randles, C., Darmenov, A., Bosilovich, M., Reichle, R., Wargan, K., Coy, L., Cullather, R., Draper, C., Akella, S., Buchard, V., Conaty, A., Da Silva, A., Gu, W., and Zhao, B.: The Modern-Era Retrospective Analysis for Research and Applications, Version 2 (MERRA-2), J. Climate, 30, 5419–5454, https://doi.org/10.1175/JCLI-D-16-0758.1, 2017 (data available at: https://disc.gsfc.nasa.gov/datasets ?project=MERRA-2, last access: 8 February 2025).
Giannadaki, D., Giannakis, E., Pozzer, A., and Lelieveld, J.: Estimating health and economic benefits of reductions in air pollution from agriculture, Sci. Total Environ., 622–623, 1304–1316, https://doi.org/10.1016/j.scitotenv.2017.12.064, 2018.
Giglio, L. and Justice, C.: MODIS/Aqua Thermal Anomalies/Fire Daily L3 Global 1km SIN Grid V061, NASA EOSDIS Land Processes Distributed Active Archive Center [data set], https://doi.org/10.5067/MODIS/MYD14A1.061, 2021.
Giglio, L., Descloitres, J., Justice, C. O., and Kaufman, Y. J.: An Enhanced Contextual Fire Detection Algorithm for MODIS, Remote Sens. Environ., 87, 273–282, https://doi.org/10.1016/S0034-4257(03)00184-6, 2003.
Gui, K., Zhang, X., Che, H., Li, L., Zheng, Y., Zhao, H., Zeng, Z., Miao, Y., Wang, H., Wang, Z., Wang, Y., Ren, H.-L., Li, J., and Zhang, X.: Future climate-driven escalation of Southeastern Siberia wildfires revealed by deep learning, npj Clim. Atmos. Sci., 7, 263, https://doi.org/10.1038/s41612-024-00815-x, 2024.
Hasenkopf, C. A., Flasher, J. C., Veerman, O., and DeWitt, H. L.: OpenAQ: a platform to aggregate and freely share global air quality data, in: AGU Fall Meeting Abstracts, 2015, A31D-0097, 2015 (data available at: http://openaq.org/, last access: 15 January 2025).
He, Q., Gu, Y., and Zhang, M.: Spatiotemporal trends of PM2.5 concentrations in central China from 2003 to 2018 based on MAIAC-derived high-resolution data, Environ. Int., 137, 105536, https://doi.org/10.1016/j.envint.2020.105536, 2020.
Hersbach, H., Bell, B., Berrisford, P., Biavati, G., Horányi, A., Muñoz Sabater, J., Nicolas, J., Peubey, C., Radu, R., Rozum, I., Schepers, D., Simmons, A., Soci, C., Dee, D., and Thépaut, J.-N.: ERA5 hourly data on pressure levels from 1940 to present, Copernicus Climate Change Service (C3S) Climate Data Store (CDS) [data set], https://doi.org/10.24381/cds.bd0915c6, 2023.
Hessl, A. E., Brown, P., Byambasuren, O., Cockrell, S., Leland, C., Cook, E., Nachin, B., Pederson, N., Saladyga, T., and Suran, B.: Fire and climate in Mongolia (1532–2010 Common Era), Geophys. Res. Lett., 43, 6519–6527, https://doi.org/10.1002/2016GL069059, 2016.
Huang, G., Chen, Y., Li, Z., Liu, Q., Wang, Y., He, Q., Liu, T., Liu, X., Zhang, Y., Gao, J., and Yao, Y.: Validation and Accuracy Analysis of the Collection 6.1 MODIS Aerosol Optical Depth Over the Westernmost City in China Based on the Sun-Sky Radiometer Observations From SONET, Earth and Space Science, 7, e2019EA001041, https://doi.org/10.1029/2019EA001041, 2020.
Huang, R., Liu, Y., Du, Z., Chen, J., and Huangfu, J.: Differences and links between the East Asian and South Asian summer monsoon systems: Characteristics and Variability, Adv. Atmos. Sci., 34, 1204–1218, https://doi.org/10.1007/s00376-017-7008-3, 2017.
Huang, X., Xue, L., Wang, Z., Liu, Y., Ding, K., and Ding, A.: Escalating Wildfires in Siberia Driven by Climate Feedbacks Under a Warming Arctic in the 21st Century, AGU Advances, 5, e2023AV001151, https://doi.org/10.1029/2023AV001151, 2024.
IHME (Institute for Health Metrics and Evaluation): The GBD Results Tool data set, Global Health Data Exchange (GHDx) [data set], http://ghdx.healthdata.org/gbd-results-tool, last access: 8 February 2025.
Jbaily, A., Zhou, X., Liu, J., Lee, T. H., Kamareddine, L., Verguet, S., and Dominici, F.: Air pollution exposure disparities across US population and income groups, Nature, 601, 228–233, https://doi.org/10.1038/s41586-021-04190-y, 2022.
Jia, R., Min, L., Liu, Y., Qingzhe, Z., Hua, S., Wu, C., and Shao, T.: Anthropogenic Aerosol Pollution over the Eastern Slope of the Tibetan Plateau, Adv. Atmos. Sci., 36, 847–862, https://doi.org/10.1007/s00376-019-8212-0, 2019.
Jin, S., Ma, Y., Huang, Z., Huang, J., Gong, W., Liu, B., Wang, W., Fan, R., and Li, H.: A comprehensive reappraisal of long-term aerosol characteristics, trends, and variability in Asia, Atmos. Chem. Phys., 23, 8187–8210, https://doi.org/10.5194/acp-23-8187-2023, 2023.
Jones, M. W., Veraverbeke, S., Andela, N., Doerr, S. H., Kolden, C., Mataveli, G., Pettinari, M. L., Le Quéré, C., Rosan, T. M., van der Werf, G. R., van Wees, D., and Abatzoglou, J. T.: Global rise in forest fire emissions linked to climate change in the extratropics, Science, 386, eadl5889, https://doi.org/10.1126/science.adl5889, 2024.
Justice, C. O., Giglio, L., Roy, D., Boschetti, L., Csiszar, I., Davies, D., Korontzi, S., Schroeder, W., O'Neal, K., and Morisette, J.: MODIS-Derived Global Fire Products, in: Land Remote Sensing and Global Environmental Change: NASA's Earth Observing System and the Science of ASTER and MODIS, edited by: Ramachandran, B., Justice, C. O., and Abrams, M. J., Springer New York, New York, NY, 661–679, https://doi.org/10.1007/978-1-4419-6749-7_29, 2011.
Kodros, J. K., Bell, M. L., Dominici, F., L'Orange, C., Godri Pollitt, K. J., Weichenthal, S., Wu, X., and Volckens, J.: Unequal airborne exposure to toxic metals associated with race, ethnicity, and segregation in the USA, Nat. Commun., 13, 6329, https://doi.org/10.1038/s41467-022-33372-z, 2022.
Korsiak, J., Pinault, L., Christidis, T., Burnett, R. T., Abrahamowicz, M., and Weichenthal, S.: Long-term exposure to wildfires and cancer incidence in Canada: a population-based observational cohort study, The Lancet Planetary Health, 6, e400–e409, https://doi.org/10.1016/s2542-5196(22)00067-5, 2022.
Kumar, I., Bandaru, V., Yampracha, S., Sun, L., and Fungtammasan, B.: Limiting rice and sugarcane residue burning in Thailand: Current status, challenges and strategies, J. Environ. Manage., 276, 111228, https://doi.org/10.1016/j.jenvman.2020.111228, 2020.
Landis, M. S., Edgerton, E. S., White, E. M., Wentworth, G. R., Sullivan, A. P., and Dillner, A. M.: The impact of the 2016 Fort McMurray Horse River Wildfire on ambient air pollution levels in the Athabasca Oil Sands Region, Alberta, Canada, Sci. Total Environ., 618, 1665–1676, https://doi.org/10.1016/j.scitotenv.2017.10.008, 2018.
Lelieveld, J., Evans, J. S., Fnais, M., Giannadaki, D., and Pozzer, A.: The contribution of outdoor air pollution sources to premature mortality on a global scale, Nature, 525, 367–371, https://doi.org/10.1038/nature15371, 2015.
Lelieveld, J., Pozzer, A., Pöschl, U., Fnais, M., Haines, A., and Münzel, T.: Loss of life expectancy from air pollution compared to other risk factors: a worldwide perspective, Cardiovasc. Res., 116, 1910–1917, https://doi.org/10.1093/cvr/cvaa025, 2020.
Li, L., Franklin, M., Girguis, M., Lurmann, F., Wu, J., Pavlovic, N., Breton, C., Gilliland, F., and Habre, R.: Spatiotemporal imputation of MAIAC AOD using deep learning with downscaling, Remote Sens. Environ., 237, 111584, https://doi.org/10.1016/j.rse.2019.111584, 2020.
Lin, Z., Chen, A., Wang, X., Liu, Z., and Piao, S.: Large language models reveal big disparities in current wildfire research, Commun. Earth Environ., 5, 168, https://doi.org/10.1038/s43247-024-01341-7, 2024.
Lu, H., Xie, M., Liu, X., Liu, B., Jiang, M., Gao, Y., and Zhao, X.: Adjusting prediction of ozone concentration based on CMAQ model and machine learning methods in Sichuan-Chongqing region, China, Atmos. Pollut. Res., 12, 101066, https://doi.org/10.1016/j.apr.2021.101066, 2021.
Lyapustin, A., Wang, Y., Korkin, S., and Huang, D.: MODIS Collection 6 MAIAC algorithm, Atmos. Meas. Tech., 11, 5741–5765, https://doi.org/10.5194/amt-11-5741-2018, 2018 (data available at: https://www.earthdata.nasa.gov/data/catalog/lancemodis-mcd19a2n-6.1nrt, last access: 8 February 2025).
McDuffie, E. E., Martin, R. V., Spadaro, J. V., Burnett, R., Smith, S. J., O'Rourke, P., Hammer, M. S., van Donkelaar, A., Bindle, L., Shah, V., Jaeglé, L., Luo, G., Yu, F., Adeniran, J. A., Lin, J., and Brauer, M.: Source sector and fuel contributions to ambient PM2.5 and attributable mortality across multiple spatial scales, Nat. Commun., 12, 3594, https://doi.org/10.1038/s41467-021-23853-y, 2021.
Mhawish, A., Banerjee, T., Sorek-Hamer, M., Lyapustin, A., Broday, D. M., and Chatfield, R.: Comparison and evaluation of MODIS Multi-angle Implementation of Atmospheric Correction (MAIAC) aerosol product over South Asia, Remote Sens. Environ., 224, 12–28, https://doi.org/10.1016/j.rse.2019.01.033, 2019.
NASA: The Infant Mortality Rate data set, NASA Earthdata [data set], https://search.earthdata.nasa.gov/search/granules?p=C3540908956-ESDIS&pg[0][v]=f&pg[0][qt]=2014-01-01T00:00:00.000Z,2021-12-31T23:59:59.999Z&pg[0][gsk]=-start_date&tl=1435795200!3!!, last access: 28 August 2025.
Panda, A. and Yamano, T.: Asia's Transition to Net Zero: Opportunities and Challenges in Agriculture, Asian Development Bank Economics Working Paper Series No. 694, https://doi.org/10.2139/ssrn.4587367, 2023.
Petersen, O. H.: Inequality of Research Funding between Different Countries and Regions is a Serious Problem for Global Science, Function, 2, zqab060, https://doi.org/10.1093/function/zqab060, 2021.
Phairuang, W., Hata, M., and Furuuchi, M.: Influence of agricultural activities, forest fires and agro-industries on air quality in Thailand, J. Environ. Sci., 52, 85–97, https://doi.org/10.1016/j.jes.2016.02.007, 2017.
Qin, Y., Wang, H., Wang, Y., Lu, X., Tang, H., Zhang, J., Li, L., and Fan, S.: Wildfires in Southeast Asia pollute the atmosphere in the northern South China Sea, Sci. Bull., 69, 1011–1015, https://doi.org/10.1016/j.scib.2024.02.026, 2024.
Reddington, C. L., Conibear, L., Robinson, S., Knote, C., Arnold, S. R., and Spracklen, D. V.: Air Pollution From Forest and Vegetation Fires in Southeast Asia Disproportionately Impacts the Poor, GeoHealth, 5, e2021GH000418, https://doi.org/10.1029/2021GH000418, 2021.
Rentschler, J. and Leonova, N.: Global air pollution exposure and poverty, Nat. Commun., 14, 4432, https://doi.org/10.1038/s41467-023-39797-4, 2023.
Romanov, A. A., Tamarovskaya, A. N., Gusev, B. A., Leonenko, E. V., Vasiliev, A. S., and Krikunov, E. E.: Catastrophic PM2.5 emissions from Siberian forest fires: Impacting factors analysis, Environ. Pollut., 306, 119324, https://doi.org/10.1016/j.envpol.2022.119324, 2022.
Schneider, S. R., Lee, K., Santos, G., and Abbatt, J. P. D.: Air Quality Data Approach for Defining Wildfire Influence: Impacts on PM2.5, NO2, CO, and O3 in Western Canadian Cities, Environ. Sci. Technol., 55, 13709–13717, https://doi.org/10.1021/acs.est.1c04042, 2021.
Schneider, S. R., Shi, B., and Abbatt, J. P. D.: The Measured Impact of Wildfires on Ozone in Western Canada From 2001 to 2019, J. Geophys. Res.-Atmos., 129, e2023JD038866, https://doi.org/10.1029/2023JD038866, 2024.
Song, C., He, J., Wu, L., Jin, T., Chen, X., Li, R., Ren, P., Zhang, L., and Mao, H.: Health burden attributable to ambient PM2.5 in China, Environ. Pollut., 223, 575–586, https://doi.org/10.1016/j.envpol.2017.01.060, 2017.
Southerland, V. A., Brauer, M., Mohegh, A., Hammer, M. S., van Donkelaar, A., Martin, R. V., Apte, J. S., and Anenberg, S. C.: Global urban temporal trends in fine particulate matter (PM2.5) and attributable health burdens: estimates from global datasets, The Lancet Planetary Health, 6, e139–e146, https://doi.org/10.1016/S2542-5196(21)00350-8, 2022.
Tessum, C. W., Apte, J. S., Goodkind, A. L., Muller, N. Z., Mullins, K. A., Paolella, D. A., Polasky, S., Springer, N. P., Thakrar, S. K., Marshall, J. D., and Hill, J. D.: Inequity in consumption of goods and services adds to racial–ethnic disparities in air pollution exposure, P. Natl. Acad. Sci. USA, 116, 6001–6006, https://doi.org/10.1073/pnas.1818859116, 2019.
Tornevi, A., Andersson, C., Carvalho, A. C., Langner, J., Stenfors, N., and Forsberg, B.: Respiratory Health Effects of Wildfire Smoke during Summer of 2018 in the Jämtland Härjedalen Region, Sweden, Int. J. Env. Res. Pub. He., 18, https://doi.org/10.3390/ijerph18136987, 2021.
Wang, T. and Sun, F.: Global gridded GDP under the historical and future scenarios, Zenodo [data set], https://doi.org/10.5281/zenodo.7898409, 2023.
Wei, J., Wang, J., Li, Z., Kondragunta, S., Anenberg, S., Wang, Y., Zhang, H., Diner, D., Hand, J., Lyapustin, A., Kahn, R., Colarco, P., da Silva, A., and Ichoku, C.: Long-term mortality burden trends attributed to black carbon and PM2.5 from wildfire emissions across the continental USA from 2000 to 2020: a deep learning modelling study, The Lancet Planetary Health, 7, e963–e975, https://doi.org/10.1016/S2542-5196(23)00235-8, 2023.
Wiedinmyer, C., Quayle, B., Geron, C., Belote, A., McKenzie, D., Zhang, X., O'Neill, S., and Wynne, K. K.: Estimating emissions from fires in North America for air quality modeling, Atmos. Environ., 40, 3419–3432, https://doi.org/10.1016/j.atmosenv.2006.02.010, 2006.
Wiedinmyer, C., Akagi, S. K., Yokelson, R. J., Emmons, L. K., Al-Saadi, J. A., Orlando, J. J., and Soja, A. J.: The Fire INventory from NCAR (FINN): a high resolution global model to estimate the emissions from open burning, Geosci. Model Dev., 4, 625–641, https://doi.org/10.5194/gmd-4-625-2011, 2011.
Wiedinmyer, C., Kimura, Y., McDonald-Buller, E. C., Emmons, L. K., Buchholz, R. R., Tang, W., Seto, K., Joseph, M. B., Barsanti, K. C., Carlton, A. G., and Yokelson, R.: The Fire Inventory from NCAR version 2.5: an updated global fire emissions model for climate and chemistry applications, Geosci. Model Dev., 16, 3873–3891, https://doi.org/10.5194/gmd-16-3873-2023, 2023.
Xie, Y., Lin, M., Decharme, B., Delire, C., Horowitz, L. W., Lawrence, D. M., Li, F., and Séférian, R.: Tripling of western US particulate pollution from wildfires in a warming climate, Proceedings of the National Academy of Sciences, 119, e2111372119, https://doi.org/10.1073/pnas.2111372119, 2022.
Xu, R., Ye, T., Yue, X., Yang, Z., Yu, W., Zhang, Y., Bell, M. L., Morawska, L., Yu, P., Zhang, Y., Wu, Y., Liu, Y., Johnston, F., Lei, Y., Abramson, M. J., Guo, Y., and Li, S.: Global population exposure to landscape fire air pollution from 2000 to 2019, Nature, 621, 521–529, https://doi.org/10.1038/s41586-023-06398-6, 2023.
Xue, T., Geng, G., Li, J., Han, Y., Guo, Q., Kelly, F. J., Wooster, M. J., Wang, H., Jiangtulu, B., Duan, X., Wang, B., and Zhu, T.: Associations between exposure to landscape fire smoke and child mortality in low-income and middle-income countries: a matched case-control study, The Lancet Planetary Health, 5, e588–e598, https://doi.org/10.1016/S2542-5196(21)00153-4, 2021.
Yin, S.: Biomass burning spatiotemporal variations over South and Southeast Asia, Environ. Int., 145, 106153, https://doi.org/10.1016/j.envint.2020.106153, 2020.
Zheng, H., Xue, L., Ding, K., Lou, S., Wang, Z., Ding, A., and Huang, X.: ENSO-Related Fire Weather Changes in Southeast and Equatorial Asia: A Quantitative Evaluation Using Fire Weather Index, J. Geophys. Res.-Atmos., 128, e2023JD039688, https://doi.org/10.1029/2023JD039688, 2023.
Zhu, J., Xia, X., Che, H., Wang, J., Zhang, J., and Duan, Y.: Study of aerosol optical properties at Kunming in southwest China and long-range transport of biomass burning aerosols from North Burma, Atmos. Res., 169, 237–247, https://doi.org/10.1016/j.atmosres.2015.10.012, 2016.