the Creative Commons Attribution 4.0 License.
the Creative Commons Attribution 4.0 License.
 | 09 Sep 2025
Covariability of dynamics and composition in the Asian monsoon tropopause layer from satellite observations and reanalysis products
Shenglong Zhang
Jiao Chen
Jonathon S. Wright
Sean M. Davis
Jie Gao
Paul Konopka
Ninghui Li
Mengqian Lu
Susann Tegtmeier
Xiaolu Yan
Guang J. Zhang
Nuanliang Zhu
The upper-level anticyclone above the Asian summer monsoon (ASM) greatly influences variations in stratospheric water vapor, which in turn have significant effects on climate. An impending data gap underscores the need to evaluate the reliability of recent reanalysis products in this region. Here, we describe three leading modes of deseasonalized water vapor variability in the tropopause layer (147–68 hPa) above the ASM. The first mode describes regional-scale moist or dry anomalies that peak in the lower stratosphere on interannual scales. Separating this mode into linear trend and detrended components, we find that the spatial pattern and sign of the trend disagree between observations and reanalyses. These discrepancies arise from different responses in the upper troposphere despite broad agreement in the lower stratosphere. Regional water vapor budgets suggest that the stratospheric trend originates outside the monsoon region, beyond our analysis domain. Interannual variability is more consistent, and arises mainly from the pre-monsoon influence of the Quasi-Biennial Oscillation. The second mode features anomalies arcing around the northern flank of the anticyclone with weaker opposing anomalies in the southeast, while the third mode features a horizontal dipole oriented east to west. These two modes often vary in quadrature as quasi-biweekly waves propagate across the region but also vary independently when other modes of convective variability manifest in similar areas. Despite lingering questions on the linear trend, mean biases, and data assimilation effects, the consistency between observation- and reanalysis-derived variability demonstrates that reanalyses are increasingly able to capture the processes controlling water vapor near the tropopause.
- Article
(21827 KB) - Full-text XML
- Companion paper
-
Supplement
(19557 KB) - BibTeX
- EndNote


Although water vapor is much less abundant in the stratosphere than in the troposphere, changes in the distribution and amount of stratospheric humidity have important influences on stratospheric chemistry and the global radiative balance (Forster and Shine, 1999; Solomon et al., 2010; Riese et al., 2012; Dessler et al., 2013; Maycock et al., 2013; Banerjee et al., 2019). Strong deep convection and the upper-level circulation associated with the Asian summer monsoon (ASM) produce clear signals in lower-stratospheric water vapor and other constituents during boreal summer (e.g., Milz et al., 2005; Park et al., 2007; Santee et al., 2017; Kumar and Ratnam, 2021), and many studies have emphasized the importance of transport through this region to humidity and composition in the lower stratosphere (e.g., Dethof et al., 1999; Bannister et al., 2004; Gettelman et al., 2004; Fueglistaler et al., 2005; Wright et al., 2011; Ploeger et al., 2013; Pan et al., 2016; Nützel et al., 2019; Yan et al., 2019). Lower-stratospheric water vapor (LSWV) above the ASM is primarily controlled by temperatures near the tropopause (James et al., 2008; Randel et al., 2015). However, very deep convective storms can substantially raise LSWV concentrations locally (Ueyama et al., 2018; Lee et al., 2019) and may also be a source of variations in water vapor above the tropopause at longer timescales (Brunamonti et al., 2018, 2019; Singh et al., 2021). Despite much progress in recent years, uncertainties remain regarding the relative influences and interplays between convective transport, large-scale circulation, and the thermodynamic structure near the tropopause in controlling humidity and composition in the upper troposphere and lower stratosphere (UTLS) above the ASM.
The seasonal cycle and interannual variability in LSWV in the tropics are intrinsically linked to variations in temperature at and around the tropical tropopause (Mote et al., 1996; Randel et al., 2006; Liu et al., 2010; Schoeberl et al., 2012), with the coldest temperatures encountered during transit effectively determining how much water vapor enters the stratosphere (Gettelman et al., 2002; Fueglistaler et al., 2005; Randel and Jensen, 2013). Focusing on the 100 hPa isobaric surface, Randel et al. (2015) reported that variations in LSWV above the Asian summer monsoon (ASM) are also controlled mainly by variations in temperatures and large-scale circulation. The most influential circulation system in this sense is the upper-level monsoon anticyclone, for which the coldest temperatures are concentrated along the southern flank over the Bay of Bengal and northern India (e.g., Wright et al., 2011; Zhang et al., 2016). This upper-level anticyclonic vortex, which forms due to diabatic heating associated with ASM convection and the Tibetan Plateau and spans more than 100° in longitude at its peak (Hoskins and Rodwell, 1995; Garny and Randel, 2013; Siu and Bowman, 2019), is bounded by the subtropical westerly jet to the north and the tropical easterly jet to the south (Zarrin et al., 2010; Manney et al., 2021). The smooth boundaries and distinct shape of the time-mean anticyclone mask vigorous variations on a wide range of timescales (Garny and Randel, 2013; Ploeger et al., 2015; Pan et al., 2016; Nützel et al., 2016; Yan et al., 2018; Ren et al., 2019; Siu and Bowman, 2020) that influence the extent to which air in the monsoon UTLS is confined and isolated from air outside the anticyclone boundaries (Ploeger et al., 2013; Nützel et al., 2019; Legras and Bucci, 2020; Honomichl and Pan, 2020; Kumar and Ratnam, 2021). The origins and full impacts of this variability are not yet well understood. Moreover, studies examining water vapor and other tracers at and above the tropopause within the ASM anticyclone have reached diverse conclusions on the importance of direct injection by overshooting convection, ranging from marginal (e.g., James et al., 2008; Randel et al., 2015; von Hobe et al., 2021; Konopka et al., 2023) to substantial (15 % or more; e.g., Ueyama et al., 2018; Wang et al., 2019). The seemingly contradictory nature of these conclusions is rooted in the difficulty of observing and modeling convective influences near the tropopause. However, despite some quantitative discrepancies, recent reanalyses largely reproduce observed seasonal-mean anomalies in water vapor near the tropopause in this region (Wright et al., 2025).
Variations in ozone and carbon monoxide (CO) exhibit strong correlations with water vapor in the UTLS and provide complementary information on the processes affecting water vapor in the monsoon tropopause layer (Pan et al., 2016; Gottschaldt et al., 2018; von Hobe et al., 2021). Stratospheric ozone influences dynamical and thermodynamic conditions through its interactions with shortwave and longwave radiation, and UTLS ozone can influence stratospheric water vapor by modulating temperatures near the tropical tropopause (Ming et al., 2017; Xia et al., 2018) and altering high cloud distributions through temperature effects on relative humidity (e.g., Xia et al., 2016, 2018). Seasonal dilution of ozone in the UTLS above the monsoon results in a local minimum that has been dubbed the “ozone valley” (Bian et al., 2011). Ozone also serves as a stratospheric tracer, with convective dilution in the core of the anticyclone (Bian et al., 2011) flanked by higher concentrations due to in-mixing from the extratropical lower stratosphere (Konopka et al., 2009, 2010). CO, as a predominantly tropospheric tracer, is a valuable marker of convective uplift of polluted air into the UTLS (Huang et al., 2014; Pan et al., 2016; Santee et al., 2017) and is often used as a proxy for local enhancements in aerosol concentrations or as a transport tracer to track the fate of polluted boundary-layer air (e.g., Pan et al., 2022).
In this study, we investigate the spatiotemporal signatures of variability in UTLS water vapor above the ASM at both interannual and subseasonal timescales and link these signatures to covariations in ozone, CO, and dynamical and thermodynamic fields from reanalyses. Ozone and CO are included to provide information complementary to that of water vapor and may be interpreted as tracers of stratospheric and tropospheric air masses, respectively. We conduct this analysis using satellite data from the Aura Microwave Limb Sounder (MLS) and products from five recent atmospheric reanalyses (see Sect. 2). This study aims to provide further insight into the mechanisms governing variations in water vapor and other trace gases in the UTLS above the ASM as represented in current atmospheric reanalysis systems. We pay particular attention to characteristic patterns of covariability between convective activity, circulation patterns, and trace gas concentrations. Much of the foundation for this work has been laid in Chap. 8 (“Tropical Tropopause Layer”) of the Stratosphere-troposphere Processes And their Role in Climate (SPARC) Reanalysis Intercomparison Project (S-RIP) Final Report (Tegtmeier et al., 2022, and references therein), along with our recent examination of reanalysis representations of climatological mean composition in this region (Wright et al., 2025). Whereas those studies focused mainly on climatological characteristics, this work focuses on variability beyond the seasonal cycle. As in Wright et al. (2025), we use a budget-oriented perspective that distinguishes the contributions of parameterized physics, resolved dynamics, and data assimilation for determining reanalysis-based water vapor fields.
The remainder of this paper is organized as follows. In Sect. 2, we introduce the data and methods used in the analysis. In Sect. 3, we use principal component analysis to identify and analyze the leading modes of variability in deseasonalized water vapor anomalies above the ASM considering both horizontal and vertical structure at timescales 5 d and longer and explore the mechanisms behind these leading modes of variability. To support this central section, we provide a Supplement in which the main elements of the analysis are repeated using different reanalysis products. In Sect. 4, we compare our results with those of other recent studies, before concluding with a brief summary in Sect. 5.
2.1 Data
We use Microwave Limb Sounder (MLS; Waters et al., 2006) version 5 (v5) gridded retrievals of water vapor (Lambert et al., 2021), ozone (Schwartz et al., 2021a), and carbon monoxide (Schwartz et al., 2021b) at 2.5° ×2.5° spatial resolution from 2005–2021 covering the ASM region (30–130° E and 15–45° N). Daily gridded data are averaged into pentads (discrete 5 d periods) starting on 1 May and ending on 2 October, totaling 31 pentads per year (155 d). We focus on humidity in the monsoon tropopause layer between 147 and 68 hPa (approximately 370–440 K potential temperature).
In addition to MLS observations, we use model-level and pressure-level outputs from five atmospheric reanalyses. These include the fifth-generation European Centre for Medium-Range Weather Forecasts (ECMWF) atmospheric reanalysis (ERA5; Hersbach et al., 2020); the Japanese Reanalysis for Three Quarters of a Century (JRA-3Q; Kosaka et al., 2024); the Modern-Era Retrospective Analysis for Research and Applications, version 2 (MERRA-2; Gelaro et al., 2017); the MERRA-2 Stratospheric Composition Reanalysis of Aura Microwave Limb Sounder (M2-SCREAM; Wargan et al., 2023); and the Copernicus Atmosphere Monitoring Service (CAMS) reanalysis of atmospheric composition (Inness et al., 2019). Among these, ERA5, JRA-3Q, and MERRA-2 are focused primarily on meteorological fields, while M2-SCREAM and CAMS are focused more on atmospheric composition. Accordingly, M2-SCREAM and CAMS feature more sophisticated chemistry and additional assimilated variables relative to the corresponding meteorological reanalyses MERRA-2 and ERA5, while the meteorological reanalyses provide a richer set of dynamical and thermodynamic diagnostics for mechanistic analysis. Key details of these five reanalysis systems, including model resolutions and a catalogue of how assimilated observations affect water vapor, ozone, and CO at these altitudes, have been provided by our companion paper (Wright et al., 2025).
We use these reanalysis products to support a deeper investigation into recurrent patterns of variability in LSWV, both to compare the consistency of internal variations to those observed by Aura MLS and to evaluate the potential mechanisms behind the observed variations. Three metrics are adopted to evaluate the effects of deep convection and thermodynamic conditions during transport. First, cold-point tropopause (CPT) temperatures are identified using instantaneous model-level temperature profiles from ERA5 and MERRA-2 and pressure-level temperature profiles from JRA-3Q as described by Tegtmeier et al. (2020). Second, all-sky outgoing longwave radiation (OLR) fields from ERA5, MERRA-2, and JRA-3Q are used to indicate the prevalence of cold high clouds, in line with previous studies on variations in the overall frequency and spatial extent of deep convection in this region (e.g., Randel et al., 2015). Variations in very deep convection are also evaluated using non-radiative diabatic heating, which primarily indicates the strength of convective ascent in the reanalysis model. Anomalous non-radiative heating at these levels is dominated by variations in the deepest simulated convective towers. Although such convection is rare, heating rates associated with these events are still approximately 1–2 orders of magnitude larger than contributions from parameterized shear-flow turbulence close to the tropopause (Wright and Fueglistaler, 2013; Tegtmeier et al., 2022). These heating rates are model products and are thus not directly constrained by data assimilation; however, they exert strong influences on composition and humidity in the reanalysis tropopause layer. Model-generated heating rates are only available for ERA5, MERRA-2, and JRA-3Q. Given the overlap in forecast models and, in the latter case, the use of the “replay” technique, heating rates for ERA5 may be taken as roughly representative of those in CAMS, and this is similar for MERRA-2 and M2-SCREAM.
Direct data assimilation constraints on humidity are weak at these levels (Wright et al., 2025). Different reanalyses deal with this lack of strong constraints in different ways. For example, the ECMWF reanalyses, ERA5 and CAMS, suppress direct assimilation increments in humidity at these levels by setting background error covariances to zero (although assimilation increments in winds and temperatures still influence the evolution of humidity fields at these altitudes). MERRA-2 only assimilates radiosonde humidities at pressures greater than 300 hPa, whereas JRA-3Q restricts radiosonde humidity assimilation to temperatures greater than −40 °C. Moreover, although satellite radiances can affect humidity at all altitudes in these two systems, small absolute concentrations mean that satellite radiances provide little information about water vapor at these altitudes. In addition, the deep vertical weighting functions of some assimilated satellite radiances may lead to data assimilation targeted at the troposphere producing correlated increments at and above the tropopause. This problem produced large biases in stratospheric humidity in JRA-55 (Davis et al., 2017; Kosaka et al., 2024), which persist in a less pronounced form in JRA-3Q (Wright et al., 2025). MERRA-2 sidesteps the issue by relaxing stratospheric humidity to a monthly-mean zonal-mean climatology (Gelaro et al., 2017); however, this approach necessarily suppresses water vapor anomalies at these altitudes, especially those on longer timescales (Davis et al., 2017). M2-SCREAM is unique among the reanalyses considered here in that it directly assimilates Aura MLS retrievals of water vapor using the Goddard Earth Observing System (GEOS) Constituent Data Assimilation System (CoDAS; Wargan et al., 2023). Accordingly, comparisons between M2-SCREAM and Aura MLS are not independent.
We also use several reanalysis-based variables to describe the dynamical state of the monsoon tropopause layer. First, we use the Montgomery streamfunction (MSF , where cp is the specific heat of dry air at constant pressure, T is temperature, and Φ is geopotential) on the 395 K isentropic surface to track the position and strength of the anticyclone (Santee et al., 2017; Manney et al., 2021). MSF, which is functionally identical to dry static energy, defines the geostrophic wind on an isentropic surface and is thus analogous to geopotential in pressure coordinates. The 395 K isentropic surface is typically located between 100 hPa and 83 hPa in the core ASM region south of the subtropical westerly jet. Second, we use horizontal winds, temperatures, ozone mass mixing ratios, and CO mass mixing ratios from each reanalysis to evaluate the dynamical transport environment within the ASM UTLS. Winds and temperatures are used to describe the structure of the anticyclone, while ozone and CO mass mixing ratios are used to qualitatively indicate anomalous in-mixing of stratospheric air and convectively detrained air, respectively (e.g., Pan et al., 2022). Among the reanalyses, only CAMS and MERRA-2 provide estimates of CO and only CAMS includes any CO-related data assimilation (Inness et al., 2019; Wright et al., 2025). Finally, we use specific humidity tendencies due to parameterized physics, data assimilation, and dynamical transport from ERA5, JRA-3Q, and MERRA-2. These three meteorological reanalyses are used because they provide enough of the terms to close the vertically resolved water vapor budget. As with diabatic heating, tendencies from ERA5 may be considered roughly representative of those for CAMS; however, tendencies from MERRA-2 are not representative of those for M2-SCREAM because these two systems treat stratospheric water vapor very differently as noted above: MERRA-2 nudges to a climatology, while M2-SCREAM assimilates Aura MLS.
2.2 Methodology
Motivated by the analysis of Randel et al. (2015), who investigated the mechanisms behind water vapor variability at 100 hPa, we evaluate coupled horizontal and vertical variations in LSWV above the ASM in the 147–68 hPa layer, including observed and reanalysis water vapor mixing ratios. This layer, which contains the CPT, is a transitional zone where air detrained from convection spirals upward into the lower stratosphere (e.g., Vogel et al., 2019). We integrate variables in pressure from pbot (147 hPa) to ptop (68 hPa) and refer to the integrated variable as partial-column water vapor (PCWV) in units of mass per area:
where g is the gravitational acceleration, q is specific humidity, and dp denotes the pressure thickness of each layer between ptop (68 hPa) and pbot (147 hPa). Specific humidity from each reanalysis is interpolated from model levels (or pressure levels, in the case of JRA-3Q) to the MLS pressure levels, but no weighting functions are applied. Partial-column ozone (PCO3) and partial-column CO (PCCO) are calculated similarly from ozone and CO mass mixing ratios.
The vertically resolved water vapor budget is used to diagnose the contributions of parameterized physical processes, resolved dynamical transport, and data assimilation for determining the spatiotemporal variability in UTLS water vapor in the meteorological reanalyses:
where p is pressure, V is the vector horizontal wind on an isobaric surface, and ω is the pressure vertical velocity. The first term on the left-hand side is the time rate of change, which is computed from assimilated water vapor fields at consecutive time steps. The second and third terms on the left-hand side are the horizontal and vertical moisture flux divergence, which are also computed from assimilated fields and referenced as the “dynamics” terms below. The terms on the right-hand side represent local sources or sinks. Sphy represents net sources and sinks due to parameterized physical processes in the forecast model (e.g., cloud microphysics, convection, and turbulent mixing), Sana is the source or sink due to data assimilation, and Sres is the residual. Subgrid-scale mixing is included in Sphy. The residual term collects high-frequency and/or small-scale covariance transports that are resolved by the reanalysis model but not by our calculation of moisture flux divergence (Wright et al., 2025). Additional details on the meaning and calculation of Sphy, Sdyn, and Sana have been provided by Wright et al. (2025). A T42 spectral filter is applied to all budget terms to reduce noise in the spatial patterns. This filter simplifies the visualizations and does not change the results in any significant way.
For subsequent analyses, we average all variables into pentads (discrete 5 d means) starting on 1 May and ending on 2 October so that the first pentad of each warm season is centered on 3 May and the last is centered on 30 September. We calculate deseasonalized anomalies in each grid cell by subtracting the mean for the corresponding pentad over 2005–2021. We then apply empirical orthogonal function (EOF) analysis to the deseasonalized water vapor anomalies. The EOF analysis considers both horizontal and vertical variations at pentad resolution. Input data are weighted by area in the horizontal dimension but are weighted equally in the vertical dimension (i.e., the only weights applied to the input data are the horizontal grid area weights). We retain the three leading principal components (PCs) as indicated by Aura MLS. Eigenvalues associated with these three modes are mutually independent based on the North test (North et al., 1982).
Separate EOF analyses are then applied to water vapor volume mixing ratio anomalies from reanalysis products interpolated to the Aura MLS levels and downscaled to the MLS horizontal grid. The PCWV anomalies from each dataset are then regressed onto the corresponding PCs for intercomparison and evaluation of variability as represented by the reanalyses. Some PCs based on reanalysis fields must be reordered for consistency with the Aura MLS results; such cases are noted in the figures and related text. Deseasonalized anomalies in reanalysis fields are then regressed onto the PCs calculated from Aura MLS for a more detailed analysis of the underlying mechanisms. This two-pronged approach provides more stringent tests of the reanalysis products because it evaluates both the extent to which each reanalysis can capture observed spatial patterns of variability in LSWV (separate PCs) and the extent to which each reanalysis reproduces anomalies in the ASM and UTLS transport environment associated with a given mode (Aura MLS PCs). Combining the second step with the reanalysis-based water vapor budget expressed in Eq. (2) allows us to further assess process-level consistency across the reanalyses.
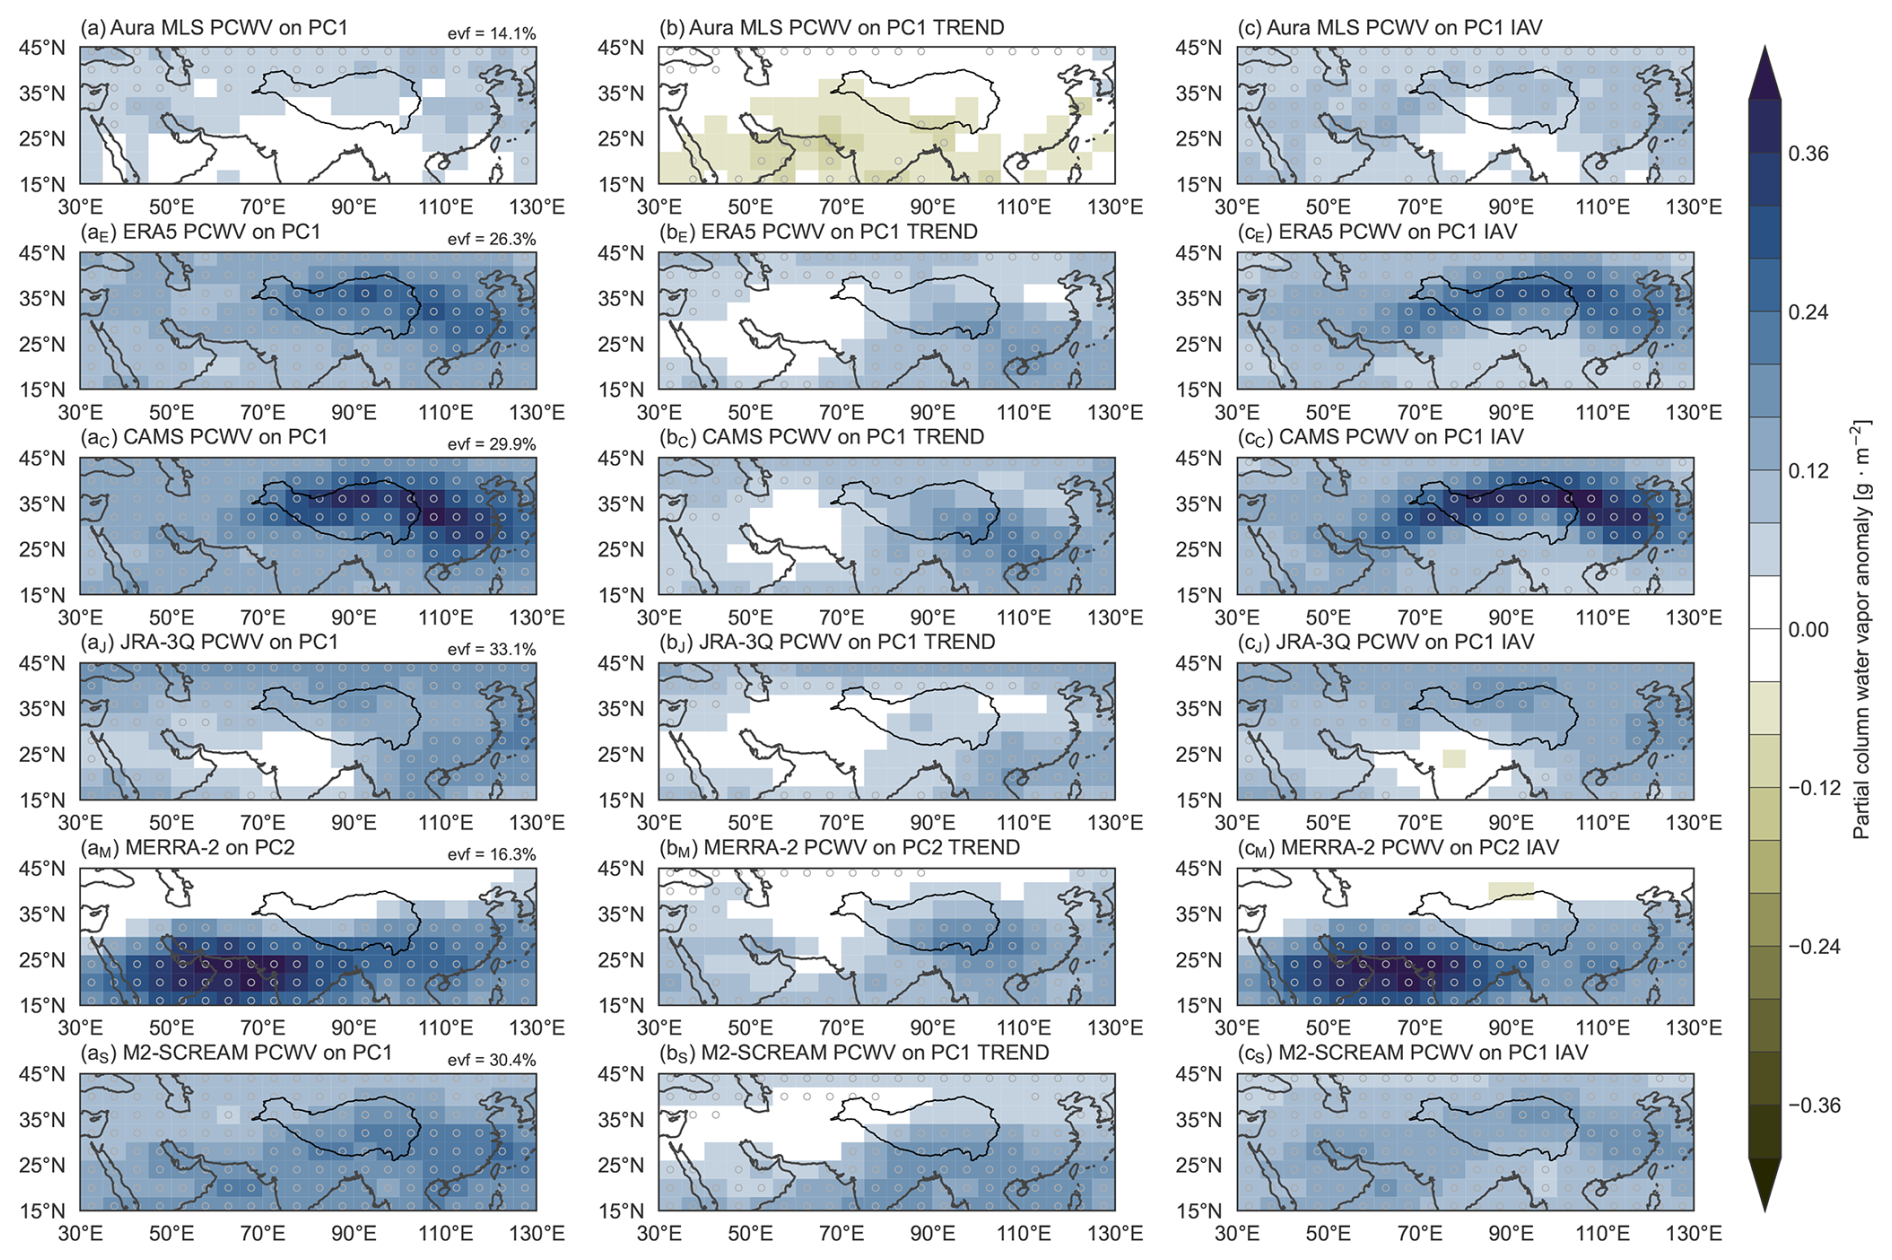
Figure 1Deseasonalized partial-column water vapor (PCWV) anomalies (Eq. 1) regressed onto the (a) first principal component (PC1) from Aura MLS and its (b) trend (PC1TREND) and (c) interannual variability (PC1IAV) components. Corresponding distributions are shown for (aE)–(cE) ERA5 PCWV on PC1 from ERA5, (aC)–(cC) CAMS PCWV on PC1 from CAMS, and (aJ)–(cJ) JRA-3Q PCWV on PC1 from JRA-3Q; (aM)–(cM) MERRA-2 PCWV on the second principal component (PC2) from MERRA-2; and (aS)–(cS) M2-SCREAM PCWV on PC1 from M2-SCREAM. Principal components (Fig. 3a–c) are based on EOF analysis of vertical and horizontal variations in water vapor for the five Aura MLS pressure levels within 68–147 hPa at 30–130° E and 15–45° N (Sect. 2.2). The location of the Tibetan Plateau is marked by a dark-grey contour, and stippling indicates that the regression is significant at the 95 % confidence level based on Student's t test. The fraction of total variance explained by each mode is listed in the upper right of panels in column (a). evf: explained variance fraction.
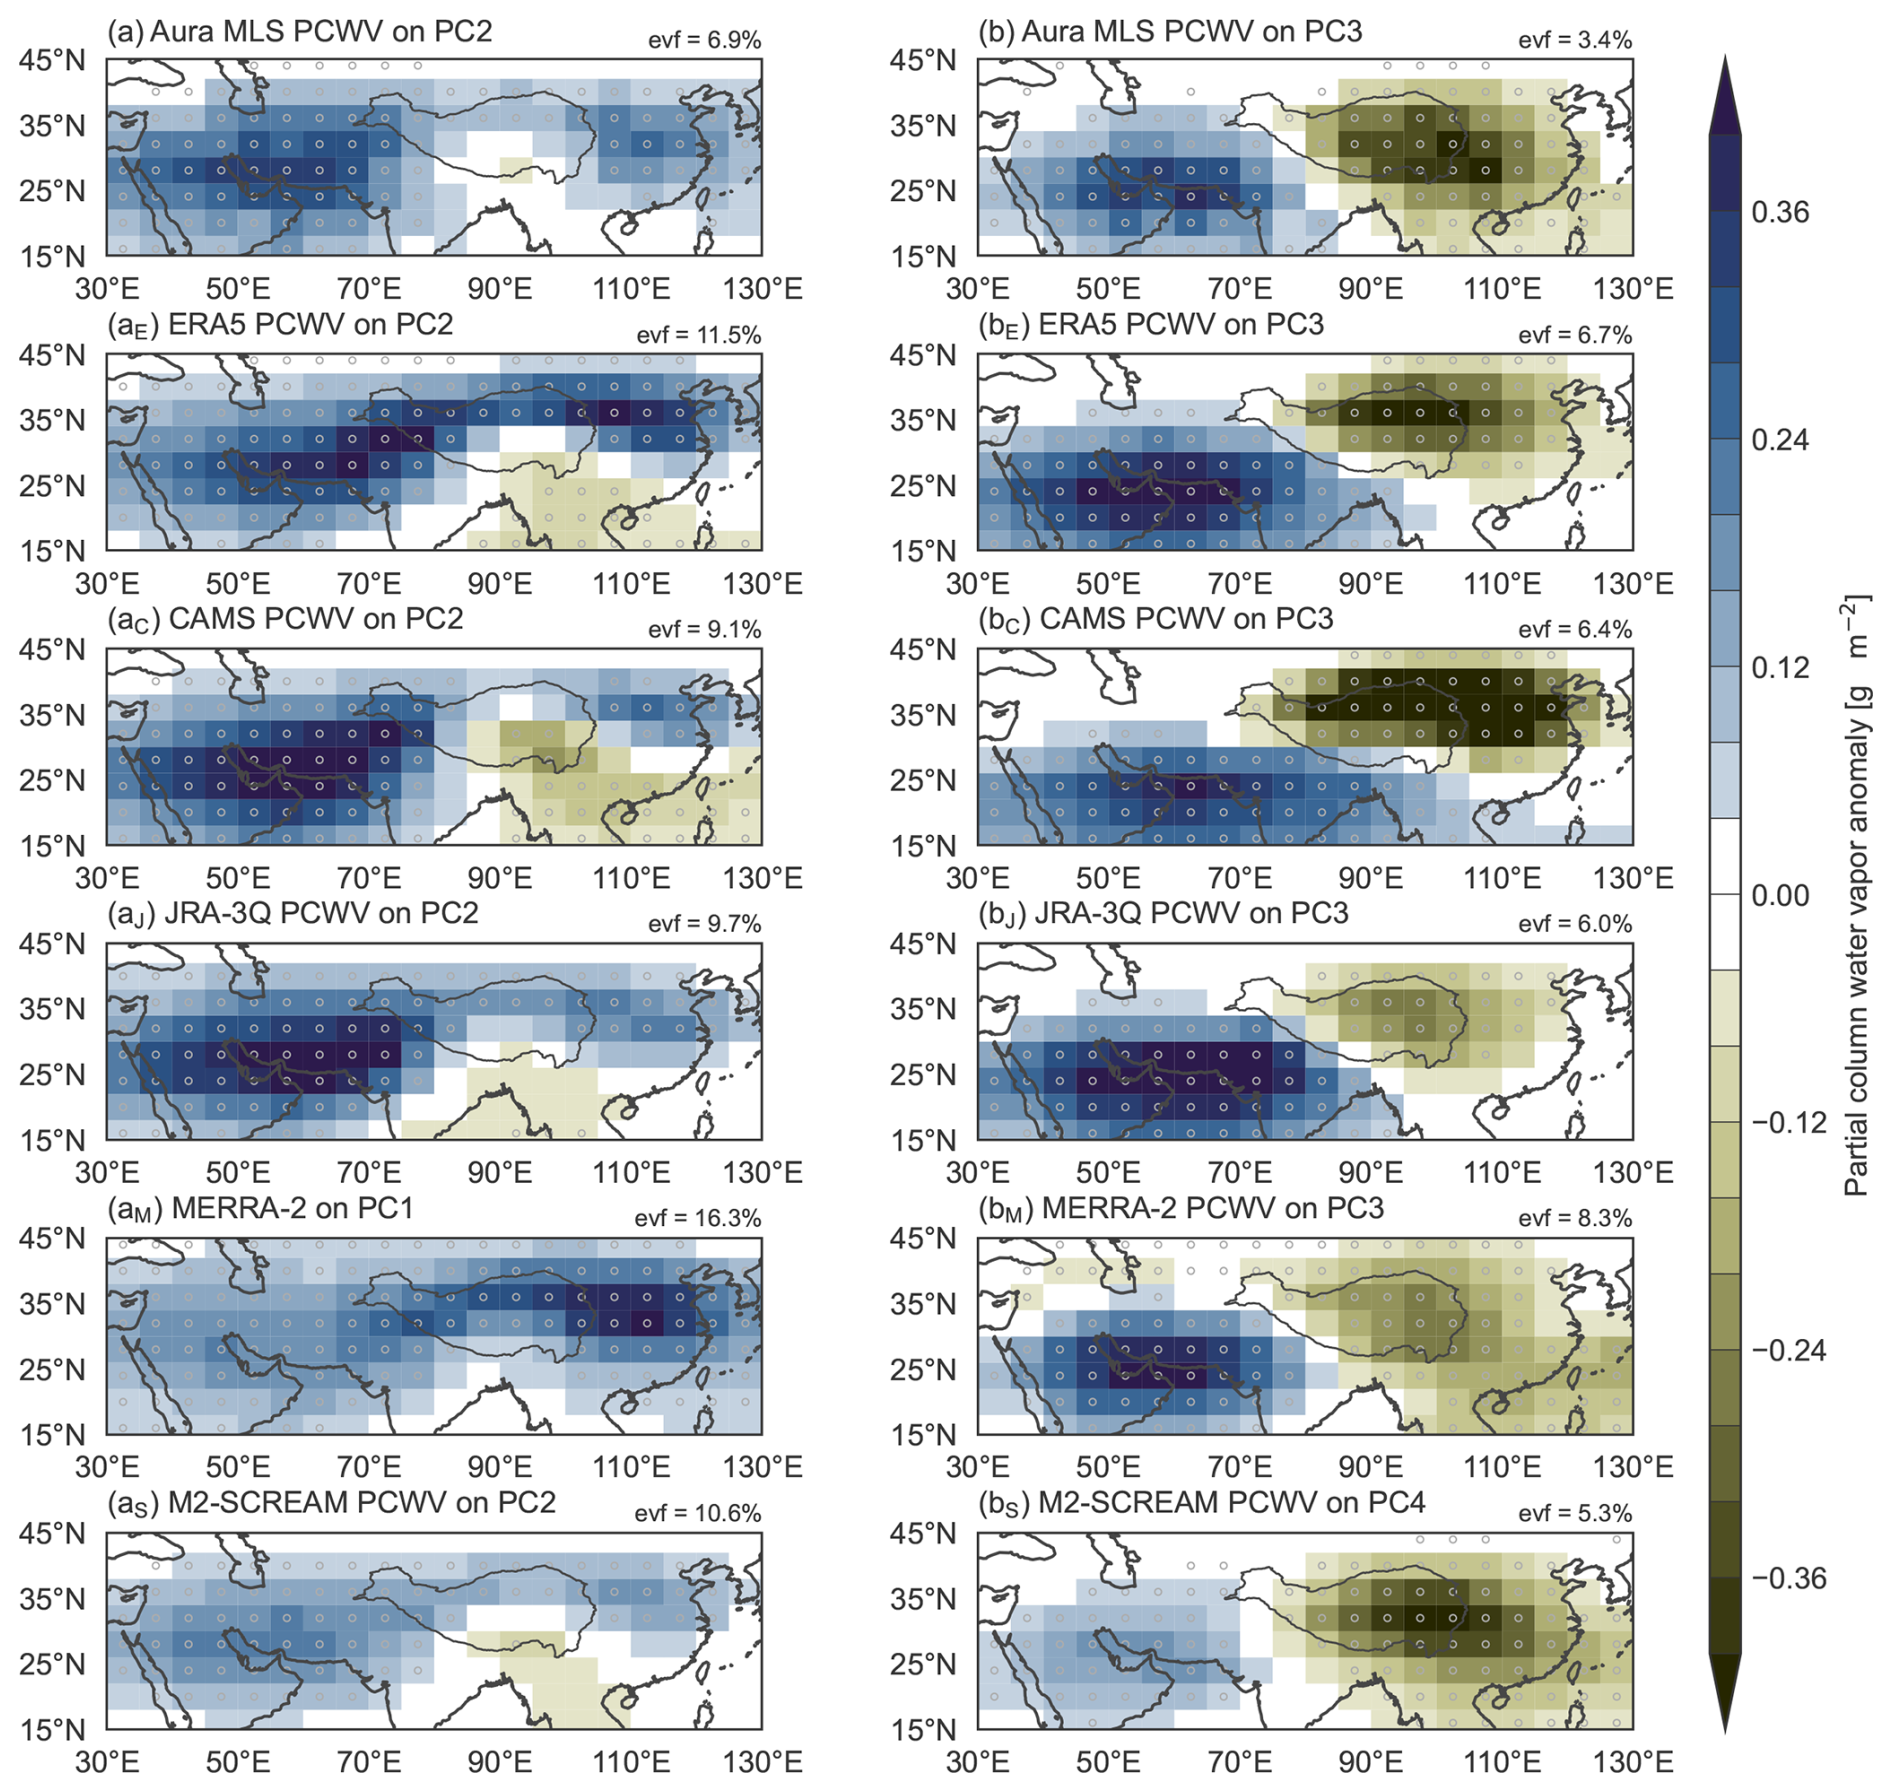
Figure 2As in Fig. 1 but for deseasonalized partial-column water vapor (PCWV) anomalies (Eq. 1) regressed onto the (a) second and (b) third principal components (PCs) from Aura MLS, the (aE) second and (bE) third PCs from ERA5, the (aC) second and (bC) third PCs from CAMS, the (aJ) second and (bJ) third PCs from JRA-3Q, the (aM) first and (bM) third PCs from MERRA-2, and the (aS) second and (bS) fourth PCs from M2-SCREAM. Dark-grey contours mark the location of the Tibetan Plateau, with stippling indicating significance at the 95 % confidence level based on Student's t test. The fraction of total variance explained by each mode is listed in the upper right of panels.
3.1 Characteristics of variability
This section provides brief descriptions of the identified modes, which are analyzed in detail in the following sections. Figures 1 and 2 show deseasonalized PCWV anomalies regressed onto leading principal components (PCs) of vertical and horizontal variability in tropopause-layer water vapor volume mixing ratios from Aura MLS, ERA5, CAMS, JRA-3Q, MERRA-2, and M2-SCREAM. The vertical structure of anomalies associated with each mode is discussed below. PC time series for all datasets are provided in Fig. 3. EOF results for reanalysis products are based on water vapor fields regridded to match the Aura MLS 2.5° × 2.5° grid and pressure levels but without applying the Aura MLS vertical weighting functions. The input data cover the ASM domain (30–130° E and 15–45°N) on the 147, 121, 100, 83, and 68 hPa isobaric levels at pentad temporal resolution.
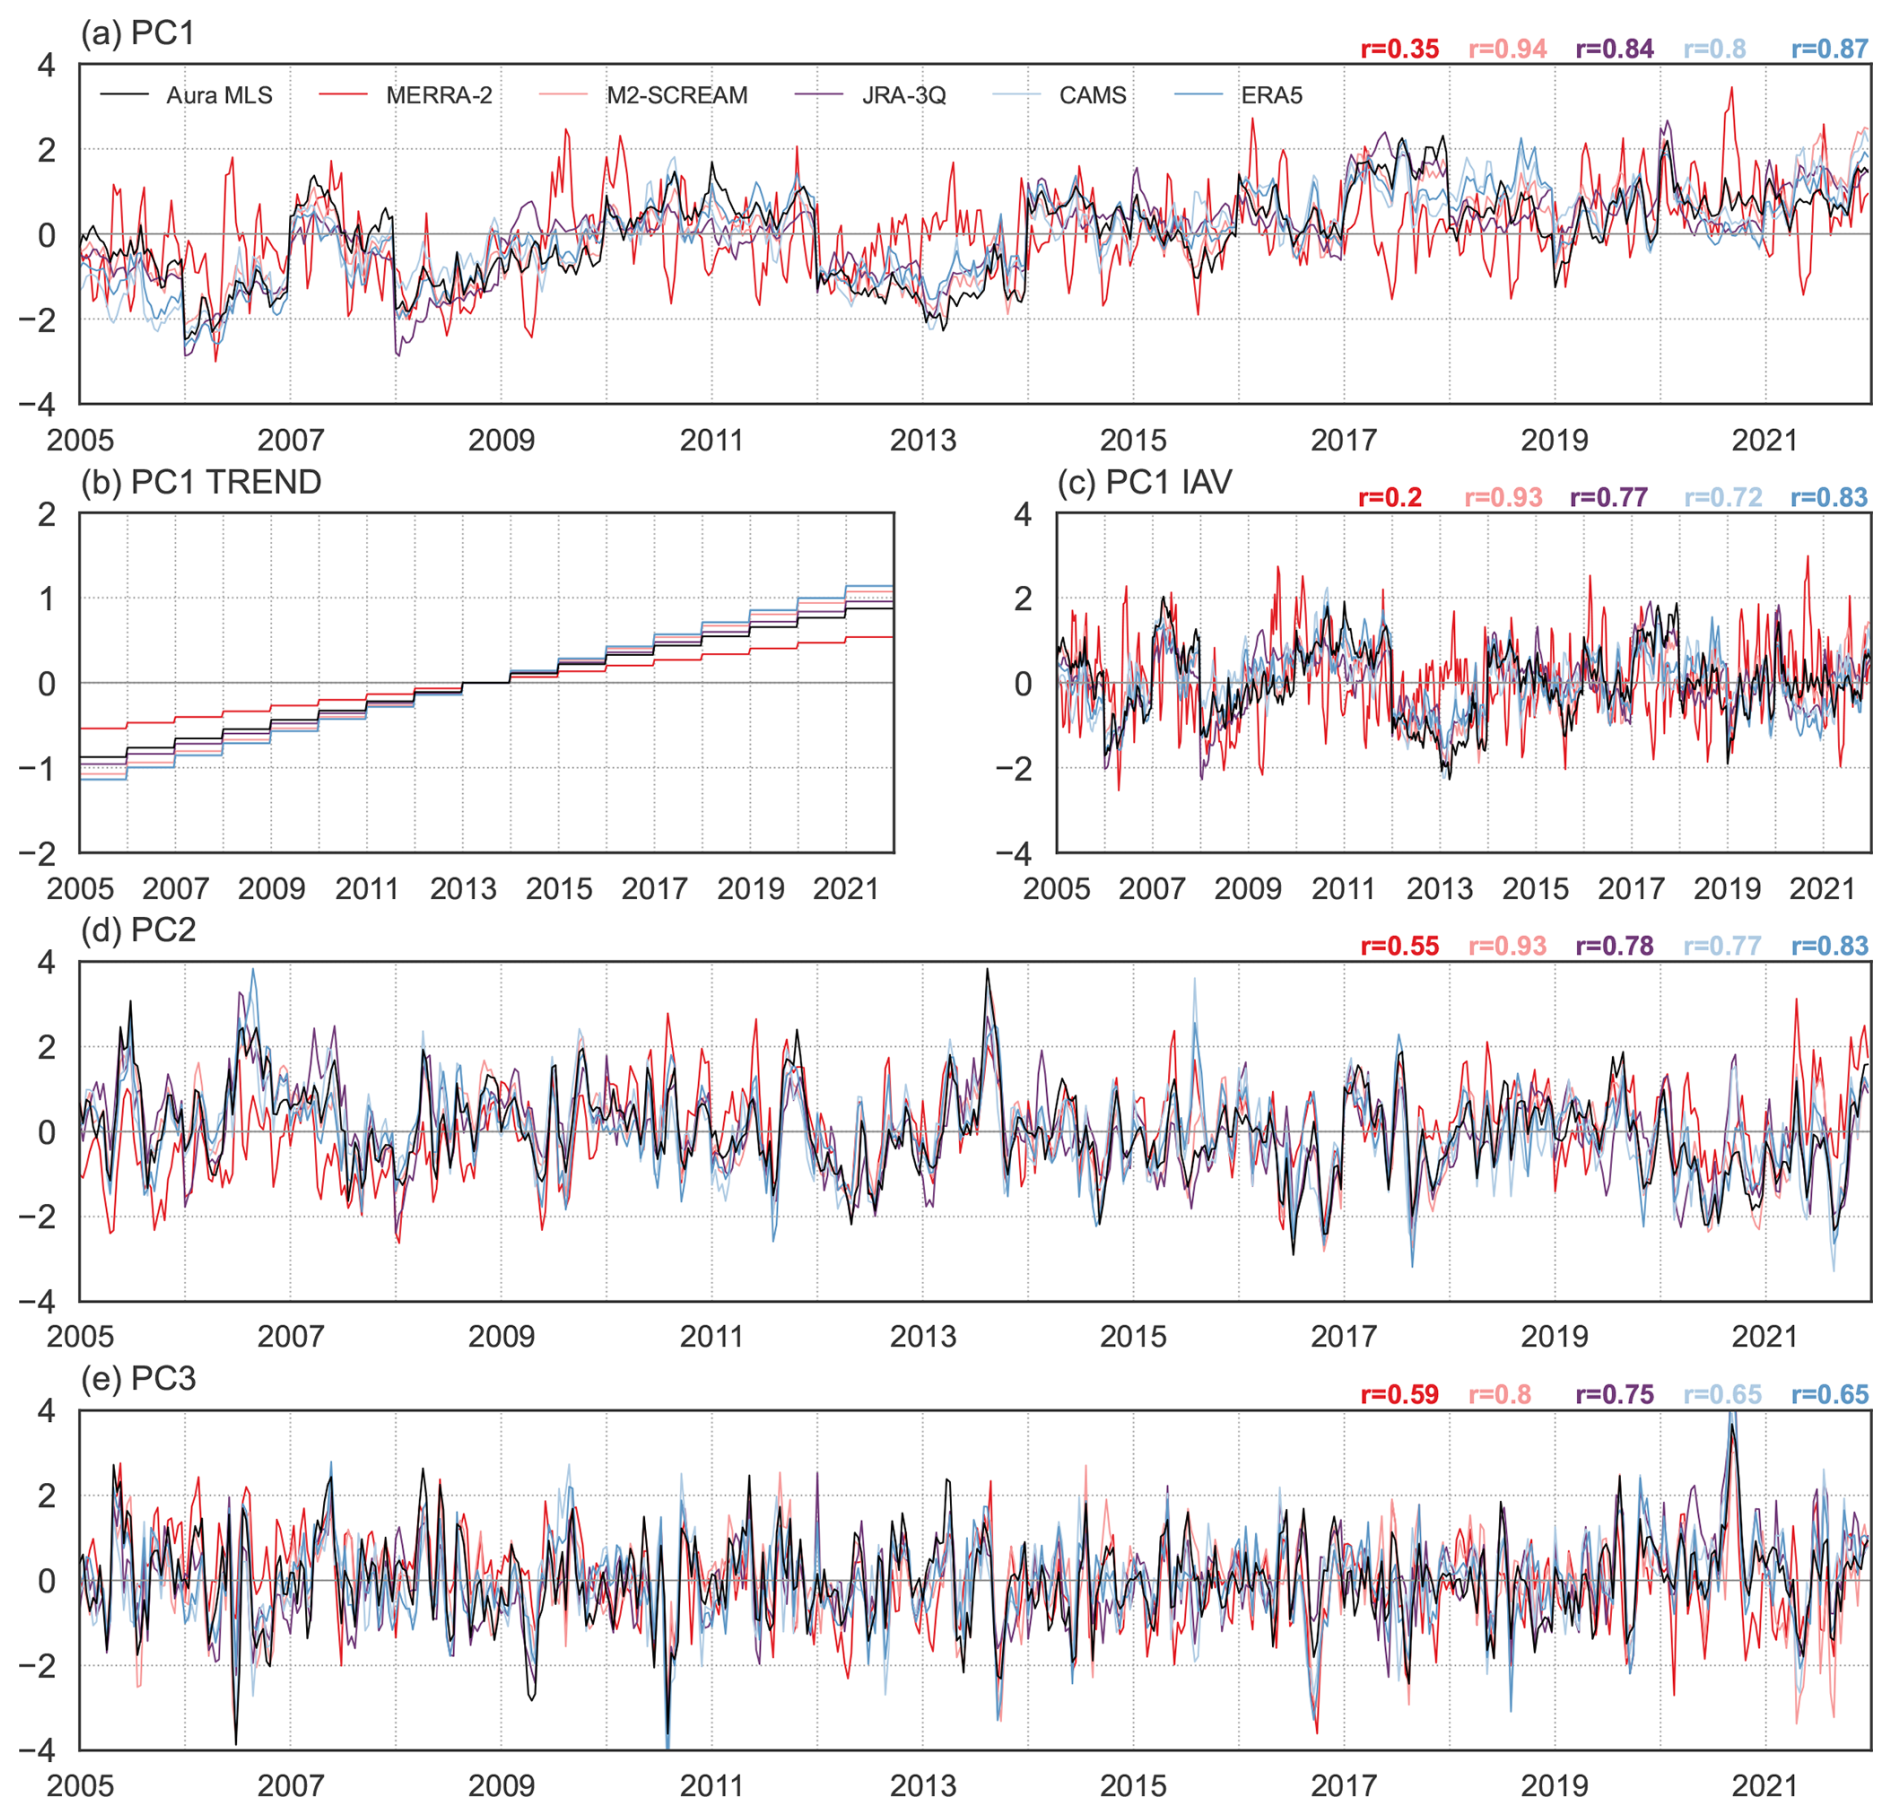
Figure 3Principal component time series for the spatial patterns shown in Figs. 1 and 2 based on Aura MLS (dark grey), ERA5 (dark blue), CAMS (light blue), JRA-3Q (purple), MERRA-2 (dark red), and M2-SCREAM (light red). Time series are shown for (a) the full first principal component (PC1) and its (b) trend (PC1TREND) and (c) interannual variability (PC1IAV) components, (d) the second principal component (PC2), and (e) the third principal component (PC3). Principal components are based on EOF analysis of vertical and horizontal variations in water vapor for the five Aura MLS pressure levels within 68–147 hPa at 30–130° E and 15–45° N (Sect. 2.2). Correlations between MLS-based PCs and those based on MERRA-2 (dark red), M2-SCREAM (light red), JRA-3Q (purple), CAMS (light blue), and ERA5 (dark blue) are listed from right to left along the tops of panels (a), (c), (d), and (e).
We retain the three leading PCs from Aura MLS, which are mutually distinct at the 95 % confidence level according to the North test (North et al., 1982) and collectively account for 24 % of the variance in Aura MLS. The corresponding spatial patterns are identifiable in all reanalyses within the first four EOF modes (significant at 90 % or greater) and account for 43 % of the water vapor variance in ERA5, 45 % in CAMS, 48 % in JRA-3Q, 33 % in MERRA-2, and 44 % in M2-SCREAM. The first principal component (PC1; column a of Fig. 1) accounts for about one-sixth to one-third of the variance in reanalysis water vapor in the ASM tropopause layer, with the smallest fraction of explained variance in MERRA-2 (16 %). PC1 primarily corresponds to interannual variability in the humidity of the lower stratosphere (Figs. S4, S6). The spatial pattern based on MERRA-2, with maximum variance in the southwestern quadrant of the anticyclone, is also considerably different from that identified in other reanalyses. MERRA-2 is a special case because it nudges stratospheric water vapor to a repeating annual cycle (Gelaro et al., 2017; Avery et al., 2017). Because the leading mode varies primarily on interannual and longer timescales (Fig. 3a), the nudging applied in the MERRA-2 lower stratosphere damps this mode in the upper part of our analysis domain.
Having no prior expectation of a substantial trend in water vapor in this region over this period, we did not detrend the input data. However, it is clear from Fig. 3a that PC1 comprises two main types of variability, a linear trend (PC1TREND; Fig. 3b) and interannual variability (PC1IAV; Fig. 3c), both of which project onto regional-scale wet or dry anomalies (Fig. 1). We define the trend component as having a single value each year and constantly increasing from year to year (Fig. 3b). The spatial patterns associated with the trend component (Fig. 1b) represent the main discrepancy between water vapor variability over the ASM region as observed by Aura MLS versus that represented by the reanalyses during our analysis period. The slopes of linear trends in all of the PC1 time series are positive. However, whereas Aura MLS regressed onto the PC1TREND time series indicates a drying trend over 2005–2021 centered in the southwest, the reanalyses show moistening centered in the southeast. This difference partially explains the larger signal and explained variance in PC1 based on M2-SCREAM, JRA-3Q, CAMS, and ERA5 relative to Aura MLS. We use version 5 (v5) of Aura MLS, in which the retrieval algorithm has been designed to mitigate a slow drift toward wet biases in the stratosphere in v4 (Livesey et al., 2021, 2022). M2-SCREAM, which assimilated Aura MLS v4 throughout our analysis period, provides an indirect indication of the difference between v4 and v5 in this region (Wright et al., 2025). Consistency between M2-SCREAM and the other reanalysis products, which did not assimilate Aura MLS, thus raises the following question: could changes to the retrieval algorithm aimed at removing the spurious drift have also removed real regional trends? However, trends based on reanalysis products may not be physically meaningful and must be interpreted with caution (e.g., SPARC, 2022), especially over periods as short as this one, and recent work has shown that trends in stratospheric water vapor are difficult to distinguish from multi-decadal variability (Tao et al., 2023). Although the remarkable consistency across reanalysis products gives cause for careful consideration, we remain skeptical of the reanalysis-based trends shown in column (b) of Fig. 1. Further details are provided in Sect. 3.2.
The largest PCWV anomalies associated with the interannual mode (PC1IAV) are located over East Asia and the area southwest of the Tibetan Plateau, with smaller anomalies over South Asia in the convective core of the monsoon (Fig. 1, right column). This spatial structure implies that interannual variability is stronger in the northeastern and southwestern sectors of the anticyclone (i.e., the eddy shedding zones; Popovic and Plumb, 2001; Honomichl and Pan, 2020; Siu and Bowman, 2020) and weak above and immediately downstream of the strongest convection. With the exception of MERRA-2 as discussed above, correlations between reanalysis-based PC1IAV and that based on Aura MLS are high, with values ranging from 0.72 (CAMS) to 0.93 (M2-SCREAM) indicating that the other four reanalyses reproduce variations in this mode well. The phase of the interannual mode is typically set at the beginning of the monsoon season (Fig. 3c), suggesting the influence of external factors. In most years, the phase is then maintained through the monsoon season, suggesting either steady in-mixing of the anomaly from outside the anticyclone, maintenance by local feedbacks, strong confinement, or some combination of these. Likely candidates for sources of interannual variability outside the monsoon region include the El Niño–Southern Oscillation (ENSO; Yan et al., 2018; Garfinkel et al., 2021) and the Quasi-Biennial Oscillation (QBO; Ziskin Ziv et al., 2022; Peña Ortiz et al., 2024). We evaluate these possibilities in Sect. 3.3.
The second principal component (PC2; column a of Fig. 2) shows moistening or drying centered in the southwestern quadrant of the anticyclone, with the largest signal centered over the Persian Gulf. This mode explains 7 %–11 % of the variance in datasets other than MERRA-2, for which this mode corresponds to PC1 and explains 16 % of the variance (Fig. 2aM). Correlations between PC2 from Aura MLS and the corresponding modes in each reanalysis range from 0.55 in MERRA-2 to 0.93 in M2-SCREAM (Fig. 2i), with JRA-3Q (r=0.78), CAMS (r=0.77), and ERA5 (r=0.83) all showing high correlations. Although this mode exhibits some variability at longer timescales, its fluctuations are mainly subseasonal.
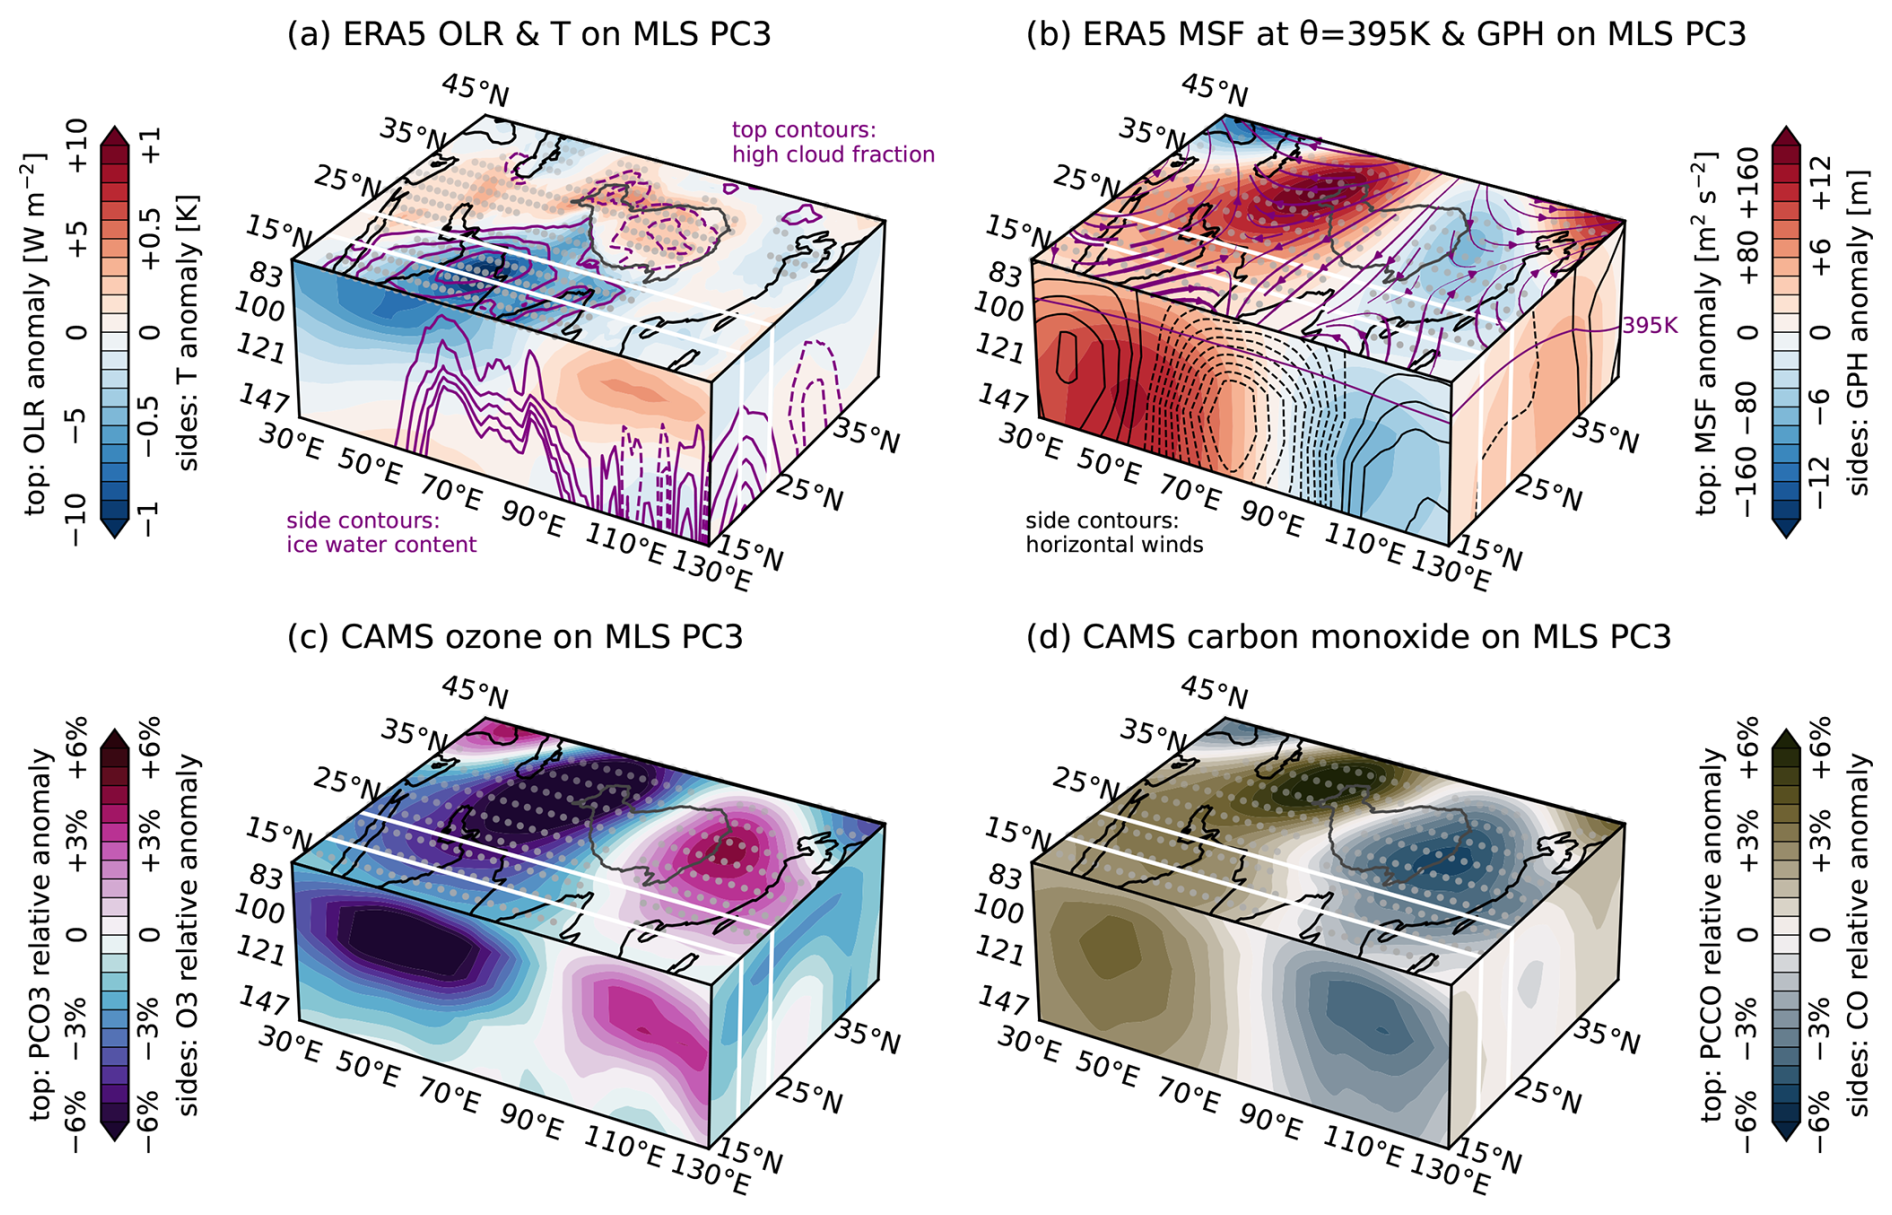
The third principal component (PC3), which consists of a southwest–northeast dipole with opposing centers of water vapor anomalies over the Persian Gulf and the eastern Tibetan Plateau, explains slightly more than 3 % of the variance in Aura MLS (Fig. 2b). This mode corresponds to the fourth mode in M2-SCREAM (5 % of the variance; Fig. 2) and the third mode in all other reanalyses (6 %–8 %). Variations in the corresponding PCs are mainly subseasonal and again show strong correlations with Aura MLS PC3, ranging from 0.59 in MERRA-2 to 0.80 in M2-SCREAM. PC2 and PC3 primarily reflect subseasonal variability below the tropopause (Figs. S5, S6). Spatial patterns show good correspondence overall, although the southwest-to-northeast tilt of the dipole is sharper in CAMS and ERA5 in comparison to the more east–west orientation in Aura MLS, MERRA-2, and M2-SCREAM. The dipole in JRA-3Q is broadly similar to the latter three but with a stronger signal on the equatorward side of the southwest pole.
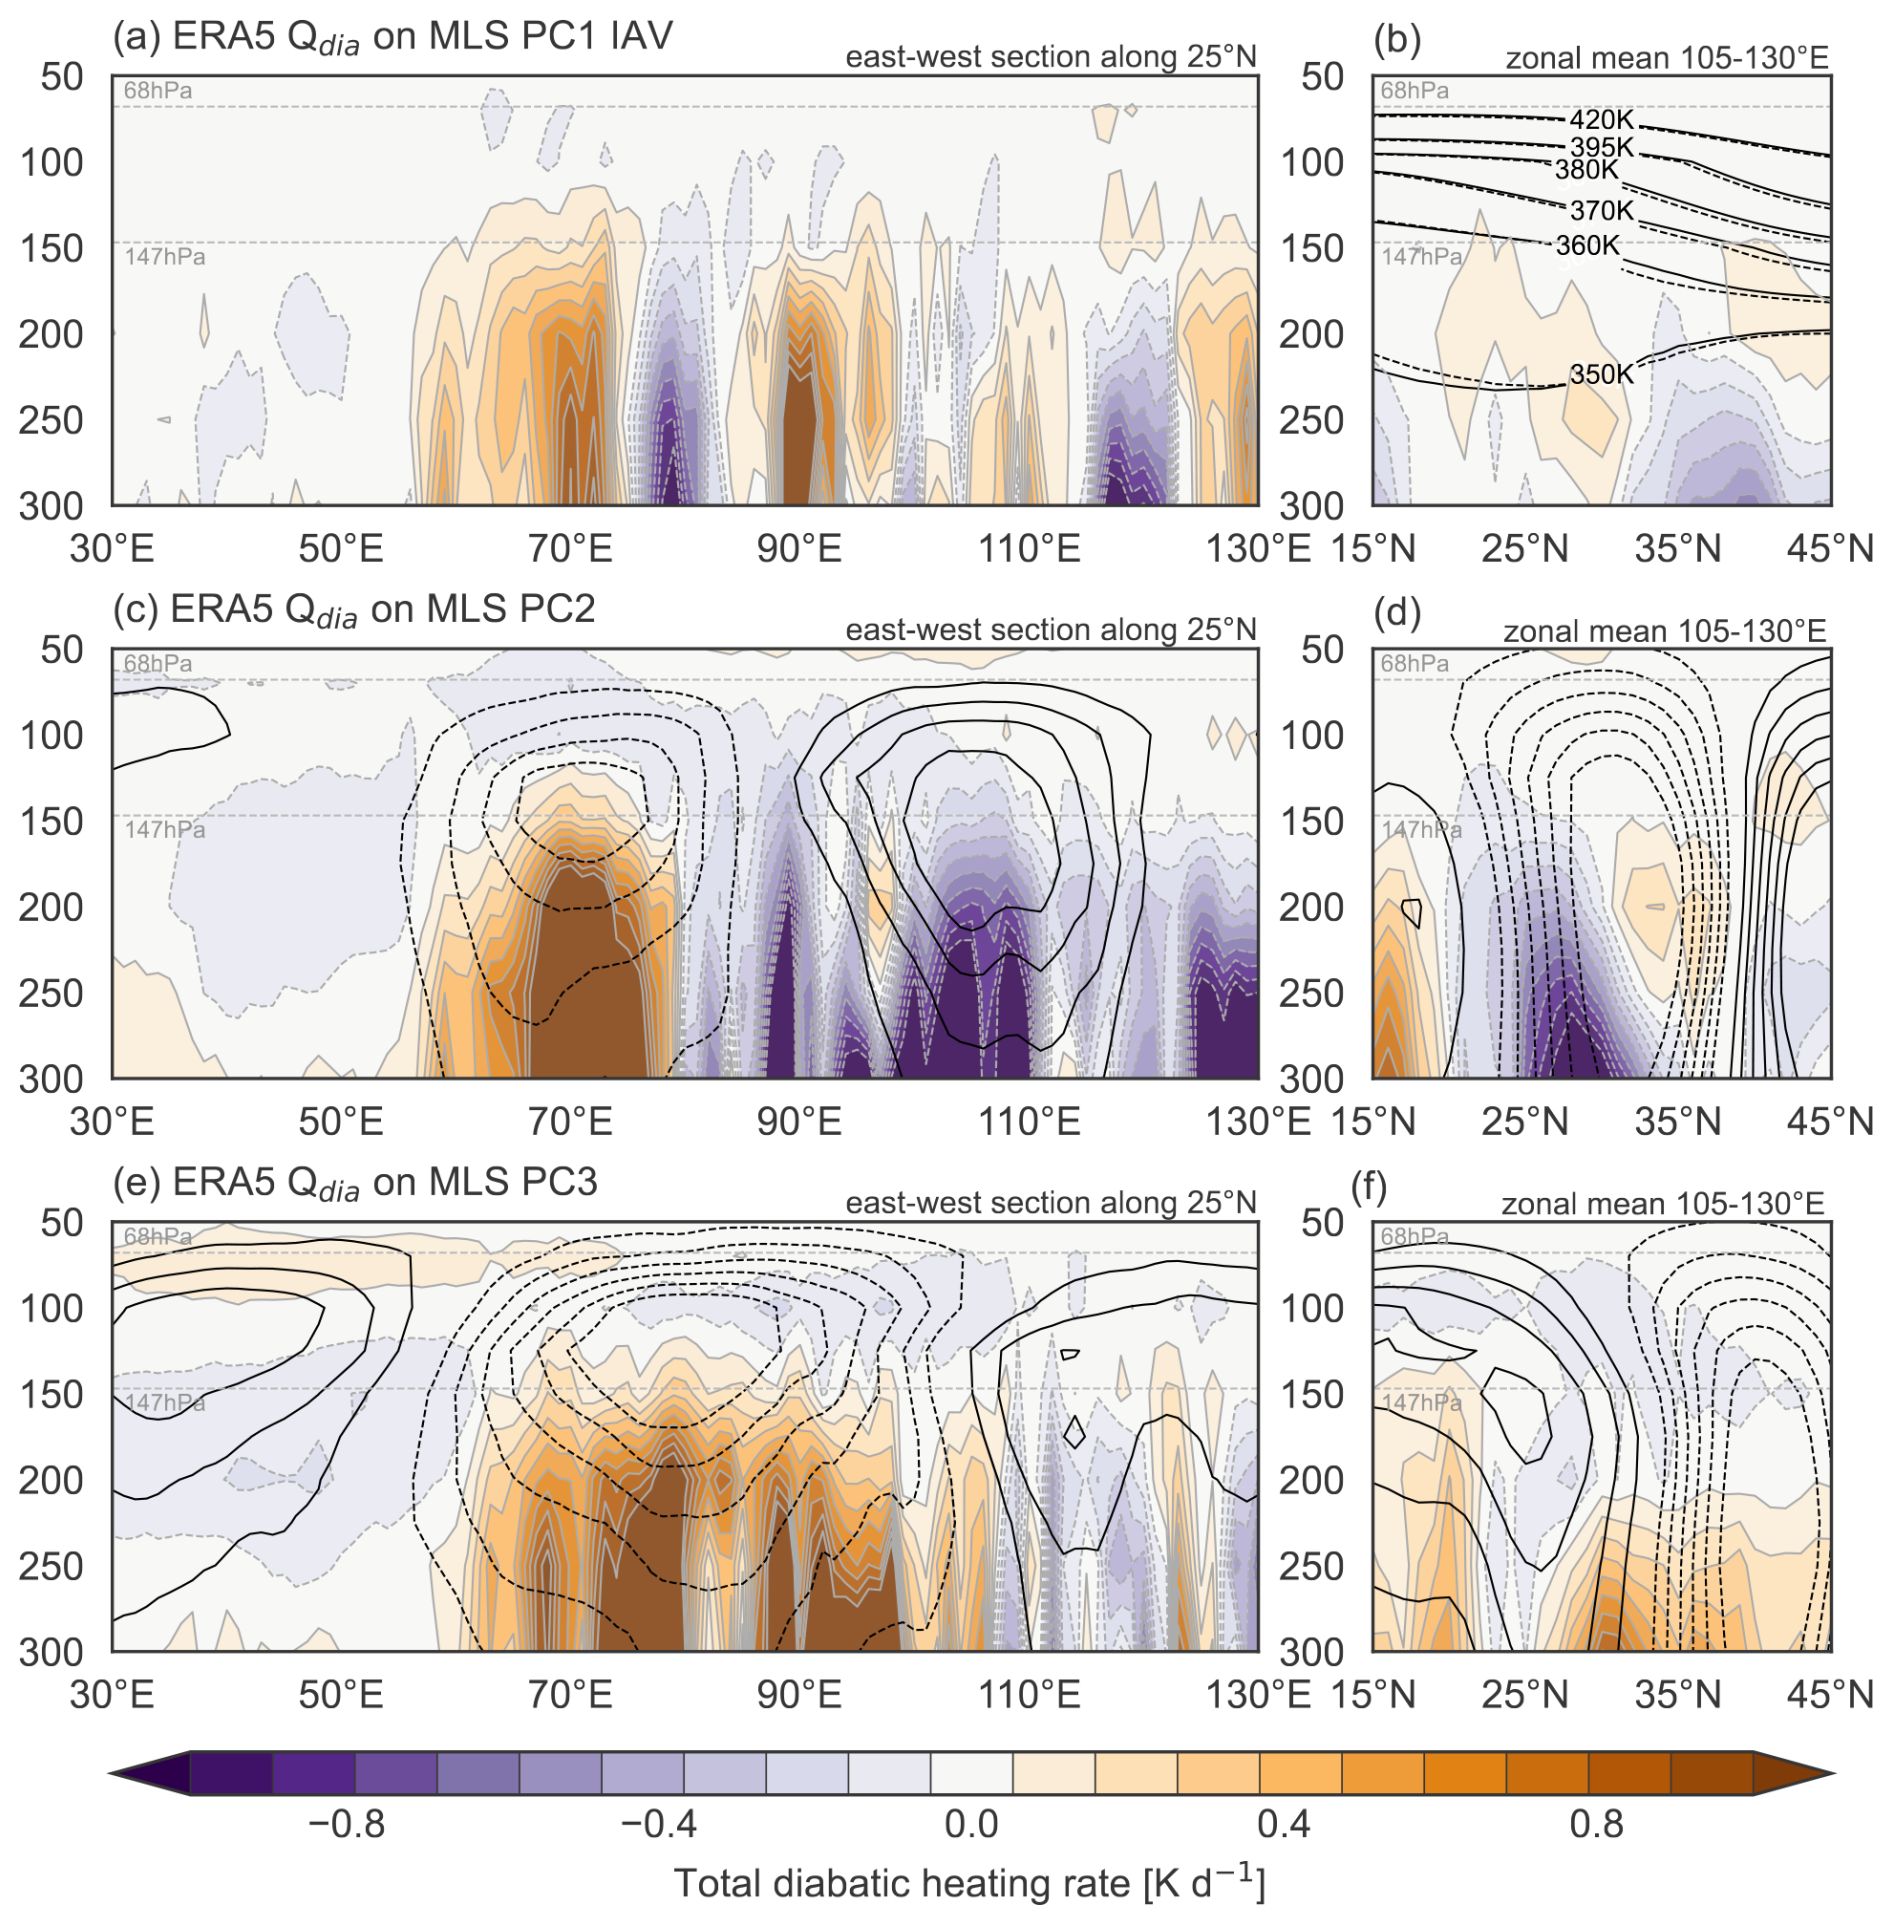
Figure 4Composite east–west and north–south transects of diabatic heating (Qdia) anomalies in ERA5 conditioned on (a–b) the detrended first principal component (PC1IAV), (c–d) the second principal component (PC2), and (e–f) the third principal component (PC3) of Aura MLS observations of water vapor variability in the monsoon tropopause layer. Composites are calculated as mean differences between pentads with PC ≥1 and pentads with PC . (a, c, e) Diabatic heating anomalies along the east–west transect are evaluated along 25° N, while (b, d, f) anomalies along the north–south transect are zonally averaged over 105–130° E. Zonal-mean isentropic surfaces are shown in (b) for the moist phase (solid) and dry phase (dotted) of PC1IAV. Composite differences in (c, e) meridional and (d, f) zonal wind for PC2 and PC3 are shown as black contours at contour intervals of 1 m s−1 starting from ±1 m s−1 (solid for southerly and westerly anomalies; dashed for northerly and easterly anomalies).
Figure 4 shows diabatic heating anomalies along the 25° N transect and zonal-mean diabatic heating anomalies averaged across the ASM domain (105–130°E). Composite mean differences between the moist (PC ≥1) and dry (PC ) phases highlight changes in the intensity and locations of monsoon convection. Here, the “moist” phase is defined by the presence of positive convective heating and PCWV anomalies in the southwestern quadrant of the anticyclone, as this heating center is present in all three modes and all three reanalyses (Figs. S1–S3 in the Supplement). The moist phase of PC1IAV is associated with enhanced deep convective heating near 70° E (near the Indus River delta), 90° E (over Bangladesh), and 130° E (western North Pacific) in ERA5 (Fig. 4a), with regions of reduced heating in between. These variations largely offset in the zonal mean, resulting in weak differences in zonally averaged heating (Fig. 4b). Comparison with results for MERRA-2 and JRA-3Q (Fig. S1) shows that increases in convective heating west of 70° E and near 130° E is robust in the three datasets but differences between 70 and 130° E are not. The largest discrepancies are over Bangladesh and the Bay of Bengal (around 85–95° E), where ERA5 shows stronger convection in the moist phase (Fig. S1a), MERRA-2 shows stronger convection in the dry phase (Fig. S1b), and JRA-3Q shows little difference between the phases. Figure 4b also shows uplift of the isentropic surfaces along the northern flank of the anticyclone in the moist phase relative to the dry phase, indicative of weaker UTLS baroclinicity, and a weaker tropical easterly jet equatorward of 25° N.
The moist phase of PC2 (Fig. 4c–d) is associated with enhanced convective heating in the west and reduced convective heating in the east along the 25° N transect, with zonal-mean heating enhanced south of this transect (15–20° N) and reduced to the north (25–30° N). These differences are consistent across all three reanalyses (Fig. S2), with the strongest signal in MERRA-2 and the weakest signal in JRA-3Q. Differences in convective heating along 25° N are located directly below strong differences in the meridional winds (Fig. 4c), with southerly anomalies over weakened convection and northerly anomalies over strengthened convection indicating an upper-level cyclonic anomaly during moist phases and an anticyclonic anomaly during dry phases. The zonal wind response (Fig. 4d) suggests a northward shift in the upper-level anticyclone.
Positive PC3 (Fig. 4e–f) is linked to enhanced deep convective heating over a broad region from 60 to 100° E along the 25° N transect, with stronger zonal-mean heating in the upper troposphere at all latitudes south of 30° N. Figure 4e also shows anomalies in meridional winds along the 25° N transect, which suggest a wave train along the subtropical westerly jet with a cyclonic center around 110° E and an anticyclonic center around 55° E. In the zonal mean, both the subtropical westerlies and the tropical easterlies are weaker in the positive phase and stronger in the negative phase (Fig. 4f). All three reanalyses indicate increases in the depth of convection along the southern flank of the anticyclone during the moist phase relative to the dry phase (Fig. S3). Distributions of anomalous heating and winds are likewise broadly consistent.
The following sections present detailed analyses of the interannual (PC1) and subseasonal (PC2 and PC3) modes, including changes in composition (based on CAMS) and the dynamical and thermodynamic environment (based on ERA5). Results for other reanalyses and inter-reanalysis differences are provided in the Supplement, with brief descriptions provided in the main text. For comparability, the following results are all based on principal components calculated based on Aura MLS.
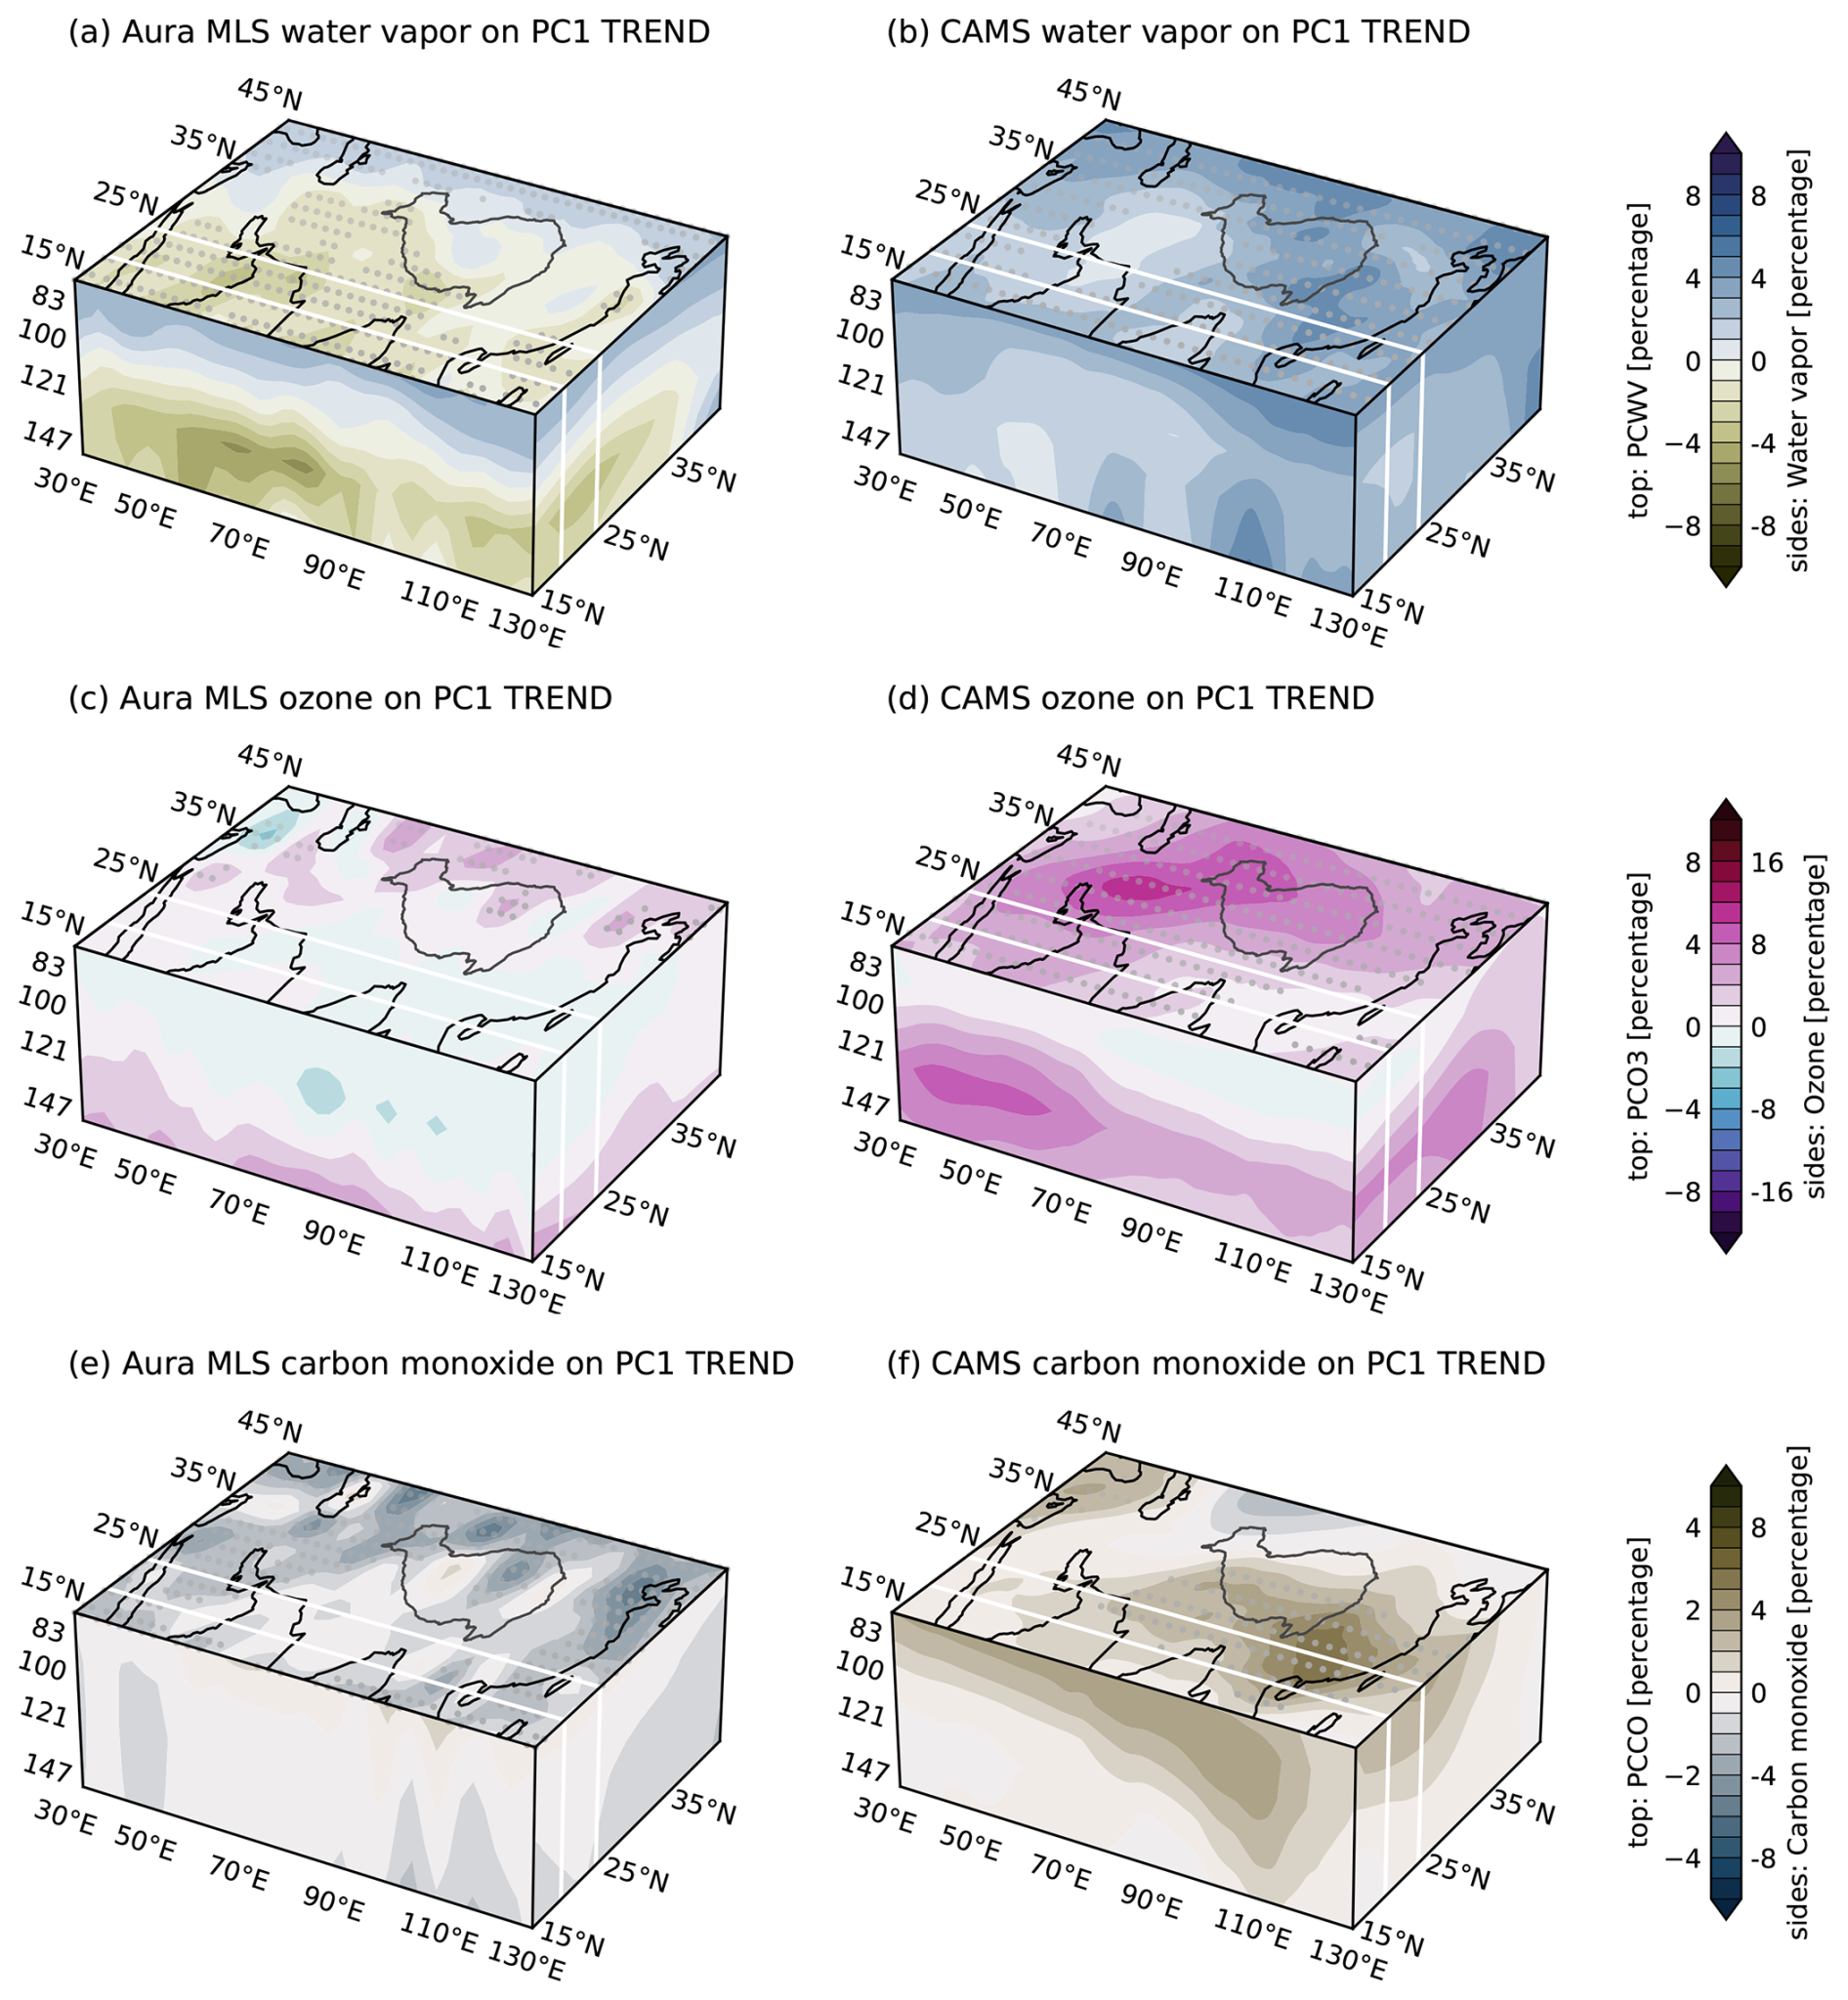
Figure 5Top faces show the horizontal structure of deseasonalized anomalies in (a, b) PCWV, (c, d) PCO3, and (e, f) PCCO regressed onto the linear trend component of the first mode (PC1TREND) based on Aura MLS. Side faces show the vertical structure of deseasonalized anomalies in (a, b) water vapor, (c, d) ozone, and (e, f) carbon monoxide averaged meridionally over 20–25° N (south face) and zonally over 30–130° E (east face) regressed onto PC1TREND. Variables in the left column are from Aura MLS, and variables in the right column are from CAMS; all are regressed onto PC1TREND from Aura MLS. The location of the Tibetan Plateau is marked by a dark-grey contour, and the boundaries of the east–west transect are marked by white lines in all panels. Stippling on the top face indicates locations where regression slopes are significant at the 95 % confidence level.
3.2 The trend component
The largest difference between Aura MLS and the reanalysis products in our results is in the linear trend component of PC1. Whereas Aura MLS suggests a drying trend during 2005–2021 centered in the southwest, the reanalyses all show regional moistening centered in the southeast (Figs. 1, 5a–b). Based on CAMS, this trend in the reanalysis is associated with increases in ozone below the tropopause and CO above the tropopause (Fig. 5d, f). Increases in water vapor (Fig. 5b) and CO below the tropopause are centered in the southeastern part of the domain, possibly suggesting an enhanced convective source to the tropopause layer in this region. However, reanalysis-based trends in water vapor do not match those in Aura MLS (Fig. 5a). Instead, the satellite observations suggest a negative trend in water vapor below the tropopause, especially in the southwestern quadrant of the anticyclone. Aura MLS further indicates that these decreases in the lower part of the tropopause layer are accompanied by decreases in CO and increases in ozone below the tropopause, while increases in lower-stratospheric water vapor are linked to decreases in ozone and increases in CO above the tropopause (Fig. 5a, c, e). Trends based on CAMS indicate a very different distribution of changes in CO (Fig. 5f). Ozone trends are in somewhat better agreement (Fig. 5d), but this is not a useful litmus test because CAMS, like most of the reanalyses, assimilates Aura MLS ozone (Inness et al., 2019; Wright et al., 2025).
The S-RIP Final Report (SPARC, 2022) advises that trends based on reanalyses should be assessed with respect to three criteria: (1) consistency across reanalyses, (2) consistency with (ideally independent) observations, and (3) a clear and convincing physical explanation. The trend discussed here meets the first criterion but does not satisfy the second. On the one hand, this disagreement between the reanalyses and Aura MLS is qualified by the v5 water vapor retrieval for Aura MLS having been designed to remove a spurious increasing trend in water vapor (Livesey et al., 2021, 2022), which raises the possibility that these adjustments could have also removed physically meaningful regional trends over the MLS record. On the other hand, except for ozone (for which CAMS assimilates retrievals from Aura MLS), trends in other variables based on Aura MLS also differ substantially from the patterns shown for CAMS (Fig. 5).
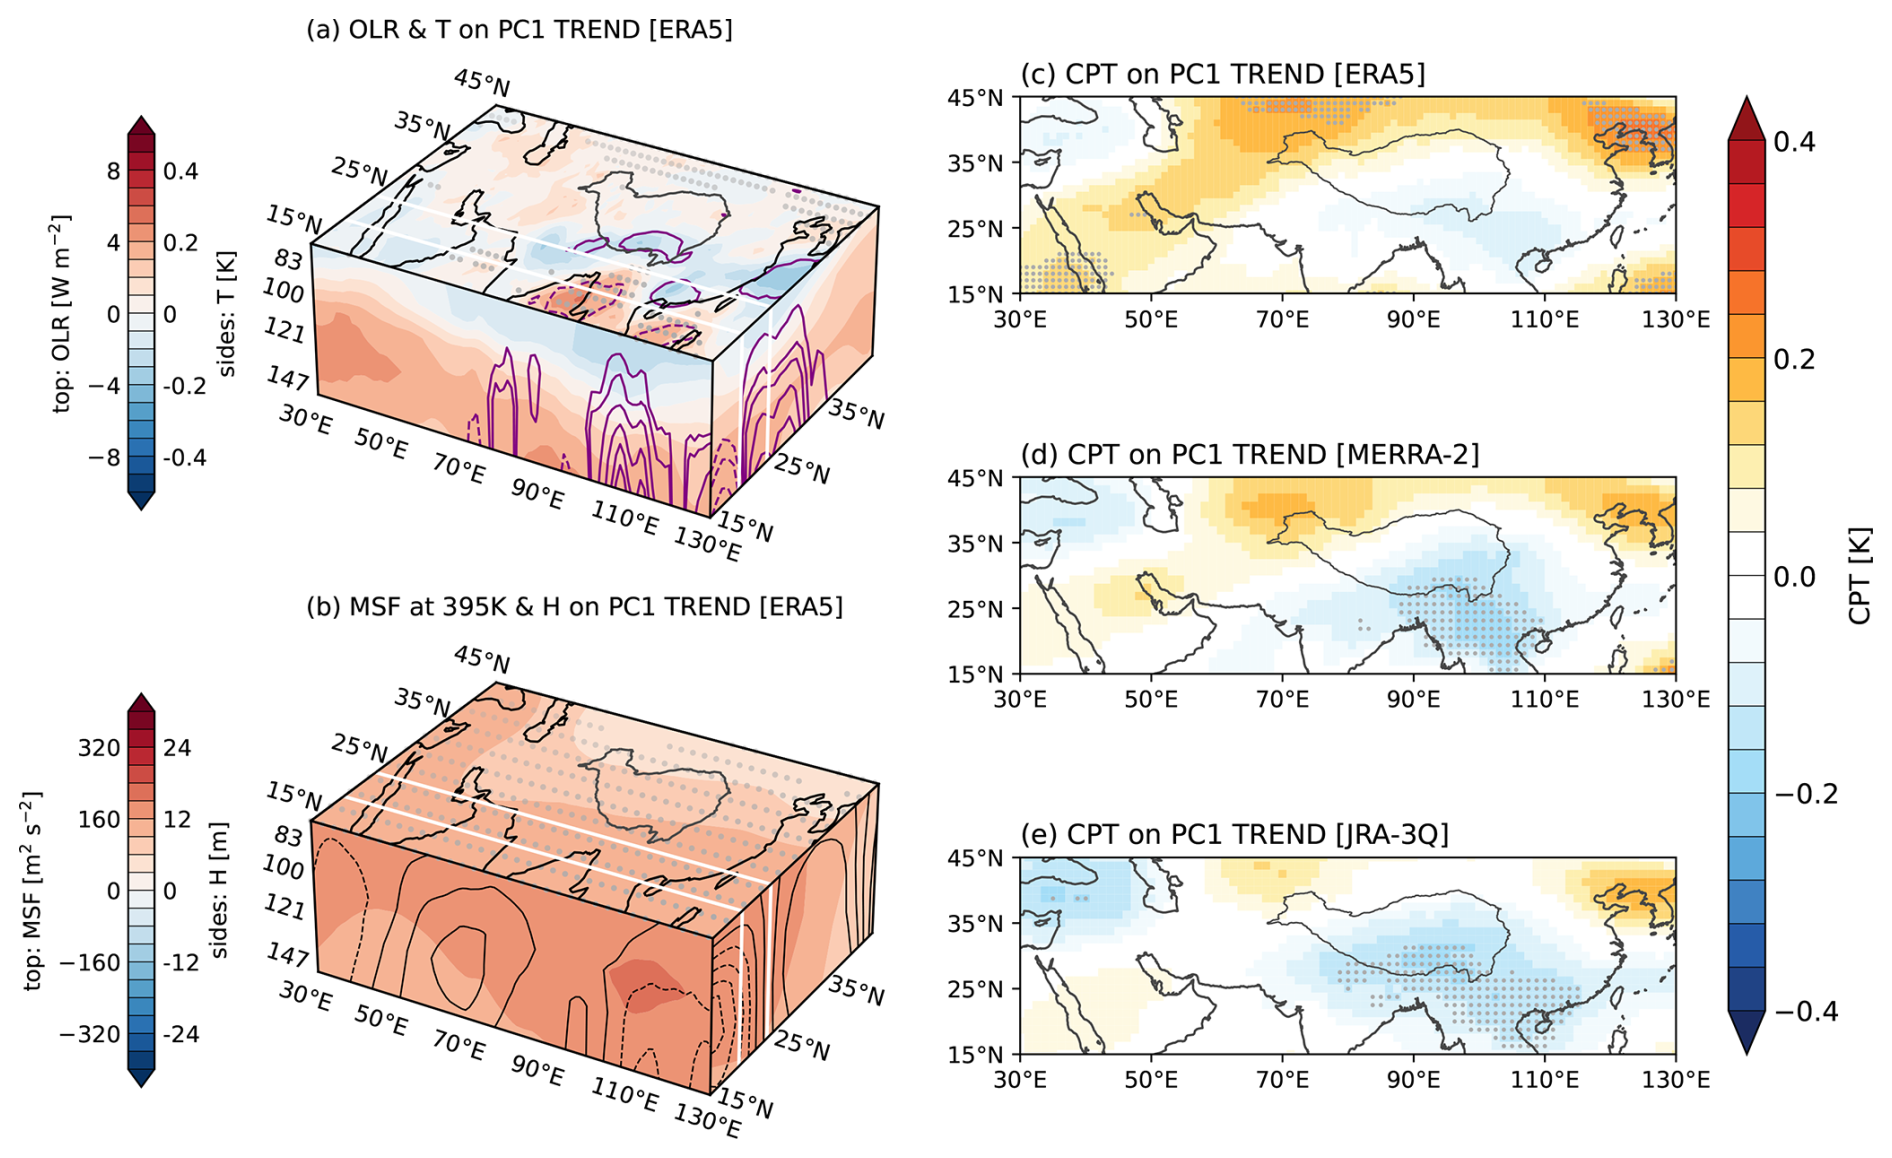
Figure 6(a) Horizontal structure of changes in outgoing longwave radiation (OLR; top face) and temperature (T; side faces) averaged meridionally over 20–25° N (south face) and zonally over 30–130° E (east face) over 2005–2021. (b) As in (a) but for the Montgomery streamfunction (MSF) on the θ=395 K isentropic surface (top face) and geopotential height (H; side faces). Purple contours in panel (a) indicate anomalies in the high cloud fraction (top face; intervals of 2 percentage points from ±2 %) and cloud ice water content (side faces; intervals of 0.2 mg kg−1 from ±0.1 mg kg−1). Black contours in panel (b) indicate changes in meridional (south face) and zonal (east face) winds at intervals of 0.2 m s−1. All variables are regressed onto the linear trend component of the first mode (PC1TREND) based on Aura MLS. (a–c) Changes in cold-point tropopause (CPT) temperatures based on (c) ERA5, (d) MERRA-2, and (e) JRA-3Q regressed onto PC1TREND. The location of the Tibetan Plateau is marked by a dark-grey contour in all panels, and the boundaries of the east–west transect are marked by white lines in panels (a) and (b). Stippling indicates locations where regression slopes are significant at the 95 % confidence level based on Student's t test.
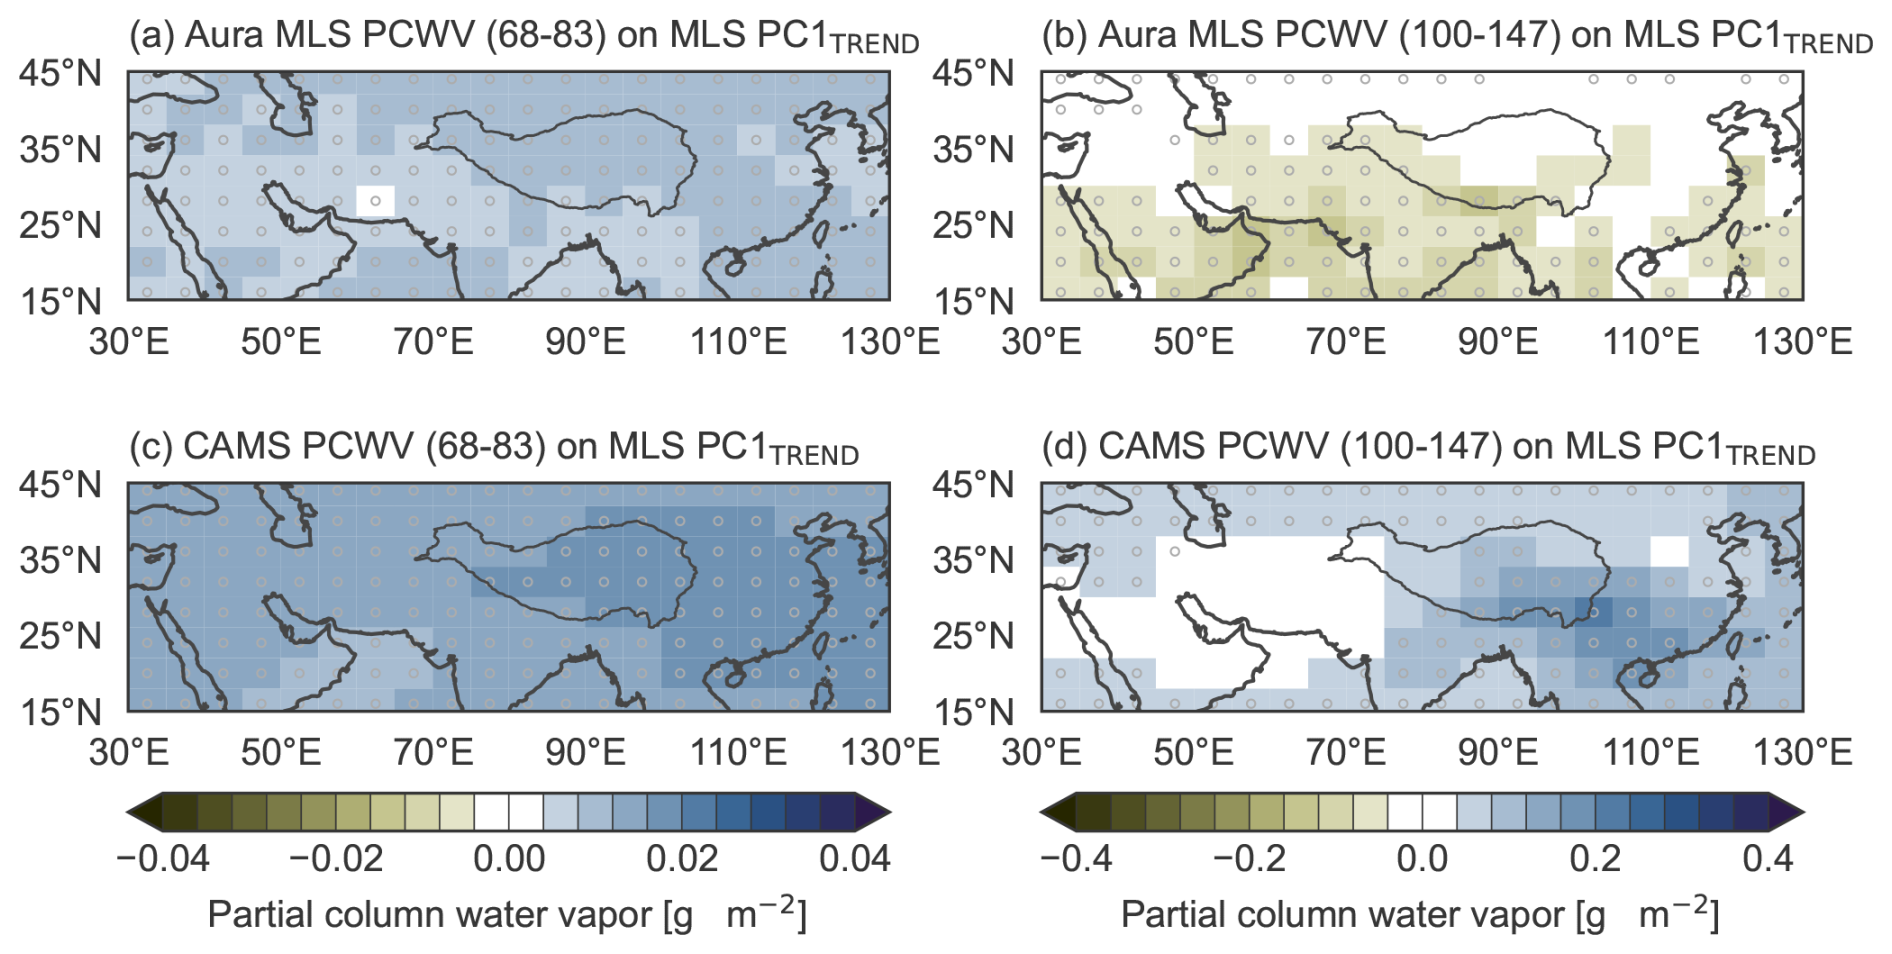
Figure 7Deseasonalized partial-column water vapor (PCWV) anomalies (Eq. 1) integrated (a, c) from 83 to 68 hPa and (b, d) from 147 to 100 hPa regressed onto the first principal component (PC1) trend variability above the tropopause (PC1TREND) from Aura MLS (Fig. 3b). PCWV distributions in the upper panels (a, b) are based on Aura MLS, and those in the lower panels (c, d) are based on CAMS. The location of the Tibetan Plateau is marked by a dark-grey contour, and stippling indicates that the regression is significant at the 95 % confidence level based on Student's t test.
Figure 6 addresses the third criterion, as it is important to understand the reanalysis-based trend even if this trend is spurious. Regressions shown in Fig. 6 are all calculated against PC1TREND from Aura MLS, thus removing the effects of different magnitudes of the year-to-year increase in PC1 across the reanalyses. Based on ERA5, warm-season cloud ice water content and high cloud cover increased over southern China, northern India, and the southeastern Tibetan Plateau during 2005–2021 (Fig. 6a). Detrainment from this deeper convection, also supported by increases in CAMS CO in this sector (Fig. 5f), may explain local increases in PCWV (Fig. 1bE–bS), especially those centered in the lower part of the tropopause layer (Fig. 5b). Temperatures decreased in the lower stratosphere in this quadrant, although the magnitude of these decreases differs across the reanalyses (Fig. 6a, c–e). Increases in geopotential height and the Montgomery streamfunction (MSF; Fig. 6b) are consistent with expectations under global warming (see also the regional expression of greenhouse gas-driven tropospheric warming and stratospheric cooling in Fig. 6a). The local enhancements of MSF and geopotential height in the southeastern quadrant of the monsoon anticyclone imply additional tropospheric warming there, suggesting that the reduction in CPT temperature may result from an increase in CPT height. These discrepancies in the trend component between observations and reanalyses arise from different responses in the upper troposphere (Fig. 7b, d; Figs. S4, S7). The reanalyses exhibit better agreement with Aura MLS above the tropopause, where both reanalysis products and observations show a regional moistening trend (Figs. 7a, c; S4). The moistening trends below the tropopause are collocated with enhanced convection in the southeast quadrant (Fig. 6a), while the largest moistening trends above the tropopause based on Aura MLS are collocated with increases in CPT temperature (Fig. 6c–e; consistent with Fig. S8a, d, g). However, further analysis is needed to determine how these features contribute to trends in tropopause-layer water vapor.
Despite qualitative consistency in the signs of water vapor trends among the reanalyses, there are some notable differences in the spatial patterns. For example, whereas JRA-3Q (Fig. 1bJ) shows moistening mainly over southern China, CAMS (Fig. 1bC) and ERA5 (Fig. 1bE) show significant increases westward over northern India. This difference may be understood to leading order as differences in the trend of CPT temperatures between ERA5 and JRA-3Q (Fig. 6c–e). M2-SCREAM (Fig. 1bS) and MERRA-2 (Fig. 1bM) show even more widespread moistening spanning westward from the South China Sea (larger magnitudes in the MERRA-2 signal are largely attributable to the weaker slope of PC1TREND in this reanalysis; Fig. 3b). These differences are more difficult to attribute to physical processes because M2-SCREAM assimilates Aura MLS v4 water vapor retrievals and MERRA-2 damps variability in lower-stratospheric water vapor by relaxing to a mean seasonal cycle. However, it is worth noting that MERRA-2 produces a pattern of cold-point temperature trends that lies roughly between that in ERA5 and that in JRA-3Q, with a similar spatial pattern (Fig. 6c–e). The robust nature of these CPT temperature changes is consistent with increased convection and cloud cover over the Tibetan Plateau and areas to its southeast. Although CPT temperatures are influenced by model physics and vertical resolution, they are also well constrained by observational data assimilation (Tegtmeier et al., 2020).
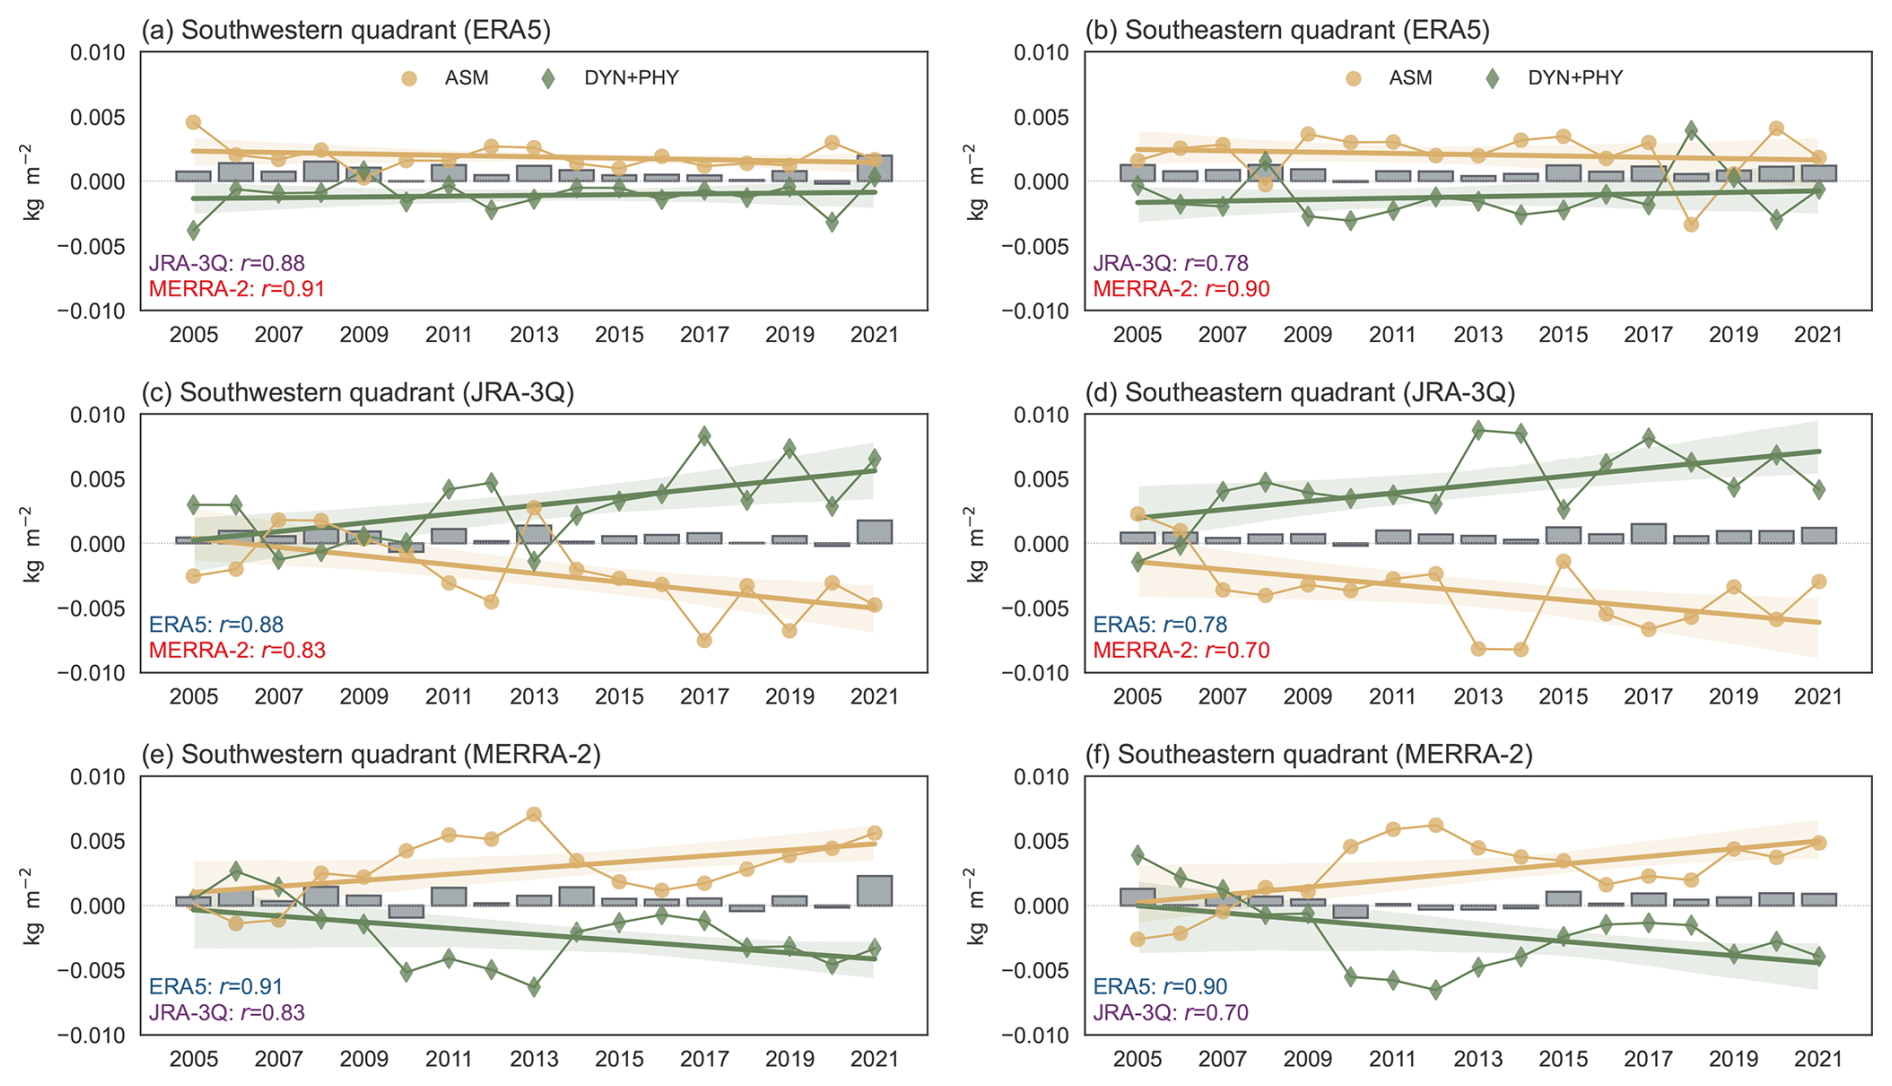
Figure 8Yearly variations in the sum of the dynamics and physics terms (green lines), assimilation increments (yellow lines), and time rate of changes in partial-column water vapor (grey boxes) in the monsoon tropopause layer based on (a, b) ERA5, (c, d) JRA-3Q, and (e, f) MERRA-2 over (a, c, e) the southwestern quadrant (15–30° N and 30–80° E) and (b, d, f) the southeastern quadrant (15–30° N and 80–130° E) of the monsoon anticyclone. Correlation coefficients between net water vapor tendency time series based on individual reanalyses are listed in the lower left corner of each panel.
Trends in reanalysis variables may also result from jumps or drifts due to changes in assimilated observations (SPARC, 2022). The budget decomposition articulated in Eq. (2) provides an opportunity to evaluate this possibility. Figure 8 shows year-to-year variations in specific humidities due to resolved transport (DYN; ), parameterized physics (PHY; Sphy), and data assimilation (ASM; Sana) over 2005–2021 based on ERA5, JRA-3Q, and MERRA-2. We split the monsoon anticyclone domain into quadrants covering the southeastern (80–130° E, 15–30° N), southwestern (30–80° E, 15–30° N), northeastern (80–130° E, 30–45° N), and northwestern (30–80° E, 30–45° N) parts of our analysis domain. We focus especially on the southeastern quadrant, since this part of the anticyclone shows the largest increasing trends as represented by the reanalyses in UTLS water vapor over 2005–2021; time series for the northwestern and northeastern quadrants are provided in the Supplement (Fig. S10). Across the three reanalysis datasets, trends in resolved transport are small but positive both above (Fig. S11) and below the tropopause (Fig. S12) in the reanalyses. The increasing trend in 68–83 hPa water vapor in the reanalyses (Fig. 7a, c) is best explained by an increase in dynamical moistening in the southeast quadrant (Fig. S11). However, the increases in these transports are offset by a decreasing trend in the physical tendencies – and sometimes more than offset, as is the case in MERRA-2. The net changes in PHY + DYN trends are inconsistent across different products and are effectively offset by the data assimilation components, regardless of the altitude relative to the tropopause. Both dynamical and physical tendencies in the southwestern and southeastern quadrants based on ERA5 were relatively flat during 2005–2021, with negative values on average. By contrast, JRA-3Q shows an increasing trend with predominantly positive values, while MERRA-2 shows a decreasing trend with predominantly negative values (Fig. 8). Regional moistening over the warm season shows no evidence of a trend in any of the reanalyses, indicating that the sources of the reanalysis-based increasing trends are outside the monsoon region or season and thus beyond the scope of this study. Such a trend is consistent with the trends based on both Aura MLS and the reanalyses in the lower stratosphere (Figs. 5a–b, 7a, c), satisfying the three criteria: (1) consistency across reanalyses, (2) consistency with independent observations, and (3) a plausible physical mechanism. Below the tropopause, there are two classes of explanations for the difference between Aura MLS and the reanalysis products: (1) Aura MLS did not observe an increase because it did not occur in reality or was limited to lower levels (i.e., an error in the reanalyses), or (2) Aura MLS did not observe an increase because of a sampling bias (e.g., it was limited mainly to a part of the diurnal cycle that MLS does not sample) or some other gap in the observations. Overall, although we find several reasons to doubt the reanalysis-based trends in water vapor below the tropopause, a more complete analysis of trends in UTLS composition and related fields in this region is warranted.
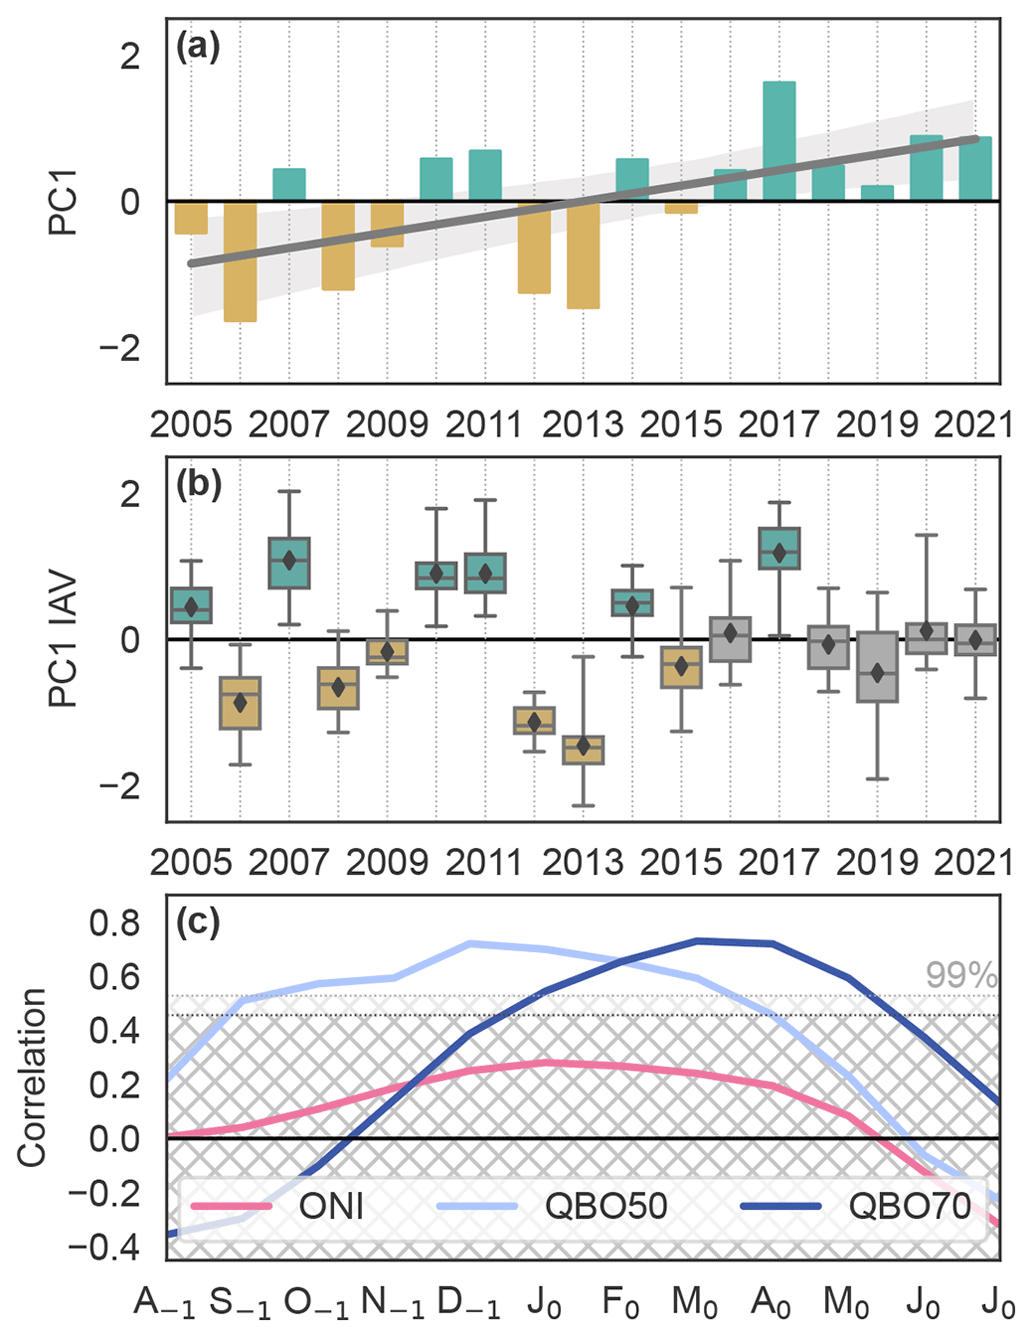
Figure 9Yearly variations in (a) the first principal component (PC1) of water vapor variability in the monsoon tropopause layer based on Aura MLS (Fig. 3a) and (b) the interannual variability component of PC1 (Fig. 3c). (c) Lag correlations of interannual mean PC1IAV (grey diamonds in panel b) against the Oceanic Niño Index (ONI; pink) and Quasi-Biennial Oscillation (QBO) indices at 50 hPa (light blue) and 70 hPa (dark blue) from the previous August to the concurrent July.
3.3 The interannual mode
Figure 9a further illustrates how we divide interannual variability in PC1 based on Aura MLS into trend (PC1TREND; Fig. 3b) and interannual (PC1IAV; Fig. 3c) components. For PC1IAV, we define moist years as those for which the 25th percentile of pentad-mean PC1IAV was positive and dry years as those for which the 75th percentile was negative. Applying this definition to PC1IAV from Aura MLS over 2005–2021, 6 years were anomalously moist, 6 years were anomalously dry, and 5 years were neutral (all within the last 6 years of the record; Fig. 9b). Remarkably, PC1IAV maintained the same sign through all 31 pentads in 7 of the 17 years (dry: 2006, 2012, 2013; moist: 2007, 2010, 2011, 2017). These results reinforce the impression from Fig. 3 that the sign of PC1IAV is set before the monsoon and maintained throughout the monsoon season.
Candidate mechanisms for controlling water vapor in the monsoon tropopause layer at interannual timescales include the El Niño–Southern Oscillation (ENSO; Yan et al., 2016; Tian et al., 2019; Alladi et al., 2024) and the Quasi-Biennial Oscillation (QBO; Randel et al., 2015; Tian et al., 2019; Peña Ortiz et al., 2024). To represent ENSO variability, we use the Oceanic Niño Index, defined as 3-month rolling mean sea surface temperature anomalies in the Niño 3.4 region (190–240° E and 5° S–5° N). To represent QBO variability, we use the updated Berlin QBO time series at 50 and 70 hPa, which is based on radiosonde observations from Singapore (1.34° N, 103.89° E) during this period. Figure 9c shows lag correlations of these indices from the preceding August to the concurrent July against seasonal-mean PC1IAV (grey diamonds in Fig. 9b). Correlations are significant for both QBO indices, with the largest correlations (r>0.7) found for the December (50 hPa) and March (70 hPa) preceding monsoon onset. These positive correlations are consistent with the moistening influence of warmer tropical tropopause temperatures as the QBO westerly phase descends toward the tropopause (Geller et al., 2002), particularly during Northern Hemisphere winter and spring (Randel and Jensen, 2013). Correlations with ENSO are weakly positive and are not statistically significant over this period. Correlations between PC1IAV and commonly used indices of the tropospheric monsoon intensity, including the All-India Rainfall Index produced by the India Meteorological Department and the tropospheric zonal wind shear index proposed by Webster and Yang (1992), are essentially zero ().
Figure 10 shows the vertical and horizontal structure of deseasonalized anomalies in water vapor and CO based on CAMS, along with temperature, cloud fields, MSF, geopotential height, and OLR based on ERA5. All variables are regressed onto Aura MLS PC1IAV. Anomalies in water vapor and CO are reported as fractional changes given the sharp vertical gradients in these species around the tropopause. The horizontal structure of fractional water vapor anomalies based on CAMS (Fig. 10c) shows a regional-scale positive anomaly of about 5 %, with the largest anomalies arcing in a band from the Persian Gulf along the northern edge of the Tibetan Plateau to the East Asian monsoon region. This distribution is consistent with the absolute anomalies in PCWV shown in column (c) of Fig. 1. The southwestern segment of this band, spanning from the Persian Gulf northeastward over the western Tibetan Plateau, also shows positive anomalies in the high cloud fraction and negative anomalies in OLR (Fig. 10a). These indicators of enhanced convective activity correspond to negative anomalies in radiative heating on the 390 K potential temperature surface (Fig. S13a) and positive anomalies in non-radiative (mainly convective) heating in the lower part of the tropopause layer (Figs. 4a–b, S13c). Cloud ice, cloud cover, and diabatic heating anomalies thus show that the moist phase of PC1IAV is associated with stronger convective activity over the Indus River valley in a band that extends northeastward from the Arabian Sea to the Karakoram Pass. The vertical structure along the southern flank of the anticyclone likewise shows large positive anomalies of convective heating penetrating into the tropopause layer in the western part of the domain and near-zero anomalies in the eastern part of the domain (Fig. 4a). In the zonal mean, the largest positive anomalies are located north of 25° N (Fig. 4b), consistent with the second center of enhanced water vapor located over the East Asian monsoon region (Figs. 1c, 10c). Positive water vapor anomalies are most widespread at 68 hPa; however, unlike anomalies below the tropopause, positive anomalies at 68 hPa are strongest in the southeastern quadrant. This difference is consistent with either in-mixing of moist air from the anomalously warm tropical lower stratosphere or clockwise ascent of water vapor anomalies over East Asia in the “upward-spiraling” carousel of the anticyclone (e.g., Vogel et al., 2019; Konopka et al., 2023) and highlights the persistence of anomalies associated with this mode. Results based on other reanalyses are generally similar to those based on CAMS (Fig. S14). MERRA-2 is again the outlier, as its strong relaxation of stratospheric water vapor to a climatology eliminates almost all interannual variability at 68 hPa. Greater consistency in the magnitudes of relative anomalies compared to those of absolute anomalies indicates that reanalysis products with larger interannual variability also tend to have larger mean humidities at these levels.
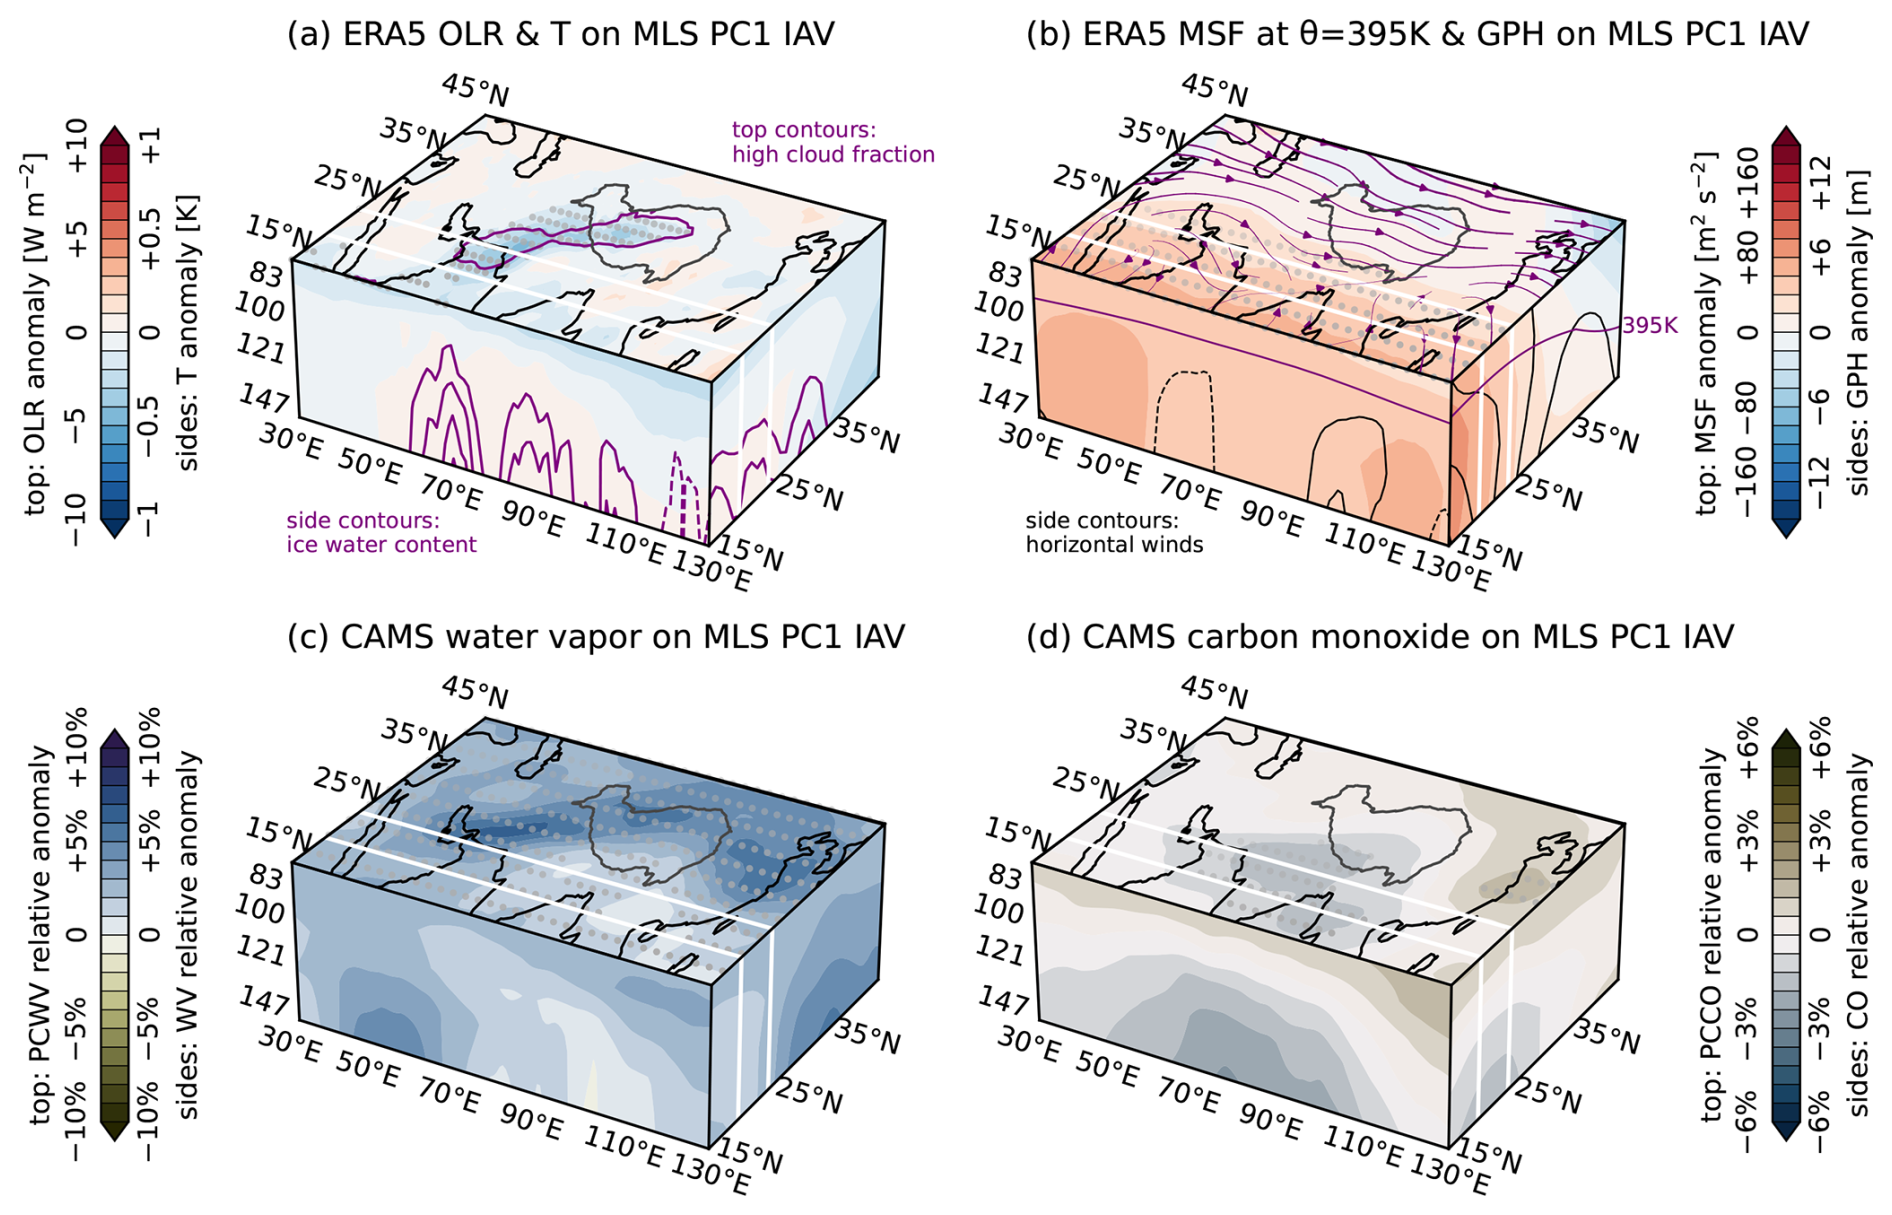
Figure 10(a) Horizontal structure of deseasonalized anomalies in outgoing longwave radiation (OLR; top face) and vertical structure of deseasonalized anomalies in temperature (T; side faces) along with the high cloud fraction and cloud ice water content (contours; averaging domains and contour intervals as in Fig. 6a). (b) As in (a) but for the Montgomery streamfunction (MSF) and winds (streamlines) on θ=395 K (top face) and geopotential height (GPH; shading) and horizontal winds (contours; intervals as in Fig. 6b). (c) As in (a) but for partial-column water vapor (PCWV; top face) and specific humidity (side faces). (d) As in (a) but for partial-column CO (PCCO) and CO mass mixing ratios (side faces). All variables are regressed onto the interannual component of the first mode (PC1IAV) based on Aura MLS (Fig. 3c). Variables in the top row are from ERA5, and variables in the bottom row are from CAMS. The location of the Tibetan Plateau is marked by a dark-grey contour, and the boundaries of the east–west transect are marked by white lines in all panels. The vertical location of the 395 K isentropic surface is indicated by the purple line on the side faces of panel (b). Stippling indicates locations where regression slopes are significant at the 95 % confidence level based on Student's t test.
Positive anomalies in MSF and geopotential height (Fig. 10b) indicate a warmer upper troposphere along the southern flank of the anticyclone, consistent with arrival of the QBO westerly phase at the tropopause. Weak warm anomalies at lower levels to the south of 25° N and weak cool anomalies to the north (Fig. 10a) imply westerly anomalies through most of the region (Fig. 10b) by thermal wind balance. Significant ozone anomalies are only found along the southern flank of the anticyclone in the lower stratosphere (Fig. S15). The distribution of ozone anomalies is consistent in five of the six datasets, with JRA-3Q as the exception (Fig. S15). JRA-3Q, which does not assimilate vertical ozone profiles (Kosaka et al., 2024; Wright et al., 2025), shows significant increases in ozone within the anticyclone associated with this mode, with large signals centered just below the tropopause (Fig. S15b). CO concentrations are significantly reduced over northern India and the Bay of Bengal and increased southeastward of the East Asian monsoon region. These anomalies are consistent among the CO products based on Aura MLS, MERRA-2, and CAMS (Fig. S16a–c).
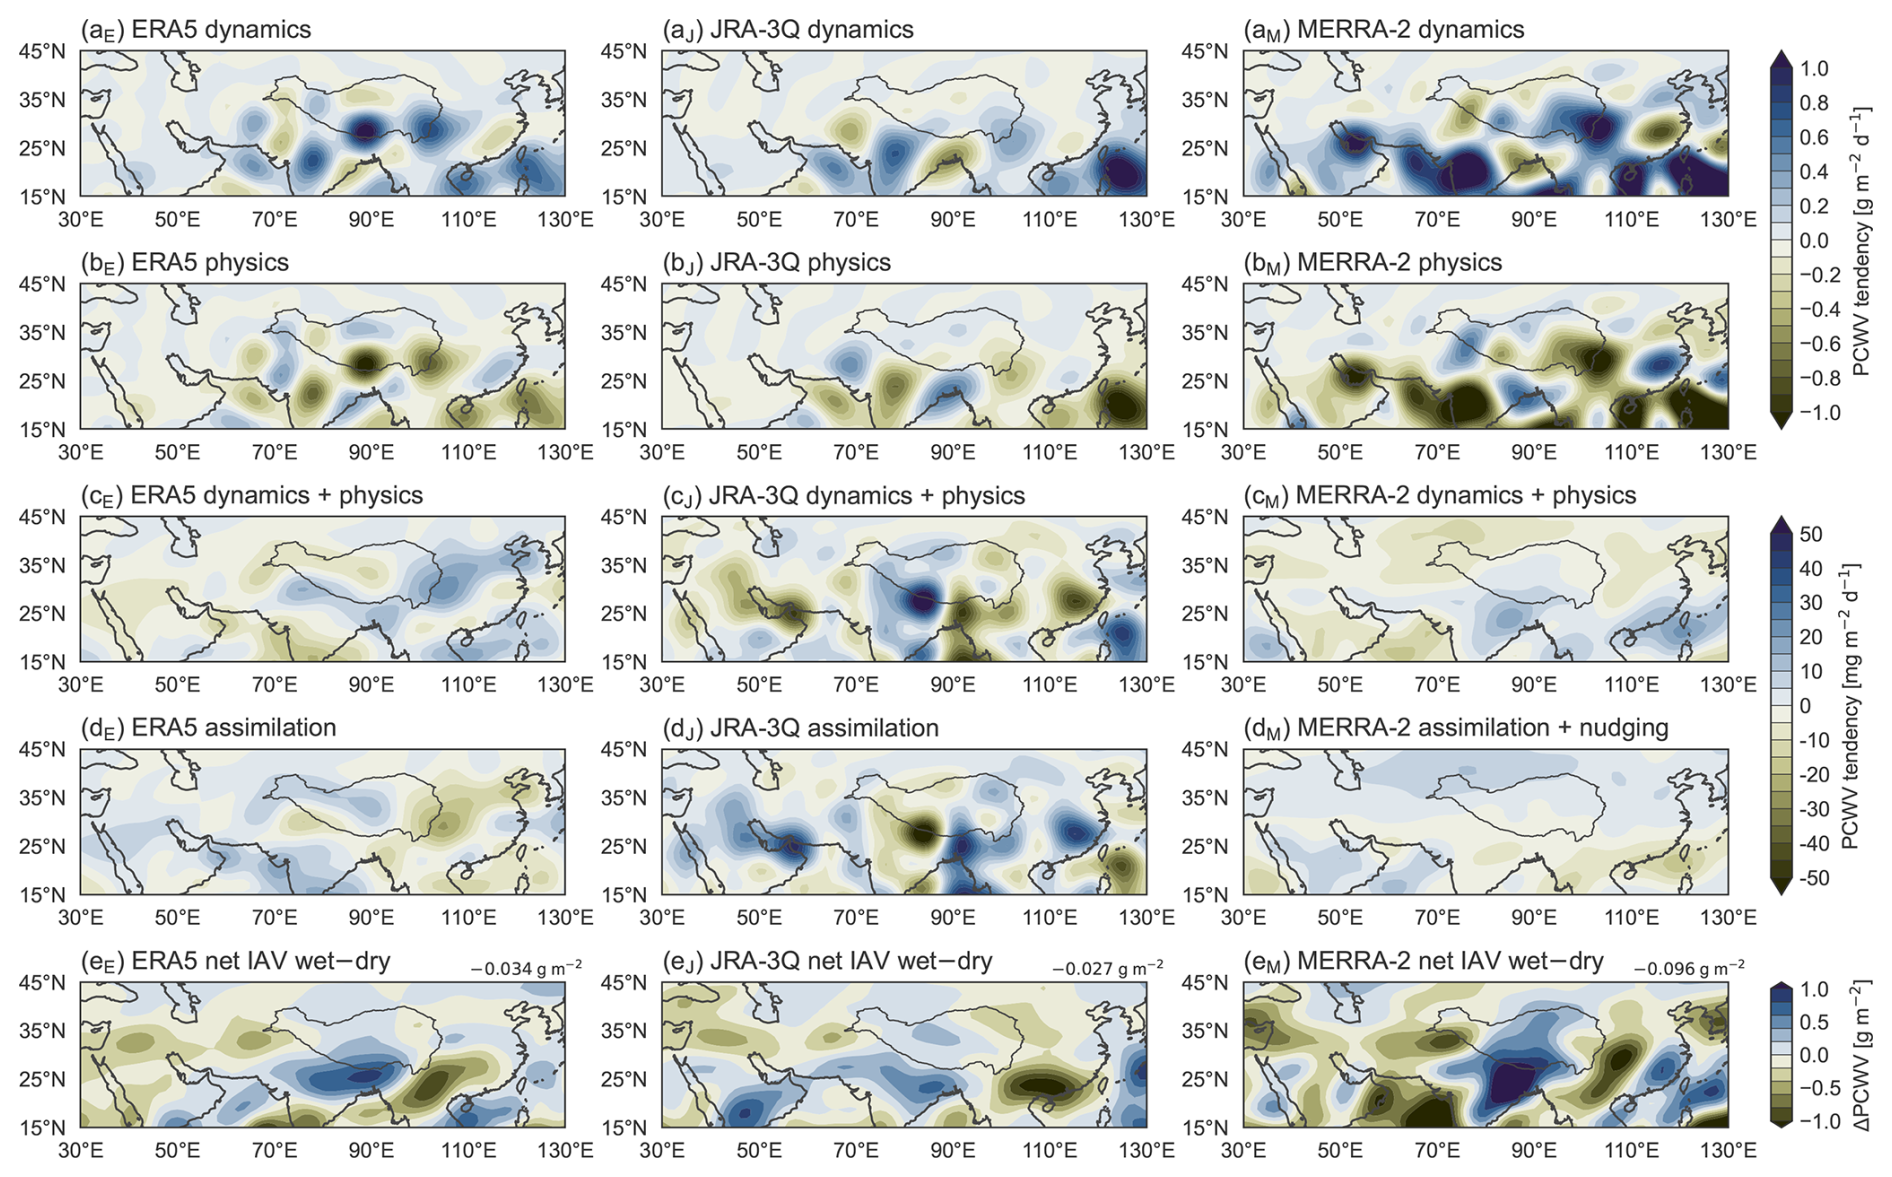
Figure 11Differences in composite mean water vapor tendencies due to (a) dynamics (i.e., moisture flux convergence), (b) parameterized physics, (c) dynamics and parameterized physics, (d) data assimilation, and (e) net moisture sources for (aE–eE) ERA5, (aJ–eJ) JRA-3Q, and (aM–eM) MERRA-2 between moist years and dry years based on the interannual variability of the detrended first principal component (PCIAV, Fig. 9b). The location of the Tibetan Plateau is marked by a dark-grey contour in all panels. Net changes in area-mean tropopause-layer PCWV are listed in the upper right corner of each panel.
Water vapor anomalies associated with PC1IAV arc clockwise around the anticyclone (right column of Fig. 1), with the minimum located over the Bay of Bengal and the maximum located over East Asia and the western Pacific. Figure 10 provides a framework for understanding this pattern. First, systematically deeper convection in the southwestern quadrant of the monsoon domain (Figs. 4a and 10a) injects larger amounts of water above the level of zero radiative heating (LZRH) (Wright et al., 2025). This water-rich air is advected northward around the inner western side of the anticyclone, where strong lower-stratospheric radiative heating rates relative to the monsoon core balance ascent across isentropic surfaces (see Figs. 8.59–8.60 of Tegtmeier et al., 2022). The moist phase of PC1 can thus be explained by anomalously deep convection delivering large amounts of water to the tropopause layer in the southwestern part of the domain and subsequent upward-spiraling transport. Conversely, the dry phase is linked to negative initial anomalies due to a colder tropical tropopause in the pre-monsoon, weaker convection in the southwest and stronger convection in the southeast and colder temperatures along the southern flank of the anticyclone that effectively throttle moist air detrained in the southeast. Additional factors may include variations in cross-tropopause transport over the East Asian summer monsoon (e.g., Luo et al., 2013) or eastward eddy shedding (e.g., Popovic and Plumb, 2001; Honomichl and Pan, 2020), both of which could contribute to the local maximum in water vapor anomalies in the northeastern part of the domain (Fig. 10c).
Figure 11 illustrates contributions to PC1IAV based on Eq. (2) applied to ERA5, JRA-3Q, and MERRA-2. These distributions are based on the composite mean over the 6 moist years minus the composite mean over the 6 dry years. In all three reanalyses, the dominant balance associated with this mode is between moistening by moisture flux convergence and drying due to parameterized physical processes (Fig. 11aE–bM; see also Wright et al., 2025). The dynamical moistening and physical drying effects nearly offset each other, with the sum of these two terms smallest in MERRA-2 and largest in JRA-3Q (Fig. 11cE–cM). The three reanalyses show different distributions of net moisture sources to the tropopause layer, with ERA5 highlighting the Sichuan Basin, JRA-3Q highlighting northern India and the adjacent southern slope of the Himalayas, and MERRA-2 highlighting the coastal regions around the Bay of Bengal (Fig. 11eE–eM). However, all three reanalyses are consistent in producing sources of water vapor to the tropopause layer over the South China Sea. As with the trend, the sum of the dynamics and physics terms is again largely compensated by the effects of data assimilation in each system (Fig. 11dE–dM). After accounting for data assimilation effects, the net change in area-mean tropopause-layer PCWV is negative over the warm season in all three reanalyses, consistent with relaxation of the initial pre-monsoon anomaly. Several anomalies in the net tendencies are robust across the reanalyses. For example, robust positive tendencies during moist years are located over the western North Pacific and South China Sea, as well as the Indo-Gangetic Plain between the Bay of Bengal and the Indus River valley, while robust positive tendencies during dry years are concentrated mainly over the Yunnan Plateau, between the South China Sea and the Bay of Bengal, and the western coast of southern India.
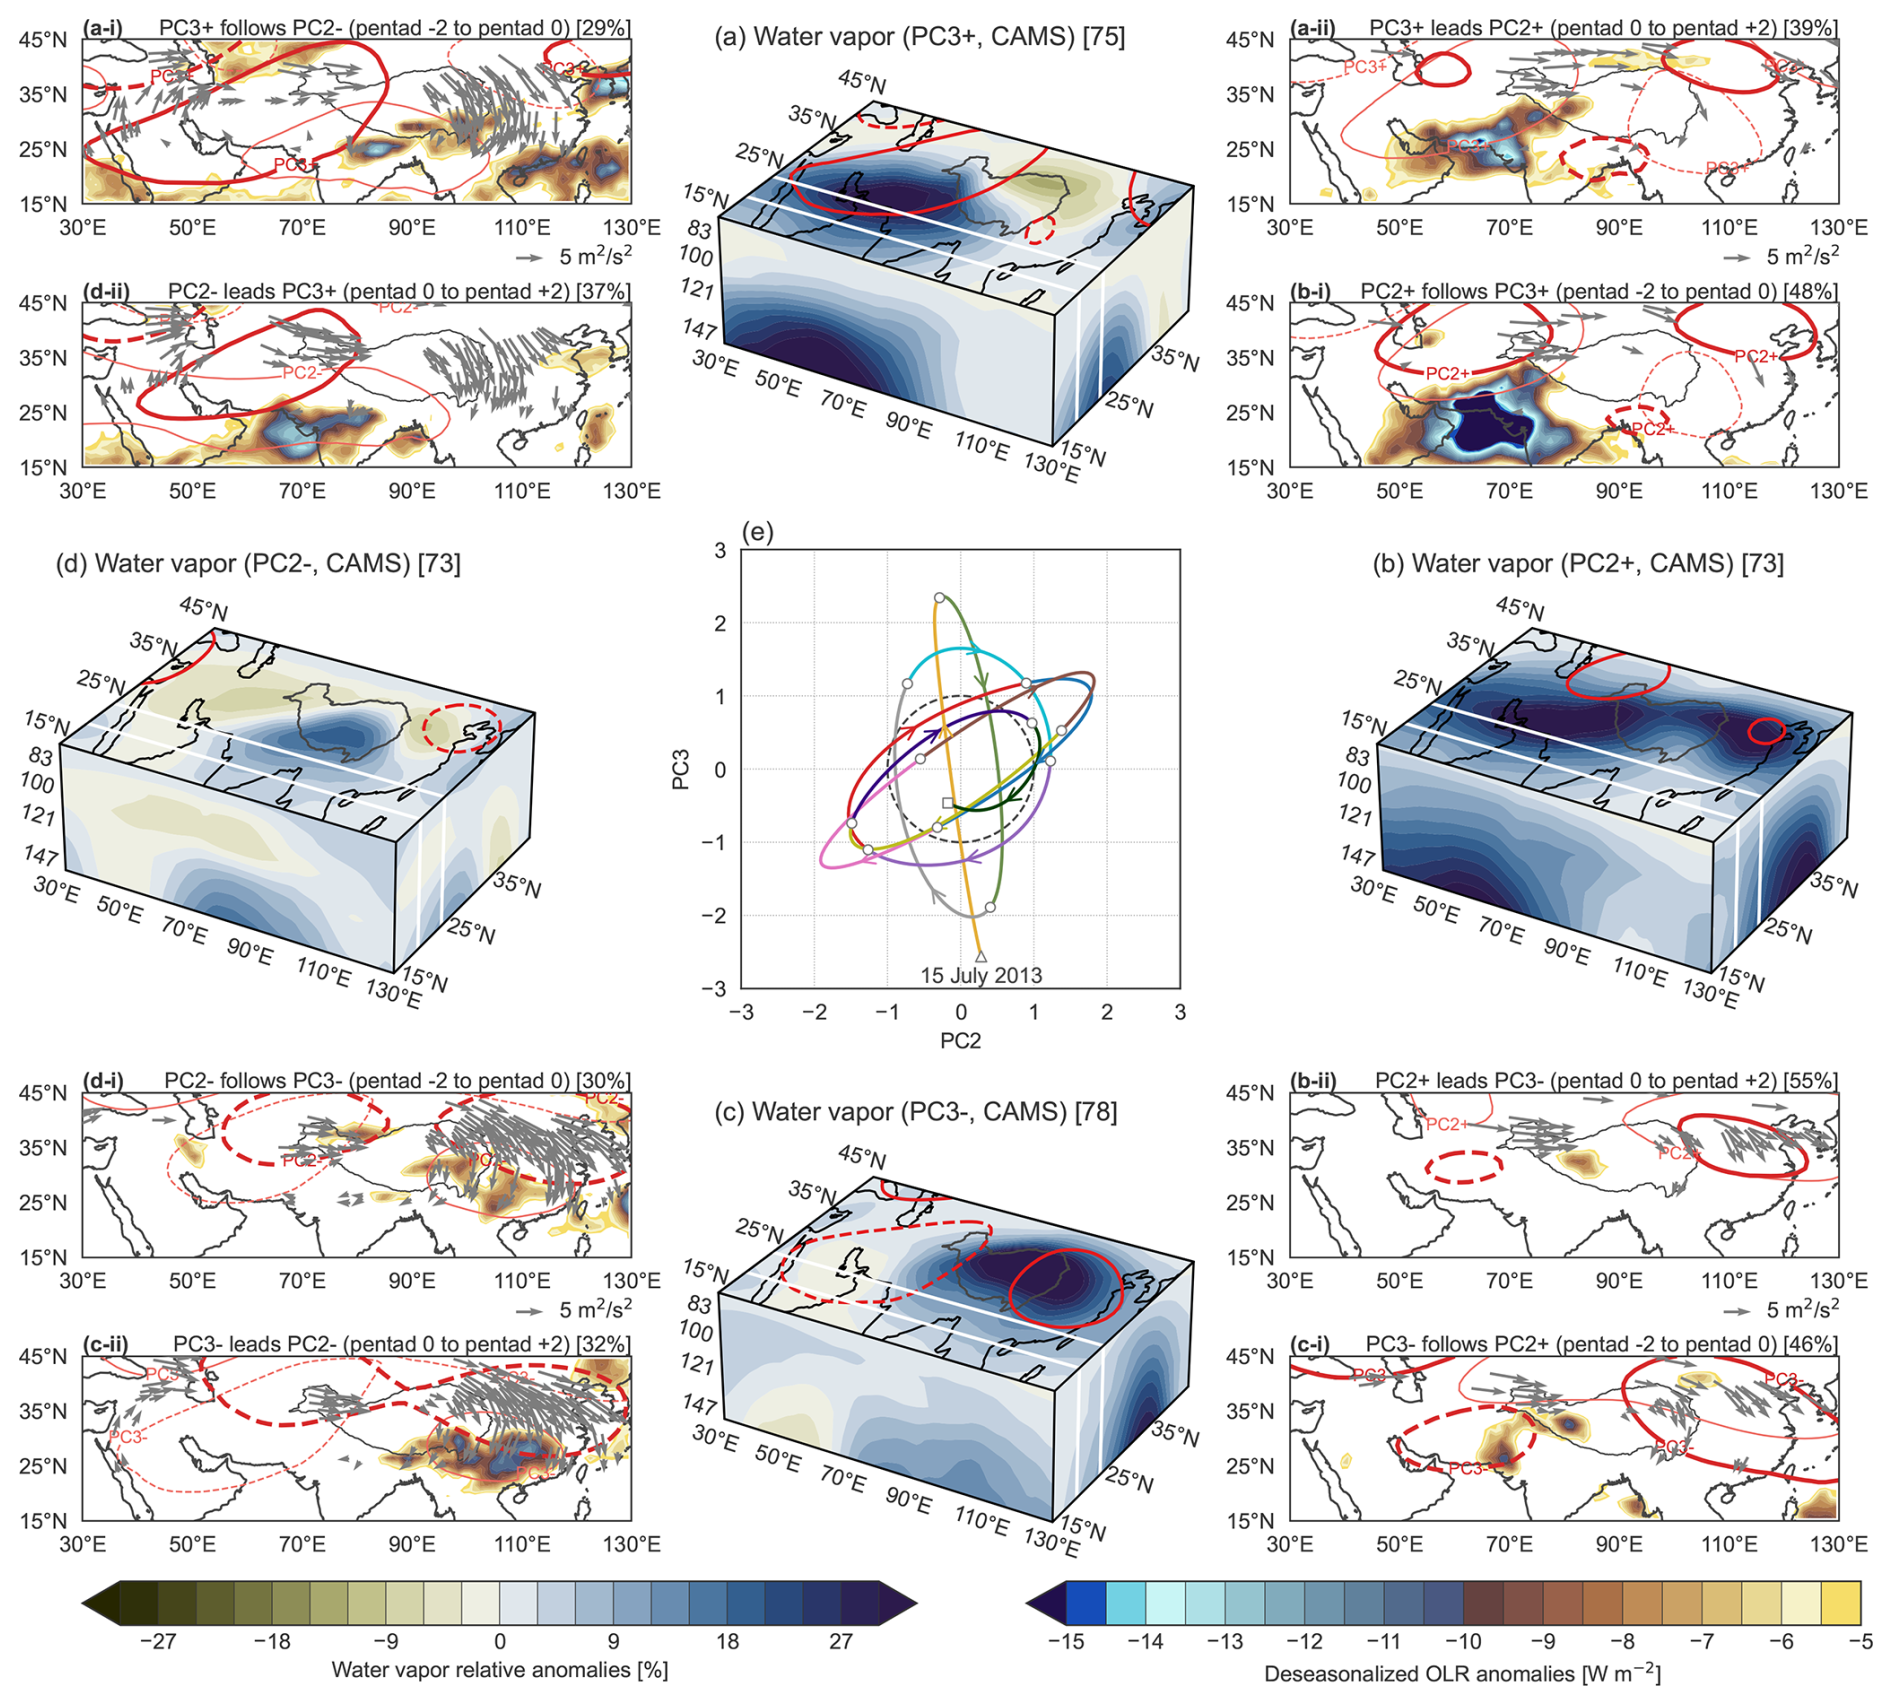
Figure 12(a–d) Cycle of water vapor subseasonal variability based on CAMS showing a typical sequence of transitions among PC2 and PC3, along with (a-i–d-ii) deseasonalized anomalies in outgoing longwave radiation (OLR; shading) based on CERES and 100 hPa geopotential height (Z100; contours at ±15 m) and wave activity fluxes (WAF100; vectors for magnitudes >2 m2 s−2) based on ERA5 during transitions. For example, panel (a-i) shows distributions of anomalous OLR, anomalous Z100, and mean WAF100 for all PC3+ events that follow PC2− events within 2 pentads and panel (a-ii) shows distributions of the same variables for all PC3+ events that lead PC2+ events within 2 pentads. Z100 and water vapor anomalies in panels (a)–(d) are averaged over all events. Z100 contours (a-i–d-ii) are dark red for the following phase and light red for the leading phase, with WAF100 vectors shown for locations where mean wave activity flux divergence during the transition exceeds ±1×10⁻⁵ m s−2. OLR anomalies are averaged over pentads −2 and −1. (e) Co-evolution of PC2 and PC3 from 15 July (marked by a triangle) to 13 September 2013 (square). The start of each pentad is marked by a circle.
3.4 The subseasonal modes
Figure 12 shows the implied quadratic cycle of PC2 and PC3, which together describe at least 10 %–20 % of water vapor subseasonal variability in the Asian monsoon tropopause layer. Anomalies in OLR, geopotential height on the 100 hPa isobaric surface, and wave activity fluxes following Takaya and Nakamura (2001) are shown for the transition periods between different phases. Not all variability in PC2 and PC3 evolves through this coupled cycle, as discussed below: many different modes of convective variability share similar centers of action in this region (e.g., Goswami and Mohan, 2001). However, the cycle serves as a useful framework for investigating the mechanisms behind these two modes. Fractions of events that propagated from the previous step in the cycle (Fig. 12a-i to d-i) or to the next step in the cycle (Fig. 12a-ii to d-ii) within 2 pentads (10 d) during 2005–2021 are marked in the upper right corners of the transition maps. The strongest links are between the moist phase of PC3 (PC3+), the moist phase of PC2 (PC2+), and the dry phase of PC3 (PC3−), clockwise from the top to the bottom of Fig. 12 (see also Fig. S17 in the Supplement).
Water vapor anomalies associated with PC3+ exhibit a horizontal dipole structure with a slight southwest-to-northeast tilt (Fig. 12a; see also Fig. 2b). Unlike the interannual mode, which is centered above the tropopause in the lowermost stratosphere, anomalies associated with this mode are mainly located in the lowest part of the tropopause layer. Positive anomalies centered in the southwest are linked to dry anomalies over the northeastern Tibetan Plateau, with amplitudes that decrease sharply with increasing height. Conversely, water vapor anomalies associated with PC3−, discussed in detail below, are associated with moist anomalies over the northern Tibetan Plateau and weak dry anomalies over the Arabian Peninsula and Persian Gulf (Fig. 12c). The largest moist anomalies associated with PC2+ are centered over Iran, Pakistan, and adjacent seas, similar to those in PC3+. However, in PC2+, these anomalies also connect through the ridgeline of the anticyclone to anomalies of the same sign northeast of the Tibetan Plateau above the East Asian monsoon rainband (Fig. 12b). Moist anomalies associated with PC2− (Fig. 12d) are centered over the southeastern Tibetan Plateau, bracketed by dry anomalies to the northwest and northeast and with amplitudes considerably weaker than those associated with the other phases. The moist anomaly over the southeastern Tibetan Plateau during PC2− produces an anomaly of the opposing sign when PCWV is regressed onto PC2 (Fig. 2a), even though this anomaly is not evident in the PC2+ composite (Fig. 12b).
It is important to emphasize that the distributions shown in Fig. 12 are based on composites for standardized principal components exceeding ±1, whereas those shown in Fig. 2 are regressed onto the principal components (see Figs. S18 and S19 for three-dimensional distributions regressed onto PC2 and PC3, respectively). The tropopause layer above the monsoon is very dry in absolute terms. Positive anomalies thus tend to be larger in magnitude than negative anomalies, as illustrated by Fig. 12. Accordingly, the two poles of the east–west dipole shown in Fig. 2b manifest more as individual monopoles in Fig. 12a and c, with the opposing dry anomalies almost disappearing. Water vapor anomalies associated with PC2 and PC3 are robust across the reanalyses and in good agreement with Aura MLS (see Figs. S18 and S19).
As noted above, the North test indicates that PC2 and PC3 are mutually independent. However, as illustrated by Fig. 12, lead–lag correlations suggest that these modes often occur in quadrature. PC3+ precedes PC2+ by 1 or 2 pentads 40 %–50 % of the time, with a strong area-weighted pattern correlation (r=0.91) between PCWV anomalies composited on PC2+ and average PCWV anomalies 2 pentads after PC3+ (Fig. S17a–c). PC3− then follows PC2+ within 2 pentads more than 50 % of the time. Accordingly, the pattern of PCWV anomalies composited on PC2+ is also highly correlated with average PCWV anomalies 2.5 pentads before PC3− (r=0.87; Fig. S17c–e). PC3− is often followed by strong wave breaking along the eastern flank of the anticyclone and enhanced precipitation over southern China (Fig. 12c-ii). These processes may complicate the transition from PC3− to PC2−, which only occurs about 30 % of the time within 10 d and shows weaker lead–lag pattern correlations (r=0.69; Fig. S17e–g). Evidence that PC2− is followed by PC3+ about 30 %–40 % of the time completes the quadratic cycle of water vapor subseasonal variability (Fig. 12d), although pattern correlations between PC2− and anomalies preceding PC3+ are again relatively weak (r=0.55; Fig. S17g, h, a). Figure 12e shows an example trajectory in the PC2–PC3 phase space, in this case calculated for 15 July–13 September 2013. The trajectory is based on bandpass-filtered 3-hourly CAMS water vapor anomalies projected onto PC2 and PC3 from Aura MLS. The primarily clockwise evolution of the trajectory matches the “typical” sequence illustrated in Fig. 12a–d.
The timescale of the PC3+-to-PC3− part of the cycle (15–25 d) slightly exceeds that corresponding to quasi-biweekly variations in monsoon circulation and precipitation fields (Ortega et al., 2017; Ren et al., 2019), although this may arise in part from our use of pentad-mean anomalies. Indeed, the return periods indicated by Fig. 12e are somewhat shorter at 10–15 d. Monsoon quasi-biweekly waves have been shown to exert substantial influences on UTLS composition in this region (e.g., Randel and Park, 2006; Satheesh Chandran and Sunilkumar, 2024). Nonetheless, the relatively tenuous links to PC2− and the substantial percentages of PC2+ events that are neither preceded by PC3+ nor followed by PC3− emphasize that these modes also vary independently. Convective activity fluctuates on many timescales within the Asian monsoon, from diurnal pulses (e.g., over the southeastern Tibetan Plateau and other high-altitude areas; Hirose and Nakamura, 2005; Zhao et al., 2022) to the synoptic scale (e.g., monsoon depressions; Hunt et al., 2016; Dong et al., 2017) upward to the quasi-biweekly and 30–50 d intraseasonal scales (e.g., the boreal summer intraseasonal oscillation; Chatterjee and Goswami, 2004; Annamalai and Sperber, 2005; Ortega et al., 2017). Variability in water vapor near the tropopause that projects onto PC2 and PC3 may emerge when these different modes of organized convective variability move into or through centers of action similar to those highlighted by the OLR anomalies in Fig. 12. Phase space trajectories for periods dominated by other convective modes evolve differently from those shown in Fig. 12e and thus may provide a means of distinguishing the imprints of these myriad modes of monsoon convective variability on water vapor near the tropopause.
Anomalies in OLR, geopotential height at the 100 hPa level, and wave activity fluxes provide insight into the mechanisms involved in this cycle. As the links are strongest between the two phases of PC3 and PC2+, we start from PC3+, at the top of the cycle in Fig. 12. To support the discussion, we also link these transitional anomalies to anomalous temperatures, upper-level cloud fields, OLR, geopotential height, winds, MSF, ozone, and CO regressed onto PC3 (Fig. 13) and PC2 (Fig. 14). An anomalous high west of the Tibetan Plateau emerges during the days leading up to PC3+ (Fig. 12a-i), with possible triggers including anomalous convection over northern India and tropopause folding upstream of the plateau. This intensified anticyclonic center in the west persists through PC3+, by which point its northern edge overlaps with the subtropical jet (Figs. 12a and 13b). Oscillations of the jet stream due to the restoring force on the poleward shift upstream of the Tibetan Plateau produce a related anomaly downstream over northern China. Each center spans approximately 20–25° longitude, separated by most of the width of the Tibetan Plateau (also ∼25° longitude). These distances indicate a zonal wavenumber of 8–9. With a background zonal wind speed of 25–30 m s−1, the anomaly over northern China should appear about 5 d after the forcing anomaly west of the Tibetan Plateau, in line with the timescales shown in Fig. 12. Convection over the Indus River valley remains intense into PC2+ (Fig. 14a). The tail of enhanced high cloud cover and reduced OLR is suggestive of the “up-and-over” transport mechanism that often links lowland monsoon depressions to episodes of strong summer precipitation over the southwestern Tibetan Plateau (Dong et al., 2016, 2017).
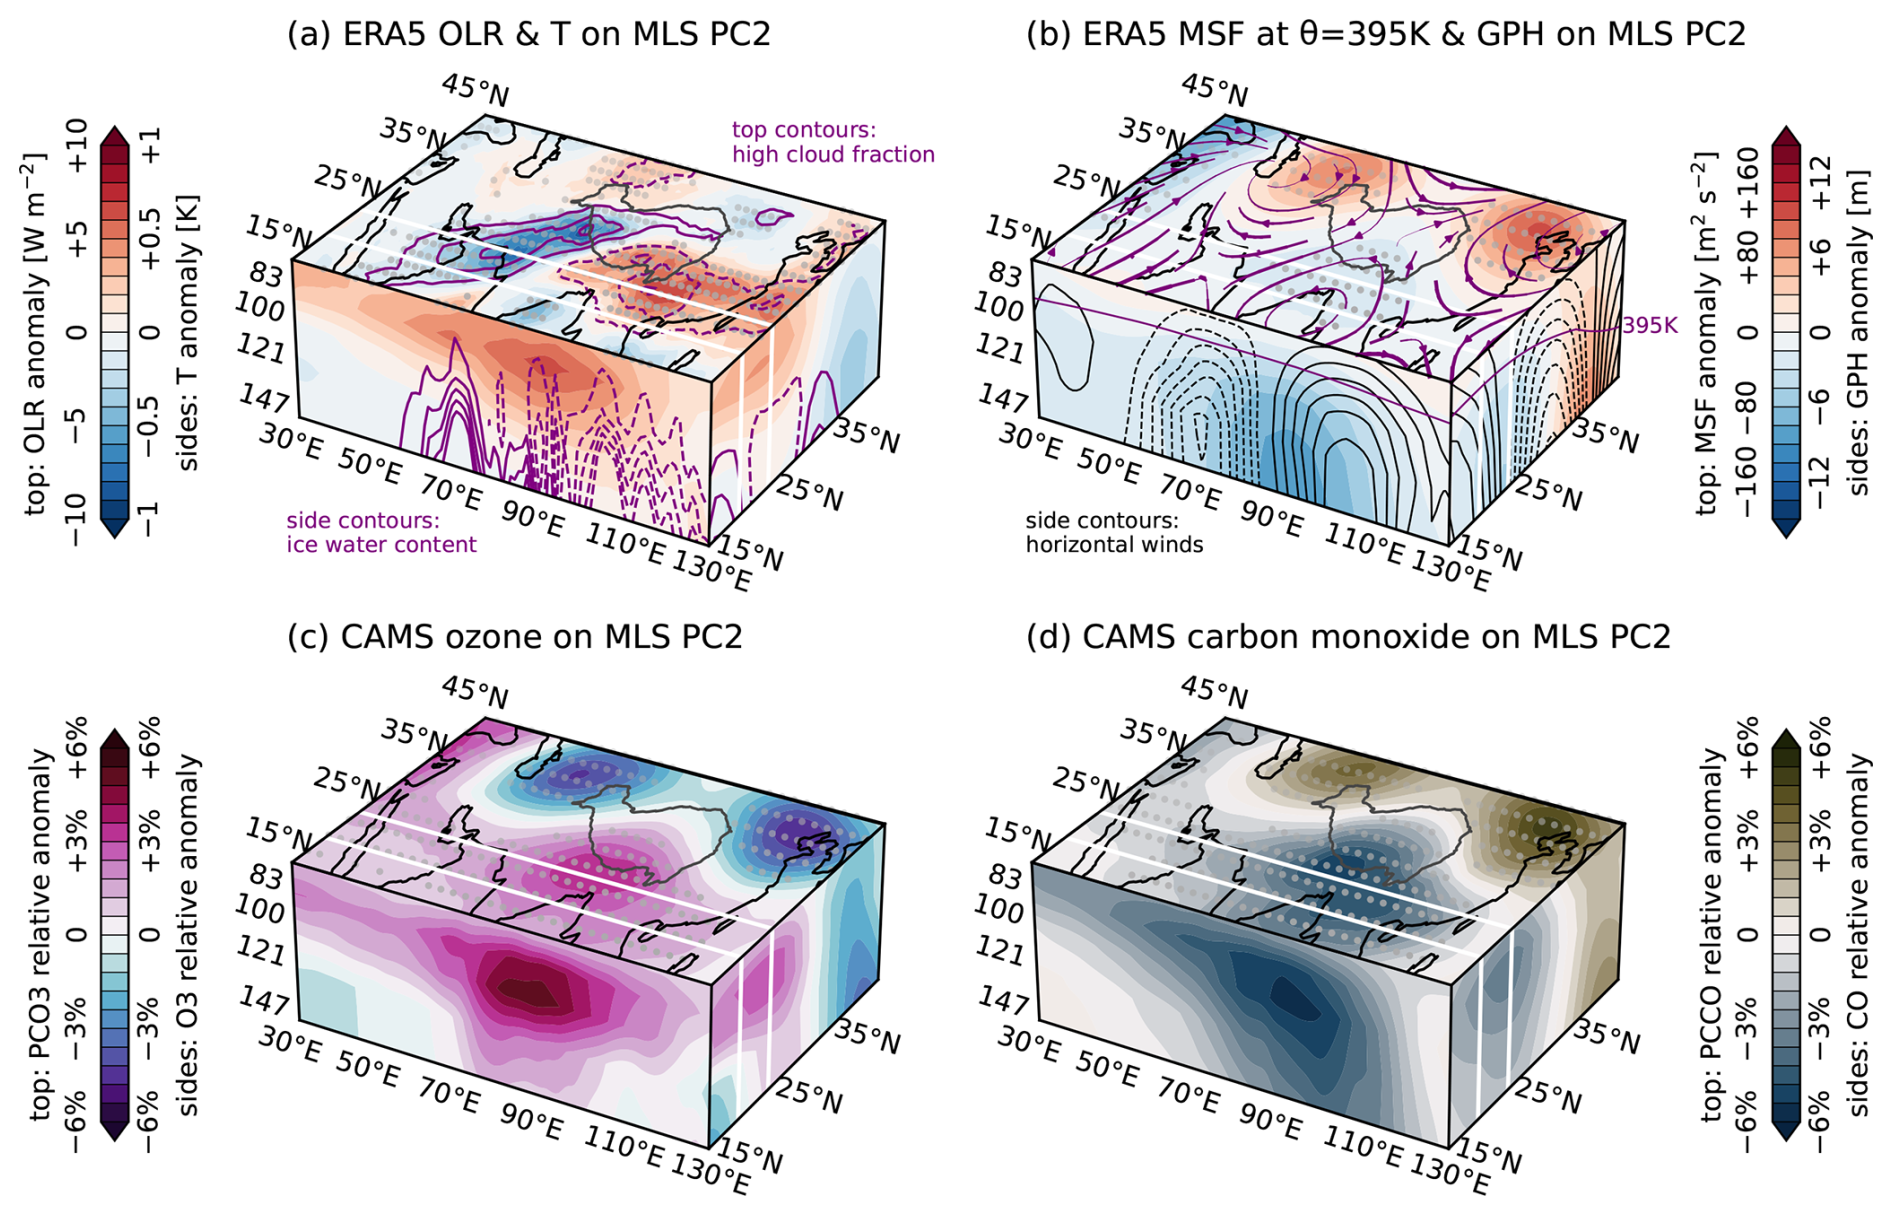
During PC2+, moist anomalies in the southwest (30–70° E along 25° N) are associated with positive anomalies in cloud ice water content (Fig. 14a) and total diabatic heating (Fig. 4c). By contrast, cloud ice water content and total diabatic heating are reduced in the southeast (90–130° E) during PC2+. These anomalies are qualitatively robust between the reanalyses (Figs. S2, S18, and S20). The reduced diabatic heating in the southeast is situated under an upper-level cyclonic anomaly over the Bay of Bengal, as shown by negative anomalies in MSF on the 395 K isentropic surface (Fig. 14b). Temperature anomalies in this region are positive (Fig. 14a), indicating that the reduction in MSF results from a decrease in geopotential height (Fig. 14b). The decrease in geopotential height implies a cooler and shallower tropospheric column, consistent with reduced convective heating over Bangladesh and southern China. MSF anomalies associated with the pair of vortices in the north are also linked to anomalous geopotential heights (Fig. 14b), as both regions feature cold-temperature anomalies near the tropopause (Fig. 14a).
Warm-temperature anomalies span the entire southern flank of the anticyclone near the tropopause during PC2+ (Figs. 14a and 15a), with the largest warming centered between positive cloud ice anomalies in the southwest and negative cloud ice anomalies in the southeast (Fig. 14a). This location corresponds to the climatological location of the monsoon cold trap (Fig. 2 of Wright et al., 2025). The variations in high clouds and attendant changes in OLR (Fig. 14a) further emphasize the shift in convective activity from the southeast to the southwest in this phase. Radiative heating anomalies on the 390 K isentropic surface are opposite to those in temperature (Fig. S20a) and can therefore be interpreted via the “Newtonian cooling” approximation (e.g., Wright and Fueglistaler, 2013), in which radiative heating rates are modeled as inversely proportional to the difference between ambient temperature and a fixed radiative equilibrium temperature.
Anomalies in ozone (Fig. 14c) and CO (Fig. 14d) reflect fluctuations in the upper-level anticyclone. Air with characteristics of the climatological anticyclone (low ozone and high CO) is concentrated in the pair of anticyclonic vortices to the northeast and northwest of the Tibetan Plateau during PC2+, implying an overall northward shift in the position of the anticyclone (see also regional-mean zonal wind anomalies along the eastern face of Fig. 14b and changes in the 2 PVU (potential vorticity unit) potential vorticity contour in Fig. 15b). Air along the southern flank exhibits more stratospheric characteristics (high ozone and low CO), especially around 90° E, where the upper-level cyclonic anomaly is centered. These changes indicate that anomalous descent and compression contribute to the warming along the southern flank, in line with reduced lower-stratospheric radiative heating (Fig. S20) and geopotential height (Fig. 14b). Large potential vorticity anomalies extend along the southern flank of the anticyclone downstream of the reduced convection over the Bay of Bengal (Fig. 15b). This distribution implies a positive diabatic potential vorticity tendency (i.e., weaker horizontal divergence) over the Bay of Bengal, with the resulting positive anomalies advected westward by the tropical easterly jet.
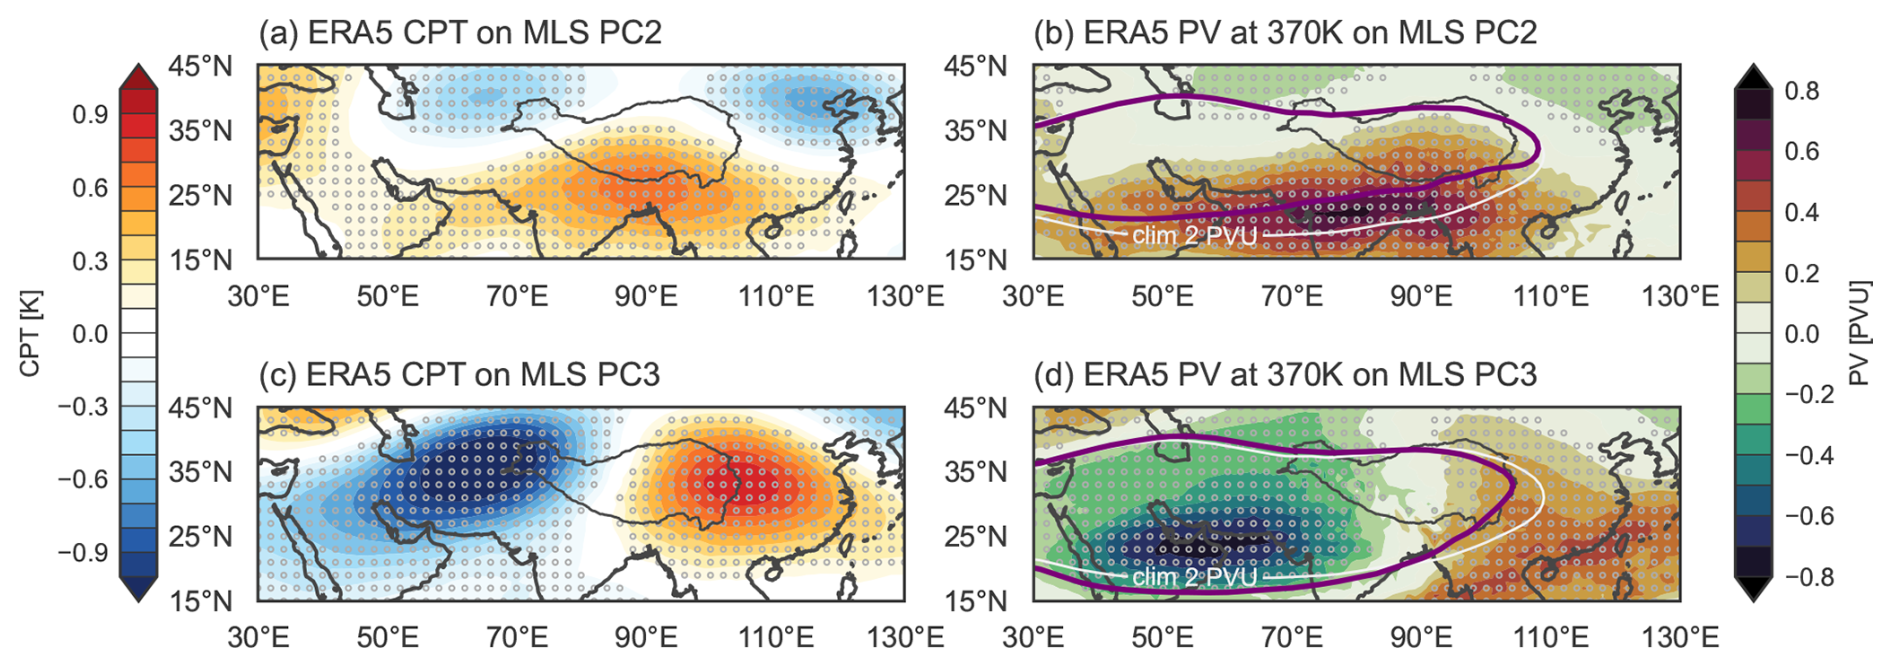
Figure 15Deseasonalized anomalies of (a, c) cold-point tropopause (CPT) temperatures and (b, d) potential vorticity (PV) on the 370 K isentropic surface based on ERA5 regressed onto (a–b) PC2 (Fig. 3d) and (c–d) PC3 (Fig. 3e) from Aura MLS. Dark-grey contours in all panels mark the location of the Tibetan Plateau. White contours in (b, d) mark the 2 PVU contour (1 PVU = 10−6 K m2 kg−1 s−1) on the 370 K isentropic surface based on the average for July 2005–2020. Stippling indicates that regressions are significant at the 95 % confidence level.
Variations in water vapor associated with PC2 can be explained to leading order by changes in convective activity and temperatures near the tropopause (Randel et al., 2015), mediated by the response of the upper-level anticyclone to the redistribution of convective heating (Nützel et al., 2016; Siu and Bowman, 2019). Area-mean CPT temperatures are much warmer than normal during the PC2+. Positive anomalies of 0.3–0.5 K over much of the region south of 30° N (Fig. 15a and Fig. S22e–f) translate to an increase of around 5 %–9 % in saturation mixing ratios at the CPT, sufficient to explain the positive fractional anomalies in water vapor anomalies west of this region (∼6 %–9 % Fig. 12b). The largest water vapor anomalies are in the southwestern quadrant, downstream of both the largest warm anomalies (Fig. 15a) and the enhanced deep convection north of the Arabian Sea (Figs. 14a, 12b-i). Stronger deep convection can inject water directly into the tropopause layer (Ueyama et al., 2018), while warmer CPT temperatures allow more of this injected water to remain. However, the anomalous cyclone to the east and the anomalous anticyclone to the north restrict the flow of anomalously humid air around the climatological anticyclone. The moist center in the northeast coincides with the northeastern anticyclonic anomaly, where ozone is reduced and CO is enhanced (Fig. 14c–d). These anomalies may thus be interpreted as an anticyclonic vortex displaced from the relatively humid southeastern quadrant into the drier northeast, possibly as a prelude to eastward eddy shedding (e.g., Honomichl and Pan, 2020; Siu and Bowman, 2020).
PC3− evokes the canonical “Tibetan Plateau” mode of the upper-level anticyclone (Qian et al., 2002; Zhang et al., 2002; Nützel et al., 2016), which has previously been linked to coherent anomalies in UTLS composition above the ASM (e.g., Yan et al., 2011; Kumar and Ratnam, 2021). The dry phase of PC3 follows a relatively quiescent period in terms of convective activity, with no notable negative anomalies in OLR within the analysis domain (Fig. 12b-ii, c-i). During this phase, the northeastern high from PC2+ propagates southward along the eastern flank of the anticyclone, as shown by enhanced southward wave activity fluxes over much of China east of the Tibetan Plateau (Fig. 12b-ii, c-i). Accordingly, the dry phase of this mode is associated with increased MSF in the east and decreased MSF in the west (Fig. 13b). Changes in MSF again arise mainly from changes in geopotential height rather than local temperature anomalies (Fig. 13a–b), with reduced MSF anomalies associated with warmer temperatures and vice versa. Changes in ozone (Fig. 13c) and CO (Fig. 13d) likewise show that the active (anticyclonic) pole contains air with more tropospheric characteristics, while the inactive (cyclonic) pole contains air with more stratospheric characteristics.
Unlike PC2, variations in local dehydration cannot provide a direct explanation for variations in water vapor in this mode because CPT temperatures are anomalously cold where water vapor is enhanced and warm where water vapor is reduced (cf. Figs. 15c, 12a). Concurrent variations in both isentropic ascent (anomalous upward tilt toward the active phase) and diabatic ascent (anomalous radiative heating where CPT temperatures are cold) may contribute, as may the changing boundaries of the anticyclone itself, under the assumption that relatively humid air is mainly confined to the active core. However, we note that deeper convective activity and more extensive high cloud cover are again located upstream of the water vapor maximum (Figs. 13a, S3, S24), though this arrangement is more pronounced in PC3+ (the “Iranian Plateau” mode) than in PC3− (the “Tibetan Plateau” mode). Over the eastern Tibetan Plateau, OLR anomalies are noticeably larger in ERA5 (Fig. 13a) than in JRA-3Q or MERRA-2 (Fig. S24), which may help to explain the sharper southwest-to-northeast tilt of this mode in the ECMWF reanalyses (i.e., CAMS and ERA5). Supporting this point, the inter-reanalysis discrepancy in the tilt of the dipole is found only in water vapor and not in ozone or CO (Figs. 13c, d, S16g-i and S23), suggesting that it may be explained by stronger convective injection in ERA5 and CAMS, which is then constrained by local dehydration in the cold anticyclonic vortex.
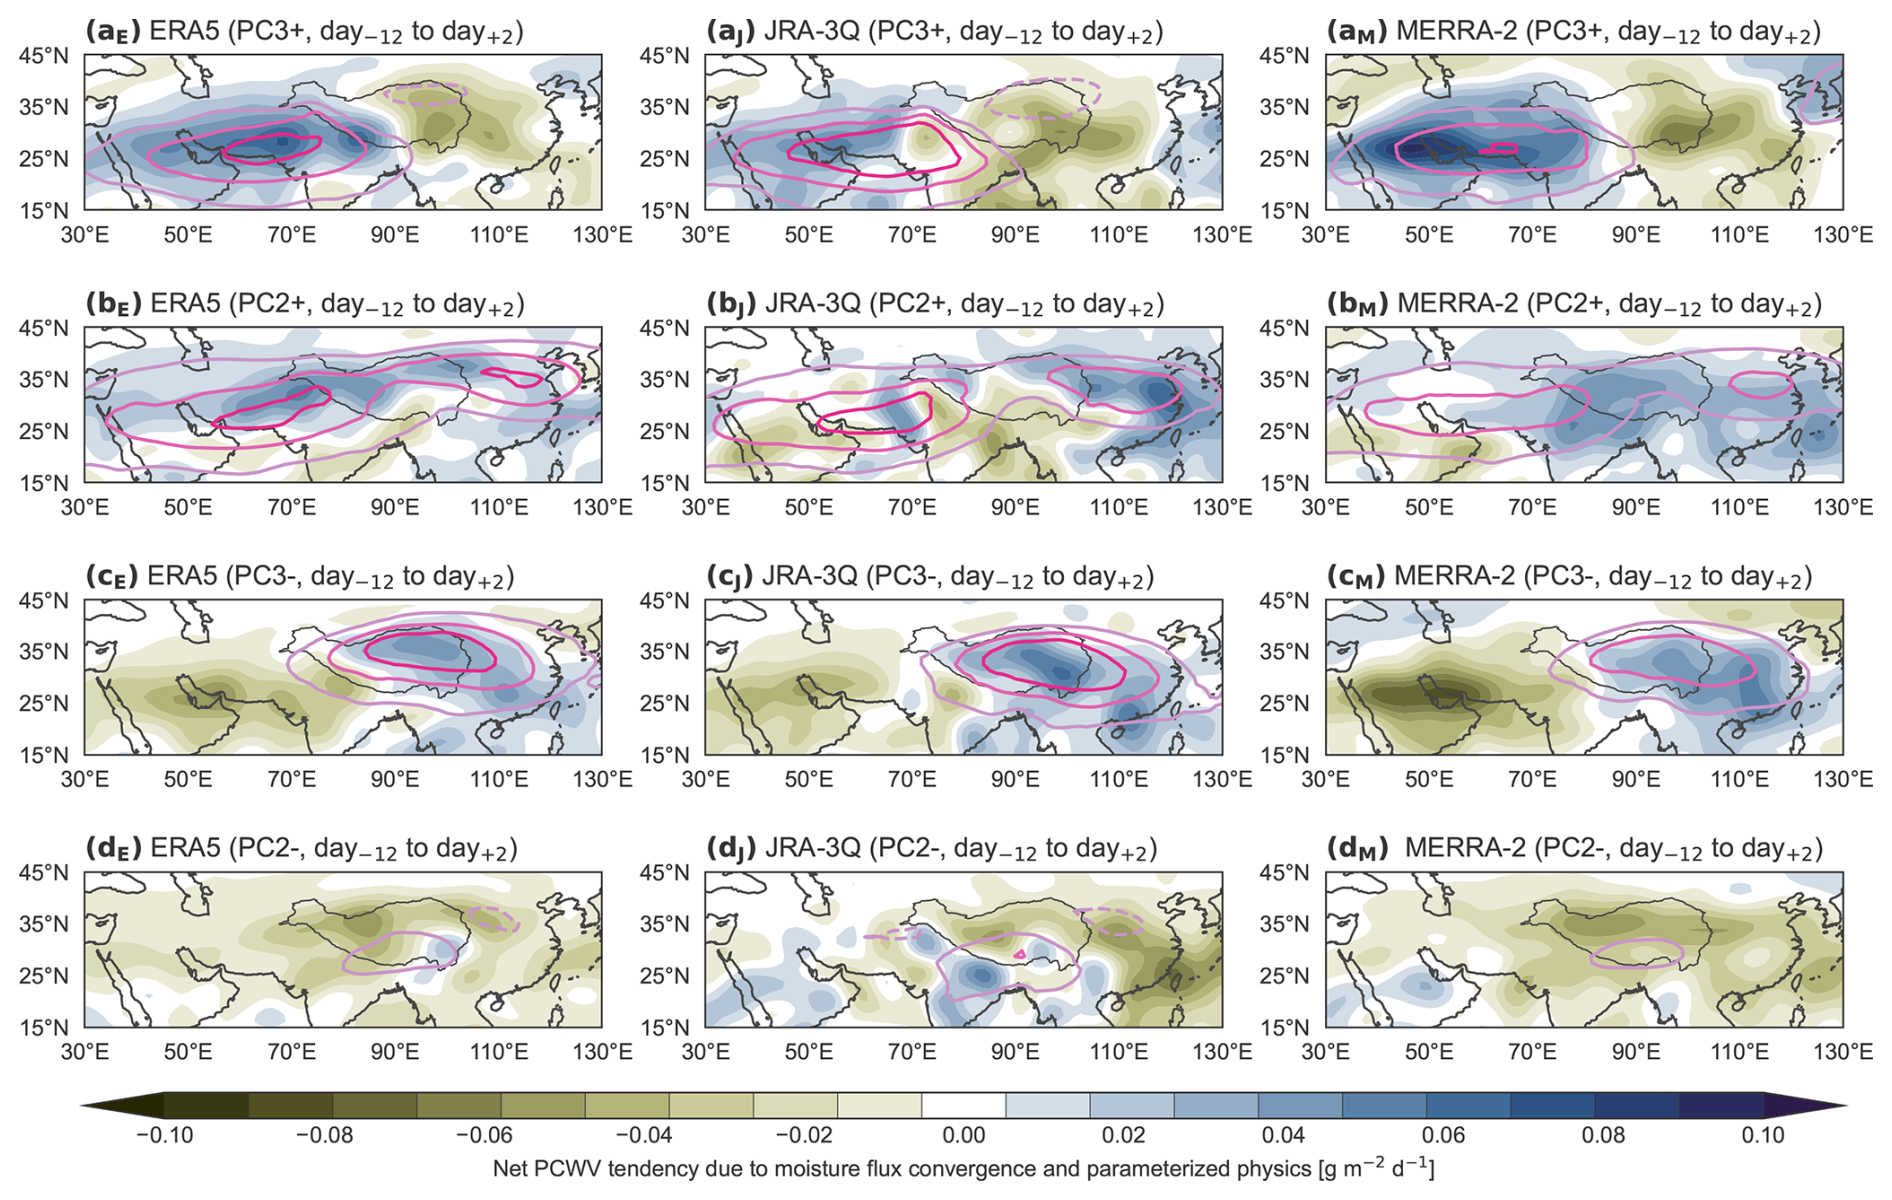
Figure 16Anomalous water vapor tendencies due to dynamics (i.e., moisture flux convergence) and parameterized physics for (aE–dE) ERA5, (aJ–dJ) JRA-3Q, and (aM–dM) MERRA-2 during the 15 d ending on episodes of (a) positive PC3 > 1 (PC3+), (b) positive PC2 > 1 (PC2+), (c) negative PC3 < −1 (PC3−), and (d) negative PC2 < −1 (PC2−). Anomalies in partial-column water vapor are marked with pink contours at intervals of 10 % from ±10 % (negative dashed) during each phase. The location of the Tibetan Plateau is marked by a dark-grey contour in all panels.
As in PC2, anomalies in temperature, radiative heating, MSF, ozone, and CO (Fig. 13) are coherent in both poles of the PC3 east–west dipole, demonstrating the dynamical reorganization of the anticyclone associated with PC3. PC3+ is linked to anomalous convective activity over South Asia, where stronger heating induces a westward shift, while PC3− is linked to anomalous convective activity over the western Pacific, where stronger heating induces an eastward shift (e.g., Fig. 15 of Nützel et al., 2016). However, our results do not rule out a role of convective injection, with the reanalyses showing enhanced deep convection over the Indus River valley and the Karakoram Pass when the anticyclone center is shifted westward and over the Sichuan Basin when the anticyclone center is shifted eastward (Figs. 13a, S24). Such shifts in deep convection may help to “fill up” the meridionally displaced anticyclone cores with freshly detrained air (e.g., Heath and Fuelberg, 2014), with the caveat that such moistening effects could be quickly damped by the negative-temperature anomalies near the tropopause (Fig. 15c).
The reanalysis products agree well with each other and with Aura MLS in their representations of anomalies in dynamical fields, temperature, cloud cover, ozone, and CO associated with PC2 and PC3 (Figs. S16, S20–S24). ERA5 shows the largest shifts and deepest penetration of anomalous deep convection along 25° N, with changes in MERRA-2 and JRA-3Q more confined to the upper troposphere, especially in PC2 (i.e., p>150 hPa; Fig. S3). Therefore, although all three reanalyses are consistent in the qualitative east–west shift in convective activity along this transect, we cannot confidently infer the implications for convective injection above the LZRH.
To emphasize these points, Fig. 16 shows anomalous water vapor tendencies due to resolved moisture flux convergence and parameterized physics (PCWVdyn+phy) during the transition phases between PC2 and PC3. Here, the transition phases are defined as the 3 pentads ending on the corresponding phase of PC2 or PC3 with no lead–lag requirement so that all events are sampled and each sampled event includes 15 d. The centers of water vapor enhancement for each phase, where fractional changes in PCWV exceed 10 %, are delineated by pink contours. Despite some differences in magnitude, anomalies in PCWVdyn+phy from these three reanalyses are broadly consistent, indicating that the reanalyses produce these modes primarily through internal processes. The one exception to this consistency is the western center of PC2 in JRA-3Q, where a weak dynamical term (Fig. S25) and a moderately strong physics term (Fig. S26) produce net tendencies that are largely out of phase with ERA5 and MERRA-2. Discrepancies between JRA-3Q and the other reanalyses in the southwestern quadrant are reduced by relatively large data assimilation increments there (Fig. S27). In all three reanalyses, the physics and dynamics terms mainly compensate each other. These individual terms have magnitudes that exceed their sum by more than a factor of 10, and their magnitudes and the detailed distributions are more varied across the reanalyses (Figs. S25 and S26). Assimilation increments are even more diverse (Fig. S27), with magnitudes only slightly less than the sum of the dynamics and physics terms PCWVdyn+phy.
Our application of EOF analysis to water vapor fields emphasizes situations for which processes that influence water vapor variability are aligned, as opposed to situations for which these influences counteract each other. For example, the east–west dipole mode (Fig. 2b) shows “Tibetan Plateau” and “Iranian Plateau” phases linked to the propagation of convectively coupled Rossby waves across the southern part of the domain (Fig. 12; see also Garny and Randel, 2013; Ren et al., 2019). Although this mode is consistently one of the leading modes of variability in water vapor in the data products considered here, it explains only 3 %–6 % of the variance in water vapor. For context, the corresponding east–west dipole modes based on Aura MLS ozone and CO (not shown) explain more than 10% of the variance (2–3 times that for water vapor) and appear as PC2. This difference suggests that the water vapor mode results from two separate features: a shift in the anticyclone center and anomalous convection that reaches deep enough to “fill up” that shifted center out of phase with the CPT anomaly (Heath and Fuelberg, 2014). ERA5 anomalies in cloud ice and convective heating associated with this mode (Fig. 13a) are consistent with this idea: anomalous cloud ice and heating approach 100 hPa in the southwestern part of the domain over the Arabian Sea in the moist (Iranian Plateau) phase and over the southeastern Tibetan Plateau and Sichuan Basin in the dry (Tibetan Plateau) mode. PC2 shows greater consistency across results based on Aura MLS water vapor, ozone, and CO, indicating a greater overlap of the convective, dynamical, and temperature anomalies that favor a humid tropopause layer. In particular, water vapor anomalies associated with PC2 are in phase rather than out of phase with anomalies in CPT temperatures.
Many studies have explored the mechanisms that link convection, composition, and circulation variability in the UTLS above the ASM. Among these, Garny and Randel (2013) emphasized the control exerted by convective heating on the ASM anticyclone on subseasonal timescales, highlighting how PV anomalies derive largely from shifts in large-scale convective heating between the maritime monsoon and the South Asian subcontinent. Their results, which link negative PV anomalies (a locally enhanced anticyclone) with positive CO anomalies, echo our results for PC2 and PC3 (Sect. 3.4). Nützel et al. (2016) and Manney et al. (2021) evaluated reanalysis representations of the ASM anticyclone in pressure and potential temperature vertical coordinates, respectively. Manney et al. (2021) further assessed internal variability, finding significant correlations between anticyclone area and ENSO but little relationship with the QBO after June. However, they only calculated correlations within a ±2-month lag, and the correlations reported for ENSO were weak at the altitudes we consider here. Influences of ENSO on the anticyclone were also reported by Nützel et al. (2016) and Yan et al. (2018), among others, but these studies focused more on how ENSO regulates subseasonal variability. Manney et al. (2021) found that the area and duration of the anticyclone increased significantly over the period 1979–2018, while Zolghadrshojaee et al. (2024) recently reported long-term increases in tropical CPT temperatures. These changes may help to explain the strong reanalysis-based moistening trends and/or the absence of such a trend in the Aura MLS record; however, detailed analysis is deferred to future work.
Randel et al. (2015) focused more specifically on the mechanisms behind water vapor variability at 100 hPa, highlighting the preeminent role of temperature anomalies in determining water vapor at this level. Our results are broadly consistent with this interpretation, with water vapor anomalies in phase with CPT temperature anomalies in both PC1 and PC2. However, water vapor anomalies are out of phase with CPT temperature in PC3 (and PC1TREND based on reanalysis products), and the largest convective and water vapor anomalies in PC2 are located downstream of anomalously warm CPT temperatures. Our results therefore suggest that deep convective sources may play a larger role in regulating water vapor in this region than that concluded by Randel et al. (2015). Satheesh Chandran and Sunilkumar (2024) analyzed how quasi-biweekly variations in monsoon convection impact composition and chemical processing within the monsoon anticyclone. Their results are mostly consistent with our PC2 and PC3 (Sect. 3.4) but with some distinctions that further highlight the importance of anomalously deep convection in modulating the signature of quasi-biweekly waves in UTLS water vapor. In particular, they reported a weaker signal in water vapor associated with the Tibetan Plateau phase, suggesting that convective anomalies under the shifted anticyclone center may not be deep enough to overcome out-of-phase CPT temperature anomalies. QBO influences on water vapor in the ASM UTLS were recently evaluated by Peña Ortiz et al. (2024). However, their work focused on the QBO influence on quasi-biweekly waves and distinct imprints of QBO on convective heating and transport to the tropopause between July and August. By contrast, our results highlight the QBO influence on interannual variability (Sect. 3.3), mainly through anomalous subsidence and warming on the tropical flank of the anticyclone as the QBO westerly phase reaches the tropopause.
At the subseasonal scale, we highlight the influences of quasi-biweekly waves (see also Randel and Park, 2006; Ren et al., 2019). Quasi-biweekly waves in the Asian monsoon system have been argued to arise from instabilities in the monsoon flow downstream of anomalous heating over the Tibetan Plateau (Liu et al., 2007). However, the sequence of large-scale organized convection in these waves is often viewed as starting from the western North Pacific east of the Philippines and then propagating northwestward (e.g., Kikuchi and Wang, 2009; Wang and Chen, 2017). During most of this propagation, these waves have a limited impact near the tropopause due to the buffering effect of the upper-level easterly jet along the southern flank of the anticyclone. The convective anomaly deepens and intensifies when it reaches the Indus River valley, where the buffering effect is much weaker. The heating associated with this convection triggers an upper-level high that disturbs the subtropical jet (Fig. 12d-ii). Downstream restoring of that disturbance produces a second high over northern China (Fig. 12a-i, a-ii), which propagates southward in the eastern flank of the anticyclone before breaking over eastern China or the western North Pacific (Fig. 12b-i, b-ii; Ortega et al., 2017). Strong upper-level wave activity fluxes along the eastern flank of the anticyclone are evident as first the anticyclonic anomaly and then a following cyclonic anomaly propagate southward after PC2+ (Fig. 12b-ii, c-i) and PC3− (Fig. 12c-ii, d-i), respectively. The former stage corresponds to the emergence of a convective anomaly over the western North Pacific and the latter stage to the arrival of this convective anomaly over southern China (Fig. 12c-i, c-ii). The southward fluxes shift toward the west as the convection center begins to emerge over the Arabian Sea and adjacent coastal areas (Fig. 12d-ii, a-i) and then becomes predominantly eastward as the upper-level high retracts into the subtropical jet waveguide (Fig. 12a-ii, b-i). Our results therefore support the contention of Ortega et al. (2017) that the upper-level expression of quasi-biweekly waves in the Asian monsoon system is not a passive response to the anomalous convective heating but part of a coupled pattern that cycles around the anticyclone. This cycle, recently been examined in more detail by Amemiya and Sato (2018, 2020), represents an important and underexplored connection between variability in the upper-level anticyclone and surface weather in the monsoon region at subseasonal scales.
In this paper, we have shown that current reanalysis products are largely able to reproduce the leading modes of variability in tropopause-layer water vapor above the Asian summer monsoon. Using a range of dynamical and thermodynamic fields, we have further investigated the physical and dynamical processes behind these modes of variability as represented in the reanalysis products. The results serve three purposes: reanalysis assessment, reanalysis intercomparison, and mechanistic analysis.
By applying principal component analysis to the vertical and horizontal variability in deseasonalized anomalies, we have identified and described three modes of spatiotemporal variability in water vapor above the ASM. Comparing five reanalyses and observational products, we identify a remarkable consistency in UTLS water vapor (for which increments from assimilated observational data are weak and sometimes detrimental; Davis et al., 2017; Kosaka et al., 2024), the terms of the tropopause-layer moisture budget, and covariations in dynamical and thermodynamic fields. This overall consistency indicates that the current generation of reanalysis products is increasingly able to reproduce the characteristics and mechanisms of water vapor variability in this part of the atmosphere. The three modes we analyze correspond to key signatures of variability in UTLS humidity in this region from intraseasonal to interannual scales. The interannual mode, which features regional-scale moist or dry anomalies in the lower stratosphere, is strongly correlated with the Quasi-Biennial Oscillation (QBO). The phase of this mode is usually set before the monsoon and then maintained as the monsoon evolves. The second and third modes highlight different phases of quasi-biweekly waves, as convective anomalies propagate from the maritime monsoon region in the southeast through Southeast Asia, Bangladesh, and northern India to the Indus River valley and Karakoram Pass in the northwest (see also Randel and Park, 2006; Nützel et al., 2016; Ortega et al., 2017; Ren et al., 2019; Satheesh Chandran and Sunilkumar, 2024). Although these modes often occur in quadrature, with PC2 following PC3 and the opposite phase of PC3 following PC2, each at roughly 10 d lag, the lead–lag correlations are relatively small (peak –0.3), suggesting that the influences of other modes of organized convective variability on water vapor in the tropopause layer also project onto these patterns.
In contrast to the good overall agreement between Aura MLS and the reanalysis products in detrended variability, linear trends in tropopause-layer water vapor over 2005–2021 differ in both magnitude and sign over much of the region, arising from different responses in the upper troposphere despite broad agreement in the lower stratosphere. The increasing trend in 68–83 hPa water vapor in the reanalyses is best explained by an increase in dynamical moistening in the southeast quadrant. Further analysis of the tropopause-layer water vapor budgets for ERA5, JRA-3Q, and MERRA-2 show that the reanalysis trends are driven by processes outside the monsoon domain and season. As a consequence, trends based on Aura MLS and the reanalyses agree best above the CPT near 68 hPa, where air masses are less affected by transport from the monsoon circulation below and less confined within the boundaries of the anticyclone (Legras and Bucci, 2020; Nützel et al., 2019). We identify two possible classes of explanations for the difference between Aura MLS and the reanalysis products: (1) Aura MLS did not observe the increase seen in the reanalysis products because it did not occur in reality (i.e., an error in the reanalyses), or (2) Aura MLS did not observe an increase because of a sampling bias (e.g., increases were limited mainly to a part of the diurnal cycle that MLS does not sample) or some other gap in the observations. Further investigation will be needed to clarify the reasons behind this discrepancy.
The influences on composition in the monsoon anticyclone reported in this work may extend into the extratropical and tropical lower stratosphere, as events of Rossby wave breaking and eddy shedding transmit the characteristics of air in this region far beyond the seasonal and geographic boundaries of the monsoon (e.g., Dethof et al., 1999; Wright et al., 2011; Ploeger et al., 2013; Yan et al., 2019). Future work may design transport simulations to target the composite evolution of convectively detrained air under these different modes, including typical transitions among the phases of the subseasonal modes. Such simulations could leverage increased consistency in reanalysis representations of deep convective and radiative heating in the monsoon tropopause layer to better quantify the influences of monsoon convection in different regions, assess key uncertainties, and estimate the potential impacts of future climate change in this system.
The ability of current reanalysis datasets to reproduce the climatology and variability in water vapor in the ASM tropopause layer underscores their increasing utility for research applications in the UTLS. With the notable exception of M2-SCREAM, which assimilates Aura MLS water vapor retrievals, this level of performance has been achieved with few direct assimilation constraints on tropopause-layer water vapor, indicating that this utility may extend beyond the retirement of Aura MLS. However, confidence in this ability depends on continued assessments of consistency across reanalysis products. To this end, our reanalysis-based budget decomposition offers valuable new perspectives on the dynamical and physical processes governing water vapor variability and the ability of current reanalysis systems to capture these processes. The budgets not only facilitate quantitative analysis of the effects of key processes, including data assimilation, but also provide a deeper understanding of the strengths and weaknesses of current reanalysis systems by identifying areas in which different reanalyses may produce similar distributions but by different mechanistic balances. This type of budget decomposition can be used to identify the potential of targeted model improvements and improve our ability to interpret reanalysis representations of water vapor and other assimilated variables throughout the atmosphere.
Aura MLS (https://doi.org/10.5067/Aura/MLS/ DATA/3508, Lambert et al., 2021; https://doi.org/10.5067/Aura/MLS/DATA/3516, Schwartz et al., 2021a; https://doi.org/10.5067/Aura/MLS/DATA/ 3506, Schwartz et al., 2021b), MERRA-2 (https://doi.org/10.5067/WWQSXQ8IVFW8, GMAO, 2015a; https://doi.org/10.5067/HO9OVZWF3KW2, GMAO, 2015b, https://doi.org/10.5067/Q9QMY5PBNV1T, GMAO, 2015c; https://doi.org/10.5067/9NCR9DDDOPFI, GMAO, 2015d), and M2-SCREAM (https://doi.org/10.5067/7PR3XRD6Q3NQ, GMAO, 2022) data were acquired from the NASA Goddard Earth Sciences Data and Information Services Center (GES DISC; https://disc.gsfc.nasa.gov, last access: 20 August 2025). ERA5 products (https://doi.org/10.24381/cds.143582cf, Hersbach et al., 2017; https://doi.org/10.24381/cds.bd0915c6, Hersbach et al., 2023a; https://doi.org/10.24381/cds.adbb2d47, Hersbach et al., 2023b) were acquired from the Copernicus Climate Data Store (CDS; https://cds.climate.copernicus.eu, last access: 20 August 2025) and CAMS reanalysis products from the Copernicus Atmosphere Data Store (ADS; https://doi.org/10.24381/d58bbf47, Copernicus Atmosphere Monitoring Service, 2020). JRA-3Q reanalysis products (https://doi.org/10.20783/DIAS.645, JMA, 2022) were acquired from the Data Integration and Analysis System (DIAS; https://search.diasjp.net/en/dataset/JRA3Q, last access: 20 August 2025) archive maintained by the Japan Agency for Marine-Earth Science and Technology (JAMSTEC) and the University of Tokyo. The Berlin Quasi-Biennial Oscillation time series was acquired from the updated archive maintained by the Karlsruhe Institute of Technology (https://www.atmohub.kit.edu/english/807.php, KIT, 2025). The Oceanic Niño Index time series was acquired from the National Oceanic and Atmospheric Administration (NOAA) Climate Prediction Center (https://www.cpc.ncep.noaa.gov/data/indices/, last access: 20 August 2025) index calculated with centered base periods using version 5 of the Extended Reconstructed Sea Surface Temperature (https://doi.org/10.5065/JZ08-3W17, National Centers for Environmental Information, NESDIS, NOAA, U.S. Department of Commerce, 2019).
The supplement related to this article is available online at https://doi.org/10.5194/acp-25-10109-2025-supplement.
SZ, JC, and JSW conceived the study and wrote the initial draft of the paper. SZ, JC, JSW, JG, and NZ conducted the analysis. XY, PK, ML, SMD, and ST provided feedback on the analysis and assisted with interpretation. GJZ, JSW, and PK acquired funding for the work. All authors contributed to writing and revising the manuscript.
At least one of the (co-)authors is a guest member of the editorial board of Atmospheric Chemistry and Physics for the special issue “The SPARC Reanalysis Intercomparison Project (S-RIP) Phase 2 (ACP/WCD inter-journal SI)”. The peer-review process was guided by an independent editor, and the authors also have no other competing interests to declare.
Publisher's note: Copernicus Publications remains neutral with regard to jurisdictional claims made in the text, published maps, institutional affiliations, or any other geographical representation in this paper. While Copernicus Publications makes every effort to include appropriate place names, the final responsibility lies with the authors.
This article is part of the special issue “The SPARC Reanalysis Intercomparison Project (S-RIP) Phase 2 (ACP/WCD inter-journal SI)”. It is not associated with a conference.
We thank Kris Wargan for assistance confirming details of the MERRA-2 and M2-SCREAM reanalyses; Yayoi Harada for assistance confirming details of the JRA-3Q reanalysis; and Hans Hersbach, Antje Inness, and Peter Bechtold for assistance confirming details of the ERA5 and CAMS reanalyses.
This research has been supported by the National Natural Science Foundation of China (grant no. 42275053); the Natural Science Foundation of Beijing Municipality (grant no. IS23121); and the Research Grants Council, University Grants Committee (project no. 16300424).
This paper was edited by Peter Haynes and reviewed by Mengchu Tao and one anonymous referee.
Alladi, H. K., Satheesh Chandran, P., and M, V. R.: Impact of ENSO on the UTLS chemical composition in the Asian Summer Monsoon Anticyclone, Atmos. Res., 309, 107551, https://doi.org/10.1016/j.atmosres.2024.107551, 2024. a
Amemiya, A. and Sato, K.: A Two-Dimensional Dynamical Model for the Subseasonal Variability of the Asian Monsoon Anticyclone, J. Atmos. Sci., 75, 3597–3612, https://doi.org/10.1175/JAS-D-17-0208.1, 2018. a
Amemiya, A. and Sato, K.: Characterizing quasi-biweekly variability of the Asian monsoon anticyclone using potential vorticity and large-scale geopotential height field, Atmos. Chem. Phys., 20, 13857–13876, https://doi.org/10.5194/acp-20-13857-2020, 2020. a
Annamalai, H. and Sperber, K. R.: Regional Heat Sources and the Active and Break Phases of Boreal Summer Intraseasonal (30–50 Day) Variability, J. Atmos. Sci., 62, 2726–2748, https://doi.org/10.1175/JAS3504.1, 2005. a
Avery, M. A., Davis, S. M., Rosenlof, K. H., Ye, H., and Dessler, A. E.: Large anomalies in lower stratospheric water vapour and ice during the 2015–2016 El Niño, Nature Geosci., 10, 405–409, https://doi.org/10.1038/ngeo2961, 2017. a
Banerjee, A., Chiodo, G., Previdi, M., Ponater, M., Conley, A. J., and Polvani, L. M.: Stratospheric water vapor: an important climate feedback, Clim. Dynam., 53, 1697–1710, https://doi.org/10.1007/s00382-019-04721-4, 2019. a
Bannister, R. N., O'neill, A., Gregory, A. R., and Nissen, K. M.: The role of the south-east Asian monsoon and other seasonal features in creating the `tape-recorder' signal in the Unified Model, Q. J. Roy. Meteor. Soc., 130, 1531–1554, https://doi.org/10.1256/qj.03.106, 2004. a
Bian, J., Yan, R., Chen, H., Lü, D., and Massie, S. T.: Formation of the summertime ozone valley over the Tibetan Plateau: The Asian summer monsoon and air column variations, Adv. Atmos. Sci., 28, 1318–1325, https://doi.org/10.1007/s00376-011-0174-9, 2011. a, b
Brunamonti, S., Jorge, T., Oelsner, P., Hanumanthu, S., Singh, B. B., Kumar, K. R., Sonbawne, S., Meier, S., Singh, D., Wienhold, F. G., Luo, B. P., Boettcher, M., Poltera, Y., Jauhiainen, H., Kayastha, R., Karmacharya, J., Dirksen, R., Naja, M., Rex, M., Fadnavis, S., and Peter, T.: Balloon-borne measurements of temperature, water vapor, ozone and aerosol backscatter on the southern slopes of the Himalayas during StratoClim 2016–2017, Atmos. Chem. Phys., 18, 15937–15957, https://doi.org/10.5194/acp-18-15937-2018, 2018. a
Brunamonti, S., Füzér, L., Jorge, T., Poltera, Y., Oelsner, P., Meier, S., Dirksen, R., Naja, M., Fadnavis, S., Karmacharya, J., Wienhold, F. G., Luo, B. P., Wernli, H., and Peter, T.: Water Vapor in the Asian Summer Monsoon Anticyclone: Comparison of Balloon-Borne Measurements and ECMWF Data, J. Geophys. Res.-Atmos., 124, 7053–7068, https://doi.org/10.1029/2018JD030000, 2019. a
Chatterjee, P. and Goswami, B. N.: Structure, genesis and scale selection of the tropical quasi-biweekly mode, Q. J. Roy. Meteor. Soc., 130, 1171–1194, https://doi.org/10.1256/qj.03.133, 2004. a
Copernicus Atmosphere Monitoring Service: CAMS global reanalysis (EAC4), Copernicus Atmosphere Monitoring Service (CAMS) Atmosphere Data Store [data set], https://doi.org/10.24381/d58bbf47, 2020. a
Davis, S. M., Hegglin, M. I., Fujiwara, M., Dragani, R., Harada, Y., Kobayashi, C., Long, C., Manney, G. L., Nash, E. R., Potter, G. L., Tegtmeier, S., Wang, T., Wargan, K., and Wright, J. S.: Assessment of upper tropospheric and stratospheric water vapor and ozone in reanalyses as part of S-RIP, Atmos. Chem. Phys., 17, 12743–12778, https://doi.org/10.5194/acp-17-12743-2017, 2017. a, b, c
Dessler, A. E., Schoeberl, M. R., Wang, T., Davis, S. M., and Rosenlof, K. H.: Stratospheric water vapor feedback, P. Natl. Acad. Sci. USA, 110, 18087–18091, https://doi.org/10.1073/pnas.1310344110, 2013. a
Dethof, A., O'Neill, A., Slingo, J. M., and Smit, H. G. J.: A mechanism for moistening the lower stratosphere involving the Asian summer monsoon, Q. J. Roy. Meteor. Soc., 125, 1079–1106, https://doi.org/10.1002/qj.1999.49712555602, 1999. a, b
Dong, W., Lin, Y., Wright, J. S., Ming, Y., Xie, Y., Wang, B., Luo, Y., Huang, W., Huang, J., Wang, L., Tian, L., Peng, Y., and Xu, F.: Summer rainfall over the southwestern Tibetan Plateau controlled by deep convection over the Indian subcontinent, Nat. Commun., 7, 10925, https://doi.org/10.1038/ncomms10925, 2016. a
Dong, W., Lin, Y., Wright, J. S., Xie, Y., Xu, F., Xu, W., and Wang, Y.: Indian Monsoon Low‐Pressure Systems Feed Up‐and‐Over Moisture Transport to the Southwestern Tibetan Plateau, J. Geophys. Res.-Atmos., 122, 12140–12151, https://doi.org/10.1002/2017jd027296, 2017. a, b
Forster, P. M. d. F. and Shine, K. P.: Stratospheric water vapour changes as a possible contributor to observed stratospheric cooling, Geophys. Res. Lett., 26, 3309–3312, https://doi.org/10.1029/1999GL010487, 1999. a
Fueglistaler, S., Bonazzola, M., Haynes, P. H., and Peter, T.: Stratospheric water vapor predicted from the Lagrangian temperature history of air entering the stratosphere in the tropics, J. Geophys. Res.-Atmos., 110, D08107, https://doi.org/10.1029/2004JD005516, 2005. a, b
Garfinkel, C. I., Harari, O., Ziskin Ziv, S., Rao, J., Morgenstern, O., Zeng, G., Tilmes, S., Kinnison, D., O'Connor, F. M., Butchart, N., Deushi, M., Jöckel, P., Pozzer, A., and Davis, S.: Influence of the El Niño–Southern Oscillation on entry stratospheric water vapor in coupled chemistry–ocean CCMI and CMIP6 models, Atmos. Chem. Phys., 21, 3725–3740, https://doi.org/10.5194/acp-21-3725-2021, 2021. a
Garny, H. and Randel, W. J.: Dynamic variability of the Asian monsoon anticyclone observed in potential vorticity and correlations with tracer distributions, J. Geophys. Res.-Atmos,, 118, 13421–13433, https://doi.org/10.1002/2013JD020908, 2013. a, b, c, d
Gelaro, R., McCarty, W., Suárez, M. J., Todling, R., Molod, A., Takacs, L., Randles, C., Darmenov, A., Bosilovich, M. G., Reichle, R., Wargan, K., Coy, L., Cullather, R., Draper, C., Akella, S., Buchard, V., Conaty, A., da Silva, A., Gu, W., Kim, G.-K., Koster, R., Lucchesi, R., Merkova, D., Nielsen, J. E., Partyka, G., Pawson, S., Putman, W., Rienecker, M., Schubert, S. D., Sienkiewicz, M., and Zhao, B.: The Modern-Era Retrospective Analysis for Research and Applications, Version 2 (MERRA-2), J. Climate, 30, 5419–5454, https://doi.org/10.1175/JCLI-D-16-0758.1, 2017. a, b, c
Geller, M. A., Zhou, X., and Zhang, M.: Simulations of the Interannual Variability of Stratospheric Water Vapor, J. Atmos. Sci., 59, 1076–1085, https://doi.org/10.1175/1520-0469(2002)059<1076:SOTIVO>2.0.CO;2, 2002. a
Gettelman, A., Randel, W. J., Wu, F., and Massie, S. T.: Transport of water vapor in the tropical tropopause layer, Geophys. Res. Lett., 29, 9-1–9-4, https://doi.org/10.1029/2001GL013818, 2002. a
Gettelman, A., Kinnison, D. E., Dunkerton, T. J., and Brasseur, G. P.: Impact of monsoon circulations on the upper troposphere and lower stratosphere, J. Geophys. Res.-Atmos., 109, D22101, https://doi.org/10.1029/2004JD004878, 2004. a
GMAO: MERRA-2 inst3_3d_asm_Nv: 3d,3-Hourly,Instantaneous,Model-Level,Assimilation,Assimilated Meteorological Fields V5.12.4, GMAO [data set], https://doi.org/10.5067/WWQSXQ8IVFW8 (last access: February 2024), 2015a. a
GMAO: MERRA-2 inst3_3d_chm_Nv: 3d,3-Hourly,Instantaneous,Model-Level,Assimilation,Carbon Monoxide and Ozone Mixing Ratio V5.12.4, GMAO [data set], https://doi.org/10.5067/HO9OVZWF3KW2 (last access: February 2024), 2015b. a
GMAO: MERRA-2 tavg1_2d_rad_Nx: 2d,1-Hourly,Time-Averaged,Single-Level,Assimilation,Radiation Diagnostics V5.12.4, GMAO [data set], https://doi.org/10.5067/Q9QMY5PBNV1T (last access: February 2024), 2015c. a
GMAO: MERRA-2 tavg3_3d_tdt_Np: 3d,3-Hourly,Time-Averaged,Pressure-Level,Assimilation,Temperature Tendencies V5.12.4, GMAO [data set], https://doi.org/10.5067/9NCR9DDDOPFI (last access: February 2024), 2015d. a
GMAO: M2-SCREAM: 3d,3-Hourly,Instantaneous,Model-Level,Assimilation,Assimilated Constituent Fields,Replayed MERRA-2 Meteorological Fields, GMAO [data set], https://doi.org/10.5067/7PR3XRD6Q3NQ (last access: February 2024), 2022. a
Goswami, B. N. and Mohan, R. S. A.: Intraseasonal Oscillations and Interannual Variability of the Indian Summer Monsoon, J. Climate, 14, 1180–1198, https://doi.org/10.1175/1520-0442(2001)014<1180:IOAIVO>2.0.CO;2, 2001. a
Gottschaldt, K.-D., Schlager, H., Baumann, R., Cai, D. S., Eyring, V., Graf, P., Grewe, V., Jöckel, P., Jurkat-Witschas, T., Voigt, C., Zahn, A., and Ziereis, H.: Dynamics and composition of the Asian summer monsoon anticyclone, Atmos. Chem. Phys., 18, 5655–5675, https://doi.org/10.5194/acp-18-5655-2018, 2018. a
Heath, N. K. and Fuelberg, H. E.: Using a WRF simulation to examine regions where convection impacts the Asian summer monsoon anticyclone, Atmos. Chem. Phys., 14, 2055–2070, https://doi.org/10.5194/acp-14-2055-2014, 2014. a, b
Hersbach, H., Bell, B., Berrisford, P., Hirahara, S., Horányi, A., Muñoz‐Sabater, J., Nicolas, J., Peubey, C., Radu, R., Schepers, D., Simmons, A., Soci, C., Abdalla, S., Abellan, X., Balsamo, G., Bechtold, P., Biavati, G., Bidlot, J., Bonavita, M., De Chiara, G., Dahlgren, P., Dee, D., Diamantakis, M., Dragani, R., Flemming, J., Forbes, R., Fuentes, M., Geer, A., Haimberger, L., Healy, S., Hogan, R., Hólm, E., Janisková, M., Keeley, S., Laloyaux, P., Lopez, P., Lupu, C., Radnoti, G., de Rosnay, P., Rozum, I., Vamborg, F., Villaume, S., and Thépaut, J.-N.: Complete ERA5 from 1940: Fifth generation of ECMWF atmospheric reanalyses of the global climate, Copernicus Climate Change Service (C3S) Data Store (CDS) [data set], https://doi.org/10.24381/cds.143582cf (last access: February 2024), 2017. a
Hersbach, H., Bell, B., Berrisford, P., Hirahara, S., Horányi, A., Muñoz-Sabater, J., Nicolas, J., Peubey, C., Radu, R., Schepers, D., Simmons, A., Soci, C., Abdalla, S., Abellan, X., Balsamo, G., Bechtold, P., Biavati, G., Bidlot, J., Bonavita, M., De Chiara, G., Dahlgren, P., Dee, D., Diamantakis, M., Dragani, R., Flemming, J., Forbes, R., Fuentes, M., Geer, A., Haimberger, L., Healy, S., Hogan, R. J., Hólm, E., Janisková, M., Keeley, S., Laloyaux, P., Lopez, P., Lupu, C., Radnoti, G., de Rosnay, P., Rozum, I., Vamborg, F., Villaume, S., and Thépaut, J.-N.: The ERA5 global reanalysis, Q. J. Roy. Meteor. Soc., 146, 1999–2049, https://doi.org/10.1002/qj.3803, 2020. a
Hersbach, H., Bell, B., Berrisford, P., Biavati, G., Horányi, A., Muñoz Sabater, J., Nicolas, J., Peubey, C., Radu, R., Rozum, I., Schepers, D., Simmons, A., Soci, C., Dee, D., and Thépaut, J.-N.: ERA5 hourly data on pressure levels from 1940 to present, Copernicus Climate Change Service (C3S) Climate Data Store (CDS) [data set], https://doi.org/10.24381/cds.bd0915c6 (last access: February 2024), 2023a. a
Hersbach, H., Bell, B., Berrisford, P., Biavati, G., Horányi, A., Muñoz Sabater, J., Nicolas, J., Peubey, C., Radu, R., Rozum, I., Schepers, D., Simmons, A., Soci, C., Dee, D., and Thépaut, J.-N.: ERA5 hourly data on single levels from 1940 to present, Copernicus Climate Change Service (C3S) Climate Data Store (CDS) [data set], https://doi.org/10.24381/cds.adbb2d47 (last access: February 2024), 2023b. a
Hirose, M. and Nakamura, K.: Spatial and diurnal variation of precipitation systems over Asia observed by the TRMM Precipitation Radar, J. Geophys. Res.-Atmos., 110, D05106, https://doi.org/10.1029/2004JD004815, 2005. a
Honomichl, S. B. and Pan, L. L.: Transport From the Asian Summer Monsoon Anticyclone Over the Western Pacific, J. Geophys. Res.-Atmos., 125, e2019JD032094, https://doi.org/10.1029/2019JD032094, 2020. a, b, c, d
Hoskins, B. J. and Rodwell, M. J.: A model of the Asian summer monsoon. Part I: The global scale, J. Atmos. Sci., 52, 1329–1340, 1995. a
Huang, L., Fu, R., and Jiang, J. H.: Impacts of fire emissions and transport pathways on the interannual variation of CO in the tropical upper troposphere, Atmos. Chem. Phys., 14, 4087–4099, https://doi.org/10.5194/acp-14-4087-2014, 2014. a
Hunt, K. M. R., Turner, A. G., Inness, P. M., Parker, D. E., and Levine, R. C.: On the Structure and Dynamics of Indian Monsoon Depressions, Mon. Weather Rev., 144, 3391–3416, https://doi.org/10.1175/MWR-D-15-0138.1, 2016. a
Inness, A., Ades, M., Agustí-Panareda, A., Barré, J., Benedictow, A., Blechschmidt, A.-M., Dominguez, J. J., Engelen, R., Eskes, H., Flemming, J., Huijnen, V., Jones, L., Kipling, Z., Massart, S., Parrington, M., Peuch, V.-H., Razinger, M., Remy, S., Schulz, M., and Suttie, M.: The CAMS reanalysis of atmospheric composition, Atmos. Chem. Phys., 19, 3515–3556, https://doi.org/10.5194/acp-19-3515-2019, 2019. a, b, c
James, R., Bonazzola, M., Legras, B., Surbled, K., and Fueglistaler, S.: Water vapor transport and dehydration above convective outflow during Asian monsoon, Geophys. Res. Lett., 35, L20810, https://doi.org/10.1029/2008GL035441, 2008. a, b
JMA: The Japanese Reanalysis for Three Quarters of a Century, Data Integration and Analysis System (DIAS) [data set], https://doi.org/10.20783/DIAS.645 (last access: March 2024), 2022. a
Kikuchi, K. and Wang, B.: Global Perspective of the Quasi-Biweekly Oscillation, J. Climate, 22, 1340–1359, https://doi.org/10.1175/2008JCLI2368.1, 2009. a
KIT: The Quasi-Biennial-Oscillation (QBO), Karlsruhe Institute of Technology [data set],https://www.atmohub.kit.edu/english/807.php (last access: 20 August 2025), 2025. a
Konopka, P., Grooß, J.-U., Plöger, F., and Müller, R.: Annual cycle of horizontal in-mixing into the lower tropical stratosphere, J. Geophys. Res.-Atmos., 114, D19111, https://doi.org/10.1029/2009JD011955, 2009. a
Konopka, P., Grooß, J.-U., Günther, G., Ploeger, F., Pommrich, R., Müller, R., and Livesey, N.: Annual cycle of ozone at and above the tropical tropopause: observations versus simulations with the Chemical Lagrangian Model of the Stratosphere (CLaMS), Atmos. Chem. Phys., 10, 121–132, https://doi.org/10.5194/acp-10-121-2010, 2010. a
Konopka, P., Rolf, C., von Hobe, M., Khaykin, S. M., Clouser, B., Moyer, E., Ravegnani, F., D'Amato, F., Viciani, S., Spelten, N., Afchine, A., Krämer, M., Stroh, F., and Ploeger, F.: The dehydration carousel of stratospheric water vapor in the Asian summer monsoon anticyclone, Atmos. Chem. Phys., 23, 12935–12947, https://doi.org/10.5194/acp-23-12935-2023, 2023. a, b
Kosaka, Y., Kobayashi, S., Harada, Y., Kobayashi, C., Naoe, H., Yoshimoto, K., Harada, M., Goto, N., Chiba, J., Miyaoka, K., Sekiguchi, R., Deushi, M., Kamahori, H., Nakaegawa, T., Tanaka, T. Y., Tokuhiro, T., Sato, Y., Matsushita, Y., and Onogi, K.: The JRA-3Q Reanalysis, J. Meteorol. Soc. Jpn. Ser. II, 102, 49–109, https://doi.org/10.2151/jmsj.2024-004, 2024. a, b, c, d
Kumar, A. H. and Ratnam, M. V.: Variability in the UTLS chemical composition during different modes of the Asian Summer Monsoon Anti-cyclone, Atmos. Res., 260, 105700, https://doi.org/10.1016/j.atmosres.2021.105700, 2021. a, b, c
Lambert, A., Read, W., Livesey, N., and Fuller, R.: MLS/Aura Level 3 Daily Binned Water Vapor (H2O) Mixing Ratio on Assorted Grids V005, Greenbelt, MD, USA, Goddard Earth Sciences Data and Information Services Center (GES DISC) [data set], https://doi.org/10.5067/Aura/MLS/DATA/3508 (last access: May 2022), 2021. a, b
Lee, K.-O., Dauhut, T., Chaboureau, J.-P., Khaykin, S., Krämer, M., and Rolf, C.: Convective hydration in the tropical tropopause layer during the StratoClim aircraft campaign: pathway of an observed hydration patch, Atmos. Chem. Phys., 19, 11803–11820, https://doi.org/10.5194/acp-19-11803-2019, 2019. a
Legras, B. and Bucci, S.: Confinement of air in the Asian monsoon anticyclone and pathways of convective air to the stratosphere during the summer season, Atmos. Chem. Phys., 20, 11045–11064, https://doi.org/10.5194/acp-20-11045-2020, 2020. a, b
Liu, Y., Hoskins, B., and Blackburn, M.: Impact of Tibetan Orography and Heating on the Summer Flow over Asia, J. Meteorol. Soc. Jpn. Ser. II, 85B, 1–19, https://doi.org/10.2151/jmsj.85b.1, 2007. a
Liu, Y. S., Fueglistaler, S., and Haynes, P. H.: Advection-condensation paradigm for stratospheric water vapor, J. Geophys. Res.-Atmos., 115, D24307, https://doi.org/10.1029/2010JD014352, 2010. a
Livesey, N. J., Read, W. G., Froidevaux, L., Lambert, A., Santee, M. L., Schwartz, M. J., Millán, L. F., Jarnot, R. F., Wagner, P. A., Hurst, D. F., Walker, K. A., Sheese, P. E., and Nedoluha, G. E.: Investigation and amelioration of long-term instrumental drifts in water vapor and nitrous oxide measurements from the Aura Microwave Limb Sounder (MLS) and their implications for studies of variability and trends, Atmos. Chem. Phys., 21, 15409–15430, https://doi.org/10.5194/acp-21-15409-2021, 2021. a, b
Livesey, N. J., Read, W. G., Wagner, P. A., Froidevaux, L., Santee, M. L., Schwartz, M. J., Lambert, A., Millán-Valle, L. F., Pumphrey, H. C., Manney, G. L., Fuller, R. A., Jarnot, R. F., Knosp, B. W., and Lay, R. R.: Version 5.0x Level 2 and 3 data quality and description document, Tech. Rep. JPL D-105336 Rev. B, Jet Propulsion Laboratory, California Institute of Technology, Pasadena, California, USA, https://mls.jpl.nasa.gov/data/v5-0_data_quality_document.pdf (last access: 20 August 2025), 2022. a, b
Luo, J., Tian, W., Pu, Z., Zhang, P., Shang, L., Zhang, M., and Hu, J.: Characteristics of stratosphere-troposphere exchange during the Meiyu season, J. Geophys. Res.-Atmos., 118, 2058–2072, https://doi.org/10.1029/2012JD018124, 2013. a
Manney, G. L., Santee, M. L., Lawrence, Z. D., Wargan, K., and Schwartz, M. J.: A Moments View of Climatology and Variability of the Asian Summer Monsoon Anticyclone, J. Climate, 34, 7821–7841, https://doi.org/10.1175/JCLI-D-20-0729.1, 2021. a, b, c, d, e
Maycock, A. C., Joshi, M. M., Shine, K. P., and Scaife, A. A.: The Circulation Response to Idealized Changes in Stratospheric Water Vapor, J. Climate, 26, 545–561, https://doi.org/10.1175/JCLI-D-12-00155.1, 2013. a
Milz, M., von Clarmann, T., Fischer, H., Glatthor, N., Grabowski, U., Höpfner, M., Kellmann, S., Kiefer, M., Linden, A., Mengistu Tsidu, G., Steck, T., Stiller, G. P., Funke, B., López-Puertas, M., and Koukouli, M. E.: Water vapor distributions measured with the Michelson Interferometer for Passive Atmospheric Sounding on board Envisat (MIPAS/Envisat), J. Geophys. Res.-Atmos., 110, D24307, https://doi.org/10.1029/2005JD005973, 2005. a
Ming, A., Maycock, A. C., Hitchcock, P., and Haynes, P.: The radiative role of ozone and water vapour in the annual temperature cycle in the tropical tropopause layer, Atmos. Chem. Phys., 17, 5677–5701, https://doi.org/10.5194/acp-17-5677-2017, 2017. a
Mote, P. W., Rosenlof, K. H., McIntyre, M. E., Carr, E. S., Gille, J. C., Holton, J. R., Kinnersley, J. S., Pumphrey, H. C., Russell III, J. M., and Waters, J. W.: An atmospheric tape recorder: The imprint of tropical tropopause temperatures on stratospheric water vapor, J. Geophys. Res.-Atmos., 101, 3989–4006, https://doi.org/10.1029/95JD03422, 1996. a
National Centers for Environmental Information, NESDIS, NOAA, U.S. Department of Commerce: NOAA NCEI Extended Reconstructed Sea Surface Temperature, NCAR Research Data Archive [data set], https://doi.org/10.5065/JZ08-3W17, 2019. a
North, G. R., Bell, T. L., Cahalan, R. F., and Moeng, F. J.: Sampling errors in the estimation of empirical orthogonal functions, Mon. Weather Rev., 110, 699–706, https://doi.org/10.1175/1520-0493(1982)110<0699:SEITEO>2.0.CO;2, 1982. a, b
Nützel, M., Dameris, M., and Garny, H.: Movement, drivers and bimodality of the South Asian High, Atmos. Chem. Phys., 16, 14755–14774, https://doi.org/10.5194/acp-16-14755-2016, 2016. a, b, c, d, e, f, g
Nützel, M., Podglajen, A., Garny, H., and Ploeger, F.: Quantification of water vapour transport from the Asian monsoon to the stratosphere, Atmos. Chem. Phys., 19, 8947–8966, https://doi.org/10.5194/acp-19-8947-2019, 2019. a, b, c
Ortega, S., Webster, P. J., Toma, V., and Chang, H.-R.: Quasi-biweekly oscillations of the South Asian monsoon and its co-evolution in the upper and lower troposphere, Clim. Dynam., 49, 3159–3174, https://doi.org/10.1007/s00382-016-3503-y, 2017. a, b, c, d, e
Pan, L. L., Honomichl, S. B., Kinnison, D. E., Abalos, M., Randel, W. J., Bergman, J. W., and Bian, J.: Transport of chemical tracers from the boundary layer to stratosphere associated with the dynamics of the Asian summer monsoon, J. Geophys. Res.-Atmos., 121, 14159–14174, https://doi.org/10.1002/2016JD025616, 2016. a, b, c, d
Pan, L. L., Kinnison, D., Liang, Q., Chin, M., Santee, M. L., Flemming, J., Smith, W. P., Honomichl, S. B., Bresch, J. F., Lait, L. R., Zhu, Y., Tilmes, S., Colarco, P. R., Warner, J., Vuvan, A., Clerbaux, C., Atlas, E. L., Newman, P. A., Thornberry, T., Randel, W. J., and Toon, O. B.: A Multimodel Investigation of Asian Summer Monsoon UTLS Transport Over the Western Pacific, J. Geophys. Res.-Atmos., 127, e2022JD037511, https://doi.org/10.1029/2022JD037511, 2022. a, b
Park, M., Randel, W. J., Gettelman, A., Massie, S. T., and Jiang, J. H.: Transport above the Asian summer monsoon anticyclone inferred from Aura Microwave Limb Sounder tracers, J. Geophys. Res.-Atmos., 112, D16309, https://doi.org/10.1029/2006JD008294, 2007. a
Peña-Ortiz, C., Plaza, N. P., Gallego, D., and Ploeger, F.: Quasi-biennial oscillation modulation of stratospheric water vapour in the Asian monsoon, Atmos. Chem. Phys., 24, 5457–5478, https://doi.org/10.5194/acp-24-5457-2024, 2024. a, b, c
Ploeger, F., Günther, G., Konopka, P., Fueglistaler, S., Müller, R., Hoppe, C., Kunz, A., Spang, R., Grooß, J.-U., and Riese, M.: Horizontal water vapor transport in the lower stratosphere from subtropics to high latitudes during boreal summer, J. Geophys. Res.-Atmos., 118, 8111–8127, https://doi.org/10.1002/jgrd.50636, 2013. a, b, c
Ploeger, F., Gottschling, C., Griessbach, S., Grooß, J.-U., Guenther, G., Konopka, P., Müller, R., Riese, M., Stroh, F., Tao, M., Ungermann, J., Vogel, B., and von Hobe, M.: A potential vorticity-based determination of the transport barrier in the Asian summer monsoon anticyclone, Atmos. Chem. Phys., 15, 13145–13159, https://doi.org/10.5194/acp-15-13145-2015, 2015. a
Popovic, J. M. and Plumb, R. A.: Eddy Shedding from the Upper-Tropospheric Asian Monsoon Anticyclone, J. Atmos. Sci., 58, 93–104, https://doi.org/10.1175/1520-0469(2001)058<0093:ESFTUT>2.0.CO;2, 2001. a, b
Qian, Y., Zhang, Q., Yao, Y., and Zhang, X.: Seasonal variation and heat preference of the South Asia high, Adv. Atmos. Sci., 19, 821–836, https://doi.org/10.1007/s00376-002-0047-3, 2002. a
Randel, W. J. and Jensen, E. J.: Physical processes in the tropical tropopause layer and their roles in a changing climate, Nature Geosci., 6, 169–176, https://doi.org/10.1038/ngeo1733, 2013. a, b
Randel, W. J. and Park, M.: Deep convective influence on the Asian summer monsoon anticyclone and associated tracer variability observed with Atmospheric Infrared Sounder (AIRS), J. Geophys. Res.-Atmos., 111, D12314, https://doi.org/10.1029/2005JD006490, 2006. a, b, c
Randel, W. J., Wu, F., Vömel, H., Nedoluha, G. E., and Forster, P.: Decreases in stratospheric water vapor after 2001: Links to changes in the tropical tropopause and the Brewer-Dobson circulation, J. Geophys. Res.-Atmos., 111, D12312, https://doi.org/10.1029/2005JD006744, 2006. a
Randel, W. J., Zhang, K., and Fu, R.: What controls stratospheric water vapor in the NH summer monsoon regions?, J. Geophys. Res.-Atmos., 120, 7988–8001, https://doi.org/10.1002/2015JD023622, 2015. a, b, c, d, e, f, g, h, i
Ren, R., Zhu, C., and Cai, M.: Linking quasi-biweekly variability of the South Asian high to atmospheric heating over Tibetan Plateau in summer, Clim. Dynam., 53, 3419–3429, https://doi.org/10.1007/s00382-019-04713-4, 2019. a, b, c, d, e
Riese, M., Ploeger, F., Rap, A., Vogel, B., Konopka, P., Dameris, M., and Forster, P.: Impact of uncertainties in atmospheric mixing on simulated UTLS composition and related radiative effects, J. Geophys. Res.-Atmos., 117, D16305, https://doi.org/10.1029/2012JD017751, 2012. a
Santee, M. L., Manney, G. L., Livesey, N. J., Schwartz, M. J., Neu, J. L., and Read, W. G.: A comprehensive overview of the climatological composition of the Asian summer monsoon anticyclone based on 10 years of Aura Microwave Limb Sounder measurements, J. Geophys. Res.-Atmos., 122, 5491–5514, https://doi.org/10.1002/2016JD026408, 2017. a, b, c
Satheesh Chandran, P. R. and Sunilkumar, S. V.: Role of deep convection and dynamics on the tracer distribution in the upper troposphere and lower stratosphere region during active and break phases of the Asian summer monsoon, Clim. Dynam., 62, 1945–1963, https://doi.org/10.1007/s00382-023-07004-1, 2024. a, b, c
Schoeberl, M. R., Dessler, A. E., and Wang, T.: Simulation of stratospheric water vapor and trends using three reanalyses, Atmos. Chem. Phys., 12, 6475–6487, https://doi.org/10.5194/acp-12-6475-2012, 2012. a
Schwartz, M., Froidevaux, L., Livesey, N., Read, W., and Fuller, R.: MLS/Aura Level 3 Daily Binned Ozone (O3) Mixing Ratio on Assorted Grids V005, Greenbelt, MD, USA, Goddard Earth Sciences Data and Information Services Center (GES DISC) [data set], https://doi.org/10.5067/Aura/MLS/DATA/3516 (last access: May 2022), 2021a. a, b
Schwartz, M., Pumphrey, H., Livesey, N., Read, W., and Fuller, R.: MLS/Aura Level 3 Daily Binned Carbon Monoxide (CO) Mixing Ratio on Assorted Grids V005, Greenbelt, MD, USA, Goddard Earth Sciences Data and Information Services Center (GES DISC) [data set], https://doi.org/10.5067/Aura/MLS/DATA/3506 (last access: May 2022), 2021b. a, b
Singh, B. B., Krishnan, R., Ayantika, D. C., Vellore, R. K., Sabin, T. P., Kumar, K. R., Brunamonti, S., Hanumanthu, S., Jorge, T., Oelsner, P., Sonbawne, S., Naja, M., Fadnavis, S., Peter, T., and Srivastava, M. K.: Linkage of water vapor distribution in the lower stratosphere to organized Asian summer monsoon convection, Clim. Dynam., 57, 1709–1731, https://doi.org/10.1007/s00382-021-05772-2, 2021. a
Siu, L. W. and Bowman, K. P.: Forcing of the Upper-Tropospheric Monsoon Anticyclones, J. Atmos. Sci., 76, 1937–1954, https://doi.org/10.1175/JAS-D-18-0340.1, 2019. a, b
Siu, L. W. and Bowman, K. P.: Unsteady Vortex Behavior in the Asian Monsoon Anticyclone, J. Atmos. Sci., 77, 4067–4088, https://doi.org/10.1175/JAS-D-19-0349.1, 2020. a, b, c
Solomon, S., Rosenlof, K. H., Portmann, R. W., Daniel, J. S., Davis, S. M., Sanford, T. J., and Plattner, G.-K.: Contributions of Stratospheric Water Vapor to Decadal Changes in the Rate of Global Warming, Science, 327, 1219–1223, https://doi.org/10.1126/science.1182488, 2010. a
SPARC: SPARC Reanalysis Intercomparison Project (S-RIP) Final Report, SPARC Report No. 10, WCRP-6/2021, 612pp., https://doi.org/10.17874/800dee57d13, 2022. a, b, c
Takaya, K. and Nakamura, H.: A Formulation of a Phase-Independent Wave-Activity Flux for Stationary and Migratory Quasigeostrophic Eddies on a Zonally Varying Basic Flow, J. Atmos. Sci., 58, 608–627, https://doi.org/10.1175/1520-0469(2001)058<0608:AFOAPI>2.0.CO;2, 2001. a
Tao, M., Konopka, P., Wright, J. S., Liu, Y., Bian, J., Davis, S. M., Jia, Y., and Ploeger, F.: Multi-decadal variability controls short-term stratospheric water vapor trends, Commun. Earth Environ., 4, 441, https://doi.org/10.1038/s43247-023-01094-9, 2023. a
Tegtmeier, S., Anstey, J., Davis, S., Dragani, R., Harada, Y., Ivanciu, I., Pilch Kedzierski, R., Krüger, K., Legras, B., Long, C., Wang, J. S., Wargan, K., and Wright, J. S.: Temperature and tropopause characteristics from reanalyses data in the tropical tropopause layer, Atmos. Chem. Phys., 20, 753–770, https://doi.org/10.5194/acp-20-753-2020, 2020. a, b
Tegtmeier, S., Krüger, K., Birner, T., Davis, N. A., Davis, S., Fujiwara, M., Homeyer, C. R., Ivanciu, I., Kim, Y.-H., Legras, B., Manney, G. L., Nishimoto, E., Nützel, M., Kedzierski, R. P., Wang, J. S., Wang, T., and Wright, J. S.: Chapter 8: Tropical Tropopause Layer, in: SPARC Report No. 10, WCRP Report 6/2021, edited by: Fujiwara, M., Manney, G., Gray, L., and Wright, J. S., 309–389, SPARC, Munich, https://doi.org/10.17874/800DEE57D13, 2022. a, b, c
Tian, E. W., Su, H., Tian, B., and Jiang, J. H.: Interannual variations of water vapor in the tropical upper troposphere and the lower and middle stratosphere and their connections to ENSO and QBO, Atmos. Chem. Phys., 19, 9913–9926, https://doi.org/10.5194/acp-19-9913-2019, 2019. a, b
Ueyama, R., Jensen, E. J., and Pfister, L.: Convective influence on the humidity and clouds in the tropical tropopause layer during boreal summer, J. Geophys. Res.-Atmos., 123, 7576–7593, https://doi.org/10.1029/2018JD028674, 2018. a, b, c
Vogel, B., Müller, R., Günther, G., Spang, R., Hanumanthu, S., Li, D., Riese, M., and Stiller, G. P.: Lagrangian simulations of the transport of young air masses to the top of the Asian monsoon anticyclone and into the tropical pipe, Atmos. Chem. Phys., 19, 6007–6034, https://doi.org/10.5194/acp-19-6007-2019, 2019. a, b
von Hobe, M., Ploeger, F., Konopka, P., Kloss, C., Ulanowski, A., Yushkov, V., Ravegnani, F., Volk, C. M., Pan, L. L., Honomichl, S. B., Tilmes, S., Kinnison, D. E., Garcia, R. R., and Wright, J. S.: Upward transport into and within the Asian monsoon anticyclone as inferred from StratoClim trace gas observations, Atmos. Chem. Phys., 21, 1267–1285, https://doi.org/10.5194/acp-21-1267-2021, 2021. a, b
Wang, X. and Chen, G.: Quasi-Biweekly Oscillation over the South China Sea in Late Summer: Propagation Dynamics and Energetics, J. Climate, 30, 4103–4112, https://doi.org/10.1175/jcli-d-16-0533.1, 2017. a
Wang, X., Dessler, A. E., Schoeberl, M. R., Yu, W., and Wang, T.: Impact of convectively lofted ice on the seasonal cycle of water vapor in the tropical tropopause layer, Atmos. Chem. Phys., 19, 14621–14636, https://doi.org/10.5194/acp-19-14621-2019, 2019. a
Wargan, K., Weir, B., Manney, G. L., Cohn, S. E., Knowland, K. E., Wales, P. A., and Livesey, N. J.: M2-SCREAM: A Stratospheric Composition Reanalysis of Aura MLS Data With MERRA-2 Transport, Earth Space Sci., 10, e2022EA002632, https://doi.org/10.1029/2022EA002632, 2023. a, b
Waters, J. W., Froidevaux, L., Harwood, R. S., Jarnot, R. F., Pickett, H. M., Read, W. G., Siegel, P. H., Cofield, R. E., Filipiak, M. J., Flower, D. A., Holden, J. R., Lau, G. K., Livesey, N. J., Manney, G. L., Pumphrey, H. C., Santee, M. L., Wu, D. L., Cuddy, D. T., Lay, R. R., Loo, M. S., Perun, V. S., Schwartz, M. J., Stek, P. C., Thurstans, R. P., Boyles, M. A., Chandra, K. M., Chavez, M. C., Gun-Shing Chen, Chudasama, B. V., Dodge, R., Fuller, R. A., Girard, M. A., Jiang, J. H., Yibo Jiang, Knosp, B. W., LaBelle, R. C., Lam, J. C., Lee, K. A., Miller, D., Oswald, J. E., Patel, N. C., Pukala, D. M., Quintero, O., Scaff, D. M., Van Snyder, W., Tope, M. C., Wagner, P. A., and Walch, M. J.: The Earth Observing System Microwave Limb Sounder (EOS MLS) on the Aura satellite, IEEE T. Geosci. Remote, 44, 1075–1092, https://doi.org/10.1109/TGRS.2006.873771, 2006. a
Webster, P. J. and Yang, S.: Monsoon and Enso: Selectively Interactive Systems, Q. J. Roy. Meteor. Soc., 118, 877–926, https://doi.org/10.1002/qj.49711850705, 1992. a
Wright, J. S. and Fueglistaler, S.: Large differences in reanalyses of diabatic heating in the tropical upper troposphere and lower stratosphere, Atmos. Chem. Phys., 13, 9565–9576, https://doi.org/10.5194/acp-13-9565-2013, 2013. a, b
Wright, J. S., Fu, R., Fueglistaler, S., Liu, Y. S., and Zhang, Y.: The influence of summertime convection over Southeast Asia on water vapor in the tropical stratosphere, J. Geophys. Res.-Atmos., 116, D12302, https://doi.org/10.1029/2010JD015416, 2011. a, b, c
Wright, J. S., Zhang, S., Chen, J., Davis, S. M., Konopka, P., Lu, M., Yan, X., and Zhang, G. J.: Evaluating reanalysis representations of climatological trace gas distributions in the Asian monsoon tropopause layer, Atmos. Chem. Phys., 25, 9617–9643, https://doi.org/10.5194/acp-25-9617-2025, 2025. a, b, c, d, e, f, g, h, i, j, k, l, m, n, o
Xia, Y., Hu, Y., and Huang, Y.: Strong modification of stratospheric ozone forcing by cloud and sea-ice adjustments, Atmos. Chem. Phys., 16, 7559–7567, https://doi.org/10.5194/acp-16-7559-2016, 2016. a
Xia, Y., Huang, Y., and Hu, Y.: On the Climate Impacts of Upper Tropospheric and Lower Stratospheric Ozone, J. Geophys. Res.-Atmos., 123, 730–739, https://doi.org/10.1002/2017JD027398, 2018. a, b
Yan, R., Bian, J., and Fan, Q.: The impact of the South Asia high bimodality on the chemical composition of the upper troposphere and lower stratosphere, Atmos. Ocean. Sci. Lett., 4, 229–234, https://doi.org/10.1080/16742834.2011.11446934, 2011. a
Yan, X., Wright, J. S., Zheng, X., Livesey, N. J., Vömel, H., and Zhou, X.: Validation of Aura MLS retrievals of temperature, water vapour and ozone in the upper troposphere and lower–middle stratosphere over the Tibetan Plateau during boreal summer, Atmos. Meas. Tech., 9, 3547–3566, https://doi.org/10.5194/amt-9-3547-2016, 2016. a
Yan, X., Konopka, P., Ploeger, F., Tao, M., Müller, R., Santee, M. L., Bian, J., and Riese, M.: El Niño Southern Oscillation influence on the Asian summer monsoon anticyclone, Atmos. Chem. Phys., 18, 8079–8096, https://doi.org/10.5194/acp-18-8079-2018, 2018. a, b, c
Yan, X., Konopka, P., Ploeger, F., Podglajen, A., Wright, J. S., Müller, R., and Riese, M.: The efficiency of transport into the stratosphere via the Asian and North American summer monsoon circulations, Atmos. Chem. Phys., 19, 15629–15649, https://doi.org/10.5194/acp-19-15629-2019, 2019. a, b
Zarrin, A., Ghaemi, H., Azadi, M., and Farajzadeh, M.: The spatial pattern of summertime subtropical anticyclones over Asia and Africa: A climatological review, Int. J. Climatol., 30, 159–173, https://doi.org/10.1002/joc.1879, 2010. a
Zhang, K., Fu, R., Wang, T., and Liu, Y.: Impact of geographic variations of the convective and dehydration center on stratospheric water vapor over the Asian monsoon region, Atmos. Chem. Phys., 16, 7825–7835, https://doi.org/10.5194/acp-16-7825-2016, 2016. a
Zhang, Q., Wu, G., and Qian, Y.: The Bimodality of the 100 hPa South Asia High and its Relationship to the Climate Anomaly over East Asia in Summer, J. Meteorol. Soc. Jpn. Ser. II, 80, 733–744, https://doi.org/10.2151/jmsj.80.733, 2002. a
Zhao, D., Dong, W., Lin, Y., Hu, Y., and Cao, D.: Diurnal Variation of Precipitation over the High Mountain Asia: Spatial Distribution and Its Seasonality, J. Hydrometeorol., 23, 1945–1959, https://doi.org/10.1175/JHM-D-21-0243.1, 2022. a
Ziskin Ziv, S., Garfinkel, C. I., Davis, S., and Banerjee, A.: The roles of the Quasi-Biennial Oscillation and El Niño for entry stratospheric water vapor in observations and coupled chemistry–ocean CCMI and CMIP6 models, Atmos. Chem. Phys., 22, 7523–7538, https://doi.org/10.5194/acp-22-7523-2022, 2022. a
Zolghadrshojaee, M., Tegtmeier, S., Davis, S. M., and Pilch Kedzierski, R.: Variability and long-term changes in tropical cold-point temperature and water vapor, Atmos. Chem. Phys., 24, 7405–7419, https://doi.org/10.5194/acp-24-7405-2024, 2024. a