the Creative Commons Attribution 4.0 License.
the Creative Commons Attribution 4.0 License.
 | 09 Sep 2025
Observationally constrained analysis on the distribution of fine- and coarse-mode nitrate in global models
Zheng Lu
Xiaohong Liu
Huisheng Bian
David D. Cohen
Mian Chin
Didier A. Hauglustaine
Vlassis A. Karydis
Marianne T. Lund
Gunnar Myhre
Andrea Pozzer
Michael Schulz
Ragnhild B. Skeie
Alexandra P. Tsimpidi
Svetlana G. Tsyro
Shaocheng Xie
Nitrate plays an important role in the Earth system and air quality. A key challenge in simulating the life cycle of nitrate aerosol in global models is to accurately represent mass size distribution of nitrate aerosol. In this study, we evaluate the performance of the Energy Exascale Earth System Model version 2 (E3SMv2) and the Community Earth System Model version 2 (CESM2), along with Aerosol Comparisons between Observations and Models (AeroCom) phase III models, in simulating spatial distribution of fine-mode nitrate, the mass size distribution of fine- and coarse-mode nitrate, and the gas–aerosol partitioning between nitric acid gas and nitrate, using long-term ground-based observations and measurements from multiple aircraft campaigns. We find that most models underestimate the annual mean PM2.5 (particulate matter with diameter less than 2.5 µm) nitrate surface concentration averaged over all sites. The observed nitrate PM2.5 PM10 and PM1 PM4 ratios are influenced by the relative contribution of fine sulfate or organic particles and coarse dust or sea salt particles. Overall, the ground-based observations give an annual mean surface nitrate PM2.5 PM10 ratio of 0.7. Most models underestimate the annual mean PM2.5 PM10 ratio in all regions. There are large spreads in the modeled nitrate PM1 PM4 ratios, which span the full range from 0 to 1. Most models underestimate the surface molar ratio of nitrate to total inorganic nitrate averaged across all sites. Our study indicates the importance of gas–aerosol partition parameterization and the simulation of dust and sea salt in correctly simulating the mass size distribution of nitrate.
- Article
(12099 KB) - Full-text XML
-
Supplement
(4689 KB) - BibTeX
- EndNote


Nitrate plays an important role in the Earth's climate and air quality (Boucher et al., 2013; Szopa et al., 2021; Gong et al., 2024). As part of atmospheric aerosols, it can scatter solar radiation (e.g., van Dorland et al., 1997; Adams et al., 2001), change cloud properties by acting as cloud condensation nuclei (CCN) (e.g., Kulmala et al., 1993), and affect atmospheric chemistry (e.g., Bassett and Seinfeld, 1983; Dentener et al., 1996; Liao and Seinfeld, 2005). Despite its important roles, large uncertainties exist in the simulated life cycle of nitrate aerosol and its radiative forcing (RF) from aerosol–radiation interactions (RFari) in global climate models (GCMs) and chemical transport models (CTMs) (e.g., Myhre et al., 2013; Bian et al., 2017; An et al., 2019; Lu et al., 2021; Zaveri et al., 2021; Wu et al., 2022). Global nitrate burdens from nine models participating in the Aerosol Comparisons between Observations and Models (AeroCom) phase III range from 0.03 to 0.43 Tg N (Bian et al., 2017). The RFari of nitrate aerosol documented in the Intergovernmental Panel on Climate Change (IPCC) Fifth Assessment Report (AR5) has a wide range of −0.30 to −0.03 W m−2 (1750–2010) (Boucher et al., 2013). Very few studies have assessed nitrate RF from aerosol–cloud interactions (RFaci) (e.g., Xu and Penner, 2012; Lu et al., 2021; Wu et al., 2022). Recent studies using the U.S. DOE's Energy Exascale Earth System Model version 2 (E3SMv2) and NCAR's Community Earth System Model version 2 (CESM2) estimated the RFaci of nitrate aerosol to be around −0.35 to −0.22 W m−2 (Lu et al., 2021; Wu et al., 2022). These estimates indicate a substantial impact of nitrate aerosol on the Earth's climate and a substantial contribution of nitrate aerosol to the total RF of aerosols.
One key challenge in simulating the life cycle of nitrate, especially the formation of nitrate aerosol, in GCMs and CTMs is accurately representing the mass size distribution of nitrate aerosol (i.e., the distribution of nitrate mass across the particle size range), which often receives less attention and lacks sufficient observational constraints. The dominant pathway of fine- and coarse-mode nitrate formation is different and regionally dependent. Fine-mode ammonium nitrate forms through the thermodynamic interactions between HNO3 and NH3 (excess after fully neutralizing sulfate) (e.g., Bassett and Seinfeld, 1983; Metzger et al., 2002). Coarse-mode nitrate forms mainly through heterogeneous reactions of nitrogen species such as HNO3 and N2O5 on the surface of coarse dust and sea salt particles (e.g., Karydis et al., 2016; Chen et al., 2020; Zhai et al., 2023). Fine-mode nitrate has a more pronounced effect on the CCN number concentration compared to coarse-mode nitrate, thereby significantly affecting RFaci. Bian et al. (2017) found that the coarse-mode fraction of nitrate aerosol from AeroCom phase III models ranges from 0 % to > 90 %. The large spread in modeled mass size distribution of nitrate aerosol can be related to aerosol-chemistry modules having various complexity adopted in GCMs and CTMs to treat nitrate formation as well as model uncertainties in simulating dust and sea salt. All nine AeroCom phase III models use thermodynamic equilibrium models (TEQMs), assuming instantaneous equilibrium between the gas and particle phases, to treat the gas–aerosol partitioning, whereas very few global modeling studies have directly simulated the dynamic gas–particle partitioning of HNO3 (e.g., Feng and Penner, 2007; Xu and Penner, 2012; Lu et al., 2021; Zaveri et al., 2021; Wu et al., 2022). Two of nine AeroCom models do not treat nitrate formation in the coarse mode. Only three models consider nitrate formation on both dust and sea salt particles and have adopted the first-order gas-to-particle approximation, instead of using only TEQMs in the coarse mode, to calculate the rates of heterogeneous reactions of HNO3 onto dust and sea salt particles.
In the past decades, there have only been a few regionally focused studies providing observational insights into the mass size distribution of nitrate aerosol, especially the significant contribution of coarse-mode nitrate. They have found large relative differences (up to 150 %) of nitrate concentrations at co-located desert and marine sites over the US between the Clean Air Status and Trends Network (CASTNET) and the Interagency Monitoring of Protected Visual Environments (IMPROVE) (Ames and Malm, 2001; Sickles and Shadwick, 2008), which suggest significant fractions of coarse-mode nitrate (PM> 2.5, particulate matter, PM, with diameter larger than 2.5 µm) related to heterogeneous reactions on dust and sea salt particles. Long-term measurements of the PM2.5 and PM10 (PM with diameter less than 2.5 and 10 µm, respectively) of nitrate surface concentrations at sites in Japan also show that PM2.5–10 (PM with diameter between 2.5 and 10 µm) nitrate accounts for ∼ 50 % to ∼ 80 % of all PM10 nitrate (Khan et al., 2010; Itahashi et al., 2016; Uno et al., 2017; Pan et al., 2018). The same studies also showed that while PM2.5 nitrate has a distinct winter-high–summer-low seasonal variation, the seasonal variation in PM2.5–10 nitrate is relatively flat. Furthermore, dust-induced PM2.5–10 nitrate mainly contributes to PM2.5–10 nitrate in spring, while sea-salt-induced PM2.5–10 nitrate dominates in other seasons. Although recent studies have attempted to compile surface observational data around the globe for both fine and coarse aerosols (e.g., Mahowald et al., 2025), there remains a lack of observational constraints on the mass size distribution of nitrate aerosol, especially from a global view.
Previous regional modeling studies have shown that including nitrate formation on coarse sea salt and dust particles through heterogeneous reactions can significantly shift the mass size distribution of nitrate aerosol (e.g., Chen et al., 2020; Zhai et al., 2023), as it competes for HNO3 with the formation of ammonium nitrate on fine particles. Chen et al. (2020) showed that heterogeneous reactions on sea salt shift the mass size distribution of nitrate from fine to coarse mode, compared with an experiment turning off sea salt emissions using WRF-Chem. The simulated mass size distribution of nitrate agrees well with measurements at Melpitz in Europe, where coarse-mode nitrate (PM> 1.2, PM with diameter larger than 1.2 µm) accounted for ∼ 20 % of total nitrate aerosol in marine air mass in September. Zhai et al. (2023), comparing simulated nitrate concentrations from GEOS-Chem with observations (PM1 and PM4, PM with diameter less than 1 and 4 µm, respectively) from the Korea-United States Air Quality (KORUS-AQ) campaign, found that including heterogeneous reactions on anthropogenic coarse particulate matter, mainly composed of anthropogenic dust, significantly reduces the overestimation of fine-mode nitrate in previous versions of GEOS-Chem.
Finally, only a few global modeling studies have evaluated the spatiotemporal distribution of fine-mode nitrate in GCMs against observations. There remains a lack of comprehensive analysis on the mass size distribution of nitrate aerosol (both fine- and coarse-mode nitrate) in GCMs. Mezuman et al. (2016) evaluated vertical profiles of PM1 nitrate simulated in the GISS model against measurements from 14 aircraft campaigns and found systematic underestimation of nitrate over the US and Europe. Bian et al. (2017) compared vertical profiles of fine-mode nitrate (PM with diameter less than 1 or 2.5 µm) simulated in AeroCom phase III models with measurements from the Arctic Research of the Composition of the Troposphere from Aircraft and Satellites (ARCTAS) campaign and found the models tend to underestimate fine-mode nitrate below 4 km. Some previous studies compared PM2.5 nitrate simulated in GCMs with IMPROVE observations over the US (e.g., Skeie et al., 2011; Bellouin et al., 2011; Hauglustaine et al., 2014; Zaveri et al., 2021; Lu et al., 2021). More recently, Tsimpidi et al. (2024) evaluated the simulated PM1 and PM2.5 nitrate surface concentrations in the EMAC model against PM1 data from field campaigns and PM2.5 data from regional networks, respectively, over the past 20 years. This comparison provides a robust basis for assessing model performance in capturing the long-term trends and variability of nitrate across key regions in the Northern Hemisphere.
The goal of this study is to evaluate the performance of E3SMv2, CESM2, and AeroCom phase III models in simulating (1) spatial distributions of fine-mode nitrate, (2) the mass size distribution of fine- and coarse-mode nitrate, and (3) gas–aerosol partitioning between HNO3 and nitrate with long-term ground-based observations and measurements from multiple aircraft campaigns. The paper is organized as follows. Section 2 introduces E3SMv2, CESM2, and AeroCom phase III models with a special focus on the treatment of nitrate formation and describes the model experiment design and observational data. Section 3 evaluates fine-mode nitrate (PM1 and PM2.5), the mass size distribution of nitrate (PM1 PM4 and PM2.5 PM10 ratios), and gas–aerosol partitioning between HNO3 and nitrate ()) from model simulations against long-term ground-based observations and measurements from several aircraft campaigns. A discussion and conclusions are presented in Sect. 4.
2.1 Model description
Among the eight models used in this study, six were included in the AeroCom phase III models that participated in previous intercomparisons relevant to nitrate aerosols (Bian et al., 2017). These AeroCom model experiments, conducted about 7 years ago, likely have outdated physical parameterizations and emissions of aerosol and gas species. E3SMv2 and CESM2 are relatively new models that were recently developed to include explicit treatment for nitrate aerosol, so these two models are described in more detail here.
2.1.1 E3SMv2
We use E3SMv2 (Golaz et al., 2022) with its atmosphere component (EAMv2) and land component (ELMv2). EAMv2 uses almost the same physical package as described in Rasch et al. (2019) and Xie et al. (2018). The Cloud Layers Unified by Binormals (CLUBB) scheme is used to treat boundary layer turbulence, shallow convection, and cloud macrophysics in a unified way (Golaz et al., 2002; Larson et al., 2017). Deep convection is parameterized by the scheme of Zhang and McFarlane (1995) (ZM scheme), with a dynamic convective available potential energy (dCAPE) trigger (Xie and Zhang, 2000) and an unrestricted air parcel launch level approach (Wang et al., 2015) as described in Xie et al. (2019). A two-moment cloud microphysics scheme (MG2; Gettelman and Morrison, 2015) is used for large-scale stratiform clouds. Wu et al. (2022) implemented the Model for Simulating Aerosol Interactions and Chemistry (MOSAIC) module (Zaveri et al., 2008) in E3SMv2 and coupled it with the Model for Ozone and Related chemical Tracers gas chemistry (MOZART-4) (Emmons et al., 2010; Tilmes et al., 2015) and an enhanced version of the four-mode version of Modal Aerosol Module (MAM4) (Liu et al., 2016; Wang et al., 2020) following previous model development effort in CESM2 (Lu et al., 2021; Zaveri et al., 2021). MOSAIC is a comprehensive aerosol chemistry module which simulates the dynamic partitioning between semivolatile gases and particles of different sizes in an accurate but computationally efficient way. MOSAIC implemented in EAMv2 replaces the default MAM4 treatment of gas–aerosol exchange between gases, including H2SO4, HNO3, NH3, HCl, and a single lumped secondary organic aerosol (SOA) precursor, and aerosols. The aqueous chemistry (i.e., occurring with cloud water) is also modified to include reactions of HNO3, NH3, and HCl. In MAM4, aerosol species are assumed to be internally mixed within modes and externally mixed among modes. Wu et al. (2022) added nitrate () and ammonium () aerosol to the Aitken, accumulation, and coarse modes of MAM4. MOSAIC explicitly and independently treats the heterogeneous reactions of HNO3 on particles containing dust (i.e., CaCO3) and/or sea salt (i.e., NaCl) in the Aitken, accumulation, and coarse modes. In EAMv2, calcium (Ca2+) and carbonate () aerosols were added in the accumulation and coarse modes with emitted dust mass fractions of 2 % and 3 %, respectively, for HNO3 reactions on dust following Zaveri et al. (2008). The remaining 95 % of the emitted dust in each mode is treated as other inorganic (OIN) matter in MOSAIC, which does not have chemical reactions with gas and aerosol species. Primary sea salt aerosol in the Aitken, accumulation, and coarse modes is split into three species: sodium (Na+), chloride (Cl−), and sea salt sulfate (), with emitted mass fractions of 38.5 %, 53.8 %, and 7.7 %, respectively (Pilson, 2012). We use accommodation coefficients for HNO3, NH3, and HCl of 0.193, 0.092, and 0.1, respectively, following Xu and Penner (2012). We ran E3SMv2 with the spectral-element dynamical core for EAMv2 at 100 km horizontal resolution on a cubed-sphere geometry with 72 vertical layers. Table 1 shows the configuration of gas and aerosol chemistry for nitrate formation in E3SMv2 and other GCMs evaluated in this study.
2.1.2 CESM2
We also use CESM2.0 (Danabasoglu et al., 2020) with the Community Atmosphere Model version 6 (CAM6) and the Community Land Model version 5 (CLM5; Lawrence et al., 2019) as the atmosphere and land components, respectively. CAM6 uses similar physical parameterizations to those in EAMv2 (i.e., CLUBB, MG2, ZM deep convection, and MAM4 aerosol module). Lu et al. (2021) implemented MOSAIC in CESM2 and coupled it with MOZART-TS1 gas chemistry (Emmons et al., 2020) and the MAM4 aerosol module (Liu et al., 2016) (Table 1). The aerosol speciation, including nitrate (NO), ammonium (), dust (i.e., Ca2+, , and OIN), and sea salt (i.e., Na+ and Cl−), in CAM6 MAM4 for coupling with MOSAIC is the same as in EAMv2 MAM4. Nitrate and ammonium aerosol are explicitly simulated in the Aitken, accumulation, and coarse modes. However, as shown in Table 1, the geometric standard deviations (σg) in the accumulation and coarse mode of MAM4 are different between CAM6 and EAMv2, which has significant impacts on the life cycle of dust through dry deposition (Wu et al., 2020). The upper and lower bounds of the number median diameter in the three modes are also different between CAM6 and EAMv2. As discussed in Wu et al. (2022), Lu et al. (2021) and Zaveri et al. (2021) used a lower accommodation coefficient for HNO3 (≤ 0.0011) in CESM–MOSAIC, which was measured for HNO3 condensing on pure dust particles and may substantially underestimate the production of nitrate aerosol associated with gas–aerosol partitioning. In this study, we use the same accommodation coefficients of HNO3, NH3, and HCl (0.193, 0.092, and 0.1, respectively) as in E3SMv2–MOSAIC. We ran CESM2.0 with the finite-volume dynamical core for CAM6 at 0.9° × 1.25° horizontal resolution with 56 vertical levels.
2.1.3 AeroCom phase III models
As shown in Table 1, we also include six AeroCom phase III models which simulate nitrate formation in both fine and coarse modes. Three of them (EMAC, OsloCTM2, and OsloCTM3) only use TEQMs for the formation of both fine- and coarse-mode nitrate. Dust (e.g., Ca, Mg, and K) and/or sea salt (e.g., Na and Cl) components are explicitly included in these TEQMs to account for heterogeneous reactions on dust and sea salt particles. Note that OsloCTM2 and OsloCTM3 only consider heterogeneous reactions on sea salt particles. Previous studies showed that supermicron (coarse) nitrate particles take significantly longer, ranging from several hours to days, to reach equilibrium between the gas (HNO3) and particle phases compared to submicron (fine) particles, which equilibrate within minutes (Meng and Seinfeld, 1996; Fridlind and Jacobson, 2000). This equilibrium timescale for supermicron particles exceeds the typical GCM time step, which is usually less than 1 h. TEQMs assume instantaneous equilibrium between gas and particle phases with each time step, which does not account for the kinetic limitation of coarse particles and therefore may lead to an overestimation of nitrate in the coarse mode. EMAC considers the kinetic limitations in large particles during the process of gas–aerosol partitioning, using only the quantity of the gas-phase species that is able to kinetically condense onto the aerosol phase within the model time step, assuming diffusion-limited condensation (Karydis et al., 2016). The other three models (EMEP, GMI, and INCA) adopt the first-order loss approximation to calculate nitrate formation in the fine and coarse mode related to heterogeneous reactions on both dust and sea salt particles but still use TEQMs to calculate gas–aerosol partitioning between sulfate, nitrate, ammonium, and gases. As mentioned in Feng and Penner (2007), this approach does not explicitly include the equilibrium vapor concentration of species on the particle surface as in the dynamic mass transfer approach, which depends on relative humidity, temperature, and aerosol chemical composition. Their results show that this hybrid approach produces more coarse-mode nitrate than the dynamical approach (similar to MOSAIC). Unlike the other AeroCom models, GMI reads in a global 3D HNO3 field archived from a previous GMI gas chemistry simulation to calculate nitrate formation. A scaling factor of 0.5 to this HNO3 field was applied to prevent the overestimation of nitrate aerosol based on a model–observation analysis of the GMI HNO3. AeroCom models have different treatments for the size distribution of nitrate, which affects the calculation of nitrate concentration at the cutoff size. All AeroCom models except EMEP have relatively coarse horizontal resolutions (2–3°) compared to E3SMv2 and CESM2.
Table 1Nitrate chemical mechanisms and physical properties.
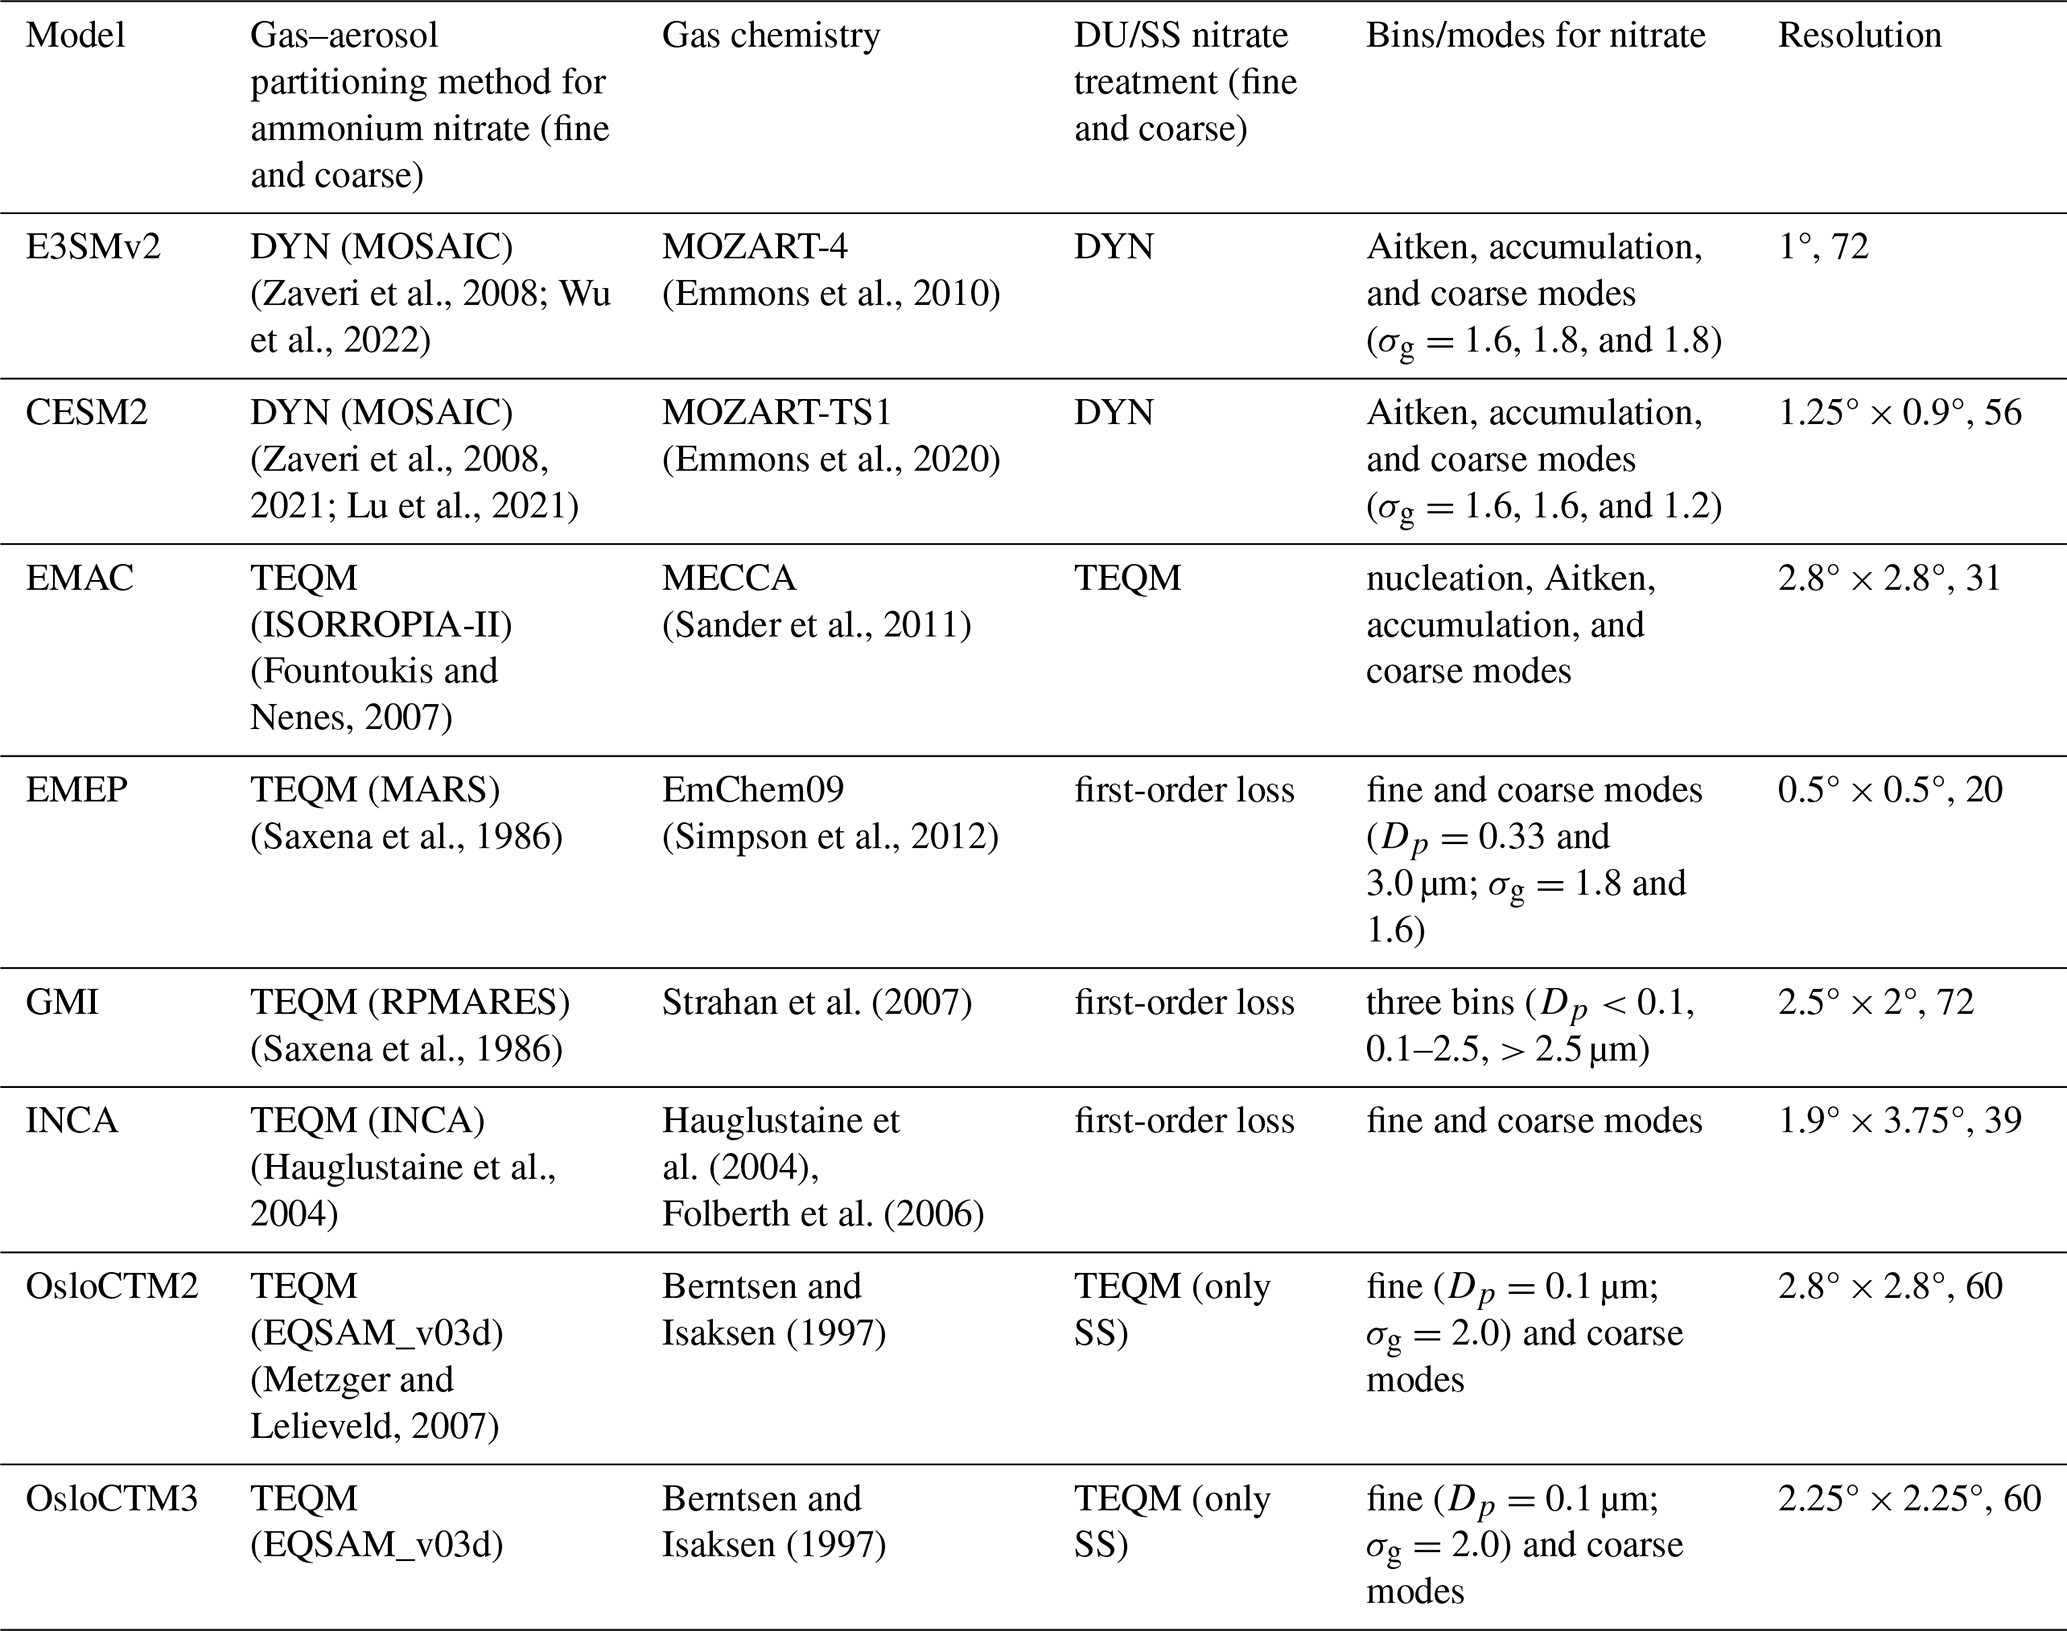
DYN: dynamic mass transfer; DU: dust; SS: sea salt.
2.2 Experiment design
We ran both E3SMv2 and CESM2.0 from 2004 to 2014 with a 1-year spin-up, and the results of the last 10 years are used for analysis. The horizontal wind components u and v were nudged towards the Modern-Era Retrospective analysis for Research and Applications Version 2 (MERRA-2; Gelaro et al., 2017) using a relaxation timescale of 6 h. Monthly mean prescribed historical sea surface temperature (SST) and sea ice in 2004–2014 from the Hadley Centre Global Sea Ice and Sea Surface Temperature (HadISST) dataset were used. Among the AeroCom models used in this study, CTMs (i.e., EMEP, GMI, OsloCTM2, and OsloCTM3) were directly driven by reanalysis data, while GCMs (i.e., EMAC and INCA) were nudged towards reanalysis meteorological data. Both sets of AeroCom models were run for 2008 following a 1-year spin-up. In this study, both E3SMv2 and CESM2 use monthly anthropogenic and biomass burning emissions of aerosol and precursor gases specified for the Coupled Model Intercomparison Project phase 6 (CMIP6) (Hoesly et al., 2018; van Marle et al., 2017), except for SOA precursors in E3SMv2 that were rescaled from GCM simulation results, as justified in Wang et al. (2020). AeroCom models followed the nitrate experiment protocol (Bian et al., 2017) using monthly anthropogenic emissions of aerosol and precursor gases from the Hemispheric Transport of Air Pollution (HTAP) v2.2 database (Janssens-Maenhout et al., 2015). Emissions of some volatile organic compound (VOC) gas species not provided by HTAP v2.2 were obtained from CMIP5 RCP8.5. Biomass burning emissions were from the Global Fire Emissions Database version 3 (GFED3) (van der Werf et al., 2010).
2.3 Observations
Table 2 summarizes the ground-based observations used in this study, and Fig. 1 shows the geographic locations of these observational sites. To evaluate simulated PM2.5 nitrate surface concentrations (nitrate component of PM2.5 concentration), surface nitrate PM2.5 PM10 ratios (ratio of PM2.5 nitrate to PM10 nitrate), and surface molar ratios of particulate nitrate to total nitrate (, we use ground-based observations from IMPROVE (Malm et al., 1994) and CASTNET over the US (Fig. 1a), the European Monitoring and Evaluation Programme (EMEP) over Europe (Fig. 1b), and the Acid Deposition Monitoring Network in East Asia (EANET) over East Asia (Fig. 1c). We also use measurements of PM2.5 and PM10 nitrate surface concentrations at Japanese sites (Fig. 1c) and South African sites (Fig. 1d), obtained from the literature (see Table 2), and measurements of PM2.5 nitrate surface concentrations from the Australian Nuclear Science and Technology Organization (ANSTO) Aerosol Sampling Program (ASP) over Australia (Fig. 1e).
There are important differences between PM2.5 and PM10 or total PM (TPM) sampling protocols from those networks and the literature, which may make the comparison with model results challenging. We use data from 31 pairs of co-located CASTNET and IMPROVE sites that are separated by less than 0.05° in latitude and longitude for the comparison of the surface nitrate PM2.5 PM10 ratio. Here we briefly discuss the differences between CASTNET and IMPROVE sampling protocols and their impacts on biases in estimating PM2.5 PM10 ratios, as examined by previous studies (Ames and Malm, 2001; Sickles and Shadwick, 2008). 24 h samples of PM2.5 nitrate and sulfate are collected on a nylon filter twice a week by the IMPROVE Module B sampler with a 2.5 µm cyclone. A carbonate-coated denuder is used, prior to the nylon filter, to remove HNO3. TPM nitrate and sulfate are collected on a Teflon filter weekly by the CASTNET filter pack sampler with a non-size-selective inlet. PM2.5 nitrate measured at the IMPROVE sites using nylon substrate would be overestimated compared with reality if HNO3 were not efficiently removed in the denuder. TPM nitrate measured at CASTNET sites using Teflon substrate may be underestimated compared with reality due to the volatilization of ammonium nitrate (Hering and Cass, 1999; Ames and Malm, 2001). EMEP sites have various sampling frequencies for PM2.5 nitrate, namely hourly; daily; every 3, 4, or 6 d; and weekly. The sampling frequencies for PM2.5 nitrate are also different from those for PM10 nitrate, mostly daily, at most EMEP sites. PM2.5 and PM10 nitrate measured at the four Japanese were collected with various sampling frequencies from hourly to twice a week. PM2.5 and PM10 nitrate reported from Maritz (2019) at four South African sites were collected monthly during 2009–2015. In our analysis, we set surface nitrate PM2.5 PM10 ratios to 1 if the measured PM2.5 is larger than the measured PM10 (or TPM) after averaging the data.
Table 2Summary of the surface observational data used in this study. Abbreviations: CSN, CASTNET; IMP, IMPROVE.
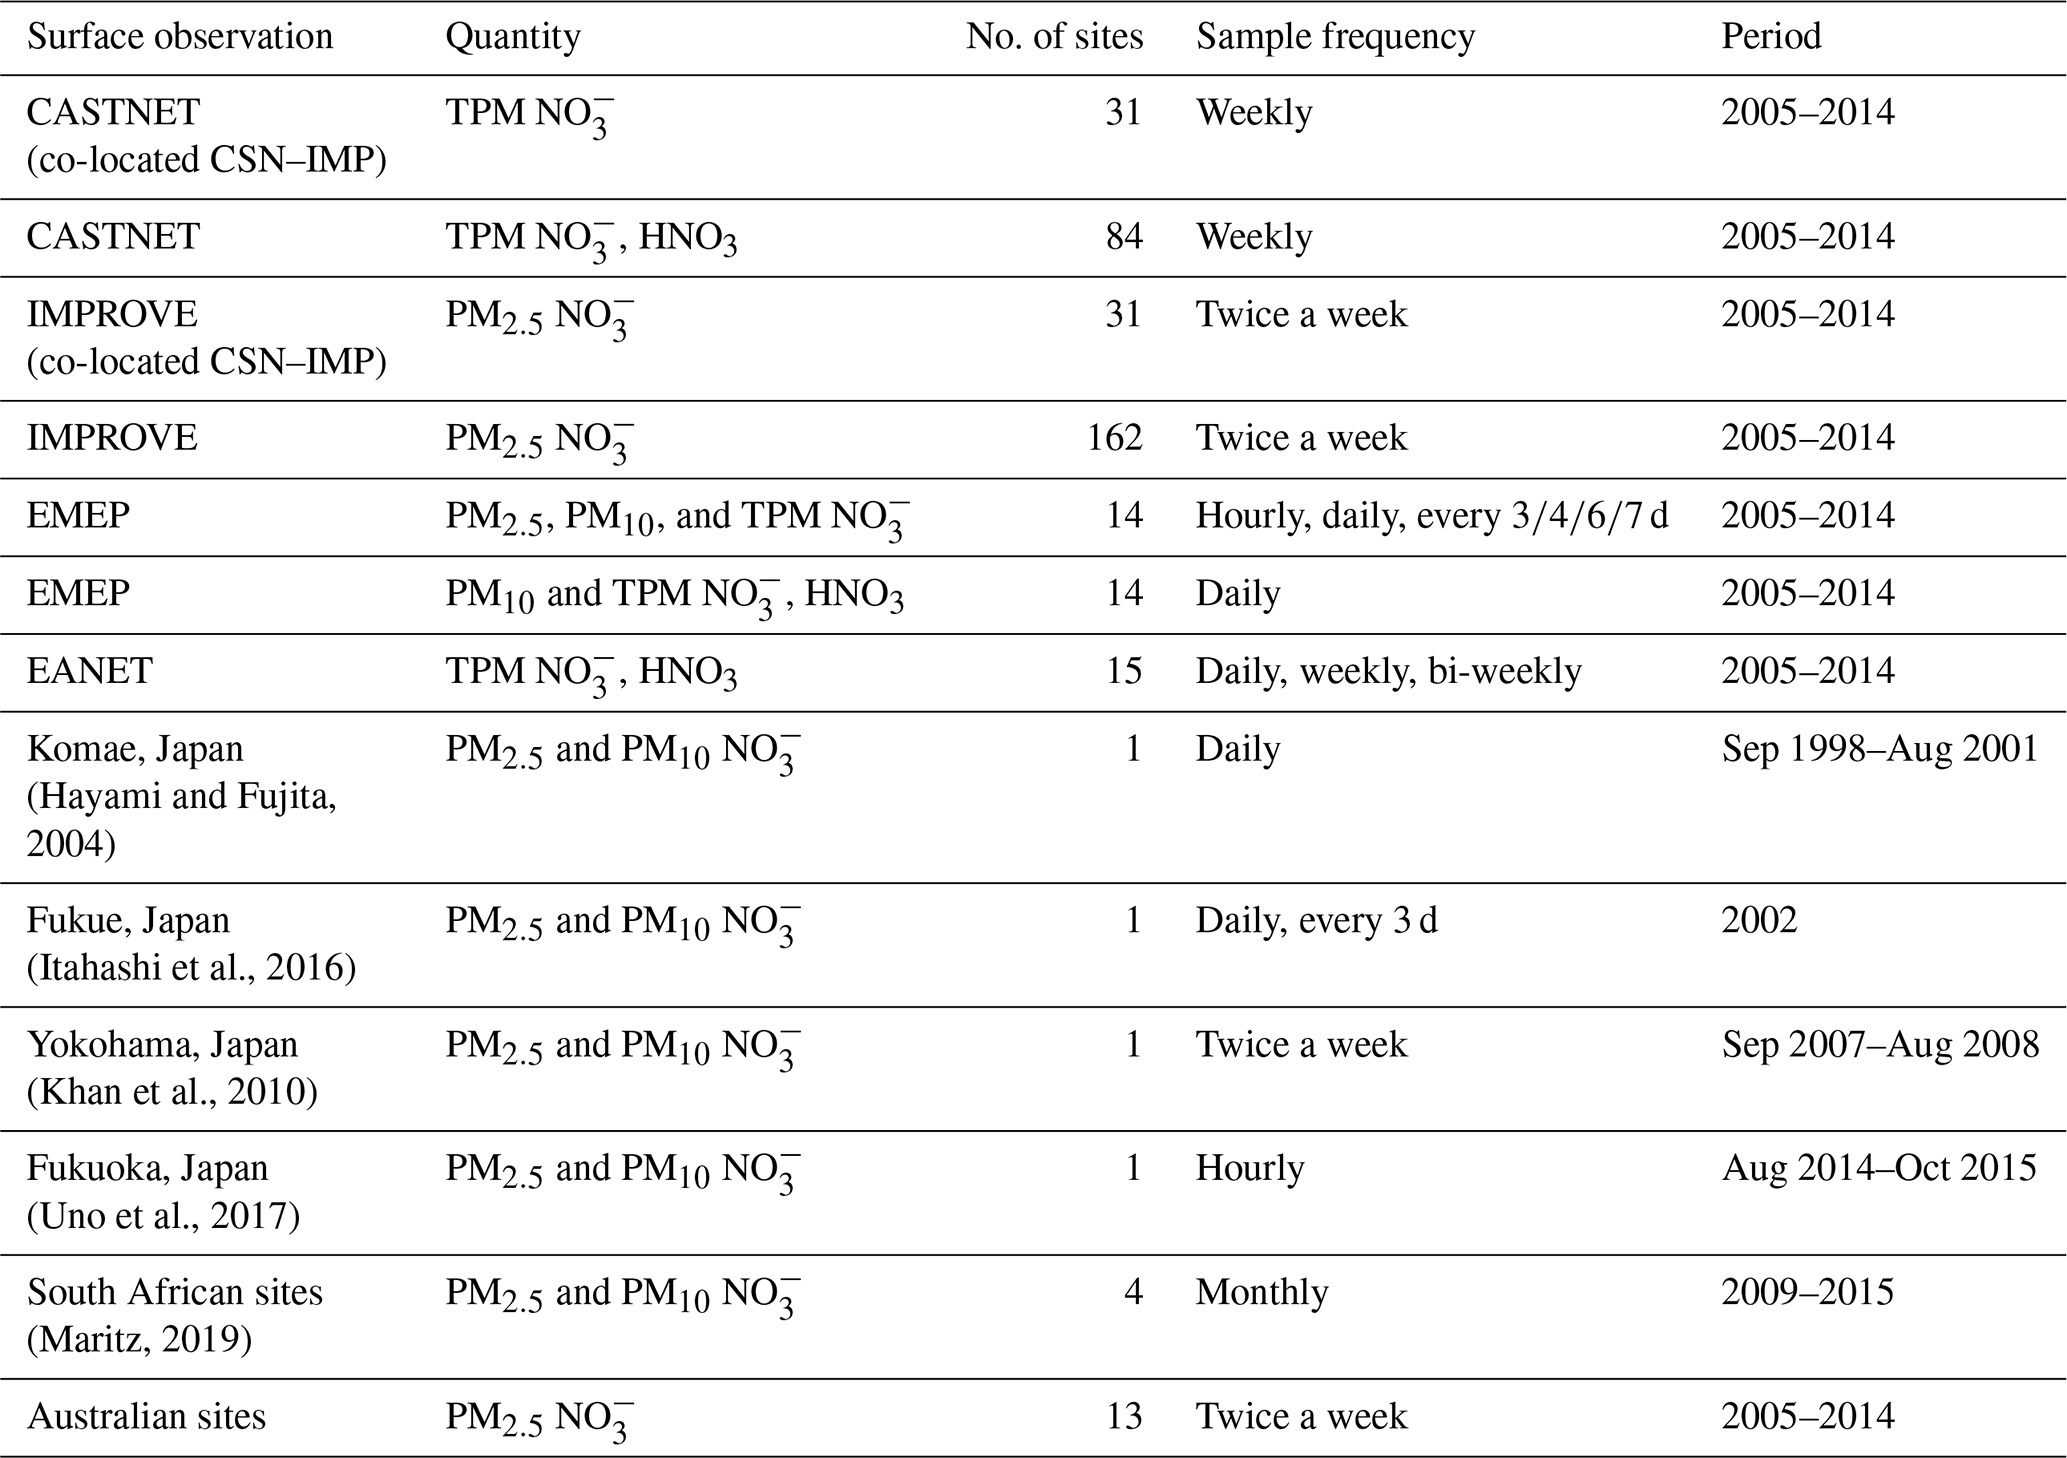
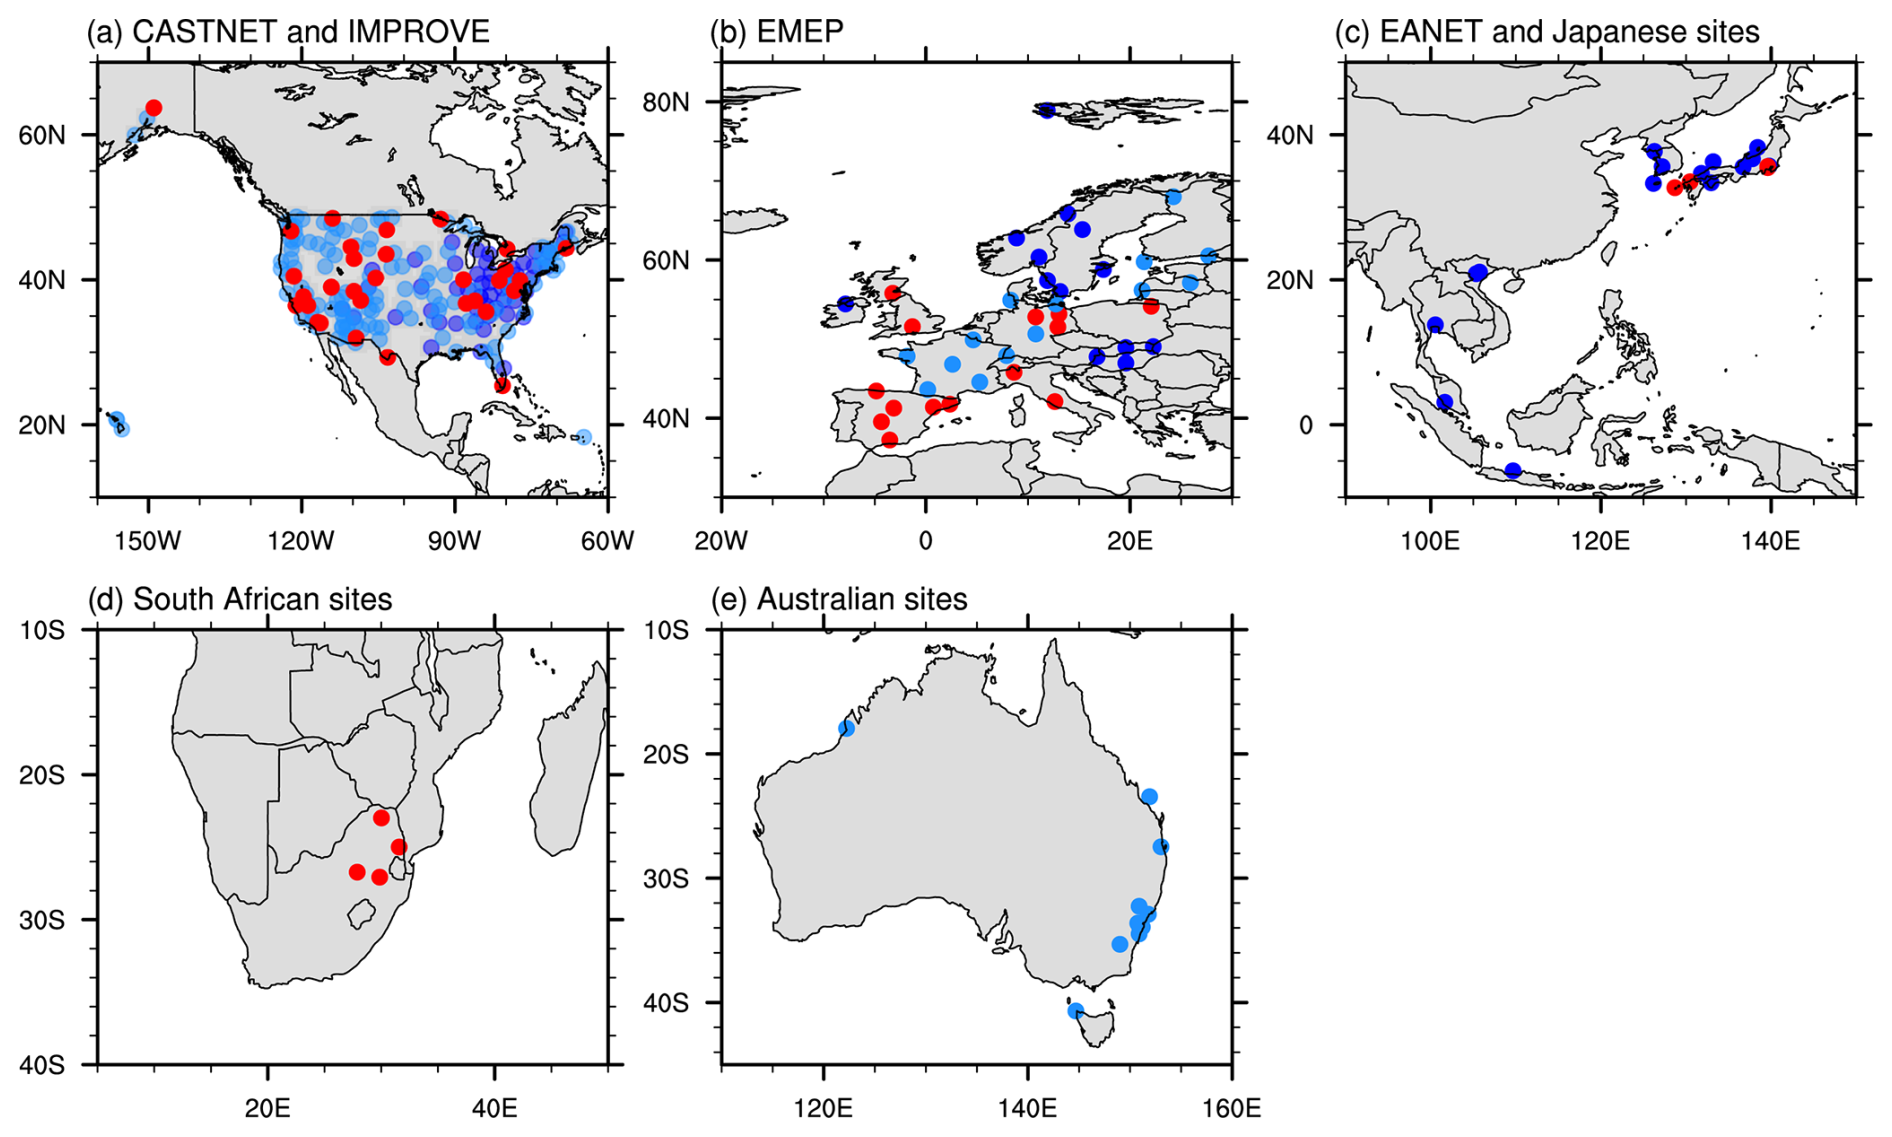
Figure 1Illustration of (a) co-located IMPROVE–CASTNET sites (red dots) measuring both PM2.5 and TPM nitrate, CASTNET sites (blue dots) measuring both HNO3 and TPM nitrate, and IMPROVE sites (light blue dots) measuring PM2.5 nitrate; (b) EMEP sites measuring both PM2.5 and PM10 nitrate (red dots), EMEP sites measuring both HNO3 and TPM nitrate (blue dots), and EMEP sites measuring PM2.5 nitrate (light blue dots); (c) Japanese sites (red dots) measuring both PM2.5 and PM10 nitrate and EANET sites (blue dots) measuring both HNO3 and TPM nitrate (blue dots); (d) South African sites (red dots) measuring both PM2.5 and PM10 nitrate; and (e) ANSTO ASP sites (light blue dots) measuring PM2.5 nitrate.
Unlike ground-based observations, only PM1 and PM4 nitrate are measured in aircraft campaigns. In this study, we also compare modeled vertical profiles of fine-mode nitrate aerosol and the nitrate PM1 PM4 ratio with measurements of PM1 nitrate from the aerosol mass spectrometer (AMS) and measurements of PM4 nitrate from the soluble acidic gases and aerosol (SAGA) filters during aircraft campaigns, including ARCTAS (Jacob et al., 2010); the Deep Convective Clouds and Chemistry (DC3) (Barth et al., 2015); the Studies of Emissions and Atmospheric Composition, Clouds, and Climate Coupling by Regional Surveys (SEAC4RS) (Toon et al., 2016); the Wintertime Investigation of Transport, Emissions, and Reactivity (WINTER); the Korea-United States Air Quality (KORUS-AQ) (Crawford et al., 2021); and the Atmospheric Tomography Mission (ATom) (Thompson et al., 2022). Figure 2 shows the flight tracks from those campaigns. We use the corresponding monthly mean model results for the aircraft campaigns operated during the simulation period. Note that all aircraft campaigns except for ARCTAS are outside the model simulation year (2008) of AeroCom phase III models. For comparisons with WINTER, KORUS-AQ, and ATom campaigns that are not within the simulation period (2005–2014) of E3SMv2 and CESM2, we use the 10-year average of the corresponding month from the two models. The model biases in the fine-mode nitrate and nitrate PM1 PM4 ratio, when compared to aircraft measurements, should be interpreted with caution due to discrepancies, particularly in the anthropogenic, biomass burning, and dust aerosol emissions, between the simulation period and the observation period. Those differences in emissions may have stronger impact on the simulated mass size distribution of nitrate in the middle to upper troposphere than in the lower troposphere over remote oceans (e.g., ATom), as sea salt is dominant in the marine boundary layer and fine sulfate or carbonaceous aerosols and coarse dust aerosols are dominant in the middle to upper troposphere (Thompson et al., 2022). Model results are interpolated along the flight tracks based on monthly mean output. We divide ATom observations and model results into eight sectors. Two cutoff sizes, dp=1 µm and dp=4 µm, are applied to modeled profiles of aerosols from E3SMv2, CESM2, and EMEP for comparison with measurements from AMS and SAGA filters (Guo et al., 2021; McNaughton et al., 2007), respectively. We set nitrate PM1 PM4 ratios to 1 if measured values from AMS are larger than those from SAGA filters after averaging the data. Due to data availability, we use fine-mode nitrate reported by OsloCTM2 and OlsoCTM3, PM2.5 nitrate reported by EMAC and INCA, and PM1 nitrate reported by GMI and EMEP in the comparison with AMS measurements from aircraft field campaigns.
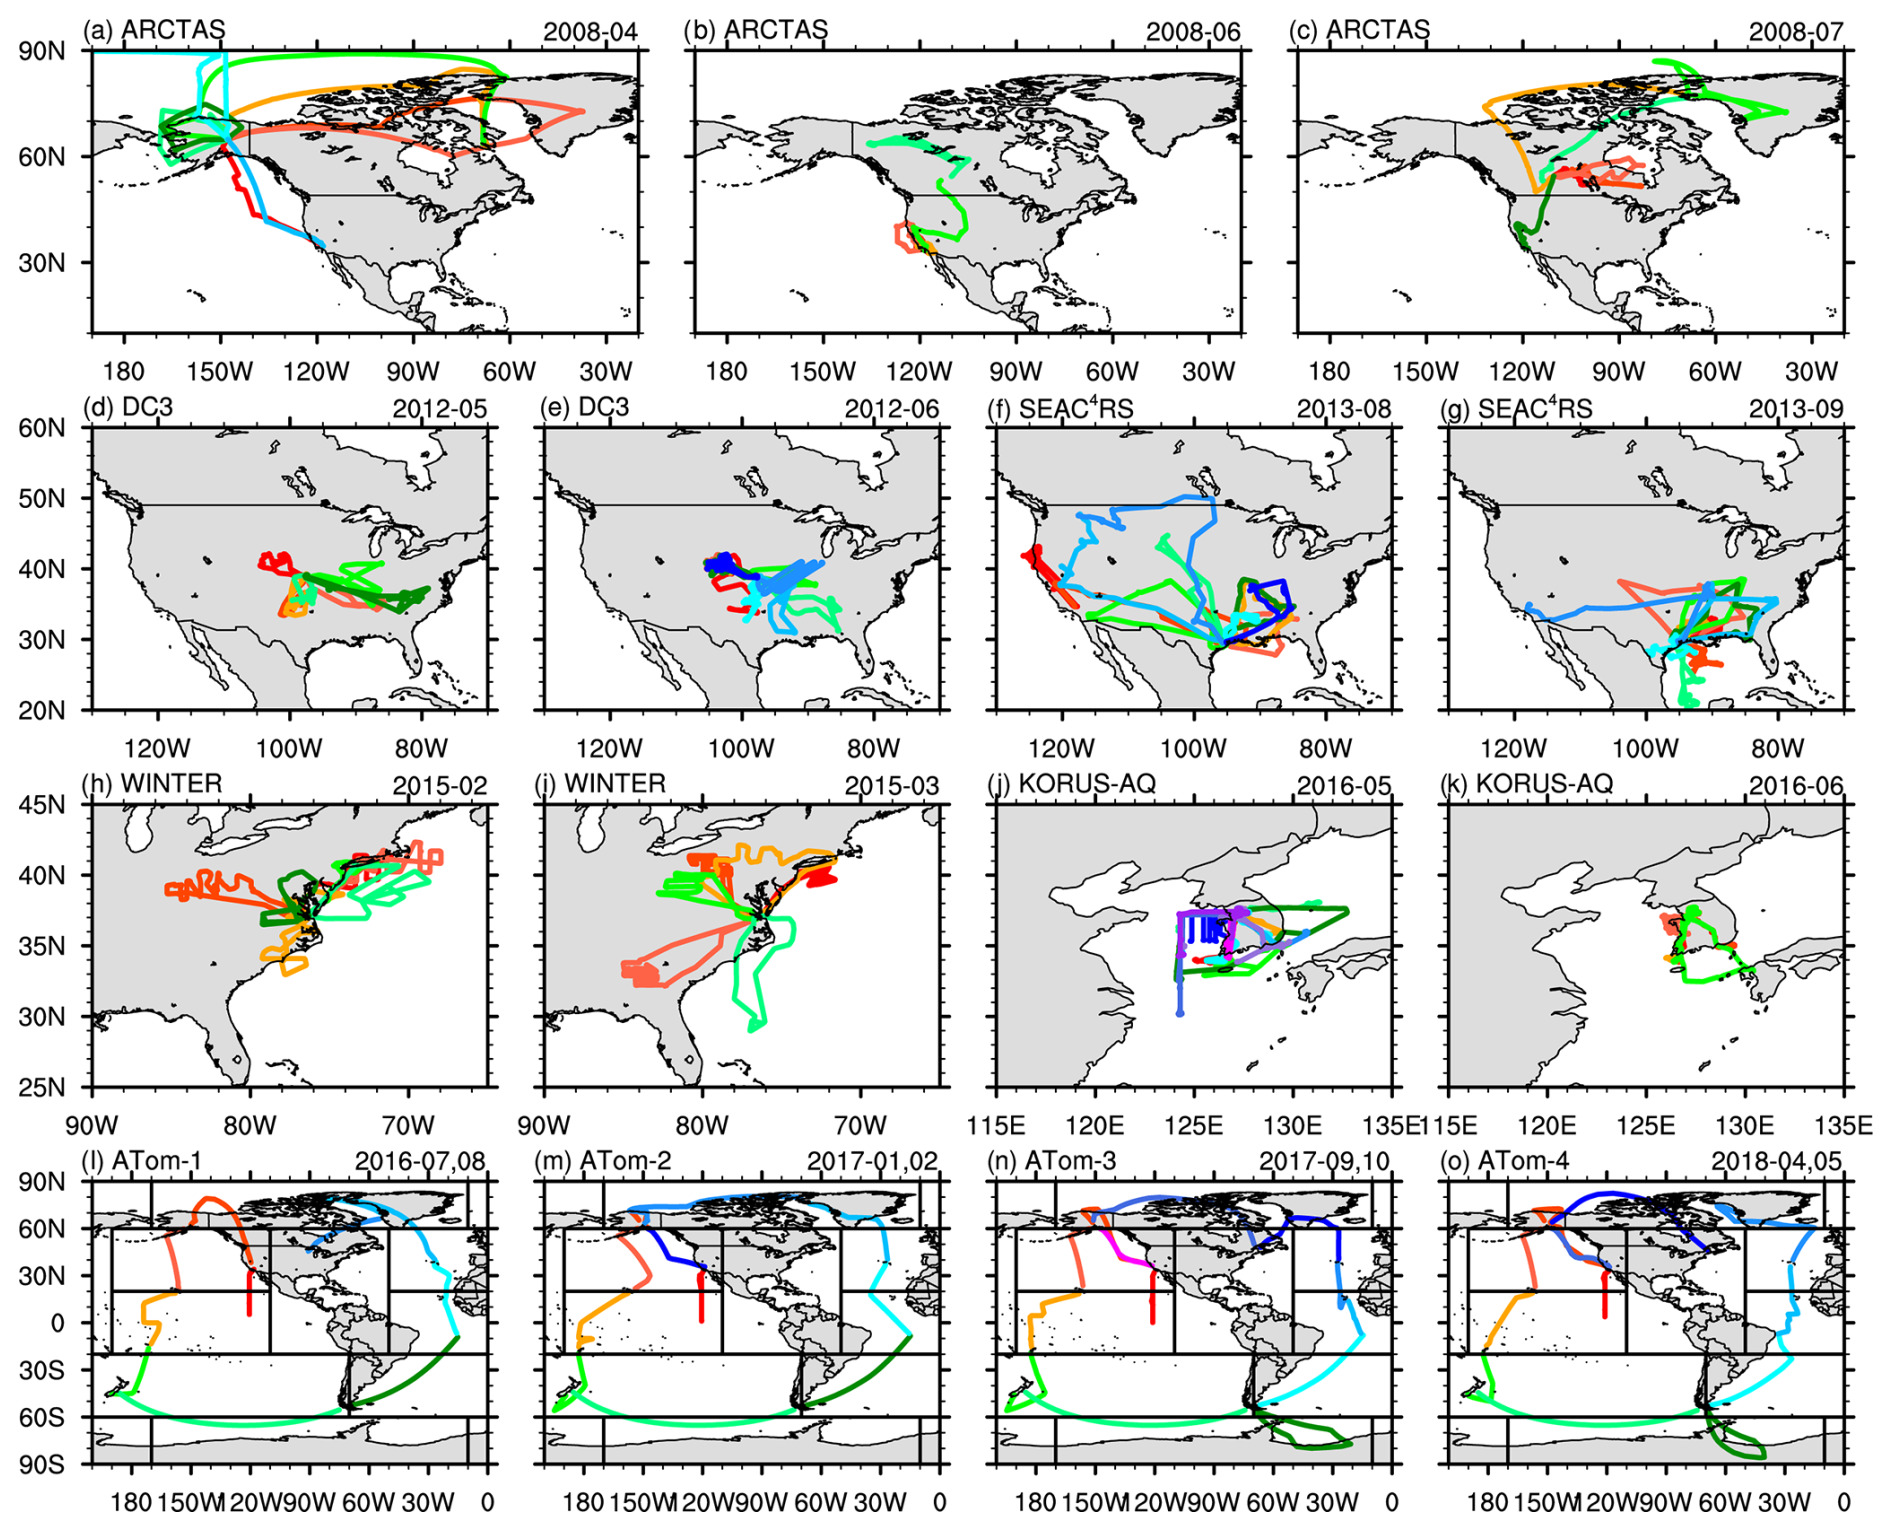
Figure 2Flight tracks of the ARCTAS, DC3, SEAC4RS, WINTER, KORUS-AQ, and ATom campaigns. Different colors in each panel represent different flight days during the month(s) noted at the upper-right corner. Black boxes in the bottom-row panels mark the regions used for the average of observations and model results along ATom flight tracks. The latitudes and longitudes of these regions are (60–90° N, 170–10° W), (20–60° N, 170° E–110° W), (20–60° N, 50° W–0°), (20° S–20° N, 170° E–110° W), (20° S–20° N, 50° W–0°), (60–20° S, 160° E–70° W), (60–20° S, 70° W–0°), and (60–90° S, 170–10° W).
As shown in Table 3, there is a large spread in the modeled global annual mean PM2.5 PM10 nitrate burden ratios from E3SMv2, CESM2, and AeroCom phase III models, ranging from 0.03 (OsloCTM3) to 0.58 (INCA). The PM2.5 PM10 nitrate burden ratios from OlsoCTM2 and OsloCTM3 are lower than those from all other models, likely because the two models use only TEQMs for the formation of coarse-mode nitrate on sea salt particles. E3SMv2 has a notably larger PM2.5 PM10 nitrate burden ratio than CESM2, although both models use MOSAIC for gas–aerosol partitioning. This is partially because CESM2 has a larger sea salt burden and longer lifetime for sea salt and dust (Table S1 in the Supplement). There is a large spread in the modeled global annual mean emission and burden of dust and sea salt (see Table S1), which can contribute to the large spread in the modeled PM2.5 PM10 nitrate burden ratio. There is also a large spread in the modeled global annual mean tropospheric burden ratio, ranging from 0.13 (GMI) to 0.59 (EMEP). We can see that a relatively high or low HNO3 tropospheric burden does not always correlate with a high or low nitrate burden in the models, such as GMI and EMAC. The global annual mean tropospheric burden ratio for GMI would be even lower, considering that GMI scales a global 3D HNO3 field from previous gas chemistry simulation by 0.5 to calculate nitrate formation. We also notice that models with relatively low PM2.5 PM10 nitrate burden ratios tend to have relatively high tropospheric burden ratios.
Table 3Global annual mean of the PM2.5 nitrate burden, total nitrate burden, PM2.5 PM10 nitrate burden ratio, tropospheric HNO3 burden (below 100 hPa), and molar ratio of the tropospheric particulate nitrate burden.
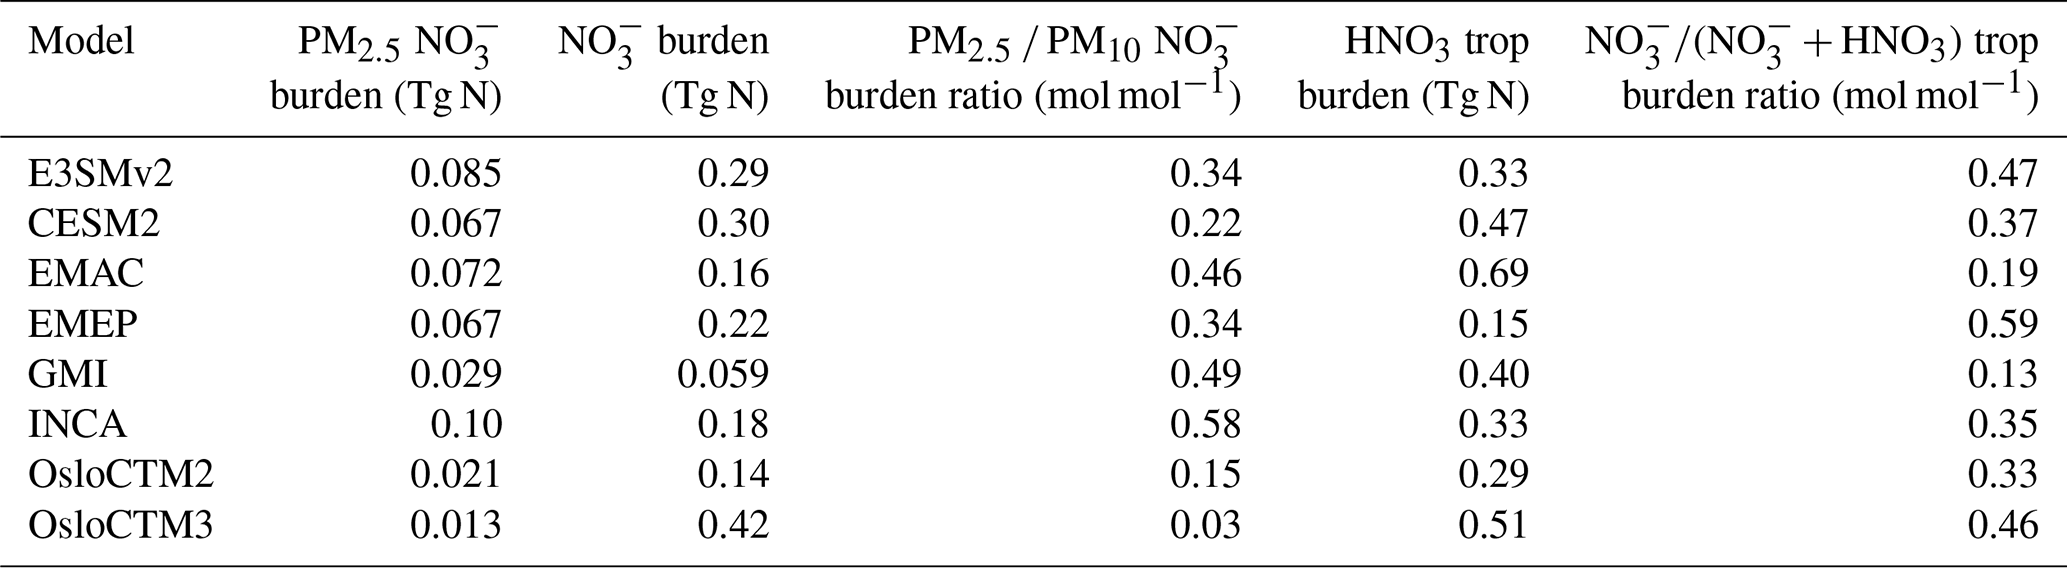
The E3SMv2 and CESM2 simulation period is 2005–2014, while the simulation period for AeroCom models is 2008.
3.1 Surface concentrations and vertical profiles of fine-mode nitrate
We first evaluate the modeled PM2.5 nitrate surface concentrations from E3SMv2, CESM2, and AeroCom phase III models against ground-based observations from IMPROVE over the US, EMEP over Europe, the South African sites, and ANSTO ASP sites over Australia (Fig. 3). In general, both E3SMv2 and CESM2 overestimate the annual mean PM2.5 nitrate surface concentration averaged across all sites, while all AeroCom models underestimate the fine-mode nitrate. The high model biases of PM2.5 nitrate surface concentration in E3SMv2, CESM2, and EMAC at IMPROVE sites are consistent with their high model biases of total nitrate aerosol reported in previous studies (Bian et al., 2017; Zaveri et al., 2021; Lu et al., 2021; Wu et al., 2022), which is due to the positive model bias of HNO3. GMI, OsloCTM2, and OsloCTM3 exhibit low model biases for PM2.5 nitrate at IMPROVE sites but show high model biases for total nitrate aerosol at CASTNET sites, as reported in Bian et al. (2017). The three models have much larger negative biases in PM2.5 nitrate than in total nitrate aerosol at EMEP sites, as reported in Bian et al. (2017). All models significantly underestimate PM2.5 nitrate at the Australian sites except for CESM2. Wu et al. (2020) showed that CESM2 significantly overestimates dust optical depth and extinction profiles over Australia due to an overestimation of the local dust emission. CESM2 reduces the geometric standard deviations of the particle size distribution in the MAM4 accumulation and coarse modes compared to those in E3SMv2, which reduces the dry deposition of dust and sea salt and, consequently, affects their life cycle. These changes inadvertently increase the nitrate formation and result in the good agreement of PM2.5 nitrate over Australia.
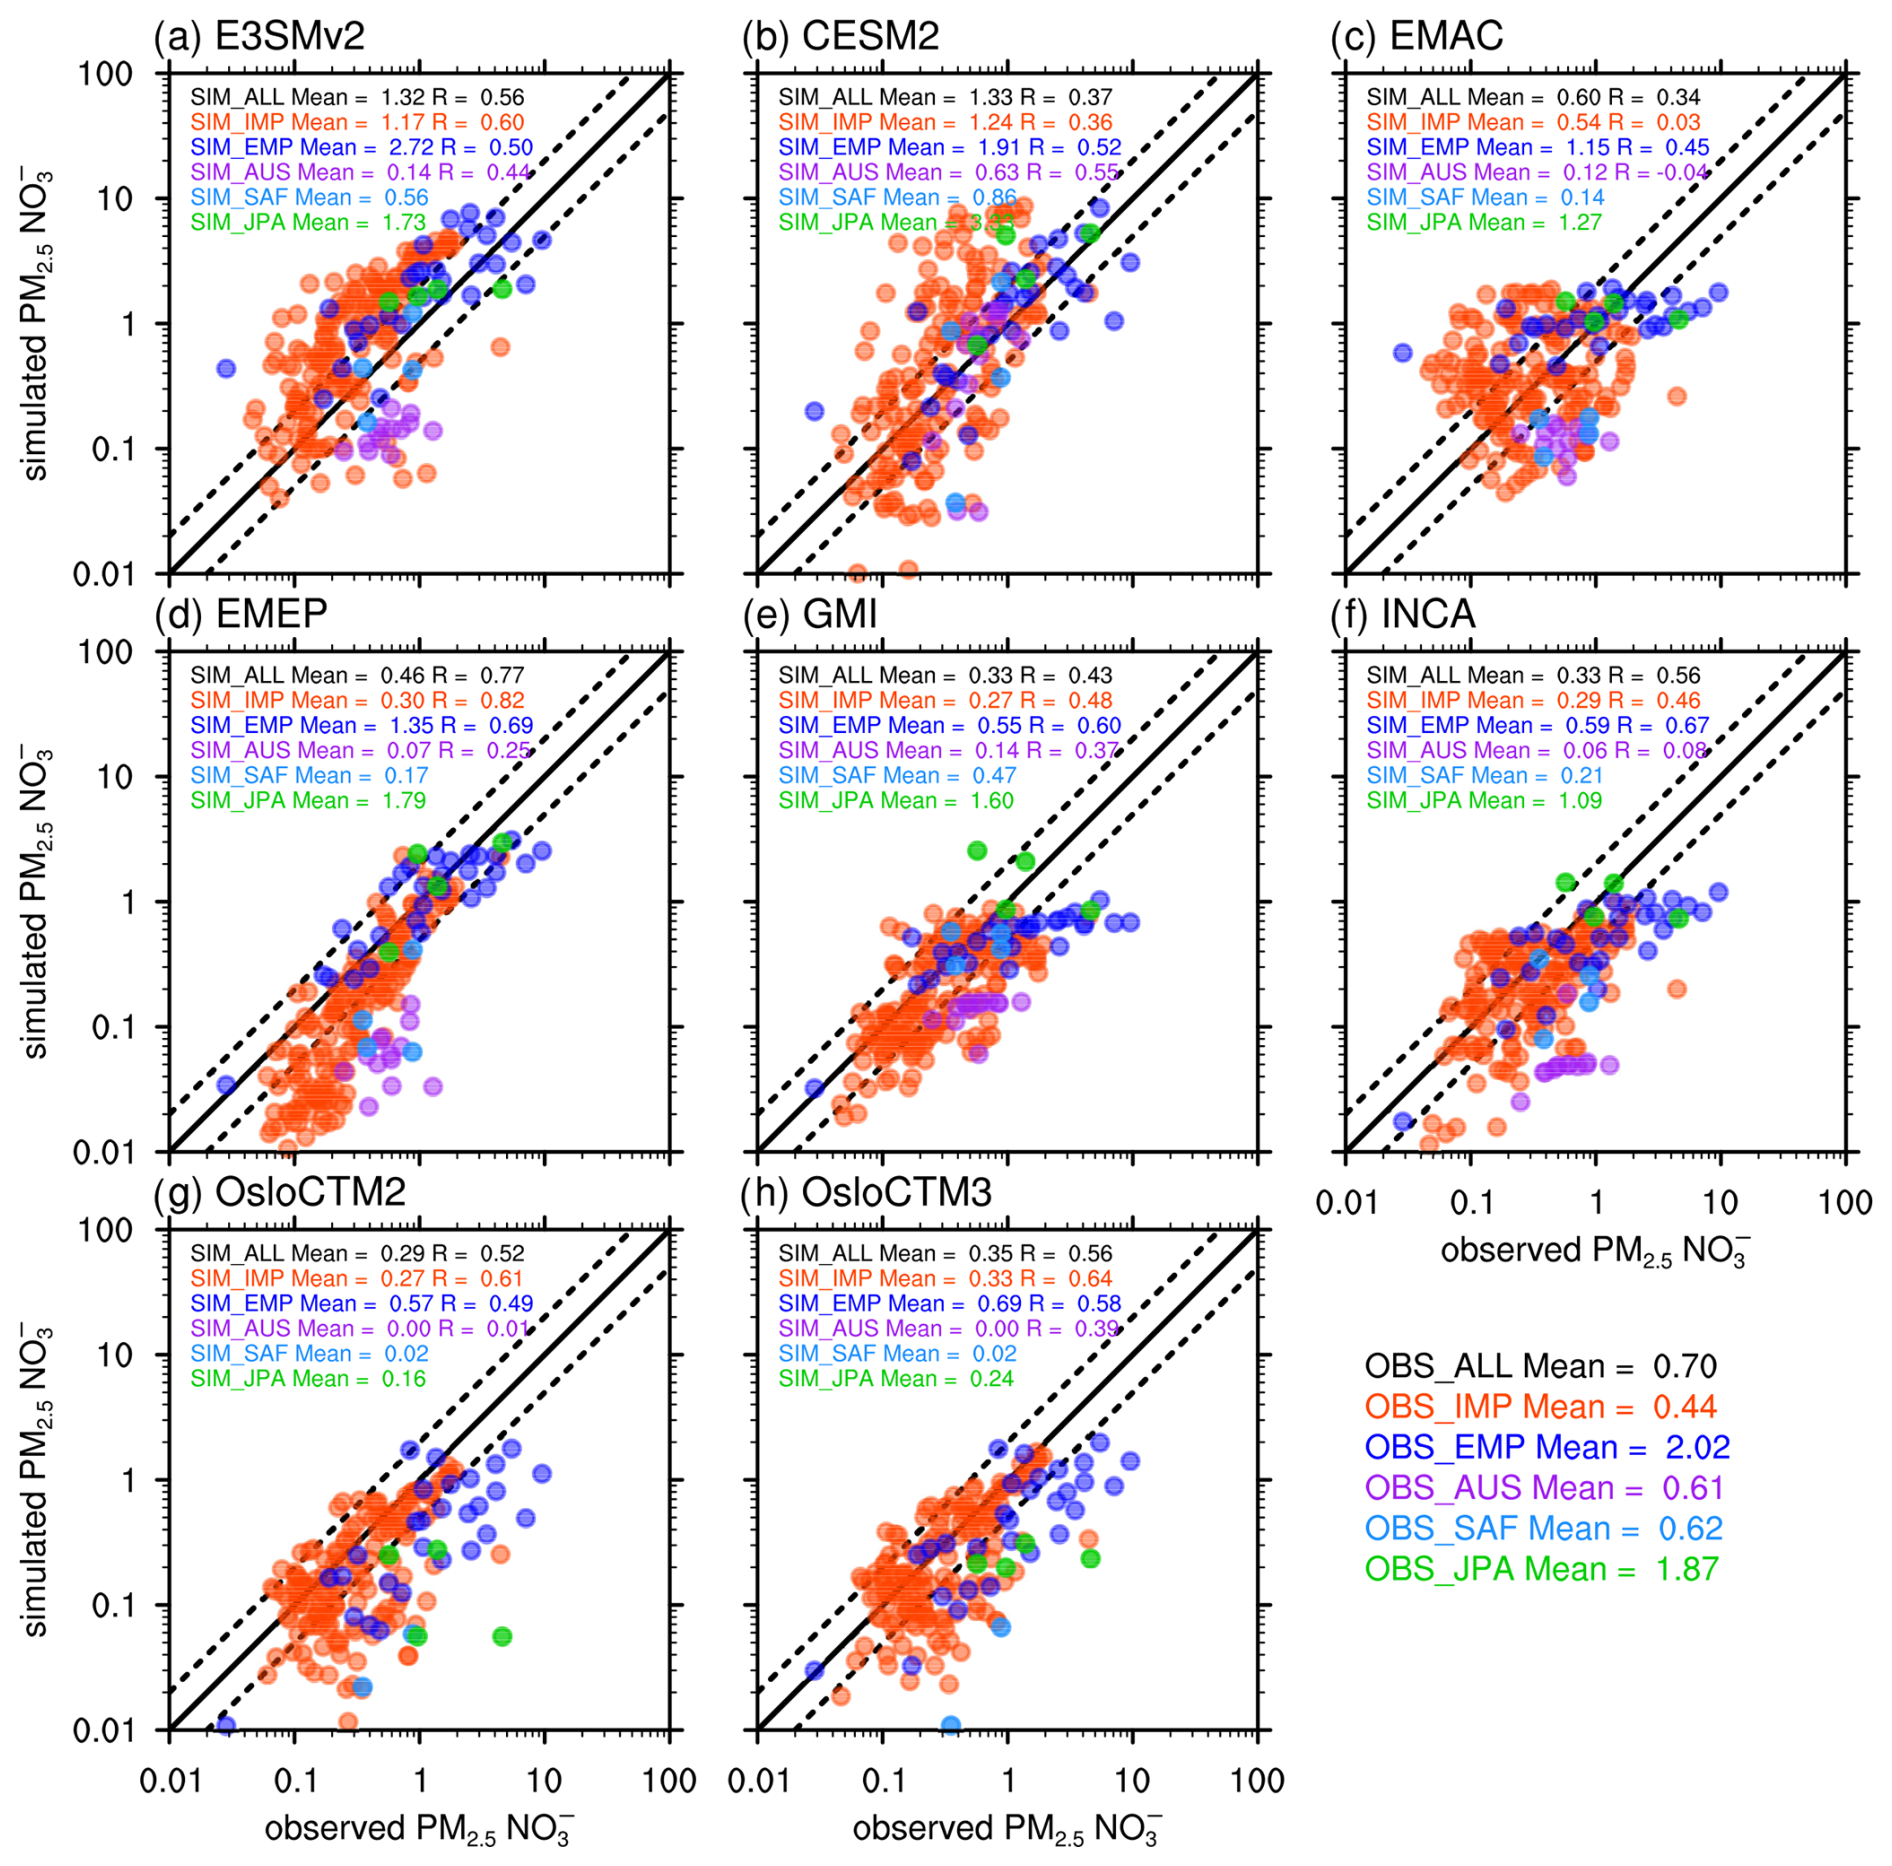
Figure 3Scatterplots of modeled annual mean PM2.5 nitrate surface concentrations (µg m−3) compared to observations from IMPROVE (IMP, red dots), EMEP (EMP, deep blue dots), the South African sites (SAF, light blue dots), the Australian sites (AUS, purple dots), and the Japanese sites (JPA, light green dots). Model names are noted at the top of individual panels. The numbers in each panel are mean concentrations and correlation coefficients at the corresponding sites (colors). Solid lines represent the 1:1 comparison. Dashed lines represent a factor-of-2 bias.
Figure 4 compares the modeled vertical profiles of fine-mode nitrate from E3SMv2, CESM2, and AeroCom phase III models with AMS measurements (PM1) from the ARCTAS, DC3, SEAC4RS, WINTER, and KORUS-AQ campaigns. KORUS-AQ has the highest observed PM1 nitrate concentrations (1 to 10 µg m−3) among all campaigns in the lower troposphere (below 800 hPa), as it was operated in South Korea and adjacent oceanic regions where nitrate concentrations are generally high. PM1 nitrate was found to be relatively high (larger than 10 µg m−3) below 1.5 km during the transport period (25–31 May), when there was significant haze development, and during an atmospheric blocking pattern period (1–7 June) compared to at other times in May (Park et al., 2021). WINTER, DC3, and SEAC4RS were all operated in the US and adjacent oceanic regions. We can see that WINTER has higher observed PM1 nitrate concentrations than DC3 and SEAC4RS in the lower troposphere, as it was operated in February and March when nitrate surface concentrations were seasonally high. The observed large spike of PM1 nitrate around 600 hPa during SEAC4RS in Fig. 4f was mostly caused by wildfires in the western US (Toon et al., 2016). The observed PM1 nitrate from WINTER strongly decreases from the surface to 600 hPa, which is quite different from the vertical variations in the other two campaigns. The observed spikes at 600 hPa in Fig. 4a and at 900 hPa in Fig. 4c may be caused by fire plumes from Siberia, California, and Saskatchewan (Jacob et al., 2010). In general, there are large spreads in the modeled fine-mode nitrate concentrations, which can span 3 orders of magnitude in some cases. Most AeroCom models underestimate PM1 nitrate concentrations below 600 hPa in ARCTAS, DC3, SEAC4RS, and KORUS-AQ, which were operated between April and September. OsloCTM2 and OsloCTM3 have much lower fine-mode nitrate concentrations and quite different vertical variations in fine-mode nitrate compared to other models and observations.
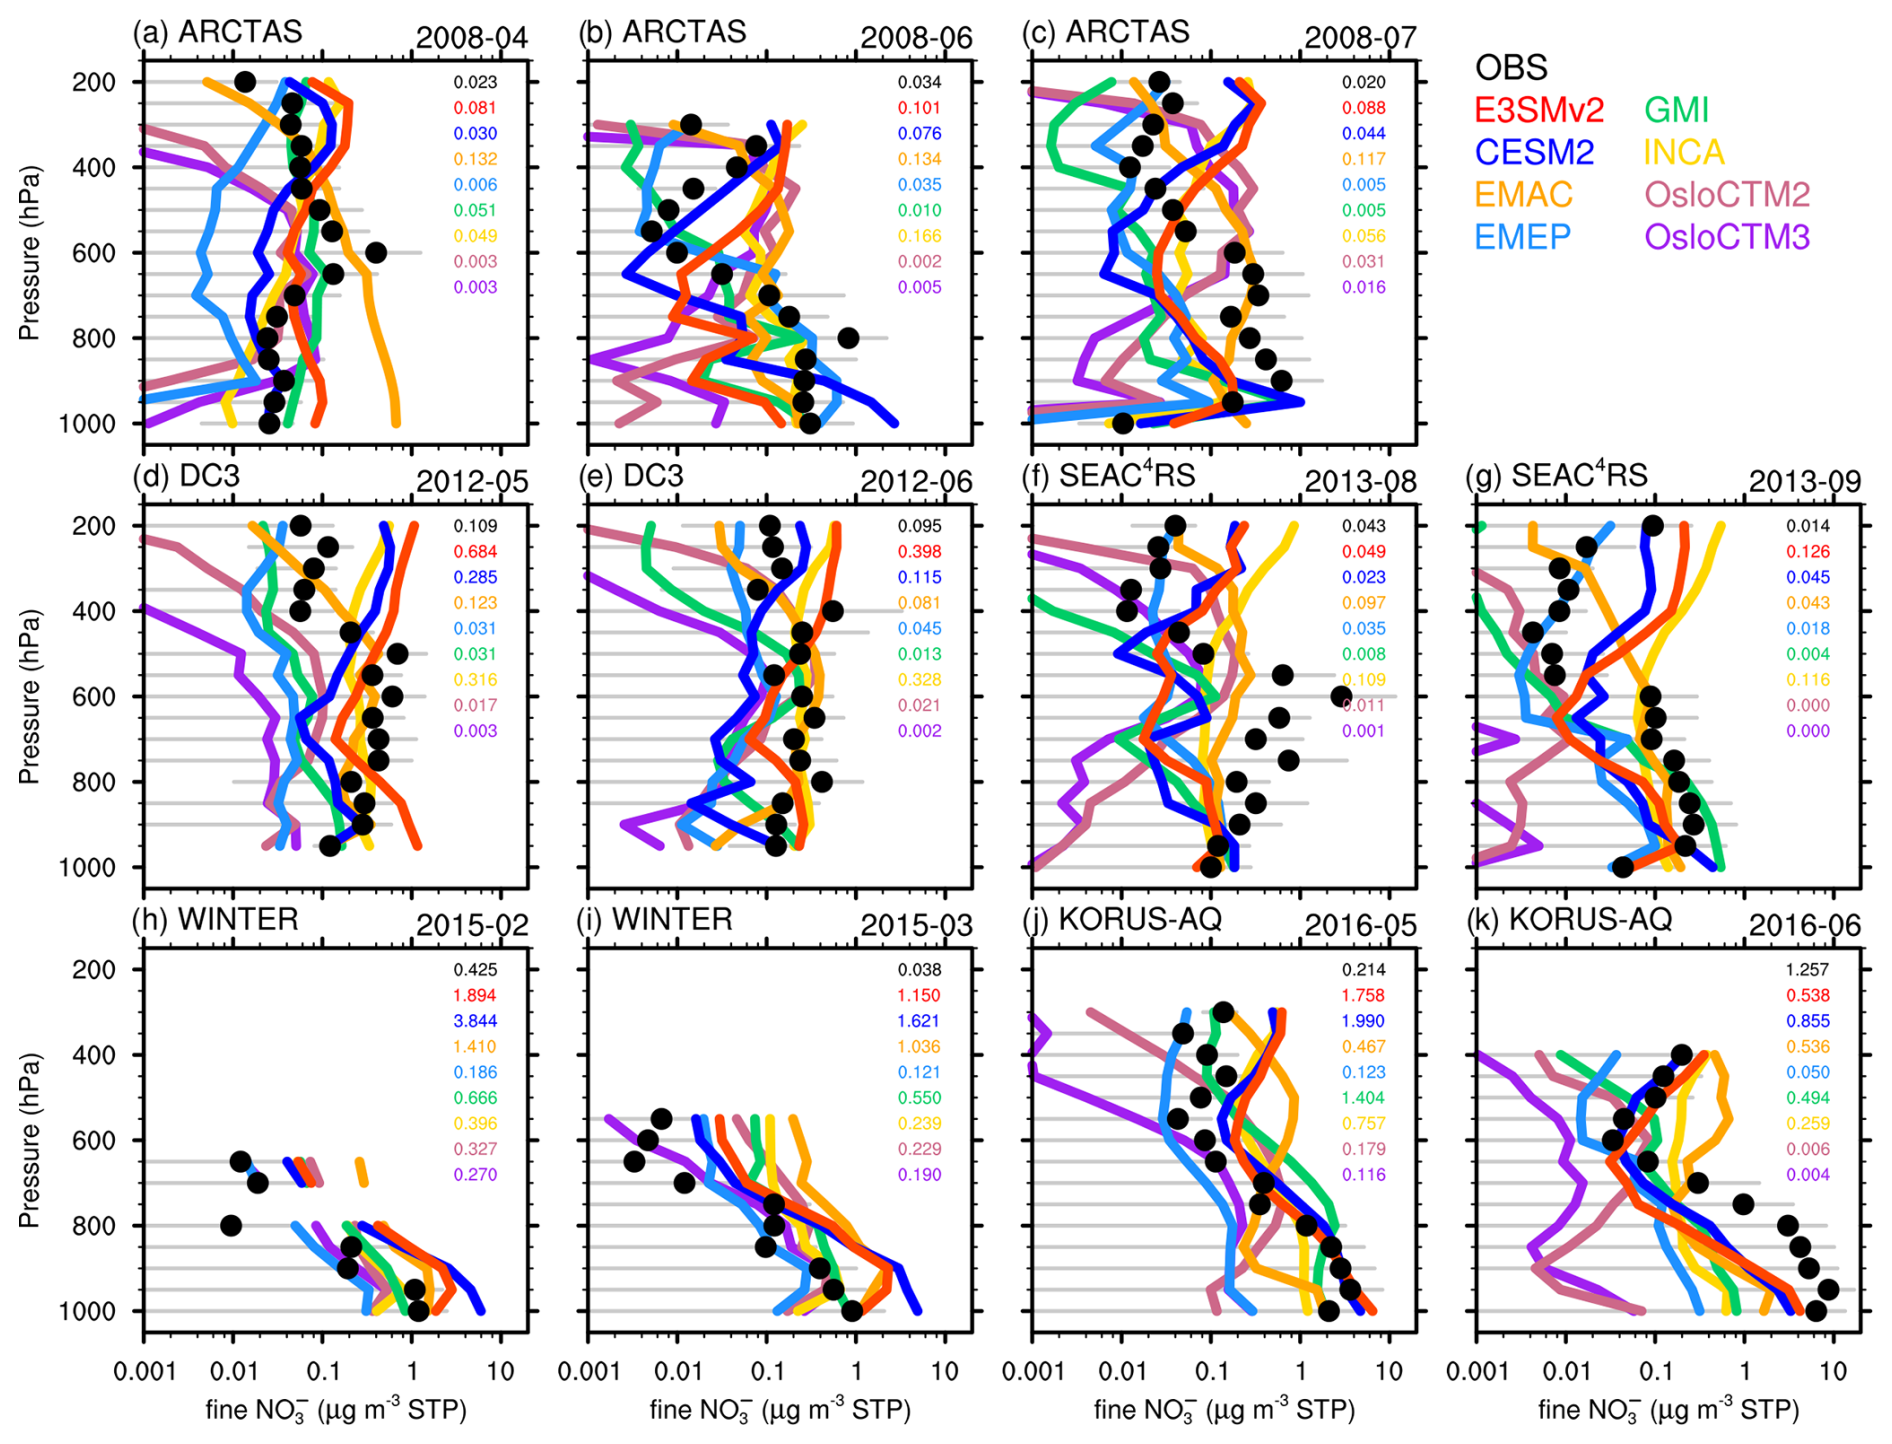
Figure 4Vertical profiles of fine-mode nitrate concentrations (µg m−3 in STP) from model simulations (colored lines) and PM1 nitrate concentrations from five aircraft campaigns: (a–c) ARCTAS, (d–e) DC3, (f–g) SEAC4RS, (h–i) WINTER, and (j–k) KORUS-AQ. Black dots denote mean values of observations, with 1 standard deviation on each side marked in grey lines. The numbers in each panel are median concentrations.
Figure 5 compares the modeled vertical profiles of fine-mode nitrate from E3SMv2, CESM2, and AeroCom phase III models with AMS measurements (PM1) from the ATom campaign. Observed PM1 nitrate concentrations were between 0.01 and 0.1 µg m−3, which are generally lower than the five campaigns in Fig. 4. Similarly, there are large spreads in the modeled fine-mode nitrate concentrations, which can span 2 orders of magnitude in some cases. EMAC and INCA have significant positive biases in the fine-mode nitrate (at least 3 times larger than observations in most regions), indicating a possible overestimation of PM1 nitrate. However, it should be noted that the comparison was made using PM2.5 nitrate data from these two models instead of PM1. Fine-mode nitrate from OsloCTM2 and OsloCTM3 has significant negative biases in all regions. Both E3SMv2 and CESM2 show much stronger vertical variations in fine-mode nitrate than all AeroCom models, especially EMAC, EMEP, GMI, and INCA, and observations. This may be related to the different treatments of CCN activation, wet scavenging, and vertical transport in these two groups of models.
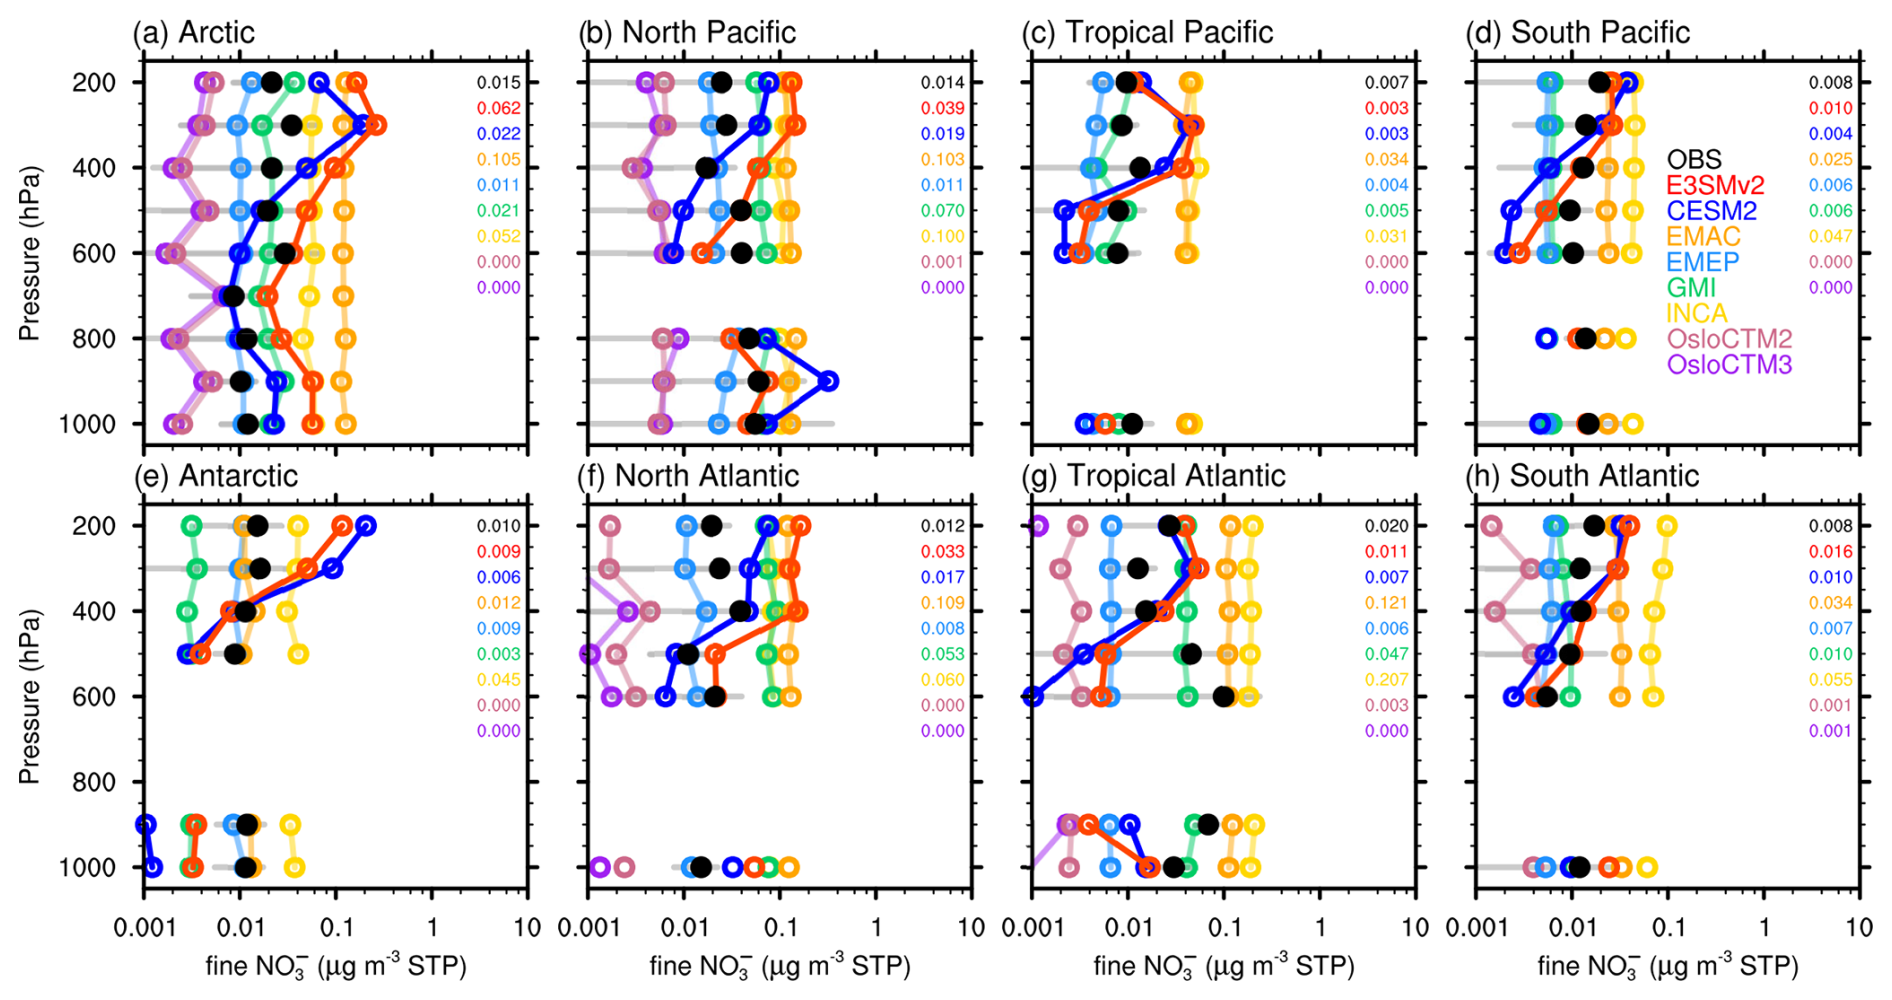
Figure 5Vertical profiles of fine-mode nitrate concentrations (µg m−3 in STP) from model simulations (colored dots) and PM1 nitrate concentrations from ATom 1–4 campaigns (with black dots for mean values and grey lines marking 1 standard deviation of observations). The numbers in each panel are median concentrations.
3.2 Mass size distribution of fine- and coarse-mode nitrate
Figure 6 evaluates the modeled surface nitrate PM2.5 PM10 ratios from E3SMv2, CESM2, and AeroCom phase III models against ground-based observations from the co-located IMPROVE–CASTNET sites over the US, the EMEP sites over Europe, the South African sites, and the Japanese sites (Fig. 1). Overall, the ground-based observations give an annual mean surface nitrate PM2.5 PM10 ratio of 0.70. The annual mean PM2.5 PM10 ratios in the four regions are 0.82, 0.71, 0.56, and 0.57, respectively. Only a few sites are dominated by coarse-mode nitrate with PM2.5 PM10 ratios below 0.5, while most sites are dominated by fine-mode nitrate. The annual mean surface nitrate PM2.5 PM10 ratio (0.70), averaged across all sites, is likely higher than the global annual mean, because the latter includes contributions from vast marine and dusty areas where coarse-mode nitrate is dominant. Most models (CESM2, EMAC, GMI, OsloCTM2, and OsloCTM3) have negative biases in all four regions. Although E3SMv2, EMEP, and INCA slightly overestimate the annual mean surface nitrate PM2.5 PM10 ratio, they still have negative biases for a considerable number of sites, especially for co-located IMPROVE–CASTNET sites. EMAC, OsloCTM2, and OsloCTM3, which use only TEQMs for the formation of coarse-mode nitrate, have larger biases than the other three AeroCom models that use first-order loss to calculate nitrate formation in the coarse mode for heterogeneous reactions on dust and sea salt. E3SMv2 with MOSAIC tends to agree with observations reasonably well, while CESM2 with MOSAIC has negative biases in all four regions. We also see that most models have consistent positive or negative biases in all four regions, while EMEP and INCA have different signs of bias among the regions. Note that the models' performance in simulating the surface nitrate PM2.5 PM10 ratio does not necessarily align with the global annual mean PM2.5 PM10 nitrate burden ratio (Table 3).
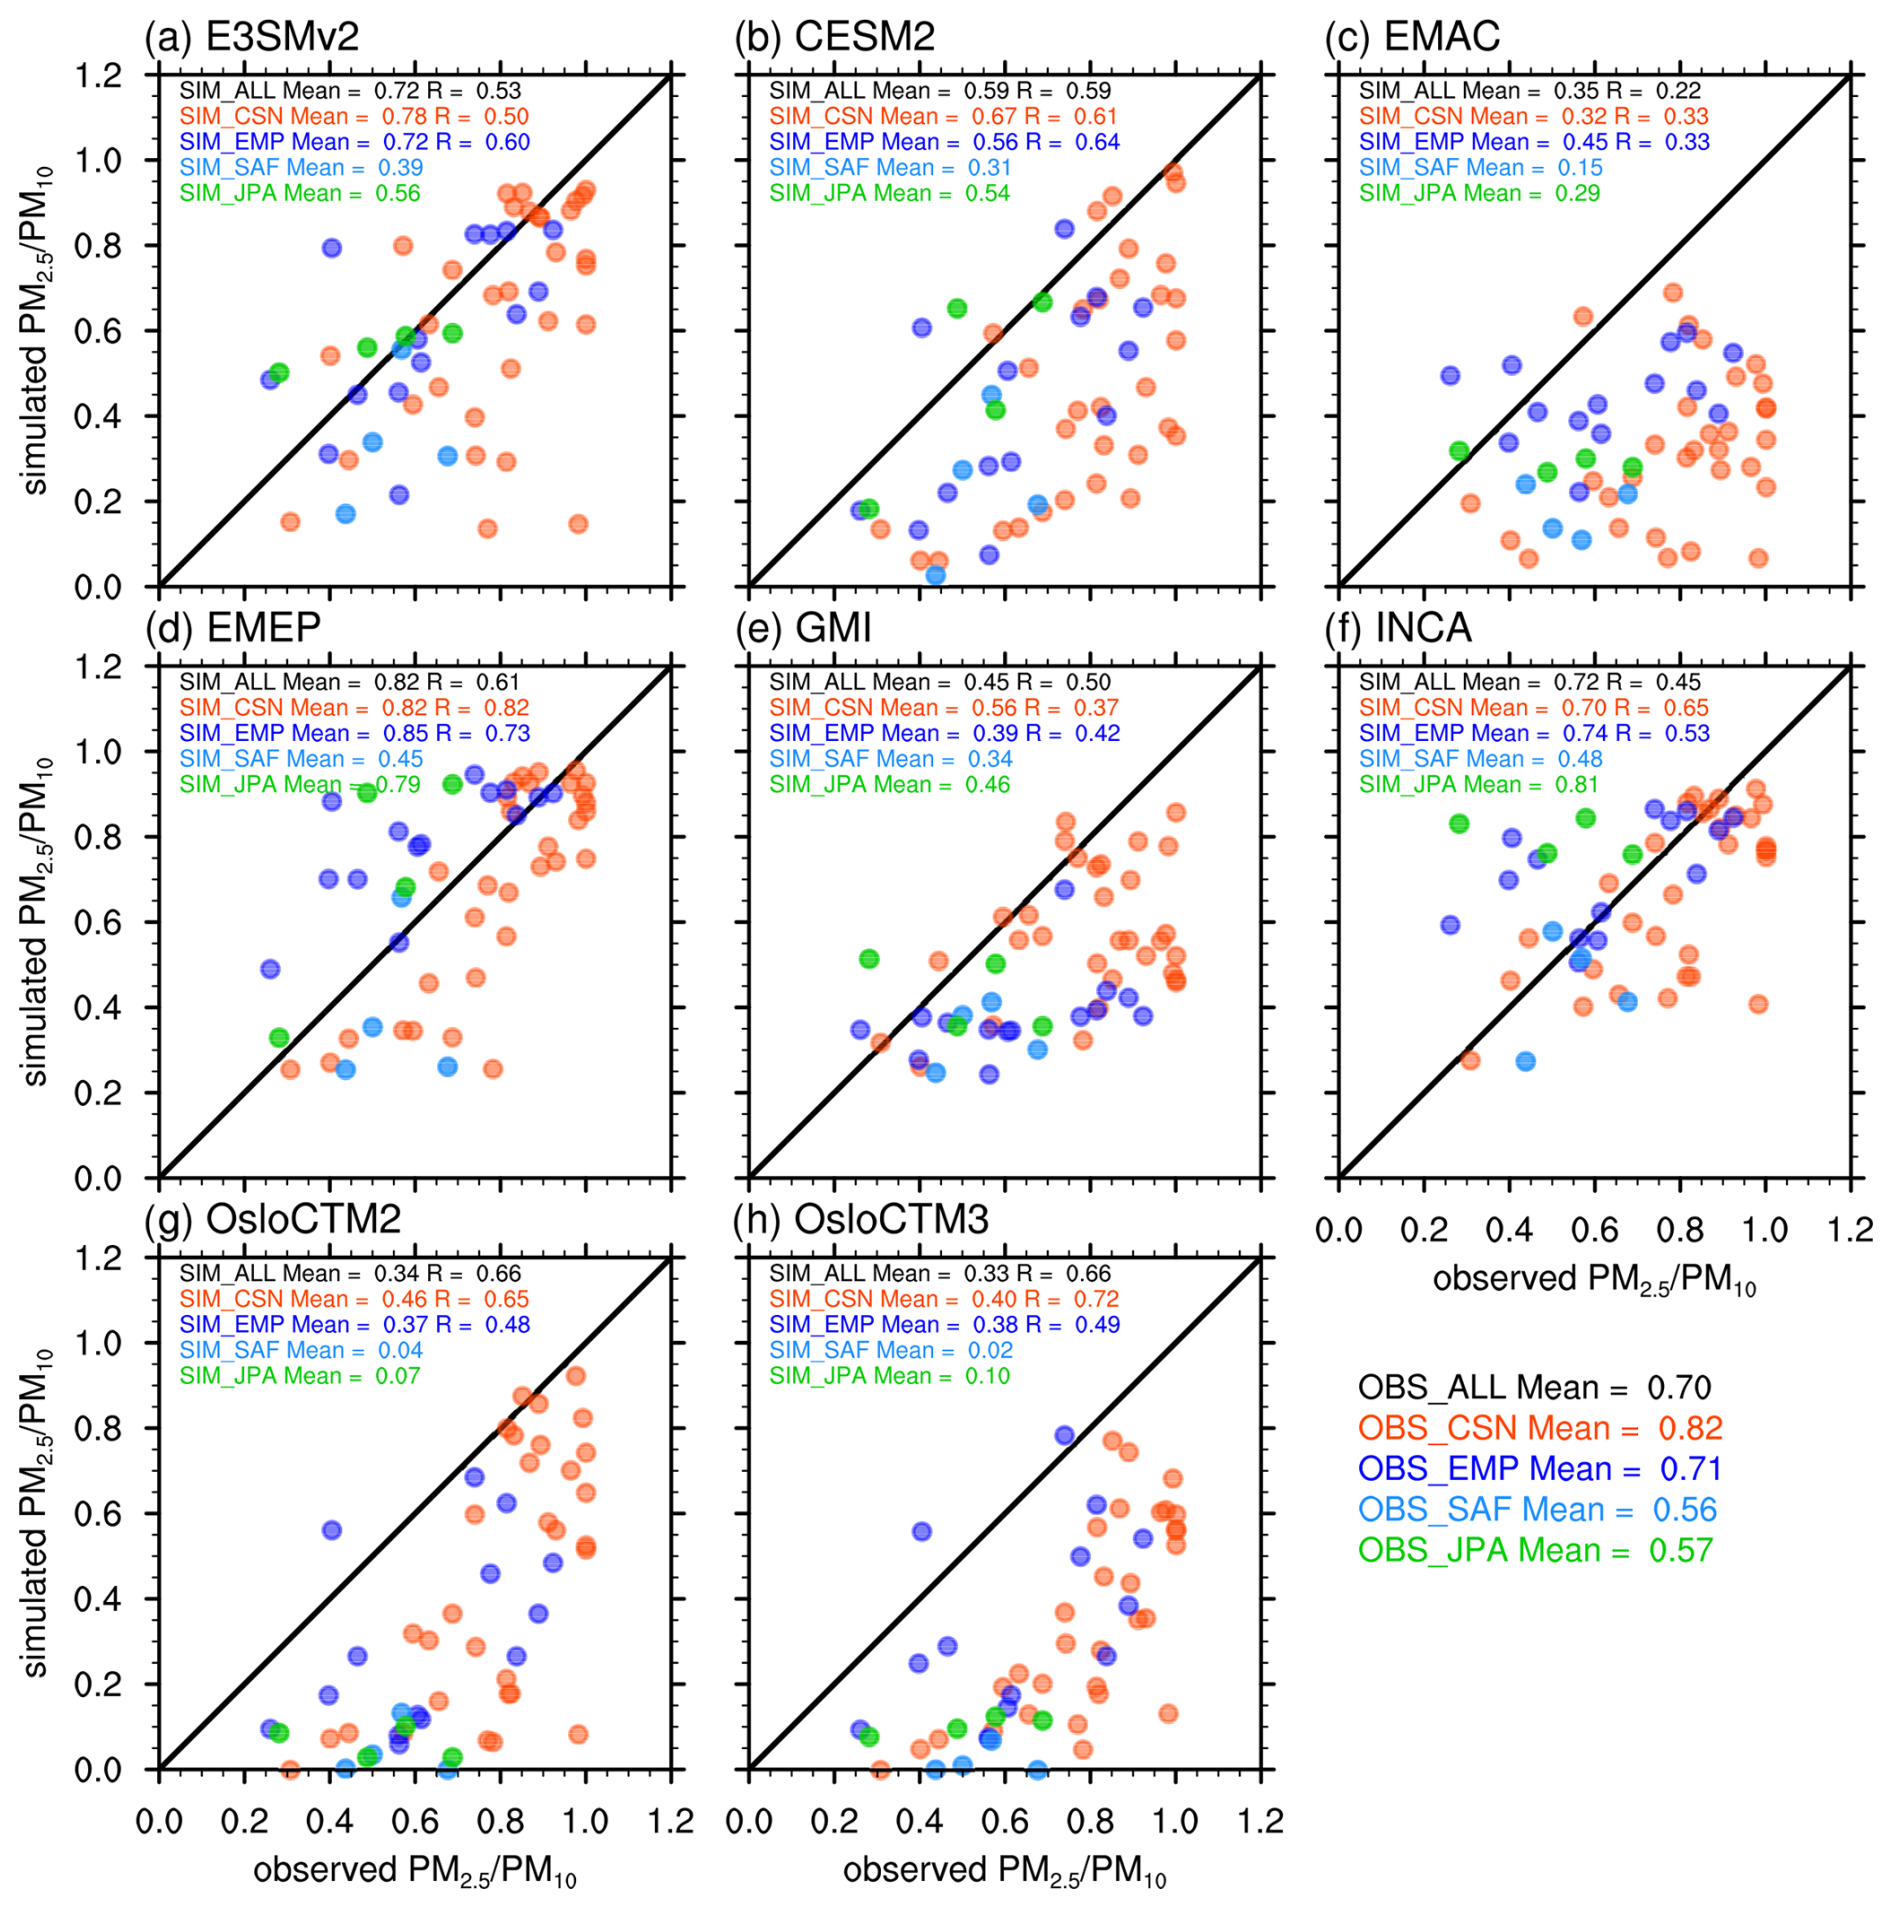
Figure 6Scatterplots of modeled annual mean surface nitrate PM2.5 PM10 ratios compared to observations from the co-located IMPROVE–CASTNET sites (CSN, red dots), EMEP (EMP, deep blue dots), the South African sites (SAF, light blue dots), and the Japanese sites (JPA, green dots). The numbers in each panel are mean ratios and correlation coefficients at the corresponding sites. Solid lines represent the 1:1 comparison. The mean surface PM2.5 PM10 ratio is calculated as mean PM2.5 divided by mean PM10.
Figures 7 and 8 show the seasonal variations in modeled surface nitrate PM2.5 PM10 ratio in comparison with observations at selected co-located IMPROVE–CASTNET sites. In Fig. 7, the nitrate surface concentrations at Everglades NP and Virgin Island (Fig. 7a and b) are dominated by coarse-mode nitrate due to heterogeneous reactions on sea salt from adjacent ocean and dust transported from North Africa (see Figs. S1 and S2 for chlorine and PM2.5 dust surface concentrations). The measured PM2.5 PM10 ratios at the two sites are around 0.3 and 0.2, respectively, with small fluctuations. The higher PM2.5 PM10 ratios observed at the two sites from May to August may be attributed to a relatively large contribution of dust compared with sea salt during this period (see Figs. S1 and S2). The nitrate concentrations at Acadia NP (Fig. 7c) are contributed by both coarse-mode nitrate due to heterogeneous reactions on sea salt and fine-mode nitrate. The measured PM2.5 PM10 ratios reach their maximum in June, which is consistent with relatively low sea salt concentrations (Fig. S1) and high sulfate concentrations (Fig. S3) in summer. The nitrate concentrations at Big Bend NP, Chiricahua, and Canyonlands NP (Fig. 7d–f) are dominated by coarse-mode nitrate due to heterogeneous reactions on local dust (see Fig. S2). The measured PM2.5 PM10 ratios at the three sites are higher than those at Everglades NP and Virgin Island but below 0.6 during most of the year. The high PM2.5 PM10 ratios measured at Canyonlands NP during winter may be caused by wildfire or air pollution.
OsloCTM2 and OsloCTM3 significantly underestimate the PM2.5 PM10 ratios at all six sites, with near-zero values in most months. EMEP, GMI, and INCA agree with the observations at Everglades NP and Virgin Island better than the other models. All models except for E3SMv2 and EMAC fail to capture the high PM2.5 PM10 ratios at Acadia NP in June and July but give high values in winter instead. E3SMv2, EMEP, GMI, and INCA tend to have stronger seasonal variations than observations at Big Bend NP, Chiricahua, and Canyonlands NP. The model biases in the PM2.5 PM10 ratio at these six sites can be partially attributed to their model biases in simulating dust and sea salt. CESM2 significantly overestimates chlorine aerosol surface concentrations at the six sites, while E3SMv2 has much better agreement with the observations (Fig. S1). This difference in chlorine aerosol can be attributed to several factors, including the reduced geometric standard deviations of particle size distribution in the CESM2 MAM4 accumulation and coarse modes compared to those in E3SMv2 (Wu et al., 2020); the numerical coupling of aerosol emissions, dry deposition, and turbulent mixing in E3SM (Wan et al., 2024); and other differences in cloud and convection parameterizations. CESM2 significantly underestimates PM2.5 dust concentrations at the six sites, while E3SMv2 has larger dust concentrations and agrees with the observations better (Fig. S2). This difference in dust aerosol can be attributed to the tuned source function for dust emissions in CESM2 compared with E3SMv2 (Wu et al., 2020). Note that most AeroCom models underestimate sulfate surface concentrations (Fig. S3). In Fig. 8, all six co-located sites are dominated by fine-mode nitrate, mostly ammonium nitrate, as the measured PM2.5 PM10 ratios are around or above 0.8. Many models produce much stronger seasonal variations (summer low, winter high) of the surface nitrate PM2.5 PM10 ratio than observations and have large negative biases during May to September. This might be related to some models failing to capture the seasonal variations (summer high, winter low) of sulfate (Fig. S4) and/or model representation of wet deposition. Similarly, CESM2 overestimates chlorine aerosol surface concentrations but underestimates PM2.5 dust surface concentrations at the six sites, while E3SMv2 has better agreement with observations (Figs. S5 and S6).
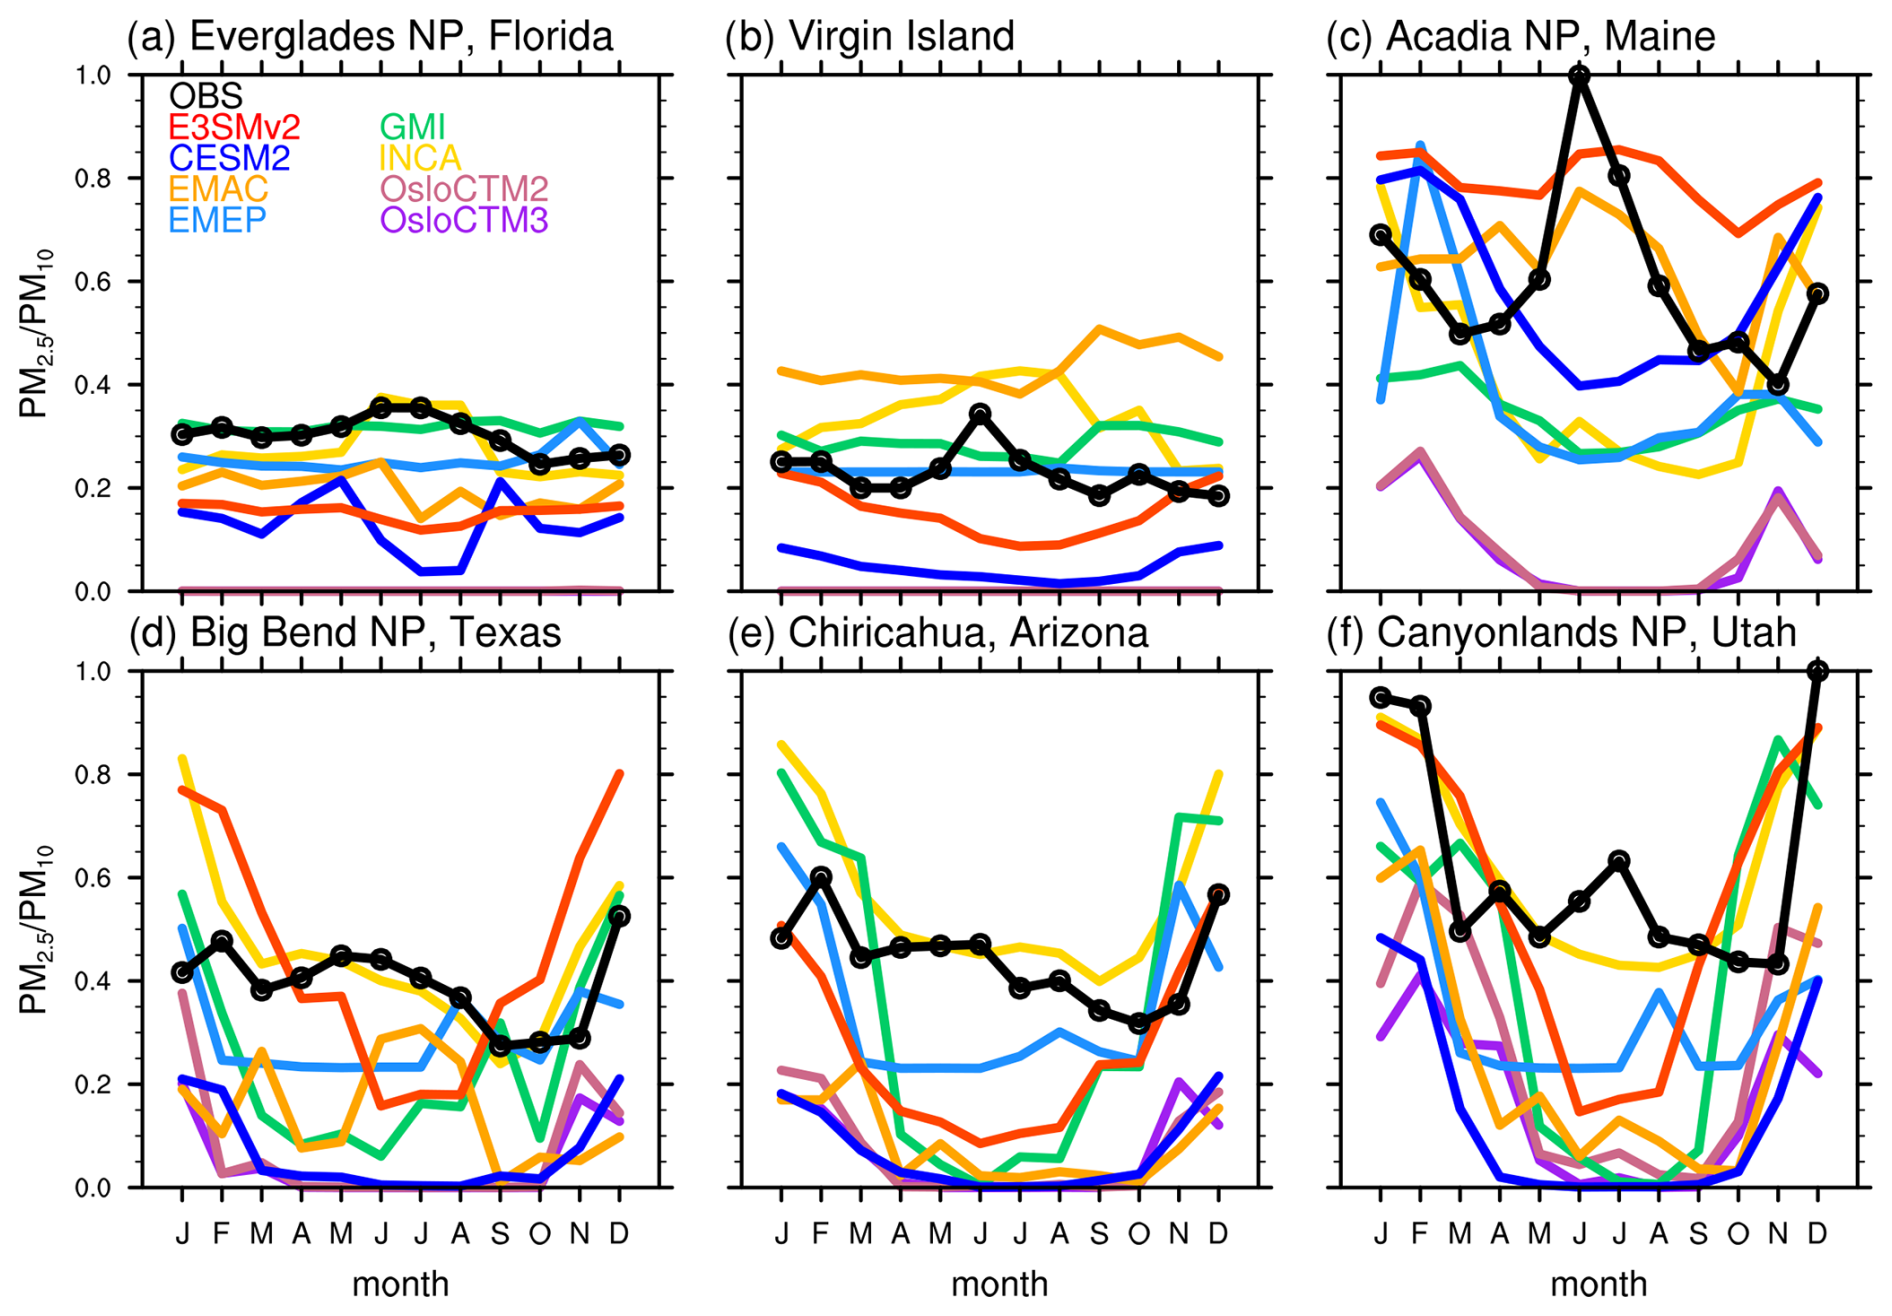
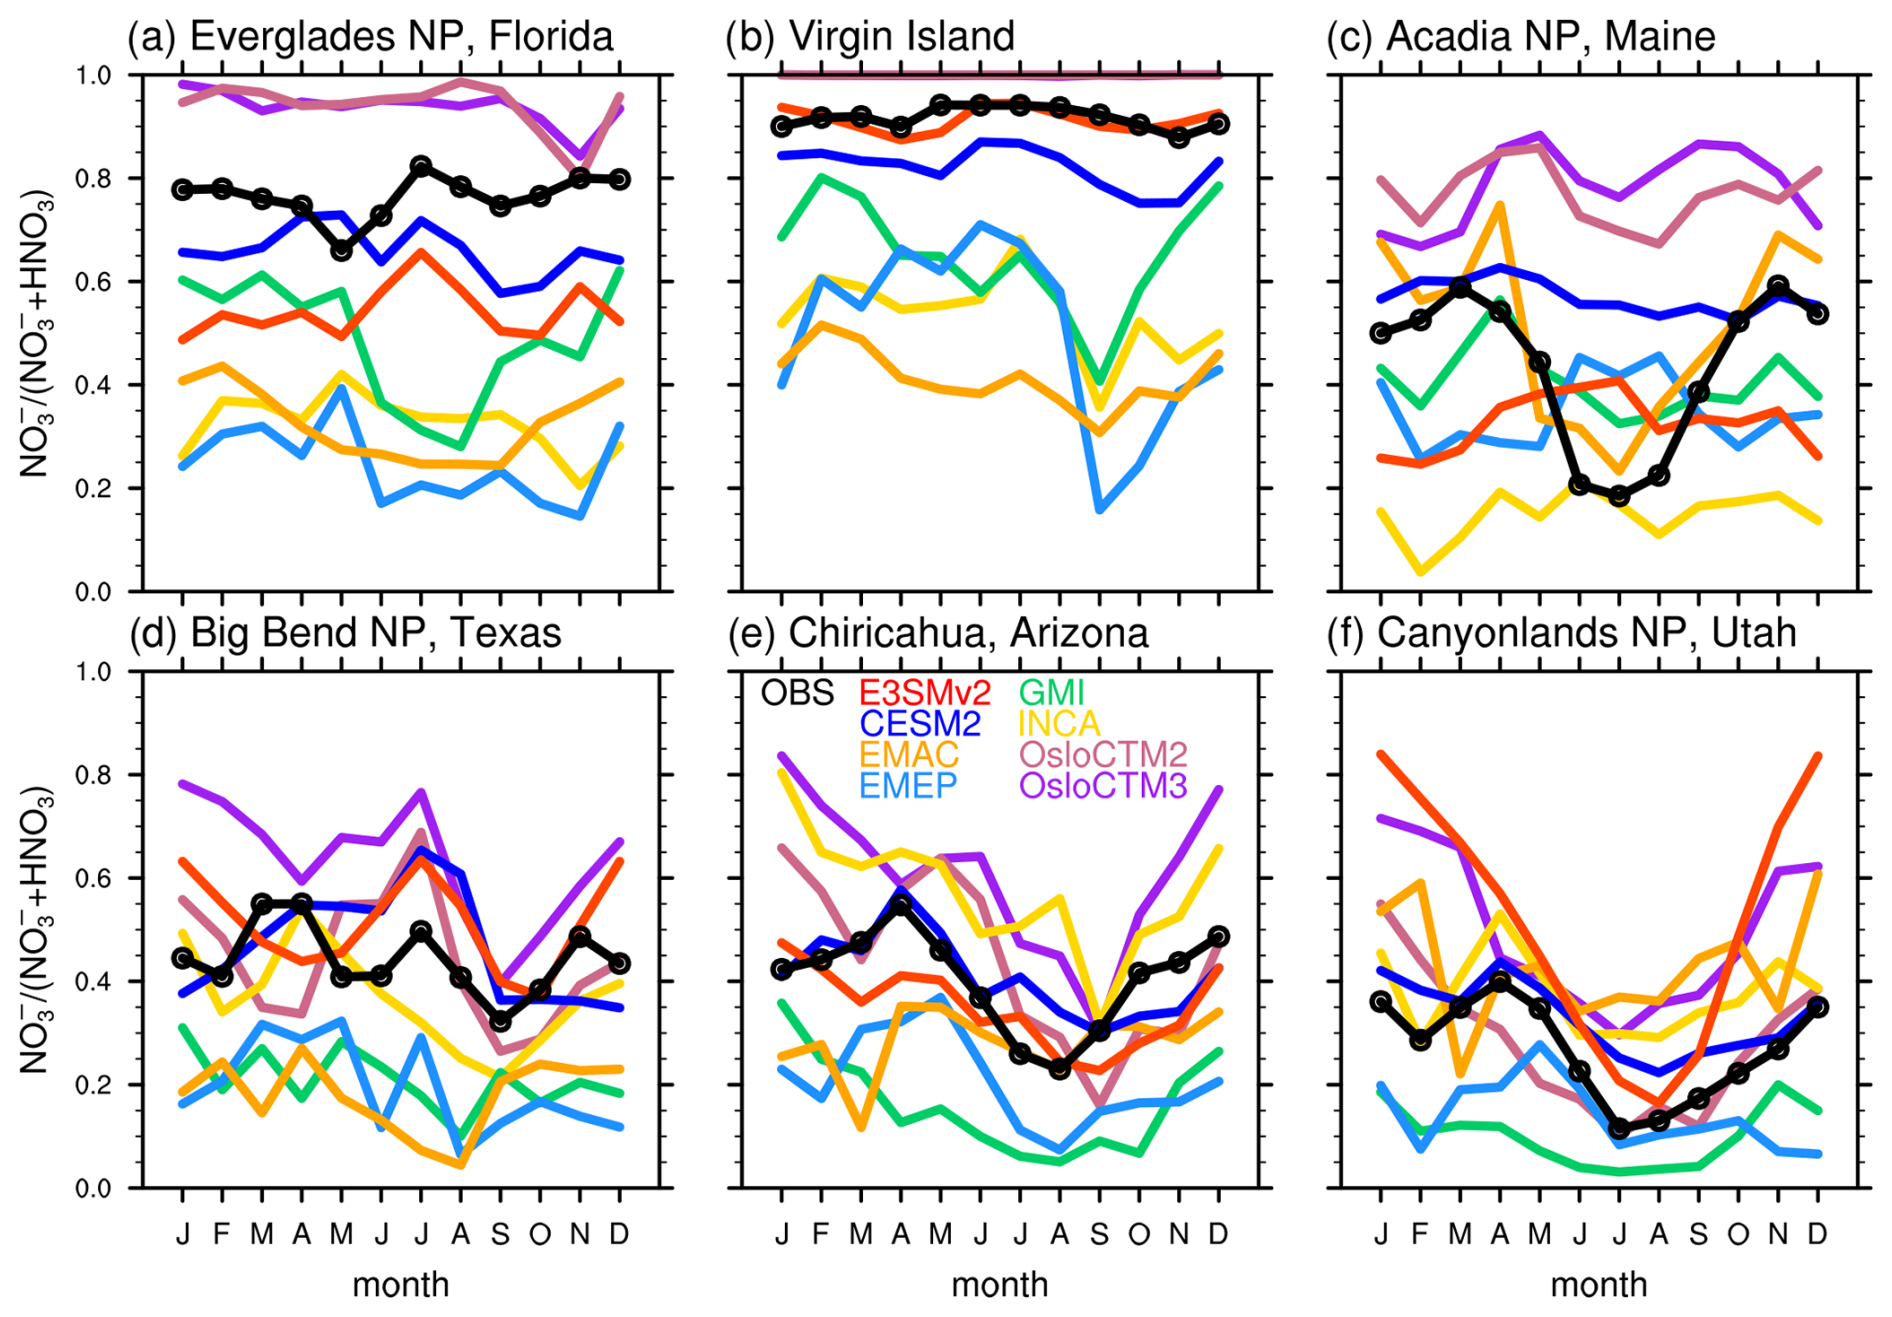
Figure 7Seasonal variations in the simulated (color lines) and observed (black lines and circles) surface nitrate PM2.5 PM10 ratio at six co-located IMPROVE–CASTNET sites dominated by coarse-mode nitrate: (a) Everglades NP (25.39° N, 80.68° W), (b) Virgin Island (18.34° N, 64.80° W), (c) Acadia NP (44.38° N, 68.26° W), (d) Big Bend NP (29.30° N, 103.18° W), (e) Chiricahua (32.01° N, 109.39° W), and (f) Canyonlands NP (38.46° N, 109.82° W).
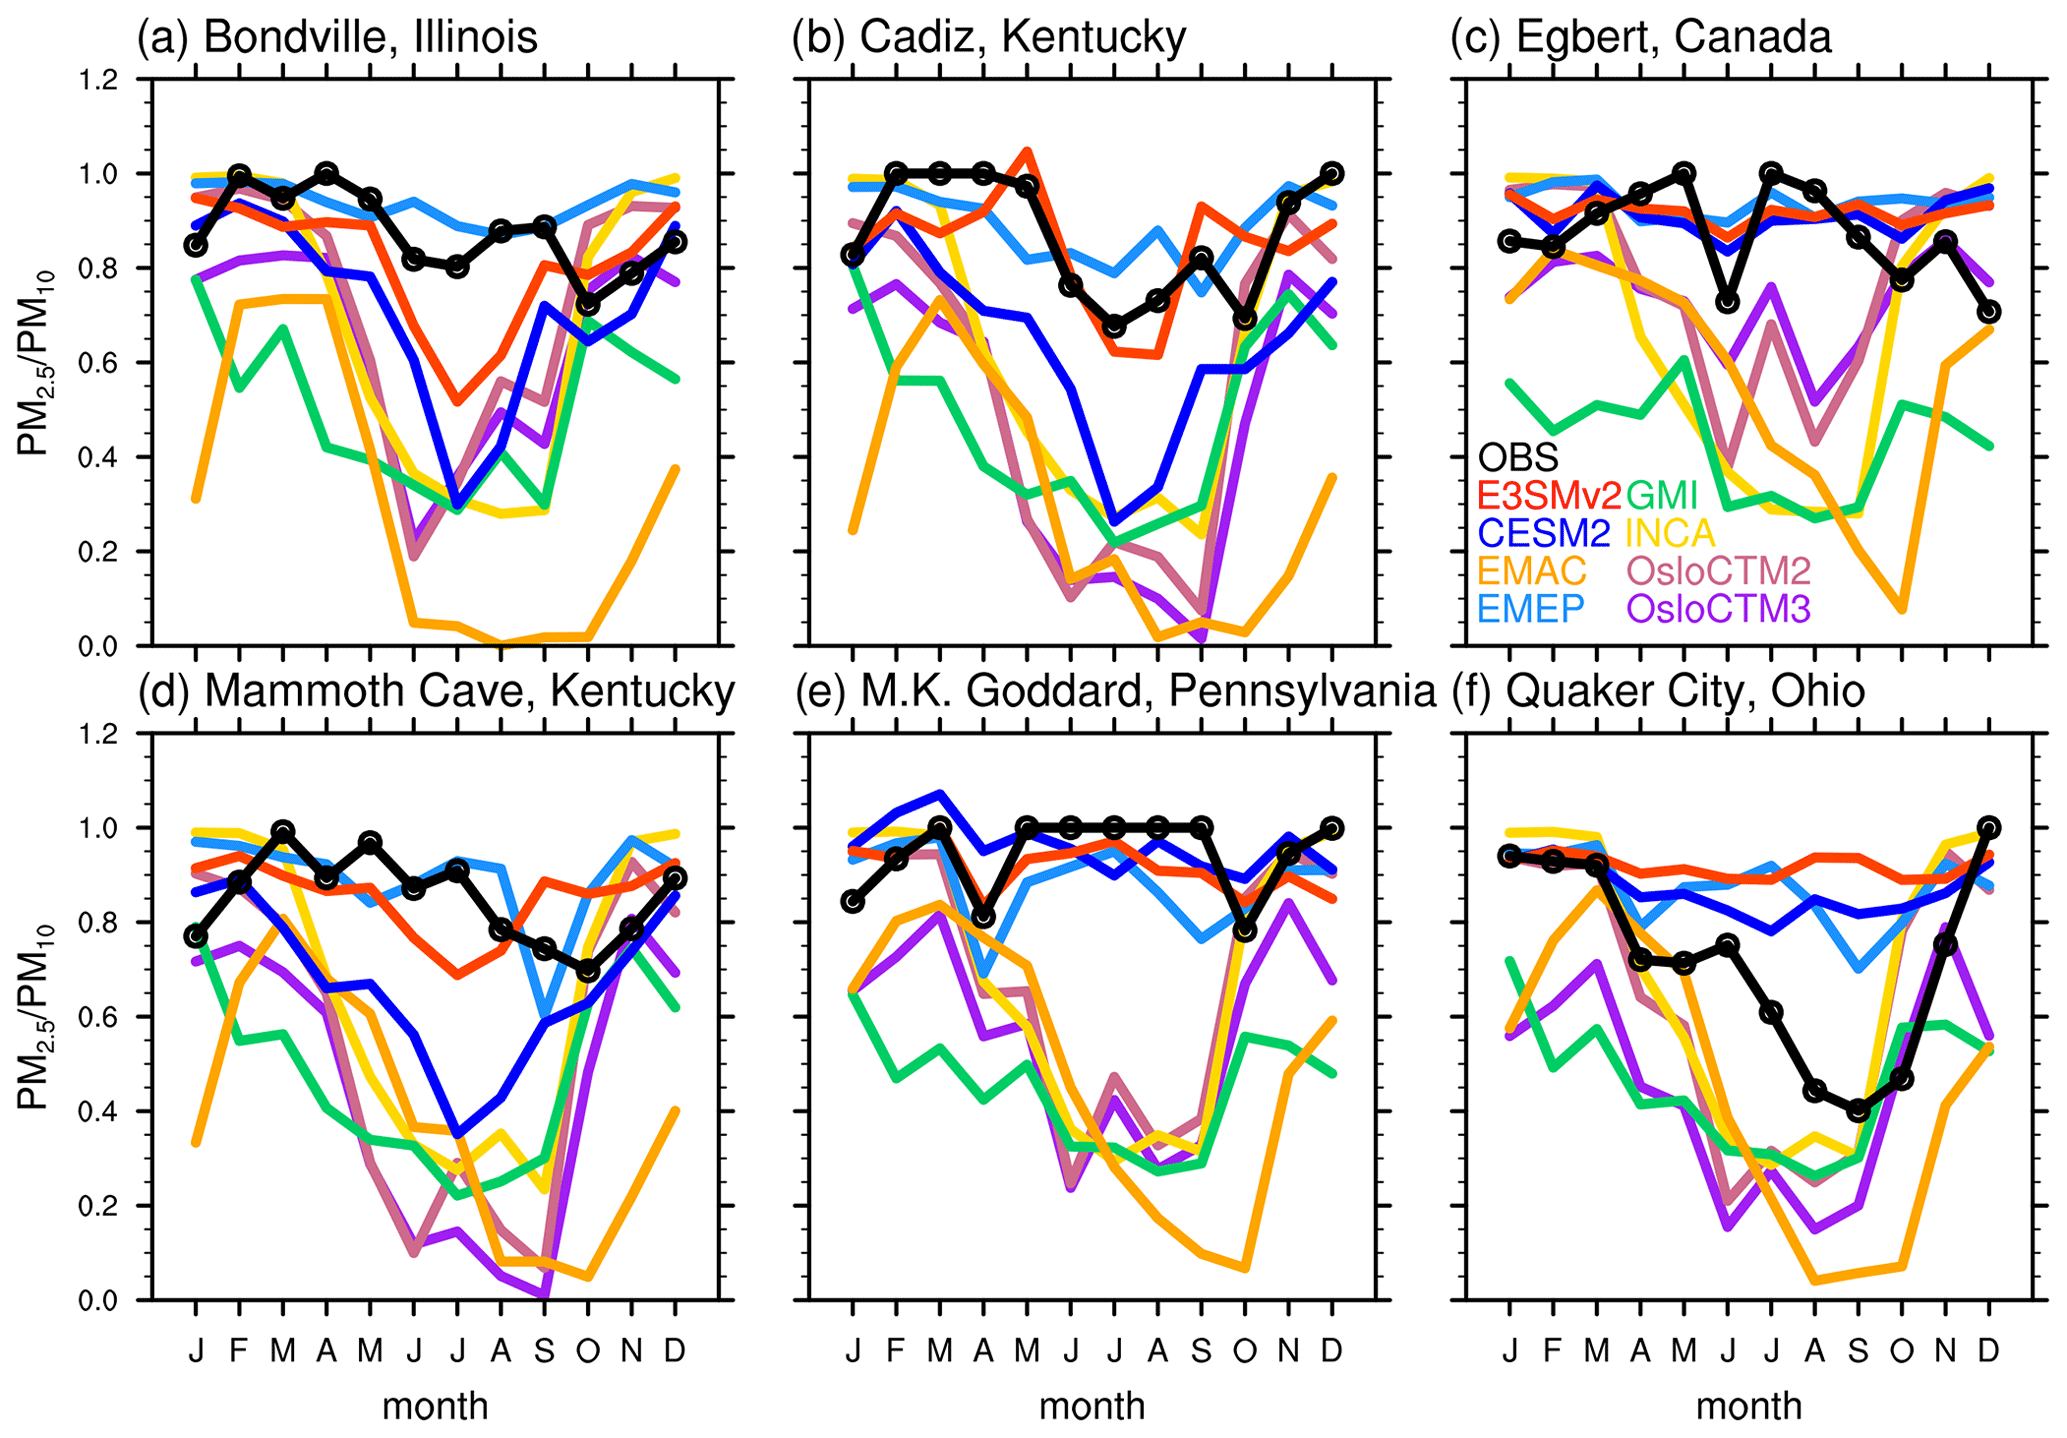
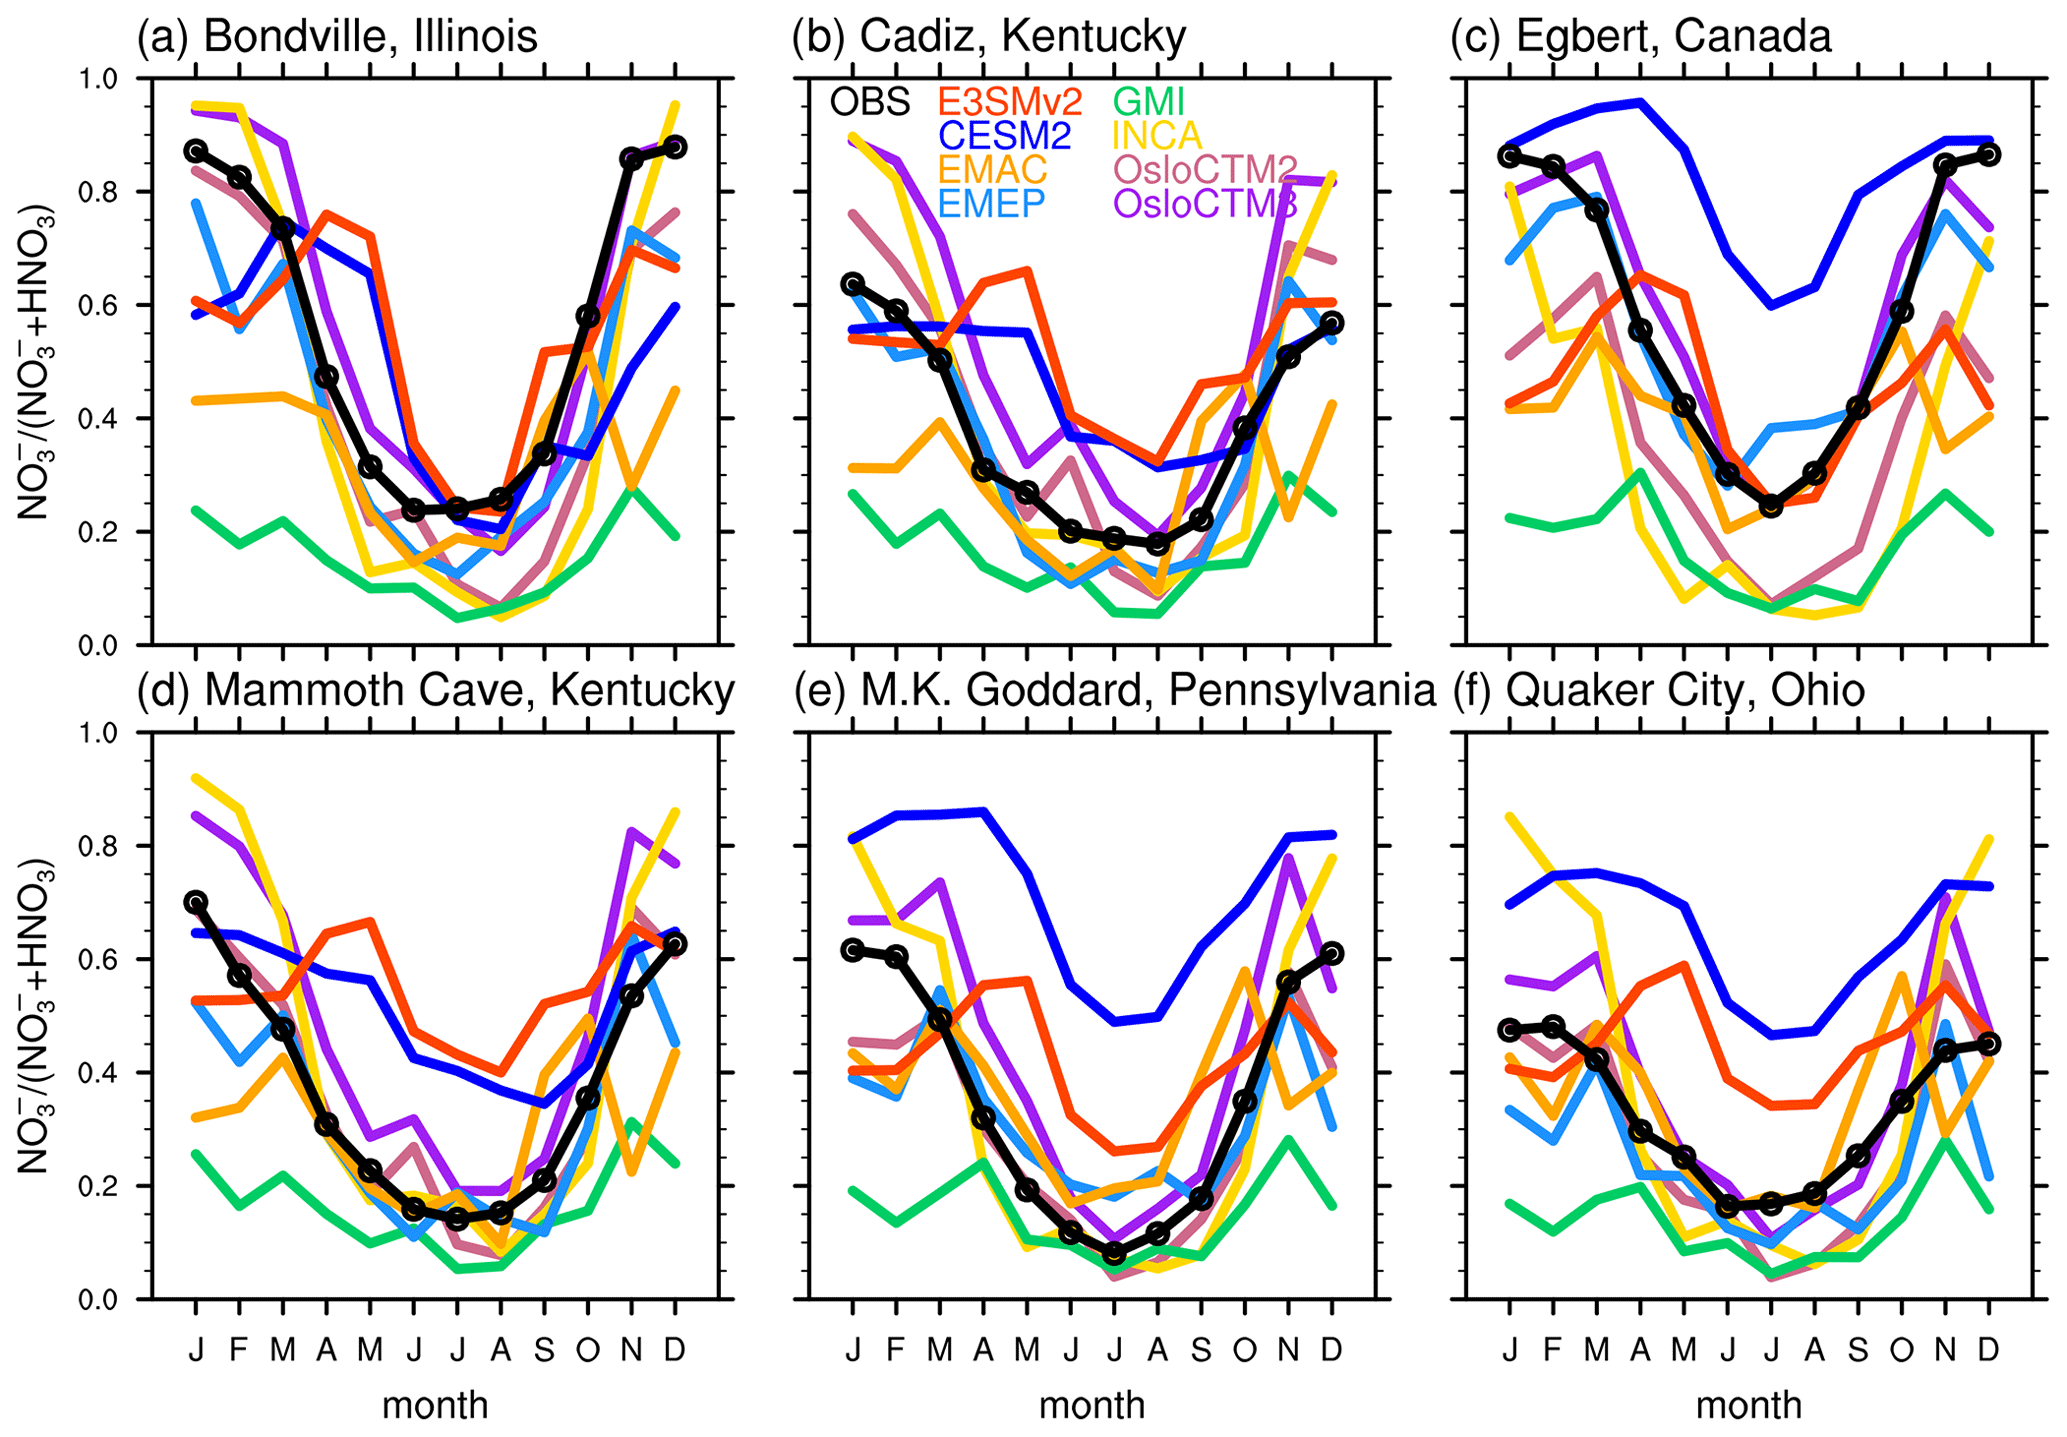
Figure 8The same as Fig. 7 but for six co-located IMPROVE–CASTNET sites dominated by fine-mode nitrate: (a) Bondville (40.05° N, 88.37° W), (b) Cadiz (36.78° N, 87.85° W), (c) Egbert (44.23° N, 79.78° W), (d) Mammoth Cave (37.13° N, 86.14° W), (e) M. K. Goddard (41.43° N, 80.15° W), and (f) Quaker City (39.94° N, 81.34° W).
Figure 9 compares the modeled vertical profiles of the nitrate PM1 PM4 ratio from E3SMv2, CESM2, and EMEP to those derived from AMS (PM1) and SAGA filter (PM4) measurements during the ARCTAS, DC3, SEAC4RS, WINTER, and KORUS-AQ campaigns. The observed nitrate PM1 PM4 ratios from ARCTAS are low (around or less than 0.2) near the surface (below 900 hPa), indicating that they are dominated by coarse PM1–4 nitrate forming on sea salt and high-latitude dust. The observed peaks at 600 hPa in Fig. 9a and at 900–850 hPa in Fig. 9c are consistent with the peaks in Fig. 4a and c, indicating that they are dominated by PM1 fine nitrate, likely from wildfire plumes. Observed PM1 PM4 ratios from DC3 and SEAC4RS are also low (around or less than 0.4) near the surface (below 900 hPa), which is consistent with low surface PM2.5 PM10 ratios in Fig. 7a–b and d–f during late spring, summer, and early autumn. The coarse PM1–4 nitrate forming on local dust and sea salt mainly contributes to the low PM1 PM4 ratios near the surface. Froyd et al. (2019) showed that mineral dust concentrations are high below 4 km in DC3 and SEAC4RS and make a considerable contribution to the total aerosol mass in DC3 (up to 50 %). It is also found that dust and sea salt dominate aerosol mass at low altitude over the Gulf of Mexico. In Fig. 9d–e, observed PM1 PM4 ratios from DC3 increase with altitude from around 0.2 near the surface to more than 0.8 at 500 hPa or above, indicating that fine PM1 nitrate from pollution or wildfire becomes dominant in the middle troposphere. In Fig. 9f, the observed PM1 PM4 ratios from SEAC4RS are high (larger than 0.8) between 750 and 550 hPa, which is consistent with the peak of PM1 nitrate around 600 hPa caused by wildfire in the western US.
The observed PM1 PM4 ratios from WINTER are high (around or above 0.8) near the surface (below 900 hPa), which is consistent with the high surface PM2.5 PM10 ratios in Fig. 8 during February and March. The observed PM1 PM4 ratio from WINTER decreases with altitude from above 0.8 near the surface to less than 0.2 at/above 800 hPa, indicating that coarse PM1–4 nitrate condensed on sea salt and dust particles may become dominant at/above the boundary layer. Similarly, the observed PM1 PM4 ratios from KORUS-AQ in Fig. 9j are relatively high near the surface but decrease with altitude to less than 0.2 around 600 hPa. Coarse PM1–4 nitrate forming on dust and anthropogenic coarse PM may contribute to the observed low PM1 PM4 ratios above 800 hPa (Zhai et al., 2023). Vertical profiles from ground-based high-spectral-resolution lidar (HSRL) show elevated dust layers transported from the Taklamakan and Gobi deserts during 4–5 May 2016 (Peterson et al., 2019). The HSRL vertical profiles also show high values of backscatter cross-section due to pollution/haze below 2.5 km during 25–26 May. In general, there are large spreads in the modeled nitrate PM1 PM4 ratios among E3SMv2, CESM2, and EMEP. The modeled PM1 PM4 ratios can range from near-zero in EMEP to 1 in CESM2, as shown in Fig. 9a–b (ARCTAS) and Fig. 9j–k (KORUS-AQ). We can also see that the three models agree with observations and each other better in Fig. 9c (ARCTAS), Fig. 9e (DC3), and Fig. 9i (WINTER) than in other panels.
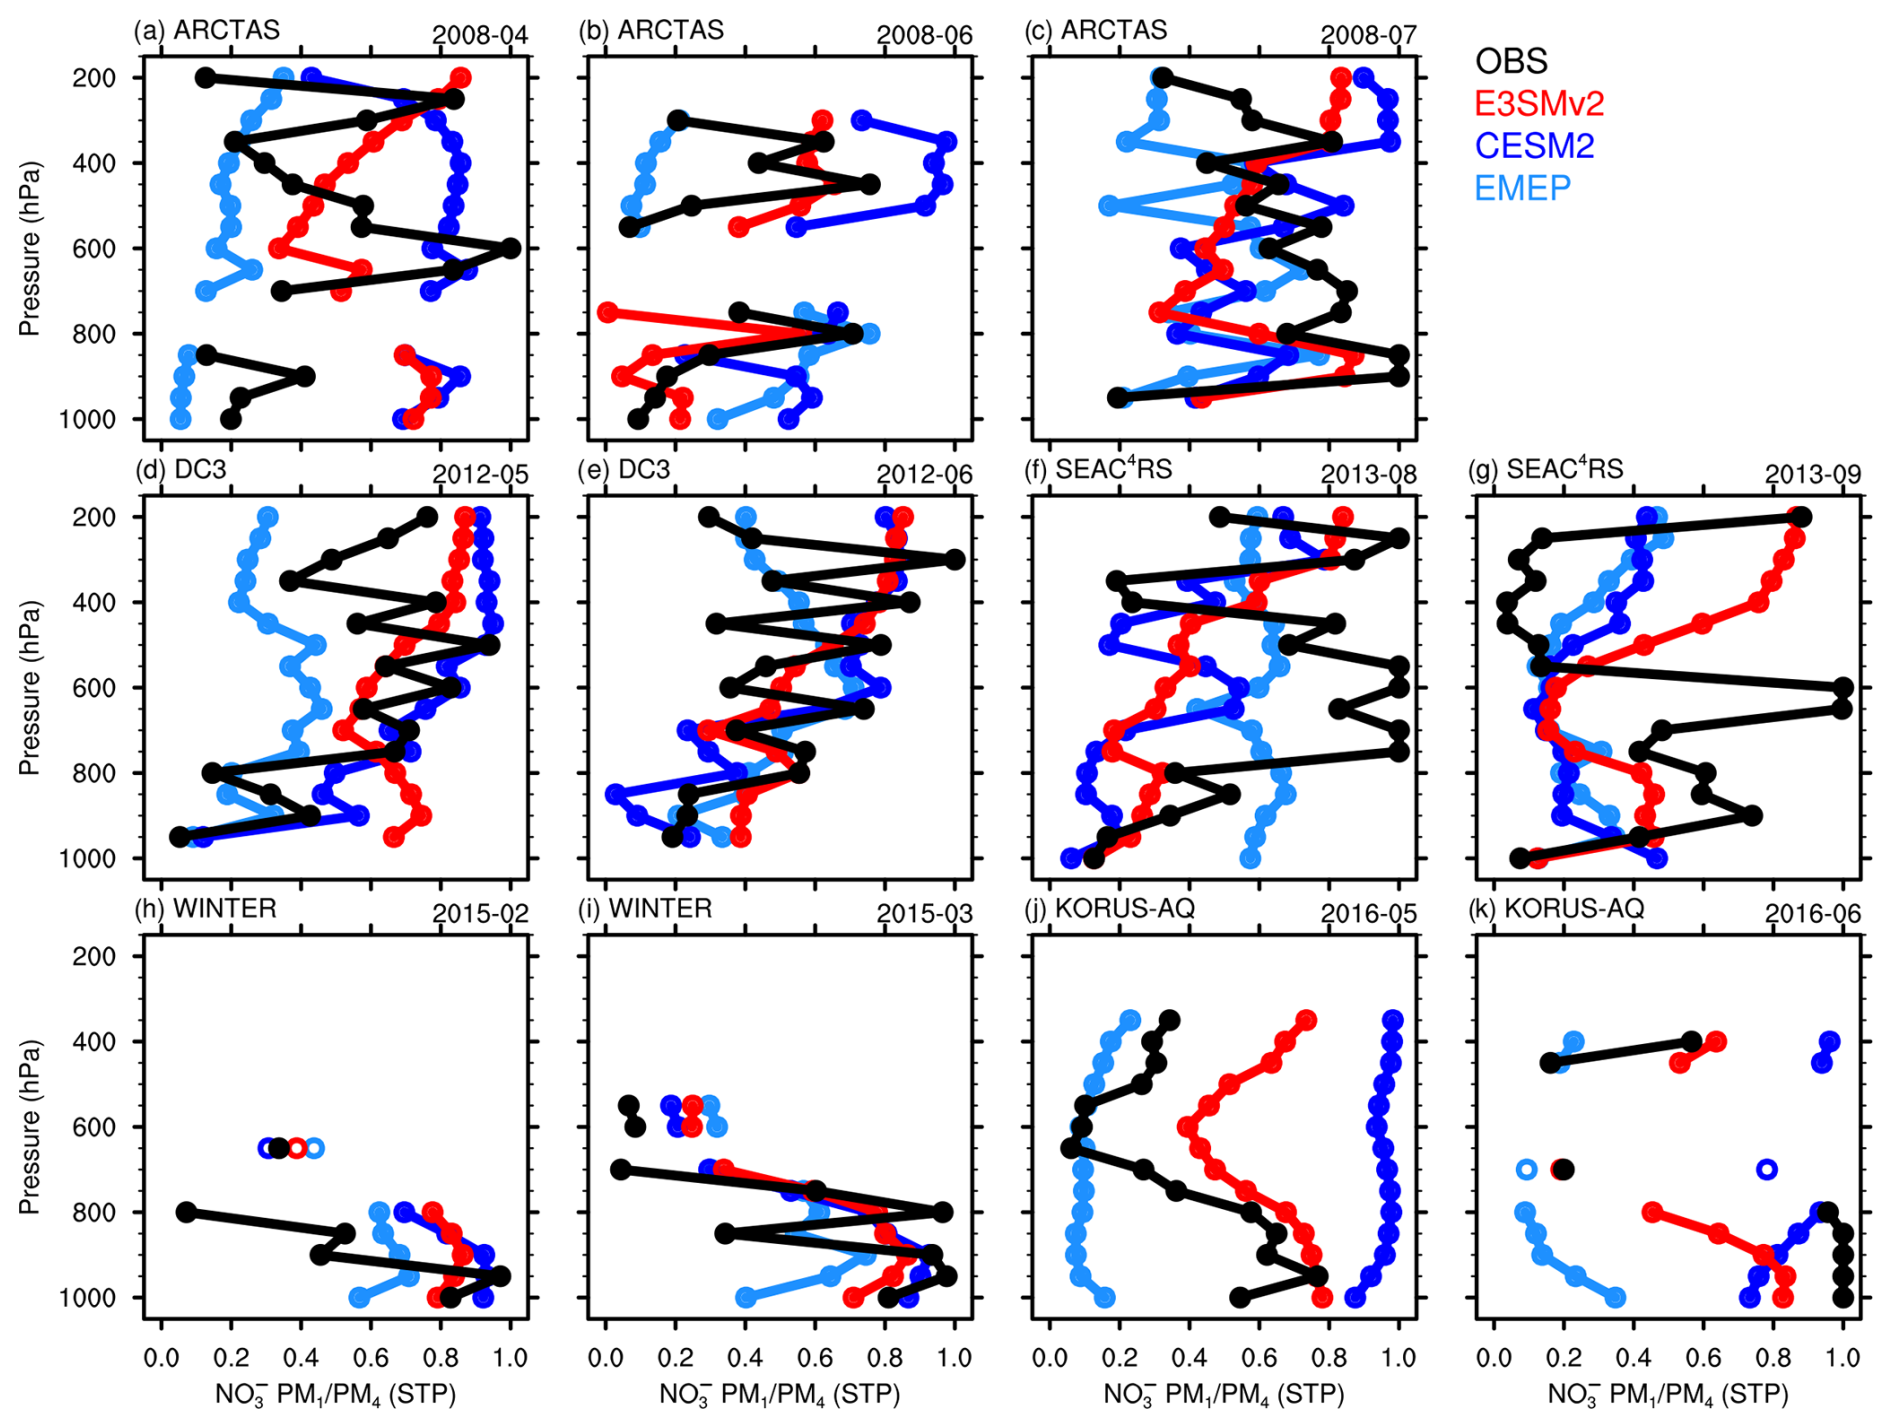
Figure 9Vertical profiles of nitrate PM1 PM4 ratios from model simulations (colored dots) and five aircraft campaigns: (a–c) ARCTAS, (d–e) DC3, (f–g) SEAC4RS, (h–i) WINTER, and (j–k) KORUS-AQ (black dots).
Figure 10 compares the modeled vertical profiles of the nitrate PM1 PM4 ratio from E3SMv2, CESM2, and EMEP to those derived from AMS (PM1) and SAGA filter (PM4) measurements during ATom flights. In general, observed PM1 PM4 ratios are low (less than 0.4) below 600 hPa, despite the scarcity of measurements, due to the contribution of coarse PM1–4 nitrate formed on sea salt. Thompson et al. (2022) showed that large sea salt particles (diameter greater than 1 µm) dominate aerosol mass in the marine boundary layer (MBL) (below 2 km) but have a significantly small contribution above the MBL. The observed PM1 PM4 ratios tend to be higher above 600 hPa than those below 600 hPa. Sometimes, fine-mode nitrate concentration measured by AMS (PM1) is larger than nitrate measured by SAGA filters (PM4) above 600 hPa. Despite the measurement uncertainties, this may indicate that fine PM1 nitrate dominates the nitrate mass in the middle-to-upper troposphere. ATom field measurements show that small sulfate and organic particles (diameter less than 1 µm) dominate aerosol mass above 2 km over the Southern Pacific and Atlantic and in the upper troposphere (6–12 km) over tropical oceans, while a considerable quantity of coarse dust particles are present in the middle troposphere (2–6 km) over tropical oceans and in the entire free troposphere over the North Pacific and Atlantic. E3SMv2 and CESM2 tend to better capture the vertical variations in the PM1 PM4 ratio than EMEP, which has much weaker vertical variations, likely due to biases in the model treatment of wet deposition and vertical transport. The three models tend to agree with each other better below 600 hPa than above 600 hPa.
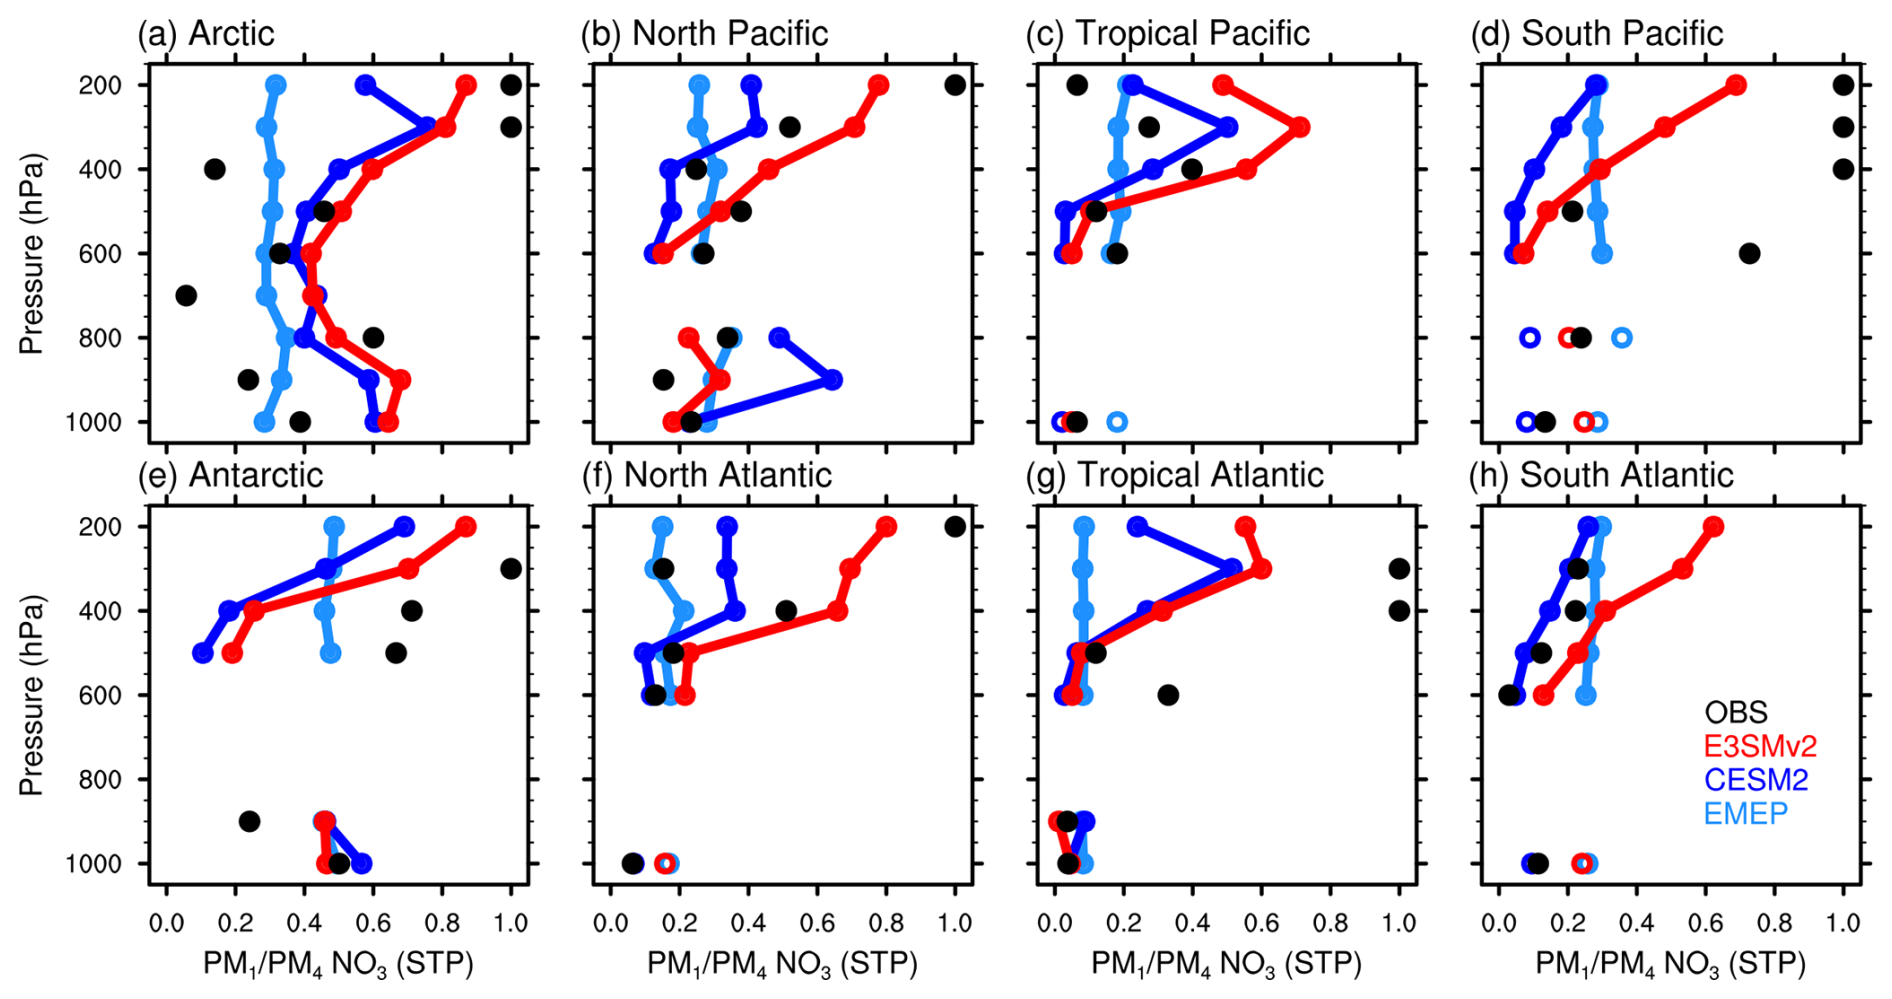
Figure 10The same as Fig. 9 but for the eight regions (marked by boxes in Fig. 2) during the ATom 1–4 campaigns.
3.3 Gas–aerosol partitioning between nitrate aerosol and HNO3
Figure 11 evaluates the modeled annual mean surface molar ratios from E3SMv2, CESM2, and AeroCom phase III models against ground-based observations from CASTNET sites over the US, EMEP sites over Europe, and EANET sites over East Asia. Overall, ground-based observations give an annual mean surface molar ratio of 0.52. The observed annual mean molar ratios at CASTNET, EMEP, and EANET sites are 0.46, 0.61, and 0.78, respectively. Observed surface molar ratios mostly fall between 0.2 and 0.8. In general, CESM2 and OsloCTM3 overestimate the surface molar ratio averaged over all sites, while the other AeroCom models underestimate the surface molar ratio. The simulated surface molar ratio in E3SMv2 agrees with the observations reasonably well. Note that the models' performance in simulating the surface molar ratio does not necessarily align with the global annual mean tropospheric burden ratio (Table 3). GMI produces the lowest surface molar ratio, which is consistent with the lowest global annual mean tropospheric burden ratio it produced among all models (Table 3). However, EMEP underestimates the surface molar ratio, resulting in values lower than those of several other models, while it produces the highest global annual mean tropospheric burden ratio among all models.
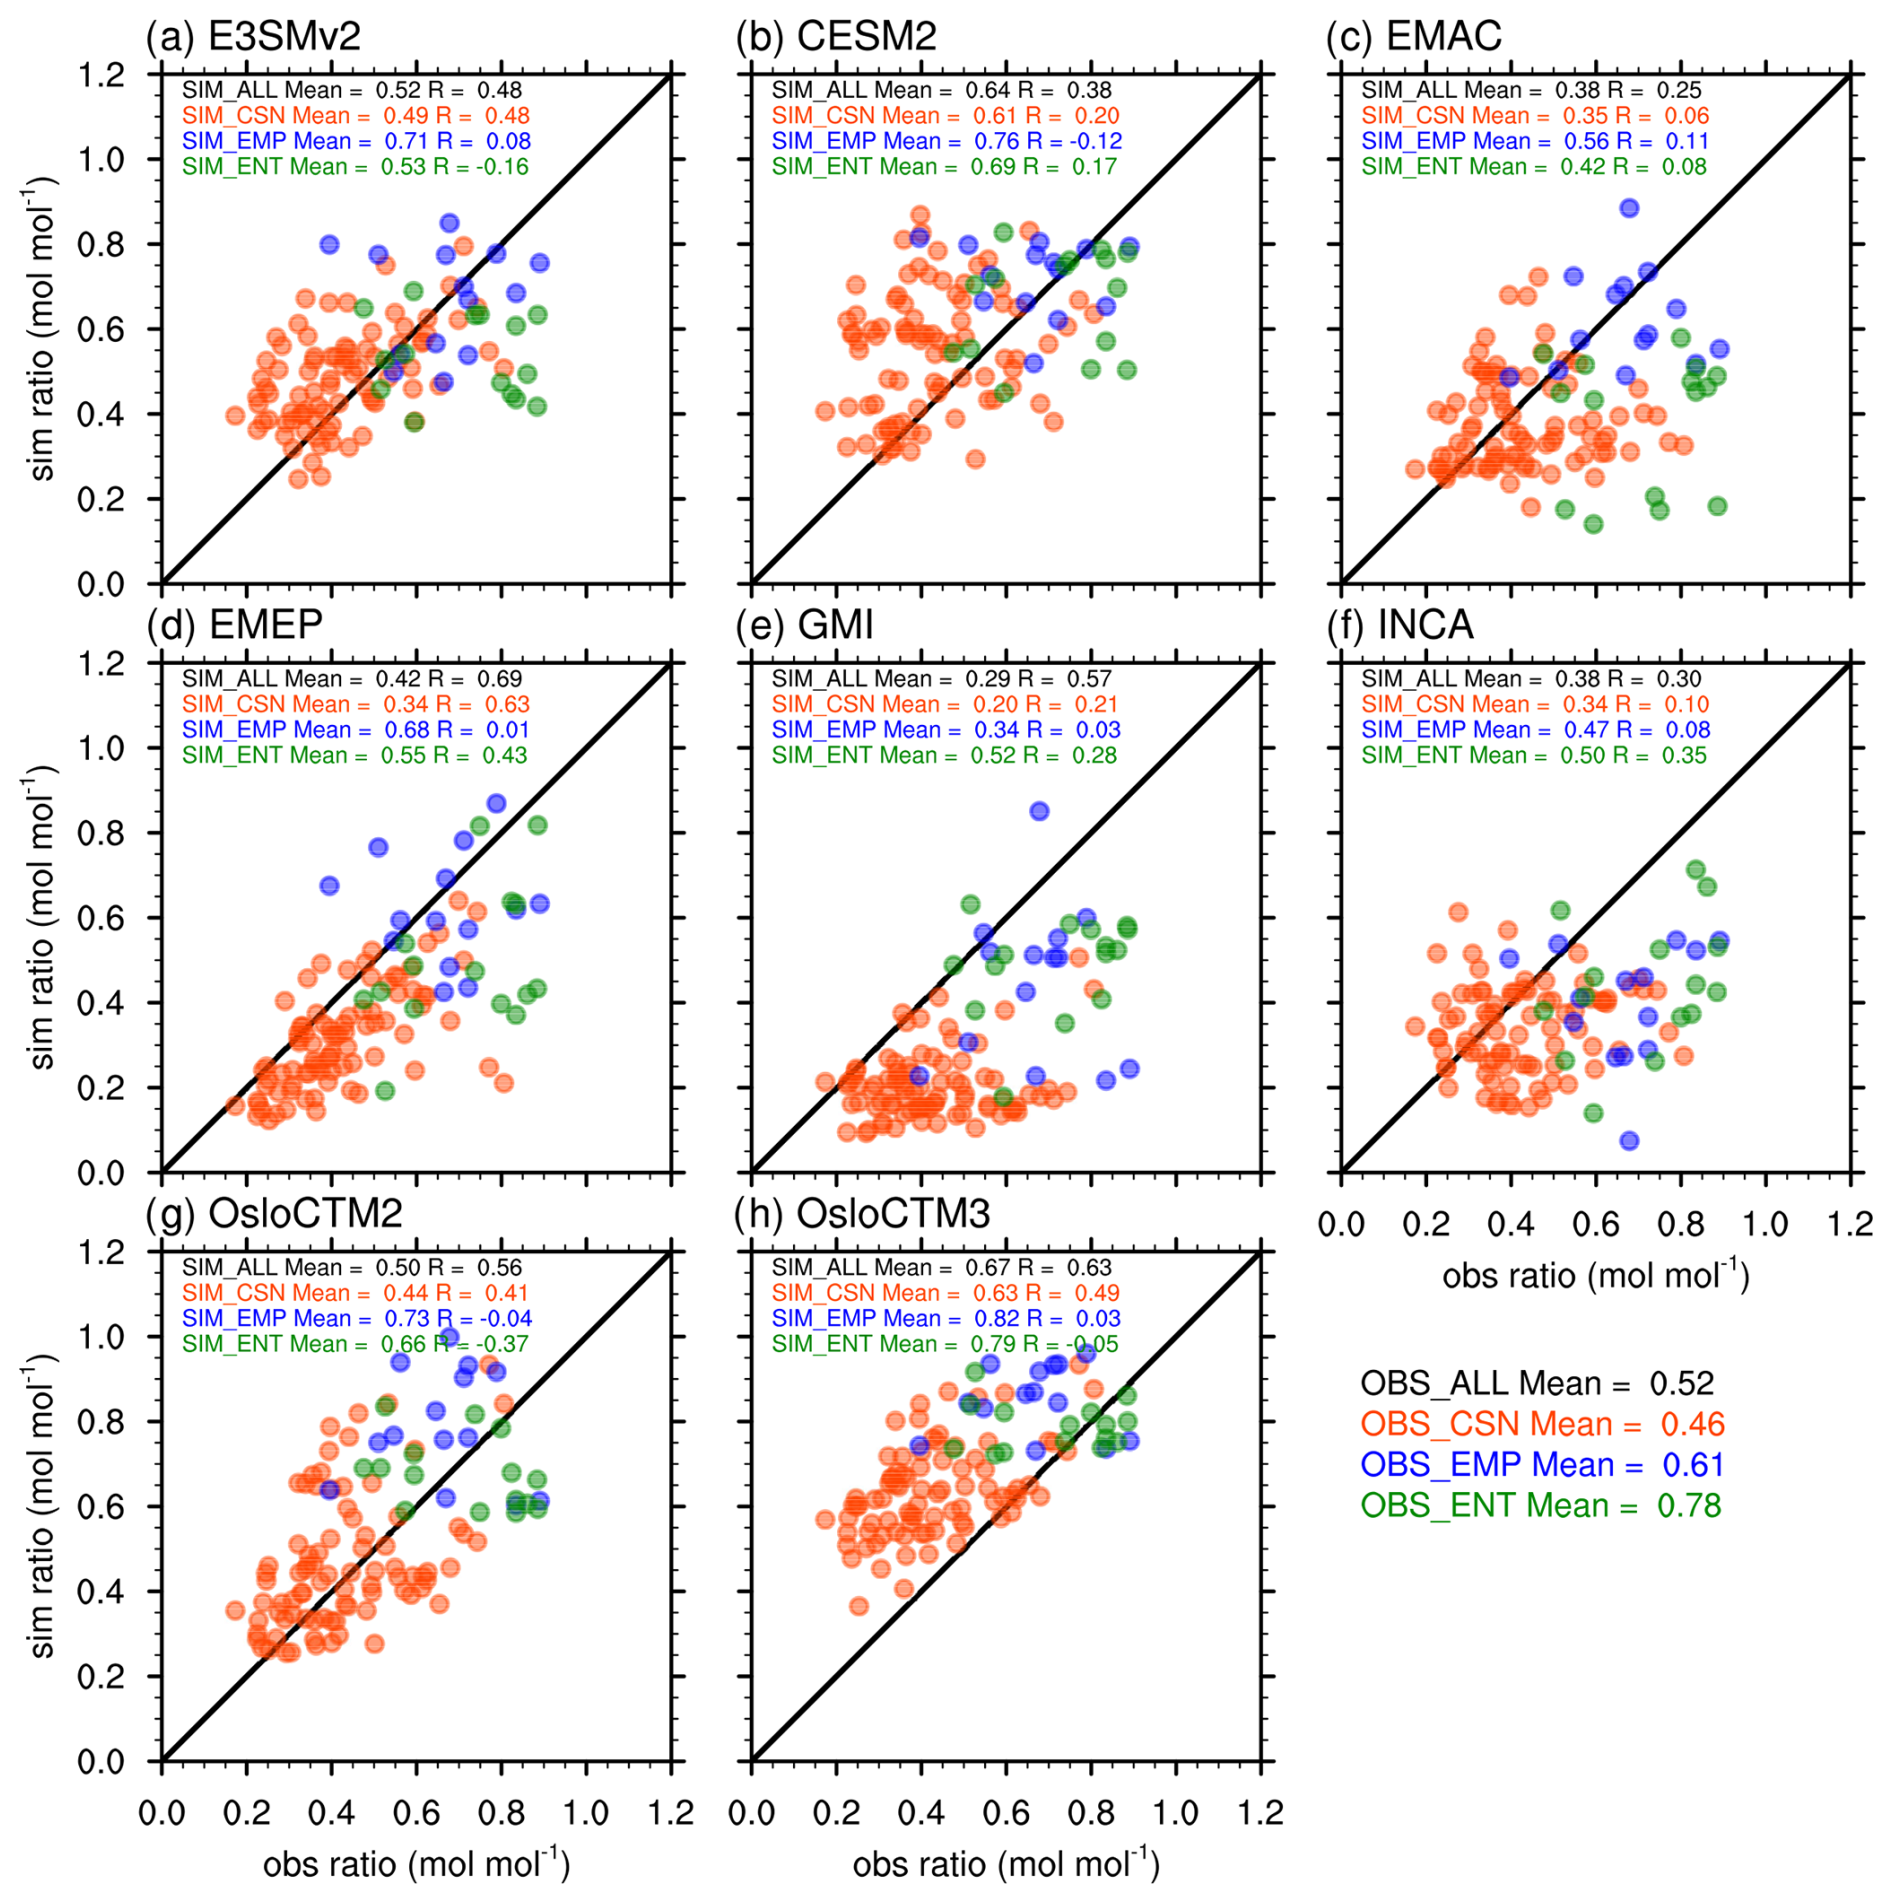
Figure 11Scatterplots of modeled annual mean surface molar ratios (mol mol−1) compared with observations from CASTNET (CSN, red dots), EMEP (EMP, blue dots), and EANET (ENT, green dots). The numbers are mean ratios and correlation coefficients at the corresponding sites. Solid lines represent the 1:1 comparison.
Figures 12 and 13 show the seasonal variations in the modeled surface molar ratio in comparison with observations at the same selected sites in Figs. 7 and 8, respectively. In general, there are large spreads in the modeled surface molar ratios. The large spreads in modeled HNO3 surface concentrations (Figs. S7 and S8) partially contribute to the large uncertainties in the modeled surface molar ratios, which can be further related to model differences in multiple processes, such as gas–aerosol partitioning between nitrate aerosol- and gas-phase HNO3, sulfate aerosol formation, gas-phase chemistry (e.g., He et al., 2015), and wet removal of HNO3 (e.g., Luo et al., 2019). Comparisons of nitrate surface concentration with CASTNET measurements are also provided in the Supplement (Figs. S9 and S10). In Fig. 12, the measured surface molar ratios at all six sites, which are dominated by coarse-mode nitrate, show relatively weak seasonal variations compared to Fig. 13. The measured molar ratios at Everglades NP and Virgin Island (Fig. 12a and b) are around 0.8 and 0.9, respectively, with small fluctuations. As shown in Fig. 7a and b, the two sites are dominated by coarse-mode nitrate formed through irreversible heterogeneous reactions on large dust and sea salt particles. The two sites also have weaker seasonal variations in sulfate aerosol than sites in the Northeastern US (summer high, winter low) (see Figs. S3 and S4). These factors can contribute to the high molar ratios and weak seasonal variations at the two sites. OsloCTM2 and OsloCTM3 have positive biases in the modeled surface molar ratios at the two marine sites, which is mainly due to their gas–aerosol partitioning methods (only TEQMs). However, EMAC has negative biases at the two sites, which is mainly due to its significant positive biases in HNO3. The observed relatively low molar ratios in summer at Acadia NP (Fig. 12c) are consistent with the relatively high sulfate concentrations (Fig. S3) and nitrate PM2.5 PM10 ratios (Fig. 7c). The measured molar ratios at the three dusty sites (Fig. 12d–f) are between 0.2 and 0.6. Their seasonal variations are correlated with the seasonality of dust aerosol (see Fig. S2).
In Fig. 13, the measured surface molar ratios at all six sites, which are dominated by fine-mode nitrate (mostly ammonium nitrate), show strong seasonal variations (summer low, winter high) due to seasonal variations in temperature, precipitation, and sulfate (Fig. S4), with maximum values between 0.5 and 0.8 during winter and minimum values around 0.2 during summer. All models capture the seasonal variations to varying degrees and have larger spread in the modeled molar ratio in winter, ranging from below 0.2 to above 0.8, than in summer. Although the model spread in the simulated HNO3 at these sites is large across all seasons, the colder temperatures, lower precipitation, and lower sulfate concentrations at the same locations in winter promote more favorable conditions for nitrate formation compared to summer. Also, as indicated by Fig. 8, the nitrate formation pathway in winter is mainly through thermodynamic interactions between HNO3 and NH3 in most models, while nitrate formation through heterogeneous reactions on coarse dust and sea salt particles also tends to make a significant contribution in summer in many models. Unlike observations, many models, especially E3SMv2, produce the maximum of surface molar ratio in spring and autumn. GMI consistently produces the lowest surface molar ratio across all months and significantly underestimates it during winter.
In this study, we evaluate the simulated PM1 and PM2.5 nitrate concentrations, nitrate PM2.5 PM10 and PM1 PM4 ratios, and surface ) molar ratios from E3SMv2, CESM2, and six selected AeroCom phase III models against observations from multiple ground networks and aircraft campaigns. We find that both E3SMv2 and CESM2 overestimate the annual mean PM2.5 nitrate surface concentration averaged over all IMPROVE, EMEP, ANTSO ASP, South African, and Japanese sites, whereas the six AeroCom models underestimate it. There are large spreads in the modeled vertical profiles of fine-mode nitrate, in some cases by 2 to 3 orders of magnitude. Most of the AeroCom models underestimate PM1 nitrate concentrations below 600 hPa compared to the ARCTAS, DC3, SEAC4RS, and KORUS-AQ campaigns. OsloCTM2 and OsloCTM3, which both use only TEQMs for the formation of coarse-mode nitrate, have uniformly significant negative biases in fine-mode nitrate concentration. EMAC, which uses only TEQM but considers the kinetic limitation, has the smallest biases in the annual mean PM2.5 nitrate surface concentration among all models.
The observed nitrate PM2.5 PM10 and PM1 PM4 ratios are influenced by the relative contribution of fine sulfate or organic particles and coarse dust or sea salt particles. Overall, the ground-based observations give an annual mean surface nitrate PM2.5 PM10 ratio of 0.7 averaged across all sites with regional annual mean ratios at the co-located IMPROVE–CASTNET, EMEP, South African, and Japanese sites of 0.82, 0.71, 0.56, and 0.57, respectively. Most models have negative biases in all four regions. The model differences in gas–aerosol partitioning and large uncertainties in the simulated life cycle of dust and sea salt contribute to the uncertainties in simulating the mass size distribution of nitrate. E3SMv2, EMEP, and INCA slightly overestimate the annual mean surface nitrate PM2.5 PM10 ratio, but they still have negative biases for a considerable number of sites. EMAC, OsloCTM2, and OsloCTM3, which all use only TEQMs for the formation of coarse-mode nitrate, have larger biases than the other three AeroCom models, which use the first-order loss approximation. E3SMv2 (coupled with MOSAIC) tends to agree reasonably well with observations, while CESM2 (also coupled with MOSAIC) has negative biases in all four regions. The observed PM2.5 PM10 ratios at two US marine sites are around 0.3 and 0.2, respectively, with small fluctuations, while the observed PM2.5 PM10 ratios at three dusty sites are higher but below 0.6 for most of the year. Quite a few of the models produce much stronger seasonal variations (summer low, winter high) in surface PM2.5 PM10 ratios than observations and have large negative biases during May to September at six selected sites over the US where the observed surface nitrate PM2.5 PM10 ratios are around 0.8.
Observed PM1 PM4 ratios from the ARCTAS, DC3, and SEAC4RS campaigns are low (around 0.2) near the surface (below 900 hPa), as they are dominated by coarse PM1–4 nitrate formed on sea salt and dust. The observed PM1 PM4 ratios from the WINTER and KORUS-AQ campaigns are high (around 0.8) near the surface, as they are dominated by fine PM1 nitrate from anthropogenic pollution. The observed PM1 PM4 ratio increases with altitude from 0.2 to 0.8 in DC3 and SEAC4RS but decreases with altitude from 0.8 to 0.2 in WINTER and KORUS-AQ. In general, there are large spreads in the modeled PM1 PM4 ratios of nitrate from E3SMv2, CESM2, and EMEP. The modeled PM1 PM4 ratios can range from near zero in EMEP to 1 in CESM2 in ARCTAS and KORUS-AQ. The observed PM1 PM4 ratios from ATom are also low (less than 0.4) below 600 hPa, while fine-mode nitrate tends to dominate in the middle to upper troposphere. E3SMv2 and CESM2 tend to capture the observed strong vertical variations in PM1 PM4 ratios better than EMEP.
Overall, ground-based observations give an annual mean surface molar ratio of 0.52 averaged across all sites, with regional annual mean ratios at the CASTNET, EMEP, and EANET sites of 0.46, 0.61, and 0.78, respectively. In general, most models overestimate the surface molar ratio averaged over all sites. The observed surface molar ratios at sites dominated by coarse-mode nitrate show relatively weak seasonal variations. The measured molar ratios at the two marine sites are high (around or above 0.8) with small fluctuations, while the measured molar ratios at the three dusty sites are relatively low (between 0.2 and 0.6). The observed surface molar ratios at sites dominated by fine-mode nitrate show strong seasonal variations (summer low, winter high) with maximum values between 0.5 and 0.8 during winter and minimum values around 0.2 during summer. There are large spreads in the modeled surface molar ratios at the selected sites, which are caused by not only the model differences in gas–aerosol partitioning but also the large uncertainties in modeled HNO3 or total nitrate (). Multiple processes such as gas-phase chemistry (O3–NOx–HOxchemistry or N2O5 hydrolysis) and the wet removal of HNO3 can also greatly affect the abundance of HNO3 and therefore change the molar ratio. In addition to those processes, sulfate aerosol formation as well as other processes can affect the abundance of free NH3 available to react with HNO3 and form particulate ammonium nitrate. All models capture the seasonal variations to varying degrees but have larger spread in the modeled molar ratio in winter than in summer at the sites dominated by fine-mode nitrate. Differences in temperature, precipitation, and sulfate concentrations, which favor nitrate formation in winter, and different dominant nitrate formation pathways contribute to the different model spread between winter and summer.
Our study indicates the importance of gas–aerosol partition parameterization and simulation of dust and sea salt in correctly simulating the mass size distribution of nitrate. Our analysis suggests that future studies and model development efforts should better represent heterogeneous reactions of nitrate formation on coarse dust and sea salt particles and use first-order loss approximation with TEQMs or dynamic mass transfer approach for gas–aerosol partitioning between nitrate aerosol and HNO3 gas, as all models that use only TEQMs have larger biases than the other models. Using TEQMs only may also significantly underestimate fine-mode nitrate compared with the other two methods. The large spread in the modeled life cycle of dust and sea salt can largely affect the mass size distribution of nitrate in GCMs and CTMs. Joint measurements of both fine- and coarse-mode nitrate (e.g., PM2.5 and PM10) with sulfate, ammonium, dust, sea salt, and related gases (e.g., HNO3, NH3, and SO2) using a unified sampling protocol would greatly benefit future studies.
Although E3SMv2 and CESM2 have a lot of similarities in physical and chemical parameterizations, there are considerable differences between the two models in the modeled PM1 and PM2.5 nitrate concentrations, nitrate PM2.5 PM10 and PM1 PM4 ratios, and surface () molar ratios. Here we briefly discuss some important differences between the two models in aerosol parameterizations which can significantly impact the simulation of nitrate aerosol. Both E3SMv2 and CESM2 use the same dust emission scheme (Zender et al., 2003) but with a different source function, which results in substantially different spatial distributions of dust emissions (Wu et al., 2020). Compared to E3SMv2, CESM2 reduces the geometric standard deviation in the accumulation and coarse modes of MAM4, which greatly reduces the dry deposition velocities for coarse dust and sea salt particles and increases the lifetime of dust and sea salt aerosol (Wu et al., 2020). Both E3SMv2 and CESM2 have an issue in the numerical coupling of aerosol emissions, dry deposition, and turbulent mixing. However, this issue has a much more significant impact on the life cycle of dust and sea salt in E3SMv2, as the lowest model level in E3SMv2 is much closer to the surface than the one in CESM2 (Wan et al., 2024). EAMv2 adopts most of the tunable parameters from the recalibrated atmosphere model, EAMv1p, which significantly improves the simulations of clouds and precipitation climatology but increases anthropogenic aerosol load, such as sulfate, and introduces larger biases into some aerosol-related fields, such as aerosol optical depth (AOD; Ma et al., 2022; Golaz et al., 2022).
It should be noted that the comparisons between model results and observations are subject to considerable spatiotemporal representativeness errors. The selected AeroCom models were only run for 2008, while E3SMv2 and CESM2 were run for 2005–2014. All aircraft campaigns except for ARCTAS are outside the model simulation year (2008) of AeroCom phase III models. WINTER, KORUS-AQ, and ATom are not within the simulation period (2005–2014) of E3SMv2 and CESM2. Bian et al. (2017) showed that there are considerable differences between monthly and daily model results when compared with measurements from ARCTAS. All AeroCom models except EMEP have a relatively coarse horizontal resolution (2–3°), compared to the 1° resolution of E3SMv2 and CESM2. The ATom deployments provided fewer data samples than the other five aircraft campaigns. It is also worth noting that differences in the sampling protocols of ground networks between PM2.5 and PM10 or TPM and aircraft campaigns between PM1 and PM4 make the evaluation of model results challenging.
The E3SM–MOSAIC source code is available at https://github.com/E3SM-Project/E3SM/tree/mingxuanwupnnl/atm/trop_strat_mam4_mosaic_maint2.0 (last access: 5 September 2025; https://doi.org/10.5281/zenodo.17009904, Wu, 2025).
CASTNET data can be downloaded from https://www.epa.gov/castnet/download-data (last access: September 2021). IMPROVE data can be downloaded from https://vista.cira.colostate.edu/Improve/improve-data/ (last access: September 2021). EMEP data can be downloaded from https://ebas-data.nilu.no/Default.aspx (last access: September 2021). EANET data can be downloaded from https://monitoring.eanet.asia/document/public/index (last access: September 2021). ARCTAS data are available at https://www-air.larc.nasa.gov/cgi-bin/ArcView/arctas (last access: September 2021). DC3 data are available at https://www-air.larc.nasa.gov/cgi-bin/ArcView/dc3 (last access: September 2021). SEAC4RS data are available at https://www-air.larc.nasa.gov/cgi-bin/ArcView/seac4rs (last access: September 2021). WINTER data are available at https://data.eol.ucar.edu/master_lists/generated/winter/ (last access: March 2024). KORUS-AQ data are available at https://www-air.larc.nasa.gov/missions/korus-aq/index.html (last access: March 2024). ATom data are available at https://espo.nasa.gov/atom (last access: September 2021). The AeroCom model output is archived on the AeroCom server.
The supplement related to this article is available online at https://doi.org/10.5194/acp-25-10049-2025-supplement.
MW conceived the project, designed the experiments for E3SMv2 and CESM2, and ran the model simulations for E3SMv2 with input from HW. ZL ran the model simulations for CESM2 with input from XL. HB helped with the data processing of AeroCom model output. DC processed and provided the observation data at ANSTO ASP sites over Australia. MW performed the analysis with help and input from HW, HB, ZL, XL, and YF. MW wrote the manuscript with contributions from all co-authors.
At least one of the (co-)authors is a member of the editorial board of Atmospheric Chemistry and Physics. The peer-review process was guided by an independent editor, and the authors also have no other competing interests to declare.
Publisher’s note: Copernicus Publications remains neutral with regard to jurisdictional claims made in the text, published maps, institutional affiliations, or any other geographical representation in this paper. While Copernicus Publications makes every effort to include appropriate place names, the final responsibility lies with the authors.
The authors are grateful to the two anonymous reviewers for their constructive suggestions, which significantly improved the manuscript. The E3SM simulation was performed on a high-performance computing cluster provided by the BER ESMD program and operated by the Laboratory Computing Resource Center at Argonne National Laboratory. The simulations at LSCE were performed using high-performance computing resources from GENCI (Grand Équipement National de Calcul Intensif) under project no. gen2201. The Pacific Northwest National Laboratory (PNNL) is operated for DOE by Battelle Memorial Institute under contract DE-AC05-76RL01830. The Lawrence Livermore National Laboratory (LLNL) is operated by Lawrence Livermore National Security, LLC, for the U.S. Department of Energy, National Nuclear Security Administration, under contract DE-AC52-07NA27344. Argonne National Laboratory is operated for the DOE by UChicago Argonne, LLC, under contract DE-AC02-06CH11357. The work at ANSTO was supported by the Accelerator staff and partially funded by the Australian National Collaborative Research Infrastructure Scheme (NCRIS). We would like to thank Syuichi Itahashi for providing measurements of PM2.5 and PM10 nitrate surface concentrations at the Fukue site in Japan.
This research was supported as part of the E3SM project, funded by the U.S. Department of Energy, Office of Science, Office of Biological and Environmental Research (BER), through the Earth System Model Development (ESMD) program area.
This paper was edited by Markus Petters and reviewed by two anonymous referees.
Adams, P. J., Seinfeld, J. H., Koch, D., Mickley, L., and Jacob, D.: General circulation model assessment of direct radiative forcing by the sulfate-nitrate-ammonium-water inorganic aerosol system, J. Geophys. Res., 106, 1097–1111, https://doi.org/10.1029/2000JD900512, 2001.
Ames, R. B. and Malm, W. C.: Comparison of sulfate and nitrate particle mass concentrations measured by IMPROVE and the CDN, Atmos. Environ., 35, 905–916, https://doi.org/10.1016/S1352-2310(00)00369-1, 2001.
An, Q., Zhang, H., Wang, Z., Liu, Y., Xie, B., Liu, Q., Wang, Z., and Gong, S.: The development of an atmospheric aerosol/chemistry–climate model, BCC_AGCM_CUACE2.0, and simulated effective radiative forcing of nitrate aerosols, J. Adv. Model. Earth Sy., 11, 3816–3835, https://doi.org/10.1029/2019MS001622, 2019.
Barth, M. C., Cantrell, C. A., Brune, W. H., Rutledge, S. A., Craw-ford, J. H., Huntrieser, H., Carey, L. D., MacGorman, D., Weis-man, M., Pickering, K. E., Bruning, E., Anderson, B., Apel, E., Biggerstaff, M., Campos, T., Campuzano-Jost, P., Cohen, R., Crounse, J., Day, D. A., Diskin, G., Flocke, F., Fried, A., Gar-land, C., Heikes, B., Honomichl, S., Hornbrook, R., Huey, L. G., Jimenez, J. L., Lang, T., Lichtenstern, M., Mikoviny, T., Nault, B., O'Sullivan, D., Pan, L. L., Peischl, J., Pollack, I., Richter, D., Riemer, D., Ryerson, T., Schlager, H., Clair, J. S., Walega, J., Weibring, P., Weinheimer, A., Wennberg, P., Wisthaler, A., Wooldridge, P. J., and Ziegler, C.: The Deep Convective Clouds and Chemistry (DC3) Field Campaign, B. Am. Meteorol. Soc., 96, 1281–1309, https://doi.org/10.1175/bams-d-13-00290.1, 2015.
Bassett, M. and Seinfeld, J. H.: Atmospheric equilibrium model of sulfate and nitrate aerosols, Atmos. Environ., 17, 2237–2252, https://doi.org/10.1016/0004-6981(83)90221-4, 1983.
Bellouin, N., Rae, J., Jones, A., Johnson, C., Haywood, J., and Boucher, O.: Aerosol forcing in the Climate Model Intercomparison Project (CMIP5) simulations by HadGEM2-ES and the role of ammonium nitrate, J. Geophys. Res., 116, D20206, https://doi.org/10.1029/2011JD016074, 2011.
Berntsen, T. K. and Isaksen, I. S. A.: A global three-dimensional chemical transport model for the troposphere. 1. Model description and CO and ozone results, J. Geophys. Res., 102, 21239–21280, https://doi.org/10.1029/97JD01140, 1997.
Bian, H., Chin, M., Hauglustaine, D. A., Schulz, M., Myhre, G., Bauer, S. E., Lund, M. T., Karydis, V. A., Kucsera, T. L., Pan, X., Pozzer, A., Skeie, R. B., Steenrod, S. D., Sudo, K., Tsigaridis, K., Tsimpidi, A. P., and Tsyro, S. G.: Investigation of global particulate nitrate from the AeroCom phase III experiment, Atmos. Chem. Phys., 17, 12911–12940, https://doi.org/10.5194/acp-17-12911-2017, 2017.
Boucher, O., Randall, D., Artaxo, P., Bretherton, C., Feingold, G., Forster, P., Kerminen, V.-M., Kondo, Y., Liao, H., Lohmann, U., Rasch, P., Satheesh, S. K., Sherwood, S., Stevens, B., and Zhang, X. Y.: Clouds and aerosols, in: Climate change 2013: the physical science basis. Contribution of Working Group I to the Fifth Assessment Report of the Intergovernmental Panel on Climate Change, Cambridge University Press, Cambridge, United Kingdom and New York, NY, USA, https://doi.org/10.1017/CBO9781107415324, 2013.
Chen, Y., Cheng, Y., Ma, N., Wei, C., Ran, L., Wolke, R., Größ, J., Wang, Q., Pozzer, A., Denier van der Gon, H. A. C., Spindler, G., Lelieveld, J., Tegen, I., Su, H., and Wiedensohler, A.: Natural sea-salt emissions moderate the climate forcing of anthropogenic nitrate, Atmos. Chem. Phys., 20, 771–786, https://doi.org/10.5194/acp-20-771-2020, 2020.
Crawford, J. H., Ahn, J.-Y., Al-Saadi, J., Chang, L., Emmons, L. K., Kim, J., Lee, G., Park, J.-H., Park, R. J., Woo, J. H., Song, C.-K., Hong, J.-H., Hong, Y.-D., Lefer, B. L., Lee, M., Lee, T., Kim, S., Min, K.-E., Yum, S. S., Shin, H. J., Kim, Y.-W., Choi, J.-S., Park, J.-S., Szykman, J. J., Long, R. W., Jordan, C. E., Simpson, I. J., Fried, A., Dibb, J. E., Cho, S., and Kim, Y. P.: The Korea–United States Air Quality (KORUS-AQ) field study, Elem. Sci. Anth., 9, 1–27, https://doi.org/10.1525/elementa.2020.00163, 2021.
Danabasoglu, G., Lamarque, J.-F., Bacmeister, J., Bailey, D. A., DuVivier, A. K., Edwards, J., Emmons, L. K., Fasullo, J., Garcia, R., Gettelman, A., Hannay, C., Holland, M. M., Large, W. G., Lauritzen, P. H., Lawrence, D. M., Lenaerts, J. T. M., Lindsay, K., Lipscomb, W. H., Mills, M. J., Neale, R., Oleson, K. W., Otto-Bliesner, B., Phillips, A. S., Sacks, W., Tilmes, S., van Kampenhout, L., Vertenstein, M., Bertini, A., Dennis, J., Deser, C., Fischer, C., Fox-Kemper, B., Kay, J. E., Kinnison, D., Kushner, P. J., Larson, V. E., Long, M. C., Mickelson, S., Moore, J. K., Nienhouse, E., Polvani, L., Rasch, P. J., and Strand, W. G.: The Community Earth System Model Version 2 (CESM2), J. Adv. Model. Earth Sy., 12, e2019MS001916, https://doi.org/10.1029/2019MS001916, 2020.
Dentener, F. J., Carmichael, G. R., Zhang, Y., Lelieveld, J., and Crutzen, P. J.: Role of mineral aerosol as a reactive surface in the global troposphere, J. Geophys. Res., 101, 22869–22889, https://doi.org/10.1029/96JD01818, 1996.
Emmons, L. K., Walters, S., Hess, P. G., Lamarque, J.-F., Pfister, G. G., Fillmore, D., Granier, C., Guenther, A., Kinnison, D., Laepple, T., Orlando, J., Tie, X., Tyndall, G., Wiedinmyer, C., Baughcum, S. L., and Kloster, S.: Description and evaluation of the Model for Ozone and Related chemical Tracers, version 4 (MOZART-4), Geosci. Model Dev., 3, 43–67, https://doi.org/10.5194/gmd-3-43-2010, 2010.
Emmons, L. K., Schwantes, R. H., Orlando, J. J., Tyndall, G., Kinnison, D., Lamarque, J.-F., Marsh, D., Mills, M. J., Tilmes, S., Bardeen, C., Buchholz, R. R., Conley, A., Gettelman, A., Garcia, R., Simpson, I., Blake, D. R., Meinardi, S., and Pétron, G.: The chemistry mechanism in the Community Earth System Model version 2 (CESM2), J. Adv. Model. Earth Sy., 12, e2019MS001882, https://doi.org/10.1029/2019MS001882, 2020.
Feng, Y. and Penner, J. E.: Global modeling of nitrate and ammonium: Interaction of aerosols and tropospheric chemistry, J. Geophys. Res., 112, D01304, https://doi.org/10.1029/2005JD006404, 2007.
Fountoukis, C. and Nenes, A.: ISORROPIA II: a computationally efficient thermodynamic equilibrium model for K+–Ca2+–Mg2+––Na+–––Cl−–H2O aerosols, Atmos. Chem. Phys., 7, 4639–4659, https://doi.org/10.5194/acp-7-4639-2007, 2007.
Folberth, G. A., Hauglustaine, D. A., Lathière, J., and Brocheton, F.: Interactive chemistry in the Laboratoire de Météorologie Dynamique general circulation model: model description and impact analysis of biogenic hydrocarbons on tropospheric chemistry, Atmos. Chem. Phys., 6, 2273–2319, https://doi.org/10.5194/acp-6-2273-2006, 2006.
Fridlind, A. M., and Jacobson, M. Z.: A study of gas-aerosol equilibrium and aerosol pH in the remote marine boundary layer during the First Aerosol Characterization Experiment (ACE 1), J. Geophys. Res., 105, 17325–17340, 2000.
Froyd, K. D., Murphy, D. M., Brock, C. A., Campuzano-Jost, P., Dibb, J. E., Jimenez, J.-L., Kupc, A., Middlebrook, A. M., Schill, G. P., Thornhill, K. L., Williamson, C. J., Wilson, J. C., and Ziemba, L. D.: A new method to quantify mineral dust and other aerosol species from aircraft platforms using single-particle mass spectrometry, Atmos. Meas. Tech., 12, 6209–6239, https://doi.org/10.5194/amt-12-6209-2019, 2019.
Gelaro, R., McCarty, W., Suárez, M. J., Todling, R., Molod, A., Takacs, L., Randles, C. A., Darmenov, A., Bosilovich, M. G., Reichle, R., Wargan, K., Coy, L., Cullather, R., Draper, C., Akella, S., Buchard, V., Conaty, A., da Silva, A. M., Gu, W., Kim, G.-K., Koster, R., Lucchesi, R., Merkova, D., Nielsen, J. E., Partyka, G., Pawson, S., Putman, W., Rienecker, M., Schubert, S. D., Sienkiewicz, M., and Zhao, B.: The Modern-Era Retrospective Analysis for Research and Applications, Version 2 (MERRA-2), J. Climate, 30, 5419–5454, https://doi.org/10.1175/JCLI-D-16- 0758.1, 2017.
Gettelman, A. and Morrison, H.: Advanced two-moment bulk microphysics for global models. Part I: Off-line tests and comparison with other schemes, J. Climate, 28, 1268-1287, https://doi.org/10.1175/JCLI-D-14-00102.1, 2015.
Golaz, J. C., Larson, V. E., and Cotton, W. R.: A pdf-based model for boundary layer clouds. Part I: Method and model description, J. Atmos. Sci., 59, 3540–3551, https://doi.org/10.1175/1520-0469(2002)059<3540:APBMFB>2.0.CO;2, 2002.
Golaz, J.-C., Van Roekel, L. P., Zheng, X., Roberts, A. F., Wolfe, J. D., Lin, W., Bradley, A. M., Tang, Q., Maltrud, M. E., Forsyth, R. M., Zhang, C., Zhou, T., Zhang, K., Zender, C. S., Wu, M., Wang, H., Turner, A. K., Singh, B., Richter, J. H., Qin, Y., Petersen, M. R., Mametjanov, A., Ma, P.-L., Larson, V. E., Krishna, J., Keen, N. D., Jeffery, N., Hunke, E. C., Hannah, W. M., Guba, O., Griffin, B. M., Feng, Y., Engwirda, D., Di Vittorio, A. V., Dang, C., Conlon, L. M., Chen, C.-C.-J., Brunke, M. A., Bisht, G., Benedict, J. J., Asay-Davis, X. S., Zhang, Y., Zhang, M., Zeng, X., Xie, S., Wolfram, P. J., Vo, T., Veneziani, M., Tesfa, T. K., Sreepathi, S., Salinger, A. G., Reeves Eyre, J. E. J., Prather, M. J., Mahajan, S., Li, Q., Jones, P. W., Jacob, R. L., Huebler, G. W., Huang, X., Hillman, B. R., Harrop, B. E., Foucar, J. G., Fang, Y., Comeau, D. S., Caldwell, P. M., Bartoletti, T., Balaguru, K., Taylor, M. A., McCoy, R. B., Leung, L. R., and Bader, D. C.: The DOE E3SM Model version 2: Overview of the physical model and initial model evaluation, J. Adv. Model. Earth Sy., 14, e2022MS003156, https://doi.org/10.1029/2022MS003156, 2022.
Gong, C., Tian, H., Liao, H., Pan, N., Pan, S., Ito, A., Jain, A. K., Kou-Giesbrecht, S., Joos, F., Sun, Q., Shi, H., Vuichard, N., Zhu, Q., Peng, C., Maggi, F., Tang, F. H. M., and Zaehle, S.: Global net climate effects of anthropogenic reactive nitrogen, Nature, 632, 557–563, https://doi.org/10.1038/s41586-024-07714-4, 2024.
Guo, H., Campuzano-Jost, P., Nault, B. A., Day, D. A., Schroder, J. C., Kim, D., Dibb, J. E., Dollner, M., Weinzierl, B., and Jimenez, J. L.: The importance of size ranges in aerosol instrument intercomparisons: a case study for the Atmospheric Tomography Mission, Atmos. Meas. Tech., 14, 3631–3655, https://doi.org/10.5194/amt-14-3631-2021, 2021.
Hauglustaine, D. A., Hourdin, F., Walters, S., Jourdain, L., Filiberti, M.-A., Larmarque, J.-F., and Holland, E. A.: Interactive chemistry in the Laboratoire de Météorologie Dynamique general circulation model: description and background tropospheric chemistry evaluation, J. Geophys. Res., 109, D04314, https://doi.org/10.1029/2003JD003957, 2004.
Hauglustaine, D. A., Balkanski, Y., and Schulz, M.: A global model simulation of present and future nitrate aerosols and their direct radiative forcing of climate, Atmos. Chem. Phys., 14, 11031–11063, https://doi.org/10.5194/acp-14-11031-2014, 2014.
Hayami, H. and Fujita, S.: Concentrations and gas-aerosol partitioning of semi-volatile inorganic species measured with denuder/filter-pack sampling system in Tokyo, J. Jpn. Soc. Atmos. Environ., 39, 77–88, https://doi.org/10.11298/taiki1995.39.2_77, 2004.
He, J., Zhang, Y., Tilmes, S., Emmons, L., Lamarque, J.-F., Glotfelty, T., Hodzic, A., and Vitt, F.: CESM/CAM5 improvement and application: comparison and evaluation of updated CB05_GE and MOZART-4 gas-phase mechanisms and associated impacts on global air quality and climate, Geosci. Model Dev., 8, 3999–4025, https://doi.org/10.5194/gmd-8-3999-2015, 2015.
Hering, S. and Cass, G.: The magnitude of bias in the measurement of PM2.5 arising from volatilization of particulate nitrate from Teflon filters, J. Air Waste Manage. Assoc., 49, 725–733, https://doi.org/10.1080/10473289.1991.10463843, 1999.
Hoesly, R. M., Smith, S. J., Feng, L., Klimont, Z., Janssens-Maenhout, G., Pitkanen, T., Seibert, J. J., Vu, L., Andres, R. J., Bolt, R. M., Bond, T. C., Dawidowski, L., Kholod, N., Kurokawa, J.-I., Li, M., Liu, L., Lu, Z., Moura, M. C. P., O'Rourke, P. R., and Zhang, Q.: Historical (1750–2014) anthropogenic emissions of reactive gases and aerosols from the Community Emissions Data System (CEDS), Geosci. Model Dev., 11, 369–408, https://doi.org/10.5194/gmd-11-369-2018, 2018.
Itahashi, S., Hayami, H., Uno, I., Pan, X., and Uematsu, M.: Importance of coarse-mode nitrate produced via sea salt as atmospheric input to East Asian oceans, Geophys. Res. Lett., 43, 5483–5491, https://doi.org/10.1002/2016GL068722, 2016.
Jacob, D. J., Crawford, J. H., Maring, H., Clarke, A. D., Dibb, J. E., Emmons, L. K., Ferrare, R. A., Hostetler, C. A., Russell, P. B., Singh, H. B., Thompson, A. M., Shaw, G. E., McCauley, E., Pederson, J. R., and Fisher, J. A.: The Arctic Research of the Composition of the Troposphere from Aircraft and Satellites (ARCTAS) mission: design, execution, and first results, Atmos. Chem. Phys., 10, 5191–5212, https://doi.org/10.5194/acp-10-5191-2010, 2010.
Janssens-Maenhout, G., Crippa, M., Guizzardi, D., Dentener, F., Muntean, M., Pouliot, G., Keating, T., Zhang, Q., Kurokawa, J., Wankmüller, R., Denier van der Gon, H., Kuenen, J. J. P., Klimont, Z., Frost, G., Darras, S., Koffi, B., and Li, M.: HTAP_v2.2: a mosaic of regional and global emission grid maps for 2008 and 2010 to study hemispheric transport of air pollution, Atmos. Chem. Phys., 15, 11411–11432, https://doi.org/10.5194/acp-15-11411-2015, 2015.
Karydis, V. A., Tsimpidi, A. P., Pozzer, A., Astitha, M., and Lelieveld, J.: Effects of mineral dust on global atmospheric nitrate concentrations, Atmos. Chem. Phys., 16, 1491–1509, https://doi.org/10.5194/acp-16-1491-2016, 2016.
Khan, M. F., Shirasuna, Y., Hirano, K., and Masunaga, S.: Characterization of PM2.5, PM2.5–10 and PM>10 in ambient air, Yokohama, Japan, Atmos. Res., 96, 159–172, https://doi.org/10.1016/j.atmosres.2009.12.009, 2010.
Kulmala, M., Laaksonen, A., Korhonen, P., Vesala, T., Ahonen, T., and Barrett, J. C.: The effects of atmospheric nitric-acid vapor on cloud condensation nucleus activation, J. Geophys. Res., 98, 22949–22958, https://doi.org/10.1029/93JD02070, 1993.
Larson, V. E.: CLUBB-SILHS: A parameterization of subgrid variability in the atmosphere, arXiv preprint, arXiv:1711.03675, https://doi.org/10.48550/arXiv.1711.03675, 2017.
Lawrence, D., Fisher, R., Koven, C., Oleson, K., Swenson, S., Vertenstein, M., Andre, B., Bonan, G., Ghimire, B., van Kampenhout, L., Kennedy, D., Kluzek, E., Knox, R., Lawrence, P., Li, F., Li, H., Lombardozzi, D., Lu, Y., Perket, J., Riley, W., Sacks, W., Shi, M., Wieder, W., Xu, C., Ali, A., Badger, A., Bisht, G., Broxton, P., Brunke, M., Buzan, J., Clark, M., Craig, T., Dahlin, K., Drewniak, B., Emmons, L., Fisher, J., Flanner, M., Gentine, P., Lenaerts, J., Levis, S., Leung, L. R., Lipscomb, W., Pelletier, J., Ricciuto, D. M., Sanderson, B., Shuman, J., Slater, A., Subin, Z., Tang, J., Tawfik, A., Thomas, Q., Tilmes, S., Vitt, F., and Zeng, X.: Technical description of version 5.0 of the Community Land Model (CLM), http://www.cesm.ucar.edu/models/cesm2/land/CLM50_Tech_Note.pdf, 2019.
Liao, H., and Seinfeld, J. H.: Global impacts of gas-phase chemistry-aerosol interactions on direct radiative forcing by anthropogenic aerosols and ozone, J. Geophys. Res., 110, D18208, https://doi.org/10.1029/2005JD005907, 2005.
Liu, X., Ma, P.-L., Wang, H., Tilmes, S., Singh, B., Easter, R. C., Ghan, S. J., and Rasch, P. J.: Description and evaluation of a new four-mode version of the Modal Aerosol Module (MAM4) within version 5.3 of the Community Atmosphere Model, Geosci. Model Dev., 9, 505–522, https://doi.org/10.5194/gmd-9-505-2016, 2016.
Lu, Z., Liu, X., Zaveri, R. A., Easter, R. C., Tilmes, S., Emmons, L. K., Vitt, F., Singh, B., Wang, H., Zhang, R., and Rasch, P. J.: Radiative forcing of nitrate aerosols from 1975 to 2010 as simulated by MOSAIC module in CESM2-MAM4, J. Geophys. Res.-Atmos., 126, https://doi.org/10.1029/2021JD034809, 2021.
Luo, G., Yu, F., and Schwab, J.: Revised treatment of wet scavenging processes dramatically improves GEOS-Chem 12.0.0 simulations of surface nitric acid, nitrate, and ammonium over the United States, Geosci. Model Dev., 12, 3439–3447, https://doi.org/10.5194/gmd-12-3439-2019, 2019.
Ma, P.-L., Harrop, B. E., Larson, V. E., Neale, R. B., Gettelman, A., Morrison, H., Wang, H., Zhang, K., Klein, S. A., Zelinka, M. D., Zhang, Y., Qian, Y., Yoon, J.-H., Jones, C. R., Huang, M., Tai, S.-L., Singh, B., Bogenschutz, P. A., Zheng, X., Lin, W., Quaas, J., Chepfer, H., Brunke, M. A., Zeng, X., Mülmenstädt, J., Hagos, S., Zhang, Z., Song, H., Liu, X., Pritchard, M. S., Wan, H., Wang, J., Tang, Q., Caldwell, P. M., Fan, J., Berg, L. K., Fast, J. D., Taylor, M. A., Golaz, J.-C., Xie, S., Rasch, P. J., and Leung, L. R.: Better calibration of cloud parameterizations and subgrid effects increases the fidelity of the E3SM Atmosphere Model version 1, Geosci. Model Dev., 15, 2881–2916, https://doi.org/10.5194/gmd-15-2881-2022, 2022.
Mahowald, N. M., Li, L., Vira, J., Prank, M., Hamilton, D. S., Matsui, H., Miller, R. L., Lu, P. L., Akyuz, E., Meidan, D., Hess, P., Lihavainen, H., Wiedinmyer, C., Hand, J., Alaimo, M. G., Alves, C., Alastuey, A., Artaxo, P., Barreto, A., Barraza, F., Becagli, S., Calzolai, G., Chellam, S., Chen, Y., Chuang, P., Cohen, D. D., Colombi, C., Diapouli, E., Dongarra, G., Eleftheriadis, K., Engelbrecht, J., Galy-Lacaux, C., Gaston, C., Gomez, D., González Ramos, Y., Harrison, R. M., Heyes, C., Herut, B., Hopke, P., Hüglin, C., Kanakidou, M., Kertesz, Z., Klimont, Z., Kyllönen, K., Lambert, F., Liu, X., Losno, R., Lucarelli, F., Maenhaut, W., Marticorena, B., Martin, R. V., Mihalopoulos, N., Morera-Gómez, Y., Paytan, A., Prospero, J., Rodríguez, S., Smichowski, P., Varrica, D., Walsh, B., Weagle, C. L., and Zhao, X.: AERO-MAP: a data compilation and modeling approach to understand spatial variability in fine- and coarse-mode aerosol composition, Atmos. Chem. Phys., 25, 4665–4702, https://doi.org/10.5194/acp-25-4665-2025, 2025.
Malm, W. C., Sisler, J. F., Huffman, D., Eldred, R. A., and Cahill, T. A.: Spatial and seasonal trends in particle concentration and optical extinction in the United States, J. Geophys. Res.-Atmos., 99, 1347–1370, https://doi.org/10.1029/93JD02916, 1994.
Maritz, P.: Long-term assessment of aerosol chemical composition in the interior of South Africa, Thesis-PhD, North West University, https://repository.nwu.ac.za/handle/10394/32805 (last access: March 2024), 2019.
McNaughton, C. S., Clarke, A. D., Howell, S. G., Pinkerton, M., Anderson, B., Thornhill, L., Hudgins, C., Winstead, E., Dibb, J. E., Scheuer, E., and Maring, H.: Results from the DC-8 Inlet Characterization Experiment (DICE): Airborne versus surface sampling of mineral dust and sea salt aerosols, Aerosol Sci. Tech., 41, 136–159, https://doi.org/10.1080/02786820601118406, 2007.
Meng, Z. and Seinfeld, J. H.: Time scales to archive atmospheric gas-aerosol equilibrium for volatile species, Atmos. Environ., 30, 2889–2900, https://doi.org/10.1016/1352-2310(95)00493, 1996.
Metzger, S., Dentener, F., Krol, M., Jeuken, A., and Lelieveld, J.: Gas/aerosol partitioning 2. Global modeling results, J. Geophys. Res., 107, 4313, https://doi.org/10.1029/2001JD001103, 2002.
Metzger, S. and Lelieveld, J.: Reformulating atmospheric aerosol thermodynamics and hygroscopic growth into fog, haze and clouds, Atmos. Chem. Phys., 7, 3163–3193, https://doi.org/10.5194/acp-7-3163-2007, 2007.
Mezuman, K., Bauer, S. E., and Tsigaridis, K.: Evaluating secondary inorganic aerosols in three dimensions, Atmos. Chem. Phys., 16, 10651–10669, https://doi.org/10.5194/acp-16-10651-2016, 2016.
Myhre, G., Samset, B. H., Schulz, M., Balkanski, Y., Bauer, S., Berntsen, T. K., Bian, H., Bellouin, N., Chin, M., Diehl, T., Easter, R. C., Feichter, J., Ghan, S. J., Hauglustaine, D., Iversen, T., Kinne, S., Kirkevåg, A., Lamarque, J.-F., Lin, G., Liu, X., Lund, M. T., Luo, G., Ma, X., van Noije, T., Penner, J. E., Rasch, P. J., Ruiz, A., Seland, Ø., Skeie, R. B., Stier, P., Takemura, T., Tsigaridis, K., Wang, P., Wang, Z., Xu, L., Yu, H., Yu, F., Yoon, J.-H., Zhang, K., Zhang, H., and Zhou, C.: Radiative forcing of the direct aerosol effect from AeroCom Phase II simulations, Atmos. Chem. Phys., 13, 1853–1877, https://doi.org/10.5194/acp-13-1853-2013, 2013.
Pan, X., Uno, I., Wang, Z., Yamamoto, S., Hara, Y., Wang, Z.: Seasonal variabilities in chemical compounds and acidity of aerosol particles at urban site in the west Pacific, Environ. Pollut., 237, 868–877, https://doi.org/10.1016/j.envpol.2017.11.089, 2018.
Park, R. J., Oak, Y. J., Emmons, L. K., Kim, C.-H., Pfister, G. G., Carmichael, G. R., Saide, P. E., Cho, S.-Y., Kim, S., Woo, J.-H., Crawford, J. H., Gaubert, B., Lee, H.-J., Park, S.-Y., Jo, Y.-J., Gao, M., Tang, B., Stanier, C. O., Shin, S. S., Park, H. Y., Bae, C., and Kim, E.: Multi-model intercomparisons of air quality simulations for the KORUS-AQ campaign, Elem. Sci. Anth., 9, 00139, https://doi.org/10.1525/elementa.2021.00139, 2021.
Peterson, D. A., Hyer, E. J., Han, S.-O., Crawford, J. H., Park, R. J., Holz, R., Kuehn, R. E., Eloranta, E., Knote, C., Jordan, C. E., and Lefer, B. L.: Meteorology influencing springtime air quality, pollution transport, and visibility in Korea, Elem. Sci. Anth., 7, 57, https://doi.org/10.1525/elementa.395, 2019.
Pilson, M. E.: An Introduction to the Chemistry of the Sea, 2nd Edn., Cambridge University Press, ISBN 9781139047203, https://doi.org/10.1017/CBO9781139047203, 2012.
Rasch, P. J., Xie, S., Ma, P.-L., Lin, W., Wang, H., Tang, Q., Burrows, S. M., Caldwell, P., Zhang, K., Easter, R. C., Cameron-Smith, P., Singh, B., Wan, H., Golaz, J.-C., Harrop, B. E., Roesler, E., Bacmeister, J., Larson, V. E., Evans, K. J., Qian, Y., Taylor, M., Leung, L. R., Zhang, Y., Brent, L., Branstetter, M., Hannay, C., Mahajan, S., Mametjanov, A., Neale, R., Richter, J. H., Yoon, J.-H., Zender, C. S., Bader, D., Flanner, M., Foucar, J. G., Jacob, R., Keen, N., Klein, S. A., Liu, X., Salinger, A. G., Shrivastava, M., and Yang, Y.: An Overview of the Atmospheric Component of the Energy Exascale Earth system Model, J. Adv. Model. Earth Sy., 11, 2377–2411, https://doi.org/10.1029/2019MS001629, 2019.
Sander, R., Baumgaertner, A., Gromov, S., Harder, H., Jöckel, P., Kerkweg, A., Kubistin, D., Regelin, E., Riede, H., Sandu, A., Taraborrelli, D., Tost, H., and Xie, Z.-Q.: The atmospheric chemistry box model CAABA/MECCA-3.0, Geosci. Model Dev., 4, 373–380, https://doi.org/10.5194/gmd-4-373-2011, 2011.
Saxena, P., Hudischewskyj, A. B., Seigneur, C., and Seinfeld, J. H.: A comparative study of equilibrium approaches to the chemical characterization of secondary aerosols, Atmos. Environ., 20, 1471–1483, https://doi.org/10.1016/0004-6981(86)90019-3, 1986.
Szopa, S., Naik, V., Adhikary, B., Artaxo, P., Berntsen, T., Collins, W. D., Fuzzi, S., Gallardo, L., Kiendler-Scharr, A., Klimont, Z., Liao, H., Unger, N., and Zanis, P.: Short-lived climate forcers, in Climate change 2021: The physical science basis. Contribution of Working Group I to the Sixth Assessment Report of the Intergovernmental Panel on Climate Change, edited by Masson-Delmotte, V., Zhai, P., Pirani, A., Connors, S. L., Péan, C., Berger, S., Caud, N., Chen, Y., Goldfarb, L., Gomis, M. I., Huang, M., Leitzell, K., Lonnoy, E., Matthews, J. B. R., Maycock, T. K., Waterfield, T., Yelekçi, O., Yu, R., and Zhou, B., Cambridge University Press, Cambridge, UK and New York, NY, USA, https://doi.org/10.1017/9781009157896.008, 2021.
Sickles, J. E. and Shadwick, D. S.: Comparison of particulate sulfate and nitrate at collocated CASTNET and IMPROVE sites in the eastern US, Atmos. Environ., 42, 2062–2073, https://doi.org/10.1016/j.atmosenv.2007.11.051, 2008.
Simpson, D., Benedictow, A., Berge, H., Bergström, R., Emberson, L. D., Fagerli, H., Flechard, C. R., Hayman, G. D., Gauss, M., Jonson, J. E., Jenkin, M. E., Nyíri, A., Richter, C., Semeena, V. S., Tsyro, S., Tuovinen, J.-P., Valdebenito, Á., and Wind, P.: The EMEP MSC-W chemical transport model – technical description, Atmos. Chem. Phys., 12, 7825–7865, https://doi.org/10.5194/acp-12-7825-2012, 2012.
Skeie, R. B., Berntsen, T. K., Myhre, G., Tanaka, K., Kvalevåg, M. M., and Hoyle, C. R.: Anthropogenic radiative forcing time series from pre-industrial times until 2010, Atmos. Chem. Phys., 11, 11827–11857, https://doi.org/10.5194/acp-11-11827-2011, 2011.
Strahan, S. E., Duncan, B. N., and Hoor, P.: Observationally derived transport diagnostics for the lowermost stratosphere and their application to the GMI chemistry and transport model, Atmos. Chem. Phys., 7, 2435–2445, https://doi.org/10.5194/acp-7-2435-2007, 2007.
Thompson, C. R., Wofsy, S. C., Prather, M. J., Newman, P. A., Hanisco, T. F., Ryerson, T. B., Fahey, D. W., Apel, E. C., Brock, C. A., Brune, W. H., Froyd, K., Katich, J. M., Nicely, J. M., Peischl, J., Ray, E., Veres, P. R., Wang, S., Allen, H. M., Asher, E., Bian, H., Blake, D., Bourgeois, I., Budney, J., Bui, T., P., Butler, A., Campuzano-Jost, P., Chang, C., Chin, M., Commane, R., Correa, G., Crounse, J. D., Daube, B., Dibb, J. E., DiGangi, J. P., Diskin, G. S., Dollner, M., Elkins, J. W., Fiore, A. M., Flynn, C. M., Guo, H., Hall, S. R., Hannun, R. A., Hills, A., Hintsa, E. J., Hodzic, A., Hornbrook, R. S., Huey, L. G., Jimenez, J. L., Keeling, R. F., Kim, M. J., Kupc, A., Lacey, F., Lait, L. R., Lamarque, J.-F., Liu, J., McKain, K., Meinardi, S., Miller, D. O., Montzka, S. A., Moore, F. L., Morgan, E. J., Murphy, D. M., Murray, L. T., Nault, B. A., Neuman, J. A., Nguyen, L., Gonzalez, Y., Rollins, A., Rosenlof, K., Sargent, M., Schill, G., Schwarz, J. P., St. Clair, J. M., Steenrod, S. D., Stephens, B. B., Strahan, S. E., Strode, S. A., Sweeney, C., Thames, A. B., Ullmann, K., Wagner, N., Weber, N., Weinzierl, B., Wennberg, P. O., Williamson, C. J., Wolfe, G. M., and Zeng, L.: The NASA Atmospheric Tomography (ATom) Mission: Imaging the chemistry of the global atmosphere, B. Am. Meteorol. Soc., 103, 761–790, https://doi.org/10.1175/BAMS-D-20-0315.1, 2022.
Tilmes, S., Lamarque, J.-F., Emmons, L. K., Kinnison, D. E., Ma, P.-L., Liu, X., Ghan, S., Bardeen, C., Arnold, S., Deeter, M., Vitt, F., Ryerson, T., Elkins, J. W., Moore, F., Spackman, J. R., and Val Martin, M.: Description and evaluation of tropospheric chemistry and aerosols in the Community Earth System Model (CESM1.2), Geosci. Model Dev., 8, 1395–1426, https://doi.org/10.5194/gmd-8-1395-2015, 2015.
Toon, O. B., Maring, H., Dibb, J., Ferrare, R., Jacob, D. J., Jensen, E. J., Luo, Z. J., Mace, G. G., Pan, L. L., Pfister, L., Rosenlof, K. H., Redemann, J., Reid, J. S., Singh, H. B., Thompson, A. M., Yokelson, R., Minnis, P., Chen, G., Jucks, K. W., and Pszenny, A.: Planning, implementation, and scientific goals of the Studies of Emissions and Atmospheric Composition, Clouds and Climate Coupling by Regional Surveys (SEAC4RS) field mission, J. Geophys. Res.-Atmos., 121, 4967–5009, https://doi.org/10.1002/2015JD024297, 2016.
Tsimpidi, A. P., Scholz, S. M. C., Milousis, A., Mihalopoulos, N., and Karydis, V. A.: Aerosol Composition Trends during 2000–2020: In depth insights from model predictions and multiple worldwide observation datasets, EGUsphere [preprint], https://doi.org/10.5194/egusphere-2024-3590, 2024.
Uno, I., Osada, K., Yumimoto, K., Wang, Z., Itahashi, S., Pan, X., Hara, Y., Kanaya, Y., Yamamoto, S., and Fairlie, T. D.: Seasonal variation of fine- and coarse-mode nitrates and related aerosols over East Asia: synergetic observations and chemical transport model analysis, Atmos. Chem. Phys., 17, 14181–14197, https://doi.org/10.5194/acp-17-14181-2017, 2017.
van der Werf, G. R., Randerson, J. T., Giglio, L., Collatz, G. J., Mu, M., Kasibhatla, P. S., Morton, D. C., DeFries, R. S., Jin, Y., and van Leeuwen, T. T.: Global fire emissions and the contribution of deforestation, savanna, forest, agricultural, and peat fires (1997–2009), Atmos. Chem. Phys., 10, 11707–11735, https://doi.org/10.5194/acp-10-11707-2010, 2010.
van Dorland, R., Dentener, F. J., and Lelieveld, J.: Radiative forcing due to tropospheric ozone and sulfate aerosols, J. Geophys. Res., 102, 28079–28100, https://doi.org/10.1029/97JD02499, 1997.
van Marle, M. J. E., Kloster, S., Magi, B. I., Marlon, J. R., Daniau, A.-L., Field, R. D., Arneth, A., Forrest, M., Hantson, S., Kehrwald, N. M., Knorr, W., Lasslop, G., Li, F., Mangeon, S., Yue, C., Kaiser, J. W., and van der Werf, G. R.: Historic global biomass burning emissions for CMIP6 (BB4CMIP) based on merging satellite observations with proxies and fire models (1750–2015), Geosci. Model Dev., 10, 3329–3357, https://doi.org/10.5194/gmd-10-3329-2017, 2017.
Wan, H., Zhang, K., Vogl, C. J., Woodward, C. S., Easter, R. C., Rasch, P. J., Feng, Y., and Wang, H.: Numerical coupling of aerosol emissions, dry removal, and turbulent mixing in the E3SM Atmosphere Model version 1 (EAMv1) – Part 1: Dust budget analyses and the impacts of a revised coupling scheme, Geosci. Model Dev., 17, 1387–1407, https://doi.org/10.5194/gmd-17-1387-2024, 2024.
Wang, H., Easter, R. C., Zhang, R., Ma, P.-L., Singh, B., Zhang, K., Ganguly, D., Rasch, P. J., Burrows, S. M., Ghan, S. J., Lou, S., Qian, Y., Yang, Y., Feng, Y., Flanner, M., Leung, L. R., Liu, X., Shrivastava, M., Sun, J., Tang, Q., Xie, S., and Yoon, J.-H.: Aerosols in the E3SM Version 1: New developments and their impacts on radiative forcing, J. Adv. Model. Earth Sy., 12, e2019MS001851, https://doi.org/10.1029/2019MS001851, 2020.
Wang, Y.-C., Pan, H.-L., and Hsu, H.-H.: Impacts of the triggering function of cumulus parameterization on warm-season diurnal rainfall cycles at the Atmospheric Radiation Measurement Southern Great Plains site, J. Geophys. Res., 120, 10681–10702, https://doi.org/10.1002/2015JD023337, 2015.
Wu, M., Liu, X., Yu, H., Wang, H., Shi, Y., Yang, K., Darmenov, A., Wu, C., Wang, Z., Luo, T., Feng, Y., and Ke, Z.: Understanding processes that control dust spatial distributions with global climate models and satellite observations, Atmos. Chem. Phys., 20, 13835–13855, https://doi.org/10.5194/acp-20-13835-2020, 2020.
Wu, M., Wang, H., Easter, R. C., Lu, Z., Liu, X., Singh, B., Ma, P.-L., Tang, Q., Zaveri, R. A., Ke, Z., Zhang, R., Emmons, L. K., Tilmes, S., Dibb, J. E., Zheng, X., Xie, S., and Leung, L. R.: Development and evaluation of E3SM-MOSAIC: Spatial distributions and radiative effects of nitrate aerosol, J. Adv. Model. Earth Sy., 14, e2022MS003157, https://doi.org/10.1029/2022MS003157, 2022.
Wu, M.: E3SM maint-2.0 branch with MOSAIC aerosol chemistry module (maint-2.0-MOSAIC_v1.0), Zenodo [code], https://doi.org/10.5281/zenodo.17009904, 2025.
Xie, S. and Zhang, M.: Impact of the convection triggering function on single-column model simulations, J. Geophys. Res., 105, 14983–14996, https://doi.org/10.1029/2000JD900170, 2000.
Xie, S., Lin, W., Rasch, P. J., Ma, P.-L., Neale, R., Larson, V. E., Qian, Y., Bogenschutz, P. A., Caldwell, P., Cameron-Smith, P., Golaz, J.-C., Mahajan, S., Singh, B., Tang, Q., Wang, H., Yoon, J.-H., Zhang, K., and Zhang, Y.: Understanding Cloud and Convective Characteristics in Version 1 of the E3SM Atmosphere Model, J. Adv. Model. Earth Sy., 10, 2618–2644, https://doi.org/10.1029/2018MS001350, 2018.
Xie, S., Wang, Y.-C., Lin, W., Ma, H.-Y., Tang, Q., Tang, S., Zheng, X., Golaz, J.-C., Zhang, G. J., and Zhang, M.: Improved Diurnal Cycle of Precipitation in E3SM With a Revised Convective Triggering Function, J. Adv. Model. Earth Sy., 11, 2290–2310, https://doi.org/10.1029/2019MS001702, 2019.
Xu, L. and Penner, J. E.: Global simulations of nitrate and ammonium aerosols and their radiative effects, Atmos. Chem. Phys., 12, 9479–9504, https://doi.org/10.5194/acp-12-9479-2012, 2012.
Zaveri, R. A., Easter, R. C., Fast, J. D., and Peters, L. K.: Model for Simulating Aerosol Interactions and Chemistry (MOSAIC), J. Geophys. Res., 113, D13204, https://doi.org/10.1029/2007jd008782, 2008.
Zaveri, R. A., Easter, R. C., Singh, B., Wang, H., Lu, Z., Tilmes, S., Emmons, L. K., Vitt, F., Zhang, R., Liu, X., Ghan, S. J., and Rasch, P. J.: Development and evaluation of chemistry-aerosol-climate model CAM5-Chem-MAM7-MOSAIC: Global atmospheric distribution and radiative effects of nitrate aerosol, J. Adv. Model. Earth Sy., 13, e2020MS002346, https://doi.org/10.1029/2020MS002346, 2021.
Zender, C. S., Bian, H., and Newman, D.: Mineral Dust Entrainment and Deposition (DEAD) model: Description and 1990s dust climatology, J. Geophys. Res., 108, 4416, https://doi.org/10.1029/2002JD002775, 2003.
Zhai, S., Jacob, D. J., Pendergrass, D. C., Colombi, N. K., Shah, V., Yang, L. H., Zhang, Q., Wang, S., Kim, H., Sun, Y., Choi, J.-S., Park, J.-S., Luo, G., Yu, F., Woo, J.-H., Kim, Y., Dibb, J. E., Lee, T., Han, J.-S., Anderson, B. E., Li, K., and Liao, H.: Coarse particulate matter air quality in East Asia: implications for fine particulate nitrate, Atmos. Chem. Phys., 23, 4271–4281, https://doi.org/10.5194/acp-23-4271-2023, 2023.
Zhang, G. J. and McFarlane, N. A.: Sensitivity of climate simulations to the parameterization of cumulus convection in the Canadian climate centre general circulation model, Atmos.-Ocean, 33, 407–446, https://doi.org/10.1080/07055900.1995.9649539, 1995.