the Creative Commons Attribution 4.0 License.
the Creative Commons Attribution 4.0 License.
 | 23 Jan 2024
Measurement report: Atmospheric nitrate radical chemistry in the South China Sea influenced by the urban outflow of the Pearl River Delta
Jie Wang
Lili Ming
Zelong Zheng
Guizhen Fang
Cuizhi Sun
Zhenhao Ling
Shaojia Fan
The nitrate radical (NO3) is a critical nocturnal atmospheric oxidant in the troposphere, which widely affects the fate of air pollutants and regulates air quality. Many previous works have reported the chemistry of NO3 in inland regions of China, while fewer studies target marine regions. Here, we present a field measurement of the NO3 reservoir, dinitrogen pentoxide (N2O5), and related species at a typical marine site (Da Wan Shan Island) located in the South China Sea in the winter of 2021. Two patterns of air masses were captured during the campaign, including the dominant airmass from inland China (IAM) with a percentage of ∼ 84 %, and the airmass from eastern coastal areas (CAM) with ∼ 16 %. During the IAM period, the NO3 production rate reached 1.6 ± 0.9 ppbv h−1 due to the transportation of the polluted urban plume with high NOx and O3. The average nocturnal N2O5 and the calculated NO3 mixing ratios were 119.5 ± 128.6 and 9.9 ± 12.5 pptv, respectively, and the steady-state lifetime of NO3 was 0.5 ± 0.7 min on average, indicating intensive nighttime chemistry and rapid NO3 loss at this site. By examining the reaction of NO3 with volatile organic compounds (VOCs) and N2O5 heterogeneous hydrolysis, we revealed that these two reaction pathways were not responsible for the NO3 loss (< 20 %) since the NO3 reactivity (k(NO3)) towards VOCs was small ( s−1) and the aerosol loading was low. Instead, NO was proposed to significantly contribute to nocturnal NO3 loss at this site, despite the nocturnal NO concentration always below the parts per billion by volume level and near the instrument detection limit. This might be from the local soil emission or something else. We infer that the nocturnal chemical NO3 reactions would be largely enhanced once without NO emission in the open ocean after the air mass passes through this site, thus highlighting the strong influences of the urban outflow to the downwind marine areas in terms of nighttime chemistry. During the CAM period, nocturnal ozone was higher, while NOx was much lower. The NO3 production was still very fast, with a rate of 1.2 ppbv h−1. With the absence of N2O5 measurement in this period, the NO3 reactivity towards VOCs and N2O5 uptake were calculated to assess NO3 loss processes. We showed that the average k(NO3) from VOCs (56.5 %, 2.6 ± 0.9 × 10⁻³ s−1) was higher than that from N2O5 uptake (43.5 %, 2.0 ± 1.5 × 10⁻³ s−1) during the CAM period, indicating a longer NO3 N2O5 lifetime than that during IAM period. This study improves the understanding of the nocturnal NO3 budget and environmental impacts with the interaction of anthropogenic and natural activities in marine regions.
- Article
(6754 KB) - Full-text XML
-
Supplement
(1059 KB) - BibTeX
- EndNote


Reactive nitrogen compounds, especially the nitrate radical (NO3) and dinitrogen pentoxide (N2O5) play an essential role in nocturnal atmospheric chemistry (Wayne et al., 1991; Brown and Stutz, 2012). NO3 is mainly generated via the oxidation of NO2 by O3 (Reaction R1), and then NO3 further reacts with NO2 to produce N2O5 (Reaction R2) with a thermal equilibrium. The temperature-dependent equilibrium constant, Keq, regulates the equilibrium, favoring NO3 and NO2 at higher temperatures (Osthoff et al., 2007; Chen et al., 2022). During daytime, the NO3 mixing ratio is generally low as its lifetime is very short (< 5 s) due to the fast photolysis (Reactions R3 and R4) and rapid reaction with NO (Reaction R5) (a rate constant of 2.6 × 10⁻¹¹ cm3 molec.−1 s−1 at 298 K, Atkinson et al., 2004). At night, NO3 accumulates and can reach tens to hundreds of parts per trillion by volume (pptv), making it the major nocturnal oxidizing agent (Wang et al., 2015).
During nighttime, NO3 is the most important oxidant for alkenes (Mogensen et al., 2015; Edwards et al., 2017), particularly in rural, remote, or forested environments, where it predominantly reacts with unsaturated biogenic volatile organic compounds (VOCs), especially isoprene and monoterpene (Ng et al., 2017; Liebmann et al., 2018b, a), to form alkyl nitrates (RONO2) that ultimately lead to secondary organic aerosols (SOAs) (Brown and Stutz, 2012). The observations and model simulations showed that the measured particulate organic nitrates were largely attributed to the nocturnal NO3 oxidation across Europe (Kiendler-Scharr et al., 2016). The NO3 oxidation was also reported to play an important role in aerosol formation in the southeastern United States, with high isoprene and monoterpene emissions (Xu et al., 2015). These studies highlighted the critical role of the reaction of NO3 with VOCs in NO3 budget and organic aerosol pollution. In addition, NO3 also reacts with dimethyl sulfide (DMS) over the ocean, affecting the marine sulfur cycle and thus cloud formation and global climate (Aldener et al., 2006; Brown and Stutz, 2012; Barnes et al., 2006; Rosati et al., 2022). In high aerosol loading regimes, the N2O5 heterogeneous uptake becomes a significant indirect NO3 loss pathway. The hydrolysis reaction produces nitrate (NO) and nitryl chloride (ClNO2) on chloride-containing aerosol surfaces (Osthoff et al., 2008; Thornton et al., 2010), in which ClNO2 activates the Cl radical and further enhances the photochemistry and ozone pollution in the following day (Riedel et al., 2012, 2014; Behnke et al., 1993).
Different NO3 loss pathways produce different air pollutants, thus characterization of NO3 budget is essential to clarifying the NO3 chemistry in air pollution under various environments. Observations of N2O5 and NO3 in different regions and evaluation of their loss processes have been reported in numerous studies (Crowley et al., 2011; Geyer et al., 2001; Brown et al., 2011; Dewald et al., 2022; Niu et al., 2022; Brown et al., 2016; Wang et al., 2020a; Tham et al., 2016; Aldener et al., 2006; Lin et al., 2022). In general, the NO3 loss process shows significant regional differences. In urban areas featuring intensive anthropogenic NOx emissions and moderate (or high) aerosol loading, N2O5 uptake is comparable or even dominates the NO3 loss (Wang et al., 2013). While in rural and forested areas with abundant biogenic VOC (BVOC) emissions, the NO3 loss processes were usually dominated by BVOCs (Dewald et al., 2022; Geyer et al., 2001; Brown et al., 2011). As for the coastal areas, which were jointly affected by the polluted air mass from inland and the relatively clean air mass from the ocean, the dominant NO3 loss process varies greatly depending on the air mass origin (Aldener et al., 2006; Niu et al., 2022; Brown et al., 2016; Crowley et al., 2011). For instance, Crowley et al. (2011) found on the Atlantic coast of southern Spain (forested area) that when the air mass mainly originated from the Atlantic, NO3 was mainly consumed by BVOCs (mainly monoterpenes) emitted from nearby forests, while when the air mass came from the continent, NO3 loss was mainly due to reactions with anthropogenic VOCs (AVOCs).
China has been recently proven to be a hot spot of nocturnal chemistry with a high NO3 production rate (H. Wang et al., 2023). Many studies have reported the mechanisms, budget, or impacts of NO3–N2O5 chemistry in different regions, where most of them were conducted in urban regions (Wang et al., 2013; Yan et al., 2021; H. Wang et al., 2020; X. F. Wang et al., 2017; Z. Wang et al., 2017). For example, H. Wang et al. (2017b) showed a significant contribution of N2O5 uptake to nitrate pollution in summer and winter, and they also highlighted the fast organic nitrate production rate observed in Beijing rural region in summer (Wang et al., 2018b). Only some studies have focused on nighttime oxidation in coastal cities like Shanghai, Shenzhen, and Hong Kong (Zhu et al., 2022; Niu et al., 2022; Yan et al., 2019), which have shown different patterns of NO3 chemistry compared with urban regions. Even fewer field studies have been conducted on islands that are far away from coastal cities where the interactions of the oceanic atmosphere and urban plumes can significantly affect the NO3 budget and impacts. Given the diversity of air masses in inland and coastal areas, studies are needed to gain a comprehensive understanding of NO3 losses in different atmospheric environments, particularly in coastal and marine areas.
Therefore, we conducted an intensive field observation on Da Wan Shan Island (DWS) in the winter of 2021, which is a typical island site in the north of the South China Sea, and downwind of the city clusters in the Pearl River Delta (PRD), China, during the winter monsoon periods. The island features a subtropical oceanic monsoon climate, and the north and northeast synoptic winds from inland PRD and eastern China coast are generally predominant in winter (Liu et al., 2019; Wang et al., 2018a). This allows us to further investigate the interactions between anthropogenic emissions and marine emissions from the perspective of nighttime chemistry. In this study, the measurements of N2O5 and the related species during the DWS winter campaign are reported. We have identified two types of air masses from both mainland China and coastal areas. Finally, the NO3 budget and loss processes in different air masses are characterized.
2.1 Site description
The field campaign was conducted at Da Wan Shan Island (21∘55′57′′ N, 113∘43′15′′ E) from 9 November to 16 December 2021. Figure 1 shows the location of the study site, which is approximately 60 km southwest of Hong Kong, 40 km southeast of Zhuhai, and about 100 and 80 km away from the megacities Guangzhou and Shenzhen, respectively. This island is dominated by mountainous terrain with an area of 8.1 km2 and has a small population of about 3000. Anthropogenic emissions are sparse and no industrial pollution sources were identified, though numerous ships engaging in local fishing activities were observed, potentially affecting the local atmosphere. During the measurement, local airflow was consistently from either the northwest or southeast (Fig. 1a) due to the winter monsoon, with wind speeds most frequently ranging from 1.8 to 7.9 m s−1 (10th–90th percentiles) and an average of 4.5 ± 2.6 m s−1. This wind direction is indicative of the mixing of air masses from both continental and coastal areas. The Hybrid Single-Particle Lagrangian Integrated Trajectory model (HYSPLIT) was adopted to investigate the historical trajectory. The HYSPLIT model was run for 48 h backward in time at 20:00, 24:00, and 04:00 (all times given are CNST, Chinese National Standard Time, UTC + 8), and at a height of 70 m above sea level. It confirmed that the airmass during nighttime mostly came from inland China (fresh urban emissions, IAM, 84 %) and the coastal areas (aged urban emissions, CAM, 16 %). IAM featured the outflow from inland China, such as Guangzhou and Changsha, while CAM featured the outflow of coastal cities like Hong Kong and Shenzhen. No air masses free of pollution from the South China Sea were observed during the measurement period. All measurement instruments were placed in the DWS Atmospheric-Marine Research Station, located on the rooftop with inlets approximately 10 m above ground level and about 72 m above sea level, with sunrise around 06:40 and sunset at 17:40.

Figure 1A map of the field measurement site of Wanshan Island (red star) and the surrounding environment (© Microsoft). Two coastal sites, Hok Tsui (Yan et al., 2019) and Yangmeikeng (Niu et al., 2022), and an urban site, Heshan (Wang et al., 2022; Yun et al., 2018b), are denoted with the blue circles and diamond, respectively. The blue triangle denotes Mt. Tai Mo Shan (957 m), a mountainous site that recorded the nighttime chemistry in the nocturnal residual layer (Brown et al., 2016). The inset (a) shows the wind rose for the sampling site during the campaign. Panel (b) shows the clustering results of the 48 h backward trajectory calculations at nighttime using the HYSPLIT model throughout the campaign.
2.2 Instrument setup
Various parameters were measured in this study, including N2O5, NO, NO2, O3, VOCs, particle number size distribution (PNSD), and meteorological parameters with different instruments. Detailed information about these instruments is listed in Table 1. The N2O5 measurements were performed using a cavity-enhanced absorption spectrometer (CEAS) which has been deployed over several field campaigns (H. Wang et al., 2017a, b; Wang et al., 2018b; Wang et al., 2020b). In brief, ambient N2O5 was thermally decomposed to NO3 in a perfluoroalkoxy alkane (PFA) tube (length: 35 cm, i.d.: 4.35 mm) heated to 130 ∘C, and NO3 was detected within a 110 ∘ PFA resonator cavity. NO was injected to destroy NO3 from N2O5 thermal decomposition in a 5 min cycle, and the result was used as the reference spectrum to avoid the influence of ambient water vapor. A pair of high-reflectivity (HR) mirrors (Layertec GmbH, Mellingen, Germany) with a diameter of 25.0 mm (+0.00 / −0.10 mm) was used to enhance the effective optical pathlength. Mirror reflectivity (R(λ)) was calibrated with high-purity He and N2 in the current experimental setup during the field measurements. R(λ) was calibrated to be 0.99997, and the effective pathlength of the optical resonator was 13.96 km. A Teflon polytetrafluoroethylene (PTFE) filter was used to remove ambient aerosol particles, and the inlet flow rate was 1.0 L min−1. The loss of N2O5 in the sampling line and filter was considered in the data correction according to previous work (H. Wang et al., 2017a). Here the CEAS measurement encompasses the combined concentration of ambient [N2O5 + NO3] and effectively represents N2O5 under high NOx (or low temperature) conditions when the ratio of NO3 to N2O5 is likely to be low. Accounting for the instrument's transmission efficiency and the thermal transformation between NO3 and N2O5, the contribution of NO3 is sufficiently negligible in comparison to N2O5. Nevertheless, we have taken it into account during the N2O5 data correction. The limit of detection (LOD) was 2.7 pptv (1σ), and the measurement uncertainty was ±19 %.
Table 1The information of observation instruments used during the DWS campaign.
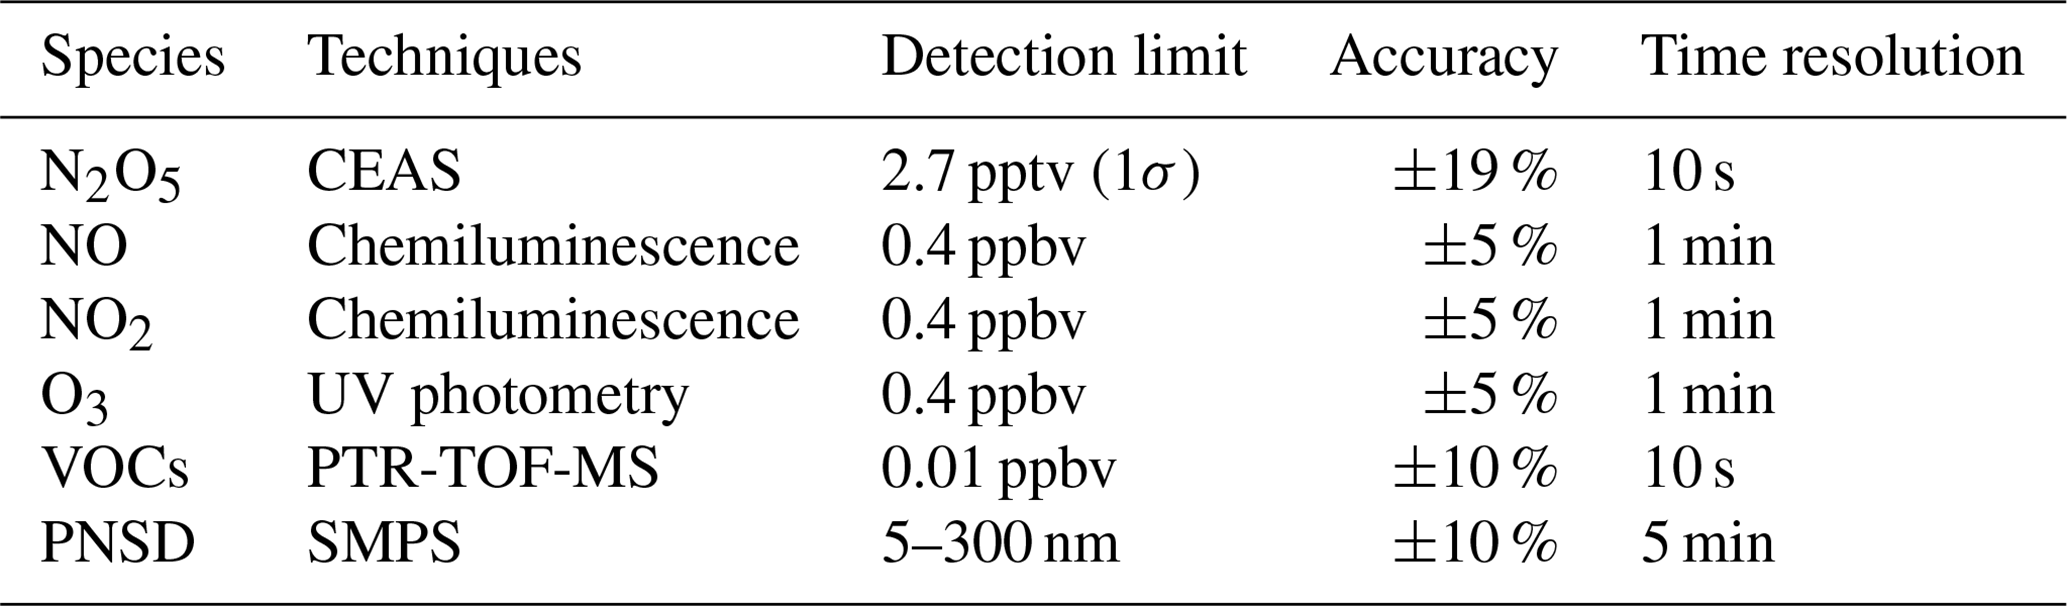
NOx and O3 were measured by commercial instruments (model T200U and model T400U, Teledyne API Inc., respectively) calibrated with zero air before the measurement. The nitrogen oxide analyzer uses the chemiluminescence detection method to measure the original NO and converted NO2, and the LOD was 0.4 ppbv for each species. Aerosol surface area density (Sa, µm2 cm−3) was calculated based on the particle numbers and geometric diameter, which were calculated from the results measured by a laboratory-assembled scanning-mobility particle sizer (SMPS) according to Mcmurry et al. (2000). This SMPS system consists of two differential mobility analyzers (DMAs, “nano-DMA” mode 3081A, and “regular-DMA” mode 3085A, TSI Inc.) in parallel and a condensed particle counter (mode 3787, TSI Inc.) as the detector. The combination of nano-DMA and conventional mode 3085A DMA enables the SMPS to have better detection performance for particles below 50 nm. In this measurement, SMPS measured the particle size distribution in 5–300 nm with a time resolution of 5 min, and Sa can be regarded as the lower limit value. A growth factor f(RH) = 1 + 8.8 × (RH100)9.7 (Liu et al., 2013) was used here to correct dry state Sa to wet state Sa.
VOCs were measured by proton transfer reaction time of flight mass spectrometry (PTR-TOF-MS, Ionicon Analytik GmbH, Innsbruck, Austria) with a time resolution of 10 s. At the end of this campaign, background measurements and instrument calibration were conducted with high-purity nitrogen and multi-component VOC gas standards, respectively. The instrument calibration results yielded strong linear relationships (R2=0.98) between the proton transfer reaction rate constants and the sensitivities of 10 calibrants: acetaldehyde, acetone, dimethyl sulfide, isoprene, methyl ethyl ketone, benzene, toluene, styrene, o-xylene, and trimethylbenzene. The sensitivities of the uncalibrated species were determined through the rate constants of the proton transfer reactions and their correlation coefficients with sensitivity. Meanwhile, the VOCs were also sampled by canister and analyzed by a gas chromatograph equipped with a mass spectrometer or flame ionization detector (GC-MS) for some ozone-polluted days. In the absence of nocturnal data from canister samples, the following analysis was based on the PTR-TOF-MS measurement, except the weight of α-pinene and β-pinene detected by GC-MS. Since monoterpene species cannot be distinguished by PTR-TOF-MS, the reaction rate constant of the sum monoterpene reaction with NO3 was weighted by the campaign-averaged weight of α-pinene and β-pinene detected by GC-MS. Meteorological parameters (i.e., temperature (T), relative humidity (RH), wind speed, and wind direction) were routinely monitored with a time resolution of 5 min.
2.3 The calculation of NO3 budget and lifetime
With the observation of N2O5, NO3 can be calculated according to their temperature-dependent equilibrium relationship (Eq. 1) (Brown and Stutz, 2012). Lifetimes are commonly expressed as the ratio of their concentrations to the NO3 production rate as determined by Eqs. (2) and (3), assuming the production and loss are in dynamic balance at night (Brown et al., 2003; Brown and Stutz, 2012). The production rate of nitrate radical, P(NO3), is commonly expressed by Eq. (4), where represents the temperature-dependent reaction rate constant of NO2 and O3 (Atkinson et al., 2004). In general, the nocturnal NO3 losses typically include three main pathways (Eq. 5): (1) the reaction with NO, (2) the reactions with VOCs, and (3) N2O5 uptake.
The NO3 reactivity towards VOCs, k(NO3), is the first-order loss rate coefficient calculated from the products of the bimolecular rate coefficients ki and the VOC concentrations, as shown in Eq. (6).
khet is the first-order loss rate coefficient of N2O5 uptake on the aerosol surface. It depends on the uptake coefficient γ(N2O5), the aerosol surface area density Sa (µm2 cm−3), and the mean molecular speed c (Eq. 7). γ(N2O5) is influenced by chemical composition, physical properties of aerosol, and ambient conditions including related humidity and temperature (Yu et al., 2020; Wagner et al., 2013; Wang et al., 2018b; Bertram and Thornton, 2009; Tang et al., 2014; Kane et al., 2001). There are several kinds of methods proposed to quantify or estimate γ(N2O5) by using observed parameters. Given that some essential parameters were not directly measured during this campaign, only two approaches were employed to estimate the N2O5 uptake coefficient. The first method is the pseudo-steady-state method, which assumes that N2O5 and NO3 have achieved a steady state (Brown et al., 2009). γ(N2O5) and can be determined from the slope and intercept of linear regression of Keq[NO2] τ(N2O5)−1 versus 0.25cSaKeq[NO2], respectively, as shown in Eq. (8). The second is the parameterization method. As the aerosol compositions used to estimate the N2O5 uptake coefficients were not measured, only a simplified parameterization is available that is based on relative humidity (RH) and temperature (Eq. 9) (Hallquist et al., 2003; Kane et al., 2001; Evans and Jacob, 2005). Although simple, it had an overall reasonable performance in China (Wang et al., 2022; Tham et al., 2018; Wang et al., 2020a).
3.1 Measurement overview
The time series of N2O5, related trace gases, and selected meteorological parameters for the study period are depicted in Fig. 2. The air masses are categorized into IAM and CAM according to the backward trajectories at 20:00, 00:00, and 04:00 each day as illustrated in Fig. 1. Detailed information of two kinds of air masses is listed in Table 2. Data gaps for N2O5 were caused by technical problems, mirror reflectivity calibration, or instrumental maintenance, which usually took place in the daytime. In this campaign, meteorological conditions featured a typical subtropical winter climate with average temperature and RH values of 20.1 ± 1.9 ∘C and 52.0 % ± 13.6 %, respectively.
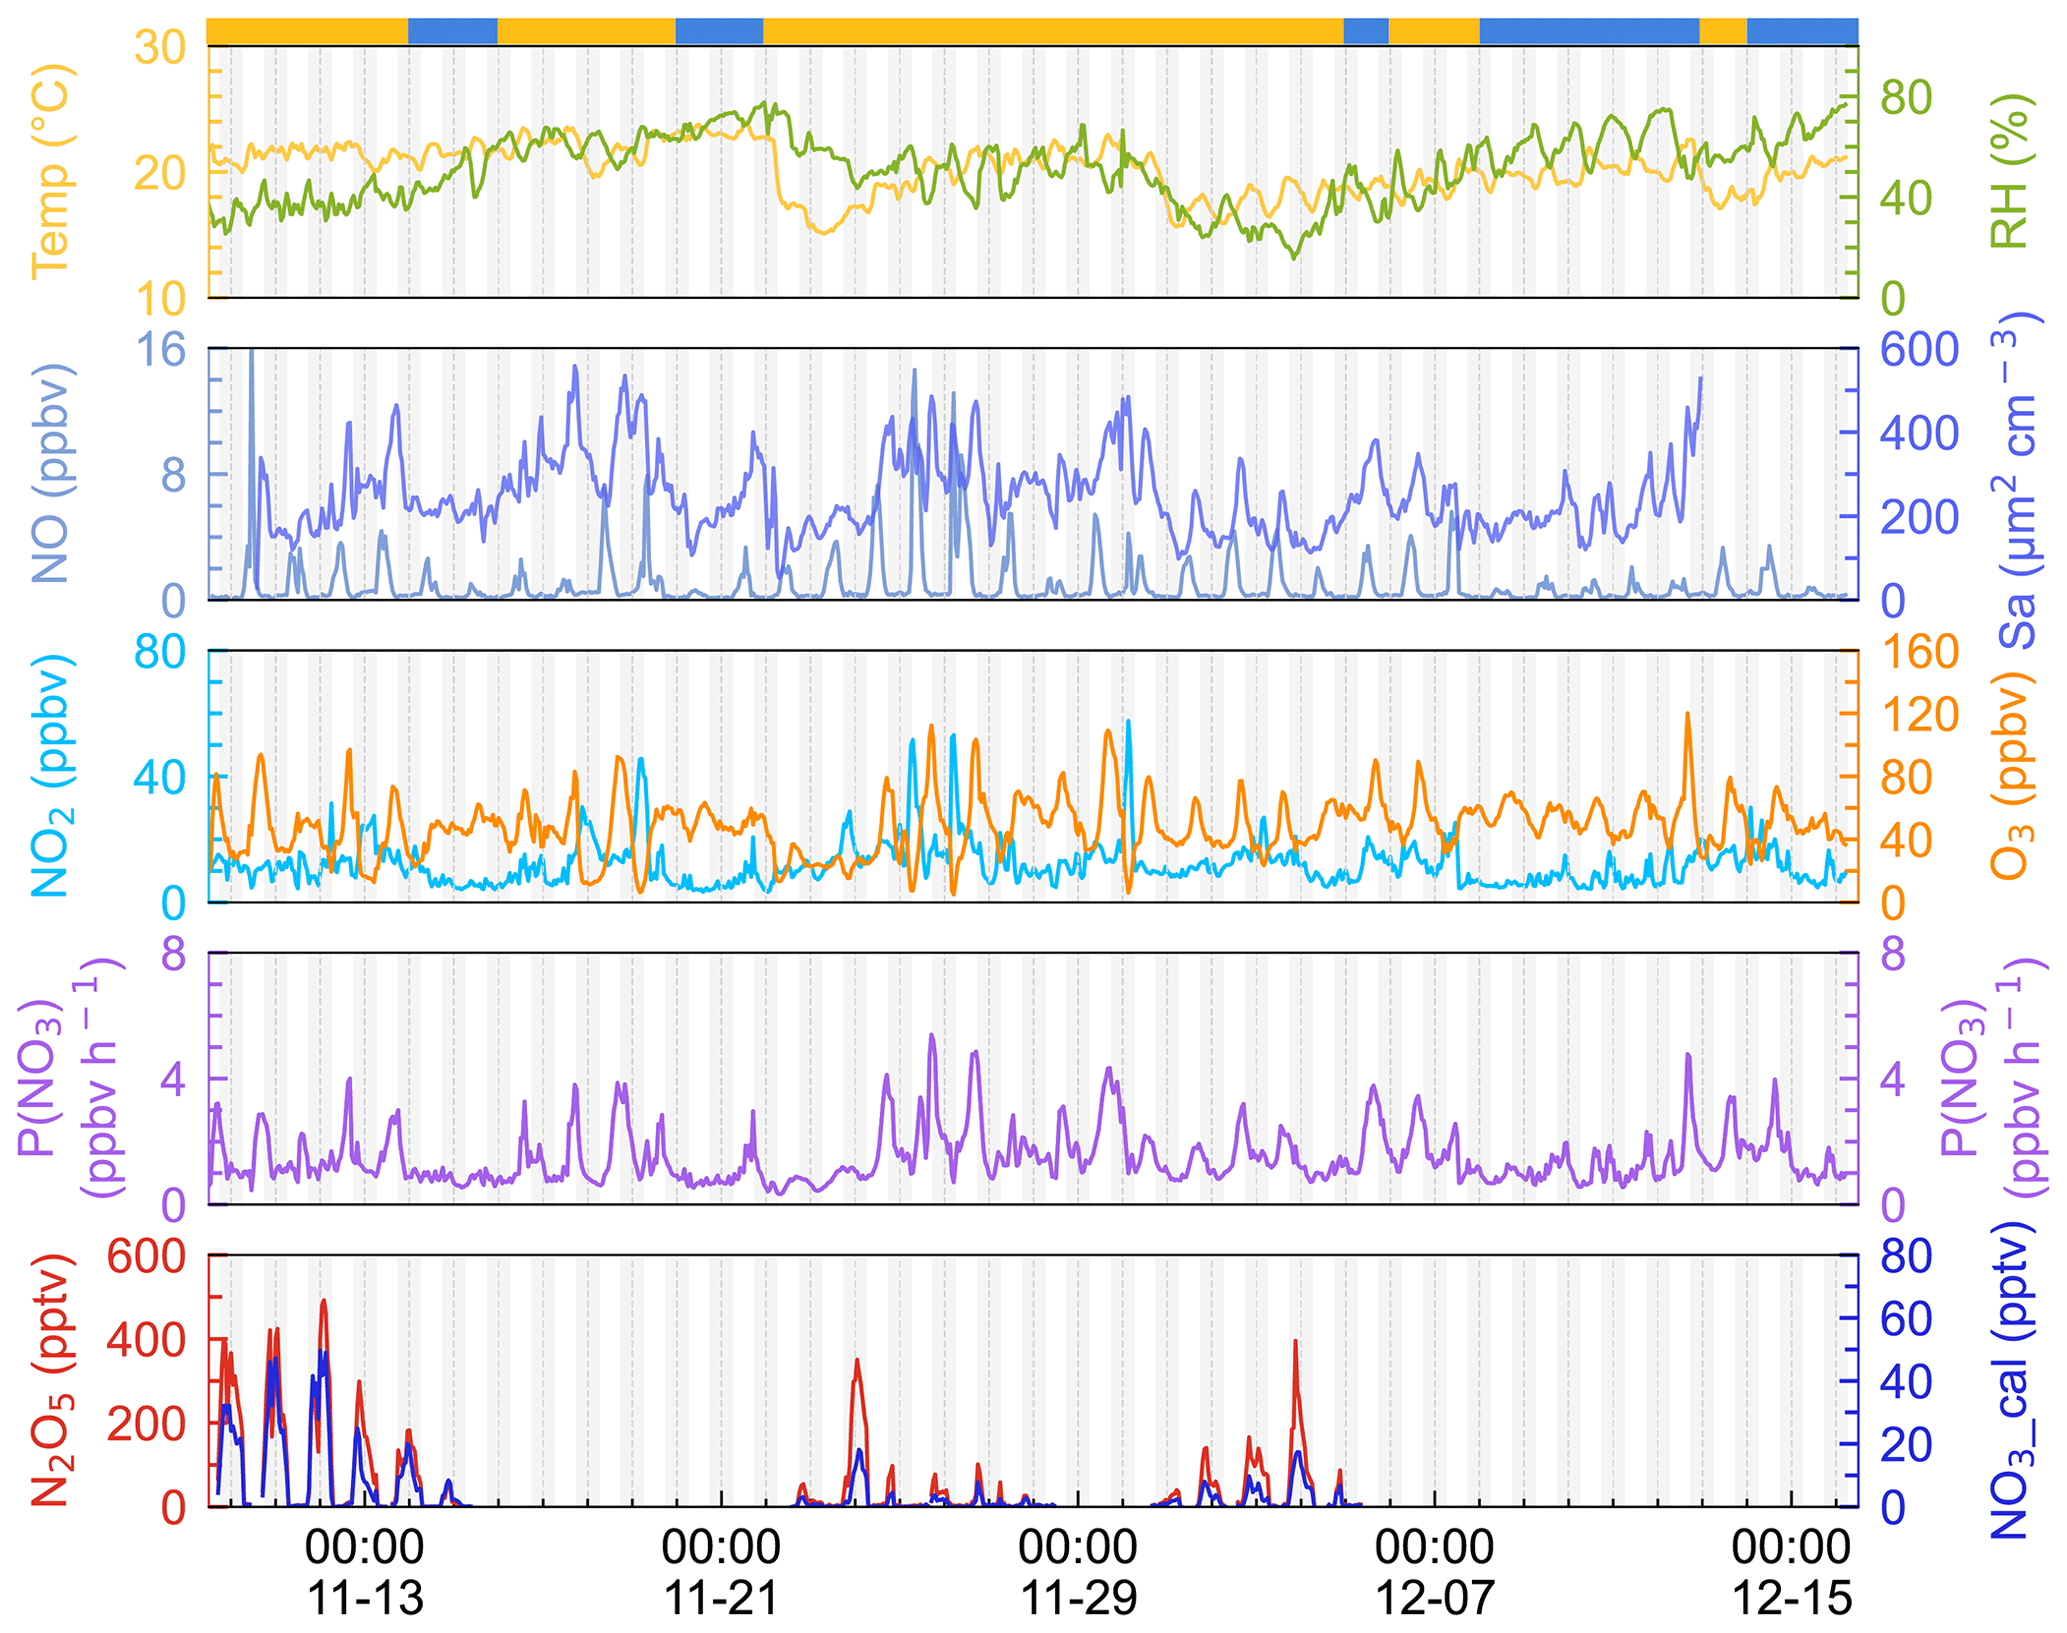
Figure 2Time series of 1 h average N2O5, NO3, P(NO3), NO, NO2, Sa, temperature, and relative humidity. NO3 was calculated by measured N2O5 according to the thermal equilibrium. The light gray shadow indicates the nighttime period. The ribbon at the top separates the air masses into two categories, yellow for IAM and blue for CAM. The x axis shows the time of day and date given in month-day format.
Ozone exhibited the characteristics of afternoon photochemical peaks, especially when the airmass came from inland. The average and maximum concentrations of ozone were 48.2 ± 18.2 and 120.1 ppbv, respectively. Once the maximum hourly average O3 exceeded the Chinese national air quality standard (200 µg m−3, equivalent to 93 ppbv), we marked this day as an O3 pollution day. During the campaign, 6 out of 37 days were O3 polluted days, and all occurred during IAM periods. Meanwhile, the mixing ratio of NO, NO2, and Sa usually increased during these days, indicating that this site was strongly affected by regional transport from the PRD city clusters. Previous observations by Wang et al. (2018a) also found high O3 levels in autumn on the same island due to the weak NO titration and high O3 production rate.
Nitrogen oxides (NOx= NO + NO2) were at a moderate level, with an average value of 13.1 ± 8.2 ppbv, which is much lower than the values in PRD regions (usually > 20 ppbv; Wang et al., 2022; Yang et al., 2022; Yun et al., 2018b) and higher than those on the remote islands in South China Sea (< 5 ppbv, Chuang et al., 2013). The mixing ratio of NO at nighttime was low and showed small peaks during daytime. With the O3 accumulating throughout the day, NO decreased to below the instrument detection limit in the first half of the night, and it began to increase as the O3 concentration decreased in the second half of the night. Given that the lifetime of NO is only a few minutes in the presence of several tens of ppbv of O3 (Dewald et al., 2022), we inferred that NO likely originates from a local source such as soil emission, boats, cooking, and so on.
Table 2Summary of parameters on the two air mass types (mean ± standard deviation).
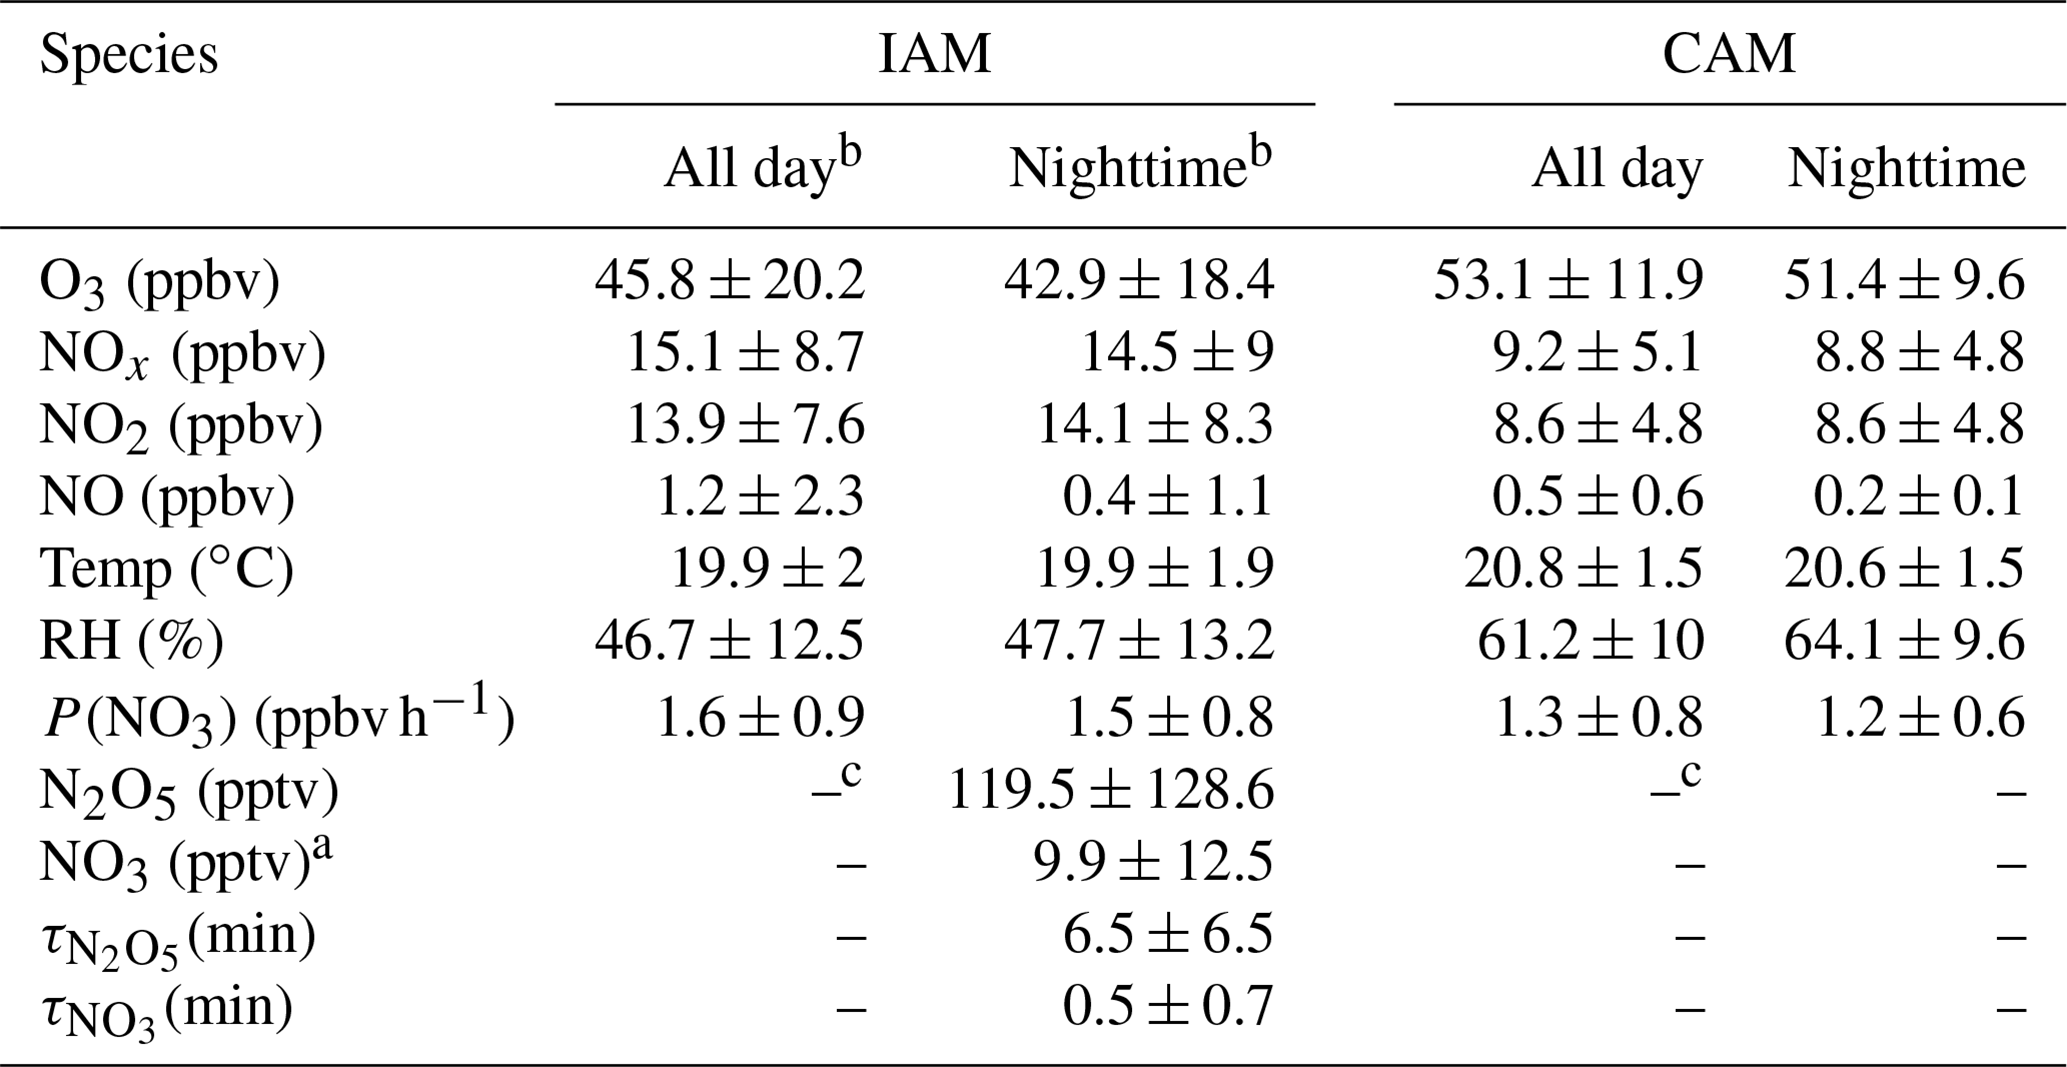
Note: a NO3 is calculated by the thermal equilibrium between NO2, NO3, and N2O5. b “All day” means the 24 h average and “Nighttime” means the time between 18:00 and 06:00 local time. c Without N2O5 measurements in the daytime and limited N2O5 data during the CAM period, N2O5, NO3, and their lifetimes were not valid here.
N2O5 was at a moderate level on most days, with a nocturnal average of 119.5 ± 128.6 pptv, with high concentrations (> 400 pptv in 1 h average) in the first 3 d of the campaign. During the nights of 9 to 12 November, the N2O5 concentrations were significantly higher than those on other nights, with a maximum of 657.3 pptv at midnight of 12 November. The NO3 concentration (calculated based on the thermal equilibrium with N2O5) was also moderate, with an average mixing ratio of 9.9±12.5 pptv, which was higher than that reported on a nearby coastal site of Hong Kong Island (Yan et al., 2019). Table 3 compares the N2O5, NO3, and P(NO3) values found in other coastal (or island) and continental regions of Europe, the United States, and China. In our study, N2O5 and NO3 were at a moderate level compared to other coastal regions when they were affected by emission plumes from continental regions, such as northwestern Europe (Morgan et al., 2015), the east coast of the USA (Brown et al., 2004), and Shenzhen, China (Niu et al., 2022), and were comparable with urban regions (H. Wang et al., 2017b; Wang et al., 2018b). The concentrations of NO3 precursors (NO2 and O3) at this site were very similar to some rural areas, leading to a high NO3 production rate with a daily average of 1.5±0.9 ppbv h−1 and a maximum of 5.9 ppbv h−1. The average value is much higher than that reported in Beijing in winter (0.4 ppbv h−1, Wang et al., 2021), comparable to autumn (1.4 ± 1.7 ppbv h−1, H. Wang et al., 2017b) and even higher than that in summer Taizhou (1.01 ± 0.47 ppbv h−1, Wang et al., 2020a). The nocturnal average P(NO3) during this campaign was 1.4±0.7 ppbv h−1, which is higher than the average value in the warm season of China of 1.07 ± 0.38 ppbv h−1 (H. Wang et al., 2023). The high reaction rate constant for NO2 and O3 due to the high temperature at this site is a potential explanation for the high P(NO3) values observed in this study (i.e., at the same NO2 and O3 level if the temperature increased from 10 to 20 ∘C, the reaction rate constant would increase from 2.27 × 10⁻¹⁷ to 3.05 × 10⁻¹⁷, which means P(NO3) would be 1.34 times faster). The high P(NO3) and the low concentrations of N2O5 and NO3 indicate intensive atmospheric oxidation capacity and fast NO3 and N2O5 removal over the Pearl River Estuary.
The mean diurnal profiles of N2O5, together with relevant species are shown in Fig. 3. Daytime N2O5 and NO3 in the IAM period were shown as NaN due to the absence of observations. Because of limited N2O5 data for the CAM period, neither N2O5 nor NO3 is shown in Fig. 3. NO exhibited similar diurnal variations in both periods and the mixing ratio was higher in the IAM period. The wind rose plot (Supplement Fig. S1) showed high concentrations of NO originating from the north characterized by the outflow from PRD regions. However, NO2 differed in the two periods, showing high anti-correlation with O3 only in the IAM period and little diurnal variation in the CAM period.
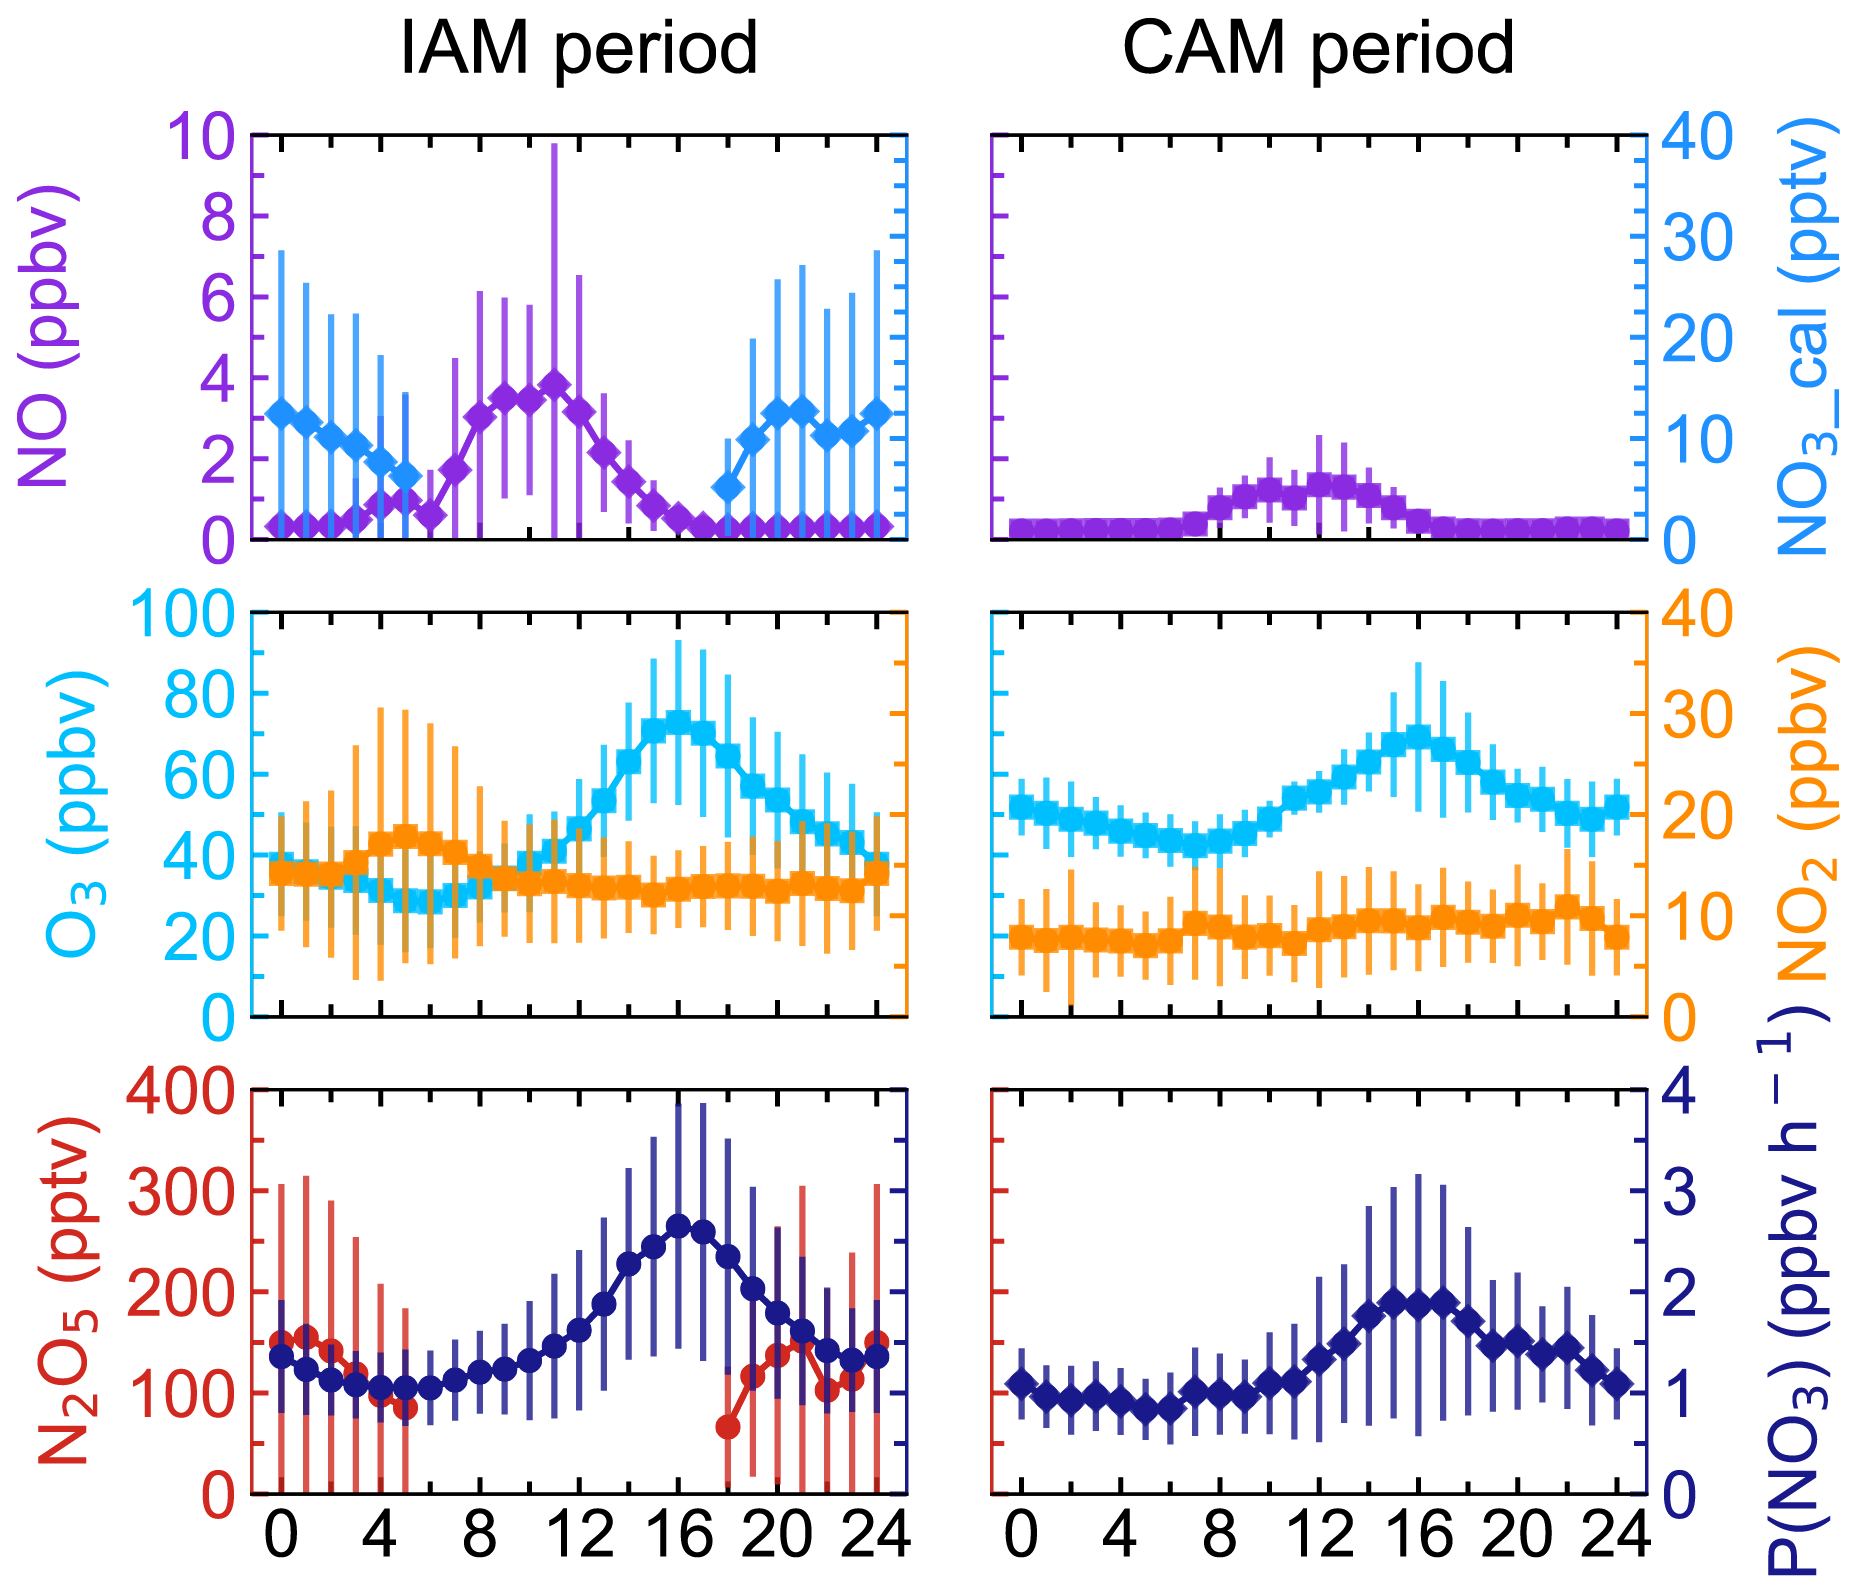
Figure 3Mean diurnal profiles of N2O5, NO3, P(NO3), and relevant parameters in the two types of air masses. NO3 was calculated from N2O5. Neither N2O5 nor NO3 was shown during the CAM period because of limited N2O5 measurement. The x axis shows the time of day.
Ozone exhibited a typical diurnal pattern for all air masses, gradually increasing until its peak at 16:00 and then slowly decreasing throughout the night until its lowest mixing ratio was reached at about 06:00. Compared to the CAM period, the lower minimum hourly O3 concentration and a small peak of NO2 in the early morning indicated that NO titration effect was stronger in the IAM period, and the higher maximum of O3 concentration in IAM indicated that photochemical formation of O3 and/or transport was faster to completely offset the titration. In addition, the higher NOx and VOC concentrations (as shown in Table S1 in the Supplement) in the IAM period facilitated O3 formation. With the elevated precursor concentrations (NO2 and O3) in the IAM period, N2O5 and NO3 accumulated rapidly after sunset, reaching their peak values (492.1 and 49.6 pptv for each). P(NO3) was highly consistent with O3 in diurnal variation and reached the peak at 16:00, with peak values of 2.7 ppbv h−1 (IAM) and 1.9 ppbv h−1 (CAM), as well as a nocturnal average value of 1.5 ± 0.8 ppbv h−1 (IAM) and 1.2 ± 0.6 ppbv h−1 (CAM), respectively. The P(NO3) of CAM was consistent with the observation when the air mass over eastern Shenzhen was transported from the clean area or sea surface (1.2 ± 0.3 ppbv h−1, Niu et al., 2022).
Table 3Summary of field-observed N2O5, NO2, and O3 concentrations and NO3 production rate.
Notes: UAM means air masses coming from continental areas, and BAM means air masses coming from background marine areas. Mean values are in the form of mean ± standard deviation or single data. The maximum was noted in the table.
3.2 The lifetimes of N2O5 and NO3
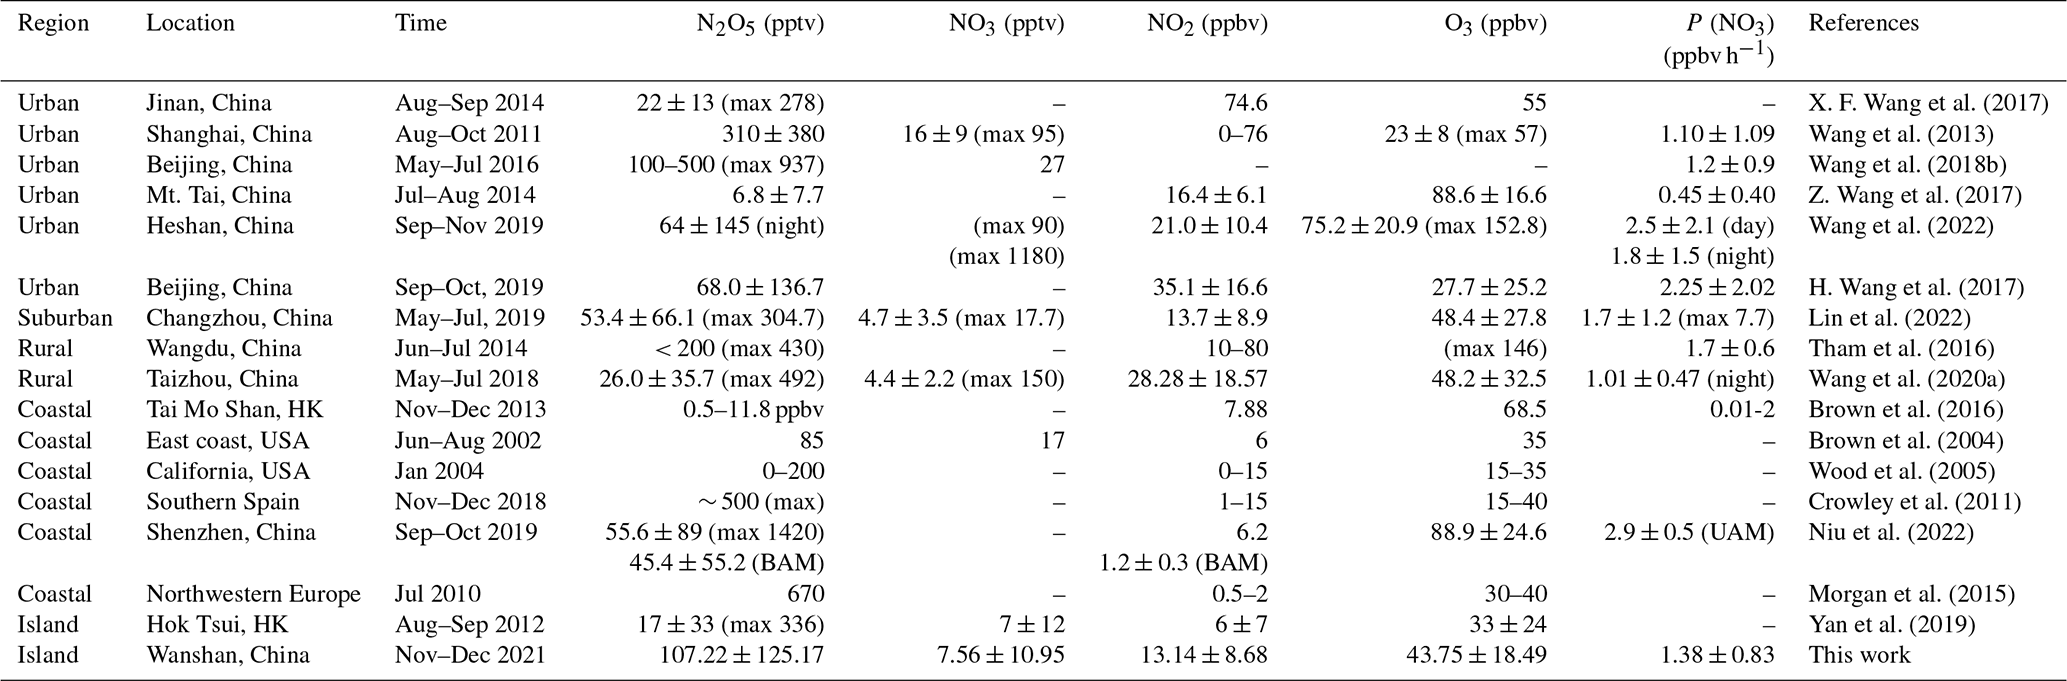
Steady-state lifetime is one of the most common and useful diagnostics for NO3 and N2O5 analysis in the atmosphere (Brown et al., 2003; Wang et al., 2018b; Wang et al., 2020a; Brown et al., 2016). As shown in Fig. 4, was low during the whole campaign, with an average of 0.5 ± 0.7 min; showed a similar pattern to but had a much higher value, ranging from 0 to 34.1 min with an average of 6.1 ± 6.5 min. The N2O5 lifetime was higher in the first half of the campaign (11.5 min, 9 to 14 November) than in the second half (3.5 min, 22 to 28 November). The difference was mainly due to the N2O5 mixing ratio rather than P(NO3), as P(NO3) showed no significant difference during the whole observation (Fig. 2).
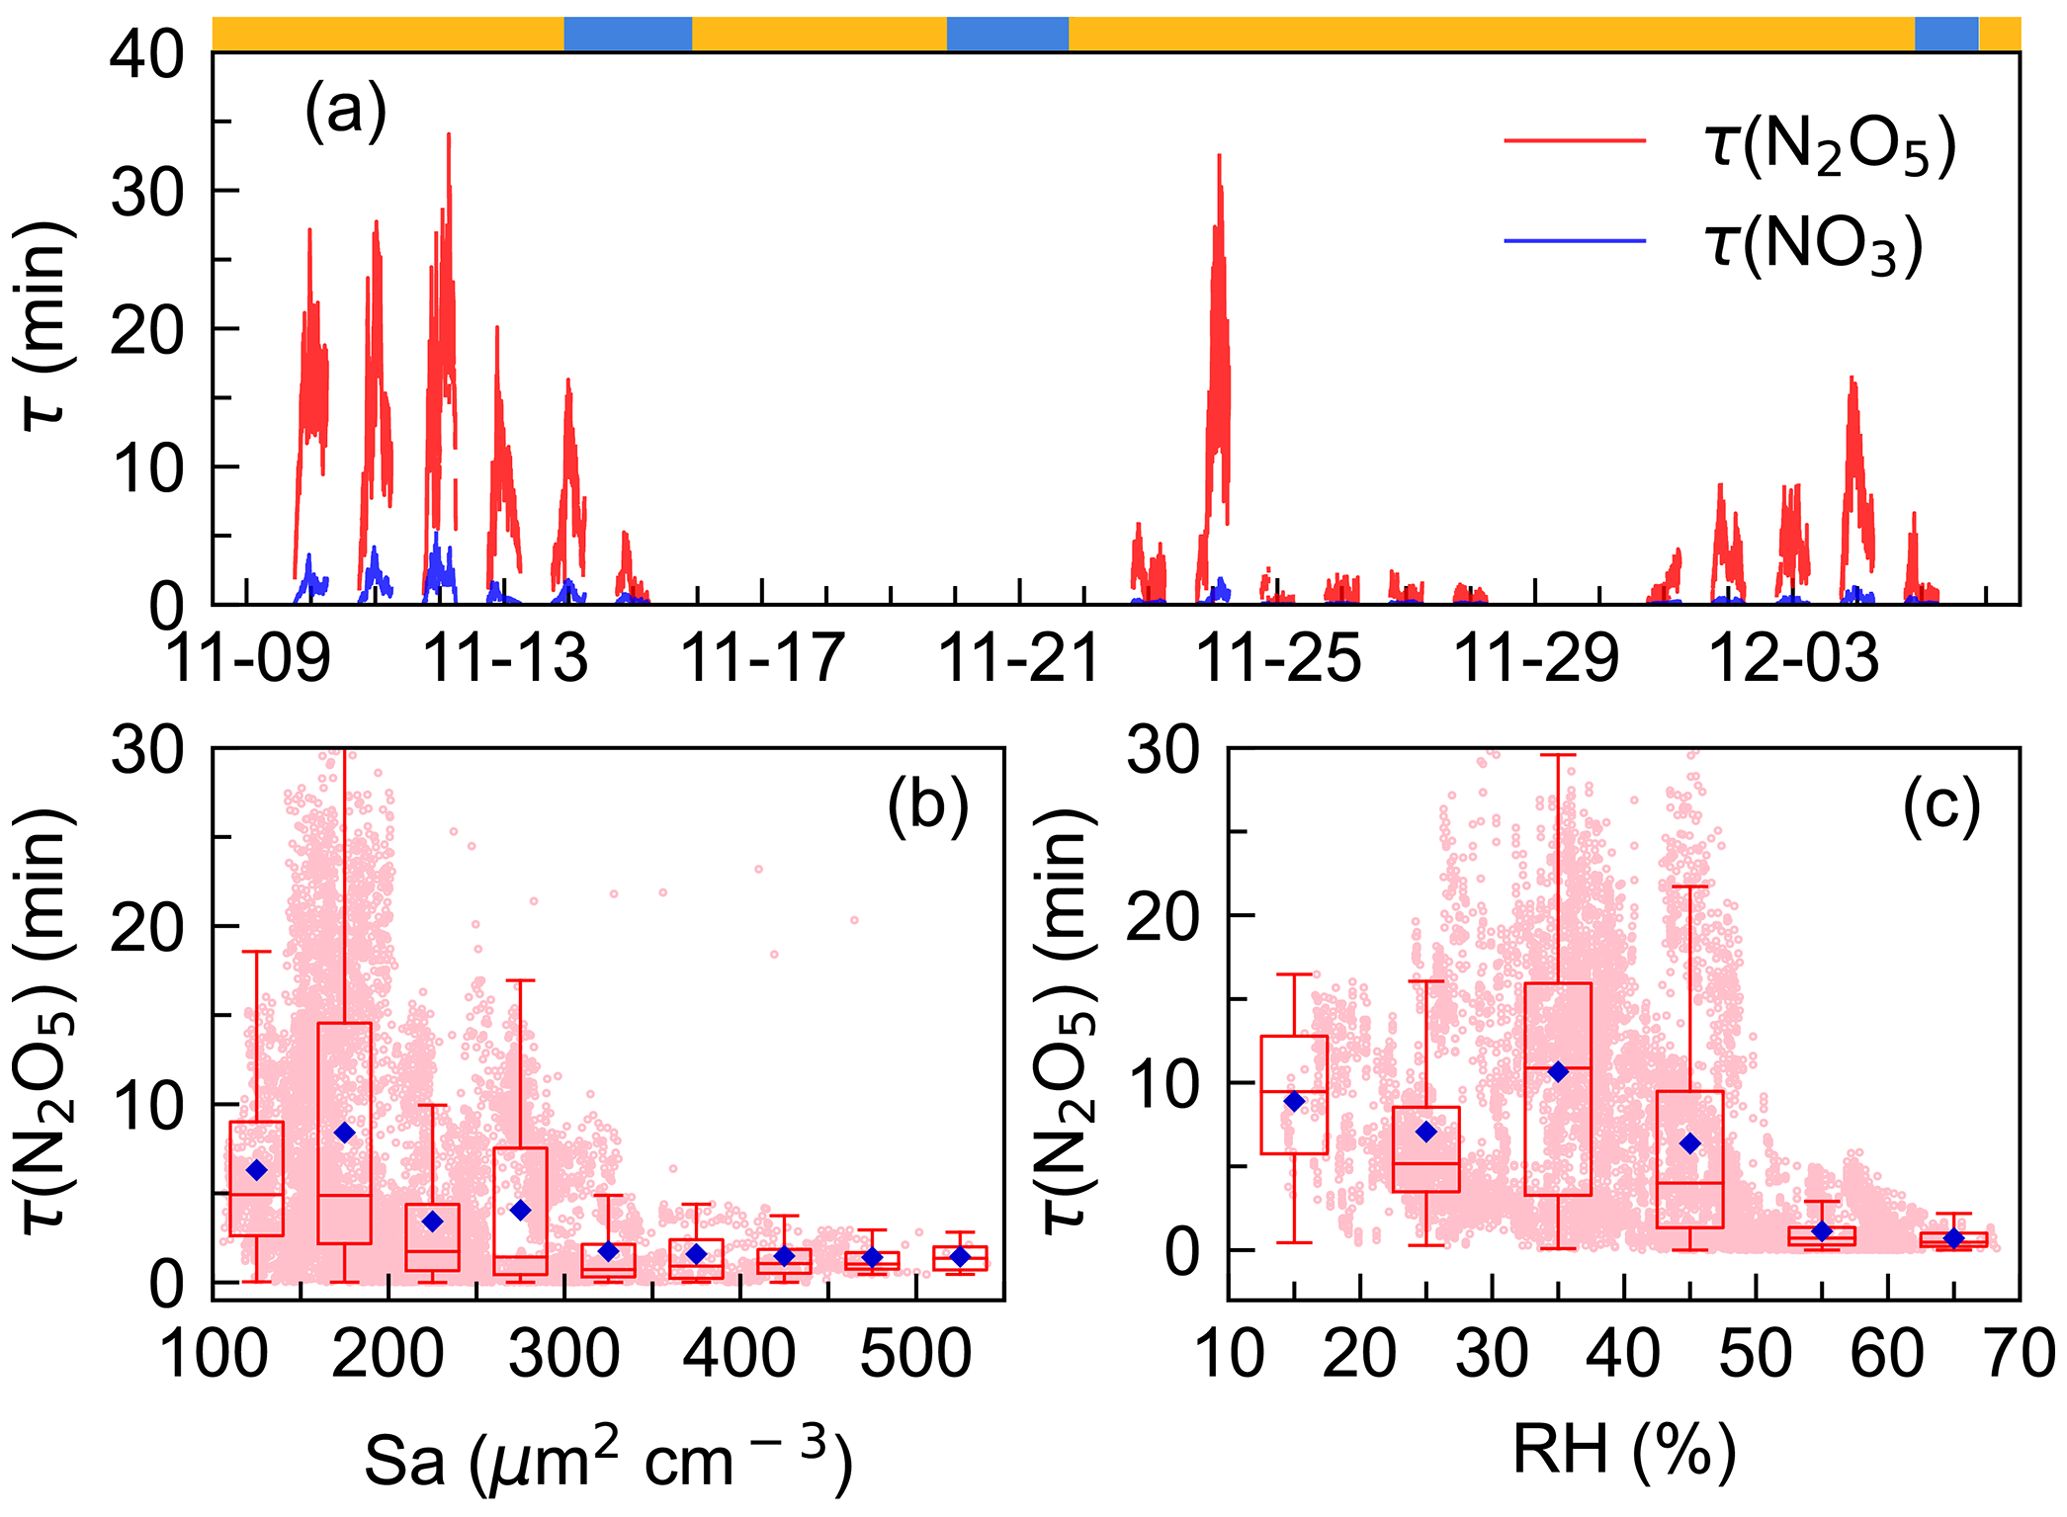
Figure 4Time series of N2O5 and NO3 lifetimes (x axis showing the time of day and date given in month-day format.) (a) and variations in nocturnal N2O5 lifetime as a function of aerosol surface area density, Sa (b), and relative humidity, RH (c). The blue diamond represents the average and pink dots represent scatter data points of 1 min. The ribbon at the top separates the air masses into two categories, yellow for IAM and blue for CAM.
values were comparable to those measured on the coastline of Finokalia, Greece, for a median of 5 min (Vrekoussis et al., 2004, 2007) but much lower than those previously reported in the residual layer in Hong Kong for 1–5 h (Brown et al., 2016). In comparison, the lifetimes were much longer than in inland urban areas, for example, 0.93 ± 1.13 min in Taizhou (Li et al., 2020) and 1.6±1.5 min in Changzhou (Lin et al., 2022) for Yangtze River Delta (YRD) regions, and 1.1–10.7 min (Zhou et al., 2018) and 4.5±4.0 min (Wang et al., 2018b) in Beijing. Typically, high aerosol loading, more intensive VOC, and NO emissions in these areas have led to enhanced N2O5 uptake and reactions of NO3 with VOC, while at this site, measurements indicated that the peak diameter in the particle number distribution was small during the whole campaign and indicated no significant difference between the two air masses with respect to the aerosol diameters (Fig. S2). Sa values ranged from 29 to 557 µm2 cm−3. All of these indicated the atmosphere was relatively clean (H. Wang et al., 2017b), making N2O5 uptake slow. Figure 4b shows that N2O5 lifetime decreased rapidly from 8.3 to 1.7 min when Sa increased up to 300 µm2 cm−3 and then remained at relatively low constant levels though Sa still increased. Such a trend of –Sa dependence was consistent with previous observations and varied in exact values (Zhou et al., 2018; Wang et al., 2018b; Li et al., 2020). Figure 4c showed that decreased as RH increased (> 40 %), possibly due to the hygroscopic aerosol growth and the dependence of the N2O5 uptake coefficient on the RH (Brown and Stutz, 2012). Overall, the trend is consistent with previous works, while the large discrepancy of the dependence implied that N2O5 uptake was not the dominant NO3 loss process.
3.3 The NO3 reactivity and N2O5 uptake coefficients
The concurrent high P(NO3) and low NO3 lifetime imply high NO3 reactivity as well as a large nocturnal NO3 loss process at DWS. The NO3 reactivity towards VOCs, calculated by Eq. (4), was categorized into anthropogenic VOC and biogenic VOC (Gu et al., 2021). Throughout the campaign, k(NO3) varied considerably (Fig. 5a), showing relatively high and fluctuated values when the air masses featured IAM. The k(NO3) ranged from 1.6 × 10⁻³ to 2.4 × 10⁻² s−1, with a daily average of 4.6 ± 2.8 × 10⁻³ s−1. Low values of k(NO3) were observed from 9 to 12 December when the air masses originated on the coast or offshore from the east and southeast, featuring the outflow of coastal cities like Hong Kong and Shenzhen.
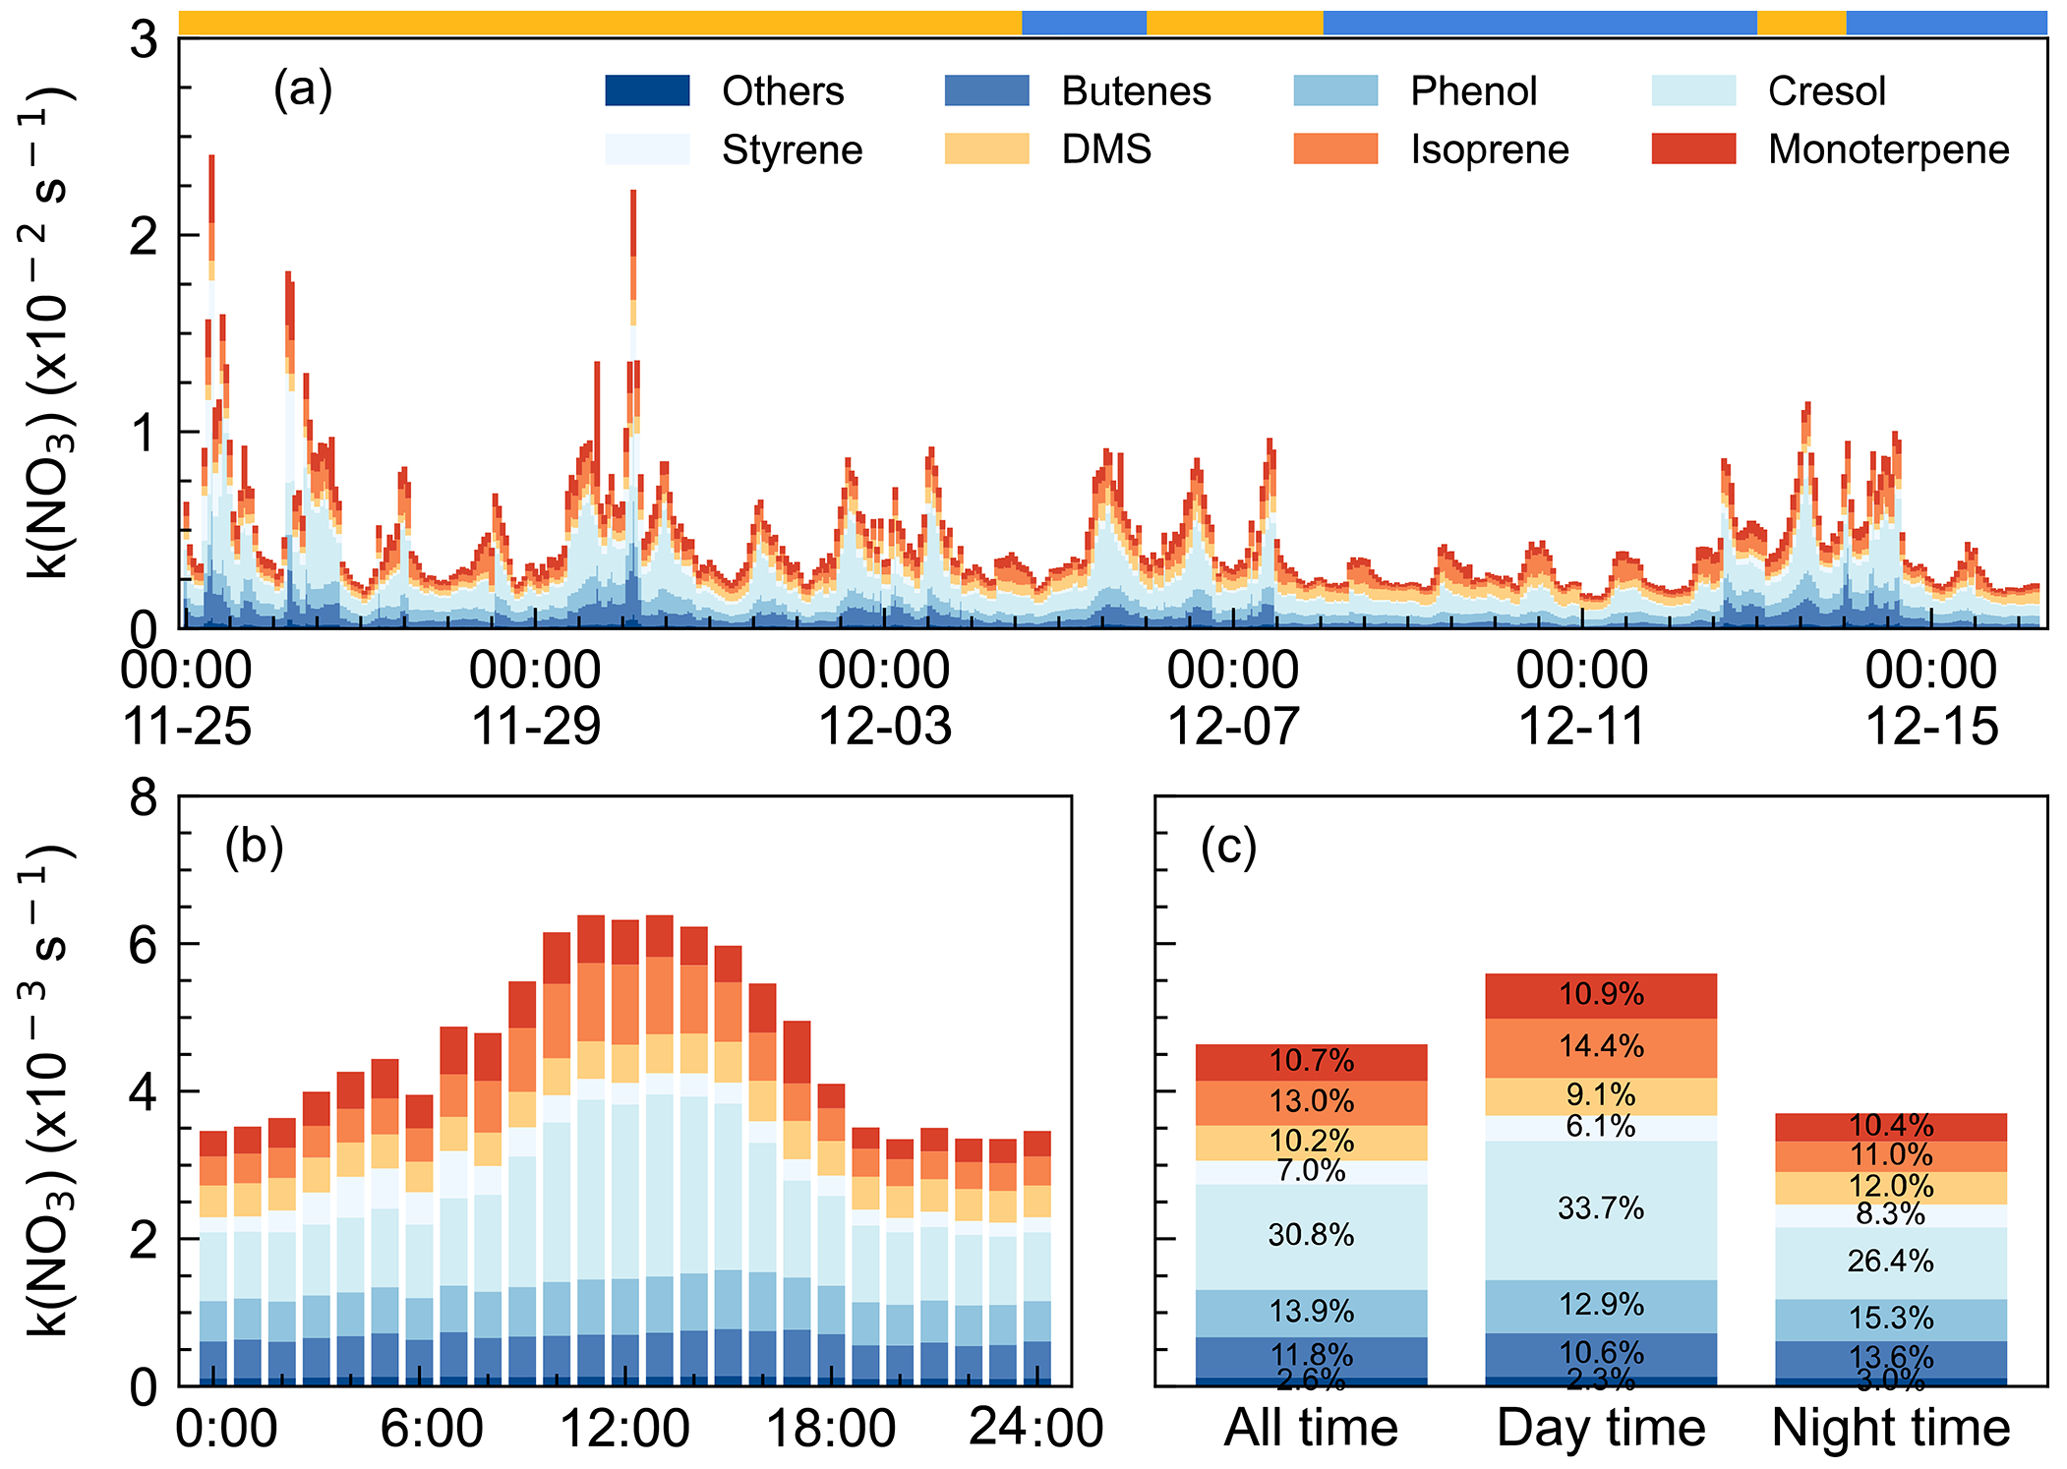
Figure 5NO3 reactivity via VOCs during the campaign. (a) k(NO3) time series from 25 November to 15 December 2021 (x axis showing the time of day and date given in month-day format), (b) mean diurnal profiles (x axis showing the time of day), and (c) the relative contribution in different categories. The ribbon at the top separates the air masses into two air masses types, yellow for IAM and blue for CAM.
Figure 5b shows the mean diurnal profile of k(NO3), where a trend of high values in the daytime and low values at nighttime are observed. Anthropogenic VOC, especially cresol, dominated the daily trend of k(NO3), while biogenic VOC-k(NO3) showed no significant diurnal variation. Except cresol, other highly reactive VOC showed little change throughout the day. Regarding the biogenic VOC-k(NO3), the concentrations of monoterpene, isoprene, and DMS changed smoothly although their emissions increased with elevated temperature and sunlight during daytime (Fuentes et al., 2000). The detailed contributions of VOC categories to k(NO3) were shown in Fig. 5c. The k(NO3) was 5.6 ± 2.8 × 10⁻³ and 3.7 ± 2.5 × 10⁻³ s−1 on average for daytime and nighttime, respectively. The daytime distribution of k(NO3) differed from that at the mountaintop of Tai Mo Shan in Hong Kong (Brown et al., 2016). During the nighttime, anthropogenic VOC-k(NO3) tripled the biogenic VOC-k(NO3) and was dominated by cresol (26.4 %). The nighttime k(NO3) corresponded to a NO3 lifetime of 4.5 min, which was about 10 times the lifetime derived from steady-state analysis, indicating that the reaction of NO3 with VOC was not significant enough. The faster NO3 loss rate also indicated the less aged air mass that was influenced by surface-level emissions.
We showed that NO3 reactivity and its composition in this study exhibited significant differences compared to other urban or forested regions (Z. Wang et al., 2017; Ayres et al., 2015; Brown et al., 2016; Lin et al., 2022). Although anthropogenic VOCs played a dominant role, accounting for 66.1 %, the major contributors were not low-carbon alkenes but phenol (13.9 %, 0.64 ± 0.28 × 10⁻³ s−1) and cresol (30.8 %, 1.4 ± 1.0 × 10⁻³ s−1), which have received little attention in previous studies. Despite their relatively low concentrations, averaging 7 ± 3 and 4 ± 3 pptv respectively, their substantial contribution to k(NO3) is notable due to their fast rate constants (3.8 × 10⁻¹² and 1.4 × 10⁻¹¹ cm3 molec.−1 s−2 at 298 K, respectively) for reaction with NO3. Considering that the measured phenol and cresol concentrations were low and near the instrumental detection limit, we note this may bring some uncertainties in quantifying the contribution to the total NO3 reactivity and NO3 loss rate. These substances are mainly secondary species from aromatic compounds and higher concentrations have also been observed, such as in the Strasbourg area, France (14 pptv, Delhomme et al., 2010), and in Great Dun Fell, UK (16 pptv, Lüttke et al., 1997). Hence, these phenolic compounds are potentially important but their contributions to NO3 reactivity in urban areas are often overlooked, and their reactions with NO3 may also contribute to the formation of nitrophenol. These reactions warrant further attention in future research. Regarding biogenic VOCs, besides the contributors commonly observed in forest regions such as monoterpenes and isoprene, the marine emissions indicator, dimethyl sulfide (DMS), contributed 10.2 % to NO3 reactivity (daily average). Previous studies have suggested that DMS may serve as a major direct sink for NO3 in clean marine regions (Allan et al., 1999; Aldener et al., 2006; Brown et al., 2007). However, this study reveals that anthropogenic VOC emissions significantly enhanced the NO3 reactivity in marine areas, highlighting the crucial influence of anthropogenic activities on marine atmospheric chemistry.
As shown in Fig. 6a, k(NO3) differed significantly between the inland and coastal air masses, with 5.2 ± 3.1 × 10⁻³ and 3.7 ± 1.9 × 10⁻³ s−1 on average in IAM and CAM periods, respectively. Of which anthropogenic VOC-k(NO3) in IAM (3.5±2.3 × 10⁻³ s−1) was higher than in CAM (2.3±1.4 × 10⁻³ s−1) and dominant in both air masses, while biogenic VOC-k(NO3) was comparable (1.7 ± 0.9 × 10⁻³ and 1.4 ± 0.6 × 10⁻³ s−1 for IAM and CAM, respectively). The difference indicated that this region was affected by long-range transport emissions to a certain extent. The pie charts in Fig. 6b show different VOC categories that contributed to k(NO3) in two periods with AVOC dominant at all times. The change in the relative contribution of various VOCs to k(NO3) varied simultaneously throughout the day, showing an increase in butene, phenol, and DMS and a decrease in cresol and monoterpene from daytime to nighttime.
Figure 6(a) Distributions of k(NO3) from AVOC and BVOC for both IAM and CAM periods. The error bar indicates the standard deviation. (b) The relative contribution of VOC categories to the k(NO3).
N2O5 heterogeneous uptake on aerosol is one of the vital loss processes of NO3, and the uptake coefficient varied greatly under different environmental conditions. For instance, γ(N2O5) can reach up to 0.072 in polluted urban regions (H. Wang et al., 2017b; Wang et al., 2018b; Lu et al., 2022; Li et al., 2020) while usually below 0.03 in coastal areas (Brown et al., 2016; Morgan et al., 2015; Niu et al., 2022). N2O5 uptake coefficient can be obtained from the pseudo-steady-state method by assuming that N2O5 and NO3 have achieved a steady state (Brown et al., 2009), in which the fitted slope represents γ(N2O5) and the intercept represents the direct loss rate coefficient, k(NO3) (as shown in Eq. 8). However, this approach failed to generate valid results in our study since a negative slope or intercept was observed (Fig. S4). These results indicated that a large NO3 removal process existed at this site, making it unable to approach a stable state. The γ(N2O5) was also calculated from 9 to 16 November by using the simplified parameterization, as shown in Eq. (9). The parameterized average γ(N2O5) showed a large variation ranging from 0.0014 to 0.0299, with an average of 0.0095±0.0059. This value is within the range of < 0.0016 to 0.03 derived from the ambient observation around other coastal areas (Niu et al., 2022; Yun et al., 2018a; Brown et al., 2006, 2016; Morgan et al., 2015) and smaller than the polluted North China Plain (X. F. Wang et al., 2017; H. Wang et al., 2017b; Z. Wang et al., 2017; Tham et al., 2018).
3.4 The NO3 loss budget
To assess the contribution of various loss processes to the total NO3 removal, we calculated their loss rate and the loss ratio, LR(NO3). The LR(NO3) is defined as the ratio of the loss rate by process X (VOC or N2O5 uptake) to the total NO3 loss rate; here the total NO3 loss rate is represented by P(NO3) since we cannot quantify the total NO3 loss rate due to the NO concentration below the limit of instrument detection. Due to the data absence of measured VOCs or N2O5 during certain periods, the loss proportion of VOCs and N2O5 uptake in NO3 loss are only presented from 26 November to 5 December 2021, during which all air masses originated from continental China. As shown in Fig. 7, a closer examination revealed that the nights can be divided into two periods: period I, 25 to 28 November when the loss ratio of VOC and N2O5 uptake remained below 3 %, and period II, 30 November to 4 December when the loss ratio was higher. Both periods had large nocturnal NO3 production rates with an average of 2.1 ± 1.1 ppbv h−1 in period I and 1.4 ± 0.6 ppbv h−1 in period II, respectively.
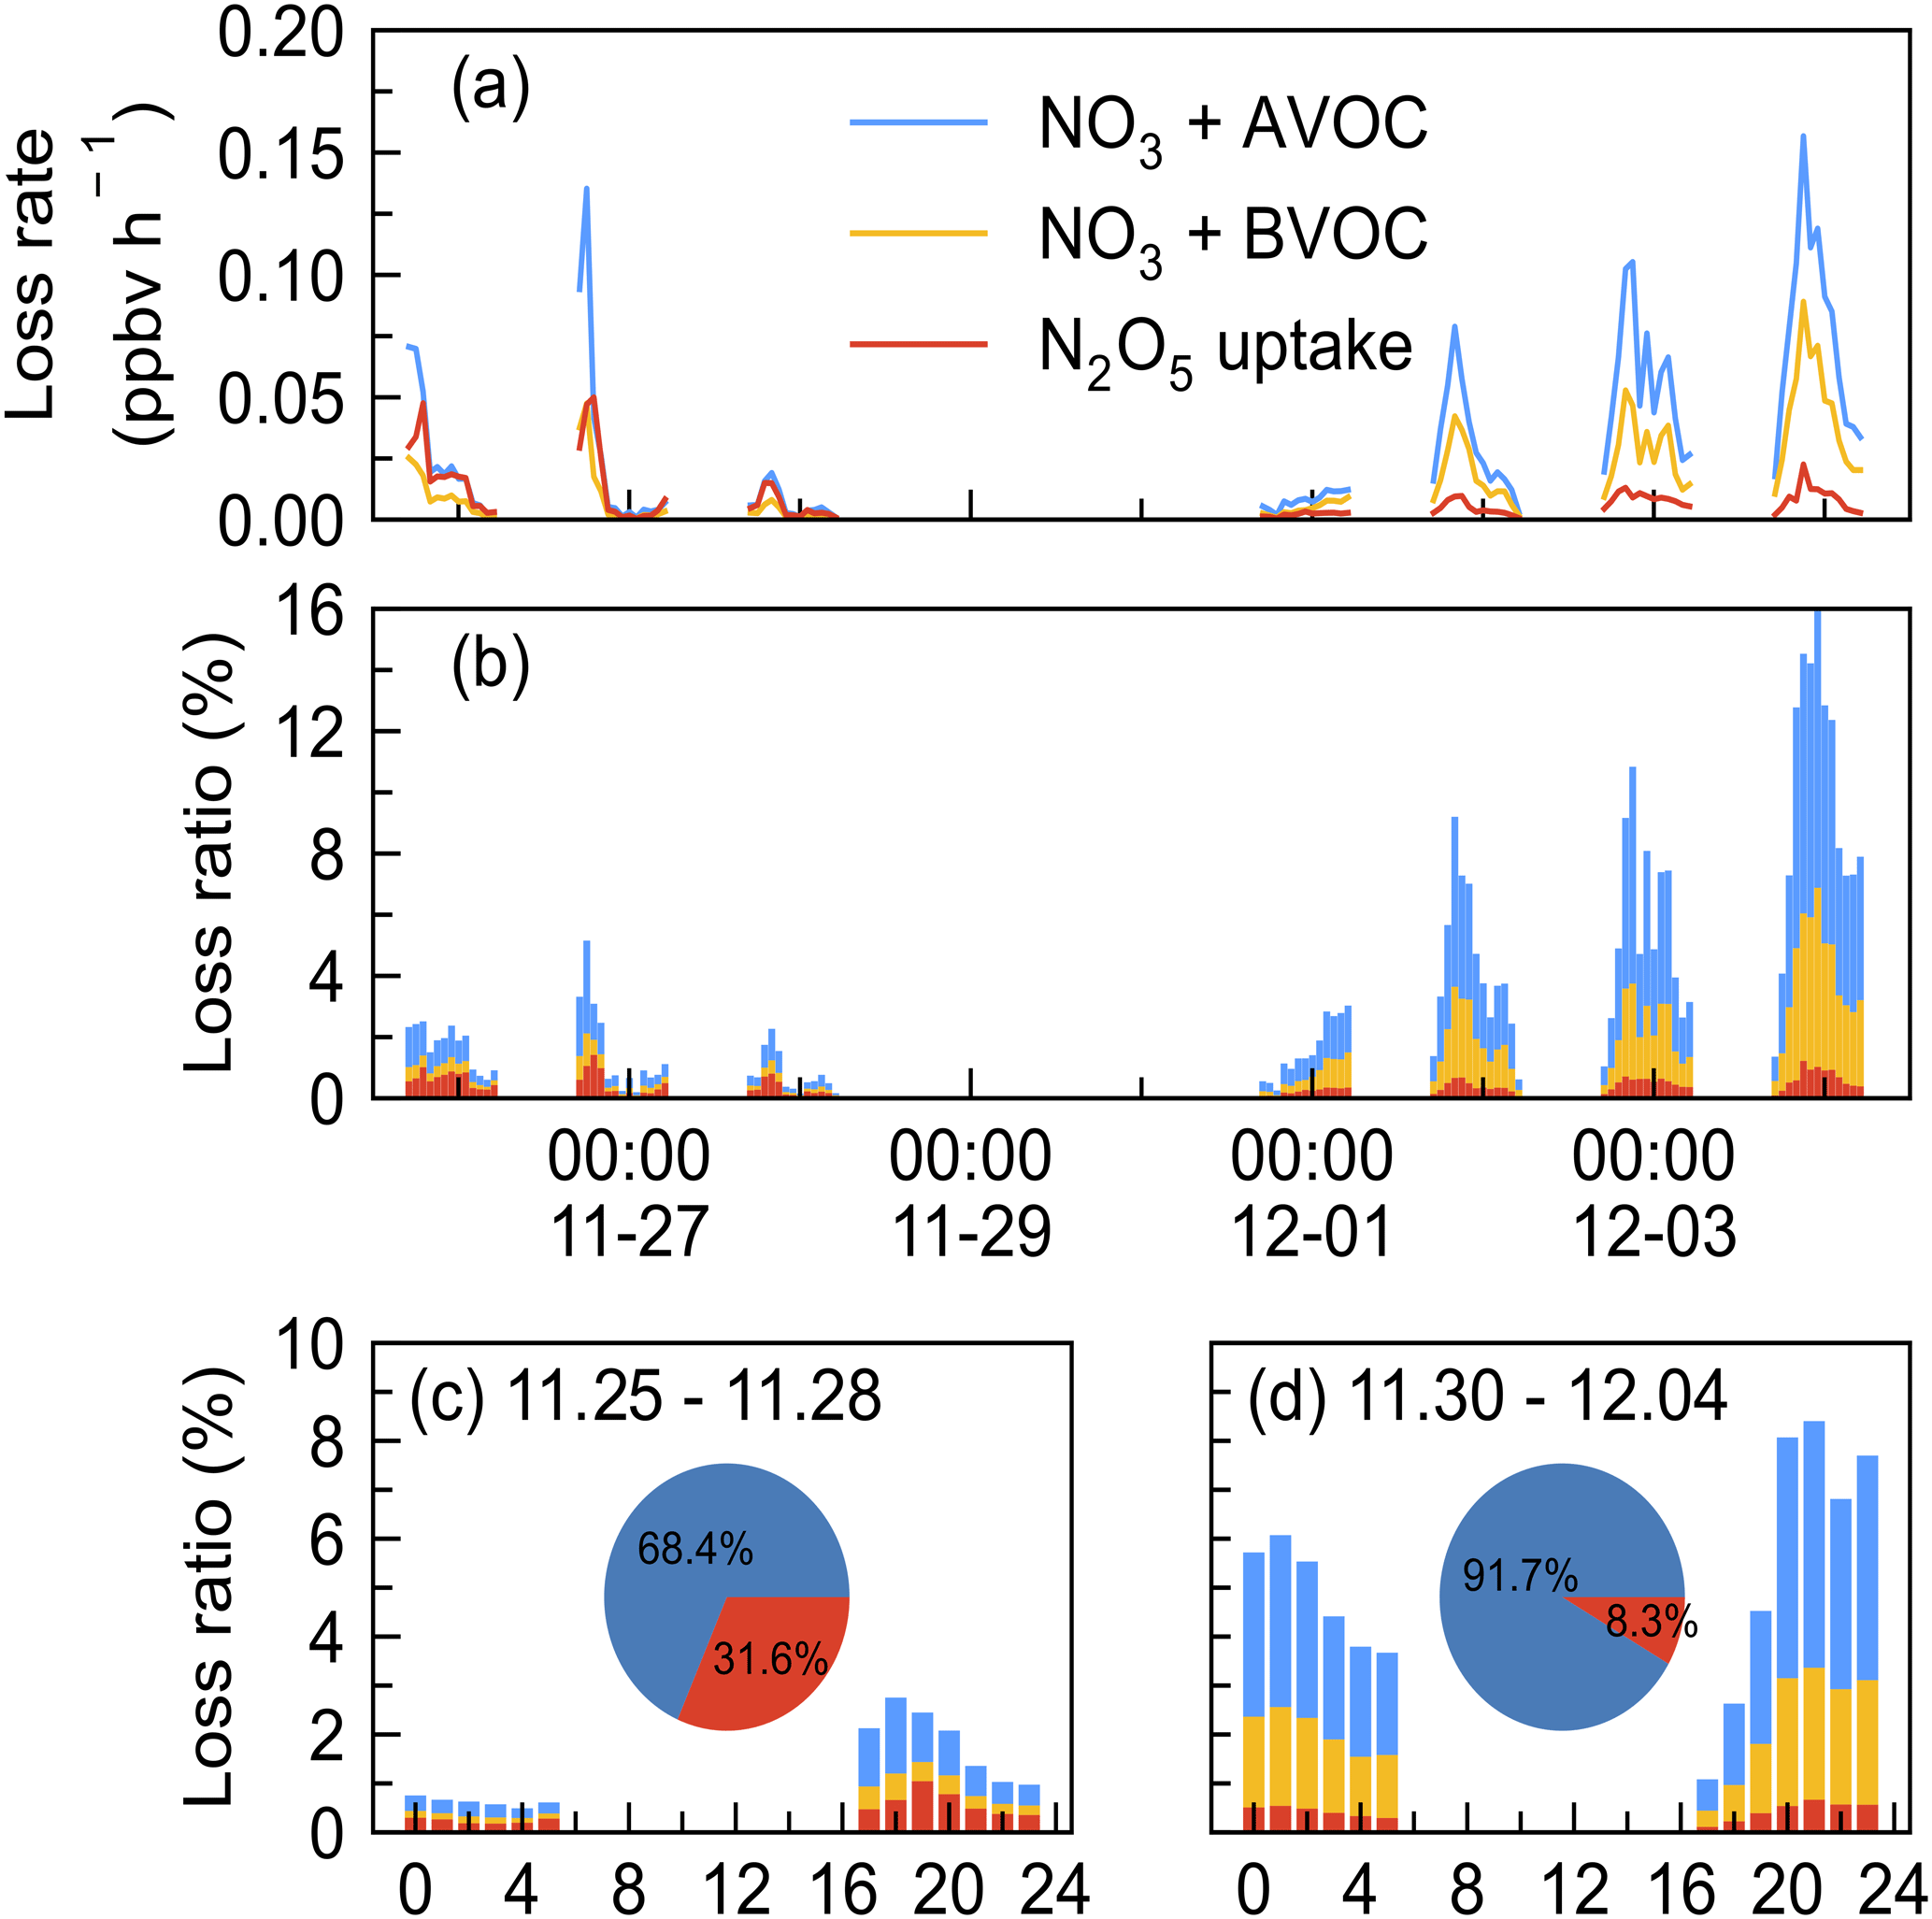
Figure 7Time series of (a) the loss rate of NO3 reactions with AVOC, BVOC, and N2O5 uptake and (b) fractional contribution to the NO3 loss during the nighttime by taking P(NO3) as the total NO3 loss in the IAM period (x axes showing the time of day and date given in month-day format). The mean diurnal profiles of NO3 loss ratio in two periods (c) 25–28 November and (d) 30 November–4 December 2021 (x axis showing the time of day). Pie charts in the center showed the relative contribution of VOCs (blue) and N2O5 uptake (red) in NO3 loss.
N2O5 uptake rate was larger in period I (0.01 ± 0.01 ppbv h−1) than in period II (0.006 ± 0.004 ppbv h−1), which can be explained by the increased RH, Sa, and N2O5 concentration, as shown in Fig. 2. The loss ratio of these processes is shown in Fig. 7b: the total NO3 loss through reactions with VOCs and N2O5 uptake accounted for less than 20 %, with an average of 1.2 % (period I) and 5.3 % (period II), respectively. This result shows that the nighttime NO3 chemistry may be almost negligible in the NOx removal compared with the day OH + NO2 pathway according to previous works reporting on urban regions (H. Wang et al., 2017b; Wang et al., 2020a). The diurnal variation of the NO3 loss fraction of both periods is shown in Fig. 7c and d, revealing that NO3 loss via N2O5 uptake and VOCs was slightly higher in the early evening and relatively stable in the late evening. The pie charts in the center were the relative contribution between VOCs and N2O5 uptake, showing that VOCs were overwhelming compared with N2O5 uptake during the two periods, with an average of 68.4 % and 91.7 % during the first and second periods, respectively.
To better understand the nocturnal oxidation of VOCs, we compared the nighttime oxidation of VOCs by NO3 with O3. Since OH was not measured and OH is often regarded as a vital daytime oxidant (Finlayson-Pitts and James, 2000; Lu et al., 2010), we did not consider OH oxidation in the nighttime. Figure S4 showed the diurnal pattern of VOC loss rate by NO3 and O3: NO3 predominantly achieves its peak oxidation rates (0.07 ppbv h−1) during the initial half of the night, accounting for 63.1 % of the total VOC oxidation on nocturnal average. Meanwhile, O3 also makes a contribution to VOC oxidation, mainly owing to its relatively high nighttime concentration levels (42.9 ± 18.4 ppbv).
Due to the difficulty in experimental quantifying γ(N2O5), the estimation of N2O5 uptake in NO3 loss may include some uncertainty. Considering the uncertainty both in parameterized γ(N2O5) and the NO3 reactivity calculation, three sensitivity tests were conducted to assess the uncertainty in period II because of the relatively high loss ratio in the above analysis (Fig. 8), and the three cases were used to represent the upper limit of their contribution to NO3 loss. Case 1 represents the overestimated contribution of N2O5 uptake by taking γ(N2O5)= 0.08, which was the high value reported from a high N2O5 and ClNO2 plume of Shenzhen (Niu et al., 2022) and approximately 7 times the parameterized value at this site. In this case, the fraction of NO3 + VOCs and N2O5 uptake was significantly elevated to account for approximately 30 % of NO3 loss. Case 2 shows the total NO3 reactivity reached an average of 5.0 × 10⁻³ s−1 by taking β-pinene as the total monoterpene because of the higher reaction rate constant. The weak change in the loss ratio indicates the reactions of NO3 with VOC may not be sensitive to the weights of monoterpenes, since the contribution of monoterpenes to the NO3 reactivity is not dominant. Case 3 is the synthesis of Case 1 and Case 2 by considering a higher N2O5 uptake coefficient and higher k(NO3) to represent the upper limit of N2O5 uptake and NO3 reaction with VOCs to NO3 loss, whose result is slightly higher than the contribution of Case 1. Nevertheless, the quantified upper contribution was still less than half. Thus, we conclude that most of the NO3 loss was not well accounted for even considering the uncertainties.
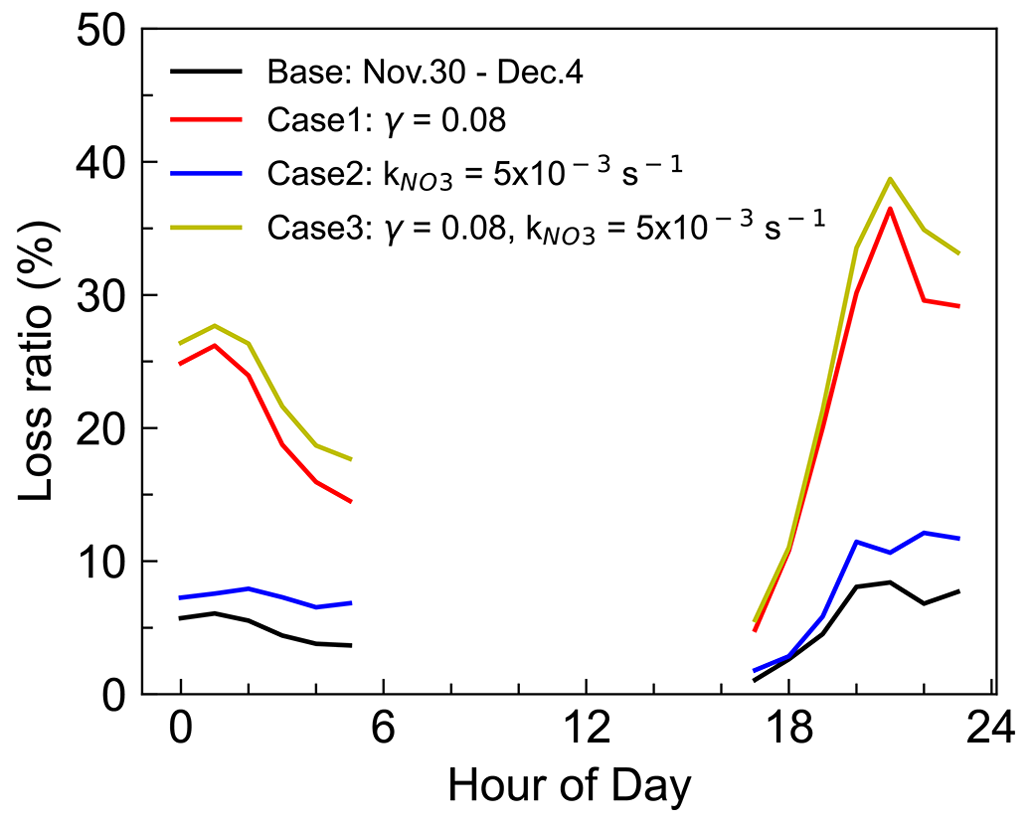
Figure 8Three sensitivity tests for the contribution of VOCs and N2O5 uptake to the NO3 loss during the nighttime of period II (30 November–4 December 2021). Case 1 takes γ(N2O5) = 0.08, which is the high value reported in a previous study. Case 2 takes β-pinene as the total monoterpene with a higher reaction rate constant, and Case 3 is the synthesis of the above two cases to represent the upper limit of the contribution.
The NO3 reaction with NO was often considered to be one of the dominant loss processes during the daytime since at nighttime NO decreased to low levels, thus not considered in the above analysis. However, by taking NO into consideration, although at low concentration levels below the detection limit of the instrument (0.4 ppbv), the contribution of NO to the nighttime NO3 loss exceeded 100 % frequently, as shown in Fig. S5. Due to the rapid reaction between NO and NO3, several pptv concentrations of NO could effectively account for most NO3 loss in a relatively clean coastal environment (Crowley et al., 2011). Nevertheless, limited by precise NO measurement, we considered the following assessments to understand the total NO3 loss processes (Fig. 9). By assuming NO at a constant value of 40–400 pptv, more than 80 % of the total NO3 loss can be well explained. Although some loss remained unidentified, these results underline that NO, often considered to be important during daytime, was the predominant NO3 loss pathway during nighttime at this study site. This also suggests accurate measurement of low NO concentrations is crucial for identifying removal pathways of nocturnal NO3 oxidants and has significant implications for nighttime atmospheric chemistry. We can infer that the nocturnal chemical NO3 reactions would be largely enhanced once without NO emission in the open ocean after the air mass passes through this site, indicating the strong influences of the urban outflow to the downwind marine areas with respect to nighttime chemistry.
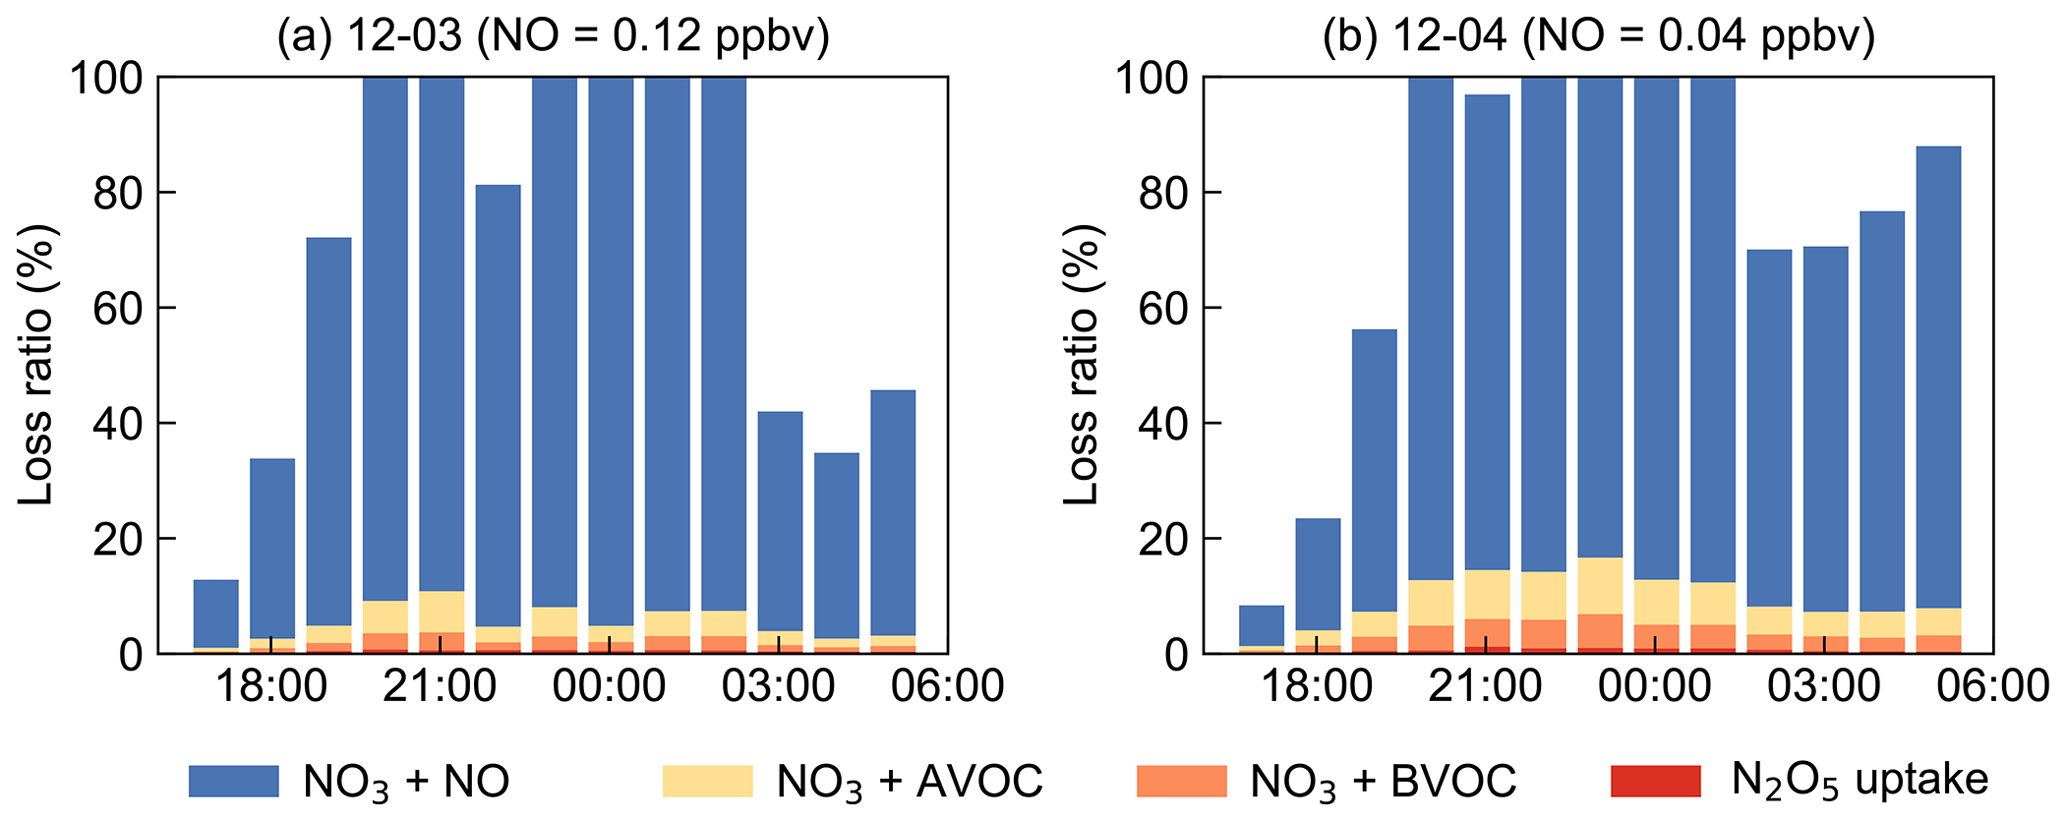
Figure 9Examples for the assessment of NO3 loss process by assuming NO as constant values to approximately explain about 80 % of the budget. The x axes show the time of day for 3 (a) and 4 (b) December.
In the absence of measured N2O5 during the CAM period, we compared k(NO3) and the reactivity of N2O5 uptake (khetKeqNO2) to indirectly reflect NO3 removal process. Overall, the NO3 reactivity values from VOCs and N2O5 uptake during nighttime were relatively comparable, 56.5 % and 43.5 %, respectively. This indicates that VOCs still had a slightly larger contribution than N2O5 uptake during the CAM period, which is consistent with the findings in southern China (Brown et al., 2016) and on the east coast of the USA (Aldener et al., 2006).
This study presents the first observation of nocturnal nitrogen oxide species, N2O5, at a typical marine site (Da Wan Shan Island, Zhuhai) in the north of the South China Sea during the winter of 2021. Although Da Wan Shan Island was almost free of local anthropogenic emissions, the air pollutants from the megacities of the Pearl River Delta were transported to this area by northerly or northeasterly winds during the measurement period. The maximum ratio of N2O5 was 657.27 pptv (1 min average) and the nocturnal average was 119.5 ± 128.6 pptv. The NO3 production rate was comparable to that in urban areas such as north China and the Yangtze River Delta, with an average value of 1.5 ± 0.9 ppbv h−1 and a maximum of up to 5.84 ppbv h−1, indicating an active nighttime chemical process in that area.
Further analysis of N2O5 and NO3 steady-state lifetimes indicates that NO3 had a very short average life of 0.5 ± 0.6 min, which was to some extent comparable to that in urban areas in summer. The combination of the high NO3 production rate and short lifetime suggests a rapid NO3 loss at night. While N2O5 uptake is inefficient in relatively clean air masses. The nighttime k(NO3) corresponded to a NO3 lifetime of 4.5 min, indicating that VOCs also contribute little to NO3 loss. Both VOC and N2O5 uptake can only explain less than 20 % of the total loss. The fast NO3 loss rate also indicated the air mass that was influenced by local surface-level emissions. We infer that the local weak NO emission may significantly change the near-surface chemical pattern of NO3 chemistry, which may result in a huge difference between the observed results on the island and those on the sea surface. We suggested that future field measurements should be made on sea surfaces away from islands, such as ship-based cruise observations, to obtain a comprehensive understanding of the nocturnal NO3 chemistry in the background marine regions.
The datasets used in this study are available at https://doi.org/10.5281/zenodo.8089100 (J. Wang et al., 2023).
The supplement related to this article is available online at: https://doi.org/10.5194/acp-24-977-2024-supplement.
HW and YJT designed the study. JW and HW analyzed the data with input from ZZ, GF, CS, ZL, JZ, and SF. HW, LY, YJT, ZL, and JZ organized this field campaign and provided the field measurement dataset. JW, HW, and YJT wrote the paper. All authors commented on and edited the article.
The contact author has declared that none of the authors has any competing interests.
Publisher’s note: Copernicus Publications remains neutral with regard to jurisdictional claims made in the text, published maps, institutional affiliations, or any other geographical representation in this paper. While Copernicus Publications makes every effort to include appropriate place names, the final responsibility lies with the authors.
The authors would like to thank the field campaign team for the data that they contributed.
This research has been supported by the National Natural Science Foundation of China (grant no. 42175111), the Guangdong Major Project of Basic and Applied Basic Research (grant no. 2020B0301030004), Guangdong Basic and Applied Basic Research Foundation (grant no. 2022A1515010852), and the Fundamental Research Funds for the Central Universities, Sun Yat-sen University (grant nos. 23lgbj002 and 23hytd002). Lili Ming received funding from the Zhuhai Science and Technology Plan Project (grant no. ZH22036201210115PWC).
This paper was edited by Eleanor Browne and reviewed by two anonymous referees.
Aldener, M., Brown, S. S., Stark, H., Williams, E. J., Lerner, B. M., Kuster, W. C., Goldan, P. D., Quinn, P. K., Bates, T. S., Fehsenfeld, F. C., and Ravishankara, A. R.: Reactivity and loss mechanisms of NO3 and N2O5 in a polluted marine environment: Results from in situ measurements during New England Air Quality Study 2002, J. Geophys. Res.-Atmos., 111, D23S73, https://doi.org/10.1029/2006jd007252, 2006.
Allan, B. J., Carslaw, N., Coe, H., Burgess, R. A., and Plane, J. M. C.: Observations of the nitrate radical in the marine boundary layer, J. Atmos. Chem., 33, 129–154, https://doi.org/10.1023/A:1005917203307, 1999.
Atkinson, R., Baulch, D. L., Cox, R. A., Crowley, J. N., Hampson, R. F., Hynes, R. G., Jenkin, M. E., Rossi, M. J., and Troe, J.: Evaluated kinetic and photochemical data for atmospheric chemistry: Volume I – gas phase reactions of Ox, HOx, NOx and SOx species, Atmos. Chem. Phys., 4, 1461–1738, https://doi.org/10.5194/acp-4-1461-2004, 2004.
Ayres, B. R., Allen, H. M., Draper, D. C., Brown, S. S., Wild, R. J., Jimenez, J. L., Day, D. A., Campuzano-Jost, P., Hu, W., de Gouw, J., Koss, A., Cohen, R. C., Duffey, K. C., Romer, P., Baumann, K., Edgerton, E., Takahama, S., Thornton, J. A., Lee, B. H., Lopez-Hilfiker, F. D., Mohr, C., Wennberg, P. O., Nguyen, T. B., Teng, A., Goldstein, A. H., Olson, K., and Fry, J. L.: Organic nitrate aerosol formation via NO biogenic volatile organic compounds in the southeastern United States, Atmos. Chem. Phys., 15, 13377–13392, https://doi.org/10.5194/acp-15-13377-2015, 2015.
Barnes, I., Hjorth, J., and Mihalopoulos, N.: Dimethyl Sulfide and Dimethyl Sulfoxide and Their Oxidation in the Atmosphere, Chem. Rev., 106, 940–975, https://doi.org/10.1021/cr020529+, 2006.
Behnke, W., and, V., Scheer, and, C., and Zetzsch: Formation of ClNO2 and HNO3 in the presence of N2O5 and wet pure NaCl- and wet mixed NaCl Na2SO4- aerosol, J. Aerosol Sci., 24, S115–S116, 1993.
Bertram, T. H. and Thornton, J. A.: Toward a general parameterization of N2O5 reactivity on aqueous particles: the competing effects of particle liquid water, nitrate and chloride, Atmos. Chem. Phys., 9, 8351–8363, https://doi.org/10.5194/acp-9-8351-2009, 2009.
Brown, S. S. and Stutz, J.: Nighttime radical observations and chemistry, Chem. Soc. Rev., 41, 6405–6447, https://doi.org/10.1039/C2cs35181a, 2012.
Brown, S. S., Stark, H., and Ravishankara, A. R.: Applicability of the steady state approximation to the interpretation of atmospheric observations of NO3 and N2O5, J. Geophys. Res.-Atmos., 108, 4539, https://doi.org/10.1029/2003jd003407, 2003.
Brown, S. S., Dibb, J. E., Stark, H., Aldener, M., Vozella, M., Whitlow, S., Williams, E. J., Lerner, B. M., Jakoubek, R., Middlebrook, A. M., DeGouw, J. A., Warneke, C., Goldan, P. D., Kuster, W. C., Angevine, W. M., Sueper, D. T., Quinn, P. K., Bates, T. S., Meagher, J. F., Fehsenfeld, F. C., and Ravishankara, A. R.: Nighttime removal of NOx in the summer marine boundary layer, Geophys. Res. Lett., 31, L07108, https://doi.org/10.1029/2004gl019412, 2004.
Brown, S. S., Ryerson, T. B., Wollny, A. G., Brock, C. A., Peltier, R., Sullivan, A. P., Weber, R. J., Dube, W. P., Trainer, M., Meagher, J. F., Fehsenfeld, F. C., and Ravishankara, A. R.: Variability in nocturnal nitrogen oxide processing and its role in regional air quality, Science, 311, 67–70, https://doi.org/10.1126/science.1120120, 2006.
Brown, S. S., Dube, W. P., Osthoff, H. D., Stutz, J., Ryerson, T. B., Wollny, A. G., Brock, C. A., Warneke, C., De Gouw, J. A., Atlas, E., Neuman, J. A., Holloway, J. S., Lerner, B. M., Williams, E. J., Kuster, W. C., Goldan, P. D., Angevine, W. M., Trainer, M., Fehsenfeld, F. C., and Ravishankara, A. R.: Vertical profiles in NO3 and N2O5 measured from an aircraft: Results from the NOAA P-3 and surface platforms during the New England Air Quality Study 2004, J. Geophys. Res.-Atmos., 112, D22304, https://doi.org/10.1029/2007jd008883, 2007.
Brown, S. S., Dube, W. P., Fuchs, H., Ryerson, T. B., Wollny, A. G., Brock, C. A., Bahreini, R., Middlebrook, A. M., Neuman, J. A., Atlas, E., Roberts, J. M., Osthoff, H. D., Trainer, M., Fehsenfeld, F. C., and Ravishankara, A. R.: Reactive uptake coefficients for N2O5 determined from aircraft measurements during the Second Texas Air Quality Study: Comparison to current model parameterizations, J. Geophys. Res.-Atmos., 114, D00F10, https://doi.org/10.1029/2008jd011679, 2009.
Brown, S. S., Dube, W. P., Peischl, J., Ryerson, T. B., Atlas, E., Warneke, C., de Gouw, J. A., Hekkert, S. T., Brock, C. A., Flocke, F., Trainer, M., Parrish, D. D., Feshenfeld, F. C., and Ravishankara, A. R.: Budgets for nocturnal VOC oxidation by nitrate radicals aloft during the 2006 Texas Air Quality Study, J. Geophys. Res.-Atmos., 116, D24305, https://doi.org/10.1029/2011jd016544, 2011.
Brown, S. S., Dube, W. P., Tham, Y. J., Zha, Q. Z., Xue, L. K., Poon, S., Wang, Z., Blake, D. R., Tsui, W., Parrish, D. D., and Wang, T.: Nighttime chemistry at a high altitude site above Hong Kong, J. Geophys. Res.-Atmos., 121, 2457–2475, https://doi.org/10.1002/2015jd024566, 2016.
Chen, X., Wang, H., and Lu, K.: Interpretation of NO3–N2O5 observation via steady state in high-aerosol air mass: the impact of equilibrium coefficient in ambient conditions, Atmos. Chem. Phys., 22, 3525–3533, https://doi.org/10.5194/acp-22-3525-2022, 2022.
Chuang, M.-T., Chang, S.-C., Lin, N.-H., Wang, J.-L., Sheu, G.-R., Chang, Y.-J., and Lee, C.-T.: Aerosol chemical properties and related pollutants measured in Dongsha Island in the northern South China Sea during 7-SEAS/Dongsha Experiment, Atmos. Environ., 78, 82–92, https://doi.org/10.1016/j.atmosenv.2012.05.014, 2013.
Crowley, J. N., Thieser, J., Tang, M. J., Schuster, G., Bozem, H., Beygi, Z. H., Fischer, H., Diesch, J.-M., Drewnick, F., Borrmann, S., Song, W., Yassaa, N., Williams, J., Pöhler, D., Platt, U., and Lelieveld, J.: Variable lifetimes and loss mechanisms for NO3 and N2O5 during the DOMINO campaign: contrasts between marine, urban and continental air, Atmos. Chem. Phys., 11, 10853–10870, https://doi.org/10.5194/acp-11-10853-2011, 2011.
Delhomme, O., Morville, S., and Millet, M.: Seasonal and diurnal variations of atmospheric concentrations of phenols and nitrophenols measured in the Strasbourg area, France, Atmos. Pollut. Res., 1, 16–22, https://doi.org/10.5094/apr.2010.003, 2010.
Dewald, P., Nussbaumer, C. M., Schuladen, J., Ringsdorf, A., Edtbauer, A., Fischer, H., Williams, J., Lelieveld, J., and Crowley, J. N.: Fate of the nitrate radical at the summit of a semi-rural mountain site in Germany assessed with direct reactivity measurements, Atmos. Chem. Phys., 22, 7051–7069, https://doi.org/10.5194/acp-22-7051-2022, 2022.
Edwards, P. M., Aikin, K. C., Dube, W. P., Fry, J. L., Gilman, J. B., de Gouw, J. A., Graus, M. G., Hanisco, T. F., Holloway, J., Huber, G., Kaiser, J., Keutsch, F. N., Lerner, B. M., Neuman, J. A., Parrish, D. D., Peischl, J., Pollack, I. B., Ravishankara, A. R., Roberts, J. M., Ryerson, T. B., Trainer, M., Veres, P. R., Wolfe, G. M., Warneke, C., and Brown, S. S.: Transition from high- to low-NOx control of night-time oxidation in the southeastern US, Nat. Geosci., 10, 490–495, https://doi.org/10.1038/Ngeo2976, 2017.
Evans, M. J. and Jacob, D. J.: Impact of new laboratory studies of N2O5 hydrolysis on global model budgets of tropospheric nitrogen oxides, ozone, and OH, Geophys. Res. Lett., 32, L09813, https://doi.org/10.1029/2005gl022469, 2005.
Finlayson-Pitts, B. J. and James, N.: Chemistry of the upper and lower atmosphere: theory, experiments and applications, Academic Press, California, ISBN 978-0-12-257060-5, 2000.
Fuentes, J. D., Lerdau., M., and Atkinson., R.: Biogenic hydrocarbons in the atmospheric boundary layer: a review, B. Am. Meteorol. Soc., 81, 1537–1575, http://www.jstor.org/stable/26215178 (last access: 10 April 2023), 2000.
Geyer, A., Alicke, B., Konrad, S., Schmitz, T., Stutz, J., and Platt, U.: Chemistry and oxidation capacity of the nitrate radical in the continental boundary layer near Berlin, J. Geophys. Res.-Atmos., 106, 8013–8025, https://doi.org/10.1029/2000jd900681, 2001.
Gu, S., Guenther, A., and Faiola, C.: Effects of Anthropogenic and Biogenic Volatile Organic Compounds on Los Angeles Air Quality, Environ. Sci. Technol., 55, 12191–12201, https://doi.org/10.1021/acs.est.1c01481, 2021.
Hallquist, M., Stewart, D. J., Stephenson, S. K., and Cox, R. A.: Hydrolysis of N2O5 on sub-micron sulfate aerosols, Phys. Chem. Chem. Phys., 5, 3453–3463, https://doi.org/10.1039/B301827j, 2003.
Kane, S. M., Caloz, F., and Leu, M. T.: Heterogeneous uptake of gaseous N2O5 by (NH4)(2)SO4, NH4HSO4, and H2SO4 aerosols, J. Phys. Chem. A, 105, 6465–6470, https://doi.org/10.1021/Jp010490x, 2001.
Kiendler-Scharr, A., Mensah, A. A., Friese, E., Topping, D., Nemitz, E., Prevot, A. S. H., Aijala, M., Allan, J., Canonaco, F., Canagaratna, M., Carbone, S., Crippa, M., Dall Osto, M., Day, D. A., De Carlo, P., Di Marco, C. F., Elbern, H., Eriksson, A., Freney, E., Hao, L., Herrmann, H., Hildebrandt, L., Hillamo, R., Jimenez, J. L., Laaksonen, A., McFiggans, G., Mohr, C., O'Dowd, C., Otjes, R., Ovadnevaite, J., Pandis, S. N., Poulain, L., Schlag, P., Sellegri, K., Swietlicki, E., Tiitta, P., Vermeulen, A., Wahner, A., Worsnop, D., and Wu, H. C.: Ubiquity of organic nitrates from nighttime chemistry in the European submicron aerosol, Geophys. Res. Lett., 43, 7735–7744, https://doi.org/10.1002/2016gl069239, 2016.
Li, Z., Xie, P., Hu, R., Wang, D., Jin, H., Chen, H., Lin, C., and Liu, W.: Observations of N2O5 and NO3 at a suburban environment in Yangtze river delta in China: Estimating heterogeneous N2O5 uptake coefficients, J. Environ. Sci.-China, 95, 248–255, https://doi.org/10.1016/j.jes.2020.04.041, 2020.
Liebmann, J., Karu, E., Sobanski, N., Schuladen, J., Ehn, M., Schallhart, S., Quéléver, L., Hellen, H., Hakola, H., Hoffmann, T., Williams, J., Fischer, H., Lelieveld, J., and Crowley, J. N.: Direct measurement of NO3 radical reactivity in a boreal forest, Atmos. Chem. Phys., 18, 3799–3815, https://doi.org/10.5194/acp-18-3799-2018, 2018a.
Liebmann, J. M., Muller, J. B. A., Kubistin, D., Claude, A., Holla, R., Plass-Dülmer, C., Lelieveld, J., and Crowley, J. N.: Direct measurements of NO3 reactivity in and above the boundary layer of a mountaintop site: identification of reactive trace gases and comparison with OH reactivity, Atmos. Chem. Phys., 18, 12045–12059, https://doi.org/10.5194/acp-18-12045-2018, 2018b.
Lin, C., Hu, R., Xie, P., Lou, S., Zhang, G., Tong, J., Liu, J., and Liu, W.: Nocturnal atmospheric chemistry of NO3 and N2O5 over Changzhou in the Yangtze River Delta in China, J. Environ. Sci.-China, 114, 376–390, https://doi.org/10.1016/j.jes.2021.09.016, 2022.
Liu, X., Lyu, X., Wang, Y., Jiang, F., and Guo, H.: Intercomparison of O3 formation and radical chemistry in the past decade at a suburban site in Hong Kong, Atmos. Chem. Phys., 19, 5127–5145, https://doi.org/10.5194/acp-19-5127-2019, 2019.
Liu, X. G., Gu, J. W., Li, Y. P., Cheng, Y. F., Qu, Y., Han, T. T., Wang, J. L., Tian, H. Z., Chen, J., and Zhang, Y. H.: Increase of aerosol scattering by hygroscopic growth: Observation, modeling, and implications on visibility, Atmos. Res., 132, 91–101, https://doi.org/10.1016/j.atmosres.2013.04.007, 2013.
Lu, K. D., Zhang, Y. H., Su, H., Brauers, T., Chou, C. C., Hofzumahaus, A., Liu, S. C., Kita, K., Kondo, Y., Shao, M., Wahner, A., Wang, J. L., Wang, X. S., and Zhu, T.: Oxidant (O3 + NO2) production processes and formation regimes in Beijing, J. Geophys. Res.-Atmos., 115, D07303, https://doi.org/10.1029/2009jd012714, 2010.
Lu, X., Qin, M., Xie, P., Duan, J., Fang, W., and Liu, W.: Observation of ambient NO3 radicals by LP-DOAS at a rural site in North China Plain, Sci. Total Environ., 804, 149680, https://doi.org/10.1016/j.scitotenv.2021.149680, 2022.
Lüttke, J., Scheer, V., Levsen, K., Wünsch, G., Cape, J. N., Hargreaves, K. J., Storeton-West, R. L., Acker, K., Wieprecht, W., and Jones, B.: Occurrence and formation of nitrated phenols in and out of cloud, Atmos. Environ., 31, 2637–2648, 1997.
McMurry, P. H., Woo, K. S., Weber, R., Chen, D. R., and Pui, D. Y. H.: Size distributions of 3–10 nm atmospheric particles: implications for nucleation mechanisms, Philos. T. R. Soc. A, 358, 2625–2642, https://doi.org/10.1098/rsta.2000.0673, 2000.
Morgan, W. T., Ouyang, B., Allan, J. D., Aruffo, E., Di Carlo, P., Kennedy, O. J., Lowe, D., Flynn, M. J., Rosenberg, P. D., Williams, P. I., Jones, R., McFiggans, G. B., and Coe, H.: Influence of aerosol chemical composition on N2O5 uptake: airborne regional measurements in northwestern Europe, Atmos. Chem. Phys., 15, 973–990, https://doi.org/10.5194/acp-15-973-2015, 2015.
Mogensen, D., Gierens, R., Crowley, J. N., Keronen, P., Smolander, S., Sogachev, A., Nölscher, A. C., Zhou, L., Kulmala, M., Tang, M. J., Williams, J., and Boy, M.: Simulations of atmospheric OH, O3 and NO3 reactivities within and above the boreal forest, Atmos. Chem. Phys., 15, 3909–3932, https://doi.org/10.5194/acp-15-3909-2015, 2015.
Ng, N. L., Brown, S. S., Archibald, A. T., Atlas, E., Cohen, R. C., Crowley, J. N., Day, D. A., Donahue, N. M., Fry, J. L., Fuchs, H., Griffin, R. J., Guzman, M. I., Herrmann, H., Hodzic, A., Iinuma, Y., Jimenez, J. L., Kiendler-Scharr, A., Lee, B. H., Luecken, D. J., Mao, J., McLaren, R., Mutzel, A., Osthoff, H. D., Ouyang, B., Picquet-Varrault, B., Platt, U., Pye, H. O. T., Rudich, Y., Schwantes, R. H., Shiraiwa, M., Stutz, J., Thornton, J. A., Tilgner, A., Williams, B. J., and Zaveri, R. A.: Nitrate radicals and biogenic volatile organic compounds: oxidation, mechanisms, and organic aerosol, Atmos. Chem. Phys., 17, 2103–2162, https://doi.org/10.5194/acp-17-2103-2017, 2017.
Niu, Y. B., Zhu, B., He, L. Y., Wang, Z., Lin, X. Y., Tang, M. X., and Huang, X. F.: Fast Nocturnal Heterogeneous Chemistry in a Coastal Background Atmosphere and Its Implications for Daytime Photochemistry, J. Geophys. Res.-Atmos., 127, e2022JD036716, https://doi.org/10.1029/2022jd036716, 2022.
Osthoff, H. D., Pilling, M. J., Ravishankara, A. R., and Brown, S. S.: Temperature dependence of the NO3 absorption cross-section above 298 K and determination of the equilibrium constant for NO3 + NO2? N2O5 at atmospherically relevant conditions, Phys. Chem. Chem. Phys., 9, 5785–5793, https://doi.org/10.1039/b709193a, 2007.
Osthoff, H. D., Roberts, J. M., Ravishankara, A. R., Williams, E. J., Lerner, B. M., Sommariva, R., Bates, T. S., Coffman, D., Quinn, P. K., Dibb, J. E., Stark, H., Burkholder, J. B., Talukdar, R. K., Meagher, J., Fehsenfeld, F. C., and Brown, S. S.: High levels of nitryl chloride in the polluted subtropical marine boundary layer, Nat. Geosci., 1, 324–328, https://doi.org/10.1038/Ngeo177, 2008.
Riedel, T. P., Bertram, T. H., Crisp, T. A., Williams, E. J., Lerner, B. M., Vlasenko, A., Li, S. M., Gilman, J., de Gouw, J., Bon, D. M., Wagner, N. L., Brown, S. S., and Thornton, J. A.: Nitryl Chloride and Molecular Chlorine in the Coastal Marine Boundary Layer, Environ. Sci. Technol., 46, 10463–10470, https://doi.org/10.1021/es204632r, 2012.
Riedel, T. P., Wolfe, G. M., Danas, K. T., Gilman, J. B., Kuster, W. C., Bon, D. M., Vlasenko, A., Li, S.-M., Williams, E. J., Lerner, B. M., Veres, P. R., Roberts, J. M., Holloway, J. S., Lefer, B., Brown, S. S., and Thornton, J. A.: An MCM modeling study of nitryl chloride (ClNO2) impacts on oxidation, ozone production and nitrogen oxide partitioning in polluted continental outflow, Atmos. Chem. Phys., 14, 3789–3800, https://doi.org/10.5194/acp-14-3789-2014, 2014.
Rosati, B., Isokääntä, S., Christiansen, S., Jensen, M. M., Moosakutty, S. P., Wollesen de Jonge, R., Massling, A., Glasius, M., Elm, J., Virtanen, A., and Bilde, M.: Hygroscopicity and CCN potential of DMS-derived aerosol particles, Atmos. Chem. Phys., 22, 13449–13466, https://doi.org/10.5194/acp-22-13449-2022, 2022.
Tang, M. J., Schuster, G., and Crowley, J. N.: Heterogeneous reaction of N2O5 with illite and Arizona test dust particles, Atmos. Chem. Phys., 14, 245–254, https://doi.org/10.5194/acp-14-245-2014, 2014.
Tham, Y. J., Wang, Z., Li, Q., Yun, H., Wang, W., Wang, X., Xue, L., Lu, K., Ma, N., Bohn, B., Li, X., Kecorius, S., Größ, J., Shao, M., Wiedensohler, A., Zhang, Y., and Wang, T.: Significant concentrations of nitryl chloride sustained in the morning: investigations of the causes and impacts on ozone production in a polluted region of northern China, Atmos. Chem. Phys., 16, 14959–14977, https://doi.org/10.5194/acp-16-14959-2016, 2016.
Tham, Y. J., Wang, Z., Li, Q., Wang, W., Wang, X., Lu, K., Ma, N., Yan, C., Kecorius, S., Wiedensohler, A., Zhang, Y., and Wang, T.: Heterogeneous N2O5 uptake coefficient and production yield of ClNO2 in polluted northern China: roles of aerosol water content and chemical composition, Atmos. Chem. Phys., 18, 13155–13171, https://doi.org/10.5194/acp-18-13155-2018, 2018.
Thornton, J. A., Kercher, J. P., Rie De L, T. P., Wagner, N. L., Cozic, J., Holloway, J. S., Dubé, W., Wolfe, G. M., Quinn, P. K., and Middlebrook, A. M.: A large atomic chlorine source inferred from mid-continental reactive nitrogen chemistry, Nature, 464, 271–274, 2010.
Vrekoussis, M., Kanakidou, M., Mihalopoulos, N., Crutzen, P. J., Lelieveld, J., Perner, D., Berresheim, H., and Baboukas, E.: Role of the NO3 radicals in oxidation processes in the eastern Mediterranean troposphere during the MINOS campaign, Atmos. Chem. Phys., 4, 169–182, https://doi.org/10.5194/acp-4-169-2004, 2004.
Vrekoussis, M., Mihalopoulos, N., Gerasopoulos, E., Kanakidou, M., Crutzen, P. J., and Lelieveld, J.: Two-years of NO3 radical observations in the boundary layer over the Eastern Mediterranean, Atmos. Chem. Phys., 7, 315–327, https://doi.org/10.5194/acp-7-315-2007, 2007.
Wagner, N. L., Riedel, T. P., Young, C. J., Bahreini, R., Brock, C. A., Dube, W. P., Kim, S., Middlebrook, A. M., Ozturk, F., Roberts, J. M., Russo, R., Sive, B., Swarthout, R., Thornton, J. A., VandenBoer, T. C., Zhou, Y., and Brown, S. S.: N2O5 uptake coefficients and nocturnal NO2 removal rates determined from ambient wintertime measurements, J. Geophys. Res.-Atmos., 118, 9331–9350, https://doi.org/10.1002/Jgrd.50653, 2013.
Wang, H., Chen, T., and Lu, K.: Measurement of NO3 and N2O5 in the Troposphere, Prog. Chem., 27, 963–976, 2015.
Wang, H., Chen, J., and Lu, K.: Development of a portable cavity-enhanced absorption spectrometer for the measurement of ambient NO3 and N2O5: experimental setup, lab characterizations, and field applications in a polluted urban environment, Atmos. Meas. Tech., 10, 1465–1479, https://doi.org/10.5194/amt-10-1465-2017, 2017a.
Wang, H., Lu, K., Chen, X., Zhu, Q., Chen, Q., Guo, S., Jiang, M., Li, X., Shang, D., Tan, Z., Wu, Y., Wu, Z., Zou, Q., Zheng, Y., Zeng, L., Zhu, T., Hu, M., and Zhang, Y.: High N2O5 Concentrations Observed in Urban Beijing: Implications of a Large Nitrate Formation Pathway, Environ. Sci. Tech. Lett., 4, 416–420, https://doi.org/10.1021/acs.estlett.7b00341, 2017b.
Wang, H., Lyu, X., Guo, H., Wang, Y., Zou, S., Ling, Z., Wang, X., Jiang, F., Zeren, Y., Pan, W., Huang, X., and Shen, J.: Ozone pollution around a coastal region of South China Sea: interaction between marine and continental air, Atmos. Chem. Phys., 18, 4277–4295, https://doi.org/10.5194/acp-18-4277-2018, 2018a.
Wang, H., Lu, K., Guo, S., Wu, Z., Shang, D., Tan, Z., Wang, Y., Le Breton, M., Lou, S., Tang, M., Wu, Y., Zhu, W., Zheng, J., Zeng, L., Hallquist, M., Hu, M., and Zhang, Y.: Efficient N2O5 uptake and NO3 oxidation in the outflow of urban Beijing, Atmos. Chem. Phys., 18, 9705–9721, https://doi.org/10.5194/acp-18-9705-2018, 2018b.
Wang, H., Chen, X., Lu, K., Hu, R., Li, Z., Wang, H., Ma, X., Yang, X., Chen, S., Dong, H., Liu, Y., Fang, X., Zeng, L., Hu, M., and Zhang, Y.: NO3 and N2O5 chemistry at a suburban site during the EXPLORE-YRD campaign in 2018, Atmos. Environ., 224, 117180, https://doi.org/10.1016/j.atmosenv.2019.117180, 2020a.
Wang, H., Chen, X., Lu, K., Tan, Z., Ma, X., Wu, Z., Li, X., Liu, Y., Shang, D., Wu, Y., Zeng, L., Hu, M., Schmitt, S., Kiendler-Scharr, A., Wahner, A., and Zhang, Y.: Wintertime N2O5 uptake coefficients over the North China Plain, Sci. Bull., 65, 765–774, https://doi.org/10.1016/j.scib.2020.02.006, 2020b.
Wang, H., Lu, K., Chen, S., Li, X., Zeng, L., Hu, M., and Zhang, Y.: Characterizing nitrate radical budget trends in Beijing during 2013–2019, Sci. Total Environ., 795, 148869, https://doi.org/10.1016/j.scitotenv.2021.148869, 2021.
Wang, H., Yuan, B., Zheng, E., Zhang, X., Wang, J., Lu, K., Ye, C., Yang, L., Huang, S., Hu, W., Yang, S., Peng, Y., Qi, J., Wang, S., He, X., Chen, Y., Li, T., Wang, W., Huangfu, Y., Li, X., Cai, M., Wang, X., and Shao, M.: Formation and impacts of nitryl chloride in Pearl River Delta, Atmos. Chem. Phys., 22, 14837–14858, https://doi.org/10.5194/acp-22-14837-2022, 2022.
Wang, H., Wang, H., Lu, X., Lu, K., Zhang, L., Tham, Y. J., Shi, Z., Aikin, K., Fan, S., Brown, S. S., and Zhang, Y.: Increased night-time oxidation over China despite widespread decrease across the globe, Nat. Geosci., 16, 217–223, https://doi.org/10.1038/s41561-022-01122-x, 2023.
Wang, S. S., Shi, C. Z., Zhou, B., Zhao, H., Wang, Z. R., Yang, S. N., and Chen, L. M.: Observation of NO3 radicals over Shanghai, China, Atmos. Environ., 70, 401–409, https://doi.org/10.1016/j.atmosenv.2013.01.022, 2013.
Wang, X. F., Wang, H., Xue, L. K., Wang, T., Wang, L. W., Gu, R. R., Wang, W. H., Tham, Y. J., Wang, Z., Yang, L. X., Chen, J. M., and Wang, W. X.: Observations of N2O5 and ClNO2 at a polluted urban surface site in North China: High N2O5 uptake coefficients and low ClNO2 product yields, Atmos. Environ., 156, 125–134, https://doi.org/10.1016/j.atmosenv.2017.02.035, 2017.
Wang, Z., Wang, W., Tham, Y. J., Li, Q., Wang, H., Wen, L., Wang, X., and Wang, T.: Fast heterogeneous N2O5 uptake and ClNO2 production in power plant and industrial plumes observed in the nocturnal residual layer over the North China Plain, Atmos. Chem. Phys., 17, 12361–12378, https://doi.org/10.5194/acp-17-12361-2017, 2017.
Wang, J., Wang, H., Tham, Y. J., Ming, L., Zheng, Z., Fang, G., Sun, C., Ling, Z., Zhao, J., and Fan, S.: Measurement report: Atmospheric nitrate radical chemistry in the South China Sea influenced by the urban outflow of the Pearl River Delta, Zenodo [data set], https://doi.org/10.5281/zenodo.8089100, 2023.
Wayne, R. P., Barnes, I., Biggs, P., Burrows, J. P., Canosamas, C. E., Hjorth, J., Lebras, G., Moortgat, G. K., Perner, D., Poulet, G., Restelli, G., and Sidebottom, H.: The Nitrate Radical – Physics, Chemistry, and the Atmosphere, Atmos. Environ. A-Gen., 25, 1–203, https://doi.org/10.1016/0960-1686(91)90192-A, 1991.
Wood, E. C., Bertram, T. H., Wooldridge, P. J., and Cohen, R. C.: Measurements of N2O5, NO2, and O3 east of the San Francisco Bay, Atmos. Chem. Phys., 5, 483–491, https://doi.org/10.5194/acp-5-483-2005, 2005.
Xu, L., Guo, H., Boyd, C. M., Klein, M., Bougiatioti, A., Cerully, K. M., Hite, J. R., Isaacman-VanWertz, G., Kreisberg, N. M., Knote, C., Olson, K., Koss, A., Goldstein, A. H., Hering, S. V., de Gouw, J., Baumann, K., Lee, S. H., Nenes, A., Weber, R. J., and Ng, N. L.: Effects of anthropogenic emissions on aerosol formation from isoprene and monoterpenes in the southeastern United States, P. Natl. Acad. Sci. USA, 112, 37–42, 2015.
Yan, C., Tham, Y. J., Zha, Q. Z., Wang, X. F., Xue, L. K., Dai, J. N., Wang, Z., and Wang, T.: Fast heterogeneous loss of N2O5 leads to significant nighttime NOx removal and nitrate aerosol formation at a coastal background environment of southern China, Sci. Total Environ., 677, 637–647, https://doi.org/10.1016/j.scitotenv.2019.04.389, 2019.
Yan, Y., Wang, S., Zhu, J., Guo, Y., Tang, G., Liu, B., An, X., Wang, Y., and Zhou, B.: Vertically increased NO3 radical in the nocturnal boundary layer, Sci. Total Environ., 763, 142969, https://doi.org/10.1016/j.scitotenv.2020.142969, 2021.
Yang, S., Yuan, B., Peng, Y., Huang, S., Chen, W., Hu, W., Pei, C., Zhou, J., Parrish, D. D., Wang, W., He, X., Cheng, C., Li, X.-B., Yang, X., Song, Y., Wang, H., Qi, J., Wang, B., Wang, C., Wang, C., Wang, Z., Li, T., Zheng, E., Wang, S., Wu, C., Cai, M., Ye, C., Song, W., Cheng, P., Chen, D., Wang, X., Zhang, Z., Wang, X., Zheng, J., and Shao, M.: The formation and mitigation of nitrate pollution: comparison between urban and suburban environments, Atmos. Chem. Phys., 22, 4539–4556, https://doi.org/10.5194/acp-22-4539-2022, 2022.
Yu, C., Wang, Z., Xia, M., Fu, X., Wang, W., Tham, Y. J., Chen, T., Zheng, P., Li, H., Shan, Y., Wang, X., Xue, L., Zhou, Y., Yue, D., Ou, Y., Gao, J., Lu, K., Brown, S. S., Zhang, Y., and Wang, T.: Heterogeneous N2O5 reactions on atmospheric aerosols at four Chinese sites: improving model representation of uptake parameters, Atmos. Chem. Phys., 20, 4367–4378, https://doi.org/10.5194/acp-20-4367-2020, 2020.
Yun, H., Wang, T., Wang, W. H., Tham, Y. J., Li, Q. Y., Wang, Z., and Poon, S. C. N.: Nighttime NOx loss and ClNO2 formation in the residual layer of a polluted region: Insights from field measurements and an iterative box model, Sci. Total Environ., 622, 727–734, https://doi.org/10.1016/j.scitotenv.2017.11.352, 2018a.
Yun, H., Wang, W., Wang, T., Xia, M., Yu, C., Wang, Z., Poon, S. C. N., Yue, D., and Zhou, Y.: Nitrate formation from heterogeneous uptake of dinitrogen pentoxide during a severe winter haze in southern China, Atmos. Chem. Phys., 18, 17515–17527, https://doi.org/10.5194/acp-18-17515-2018, 2018b.
Zhou, W., Zhao, J., Ouyang, B., Mehra, A., Xu, W., Wang, Y., Bannan, T. J., Worrall, S. D., Priestley, M., Bacak, A., Chen, Q., Xie, C., Wang, Q., Wang, J., Du, W., Zhang, Y., Ge, X., Ye, P., Lee, J. D., Fu, P., Wang, Z., Worsnop, D., Jones, R., Percival, C. J., Coe, H., and Sun, Y.: Production of N2O5 and ClNO2 in summer in urban Beijing, China, Atmos. Chem. Phys., 18, 11581–11597, https://doi.org/10.5194/acp-18-11581-2018, 2018.
Zhu, J., Wang, S., Zhang, S., Xue, R., Gu, C., and Zhou, B.: Changes in NO3 Radical and Its Nocturnal Chemistry in Shanghai From 2014 to 2021 Revealed by Long-Term Observation and a Stacking Model: Impact of China’s Clean Air Action Plan, J. Geophys. Res.-Atmos., 127, e2022JD037438, https://doi.org/10.1029/2022jd037438, 2022.