the Creative Commons Attribution 4.0 License.
the Creative Commons Attribution 4.0 License.
 | 29 Aug 2024
Insights into the sources of ultrafine particle numbers at six European urban sites obtained by investigating COVID-19 lockdowns
Alex Rowell
James Brean
David C. S. Beddows
Tuukka Petäjä
Máté Vörösmarty
Imre Salma
Jarkko V. Niemi
Hanna E. Manninen
Dominik van Pinxteren
Thomas Tuch
Kay Weinhold
Zongbo Shi
Lockdown restrictions in response to the COVID-19 pandemic led to the curtailment of many activities and reduced emissions of primary air pollutants. Here, we applied positive matrix factorisation to particle size distribution (PSD) data from six monitoring sites (three urban background and three roadside) between four European cities (Helsinki, Leipzig, Budapest, and London) to evaluate how particle number concentrations (PNCs) and their sources changed during the respective 2020 lockdown periods compared to the reference years 2014–2019. A number of common factors were resolved between sites, including nucleation, road traffic semi-volatile fraction (road trafficsvf), road traffic solid fraction (road trafficsf), diffuse urban (wood smoke + aged traffic), ozone-associated secondary aerosol (O3-associated SA), and secondary inorganic aerosol (SIA). Nucleation, road traffic, and diffuse urban factors were the largest contributors to mean PNCs during the reference years and respective lockdown periods. However, SIA factors were the largest contributors to particle mass concentrations, irrespective of environment type. Total mean PNCs were lower at two of the urban-background and all roadside sites during lockdown. The response of nucleation and road trafficsvf factors to lockdown restrictions was highly variable, although road trafficsf factors were consistently lower at roadside sites. The responses of diffuse urban factors were largely consistent and were mostly lower at urban-background sites. Secondary aerosols (O3-associated SA and SIA) exhibited extensive reductions in their mean PNCs at all sites. These variegated responses to lockdowns across Europe point to a complex network of sources and aerosol sinks contributing to PSDs.
- Article
(2644 KB) - Full-text XML
-
Supplement
(1921 KB) - BibTeX
- EndNote


The COVID-19 pandemic and the resultant curtailment of human activities had profound impacts on global atmospheric chemistry, reflected in the concentrations of greenhouse gases (Le Quéré et al., 2020), gas phase pollutants (Shi et al., 2021), and particulate matter (Hammer et al., 2021; Putaud et al., 2023; Torkmahalleh et al., 2021). Ambient atmospheric aerosol particles are of scientific concern due to their detrimental effects on human health (Cohen et al., 2017) and the uncertainties they cause in models of global radiative forcing (Storelvmo et al., 2016). These health and climatic effects depend on particle size, as their ability to enter the lung, reflect or refract solar radiation, and form clouds is a size-dependent process. For their parameterisation in air quality and climate models, it is therefore important to understand the sources of differently sized aerosol particles. Particle mass concentrations (PMCs) are typically dominated by larger particles, such as those with mobility diameters > 100 nm, whereas particle number concentrations (PNCs) are typically dominated by smaller particles, such as those ≤ 100 nm, commonly referred to as ultrafine particles (UFPs). The human health effects of UFPs are less clear, however; there is epidemiological evidence of the adverse health effects of UFP exposure when weighted by number (Ohlwein et al., 2019), and particle count in different size ranges is an important metric for understanding the climatic effects of aerosols (Jiang et al., 2021).
Number size distributions are typically comprised of a series of lognormal modes. Each mode represents a different source, or an aggregate of sources (referred to as a factor), as modified by aerosol microphysical processes, such as particle shrinkage. Different sources of particles produce different modal diameters (Vu et al., 2015). In urban environments, primary and secondary particle production (< 1000 nm) arises from factors of natural and anthropogenic origin. In the existing literature, a number of common source-related factors have been identified around the world, including nucleation, traffic (multiple), heating, ozone-associated secondary aerosol, and secondary inorganic aerosol, as well as biomass burning and various unidentified factors (Hopke et al., 2022). However, the identification of such factors is not straightforward. The shape of the particle size distribution from primary traffic emissions, for example, depends on a host of variables, including fuel type and driving conditions (Rönkkö and Timonen, 2019). Secondary aerosols arise in the smallest diameters from new particle formation (NPF) processes, where vapours such as sulfuric acid and amines cluster in the atmosphere to form new thermodynamically stable aerosol particles at ∼ 1.5 nm, before growing to larger sizes due to the condensation of oxidised organic molecules (OOMs), acids, and other suitably involatile vapours (Kulmala et al., 2014; Lee et al., 2019). Vapour nucleation and the subsequent formation of new particles occur most commonly during photochemically active periods. Secondary accumulation mode aerosols are typically comprised largely of nitrate, sulfate, organic matter, and ammonium, and the modal diameter depends on precursor concentrations and rates of oxidation chemistry. Whilst size distribution data do not provide any compositional information, sources and mechanisms can be inferred through their modal diameters, as well as their daily, weekly, and monthly cycles.
The COVID-19 pandemic, as well as the associated lockdown periods, will have impacted these factors and their respective contributions to total PNCs. In order to better understand these changes, a mathematical receptor model (Positive Matrix Factorization, PMF) was applied to particle size distribution data from six monitoring sites between four European cities (Helsinki, Leipzig, Budapest, and London) to identify the major factors contributing to total PNCs during lockdown compared to the associated periods in the reference years 2014–2019, depending on data coverage.
2.1 Monitoring stations
This study is based on data from six monitoring sites spanning four European countries including Finland, Germany, Hungary, and the United Kingdom (Fig. 1). Each site was assigned a unique identifier denoting its location and environment type (Table 1). The monitoring sites incorporate two different environment types, including urban-background (denoted as UB) and roadside (denoted as RS) locations. Three urban-background and three roadside sites were included in this study. The urban-background sites are not dominated by any single source or street and are deemed representative of a well-mixed, average atmospheric environment within their respective cities. Their surroundings are similarly varied and broadly consist of commercial and residential property, transport infrastructure, and green space. The roadside sites are located such that their pollution levels are heavily influenced by the emissions from nearby traffic. Their surroundings are also similarly varied; however, they differ in terms of their aspect ratios (average building height divided by the most frequent width of the street canyon) and daily traffic volumes. As the COVID lockdown was different in each country, we chose the start point as where a substantial limitation on human movement was imposed around mid-March and the end of the period as when a large change was made to human movement in mid-May. Using any single metric would lead to vastly different sampling periods where differences in meteorology would dominate our results, rather than differences in emissions.
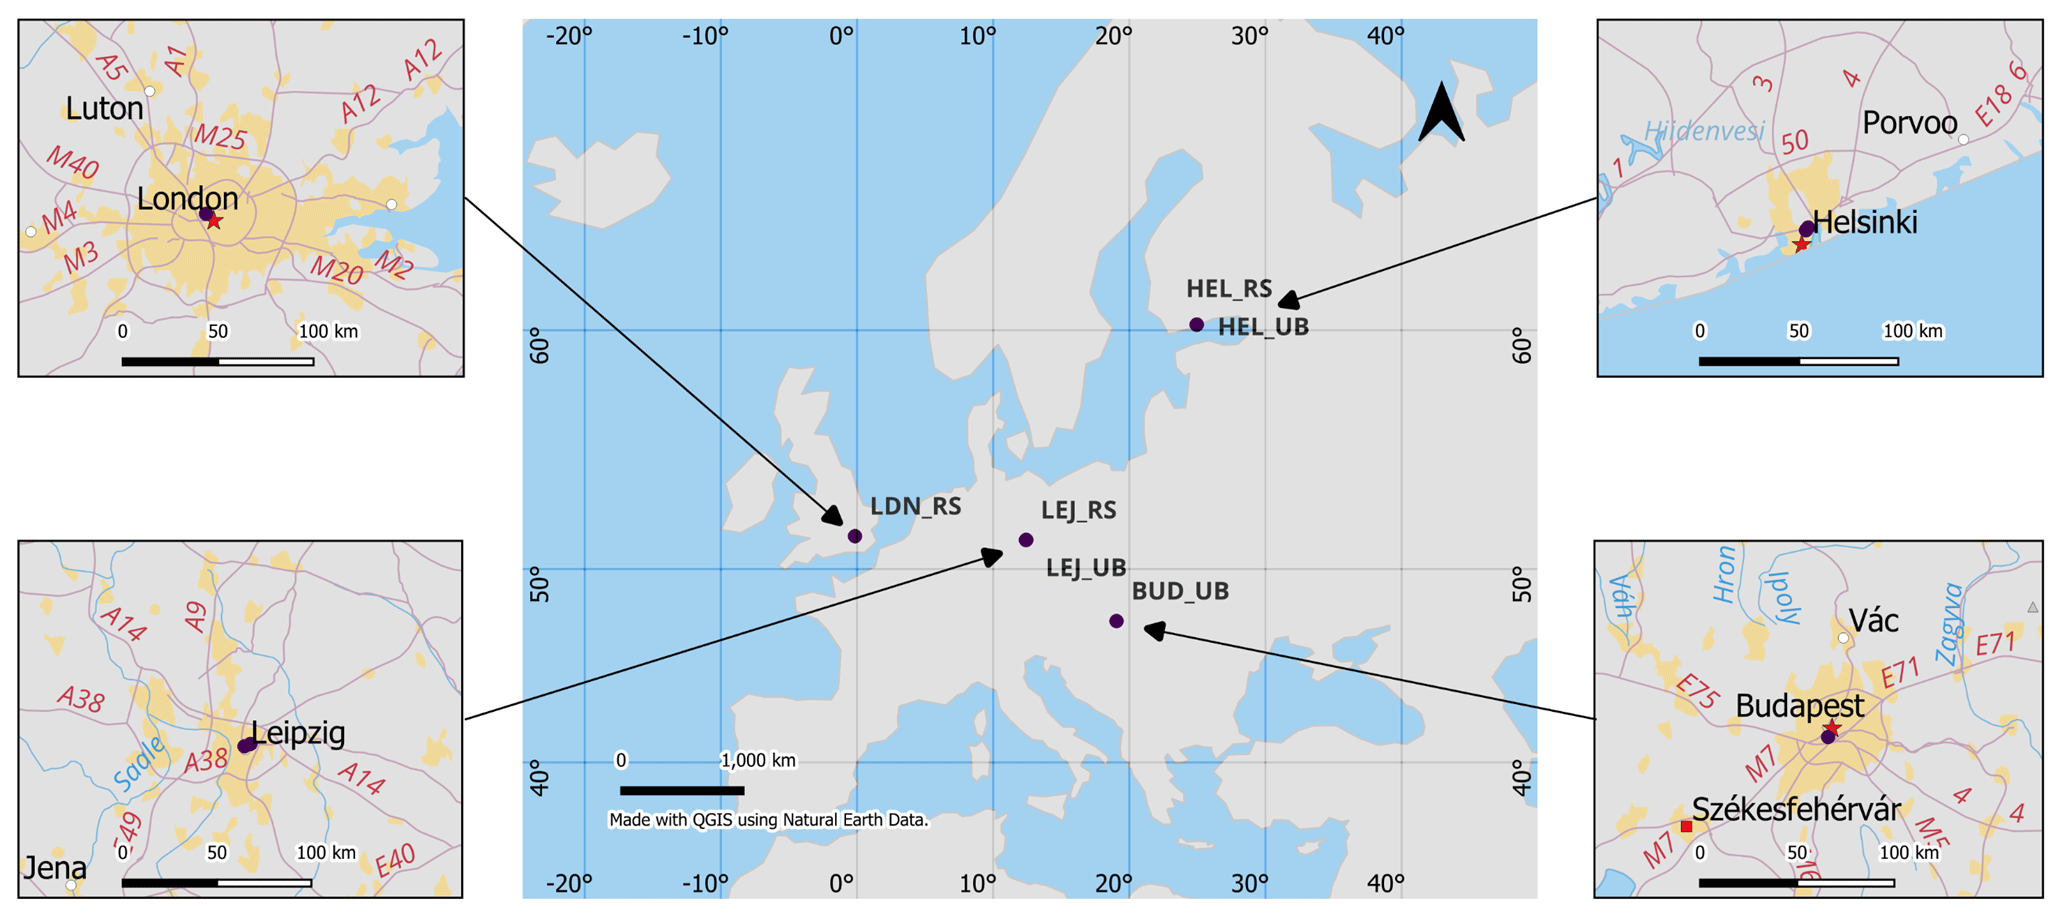
Figure 1Monitoring site locations. Top left: London (United Kingdom) roadside; top right: Helsinki (Finland) urban background and roadside; bottom left: Leipzig (Germany) urban background and roadside; bottom right: Budapest (Hungary) urban background.
Table 1Monitoring site information. An asterisk (*) in the Site ID column denotes if a site is participating in the Aerosol, Clouds and Trace Gases Research Infrastructure (ACTRIS) consortium. SMEAR III: Station for Measuring Ecosystem–Atmosphere Relations. TROPOS: Leibniz Institute for Tropospheric Research. BpART: Budapest platform for Aerosol Research and Training.
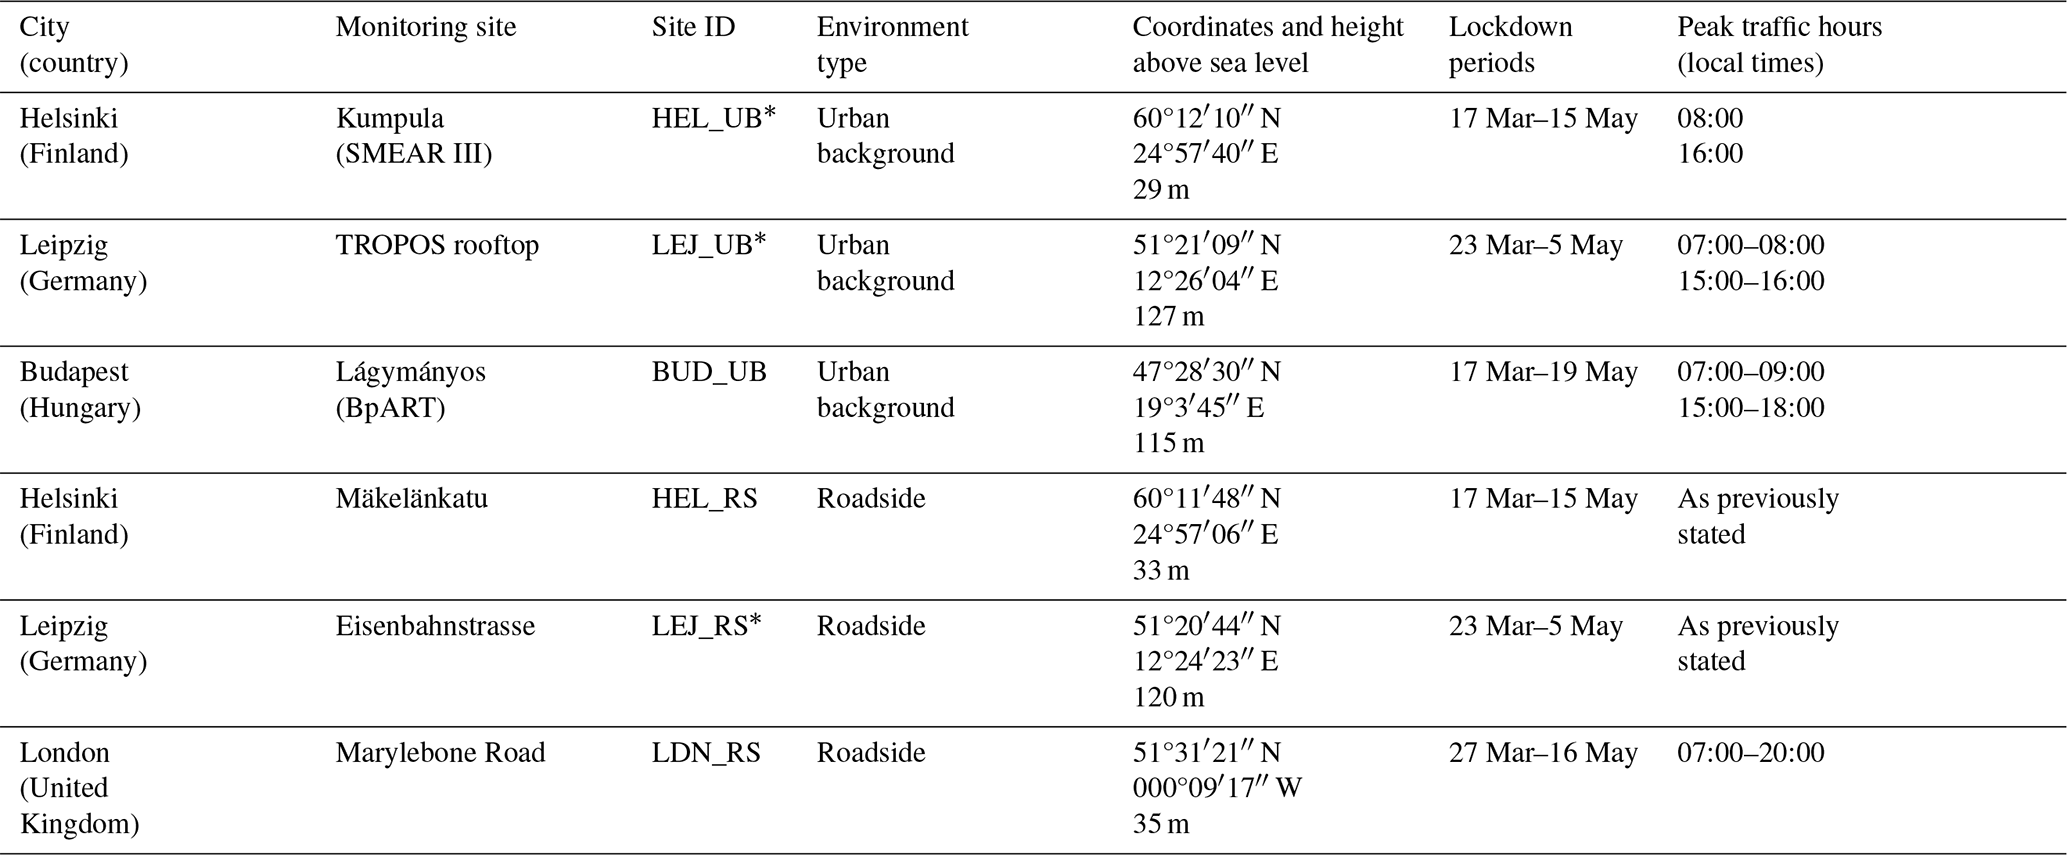
Peak traffic hours were obtained from the TomTom Traffic Index (https://www.tomtom.com/traffic-index/, last access: 11 November 2022).
2.1.1 Helsinki, Finland
Helsinki is located in southern Finland, at the shore of the Gulf of Finland in the Baltic Sea. The capital is Finland's largest city, with 0.66 million inhabitants or 1.59 million inhabitants including its sub-regional units. Finland has 497 passenger cars per 1000 inhabitants, which is below the average motorisation rate in the European Union (EU). However, Helsinki's car density is ∼ 1035 cars km−2, which is comparable with densities observed in other cities across Europe.
Urban-background aerosol data were obtained from the SMEAR III research station (Jarvi et al., 2009), located on the Kumpula campus of the University of Helsinki. Measurements are taken at 4 m above ground level and at distances > 125 m from highly trafficked roads bordering the site. The busy roadways experience 44 000 vehicles per workday (Järvi et al., 2012). The station's immediate surroundings also include multi-storey buildings, access roads, allotted parking bays, and green space.
Roadside aerosol data were obtained from a supersite monitoring station along one of Helsinki's main thoroughfares known as Mäkelänkatu. The street is ∼ 42 m in width and is flanked by three- and four-storey buildings, yielding an aspect ratio of 0.40 (often referred to as an avenue canyon) (Rönkkö et al., 2017) and experiences 28 000 vehicles per day (Helin et al., 2018; Kuula et al., 2020). The station's immediate surroundings also include six lanes of traffic (three in each direction of travel), a central tramline bordered by tall vegetation, two footpaths, and on-street parking.
2.1.2 Leipzig, Germany
Leipzig is located in the German state of Saxony in eastern Germany. Leipzig is the eighth most populated city in Germany, with 0.6 million inhabitants. Germany has 574 passenger cars per 1000 inhabitants, which is comparable with the average motorisation rate in the EU. Leipzig's vehicle density is ∼ 913 vehicles km−2, which is comparable with densities observed in other cities across Europe.
Urban-background aerosol data were obtained from an atmospheric research station operated by the Leibniz Institute for Tropospheric Research (TROPOS) within the Leipzig Science Park. Measurements are taken on the roof of an institute building at 16 m above ground level and at distances > 100 m from highly trafficked roads bordering the site (Klose et al., 2009; Birmili et al., 2016). The Leipzig Science Park contains other research institutes and related companies, green space, and allotted parking bays, including a multi-storey car park. Its perimeter includes transport infrastructure (road, rail, and tramways), commercial property (restaurants, hotels, a petrol station, etc.), residential property, on-street parking, and green space.
Roadside aerosol data were obtained from a permanent observation site located along an important connecting road in the east of the city known as Eisenbahnstrasse. Measurements are taken from an apartment window at 6 m above ground level on the northern side of the street. The street is ∼ 20 m in width and is flanked by multi-storey period buildings, yielding an aspect ratio of 0.90, and is used by 12 000 vehicles per working day (Birmili et al., 2016). The station's immediate surroundings also include two lanes of traffic (one in each direction of travel), an integrated tramline, on-street parking, two bicycle lanes (one in each direction of travel), two footpaths, and scant vegetation.
2.1.3 Budapest, Hungary
Budapest is located in the Carpathian Basin in central Hungary. It is the capital and the largest city of the country, with 1.72 million inhabitants. Hungary has 395 passenger cars per 1000 inhabitants, which is one of the lowest motorisation rates in the EU. However, Budapest's car density is ∼ 1315 cars km−2, which is comparable with densities commonly observed in other European cities.
Urban-background aerosol data were obtained from the Budapest platform for Aerosol Research and Training (BpART) laboratory, located on the second-floor balcony of the northern block of the Lágymányos Campus of Eötvös Loránd University. The balcony is 11 m above the street level of the closest road and is situated 85 m from the right bank of the Danube River (Salma et al., 2016). Sampling inlets and sensors are set up at heights of between 80 and 150 cm above the rooftop level of the measurement container.
2.1.4 London, United Kingdom
London is located in southeastern England (United Kingdom, UK). The capital is the UK's largest city, with 9 million people occupying Greater London. The UK has 589 passenger cars per 1000 inhabitants, which is comparable with the average motorisation rate in the EU. However, Greater London's car density is ∼ 1938 cars km−2, which is well above average densities commonly observed in other cities across Europe.
Roadside aerosol data were obtained from a supersite monitoring station, located along Marylebone Road opposite one of London's top attractions, Madame Tussauds. Measurements are taken on the roof of a cabin positioned kerbside at 4 m above ground level (Harrison et al., 2019). The street is ∼ 34 m in width and is flanked by multi-storey buildings, yielding an aspect ratio of 1.00 (often referred to as a regular street canyon), and is used by 80 000 vehicles per day (Harrison et al., 2019). The monitoring station's surroundings also include six lanes of traffic (three in each direction of travel), two footpaths, and scant vegetation. Analyses of air quality data from this site have been reported by Kamara and Harrison (2021).
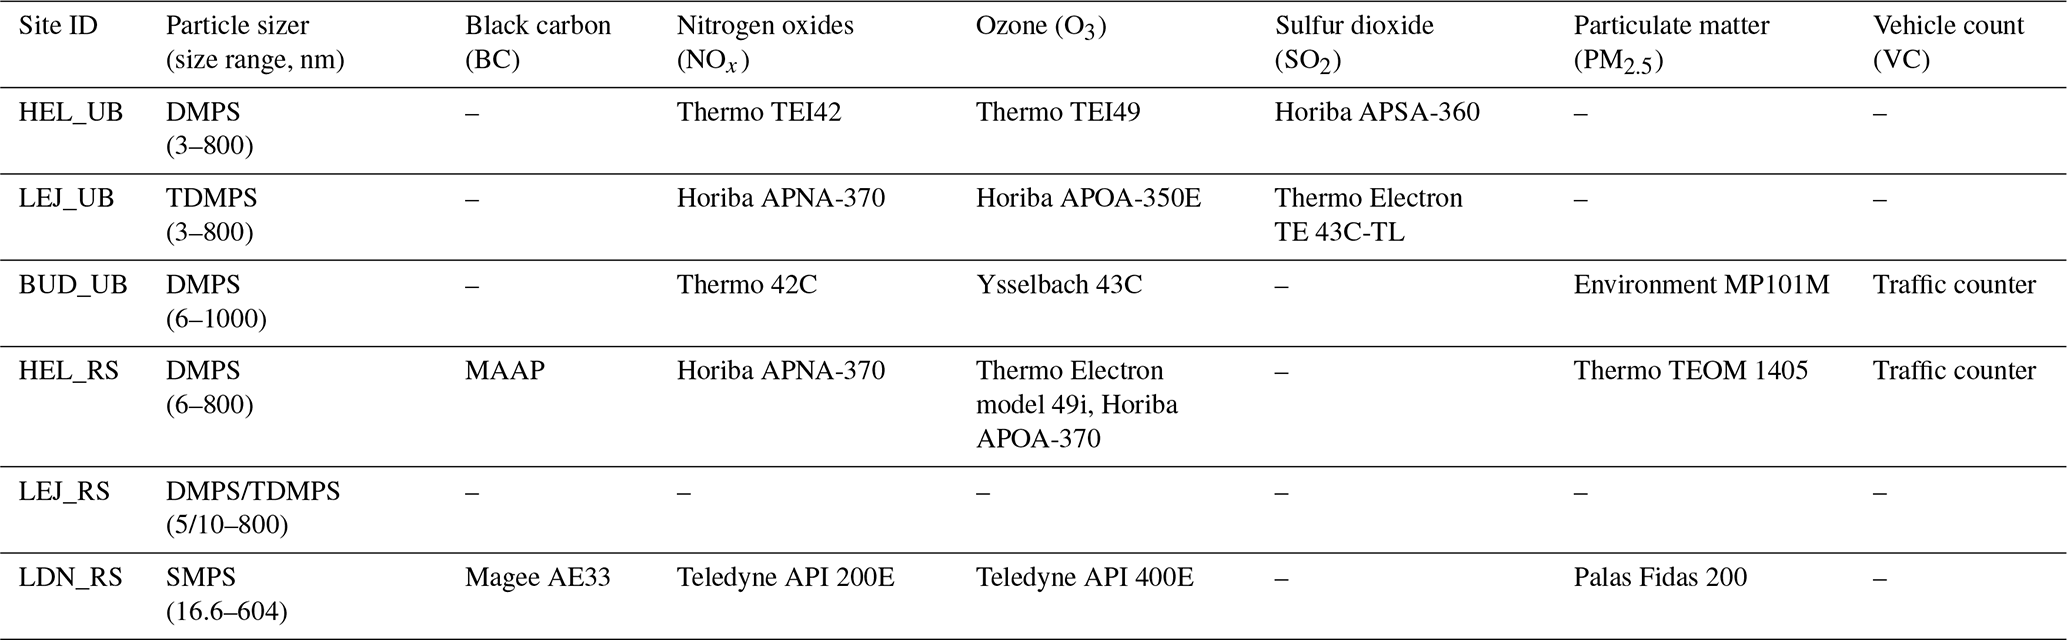
2.2 Instrumentation and data coverage
Instrumentation used to sample aerosol size distributions, as well as gaseous pollutants, particle mass concentrations, black carbon concentrations, and vehicle counts (referred to as auxiliary data) at the different monitoring sites, is stated in Table 2; the sampling methodologies are outlined in Supplement Sect. S1.1; and the applicable data coverage is plotted in Fig. S1. The particle sizers covered different size ranges; therefore a reduced common range (10–600 nm) was selected (although the whole range was utilised in the model; see Supplement Sect. S1.2). The years of study varied depending on the availability of the data, but each dataset covered the associated spring 2020 lockdown period, as well as an equivalent time period between 2014 and 2019, for comparison purposes.
Table 2Sampling equipment used at each monitoring site. DMPS: differential mobility particle sizer. TDMPS: twin differential mobility particle sizer. SMPS: scanning mobility particle sizer. MAAP: multi-angle absorption photometer.
2.3 Positive matrix factorisation
The application of PMF is similar to the previous work of Rivas et al. (2020) and implemented using PMF2 (Positive Matrix Factorization, 25 September 2012, vers. 4.2; copyright 1993, 2004 Pentti Paatero, Helsinki, Finland). PMF is a well-established receptor model (Paatero and Tapper, 1994) used to solve functional mixing models when the source profiles are unknown and presumed to be constant. PMF solutions are constrained to be non-negative, and a least-squares algorithm is applied which accounts for uncertainties in the dataset. PMF is therefore quantitative and identifies a user-specified number of sources depending on how well the outputs describe the monitoring site. These make it suitable for the source apportionment of size distribution data. Details of the PMF methodology can be found in Supplement Sect. S1.2.
2.4 Condensation sink
The condensation sink (CS) represents the rate at which a vapour phase molecule will collide with the pre-existing particle surface and was calculated from the size distribution data as follows:
where D (m2 s−1) is the diffusion coefficient of the diffusing vapour (assumed sulfuric acid), βm is a transition regime correction, dp (m) is particle diameter, and (m−3) is the number of particles at diameter dp.
2.5 Statistical analysis
An independent samples t test was performed to compare the means of the resolved factors from the PMF model (from the source apportionment of size distribution data; Sect. 2.3) for the respective lockdown periods at each site to the equivalent periods in the reference years (depending on data availability). The purpose of this test was to determine if the resolved factors were different between the associated periods at each location. The significance level was set at 0.05 (i.e. a p value < 0.05 was deemed statistically significant).
3.1 Identification of major factors
Data covering the spring 2020 lockdown period for each monitoring site were individually analysed using PMF. Multiple outputs were compared, and a solution was selected based on the cogency and spatiotemporal behaviour of each factor. A number of common factors were resolved between the sites including nucleation, road traffic semi-volatile fraction (road trafficsvf), road traffic solid fraction (road trafficsf), diffuse urban (wood smoke + aged traffic), ozone-associated secondary aerosol (O3-associated SA), and secondary inorganic aerosol (SIA). We do not expect a substantial contribution from dust and sea salt in the particle number size distribution at diameters < 600 nm. Despite their commonalities, factors exhibited varying profiles at each site. Their particle number (Fig. 2a) and mass (Fig. 2b) size distributions, mean daily (Fig. 3a, diurnals during and outside of lockdowns in Fig. S5) and weekly (Fig. 3b) cycles, relative associations with available auxiliary data (Fig. 4), and polar plots showing wind directions and speeds coincidental with the top 25th percentile of factor intensity (Fig. S6) were tabled and/or plotted for analysis. The factors are broadly summarised below, and site-by-site descriptions can be found in Supplement Sect. S2.1.
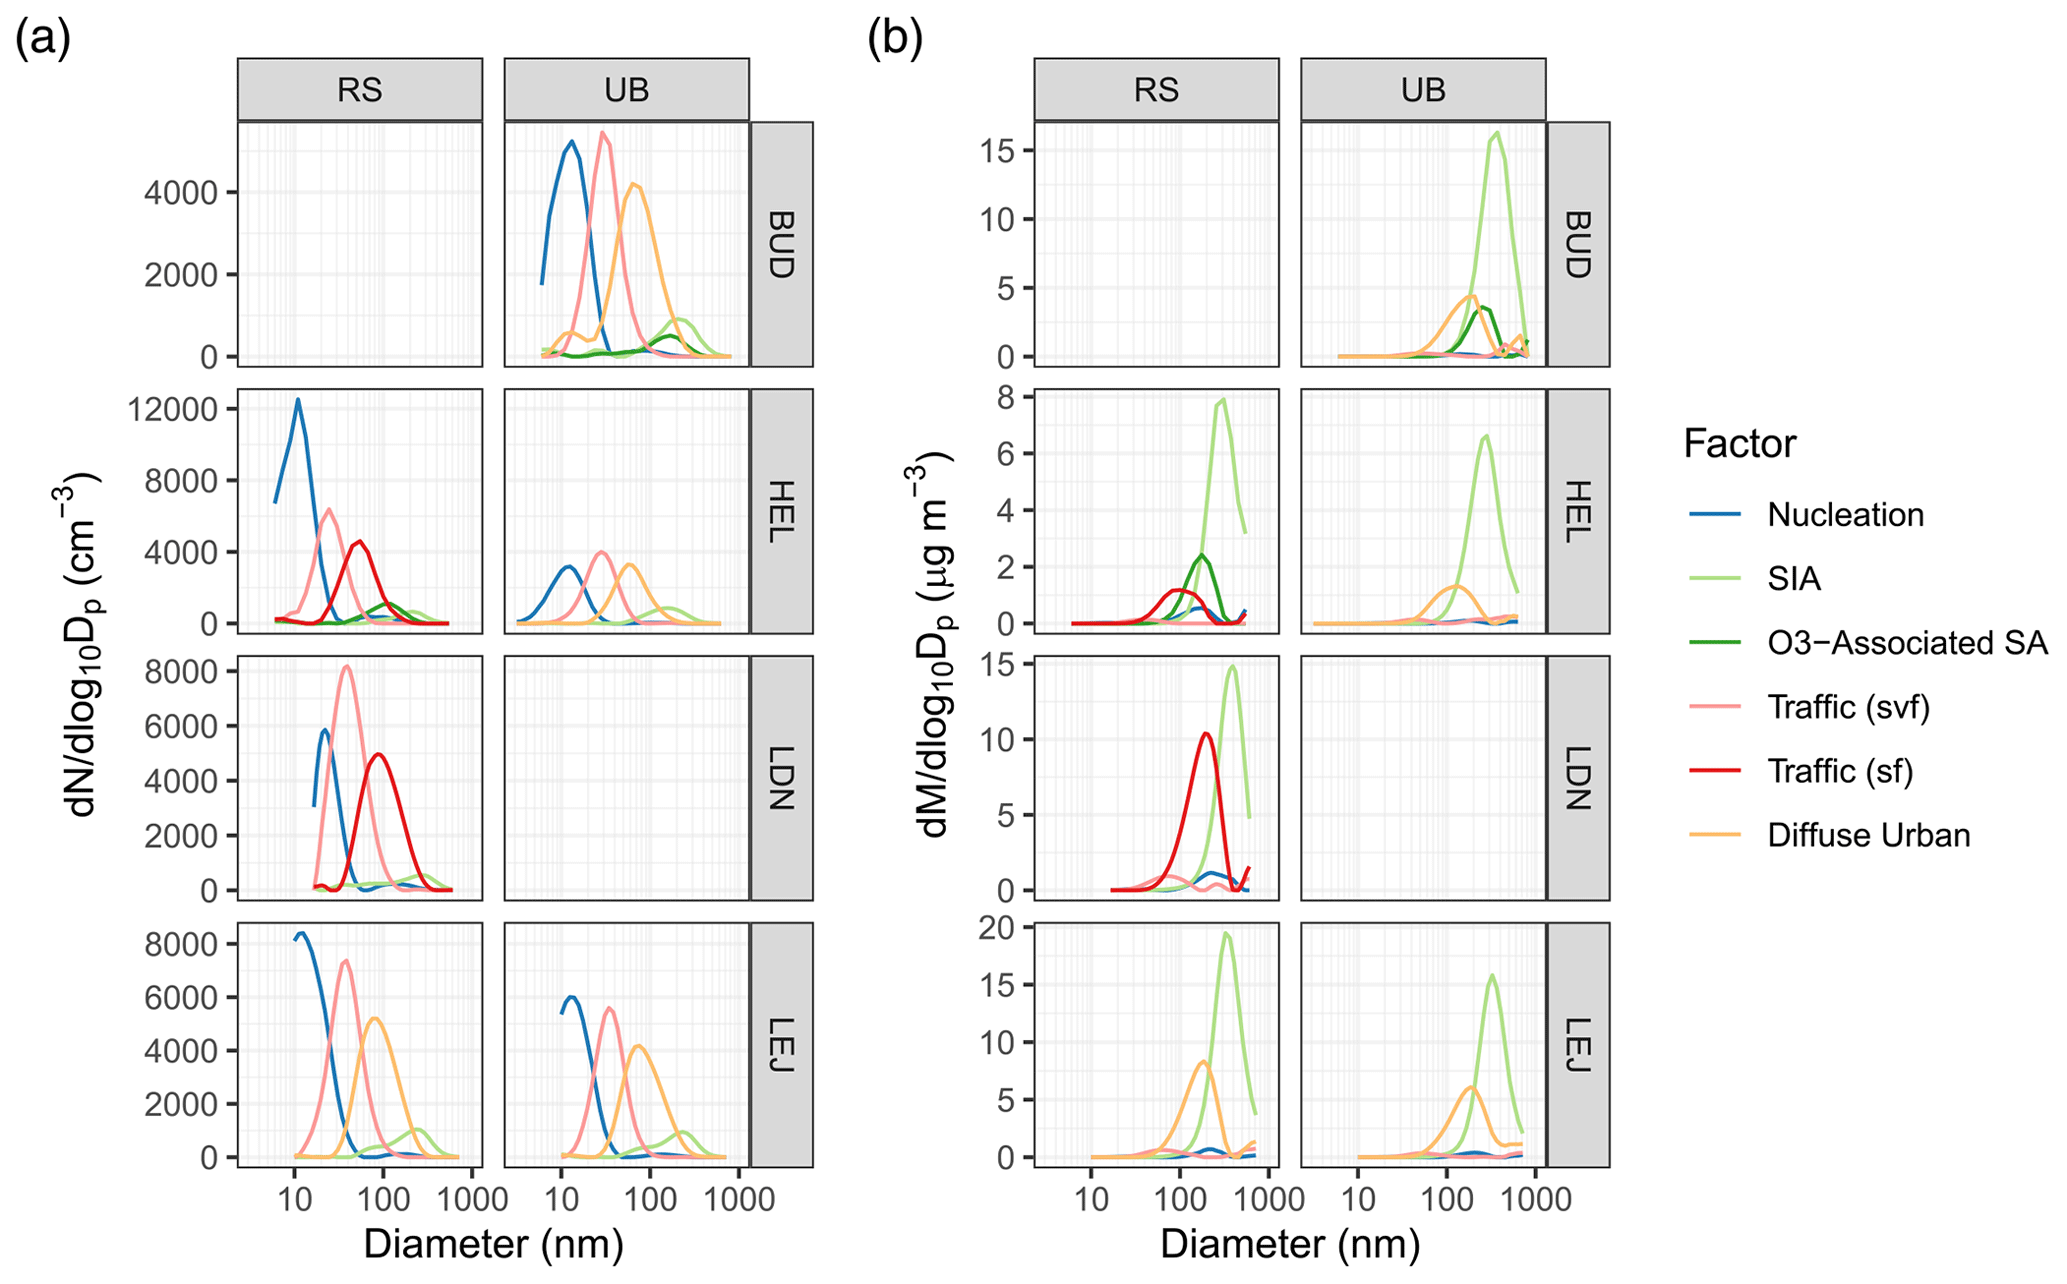
Figure 2(a) Number and (b) mass size distribution data for each factor at each monitoring site. Each panel represents a factor, and each colour represents a site.
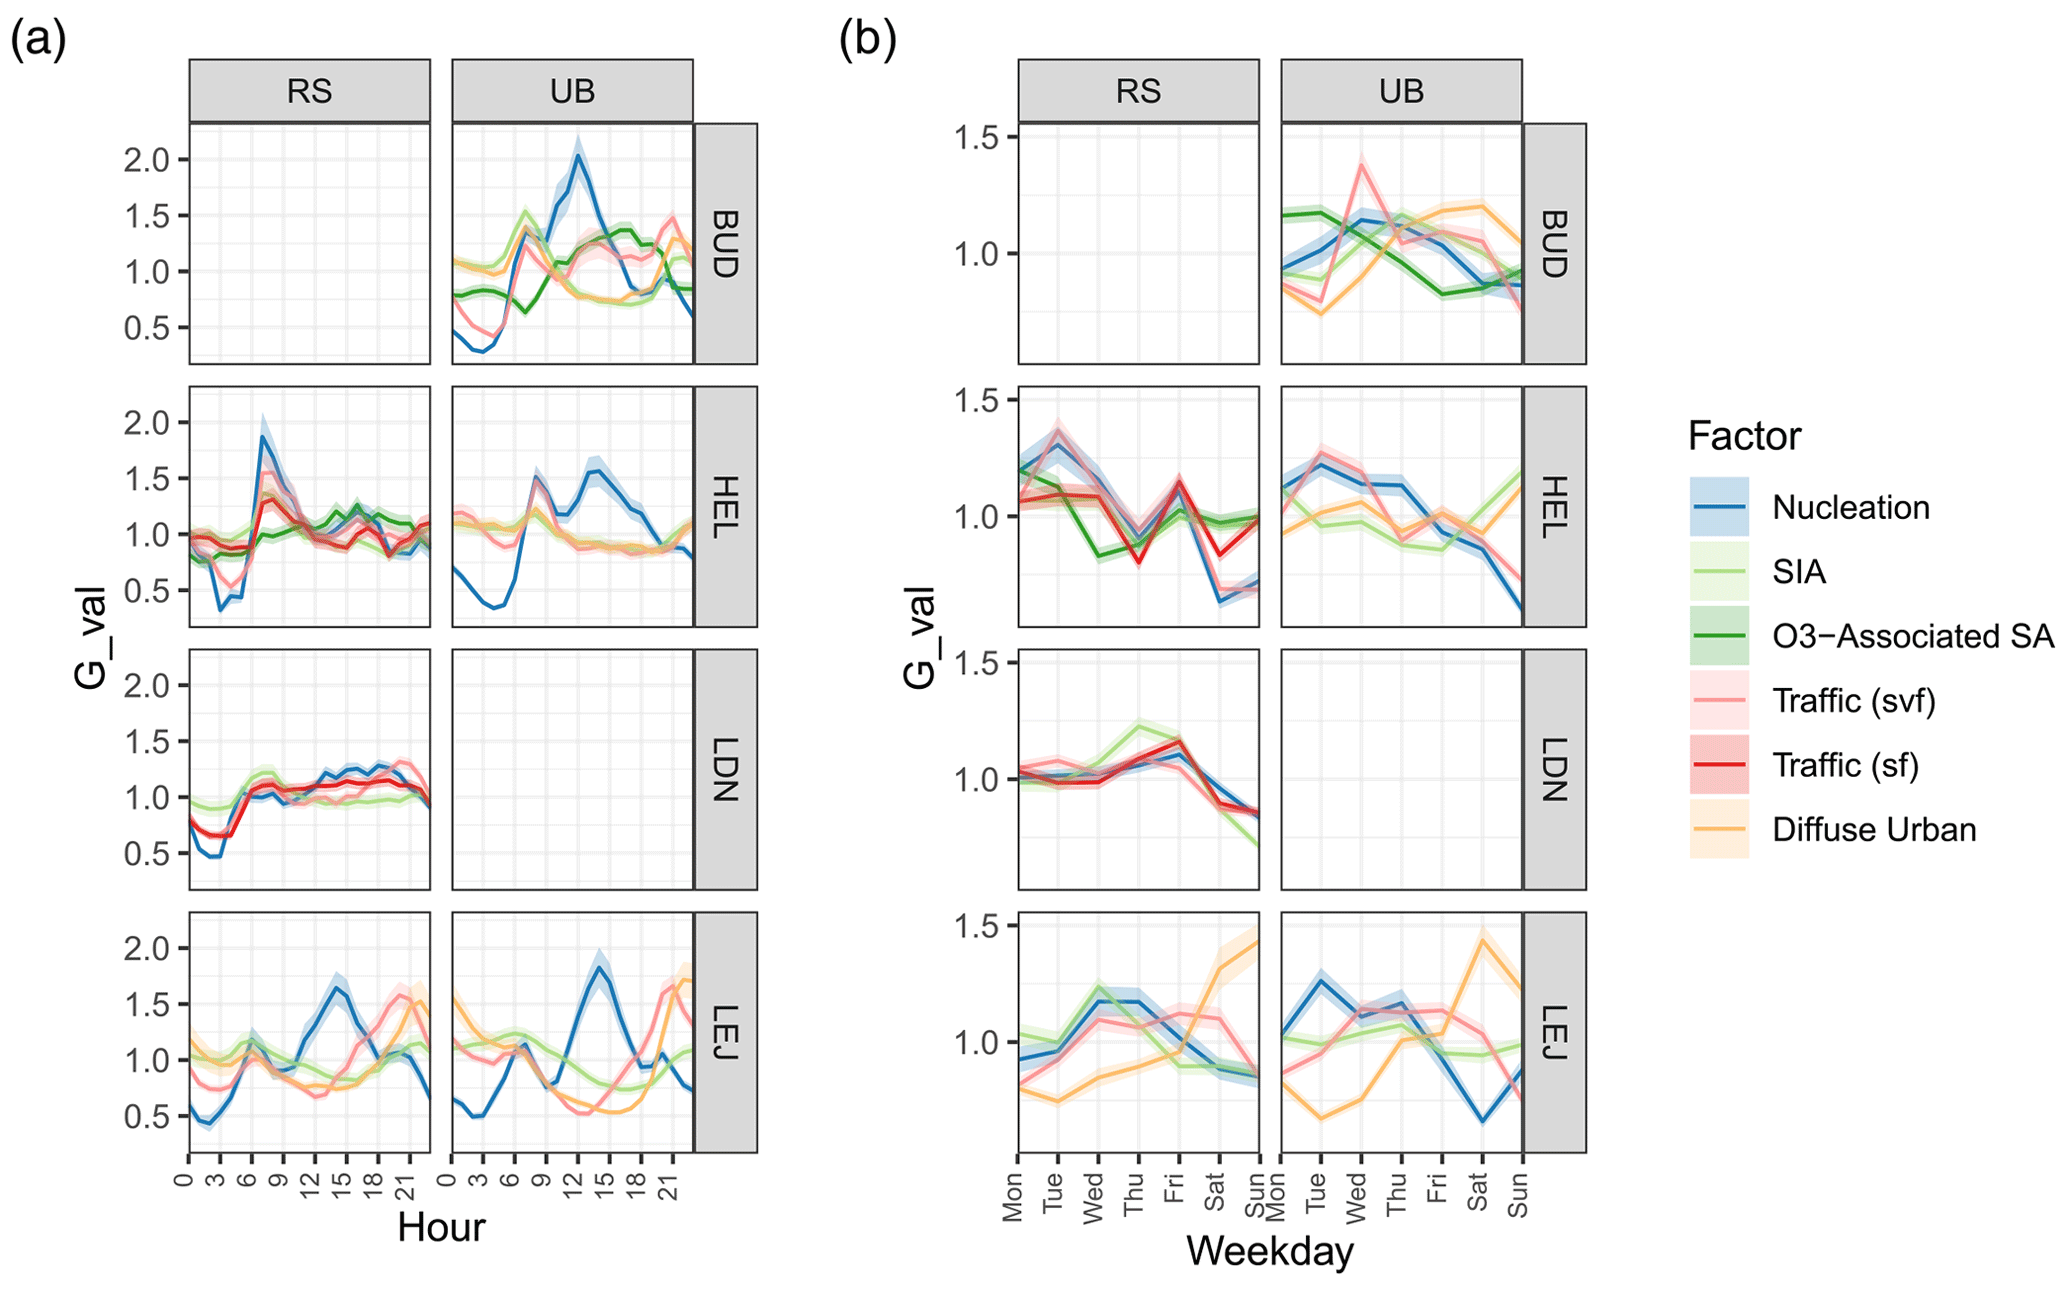
Figure 3Time series of factors from the PMF model, showing (a) daily and (b) weekly cycles. Each panel represents a factor, and each colour represents a monitoring site. The shaded region represents the standard error of the mean. The G value is the time-series component of the PMF solution (see Supplement).
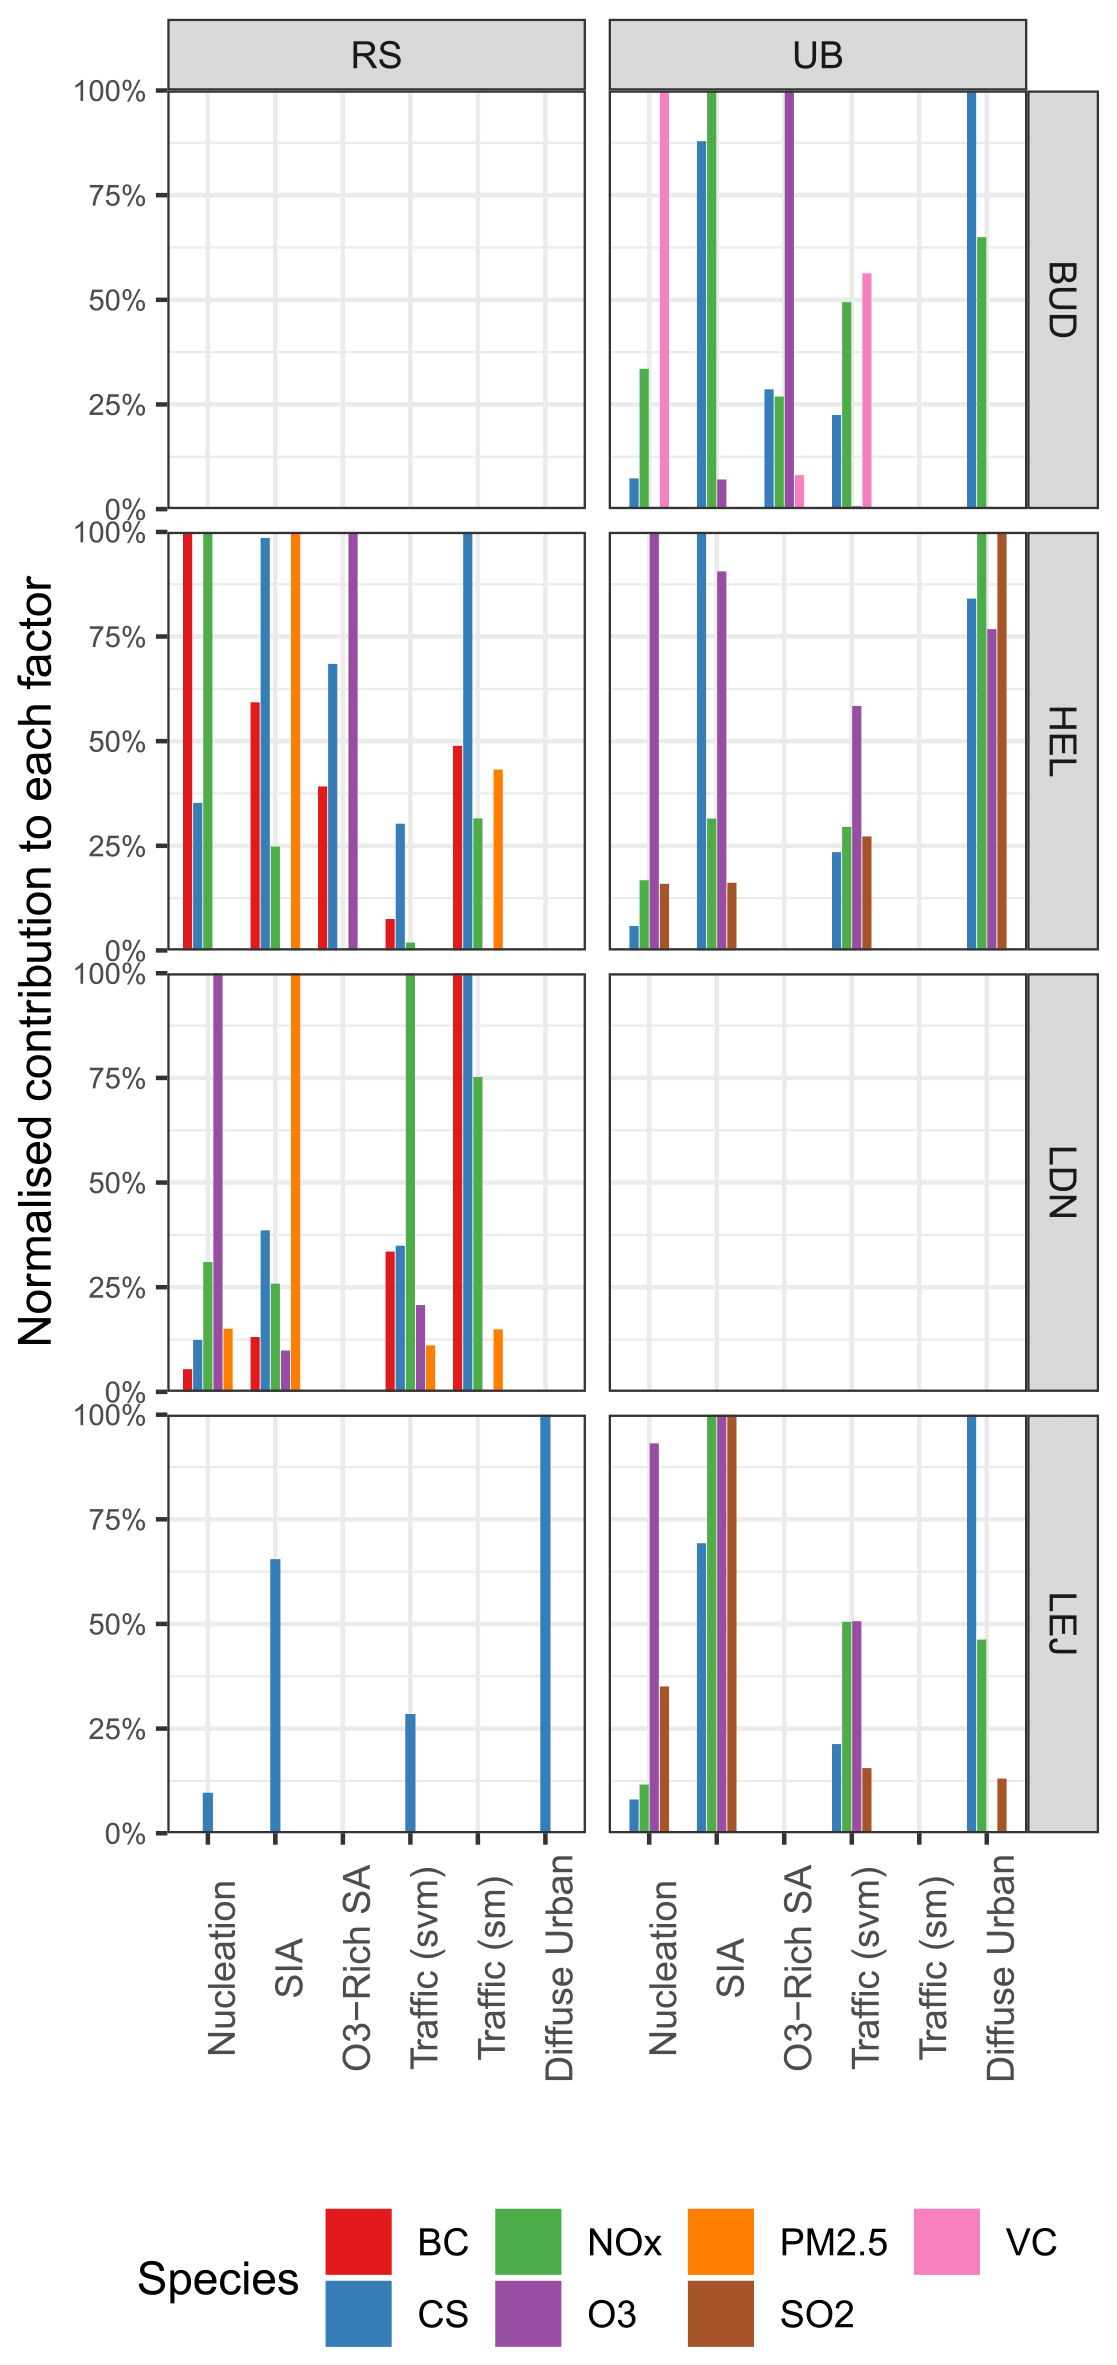
Figure 4Normalised contribution of downweighted auxiliary variables to each factor for each monitoring site. The mean G values for each variable for each site are normalised to a maximum of 1 and expressed as a percentage. The normalisation is performed so each variable has a maximum value of 1 for easy comparison. The G value is the time-series component of the PMF solution (see Supplement).
3.1.1 Nucleation
Factors attributed to nucleation were resolved at all sites. The factors had a major mode in the size distribution, which peaked at ∼ 11–22 nm (Fig. 2a), and a mass distribution dominated by particles in the accumulation mode (Fig. 2b). Factor contributions typically peaked in the afternoon and with busy traffic periods (Fig. 3a) and were higher on weekdays compared to weekends (Fig. 3b). The factors were associated to varying degrees with BC, NOx, SO2, O3, and PM2.5 (Fig. 4). Additionally, the factors were consistently associated with a low CS value (Fig. 4), which is a key determinant for NPF in urban environments (Deng et al., 2021). CS is the largest sink for vapours such as sulfuric acid, as well as other low-volatility molecules, and occurs synchronously with high coagulation losses of small particles. We inferred that this factor is likely the sum of particles produced by means of photochemically induced nucleation processes, as well as some combustion-related processes, such as ultrafine vehicle emissions and the formation of new particles through the dilution and cooling of vehicle exhaust (Charron and Harrison, 2003; Pérez et al., 2010). The diurnal profiles at most sites suggest a predominantly non-traffic formation source. However, the nucleation factor at HEL_RS is mainly related to the traffic source, since the diurnal variation shows clear morning and afternoon rush hour peaks and the contribution of NOx and BC are very high.
3.1.2 Road traffic semi-volatile fraction (road trafficsvf)
Factors attributed to road trafficsvf were resolved at all sites. The factors had a major mode in the size distribution, which peaked at ∼ 25–40 nm (Fig. 2a), and a mass distribution dominated by Aitken and/or accumulation mode particles (Fig. 2b). Factor contributions typically peaked in the morning and afternoon/evening (Fig. 3a); were higher on weekdays compared to weekends (Fig. 3b); and were associated to varying degrees with combustion-related pollutants including BC, NOx, SO2, and PM2.5 (Fig. 4). In Europe, diesel vehicles are responsible for much of the exhaust PM from road traffic (Damayanti et al., 2023). Particles emitted in diesel exhaust fall into two main categories: semi-volatile and solid graphitic (black carbon) particles (Harrison et al., 2018; Kittelson et al., 2006). We inferred that these factors likely represent the former particle type, as well as a likely contribution from other mobile and/or stationary combustion-related activities (i.e. cooking and heating emissions). The factors closely resemble those referred to as “traffic 1” in the literature, typically in reference to spark-ignition vehicle emissions or freshly emitted traffic particles (Hopke et al., 2022) and may include petrol vehicle emissions.
3.1.3 Road traffic solid fraction (road trafficsf)
Factors attributed to road trafficsf were resolved at HEL_RS and LDN_RS. The factors had a major mode in the size distribution, which peaked at ∼ 55–90 nm (Fig. 2a), and a mass distribution dominated by particles in the Aitken and/or accumulation mode (Fig. 2b). Factor contributions typically peaked in the morning and afternoon/evening (Fig. 3a); were higher on weekdays compared to weekends (Fig. 3b); and were associated to varying degrees with combustion-related pollutants including BC, NOx, SO2, and PM2.5 (Fig. 4). We inferred that these factors predominantly represent the solid particle mode arising from diesel road traffic (Harrison et al., 2018; Kittelson et al., 2006). The factors closely resemble those referred to as “traffic 2” in the literature, typically in reference to diesel vehicle emissions or distant traffic particles (Hopke et al., 2022).
3.1.4 Diffuse urban
Factors attributed to diffuse urban were mainly resolved at urban-background sites. The factors had a major mode in the size distribution, which peaked at ∼ 75–90 nm (Fig. 2a), and a mass distribution dominated by accumulation mode particles (Fig. 2b). Factor contributions typically peaked in the morning and evening (Fig. 3a), were higher on weekends compared to weekdays (Fig. 3b), and were associated to varying degrees with combustion-related pollutants including NOx and SO2 (Fig. 4). The factors closely resemble those referred to as “urban background” by Beddows et al. (2015) and later “diffuse urban” by Beddows and Harrison (2019), representing aged wood smoke and road traffic emissions. A contribution of aged natural aerosol may also be present in this factor. Urban background has other connotations, and therefore we opted to use diffuse urban as a factor name as it better categorised the emission source, with less confusion with the literature.
3.1.5 Ozone-associated secondary aerosol (O3-associated SA)
Factors attributed to O3-associated SA were resolved at BUD_UB and HEL_RS. The factors had a major mode in the size distribution, which peaked at ∼ 125–175 nm (Fig. 2a), and a mass distribution dominated by particles in the accumulation mode (Fig. 2b). Factor contributions peaked in the daytime (Fig. 3a), were higher on weekdays compared to weekends (Fig. 3b), and were strongly associated with O3 (Fig. 4). The exact nature of these factors are uncertain; however, they are consistent with other such observations (often referred to as O3-rich SA) in the available literature (Ogulei et al., 2007; Liu et al., 2014; Squizzato et al., 2019) and likely represent particles which have grown through the condensation of secondary material (Hopke et al., 2022). In an urban environment it is reasonable to presume that most SA precursors are anthropogenic, but an influence of natural SA precursors will also contribute some fraction of total SA.
3.1.6 Secondary inorganic aerosol (SIA)
Factors attributed to SIA were resolved at all sites. The factors had a major mode in the size distribution, which peaked at ∼ 175–265 nm (Fig. 2a), and a mass distribution dominated by accumulation mode particles (Fig. 2b). Factor contributions typically peaked in the morning and evening/night (Fig. 3a), were higher on weekdays compared to weekends (Fig. 3b), and were associated with a host of auxiliary variables (Fig. 4). Multimodal number size distributions have also been observed at other locations and suggest the presence of both local and distant particles thought to have been formed through the atmospheric processing of NOx and other gaseous precursor emissions (Ogulei et al., 2007; Kasumba et al., 2009).
3.2 Changes in factor contributions under lockdown restrictions
To evaluate the effects of lockdown restrictions on PNCs, the applicable 2020 lockdown periods at each monitoring site were compared to the equivalent days of the year in the reference years 2014–2019, depending on data coverage. In examining temporal changes affecting pollutant concentrations, it is now common practice to remove the influences of changes in weather variables which affect primary pollutants concentrations (Vu et al., 2019; Shi et al., 2021) primarily by accounting for dilution effects. Such a treatment was not applied in this study as weather variables affect both photochemical nucleation, with elevated temperatures accelerating the evaporation rate of clusters, and intense solar radiation, accelerating the generation of NPF precursors (Lee et al., 2019; Bousiotis et al., 2021), and the semi-volatile fraction of both traffic and secondary aerosols through evaporation (Charron et al., 2003). Similarly, emissions of organic aerosol precursors are temperature-dependent (Lee et al., 2019). The dynamics of the number size distribution are therefore more complex than can be accounted for by de-weathering methods, and such results could not be interpreted with confidence. Rather, the trends in meteorological variables are presented in Fig. S8 and commented upon in the text, where considered relevant.
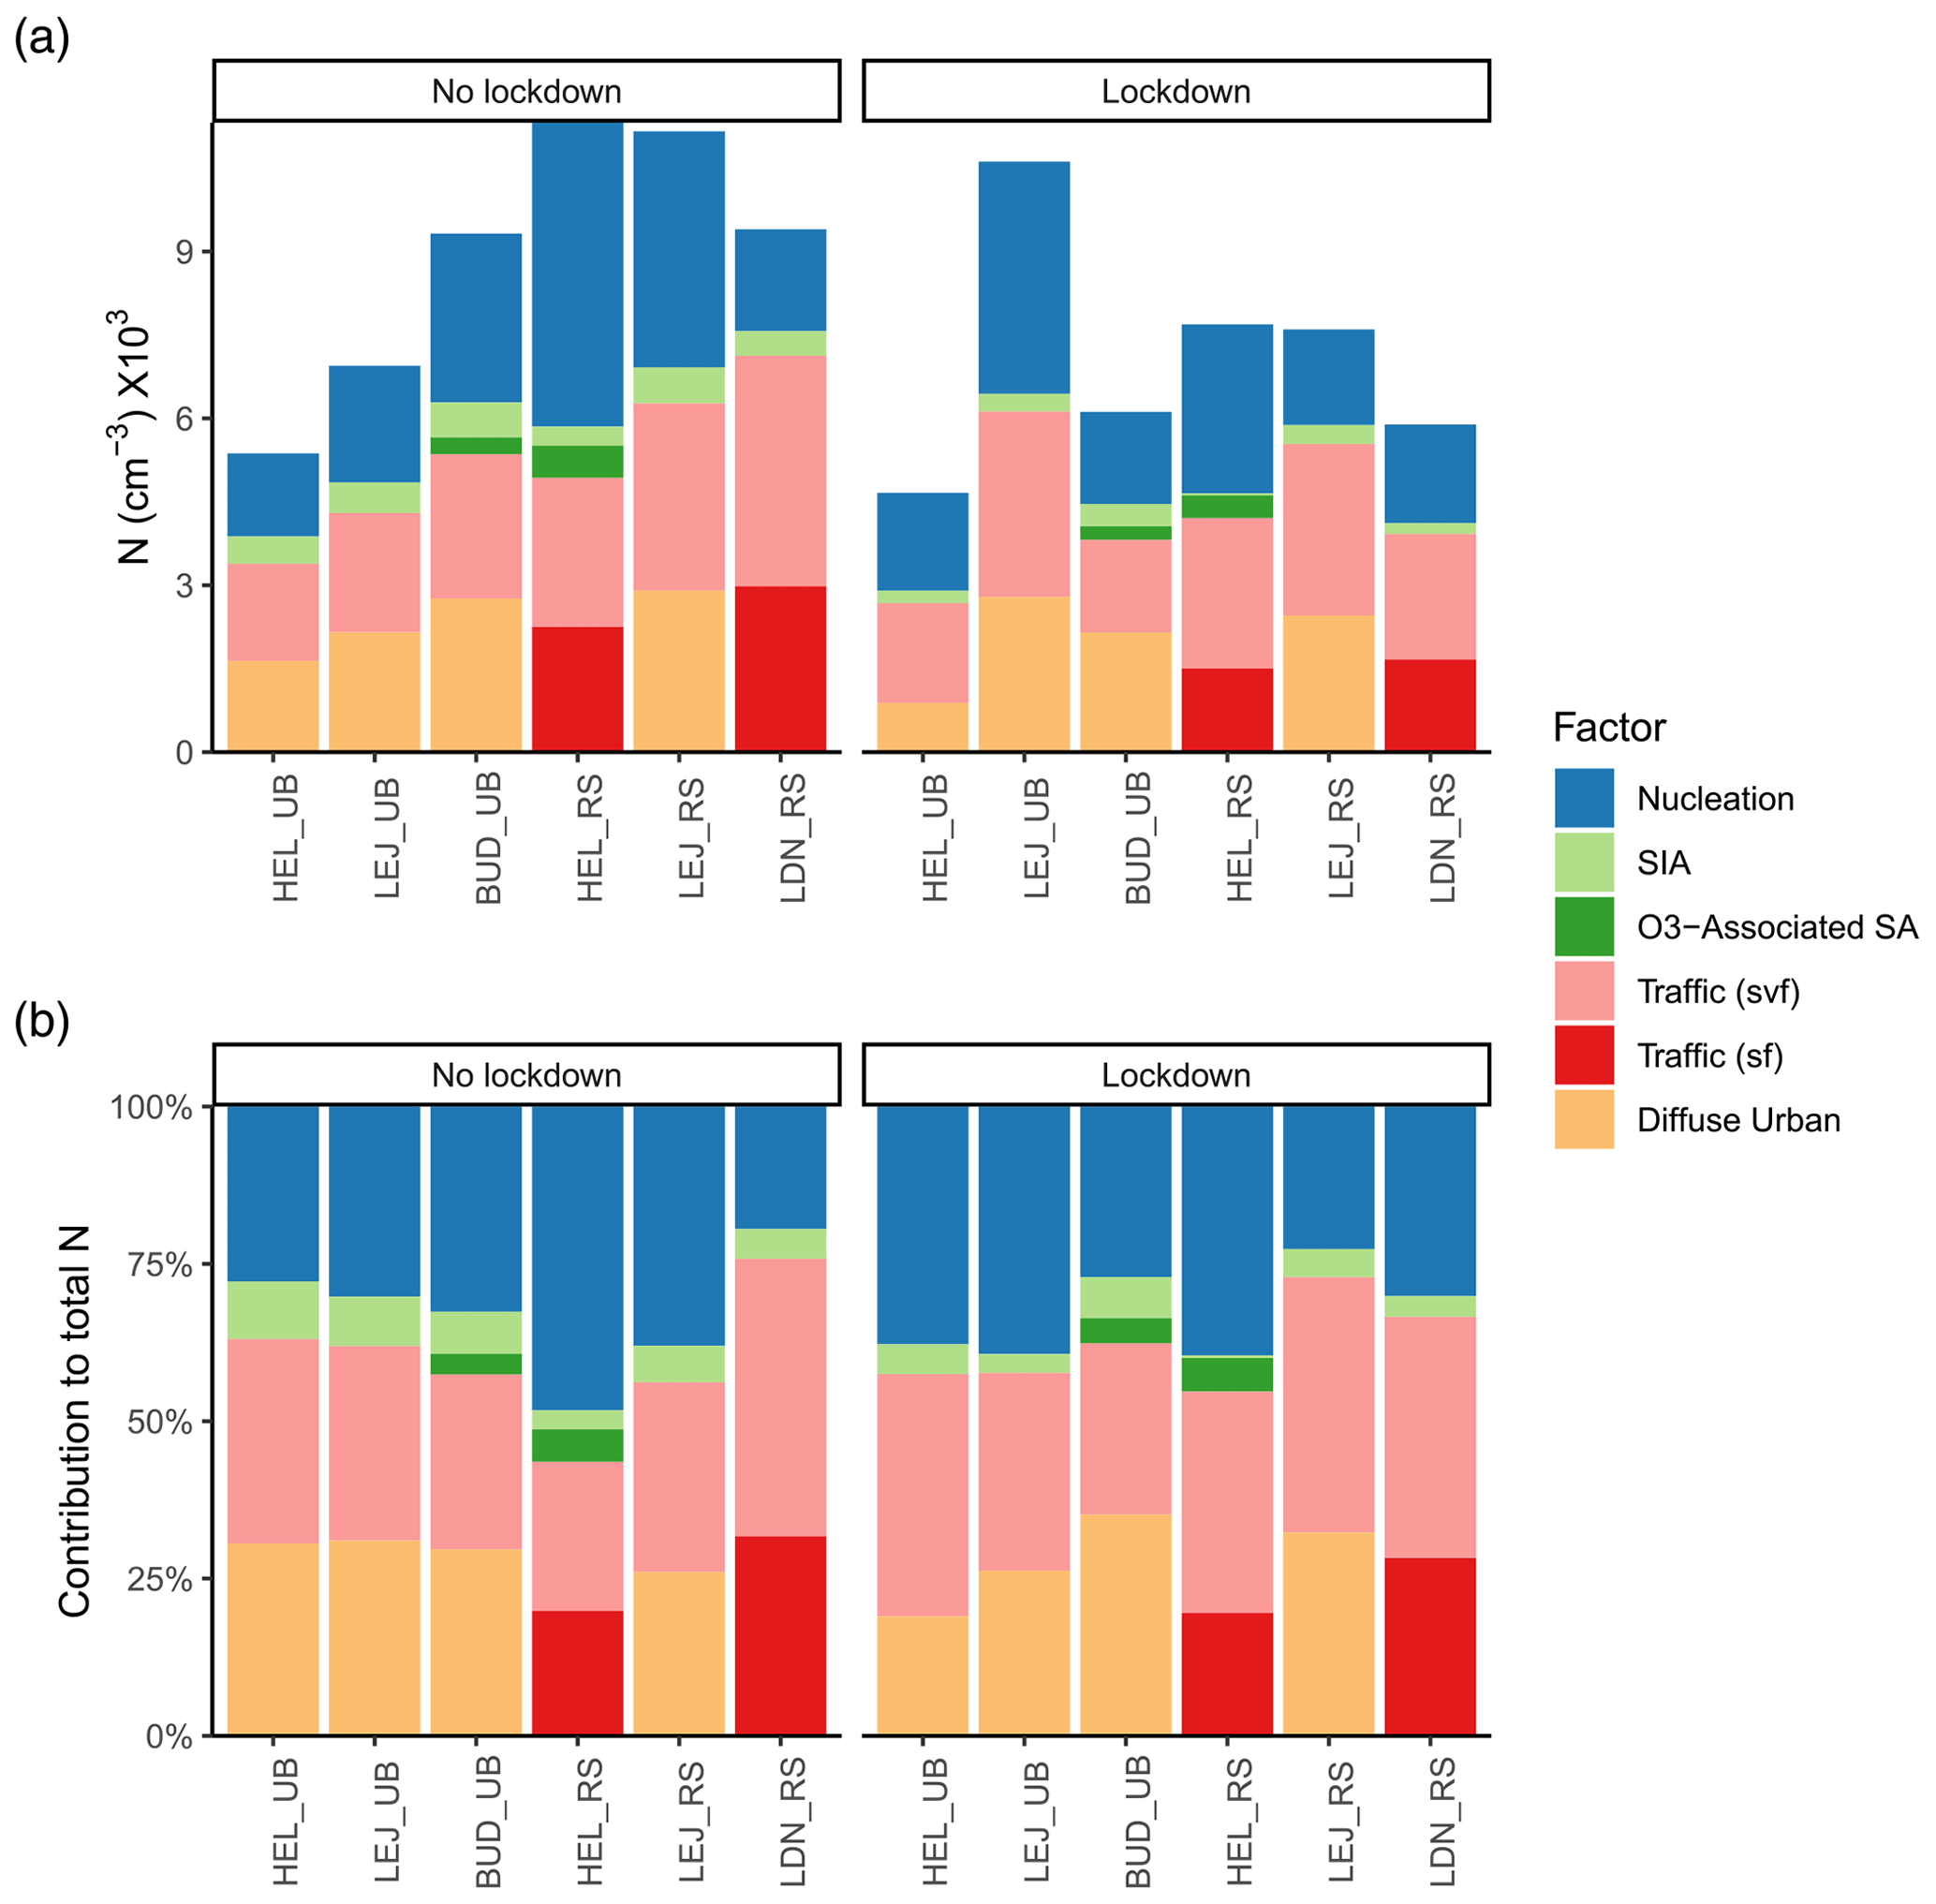
Figure 5(a) Mean total particle number concentrations (PNCs) and (b) mean contributions to total PNCs for the 2020 lockdown period for each factor at each monitoring site and the equivalent periods in the reference years 2014–2019, depending on data availability. Also see Tables 3 and 4.
Table 3Mean and min/max particle number concentrations (cm−3) during lockdown compared to the equivalent periods in the reference years 2014–2019 (depending on data availability) for urban-background sites. An asterisk (*) in the Lockdown column denotes if a factor is significantly different (p value is less than 0.05) between the reference years and lockdown period by way of an independent samples t test.
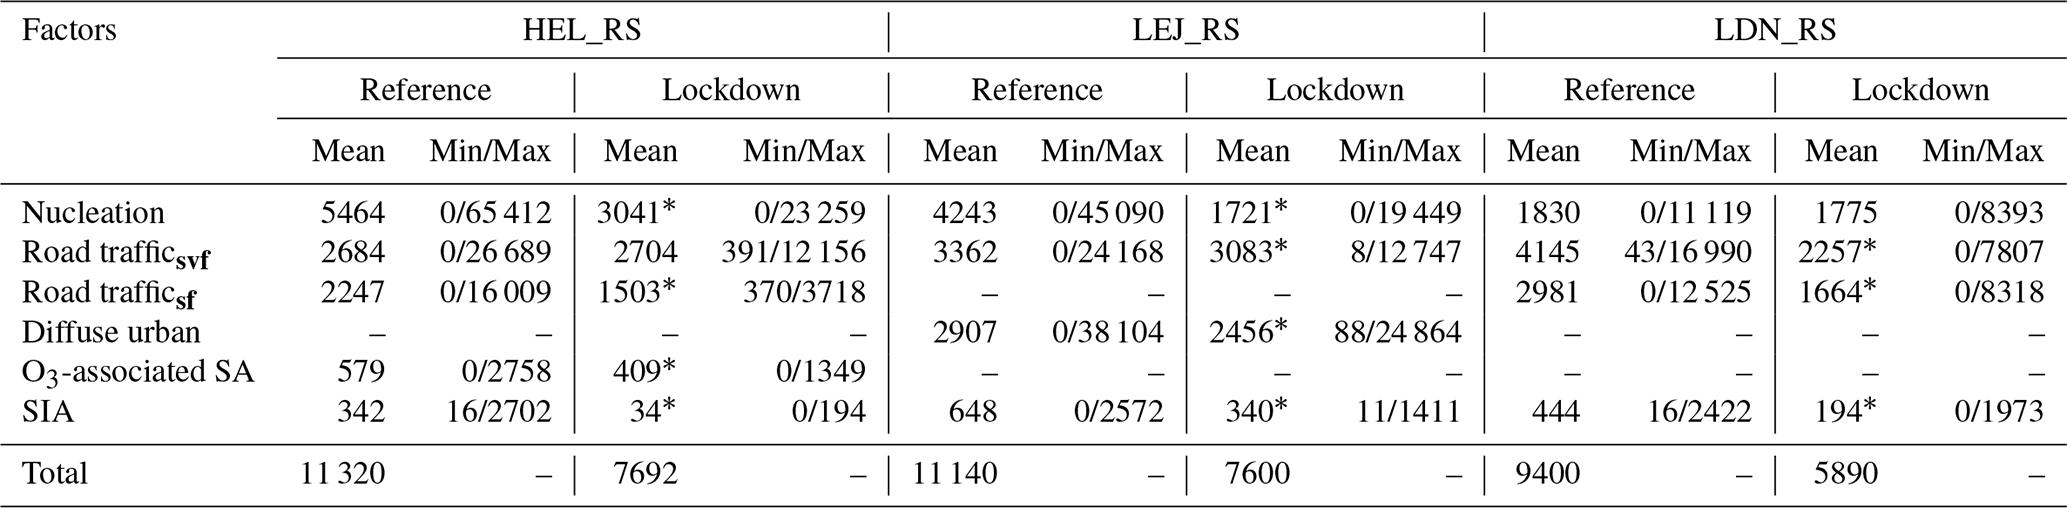
Table 4Mean and min/max particle number concentrations (cm−3) during lockdown compared to the equivalent periods in the reference years 2014–2019 (depending on data availability) for roadside sites. An asterisk (*) in the Lockdown column denotes if a factor is significantly different (p value is less than 0.05) between the reference years and lockdown period by way of an independent samples t test.
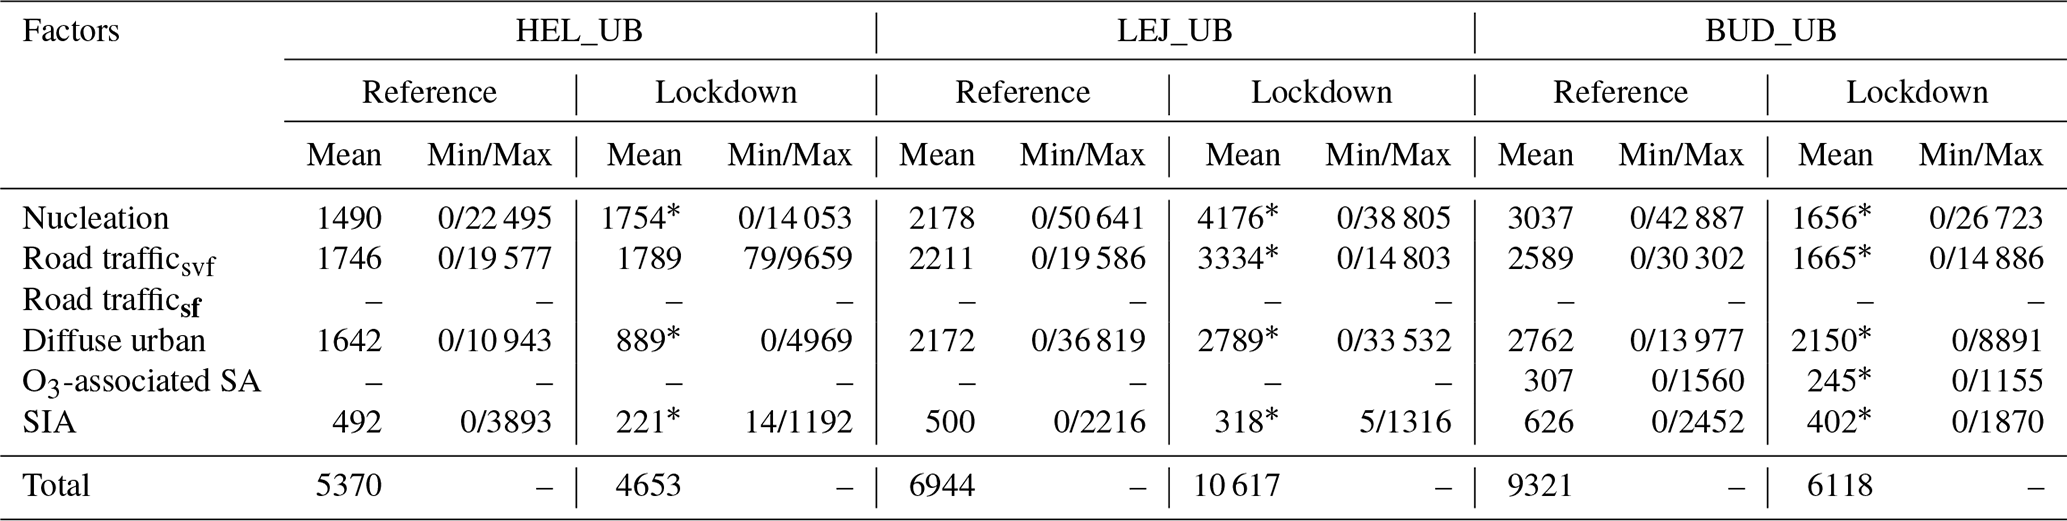
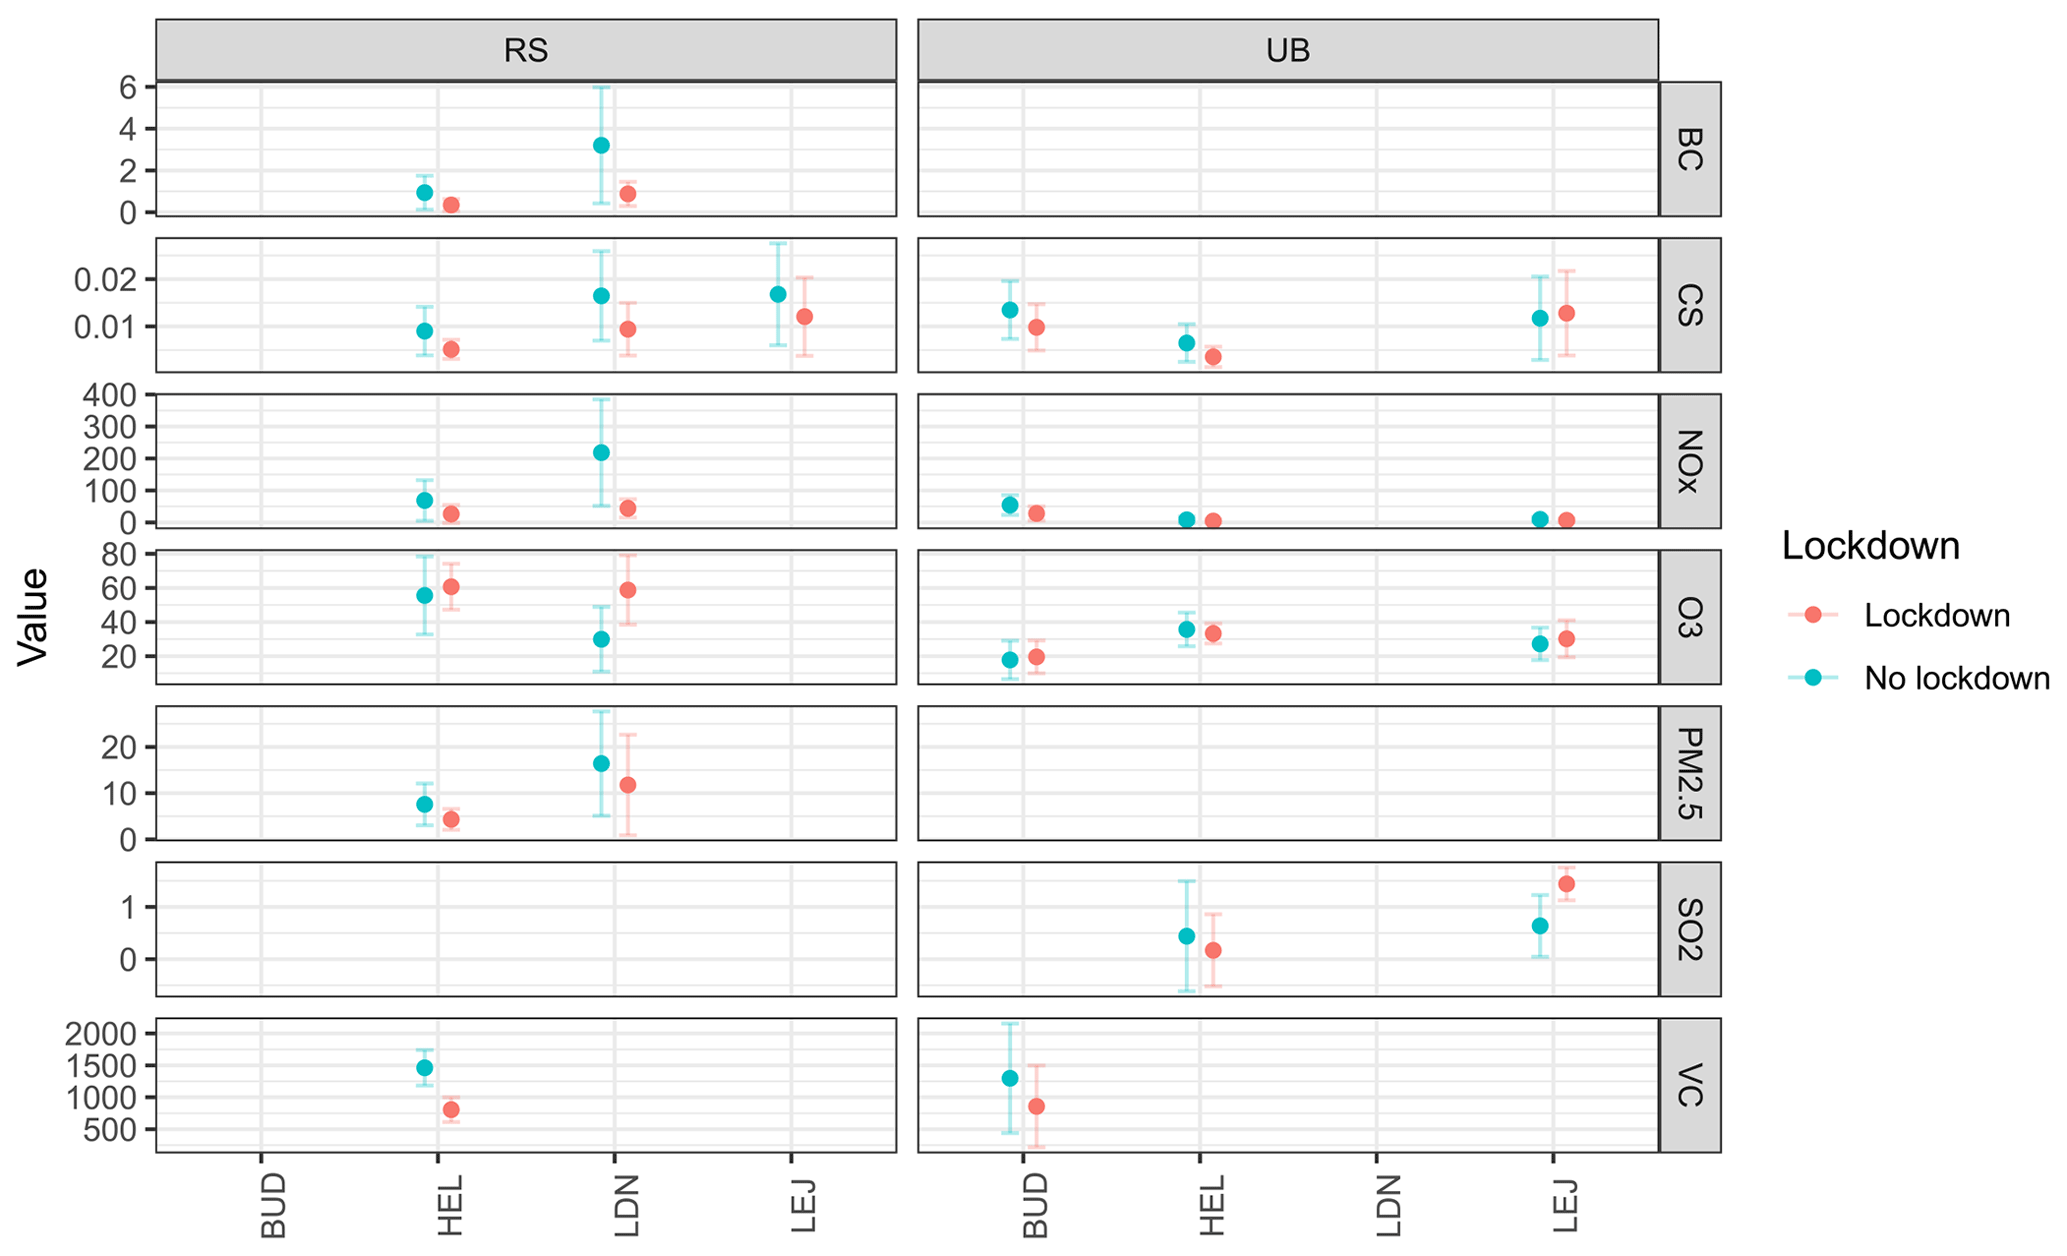
Figure 6Means of auxiliary variables during lockdown compared to the equivalent periods in the reference years 2014–2019 (depending on data availability) for each monitoring site included in this study. Black carbon (BC) in micrograms per cubic metre (µg m−3); condensation sink (CS) in per second (s−1); nitrogen oxides (NOx), ozone (O3), and sulfur dioxide (SO2) in parts per billion (ppb); and vehicle count (VC) in per hour (h−1).
3.2.1 Comparison of total particle number concentrations during lockdowns to the reference years
During lockdown, total mean PNCs were lower at most urban-background (Fig. 5 and Table 3) and all roadside sites (Fig. 5 and Table 4) included in this study, in comparison to the reference years. Regression estimates also showed that measured PNCs were lower than predicted at the majority of monitoring sites (Fig. S7a), and the diurnal cycle of each source-related factor is similar for both the lockdown and reference years (Fig. S5).
Among urban-background sites, total mean PNCs were higher at LEJ_UB and lower at HEL_UB and BUD_UB during lockdown compared to the equivalent periods in the reference years (Fig. 5 and Table 3). Nucleation, road trafficsvf, and diffuse urban factors were primarily responsible for the changes in total mean PNCs at LEJ_UB.
Mean PNCs were lower at all of the roadside sites during lockdown compared to the equivalent periods in the reference years (Fig. 5 and Table 4). Changes to nucleation and road traffic factors were primarily responsible for the fall in total mean PNCs at roadside sites.
3.2.2 Comparison of road-traffic-related particle number concentrations during lockdowns to the reference years
Mean PNCs from factors attributed to road trafficsvf, during reference and lockdown periods, were amongst the largest of the resolved factors, at both roadside and urban-background sites (Fig. 5 and Tables 3, 4). The response of road trafficsvf to lockdown restrictions was varied. Mean PNCs from factors attributed to road trafficsf factors were also substantial, regardless of lockdown measures (Fig. 5 and Table 4). However, their decrease during lockdown restrictions was consistent across all sites.
Among urban-background sites, mean PNCs from road trafficsvf factors were higher at LEJ_UB, comparable at HEL_UB, and lower at BUD_UB during lockdown compared to the equivalent periods in the reference years, with a mean change of +3.7 % across the three sites (Fig. 5 and Table 3). Large reductions in traffic volumes were observed on major roads across Finland (Riuttanen et al., 2021) and the German state of Saxony (Jaekel and Muley, 2022). However, the associated emission reductions may have been offset by increased emissions from private households. Fuel oils are regularly used in urban households for a variety of domestic activities and predominantly generate Aitken and nucleation mode particles (Tiwari et al., 2014). Lockdown restrictions had immediate and varied impacts on energy use, with increased residential demand due to people being confined to their homes. This points to a systematic misattribution of this factor throughout the literature, where this traffic factor contains some contribution from domestic heating. Road traffic volumes in central Budapest were also substantially reduced (Salma et al., 2020). These reductions were reflected in the road trafficsvf factor at BUD_UB.
At roadside sites, mean PNCs from road trafficsvf factors were comparable at HEL_RS and lower at LEJ_RS and LDN_RS during lockdown compared to the equivalent periods in the reference years, with a mean decrease of −21 % (Fig. 5 and Table 4). Mean PNCs from road trafficsf factors were also lower at HEL_RS and LDN_RS during lockdown, with a mean decrease of −39 % (Fig. 5 and Table 4). Changes to mean PNCs from road traffic factors were notably more pronounced at LDN_RS than at other roadside sites included in this study. This is in some measure due to the enormous volumes of traffic typically present along Marylebone Road which were significantly reduced during lockdown (Hicks et al., 2021). However, BC concentrations have reduced considerably in recent years (Fig. S7c), likely associated with the increased proportion of Euro 6-compliant (Euro VI-compliant) vehicles (Damayanti et al., 2023; Luoma et al., 2021). The adoption of Euro 6 (Euro VI) vehicle emission standards and the compulsory emission technologies (such as diesel particle filters, DPFs) will have impacted road traffic factors over time, especially the road trafficsf factors resolved at HEL_RS and LDN_RS. DPFs do not suppress the semi-volatile mode of the emissions with high efficiency (Damayanti et al., 2023), explaining the smaller reduction in road trafficsvf.
3.2.3 Comparison of diffuse urban particle number concentrations during lockdowns to the reference years
Mean PNCs from factors attributed to diffuse urban, during reference and lockdown periods, were amongst the largest of the resolved factors (Fig. 5 and Tables 3, 4). The response of these factors to lockdown measures was largely consistent, and the diurnal cycle in each source-related factor is similar for both the lockdown and reference years (Fig. S5).
Among urban-background sites, mean PNCs from diffuse urban factors were higher at LEJ_UB and lower at HEL_UB and BUD_UB during lockdown compared to the equivalent periods in the reference years, with a mean decrease of −11 % (Fig. 5 and Table 3). Mean PNCs from the factor were also lower at LEJ_RS during lockdown by −16 % (Fig. 5 and Table 4). Changes to mean PNCs from diffuse urban factors likely reflect variations in residential wood combustion and reductions in traffic volumes. As previously mentioned, large reductions in traffic volumes were reported across Helsinki (Riuttanen et al., 2021), the German state of Saxony (Jaekel and Muley, 2022), and central Budapest (Salma et al., 2020). Variations in residential wood combustion, on the other hand, may reflect responses to outdoor temperature fluctuations (Fig. S8), as well as the more social and cultural aspects of urban air pollution. It is commonplace in northern countries to use firewood in sauna stoves and various fireplaces as supplementary heating (Kukkonen et al., 2020). Reductions in BC concentrations in northern Helsinki may be related to decreased wood burning (Harni et al., 2023) and/or weather conditions during lockdown. Nevertheless, biomass burning has previously been identified as a major contributor to PM concentrations in Helsinki (PM2.5; Saarnio et al., 2012), Leipzig (PM10; van Pinxteren et al., 2016), and Budapest (PM2.5; Salma et al., 2017) during the heating period.
3.2.4 Comparison of nucleation particle number concentrations during lockdowns to the reference years
Mean PNCs from factors attributed to nucleation, during reference and lockdown periods, were amongst the largest of the resolved factors, irrespective of environment type (Fig. 5 and Tables 3, 4). The response of these factors to lockdown restrictions was varied.
Among urban-background sites, mean PNCs from nucleation factors were higher at HEL_UB and LEJ_UB and lower at BUD_UB during lockdown compared to the equivalent periods in the reference years, with a mean increase of 13 % (Fig. 5 and Table 3). Changes to mean PNCs from nucleation factors likely reflect variations to NPF, as well as reductions in primary and delayed primary emissions (Rönkkö et al., 2017). NPF in these urban areas is likely driven by sulfuric acid, bases such as dimethylamine, and OOMs likely from anthropogenic volatile organic compound (AVOC) oxidation (Lee et al., 2019), meaning our NPF is mostly driven by anthropogenic emissions. Variations in solar radiation (Fig. S8) could also influence NPF via photochemical processes (Shen et al., 2021) but do not explain the trends we see in our data. The insolation was markedly higher in London during the lockdown period than in previous years, but the other cities show only a small increase. Strong solar radiation favours OH production which through various formation and oxidation processes produces sulfuric acid and other low-volatility vapours in the atmosphere (Wang et al., 2023). NPF is inhibited by high particle surface area, which was lower during lockdowns at all sites except LEJ_UB (Fig. 6) (Du et al., 2022). Primary and delayed nucleation particles are linked to the number of vehicles on the road, as well as the associated emission technologies, which can significantly impact the formation mechanisms and composition of emitted nanocluster aerosol (Rönkkö et al., 2017). The mixed response of nucleation factors at urban-background sites to lockdown restrictions likely represents the interplay between these complex variables.
Across all urban-background sites, the largest increase to nucleation was at LEJ_UB, with a 92 % increase, where the greatest increase to traffic factors was also seen (51 % increase to road trafficsvf), while CS also increased (Fig. 6). The largest decrease in nucleation was at BUD_UB, with a 45 % decrease, where the greatest reduction in traffic factors was also seen (−36 % decrease to road trafficsvf), while CS decreased. Primary nanocluster aerosol will have a lifetime on the order of tens of minutes and will need to grow to 10 nm and also undergo dilution while being transported from the roadside to the urban-background measurement stations. Primary and delayed primary particle emissions will be less important here than at the roadside, and we infer a substantial role of primary gaseous traffic emissions in accelerating NPF (Brean et al., 2023).
3.2.5 Comparison of secondary-aerosol particle number concentrations during lockdowns to the reference years
Mean PNCs from factors attributed to secondary aerosols (O3-associated SA and SIA), during the reference and lockdown periods, were the smallest of the resolved factors, irrespective of environment type (Fig. 5 and Tables 3, 4). Though, SIA factors were the largest contributors to PMCs (Fig. 2b) due to the large median diameters of the modes. The response of these factors to the lockdown periods was consistent across all of the monitoring sites included in this study.
Mean PNCs from O3-associated SA and SIA factors were lower at urban-background and roadside sites during lockdown compared to the equivalent periods in the reference years, with mean decreases of −42 % in SIA at the urban-background sites and −42 % and −60 % for O3-associated SA and SIA at the roadside (Fig. 5 and Tables 3, 4). The response of SIA factors to lockdown restrictions may reflect reductions in gaseous precursor pollutants (Fig. 4). Mechanisms of secondary aerosol formation changed under lockdown conditions in Beijing, for example, when NOx levels substantially declined (Yan et al., 2023). SIA is generated by the transfer of inorganic material from the vapour to the aerosol phase following the chemical processing of emitted gas phase precursor emissions (McFiggans et al., 2015). Both precursors and particles may be emitted locally or transported over long distances from adjacent source regions. Road traffic is typically the largest source of NOx in an urban area, as well as an under-recognised source of ammonia (Cao et al., 2022). Ammonia reacts with acid pollutants such as oxidation products of NOx and SO2 to form ammonium nitrate and ammonium sulfate, which is essential for the generation of SIA in PM (Duan et al., 2021). These interactions may help to explain why changes to mean PNCs from SIA factors were typically more pronounced at roadside sites. Similarly, if O3-associated SA is generated through ozonolysis of VOCs, VOC concentrations will have declined substantially during lockdown periods, although O3 concentrations increased during lockdown periods (Shi et al., 2021). This decline to secondary aerosol is large, is consistent across all sites, and will result in a substantial reduction in PM mass.
A multivariate factor analysis technique, PMF, was applied to particle number size distribution data to better understand how PNCs and their sources changed during the respective spring 2020 lockdown periods, compared to the equivalent days of the year in the reference years 2014–2019, depending on data coverage. The analysis involved six monitoring sites (three urban background and three roadside) between four European cities, including Helsinki, Leipzig, Budapest, and London. A number of common factors were resolved between the different sites, including nucleation, road trafficsvf, road trafficsf, diffuse urban, O3-associated SA, and SIA. Despite their commonalities, factors exhibited varying profiles between sites, illustrative of the complex network of aerosol sources and sinks contributing to particle size distributions in urban areas.
The factors attributed to nucleation, road traffic, and diffuse urban were the largest contributors to mean PNCs, during the reference years and the respective lockdown periods. Total mean PNCs were lower at two of the three urban-background sites and at all of the roadside sites during lockdown compared to the reference years. Nucleation factors showed highly variable behaviour. This perhaps demonstrates the important contribution from traffic to nucleation mode particles – either through the direct emission of primary aerosol or via key precursor compounds, such as amines and organic molecules. Road trafficsvf factors were also highly variable. This likely reflects the complex interplay between decreased precursor emissions and a lower condensation/coagulation sink giving variable outcomes. It is also possible that reduced traffic volumes and economic activities were partly counterbalanced by increased domestic emissions. Mean PNCs from road trafficsf, on the other hand, were notably lower at roadside locations. The response of diffuse urban factors to lockdown measures was largely consistent and perhaps reflects the more social and cultural aspects of urban air pollutant emissions. Secondary aerosols (O3-associated SA and SIA) exhibited extensive reductions in their mean PNCs during lockdown at all sites. However, SIA remained the largest contributor to PMCs.
The analyses reveal a complex and varied response in the particle size distributions to the curtailment of human mobility during the COVID-19 lockdown periods. The analyses also offer a glimpse into the future, where the electrification of road transport, together with traffic reduction schemes, may reduce mean PNCs from traffic, as well as potentially shift the relative importance of other sources in urban areas, driving the need for further air quality interventions and policy changes.
Furthermore, as alluded to in this study, the literature encompasses a wide range of named factors, often characterised by substantial overlap, particularly when it comes to factors related to road traffic. We argue that the named factors introduced in this study describe the reality better than variants present in other works and should be used going forward.
Data supporting this publication are openly available from the UBIRA eData repository at https://doi.org/10.25500/edata.bham.00001040 (Harrison et al., 2023).
The supplement related to this article is available online at: https://doi.org/10.5194/acp-24-9515-2024-supplement.
Conceptualisation: JB. Data curation and/or resources: TP, MV, IS, JN, HEM, and DvP. Formal analysis: AR and JB. Funding acquisition: RMH. Investigation: AR and JB. Methodology: JB. Project administration: RMH. Software: JB and DCSB. Supervision: RMH and ZS. Visualisation: AR, JB, and DCSB. Writing (original draft preparation): AR. Writing (review and editing): JB, DCSB, ZS, RMH, TP, IS, JVN, and DvP.
At least one of the (co-)authors is a member of the editorial board of Atmospheric Chemistry and Physics. The peer-review process was guided by an independent editor, and the authors also have no other competing interests to declare.
Publisher's note: Copernicus Publications remains neutral with regard to jurisdictional claims made in the text, published maps, institutional affiliations, or any other geographical representation in this paper. While Copernicus Publications makes every effort to include appropriate place names, the final responsibility lies with the authors.
The University of Birmingham acknowledges the National Physical Laboratory (NPL) for facilitating access to the London Marylebone Road datasets. Pasi Aalto, University of Helsinki, is acknowledged for his work on maintaining and developing size distribution measurements at the Helsinki sites. Katja Moilanen from the City of Helsinki is acknowledged for the traffic count data from Mäkelänkatu. TROPOS acknowledges technical support of the measurements by René Rabe and Anett Dietze.
The Hungarian National Research, Development and Innovation Office supported this work (grant no. K132254). Financial support was provided by the University of Helsinki through ACTRIS-HY, by the Research Council of Finland via the Atmosphere and Climate Competence Center (ACCC; grant no. 337549), and by Urbaani Ilmanlaatu 2.0 via the Technology Industries of Finland Centennial Foundation. This research has been supported by the European Union's Horizon 2020 programme (grant no. 101036245) and the Natural Environment Research Council (grant nos. R8/H12/83/011 and NE/V001523/1).
This paper was edited by Manish Shrivastava and reviewed by two anonymous referees.
Beddows, D. C. S. and Harrison, R. M.: Receptor modelling of both particle composition and size distribution from a background site in London, UK – a two-step approach, Atmos. Chem. Phys., 19, 4863–4876, https://doi.org/10.5194/acp-19-4863-2019, 2019.
Beddows, D. C. S., Harrison, R. M., Green, D. C., and Fuller, G. W.: Receptor modelling of both particle composition and size distribution from a background site in London, UK, Atmos. Chem. Phys., 15, 10107–10125, https://doi.org/10.5194/acp-15-10107-2015, 2015.
Birmili, W., Weinhold, K., Rasch, F., Sonntag, A., Sun, J., Merkel, M., Wiedensohler, A., Bastian, S., Schladitz, A., Löschau, G., Cyrys, J., Pitz, M., Gu, J., Kusch, T., Flentje, H., Quass, U., Kaminski, H., Kuhlbusch, T. A. J., Meinhardt, F., Schwerin, A., Bath, O., Ries, L., Gerwig, H., Wirtz, K., and Fiebig, M.: Long-term observations of tropospheric particle number size distributions and equivalent black carbon mass concentrations in the German Ultrafine Aerosol Network (GUAN), Earth Syst. Sci. Data, 8, 355–382, https://doi.org/10.5194/essd-8-355-2016, 2016.
Bousiotis, D., Brean, J., Pope, F. D., Dall'Osto, M., Querol, X., Alastuey, A., Perez, N., Petäjä, T., Massling, A., Klenø Nøjgaard, J., Nordstrøm, C., Kouvarakis, G., Vratolis, S., Eleftheriadis, K., Niemi, J. V., Portin, H., Wiedensohler, A., Weinhold, K., Merkel, M., Tuch, T., and Harrison, R. M.: The effect of meteorological conditions and atmospheric composition in the occurrence and development of new particle formation (NPF) events in Europe, Atmos. Chem. Phys., 21, 3345–3370, https://doi.org/10.5194/acp-21-3345-2021, 2021.
Brean, J., Rowell, A., Beddows, D. C. S., Weinhold, K., Mettke, P., Merkel, M., Tuch, T., Rissanen, M., Maso, M. D., Kumar, A., Barua, S., Iyer, S., Karppinen, A., Wiedensohler, A., Shi, Z., and Harrison, R. M.: Road Traffic Emissions Lead to Much Enhanced New Particle Formation through Increased Growth Rates, Environ. Sci. Technol., 58, 10664–10674, https://doi.org/10.1021/acs.est.3c10526, 2024.
Cao, H., Henze, D. K., Cady-Pereira, K., McDonald, B. C., Harkins, C., Sun, K., Bowman, K. W., Fu, T.-M., and Nawaz, M. O.: COVID-19 Lockdowns Afford the First Satellite-Based Confirmation That Vehicles Are an Under-recognized Source of Urban NH3 Pollution in Los Angeles, Environ. Sci. Technol. Lett., 9, 3–9, https://doi.org/10.1021/acs.estlett.1c00730, 2022.
Charron, A. and Harrison, R. M.: Primary particle formation from vehicle emissions during exhaust dilution in the roadside atmosphere, Atmos. Environ., 37, 4109–4119, https://doi.org/10.1016/S1352-2310(03)00510-7, 2003.
Cohen, A. J., Brauer, M., Burnett, R., Anderson, H. R., Frostad, J., Estep, K., Balakrishnan, K., Brunekreef, B., Dandona, L., Dandona, R., Feigin, V., Freedman, G., Hubbell, B., Jobling, A., Kan, H., Knibbs, L., Liu, Y., Martin, R., Morawska, L., Pope, C. A., Shin, H., Straif, K., Shaddick, G., Thomas, M., van Dingenen, R., van Donkelaar, A., Vos, T., Murray, C. J. L., and Forouzanfar, M. H.: Estimates and 25-year trends of the global burden of disease attributable to ambient air pollution: an analysis of data from the Global Burden of Diseases Study 2015, Lancet, 389, 1907–1918, https://doi.org/10.1016/S0140-6736(17)30505-6, 2017.
Damayanti, S., Harrison, R. M., Pope, F., and Beddows, D. C. S.: Limited impact of diesel particle filters on road traffic emissions of ultrafine particles, Environ. Int., 174, 107888, https://doi.org/10.1016/j.envint.2023.107888, 2023.
Deng, C., Cai, R., and Yan, C.: Formation and growth of sub-3 nm particles in megacities: impact of background aerosols, Faraday Discuss., 226, 348–363, https://doi.org/10.1039/d0fd00083c, 2021.
Du, W., Cai, J., Zheng, F., Yan, C., Zhou, Y., Guo, Y., Chu, B., Yao, L., Heikkinen, L. M., Fan, X., Wang, Y., Cai, R., Hakala, S., Chan, T., Kontkanen, J., Tuovinen, S., Petäjä, T., Kangasluoma, J., Bianchi, F., Paasonen, P., Sun, Y., Kerminen, V.-M., Liu, Y., Daellenbach, K. R., Dada, L., and Kulmala, M.: Influence of Aerosol Chemical Composition on Condensation Sink Efficiency and New Particle Formation in Beijing, Environ. Sci. Technol. Lett., 9, 375–382, https://doi.org/10.1021/acs.estlett.2c00159, 2022.
Duan, X., Yan, Y., Peng, L., Xie, K., Hu, D., Li, R., and Wang, C.: Role of ammonia in secondary inorganic aerosols formation at an ammonia-rich city in winter in north China: A comparative study among industry, urban, and rural sites, Environ. Pollut., 291, 118151, https://doi.org/10.1016/j.envpol.2021.118151, 2021.
Hammer, M. S., Donkelaar, A. Van, Martin, R. V, Mcduffie, E. E., Lyapustin, A., Sayer, A. M., Hsu, N. C., Levy, R. C., Garay, M. J., Kalashnikova, O. V., and Kahn, R. A.: Effects of COVID-19 lockdowns on fine particulate matter concentrations, Sci. Adv., 7, 1–11, https://doi.org/10.1126/sciadv.abg767, 2021.
Harni, S. D., Saarikoski, S., Kuula, J., Helin, A., Aurela, M., Niemi, J. V, Kousa, A., Rönkkö, T., and Timonen, H.: Effects of emission sources on the particle number size distribution of ambient air in the residential area, Atmos. Environ., 293, 119419, https://doi.org/10.1016/j.atmosenv.2022.119419, 2023.
Harrison, R. M., Rob MacKenzie, A., Xu, H., Alam, M. S., Nikolova, I., Zhong, J., Singh, A., Zeraati-Rezaei, S., Stark, C., Beddows, D. C. S., Liang, Z., Xu, R., and Cai, X.: Diesel exhaust nanoparticles and their behaviour in the atmosphere, P. R. Soc. A, 474, 20180492, https://doi.org/10.1098/rspa.2018.0492, 2018.
Harrison, R. M., Beddows, D. C. S., Alam, M. S., Singh, A., Brean, J., Xu, R., Kotthaus, S., and Grimmond, S.: Interpretation of particle number size distributions measured across an urban area during the FASTER campaign, Atmos. Chem. Phys., 19, 39–55, https://doi.org/10.5194/acp-19-39-2019, 2019.
Harrison, R. M., Rowell, A., and Brean, J.: Research data supporting “Insights into the sources of ultrafine particle numbers at six European urban sites obtained by investigating COVID-19 lockdowns”, University of Birmingham eData Repository [data set], https://doi.org/10.25500/edata.bham.00001040, 2023.
Helin, A., Niemi, J. V, Virkkula, A., Pirjola, L., Teinilä, K., Backman, J., Aurela, M., Saarikoski, S., Rönkkö, T., Asmi, E., and Timonen, H.: Characteristics and source apportionment of black carbon in the Helsinki metropolitan area, Finland, Atmos. Environ., 190, 87–98, https://doi.org/10.1016/j.atmosenv.2018.07.022, 2018.
Hicks, W., Beevers, S., Tremper, A. H., Stewart, G., Priestman, M., Kelly, F. J., Lanoisellé, M., Lowry, D., and Green, D. C.: Quantification of Non-Exhaust Particulate Matter Traffic Emissions And The Impact Of COVID-19 lockdown at London Marylebone Road, Atmosphere, 12, 190, https://doi.org/10.3390/atmos12020190, 2021.
Hopke, P. K., Feng, Y., and Dai, Q.: Source apportionment of particle number concentrations: A global review, Sci. Total Environ., 819, 153104, https://doi.org/10.1016/j.scitotenv.2022.153104, 2022.
Jaekel, B. and Muley, D.: Transport impacts in Germany and State of Qatar: An assessment during the first wave of COVID-19, Transp. Res. Interdiscip. Perspect., 13, 100540, https://doi.org/10.1016/j.trip.2022.100540, 2022.
Jarvi, L., Hannuniemi, H., Hussein, T., Junninen, H., Aalto, P. P., Hillamo, R., Makela, T., Keronen, P., Siivola, E., Vesala, T., and Kulmala, M.: The urban measurement station SMEAR III: Continuous monitoring of air pollution and surface-atmosphere interactions in Helsinki, Finland, Boreal Environ. Res., 14, 86–109, 2009.
Järvi, L., Nordbo, A., Junninen, H., Riikonen, A., Moilanen, J., Nikinmaa, E., and Vesala, T.: Seasonal and annual variation of carbon dioxide surface fluxes in Helsinki, Finland, in 2006–2010, Atmos. Chem. Phys., 12, 8475–8489, https://doi.org/10.5194/acp-12-8475-2012, 2012.
Jiang, S., Zhang, F., Ren, J., Chen, L., Yan, X., Liu, J., Sun, Y., and Li, Z.: Evaluation of the contribution of new particle formation to cloud droplet number concentration in the urban atmosphere, Atmos. Chem. Phys., 21, 14293–14308, https://doi.org/10.5194/acp-21-14293-2021, 2021.
Kamara, A. A. and Harrison, R. M.: Analysis of the air pollution climate of a central urban roadside supersite: London, Marylebone Road, Atmos. Environ., 258, 118479, https://doi.org/10.1016/j.atmosenv.2021.118479, 2021.
Kasumba, J., Hopke, P. K., Chalupa, D. C., and Utell, M. J.: Comparison of sources of submicron particle number concentrations measured at two sites in Rochester, NY, Sci. Total Environ., 407, 5071–5084, https://doi.org/10.1016/j.scitotenv.2009.05.040, 2009.
Kittelson, D. B., Watts, W. F., and Johnson, J. P.: On-road and laboratory evaluation of combustion aerosols – Part 1: Summary of diesel engine results, J. Aerosol Sci., 37, 913–930, https://doi.org/10.1016/j.jaerosci.2005.08.005, 2006.
Klose, S., Birmili, W., Voigtländer, J., Tuch, T., Wehner, B., Wiedensohler, A., and Ketzel, M.: Particle number emissions of motor traffic derived from street canyon measurements in a Central European city, Atmos. Chem. Phys. Discuss., 9, 3763–3809, https://doi.org/10.5194/acpd-9-3763-2009, 2009.
Kukkonen, J., López-Aparicio, S., Segersson, D., Geels, C., Kangas, L., Kauhaniemi, M., Maragkidou, A., Jensen, A., Assmuth, T., Karppinen, A., Sofiev, M., Hellén, H., Riikonen, K., Nikmo, J., Kousa, A., Niemi, J. V, Karvosenoja, N., Santos, G. S., Sundvor, I., Im, U., Christensen, J. H., Nielsen, O.-K., Plejdrup, M. S., Nøjgaard, J. K., Omstedt, G., Andersson, C., Forsberg, B., and Brandt, J.: The influence of residential wood combustion on the concentrations of PM2.5 in four Nordic cities, Atmos. Chem. Phys., 20, 4333–4365, https://doi.org/10.5194/acp-20-4333-2020, 2020.
Kulmala, M., Petäjä, T., Ehn, M., Thornton, J., Sipilä, M., Worsnop, D. R., and Kerminen, V.-M.: Chemistry of atmospheric nucleation: on the recent advances on precursor characterization and atmospheric cluster composition in connection with atmospheric new particle formation., Annu. Rev. Phys. Chem., 65, 21–37, https://doi.org/10.1146/annurev-physchem-040412-110014, 2014.
Kuula, J., Kuuluvainen, H., Niemi, J. V, Saukko, E., Portin, H., Kousa, A., Aurela, M., Rönkkö, T., and Timonen, H.: Long-term sensor measurements of lung deposited surface area of particulate matter emitted from local vehicular and residential wood combustion sources, Aerosol Sci. Technol., 54, 190–202, https://doi.org/10.1080/02786826.2019.1668909, 2020.
Lee, S. H., Gordon, H., Yu, H., Lehtipalo, K., Haley, R., Li, Y., and Zhang, R.: New particle formation in the atmosphere: From molecular clusters to global climate, J. Geophys. Res.-Atmos., 124, 7098–7146, https://doi.org/10.1029/2018JD029356, 2019.
Le Quéré, C., Jackson, R. B., Jones, M. W., Smith, A. J. P., Abernethy, S., Andrew, R. M., De-gol, A. J., Willis, D. R., Shan, Y., Canadell, J. G., Friedlingstein, P., Creutzig, F., and Peters, G. P.: Temporary reduction in daily global CO2 emissions during the COVID-19 forced confinement, Nat. Clim. Change, 10, 647–654, https://doi.org/10.1038/s41558-020-0797-x, 2020.
Liu, Z. R., Hu, B., Liu, Q., Sun, Y., and Wang, Y. S.: Source apportionment of urban fine particle number concentration during summertime in Beijing, Atmos. Environ., 96, 359–369, https://doi.org/10.1016/j.atmosenv.2014.06.055, 2014.
Luoma, K., Niemi, J. V, Aurela, M., Fung, P. L., Helin, A., Hussein, T., Kangas, L., Kousa, A., Rönkkö, T., Timonen, H., Virkkula, A., and Petäjä, T.: Spatiotemporal variation and trends in equivalent black carbon in the Helsinki metropolitan area in Finland, Atmos. Chem. Phys., 21, 1173–1189, https://doi.org/10.5194/acp-21-1173-2021, 2021.
McFiggans, G., Alfarra, M., Allan, J., Coe, H., Hamilton, J., Harrison, R., Jenkin, M., Lewis, A., Moller, S., and Williams, P.: A review of the state-of-the-science relating to secondary particulate matter of relevance to the composition of the UK atmosphere, Defra, 2015.
Ogulei, D., Hopke, P. K., Chalupa, D. C., and Utell, M. J.: Modeling source contributions to submicron particle number concentrations measured in Rochester, New York, Aerosol Sci. Technol., 41, 179–201, https://doi.org/10.1080/02786820601116012, 2007.
Ohlwein, S., Kappeler, R., Kutlar, M., and Nino, J.: Health effects of ultrafine particles: a systematic literature review update of epidemiological evidence, Int. J. Public Health, 7, 547–559, https://doi.org/10.1007/s00038-019-01202-7, 2019.
Paatero, P. and Tapper, U.: Positive matrix factorization: A non-negative factor model with optimal utilization of error estimates of data values, Environmetrics, 5, 111–126, https://doi.org/10.1002/env.3170050203, 1994.
Pérez, N., Pey, J., Cusack, M., Reche, C., Querol, X., Alastuey, A., and Viana, M.: Variability of particle number, black carbon, and PM10, PM2.5, and PM1 levels and speciation: Influence of road traffic emissions on urban air quality, Aerosol Sci. Technol., 44, 487–499, https://doi.org/10.1080/02786821003758286, 2010.
Putaud, J.-P., Pisoni, E., Mangold, A., Hueglin, C., Sciare, J., Pikridas, M., Savvides, C., Ondracek, J., Mbengue, S., Wiedensohler, A., Weinhold, K., Merkel, M., Poulain, L., van Pinxteren, D., Herrmann, H., Massling, A., Nordstroem, C., Alastuey, A., Reche, C., Pérez, N., Castillo, S., Sorribas, M., Adame, J. A., Petaja, T., Lehtipalo, K., Niemi, J., Riffault, V., de Brito, J. F., Colette, A., Favez, O., Petit, J.-E., Gros, V., Gini, M. I., Vratolis, S., Eleftheriadis, K., Diapouli, E., Denier van der Gon, H., Yttri, K. E., and Aas, W.: Impact of 2020 COVID-19 lockdowns on particulate air pollution across Europe, EGUsphere [preprint], https://doi.org/10.5194/egusphere-2023-434, 2023.
Riuttanen, A., Ponkilainen, V., Kuitunen, I., Reito, A., Sirola, J., and Mattila, V. M.: Severely injured patients do not disappear in a pandemic: Incidence and characteristics of severe injuries during COVID-19 lockdown in Finland, Acta Orthop., 92, 249–253, https://doi.org/10.1080/17453674.2021.1881241, 2021.
Rivas, I., Beddows, D. C. S., Amato, F., Green, D. C., Järvi, L., Hueglin, C., Reche, C., Timonen, H., Fuller, G. W., Niemi, J. V., Pérez, N., Aurela, M., Hopke, P. K., Alastuey, A., Kulmala, M., Harrison, R. M., Querol, X., and Kelly, F. J.: Source apportionment of particle number size distribution in urban background and traffic stations in four European cities, Environ. Int., 135, 105345, https://doi.org/10.1016/j.envint.2019.105345, 2020.
Rönkkö, T. and Timonen, H.: Overview of Sources and Characteristics of Nanoparticles in Urban Traffic-Influenced Areas, J. Alzheimer's Dis., 72, 15–28, https://doi.org/10.3233/JAD-190170, 2019.
Rönkkö, T., Kuuluvainen, H., Karjalainen, P., Keskinen, J., Hillamo, R., Niemi, J. V., Pirjola, L., Timonen, H. J., Saarikoski, S., Saukko, E., Järvinen, A., Silvennoinen, H., Rostedt, A., Olin, M., Yli-Ojanperä, J., Nousiainen, P., Kousa, A., and Dal Maso, M.: Traffic is a major source of atmospheric nanocluster aerosol, P. Natl. Acad. Sci. USA, 114, 7549–7554, https://doi.org/10.1073/pnas.1700830114, 2017.
Saarnio, K., Niemi, J., Saarikoski, S., Aurela, M., Timonen, H., Teinila, K., Myllynen, M., Frey, A., Lamberg, H., Jokiniemi, J., and Hillamo, R.: Using monosaccharide anhydrides to estimate the impact of wood combustion on fine particles in the Helsinki Metropolitan Area, Boreal Environ. Res., 17, 163–183, 2012.
Salma, I., Németh, Z., Kerminen, V., Aalto, P., Nieminen, T., and Weidinger, T.: Regional effect on urban atmospheric nucleation, Atmos. Chem. Phys., 16, 8715–8728, https://doi.org/10.5194/acp-16-8715-2016, 2016.
Salma, I., Németh, Z., Weidinger, T., Maenhaut, W., Claeys, M., Molnár, M., Major, I., Ajtai, T., Utry, N., and Bozóki, Z.: Source apportionment of carbonaceous chemical species to fossil fuel combustion, biomass burning and biogenic emissions by a coupled radiocarbon–levoglucosan marker method, Atmos. Chem. Phys., 17, 13767–13781, https://doi.org/10.5194/acp-17-13767-2017, 2017.
Salma, I., Vörösmarty, M., Gyöngyösi, A. Z., Thén, W., and Weidinger, T.: What can we learn about urban air quality with regard to the first outbreak of the COVID-19 pandemic? A case study from central Europe, Atmos. Chem. Phys., 20, 15725–15742, https://doi.org/10.5194/acp-20-15725-2020, 2020.
Shen, X., Sun, J., Yu, F., Wang, Y., Zhong, J., Zhang, Y., Hu, X., Xia, C., Zhang, S., and Zhang, X.: Enhancement of nanoparticle formation and growth during the COVID-19 lockdown period in urban Beijing, Atmos. Chem. Phys., 21, 7039–7052, https://doi.org/10.5194/acp-21-7039-2021, 2021.
Shi, Z., Song, C., Liu, B., Lu, G., Xu, J., Vu, T. Van, Elliott, R. J. R., Li, W., Bloss, W. J., and Harrison, R. M.: Abrupt but smaller than expected changes in surface air quality attributable to COVID-19 lockdowns, Science, 7, eabd6696, https://doi.org/10.1126/sciadv.abd6696, 2021.
Squizzato, S., Masiol, M., Emami, F., Chalupa, D. C., Utell, M. J., Rich, D. Q., and Hopke, P. K.: Long-Term Changes of Source Apportioned Particle Number Concentrations in a Metropolitan Area of the Northeastern United States, Atmosphere, 10, 27, https://doi.org/10.3390/atmos10010027, 2019.
Storelvmo, T., Leirvik, T., Lohmann, U., Phillips, P. C. B., and Wild, M.: Disentangling greenhouse warming and aerosol cooling to reveal Earth's climate sensitivity, Nat. Geosci., 9, 286–289, https://doi.org/10.1038/ngeo2670, 2016.
Tiwari, M., Sahu, S. K., Bhangare, R. C., Yousaf, A., and Pandit, G. G.: Particle size distributions of ultrafine combustion aerosols generated from household fuels, Atmos. Pollut. Res., 5, 145–150, https://doi.org/10.5094/APR.2014.018, 2014.
Torkmahalleh, M. A., Akhmetvaliyeva, Z., Omran, A. D., Omran, F. F. D., Kazemitabar, M., Naseri, M., Naseri, M., Sharifi, H., Malekipirbazari, M., Adotey, E. K., Gorjinezhad, S., Eghtesadi, N., Sabanov, S., Alastuey, A., de Fátima Andrade, M., Buonanno, G., Carbone, S., Cárdenas-Fuentes, D. E., Cassee, F. R., Dai, Q., Henríquez, A., Hopke, P. K., Keronen, P., Khwaja, H. A., Kim, J., Kulmala, M., Kumar, P., Kushta, J., Kuula, J., Massagué, J., Mitchell, T., Mooibroek, D., Morawska, L., Niemi, J. V, Ngagine, S. H., Norman, M., Oyama, B., Oyola, P., Öztürk, F., Petäjä, T., Querol, X., Rashidi, Y., Reyes, F., Ross-Jones, M., Salthammer, T., Savvides, C., Stabile, L., Sjöberg, K., Söderlund, K., Raman, R. S., Timonen, H., Umezawa, M., Viana, M., and Xie, S.: Global air quality and COVID-19 pandemic: Do we breathe cleaner air?, Aerosol Air Qual. Res., 21, 200567, https://doi.org/10.4209/aaqr.200567, 2021.
van Pinxteren, D., Fomba, K. W., Spindler, G., Müller, K., Poulain, L., Iinuma, Y., Löschau, G., Hausmann, A., and Herrmann, H.: Regional air quality in Leipzig Germany: detailed source apportionment of size-resolved aerosol particles and comparison with the year 2000, Faraday Discuss., 189, 291–315, https://doi.org/10.1039/C5FD00228A, 2016.
Vu, T. V., Delgado-Saborit, J. M., and Harrison, R. M.: Review: Particle number size distributions from seven major sources and implications for source apportionment studies, Atmos. Environ., 122, 114–132, https://doi.org/10.1016/j.atmosenv.2015.09.027, 2015.
Vu, T. V, Shi, Z., Cheng, J., Zhang, Q., He, K., Wang, S., and Harrison, R. M.: Assessing the impact of clean air action on air quality trends in Beijing using a machine learning technique, Atmos. Chem. Phys., 19, 11303–11314, https://doi.org/10.5194/acp-19-11303-2019, 2019.
Wang, K., Ma, X., Tian, R., and Yu, F.: Analysis of new particle formation events and comparisons to simulations of particle number concentrations based on GEOS-Chem–advanced particle microphysics in Beijing, China, Atmos. Chem. Phys., 23, 4091–4104, https://doi.org/10.5194/acp-23-4091-2023, 2023.
Yan, C., Tham, Y. J., Nie, W., Xia, M., Wang, H., Guo, Y., Ma, W., Zhan, J., Hua, C., Li, Y., Deng, C., Li, Y., Zheng, F., Chen, X., Li, Q., Zhang, G., Mahajan, A. S., Cuevas, C. A., Huang, D. D., Wang, Z., Sun, Y., Saiz-Lopez, A., Bianchi, F., Kerminen, V.-M., Worsnop, D. R., Donahue, N. M., Jiang, J., Liu, Y., Ding, A., and Kulmala, M.: Increasing contribution of nighttime nitrogen chemistry to wintertime haze formation in Beijing observed during COVID-19 lockdowns, Nat. Geosci., 16, 975–981, https://doi.org/10.1038/s41561-023-01285-1, 2023.