the Creative Commons Attribution 4.0 License.
the Creative Commons Attribution 4.0 License.
 | 15 Sep 2024
The importance of an informed choice of CO2-equivalence metrics for contrail avoidance
Olivier Boucher
Keith P. Shine
Marc Stettler
Katsumasa Tanaka
Roger Teoh
Nicolas Bellouin
One of the proposed ways to reduce the climate impact of civil aviation is rerouting aircraft to minimise the formation of warming contrails. As this strategy may increase fuel consumption, it would only be beneficial if the climate impact reduction from the avoided contrails exceeds the negative impact of any additional carbon dioxide (CO2) emitted by the rerouted flight. In this study, we calculate the surface temperature response of almost half a million flights that crossed the North Atlantic sector in 2019 and compare it to the temperature response of hypothetical rerouted flights. The climate impacts of contrails and CO2 are assessed through the perspective of CO2-equivalence metrics, represented here as nine combinations of different definitions and time horizons. We estimate that the total emitted CO2 and the persistent contrails formed will have warmed the climate by 17.2 µK in 2039, 13.7 µK in 2069, and 14.1 µK in 2119. Under an idealised scenario where 1 % additional carbon dioxide is enough to reroute all contrail-forming flights and avoid contrail formation completely, total warming would decrease by 4.9 (−28 %), 2.6 (−19 %), and 1.9 (−13 %) µK in 2039, 2069, and 2119, respectively. In most rerouting cases, the results based on the nine different CO2-equivalence metrics agree that rerouting leads to a climate benefit, assuming that contrails are avoided as predicted. But the size of that benefit is very dependent on the choice of CO2-equivalence metrics, contrail efficacy and CO2 penalty. Sources of uncertainty not considered here could also heavily influence the perceived benefit. In about 10 % of rerouting cases, the climate damage resulting from contrail avoidance indicated by CO2-equivalence metrics integrated over a 100-year time horizon is not predicted by metrics integrated over a 20-year time horizon. This study highlights, using North Atlantic flights as a case study, the implications of the choice of CO2-equivalence metrics for contrail avoidance, but the choice of metric implies a focus on a specific climate objective, which is ultimately a political decision.
- Article
(1038 KB) - Full-text XML
-
Supplement
(1510 KB) - BibTeX
- EndNote


Civil aviation mostly contributes to climate change through the in-flight emissions of commercial aircraft. These emissions include carbon dioxide (CO2): the global aviation fleet represented about 2.4 % of the global annual fossil-fuel CO2 emissions in 2018 (ICCT, 2018). However, kerosene combustion also emits non-CO2 species such as nitrogen oxides (NOx), water vapour, and soot particles. These emissions exert the so-called non-CO2 effects of aviation (EASA, 2020). The CO2 and non-CO2 climate effects have usually been compared in terms of radiative forcing (e.g. Ramaswamy et al., 2018) or other dedicated metrics (e.g. Fuglestvedt et al., 2010). According to current knowledge, non-CO2 effects could exert two-thirds of the total effective radiative forcing due to civil aviation since its inception in 1940 (Lee et al., 2021). Uncertainties in the estimates of non-CO2 effects are large and the subject of active research.
Contrails (condensation trails) form when atmospheric conditions allow water vapour to condense onto aerosols emitted by the incomplete combustion of kerosene impurities in the aircraft engines (Schumann et al., 2012; Kärcher, 2018). Contrails that form in ice supersaturated regions (ISSRs) of the upper atmosphere persist to form contrail cirrus clouds. These clouds reflect a fraction of incoming sunlight back to space, cooling the climate system, but they also absorb and re-emit infrared radiation at colder temperatures than the underlying surface and atmosphere, leading to a warming. The overall impact depends on the contrail properties, its ambient environment, and the time of day. Some persistent contrails cool the Earth, but most have a warming effect (Wilhelm et al., 2021; Wang et al., 2023). Taken together, contrail cirrus are currently thought to be the largest contributor of climate forcing by aviation (Fig. 6.16 of Szopa et al., 2021) and hence are the focus of this study. A more comprehensive discussion would need to assess the impact of other non-CO2 effects, such as NOx and aerosols. There is an interdependency between them: for example, aerosols play a role in contrail formation but also exert their own radiative forcing, directly by interacting with radiation or via their interactions with clouds, but the magnitude and size of this forcing is highly uncertain (Lee et al., 2021).
On average, 13 % of flight time occurs in ISSRs (Gierens et al., 1999), and studies suggest that only a minority of flights in a given airspace are responsible for most of the higher-impact persistent contrails (Teoh et al., 2020, 2022, 2023). It is therefore tempting to avoid flight trajectories or altitudes that encounter ISSRs to avoid the formation of persistent contrails. This strategy assumes that the location and properties of ISSRs can be accurately predicted on both the original and rerouted trajectories, and it also assumes that other considerations, including impacts on air traffic management, safety, and flight duration, make a reroute practical. In addition, the rerouted aircraft could deviate from its optimal trajectory in terms of fuel consumption and therefore CO2 emissions, thus requiring methods to quantify the trade-off between CO2 and non-CO2 climate impacts.
The radiative and climate impacts of CO2 and non-CO2 effects are usually compared using a CO2-equivalence metric as a multiplicative factor that operates on the CO2-only effect (Fuglestvedt et al., 2010). For example, a factor of 2 indicates a net CO2 and non-CO2 effect that is twice as large as that of the CO2 effect alone, while a factor of 1 indicates that the net non-CO2 effects are zero. The multiplicative factor can thus translate emissions of aviation into CO2-equivalent emissions.
It is now well accepted that the choice of CO2-equivalence metric depends on the perspective and objectives of climate policies (Fuglestvedt et al., 2010; Tanaka et al., 2010; Forster et al., 2021; Megill et al., 2024). The UNFCCC (United Nations Framework Convention on Climate Change) decided in 1995 for its Kyoto Protocol to compute CO2-equivalent emissions of greenhouse gas emissions using a metric definition based on the integration of radiative forcing, called the global warming potential (GWP), over a time horizon of 100 years. That decision was reconfirmed in 2018 (UNFCCC, 1995, 2019). The initial choice was informed by the First Assessment Report of the Intergovernmental Panel on Climate Change (IPCC), which assessed GWP for 20-, 100-, and 500-year time horizons in its Table 2.8 (Shine et al., 1990). The report noted that these “three different time horizons are presented as candidates for discussion and should not be considered as having any special significance” (Shine, 2009). UNFCCC therefore had a limited choice of CO2-equivalence metric, since GWP was the only metric assessed by the IPCC at the time. It is believed that the 100-year time horizon may have been chosen as a middle ground between shorter and longer options. The EU Emissions Trading System followed in 2003 the UNFCCC choice of GWP (European Commission, 2003, Directive 2003/87/EC). This decision does not mandate a particular time horizon, but 100 years is likely to remain the most widely used. In its most recent assessment (AR6), the IPCC refrained from recommending an emission metric (Box 7.3 of Forster et al., 2021), noting that the choice “depends on the purposes for which (…) forcing agents are being compared”. Although the UNFCCC choice of GWP100 was based on the limited research available in the mid-1990s, it is becoming clearer that GWP100 is relatively close to an economically optimal metric at least currently for achieving the long-term temperature goals of the Paris Agreement (see Cross Chapter 2 of Dhakal et al., 2022; Tanaka et al., 2021).
In the case of aviation, Grewe et al. (2014) studied the impact of metric choice on estimating the short-, medium-, and long-term climate impacts of rerouting strategies and found that some combinations of metrics and time horizon put a greater value on reducing the radiative forcing of short-lived components like contrails, while other combinations put a greater value on reducing the forcing due to CO2. Aviation is not the only sector where non-CO2 emissions are a significant fraction of the CO2-equivalent emissions. Most notable are methane emissions from the agricultural sector for which the CO2 equivalence is also heavily dependent on the choice of metric and time horizon, and the debate and lack of scientific consensus on that choice continues, as noted in the latest report of the Food and Agriculture Organization (FAO) on the topic (FAO, 2023).
The present study revisits the question of the choice of a CO2-equivalence metric definition and time horizon in the context of contrail avoidance, using the actual 2019 North Atlantic air traffic to quantify the climate outcome of that choice. It includes a sensitivity analysis of the results to the amount of additional CO2 needed to reroute a flight, to the capability of the rerouting to fully avoid the formation of a persistent contrail, and to the efficacy of contrail radiative forcing to induce surface temperature changes. Section 2 details the metrics used to quantify the impact of contrails and the CO2-equivalence metric definition that allows comparison of CO2 and contrails climate impacts. Section 3 describes the air traffic dataset used in this study and the contrail and Earth system models used to calculate the surface temperature change exerted by a flight based on its CO2 emissions and contrail radiative forcing. Section 4 discusses how the different timescales of the climate perturbations of CO2 and contrails affect the results based on different CO2-equivalence metrics, focusing on nine metrics, which are the combinations of three different metric definitions (global warming potential, global temperature change potential, and average temperature response) with three alternative time horizons (20, 50, and 100 years). Section 5 assesses the climate implications of rerouting strategies applied to contrail-forming aircraft traffic over the North Atlantic for the year 2019, with simplified assumptions on the additional CO2 emitted to avoid contrail formation. This section also investigates the sensitivity of the results to more realistic rerouting and to contrail efficacy, respectively. Section 6 concludes the study, highlighting the implications of radiative forcing uncertainties.
It is impractical to run climate models to quantify the different contributions to temperature change for individual activities, or individual flights in our case, because the climate impact of such a small emission pulse would be lost in the internal variability of the Earth system, requiring too many climate model simulations to identify it robustly. Instead, different CO2-equivalence metrics (also called “climate metrics”, “emission metrics”, or simply “metrics” in the literature) have been developed to compare CO2 and non-CO2 effects (Fuglestvedt et al., 2010). Such a comparison can be done in terms of the time evolution of the radiative forcing ΔF exerted by the constituent or of the temperature change ΔT that follows from ΔF.
The absolute global warming potential (AGWP) measures the cumulative radiative forcing exerted by a pulse emission at t0 of the constituent of interest over a given time horizon H (Fuglestvedt et al., 2010):
Relating the AGWPH of contrails to a pulse emission is not straightforward, since contrails are not emitted. Instead, contrails form owing to the release of water vapour and aerosols from fuel combustion, and one estimates the AGWPH of a contrail formed from the energy it adds to or removes from the Earth system during its lifetime. AGWPH is a time-integrated metric, and because it is based on radiative forcing, it is not an explicit measure of the climate response (Fuglestvedt et al., 2010).
To consider the climate response, the absolute global temperature change potential (AGTP; Shine et al., 2005) measures the change in global surface temperature at time horizon H after a pulse emission at t0:
Unlike AGWPH, AGTPH is an endpoint metric. Corresponding integrated metrics have been proposed that measure global surface temperature change averaged over H: the integrated GTP (Peters et al., 2011), mean GTP (Gillett and Matthews, 2010), or average temperature response (ATR; Grewe et al., 2021). The latter has been introduced in a slightly different form by Dallara et al. (2011) and then used regularly in aviation–climate studies following the publication of Grewe et al. (2014), so it will be considered here. ATRH is the average change in temperature between the time of an emission at t0 and the end of the time horizon t0+H:
Hereafter, we denote the unit of ATR with brackets 〈K〉, to distinguish an average temperature over a time period from an endpoint temperature change.
Combined pulse–sustained metrics, like the GWP∗ (Allen et al., 2018) and combined GTP (Collins et al., 2020), have been proposed to ensure equivalency in the temperature response of short-lived and long-lived climate forcers (Allen et al., 2022). Those metrics are not considered here because they are most suited for quantifying CO2/non-CO2 trade-off for future emission scenarios rather than for quantifying potential reductions in climate impact for individual flights, which is the topic of this study.
Note that, as detailed in the next section, we calculate the time-dependent temperature response and then apply the perspective of CO2-equivalence metrics to interpret the results, without relying on previously published values of CO2-equivalence metrics (see Cross Chapter 2 of Dhakal et al., 2022).
This study considers flight trajectories, their associated fuel consumption and CO2 emissions, and, when relevant, the persistent contrails formed. Each specific persistent contrail is described using its energy forcing EFcontrail (Teoh et al., 2020), in joules, which quantifies the total energy added to or lost by the Earth system by the contrail during its lifetime while accounting for the length of the contrail L, its width W, and lifetime τ:
where ΔFcontrail is the instantaneous contrail radiative forcing (RF). EFcontrail is almost equal to AGWPH (but in a different unit) for time horizons greater than 1 year (see Supplementary Data of Irvine et al., 2014). Such time horizons are much longer than the lifetime of a contrail; therefore, AGWPH integrates the whole contrail radiative forcing. However, the equality is not exact because of the existence of slow carbon cycle feedbacks within the Earth system, and AGWPH is about 7 %, 10 %, and 13 % greater than EFcontrail for a time horizon of 20, 50, and 100 years, respectively.
This study considers all segments of flights that operated over the North Atlantic in the Shanwick and Gander oceanic control areas, which are approximately bounded by latitudes 40 and 75° N and longitudes 50 and 10° W. We use the data from the year 2019, before the disruption caused to intercontinental routes by the Covid-19 pandemic. That represents a total of 477 923 flights.
The dataset provides fuel consumption and EFcontrail, which were calculated by Teoh et al. (2022) using the following: (i) actual flight trajectories provided by the UK National Air Traffic Services (NATS); (ii) the European Centre for Medium Range Weather Forecasts (ECMWF) ERA5 high-resolution realisation (HRES) reanalysis, which, for the purposes of this study, is presumed to be completely accurate; and (iii) the contrail cirrus prediction model CoCiP (Schumann et al., 2012). CoCiP tests the meteorological conditions over flight segments, and if they are favourable to contrail formation, a contrail segment is formed. CoCiP then advects the contrail in a Lagrangian framework to simulate coverage and radiative properties over the contrail lifetime. In this study, EFcontrail is expressed in terms of energy forcing per flown distance, dividing total energy forcing by total flown distance for each flight.
According to those calculations, 260 854 flights (55 %) formed contrails, and 208 965 flights (80 % of contrail-forming flights) formed contrails that exerted a positive contrail energy forcing. Contrail energy forcing per flown distance ranges from −8.7 × 10¹¹ to 5.0 × 10¹² J km−1, with a mean of 9.6 × 10¹⁰ J km−1 and a median of 2.9 × 10¹⁰ J km−1. The 10th and 90th percentiles are −6.0 × 10⁹ and 2.8 × 10¹¹ J km−1, respectively. The mean energy forcing per unit flown distance of warming contrails is 1.3 × 10¹⁰ J km−1, and it is −2.3 × 10¹⁰ J km−1 for cooling contrails. Although cooling contrails are associated with 20 % of contrail-forming flights, their relatively weak energy forcing leads to removing a total energy of 2.8 × 10¹⁸ J from the climate system, while warming contrails add 6.6 × 10¹⁹ J to it, i.e. 23 times more in absolute terms. It should be noted that the uncertainties associated with those energy forcing estimates are large. Uncertainties were estimated by Teoh et al. (2022) but are left out of the present analysis.
Contrail energy forcing and emitted CO2 are enough to calculate the radiative forcing of each flight but are not directly comparable quantities. So this study uses the OSCAR reduced-complexity Earth system model in its version 3.1.1 (Gasser et al., 2017a, 2020) to compute for each individual flight, with a 1-year time step, the time evolution of the globally averaged radiative forcing and the globally averaged surface temperature change that occurs in response to that forcing. For CO2, OSCAR computes the time evolution of stratospheric-adjusted radiative forcing (Hansen et al., 2005; Forster et al., 2007) from the provided flight CO2 emissions using a multi-region box model with the empirical formula for CO2 radiative forcing from Myhre et al. (2013). For contrails, energy forcing, in joules, is added to the climate system uniformly over 1 year, which is the time step of the model. That is done without geographical considerations. The use of instantaneous contrail RF (corresponding to EF) for contrails and the use of stratospheric-adjusted RF for CO2 are not inconsistent, as instantaneous RF and stratospheric-adjusted RF do not differ significantly for contrails (Dietmüller et al., 2016). OSCAR calculates the climate response to radiative forcing by using an impulse response function. The carbon cycle response to a pulse CO2 emission depends on the background concentration of CO2. That background concentration is simulated using the emission scenario SSP4-3.4 in our experiment, which is characterised by a low atmospheric CO2 concentration in comparison to the other pathways. However, conclusions are qualitatively independent of the chosen scenario.
Uncertainties in radiative forcing and surface temperature change calculated by OSCAR are assessed using a Monte Carlo approach based on 2000 simulations with different model parameters. We disregard 274 simulations that did not converge to a solution, which can arise with the Monte Carlo approach, and use the remaining 1726 simulations to provide the best estimate and standard deviation.
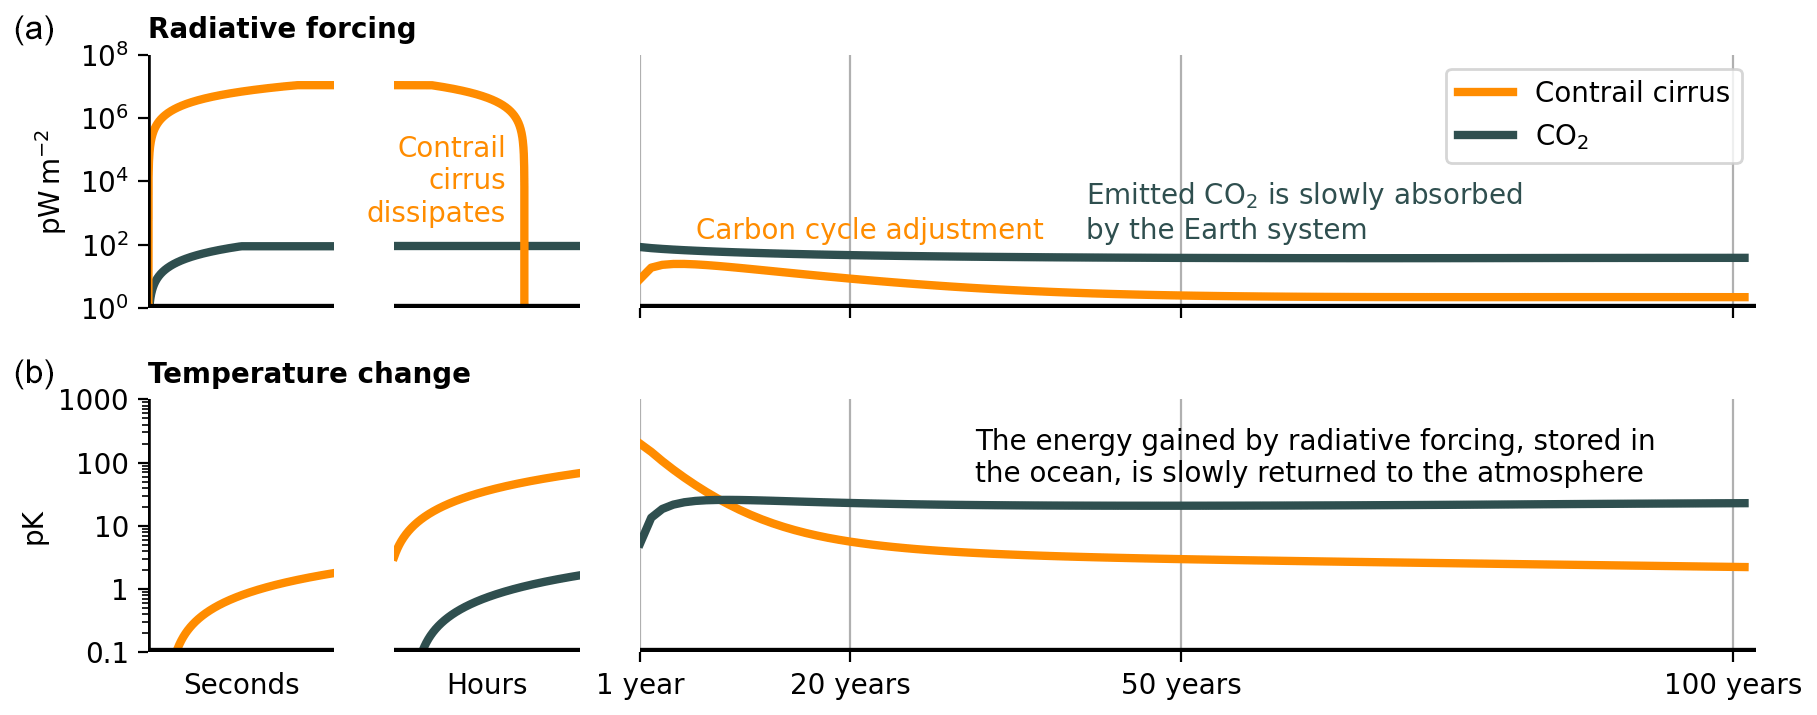
Figure 1Time evolution of (a) globally averaged effective radiative forcing (in pW m−2; 10−12 W m−2), and (b) global surface temperature change (in pK; 10−12 K), for a flight that emits 53 t of CO2 (grey) in the atmosphere and forms a contrail (orange) with an energy forcing of 2.9 × 10¹⁰ J km−1 over the whole 2450 km of its journey. Contrail efficacy is set to 0.37. Background CO2 concentrations follow the SSP4-3.4 scenario.
CoCiP and OSCAR do not simulate the tropospheric and stratospheric adjustments triggered by the contrail climate forcing. A contrail efficacy factor is used here for contrails and contrail cirrus to account for those adjustments: the contrail radiative forcing calculated by Teoh et al. (2022) is thus multiplied by contrail efficacy before being used in OSCAR. Contrail efficacy is divided into two parts: the ERF-to-RF ratio and the ERF-based efficacy, with ERF being the effective radiative forcing (Hansen et al., 2005; Ponater et al., 2021; Bickel, 2023). The ERF-to-RF ratio quantifies the atmospheric adjustments that follow contrail formation, i.e. changes in stratospheric and tropospheric temperature, humidity, or cloudiness that happen without large-scale changes in surface temperature (Sherwood et al., 2015). The ERF-based efficacy quantifies the ability of a unit of contrail ERF to change surface temperatures compared to a unit of CO2 ERF, noting that there is a small dependence on the efficacy of the assumed size of the CO2 perturbation (Hansen et al., 2005). It can differ from 1 because different ERF patterns trigger different surface temperature responses (e.g. Hansen et al., 2005; Shindell and Faluvegi, 2009; Richardson et al., 2019). Total contrail efficacy is the product of these two efficacies. It is set to 0.37 in this study, which is the average of the three available estimates in the literature, specifically 0.59 (Ponater et al., 2005), 0.31 (Rap et al., 2010), and 0.21 (Bickel, 2023). The same factor is assumed here to apply to all contrails, but it is likely that contrail efficacy varies depending on the location and time of a flight. Nevertheless, this assumption is adopted here in the context of this study, where results are considered an average over a population of North Atlantic flights. Contrail RF is multiplied with total contrail efficacy before running OSCAR and is taken into account in all the results in this study, in particular when using the AGWP (Fuglestvedt et al., 2003, their Eq. 7). The sensitivity of the climate outcome of contrail avoidance to the uncertainty in total contrail efficacy is investigated in Sect. 5.4.
The climate perturbations of CO2 and contrails are associated with very different timescales. These timescales are illustrated in an idealised but representative way by Fig. 1, which shows the radiative forcing and surface temperature response caused by a typical contrail-forming flight flying 2450 km in the Shanwick and Gander sectors of the North Atlantic. This typical segment of flight burns 17 t of kerosene and emits a total of 53 t of CO2 into the atmosphere. We assume in addition that the flight is responsible for forming a contrail cirrus with an energy per flown distance of 2.9 × 10¹⁰ J km−1, which is the median value for contrail-forming flights in the dataset.
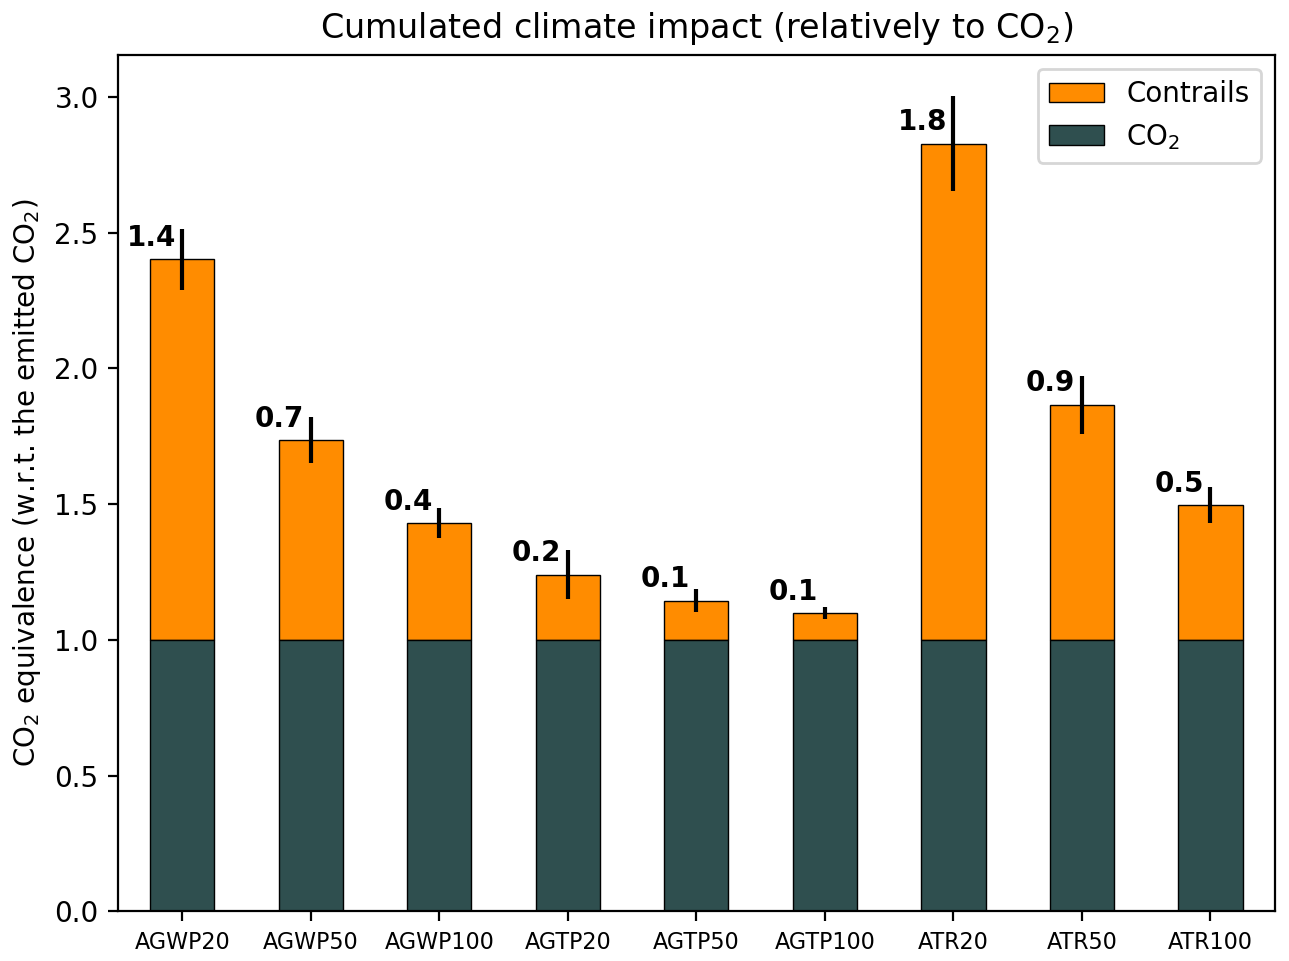
Figure 2CO2 equivalence of a median North Atlantic contrail with a contrail efficacy of 0.37 (orange) compared to the emitted CO2 during the median flight (grey) when using absolute global warming potential (AGWP), absolute global temperature change potential (AGTP), and average temperature response (ATR) with time horizons of 20, 50, and 100 years. Error bars quantify the 1σ uncertainty arising from the physical climate and carbon cycle of OSCAR, rather than uncertainties in the contrail radiative forcing and efficacy. The values at the top of each bar are the ratio of non-CO2 to CO2 effects for each metric choice.
The emission of CO2 molecules from kerosene combustion is instantaneous, while the formation of the ice crystals that form persistent contrails and contrail cirrus takes a few seconds (Kärcher, 2018). Both the CO2 molecules or ice crystals will exert a radiative forcing for as long as their respective atmospheric concentrations remain perturbed. The radiative forcing exerted by the contrail ice crystals, which is assumed in Fig. 1 to be positive, lasts up to 10–15 h (Kärcher, 2018), except for very small carbon cycle adjustments that develop over a few decades (Gasser et al., 2017b). In stark contrast, the emission of fossil CO2 causes an initial increase in the CO2 concentration in the atmosphere, and about 30 % of this increase persists after 100 years, and even about 20 % persists after 1000 years, thus exerting a radiative forcing long in the future (Archer et al., 2009; Joos et al., 2013). Note however that although the radiative forcing of contrail operates on a timescale orders of magnitude shorter than that of CO2, it is also orders of magnitude stronger.
The stark differences in CO2 and contrail radiative forcing timescales do not fully propagate to the temperature response (bottom row of Fig. 1) because the ocean absorbs the energy perturbation resulting from the radiative forcing over the time the forcing is exerted, increasing its heat content, before returning that heat to the atmosphere over several decades (Stjern et al., 2023). CO2 is associated with both short and long timescales because its radiative forcing is exerted over many years, effectively providing a slowly decreasing source of energy for the ocean to absorb and then release. The warming of contrails is felt by the climate system through the ocean response over several decades despite contrail cirrus only lasting for several hours. This long-term response is further amplified by so-called carbon cycle feedback, which causes the small increase in contrail radiative forcing that can be seen in Fig. 1 a few years after the contrail has dissipated. That feedback occurs because warming leads to a release of CO2, primarily through increased decomposition of soil organic matter, which in turn leads to more warming.
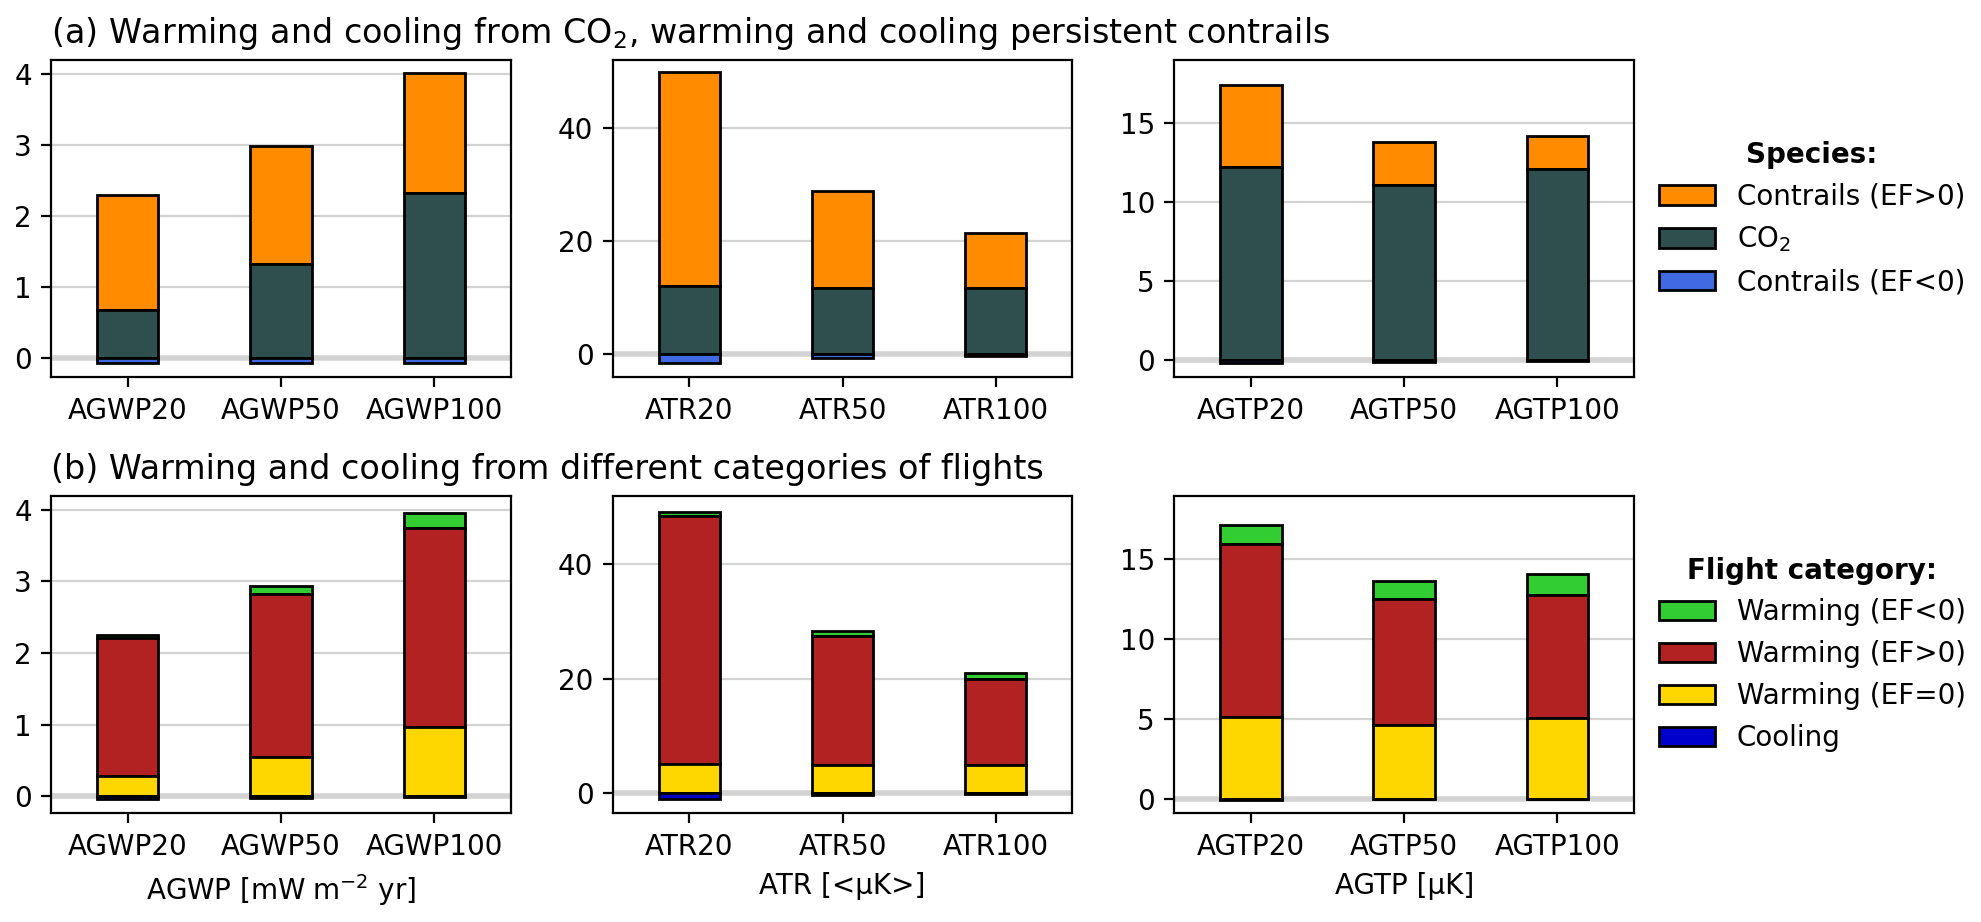
Figure 3Cumulative histogram of the warming or cooling by emitted CO2 and persistent contrails formed by the 477 923 flights that crossed the North Atlantic sector in 2019 (Teoh et al., 2022) for nine CO2-equivalence metrics. The first row (a) shows the decomposition into forcers: warming contrails (orange), CO2 (grey), and cooling contrails (blue). The second row (b) shows the decomposition into different categories of flights: warming flights that formed cooling contrails (green), warming flights that formed warming contrails (dark red), warming flights that did not form persistent contrails (yellow), and cooling flights (blue), including the effects of CO2 for those flights. The corresponding numbers are presented in Tables S1 and S2 in the Supplement.
This discussion of timescales already implies that the behaviour of CO2-equivalence metrics will depend on whether they are based on radiative forcing or temperature response and whether they are integrated or endpoint metrics. Figure 2 compares the multiplicative factors associated with the AGWP, AGTP, and ATR using the three time horizons, 20, 50, and 100 years, for the same flight presented in Fig. 1. Multiplicative factors are here presented relative to the emitted CO2, which is therefore given a value of 1. The values shown in Fig. 2 are about half of those in Table 5 of Lee et al. (2021) because this study assumes a contrail efficacy of 0.37 compared to 0.42 in Lee et al. (2021), but mostly because Lee et al. (2021) computes the mean over all flights, which gives an energy forcing of 3.6 × 10¹⁰ J km−1, while this study uses the median over contrail-forming flights, which is equal to 2.9 × 10¹⁰ J km−1. The distribution of contrail energy forcing per flown distance is strongly skewed by a few flights that form very strongly warming contrails; therefore, the mean radiative forcing is shifted toward higher values than the median. Figure 2 includes the uncertainty in the climate response obtained using the Monte Carlo approach described above, which does not account for the uncertainties in contrail ERF and its efficacy, which are both large. According to the 5 %–95 % confidence level in contrail cirrus ERF, as given by Lee et al. (2021) on the basis of the corresponding RF uncertainty, the contrail multiplicative factors could be between one-third and double the length shown in Fig. 2.
The largest CO2-equivalence metrics are obtained for a 20-year time horizon, regardless of the metric definition, and CO2-equivalence tends toward 1 when time horizon increases. From a radiative forcing point of view, this is because the AGWP of contrails only slightly increases once the contrail has dissipated due to the carbon cycle feedback, while the AGWP of CO2 keeps increasing with increasing time horizon. From a temperature response point of view, this is because the AGTP of contrails decays by 2 orders of magnitude after about 50 years. The AGWP20 and ATR20 of contrail cirrus are therefore large, ranging from 1.4 to 1.8 times the respective metric for CO2. If these larger values were used in a practical setting, they would indicate a larger perceived benefit of contrail avoidance. Overall, AGWP and ATR yield greater multiplicative factors than AGTP, which places emphasis on the longer-term warming (Fig. 1).
5.1 Assessment of an idealised contrail avoidance scenario
The OSCAR model is now run for each of the 477 923 flights in 2019 considered by Teoh et al. (2022), including 260 854 contrail-forming flights. Figure 3 shows the absolute climate impact of those flights for the nine CO2-equivalence metrics, for CO2 and contrails and different flight categories. Overall, we estimate that the CO2 emitted and the contrails formed by those flights will have warmed the climate by a total of 17.2 µK in 2039, 13.7 µK in 2069, and 14.1 µK in 2119, using AGTP. The 0.4 µK rise between 2069 and 2119 is due to CO2 and the chosen background scenario, SSP4-3.4, which assumes that CO2 concentration decreases after 2080 (Meinshausen et al., 2020). Because the dependence between radiative forcing and CO2 concentration is logarithmic (e.g. Etminan et al., 2016), emitted CO2 has an increased radiative forcing when the atmospheric concentration decreases. In this case, this increase is greater than the decrease from the removal of CO2 by the ocean and land surfaces, thus leading to a temperature increase from 11.0 µK in 2069 to 12.1 µK in 2119. During the same period, the warming originating from contrails decreases, from 2.7 to 2.1 µK. The ATR of CO2 averages out the small increases or decreases in temperature, being therefore almost constant at 11.7 〈µK〉, while the ATR of warming contrails decreases in time. Using AGWP, the impact of warming contrails is almost constant in time, because the contrail lifetime is much shorter than all considered time horizons, while the impact of CO2 increases with time.
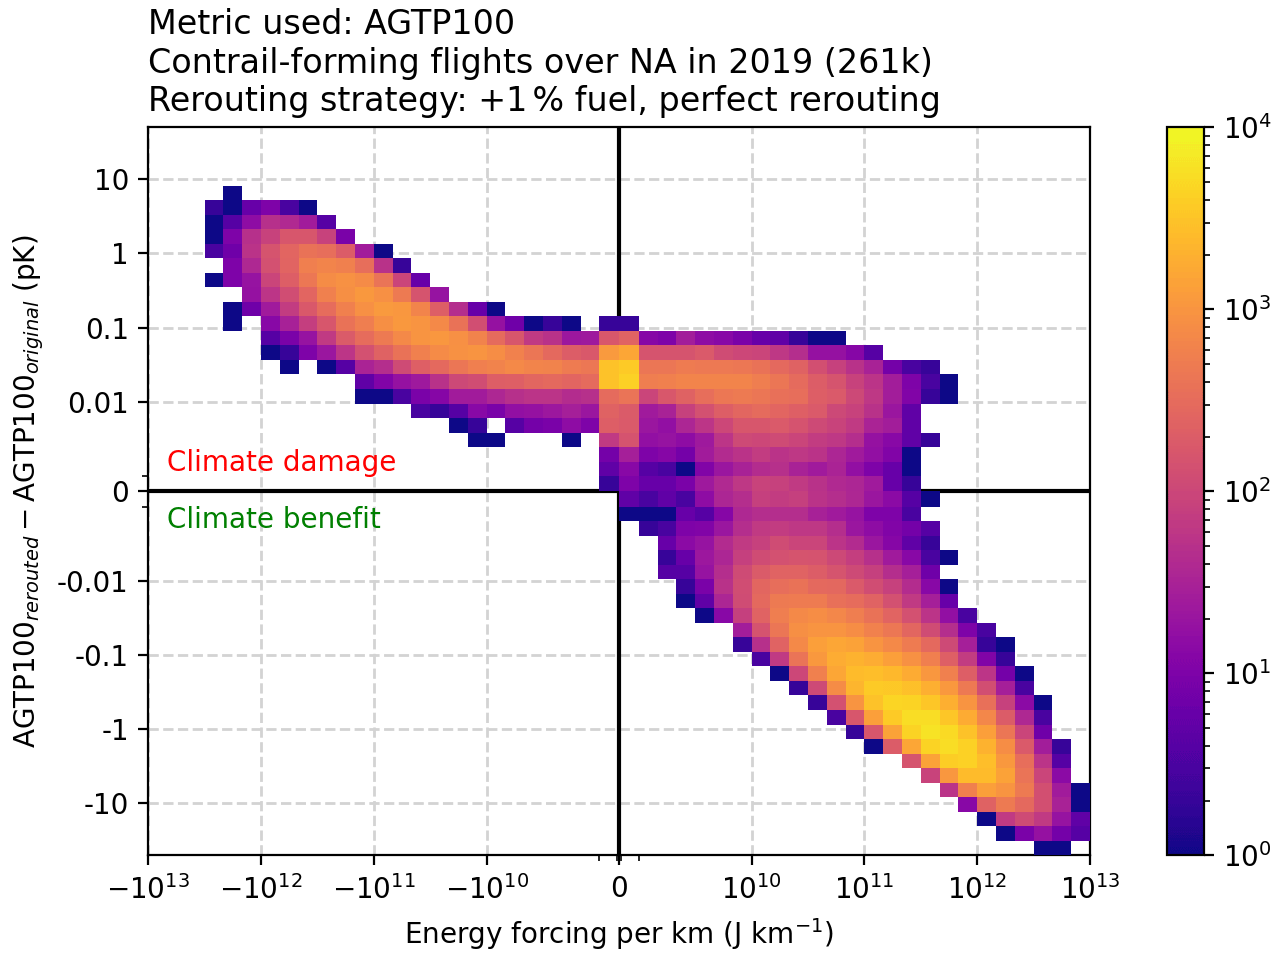
Figure 4Difference in AGTP100 between rerouted and original flights (in pK; 10−12 K), as a function of the energy forcing per persistent contrail distance of the original flight (in J km−1). Flights are all the contrail-forming flights that flew over the North Atlantic in 2019. Colours indicate the number of flights for each combination, for a total of 260 854 contrail-forming flights. The rerouted flights emit 1 % more CO2 but do not form a contrail. Contrail efficacy is set to 0.37. The same figures expressed in other CO2-equivalence metrics are in the Supplement.
Figure 3b shows that flights that form persistent warming contrails are responsible for 2.8 mW m−2 yr, 15.1 〈µK〉, and 7.7 µK of warming from both CO2 and contrails according to AGWP100, ATR100, and AGTP100. This corresponds to 71 %, 72 %, and 55 % of the warming from all flights, although flights that form persistent warming contrails only represent 44 % of the dataset. For AGWP20, ATR20, and AGTP20, the contributions become 1.9 mW m−2 yr, 43.4 〈µK〉, and 10.9 µK, respectively, corresponding to 87 %, 90 %, and 63 %, respectively, of the warming from all flights. The important decrease in the contribution from warming contrails with increasing time horizon indicates that the impact of flights forming warming contrails is largely dominated by the warming from these contrails, instead of the warming from CO2. This is because the warming from a persistent contrail decreases with time, relative to the warming from CO2.
In all panels, the impact of cooling contrails (Fig. 3a, blue bars) or cooling flights and warming flights with cooling contrails (Fig. 3b, blue and green bars) is limited, because the absolute total energy forcing from warming contrails is 23 times greater than that from cooling contrails. Total cooling from flights where contrail cooling exceeds CO2 warming offsets at most 2 % of total warming.
OSCAR is used again to simulate the hypothetical rerouted flights. For each contrail-forming flight, we assume that it is possible to reroute the flight to avoid forming the persistent contrail. In practice, the increase in flight time and distance would depend on the size of the ISSR in which the contrail is formed and whether it is avoided horizontally or vertically. But what matters here is the additional CO2 emitted by the rerouted flight. We set that additional CO2 to 1 % of the original flight emissions, which is in the range of increased fuel burn found in the case studies of Zengerling et al. (2023). In addition, fuel consumption and flight delays are both associated with large costs to airlines, so they might be unlikely to commit to larger increases. The additional CO2 due to the rerouting would in practice depend also on the initial trajectory flown, ambient wind fields, and aircraft characteristics (Irvine et al., 2014). Rerouting is assumed to have been successful with persistent contrail formation being completely avoided, although it should be noted that this assumption is overly optimistic and cannot be currently guaranteed in any realistic setting.
Figure 4 shows the climate outcome of the rerouting, calculated here as the difference in AGTP100 between the rerouted and original flight, as a function of the contrail energy forcing of the original flight. AGTP100 is taken here as the reference because it is by definition equal to the temperature change after 100 years, so is easy to interpret physically. Rerouting, done within the assumptions above, leads to climate benefit for 69 % of the contrail-forming flights (bottom right quadrant), for a total decrease in warming of 2.0 µK (−14 % compared to total warming from all original flights). Rerouting the remaining 31 % of the flights would damage the climate, for a total increase in warming of 0.1 µK (+0.7 % compared to total warming from all original flights). For those flights, the temperature change contribution by the rerouted flight is 5 % larger than that of the original flight, either because the original flight was cooling (top left quadrant) or because the contrail formed had a positive radiative forcing that is too weak to be worth the additional CO2 under the 1 % additional CO2 assumption (top right quadrant). Illustrative case studies to clarify the results shown in Fig. 4 are presented in the Supplement.
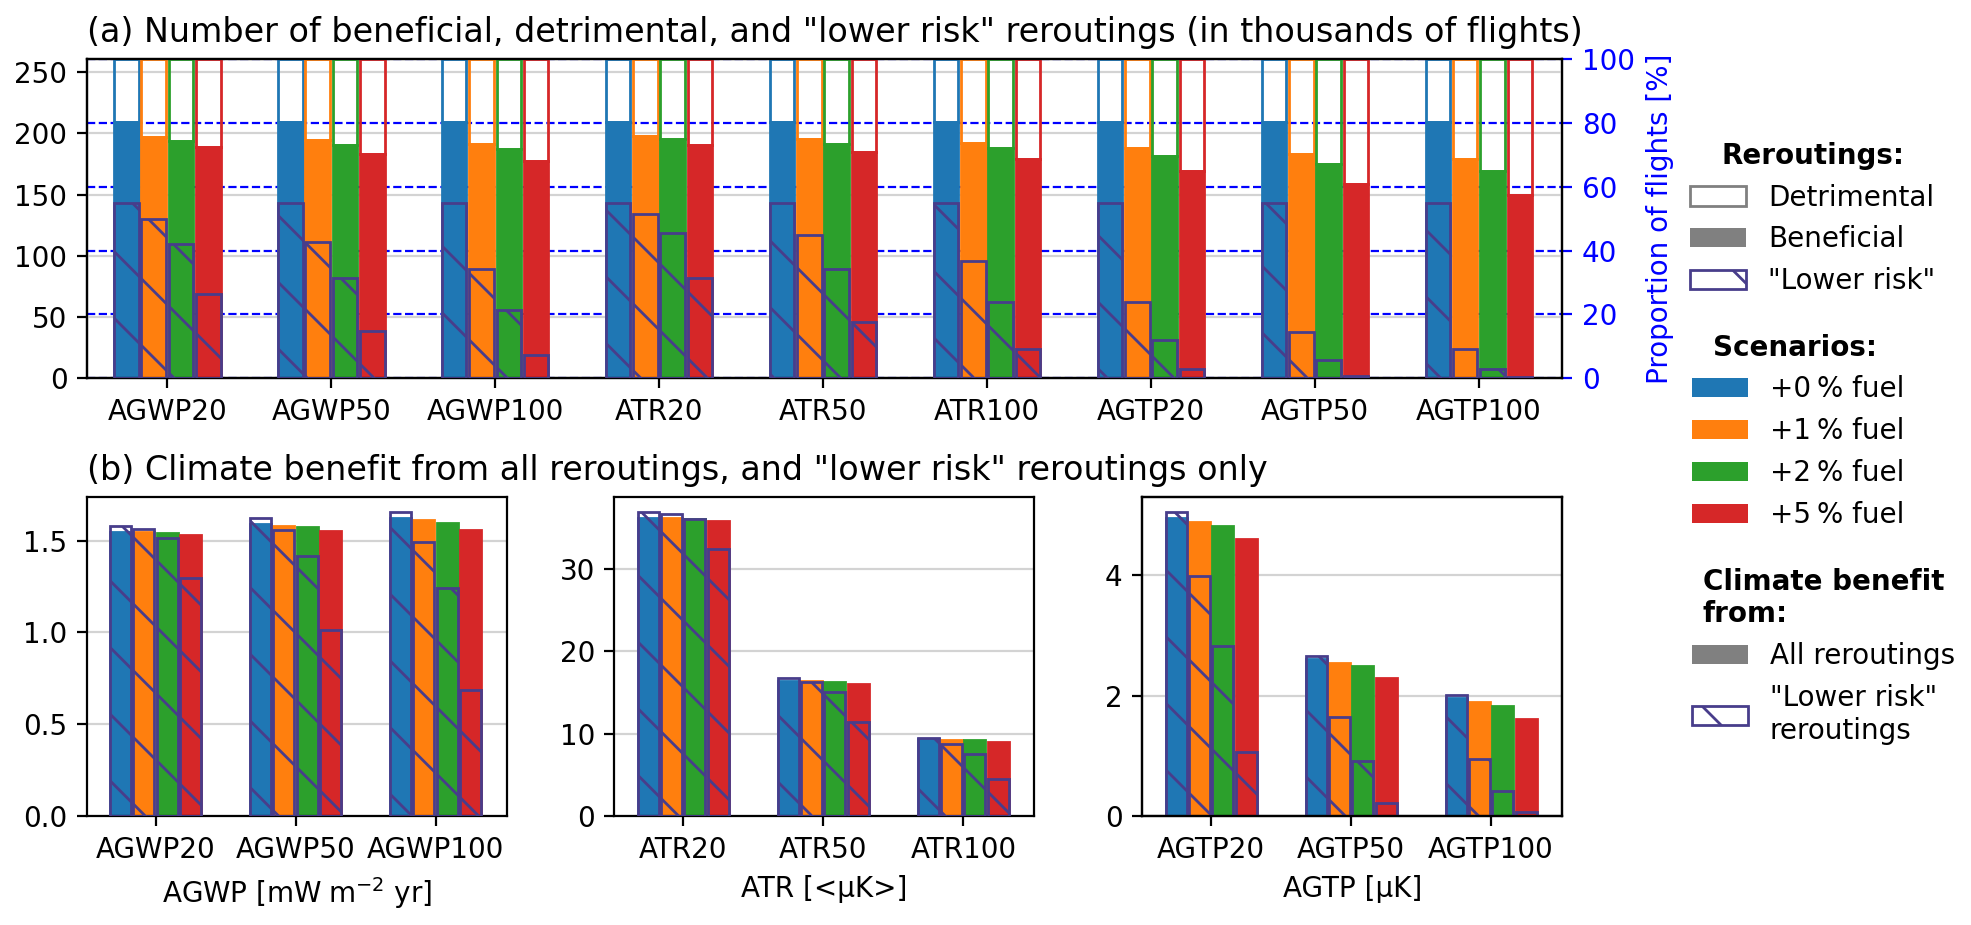
Figure 5(a) Number of flights flown over the North Atlantic in 2019, for a total of 260 854 contrail-forming flights, for which rerouting leads to climate benefit (colours) or climate damage (white) according to nine CO2-equivalence metrics and depending on the additional CO2 emitted to reroute. Colours indicate the amount of additional CO2 emitted to reroute: +0 % (blue), +1 % (orange), +2 % (green), and +5 % (red). Rerouting is assumed to be successful, so the rerouted flight does not form a contrail, and a contrail would have formed on the original route. “Lower risk” reroutings (see text) are marked with hatches. (b) Same as the first row but showing the climate benefit from rerouting all contrail-forming flights. The corresponding numbers are presented in Table S3 in the Supplement.
It could be of interest to focus on flights in the bottom right corner of Fig. 4 because their energy forcing might be sufficiently large to indicate with high likelihood that they do indeed warm the climate despite uncertainties in contrail EF. Such flights might be good candidates for “lower risk” contrail avoidance provided ISSR forecasts are reliable such that there is a lower risk to reroute these flights than others. That subset of flights can be selected in various ways. For example, selecting flights with an energy forcing per contrail length larger than 1011 J km−1 and whose climate benefit from contrail avoidance is 100 times larger than the climate damage from emitting 1 % more CO2 leaves 9.1 % of contrail-forming flights. They contribute 1.48 µK to the initial AGTP100, which is reduced to 0.53 µK after rerouting. In other words, those 9.1 % of flights represent 47 % of the potential climate benefit of contrail avoidance. However, as will be shown in the next subsection, the number of flights that match the selection criteria is a strong function of the choice of the CO2-equivalence metric. There are many other options that determine not only the level of ambition and complexity of the diversion, but also the climate benefit, which will be dependent on the CO2-equivalence metric used.
5.2 Sensitivity to the amount of additional CO2 emissions
So far, the rerouting scenario has assumed that contrails could be fully avoided by consuming 1 % more fuel. Additional fuel consumption is now set to 0 %, 2 %, and 5 % to cover the range of estimated additional fuel burn from the case studies of Zengerling et al. (2023). Results are shown in Fig. 5 for the nine CO2-equivalence metrics. Emitting more CO2 forces more flights into the climate damage category for all metrics, as defined in the previous subsection. Focusing on AGTP100, the effect is sizeable in terms of number of flights: at 5 % additional CO2, rerouting damages climate for 43 % of contrail-forming flights, 12 percentage points more than the assumption with 1 % additional CO2 (31 %). In the scenario where no additional CO2 is emitted, the number of reroutings that damage climate is decreased by 11 percentage points compared to the 1 % additional CO2 scenario, falling to 20 % of contrail-forming flights. These flights damage the climate because a cooling contrail is avoided. The number of “lower risk” reroutings is 5 times larger when no additional fuel is emitted compared to the +1 % fuel scenario. This is because our definition of “lower risk” reroutings relies on a maximum amount of additional fuel, and this condition is always met when no additional fuel is emitted.
Choosing a shorter time horizon enhances the perceived climate benefit but underestimates the long-term climate damage, as shown in Fig. 5b. Using AGTP20 and the 1 % additional CO2 scenario, 11 % fewer flights fall in the climate damage category than with AGTP100. Additionally, the climate benefit from all reroutings depends slightly on the fuel scenario, especially for CO2-equivalence metrics that put more weight on the impact of contrails, such as ATR20. However, “lower risk” reroutings depend much more on the scenario. For example for AGTP100, the number of “lower risk” reroutings is almost 0 in the +5 % scenario, indicating that although the perceived climate benefit is rather high, some reroutings could in fact lead to climate damage because of the uncertainties in contrail EF.
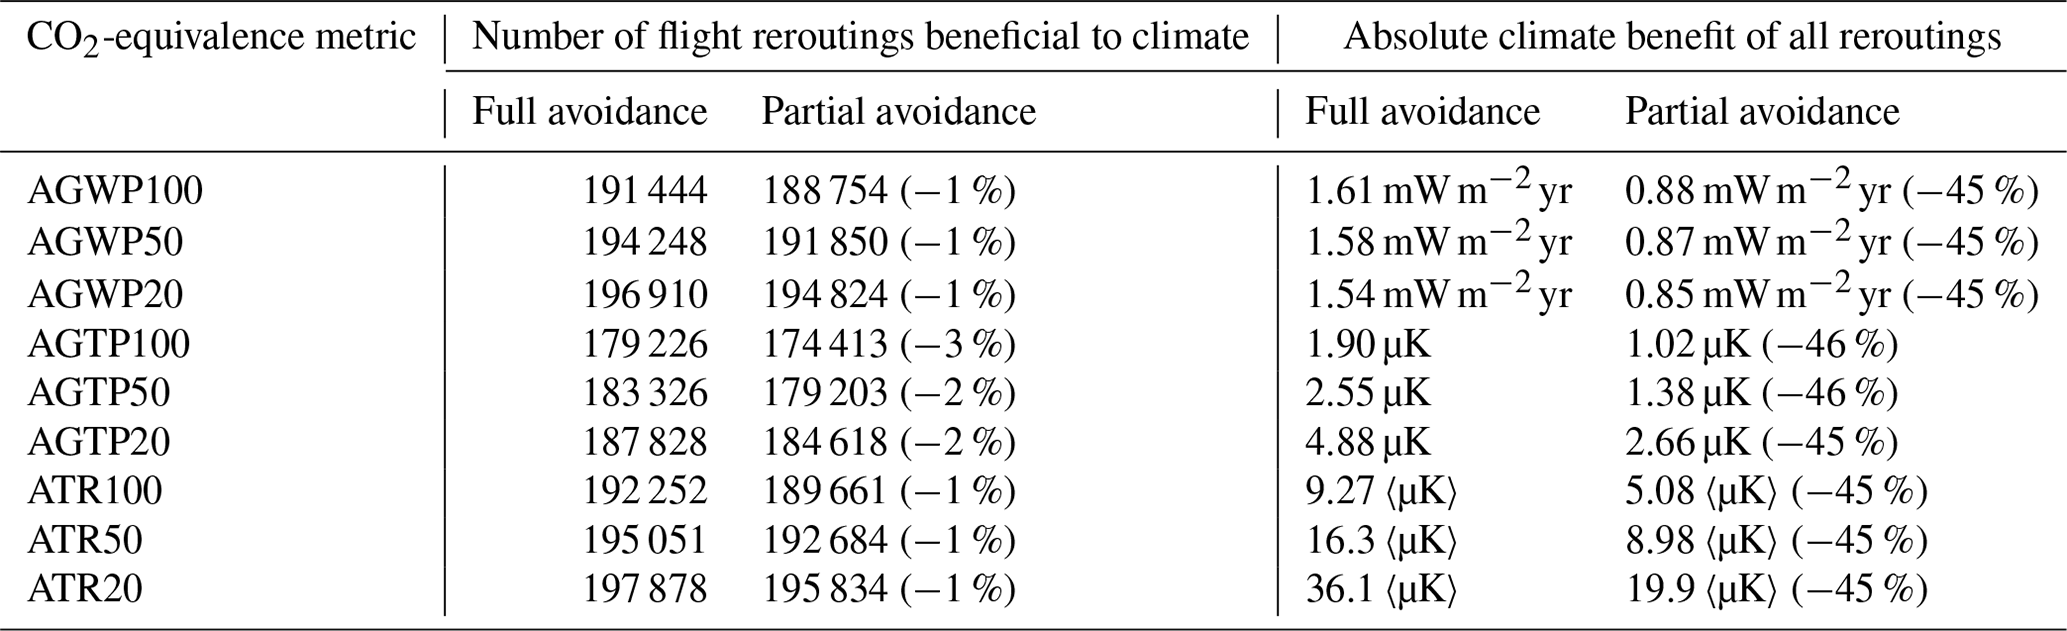
Table 1Number of flights flown over the North Atlantic in 2019, out of a total of 260 854 contrail-forming flights, whose rerouting is beneficial to climate, and absolute benefit of all reroutings (beneficial and detrimental to climate), assuming that contrail formation is fully or partially avoided (see text), as a function of the CO2-equivalence metric.
For a given CO2 scenario and for most contrail-forming flights, all CO2-equivalence metrics agree that rerouting would benefit climate. Disagreements between CO2-equivalence metrics happen for about 10 % of flights, which form low-energy contrails that do not contribute much to climate damage anyway. The range of contrail EF where at least one CO2-equivalence metric gives a different climate outcome of rerouting than the other metrics depends on the flight and CO2 scenario. For the median flight with 1 % additional CO2, that range spans 7 % of the contrail-forming flights, from the 24th to the 31st percentiles. This range represents very low-energy contrails, with EF per flown kilometre from 1.7 × 10⁸ to 3.1 × 10⁹ J km−1. However, the perceived climate benefit as shown in Fig. 5b depends greatly on the CO2-equivalence metric.
5.3 Sensitivity to partial contrail avoidance
The results presented in Fig. 5 are idealised because the additional CO2 is independent of the distance over which a contrail is formed. It is plausible that 1 % additional CO2, and indeed even 5 %, would not allow the complete avoidance of some contrails. Determining the best avoidance strategy for a given flight requires accurate forecasts of meteorological conditions for that flight, which is out of the scope of this study. There is no simple relationship between additional CO2 and contrail EF: ISSRs could be orthogonal to the plane trajectory and so difficult to avoid, or conversely vertical avoidance might be very easy, irrespective of contrail EF. There might also be cases where two different routes have very different ISSR occurrence but identical fuel burn.
But to illustrate the impact of partial contrail avoidance, we assume here that the longer the contrail, the more difficult it is to completely avoid. A rerouting efficiency factor is therefore calculated as the ratio of the contrail length to total distance flown for the original flight. For each rerouting, contrail energy forcing is inversely scaled by this rerouting efficiency factor, which is less than the 100 % efficiency assumed in the full contrail avoidance scenario. So rerouting efficiency is set to 0 % for a contrail that is as long as the flight length, meaning that the rerouting fails to reduce the energy forcing of the contrail. Rerouting efficiency will tend toward 100 % for contrails that are very small compared to the length of the flight, meaning that the contrail is fully avoided. For the contrail-forming flights flown over the North Atlantic in 2019, we calculate that the average rerouting efficiency for all reroutings would be 71 %, and the 5th and 95th percentiles are 31 % and 95 %, respectively.
Table 1 shows the number of reroutings beneficial to climate and the absolute benefit of all reroutings (both beneficial and detrimental to climate) as a function of the CO2-equivalence metric. For the sake of simplicity, the +1 % fuel scenario is used for all reroutings, and results for full and partial avoidance are compared. The total decrease in warming in 100 years (i.e. using AGTP100) is 1.02 µK, a reduction of 46 % compared with assuming a rerouting efficiency of 100 % for all flights, where total warming was decreased by 1.90 µK. That reduction is larger than the reduction in average rerouting efficiency, which is only 29 % (from 100 % to 71 %), because high-energy contrails are often longer than low-energy ones. Therefore, their rerouting efficiency is lower, although they contribute more to the absolute benefit of the rerouting. In contrast, the number of reroutings leading to climate benefit in terms of AGTP100 decreases by only 3 %, from 179 226 to 174 413. That is because reducing the climate impact of strongly warming contrails leads to a climate benefit even when that reduction is incomplete.
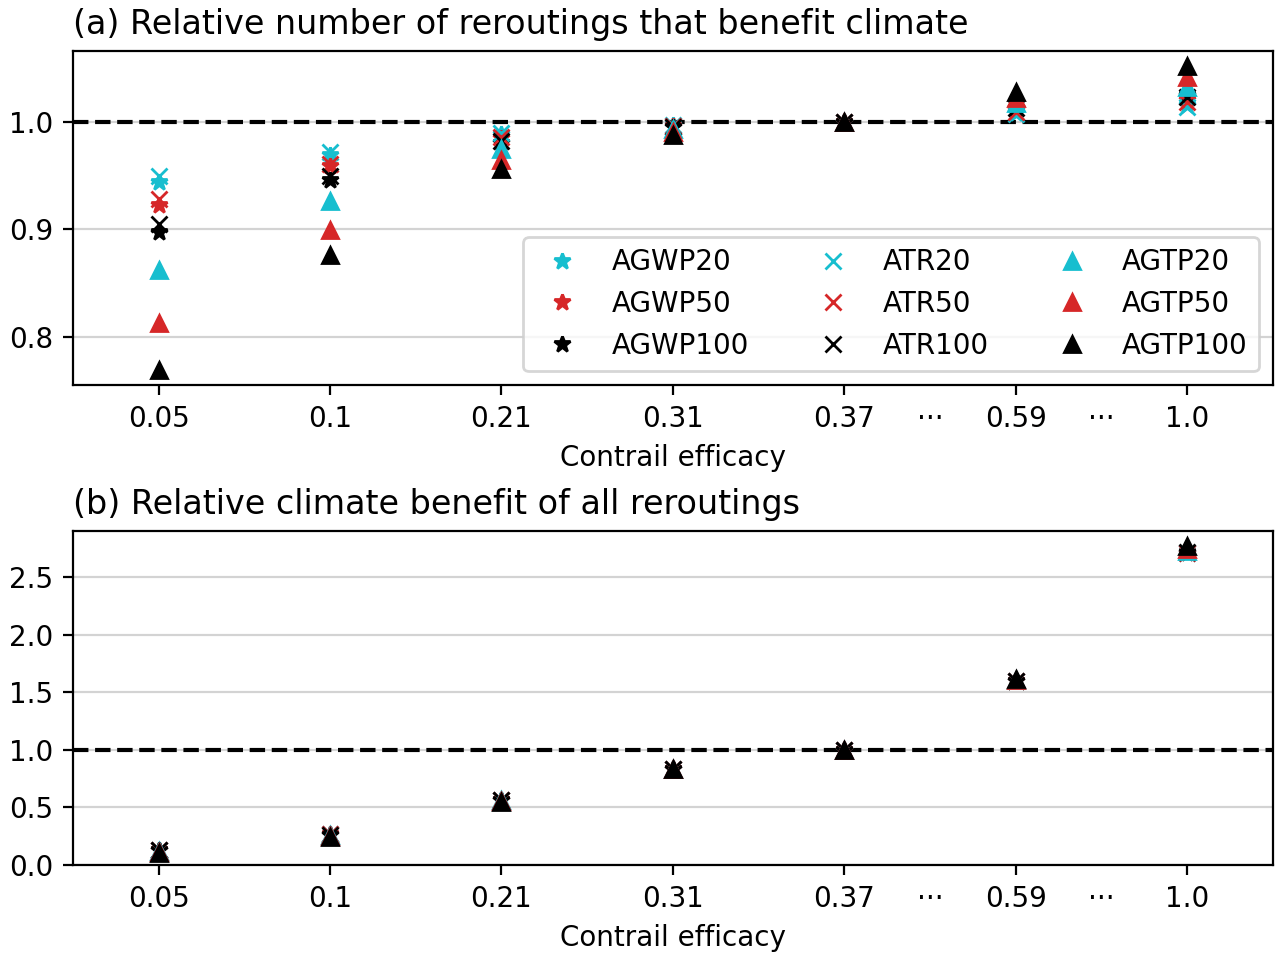
Figure 6Relative number of reroutings that benefit climate (a) and relative climate benefit of all reroutings (b), for the nine CO2-equivalence metrics considered in this study (colours and symbols) and as a function of contrail efficacy. Additional CO2 emitted is 1 %, and contrail avoidance is assumed to be complete. Values are normalised to the case where contrail efficacy is 0.37.
The relative decrease in climate benefit depends only slightly on the CO2-equivalence metric. The number of reroutings that benefit climate does not change much in this partial contrail avoidance calculation, ranging from −1 % to −3 %. This indicates that the previous finding that qualitative decision making is almost independent of the choice of CO2-equivalence metric remains valid. Moreover, the absolute benefit is reduced by around 45 % for all CO2-equivalence metrics. As we showed earlier in this section, this is because a large part of the absolute benefit comes from flights for which the impact of the additionally emitted CO2 is much lower than the impact of the avoided contrail. For these flights, CO2 is of secondary importance. Therefore, the CO2-equivalence metrics mostly quantify the climate outcome of contrail avoidance, which is reduced in a partial avoidance scenario.
5.4 Sensitivity to contrail efficacy
Contrail efficacy has been set so far to 0.37. To study the sensitivity of our results to that choice, contrail efficacy is varied from 1 to 0.05 by considering six values:
-
0.21, 0.31, and 0.59, which are the estimates from Bickel (2023), Rap et al. (2010), and Ponater et al. (2005), respectively, for the total contrail efficacy;
-
1.0, which is not supported by climate modelling but corresponds to a focus on contrail radiative forcing, rather than effective radiative forcing;
-
0.05 and 0.1, which are very low efficacies that might be possible if the lower end of the Bickel et al. (2020) confidence interval for the ERF-to-RF ratio were multiplied by an ERF-based efficacy of 0.38 (Bickel, 2023).
Figure 6a shows that the number of reroutings beneficial to climate does not change drastically between different choices of contrail efficacy. For contrail efficacies between 0.05 and 1, the maximum difference is 25 % for AGTP100 for a contrail efficacy of 0.05. This implies that contrail efficacy plays a minor role in the decision making of a rerouting: in the worst case, 75 % of the reroutings that benefit climate remain beneficial. This again comes from the fact that, most of the time and for all the CO2-equivalence metrics we investigated, a warming contrail warms the climate by a few orders of magnitude more than the additional CO2 emitted to avoid it.
In contrast, the perceived climate benefit associated with a rerouting depends highly on contrail efficacy. Figure 6b shows that the impact of contrail efficacy on the quantification of the climate benefit of reroutings is much larger. Climate benefit is more than 2.5 times larger for a contrail efficacy of 1 than for an efficacy of 0.37 and about 10 times smaller for a contrail efficacy of 0.05. It should be noted that this impact does not depend much on the CO2-equivalence metric, because the climate benefit of very high-energy contrails is much greater than the climate damage by the additionally emitted CO2. Therefore, changing the contrail efficacy by a given factor changes the absolute climate benefit by about the same factor, for all the considered metrics. However, this is only true when considering rerouted flights together, not on a flight-to-flight basis.
The different timescales of CO2 and contrail cirrus radiative forcing and temperature response cause different behaviours in CO2-equivalence metrics. Time-integrated metrics defined on a short time horizon, like AGWP20 or ATR20, put more weight on contrail cirrus, while endpoint metrics on a long time horizon, like AGTP100, put more weight on CO2. This behaviour, which had already been noted (e.g. Deuber et al., 2013; Irvine et al., 2014; Grewe et al., 2014), means that the choice of metric definition and time horizon can have implications for decision making related to contrail avoidance. Using an analysis of potential contrail avoidance strategies in the North Atlantic flight corridor, this study shows that the decision of whether to reroute a flight or not is generally independent of the choice of CO2-equivalence metric. This is because when a persistent warming contrail is formed, this contrail is often orders of magnitude more warming than the potential additional emission of CO2 to avoid its formation. In many of these situations, all the investigated metrics indicate that the flight should be rerouted, although the weight put on contrails is not the same.
The lack of consensus on what is a suitable or the correct CO2-equivalence metric is therefore not an obstacle to implementing contrail avoidance policies. However, the quantification of how much additional CO2 can be emitted on a rerouted flight and the resulting climate outcome of a rerouting both depend on that choice. For a flight for which all metrics agree that a rerouting would benefit climate, time-integrated metrics with short time horizons, like AGWP20 or ATR20, calculate a much greater apparent climate benefit than endpoint metrics with long time horizons like AGTP100, which in many situations indicates that the benefit is moderate. Assuming that additional CO2 emissions are fixed percentages of original emissions or an increasing function of contrail length does not change these findings. The same conclusion is also drawn when considering sensitivity to contrail efficacy: the number of reroutings that benefit climate is a weak function of contrail efficacy, but the size of the climate benefit is very dependent on contrail efficacy.
This study used the contrail energy forcing distribution from Teoh et al. (2022) computed with CoCiP (Schumann et al., 2012) as radiative forcing input to the OSCAR compact Earth system model (Gasser et al., 2020). Rerouting was represented in a simplified way because the knowledge of flight trajectories and meteorology has been lost into the contrail energy forcing distribution. Future studies should investigate more realistic cases, considering the meteorology and particularly the horizontal and vertical sizes and humidity profiles of ISSRs. However, our work shows that even a partially avoided contrail can be beneficial for the climate if the contrail is sufficiently warming (e.g. with a contrail energy forcing per contrail length greater than 1011 J km−1) and that many flights formed such contrails over the North Atlantic in 2019 (30 % of all flights for the latter condition). The contrail climate impact is often orders of magnitude greater than the impact of the additionally emitted CO2, so a rerouting can still be effective if it leads to the formation of much weaker contrails. Moreover, this study has assumed that contrail avoidance translates into unchanged or increased fuel burn and CO2 emissions. In fact, current flight trajectories are predominantly optimised to minimise total cost (including but not limited to fuel burn, airspace charges, and staff costs), so there is a possibility that rerouting flights to minimise in addition the climate impact by avoiding contrails could lead to a reduction in overall fuel burn for some flights (Dalmau et al., 2018).
This study focuses on the North Atlantic, so its results do not necessarily carry over to other regions which may have different characteristics, for example in the diurnal variation of air traffic, the probability of encountering ISSRs, the average altitude of flights, and the practicality and operational constraints of rerouting due to the volume of air traffic. However, the large difference between contrail warming and the additionally emitted CO2 seen for the most warming flights is likely a defining feature of such flights in any region, so the fundamental results are expected to remain valid.
Implementing a contrail avoidance scheme is likely to be complex because of the difficulties in predicting ISSRs (Gierens et al., 2020), the large uncertainties in calculating the radiative forcing of contrails (Wilhelm et al., 2021), or operational challenges with air traffic management. Sausen et al. (2023) found in a case study of contrail avoidance over the Netherlands that persistent contrails were not observed in about half the cases when they were forecast, which indicates the risk of unnecessary diversions. Lee et al. (2021) found a 5 %–95 % confidence level for contrail cirrus radiative forcing of 33 to 189 mW m−2. By contrast, the CO2 forcing is uncertain by only ± 10 % (31–38 mW m−2). This study considered uncertainties originating from the OSCAR climate model, which are comprised within a 10 % range, but did not account for uncertainties in contrail radiative forcing or ISSR prediction in the ERA5 reanalysis. On a flight-by-flight basis, rerouting would need to use operational weather forecasts rather than a reanalysis. However, such forecasts are known to have a greater uncertainty. So the jury is still out as to whether contrail avoidance has in practice the potential to substantially reduce the total radiative forcing of aviation and whether that reduction can be validated. One way to avoid dealing directly with uncertainty could be to target the subset of strongly warming contrails whose energy forcing is sufficiently strong to remain positive despite large contrail uncertainties, assuming these can be adequately forecast. But our results suggest that the number of flights selected in that way strongly depends on the choice of CO2-equivalence metrics. A cautious approach to select such flights could be to use AGTP100 to maximise the probability that the rerouting does indeed benefit climate. The next step is therefore to link the present analysis to estimates of contrail radiative forcing uncertainty and to use real cases of contrail avoidance reroutings to quantify the potential contrail energy forcing reduction with the corresponding additionally emitted CO2.
Which CO2-equivalence metric works best for contrail avoidance? This study offers some insights. In terms of choice of time horizon, rerouted flights can be perceived to be a climate benefit using short time horizons. However, an increasing proportion of these become climate damaging as the time horizon is increased, as shown in Fig. 5. Indeed, it has been noted that the use of GWP20 is equivalent to using a discount rate of more than 10 % (Sarofim and Giordano, 2018; Mallapragada and Mignone, 2020), which is much higher than the discount rate of 4 % to 5 % typically assumed for designing cost-effective mitigation scenarios using integrated assessment models (Emmerling et al., 2019). Furthermore, it can be argued that aviation would have to be at an advanced stage of decarbonisation, at least in some regions, to justify using a shorter time horizon than the 100 years used for surface emissions from other economic sectors. In terms of choice of metric definition, AGWP and ATR, which both involve a time integration over the time horizon, behave very similarly, both qualitatively and quantitatively. AGWP has the advantage over ATR of being less subject to uncertainties, whereas AGWP is less comprehensive than ATR in terms of the consideration of climate impacts. AGTP behaves differently from the other two metrics and generally predicts fewer positive climate outcomes of contrail avoidance. But it has the advantage of measuring surface temperature change, which is directly relevant to the warming target of the Paris Agreement.
Until such a political decision has been made, any proposed contrail avoidance schemes should, in addition to considering the many scientific uncertainties inherent in such schemes, consider a range of metrics and time horizons, such as those used in this study, to assess the robustness of rerouting decisions and to quantify the actual climate benefit. Such a recommendation has already been made (Levasseur et al., 2016; Cherubini et al., 2016; Jolliet et al., 2018) and applied (e.g. Tanaka et al., 2019; Reisinger et al., 2017; Tibrewal and Venkataraman, 2021) by the life cycle impact assessment community, which uses by consensus GWP100, GWP20, GTP100, and GTP20 in their assessments.
CO2 emission and contrail energy forcing data were made available from Roger Teoh (roger.teoh15@imperial.ac.uk; Teoh et al., 2020). The source code of OSCAR is available at https://github.com/tgasser/OSCAR (Gasser, 2023). Additional scripts and data are available upon request from the corresponding author.
The supplement related to this article is available online at: https://doi.org/10.5194/acp-24-9401-2024-supplement.
AB and NB conceptualised and conducted the study and prepared the manuscript. All the authors discussed and commented on the manuscript.
The contact author has declared that none of the authors has any competing interests.
Publisher's note: Copernicus Publications remains neutral with regard to jurisdictional claims made in the text, published maps, institutional affiliations, or any other geographical representation in this paper. While Copernicus Publications makes every effort to include appropriate place names, the final responsibility lies with the authors.
Audran Borella, Olivier Boucher, and Nicolas Bellouin acknowledge the support of the French Ministère de la Transition écologique et solidaire, with support from France's Plan National de Relance et de Résilience (PNRR) and the European Union's NextGenerationEU. Katsumasa Tanaka benefited from state assistance managed by the National Research Agency in France under the Programme d'Investissements d'Avenir.
This research has been supported by the Direction générale de l'aviation civile (grant no. DGAC 382 N2021-39) and the Agence Nationale de la Recherche (grant no. ANR-19-MPGA-0008).
This paper was edited by Martina Krämer and reviewed by Michael Ponater and one anonymous referee.
Allen, M. R., Shine, K. P., Fuglestvedt, J. S., Millar, R. J., Cain, M., Frame, D. J., and Macey, A. H.: A solution to the misrepresentations of CO2-equivalent emissions of short-lived climate pollutants under ambitious mitigation, npj Clim. Atmos. Sci., 1, 16, https://doi.org/10.1038/s41612-018-0026-8, 2018.
Allen, M. R., Peters, G. P., Shine, K. P., Azar, C., Balcombe, P., Boucher, O., Cain, M., Ciais, P., Collins, W., Forster, P. M., Frame, D. J., Friedlingstein, P., Fyson, C., Gasser, T., Hare, B., Jenkins, S., Hamburg, S. P., Johansson, D. J. A., Lynch, J., Macey, A., Morfeldt, J., Nauels, A., Ocko, I., Oppenheimer, M., Pacala, S. W., Pierrehumbert, R., Rogelj, J., Schaeffer, M., Schleussner, C. F., Shindell, D., Skeie, R. B., Smith, S. M., and Tanaka, K.: Indicate separate contributions of long-lived and short-lived greenhouse gases in emission targets, npj Clim. Atmos. Sci., 5, 1–4, https://doi.org/10.1038/s41612-021-00226-2, 2022.
Archer, D., Eby, M., Brovkin, V., Ridgwell, A, Cao, L., Mikolajewicz, U., Caldeira, K., Matsumoto, K., Munhoven, G., Montenegro, A., and Tokos, K.: Atmospheric lifetime of fossil fuel carbon dioxide, Annu. Rev. Earth Pl. Sc. 37, 117–134, https://doi.org/10.1146/annurev.earth.031208.100206, 2009.
Bickel, M.: Climate Impact of Contrail Cirrus, DLR-Forschungsbericht, DLR-FB-2023-14, Dissertation, Ludwig-Maximilians-Universität München, 133 S, https://doi.org/10.57676/mzmg-r403, 2023.
Bickel, M., Ponater, M., Bock, L., Burkhardt, U., and Reineke, S.: Estimating the effective radiative forcing of contrail cirrus, J. Climate, 33, 1991–2005, https://doi.org/10.1175/JCLI-D-19-0467.1, 2020.
Cherubini F., Fuglestvedt, J., Gasser, T., Reisinger, A., Cavalett, O., Huijbregts, M. A. J., Johansson, D. J. A., Jørgensen, S. V., Raugei, M., Schivley, G., Strømman, A. H., Tanaka, K., and Levasseur, A.: Bridging the gap between impact assessment methods and climate science, Environ. Sci. Policy, 64, 129–140, https://doi.org/10.1016/j.envsci.2016.06.019, 2016.
Collins, W. J. (B.), Frame, D. J., Fuglestvedt, J., and Shine, K. P.: Stable climate metrics for emissions of short and long-lived species – combining steps and pulses, Environ. Res. Lett., 15, 024018, https://doi.org/10.1088/1748-9326/ab6039, 2020.
Dallara, E. S., Kroo, I. M., and Waitz, I. A.: Metric for Comparing Lifetime average Climate Impact of Aircraft, AIAA J., 49, 1600–1613, https://doi.org/10.2514/1.J050763, 2011.
Dalmau, R., Melgosa, M., Vilardaga, S., and Prats, X.: A Fast and Flexible Aircraft Trajectory Predictor and Optimiser for ATM Research Applications. A: International Conference on Research in Air Transportation, “ICRAT 2018 – 8th International Conference for Research in Air Transportation, Castelldefels, Espanya, 26–29 June 2018”, p. 1–8, 2018.
Deuber, O., Matthes, S., Sausen, R., Ponater, M., and Ling, L.: A physical metric-based framework for evaluating the climate trade-off between CO2 and contrails – the case of lowering aircraft flight trajectories, Environ. Sci. Policy, 25, 176–185, https://doi.org/10.1016/j.envsci.2012.10.004, 2013.
Dhakal, S., Minx, J. C., Toth, F. L., Abdel-Aziz, A., Figueroa Meza, M. J., Hubacek, K., Jonckheere, I. G. C., Kim, Y.-G., Nemet, G. F., Pachauri, S., Tan, X. C., and Wiedmann, T.: 2022: Emissions Trends and Drivers, in: IPCC, 2022: Climate Change 2022: Mitigation of Climate Change. Contribution of Working Group III to the Sixth Assessment Report of the Intergovernmental Panel on Climate Change, edited by: Shukla, P. R., Skea, J., Slade, R., Al Khourdajie, A., van Diemen, R., McCollum, D., Pathak, M., Some, S., Vyas, P., Fradera, R., Belkacemi, M., Hasija, A., Lisboa, G., Luz, S., and Malley, J., Cambridge University Press, Cambridge, UK and New York, NY, USA, https://doi.org/10.1017/9781009157926.004, 2022.
Dietmüller, S., Jöckel, P., Tost, H., Kunze, M., Gellhorn, C., Brinkop, S., Frömming, C., Ponater, M., Steil, B., Lauer, A., and Hendricks, J.: A new radiation infrastructure for the Modular Earth Submodel System (MESSy, based on version 2.51), Geosci. Model Dev., 9, 2209–2222, https://doi.org/10.5194/gmd-9-2209-2016, 2016.
EASA: Updated analysis of the non-CO2 climate impacts of aviation and potential policy measures pursuant to the EU Emissions Trading System Directive Article 30(4), European Union Aviation Safety Agency, https://www.easa.europa.eu/en/document-library/research-reports/report-commission-european-parliament-and-council (last access: 17 October 2023), 192 pp, 2020.
Emmerling, J., Drouet, L., van der Wijst, K.-I., van Vuuren, D., Bosetti, V., and Tavoni, M.: The role of the discount rate for emission pathways and negative emissions, Environ. Res. Lett., 14, 104008, https://doi.org/10.1088/1748-9326/ab3cc9, 2019.
Etminan, M., Myhre, G., Highwood, E. J., and Shine, K. P.: Radiative forcing of carbon dioxide, methane, and nitrous oxide: A significant revision of the methane radiative forcing, Geophys. Res. Lett., 43, 12614–12623, https://doi.org/10.1002/2016gl071930, 2016.
European Commission: Directive 2003/87/EC of the European Parliament and of the Council of 13 October 2003 establishing a scheme for greenhouse gas emission allowance trading within the Community and amending Council Directive 96/61/EC, https://eur-lex.europa.eu/legal-content/EN/TXT/?uri=celex%3A32003L0087 (last access: 17 October 2023), 2003.
FAO: Methane emissions in livestock and rice systems – Sources, quantification, mitigation and metrics, FAO, Rome, https://doi.org/10.4060/cc7607en, 2023.
Forster, P., Ramaswamy, V., Artaxo, P., Berntsen, T., Betts, R., Fahey, D. W., Haywood, J., Lean, J., Lowe, D. C., Myhre, G., Nganga, J., Prinn, R., Raga, G., Schulz , M., and Van Dorland, R.: Changes in Atmospheric Constituents and in Radiative Forcing, in: Climate Change 2007: The Physical Science Basis. Contribution of Working Group I to the Fourth Assessment Report of the Intergovernmental Panel on Climate Change, edited by: Solomon, S., Qin, D., Manning, M., Chen, Z., Marquis, M., Averyt, K. B., Tignor , M., and Miller , H. L., Cambridge University Press, Cambridge, United Kingdom and New York, NY, USA, 2007.
Forster, P., Storelvmo, T., Armour, K., Collins, W., Dufresne, J.-L., Frame, D., Lunt, D. J., Mauritsen, T., Palmer, M. D., Watanabe, M., Wild, M., and Zhang, H.: The Earth's Energy Budget, Climate Feedbacks, and Climate Sensitivity, in: Climate Change 2021: The Physical Science Basis. Contribution of Working Group I to the Sixth Assessment Report of the Intergovernmental Panel on Climate Change, edited by: Masson-Delmotte, V., Zhai, P., Pirani, A., Connors, S. L., Péan, C., Berger, S., Caud, N., Chen, Y., Goldfarb, L., Gomis, M. I., Huang, M., Leitzell, K., Lonnoy, E., Matthews, J. B. R., Maycock, T. K., Waterfield, T., Yelekçi, O., Yu, R., and Zhou, B., Cambridge University Press, Cambridge, United Kingdom and New York, NY, USA, https://doi.org/10.1017/9781009157896.009, pp. 923–1054, 2021.
Friedlingstein, P., O'Sullivan, M., Jones, M. W., Andrew, R. M., Bakker, D. C. E., Hauck, J., Landschützer, P., Le Quéré, C., Luijkx, I. T., Peters, G. P., Peters, W., Pongratz, J., Schwingshackl, C., Sitch, S., Canadell, J. G., Ciais, P., Jackson, R. B., Alin, S. R., Anthoni, P., Barbero, L., Bates, N. R., Becker, M., Bellouin, N., Decharme, B., Bopp, L., Brasika, I. B. M., Cadule, P., Chamberlain, M. A., Chandra, N., Chau, T.-T.-T., Chevallier, F., Chini, L. P., Cronin, M., Dou, X., Enyo, K., Evans, W., Falk, S., Feely, R. A., Feng, L., Ford, D. J., Gasser, T., Ghattas, J., Gkritzalis, T., Grassi, G., Gregor, L., Gruber, N., Gürses, Ö., Harris, I., Hefner, M., Heinke, J., Houghton, R. A., Hurtt, G. C., Iida, Y., Ilyina, T., Jacobson, A. R., Jain, A., Jarníková, T., Jersild, A., Jiang, F., Jin, Z., Joos, F., Kato, E., Keeling, R. F., Kennedy, D., Klein Goldewijk, K., Knauer, J., Korsbakken, J. I., Körtzinger, A., Lan, X., Lefèvre, N., Li, H., Liu, J., Liu, Z., Ma, L., Marland, G., Mayot, N., McGuire, P. C., McKinley, G. A., Meyer, G., Morgan, E. J., Munro, D. R., Nakaoka, S.-I., Niwa, Y., O'Brien, K. M., Olsen, A., Omar, A. M., Ono, T., Paulsen, M., Pierrot, D., Pocock, K., Poulter, B., Powis, C. M., Rehder, G., Resplandy, L., Robertson, E., Rödenbeck, C., Rosan, T. M., Schwinger, J., Séférian, R., Smallman, T. L., Smith, S. M., Sospedra-Alfonso, R., Sun, Q., Sutton, A. J., Sweeney, C., Takao, S., Tans, P. P., Tian, H., Tilbrook, B., Tsujino, H., Tubiello, F., van der Werf, G. R., van Ooijen, E., Wanninkhof, R., Watanabe, M., Wimart-Rousseau, C., Yang, D., Yang, X., Yuan, W., Yue, X., Zaehle, S., Zeng, J., and Zheng, B.: Global Carbon Budget 2023, Earth Syst. Sci. Data, 15, 5301–5369, https://doi.org/10.5194/essd-15-5301-2023, 2023.
Fuglestvedt, J. S., Berntsen, T. K., Godal, O., Sausen, R., Shine, K. P., and Skodvin, T.: Metrics of Climate Change: Assessing Radiative Forcing and Emission Indices, Climatic Change, 58, 267–33, https://doi.org/10.1023/A:1023905326842, 2003.
Fuglestvedt, J. S., Shine, K. P., Berntsen, T., Cook, J., Lee, D. S., Stenke, A., Skeie, R. B., Velders, G. J. M. M., and Waitz, I. A.: Transport impacts on atmosphere and climate: metrics, Atmos. Environ., 44, 4648–4677, https://doi.org/10.1016/j.atmosenv.2009.04.044, 2010.
Gasser, T.: OSCAR, Github [code], https://github.com/tgasser/OSCAR, last access: 1 September 2023.
Gasser, T., Ciais, P., Boucher, O., Quilcaille, Y., Tortora, M., Bopp, L., and Hauglustaine, D.: The compact Earth system model OSCAR v2.2: description and first results, Geosci. Model Dev., 10, 271–319, https://doi.org/10.5194/gmd-10-271-2017, 2017a.
Gasser, T., Peters, G. P., Fuglestvedt, J. S., Collins, W. J., Shindell, D. T., and Ciais, P.: Accounting for the climate–carbon feedback in emission metrics, Earth Syst. Dynam., 8, 235–253, https://doi.org/10.5194/esd-8-235-2017, 2017b.
Gasser, T., Crepin, L., Quilcaille, Y., Houghton, R. A., Ciais, P., and Obersteiner, M.: Historical CO2 emissions from land use and land cover change and their uncertainty, Biogeosciences, 17, 4075–4101, https://doi.org/10.5194/bg-17-4075-2020, 2020.
Gierens, K., Schumann, U., Helten, M., Smit, H., and Marenco, A.: A distribution law for relative humidity in the upper troposphere and lower stratosphere derived from three years of MOZAIC measurements, Ann. Geophys., 17, 1218–1226, https://doi.org/10.1007/s00585-999-1218-7, 1999.
Gierens, K., Matthes, S., and Rohs, S.: How well can persistent contrails be predicted?, Aerospace, 7, 169, https://doi.org/10.3390/aerospace7120169, 2020.
Gillett, N. P. and Matthews, H. D.: Accounting for carbon cycle feedbacks in a comparison of the global warming effects of greenhouse gases, Environ. Res. Lett., 5, 034011, https://doi.org/10.1088/1748-9326/5/3/034011, 2010.
Grewe, V., Frömming, C., Matthes, S., Brinkop, S., Ponater, M., Dietmüller, S., Jöckel, P., Garny, H., Tsati, E., Dahlmann, K., Søvde, O. A., Fuglestvedt, J., Berntsen, T. K., Shine, K. P., Irvine, E. A., Champougny, T., and Hullah, P.: Aircraft routing with minimal climate impact: the REACT4C climate cost function modelling approach (V1.0), Geosci. Model Dev., 7, 175–201, https://doi.org/10.5194/gmd-7-175-2014, 2014.
Grewe, V., Gangoli Rao, A., Grönstedt, T., Xisto, C., Linke, F., Melkert, J., Middel, J., Ohlenforst, B., Blakey, S., Christie, S., Matthes, S., and Dahlmann, K.: Evaluating the climate impact of aviation emission scenarios towards the Paris agreement including COVID-19 effects, Nat. Commun., 12, 3841, https://doi.org/10.1038/s41467-021-24091-y, 2021.
Hansen, J., Sato, M., Ruedy, R., Nazarenko, L., Lacis, A., Schmidt, G. A., Russell, G., Aleinov, I., Bauer, M., Bauer, S., Bell, N., Cairns, B., Canuto, V., Chandler, M., Cheng, Y., Del Genio, A., Faluvegi, G., Fleming, E., Friend, A., Hall, T., Jackman, C., Kelley, M., Kiang, N., Koch, D., Lean, J., Lerner, J., Lo, K., Menon, S., Miller, R., Minnis, P., Novakov, T., Oinas, V., Perlwitz, Ja., Perlwitz, Ju., Rind, D., Romanou, A., Shindell, D., Stone, P., Sun, S., Tausnev, N., Thresher, D., Wielicki, B., Wong, T., Yao, M., and Zhang, S.: Efficacy of climate forcings, J. Geophys. Res., 110, D18104, https://doi.org/10.1029/2005JD005776, 2005.
ICCT: CO2 emissions from commercial aviation 2018, by: Graver, B., Zhang, K., and Rutherford, D., International Council on Clean Transportation, https://theicct.org/publication/co2-emissions-from-commercial-aviation-2018/ (last access: 17 October 2023), 2018.
Irvine, E. A., B. J. Hoskins, and Shine, K. P.: A simple framework for assessing the trade-off between the climate impact of aviation carbon dioxide emissions and contrails for a single flight, Environ. Res. Lett., 9, 064021, https://doi.org/10.1088/1748-9326/9/6/064021, 2014.
Jolliet, O., Antón, A., Boulay, A.-M., Cherubini, F., Fantke, P., Levasseur, A., McKone, T. E., Michelsen, O., Milà i Canals, L., Motoshita, M., Pfister, S., Verones, F., Vigon, B., and Frischknecht, R.: Global guidance on environmental life cycle impact assessment indicators: impacts of climate change, fine particulate matter formation, water consumption and land use, Int. J. Life. Cycle. Ass., 23, 2189–2207, https://doi.org/10.1007/s11367-018-1443-y, 2018.
Joos, F., Roth, R., Fuglestvedt, J. S., Peters, G. P., Enting, I. G., von Bloh, W., Brovkin, V., Burke, E. J., Eby, M., Edwards, N. R., Friedrich, T., Frölicher, T. L., Halloran, P. R., Holden, P. B., Jones, C., Kleinen, T., Mackenzie, F. T., Matsumoto, K., Meinshausen, M., Plattner, G.-K., Reisinger, A., Segschneider, J., Shaffer, G., Steinacher, M., Strassmann, K., Tanaka, K., Timmermann, A., and Weaver, A. J.: Carbon dioxide and climate impulse response functions for the computation of greenhouse gas metrics: a multi-model analysis, Atmos. Chem. Phys., 13, 2793–2825, https://doi.org/10.5194/acp-13-2793-2013, 2013.
Kärcher, B.: Formation and radiative forcing of contrail cirrus, Nat. Commun., 9, 1824, https://doi.org/10.1038/s41467-018-04068-0, 2018.
Lee, D. S., Fahey, D. W., Skowron, A., Allen, M. R., Burkhardt, U., Chen, Q., Doherty, S. J., Freeman, S., Forster, P. M., Fuglestvedt, J., Gettelman, A., De León, R. R., Lim, L. L., Lund, M. T., Millar, R. J., Owen, B., Penner, J. E., Pitari, G., Prather, M. J., Sausen, R., and Wilcox, L. J.: The contribution of global aviation to anthropogenic climate forcing for 2000 to 2018, Atmos. Environ., 244, 117834, https://doi.org/10.1016/j.atmosenv.2020.117834, 2021.
Levasseur, A., Cavalett, O., Fuglestvedt, J. S., Gasser, T., Johansson, D. J. A., Jørgensen, S. V., Raugei, M., Reisinger, A., Schivley, G., Strømman, A., Tanaka, K., and Cherubini, F.: Enhancing life cycle impact assessment from climate science: Review of recent findings and recommendations for application to LCA, Ecol. Indic., 71, 163–174, https://doi.org/10.1016/j.ecolind.2016.06.049, 2016.
Mallapragada, D. S. and Mignone, B. K.: A theoretical basis for the equivalence between physical and economic climate metrics and implications for the choice of Global Warming Potential time horizon, Climatic Change, 158, 107–124, https://doi.org/10.1007/s10584-019-02486-7, 2020.
Megill, L., Deck, K., and Grewe, V.: Alternative climate metrics to the Global Warming Potential are more suitable for assessing aviation non-CO2 effects, Commun. Earth Environ., 5, 249, https://doi.org/10.1038/s43247-024-01423-6, 2024.
Meinshausen, M., Nicholls, Z. R. J., Lewis, J., Gidden, M. J., Vogel, E., Freund, M., Beyerle, U., Gessner, C., Nauels, A., Bauer, N., Canadell, J. G., Daniel, J. S., John, A., Krummel, P. B., Luderer, G., Meinshausen, N., Montzka, S. A., Rayner, P. J., Reimann, S., Smith, S. J., van den Berg, M., Velders, G. J. M., Vollmer, M. K., and Wang, R. H. J.: The shared socio-economic pathway (SSP) greenhouse gas concentrations and their extensions to 2500, Geosci. Model Dev., 13, 3571–3605, https://doi.org/10.5194/gmd-13-3571-2020, 2020.
Myhre, G., Shindell, D., Bréon, F.-M., Collins, W., Fuglestvedt, J., Huang, J., Koch, D., Lamarque, J.-F., Lee, D., Mendoza, B., Nakajima, T., Robock, A., Stephens, G., Takemura, T., and Zhang, H.: Anthropogenic and natural radiative forcing, in: Climate change 2013: The physical science basis. Contribution of Working Group I to the Fifth Assessment Report of the Intergovernmental Panel on Climate Change, edited by: Stocker, T. F., Qin, D., Plattner, G. K., Tignor, M., Allen, S. K., Boschung, J., Nauels, A., Xia, Y., Bex, V., and Midgley, P. M., Cambridge University Press, Cambridge, United Kingdom and New York, NY, USA, https://doi.org/10.1017/cbo9781107415324.018, pp. 659–740, 2013.
Peters, G. P., Aamaas, B., Berntsen, T., and Fuglestvedt, J. S.: The integrated global temperature change potential (iGTP) and relationships between emission metrics, Environ. Res. Lett., 6 044021, https://doi.org/10.1088/1748-9326/6/4/044021, 2011.
Ponater, M., Marquart, S., Sausen, R., and Schumann, U.: On contrail climate sensitivity, Geophys. Res. Lett., 32, L10706, https://doi.org/10.1029/2005GL022580, 2005.
Ponater, M., Bickel, M., Bock, L., and Burkhardt, U.: Towards Determining the Contrail Cirrus Efficacy, Aerospace, 8, 42, https://doi.org/10.3390/aerospace8020042, 2021.
Ramaswamy, V., Collins, W., Haywood, J., Lean, J., Mahowald, N., Myhre, G., Naik, V., Shine, K. P., Soden, B., Stenchikov, G., and Storelvmo, T.: Radiative forcing of climate: The historical evolution of the radiative forcing concept, the forcing agents and their quantification, and applications, Meteor. Mon., 59, 14.1–14.101, https://doi.org/10.1175/AMSMONOGRAPHS-D-19-0001.1, 2018.
Rap, A., Forster, P. M., Haywood, J. M., Jones, A., and Boucher, O.: Estimating the climate impact of linear contrails using the UK Met Office climate model, Geophys. Res. Lett., 37, L20703, https://doi.org/10.1029/2010GL045161, 2010.
Reisinger A., Ledgard, S. F., and Falconer, S. J.: Sensitivity of the carbon footprint of New Zealand milk to greenhouse gas metrics, Ecol. Indic., 81, 74–82, https://doi.org/10.1016/j.ecolind.2017.04.026, 2017.
Richardson, T. B., Forster, P. M., Smith, C. J., Maycock, A. C., Wood, T., Andrews, T., Boucher, O., Faluvegi, G., Fläschner, D., Hodnebrog, Ø., Kasoar, M., Kirkevåg, A., Lamarque, J.-F., Mülmenstädt, J., Myhre, G., Olivié, D., Portmann, R. W., Samset, B. H., Shawki, D., Shindell, D., Stier, P., Takemura, T., Voulgarakis, A., and Watson-Parris, D.: Efficacy of Climate Forcings in PDRMIP Models, J. Geophys. Res.-Atmos., 124, 12824–12844, https://doi.org/10.1029/2019JD030581, 2019.
Sarofim, M. C. and Giordano, M. R.: A quantitative approach to evaluating the GWP timescale through implicit discount rates, Earth Syst. Dynam., 9, 1013–1024, https://doi.org/10.5194/esd-9-1013-2018, 2018.
Sausen, R., Hofer, S. M., Gierens, K. M., Bugliaro Goggia, L., Ehrmanntraut, R., Sitova, I., Walczak, K., Burridge-Diesing, A., Bowman, M., and Miller, N.: Can we successfully avoid persistent contrails by small altitude adjustments of flights in the real world?, Meteorol. Z., 33, 83–98, https://doi.org/10.1127/metz/2023/1157, 2023.
Schumann, U., Mayer, B., Graf, K., and Mannstein, H.: A Parametric Radiative Forcing Model for Contrail Cirrus, J. Appl. Meteorol. Climatol., 51, 1391–1406, https://doi.org/10.1175/JAMC-D-11-0242.1, 2012.
Sherwood, S. C., Bony, S., Boucher, O., Bretherton, C., Forster, P. M., Gregory, J. M., and Stevens, B.: Adjustments in the Forcing-Feedback Framework for Understanding Climate Change, Bull. Am. Meteorol. Soc., 96, 217–228, https://doi.org/10.1175/BAMS-D-13-00167.1, 2015.
Shindell, D. and Faluvegi, G.: Climate response to regional radiative forcing during the twentieth century, Nat. Geosci., 2, 294–300, https://doi.org/10.1038/ngeo473, 2009.
Shine, K. P.: The global warming potential—the need for an interdisciplinary retrial, Climatic Change, 96, 467–472, https://doi.org/10.1007/s10584-009-9647-6, 2009.
Shine, K. P., Derwent, R. G., Wuebbles, D. J., and Morcrette, J.-J.: Radiative Forcing of Climate, Chapter 2 of the First Assessment Report of the Intergovernmental Panel on Climate Change, Cambridge University Press, ISBN 0 521 40720 6, 1990.
Shine, K. P., Fuglestvedt, J. S., Hailemariam, K., and Stuber, N.: Alternatives to the Global Warming Potential for Comparing Climate Impacts of Emissions of Greenhouse Gases, Climatic Change, 68, 281–302, https://doi.org/10.1007/s10584-005-1146-9, 2005.
Stjern, C. W., Forster, P. M., Jia, H., Jouan, C., Kasoar, M. R., Myhre, G., Olivié, D., Quaas, J., Samset, B. H., Sand, M., Takemura, T., Voulgarakis, A., and Wells, C. D.: The time scales of climate responses to carbon dioxide and aerosols, J. Climate, 36, 3537–3551, https://doi.org/10.1175/JCLI-D-22-0513.1, 2023.
Szopa, S., Naik, V., Adhikary, B., Artaxo, P., Berntsen, T., Collins, W. D., Fuzzi, S., Gallardo, L., Kiendler-Scharr, A., Klimont, Z., Liao, H., Unger, N., and Zanis, P.: Short-Lived Climate Forcers, in: Climate Change 2021: The Physical Science Basis. Contribution of Working Group I to the Sixth Assessment Report of the Intergovernmental Panel on Climate Change, edited by: Masson-Delmotte, V., Zhai, P., Pirani, A., Connors, S. L., Péan, C., Berger, S., Caud, N., Chen, Y., Goldfarb, L., Gomis, M. I., Huang, M., Leitzell, K., Lonnoy, E., Matthews, J. B. R., Maycock, T. K., Waterfield, T., Yelekçi, O., Yu, R., and Zhou, B., Cambridge University Press, Cambridge, United Kingdom and New York, NY, USA, https://doi.org/10.1017/9781009157896.008, pp. 817–922, 2021.
Tanaka, K., Peters, G. P. and Fuglestvedt, J. S.: Policy update: Multicomponent climate policy: why do emission metrics matter?, Carbon Manag., 1, 191–197, https://doi.org/10.4155/cmt.10.28, 2010.
Tanaka, K., Cavalett, O., Collins, W. J., and Cherubini, F.: Asserting the climate benefits of the coal-to-gas shift across temporal and spatial scales, Nat. Clim. Change, 9, 389–396, https://doi.org/10.1038/s41558-019-0457-1, 2019.
Tanaka, K., Boucher, O., Ciais, P., Johansson, D. J. A., and Morfeldt, J.: Cost-effective implementation of the Paris Agreement using flexible greenhouse gas metrics, Sci. Adv., 7, eabf9020, https://doi.org/10.1126/sciadv.abf9020, 2021.
Teoh, R., Schumann, U., Majumdar, A., and Stettler, M. E. J.: Mitigating the Climate Forcing of Aircraft Contrails by Small-Scale Diversions and Technology Adoption, Environ. Sci. Technol., 54, 2941–2950, https://doi.org/10.1021/acs.est.9b05608, 2020.
Teoh, R., Schumann, U., Gryspeerdt, E., Shapiro, M., Molloy, J., Koudis, G., Voigt, C., and Stettler, M. E. J.: Aviation contrail climate effects in the North Atlantic from 2016 to 2021, Atmos. Chem. Phys., 22, 10919–10935, https://doi.org/10.5194/acp-22-10919-2022, 2022.
Teoh, R., Engberg, Z., Shapiro, M., Dray, L., and Stettler, M.: A high-resolution Global Aviation emissions Inventory based on ADS-B (GAIA) for 2019–2021, EGUsphere [preprint], https://doi.org/10.5194/egusphere-2023-724, 2023.
Tibrewal, K. and Venkataraman, C.: Climate co-benefits of air quality and clean energy policy in India, Nat. Sustain., 4, 305–313, https://doi.org/10.1038/s41893-020-00666-3, 2021.
UNFCCC: Decision 4/CP.1 Methodological issues, United Nations Framework Convention on Climate Change, https://unfccc.int/decisions?f%5B0%5D=session%3A3851 (last access: 17 October 2023), 63 pp, 1995.
UNFCCC: Report of the Conference of the Parties serving as the meeting of the Parties to the Paris Agreement on the third part of its first session, held in Katowice from 2 to 15 December 2018, Addendum 2. Part two: Action taken by the Conference of the Parties serving as the meeting of the Parties to the Paris Agreement (FCCC/PA/CMA/2018/3/Add.2 2019), United Nations Framework Convention on Climate Change, https://unfccc.int/sites/default/files/resource/cma2018_3_add2_new_advance.pdf (last access: 12 December 2023), 65 pp, 2019.
Wang, Z., Bugliaro, L., Jurkat-Witschas, T., Heller, R., Burkhardt, U., Ziereis, H., Dekoutsidis, G., Wirth, M., Groß, S., Kirschler, S., Kaufmann, S., and Voigt, C.: Observations of microphysical properties and radiative effects of a contrail cirrus outbreak over the North Atlantic, Atmos. Chem. Phys., 23, 1941–1961, https://doi.org/10.5194/acp-23-1941-2023, 2023.
Wilhelm, L., Gierens, K., and Rohs, S.: Weather Variability Induced Uncertainty of Contrail Radiative Forcing, Aerospace, 8, 332, https://doi.org/10.3390/aerospace8110332, 2021.
Zengerling, Z. L., Linke, F., Weder, C. M., Dietmüller, S., Matthes, S., and Peter, P.: Flying low and slow: Application of algorithmic climate change functions to assess the climate mitigation potential of reduced cruise altitudes and speeds on different days, Meteorol. Z., 33, 67–81, https://doi.org/10.1127/metz/2023/1194, 2023.