the Creative Commons Attribution 4.0 License.
the Creative Commons Attribution 4.0 License.
 | 22 Jan 2024
Contribution of intermediate-volatility organic compounds from on-road transport to secondary organic aerosol levels in Europe
Stella E. I. Manavi
Spyros N. Pandis
Atmospheric organic compounds with an effective saturation concentration (C∗) at 298 K between 103 and 106 µg m−3 are called intermediate-volatility organic compounds (IVOCs), and they have been identified as important secondary organic aerosol (SOA) precursors. In this work, we simulate IVOCs emitted from on-road diesel and gasoline vehicles over Europe with a chemical transport model (CTM), utilizing a new approach in which IVOCs are treated as lumped species that preserve their chemical characteristics. This approach allows us to assess both the overall contribution of IVOCs to SOA formation and the role of specific compounds. For the simulated early-summer period, the highest concentrations of SOA formed from the oxidation of on-road IVOCs (SOA-iv) are predicted for major European cities, like Paris, Athens, and Madrid. In these urban environments, on-road SOA-iv can account for up to a quarter of the predicted total SOA. Over Europe, unspeciated cyclic alkanes in the IVOC range are estimated to account for up to 72 % of the total on-road SOA-iv mass, with compounds with 15 to 20 carbons being the most prominent precursors. The sensitivity of the predicted SOA-iv concentrations to the selected parameters of the new lumping scheme is also investigated. Active multigenerational aging of the secondary aerosol products has the most significant effect as it increases the predicted SOA-iv concentrations by 67 %.
- Article
(3414 KB) - Full-text XML
-
Supplement
(2145 KB) - BibTeX
- EndNote


Atmospheric particles, especially fine particles with a diameter of 2.5 µm or less (PM2.5), have significant adverse effects on human health (Chen and Hoek, 2020; Pond et al., 2021) and also affect the energy balance of our planet. Organic aerosol (OA) is often the most important constituent of PM2.5 (Zhang et al., 2007). When OA is directly emitted in the particulate phase it is called primary (POA), whereas when it is formed through the condensation of oxidation products of organic vapors it is characterized as secondary (SOA). Volatile organic compounds (VOCs) have been traditionally considered the main SOA precursors, and their role has been the topic of studies for more than 50 years. Although atmospheric measurements have shown that SOA often comprises 60 %–90 % of OA, air quality models often underestimate both the concentrations and the oxidation state of SOA (Zhang et al., 2007; Zhang and Seinfeld, 2013; Couvidat et al., 2013; Hayes et al., 2015; An et al., 2023). Several studies have proposed that accounting for the formation of secondary PM from the oxidation of intermediated volatility organic compounds (IVOCs) can bridge the gap between measured and model-predicted SOA concentrations (Robinson et al., 2007; Pye and Seinfeld, 2010; Barsanti et al., 2013; Ait-Helal et al., 2014; Jathar et al., 2014; Ots et al., 2016; B. Zhao et al., 2016; Giani et al., 2019; Lu et al., 2020; Ling et al., 2022: An et al., 2023).
IVOCs are atmospheric organic gases with an effective saturation concentration (C∗) at 298 K between 103 and 106 µg m−3, and they occupy four volatility bins in the logarithmically spaced volatility basis set (VBS) (Donahue et al., 2006; Robinson et al., 2007). This volatility range roughly corresponds to compounds with 12 to 22 carbons, including intermediate length alkanes (linear, branched, cyclic); small polycyclic aromatic hydrocarbons (PAHs); and aromatics and oxidized species such as phenols, furans, ketones, and esters. Smog chamber experiments have suggested that IVOCs can be an important class of SOA precursors as their yields are higher compared to those of VOCs (Chan et al., 2009; Presto et al., 2009; Tkacik et al., 2012; Docherty et al., 2021). Moreover, IVOCs have been detected in the emissions of mobile sources, such as on-road and off-road diesel and gasoline vehicles (Schauer et al., 1999; Gordon et al., 2014; Zhao et al., 2014, 2015, 2016; Drozd et al., 2019; Tang et al., 2021), aircraft (Presto et al., 2011) and ship engines (Huang et al., 2018; Lou et al., 2019; Su et al., 2020) and other sources, such as biomass burning (Schauer et al., 2001; Ciarelli et al., 2017b; Hatch et al., 2017; Qian et al., 2021) and consumer products (Li et al., 2018; Seltzer et al., 2021).
Until recently, a combination of measurement and modeling challenges has prevented the simulation of the SOA formed from the oxidation of IVOCs (SOA-iv) in chemical transport models (CTMs). Most existing emissions inventories do not include IVOCs as identifying and quantifying their emissions remains challenging. There are hundreds of organic compounds and their isomers in the IVOC range,and they are difficult to speciate using traditional gas chromatography techniques. The majority of the emitted IVOCs is reported as an unresolved complex mixture (UCM) of co-eluting compounds (Schauer et al., 1999, 2001). For example, speciated compounds (n-alkanes, b-alkanes, n-alkylcyclohexanes, n-alkylbenzenes, and PAHs) constituted less than 10 % of the total IVOC mass emitted from on-road diesel vehicles (Zhao et al., 2015). For other mobile sources like ocean-going vessels, speciated compounds contributed on average 13 % of the total IVOC mass (Lou et al., 2019), while for stationary sources like coal combustion, 27 % of the measured IVOC mass was attributed to speciated compounds (Qian et al., 2021). Besides the lack of adequate emission rates, insufficient chemical characterization of the UCM limits our ability to determine necessary SOA formation parameters, like SOA yields, vaporization enthalpies, and reaction rate constants.
Zhao et al. (2014) developed a method to estimate the emission factors (EFs) and the chemical characteristics of the UCM components. At first the UCM mass is separated into 11 bins (B12–B22) across the volatility range, with each bin corresponding to the retention time of an n-alkane (C12–C22), and then it is further separated into two chemical groups, one representing unspeciated branched alkanes and one representing unspeciated cyclic compounds. The same approach was used by other studies to determine the EFs of 79 speciated and unspeciated IVOCs from on-road and off-road diesel and gasoline vehicles (Zhao et al., 2015, 2016; Tang et al., 2021; Fang et al., 2021), non-road construction machinery (Qi et al., 2019), residential solid-fuel combustion (Qian et al., 2021), vessel engines (Huang et al., 2018; Lou et al., 2019; Su et al., 2020), and in-field measurements (Li et al., 2019). Recently, Huo et al. (2021) analyzed samples from household biomass and coal burning using two-dimensional gas chromatography–time-of-flight mass spectrometry techniques and developed a new method for further speciating the emitted UCM mass. This approach reduced the unspeciated mass to 2 % of the total measured IVOCs and provided additional insights about the chemical characteristics of the UCM from these sources.
Previous modeling studies have estimated IVOC emissions based on known emissions of other species emitted from the same source. Robinson et al. (2007) estimated IVOC emissions in the eastern United States by multiplying the assumed non-volatile and non-reactive POA within the emission inventory with a factor of 1.5. This 1.5 IVOC-to-POA emissions ratio is a zeroth-order assumption based on measurements of diesel emissions (Schauer et al., 1999). A number of subsequent studies have used the same or different ratios to estimate IVOC emissions both from on-road transportation and from other sources (Murphy and Pandis, 2009, 2010; Tsimpidi et al., 2010; Koo et al., 2014; Jathar et al., 2011; Ots et al., 2016; B. Zhao et al., 2016; Li et al., 2020; Huang et al., 2021; Wu et al., 2021). Another approach for calculating the IVOC emissions is using an IVOC-to-VOC emissions ratio (Ots et al., 2016; Sartelet et al., 2018; Hodzic et al., 2016; Jathar et al., 2014; Lu et al., 2020; Miao et al., 2021). It is also possible to use a combination of the two ratios to estimate the emissions from different sources (Hodzic et al., 2016; Jathar et al., 2017; Giani et al., 2019; Lannuque et al., 2020). The choice of IVOC-to-POA or IVOC-to-VOC ratio for the estimation of the IVOC emissions may depend on the source of interest. For example, Zhao et al. (2015) found that in diesel vehicle emissions there is a strong correlation between IVOCs and VOCs, whereas Huang et al. (2018) suggested that in ship engines the relation between IVOCs and POA is stronger.
The first implementations of SOA-iv formation in CTMs were based on the one-dimensional volatility basis set (1D-VBS), in which IVOCs are simulated using four surrogate species occupying the four highest volatility bins (C∗ equal to 103, 104, 105, and 106 µg m−3) of the VBS framework (Donahue et al., 2006; Robinson et al., 2007; Murphy and Pandis, 2009; Tsimpidi et al., 2010; Jathar et al., 2011; Fountoukis et al., 2011; Li et al., 2020). In the original 1D-VBS, each of the four IVOC surrogate species reacts in the gas phase, with the OH radical forming less volatile products which can then partition to the particulate phase, forming SOA-iv. Koo et al. (2014) proposed the 1.5D-VBS, a modified approach in which secondary products retain information about both their volatility and their oxidation state (O:C) (Ots et al., 2016; Ciarelli et al., 2017; Jathar et al., 2017; Giani et al., 2019; Huang et al., 2021). In the 1.5D-VBS of Koo et al. (2014), all IVOCs are represented using a single surrogate compound that contributes to the formation of four semi-volatile products (the same four products are also used to represent the oxidation products of the VOC precursors). By assuming that all IVOCs are only characterized by their volatility and that they follow the same oxidation path, these highly parametrized schemes cannot reproduce the chemical diversity of the individual IVOCs encountered in the atmosphere. A few studies improved the depiction of IVOC chemistry using surrogate species such as naphthalene (Pye and Seinfeld, 2010; Miao et al., 2021) or n-pentadecane (Ots et al., 2016) to represent all IVOCs. However, the wide range of IVOCs present in the atmosphere was still oversimplified in these studies. Lu et al. (2020) improved the simulation of IVOCs emitted from mobile sources (diesel, gasoline, and aircraft) in the 1.5D-VBS approach by substituting the single IVOC surrogate with six new lumped species, which were characterized by their volatility and their chemical characteristics. The new lumping scheme and the developed semi-empirical SOA-iv formation parametrization were based on the experiments of Zhao et al. (2015, 2016). Including SOA-iv formed from mobile sources reduced the gap between measured and model-predicted SOA concentration, and the remaining difference was attributed to IVOCs emitted from other non-mobile sources. Pennington et al. (2021) extended the lumping scheme of Lu et al. (2020) to include IVOCs from consumer and industrial products based on the emissions inventory developed by Seltzer et al. (2021).
A number of studies have simulated the effect of IVOCs on SOA formation over both the whole European domain (Fountoukis et al., 2011; Lannuque et al., 2020) and specific European cities and regions (Ots et al., 2016; Sartelet et al., 2018; Giani et al., 2019). Although the incorporation of IVOCs could not completely bridge the gap between measured and predicted OA concentrations, it significantly improved the model's performance for the SOA concentrations over Europe. Lannuque et al. (2020) showed that SOA-iv produced from on-road transportation can be significant at a regional level. In megacities like London, Ots et al. (2016) found that diesel-related IVOCs could explain on average 30 % of the SOA produced on an annual basis.
Recently, to simulate IVOCs in CTMs, Manavi and Pandis (2022a) proposed a new approach that considers both the SOA formation potential and the complex chemistry of atmospheric IVOCs. In their approach, IVOCs are treated as lumped species, and they retain their chemical characteristics (alkanes, aromatics, polyaromatics, etc.). In their work, Manavi and Pandis (2022a) have also estimated the on-road transport emissions of the new lumped IVOCs in Europe, alongside other parameters that are necessary for the simulation of the SOA formation, such as the SOA yields and the effective vaporization enthalpy. The estimated on-road diesel and gasoline vehicle emissions utilized the experimentally measured EFs of Zhao et al. (2015, 2016) and were 8 times higher compared to emissions from the same source that were estimated using the 1.5 IVOC-to-POA factor. For diesel vehicles, the highest IVOC emissions were from the new lumped alkane species, whereas for gasoline vehicles the highest IVOC emissions were due to the new lumped PAHs species. Moreover, the estimated SOA yields of the new lumped species were higher compared to those used for the simulation of SOA formation from the VOCs.
Most models simulate SOA-iv formation over Europe by utilizing a variation of the VBS framework (Fountoukis et al., 2011; Ots et al., 2016; Giani et al., 2019; Lannuque et al., 2020). Although the VBS framework is useful in estimating the bulk contribution of IVOCs to SOA levels, it does not provide any information about the chemical characteristics of these compounds. Moreover, little is known about the role of IVOCs in the gas-phase chemistry of the European domain. The aim of this work is to estimate the overall contribution of IVOCs to SOA concentrations and to gas-phase chemistry over Europe, together with the chemical characteristics of those species. Specifically, we present and evaluate an implementation of the lumping scheme of Manavi and Pandis (2022a) in PMCAMx, a three-dimensional CTM. The new version of the model is called PMCAMx-iv, and it is applied over Europe for the IVOCs emitted from on-road diesel and gasoline vehicles. The implementation and evaluation of the new lumped species approach to other IVOC sources will be the subject of subsequent publications. The sensitivity of the SOA predictions on the details of the parametrization of the proposed lumping scheme is also investigated.
2.1 PMCAMx
PMCAMx describes the processes of horizontal and vertical advection, horizontal and vertical dispersion, gas and aqueous-phase chemistry, aerosol dynamics and thermodynamics, and wet and dry deposition (Murphy and Pandis, 2009; Tsimpidi et al., 2010; Fountoukis et al., 2011). The gas-phase chemical mechanism utilized in the simulations is an extension of the SAPRC mechanism (Carter, 2010; Environ., 2013). In SAPRC, VOCs are lumped into species based on their chemical characteristics and their reaction rate constant with the hydroxyl radical (kOH). The version of SAPRC used here includes 237 reactions of 91 gases and 18 radicals. Alkanes in the VOC range are represented by five lumped species (ALK1–ALK5), olefins by two (OLE1, OLE2), and aromatics by another two (ARO1, ARO2). One species represents monoterpenes (TERP), and there is also one sesquiterpenes species (SESQ).
In this application for the aerosol processes, bulk equilibrium is assumed, and the 1D-VBS approach (Donahue et al., 2006) is utilized treating both primary and secondary OA species as chemically reactive. In the base version of PMCAMx, IVOCs are represented by the 103, 104, 105, and 106 µg m−3 volatility bins. To explicitly represent SOA-iv formation, the model utilizes 22 species (four surrogate species in the gas-phase and nine pairs of gas–aerosol secondary species), 12 gas-phase reactions with the hydroxyl radical, and 9 partitioning reactions. With each gas-phase reaction, the volatility of the oxidized vapor product is reduced by 1 order of magnitude, and its mass is increased by 7.5 % to account for the added oxygen. The aging OH reactions have a reaction rate constant of 4 × 10⁻¹¹ . The emissions of the 1D-VBS IVOCs are calculated using the 1.5 IVOC-to-POA emissions ratio. More specifically, the emissions of the C∗ = 103 µg m−3 bin are assumed to be 0.15 POA, of the C∗ = 104 µg m−3 bin 0.4 POA, of the C∗ = 105 µg m−3 bin 0.5 POA, and finally of the C∗ = 106 µg m−3 bin equal to 0.8 POA. More detailed information about this base version of the model can be found in Murphy and Pandis (2009), Tsimpidi et al. (2010), and Fountoukis et al. (2011).
2.2 The PMCAMx-iv model
PMCAMx-iv uses the IVOC lumped species approach of Manavi and Pandis (2022a). The new lumping scheme is an effort to better simulate the complex chemistry of IVOCs and the SOA-iv production in CTMs. One of the benefits of the increased complexity is the ability to identify the compounds or compound classes (out of the thousands of compounds in the IVOC range) that are the most important SOA precursors and provide insights about which model parameters should be better constrained in the future. The proposed approach, and subsequently this work, focuses only on IVOCs emitted from on-road transport and more specifically on IVOCs emitted by diesel and gasoline vehicles following the studies of Zhao et al. (2015, 2016). IVOCs from other sources are simulated using the 1D-VBS approach.
2.2.1 The new IVOC lumping scheme
In PMCAMx-iv, seven new lumped species that represent IVOCs are added to SAPRC. The individual speciated and unspeciated compounds reported in the studies of Zhao et al. (2015, 2016) are lumped into seven species based on their chemical type and their reaction rate constant with the hydroxyl radical (kOH). The lumping criteria used are consistent with the philosophy and criteria of the rest of the SAPRC mechanism. The seven new lumped IVOC species include four species (ALK6–ALK9) representing C12–C22 alkanes, one species (ARO3) representing aromatics with carbon numbers from 11 to 22, and two species (PAH1, PAH2) representing C10–C17 PAHs. Details about the new lumped species and their components can be found in Manavi and Pandis (2022a). The original version of SAPRC does not explicitly account for IVOCs, but some individual species are lumped in the simulated VOCs. Thus, to avoid double counting in the new scheme, ALK5, which previously included n-dodecane (C12H26), is revised to include compounds with a kOH between 0.6 and 1.3 × 10⁻¹¹ (this corresponds to undecane and its isomers).
2.2.2 Parametrization of the gas-phase chemistry and the SOA production
All seven lumped IVOC species that are added to the model react individually with the hydroxyl radical (OH) producing both volatile products, that remain in the gas phase, and less volatile products that are able to partition to the aerosol phase, forming SOA-iv. The SAPRC framework is used to simulate the volatile products, while the semi-volatile and low-volatility products are simulated following the SOA VBS scheme (Lane et al., 2008). The reaction of each of the seven added lumped species is assumed to lead to the formation of a set of five semi-volatile products with C∗ of 0.1, 1, 10, 100, and 103 µg m−3 at 298 K, to simulate SOA formation. For the simulation of the more volatile products of the oxidation reaction of the new lumped species, it is assumed that they are the same as the ones produced from the corresponding reactions of larger VOCs with similar chemical characteristics that are already present in the SAPRC mechanism. Overall, the lumped species approach requires the simulation of 17 species (7 lumped species in the gas-phase and 5 pairs of gas–aerosol secondary species), seven gas-phase reactions and five partitioning reactions. Further details about the added reactions are included in the Supplement S1 and in Manavi and Pandis (2022a).
NOx-dependent SOA mass-based yields (ai) are used in PMCAMx-iv for the seven IVOC lumped species following Manavi and Pandis (2022a). Due to a lack of appropriate experimental data, the mass-based yields of the new alkane species are assumed to be the same under high- and low-NOx conditions, and the mass-based yields of ARO3 are assumed to be 20 % higher than those of ARO2. Both assumptions are evaluated in the sensitivity analysis section. Moreover, in the implemented IVOC scheme, once the five condensable products are formed, they do not undergo any further oxidation. However, for consistency reasons, PMCAMx-iv includes the multigenerational aging reactions of the five condensable products, but the kOH for all of them is set to zero. In the sensitivity section, we also assess the effect of multigenerational aging on SOA-iv production.
2.3 Model application
In this study we simulate the month of May 2008, which corresponds to the EUCAARI intensive measurement campaign across Europe. PMCAMx, which used the 1D-VBS for all sources, has been evaluated for the studied period by Fountoukis et al. (2011, 2014). The modeling domain and the input parameters are the same as those in Fountoukis et al. (2011, 2014). Briefly, the modeling domain corresponds to a region of 5400 × 5832 km2 over Europe, with a 36 × 36 km grid resolution and 14 vertical layers reaching up to approximately 6 km in height. A rotated polar stereographic map projection is used. Meteorological inputs to the model, such as horizontal wind components, vertical diffusivity, temperature, pressure, water vapor, clouds, and rainfall, are generated by the WRF (Weather Research and Forecasting) model (Skamarock et al., 2008). For the anthropogenic emissions, the GEMS emissions inventory (Visschedijk et al., 2007) is used for the gas-phase emissions and the EUCAARI Pan-European Carbonaceous Aerosol Inventory (Kulmala et al., 2009) for the particulate emissions of organic and elemental carbon. The anthropogenic emissions have been developed by TNO (Netherlands Organization for Applied Scientific Research), and they include emissions from industrial, domestic, agricultural, and traffic sources. The biogenic emissions are produced by MEGAN (Model of Emissions of Gases and Aerosols from Nature), and a marine aerosol emission model (O'Dowd et al., 2008) was used for sea salt emissions.
During the EUCAARI measurement campaign, observational data were consistently collected from four ground stations located in remote and rural areas, and these measurements are representative of background atmospheric conditions in Europe. The four measuring sites are located in Cabauw (Netherlands), Finokalia (Greece), Mace Head (Ireland), and Melpitz (Germany). The PMCAMx-iv model results are evaluated against the hourly measurements taken from these four sites.
2.3.1 IVOC emissions
The simulation of an IVOC source with the lumped species approach requires information about the chemical characteristics of the emitted compounds. In PMCAMx-iv, the emissions of the new lumped IVOC species from on-road diesel and gasoline vehicles are estimated using source-specific EFs of the individual compounds included in each of the seven lumped IVOCs. The EFs of the individual compounds and the total VOCs are based on two US studies (Zhao et al., 2015, 2016). The application of these emission factors to European vehicles is a necessary assumption at this stage as there is little information about IVOCs emitted from on-road gasoline and diesel vehicles in Europe. The effect of this assumption is estimated in the sensitivity section. To avoid double counting, the 1D-VBS IVOC emissions from on-road diesel and gasoline vehicles are removed from the inventory. For the same reasons, we have also removed 2 % of the ALK5 emissions from the on-road transportation emissions as they correspond to the n-dodecane isomer emissions. In the lumped species approach, the chemistry and the emissions of n-dodecane are represented by the ALK6 species. For the simulation of the IVOCs emitted from sources other than on-road diesel and gasoline vehicles, we utilize the standard IVOC emissions of the VBS; thus their emissions are estimated using the existing IVOC-to-POA ratio. The field studies of Zhao et al. (2014, 2015, 2016) were one of the first efforts that were able to constrain the UCM, provide information about its chemical characteristics, and estimate the corresponding emission factors. Therefore, these studies were selected as the starting point for the application of the lumped species approach. In the future, as more experimental studies provide detailed chemical emission profiles, other sources can also be simulated with the lumped species approach.
Over the past decade, the imposed EU regulations on on-road vehicles has resulted in a reduction in VOC emissions (Sicard et al., 2021). Given that there is a strong correlation between VOC and IVOC emissions from on-road diesel and gasoline vehicles (Lu et al., 2018), the current IVOC concentrations may be lower compared to the ones predicted by PMCAMx-iv for May 2008. Nevertheless, without the corresponding measurements from in-use European vehicles, it is difficult to estimate the effect of EU legislation on current IVOC concentrations accurately. For example, Fang et al. (2021) showed that in China the emission factors of IVOCs emitted from in-use vehicles are higher compared to those measured by Zhao et al. (2015, 2016) in the United States.
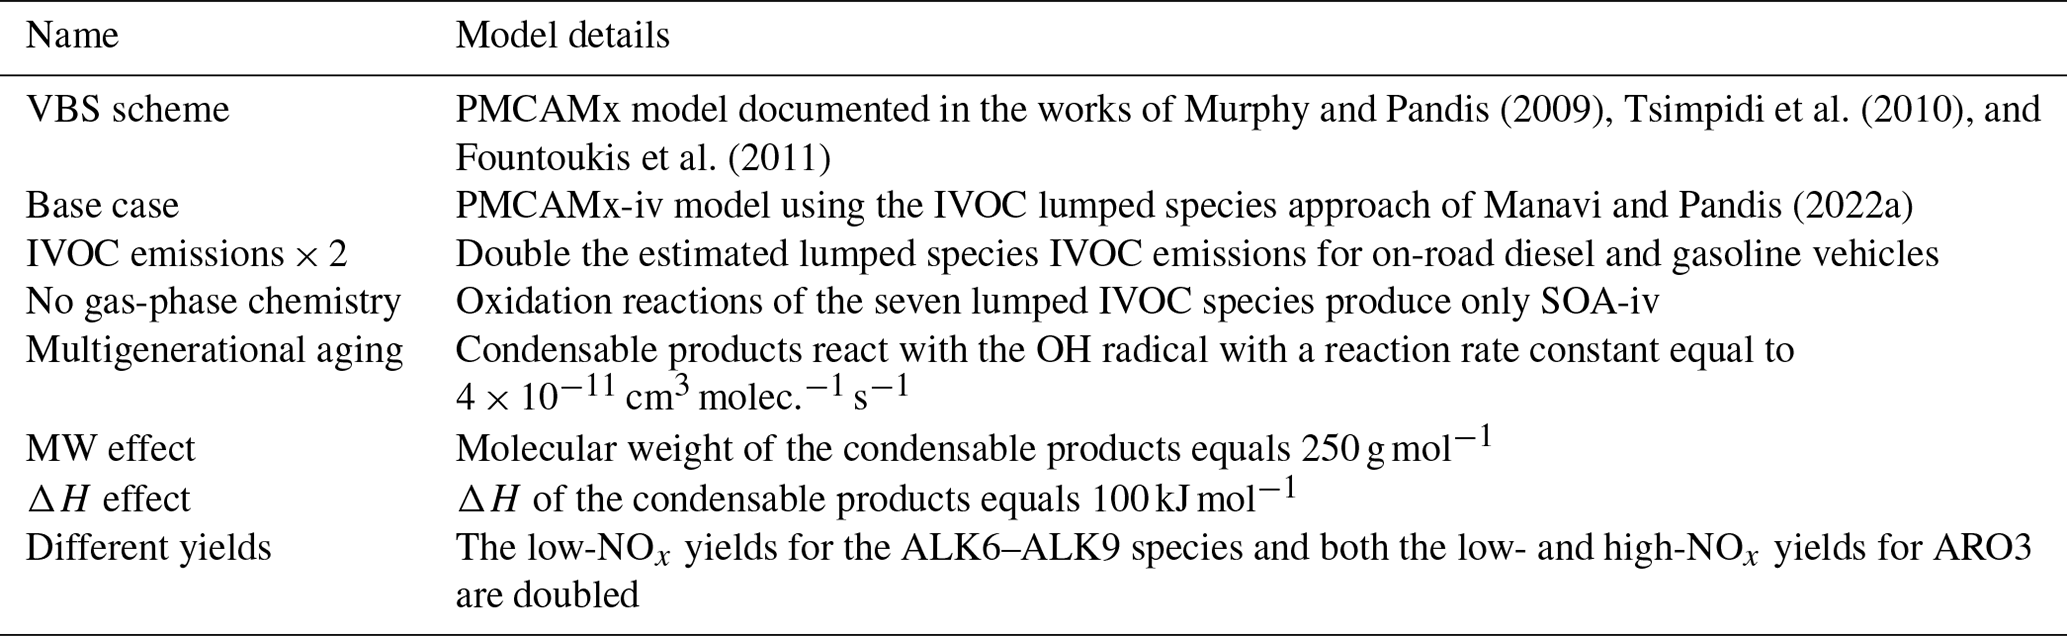
2.4 Simulation cases
Eight simulations were performed to systemically explore the performance of the new lumped species approach for the simulation of IVOCs emitted from diesel and gasoline vehicles (Table 1). The first was the “VBS scheme” simulation, and it was conducted with the base version of PMCAMx using the 1D-VBS approach to simulate IVOCs emitted from the different anthropogenic sources (on-road and non-road transport, agriculture, domestic and industrial sources). For the second simulation (“base case”), we used the PMCAMx-iv model that treats IVOCs emitted from on-road diesel and gasoline vehicles with the new lumped species approach. This base case simulation includes the updated emission inventories over Europe for that source, the new gas-phase chemistry, and the new SOA-iv parametrization. The other six simulations are part of the sensitivity analysis of PMCAMx-iv.
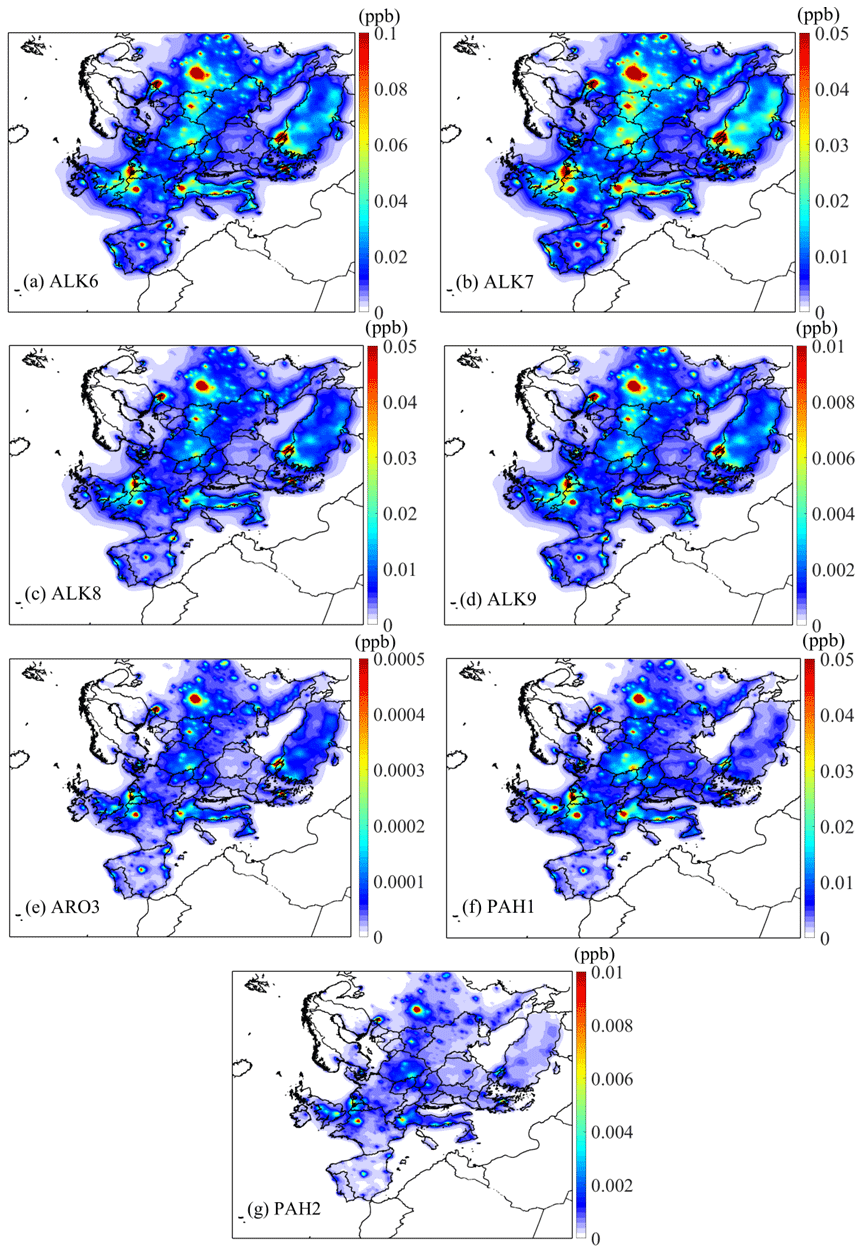
Figure 1Predicted average ground-level gas-phase mixing ratios (in ppb) of the lumped IVOC species (a ALK6, b ALK7, c ALK8, d ALK9, e ARO3, f PAH1, g PAH2) by PMCAMx-iv emitted by on-road transport for May 2008. Different scales are used.
3.1 Concentrations and diurnal profiles of on-road transport IVOCs
Figure 1 shows the average ground-level concentrations of the lumped IVOC species predicted by PMCAMx-iv in the base case test. All seven species have similar spatial distributions, with the highest concentrations located in major European cities, such as Paris, London, Madrid, and Athens, and regionally in countries like Italy, the Netherlands, Poland, and the UK. The highest average concentrations are predicted for ALK6 and range up to 1.1 ppb. This is expected as ALK6 is also the species with the highest emissions, with diesel vehicles being its major source (Manavi and Pandis, 2022a). PMCAMx-iv predicts that the second-highest average concentrations are those of ALK7, with values ranging up to 0.7 ppb. ALK8 and PAH1 are predicted to have similar average ground-level concentrations up to 0.4 ppb. The average concentrations of the three remaining species are, in descending order, ALK9 (0–0.1 ppb), PAH2 (0–0.04 ppb), and ARO3 (0–0.01 ppb). These three surrogate species are also estimated to have the lowest emissions from on-road diesel and gasoline vehicles.
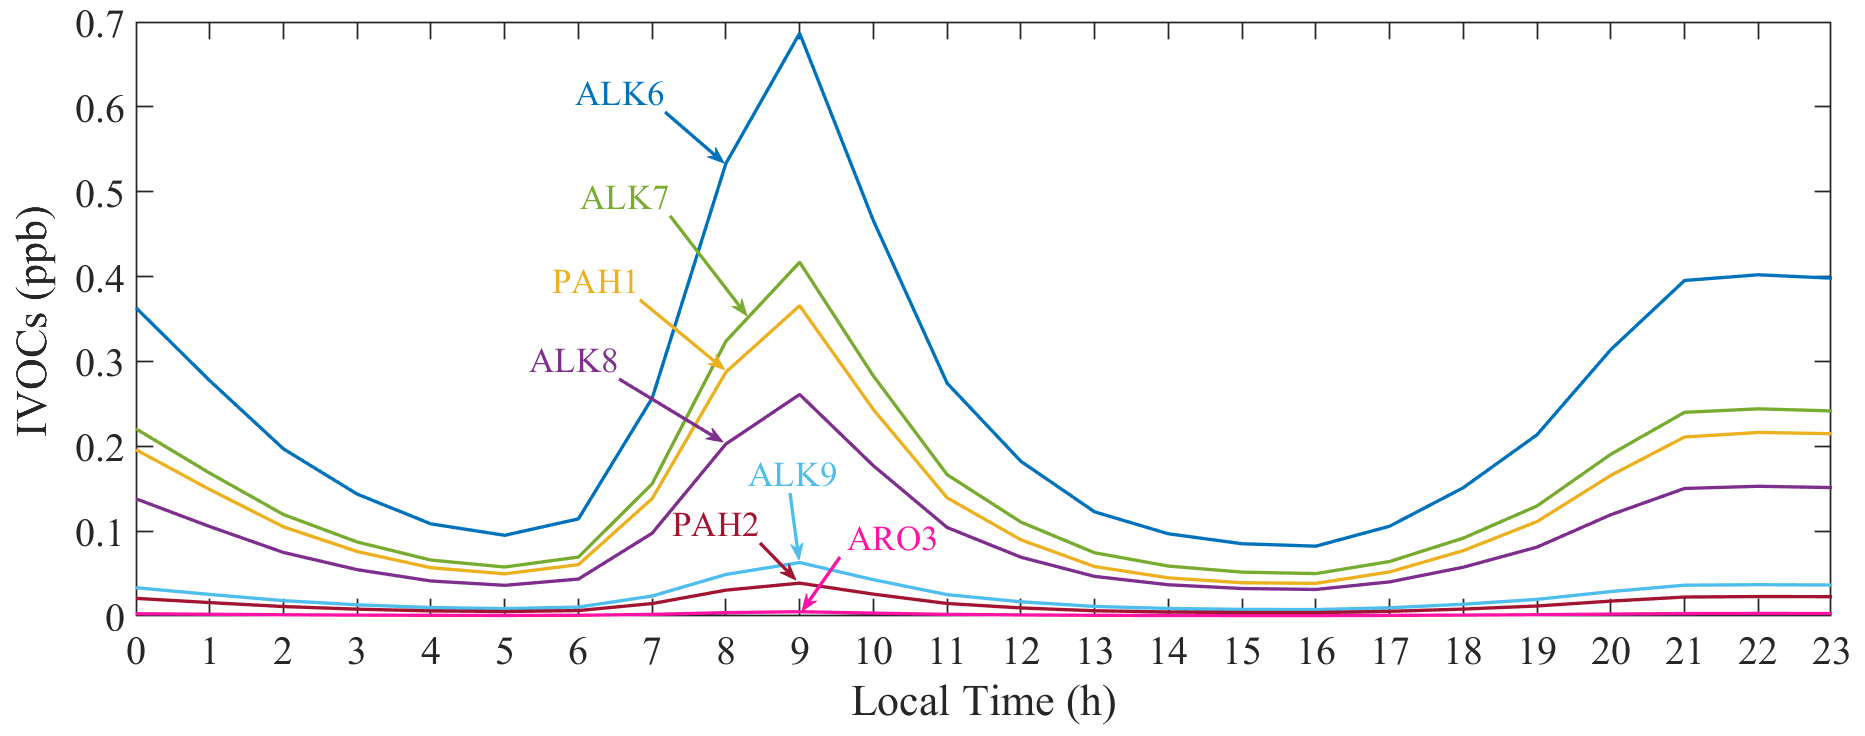
Figure 2PMCAMx-iv-predicted average diurnal profiles for the ground-level concentrations of the lumped IVOC species emitted by on-road transport over the city of Paris for May 2008.
The predicted diurnal profiles of the new lumped IVOC species over the city of Paris (France) for May 2008 are shown in Fig. 2. PMCAMx-iv predicts that the concentrations of the seven added IVOC species start increasing after 05:00 local time (LT), leading up to the first peak of the day around 09:00 LT. This morning peak is also the highest predicted during the day. After the first peak, ground-level IVOC concentrations decrease and stabilize until 16:00 LT, when IVOC concentrations begin to increase again, leading to the second peak of the day around 21:00 LT. The concentrations predicted during the second peak are approximately half of those predicted for the morning peak. Later in the night, IVOC concentrations decrease, reaching their lowest values at 05:00 LT. The increase and the two peaks in the modeled concentrations correspond to on-road traffic in Paris. During the morning, the average diurnal profiles of the IVOC concentrations are similar to those of the corresponding emission rates (Fig. S1 in the Supplement). As the day progresses and the lumped IVOC species undergo several processes in the model, the two profiles become different. After the first peak, the predicted reduction of the lumped IVOC concentrations is due to both their oxidation reactions and dilution as the mixing height increases. After sunset (occurring on average after 21:00 LT), the simulated chemistry slows down, the mixing height decreases, and the corresponding emissions, even if they are much lower than in the morning, result in the second predicted peak.
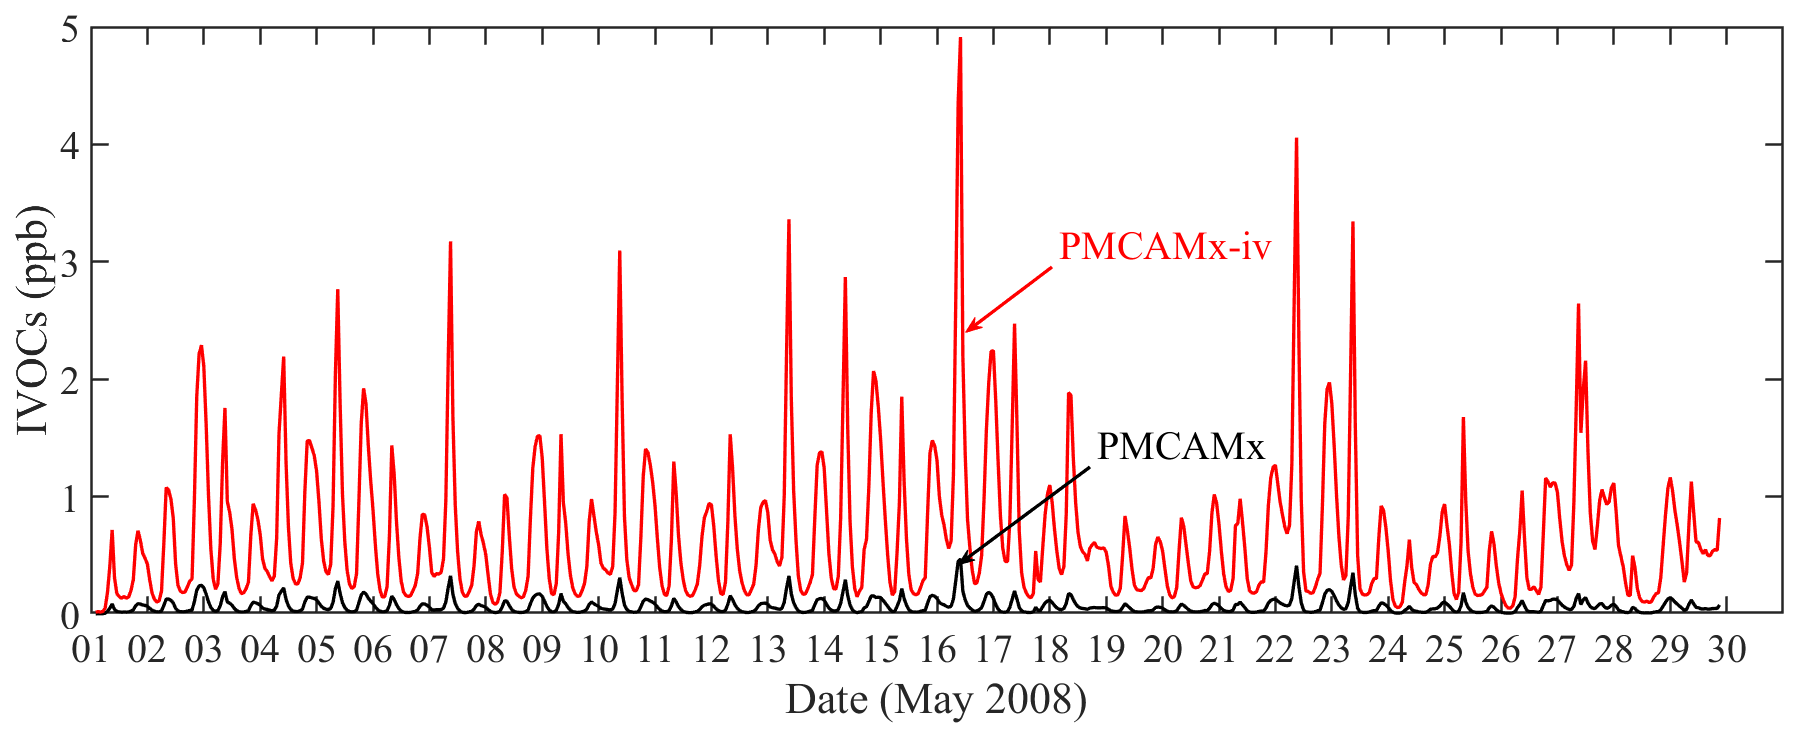
Figure 3Hourly averaged ground-level IVOC concentration emitted by on-road vehicles in Paris as predicted by PMCAMx (sum of the four surrogate VBS species) and PMCAMx-iv (sum of the seven lumped IVOC species) for May 2008.
Figure 3 compares the hourly averaged ground-level IVOC concentrations in Paris that are predicted by PMCAMx (sum of the four surrogate VBS species) and PMCAMx-iv (sum of the seven lumped IVOC species). The comparison focuses only on the IVOCs emitted from on-road diesel and gasoline vehicles. The higher emissions added in the lumped IVOC scheme result in higher IVOC concentrations compared to those predicted by the VBS scheme simulation. On average there is 1 order of magnitude difference between the concentrations predicted by the two schemes. Besides the difference in the predicted values, the two time series are similar, with the highest and lowest values of the two models coinciding. For example, for Paris both models estimate that the highest total IVOC ground-level concentration from diesel and gasoline vehicles occurs during 16 May 2008, at 10:00 LT. PMCAMx-iv predicts a concentration of 5 ppb, whereas PMCAMx predicts a concentration of 0.5 ppb. The similarity between the two time series is also confirmed by the average diurnal profiles of the ground-level IVOC concentrations in Paris (Fig. S2 in the Supplement).
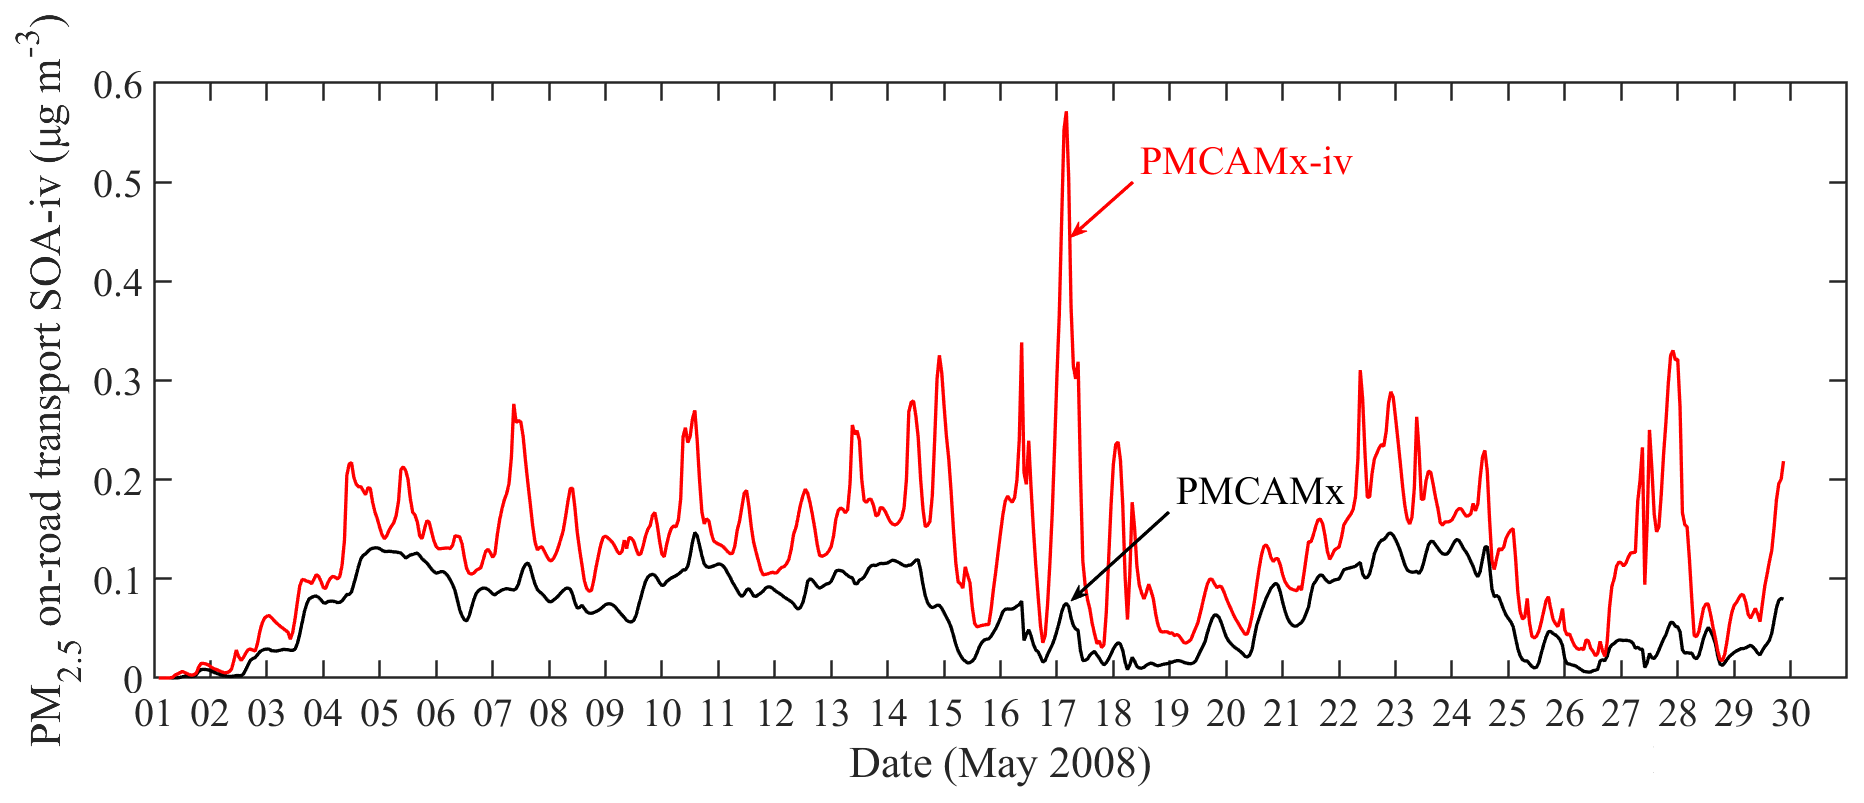
Figure 4Hourly averaged predicted ground-level concentrations of on-road transport PM2.5 SOA-iv by PMCAMx and PMCAMx-iv over the city of Paris for May 2008.
3.2 SOA-iv formation from on-road transport
3.2.1 Predicted SOA-iv concentrations in an urban environment
In PMCAMx-iv, SOA-iv is formed from the condensation of the five low-volatility and semi-volatile products of the seven lumped IVOC species. Figure 4 depicts the hourly averaged ground-level concentrations of PM2.5 SOA-iv from on-road transportation over the city of Paris for the simulated month. For Paris, the mean on-road SOA-iv concentration that is predicted by PMCAMx-iv is 0.13 µg m−3, while there are several days during the month on which hourly averaged concentrations reach up to 0.6 µg m−3. PMCAMx using the 1D-VBS framework predicts lower on-road transport SOA-iv concentrations. Moreover, the two temporal profiles of the SOA-iv concentrations are different, with PMCAMx predicting the highest on-road transport SOA-iv concentration of the month on a different date (0.14 µg m−3 on 10 May) compared to the date predicted by PMCAMx-iv.
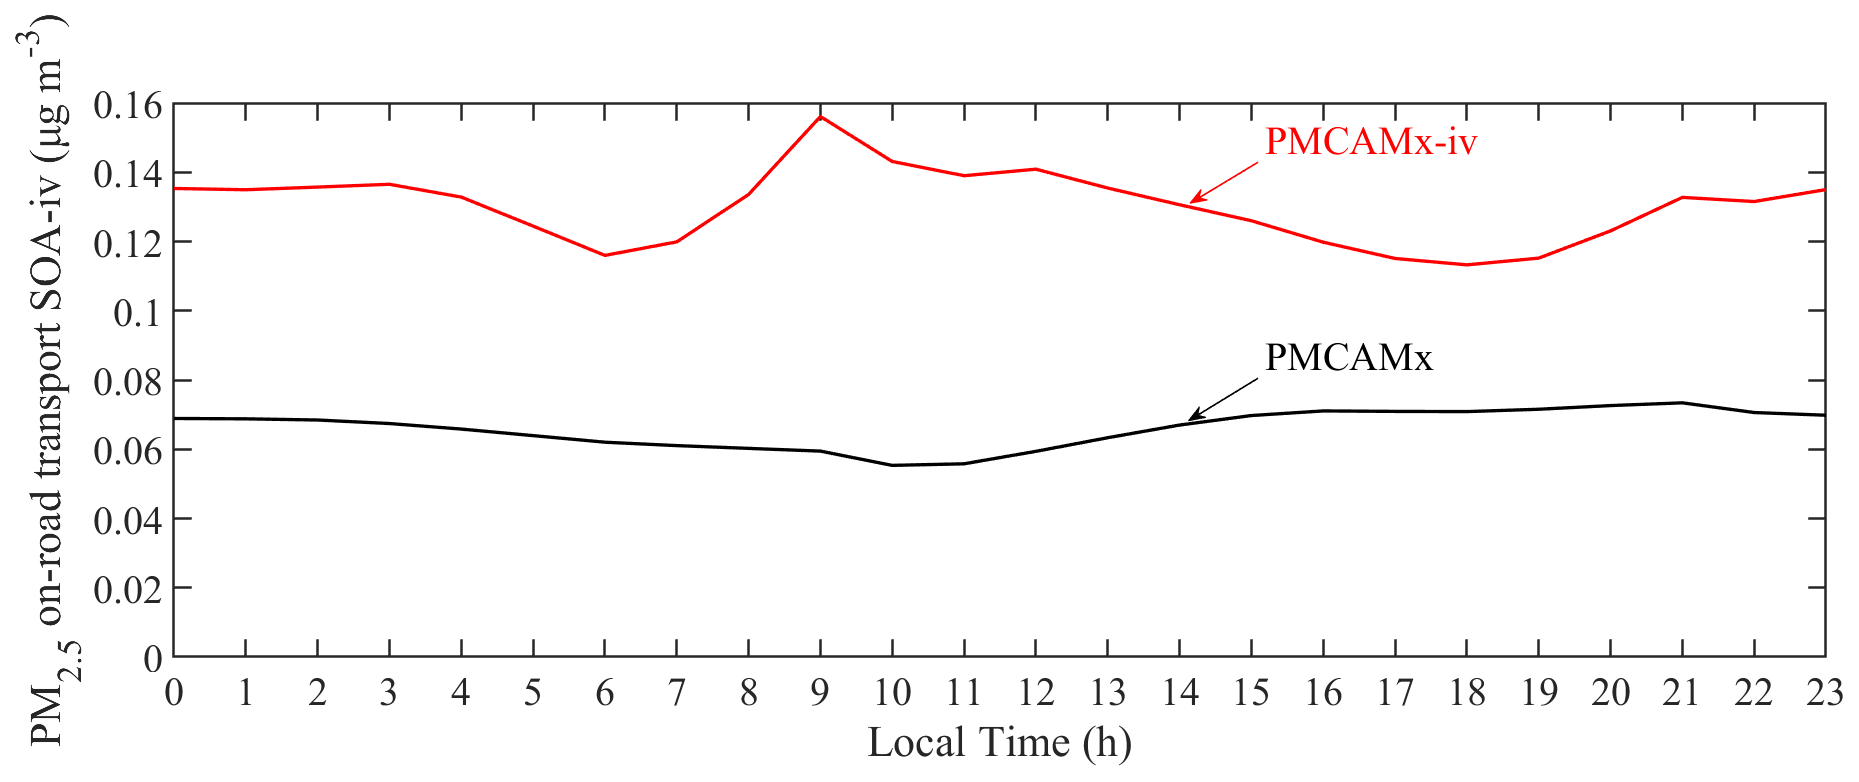
Figure 5Average diurnal profile of the ground-level on-road transport PM2.5 SOA-iv concentrations over Paris predicted by PMCAMx and PMCAMx-iv.
The diurnal profiles also highlight the fact that in an urban environment the on-road SOA-iv concentrations predicted using the lumped IVOC scheme have a different temporal pattern compared to those predicted using the 1D-VBS scheme (Fig. 5). PMCAMx-iv on-road transport SOA-iv concentrations start increasing around 06:00 LT, following the concentration increase of the lumped IVOC species with 1 h difference, and they peak at around 09:00 LT. The peak concentration (0.16 µg m−3) is followed by a decrease until 18:00, when concentrations begin to increase again until they reach a value of 0.13 µg m−3 at 21:00 LT. After sunset, predicted average on-road SOA-iv concentrations are relatively stable until the early morning hours (03:00 LT) when concentrations begin to decrease, due to dilution and transport out of the city. Comparison between the on-road SOA-iv diurnal profiles of the two models shows that the lumped species approach forms SOA-iv faster than the 1D-VBS approach. In PMCAMx, average SOA-iv concentrations begin increasing only after 10:00 LT, 5 h after IVOC concentrations begin to increase and 3 h after PMCAMx-iv SOA-iv concentrations increase. Due to its late response, the highest concentration of SOA-iv with the 1D-VBS approach is reached in the late afternoon (16:00 LT), and it is maintained until 21:00 LT. Tsimpidi et al. (2011), while evaluating the performance of PMCAMx in an urban environment (Mexico City), found that the model underpredicted the observed morning peak and overpredicted the peak observed during the afternoon. These findings suggested that in PMCAMx, the chemistry of the SOA formation is slower compared to what is happening in the atmosphere. Although a one-to-one comparison between this study and the study of Tsimpidi et al. (2011) is not possible, the faster response of PMCAMx-iv is an encouraging result.
3.2.2 Average ground-level SOA-iv concentrations
Figure 6 depicts the PMCAMx-iv-predicted average ground-level concentrations of PM2.5 SOA-iv formed from on-road diesel and gasoline IVOC emissions over the modeling domain for May 2008. The highest average PM2.5 on-road SOA-iv concentration is 0.18 µg m−3, predicted for Istanbul. The spatial distribution of the average predicted on-road SOA-iv concentrations is similar to that of the new lumped species, with the highest concentrations values located in the corresponding European cities and regions.
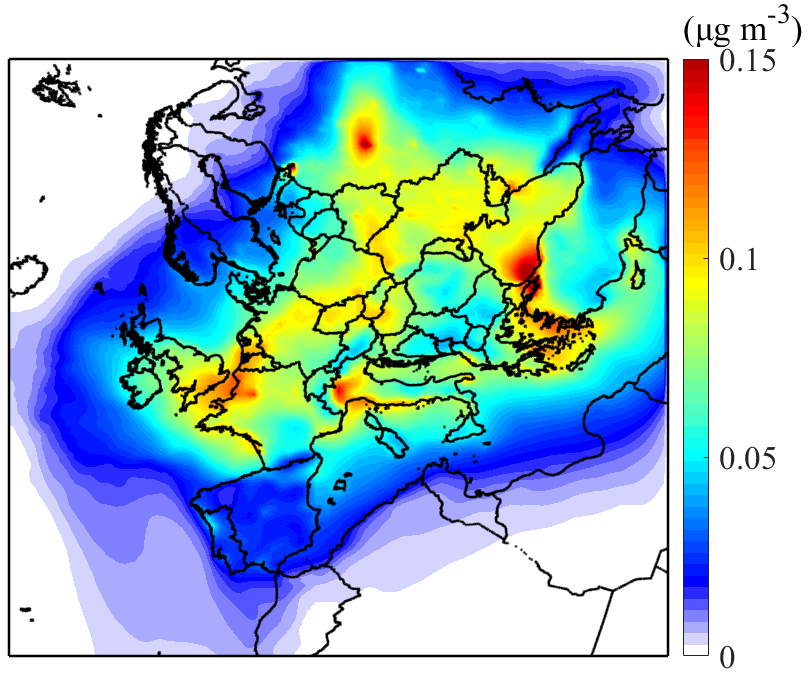
Figure 6PMCAMx-iv (base case test) average ground-level concentrations of on-road transport PM2.5 SOA-iv ( µg m−3) over Europe for May 2008.
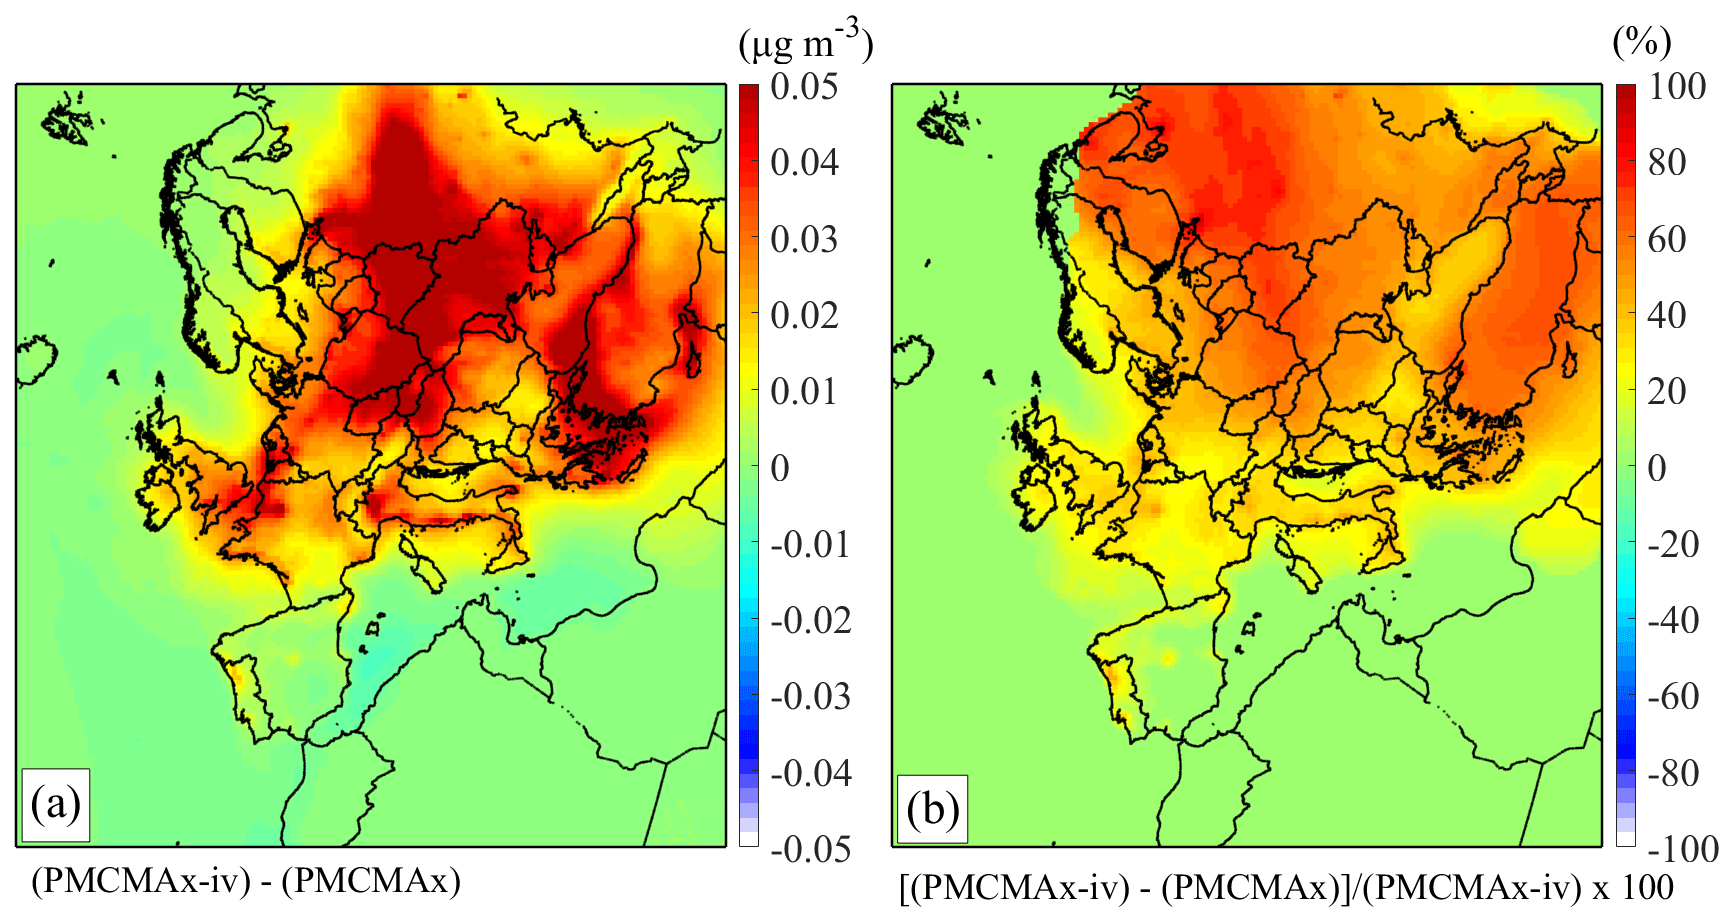
Figure 7(a) Absolute and (b) percentage differences between the average ground-level concentrations of PM2.5 on-road transport SOA-iv predicted by PMCAMx and PMCAMx-iv.
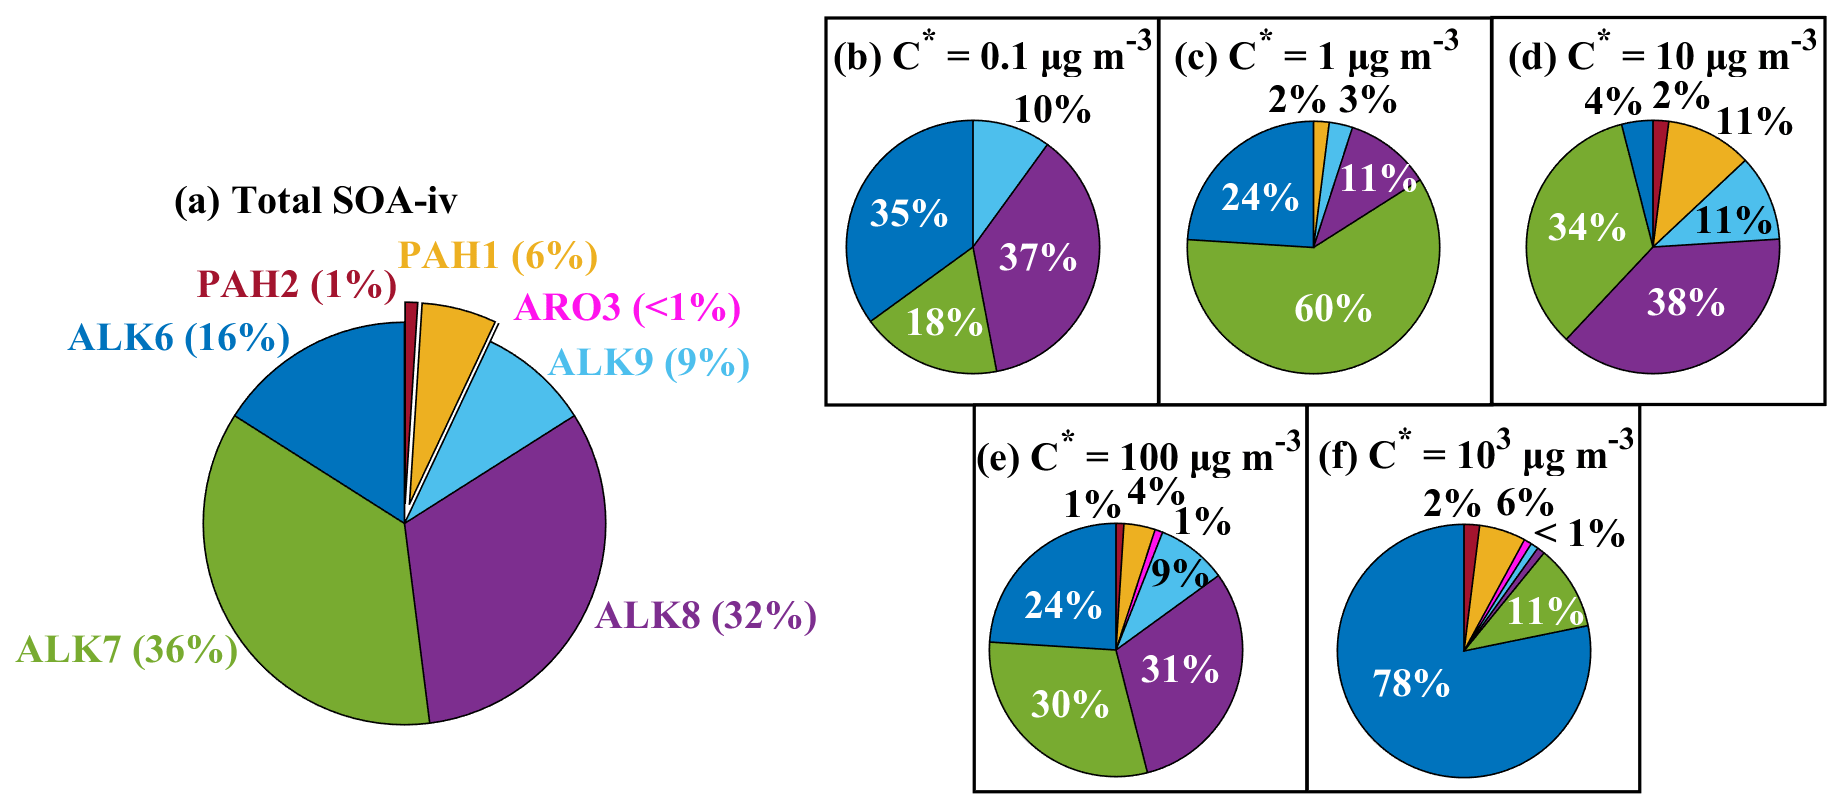
Figure 8Contribution of seven lumped species (a) to the total SOA-iv and to the SOA-iv components with C∗ of (b) 0.1, (c) 1, (d) 10, (e) 100, and (f) 103 µg m−3 at 298 K.
However, a key difference is that the produced aerosol is transported beyond continental Europe, reaching the shores of northern Africa. To quantify the differences between PMCAMx and PMCAMx-iv over the European domain, we estimate the absolute and percentage differences between the average ground-level concentrations of PM2.5 on-road SOA-iv (Fig. 7). Compared to PMCAMx, PMCAMx-iv predicts consistently higher concentrations over the domain, with a domain-average percentage increase of 60 %. The differences between the two models are more prominent over major European cities and over eastern Europe.
The lumped species approach predicts higher concentrations of the IVOC products both in the aerosol and in the gas phase compared to the 1D-VBS approach (Fig. S3 in the Supplement). Specifically, PMCAMx-iv predicts that in the gas-phase the secondary products, produced from the oxidation reactions of the new lumped IVOCs from on-road vehicles, have a mean ground-level concentration of 0.019 ppb. On the contrary, the average concentration of the IVOC oxidation products for PMCAMx is predicted to have a value of 0.0008 ppb. For the secondary products in the aerosol phase, PMCAMx predicts a domain-averaged concentration of 0.02 µg m−3, whereas the corresponding value for PMCAMx-iv is 0.03 µg m−3.
The volatility distributions of the on-road SOA-iv products are quite different between the two cases. With the 1D-VBS approach, 84 % of the secondary products in the aerosol phase has a C∗ of less than or equal to 1 µg m−3, while with the lumped species approach, 52 % of the secondary aerosol mass has a C∗ of 10 µg m−3. The mean concentrations of the secondary aerosol products in the 0.1 µg m−3 bin are equal between the two models. Furthermore, the average concentration of the aerosol products in the 1 µg m−3 bin is higher in PMCAMx than in PMCAMx-iv. A similar shift in volatility is also observed in the gas-phase products. Again, in the case of PMCAMx-iv, a significant amount of the gas-phase mass has a C∗ of 10 µg m−3 (46 % of the secondary mass in the gas phase), when 76 % of the gas-phase products of PMCAMx have a C∗ greater than or equal to 100 µg m−3.
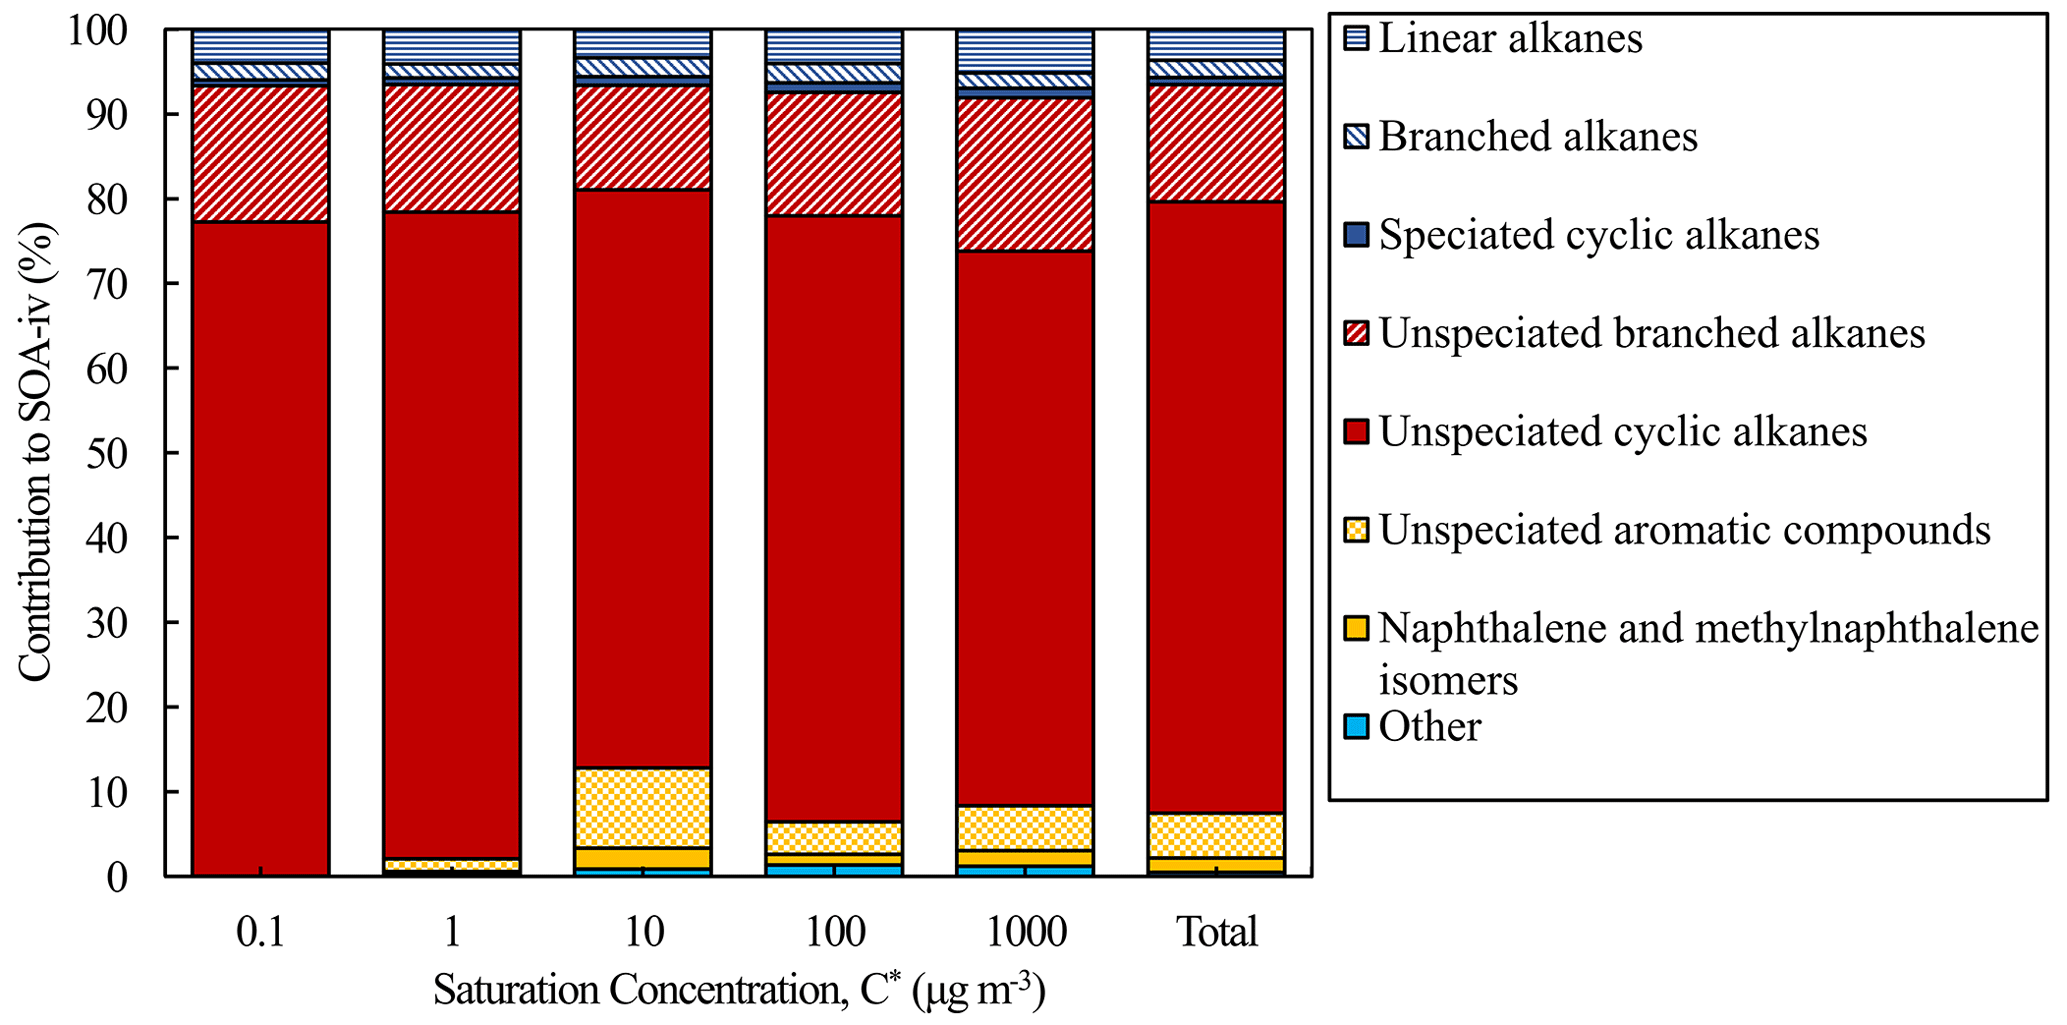
Figure 9Average contribution of the individual species to the SOA-iv components for the whole modeling domain.
3.2.3 Contribution of the lumped and individual species to SOA-iv formation
Figure 8 shows the PMCAMx-iv-predicted contribution of the seven lumped IVOC species emitted from on-road diesel and gasoline vehicles to the total SOA-iv and to the five SOA-iv volatility bins. The alkanes (ALK6–ALK9) have the highest contribution to the predicted SOA-iv. Specifically, ALK6–ALK9 are, respectively responsible for the formation of 16 %, 36 %, 32 %, and 9 % of the SOA-iv, whereas the other species contribute the remaining 7 %. Although ALK6 is the species with the highest emissions and ground-level concentrations, it is only the third-most-important precursor for SOA-iv according to PMCAMx-iv. This is mainly due to the comparatively lower SOA yields of ALK6. On the other hand, even though ALK7 and ALK8 have lower emissions and predicted ground-level concentrations, because of their elevated mass-based yields, they are responsible for the formation of almost 70 % of the predicted SOA-iv mass. Moreover, the contribution of ALK8 and ALK9 may be underestimated as their mass-based yields in our SOA scheme are based on the yields of n-heptadecane due to a lack of experimental yield data for alkanes with more than 17 carbons.
Analysis of the contribution of individual compounds to SOA-iv formation suggests that the unspeciated cyclic alkanes, which are lumped in the IVOC alkanes, are the most important SOA-iv precursors, producing 72 % of the total SOA-iv mass, as predicted by PMCAMx-iv (Fig. 9). More specifically, unspeciated cyclic alkanes with 15 to 17 carbons (lumped in ALK7) are responsible for 29 % of the total SOA-iv and unspeciated cyclic alkanes with 18 to 20 carbons (lumped in ALK8) for another 25 % of the total predicted SOA-iv. The contribution of the individual compounds lumped in ALK8 might be a lower bound due to the conservative estimate of their SOA yield parameters. Unspeciated branched alkanes and unspeciated aromatic compounds are, respectively, the second-most-important (14 %) and third-most-important (5 %) contributors to the predicted SOA-iv. Regarding the contribution to the secondary product with C* equal to 10 µg m−3, compounds lumped in the lumped PAH species, such as the unspeciated aromatic compounds, naphthalene, and methylnaphthalene isomers, are the second-most-important contributor.
3.2.4 Contribution of on-road transport IVOCs to SOA and OA levels
According to the results of PMCAMx-iv, the domain-averaged contributions of the on-road IVOCs to the SOA and OA are low (less than 10 %) (Fig. S4 in the Supplement). Specifically, using the lumped species approach, the domain-averaged contribution of on-road IVOCs to SOA and OA is 3.3 % and 1.4 %. In European cities, where the on-road diesel and gasoline vehicle emissions are higher, the monthly averaged contribution of on-road IVOCs to SOA and OA formation is greater than the domain average. Table S1 in the Supplement includes the contributions of on-road IVOCs to the monthly averaged SOA and OA concentrations for 44 European cities. In an urban environment, the contribution of on-road IVOCs to the monthly average SOA budget can range from 8.8 % (Moscow, Russia) to 2.6 % (Oslo, Norway). Moreover, PMCAMx-iv estimates that Minsk (Belarus) is the city with the highest contribution of on-road IVOCs to the monthly mean urban OA levels. Across the domain, the on-road SOA-iv that is formed using the lumped species approach contributes significantly more to PM2.5 SOA and OA levels compared to the predictions of the 1D-VBS approach (Fig. S4).
Figure S5 in the Supplement depicts the hourly averaged ground-level SOA and OA concentrations alongside the contribution of on-road IVOCs to the formed aerosol over Moscow for May 2008. On 12 May at 02:00 LT, when the total SOA concentrations peak in Moscow, the contribution of on-road IVOCs to the SOA is 11 %. During OA peaks (highest concentration of the month is predicted on 12 May at 08:00 LT), the on-road IVOCs contribute up to 6 % of the estimated OA budget. It should be noted that the maximum contribution of the on-road IVOCs does not coincide with the peak concentrations of SOA or OA. For example, on 12 May at 16:00 LT, after 8 h from the predicted OA peak, on-road IVOCs have a considerable contribution to the estimated OA concentrations (13 % of the OA).
3.3 Evaluation of the model
The results of PMCAMx and PMCAMx-iv and the six PMCAMx-iv sensitivity tests are evaluated against ground-level hourly PM1 OA concentration measurements that were taken at the four EUCAARI measuring sites (Cabauw, Finokalia, Mace Head, Melpitz). Figure S6 in the Supplement shows the time series of the predicted and the measured concentrations of PM1 OA at the four measuring stations and Fig. S7 in the Supplement the corresponding diurnal profiles. To assess the prediction skills of the models, we consider the normalized mean bias (NMB), the normalized mean error (NME), the mean bias (MB), the mean absolute gross error (MAGE), the fractional bias (FBIAS), and the fractional error (FERROR). The definitions and estimated values of these metrics are presented, respectively, in the Supplement S2 and Table S2.
Overall, neither PMCAMx-iv nor any of the sensitivity tests have any significant effect on the performance of the model (Table S2). These results are expected, as the four measuring stations are located in either remote or rural areas, where the predominant source of OA is long-range transport. In almost all simulation cases the contribution of the on-road IVOCs to the PM1 OA concentrations in the four measuring sites is less than 5 % (Table S3 in the Supplement). To directly evaluate the performance and reliability of the lumped species approach, measurements of gas-phase concentrations of both IVOCs and SOA-iv are required. Specifically for the effect of on-road transportation IVOCs, these measurements would be even more challenging, as they require estimation of the SOA-iv produced from this specific source. To the best of our knowledge, for the European domain no such information is currently available. Moreover, deconvoluting the SOA-iv component from other component classes of OA with measuring techniques such as the positive-matrix factorization (PMF) analysis of the aerosol mass spectrometer (AMS) data is practically impossible at this stage. In the future, as more experimental techniques are developed and more field measurements focus on IVOCs and the effect of SOA-iv in urban environments, the evaluation of the model will be revisited.
3.4 Sensitivity analysis
In the current literature only a small fraction of the simulated IVOCs has been studied in smog chambers. Therefore, certain aspects of the IVOC chemistry remain highly uncertain. For example, depending on the chemical class of the IVOCs there might be stronger or weaker effects of fragmentation and functionalization (Tkacik et al., 2012; Yee et al., 2013; Chen et al., 2016). This will have a direct effect on the parametrization of the SOA-iv formation. To overcome this lack of experimental data, during the development of the lumping scheme, the values of certain parameters were necessarily based on assumptions. The aim of the six sensitivity tests described in this section is to evaluate the effect of these assumptions, so that future work will be able to focus on the determination of the most important parameters.
3.4.1 The effect of the selected emission factors
Due to a lack of extensive experimental data on IVOCs emitted from European on-road diesel and gasoline vehicles, the lumped IVOC emissions utilized in this study are quite uncertain as they are based on emission factors provided by two experimental studies conducted in the United States (Zhao et al., 2015, 2016). Since the percentage of diesel vehicles is higher in Europe compared to the United States, an “underestimation” is possible as diesel vehicles emit more IVOCs compared to gasoline vehicles. The “lumped IVOC emissions × 2” sensitivity uses the same model configuration of PMCAMx-iv as the base case, except that the estimated on-road diesel and gasoline vehicle emissions of the lumped IVOC species are doubled.
The effect of the doubled emissions is similar over the whole domain, with the average ground-level concentrations of the sum of the seven lumped IVOC species being 50 % higher compared to the ones predicted in the base case simulation (Fig. S8 in the Supplement). Similarly, the domain-averaged concentrations of the secondary products are 2 times higher compared to the base case test (Fig. S3). In an urban setting, like in the city of Athens (Greece), the highest hourly averaged on-road SOA-iv concentration predicted by the lumped IVOC emissions × 2 sensitivity test is 1.4 µg m−3 (14:00 LT on 28 May) and accounts for a quarter of the PM2.5 SOA mass (Fig. S9 in the Supplement). For the same hour, the base case on-road SOA-iv concentration is 0.6 µg m−3, and it is 13.6 % of the SOA. Figure S10 in the Supplement depicts the maximum hourly PM2.5 SOA-iv concentrations over Paris for the base case and the six sensitivity tests. The lumped IVOC emissions × 2 test has the highest maximum value (1.15 µg m−3) among the sensitivity tests.
3.4.2 Effect of the IVOC chemistry on O3
The second sensitivity test (“no gas-phase chemistry”) examines the effect of the more complex IVOCs gas-phase chemistry on ozone production. The yields of the gas-phase products were set to zero, and the seven IVOC reactions with the OH radical produce only SOA-iv species. Figure S11 in the Supplement depicts the absolute and percentage differences between the averaged ground-level concentrations of O3 that are predicted in the base case and in the no gas-phase chemistry simulations. The absolute differences range from 0 to 0.3 ppb and the percentage differences from 0 % to 1.2 %. This small effect of on-road IVOCs on O3 production is expected, as the predicted IVOC concentrations are much lower compared to those predicted for VOCs.
Considering that the O3 concentrations vary significantly over time and that the effect of the IVOCs is limited, we focus on the hourly averaged O3 concentrations over Milan (Italy), an urban area where the effect of IVOCs on O3 appears to be more prominent. More specifically, we focus on the concentrations of O3 over Milan on 8 May as this is the day when the highest difference between the two models is predicted (Fig. S12 in the Supplement). The contribution of the lumped IVOC species leads to a maximum increase of 1 ppb, which occurs when ground-level ozone concentrations peak at 16:00 LT. Even if the present results suggest that on-road IVOCs have a small effect on regional ozone concentrations over Europe for the simulated period, these results should not be generalized for different areas of the world or for the simulation of other sources. For example, while studying the effect of IVOCs emitted from consumer products and industrial processes, Pennington et al. (2021) showed that the inclusion of IVOC chemistry significantly improved their model predictions for ozone concentrations. It should also be noted that in PMCAMx-iv the yields of the gas-phase products, which contribute to ozone formation, are based on the reactions of VOCs which have similar chemical characteristics (ALK5 and ARO2). In the future, as experimental studies provide more information about the IVOC gas-phase chemistry, the model can be updated with more realistic parameters and be re-evaluated.
3.4.3 Multigenerational SOA-iv aging
In the next sensitivity test (“multigenerational aging”), we assess the effect of multigenerational aging by changing the kOH of the corresponding reactions from 0 to 4 × 10⁻¹¹ . With each aging reaction, the volatility of the condensable products is assumed to decrease by 1 order of magnitude, and there is a 7.5 % mass increase to account for the added oxygen.
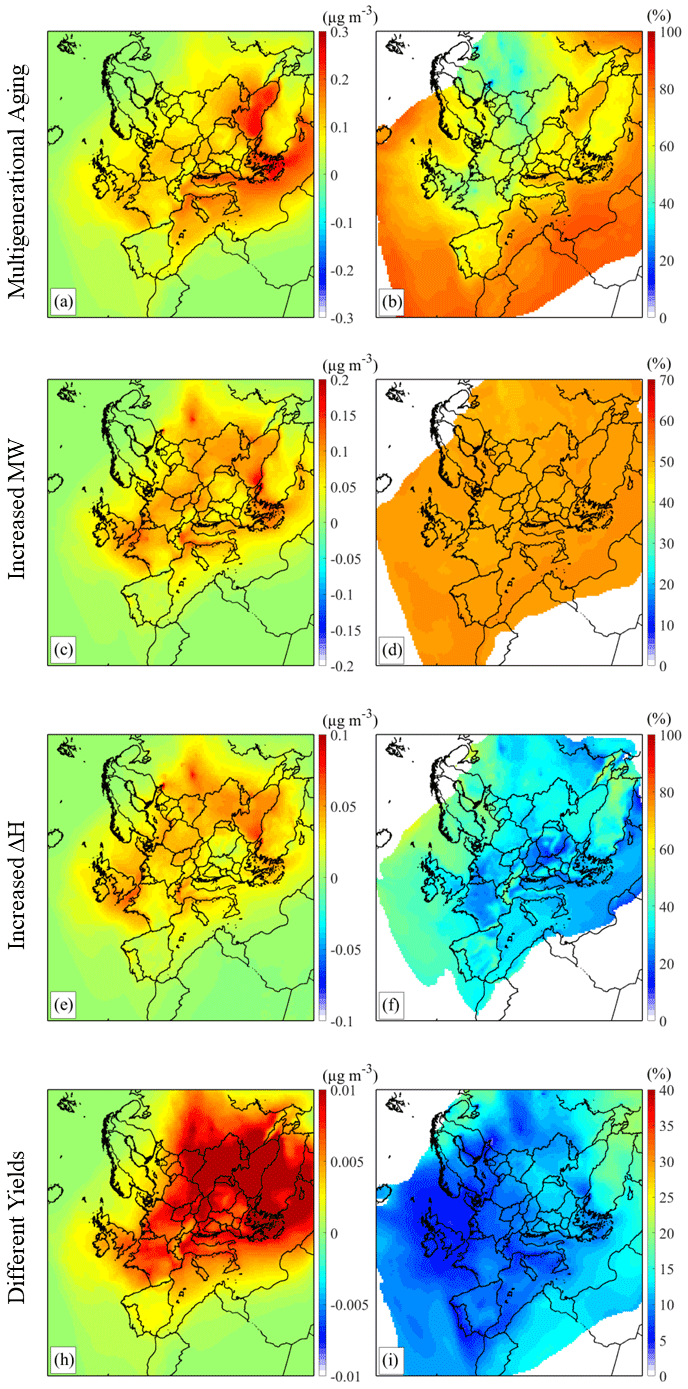
Figure 10(a, c, e, and h) Absolute and (b, d, f, and i) percentage differences between the average ground-level PM2.5 concentrations of on-road transport SOA-iv predicted by the base case and four sensitivity tests (multigenerational aging, MW effect, ΔH effect, and different yields.
By allowing the secondary products to further oxidize after they are formed, the mean PM2.5 on-road SOA-iv concentrations over the domain increase on average by 67 % (Fig. 10). The differences between the estimated SOA-iv concentrations of the two tests are higher above the Mediterranean Sea and the Black Sea, where OH levels are high. Moreover, in the multigenerational aging test the domain-averaged concentration of SOA-iv is 0.09 µg m−3, 3 times higher compared to the one estimated in the base case (0.03 µg m3). With active multigenerational aging, the produced aerosol becomes less volatile, and more mass ends up in the low-volatility bins (Fig. S3). This also explains the high differences in remote areas, which are affected by long-range transport. Over the Finokalia site, the multigenerational aging simulation predicts that the contribution of on-road IVOCs to PM1 OA levels reaches up to 10 % (Table S3). Even though this is the highest estimated contribution to OA levels among the four measuring sites and for all sensitivity tests, the change to the mean predicted OA concentration does not exceed 0.1 µg m−3. Figure S13 in the Supplement compares the predicted diurnal profiles of the on-road transport SOA-iv concentrations over Paris with and without multigenerational aging. After the first peak at 09:00 LT, which is also predicted in the base case, the multigenerational aging test predicts that the concentrations will keep increasing, reaching the second peak of the day at 15:00 LT. This high concentration is sustained until sunset when concentrations begin to decrease appropriately. This difference in the diurnal profiles could be useful in determining the importance of the effect of SOA-iv, when measurements become available.
There is conflicting evidence in the literature on whether the active multigenerational aging of SOA-iv in models like PMCAMx-iv could better reflect ambient concentrations and the oxidation state of SOA-iv. For example, smog-chamber studies have shown that the SOA produced from the oxidation of PAHs in the IVOC range can have an O:C ratio close to 0.7 (Chen et al., 2016). Similarly, when investigating the oxidation of hexylcyclohexane (cyclic alkane with 12 carbons), Yee et al. (2013) found that the corresponding SOA has an O:C above 0.3, indicating that the oxidation products of the cyclic alkanes in the IVOC range may be susceptible to further oxidation. However, studies that examined the oxidation of linear and branched alkanes in the IVOC range suggest that the SOA-iv produced is more closely related to first or at least early-generation products (Tkacik et al., 2012; Yee et al., 2013). Therefore, more laboratory and ambient data are needed to set active multigenerational aging as a default in PMCAMx-iv for simulating on-road IVOCs.
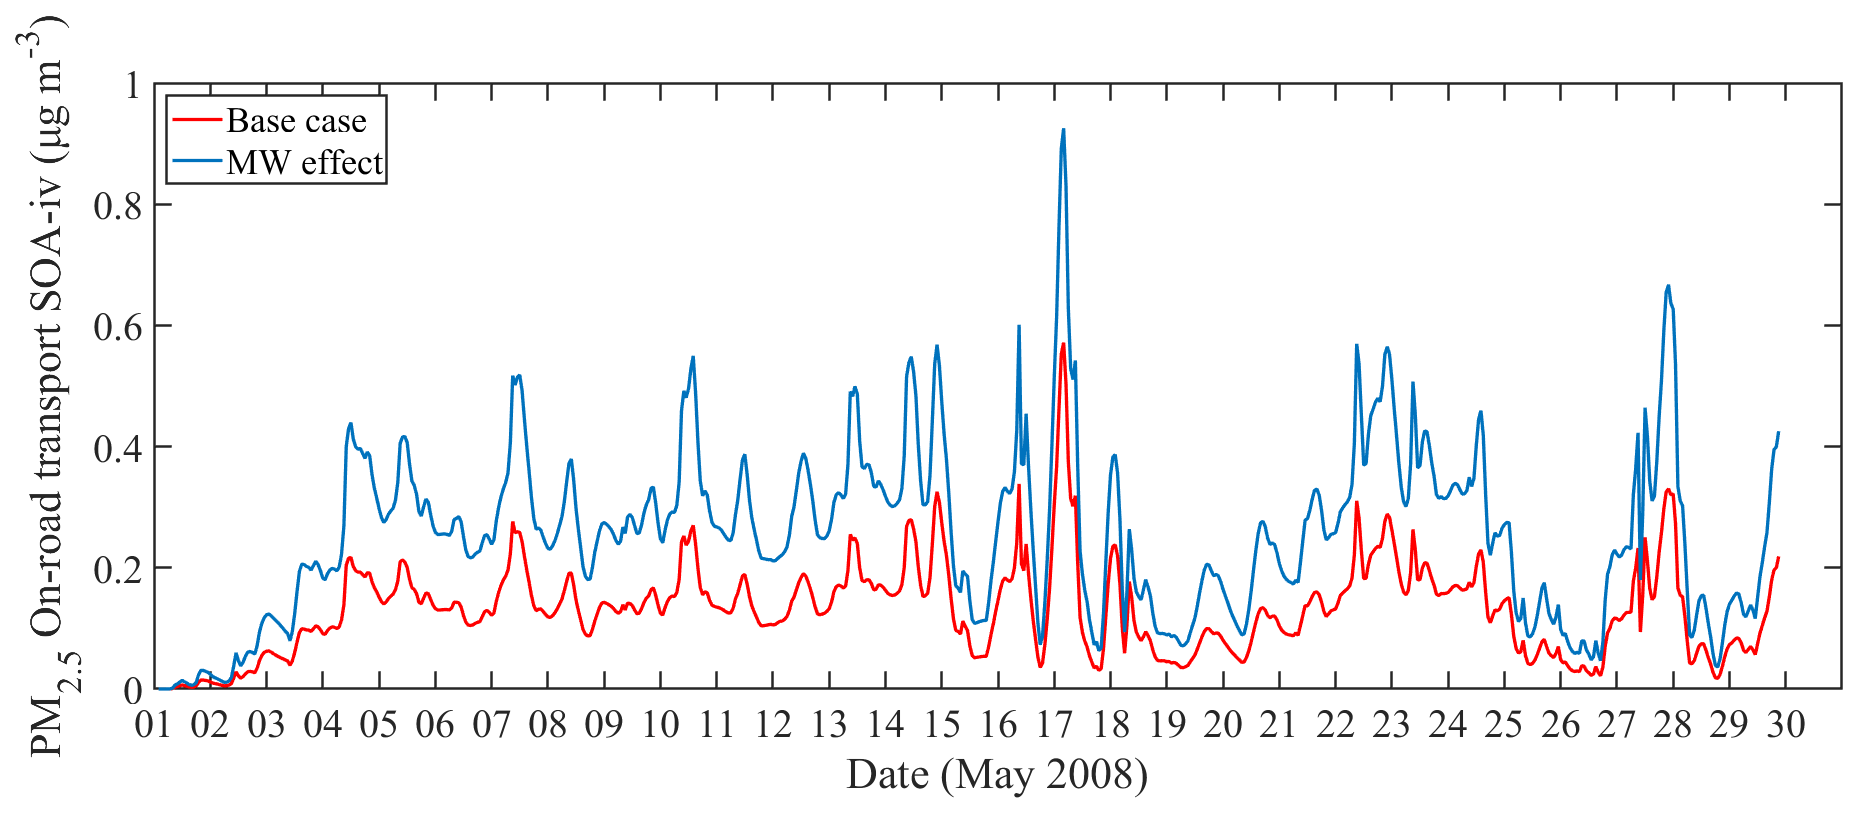
Figure 11Hourly averaged predicted ground-level concentrations of on-road transport PM2.5 SOA-iv by the base case and the MW effect test over the city of Paris for May 2008.
3.4.4 The effect of MW (molecular weight)
In the “MW effect” sensitivity test of PMCAMx-iv, the molecular weights of the five SOA-iv products were increased from 150 to 250 g mol−1. For the simulated period, this leads to a significant increase in the domain-averaged concentration of SOA-iv from 0.03 µg m−3 to 0.07 µg m−3 (Fig. S3). The SOA-iv increase is consistent throughout Europe, and it is approximately 50 % over the domain (Fig. 10). In an urban environment like in the city of Paris, the predicted SOA-iv concentrations also increase by 50 %, which leads to a peak value of 1 µg m−3 (Figs. 11 and S10).
By increasing the MW of the five SOA-iv products, the molar fraction of each product in the organic aerosol phase decreases, and subsequently the equilibrium concentrations of the secondary gas-phase condensable products also decrease, leading to increased aerosol-phase concentrations. Therefore, this is a relative important parameter for the model that should be better constrained by future experimental studies.
3.4.5 The effect of vaporization ΔH
In the “ΔH effect” sensitivity test of PMCAMx-iv, the effective vaporization enthalpy was increased from 30 to 100 kJ mol−1. Increasing the ΔHvap results in an increase of the predicted domain-average SOA-iv levels by 30 %. Compared to the base case simulation, the “ΔH effect” sensitivity test leads to higher average concentrations over northern Italy, the English Channel, and eastern Europe (Fig. 10). In Paris, the average daily SOA-iv peak concentration increases to 0.2 µg m−3 (Fig. S13). Increasing the ΔHvap affects the partitioning of the secondary products, and depending on the temperature, this can lead to either an increase or a decrease in the aerosol concentration.
3.4.6 SOA-iv yield parametrization
In the “different yields” sensitivity test, we investigate some of the assumptions about the mass-based yields of the new lumped species. Specifically, the mass-based yields of the new alkane species (ALK6–ALK9) under high-NOx conditions and those of the ARO3 species under both high- and low-NOx conditions are assumed to be 2 times higher.
On average over the domain, the different yields test predicts 10 % higher SOA-iv concentrations compared to PMCAMx-iv (Fig. 10). The effect is low because of the low concentrations of these compounds. To assess the effect of the increased yields under low-NOx conditions, we also examine the diurnal profile of the on-road transport SOA-iv concentration over Finokalia (Fig. S14 in the Supplement). Throughout the day, the different yields test predicts higher concentrations, reaching up to 0.1 µg m−3 at 20:00 LT.
A lumped species approach for the simulation of IVOCs and SOA-iv formation was implemented in a CTM, PMCAMx-iv. The new model includes updated on-road transport emissions, describes IVOC chemistry more realistically, and utilizes a new method for simulating aerosol formation from IVOCs.
For the simulated period, the maximum ground-level SOA-iv concentrations predicted by PMCAMx-iv, over major European cities like London, Paris, and Athens, can reach up to 0.63 µg m−3. If multigenerational aging is considered, the predicted on-road SOA-iv concentrations increase on average over the European domain by 67 %. This means that in an urban setting like the city of Athens, on-road IVOCs can account for 30 % of the total SOA. Moreover, PMCAMx-iv predicts that among the simulated IVOCs, the most important contributors to SOA-iv formed from on-road diesel and gasoline vehicles are unspeciated cyclic alkanes, contributing 72 % of the total SOA-iv mass. In particular, unspeciated cyclic alkanes with 15 to 20 carbons are estimated to be the most important SOA-iv precursors. Compared to a previous version of the model, that utilizes the 1D-VBS approach to simulate IVOCs, the domain-averaged concentrations of on-road SOA-iv have increased by 60 % over the simulated domain. Also, with the implementation of experimental SOA-iv yield data in PMCAMx-iv, the formation of on-road SOA-iv occurs earlier in the day than the 1D-VBS approach. It should be noted that the results presented here are indicative of spring and summer months in Europe. The effect of on-road IVOCs during winter, when other sources like biomass burning become more prominent and the weather conditions change, will be the focus of future work.
The results presented in this work may be a lower bound as the SOA-iv yields of these compounds are based on rough approximations. The sensitivity analysis on the yields and the SOA-iv parameters showed that the molecular weight can have a significant impact on the predicted SOA-iv concentrations. Future experimental results on those aspects will help constrain the effect of the assumptions made. Also due to a lack of experimental data, the current model only simulated the OH oxidation reaction of IVOCs. Further investigation of the oxidation reactions of IVOCs during nighttime is needed. The simulations indicate that as expected, on-road IVOCs and their effect on SOA and OA levels over Europe are more prominent locally in urban environments.
The source code for PMCAMx-iv is available at https://doi.org/10.5281/zenodo.6515734 (Manavi and Pandis, 2022b).
The on-road transport IVOC emissions inventory is available at https://doi.org/10.5281/zenodo.6515734 (Manavi and Pandis, 2022b). The EUCAARI observational dataset is available through the EBAS site (https://ebas-data.nilu.no/Default.aspx, EUCAARI, 2008).
The supplement related to this article is available online at: https://doi.org/10.5194/acp-24-891-2024-supplement.
SEIM and SNP designed the research. SEM implemented the lumping scheme in the model, performed the simulations, and analyzed the results. SEM wrote the paper with input from SNP.
The contact author has declared that neither of the authors has any competing interests.
Publisher's note: Copernicus Publications remains neutral with regard to jurisdictional claims made in the text, published maps, institutional affiliations, or any other geographical representation in this paper. While Copernicus Publications makes every effort to include appropriate place names, the final responsibility lies with the authors.
This research has been supported by Horizon 2020 (grant no. FORCeS 821205) and Horizon Europe Climate, Energy and Mobility (grant no. EASVOLEE 101095457).
This paper was edited by Andrea Pozzer and reviewed by Paolo Giani and two anonymous referees.
Ait-Helal, W., Borbon, A., Sauvage, S., de Gouw, J. A., Colomb, A., Gros, V., Freutel, F., Crippa, M., Afif, C., Baltensperger, U., Beekmann, M., Doussin, J.-F., Durand-Jolibois, R., Fronval, I., Grand, N., Leonardis, T., Lopez, M., Michoud, V., Miet, K., Perrier, S., Prévôt, A. S. H., Schneider, J., Siour, G., Zapf, P., and Locoge, N.: Volatile and intermediate volatility organic compounds in suburban Paris: variability, origin and importance for SOA formation, Atmos. Chem. Phys., 14, 10439–10464, https://doi.org/10.5194/acp-14-10439-2014, 2014.
An, J., Huang, C., Huang, D., Qin, M., Liu, H., Yan, R., Qiao, L., Zhou, M., Li, Y., Zhu, S., Wang, Q., and Wang, H.: Sources of organic aerosols in eastern China: a modeling study with high-resolution intermediate-volatility and semivolatile organic compound emissions, Atmos. Chem. Phys., 23, 323–344, https://doi.org/10.5194/acp-23-323-2023, 2023.
Barsanti, K. C., Carlton, A. G., and Chung, S. H.: Analyzing experimental data and model parameters: implications for predictions of SOA using chemical transport models, Atmos. Chem. Phys., 13, 12073–12088, https://doi.org/10.5194/acp-13-12073-2013, 2013.
Carter, W. P. L.: SAPRC-99 mechanism files and associated programs and examples, https://intra.cert.ucr.edu/~carter/SAPRC99/index.htm (last access: 6 July 2023), 2010.
Chan, A. W. H., Kautzman, K. E., Chhabra, P. S., Surratt, J. D., Chan, M. N., Crounse, J. D., Kürten, A., Wennberg, P. O., Flagan, R. C., and Seinfeld, J. H.: Secondary organic aerosol formation from photooxidation of naphthalene and alkylnaphthalenes: implications for oxidation of intermediate volatility organic compounds (IVOCs), Atmos. Chem. Phys., 9, 3049–3060, https://doi.org/10.5194/acp-9-3049-2009, 2009.
Chen, J. and Hoek, G.: Long-term exposure to PM and all-cause and cause-specific mortality: A systematic review and meta-analysis, Environ. Int., 143, 105974, https://doi.org/10.1016/j.envint.2020.105974, 2020.
Chen, C.-L., Kacarab, M., Tang, P., and Cocker, D. R.: SOA formation from naphthalene, 1-methylnaphthalene, and 2-methylnaphthalene photooxidation, Atmos. Environ., 131, 424–433, https://doi.org/10.1016/j.atmosenv.2016.02.007, 2016.
Ciarelli, G., El Haddad, I., Bruns, E., Aksoyoglu, S., Möhler, O., Baltensperger, U., and Prévôt, A. S. H.: Constraining a hybrid volatility basis-set model for aging of wood-burning emissions using smog chamber experiments: a box-model study based on the VBS scheme of the CAMx model (v5.40), Geosci. Model Dev., 10, 2303–2320, https://doi.org/10.5194/gmd-10-2303-2017, 2017.
Couvidat, F., Kim, Y., Sartelet, K., Seigneur, C., Marchand, N., and Sciare, J.: Modeling secondary organic aerosol in an urban area: application to Paris, France, Atmos. Chem. Phys., 13, 983–996, https://doi.org/10.5194/acp-13-983-2013, 2013.
Docherty, K. S., Yaga, R., Preston, W. T., Jaoui, M., Reidel, T. P., Offenberg, J. H., Kleindienst, T. E., and Lewandowski, M.: Relative contributions of selected multigeneration products to chamber SOA formed from photooxidation of a range (C10–C17) of n-alkanes under high NOx conditions, Atmos. Environ., 244, 117976, https://doi.org/10.1016/j.atmosenv.2020.117976, 2021.
Donahue, N. M., Robinson, A. L., Stanier, C. O., and Pandis, S. N.: Coupled partitioning, dilution, and chemical aging of semivolatile organics, Environ. Sci. Technol., 40, 2635–2643, https://doi.org/10.1021/es052297c, 2006.
Drozd, G. T., Zhao, Y., Saliba, G., Frodin, B., Maddox, C., Oliver Chang, M. C., Maldonado, H., Sardar, S., Weber, R. J., Robinson, A. L., and Goldstein, A. H.: Detailed speciation of intermediate volatility and semivolatile organic compound emissions from gasoline vehicles: Effects of cold-starts and implications for secondary organic aerosol formation, Environ. Sci. Technol., 53, 1706–1714, https://doi.org/10.1021/acs.est.8b05600, 2019.
Environ, A.: User's guide to the comprehensive air quality model with extensions (CAMx), Version 6.00., ENVIRON Int. Corp., Novato, Calif., 2013.
EUCAARI: European Integrated Project on Aerosol Cloud Climate Air Quality Interactions, EBAS [data set], https://ebas-data.nilu.no/Default.aspx (last access: 16 January 2024), 2008.
Fang, H., Huang, X., Zhang, Y., Pei, C., Huang, Z., Wang, Y., Chen, Y., Yan, J., Zeng, J., Xiao, S., Luo, S., Li, S., Wang, J., Zhu, M., Fu, X., Wu, Z., Zhang, R., Song, W., Zhang, G., Hu, W., Tang, M., Ding, X., Bi, X., and Wang, X.: Measurement report: Emissions of intermediate-volatility organic compounds from vehicles under real-world driving conditions in an urban tunnel, Atmos. Chem. Phys., 21, 10005–10013, https://doi.org/10.5194/acp-21-10005-2021, 2021.
Fountoukis, C., Racherla, P. N., Denier van der Gon, H. A. C., Polymeneas, P., Charalampidis, P. E., Pilinis, C., Wiedensohler, A., Dall'Osto, M., O'Dowd, C., and Pandis, S. N.: Evaluation of a three-dimensional chemical transport model (PMCAMx) in the European domain during the EUCAARI May 2008 campaign, Atmos. Chem. Phys., 11, 10331–10347, https://doi.org/10.5194/acp-11-10331-2011, 2011.
Fountoukis, C., Megaritis, A. G., Skyllakou, K., Charalampidis, P. E., Pilinis, C., Denier van der Gon, H. A. C., Crippa, M., Canonaco, F., Mohr, C., Prévôt, A. S. H., Allan, J. D., Poulain, L., Petäjä, T., Tiitta, P., Carbone, S., Kiendler-Scharr, A., Nemitz, E., O'Dowd, C., Swietlicki, E., and Pandis, S. N.: Organic aerosol concentration and composition over Europe: insights from comparison of regional model predictions with aerosol mass spectrometer factor analysis, Atmos. Chem. Phys., 14, 9061–9076, https://doi.org/10.5194/acp-14-9061-2014, 2014.
Giani, P., Balzarini, A., Pirovano, G., Gilardoni, S., Paglione, M., Colombi, C., Gianelle, V. L., Belis, C. A., Poluzzi, V., and Lonati, G.: Influence of semi- and intermediate-volatile organic compounds (S/IVOC) parameterizations, volatility distributions and aging schemes on organic aerosol modelling in winter conditions, Atmos. Environ., 213, 11–24, https://doi.org/10.1016/j.atmosenv.2019.05.061, 2019.
Gordon, T. D., Presto, A. A., Nguyen, N. T., Robertson, W. H., Na, K., Sahay, K. N., Zhang, M., Maddox, C., Rieger, P., Chattopadhyay, S., Maldonado, H., Maricq, M. M., and Robinson, A. L.: Secondary organic aerosol production from diesel vehicle exhaust: impact of aftertreatment, fuel chemistry and driving cycle, Atmos. Chem. Phys., 14, 4643–4659, https://doi.org/10.5194/acp-14-4643-2014, 2014.
Hatch, L. E., Yokelson, R. J., Stockwell, C. E., Veres, P. R., Simpson, I. J., Blake, D. R., Orlando, J. J., and Barsanti, K. C.: Multi-instrument comparison and compilation of non-methane organic gas emissions from biomass burning and implications for smoke-derived secondary organic aerosol precursors, Atmos. Chem. Phys., 17, 1471–1489, https://doi.org/10.5194/acp-17-1471-2017, 2017.
Hayes, P. L., Carlton, A. G., Baker, K. R., Ahmadov, R., Washenfelder, R. A., Alvarez, S., Rappenglück, B., Gilman, J. B., Kuster, W. C., de Gouw, J. A., Zotter, P., Prévôt, A. S. H., Szidat, S., Kleindienst, T. E., Offenberg, J. H., Ma, P. K., and Jimenez, J. L.: Modeling the formation and aging of secondary organic aerosols in Los Angeles during CalNex 2010, Atmos. Chem. Phys., 15, 5773–5801, https://doi.org/10.5194/acp-15-5773-2015, 2015.
Hodzic, A., Kasibhatla, P. S., Jo, D. S., Cappa, C. D., Jimenez, J. L., Madronich, S., and Park, R. J.: Rethinking the global secondary organic aerosol (SOA) budget: stronger production, faster removal, shorter lifetime, Atmos. Chem. Phys., 16, 7917–7941, https://doi.org/10.5194/acp-16-7917-2016, 2016.
Huang, C., Hu, Q., Li, Y., Tian, J., Ma, Y., Zhao, Y., Feng, J., An, J., Qiao, L., Wang, H., Jing, S., Huang, D., Lou, S., Zhou, M., Zhu, S., Tao, S., and Li, L.: Intermediate volatility organic compound emissions from a large cargo vessel operated under real-world conditions, Environ. Sci. Technol., 52, 12934–12942, https://doi.org/10.1021/acs.est.8b04418, 2018.
Huang, L., Wang, Q., Wang, Y., Emery, C., Zhu, A., Zhu, Y., Yin, S., Yarwood, G., Zhang, K., and Li, L.: Simulation of secondary organic aerosol over the Yangtze River Delta region: The impacts from the emissions of intermediate volatility organic compounds and the SOA modeling framework, Atmos. Environ., 246, 118079, https://doi.org/10.1016/j.atmosenv.2020.118079, 2021.
Huo, Y., Guo, Z., Liu, Y., Wu, D., Ding, X., Zhao, Z., Wu, M., Wang, L., Feng, Y., Chen, Y., Wang, S., Li, Q., and Chen, J.: Addressing unresolved complex mixture of I/SVOCs emitted from incomplete combustion of solid fuels by nontarget analysis, J. Geophys. Res., 126, e2021JD035835, https://doi.org/10.1029/2021JD035835, 2021.
Jathar, S. H., Farina, S. C., Robinson, A. L., and Adams, P. J.: The influence of semi-volatile and reactive primary emissions on the abundance and properties of global organic aerosol, Atmos. Chem. Phys., 11, 7727–7746, https://doi.org/10.5194/acp-11-7727-2011, 2011.
Jathar, S. H., Gordon, T. D., Hennigan, C. J., Pye, H. O. T., Pouliot, G., Adams, P. J., Donahue, N. M., and Robinson, A. L.: Unspeciated organic emissions from combustion sources and their influence on the secondary organic aerosol budget in the United States, P. Natl. Acad. Sci. USA, 111, 10473, https://doi.org/10.1073/pnas.1323740111, 2014.
Jathar, S. H., Woody, M., Pye, H. O. T., Baker, K. R., and Robinson, A. L.: Chemical transport model simulations of organic aerosol in southern California: model evaluation and gasoline and diesel source contributions, Atmos. Chem. Phys., 17, 4305–4318, https://doi.org/10.5194/acp-17-4305-2017, 2017.
Koo, B., Knipping, E., and Yarwood, G.: 1.5-Dimensional volatility basis set approach for modeling organic aerosol in CAMx and CMAQ, Atmos. Environ., 95, 158–164, https://doi.org/10.1016/j.atmosenv.2014.06.031, 2014.
Kulmala, M., Asmi, A., Lappalainen, H. K., Carslaw, K. S., Pöschl, U., Baltensperger, U., Hov, Ø., Brenquier, J.-L., Pandis, S. N., Facchini, M. C., Hansson, H.-C., Wiedensohler, A., and O'Dowd, C. D.: Introduction: European Integrated Project on Aerosol Cloud Climate and Air Quality interactions (EUCAARI) – integrating aerosol research from nano to global scales, Atmos. Chem. Phys., 9, 2825–2841, https://doi.org/10.5194/acp-9-2825-2009, 2009.
Lane, T. E., Donahue, N. M., and Pandis, S. N.: Simulating secondary organic aerosol formation using the volatility basis-set approach in a chemical transport model, Atmos. Environ., 42, 7439–7451, https://doi.org/10.1016/j.atmosenv.2008.06.026, 2008.
Lannuque, V., Couvidat, F., Camredon, M., Aumont, B., and Bessagnet, B.: Modeling organic aerosol over Europe in summer conditions with the VBS-GECKO parameterization: sensitivity to secondary organic compound properties and IVOC (intermediate-volatility organic compound) emissions, Atmos. Chem. Phys., 20, 4905–4931, https://doi.org/10.5194/acp-20-4905-2020, 2020.
Li, J., Han, Z., Li, J., Liu, R., Wu, Y., Liang, L., and Zhang, R.: The formation and evolution of secondary organic aerosol during haze events in Beijing in wintertime, Sci. Total Environ., 703, 134937, https://doi.org/10.1016/j.scitotenv.2019.134937, 2020.
Li, W., Li, L., Chen, C.-l., Kacarab, M., Peng, W., Price, D., Xu, J., and Cocker, D. R.: Potential of select intermediate-volatility organic compounds and consumer products for secondary organic aerosol and ozone formation under relevant urban conditions, Atmos. Environ., 178, 109–117, https://doi.org/10.1016/j.atmosenv.2017.12.019, 2018.
Li, Y., Ren, B., Qiao, Z., Zhu, J., Wang, H., Zhou, M., Qiao, L., Lou, S., Jing, S., Huang, C., Tao, S., Rao, P., and Li, J.: Characteristics of atmospheric intermediate volatility organic compounds (IVOCs) in winter and summer under different air pollution levels, Atmos. Environ., 210, 58–65, https://doi.org/10.1016/j.atmosenv.2019.04.041, 2019.
Ling, Z., Wu, L., Wang, Y., Shao, M., Wang, X., and Huang, W.: Roles of semivolatile and intermediate-volatility organic compounds in secondary organic aerosol formation and its implication: A review, J. Environ. Sci., 114, 259–285, https://doi.org/10.1016/j.jes.2021.08.055, 2022.
Lou, H., Hao, Y., Zhang, W., Su, P., Zhang, F., Chen, Y., Feng, D., and Li, Y.: Emission of intermediate volatility organic compounds from a ship main engine burning heavy fuel oil, J. Environ. Sci., 84, 197–204, https://doi.org/10.1016/j.jes.2019.04.029, 2019.
Lu, Q., Zhao, Y., and Robinson, A. L.: Comprehensive organic emission profiles for gasoline, diesel, and gas-turbine engines including intermediate and semi-volatile organic compound emissions, Atmos. Chem. Phys., 18, 17637–17654, https://doi.org/10.5194/acp-18-17637-2018, 2018.
Lu, Q., Murphy, B. N., Qin, M., Adams, P. J., Zhao, Y., Pye, H. O. T., Efstathiou, C., Allen, C., and Robinson, A. L.: Simulation of organic aerosol formation during the CalNex study: updated mobile emissions and secondary organic aerosol parameterization for intermediate-volatility organic compounds, Atmos. Chem. Phys., 20, 4313–4332, https://doi.org/10.5194/acp-20-4313-2020, 2020.
Manavi, S. E. I. and Pandis, S. N.: A lumped species approach for the simulation of secondary organic aerosol production from intermediate-volatility organic compounds (IVOCs): application to road transport in PMCAMx-iv (v1.0), Geosci. Model Dev., 15, 7731–7749, https://doi.org/10.5194/gmd-15-7731-2022, 2022a.
Manavi, S. E. I. and Pandis, S. N.: Code and data: A lumped species approach for the simulation of secondary organic aerosol production from intermediate volatility organic compounds (IVOCs): Application to road transport in PMCAMx-iv (v1.0), Geoscientific Model Development, Zenodo [data set and code], https://doi.org/10.5281/zenodo.6515734, 2022.
Miao, R., Chen, Q., Shrivastava, M., Chen, Y., Zhang, L., Hu, J., Zheng, Y., and Liao, K.: Process-based and observation-constrained SOA simulations in China: the role of semivolatile and intermediate-volatility organic compounds and OH levels, Atmos. Chem. Phys., 21, 16183–16201, https://doi.org/10.5194/acp-21-16183-2021, 2021.
Murphy, B. N. and Pandis, S. N.: Simulating the formation of semivolatile primary and secondary organic aerosol in a regional chemical transport model, Environ. Sci. Technol., 43, 4722–4728, https://doi.org/10.1021/es803168a, 2009.
Murphy, B. N. and Pandis, S. N.: Exploring summertime organic aerosol formation in the eastern United States using a regional-scale budget approach and ambient measurements, J. Geophys. Res.-Atmos., 115, D24216, https://doi.org/10.1029/2010JD014418, 2010.
O'Dowd, C. D., Langmann, B., Varghese, S., Scannell, C., Ceburnis, D., and Facchini, M. C.: A combined organic-inorganic sea-spray source function, Geophys. Res. Lett., 35, L011801, https://doi.org/10.1029/2007GL030331, 2008.
Ots, R., Young, D. E., Vieno, M., Xu, L., Dunmore, R. E., Allan, J. D., Coe, H., Williams, L. R., Herndon, S. C., Ng, N. L., Hamilton, J. F., Bergström, R., Di Marco, C., Nemitz, E., Mackenzie, I. A., Kuenen, J. J. P., Green, D. C., Reis, S., and Heal, M. R.: Simulating secondary organic aerosol from missing diesel-related intermediate-volatility organic compound emissions during the Clean Air for London (ClearfLo) campaign, Atmos. Chem. Phys., 16, 6453–6473, https://doi.org/10.5194/acp-16-6453-2016, 2016.
Pennington, E. A., Seltzer, K. M., Murphy, B. N., Qin, M., Seinfeld, J. H., and Pye, H. O. T.: Modeling secondary organic aerosol formation from volatile chemical products, Atmos. Chem. Phys., 21, 18247–18261, https://doi.org/10.5194/acp-21-18247-2021, 2021.
Pond, Z. A., Hernandez, C. S., Adams, P. J., Pandis, S. N., Garcia, G. R., Robinson, A. L., Marshall, J. D., Burnett, R., Skyllakou, K., Garcia Rivera, P., Karnezi, E., Coleman, C. J., and Pope, C. A.: Cardiopulmonary mortality and fine particulate air pollution by species and source in a National U. S. Cohort, Environ. Sci. Technol., 56, 7214–7223, https://doi.org/10.1021/acs.est.1c04176, 2021.
Presto, A. A., Miracolo, M. A., Kroll, J. H., Worsnop, D. R., Robinson, A. L., and Donahue, N. M.: Intermediate-volatility organic compounds: a potential source of ambient oxidized organic aerosol, Environ. Sci. Technol., 43, 4744–4749, https://doi.org/10.1021/es803219q, 2009.
Presto, A. A., Nguyen, N. T., Ranjan, M., Reeder, A. J., Lipsky, E. M., Hennigan, C. J., Miracolo, M. A., Riemer, D. D., and Robinson, A. L.: Fine particle and organic vapor emissions from staged tests of an in-use aircraft engine, Atmos. Environ., 45, 3603–3612, https://doi.org/10.1016/j.atmosenv.2011.03.061, 2011.
Pye, H. O. T. and Seinfeld, J. H.: A global perspective on aerosol from low-volatility organic compounds, Atmos. Chem. Phys., 10, 4377–4401, https://doi.org/10.5194/acp-10-4377-2010, 2010.
Qi, L., Liu, H., Shen, X. e., Fu, M., Huang, F., Man, H., Deng, F., Shaikh, A. A., Wang, X., Dong, R., Song, C., and He, K.: Intermediate-volatility organic compound emissions from nonroad construction machinery under different operation modes, Environ. Sci. Technol., 53, 13832–13840, https://doi.org/10.1021/acs.est.9b01316, 2019.
Qian, Z., Chen, Y., Liu, Z., Han, Y., Zhang, Y., Feng, Y., Shang, Y., Guo, H., Li, Q., Shen, G., Chen, J., and Tao, S.: Intermediate volatile organic compound emissions from residential solid fuel combustion based on field measurements in rural China, Environ. Sci. Technol., 55, 5689–5700, https://doi.org/10.1021/acs.est.0c07908, 2021.
Robinson, A. L., Donahue, N. M., Shrivastava, M. K., Weitkamp, E. A., Sage, A. M., Grieshop, A. P., Lane, T. E., Pierce, J. R., and Pandis, S. N.: Rethinking organic aerosols: semivolatile emissions and photochemical aging, Science, 315, 1259–1262, https://doi.org/10.1126/science.1133061, 2007.
Sartelet, K., Zhu, S., Moukhtar, S., André, M., André, J. M., Gros, V., Favez, O., Brasseur, A., and Redaelli, M.: Emission of intermediate, semi and low volatile organic compounds from traffic and their impact on secondary organic aerosol concentrations over Greater Paris, Atmos. Environ., 180, 126–137, https://doi.org/10.1016/j.atmosenv.2018.02.031, 2018.
Schauer, J. J., Kleeman, M. J., Cass, G. R., and Simoneit, B. R. T.: Measurement of emissions from air pollution sources. 2. C1 through C30 organic compounds from medium duty diesel trucks, Environ. Sci. Technol., 33, 1578–1587, https://doi.org/10.1021/es980081n, 1999.
Schauer, J. J., Kleeman, M. J., Cass, G. R., and Simoneit, B. R. T.: Measurement of emissions from air pollution sources. 3. C1–C29 Organic compounds from fireplace combustion of wood, Environ. Sci. Technol., 35, 1716–1728, https://doi.org/10.1021/es001331e, 2001.
Seltzer, K. M., Pennington, E., Rao, V., Murphy, B. N., Strum, M., Isaacs, K. K., and Pye, H. O. T.: Reactive organic carbon emissions from volatile chemical products, Atmos. Chem. Phys., 21, 5079–5100, https://doi.org/10.5194/acp-21-5079-2021, 2021.
Sicard, P., Agathokleous, E., De Marco, A., Paoletti, E., and Calatayud, V.: Urban population exposure to air pollution in Europe over the last decades, Environ. Sci. Eur., 33, 28, https://doi.org/10.1186/s12302-020-00450-2, 2021.
Skamarock, W. C., Klemp, J. B., Dudhia, J., Gill, D. O., Barker, D. M., Duda, M. G., Huang, X., Wang, W., and Powers, J. G.: A Description of the advanced Research WRF version 3, NCAR Technical, http://www.mmm.ucar.edu/wrf/users/docs/arw_v3.pdf (last access: 6 July 2023), 2008.
Su, P., Hao, Y., Qian, Z., Zhang, W., Chen, J., Zhang, F., Yin, F., Feng, D., Chen, Y., and Li, Y.: Emissions of intermediate volatility organic compound from waste cooking oil biodiesel and marine gas oil on a ship auxiliary engine, J. Environ. Sci., 91, 262–270, https://doi.org/10.1016/j.jes.2020.01.008, 2020.
Tang, R., Lu, Q., Guo, S., Wang, H., Song, K., Yu, Y., Tan, R., Liu, K., Shen, R., Chen, S., Zeng, L., Jorga, S. D., Zhang, Z., Zhang, W., Shuai, S., and Robinson, A. L.: Measurement report: Distinct emissions and volatility distribution of intermediate-volatility organic compounds from on-road Chinese gasoline vehicles: implication of high secondary organic aerosol formation potential, Atmos. Chem. Phys., 21, 2569–2583, https://doi.org/10.5194/acp-21-2569-2021, 2021.
Tkacik, D. S., Presto, A. A., Donahue, N. M., and Robinson, A. L.: Secondary organic aerosol formation from intermediate-volatility organic compounds: cyclic, linear, and branched alkanes, Environ. Sci. Technol., 46, 8773–8781, https://doi.org/10.1021/es301112c, 2012.
Tsimpidi, A. P., Karydis, V. A., Zavala, M., Lei, W., Molina, L., Ulbrich, I. M., Jimenez, J. L., and Pandis, S. N.: Evaluation of the volatility basis-set approach for the simulation of organic aerosol formation in the Mexico City metropolitan area, Atmos. Chem. Phys., 10, 525–546, https://doi.org/10.5194/acp-10-525-2010, 2010.
Tsimpidi, A. P., Karydis, V. A., Zavala, M., Lei, W., Bei, N., Molina, L., and Pandis, S. N.: Sources and production of organic aerosol in Mexico City: insights from the combination of a chemical transport model (PMCAMx-2008) and measurements during MILAGRO, Atmos. Chem. Phys., 11, 5153–5168, https://doi.org/10.5194/acp-11-5153-2011, 2011.
Visschedijk, A. J. H., Zandveld, P., and Denier van der Gon, H. A. C.: A high resolution gridded European emission database for the EU integrated project GEMS, TNO Report 2007 A-R0233/B, Organization for Applied Scientific Research, the Netherlands,2007.
Wu, L., Ling, Z., Liu, H., Shao, M., Lu, S., Wu, L., and Wang, X.: A gridded emission inventory of semi-volatile and intermediate volatility organic compounds in China, Sci. Total Environ., 761, 143295, https://doi.org/10.1016/j.scitotenv.2020.143295, 2021.
Yee, L. D., Craven, J. S., Loza, C. L., Schilling, K. A., Ng, N. L., Canagaratna, M. R., Ziemann, P. J., Flagan, R. C., and Seinfeld, J. H.: Effect of chemical structure on secondary organic aerosol formation from C12 alkanes, Atmos. Chem. Phys., 13, 11121–11140, https://doi.org/10.5194/acp-13-11121-2013, 2013.
Zhang, Q., Jimenez, J. L., Canagaratna, M. R., Allan, J. D., Coe, H., Ulbrich, I., Alfarra, M. R., Takami, A., Middlebrook, A. M., Sun, Y. L., Dzepina, K., Dunlea, E., Docherty, K., DeCarlo, P. F., Salcedo, D., Onasch, T., Jayne, J. T., Miyoshi, T., Shimono, A., Hatakeyama, S., Takegawa, N., Kondo, Y., Schneider, J., Drewnick, F., Borrmann, S., Weimer, S., Demerjian, K., Williams, P., Bower, K., Bahreini, R., Cottrell, L., Griffin, R. J., Rautiainen, J., Sun, J. Y., Zhang, Y. M., and Worsnop, D. R.: Ubiquity and dominance of oxygenated species in organic aerosols in anthropogenically-influenced Northern Hemisphere midlatitudes, Geophys. Res. Lett., 34, L13801, https://doi.org/10.1029/2007GL029979, 2007.
Zhang, X. and Seinfeld, J. H.: A functional group oxidation model (FGOM) for SOA formation and aging, Atmos. Chem. Phys., 13, 5907–5926, https://doi.org/10.5194/acp-13-5907-2013, 2013.
Zhao, B., Wang, S., Donahue, N. M., Jathar, S. H., Huang, X., Wu, W., Hao, J., and Robinson, A. L.: Quantifying the effect of organic aerosol aging and intermediate-volatility emissions on regional-scale aerosol pollution in China, Sci. Rep.-UK, 6, 28815, https://doi.org/10.1038/srep28815, 2016.
Zhao, Y., Hennigan, C. J., May, A. A., Tkacik, D. S., de Gouw, J. A., Gilman, J. B., Kuster, W. C., Borbon, A., and Robinson, A. L.: Intermediate-volatility organic compounds: a large source of secondary organic aerosol, Environ. Sci. Technol., 48, 13743–13750, https://doi.org/10.1021/es5035188, 2014.
Zhao, Y., Nguyen, N. T., Presto, A. A., Hennigan, C. J., May, A. A., and Robinson, A. L.: Intermediate volatility organic compound emissions from on-road diesel vehicles: chemical composition, emission factors, and estimated secondary organic aerosol production, Environ. Sci. Technol., 49, 11516–11526, https://doi.org/10.1021/acs.est.5b02841, 2015.
Zhao, Y., Nguyen, N. T., Presto, A. A., Hennigan, C. J., May, A. A., and Robinson, A. L.: Intermediate volatility organic compound emissions from on-road gasoline vehicles and small off-road gasoline engines, Environ. Sci. Technol., 50, 4554–4563, https://doi.org/10.1021/acs.est.5b06247, 2016.