the Creative Commons Attribution 4.0 License.
the Creative Commons Attribution 4.0 License.
 | 01 Aug 2024
Characteristics and sources of nonmethane volatile organic compounds (NMVOCs) and O3–NOx–NMVOC relationships in Zhengzhou, China
Dong Zhang
Xiao Li
Minghao Yuan
Yifei Xu
Qixiang Xu
Fangcheng Su
Shenbo Wang
Ruiqin Zhang
Nonmethane volatile organic compounds (NMVOCs) are important precursors of ozone (O3) formation under sufficient nitrogen oxide conditions. Understanding the characteristics and emission sources of NMVOCs, as well as the relationship between NMVOCs and O3, is of great significance for effective O3 pollution control. In this study, continuous online monitoring of NMVOCs was carried out in Zhengzhou, Henan, from 1–30 June. Furthermore, the study provided recommendations for strategies aimed at reducing O3 formation. During the observation period, the concentration of total NMVOCs (TNMVOCs) varied from 9.9 to 60.3 ppbv, with an average of 22.8 ± 8.3 ppbv. The average concentration of TNMVOCs during O3 pollution events was higher than on clean days. Six major sources of NMVOCs were identified using the positive-matrix-factorization model. Vehicular exhausts (28 %), solvent usage (27 %), and industrial production (22 %) were the main sources. We explore the O3–precursors relationship and propose observation-oriented O3 control strategies. The results of the relative incremental reactivity (RIR) and the Empirical Kinetics Modeling Approach show that Zhengzhou was under an anthropogenic volatile organic compound (AVOC)-limited regime. NMVOCs had the largest RIR value, while NOx exhibited a negative RIR value. It is noteworthy that the sensitivity of O3 formation to biogenic volatile organic compounds (BVOCs) was greater than that to AVOCs. Considering the reduction effect, it is recommended that the ratio of AVOCs to NOx be maintained at no less than 3:1 to effectively reduce O3 formation.
- Article
(5570 KB) - Full-text XML
-
Supplement
(1758 KB) - BibTeX
- EndNote


In recent years, ozone (O3) pollution has become increasingly prominent in China, especially in urban areas (B. Liu et al., 2023; Zhao et al., 2021; Yan et al., 2023; Sicard et al., 2020). O3 pollution is an important factor affecting ambient air quality (Zhang et al., 2023). Nonmethane volatile organic compounds (NMVOCs) are an important precursor of O3 and secondary organic aerosols; they widely exist in the atmospheric environment and participate in many photochemical reactions, significantly affecting atmospheric oxidation capacity and air quality (Zhu et al., 2021). Some NMVOCs are also air toxics (Billionnet et al., 2011), e.g., benzene, trichloroethylene, and chloroform (Lerner et al., 2012). Long-term exposure to higher concentrations of NMVOCs can lead to acute or chronic health risks (He et al., 2015). Therefore, it is necessary to continue carrying out NMVOC-monitoring activities in O3 pollution areas to analyze the concentrations levels and sources of NMVOCs, as well as their effects on O3 generation.
The concentration of NMVOCs is affected by background concentration levels, weather conditions (Mo et al., 2015), emission sources, terrain conditions (Liu et al., 2016), and the extent of pollutant transport (Shao et al., 2009). In addition, under meteorological conditions with higher temperatures, NMVOCs exhibit photochemical losses during dispersion and regional transport (Zou et al., 2023; B. Liu et al., 2023; Liu et al., 2020). As a result, ambient NMVOC concentrations vary with locality and season. For example, in typical coastal areas of Ningbo, seasonal variation in NMVOC concentrations is of the following order: winter, spring, fall, and summer (Huang et al., 2023). The coastal areas of Shandong exhibit the highest values in winter (28.5 ± 15.1 ppbv) and the lowest value in fall (14.5 ± 7.6 ppbv) (Huang et al., 2023). The average summer concentration of total NMVOCs (TNMVOCs) in the suburbs of Jinan (12.0 ± 5.1 ppbv) (Z. Liu et al., 2023b) is lower than that in the suburbs of Beijing (18.3 ± 8.9 ppb) and much lower than that in the central city of Beijing (44.0 ± 28.9 ppbv) (Wu et al., 2023a). The average TNMVOC concentration (21.7 ppbv) during the O3 pollution period in Tianjin is 12 % higher than during the period with no O3 pollution (B. Liu et al., 2023).
NMVOCs are emitted from various sources, including both anthropogenic sources and biogenic sources (Chameides et al., 1992), as well as through secondary generation via photochemical reactions (Yuan et al., 2012). The main sources of NMVOCs include motor vehicle emissions, industrial processes, solvent usage, fuel evaporation, combustion, and biogenic emissions (Wu et al., 2016; Prendez et al., 2013; Watson et al., 2001). Biogenic emissions are mainly affected by temperature and radiation conditions (Li et al., 2020). Biogenic emissions are therefore higher during hotter months, especially in summer (Pacifico et al., 2009; Xu et al., 2023). Urban areas are greatly affected by anthropogenic sources (Zhang et al., 2023; Goldstein and Galbally, 2007). In different regions, the main contribution sources of NMVOCs vary. For example, the main sources of anthropogenic volatile organic compounds (AVOCs) in the Yangtze River Delta region of China are vehicle emissions and solvent evaporation (Xu et al., 2023). The Pearl River Delta region is mainly affected by solvent use, the use of liquefied petroleum gas, and vehicle exhaust emissions. Atmospheric NMVOCs in Beijing are greatly influenced by motor vehicle emission sources and combustion sources (Liu et al., 2021; Zhang et al., 2020). Huang et al. (2023) reported that plastic synthesis, industrial processes, organic solvents, dyeing, traffic emissions, and pesticides have been identified as the main sources of NMVOCs in the city of Ningbo, a coastal area (Z. Liu et al., 2023a). Since different emission sources contribute differently to NMVOCs and thus have different impacts on the generation of O3 (Zhang et al., 2023), it is necessary to investigate the sources of NMVOCs in different cities.
Designing a reasonable and effective precursor emission control strategy is crucial for controlling the photochemical generation of O3 (Yang et al., 2021). The relationship between O3 and its precursors is nonlinear (Chameides et al., 1992), and precursor emission reduction strategies need to be dynamically adjusted based on the actual sensitivity of O3 formation (Chu et al., 2023; Lin et al., 2005). The observation-based model (OBM) is a widely used tool for analyzing O3–NOx–NMVOC sensitivity (Zhang et al., 2008; Nelson et al., 2021; Cardelino and Chameides, 1995). Several studies in China have analyzed the sensitivity of O3 to precursors and control scenarios. For example, O3 in the central area of the Yangtze River Delta is under an NMVOC-limited regime, and AVOCs play a leading role in the formation of O3 (Z. Liu et al., 2023a). Chengdu is in a typical NMVOC-restricted area, meaning NMVOC emission reduction helps to prevent and control O3 pollution. The emission reduction scenario based on NMVOC sources showed that the emission reduction ratio of NMVOCs to NO2 needs to exceed 3:1 to prevent O3 pollution (Chen et al., 2022b). Xie et al. (2021) found that controlling NMVOCs in Leshan, a nonprovincial capital city in southwestern China, can effectively reduce the photochemical generation of O3; they also pointed out that the best emission reduction strategy for NMVOCs and NOx involves a ratio of 3:1. In addition, the generation of O3 in areas like Shanghai (Lu et al., 2023), Rizhao (Zhang et al., 2023), and Nanjing (Mozaffar et al., 2021) is generally limited by NMVOCs. However, in the United States and European countries, O3 formation has gradually transitioned from an NMVOC-limited regime to an NOx-limited regime (Nopmongcol et al., 2012; Ring et al., 2018; Goldberg et al., 2016).
Zhengzhou is the capital city of the province of Henan and an important transportation hub in China. High population density levels, extensive vehicle ownership (MPS, 2022), and complex industrial structures determine the complexity of NMVOC emission sources. In recent years, O3 pollution in Zhengzhou has intensified, making it one of the cities with the highest O3 pollution levels in central China (M. Wang et al., 2023; Min et al., 2022). In each year from 2020 to 2022, the annual 90th percentile of the mean maximum daily 8 h average of O3, published by the Zhengzhou Ecological Environment Bureau, was 182, 177, and 178 µg m−3, respectively – i.e., 10 % to 13 % higher than Grade II of the National Ambient Air Quality Standards (160 µg m−3) (https://sthjj.zhengzhou.gov.cn/, last access: June 2023). Some studies have analyzed the concentration levels, sources, and impacts of NMVOCs on O3 in Zhengzhou (Zeng et al., 2023; M. Wang et al., 2023; Min et al., 2022). Wang et al. (2022) analyzed the sensitivity of O3 to precursors and found that in July, with low O3 levels in Zhengzhou, O3 formation is under an NMVOC-limited regime, while on days with O3 pollution accumulation and persistence, O3 formation is in a transitional state. Yu et al. (2021) showed that Zhengzhou is under an NMVOC-sensitive regime in September. These studies show that it is important to study emission reduction of precursors to control O3 generation. However, there is still a lack of relevant research with respect to June, the month with the highest O3 pollution levels in Zhengzhou. In order to effectively address the increasingly serious trend of O3 pollution in Zhengzhou, it is necessary to prioritize and strengthen research in the Zhengzhou area, especially during periods of high O3 pollution. Therefore, it is necessary to continue to pay attention to the pollution levels of O3 and precursors in Zhengzhou and further explore the relationship between them.
In this study, we conducted online measurements of NMVOCs in June, when O3 pollution is severe in Zhengzhou. The concentrations of, composition of, and diurnal variation in NMVOCs in the atmosphere were analyzed. The main sources of NMVOCs were discussed using the ratio method and the positive-matrix-factorization (PMF) model. The OBM was used to analyze the sensitivity of O3–NOx–NMVOC relationships, and consequently, we proposed an emission reduction strategy for precursors to control O3 concentrations. This study establishes a collaborative control strategy for atmospheric NMVOCs, which is of great significance for managing atmospheric O3 pollution in Zhengzhou.
2.1 Sampling site
The monitoring site is located on the roof (about 20 m above ground) of the building at the Environmental Protection Monitoring Center Station of Zhengzhou (34.75° N, 113.60° E) (Fig. S1 in the Supplement). The sampling site is a typical urban site that is surrounded by residential areas, commercial areas, and office buildings. There are no point sources of air pollution within a radius of 1 km. The sampling site may be affected by motor vehicle and plant emissions.
2.2 Sample collection and chemical analysis
The sampling campaign was conducted from 1–30 June 2023. NMVOC concentrations were observed using a gas chromatography–mass spectrometer (GC–MS; TH-PKU 300B, Wuhan Tianhong Instrument Co. Ltd, China), which employs detection technology with an ultralow-temperature preconcentration combined with a GC–MS/flame ionization detector (FID). The time resolution of the instrument is 1 h, and the flow rate is 60 mL min−1. The air samples were collected for the first 5 min of each hour and then preconcentrated through a cold trap to remove H2O2 and CO2. The samples were captured using an empty capillary column. After preconcentration, the samples were desorbed by rapid heating and introduced into an analytical system. After separation via a chromatographic column, the samples were detected using the FID (for C2–C5 hydrocarbons) and the MS (for C5–C12 hydrocarbons, halocarbons, and oxygenated volatile organic compounds (OVOCs)). The correlation coefficient of the standard curve for the target compound was greater than or equal to 0.99, and the detection limit of the instrument method was less than or equal to 0.1 nmol mol−1. A total of 115 NMVOCs were monitored, including 29 alkanes, 11 alkenes, 1 alkyne, 17 aromatic hydrocarbons, 35 halogenated hydrocarbons, 21 OVOCs, and 1 sulfide (carbon disulfide). Details of the device can be found in our previous study (Zhang et al., 2021). The individual NMVOC concentrations measured during the observation period are shown in Table S1 in the Supplement. Additionally, the study conducted simultaneous online measurements of hourly concentrations of particulate matter (PM2.5 and PM10 (not discussed below)), other trace gases (CO, O3, NO, and SO2), and meteorological data (temperature (T), relative humidity (RH), atmospheric pressure, wind speed (WS), and wind direction (WD)).
2.3 PMF model
The PMF 5.0 model is an advanced multivariate factor analysis tool (USEPA, 2014) that can be used to identify the sources of NMVOCs (Norris et al., 2014). The PMF model is expressed as follows:
where, i, j, and k represent the ith sample, the jth chemical species, and the kth factor, respectively. X represents the concentrations of the chemical species measured in the sample, g is the species contribution, f is the species fraction, and e is the residual matrix.
The number of factors is obtained by minimizing the objective residual function Q as follows:
where μij is the sample data uncertainty.
The sample data uncertainty (Unc) is calculated using Eqs. (3) and (4). If the data concentration is less than the method detection limit (MDL), Eq. (3) is used. Otherwise, Eq. (4) is used. The equations are as follows:
where “Error Fraction” represents the precision (%) of each species.
Species with a high proportion of missing samples or with concentration values more than 25 % below the MDLs were excluded, while NMVOCs serving as typical tracers of emission sources were included (USEPA, 2014). NMVOCs with short atmospheric lifetimes were also excluded (Callén et al., 2014; Guo et al., 2011). In this study, 29 out of 115 NMVOCs collected over the sampling period were analyzed by the PMF model. In this study, a seven-factor solution (; Fpeak=0, where Fpeak refers to a parameter used to control the rotation of factor-loading matrices in factor analysis) was chosen (Fig. S2 in the Supplement).
2.4 Conditional-probability-function analysis
The conditional probability function (CPF) is a source identification tool that can be used to identify local emission sources of pollutants (Uria-Tellaetxe and Carslaw, 2014). CPF analysis methods were employed to determine the potential direction of emission sources by utilizing wind directions and source contributions calculated through the PMF model (Kim and Hopke, 2004). The CPF is defined as
where mΔθ represents the frequency of occurrences from the wind sector Δθ for the top 75 % of the contributions from each identified NMVOC source, while nΔθ represents the total occurrences from the same wind sector. The CPF analyses were conducted using the “openair” package (Carslaw and Ropkins, 2012) in the statistical software R (R Foundation for Statistical Computing, Vienna, Austria).
2.5 OBM
An OBM configured with the Master Chemical Mechanism (MCM v3.3.1; https://mcm.york.ac.uk/MCM/, last access: May 2024) was employed to estimate the effect of changes in precursors on O3 (Liu et al., 2022). Detailed information about the OBM can be viewed in previous studies (Chu et al., 2023; Ling et al., 2011). Briefly, the OBM is a zero-dimensional model that assumes a well-mixed atmosphere and, combined with atmospheric chemical mechanisms, simulates the O3 production rate and the corresponding O3 concentration at a given time (Kleinman, 2000).
The OBM used in this study iteratively solves a set of ordinary differential equations (ODEs) that describe the evolution of species concentrations over time. For species with observed concentrations (normally consisting of primary NMVOCs and NOx), horizontal convection and emissions are normally significant. In a zero-dimensional model, these processes are incorporated into Rother. Within each iteration, Rother is determined using Eq. (6):
where Pi and LiCi represent the total production rate and total loss rate, respectively. Moreover, represents the sum of the mixing and deposition rates; represents the mass exchange rate with the background atmosphere; Raero,i and Raq,i are the rates of aerosol and aqueous processes, respectively; and denotes the real rate of change in concentration, which is interpolated from hourly observed data points.
With the value of Rother explicitly determined from Eq. (6), the concentrations of all species are predicted by integrating the governing Eq. (7), which is expressed as
New iterations start with updated Rother values based on the concentrations predicted in the previous step, continuing until a converged solution is obtained.
In this model, the net production rate of O3 (P(O3)) is determined as the difference between O3 production (the oxidation of NO by HO2 and RO2) and O3 destruction (i.e., O3 photolysis, reactions of O3 with OH and HO2, reactions of OH with NO2, and reactions of O3 with alkenes). This method for estimating O3 production and removal rates has been utilized in several previous studies (Wang et al., 2017, 2022). The constant (k) serves as the rate coefficient in the following reactions:
The relative incremental reactivity (RIR) was computed through the OBM to evaluate the sensitivity of the photochemical production of O3 to changes in the concentration of individual precursors within a given region (Ling et al., 2013; Cardelino and Chameides, 2000). It is calculated as follows:
where X is a specific precursor of O3, and denote the net production of O3 simulated by the OBM, and represents the change in the concentration of S(X). Large changes in primary pollutants (>20 %) deviate greatly from the base scenario and are not representative of the current situation. Therefore, the concentration changes in were assumed to be 20 %. In this study, the values of S for NMVOCs and NOx were reduced by 0 %–100 %. The relative change in with S(NMVOCs) and S(NOx) can be expressed as an isogram of .
The concentrations of trace gases (SO2, O3, CO, and NO) and meteorological parameters (T, RH, and WS) with a 1 h time resolution were used as constraints in this model. At the same time, the concentrations of 75 NMVOCs observed using a 1 h time resolution were selected for input into the model as these 75 NMVOCs were included in MCM v3.3.1. The values for the photolysis frequency (J(H2O2), J(NO2)) and the planetary boundary layer are set to their default values. The setup and parameters of the OBM are summarized in Table S2 in the Supplement.
To evaluate the performance of this model, the index of agreement (IOA) was used in this study (Huang et al., 2005):
where Oi, Mi, and represent the hourly values of the observation, the simulation, and the average of the observations, respectively. In various studies, model simulation results are often considered acceptable when the IOA value falls within the range of 0.68 to 0.89 (Wang et al., 2018). To evaluate the reliability of our model simulations, we conducted an analysis of O3 concentration in the atmosphere and calculated the IOA values. Our model does not directly incorporate O3 observations. Instead, it utilizes concentrations of trace gases (SO2, CO, and NO) and 75 NMVOCs, as well as meteorological parameters (T, RH, and WS), to simulate the concentration of O3 in the atmospheric environment. The IOA values for O3 were calculated from 07:00 to 19:00 LT during the day a result of 0.8 was obtained. Therefore, the results simulated by our model are reliable.
3.1 General characteristics
3.1.1 NMVOC concentrations and composition
According to the National Ambient Air Quality Standards (NAAQS) of China from 2012 (Ministry of Environmental Protection of China, 2012), the Grade-II threshold for the maximum daily 8 h average (MDA8) of O3 was 160 µg m−3 (∼75 ppbv). Two O3 pollution events exceeding 160 µg m−3 were identified: Case 1 (8–17 June) and Case 2 (20–27 June). Additionally, there were O3 pollution events on 6 June and from 29–30 June. However, for better data coverage, this study focuses on periods of O3 pollution lasting at least a week, and processes with fewer days of pollution are not discussed in this study. The remaining observation periods were classified as clean days. Figure 1 shows time series illustrating the concentration of TNMVOCs, the 8 h moving average of O3, SO2, PM2.5, NO2, CO, and meteorological parameters (WD, WS, T, and RH) from 1–30 June 2023. The gray areas in Fig. 1 represent O3 pollution events, and the white areas represent clean days. During the observation period, there were 21 d of O3 pollution, accounting for 70 % of the period.
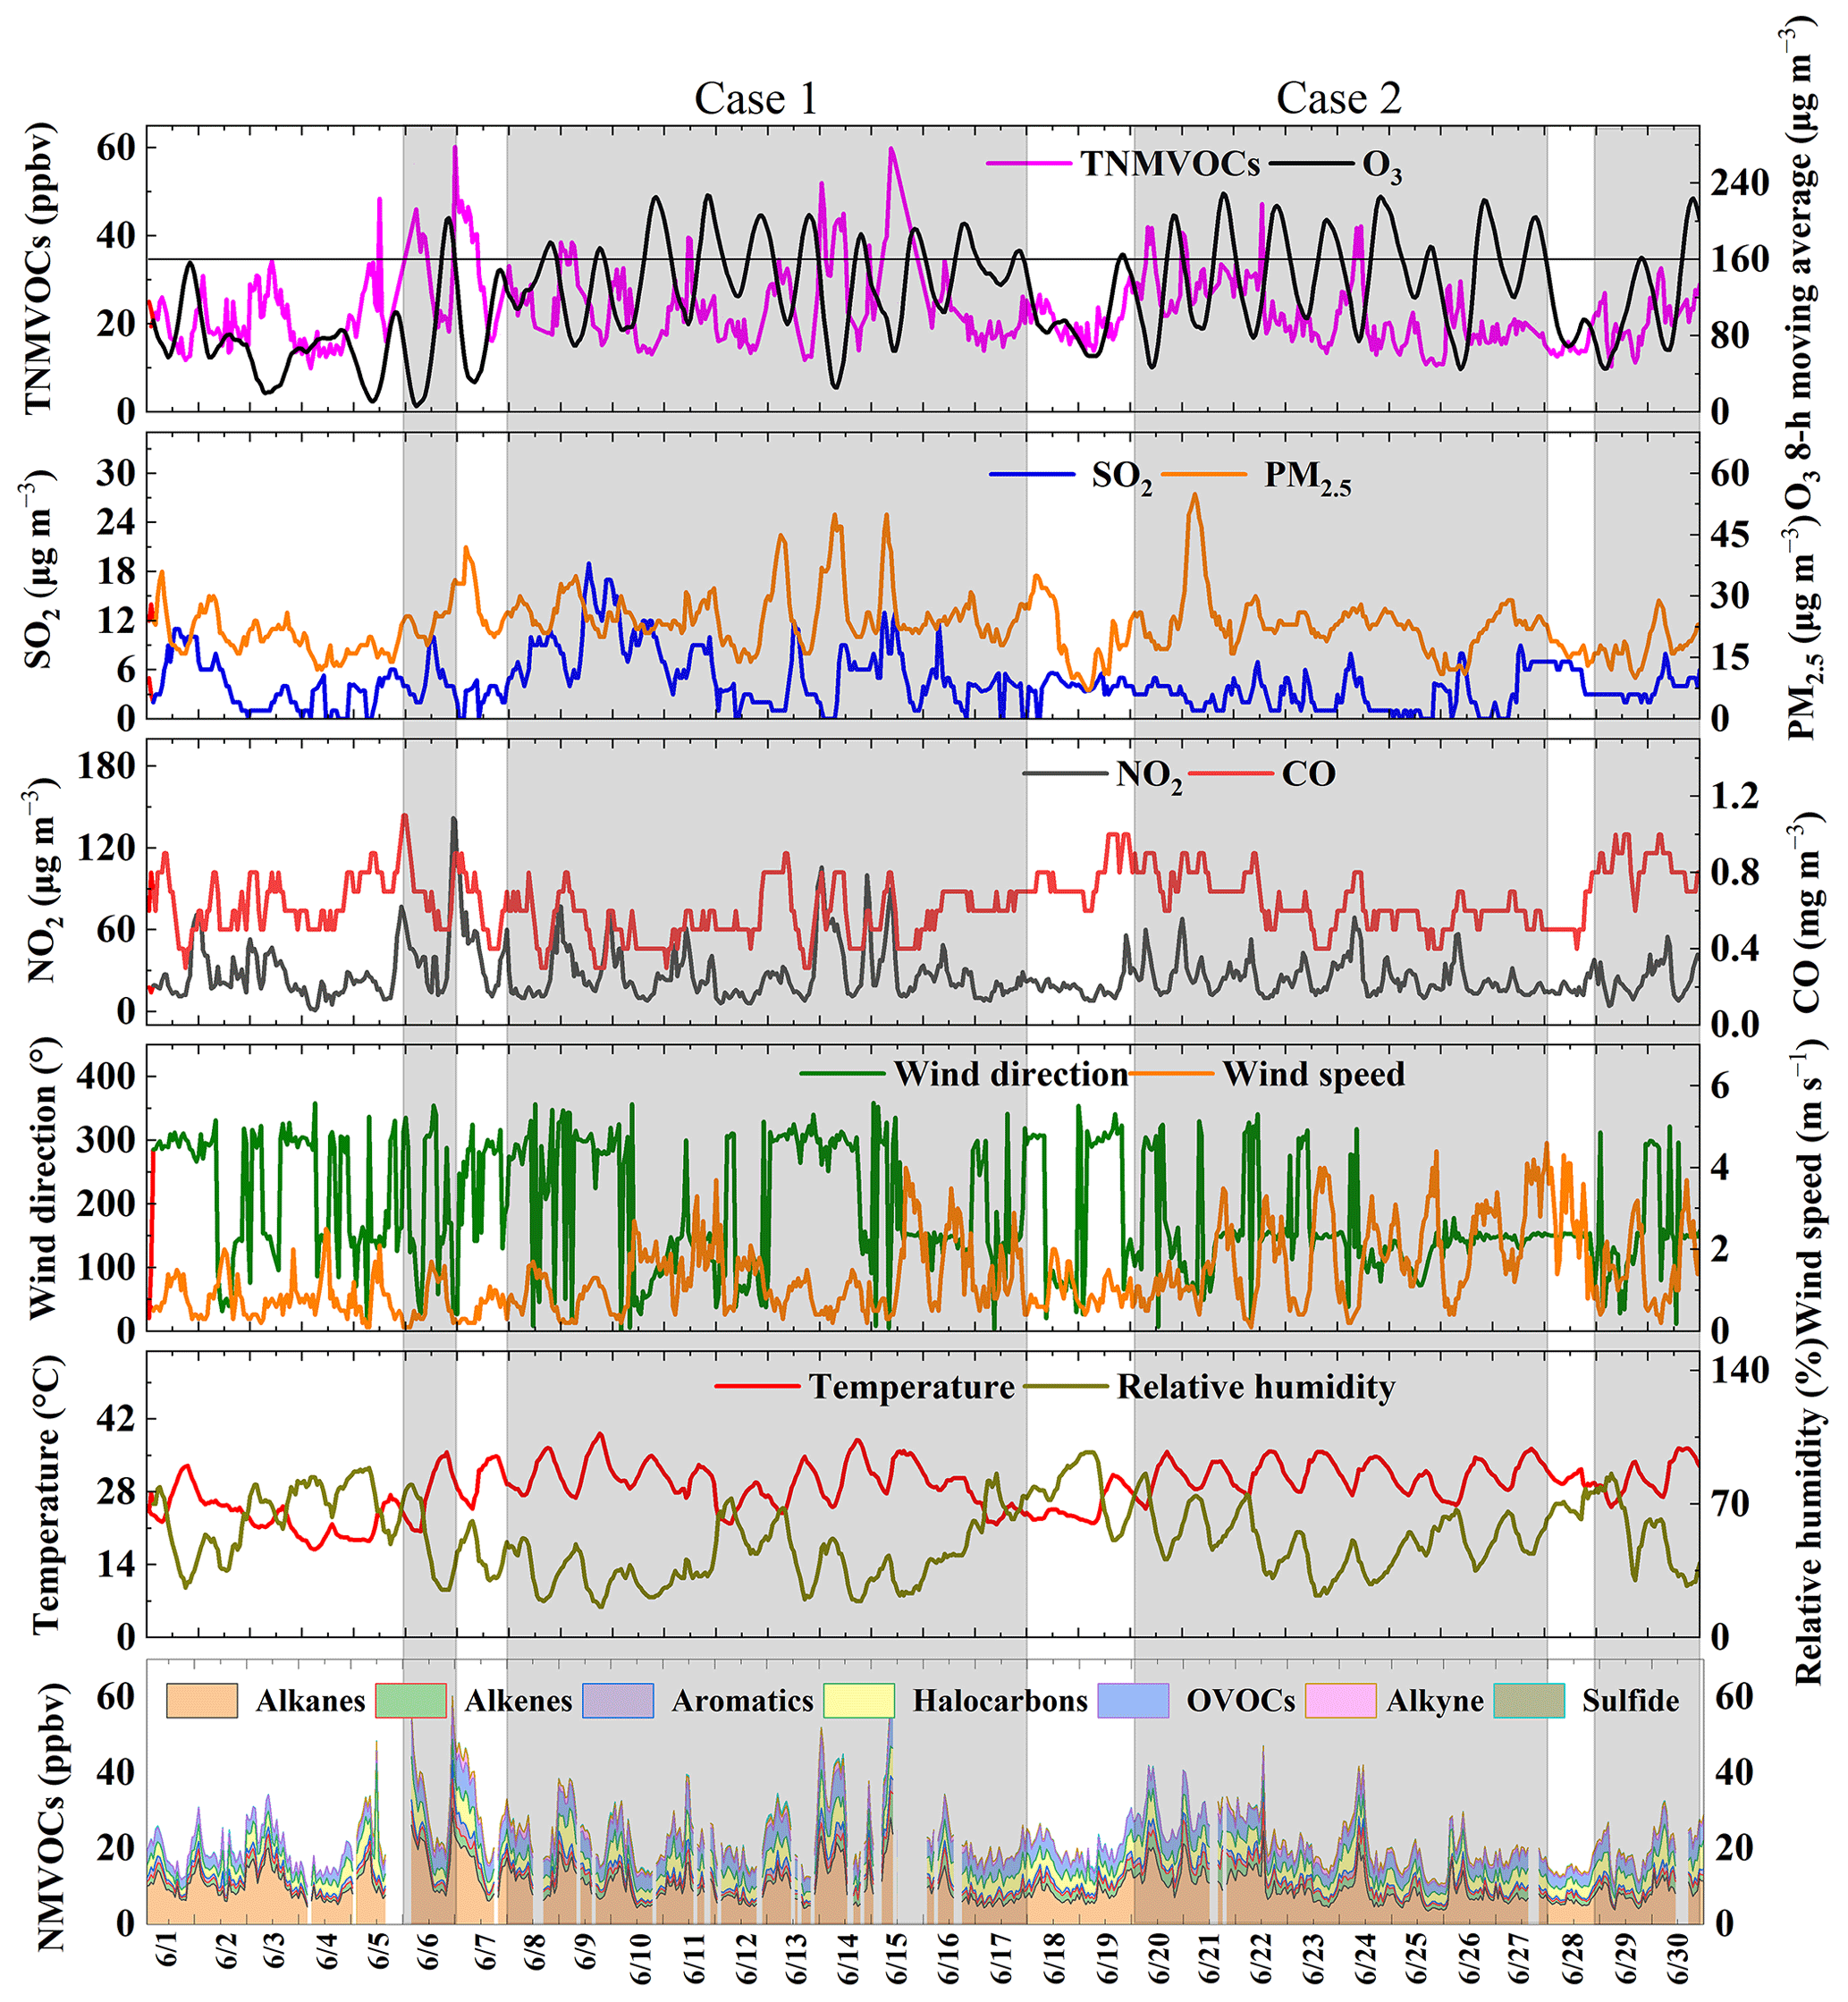
Figure 1Time series illustrating hourly concentrations of TNMVOCs, the 8 h moving average of O3, SO2, PM2.5, NO2, CO, meteorological parameters (WD, WS, T, and RH), and NMVOCs during the sampling period. Gray regions represent O3 pollution processes.
During the observation period, the average wind speed (1.3 ± 0.9 m s−1) was relatively low, which was not conducive to dispersion. The mean RH (52 % ± 19 %) was low, and the mean temperature (28.9 ± 4.6 °C) was high. The meteorological conditions of high temperature and low RH are conducive to the occurrence of photochemical pollution. The maximum daily 8 h moving average (MDA8) of O3 reached 229 µg m−3. The hourly average concentrations of SO2, NO2, CO, and PM2.5 were 4.4 ± 3.3 µg m−3, 26.5 ± 17.9 µg m−3, 0.6 ± 0.2 mg m−3, and 22.9 ± 7.1 µg m−3, respectively. The concentrations of these pollutants were 97 %, 87 %, 94 %, and 35 % lower than the Grade-I threshold of the 2012 NAAQS, respectively. The average concentration of the TNMVOCs was 22.8 ± 8.3 ppbv.
During the Case-1 process, O3 pollution lasted for 10 d. The average RH and temperature were 41 % ± 16 % and 29.9 ± 4.1 °C, respectively, and the average WS was 1.3 ± 0.8 m s−1. The concentration of MDA8 O3 reached a maximum of 228 µg m−3 (11 June) during the pollution period, exceeding the Grade-II threshold of MDA8 O3. In Case 1, the mean concentrations of SO2, NO2, CO, and PM2.5 were 6.1 ± 4.1 µg m−3, 27.4 ± 19.5 µg m−3, 0.6 ± 0.1 mg m−3, and 25.6 ± 6.8 µg m−3, respectively. The average concentration of TNMVOCs during this process was 24.1 ± 8.9 ppbv. In Case 2, O3 pollution occurred continuously for 8 d. The average RH and average temperature were 50 % ± 14 % and 31.2 ± 2.9 °C, respectively. The average concentrations of TNMVOCs (22.5 ± 7.4 ppbv), SO2 (2.7 ± 2.1 µg m−3), NO2 (24.9 ± 12.3 µg m−3), CO (0.6 ± 0.1 mg m−3), and PM2.5 (24 ± 7 µg m−3) in Case 2 were all lower than those in Case 1.
The average concentrations of TNMVOCs, NO2, and PM2.5 on clean days were lower than those during the O3 pollution events. The average RH (65 % ± 17 %) on clean days was higher than during the Case-1 and Case-2 events, while the average temperature (26.0 ± 4.8 °C) was lower than during the Case-1 and Case-2 events. According to the analysis in Fig. S3a and b in the Supplement, O3 concentrations show a significant correlation with temperature and RH, with correlation coefficients of 0.7 and −0.61, respectively. Therefore, conditions of high temperatures and low RH are more conducive to O3 pollution. Figure S3c indicates that O3 concentrations exceeding the secondary standard mainly occur under meteorological conditions of high temperatures (greater than 30 °C) and low RH (less than 55 %). It can be noted that when and , O3 concentrations consistently exceed the Grade-II threshold of the 2012 NAAQS. High temperatures and low RH are more conducive to O3 pollution (Chen et al., 2020; Zhang et al., 2015). Meng et al. (2023) argue that most reactions involved in O3 formation accelerate with temperature and that the rate of O3 production exceeds that of O3 loss by a large margin. Therefore, during the study period, the meteorological conditions of high temperature and low RH were also important factors affecting the occurrence of O3 pollution.
Additionally, the average concentration of NO2 on clean days (24.4 ± 16.1 µg m−3) was lower than that in Case 1 and Case 2, while the average concentration of NO on clean days (4.8 ± 5.5 µg m−3) was higher than during Case 1 (3.9 ± 3.8 µg m−3) and Case 2 (3.9 ± 2.4 µg m−3). A higher concentration of NO2 can promote the formation of O3, whereas the titration reaction between NO and O3 consumes O3 (Sillman, 1999). Therefore, the higher concentration of NO2 and the lower concentration of NO during pollution events are key factors contributing to the occurrence of O3 pollution events.
Table 1Concentrations of NMVOCs (ppbv) during different processes in Zhengzhou.
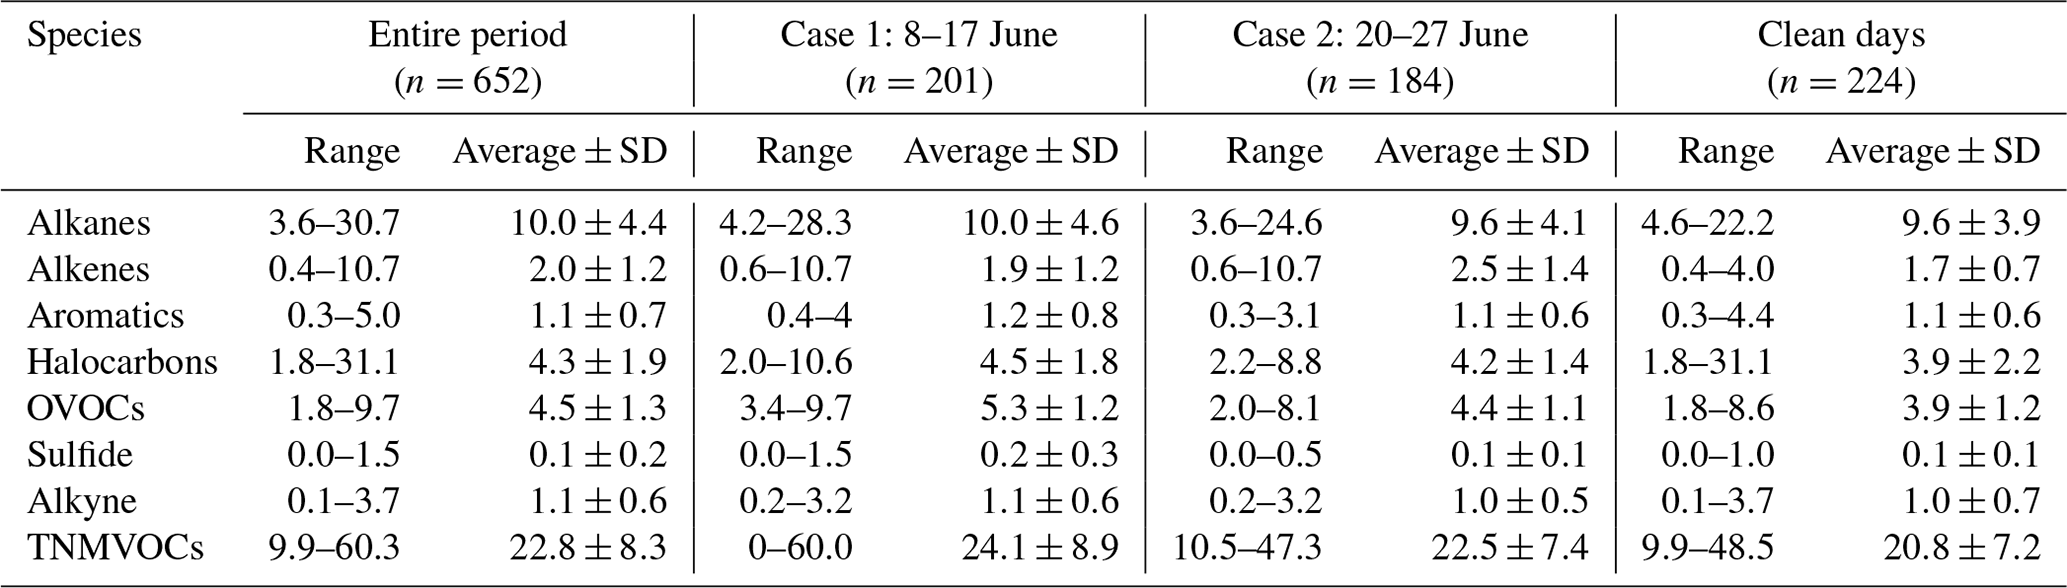
Note that n stands for the total sampling number used for each process.
The means and standard deviations of NMVOC groups during different processes are listed in Table 1. During the entire period, the concentration of TNMVOCs varied from 10 to 60 ppbv, with an average concentration of 23.0 ± 8.0 ppbv. Similar levels of NMVOC concentrations were observed for Case 1 (24.0 ± 9.0 ppbv) and Case 2 (23.0 ± 7.0 ppbv). The TNMVOC concentrations on clean days were relatively low (21 ± 7.2 ppbv). Furthermore, nearly all NMVOC groups were more abundant during O3 pollution events than on clean days.
Throughout the entire sampling period, alkanes (10.0 ± 4.4 ppbv), OVOCs (4.5 ± 1.3 ppbv), and halocarbons (4.3 ± 1.9 ppbv) were the most abundant NMVOC groups, accounting for 44 %, 20 %, and 19 % of the TNMVOCs, respectively. These groups were followed by alkenes (9 %), aromatics (5 %), alkynes (5 %), and sulfides (< 1 %). During the two O3 pollution events, alkanes, being the most abundant NMVOC group, contributed 41 % (Case 1) and 43 % (Case 2) to the TNMVOCs. Alkanes were the most abundant NMVOC group during the observation period, partly due to the presence of alkane emission sources around the observation site (e.g., civilian combustion and motor vehicle emissions) and the low photochemical reactivity of alkanes (Mozaffar et al., 2020). Even on clean days, alkanes (9.6 ± 3.9 ppbv) were still the most abundant group (46 %), and halocarbons (19 %) and OVOCs (19 %) were the two other major groups.
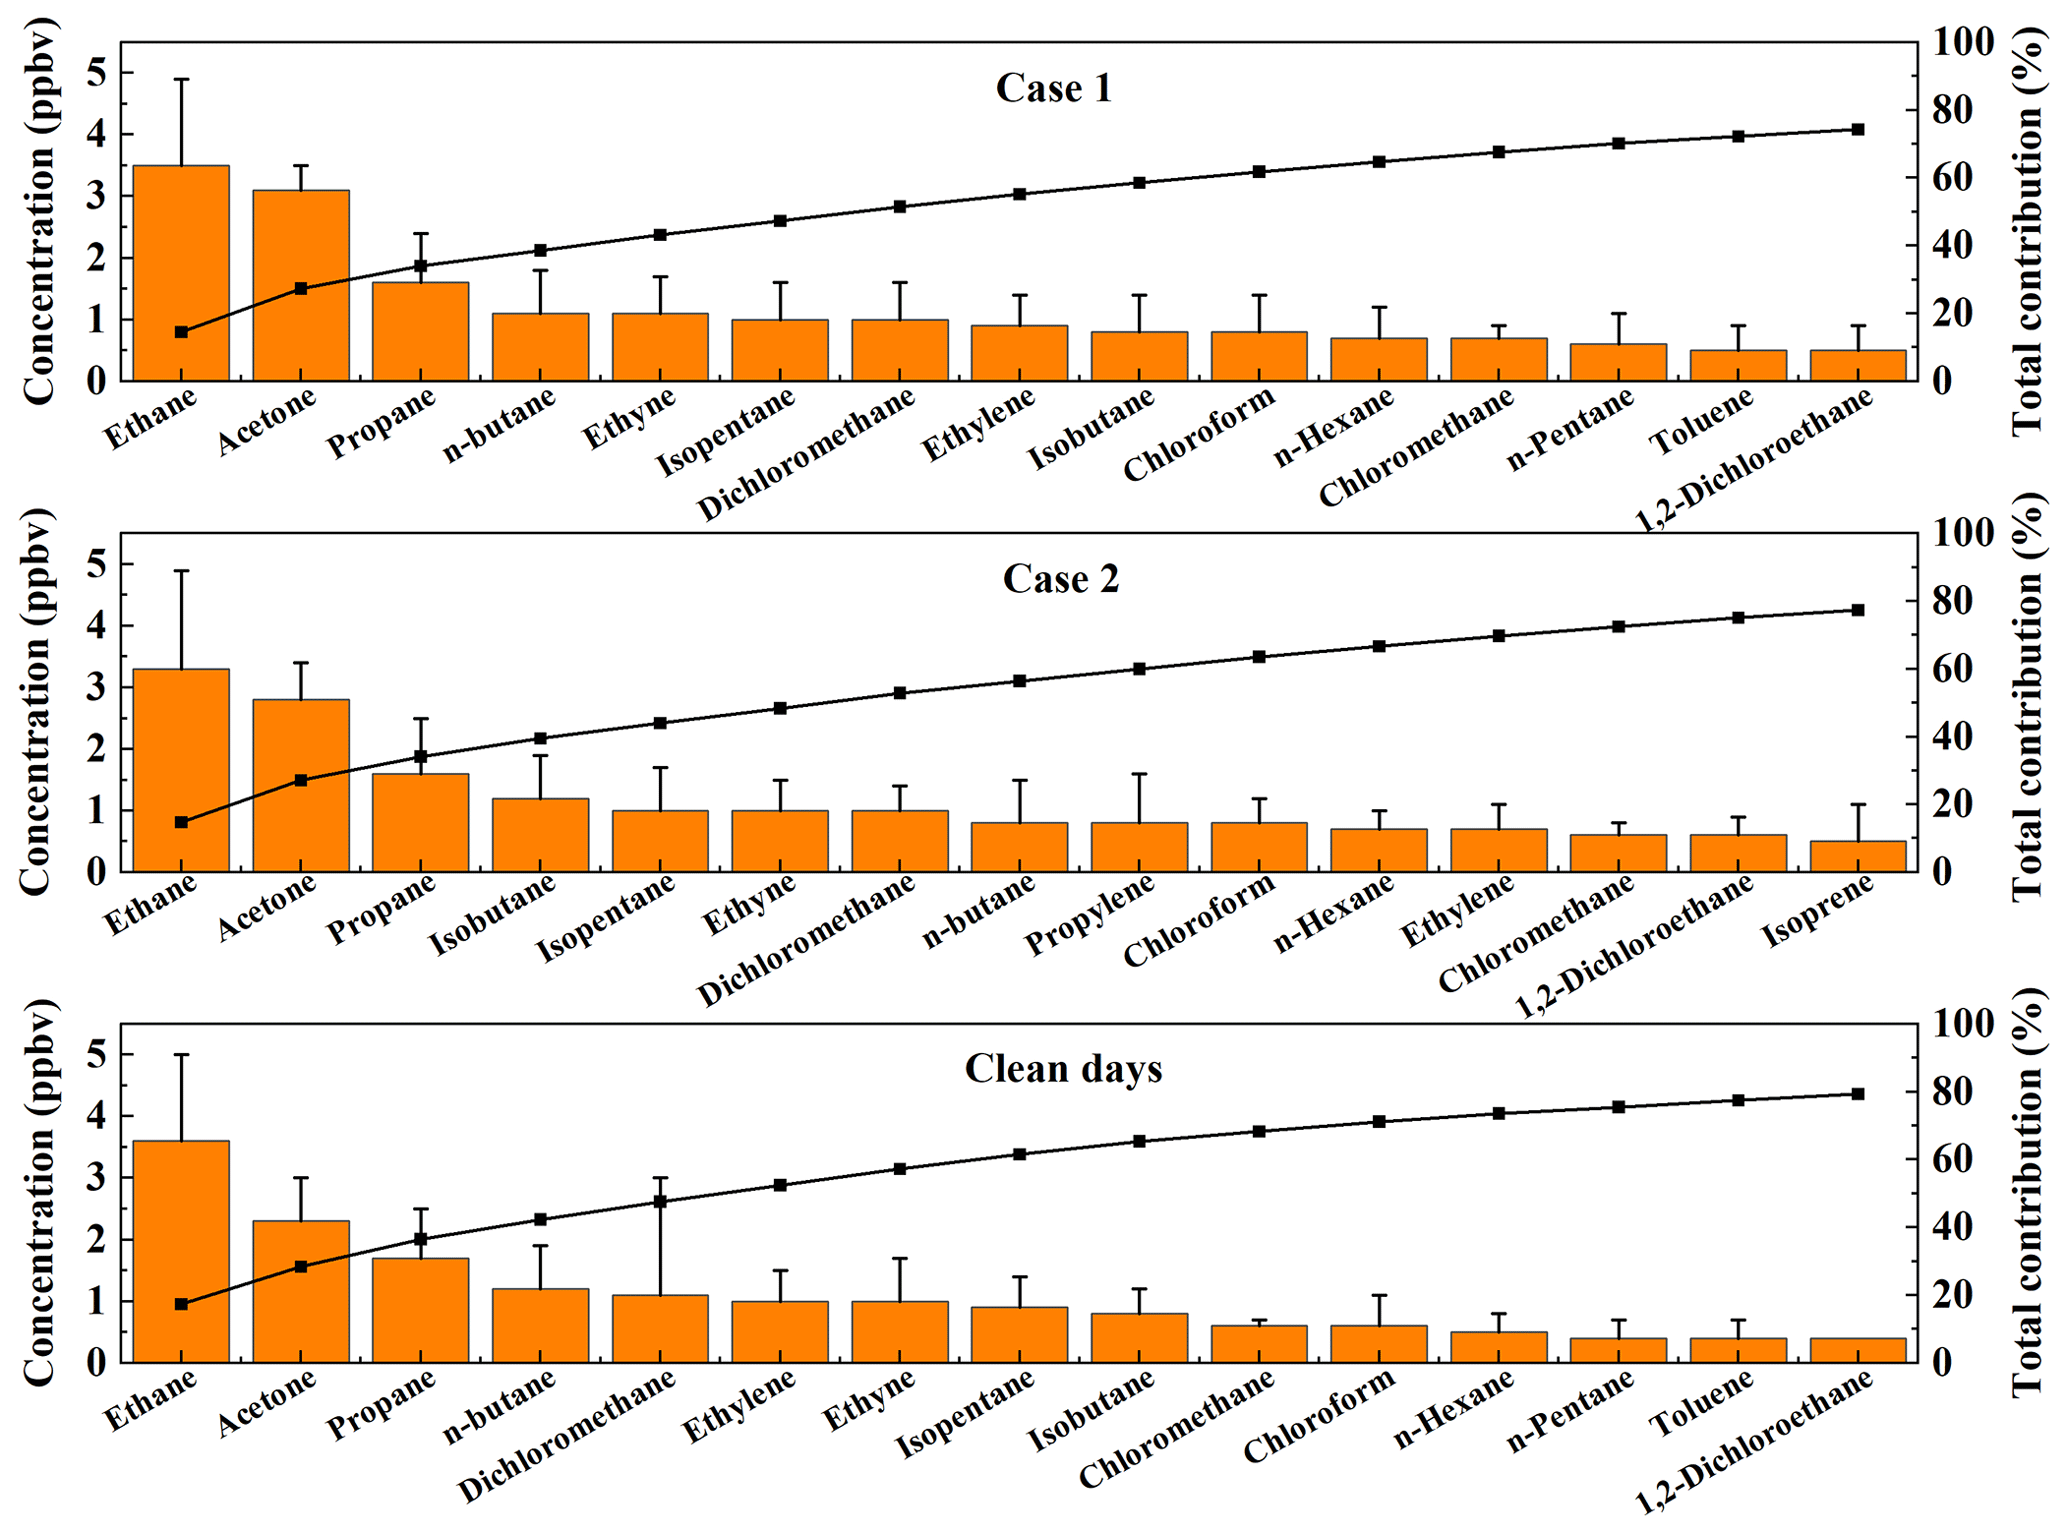
Figure 2Comparisons of the concentrations of the 15 NMVOCs (ppbv) with the highest average mixing ratios for different processes. Error bars represent standard deviations.
Figure 2 illustrates the 15 NMVOCs with the highest average mixing ratios during the two O3 pollution events and on clean days. Ethane, propane, n-butane, isopentane, isobutane, n-hexane, and n-pentane were the most abundant alkanes throughout the entire observation period. Ethane is a major component of natural gas (NG) (Thijsse et al., 1999), while propane, n-butane, and isobutane are important tracers of liquefied petroleum gas (LPG) (Tsai et al., 2006; An et al., 2014). Moreover, n-hexane mainly originates from solvent emissions. Ethylene, propylene, and isoprene were the most abundant alkenes. Ethylene and propylene mainly originate from biomass burning (Andreae and Merlet, 2001). Isoprene mainly comes from plants (Brown et al., 2007). There was also a high level of acetylene, which is a tracer of incomplete combustion (Blake and Rowland, 1995). Benzene and toluene were the most abundant aromatics; they mainly originate from solvent emissions, vehicular exhausts, and industry processes (Seila et al., 2001; Mo et al., 2015). Dichloromethane, an important species in solvent usage, was the most abundant halohydrocarbon species (Huang et al., 2014). Acetone was the most abundant OVOC species; it has complex atmospheric sources and is mainly attributed to vehicular emissions and secondary formation (Guo et al., 2013; Watson et al., 2001). The concentration of acetone in the two pollution processes was significantly higher than on clean days, as reported in other studies (Guo et al., 2013), indicating a strong photochemical reaction during the pollution process, e.g., the photo-oxidation of i-butene to acetone (Guo et al., 2013). Therefore, vehicle exhaust emissions, solvent use, combustion, biogenic emissions, and industrial processes are important sources of NMVOCs at the observation sites, as further illustrated in the PMF source apportionment (in Sect. 3.2.2).
3.1.2 Diurnal variations in NMVOCs, O3, and NOx
The concentration characteristics of pollutants in the atmosphere are affected by the variation pattern of the atmospheric boundary layer, the intensity of photochemical reactions, and pollution source emissions (B. Wang et al., 2023). A selection of NMVOCs, O3, and NOx were chosen, and their daily changes were analyzed, as shown in Fig. S4 in the Supplement. The diurnal variation in O3 concentration shows unimodal characteristics. During the day, with the increase in temperature and light intensity, the concentration of O3 gradually increased and reached a peak at about 14:00 LT, and then the concentration gradually decreased. This diurnal pattern was influenced by strong photochemical reactivity, boundary layer processes, and meteorological parameters. Higher O3 production during the day indicates significant contributions from both photochemical reactions and atmospheric mixing processes. The diurnal variations in ethane, propane, isobutane, n-butane, isopentane, n-pentane, ethylene, propylene, acetylene, benzene, and toluene were similar, showing low concentrations in the daytime and high concentrations in the evening. This pattern is associated with a higher boundary layer and strong photochemical reactivity during the day (Tang et al., 2007). An elevated boundary layer is conducive to the dispersion of NMVOCs and other pollutants (Bon et al., 2011; Chen et al., 2022a), while strong photochemical reactions consume NMVOCs (Xia et al., 2014; Zhang et al., 2018). In addition, the peak concentrations of these NMVOCs occurred in the morning and evening (07:00–08:00 and 23:00–24:00 LT, respectively), showing a consistent daily pattern with NOx. This suggests that the emissions of these NMVOCs were significantly influenced by motor vehicle emissions and fuel combustion. The higher NMVOC and NOx concentrations at night may have been caused by heavy-traffic emissions related to traditional nighttime activities in the city. Isoprene, a typical tracer of plant emissions, is highly dependent on temperature and solar radiation (Guenther et al., 1993; Sharkey et al., 1996). Therefore, the concentration of isoprene increased significantly during the day (07:00–20:00 LT) and decreased significantly at night. It is worth noting that the concentration of isoprene showed a bimodal characteristic, with peaks at 10:00 and 15:00 LT. Previous studies have shown that the rate at which plants emit isoprene decreases when temperatures exceed 40 °C (Guenther et al., 1993; Sharkey et al., 1996). Therefore, the drop in isoprene concentrations observed at noon may have been due to excessive temperatures affecting biogenic emissions. Additionally, the concentration of OH radicals peaked at noon (Fig. S5 in the Supplement), leading to the rapid oxidation of isoprene by OH radicals, further contributing to the observed bimodal pattern (Paulot et al., 2009). Acetone comes from a wide range of sources, including vehicle emissions, industrial production, and secondary formation (Sha et al., 2021). Acetone remained at high concentrations throughout the day, and there was no obvious diurnal variation, suggesting that primary acetone sources near the site may have concealed the daytime acetone peak produced by photochemical reactions (Guo et al., 2013). Dichloromethane, which mainly originates from solvent use, exhibited high concentrations mainly at night (23:00–05:00 LT). This might be related to the longer atmospheric lifetime of dichloromethane and its lower boundary layer height at night (Li et al., 2018; Chen et al., 2022a).
3.2 Sources of NMVOCs
3.2.1 Diagnostic ratios
Ratios of specific NMVOCs can be used to assess the initial emission source of NMVOCs or the degree of photochemical reaction (Miller et al., 2012; An et al., 2014). The ratios of isopentane / n-pentane, toluene / benzene (T / B), and (m-/p-xylene) / ethylbenzene (E / X) are discussed in this study (Fig. 3).
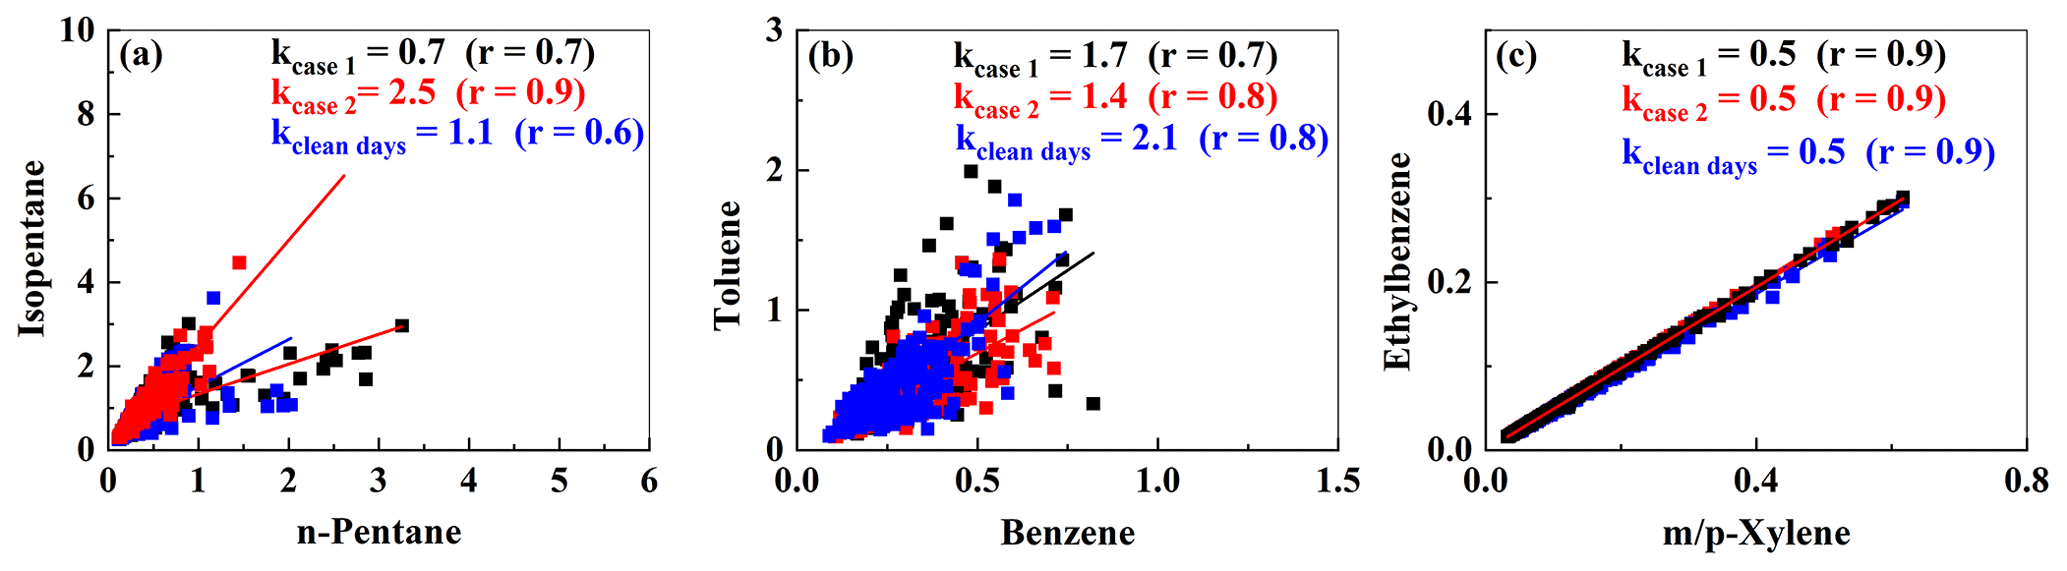
Figure 3Correlations between compounds with different observation periods (k denotes the slope).
In Case 1 and Case 2 and on clean days, the Pearson coefficients for isopentane and n-pentane were 0.7, 0.94, and 0.6, respectively, indicating a strong correlation and suggesting a common emission source between the two substances. Isopentane / n-pentane ratios of 0.8–0.9, 2.2–3.8, 1.5–3.0, and 1.8–4.6 (Fig. 3a) indicate that isopentane and n-pentane originate from NG, vehicle emissions, liquid gasoline, and fuel evaporation, respectively (An et al., 2014; Watson et al., 2001). In this study, the ratios for Case 1, Case 2, and the clean days were 0.7, 2.5, and 1.1, respectively. This suggests that isopentane and n-pentane may originate from NG emissions, vehicular exhausts, and liquid gasoline, respectively.
The T / B ratio can be used to distinguish between coal and biomass combustion (0.2–0.6), motor vehicle emissions (∼ 2.0) (Liu et al., 2008), industrial processes (3.0–6.9) (Zhang et al., 2016), and fuel evaporation (∼4.1) (Dai et al., 2013). In this study, the T / B ratios for the two O3 pollution events were 1.7 and 1.4 (Fig. 3b), respectively, indicating that combustion and vehicle emissions were the main sources of benzene and toluene emissions (Hong et al., 2019).
Since m-xylene, p-xylene, and ethylbenzene share a common source but differ in terms of their OH radical reaction rate constants, the E / X ratio can be used to understand source characteristics (Miller et al., 2012; Yurdakul et al., 2018). During the pollution events and on clean days, m-xylene, p-xylene, and ethylbenzene showed a strong positive correlation (r=0.9; Fig. 3c), indicating that they originated from a common emission source. Previous studies have shown that NMVOCs are transported from inner urban areas when the E / X ratio is 0.3–0.4 and that NMVOCs are transported from distant sources when the ratio is significantly higher than 0.3 (Monod et al., 2001). In this study, the E / X ratios for the two pollution events and the clean days came to 0.5, indicating that the air mass measured at the observation point was affected by air mass transport. We analyzed the relationship between ethylbenzene, m-xylene, p-xylene, the E / X ratio, wind direction, and wind speed. As shown in Fig. S6 in the Supplement, the concentrations of ethylbenzene, m-xylene, and p-xylene are mainly influenced by winds from the northwest, and their concentrations tend to increase with stronger wind speeds. Similarly, the E / X ratio also exhibits similar patterns of variation, further indicating the regional transport of ethylbenzene, m-xylene, and p-xylene from distant sources.
3.2.2 Source apportionment
In this study, the PMF 5.0 model from the Environmental Protection Agency (EPA) was used to analyze the source profile and species percentage of each source during the observation period to determine the relative contribution of each potential source, as shown in Fig. 4. Seven factors were determined by the model: combustion, industrial production, biogenic emissions, vehicular exhausts, LPG/NG, “solvent use 1”, and “solvent use 2”. A detailed analysis is given below.
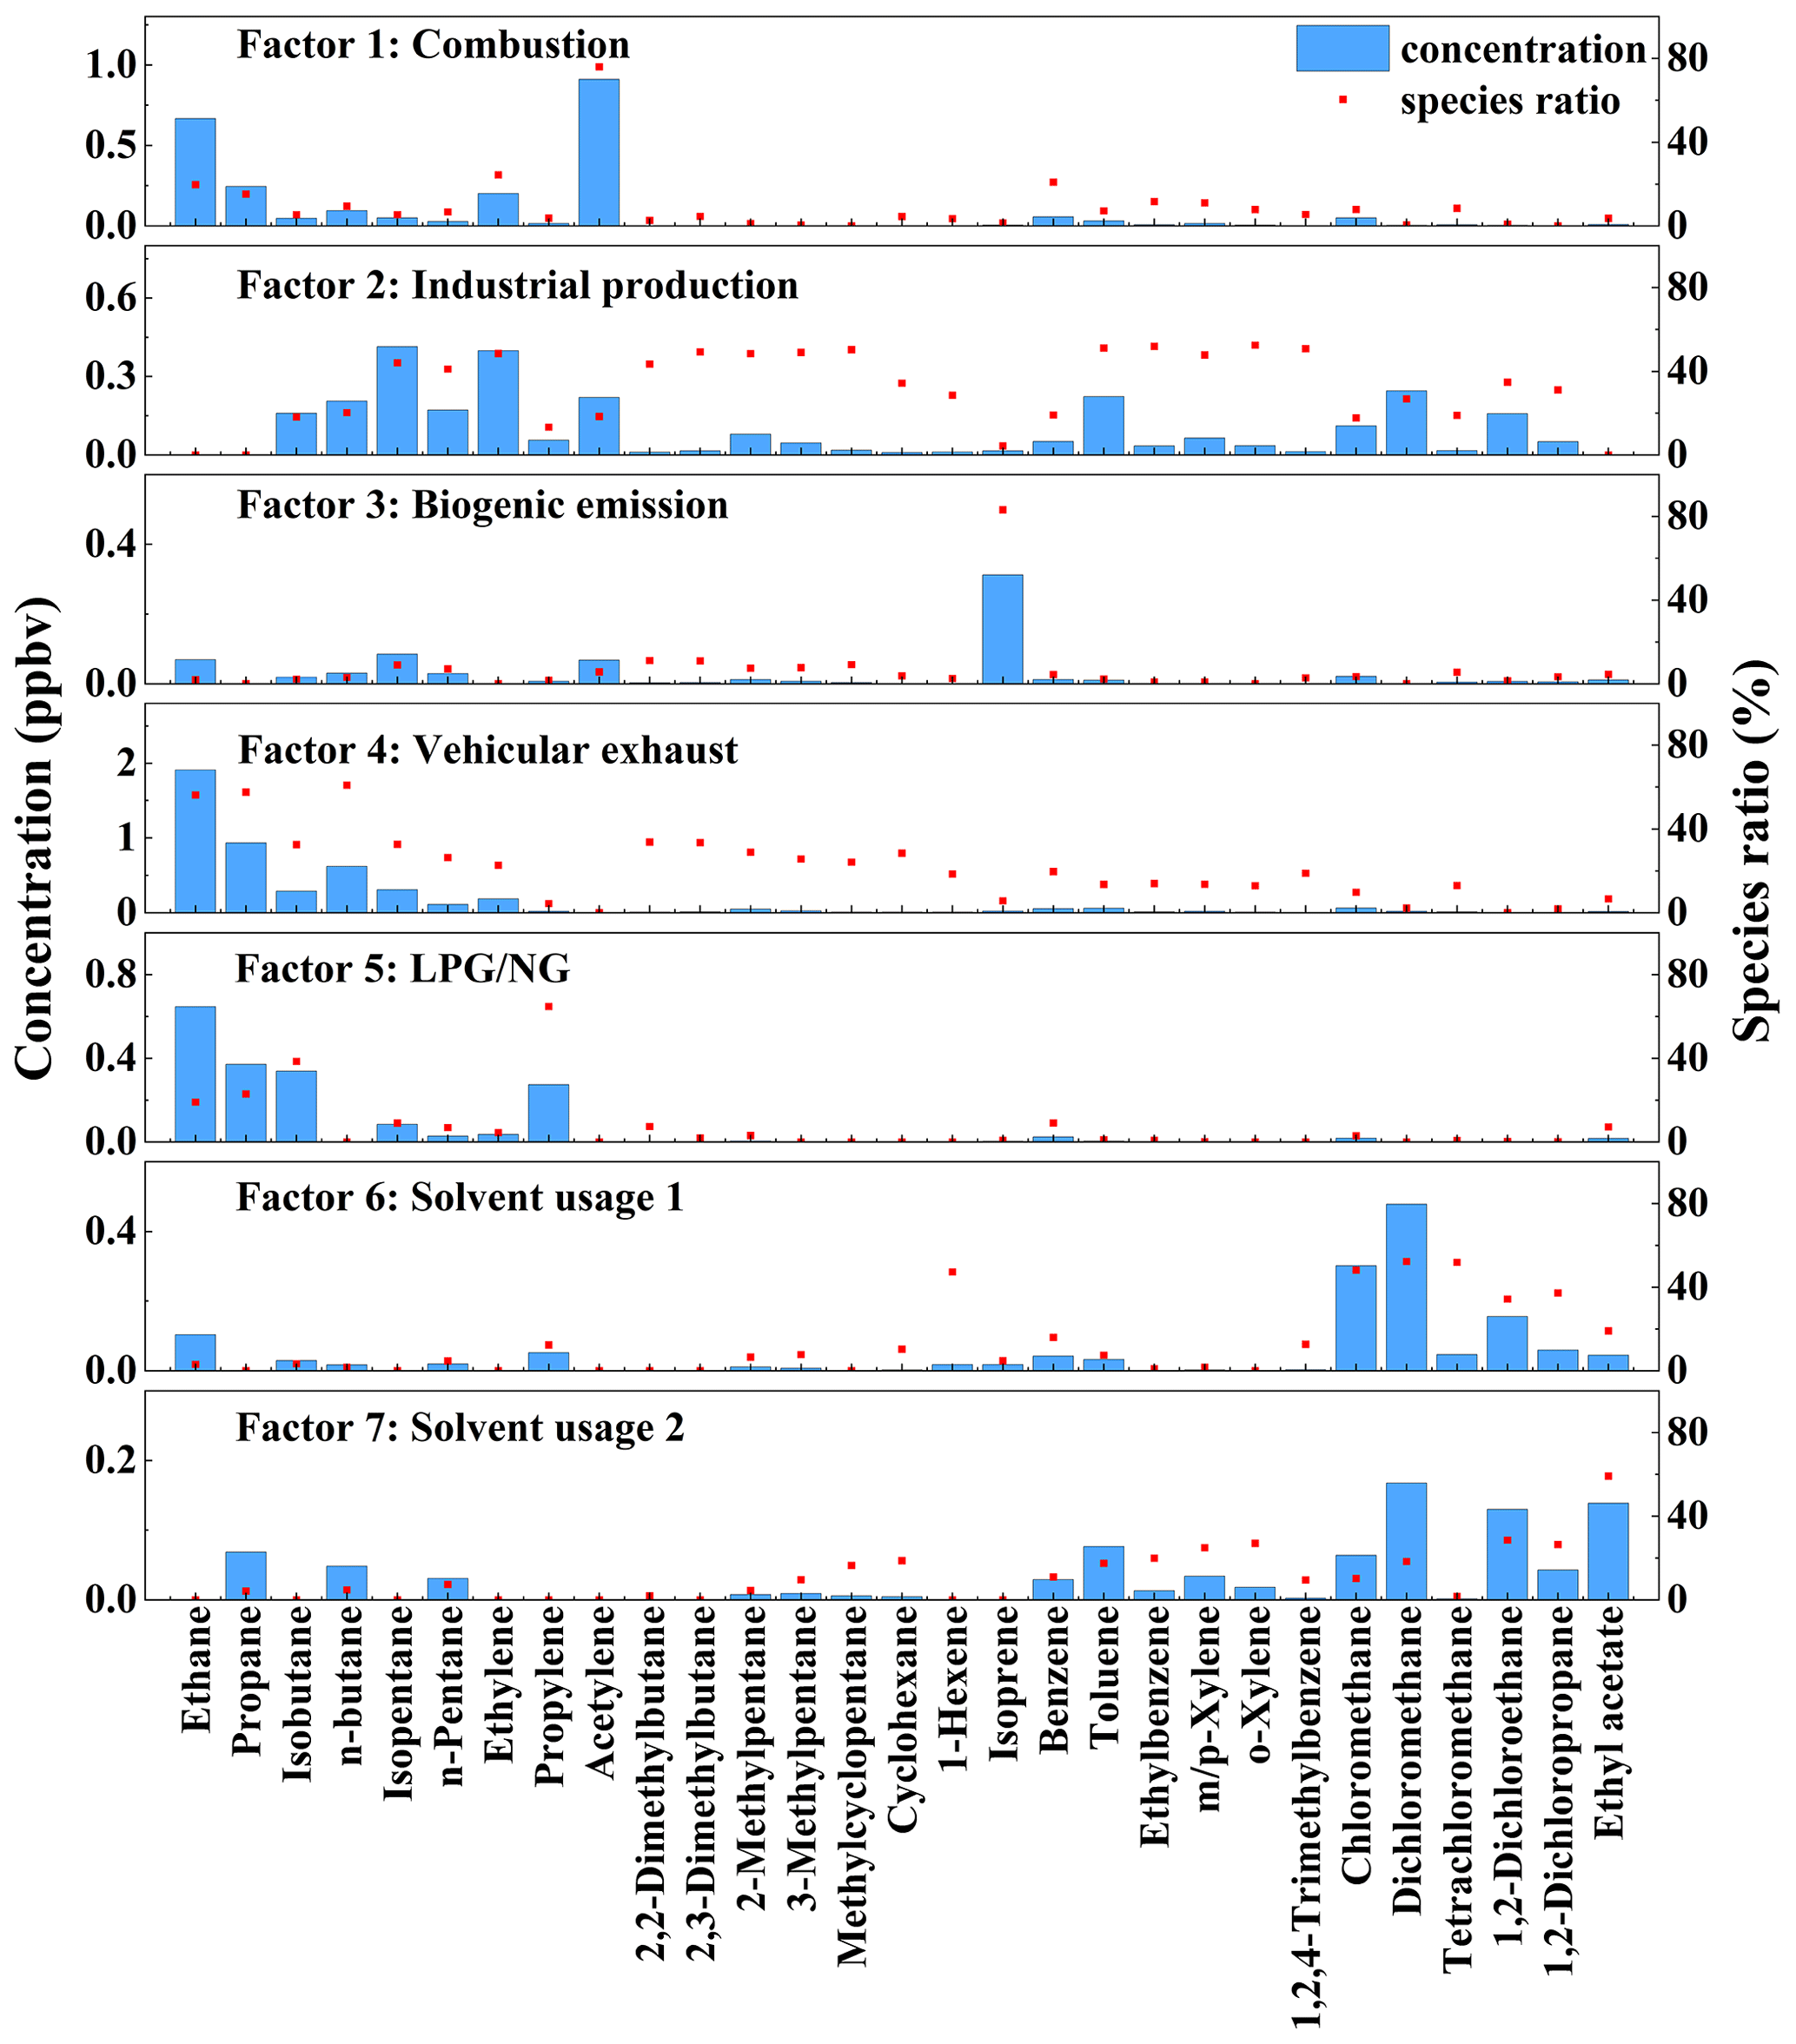
Factor 1 was characterized by high percentages of acetylene (76 %), ethane, propane, ethylene benzene, and toluene. Acetylene is a typical tracer of coal burning (Barletta et al., 2005). Ethane, propane, and ethylene are typical tracers of incomplete combustion (Guo et al., 2011; Ling et al., 2011). Therefore, Factor 1 was classified as combustion. The CPF plots indicate that the contributing direction was northwest at about 2 m s−1 (Fig. S7a in the Supplement).
Factor 2 was rich in C4–C6 alkanes, aromatics (toluene, ethylbenzene, m-xylene, p-xylene, o-xylene, and 1,2,4-trimethylbenzene), and halocarbons (1,2-dichloroethane and 1,2-dichloropropane). Previous studies have shown that these species are all related to industrial production. Therefore, Factor 2 was classified as industrial production. The CPF plots indicate that a local source with a low wind speed of <1 m s−1 was the dominant source (Fig. S7b).
Factor 3 was characterized by a high percentage (83 %) of isoprene, a typical tracer of biogenic emissions (Brown et al., 2007). High temperatures and strong radiation in summer are more conducive to the biogenic emissions of isoprene (Liu et al., 2016). Therefore, Factor 3 was classified as biogenic emissions. The CPF plots indicate that the dominant source direction was southwest when wind speeds were below 2 m s−1 (Fig. S7c).
Factor 4 was characterized by high percentages of C2–C6 alkanes (such as ethane, propane, isobutane, n-butane, isopentane, n-pentane, 2,2-dimethylbutane, and 2,3-dimethylbutane), benzene, toluene, ethylbenzene, m-xylene, and p-xylene), which are related to vehicular emissions (Jorquera and Rappenglück, 2004; Song et al., 2007; Chen et al., 2014). Therefore, Factor 4 was classified as vehicular exhausts. The CPF plots indicate that a local source with low wind speeds was the dominant source, likely related to the large amount of traffic on the main roads in the southern and western directions (Fig. S7d).
Factor 5 was characterized by high percentages of ethane, propane, isobutane, and propylene, which are the main components of LPG and NG (Shao et al., 2016; Song et al., 2007; Na et al., 2001). Therefore, Factor 5 was classified as an LPG and NG source. The CPF plots show that the dominant source direction of this factor was east at 1–2 m s−1 (Fig. S7e).
Factor 6 was characterized by high percentages of chloromethane, dichloromethane, tetrachloromethane, 1,2-dichloroethane, 1,2-dichloropropane, and ethyl acetate, which are typical solvents for industrial applications (Li et al., 2020; Huang et al., 2014). Therefore, Factor 6 was classified as solvent usage 1. The CPF plots for this factor indicate that the dominant directions were northeast and southeast (Fig. S7f).
Factor 7 was dominated by methylcyclopentane, cyclohexane, TEXs (toluene, ethylbenzene, and xylenes (m-xylene, p-xylene, and o-xylene)), 1,2-dichloroethane, 1,2-dichloropropane, and ethyl acetate. Methylcyclopentane and cyclohexane are commonly used as solvents in industrial processes (Lyu et al., 2016; Yuan et al., 2013). TEXs are the main component of organic solvents (Guo et al., 2011; Watson et al., 2001). Therefore, Factor 7 was classified as solvent usage 2. The CPF plots for this factor indicate that the high CPF values were found near the center when the wind speed was low (≤1 m s−1). This finding indicates that local emissions were the dominant source (Fig. S7g).
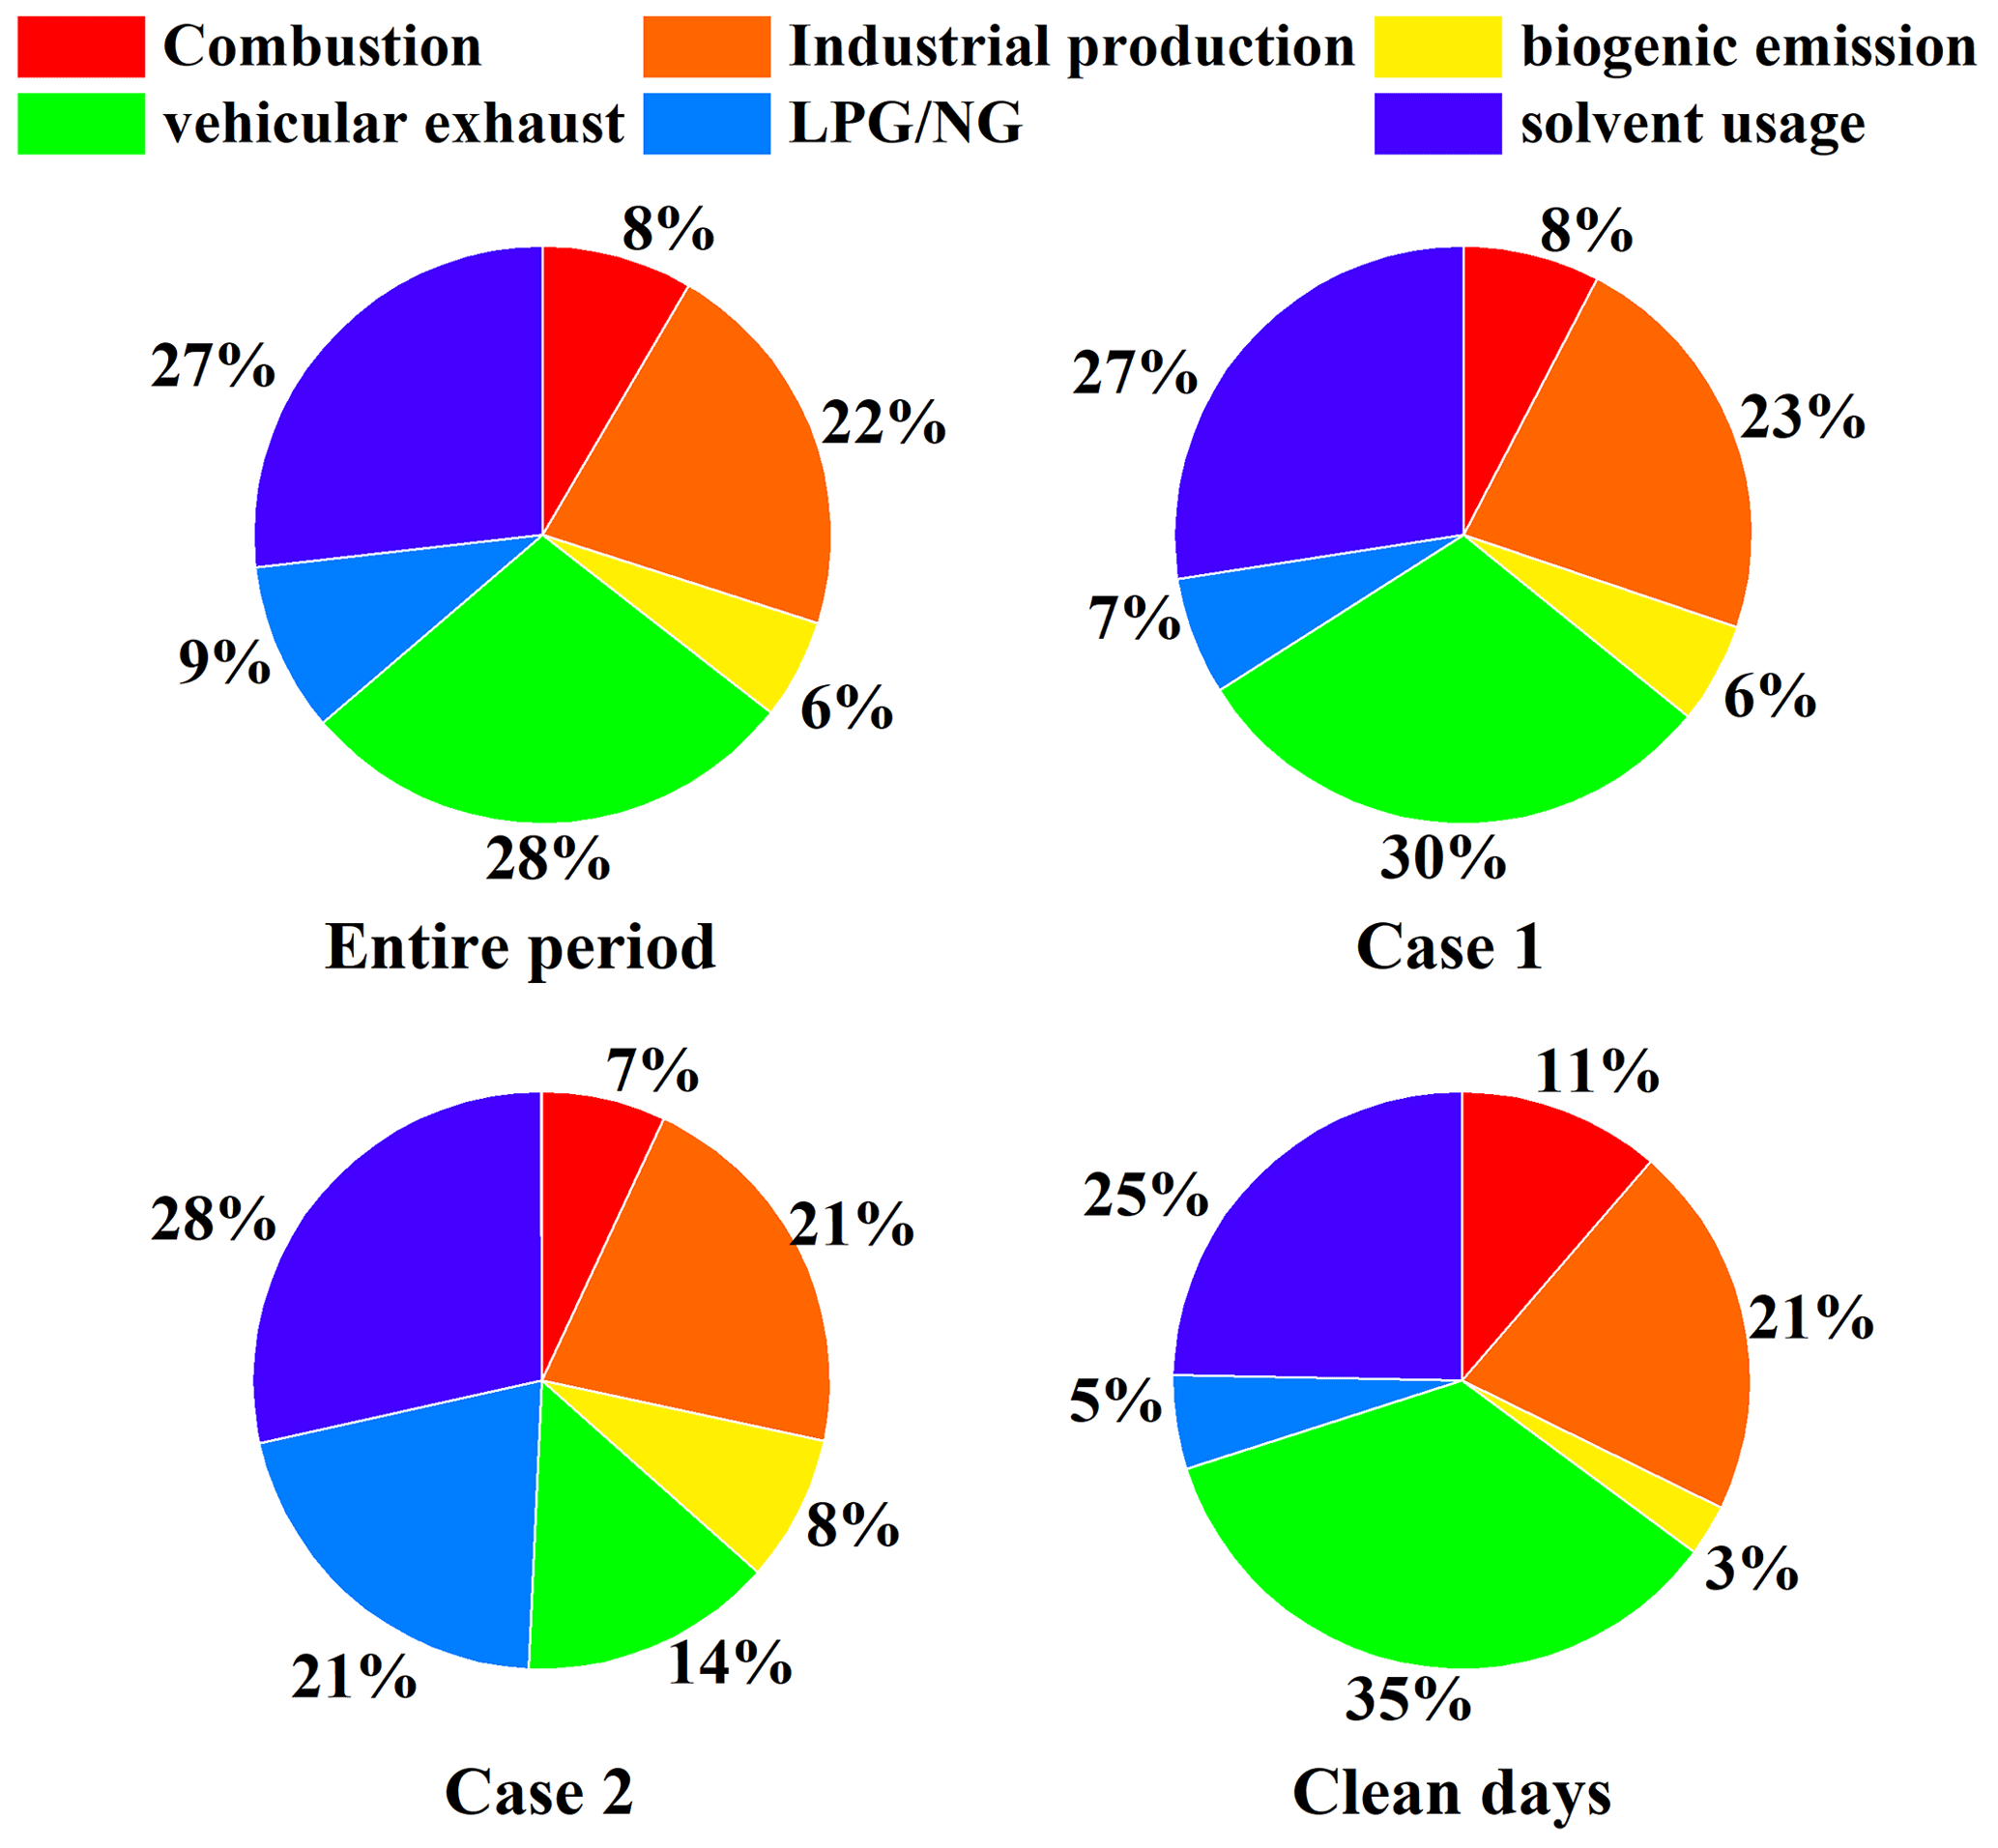
Figure 5 shows the proportion of each NMVOC source during the observation process. Throughout the entire observation period, vehicular exhausts were the main contributor, accounting for 28 %, followed by solvent usage (27 %) and industrial production (22 %). Other sources, including LPG/NG (9 %), combustion sources (8 %), and biogenic emissions (6 %), contributed comparatively little. In Case 1, vehicular exhausts (30 %) were the largest contributor, followed by solvent usage (27 %) and industrial production (23 %). Compared with the Case-1 event, the contributions of solvent usage and industrial production in the Case-2 event did not change much, but the contribution of LPG/NG increased by 14 %, becoming an important source. On clean days, vehicular exhausts (35 %), solvent usage (25 %), and industrial production (21 %) were the most significant contributors. Compared to clean days, the contributions of solvent usage, industrial production, biogenic emissions, and LPG/NG increased during both pollution events, while the contributions of combustion sources and vehicular exhausts decreased. In summary, vehicular exhausts, solvent usage, and industrial production were major contributors to both O3 pollution events and the clean days.
In summary, the observation sites are significantly influenced by vehicular exhausts, solvent usage, and industrial production. The results of this study show similarities in the source apportionment of NMVOCs in Zhengzhou during the summers of 2018 to 2021 (Yu et al., 2022; Guo et al., 2024). Yu et al. (2022) found that vehicular exhausts and industrial production contributed the most to NMVOC emissions in Zhengzhou from 2018 to 2020, with the main sources of NMVOCs in summer being vehicular exhausts, solvent usage, and industrial production. In contrast to the NMVOC source apportionment results from Li et al. (2020) for the O3 pollution process in Zhengzhou that occurred in May 2018, the difference lies in the higher impact of solvent usage compared to that of vehicular exhausts and industrial production. This is mainly attributed to the fact that the observation site used in Li et al. (2021) was located at Zhengzhou University, making it more susceptible to the influence of chemical-reagent use. In comparison to the source apportionment of NMVOCs in Zhengzhou during winter (Zhang et al., 2021), combustion becomes an important contributor during winter due to the increased heating demand, while the contribution from solvent usage is relatively lower due to the cold temperatures. In comparison with other cities (Table S3 in the Supplement), vehicular exhausts in Zhengzhou contribute the most – more than in cities like Qingdao (Wu et al., 2023b), Xuchang (Qin et al., 2021), Guangzhou (Meng et al., 2022), Nanjing (Fan et al., 2021), Shijiazhuang (Guan et al., 2020), and Weinan (Hui et al., 2020) but less than in Changzhou (Z. Liu et al., 2023a) and on par with Beijing (Liu et al., 2020). Solvent usage is a larger contributor in Zhengzhou than in Qingdao (Wu et al., 2023b), Xuchang (Qin et al., 2021), Nanjing (Fan et al., 2021), Shijiazhuang (Guan et al., 2020), Weinan (Hui et al., 2020), Changzhou (Z. Liu et al., 2023a), and Beijing (Liu et al., 2020) but a smaller contributor than in Guangzhou (Meng et al., 2022). Industrial production is a larger contributor in Zhengzhou than in Xuchang (Qin et al., 2021), Guangzhou (Meng et al., 2022), Nanjing (Fan et al., 2021), Weinan (Hui et al., 2020), and Changzhou (Z. Liu et al., 2023a) but a smaller contributor than in Shijiazhuang (Guan et al., 2020).
3.3 Contribution to O3 formation
3.3.1 O3 sensitivity analysis
In this study, the RIR of AVOCs, biogenic volatile organic compounds (BVOCs), CO, NOx, alkanes, alkenes, and aromatics were calculated (Fig. 6). The RIR values for NMVOCs were all positive throughout the entire period, indicating that O3 generation is most sensitive to reductions in NMVOCs. In comparison, the RIR value for NOx was negative, indicating that a reduction in NOx would lead to an increase in O3 concentration. Among the AVOCs, aromatics exhibited the highest RIR values, followed by alkenes and alkanes. During both O3 pollution events and on clean days, the RIR values for NOx were negative, while the RIR values for NMVOCs and CO were positive. In pollution events, except for those concerning BVOCs, the absolute values of RIR for each group and species were lower than those observed on clean days, indicating that the sensitivity of O3 to NMVOCs, NOx, and CO was higher on clean days than during the O3 pollution events. Compared to clean days, during ozone pollution events, the RIR value for AVOCs decreased by 11 %, with aromatics showing the largest decrease (26 %), while alkanes and alkenes increased by 7 % and 3 %, respectively. Additionally, during pollution events, CO and NOx were reduced by 41 % and 18 %, respectively. Additionally, CO and NOx decreased by 29 % and 22 %.
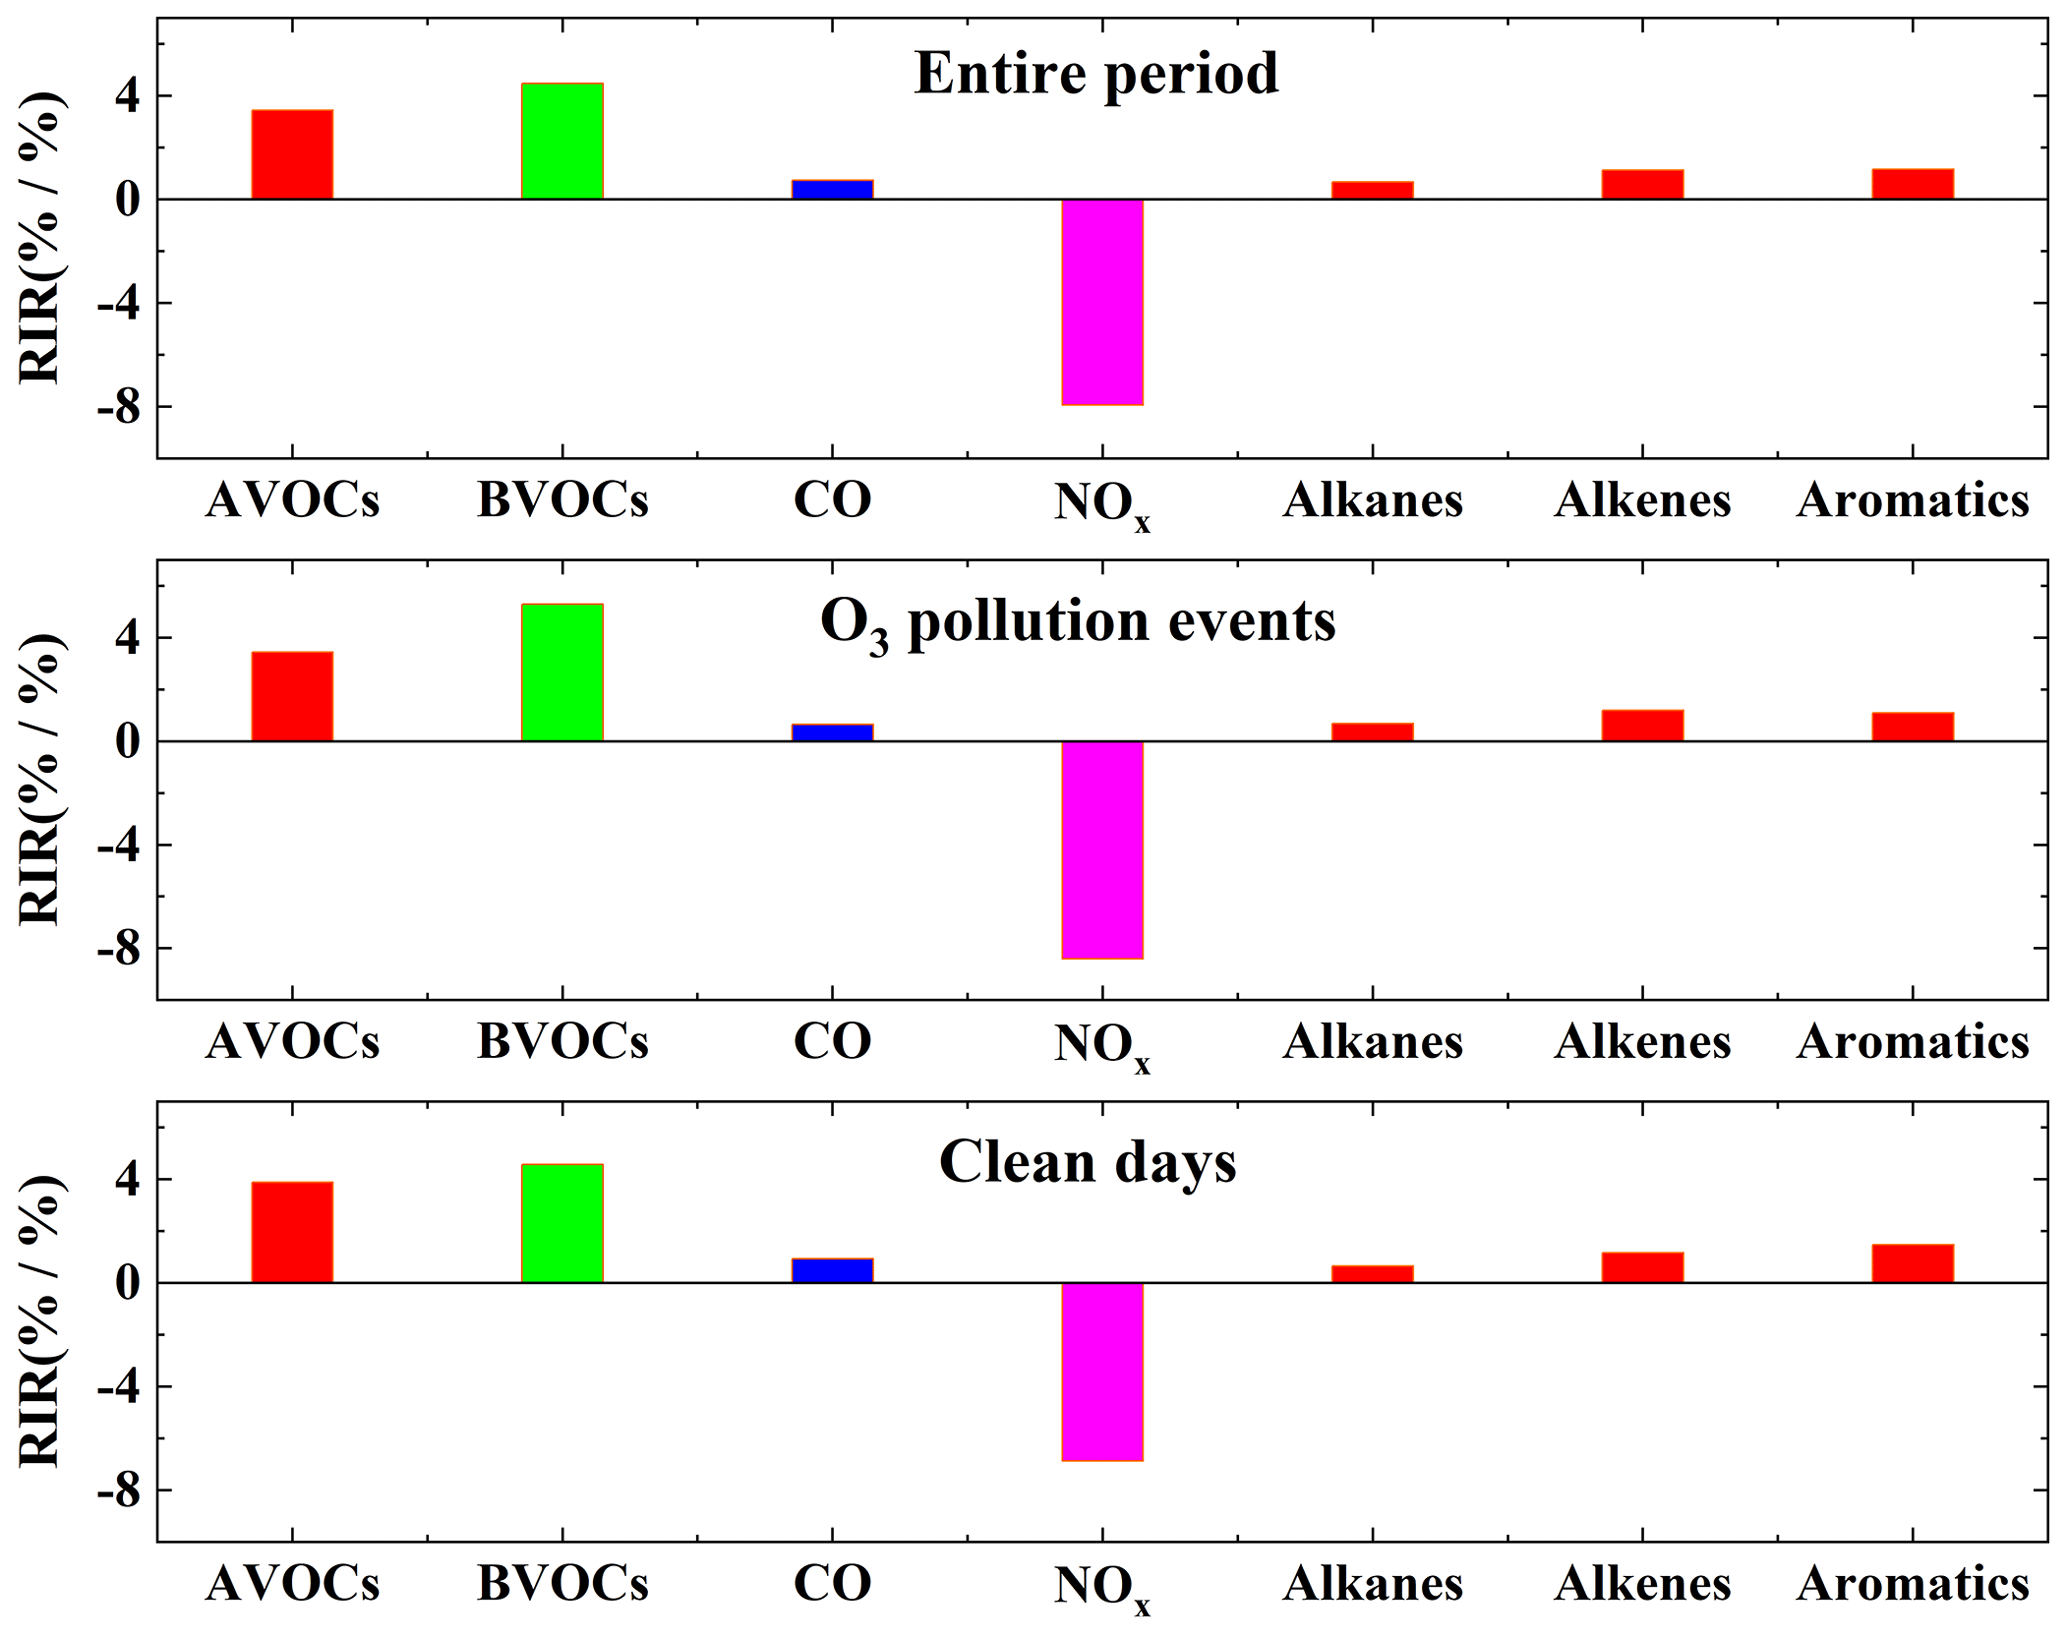
Figure 6Average RIR values of O3 for different species and groups during different processes in Zhengzhou.
Isoprene was the sole BVOC considered in this study and is an important tracer for indicating biogenic emissions (Xie et al., 2021; Li et al., 2024; Qin et al., 2023). Throughout the entire period, especially during the pollution events, the RIR values for the AVOCs were lower than those for the BVOCs, indicating that O3 formation was more sensitive to biogenic emissions. This may be due to increased BVOC emissions caused by higher temperatures and certain solar radiation conditions, combined with their high reactivity and O3 formation potential. Studies in Yucheng (Zong et al., 2018), Leshan (Xie et al., 2021), and Nanjing (Fan et al., 2021; Ming et al., 2020) have shown that O3 is highly sensitive to BVOCs. Studies in Zhengzhou (Wang et al., 2022), Hangzhou (Zhao et al., 2020), and Hong Kong (Wang et al., 2017) have suggested that O3 exhibits greater sensitivity to BVOCs than AVOCS during hot seasons. In their study on O3 source apportionment in the province of Henan, where Zhengzhou is located, Wang et al. (2019) found that BVOCs contribute approximately 23.9 % of the O3 attributed to NMVOCs. Therefore, the contribution of BVOCs to O3 is very important.
3.3.2 Results of the Empirical Kinetics Modeling Approach (EKMA)
Given the current limitations in implementing appropriate control measures for BVOCs, the following analysis focuses solely on the impact of AVOCs and NOx on O3 formation. The EKMA curve based on the OBM is shown in Fig. 7. It can be seen from the EKMA curve that there is a highly nonlinear relationship between the generation of O3 and its precursor compounds, AVOCs and NOx. The same O3 concentration can be generated using different combinations of AVOC and NOx concentrations. In the figure, AVOCs and NOx at 100 % represent the base case, and the y axis and x axis represent the percentages of AVOCs and NOx, respectively, relative to the actual observed mixture ratio (100 %). The straight lines in the figure, known as ridge lines, are formed by the junctions of turning points on O3 concentration lines (Dodge, 1977).
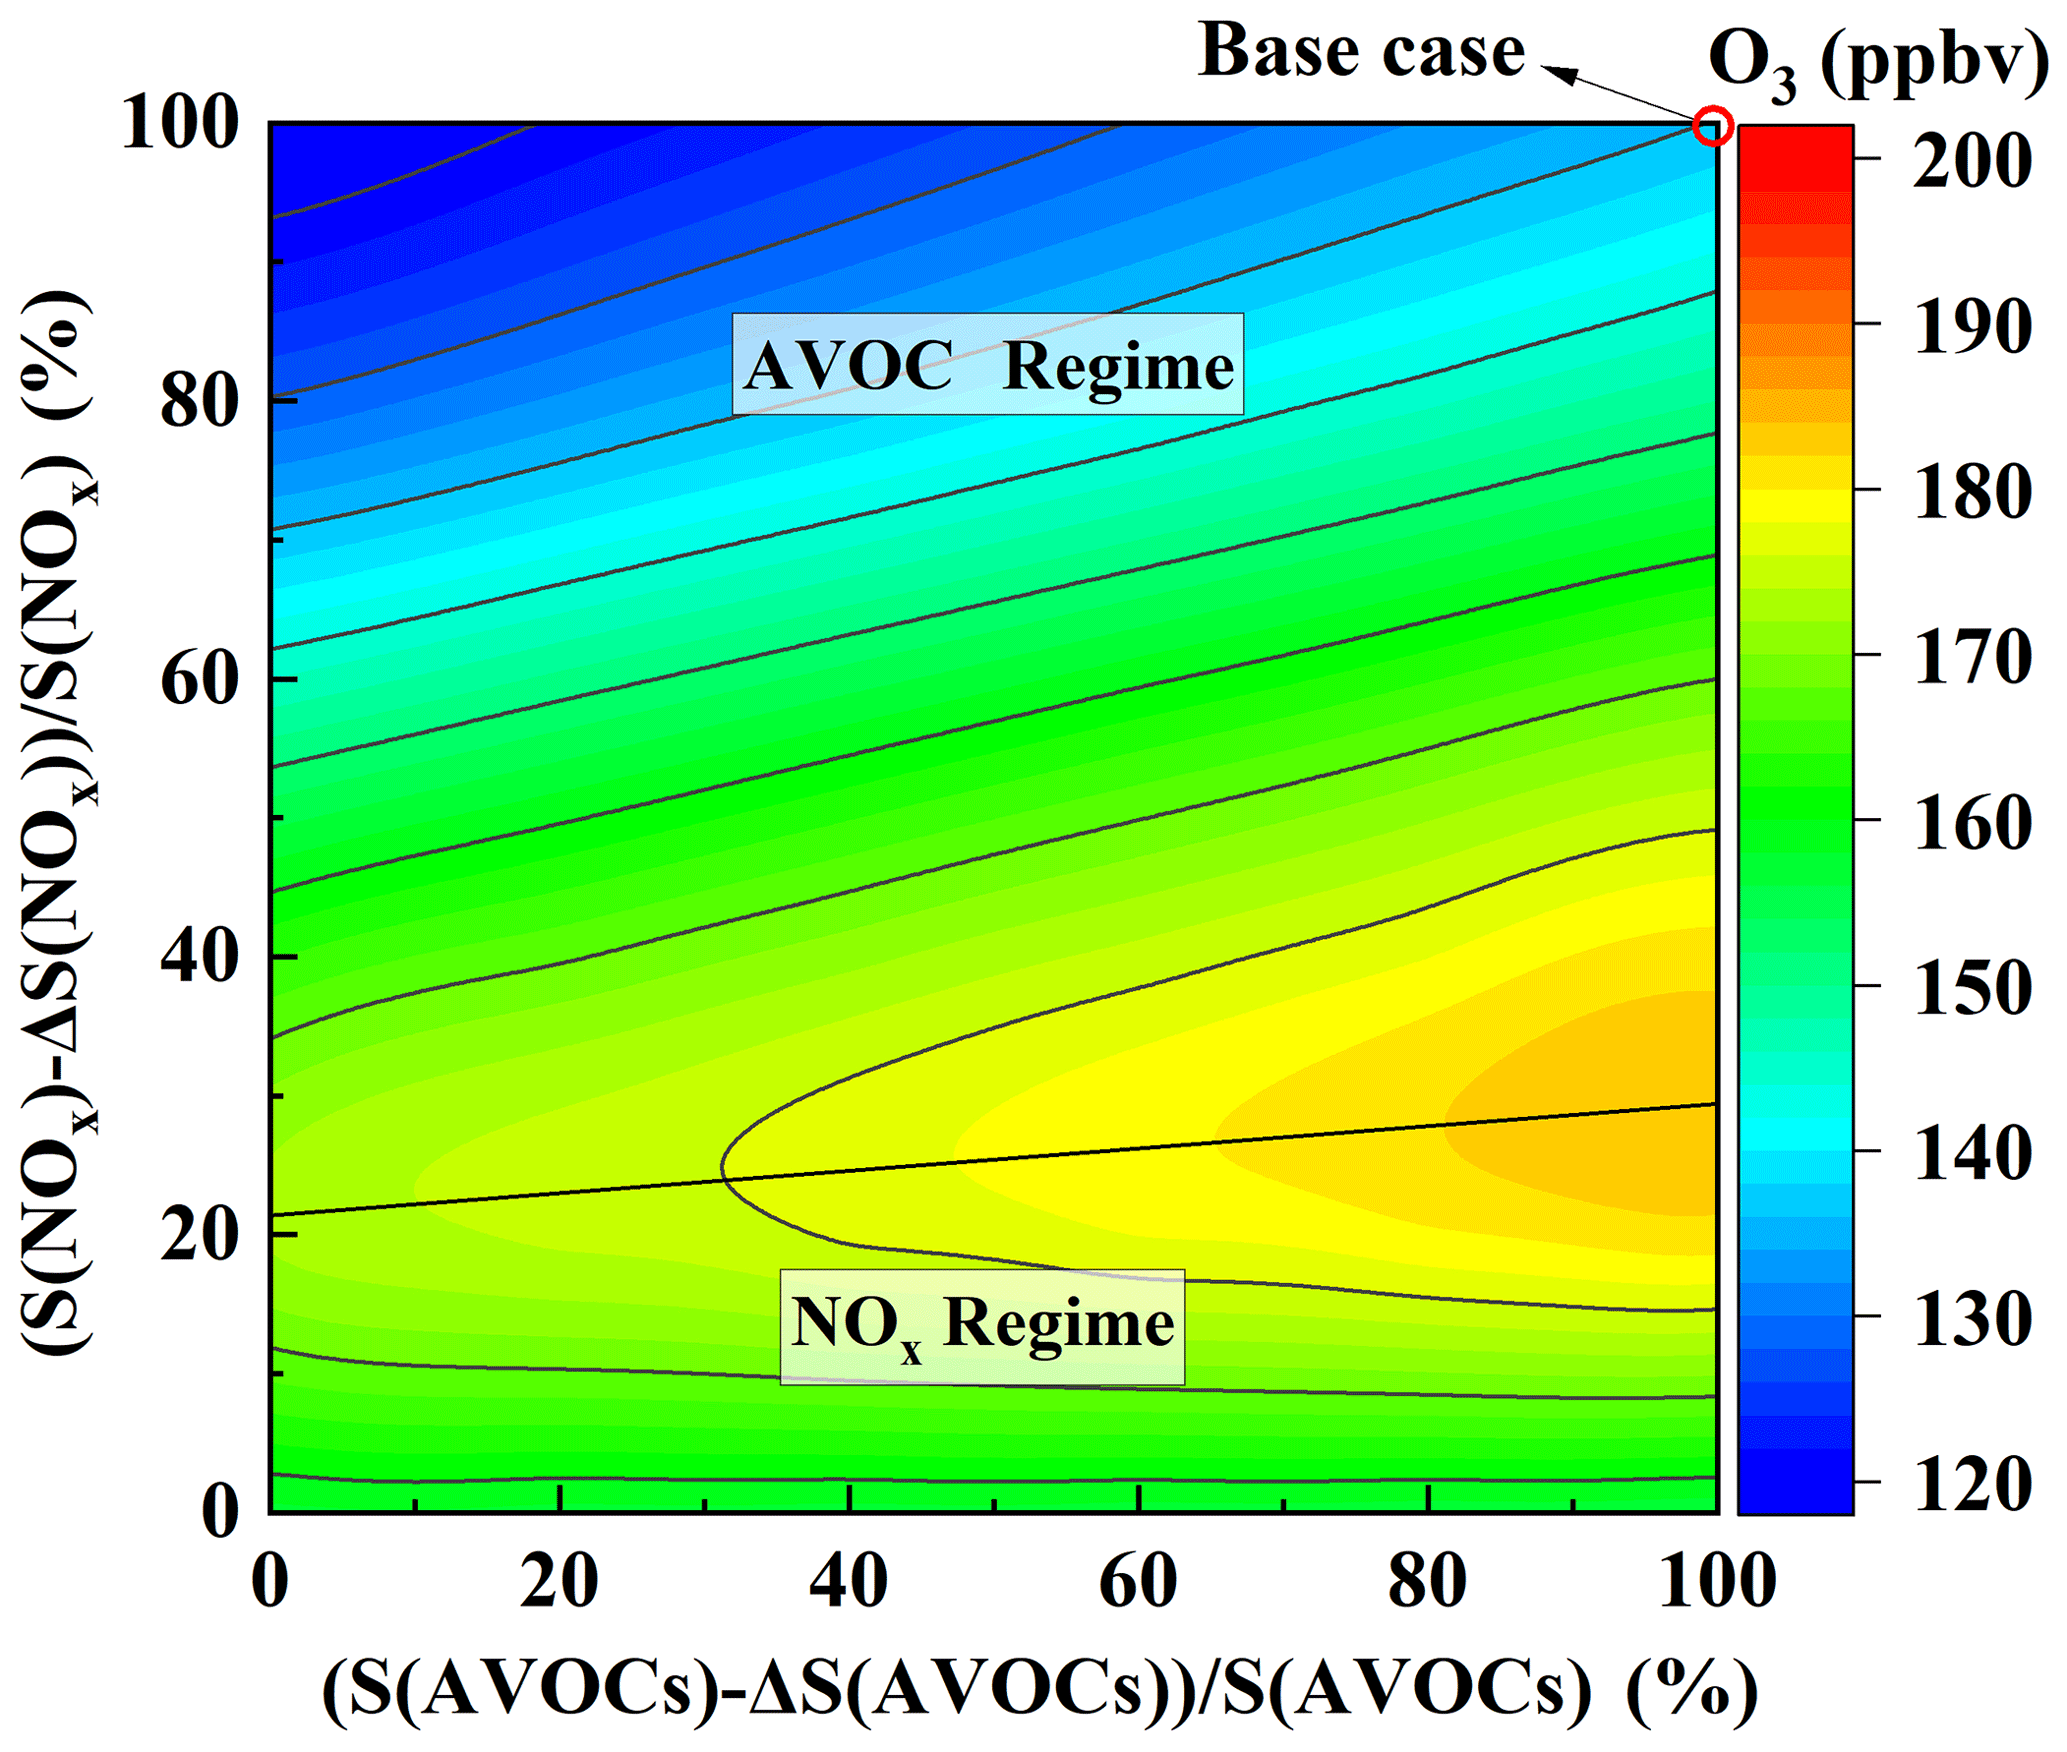
Figure 7Isopleth diagram illustrating modeled O3 using the remaining percentages of S(AVOCs) and S(NOx).
The ridge divides the graph into two regions: the upper-left region and the lower-right region, with large differences in O3 generation between these two regions. In the lower-right region, the O3 concentration lines and the horizontal coordinates show a parallel relationship. If the NOx concentration remains constant, the O3 concentration does not change with the variations in AVOC concentration. When the AVOC concentration remains constant, the concentration of O3 decreases as the NOx concentration decreases. Therefore, in this region, O3 generation is controlled by NOx. In the upper-left region, if only the concentration of AVOCs is reduced, the concentration of O3 will decrease significantly. If only the concentration of NOx is reduced, the concentration of O3 will rise to a maximum and then decrease slightly; however, it will remain higher than the original mixture ratio (red circle at the top right of the figure). In this region, O3 generation is controlled by AVOCs. Near the ridge line, when NOx and AVOCs are reduced at the same time, the O3 concentration decreases, and O3 generation is in the cooperative control area of the AVOCs and NOx.
The slope of this ridge line on this EKMA curve is about 6:1, meaning that reducing NOx and AVOCs along this ridge is the fastest way to reduce the O3 concentration. As shown in the figure, Zhengzhou is a typical AVOC control area, and O3 is very sensitive to changes in AVOCs. At the same time, Case 1, Case 2, and clean days are all above the ridge line and belong to the AVOC control region (Fig. S8 in the Supplement). Therefore, reducing AVOCs can effectively reduce the generation of O3.
3.3.3 Control strategies of O3
The above analysis, based on single species (NOx or AVOCs), was only used to discuss the sensitivity of O3 concentration to precursors; however, such extreme control measures are difficult to achieve. Usually, in actual operations, the method of simultaneously controlling NOx and AVOC emissions is adopted to reduce the concentration of O3. To establish a reasonable and effective AVOC and NOx emission reduction plan, we conducted a series of simulations to calculate the O3 concentration by adjusting the ratio of input AVOCs to NOx. The following analysis examines the reduction cases with regard to O3 control between 10:00 and 16:00 LT during the observation period.
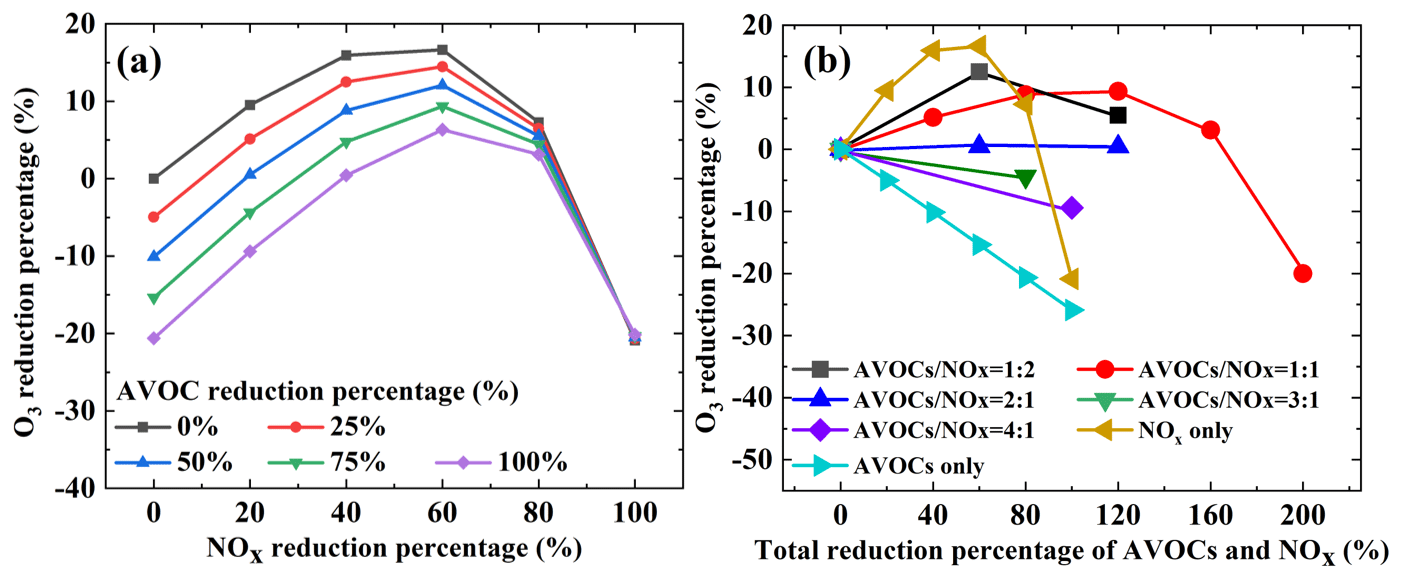
Figure 8Response of O3 concentration to different AVOC and NOx reduction percentages. Note that AVOCs / NOx represents the ratio of the percentage reduction in AVOCs to that in NOx.
Figure 8 shows different reduction schemes. In Fig. 8, the y axis and x axis correspond to the reduction percentages of NOx (or NOx and AVOCs) and the percentage reduction in O3 concentration, respectively. Positive and negative values represent increases and decreases in O3 concentration compared to the base case, respectively. The results show that O3 concentration will eventually decline regardless of the reduction method used, with the trend of change illustrated in Fig. 8a. As shown in Fig. 8b, if only NOx is reduced, when the emission reduction is less than 60 %, O3 concentration increases, and when the emission reduction is greater than 60 %, O3 concentration decreases. Therefore, reducing only NOx emissions is not conducive to reducing O3 concentration. When the AVOCs / NOx reduction ratio is 1:2 or 1:1, the variations in O3 concentration exhibits a similar trend to the variations in NOx emission reduction alone, and O3 concentration increases first and then decreases. When the AVOCs / NOx reduction ratio is 2:1, O3 concentration increases to a certain extent. When the AVOCs / NOx emission reduction ratio is 3:1 or 4:1, O3 concentration continues to decline, and the rate of decline in O3 concentration is higher at 4:1 than at 3:1. When only AVOC emissions are reduced, there is a continuous downward trend in O3 concentration, and the decline rate is very fast. However, with regard to actual production activities, simply reducing AVOC emissions cannot be achieved, which is not conducive to policy implementation. Therefore, from the perspective of comprehensive emission reduction effects, the AVOCs / NOx reduction ratio should be no less than 3:1 in order for it to be conducive to the reduction in O3 concentration.
In addition, this study analyzed O3 reduction schemes from 10:00 to 16:00 LT. It can be seen in Fig. S9 in the Supplement that as NOx decreases, O3 concentration increases and then decreases. When the AVOC reduction ratio is fixed and the NOx reduction ratio is less than 60 %, O3 concentration increases as NOx decreases. In this case, O3 concentration increases by 30 %, 21 %, 16 %, 13 %, 13 %, 15 %, and 15 % from 10:00 to 16:00 LT – that is, under the AVOC scenario without reduction. When the NOx reduction ratio is greater than 60 %, O3 concentration decreases as NOx decreases. When the reduction is at its greatest (i.e., 100 % reduction in NOx and AVOCs), O3 concentration at 10:00 LT is still increased compared with the observed atmospheric concentration, which increases by 14 %. O3 concentration at hourly intervals from 11:00 to 16:00 LT decreases by 2 %, 15 %, 25 %, 32 %, 36 %, and 36 %, respectively.
From 10:00 to 16:00 LT, when only NOx is reduced, O3 concentration increases and then decreases. When only AVOCs are reduced, O3 concentration continues to decrease. When the AVOCs / NOx reduction ratio is less than 2:1, O3 concentration increases and then decreases. When the AVOCs / NOx reduction ratio is greater than 2:1, O3 concentration continues to decrease. When the AVOCs / NOx reduction ratio is equal to 4:1, O3 concentration decreases the most and the fastest. When the AVOCs / NOx reduction ratio equals 4:1, the maximum reduction in O3 concentration at hourly intervals from 10:00 to 16:00 LT amounts to 3 %, 6 %, 10 %, 11 %, 13 %, and 13 %, respectively.
Summer O3 pollution remains an important environmental issue in Zhengzhou. This study investigated the characteristics and emission sources of O3 precursors from 1–30 June 2023. The OBM was used to analyze the influence of precursors on the formation of O3, and an emission reduction strategy for these precursors was proposed to control the concentration of O3. During the entire period, the concentration of TNMVOCs varied from 9.9 to 60.3 ppbv, with an average value of 22.9 ± 8.3 ppbv. The average concentrations of TNMVOCs during O3 pollution events were higher than on clean days. Alkanes (44 %), OVOCs (20 %), and halocarbons (19 %) were the most abundant NMVOC groups. The most abundant species during the O3 pollution events and on clean days were ethane, acetone, and propane. The average concentrations of NO2 during pollution events were higher than on clean days, while the average concentrations of NO were lower than on clean days. Therefore, increasing concentrations of O3 precursors were found to be a significant factor in the formation of O3 pollution. At the same time, the unfavorable meteorological conditions of high temperatures and low RH in the observation process were also important factors in the formation of O3 pollution. Further analysis of the sources revealed that vehicular exhausts (28 %), solvent usage (27 %), and industrial production (22 %) were the main emission sources of NMVOCs. The increase in solvent usage, biogenic emissions, and LPN/NG contributions is an important cause of O3 pollution. An analysis of the sensitivity of O3 to precursors found that NMVOCs had the highest RIR values, while NOx had negative RIR values. Alkenes had the highest RIR values among the AVOCs. It should be noted that the RIR value of the BVOCs was greater than that of the AVOCs. The local O3 formations occurred under an AVOC-limited regime, which means that reducing concentrations of AVOCs is an effective way to reduce O3 concentration. We recommend a minimum AVOCs / NOx reduction ratio of no less than 3:1 to effectively reduce O3 formation.
The data set is available to the public and can be accessed upon request from Ruiqin Zhang (rqzhang@zzu.edu.cn).
The supplement related to this article is available online at: https://doi.org/10.5194/acp-24-8549-2024-supplement.
DZ performed chemical modeling analyses of the OBMs and wrote the paper. XL collected the data and contributed to the data analysis. RZ designed and revised the paper. QX, FS, and SW contributed to the discussions of the results. MY and YX provided part of the data from Zhengzhou.
The contact author has declared that none of the authors has any competing interests.
Publisher's note: Copernicus Publications remains neutral with regard to jurisdictional claims made in the text, published maps, institutional affiliations, or any other geographical representation in this paper. While Copernicus Publications makes every effort to include appropriate place names, the final responsibility lies with the authors.
This work was supported by the Zhengzhou PM2.5 and O3 Collaborative Control and Monitoring Project (grant no. 20220347A), the Natural Science Foundation of Henan Province (grant no. 232300421395), and the National Key Research and Development Program of China (grant no. 2017YFC0212403).
This research has been supported by the Zhengzhou PM2.5 and O3 Collaborative Control and Monitoring Project (grant no. 20220347A), the Natural Science Foundation of Henan Province (grant no. 232300421395), and the National Key Research and Development Program of China (grant no. 2017YFC0212403).
This paper was edited by Rob MacKenzie and reviewed by two anonymous referees.
An, J., Zhu, B., Wang, H., Li, Y., Lin, X., and Yang, H.: Characteristics and source apportionment of VOCs measured in an industrial area of Nanjing, Yangtze River Delta, China, Atmos. Environ., 97, 206–214, https://doi.org/10.1016/j.atmosenv.2014.08.021, 2014.
Andreae, M. O. and Merlet, P.: Emission of trace gases and aerosols from biomass burning, Global Biogeochem. Cy., 15, 955–966, https://doi.org/10.1029/2000GB001382, 2001.
Barletta, B., Meinardi, S., Sherwood Rowland, F., Chan, C.-Y., Wang, X., Zou, S., Yin Chan, L., and Blake, D. R.: Volatile organic compounds in 43 Chinese cities, Atmos. Environ., 39, 5979–5990, https://doi.org/10.1016/j.atmosenv.2005.06.029, 2005.
Billionnet, C., Gay, E., Kirchner, S., Leynaert, B., and Annesi-Maesano, I.: Quantitative assessments of indoor air pollution and respiratory health in a population-based sample of French dwellings, Environ. Res., 111, 425–434, https://doi.org/10.1016/j.envres.2011.02.008, 2011.
Blake, D. R. and Rowland, F. S.: Urban Leakage of Liquefied Petroleum Gas and Its Impact on Mexico City Air Quality, Science, 269, 953–956, https://doi.org/10.1126/science.269.5226.953, 1995.
Bon, D. M., Ulbrich, I. M., de Gouw, J. A., Warneke, C., Kuster, W. C., Alexander, M. L., Baker, A., Beyersdorf, A. J., Blake, D., Fall, R., Jimenez, J. L., Herndon, S. C., Huey, L. G., Knighton, W. B., Ortega, J., Springston, S., and Vargas, O.: Measurements of volatile organic compounds at a suburban ground site (T1) in Mexico City during the MILAGRO 2006 campaign: measurement comparison, emission ratios, and source attribution, Atmos. Chem. Phys., 11, 2399–2421, https://doi.org/10.5194/acp-11-2399-2011, 2011.
Brown, S. G., Frankel, A., and Hafner, H. R.: Source apportionment of VOCs in the Los Angeles area using Positive Matrix Factorization, Atmos. Environ., 41, 227–237, https://doi.org/10.1016/j.atmosenv.2006.08.021, 2007.
Callén, M. S., Iturmendi, A., and López, J. M.: Source apportionment of atmospheric PM2.5-bound polycyclic aromatic hydrocarbons by a PMF receptor model. Assessment of potential risk for human health, Environ. Pollut., 195, 167–177, https://doi.org/10.1016/j.envpol.2014.08.025, 2014.
Cardelino, C. A. and Chameides, W. L.: An observation-based model for analyzing ozone precursor relationships in the urban atmosphere, J. Air Waste Manage., 45, 161–180, https://doi.org/10.1080/10473289.1995.10467356, 1995.
Cardelino, C. A. and Chameides, W. L.: The application of data from photochemical assessment monitoring stations to the observation-based model, Atmos. Environ., 34, 2325–2332, https://doi.org/10.1016/S1352-2310(99)00469-0, 2000.
Carslaw, D. C. and Ropkins, K.: openair – An R package for air quality data analysis, Environ. Modell. Softw., 27–28, 52–61, https://doi.org/10.1016/j.envsoft.2011.09.008, 2012.
Chameides, W. L., Fehsenfeld, F., Rodgers, M. O., Cardelino, C., Martinez, J., Parrish, D., Lonneman, W., Lawson, D. R., Rasmussen, R. A., Zimmerman, P., Greenberg, J., Middleton, P., and Wang, T.: Ozone precursor relationships in the ambient atmosphere, J. Geophys. Res.-Atmos., 97, 6037–6055, https://doi.org/10.1029/91jd03014, 1992.
Chen, D., Xu, Y., Xu, J., Lian, M., Zhang, W., Wu, W., Wu, M., and Zhao, J.: The Vertical Distribution of VOCs and Their Impact on the Environment: A Review, Atmosphere, 13, 1940, https://doi.org/10.3390/atmos13121940, 2022a.
Chen, D., Zhou, L., Wang, C., Liu, H., Qiu, Y., Shi, G., Song, D., Tan, Q., and Yang, F.: Characteristics of ambient volatile organic compounds during spring O3 pollution episode in Chengdu, China, J. Environ. Sci., 114, 115–125, https://doi.org/10.1016/j.jes.2021.08.014, 2022b.
Chen, L., Zhu, J., Liao, H., Yang, Y., and Yue, X.: Meteorological influences on PM2.5 and O3 trends and associated health burden since China's clean air actions, Sci. Total Environ., 744, 140837, https://doi.org/10.1016/j.scitotenv.2020.140837, 2020.
Chen, W. T., Shao, M., Lu, S. H., Wang, M., Zeng, L. M., Yuan, B., and Liu, Y.: Understanding primary and secondary sources of ambient carbonyl compounds in Beijing using the PMF model, Atmos. Chem. Phys., 14, 3047–3062, https://doi.org/10.5194/acp-14-3047-2014, 2014.
Chu, W., Li, H., Ji, Y., Zhang, X., Xue, L., Gao, J., and An, C.: Research on ozone formation sensitivity based on observational methods: Development history, methodology, and application and prospects in China, J. Environ. Sci., 138, 543–560, https://doi.org/10.1016/j.jes.2023.02.052, 2023.
Dai, P., Ge, Y., Lin, Y., Su, S., and Liang, B.: Investigation on characteristics of exhaust and evaporative emissions from passenger cars fueled with gasoline/methanol blends, Fuel, 113, 10–16, https://doi.org/10.1016/j.fuel.2013.05.038, 2013.
Dodge, M. C.: Combined use of modeling techniques and smog chamber data to derive ozone precursor relationships, in: Proceedings of the International Conference on Photochemical Oxidant Pollution and its Control, 12–17 September 1976, Research Triangle Park, North Carolina, USA, edited by: Dimitriades, B., US EPA, RTP, NC, Vol. II, 881–889, EPA-600/3-77-0016, 1977.
Fan, M., Zhang, Y., Lin, Y., Li, L., Xie, F., Hu, J., Mozaffar, A., and Cao, F.: Source apportionments of atmospheric volatile organic compounds in Nanjing, China during high ozone pollution season, Chemosphere, 263, 128025, https://doi.org/10.1016/j.chemosphere.2020.128025, 2021.
Goldberg, D. L., Vinciguerra, T. P., Anderson, D. C., Hembeck, L., Canty, T. P., Ehrman, S. H., Martins, D. K., Stauffer, R. M., Thompson, A. M., Salawitch, R. J., and Dickerson, R. R.: CAMx ozone source attribution in the eastern United States using guidance from observations during DISCOVER-AQ Maryland, Geophys. Res. Lett., 43, 2249–2258, https://doi.org/10.1002/2015gl067332, 2016.
Goldstein, A. H. and Galbally, I. E.: Known and unexplored organic constituents in the earth's atmosphere, Environ. Sci. Technol., 41, 1514–1521, https://doi.org/10.1021/es072476p, 2007.
Guan, Y., Wang, L., Wang, S., Zhang, Y., Xiao, J., Wang, X., Duan, E., and Hou, L. A.: Temporal variations and source apportionment of volatile organic compounds at an urban site in Shijiazhuang, China, J. Environ. Sci., 97, 25–34, https://doi.org/10.1016/j.jes.2020.04.022, 2020.
Guenther, A. B., Zimmerman, P. R., Harley, P. C., Monson, R. K., and Fall, R.: Isoprene and monoterpene emission rate variability: Model evaluations and sensitivity analyses, J. Geophys. Res.-Atmos., 98, 12609–12617, https://doi.org/10.1029/93JD00527, 1993.
Guo, H., Cheng, H. R., Ling, Z. H., Louie, P. K., and Ayoko, G. A.: Which emission sources are responsible for the volatile organic compounds in the atmosphere of Pearl River Delta?, J. Hazard. Mater., 188, 116–124, https://doi.org/10.1016/j.jhazmat.2011.01.081, 2011.
Guo, H., Ling, Z. H., Cheung, K., Wang, D. W., Simpson, I. J., and Blake, D. R.: Acetone in the atmosphere of Hong Kong: Abundance, sources and photochemical precursors, Atmos. Environ., 65, 80–88, https://doi.org/10.1016/j.atmosenv.2012.10.027, 2013.
Guo, J., Xu, Q., Yu, S., Zhao, B., and Zhang, M.: Investigation of atmospheric VOCs sources and ozone formation sensitivity during epidemic closure and control: A case study of Zhengzhou, Atmos. Pollut. Res., 15, 102035, https://doi.org/10.1016/j.apr.2023.102035, 2024.
He, Z., Li, G., Chen, J., Huang, Y., An, T., and Zhang, C.: Pollution characteristics and health risk assessment of volatile organic compounds emitted from different plastic solid waste recycling workshops, Environ. Int., 77, 85–94, https://doi.org/10.1016/j.envint.2015.01.004, 2015.
Hong, Z., Li, M., Wang, H., Xu, L., Hong, Y., Chen, J., Chen, J., Zhang, H., Zhang, Y., Wu, X., Hu, B., and Li, M.: Characteristics of atmospheric volatile organic compounds (VOCs) at a mountainous forest site and two urban sites in the southeast of China, Sci. Total Environ., 657, 1491–1500, https://doi.org/10.1016/j.scitotenv.2018.12.132, 2019.
Huang, B., Lei, C., Wei, C., and Zeng, G.: Chlorinated volatile organic compounds (Cl-VOCs) in environment – sources, potential human health impacts, and current remediation technologies, Environ. Int., 71, 118–138, https://doi.org/10.1016/j.envint.2014.06.013, 2014.
Huang, C., Shi, Y., Yang, M., Tong, L., Dai, X., Liu, F., Huang, C., Zheng, J., Li, J., and Xiao, H.: Spatiotemporal distribution, source apportionment and health risk assessment of atmospheric volatile organic compounds using passive air samplers in a typical coastal area, China, J. Clean. Prod., 423, 138741, https://doi.org/10.1016/j.jclepro.2023.138741, 2023.
Huang, J., Fung, J. C. H., Lau, A. K. H., and Qin, Y.: Numerical simulation and process analysis of typhoon-related ozone episodes in Hong Kong, J. Geophys. Res.-Atmos., 110, D05301, https://doi.org/10.1029/2004jd004914, 2005.
Hui, L., Ma, T., Gao, Z., Gao, J., Wang, Z., Xue, L., Liu, H., and Liu, J.: Characteristics and sources of volatile organic compounds during high ozone episodes: A case study at a site in the eastern Guanzhong Plain, China, Chemosphere, 265, 129072, https://doi.org/10.1016/j.chemosphere.2020.129072, 2020.
Jorquera, H. and Rappenglück, B.: Receptor modeling of ambient VOC at Santiago, Chile, Atmos. Environ., 38, 4243–4263, https://doi.org/10.1016/j.atmosenv.2004.04.030, 2004.
Kim, E. and Hopke, P.: Comparison between conditional probability function and nonparametric regression for fine particle source directions, Atmos. Environ., 38, 4667–4673, https://doi.org/10.1016/j.atmosenv.2004.05.035, 2004.
Kleinman, L. I.: Ozone process insights from field experiments – part II: Observation-based analysis for ozone production, Atmos. Environ., 34, 2023–2033, https://doi.org/10.1016/S1352-2310(99)00457-4, 2000.
Lerner, J. E. C., Sanchez, E. Y., Sambeth, J. E., and Porta, A. A.: Characterization and health risk assessment of VOCs in occupational environments in Buenos Aires, Argentina, Atmos. Environ., 55, 440–447, https://doi.org/10.1016/j.atmosenv.2012.03.041, 2012.
Li, J., Zhai, C., Yu, J., Liu, R., Li, Y., Zeng, L., and Xie, S.: Spatiotemporal variations of ambient volatile organic compounds and their sources in Chongqing, a mountainous megacity in China, Sci. Total Environ., 627, 1442–1452, https://doi.org/10.1016/j.scitotenv.2018.02.010, 2018.
Li, Y., Yin, S., Yu, S., Yuan, M., Dong, Z., Zhang, D., Yang, L., and Zhang, R.: Characteristics, source apportionment and health risks of ambient VOCs during high ozone period at an urban site in central plain, China, Chemosphere, 250, 126283, https://doi.org/10.1016/j.chemosphere.2020.126283, 2020.
Li, Y., Wu, Z., Ji, Y., Chen, T., Li, H., Gao, R., Xue, L., Wang, Y., Zhao, Y., and Yang, X.: Comparison of the ozone formation mechanisms and VOCs apportionment in different ozone pollution episodes in urban Beijing in 2019 and 2020: Insights for ozone pollution control strategies, Sci. Total Environ., 908, 168332, https://doi.org/10.1016/j.scitotenv.2023.168332, 2024.
Lin, C., Ho, T. C., Chu, H., Yang, H., Chandru, S., Krishnarajanagar, N., Chiou, P., and Hopper, J. R.: Sensitivity analysis of ground-level ozone concentration to emission changes in two urban regions of southeast Texas, J. Environ. Manage., 75, 315–323, https://doi.org/10.1016/j.jenvman.2004.09.012, 2005.
Ling, Z. H., Guo, H., Cheng, H. R., and Yu, Y. F.: Sources of ambient volatile organic compounds and their contributions to photochemical ozone formation at a site in the Pearl River Delta, southern China, Environ. Pollut., 159, 2310–2319, https://doi.org/10.1016/j.envpol.2011.05.001, 2011.
Ling, Z. H., Guo, H., Zheng, J. Y., Louie, P. K. K., Cheng, H. R., Jiang, F., Cheung, K., Wong, L. C., and Feng, X. Q.: Establishing a conceptual model for photochemical ozone pollution in subtropical Hong Kong, Atmos. Environ., 76, 208–220, https://doi.org/10.1016/j.atmosenv.2012.09.051, 2013.
Liu, B., Liang, D., Yang, J., Dai, Q., Bi, X., Feng, Y., Yuan, J., Xiao, Z., Zhang, Y., and Xu, H.: Characterization and source apportionment of volatile organic compounds based on 1 year of observational data in Tianjin, China, Environ. Pollut., 218, 757–769, https://doi.org/10.1016/j.envpol.2016.07.072, 2016.
Liu, B., Yang, Y., Yang, T., Dai, Q., Zhang, Y., Feng, Y., and Hopke, P. K.: Effect of photochemical losses of ambient volatile organic compounds on their source apportionment, Environ. Int., 172, 107766, https://doi.org/10.1016/j.envint.2023.107766, 2023.
Liu, T., Hong, Y., Li, M., Xu, L., Chen, J., Bian, Y., Yang, C., Dan, Y., Zhang, Y., Xue, L., Zhao, M., Huang, Z., and Wang, H.: Atmospheric oxidation capacity and ozone pollution mechanism in a coastal city of southeastern China: analysis of a typical photochemical episode by an observation-based model, Atmos. Chem. Phys., 22, 2173–2190, https://doi.org/10.5194/acp-22-2173-2022, 2022.
Liu, Y., Shao, M., Fu, L., Lu, S., Zeng, L., and Tang, D.: Source profiles of volatile organic compounds (VOCs) measured in China: Part I, Atmos. Environ., 42, 6247–6260, https://doi.org/10.1016/j.atmosenv.2008.01.070, 2008.
Liu, Y., Song, M., Liu, X., Zhang, Y., Hui, L., Kong, L., Zhang, Y., Zhang, C., Qu, Y., An, J., Ma, D., Tan, Q., and Feng, M.: Characterization and sources of volatile organic compounds (VOCs) and their related changes during ozone pollution days in 2016 in Beijing, China, Environ. Pollut., 257, 113599, https://doi.org/10.1016/j.envpol.2019.113599, 2020.
Liu, Y., Kong, L., Liu, X., Zhang, Y., Li, C., Zhang, Y., Zhang, C., Qu, Y., An, J., Ma, D., Tan, Q., Feng, M., and Zha, S.: Characteristics, secondary transformation, and health risk assessment of ambient volatile organic compounds (VOCs) in urban Beijing, China, Atmos. Pollut. Res., 12, 33–46, https://doi.org/10.1016/j.apr.2021.01.013, 2021.
Liu, Z., Hu, K., Zhang, K., Zhu, S., Wang, M., and Li, L.: VOCs sources and roles in O3 formation in the central Yangtze River Delta region of China, Atmos. Environ., 302, 119755, https://doi.org/10.1016/j.atmosenv.2023.119755, 2023a.
Liu, Z., Wang, B., Wang, C., Sun, Y., Zhu, C., Sun, L., Yang, N., Fan, G., Sun, X., Xia, Z., Pan, G., Zhu, C., Gai, Y., Wang, X., Xiao, Y., Yan, G., and Xu, C.: Characterization of photochemical losses of volatile organic compounds and their implications for ozone formation potential and source apportionment during summer in suburban Jinan, China, Environ. Res., 238, 117158, https://doi.org/10.1016/j.envres.2023.117158, 2023b.
Lu, B., Zhang, Z., Jiang, J., Meng, X., Liu, C., Herrmann, H., Chen, J., Xue, L., and Li, X.: Unraveling the O3-NOx-VOCs relationships induced by anomalous ozone in industrial regions during COVID-19 in Shanghai, Atmos. Environ., 308, 119864, https://doi.org/10.1016/j.atmosenv.2023.119864, 2023.
Lyu, X. P., Chen, N., Guo, H., Zhang, W. H., Wang, N., Wang, Y., and Liu, M.: Ambient volatile organic compounds and their effect on ozone production in Wuhan, central China, Sci. Total Environ., 541, 200–209, https://doi.org/10.1016/j.scitotenv.2015.09.093, 2016.
Meng, X., Jiang, J., Chen, T., Zhang, Z., Lu, B., Liu, C., Xue, L., Chen, J., Herrmann, H., and Li, X.: Chemical drivers of ozone change in extreme temperatures in eastern China, Sci. Total Environ., 874, 162424, https://doi.org/10.1016/j.scitotenv.2023.162424, 2023.
Meng, Y., Song, J., Zeng, L., Zhang, Y., Zhao, Y., Liu, X., Guo, H., Zhong, L., Ou, Y., Zhou, Y., Zhang, T., Yue, D., and Lai, S.: Ambient volatile organic compounds at a receptor site in the Pearl River Delta region: Variations, source apportionment and effects on ozone formation, J. Environ. Sci., 111, 104–117, https://doi.org/10.1016/j.jes.2021.02.024, 2022.
Miller, L., Xu, X., Grgicak-Mannion, A., Brook, J., and Wheeler, A.: Multi-season, multi-year concentrations and correlations amongst the BTEX group of VOCs in an urbanized industrial city, Atmos. Environ., 61, 305–315, https://doi.org/10.1016/j.atmosenv.2012.07.041, 2012.
Min, R., Wang, F., Wang, Y., Song, G., Zheng, H., Zhang, H., Ru, X., and Song, H.: Contribution of local and surrounding area anthropogenic emissions to a high ozone episode in Zhengzhou, China, Environ. Res., 212, 113440, https://doi.org/10.1016/j.envres.2022.113440, 2022.
Ming, W., Wentai, C., Lin, Z., Wei, Q., Yong, Z., Xiangzhi, Z., and Xin, X.: Ozone pollution characteristics and sensitivity analysis using an observation-based model in Nanjing, Yangtze River Delta Region of China, J. Environ. Sci., 93, 13–22, https://doi.org/10.1016/j.jes.2020.02.027, 2020.
Ministry of Environmental Protection of China: Ambient air quality standards (GB 3095-2012), https://www.mee.gov.cn/ywgz/fgbz/bz/bzwb/dqhjbh/dqhjzlbz/201203/W020120410330232398521.pdf (last access: May 2024), 2012.
Mo, Z., Shao, M., Lu, S., Qu, H., Zhou, M., Sun, J., and Gou, B.: Process-specific emission characteristics of volatile organic compounds (VOCs) from petrochemical facilities in the Yangtze River Delta, China, Sci. Total Environ., 533, 422–431, https://doi.org/10.1016/j.scitotenv.2015.06.089, 2015.
Monod, A., Sive, B. C., Avino, P., Chen, T., Blake, D. R., and Sherwood Rowland, F.: Monoaromatic compounds in ambient air of various cities: a focus on correlations between the xylenes and ethylbenzene, Atmos. Environ., 35, 135–149, https://doi.org/10.1016/S1352-2310(00)00274-0, 2001.
Mozaffar, A., Zhang, Y., Fan, M., Cao, F., and Lin, Y.: Characteristics of summertime ambient VOCs and their contributions to O3 and SOA formation in a suburban area of Nanjing, China, Atmos. Res., 240, 104923, https://doi.org/10.1016/j.atmosres.2020.104923, 2020.
Mozaffar, A., Zhang, Y.-L., Lin, Y.-C., Xie, F., Fan, M.-Y., and Cao, F.: Measurement report: High contributions of halocarbon and aromatic compounds to atmospheric volatile organic compounds in an industrial area, Atmos. Chem. Phys., 21, 18087–18099, https://doi.org/10.5194/acp-21-18087-2021, 2021.
MPS (The Ministry of Public Security of the People's Republic of China): The number of motor vehicles in China exceeded 400 million, https://www.mps.gov.cn/n2254314/n6409334/c8451247/content.html (last access: 10 October 2023), 2022.
Na, K., Kim, Y. P., Moon, K.-C., Moon, I., and Fung, K.: Concentrations of volatile organic compounds in an industrial area of Korea, Atmos. Environ., 35, 2747–2756, https://doi.org/10.1016/S1352-2310(00)00313-7, 2001.
Nelson, B. S., Stewart, G. J., Drysdale, W. S., Newland, M. J., Vaughan, A. R., Dunmore, R. E., Edwards, P. M., Lewis, A. C., Hamilton, J. F., Acton, W. J., Hewitt, C. N., Crilley, L. R., Alam, M. S., Şahin, Ü. A., Beddows, D. C. S., Bloss, W. J., Slater, E., Whalley, L. K., Heard, D. E., Cash, J. M., Langford, B., Nemitz, E., Sommariva, R., Cox, S., Shivani, Gadi, R., Gurjar, B. R., Hopkins, J. R., Rickard, A. R., and Lee, J. D.: In situ ozone production is highly sensitive to volatile organic compounds in Delhi, India, Atmos. Chem. Phys., 21, 13609–13630, https://doi.org/10.5194/acp-21-13609-2021, 2021.
Nopmongcol, U., Koo, B., Tai, E., Jung, J., Piyachaturawat, P., Emery, C., Yarwood, G., Pirovano, G., Mitsakou, C., and Kallos, G.: Modeling Europe with CAMx for the Air Quality Model Evaluation International Initiative (AQMEII), Atmos. Environ., 53, 177–185, https://doi.org/10.1016/j.atmosenv.2011.11.023, 2012.
Norris, G., Duvall, R., Brown, S., and Bai, S.: EPA Positive Matrix Factorization (PMF) 5.0. Fundamentals and User Guide Prepared for the U. S. Environmental Protection Agency Office of Research and Development, Washington, DC (EPA/600/R-14/108; STI-9105115594-UG, April), 2014.
Pacifico, F., Harrison, S. P., Jones, C. D., and Sitch, S.: Isoprene emissions and climate, Atmos. Environ., 43, 6121–6135, https://doi.org/10.1016/j.atmosenv.2009.09.002, 2009.
Paulot, F., Crounse, J. D., Kjaergaard, H. G., Kürten, A., St Clair, J. M., Seinfeld, J. H., and Wennberg, P. O.: Unexpected Epoxide Formation in the Gas-Phase Photooxidation of Isoprene, Science, 325, 730–733, https://doi.org/10.1126/science.1172910, 2009.
Prendez, M., Carvajal, V., Corada, K., Morales, J., Alarcon, F., and Peralta, H.: Biogenic volatile organic compounds from the urban forest of the Metropolitan Region, Chile, Environ. Pollut., 183, 143–150, https://doi.org/10.1016/j.envpol.2013.04.003, 2013.
Qin, J., Wang, X., Yang, Y., Qin, Y., Shi, S., Xu, P., Chen, R., Zhou, X., Tan, J., and Wang, X.: Source apportionment of VOCs in a typical medium-sized city in North China Plain and implications on control policy, J. Environ. Sci., 107, 26–37, https://doi.org/10.1016/j.jes.2020.10.005, 2021.
Qin, Z., Xu, B., Zheng, Z., Li, L., Zhang, G., Li, S., Geng, C., Bai, Z., and Yang, W.: Integrating ambient carbonyl compounds provides insight into the constrained ozone formation chemistry in Zibo city of the North China Plain, Environ. Pollut., 324, 121294, https://doi.org/10.1016/j.envpol.2023.121294, 2023.
Ring, A. M., Canty, T. P., Anderson, D. C., Vinciguerra, T. P., He, H., Goldberg, D. L., Ehrman, S. H., Dickerson, R. R., and Salawitch, R. J.: Evaluating commercial marine emissions and their role in air quality policy using observations and the CMAQ model, Atmos. Environ., 173, 96–107, https://doi.org/10.1016/j.atmosenv.2017.10.037, 2018.
Seila, R. L., Main, H. H., Arriaga, J. L., Martínez V, G., and Ramadan, A. B.: Atmospheric volatile organic compound measurements during the 1996 Paso del Norte Ozone Study, Sci. Total Environ., 276, 153–169, https://doi.org/10.1016/S0048-9697(01)00777-X, 2001.
Sha, Q., Zhu, M., Huang, H., Wang, Y., Huang, Z., Zhang, X., Tang, M., Lu, M., Chen, C., Shi, B., Chen, Z., Wu, L., Zhong, Z., Li, C., Xu, Y., Yu, F., Jia, G., Liao, S., Cui, X., Liu, J., and Zheng, J.: A newly integrated dataset of volatile organic compounds (VOCs) source profiles and implications for the future development of VOCs profiles in China, Sci. Total Environ., 793, 148348, https://doi.org/10.1016/j.scitotenv.2021.148348, 2021.
Shao, M., Zhang, Y., Zeng, L., Tang, X., Zhang, J., Zhong, L., and Wang, B.: Ground-level ozone in the Pearl River Delta and the roles of VOC and NO(x) in its production, J. Environ. Manage., 90, 512–518, https://doi.org/10.1016/j.jenvman.2007.12.008, 2009.
Shao, P., An, J., Xin, J., Wu, F., Wang, J., Ji, D., and Wang, Y.: Source apportionment of VOCs and the contribution to photochemical ozone formation during summer in the typical industrial area in the Yangtze River Delta, China, Atmos. Res., 176–177, 64–74, https://doi.org/10.1016/j.atmosres.2016.02.015, 2016.
Sharkey, T. D., Singsaas, E. L., Vanderveer, P. J., and Geron, C.: Field measurements of isoprene emission from trees in response to temperature and light, Tree Physiol., 16, 649–654, https://doi.org/10.1093/treephys/16.7.649, 1996.
Sicard, P., De Marco, A., Agathokleous, E., Feng, Z., Xu, X., Paoletti, E., Rodriguez, J. J. D., and Calatayud, V.: Amplified ozone pollution in cities during the COVID-19 lockdown, Sci. Total Environ., 735, 139542, https://doi.org/10.1016/j.scitotenv.2020.139542, 2020.
Sillman, S.: The relation between ozone, NOx and hydrocarbons in urban and polluted rural environments, Atmos. Environ., 33, 1821–1845, https://doi.org/10.1016/S1352-2310(98)00345-8, 1999.
Song, Y., Shao, M., Liu, Y., Lu, S., Kuster, W., Goldan, P., and Xie, S.: Source apportionment of ambient volatile organic compounds in Beijing, Environ. Sci. Technol., 41, 4348–4353, 2007.
Tang, J. H., Chan, L. Y., Chan, C. Y., Li, Y. S., Chang, C. C., Liu, S. C., Wu, D., and Li, Y. D.: Characteristics and diurnal variations of NMHCs at urban, suburban, and rural sites in the Pearl River Delta and a remote site in South China, Atmos. Environ., 41, 8620–8632, https://doi.org/10.1016/j.atmosenv.2007.07.029, 2007.
Thijsse, T. R., Oss, R. F. V., and Lenschow, P.: Determination of Source Contributions to Ambient Volatile Organic Compound Concentrations in Berlin, J. Air Waste Manage., 49, 1394–1404, https://doi.org/10.1080/10473289.1999.10463974, 1999.
Tsai, W. Y., Chan, L. Y., Blake, D. R., and Chu, K. W.: Vehicular fuel composition and atmospheric emissions in South China: Hong Kong, Macau, Guangzhou, and Zhuhai, Atmos. Chem. Phys., 6, 3281–3288, https://doi.org/10.5194/acp-6-3281-2006, 2006.
Uria-Tellaetxe, I. and Carslaw, D. C.: Conditional bivariate probability function for source identification, Environ. Modell. Softw., 59, 1–9, https://doi.org/10.1016/j.envsoft.2014.05.002, 2014.
USEPA: Epa Positive Matrix Factorization (PMF) 5.0 Fundamentals & User Guide, USEPA Office of Research and Development, https://www.epa.gov/air-research/epa-positive-matrix-factorization-50-fundamentals-and-user-guide (last access: July 2024), 2014.
Wang, B., Liu, Z., Li, Z., Sun, Y., Wang, C., Zhu, C., Sun, L., Yang, N., Bai, G., Fan, G., Sun, X., Xia, Z., Pan, G., Xu, C., and Yan, G.: Characteristics, chemical transformation and source apportionment of volatile organic compounds (VOCs) during wintertime at a suburban site in a provincial capital city, east China, Atmos. Environ., 298, 119621, https://doi.org/10.1016/j.atmosenv.2023.119621, 2023.
Wang, M., Sheng, H., Liu, Y., Wang, G., Huang, H., Fan, L., and Ye, D.: Research on the diurnal variation characteristics of ozone formation sensitivity and the impact of ozone pollution control measures in “2+26” cities of Henan Province in summer, Sci. Total Environ., 888, 164121, https://doi.org/10.1016/j.scitotenv.2023.164121, 2023.
Wang, P., Chen, Y., Hu, J., Zhang, H., and Ying, Q.: Source apportionment of summertime ozone in China using a source-oriented chemical transport model, Atmos. Environ., 211, 79–90, https://doi.org/10.1016/j.atmosenv.2019.05.006, 2019.
Wang, X., Yin, S., Zhang, R., Yuan, M., and Ying, Q.: Assessment of summertime O3 formation and the O3-NOx-VOC sensitivity in Zhengzhou, China using an observation-based model, Sci. Total Environ., 813, 152449, https://doi.org/10.1016/j.scitotenv.2021.152449, 2022.
Wang, Y., Wang, H., Guo, H., Lyu, X., Cheng, H., Ling, Z., Louie, P. K. K., Simpson, I. J., Meinardi, S., and Blake, D. R.: Long-term O3–precursor relationships in Hong Kong: field observation and model simulation, Atmos. Chem. Phys., 17, 10919–10935, https://doi.org/10.5194/acp-17-10919-2017, 2017.
Wang, Y., Guo, H., Zou, S., Lyu, X., Ling, Z., Cheng, H., and Zeren, Y.: Surface O3 photochemistry over the South China Sea: Application of a near-explicit chemical mechanism box model, Environ. Pollut., 234, 155–166, https://doi.org/10.1016/j.envpol.2017.11.001, 2018.
Watson, J. G., Chow, J. C., and Fujita, E. M.: Review of volatile organic compound source apportionment by chemical mass balance, Atmos. Environ., 35, 1567–1584, https://doi.org/10.1016/S1352-2310(00)00461-1, 2001.
Wu, R., Li, J., Hao, Y., Li, Y., Zeng, L., and Xie, S.: Evolution process and sources of ambient volatile organic compounds during a severe haze event in Beijing, China, Sci. Total Environ., 560–561, 62–72, https://doi.org/10.1016/j.scitotenv.2016.04.030, 2016.
Wu, Y., Fan, X., Liu, Y., Zhang, J., Wang, H., Sun, L., Fang, T., Mao, H., Hu, J., Wu, L., Peng, J., and Wang, S.: Source apportionment of VOCs based on photochemical loss in summer at a suburban site in Beijing, Atmos. Environ., 293, 119459, https://doi.org/10.1016/j.atmosenv.2022.119459, 2023a.
Wu, Y., Liu, B., Meng, H., Dai, Q., Shi, L., Song, S., Feng, Y., and Hopke, P. K.: Changes in source apportioned VOCs during high O3 periods using initial VOC-concentration-dispersion normalized PMF, Sci. Total Environ., 896, 165182, https://doi.org/10.1016/j.scitotenv.2023.165182, 2023b.
Xia, L., Cai, C., Zhu, B., An, J., Li, Y., and Li, Y.: Source apportionment of VOCs in a suburb of Nanjing, China, in autumn and winter, J. Atmos. Chem., 71, 175–193, https://doi.org/10.1007/s10874-014-9289-6, 2014.
Xie, Y., Cheng, C., Wang, Z., Wang, K., Wang, Y., Zhang, X., Li, X., Ren, L., Liu, M., and Li, M.: Exploration of O3-precursor relationship and observation-oriented O3 control strategies in a non-provincial capital city, southwestern China, Sci. Total Environ., 800, 149422, https://doi.org/10.1016/j.scitotenv.2021.149422, 2021.
Xu, Z., Zou, Q., Jin, L., Shen, Y., Shen, J., Xu, B., Qu, F., Zhang, F., Xu, J., Pei, X., Xie, G., Kuang, B., Huang, X., Tian, X., and Wang, Z.: Characteristics and sources of ambient Volatile Organic Compounds (VOCs) at a regional background site, YRD region, China: Significant influence of solvent evaporation during hot months, Sci. Total Environ., 857, 159674, https://doi.org/10.1016/j.scitotenv.2022.159674, 2023.
Yan, D., Zhang, Z., Jin, Z., Li, M., Sheridan, S. C., and Wang, T.: Ozone variability driven by the synoptic patterns over China during 2014–2022 and its implications for crop yield and economy, Atmos. Pollut. Res., 14, 101843, https://doi.org/10.1016/j.apr.2023.101843, 2023.
Yang, L., Yuan, Z., Luo, H., Wang, Y., Xu, Y., Duan, Y., and Fu, Q.: Identification of long-term evolution of ozone sensitivity to precursors based on two-dimensional mutual verification, Sci. Total Environ., 760, 143401, https://doi.org/10.1016/j.scitotenv.2020.143401, 2021.
Yu, S., Su, F., Yin, S., Wang, S., Xu, R., He, B., Fan, X., Yuan, M., and Zhang, R.: Characterization of ambient volatile organic compounds, source apportionment, and the ozone–NOx–VOC sensitivities in a heavily polluted megacity of central China: effect of sporting events and emission reductions, Atmos. Chem. Phys., 21, 15239–15257, https://doi.org/10.5194/acp-21-15239-2021, 2021.
Yu, S., Wang, S., Xu, R., Zhang, D., Zhang, M., Su, F., Lu, X., Li, X., Zhang, R., and Wang, L.: Measurement report: Intra- and interannual variability and source apportionment of volatile organic compounds during 2018–2020 in Zhengzhou, central China, Atmos. Chem. Phys., 22, 14859–14878, https://doi.org/10.5194/acp-22-14859-2022, 2022.
Yuan, B., Shao, M., de Gouw, J., Parrish, D. D., Lu, S., Wang, M., Zeng, L., Zhang, Q., Song, Y., Zhang, J., and Hu, M.: Volatile organic compounds (VOCs) in urban air: How chemistry affects the interpretation of positive matrix factorization (PMF) analysis, J. Geophys. Res.-Atmos., 117, 24302, https://doi.org/10.1029/2012jd018236, 2012.
Yuan, Z., Zhong, L., Lau, A. K. H., Yu, J. Z., and Louie, P. K. K.: Volatile organic compounds in the Pearl River Delta: Identification of source regions and recommendations for emission-oriented monitoring strategies, Atmos. Environ., 76, 162–172, https://doi.org/10.1016/j.atmosenv.2012.11.034, 2013.
Yurdakul, S., Civan, M., Kuntasal, Ö., Doğan, G., Pekey, H., and Tuncel, G.: Temporal variations of VOC concentrations in Bursa atmosphere, Atmos. Pollut. Res., 9, 189–206, https://doi.org/10.1016/j.apr.2017.09.004, 2018.
Zeng, X., Han, M., Ren, G., Liu, G., Wang, X., Du, K., Zhang, X., and Lin, H.: A comprehensive investigation on source apportionment and multi-directional regional transport of volatile organic compounds and ozone in urban Zhengzhou, Chemosphere, 334, 139001, https://doi.org/10.1016/j.chemosphere.2023.139001, 2023.
Zhang, D., He, B., Yuan, M., Yu, S., Yin, S., and Zhang, R.: Characteristics, sources and health risks assessment of VOCs in Zhengzhou, China during haze pollution season, J. Environ. Sci., 108, 44–57, https://doi.org/10.1016/j.jes.2021.01.035, 2021.
Zhang, H., Wang, Y., Hu, J., Ying, Q., and Hu, X. M.: Relationships between meteorological parameters and criteria air pollutants in three megacities in China, Environ. Res., 140, 242–254, https://doi.org/10.1016/j.envres.2015.04.004, 2015.
Zhang, L., Li, H., Wu, Z., Zhang, W., Liu, K., Cheng, X., Zhang, Y., Li, B., and Chen, Y.: Characteristics of atmospheric volatile organic compounds in urban area of Beijing: Variations, photochemical reactivity and source apportionment, J. Environ. Sci., 95, 190–200, https://doi.org/10.1016/j.jes.2020.03.023, 2020.
Zhang, Y., Li, R., Fu, H., Zhou, D., and Chen, J.: Observation and analysis of atmospheric volatile organic compounds in a typical petrochemical area in Yangtze River Delta, China, J. Environ. Sci., 71, 233–248, https://doi.org/10.1016/j.jes.2018.05.027, 2018.
Zhang, Y. H., Su, H., Zhong, L. J., Cheng, Y. F., Zeng, L. M., Wang, X. S., Xiang, Y. R., Wang, J. L., Gao, D. F., and Shao, M.: Regional ozone pollution and observation-based approach for analyzing ozone–precursor relationship during the PRIDE-PRD2004 campaign, Atmos. Environ., 42, 6203–6218, https://doi.org/10.1016/j.atmosenv.2008.05.002, 2008.
Zhang, Z., Zhang, Y., Wang, X., Lü, S., Huang, Z., Huang, X., Yang, W., Wang, Y., and Zhang, Q.: Spatiotemporal patterns and source implications of aromatic hydrocarbons at six rural sites across China's developed coastal regions, J. Geophys. Res.-Atmos., 121, 6669–6687, https://doi.org/10.1002/2016jd025115, 2016.
Zhang, Z., Sun, Y., and Li, J.: Characteristics and sources of VOCs in a coastal city in eastern China and the implications in secondary organic aerosol and O3 formation, Sci. Total Environ., 887, 164117, https://doi.org/10.1016/j.scitotenv.2023.164117, 2023.
Zhao, C., Sun, Y., Zhong, Y., Xu, S., Liang, Y., Liu, S., He, X., Zhu, J., Shibamoto, T., and He, M.: Spatio-temporal analysis of urban air pollutants throughout China during 2014–2019, Air Qual. Atmos. Hlth., 14, 1619–1632, https://doi.org/10.1007/s11869-021-01043-5, 2021.
Zhao, Y., Chen, L., Li, K., Han, L., Zhang, X., Wu, X., Gao, X., Azzi, M., and Cen, K.: Atmospheric ozone chemistry and control strategies in Hangzhou, China: Application of a 0-D box model, Atmos. Res., 246, 105109, https://doi.org/10.1016/j.atmosres.2020.105109, 2020.
Zhu, B., Huang, X., Xia, S., Lin, L., Cheng, Y., and He, L.: Biomass-burning emissions could significantly enhance the atmospheric oxidizing capacity in continental air pollution, Environ. Pollut., 285, 117523, https://doi.org/10.1016/j.envpol.2021.117523, 2021.
Zong, R., Yang, X., Wen, L., Xu, C., Zhu, Y., Chen, T., Yao, L., Wang, L., Zhang, J., Yang, L., Wang, X., Shao, M., Zhu, T., Xue, L., and Wang, W.: Strong ozone production at a rural site in theNorth China Plain: Mixed effects of urban plumesand biogenic emissions, J. Environ. Sci., 71, 261–270, https://doi.org/10.1016/j.jes.2018.05.003, 2018.
Zou, Y., Yan, X. L., Flores, R. M., Zhang, L. Y., Yang, S. P., Fan, L. Y., Deng, T., Deng, X. J., and Ye, D. Q.: Source apportionment and ozone formation mechanism of VOCs considering photochemical loss in Guangzhou, China, Sci. Total Environ., 903, 166191, https://doi.org/10.1016/j.scitotenv.2023.166191, 2023.