the Creative Commons Attribution 4.0 License.
the Creative Commons Attribution 4.0 License.
 | 25 Jul 2024
Source-resolved atmospheric metal emissions, concentrations, and deposition fluxes into the East Asian seas
Shenglan Jiang
Yan Zhang
Guangyuan Yu
Zimin Han
Junri Zhao
Tianle Zhang
Mei Zheng
Atmospheric deposition is an important source of marine metallic elements, which have a non-negligible impact on marine ecology. Trace metals from different sources undergo their respective transport processes in the atmosphere, ultimately depositing into the ocean. This study aims to provide gridded data on sea-wide concentrations, deposition fluxes, and soluble deposition fluxes with detailed source categories of metals using the modified Community Multiscale Air Quality (CMAQ) model. A monthly emission inventory of six metals – Fe, Al, V, Ni, Zn, and Cu – from terrestrial anthropogenic, ship, and dust sources in East Asia (0–55° N, 85–150° E) in 2017 was developed. Most metals came primarily from land-based sources, contributing over 80 %. The annual marine atmospheric deposition fluxes of Fe, Al, V, Ni, Zn, and Cu were 8827.0, 13 384.3, 99.3, 82.4, 162.7, and 86.5 µg m−2, respectively, and the corresponding soluble deposition fluxes were 634.3, 1701.6, 74.3, 46.1, 113.0, and 42.0 µg m−2. The contributions of each source of trace metals varied in emissions, atmospheric concentrations, and depositions. Dust sources, as a main contributor of Fe and Al, accounted for a higher proportion of emissions (∼90 %) than marine deposition fluxes (∼20 %). However, anthropogenic sources have larger shares of the marine deposition flux compared with emissions. The deposition of Zn, Cu, and soluble Fe in East Asian seas was dominated by terrestrial anthropogenic sources, while V and Ni were dominated by shipping. The identification of the dominant source of metal deposition offers a foundation for dynamic assessments of the marine ecological effects of atmospheric trace metals. The source-resolved seasonal gridded data make it possible to calculate the soluble metal deposition flux on a source-by-source basis.
- Article
(4552 KB) - Full-text XML
-
Supplement
(2325 KB) - BibTeX
- EndNote


Trace metals (iron, cobalt, nickel, copper, zinc, manganese, cadmium, lead, and rare earth elements, among others) have been the focus of marine biogeochemical studies for half a century. They are present in seawater at very low concentrations, typically in the picomole-per-liter (pmol L−1) to nanomole-per-liter (nmol L−1) range (Morel and Price, 2003). During the evolution of life, transition metals play a crucial role in many biochemical functions. It is widely documented that transition trace metals, such as Fe, Zn, Cu, and Ni, are essential nutrients for marine biota (Butler, 1998; de Baar et al., 2018; Whitfield, 2001). Trace metals are involved in nitrogen and carbon fixation by marine phytoplankton, and their mechanism of action is to regulate the expression of biological enzymes (Bonnet et al., 2008; Browning et al., 2017; Mackey et al., 2015; Morel et al., 1994; Nuester et al., 2012; Rodriguez and Ho, 2014; Schmidt et al., 2016; Shaked et al., 2006; Sunda, 2012; Tortell et al., 2000; Wuttig et al., 2013a, b). Atmospheric deposition, seafloor hydrothermal upwelling, land-based sediment and riverine inputs, and remineralization of the oceanic substrate are important sources of marine metals (Longhini et al., 2019; Yang et al., 2019). It has been shown that the source of atmospheric deposition is important for some elements in seawater, e.g., the global atmospheric deposition of copper is comparable to or even higher than riverine inputs (Little et al., 2014; Takano et al., 2014), and that atmospheric deposition can carry elements to more remote seas compared with riverine inputs (Yamamoto et al., 2022).
Atmospheric aerosols originate from both natural and anthropogenic sources. Aerosols originating from natural sources (e.g., dust storms, volcanic eruptions, and wildfires) differ significantly with respect to their fluxes, composition, and properties from those produced by human activities (e.g., industrial emissions, transportation, mining, and agriculture) (Baker and Jickells, 2017; Barkley et al., 2019; Hamilton et al., 2022; Ito et al., 2021; Shi et al., 2023; Zhang et al., 2022). Aerosols from natural sources have high deposition fluxes and broad deposition ranges, especially for Al and Fe, but generally have low solubility (Baker et al., 2020; Mahowald et al., 2005; Shi et al., 2015). By contrast, aerosols emitted from anthropogenic sources are often produced by high-temperature combustion, are characterized by small particle sizes (Bowie et al., 2009; Chen et al., 2012; Li et al., 2017; Oakes et al., 2012), and contain more soluble metallic elements (Yamamoto et al., 2022; Zhang et al., 2024). To accurately assess the biogeochemical impact of the atmospheric input, atmospheric particulate species should be determined for the bioavailable soluble fraction, rather than only for the total concentrations or depositions (Birmili et al., 2006; Hsu et al., 2010). Therefore, emissions from anthropogenic sources, although not as high as those from natural sources, are still of great concern. Anthropogenic sources can be subdivided into land-based sources and shipping sources. Emissions from ships can be transported to remote sea areas that land-based aerosols rarely reach. With the development of a booming shipping industry, their contribution to metal deposition should not be ignored, particularly for V and Ni, which are considered the most abundant trace metals in ship heavy-fuel oil (HFO) (Celo et al., 2015; Corbin et al., 2018).
The spatial distribution of metal emissions from ship and anthropogenic sources contrasts with that of dust (Mahowald et al., 2018). Dust has long been considered an important source of Fe to the surface ocean, particularly in remote areas away from continental margins (Jickells et al., 2005). However, Matsui et al. (2018) suggested that anthropogenic Fe may dominate the total deposition flux of soluble Fe and its variability over southern oceans (30–90° S); they established this by incorporating recent measurements of anthropogenic magnetite into a global aerosol model, which increased the estimated total deposition flux of soluble Fe to southern oceans by 52 %. Using iron-stable isotopes, Pinedo-González et al. (2020) determined that anthropogenic Fe contributed 21 %–59 % of soluble Fe measured in the North Pacific Ocean. The northwestern Pacific is located directly downwind of the industrially active East Asian region, experiences significant and increasing metal emissions, and is influenced by westerly winds transporting Asian dust (often mixed with anthropogenic aerosol and gases) (Hamilton et al., 2023). Thus, identifying the dominant sources of metal deposition in the ocean is important for estimating soluble metal deposition, especially in the East Asian seas which encounter significant contributions from both dust and anthropogenic metal emissions.
Recent studies on metal emission inventories have mainly focused on land-based emission sources (Bai et al., 2021; Tian et al., 2015; Wang et al., 2016). Furthermore, the inventories including high-resolution ship sources only cover a limited number of metals, such as V and Ni (Zhai et al., 2023; J. Zhao et al., 2021b), but the contribution of shipping to other metals should also be considered. Previous studies on the concentration and deposition flux of metals have been carried out using site observations and source apportionment via statistical methodologies (Fu et al., 2023; Okubo et al., 2013; Pan and Wang, 2015; Pan et al., 2021; Tao et al., 2016, 2017; Wei et al., 2014; Zhang et al., 2024). Due to limitations with respect to the location of the observation sites, these studies have been unable to provide data over a wide area of the ocean, and uncertainty exists regarding source confirmation based on statistical methods. Current model-based simulations of gridded concentrations, deposition fluxes, and source apportionment have mainly been focused on Fe (Matsui et al., 2018; Yamamoto et al., 2022). Moreover, broader regional-scale studies using air quality models have been rare, perhaps due to the shortage of emission inventories of trace elements. Thus, emission inventories that include metals with marine ecological effects and metals representative of dust and ship sources need to be developed. Additionally, the atmospheric transport processes of these metals and their deposition fluxes to the ocean remain to be studied.
In this work, we established an emission inventory of six metallic elements (Fe, Al, V, Ni, Zn, and Cu) from three major emission sources, namely, terrestrial anthropogenic, ship, and dust sources, in the East Asian region (0–55° N, 85–150° E) in 2017. The aerosol module in the Community Multiscale Air Quality (CMAQ) model was modified to simulate the concentration and dry- and wet-deposition fluxes of the metallic elements and to calculate the soluble metal deposition fluxes. In addition, we quantified the contribution of each source to the emissions and concentrations of metallic elements in East Asia and analyzed the sources of deposited metals in different sea areas.
2.1 Description of the modeling system
The CMAQ (U.S. EPA, 2020) is a widely used air quality model that encompasses a wide range of complex atmospheric physicochemical processes. This study modeled metal concentrations and dry- and wet-deposition fluxes using CMAQ version 5.4. The multi-pollutant code in the aerosol module and the in-line dust emission module of CMAQ v5.4 were modified to add metallic elements as modeling variables. In the revised version of the CMAQ model, it was assumed that these six metallic elements were considered inert chemical constituents in aerosols, which can participate in atmospheric physical processes such as diffusion, advection, and deposition but do not participate in any atmospheric chemical reactions. Specific modifications are described in the Supplement (Sect. S1).
The CMAQ model configuration utilized AERO7 for the aerosol module (Xu et al., 2018) and CB6r5 for the gas-phase mechanism (Amedro et al., 2020), including detailed halogen chemical components (Sarwar et al., 2019) and dimethylsulfide (DMS) (Lana et al., 2011; J. Zhao et al., 2021a). The M3Dry scheme was used to calculate dry deposition (Pleim and Ran, 2011), and the aerosol dry-deposition model was upgraded in version 5.4, showing better comparison with size-resolved observations (Pleim et al., 2022); AQCHEM cloud chemistry was used to calculate wet deposition (Fahey et al., 2017). Initial and boundary conditions for the simulation domain were established based on seasonal average hemispheric CMAQ output from the CMAS data repository (E.P.A., 2019). Meteorological fields were generated using the Weather Research and Forecasting (WRF) model version 4.1.1, with initial and boundary conditions sourced from the 6 h temporal resolution National Centers for Environmental Prediction (NCEP) Final operational global analysis dataset. The physics schemes are listed in the Supplement (Sect. S2).
In this study, three scenarios were carried out to investigate the whole process, from emission to atmospheric concentration to deposition in the sea. The effects of different emission sources on atmospheric concentration and the deposition fluxes of metals were also examined. The first scenario included three emission sources, terrestrial anthropogenic, ship, and dust sources; the second scenario included only terrestrial anthropogenic and dust sources; and the third scenario included only terrestrial anthropogenic and ship sources. The contributions of ship and dust sources to metal concentrations and deposition fluxes were extracted based on the zero-out method, i.e., two runs with and without ship or dust emissions. The impact of terrestrial anthropogenic sources was also calculated. Each simulation was conducted for January, April, July, and October of 2017, with a 5 d spin-up period to calculate the atmospheric concentrations and deposition fluxes of metals, representing winter, spring, summer, and autumn, respectively. The simulation domain covers East Asia and most of the East Asian seas, as shown in Fig. S1 in the Supplement, discretized with a horizontal grid resolution of 36 km and 27 vertical layers between the surface and 100 hPa; the surface layer thickness was ∼40 m.
2.2 Methodology of metal emission inventory
In this study, metal emission sources were categorized into terrestrial anthropogenic, ship, and dust sources. The general methodology for calculating monthly terrestrial anthropogenic emissions of metals was to multiply each source of particulate matter (PM) emissions by the fraction of the metal content in PM. Monthly emissions data for 2017 for each source category of PM were provided by the Emissions Database for Global Atmospheric Research (EDGAR) emission inventories (global, 0.1° × 0.1° resolution; Crippa et al., 2020), and corresponding source-specific speciation profiles were created based on the SPECIATE v5.1 database (Bray et al., 2019; Simon et al., 2010) The same approach has been used in previous metal emission inventories (Gargava et al., 2014; Kajino et al., 2020; Reff et al., 2009; Xuan, 2005; Ying et al., 2018).
The monthly emission inventory of metals from ship sources was established using a bottom-up approach based on real-time data from the Automatic Identification System (AIS) database for ships for the year 2017 (Yuan et al., 2023; Zhao et al., 2020). Parameters such as power-based emission factors (in g kWh−1) are listed in the Supplement (Tables S1, S2), and the low-load adjustment multipliers can be found in the previous studies (Chen et al., 2017; Fan et al., 2016). More information on the emission inventories can be found in the Supplement (Sect. S3).
The monthly dust emissions of trace metals in 2017 were generated from in-line modules developed by Foroutan et al. (2017) during the CMAQ run. We modified the in-line windblown dust module to incorporate metal species, facilitating its concurrent operation with MODIS land cover data. For the dust speciation factor, we adjusted the fine- and coarse-mode mass fractions of metal species based on a comprehensive literature review. The detailed findings of the literature review and the ultimately modified values are presented in Table S3.
2.3 Calculation of soluble metal deposition fluxes
In this study, the soluble fraction of the metal deposition flux was roughly calculated by multiplying the deposition flux obtained from the CMAQ simulation by the solubility of the metal, which has also been used in previous studies (Liu et al., 2022; Zhang et al., 2024). The solubility of metals is closely related to the source (Chester et al., 1993). Kurisu et al. (2021) used the stable Fe isotope source apportionment method to analyze dust Fe and anthropogenic Fe concentrations in total and soluble Fe samples. The results showed that the solubility of dust Fe in the northwestern Pacific Ocean ranged from 0.9 %–1.3 % (dust-contributed soluble Fe divided by dust-contributed total Fe) to 11 % with respect to the solubility of anthropogenic Fe (anthropogenic-contributed soluble Fe divided by anthropogenic-contributed total Fe). However, a large number of observations reported samples with iron solubility in the marine atmosphere exceeding 10 % (Gao et al., 2013; Shi et al., 2013; Sholkovitz et al., 2012), illustrating the fact that a rough classification of sources into dust and anthropogenic sources is not sufficiently plausible and that sources of emissions of highly soluble metals, such as those from shipping, need to be considered as well (Ito, 2015). This study distinguished the contributions of different sources to the deposition flux of metals, allowing for the consideration of the distinct solubilities of metals from various sources. Given that recent studies have primarily focused on Fe, obtaining solubility data for other metals from different sources proved challenging. The solubility adopted in this study is shown in Table S4, which differentiates between the fine and coarse modes and three emission sources for Fe, whereas only the two modes are used for the other metals.
3.1 Emission inventory
3.1.1 Contributions of various sectors
We used monthly emission inventories from terrestrial anthropogenic and ship sources and modeled monthly dust emissions for 2017 to calculate metal emissions for the entire year. The relative contribution of the three sources to metal emissions and the seasonal variation characteristics were assessed, and emissions from terrestrial anthropogenic sources were then further specified.
As shown in Fig. 1, for the fine mode of six metals, emissions originating from terrestrial anthropogenic sources were much more significant than those from ship or dust sources, with relative contributions largely exceeding 59 % and peaking at 95.2 %. The emissions from ship sources were not large overall, but the relative contribution to fine-mode V and Ni could reach 21.4 % and 13.4 %, which is similar to the results of previous studies on ship emissions (Yuan et al., 2023; J. Zhao et al., 2021b). Dust substantially released Fe and Al in the coarse mode (accounting for 79.6 % and 87.4 % of the coarse-mode emissions, respectively), while showing a rather low contribution to other metals, which was related to the content of metallic elements in soil minerals. Terrestrial anthropogenic sources showed higher emissions of Fe and Al elements, amounting to 208.1 and 242.2 kt yr−1, respectively. In contrast, V and Ni showed a lesser degree of impact from terrestrial anthropogenic activities, with values of 8.2 and 9.4 kt yr−1. V showed the highest fine-mode-to-coarse-mode ratio of 4.6, while Cu showed a ratio of 1.1.
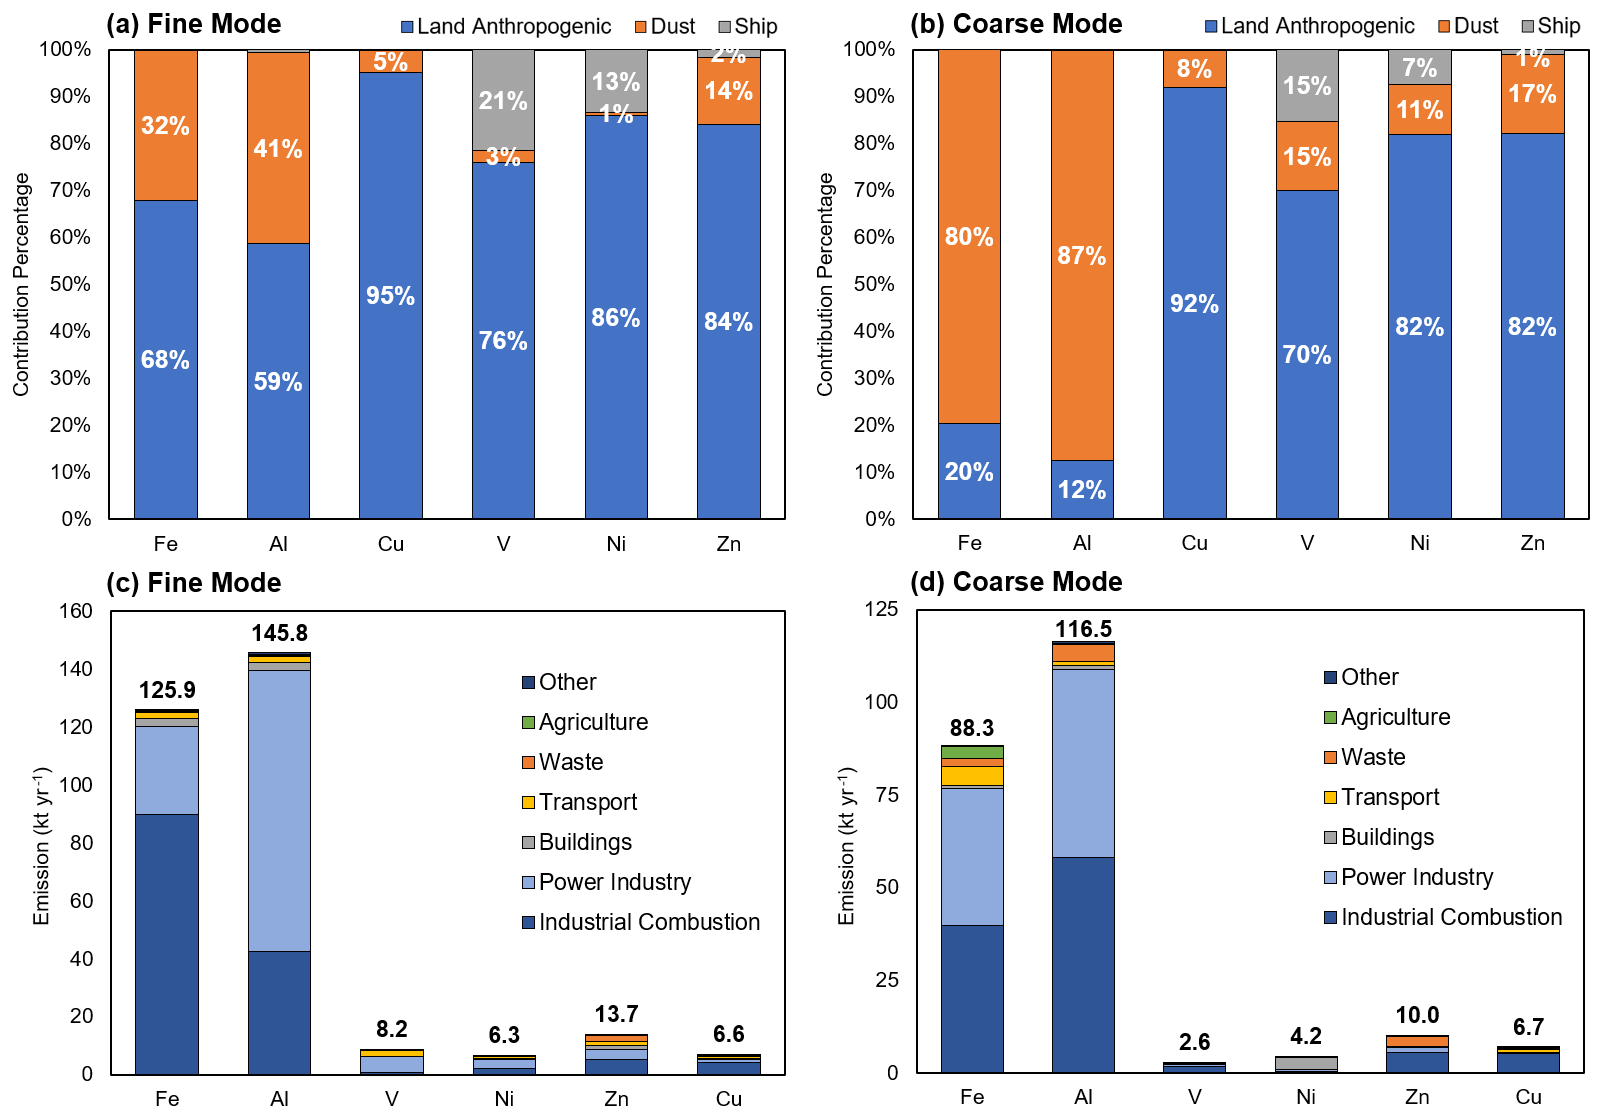
Figure 1Relative contributions of terrestrial anthropogenic, ship, and dust sources to fine-mode (a) and coarse-mode (b) emissions of the six metals (Fe, Al, V, Ni, Zn, and Cu). Stacked histograms of the absolute contributions of the seven emission sectors of terrestrial anthropogenic sources to the fine mode (c) and coarse mode (d); the numbers represent the total emissions from all anthropogenic emission sectors. The sum of all percentages in panels (a) and (b) is 100, except that numbers too small to be labeled, such as 1 %, are not labeled.
The monthly emission statistics of the three sources are detailed in Tables S5–S9. According to Table S5, the overall quantity of metals emitted by ships was predominantly higher in summertime (July and August), followed by wintertime (November and December), while it was relatively lower in September. This is related to the activities of ships, which are more active in the summer months and have higher emissions – a trend that has been reported in previous studies (Chen et al., 2018; Zhai et al., 2023). In terms of terrestrial anthropogenic sources (Tables S6, S7), the emissions of all metallic elements in the fine mode were greater in winter (December and January) due to elevated heating demand, which is a seasonal feature consistent with previous studies (Luo et al., 2022; S. Zhao et al., 2021). The emissions of Fe, Al, and Ni in the coarse mode showed the same seasonal characteristics, while the highest emissions of V, Cu, and Zn occurred in April and October. Overall, the monthly variation in metal emissions from terrestrial anthropogenic sources was not as significant as that from ship sources, suggesting that metals could have been emitted from stable sources, such as Industrial Combustion (Zhang et al., 2018). Dust emissions were mainly concentrated in April, accounting for about 45 % of the total annual emissions. In consideration of the significant seasonal variation, we counted the contribution of metals from the three emission sources in spring, as shown in Fig. S2. Dust sources were identified as the primary contributor to the coarse-mode emissions of Fe and Al, accounting for a higher proportion of spring emissions than of annual emissions (90.0 % and 94.2 %, respectively). For the fine-mode springtime emissions of these two metals, dust sources accounted for 51.9 % and 61.8 %, respectively, and were also the most significant emission source sector. Moreover, there were relatively high emissions in July and May, with the remaining months being insignificant. This is related to the fact that dust events in East Asia occur mainly in spring (Gui et al., 2022; Hsu et al., 2010; Kang and Wang, 2005; Kang et al., 2016), although studies have also reported dust events in summer (Chen et al., 2014) and autumn (Zhang et al., 2015) in certain years.
The predominant sources of emissions, specifically terrestrial anthropogenic sources, were further classified into seven categories according to EDGAR, namely “Industrial Combustion”, “Power Industry”, “Buildings”, “Transport”, “Waste”, “Agriculture”, and “Other” (Fig. 1c, d). For all six metals, both the Power Industry and Industrial Combustion sources emerged as the prominent contributors, collectively accounting for more than 50 % of the total terrestrial anthropogenic emissions. The emissions of Fe originating from Industrial Combustion were the largest, amounting to 129.5 kt yr−1, with the fine mode accounting for 69.4 %. The emissions of Al from the Power Industry source were significant, amounting to 148.0 kt yr−1, with the fine mode accounting for 65.7 %. In addition, the Waste sector made a substantial contribution to Zn with 5.0 kt yr−1, which was comparable to the 4.6 kt yr−1 contributed by the Power Industry. Moreover, the metals emitted from the Waste sector were mainly in the coarse mode: the proportion of coarse-mode emissions was more than 80 %, except for Cu (24.8 %) and Zn (55.9 %).
Several studies on metal emission inventories (refer to Table S10) are accessible for conducting comparative analyses. In the context of terrestrial anthropogenic sources, the emissions of Ni were reported to be 3395.5 t, Zn emissions were reported to be 22 319.6 t, and Cu emissions were reported to be 9547.6 t in China in 2012 (Tian et al., 2015). Additionally, V emissions, inclusive of terrestrial anthropogenic and dust emissions, were documented to be 11 505.04 t in China in 2017 (Bai et al., 2021). In this study, the corresponding values (ensuring consistency of emission sources and areas) were 5494.5 t for Ni, 13 407.2 t for Zn, 6578.9 t for Cu, and 11 093.7 t for V in 2017. In terms of subdivided emission sectors, solid waste contributions were 0.3, 43.5, 1790.7, and 382.4 t yr−1 for V, Ni, Zn, and Cu, respectively (Bai et al., 2021; Y. Wang et al., 2017), whereas the corresponding values were 0.6, 27.9, 2194.0, and 185.6 t yr−1 in this study. The “Iron and Steel” sector emitted 79.6 and 105.0 t yr−1 of V and Ni (Bai et al., 2021; Wang et al., 2016), respectively, compared with corresponding values of 109.2 and 196.0 t yr−1 in this study. The ship emissions of V and Ni in East Asia in 2015 reported by J. Zhao et al. (2021b) were 1329.8 and 580.4 t yr−1, whereas the corresponding values were 1802.6 and 854.8 t yr−1 in this study, with an acceptable range of differences. Considering the different base years of the inventories and the different types of anthropogenic sources covered, the results of this study were consistent overall with previous publications.
3.1.2 Spatial distribution of metal emissions
The spatial distributions of metal emissions are presented in Fig. 2a–f. For the entire simulation area, the emissions of Fe, Al, V, Ni, Zn, and Cu from all sources were 1021.5, 1940.4, 11.7, 11.5, 27.2, and 14.0 kt in 2017, respectively. In the context of the modeled land area, China was found to release substantial amounts of Fe, Al, V, Ni, Zn, and Cu, totaling 810 869.5, 157 099.8, 7994.9, 7639.7, 18 838.1, and 10 225.6 t yr−1, respectively. Beyond China, significant emissions were found in the coastal cities of Japan and South Korea as well as in Southeast Asian regions. Specifically, Japan and South Korea contributed 6239.5, 4545.3, 190.7, 197.3, 538.8, and 424.6 t yr−1 to the six aforementioned metals, respectively. The emissions from India were 37 717.2, 54 059.0, 1059.3, 2028.7, 3057.3, and 1754.0 t yr−1, respectively. Meanwhile, the emissions from Southeast Asia were 6315.9, 10 249.2, 258.0, 607.8, 747.0, and 407.0 t yr−1, respectively. Significant emissions in the North China Plain, the Yangtze River Delta, the Pearl River Delta, and Central China can be attributed to dense human activity levels in these regions, as reported by previous work (Bai et al., 2021). Notably, the dust source regions of East Asia, namely the Taklamakan Desert and the Mongolian Plateau, showed remarkable emissions of Fe and Al, surpassing those of densely populated and economically developed regions by an order of magnitude or more.
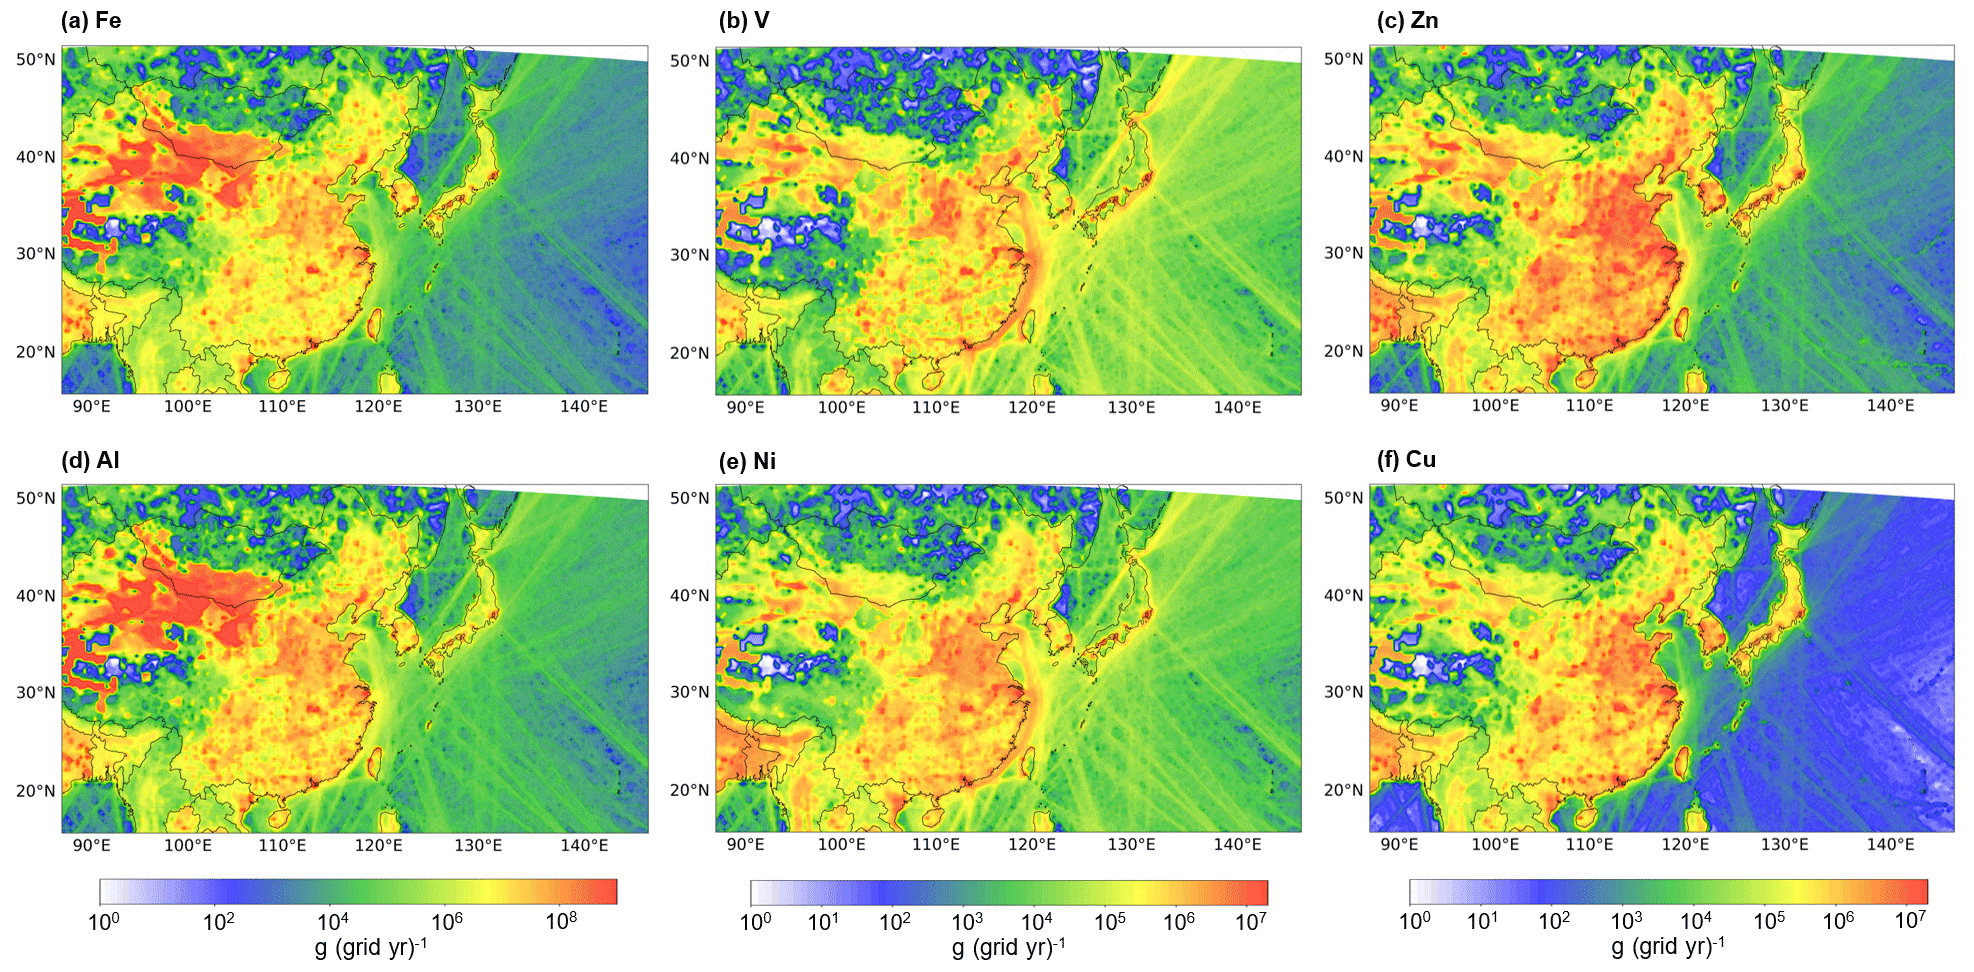
Figure 2Gridded metal emissions from all sources for the year 2017 (including terrestrial anthropogenic, ship, and dust sources; 36 km×36 km resolution; units: grams per year per grid cell) for Fe (a), V (b), Zn (c), Al (d), Ni (e), and Cu (f). See Tables S5–S9 for detailed emission data information.
Within the marine domain, the emission trajectories of V and Ni were more substantial than the rest of the metals, as illustrated in Fig. 2. In the coastal waters of eastern China, ship activities are dynamic, creating a linear high-emission zone in areas with dense shipping routes; thus, the emissions of V and Ni brought by ships were comparable to the contribution of terrestrial anthropogenic sources. By contrast, the emissions of the remaining four metals in the marine area were notably lower than those in the land area. Furthermore, ships represent on-site sources of marine pollution (their emission footprint covers the vast expanse of the Pacific Ocean), highlighting the importance of considering ship sources in emission inventories.
3.2 Contributions of different sources to marine atmospheric metal concentrations and deposition fluxes
3.2.1 Contributions of different sources to marine atmospheric metal concentrations
Based on the emission inventory of metallic elements established in Sect. 3.1, the concentrations of metals in the sea areas and the contributions of different sources were simulated by the CMAQ model. Overall, the seasonal mean metallic concentrations in sea areas were 34.9, 51.3, 1.0, 0.6, 1.0, and 0.5 ng m−3 for Fe, Al, V, Ni, Zn, and Cu, respectively. It is worth noting that we chose January, April, July, and October to represent each of the four seasons; thus, as most of the spring dust events in East Asia occur in April, this estimate would result in a slight overestimation of the contribution of dust sources. Concentrations in the Bohai Sea (BS) and the Yellow Sea (YS) were significantly higher than those in the other seas, about 5–20 times higher than the sea-wide average (Fig. 3). The BS demonstrated the highest concentrations of five metallic elements, Fe, Al, Ni, Zn, and Cu, at 225.3, 249.7, 10.4, 18.7, and 9.6 ng m−3, respectively. The YS showed a notably higher concentration of V (15.34 ng m−3), which was attributed to dense ship activities in the marginal sea of China. Dust sources predominantly influenced the concentrations of Fe and Al, accounting for 17.9 % and 28.5 %, on the sea-wide average, and their contributions to the remaining four elements were far less than those from terrestrial anthropogenic or ship sources. Asian dust storms occur annually in late-winter and spring in the main dust regions of the Gobi Desert, the Taklamakan Desert, and the Loess Plateau (Hsu et al., 2010). Therefore, dust sources played a more significant role in April, contributing 39.2 % of the Fe and 51.3 % of the Al in the sea area covered by the study. In the East China Sea (ECS), these values could reach 48.3 % and 67.8 %, respectively (as presented in Fig. S3). Ship sources mainly contributed to the concentrations of V and Ni in the sea area, with average contribution shares of 56.4 % and 37.8 %, and can reach 65.7 % and 49.3 % in the ECS, respectively. Terrestrial anthropogenic sources were the most important contributors to the marine concentrations of most of the metallic elements, excluding V, with an average contribution of 42.7 %. Notably, for Cu, which is not a major metallic element emitted from ships and whose content in dust particles is relatively small, the contribution from anthropogenic sources was as high as 97.6 %. The concentration of Fe was 201.1 ng m−3 in the YS and 92.17 ng m−3 in the ECS, and the contribution of terrestrial anthropogenic sources to the Fe concentration was 71.6 % in the ECS, similar to the values reported by previous work (Zhang et al., 2024). The available long-term and near-real-time concentration monitoring data of V and Ni in the fine mode at the Pudong site (in Shanghai, China) obtained by Zou et al. (2020) were used to further validate the model simulation. As presented in Fig. S4, the simulated concentrations of V and Ni were in good agreement with the monitoring data, with a respective normalized mean fractional bias (NMFB) and normalized mean fractional error (NMFE) of −0.31 and 0.37 for V and −0.38 and 0.40 for Ni. Additionally, Table S11 presents a comparison between the metallic-element concentrations in the East Asian land region and the simulation results derived from this study.
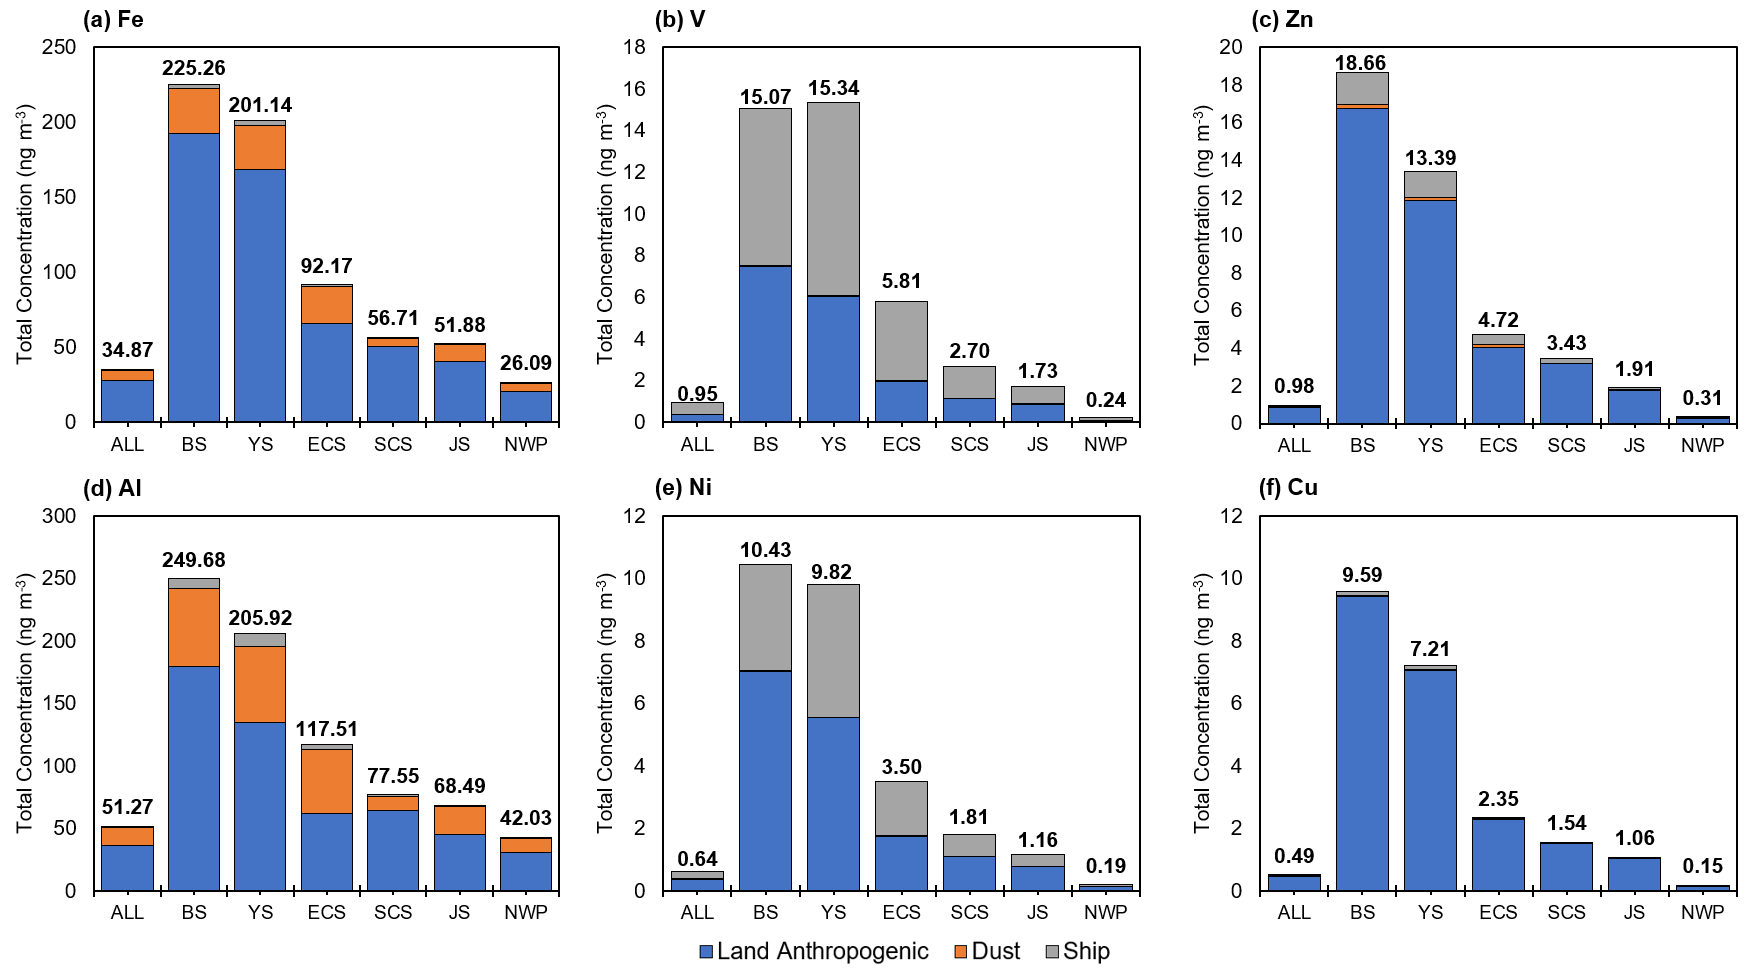
Figure 3Contributions of seasonal mean concentrations of metallic elements in different sea areas from terrestrial anthropogenic, ship, and dust sources for Fe (a), V (b), Zn (c), Al (d), Ni (e), and Cu (f) (units: ng m−3); the numbers at the top of the stacked bar charts represent the total seasonal mean concentrations from the three major sources.
Terrestrial anthropogenic, ship, and dust sources presented discernible differences in both the absolute and relative contributions of metallic elements across diverse sea areas. Moreover, metallic-element concentrations originating from these three sources showed distinct spatial distributions. As illustrated in Fig. S5, all six metal concentrations attributed to terrestrial anthropogenic sources were notably higher in coastal areas, particularly in the proximity of China and both South Korea and North Korea. In contrast to dust sources, terrestrial anthropogenic metals are predominantly transported by diffusion and advection, rather than by strong weather processes. Studies have shown that the outbreak of Asian dust storms is often associated with Mongolian cyclones during spring (Gui et al., 2022). This atmospheric phenomenon results in the transport of metal particles from natural dust sources to more open-ocean areas, rather than being confined to coastal areas, and these metal particles show a spatial distribution pattern following the trailing flow of the cyclone. As shown in Fig. S3, dust sources contributed 40.8 % and 50.3 % of the atmospheric concentrations of Fe and Al in the northwestern Pacific Ocean (NWP) in spring, respectively. Due to the higher contents of Fe and Al elements in soil, concentrations of Fe and Al resulting from dust were 2–3 orders of magnitude higher than those of the other four metals. Metal concentrations from ship sources were predominantly distributed around busy shipping routes, with higher concentrations within a 200 nmi (nautical mile) range of East Asian countries. However, high concentration values were noted at a certain distance from the coastline, distinct from the concentration distribution of terrestrial anthropogenic sources.
3.2.2 Contributions of different sources to marine atmospheric metal deposition fluxes
The influence of the three emission sources on metal deposition fluxes and concentrations across the sea areas displayed distinctive characteristics. As depicted in Fig. 3, the concentrations of six metallic elements over the BS and the YS markedly surpassed those recorded in other seas and were even 6–60 times higher than those over the open NWP. However, the deposition fluxes of metallic elements over proximate coastal areas, including the BS, the YS, the ECS, the South China Sea (SCS), and the Sea of Japan (JS), showed relatively insignificant differences, although the BS and the YS still displayed the highest fluxes (Fig. 4). It can be seen that the spatial distribution of metal deposition in the seas was broader than that of metal concentrations (Fig. S6). Similar to Sect. 3.2.1, deposition fluxes from terrestrial anthropogenic and ship sources during representative months of the four seasons were used to estimate the deposition fluxes for the corresponding seasons to calculate the estimated annual values, which is an estimation method that has been used in previous studies (Lin et al., 2010; Zhang et al., 2010). Given the considerable seasonal variability in dust sources, we employed a conversion factor to estimate the seasonal values via monthly deposition fluxes, which was derived from the ratio of the total seasonal emissions from dust sources to the emissions in a representative month. For example, if the dust emissions in spring (March–April–May) are 1.27 times the dust emissions in April, the spring deposition flux from dust sources is calculated as the deposition flux from the April dust contribution multiplied by 1.27. Table S12 presents a comparison of the stimulated deposition fluxes of the metals in this study with existing observation-based studies on metal deposition fluxes. Given that the existing studies focused more on the land area, this study employed land deposition flux data for comparison. The deposition fluxes of the six metals were within the range of the existing studies, validating our results.
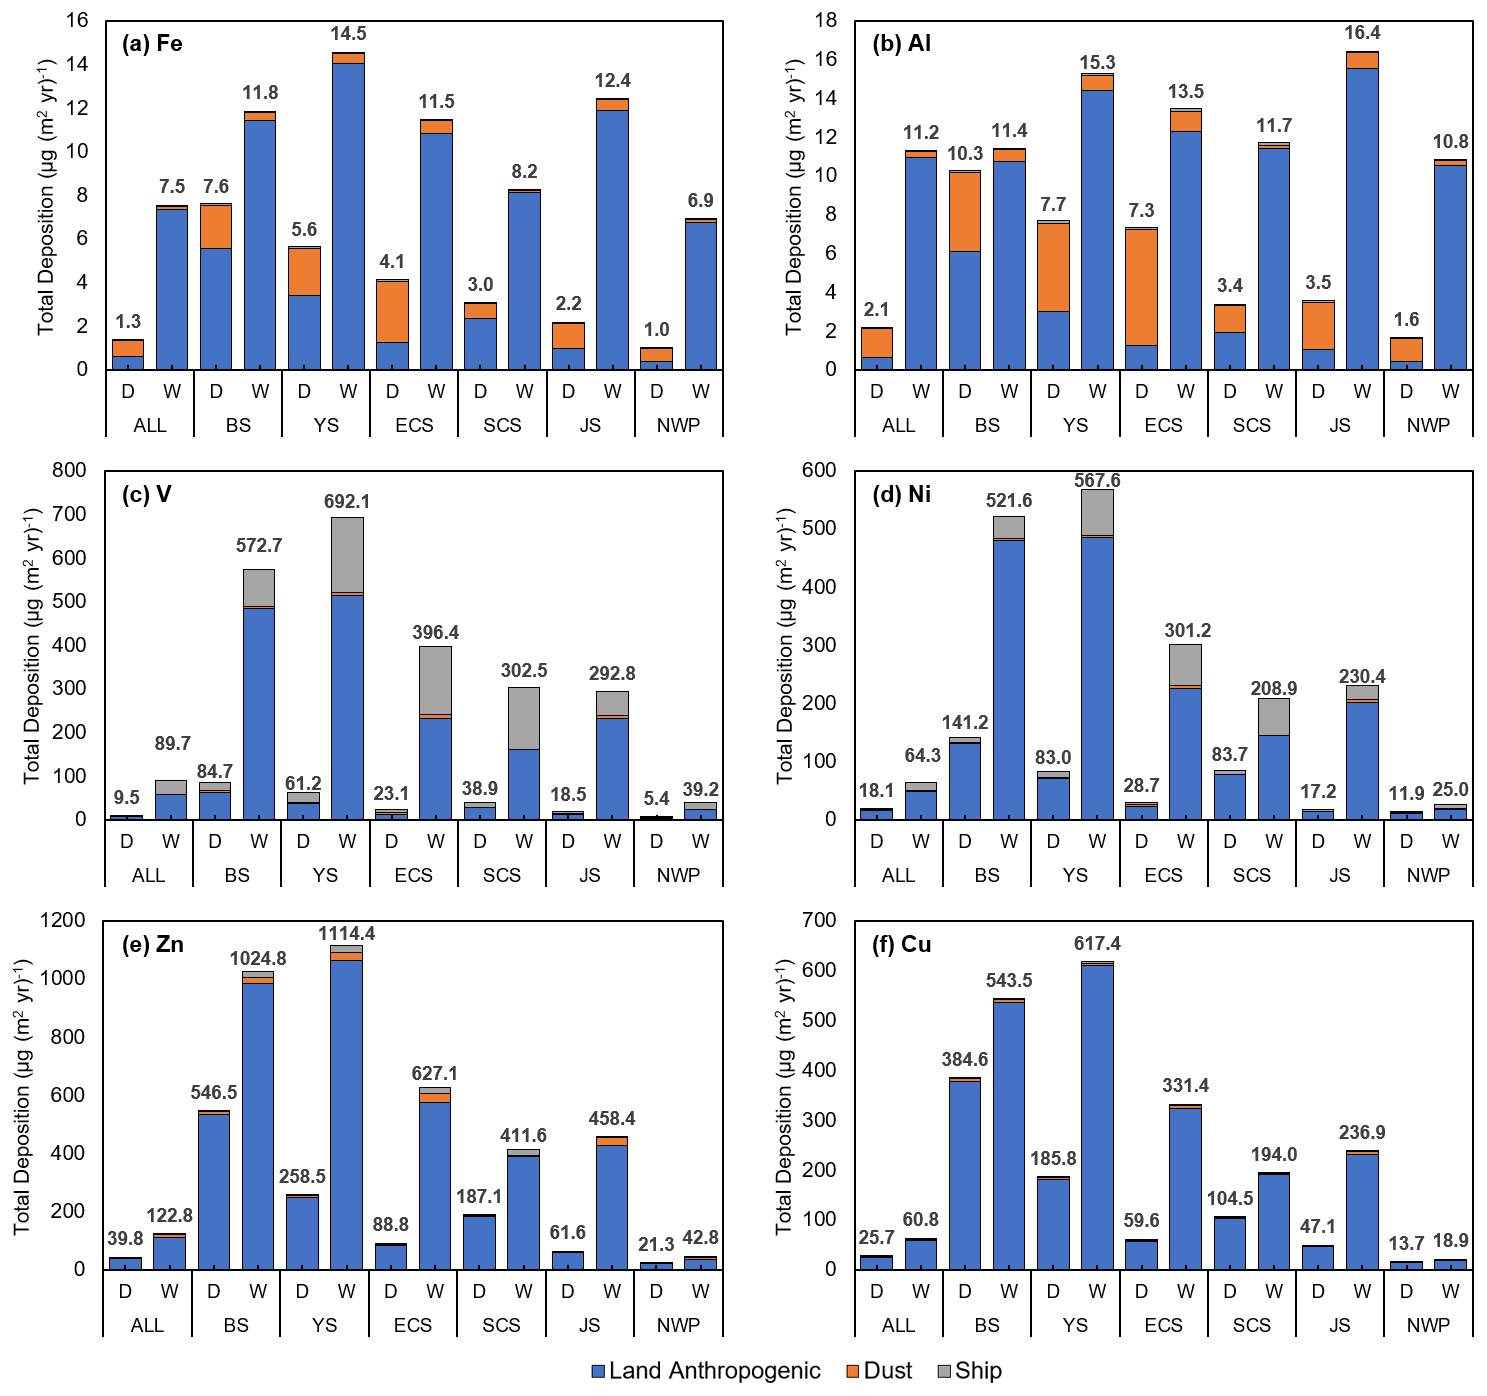
Figure 4Contributions of terrestrial anthropogenic, ship, and dust sources to the estimated annual dry- and wet-deposition fluxes of metallic elements (represented by D and W in the panels, respectively) in different marine areas for Fe (a), Al (b), V (c), Ni (d), Zn (e), and Cu (f) (units: for Fe and Al; for V, Ni, Zn, and Cu); the numbers above the stacked bars represent the total annual dry- or wet-deposition fluxes from the three major sources.
Particulate elements are removed from the atmosphere through dry- and wet-deposition processes, and wet deposition is generally more important than dry deposition in marine areas (Mahowald et al., 2005). At the marine scale, wet-deposition fluxes were greater than dry deposition for all six metallic elements, which is in line with previous findings (Connan et al., 2013; Gao et al., 2013; Zhang et al., 2024). The dry- and wet-deposition ratios (i.e., dry-deposition flux / wet-deposition flux) of Fe, Al, V, Ni, Zn, and Cu were 0.18, 0.19, 0.11, 0.28, 0.32, and 0.42 across the entire study sea area, respectively. Dry-deposition flux is a function of atmospheric concentration and particle dry-deposition velocity. Wet deposition removes airborne particulate elements via precipitation scavenging, which includes in-cloud and below-cloud scavenging (Cheng et al., 2021). The size distribution of metals in atmospheric aerosols is a key factor influencing the differences between wet- and dry-deposition flux. Sakata and Asakura (2011) indicated that metals associated with coarse particles (>2.5 µm in diameter) have shorter atmospheric lifetimes due to gravitational settling and inertial deposition, which easily govern dry deposition. Fine particulate matter, on the other hand, is more likely to serve as condensation nuclei for wet deposition. Dust sources, typically characterized by large particle sizes, are consequently more readily removed from the atmosphere through dry deposition during atmospheric transport. The fine-mode proportion of the six metals from both terrestrial anthropogenic and ship sources were, in descending order, V (82 %), Ni (62 %), Fe (60 %), Zn (60 %), Al (59 %), and Cu (51 %), and anthropogenic sources contributed more than dust sources. As a result, these sources contributed predominantly to metal deposition in the sea through wet-deposition processes. The difference in particle size and behavior highlights the complex interplay between source-specific attributes and deposition mechanisms, influencing the fate of metals in the atmosphere and their subsequent deposition in the ocean.
The spatial distribution of annual deposition fluxes of six metals in the sea is illustrated in Fig. S6. Over the whole sea area, the estimated annual deposition fluxes of Fe, Al, V, Ni, Zn, and Cu were 8827.0, 13 384.3, 99.3, 82.4, 162.7, and 86.5 , respectively, in which the highest corresponding deposition flux values reached 246.5, 246.2, 7.4, 3.3, 16.9, and 11.0 . The deposition of Fe and Al in the sea showed a wider spatial extent compared with the other four metals, particularly in the NWP. Combined with Fig. S5, it can be hypothesized that this phenomenon was caused by dust sources, as metallic particulate matter was transported and deposited into the more open ocean along with intense weather processes like cyclones and cold fronts (Li and Chen, 2023). During the spring season, when dusty weather is frequent, the contribution of dust sources to the deposition fluxes of Fe and Al in the whole sea area reached 50.9 % and 60.5 %, respectively, and the contribution to the NWP could also reach 49.2 % and 57.3 %, respectively. The deposition of V, Ni, Zn, and Cu, was primarily distributed in offshore waters, such as the BS, the YS, and the JS, as well as within a 100 nmi range of eastern China. The deposition fluxes of V were high within a 200 nmi range of eastern China, which is related to the ship activities, as reported by previous work (J. Zhao et al., 2021b).
3.2.3 Estimation of deposition flux of soluble metals in maritime areas
Utilizing the calculation methods in Sect. 2.3, the detailed results of these calculations for soluble metal deposition fluxes to the ocean within the study area are provided in Table 1. In this context, the soluble Fe deposition flux was calculated separately for each of the three sources and then summed to obtain the total soluble deposition flux. Terrestrial anthropogenic, ship, and dust sources has respective contributions of 600.0, 10.6, and 1.7 of soluble Fe in the fine mode and 10.9, 0, and 12.0 of soluble Fe in the coarse mode. Based on this method, the solubility of Fe (soluble Fe from all three sources divided by total Fe deposition flux) obtained in this study ranged from 4 % to 17 %, which is comparable to the results of previous studies (Alexander et al., 2009; Kurisu et al., 2021; Shao et al., 2019).
Table 1Marine deposition fluxes of soluble metals in fine and coarse particulate forms (units: ).
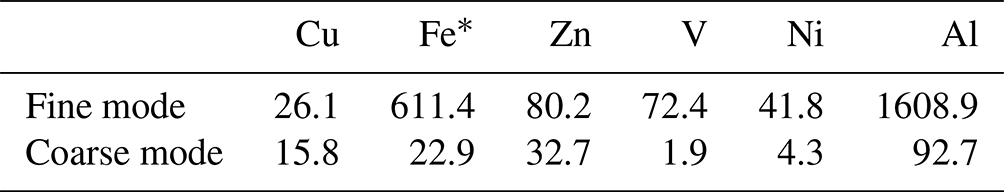
∗ The soluble iron deposition flux was calculated separately for each of the three sources and then summed to obtain the total soluble deposition flux.
Figure 5 illustrates the spatial distribution of fine- and coarse-mode soluble Fe deposition over different sea areas, and Fig. S7 shows the absolute and relative contributions of the three sources to soluble Fe deposition over these areas. The spatial distribution displayed marked differences for different particle sizes. The deposition fluxes of fine-mode soluble Fe were large throughout the ocean and varied less between seas. The highest deposition flux occurred in the YS (1110.8 ) and the lowest occurred in the NWP (566.4 ). Despite the relatively lower deposition flux in the NWP, it still exerted a noticeable impact on the NWP. In contrast, coarse-mode soluble Fe was mainly distributed in marginal seas, and the depositional flux in the BS (186.1 ) was ∼14 times higher than that in the NWP (12.9 ). Across the ocean, soluble Fe deposition fluxes were greater in the fine mode than in the coarse mode, at 611.4 and 22.9 , respectively. As illustrated in Fig. S7, fine-mode soluble Fe was primarily contributed by terrestrial anthropogenic sources, with a relative contribution exceeding 94 % across all marine regions. The contribution of ship sources to the deposition of fine-mode soluble Fe was greater than that of dust sources, ranging from 3 % to 6 % in the Chinese marginal seas, and up to 19.2 % in the ECS during the summertime when ship activities are dynamic. Coarse-mode soluble Fe was strongly influenced by dust, with a seasonal average contribution of 7.0 % over the sea areas, which can reach 39.9 % in April when dusty weather is prevalent.
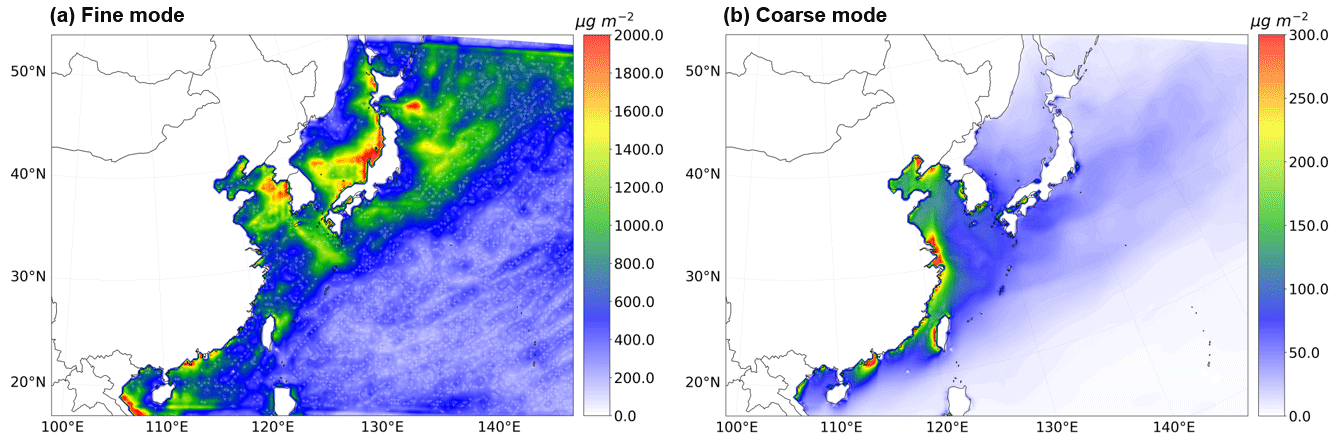
Figure 5Fine-mode (a) and coarse-mode (b) spatial distribution of the estimated soluble iron deposition fluxes throughout the year of 2017 (units: ), including terrestrial anthropogenic, ship, and dust sources).
On the one hand, aerosols emitted by anthropogenic sources are rich in acidic species, such as NOx and sulfur dioxide (SO2), whereas aerosols of dust tend to contain a significant portion of carbonates (Böke et al., 1999), which are much less acidic than anthropogenically sourced aerosols (Ito et al., 2019). For trace metals, acidity affects solubility through insoluble minerals readily dissolving under acidic conditions relevant to atmospheric aerosol (Baker et al., 2021; Hamilton et al., 2023; Li et al., 2017). On the other hand, smaller particles can undergo longer-distance transport in the atmosphere. Along with particle aging, the metal morphology changes and more metals dissolve. Furthermore, the emission of metals from anthropogenic sources was higher in the fine mode than in the coarse mode. The above reasons collectively lead to a higher deposition flux of soluble iron in the fine mode.
3.3 Sources and sinks of marine metals
3.3.1 Budget of trace metals from emission to deposition
In Sects. 3.1 and 3.2, we discussed the contributions of the terrestrial anthropogenic, ship, and dust sources to the emissions, atmospheric concentrations, and deposition flux of six metallic elements. This section focuses on the source–sink patterns of metallic elements in maritime areas. Figure 6 illustrates the proportional contributions of the three major emission sources to the entire area (land and ocean), the atmospheric concentrations, and the deposition of the six metals (percentages were calculated from a specific source divided by the total contribution of the three sources) in the sea areas and land areas, respectively.
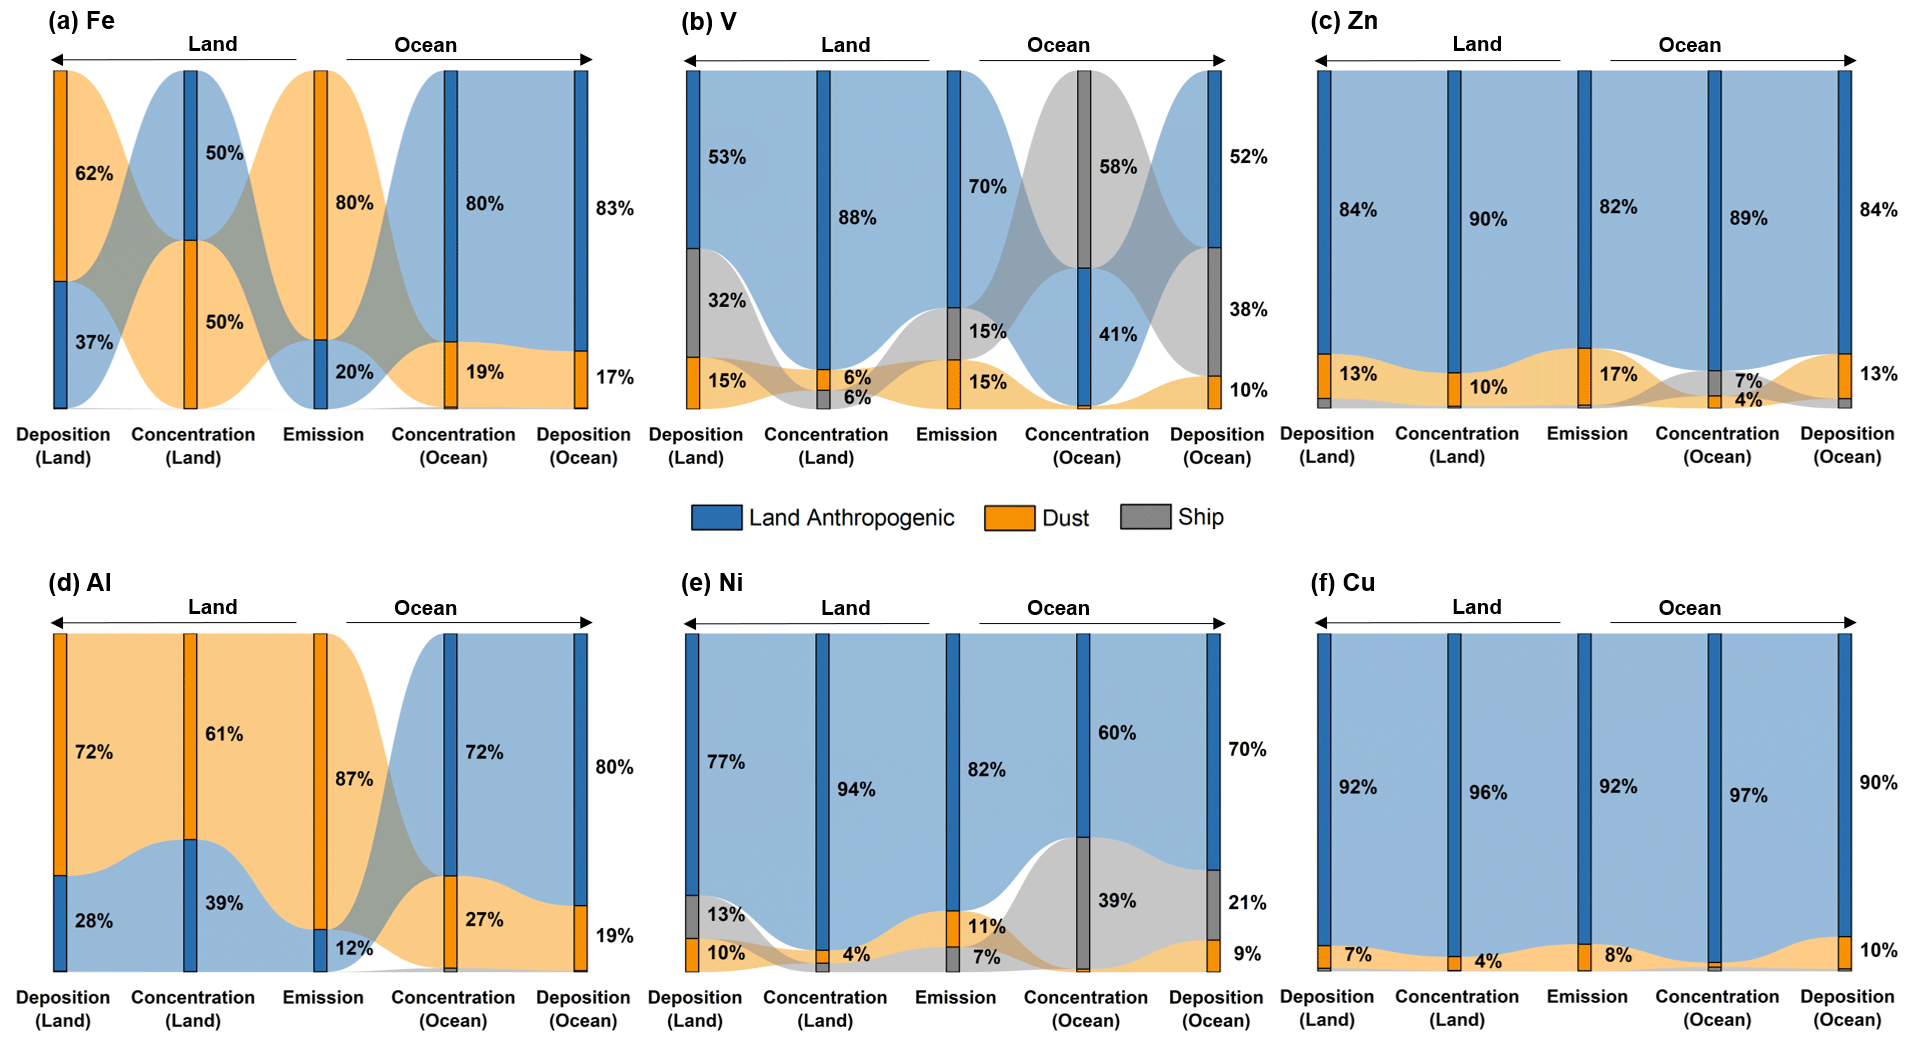
Figure 6Evolution of the relative contributions of the terrestrial anthropogenic, ship, and dust sources to emissions, seasonal mean atmospheric concentrations, and annual deposition fluxes of Fe (a), V (b), Zn (c), Al (d), Ni (e), and Cu (f). Concentrations and depositional fluxes labeled “Ocean” in the figure were for the oceans only, whereas concentrations and depositional fluxes labeled “Land” were for land only.
It can be found that the contributions of dust sources to emissions far exceeded those of terrestrial anthropogenic sources for the predominant emission metals (Fe and Al) originating from dust sources. However, as atmospheric transport processes occurred, the contribution of terrestrial anthropogenic sources became significant and was comparable to the contribution of dust sources to atmospheric concentrations. In particular, the contribution of terrestrial anthropogenic sources became dominant when focusing on marine deposition. For Fe, the contribution from terrestrial anthropogenic sources was 20 %, 80 %, and 83 % in the three stages from emissions to marine deposition flux, similar to results reported by previous work (Kajino et al., 2020). Similarly, for Al, the corresponding contributions were 12 %, 72 %, and 80 %. The contributions from dust sources in the marine deposition flux (17 % for Fe and 19 % for Al) were much lower than those in emissions (80 % for Fe and 87 % for Al). Dust particles typically have large particle sizes, making them more likely to deposit during atmospheric transport, which explains why, for all metals, the contribution of dust sources in concentrations was lower than that in emissions over both the land and the ocean area. However, because the dust source areas are mainly located inland, such as Mongolia and northwestern China, the contribution of dust sources to metal deposition in the sea was much less than that in the land area. To more accurately assess the impact of dust sources on the budget of metals during the dust season (spring), we plotted the evolution of the same relative contributions for April emissions, atmospheric concentrations, and deposition fluxes (Fig. S8). The contribution of dust sources to the spring marine deposition fluxes of all metals became larger compared with the annual values, especially for Fe and Al, where the contribution exceeded 50 %. This indicated that dust sources were the most important source of spring marine deposition fluxes for these two metals. However, the contribution of dust sources to metal deposition fluxes is significantly seasonal. On an annual basis, dust sources were not the most important contributors to metal deposition fluxes in the East Asian seas.
For metals such as V and Ni, the contributions from ship sources in marine deposition flux (38 % and 21 %, respectively) were larger than those in emissions (15 % and 7 %, respectively) and in deposition over the land area (32 % and 13 %, respectively). This reaffirmed the importance of ship sources when considering the metal deposition in the sea areas. Analyzing the contributions from the three sources revealed that, despite the presence of dust source areas and high dust emissions in East Asia, the impact of dust on marine depositional fluxes was not as large as its impact on emissions. The contribution of terrestrial anthropogenic sources to the maritime deposition flux was generally higher than that to emissions, except for V, for which ship sources had a greater impact on deposition fluxes than on emissions. While it is true that dust sources contribute more metals, the impact of human activities on metal deposition is of greater concern when we focus on the East Asian seas.
3.3.2 Dominant maritime regions for the three major emission sources
The identification of the dominant sea area for sources was established based on the contributions of the three major sources to the marine deposition flux of metals. For each ocean grid in this study, the contribution rate of a source was calculated by dividing the metal deposition flux attributed to that source by the total deposition flux of the metal, thereby obtaining the contribution rate for the specific grid. The criteria employed were as follows: if one source contributed more than 66.7 %, it was considered to dominate the metal deposition flux of the grid; if both sources contributed more than 33.3 %, with the remaining one contributing less than 33.3 %, it was considered that the two sources jointly dominated the deposition flux of the grid; and, in the absence of dominance by one or two sources, it was considered that the three major sources collectively influenced the metal deposition flux of the grid.
Based on the aforementioned calculation and criteria, the dominant sea areas for metal deposition fluxes from the three major sources are depicted in Fig. 7. For Fe. Al, Zn, and Cu, terrestrial anthropogenic sources dominated the deposition fluxes in almost all offshore areas proximate to land. For V and Ni, a considerable range of metal deposition fluxes were dominated by both terrestrial anthropogenic and ship sources in offshore areas near land, especially in the BS, the YS, and the JS. In the vast majority of the open-ocean area, the deposition of V and Ni was mainly dominated by ship sources. In contrast, for Fe and Al, there were scarcely any regions where terrestrial anthropogenic and ship sources co-dominated; however, in the ECS and the NWP, a large range of metal deposition was co-dominated by both terrestrial anthropogenic and dust sources, similar to the previous result (Matsui et al., 2018). For Cu and Zn, the area dominated by terrestrial anthropogenic sources was extensive, especially for Cu, for which terrestrial anthropogenic sources dominated the metal deposition fluxes in almost the entire ocean. Conversely, for Zn, areas still existed where both dust and terrestrial anthropogenic sources dominated, alongside areas where the three major sources collectively influenced the deposition fluxes in the western Pacific Ocean.
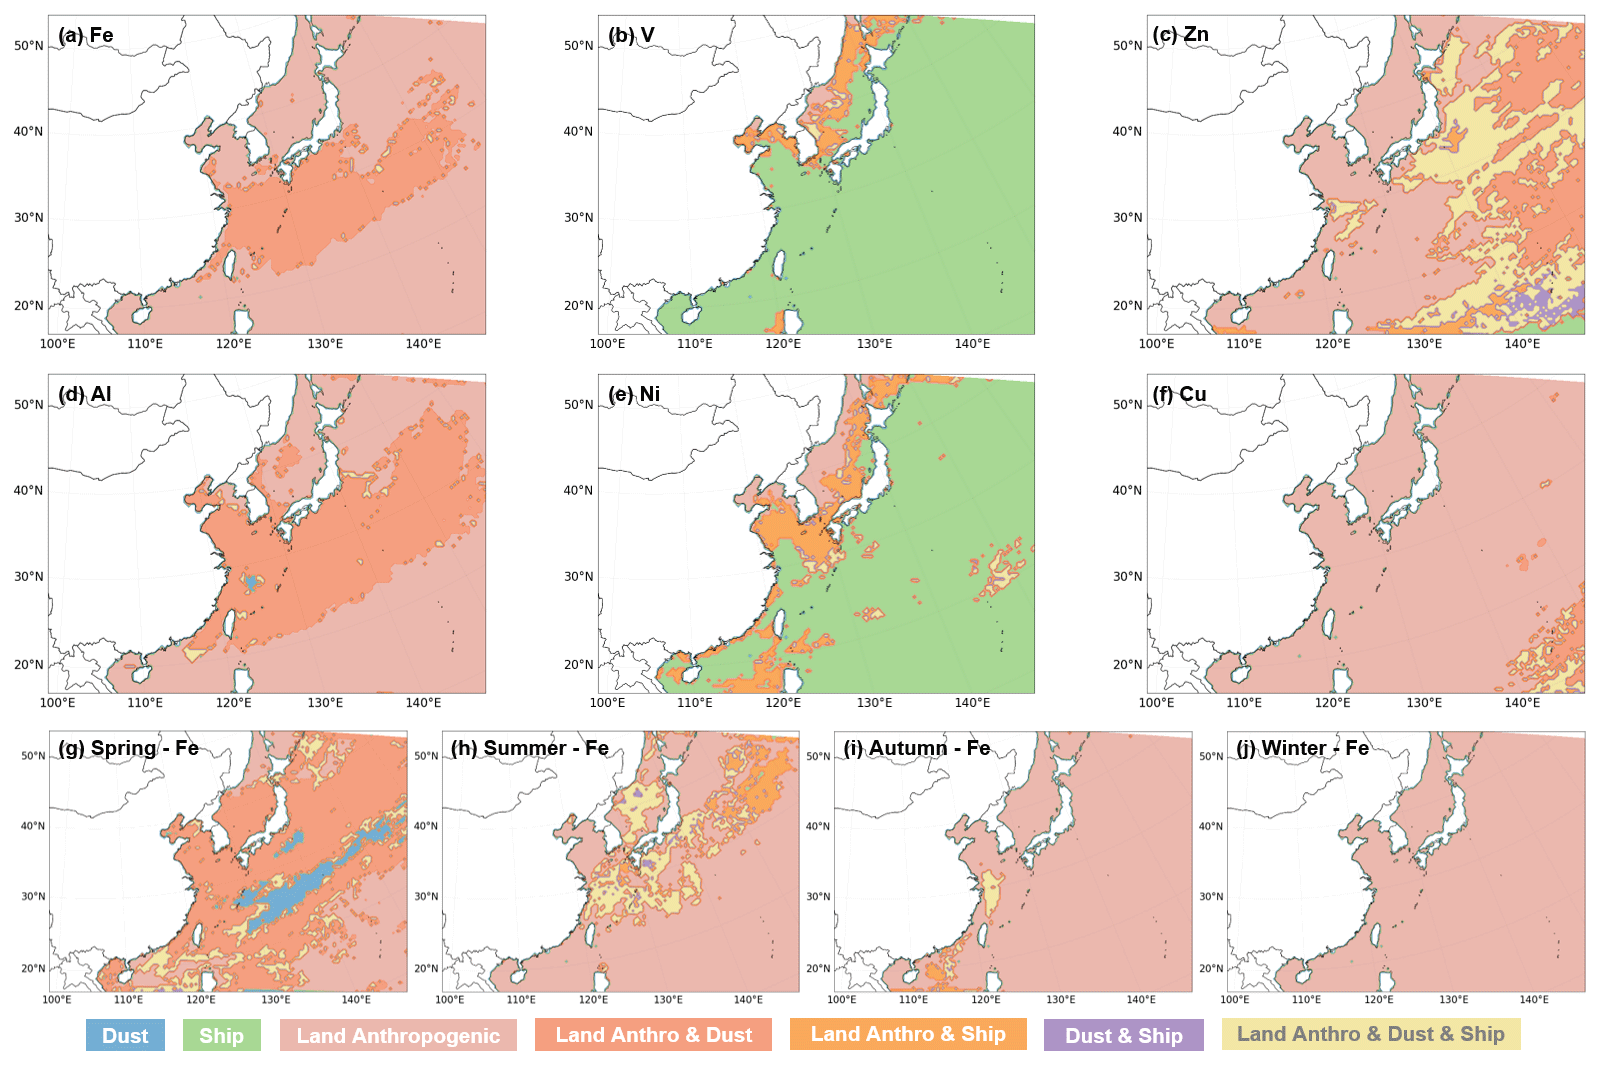
Figure 7The dominant source distributions of metal deposition fluxes in the ocean for Fe (a), V (b), Zn (c), Al (d), Ni (e), and Cu (f). The dominant sources of the deposition fluxes of soluble Fe in the spring (g), summer (h), autumn (i), and winter (j) seasons are also shown. In this study, we calculated the relative contributions of the metal sedimentation fluxes from the three major sources for each grid. A source was considered to dominate metal deposition on the grid if its contribution was >67 %, two sources were considered to jointly dominate metal deposition on the grid if both sources contributed >33 %, and three sources were considered to jointly dominate in the rest of the cases.
The main sources of six metallic elements were different, leading to the deposition of metallic elements in distinct oceanic areas. Consequently, when assessing the ecological effects of a specific metal, it becomes particularly important to identify its dominant emission sources. Mahowald et al. (2010) estimated that ocean primary productivity was enhanced by 6 % due to the doubling of desert dust which carried iron during the 20th century. When we combined this result for dust sources with our findings regarding the dominant source of soluble iron (see Fig. 7g–j) – the area of the East Asian seas dominated by anthropogenic sources of deposition was larger than that of dust sources – the resulting primary productivity of the East Asian seas may be more significant with the growing metal emissions from anthropogenic sources. Given that different metallic elements have distinct ecological effects in marine environments, it is crucial to consider their specific implications. For example, the nutrient effect of Fe on marine primary productivity is a significant consideration (Bonnet et al., 2008; Mackey et al., 2015; Mahowald et al., 2009; Schmidt et al., 2016; Yamamoto et al., 2022). For Cu, the focus may be on its toxicity or synergistic effects with Fe on biophysiological processes (Guo et al., 2012; F. J. Wang et al., 2017; Yang et al., 2019; Zou et al., 2015). Zn, on the other hand, might be considered for its role in carbonic anhydrase and other biochemical processes (Morel et al., 1994; Shaked et al., 2006; Tortell et al., 2000). Thus, our identification of the main sources of metal deposition in sea waters aids in investigating the potential ecological impacts.
Trace metals have a non-negligible impact on marine ecology, and their impact on marine productivity continues to be explored. Due to the challenges of measuring atmospheric deposition fluxes in open seas, air quality models provide a solution for this task. In this study, we established a monthly emission inventory covering six metallic elements (Fe, Al, V, Ni, Zn, and Cu) in the East Asian region (0–55° N, 85–150° E), incorporating terrestrial anthropogenic, ship, and dust sources. The CMAQ model was modified to assess the concentrations and deposition fluxes of metal species over the East Asian seas and subsequently estimate the soluble metal deposition fluxes, with a focus on the contributions of different sources across various sea regions. We analyzed the evolution of the relative contributions of the three sources to the six metals from source (emission) to sink (deposition) and identified the dominant sources of deposition of the six metals in marine waters.
Throughout the year 2017, emissions from all sources were 1021.5, 1940.4, 11.7, 11.5, 27.2, and 14.0 kt of Fe, Al, V, Ni, Zn, and Cu, respectively. The contribution of terrestrial anthropogenic sources to metal emissions was significant, exceeding 60 % for most metals, except for Fe and Al in the coarse mode, where the contributions from dust sources (80 % and 87 %, respectively) were larger. Ship sources contributed more to V and Ni than to the remaining metals, mainly in the fine mode. China was an emission hotspot for metallic elements within the modeled land area, and regions with dynamic ship activity were emission hotspots for metals in the modeled sea area. The seasonal mean concentrations of Fe, Al, V, Ni, Zn, and Cu in the sea areas were 34.87, 51.27, 0.95, 0.64, 0.98, and 0.49 ng m−3, respectively. Furthermore, the concentrations of six metals over the BS and the YS markedly surpassed those recorded in other seas and were 6–60 times higher than those over the NWP. In contrast, the deposition fluxes of the six metals varied much less over different sea areas and could affect more remote waters, such as the NWP. Pollutants carried by dust, especially Fe and Al, were transported to more open-ocean areas via intense weather processes. The spatial distribution of the deposition flux for these two metals in the sea areas was broader than that of the remaining four metals. The estimated annual soluble deposition fluxes of Fe, Al, V, Ni, Zn, and Cu were 634.3, 1701.6, 74.3, 46.1, 113.0, and 42.0 µg m−2, respectively. The contribution of terrestrial anthropogenic sources to fine-mode soluble iron was significant (>94 % across all sea areas), and dust sources contributed a lot to coarse-mode soluble iron (ranging from 18 % to 74 %). Particulate matter emitted by anthropogenic sources is more acidic than dust sources and is distributed with a higher percentage in the fine mode, allowing for a longer particle aging processes. As a result, there are higher soluble iron deposition fluxes in the fine mode compared with the coarse mode.
Both land-based and marine-based anthropogenic sources (also known as shipping) played more important roles in maritime deposition flux compared with the emissions of trace metals. However, the impact of dust on depositional fluxes was not as large as its impact on emissions for East Asian seas. Terrestrial anthropogenic sources dominated or co-dominated the deposition of most metals and soluble iron in East Asian seas. Ship sources dominated the deposition of V and Ni in most of the sea areas. Only the soluble iron deposition in spring was dominated by dust; this was associated with the seasonal characteristics of Asian dust, which mostly occurs in spring.
This study provides gridded data on atmospheric deposition fluxes with detailed source categories and identifies the dominant source of metal deposition in the ocean for future assessments of the impact of trace metals on marine ecology. It lays the foundation for a more profound understanding of the contributions of human activities and natural processes to metal distribution in marine areas. Additionally, considering the different solubilities of metals from various sources, our source-resolved data make it possible to calculate the soluble metal deposition flux on a source-by-source basis. However, further research is still needed to investigate the deposition and solubility of metallic elements in marine environments, with the aim of enhancing the accuracy of estimates for soluble metal deposition flux.
The Final (FNL) analysis meteorological data are available from the National Centers for Environmental Prediction (NCEP) at https://doi.org/10.5065/D6M043C6 (National Centers for Environmental Prediction/National Weather Service/NOAA/U.S. Department of Commerce, 2000). The base source code of CMAQv5.4 is available at https://doi.org/10.5281/zenodo.4081737 (U.S. EPA, 2020). The model data presented in this paper can be obtained from Yan Zhang (yan_zhang@fudan.edu.cn) upon request.
The supplement related to this article is available online at: https://doi.org/10.5194/acp-24-8363-2024-supplement.
SJ: investigation, methodology, software, validation, formal analysis, data curation, visualization, and writing – original draft preparation; YZ: conceptualization, investigation, supervision, methodology, validation, formal analysis, project administration, funding acquisition, and writing – review and editing; GY: validation, investigation, and writing – review and editing; ZH: data curation and software; JZ: data curation, investigation and methodology; TZ: data curation and writing – review and editing; MZ: funding acquisition and writing – review.
The contact author has declared that none of the authors has any competing interests.
Publisher's note: Copernicus Publications remains neutral with regard to jurisdictional claims made in the text, published maps, institutional affiliations, or any other geographical representation in this paper. While Copernicus Publications makes every effort to include appropriate place names, the final responsibility lies with the authors.
This article is part of the special issue “RUSTED: Reducing Uncertainty in Soluble aerosol Trace Element Deposition (AMT/ACP/AR/BG inter-journal SI)”. It is not associated with a conference.
The work was supported by the National Natural Science Foundation of China (grant nos. 42375100 and 42030708); the Natural Science Foundation of Shanghai Municipality, Committee of Science and Technology, China (grant no. 22ZR1407700); and the Program of Pudong, Committee of Science and Technology, Shanghai (grant no. PKJ2022-C05).
This research has been supported by the National Natural Science Foundation of China (grant nos. 42375100 and 42030708); the Natural Science Foundation of Shanghai Municipality (grant no. 22ZR1407700); and the Program of Pudong, Committee of Science and Technology, Shanghai (grant no. PKJ2022-C05).
This paper was edited by Leiming Zhang and reviewed by Lei Liu and one anonymous referee.
Alexander, B., Park, R. J., Jacob, D. J., and Gong, S.: Transition metal-catalyzed oxidation of atmospheric sulfur: Global implications for the sulfur budget, J. Geophys. Res.-Atmos., 114, D02309, https://doi.org/10.1029/2008JD010486, 2009.
Amedro, D., Berasategui, M., Bunkan, A. J. C., Pozzer, A., Lelieveld, J., and Crowley, J. N.: Kinetics of the OH+NO2 reaction: effect of water vapour and new parameterization for global modelling, Atmos. Chem. Phys., 20, 3091–3105, https://doi.org/10.5194/acp-20-3091-2020, 2020.
Bai, X., Luo, L., Tian, H., Liu, S., Hao, Y., Zhao, S., Lin, S., Zhu, C., Guo, Z., and Lv, Y.: Atmospheric Vanadium Emission Inventory from Both Anthropogenic and Natural Sources in China, Environ. Sci. Technol., 55, 11568–11578, https://doi.org/10.1021/acs.est.1c04766, 2021.
Baker, A. R. and Jickells, T. D.: Atmospheric deposition of soluble trace elements along the Atlantic Meridional Transect (AMT), Prog. Oceanogr., 158, 41–51, https://doi.org/10.1016/j.pocean.2016.10.002, 2017.
Baker, A. R., Li, M., and Chance, R.: Trace Metal Fractional Solubility in Size-Segregated Aerosols From the Tropical Eastern Atlantic Ocean, Global Biogeochem. Cy., 34, e2019GB006510, https://doi.org/10.1029/2019GB006510, 2020.
Baker, A. R., Kanakidou, M., Nenes, A., Myriokefalitakis, S., Croot, P. L., Duce, R. A., Gao, Y., Guieu, C., Ito, A., Jickells, T. D., Mahowald, N. M., Middag, R., Perron, M. M. G., Sarin, M. M., Shelley, R., and Turner, D. R.: Changing atmospheric acidity as a modulator of nutrient deposition and ocean biogeochemistry, Science Advances, 7, eabd8800, https://doi.org/10.1126/sciadv.abd8800, 2021.
Barkley, A. E., Prospero, J. M., Mahowald, N., Hamilton, D. S., Popendorf, K. J., Oehlert, A. M., Pourmand, A., Gatineau, A., Panechou-Pulcherie, K., Blackwelder, P., and Gaston, C. J.: African biomass burning is a substantial source of phosphorus deposition to the Amazon, Tropical Atlantic Ocean, and Southern Ocean, P. Natl. Acad. Sci. USA, 116, 16216–16221, https://doi.org/10.1073/pnas.1906091116, 2019.
Birmili, W., Allen, A. G., Bary, F., and Harrison, R. M.: Trace Metal Concentrations and Water Solubility in Size-Fractionated Atmospheric Particles and Influence of Road Traffic, Environ. Sci. Technol., 40, 1144–1153, https://doi.org/10.1021/es0486925, 2006.
Böke, H., Göktürk, E. H., Caner-Saltık, E. N., and Demirci, Ş.: Effect of airborne particle on SO2–calcite reaction, Appl. Surf. Sci., 140, 70–82, https://doi.org/10.1016/S0169-4332(98)00468-1, 1999.
Bonnet, S., Guieu, C., Bruyant, F., Prášil, O., Van Wambeke, F., Raimbault, P., Moutin, T., Grob, C., Gorbunov, M. Y., Zehr, J. P., Masquelier, S. M., Garczarek, L., and Claustre, H.: Nutrient limitation of primary productivity in the Southeast Pacific (BIOSOPE cruise), Biogeosciences, 5, 215–225, https://doi.org/10.5194/bg-5-215-2008, 2008.
Bowie, A. R., Lannuzel, D., Remenyi, T. A., Wagener, T., Lam, P. J., Boyd, P. W., Guieu, C., Townsend, A. T., and Trull, T. W.: Biogeochemical iron budgets of the Southern Ocean south of Australia: Decoupling of iron and nutrient cycles in the subantarctic zone by the summertime supply, Global Biogeochem. Cy., 23, GB4034, https://doi.org/10.1029/2009GB003500, 2009.
Bray, C. D., Strum, M., Simon, H., Riddick, L., Kosusko, M., Menetrez, M., Hays, M. D., and Rao, V.: An assessment of important SPECIATE profiles in the EPA emissions modeling platform and current data gaps, Atmos. Environ., 207, 93–104, https://doi.org/10.1016/j.atmosenv.2019.03.013, 2019.
Browning, T. J., Achterberg, E. P., Yong, J. C., Rapp, I., Utermann, C., Engel, A., and Moore, C. M.: Iron limitation of microbial phosphorus acquisition in the tropical North Atlantic, Nat. Commun., 8, 15465, https://doi.org/10.1038/ncomms15465, 2017.
Butler, A.: Acquisition and Utilization of Transition Metal Ions by Marine Organisms, Science, 281, 207–209, https://doi.org/10.1126/science.281.5374.207, 1998.
Celo, V., Dabek-Zlotorzynska, E., and McCurdy, M.: Chemical Characterization of Exhaust Emissions from Selected Canadian Marine Vessels: The Case of Trace Metals and Lanthanoids, Environ. Sci. Technol., 49, 5220–5226, https://doi.org/10.1021/acs.est.5b00127, 2015.
Chen, D., Wang, X., Li, Y., Lang, J., Zhou, Y., Guo, X., and Zhao, Y.: High-spatiotemporal-resolution ship emission inventory of China based on AIS data in 2014, Sci. Total Environ., 609, 776–787, https://doi.org/10.1016/j.scitotenv.2017.07.051, 2017.
Chen, D., Zhao, N., Lang, J., Zhou, Y., Wang, X., Li, Y., Zhao, Y., and Guo, X.: Contribution of ship emissions to the concentration of PM2.5: A comprehensive study using AIS data and WRF/Chem model in Bohai Rim Region, China, Sci. Total Environ., 610–611, 1476–1486, https://doi.org/10.1016/j.scitotenv.2017.07.255, 2018.
Chen, H., Laskin, A., Baltrusaitis, J., Gorski, C. A., Scherer, M. M., and Grassian, V. H.: Coal Fly Ash as a Source of Iron in Atmospheric Dust, Environ. Sci. Technol., 46, 2112–2120, https://doi.org/10.1021/es204102f, 2012.
Chen, S., Zhao, C., Qian, Y., Leung, L. R., Huang, J., Huang, Z., Bi, J., Zhang, W., Shi, J., Yang, L., Li, D., and Li, J.: Regional modeling of dust mass balance and radiative forcing over East Asia using WRF-Chem, Aeolian Res., 15, 15–30, https://doi.org/10.1016/j.aeolia.2014.02.001, 2014.
Cheng, I., Mamun, A. A., and Zhang, L.: A synthesis review on atmospheric wet deposition of particulate elements: scavenging ratios, solubility, and flux measurements, Environ. Rev., 29, 340–353, https://doi.org/10.1139/er-2020-0118, 2021.
Chester, R., Murphy, K. J. T., Lin, F. J., Berry, A. S., Bradshaw, G. A., and Corcoran, P. A.: Factors controlling the solubilities of trace metals from non-remote aerosols deposited to the sea surface by the “dry” deposition mode, Mar. Chem., 42, 107–126, https://doi.org/10.1016/0304-4203(93)90241-F, 1993.
Connan, O., Maro, D., Hébert, D., Roupsard, P., Goujon, R., Letellier, B., and Le Cavelier, S.: Wet and dry deposition of particles associated metals (Cd, Pb, Zn, Ni, Hg) in a rural wetland site, Marais Vernier, France, Atmos. Environ., 67, 394–403, https://doi.org/10.1016/j.atmosenv.2012.11.029, 2013.
Corbin, J. C., Mensah, A. A., Pieber, S. M., Orasche, J., Michalke, B., Zanatta, M., Czech, H., Massabò, D., Buatier de Mongeot, F., Mennucci, C., El Haddad, I., Kumar, N. K., Stengel, B., Huang, Y., Zimmermann, R., Prévôt, A. S. H., and Gysel, M.: Trace Metals in Soot and PM2.5 from Heavy-Fuel-Oil Combustion in a Marine Engine, Environ. Sci. Technol., 52, 6714–6722, https://doi.org/10.1021/acs.est.8b01764, 2018.
Crippa, M., Solazzo, E., Huang, G., Guizzardi, D., Koffi, E., Muntean, M., Schieberle, C., Friedrich, R., and Janssens-Maenhout, G.: High resolution temporal profiles in the Emissions Database for Global Atmospheric Research, Scientific Data, 7, 121, https://doi.org/10.1038/s41597-020-0462-2, 2020.
de Baar, H. J. W., van Heuven, S. M. A. C., and Middag, R.: Ocean Biochemical Cycling and Trace Elements, Encyclopedia of Geochemistry: A Comprehensive Reference Source on the Chemistry of the Earth, Springer International Publishing, Cham, 1023–1042, 2018.
Fahey, K. M., Carlton, A. G., Pye, H. O. T., Baek, J., Hutzell, W. T., Stanier, C. O., Baker, K. R., Appel, K. W., Jaoui, M., and Offenberg, J. H.: A framework for expanding aqueous chemistry in the Community Multiscale Air Quality (CMAQ) model version 5.1, Geosci. Model Dev., 10, 1587–1605, https://doi.org/10.5194/gmd-10-1587-2017, 2017.
Fan, Q., Zhang, Y., Ma, W., Ma, H., Feng, J., Yu, Q., Yang, X., Ng, S. K. W., Fu, Q., and Chen, L.: Spatial and Seasonal Dynamics of Ship Emissions over the Yangtze River Delta and East China Sea and Their Potential Environmental Influence, Environ. Sci. Technol., 50, 1322–1329, https://doi.org/10.1021/acs.est.5b03965, 2016.
Foroutan, H., Young, J., Napelenok, S., Ran, L., Appel, K. W., Gilliam, R. C., and Pleim, J. E.: Development and evaluation of a physics-based windblown dust emission scheme implemented in the CMAQ modeling system, J. Adv. Model. Earth Sy., 9, 585–608, https://doi.org/10.1002/2016MS000823, 2017.
Fu, Y., Tang, Y., Shu, X., Hopke, P. K., He, L., Ying, Q., Xia, Z., Lei, M., and Qiao, X.: Changes of atmospheric metal(loid) deposition from 2017 to 2021 at Mount Emei under China's air pollution control strategy, Atmos. Environ., 302, 119714, https://doi.org/10.1016/j.atmosenv.2023.119714, 2023.
Gao, Y., Xu, G., Zhan, J., Zhang, J., Li, W., Lin, Q., Chen, L., and Lin, H.: Spatial and particle size distributions of atmospheric dissolvable iron in aerosols and its input to the Southern Ocean and coastal East Antarctica, J. Geophys. Res.-Atmos., 118, 12634–12648, https://doi.org/10.1002/2013JD020367, 2013.
Gargava, P., Chow, J. C., Watson, J. G., and Lowenthal, D. H.: Speciated PM10 Emission Inventory for Delhi, India, Aerosol Air Qual. Res., 14, 1515–1526, https://doi.org/10.4209/aaqr.2013.02.0047, 2014.
Gui, K., Yao, W., Che, H., An, L., Zheng, Y., Li, L., Zhao, H., Zhang, L., Zhong, J., Wang, Y., and Zhang, X.: Record-breaking dust loading during two mega dust storm events over northern China in March 2021: aerosol optical and radiative properties and meteorological drivers, Atmos. Chem. Phys., 22, 7905–7932, https://doi.org/10.5194/acp-22-7905-2022, 2022.
Guo, J., Lapi, S., Ruth, T. J., and Maldonado, M. T.: The effects of iron and copper availability on the copper stoichiometry of marine phytoplankton, J. Phycol., 48, 312–325, https://doi.org/10.1111/j.1529-8817.2012.01133.x, 2012.
Hamilton, D. S., Perron, M. M. G., Bond, T. C., Bowie, A. R., Buchholz, R. R., Guieu, C., Ito, A., Maenhaut, W., Myriokefalitakis, S., Olgun, N., Rathod, S. D., Schepanski, K., Tagliabue, A., Wagner, R., and Mahowald, N. M.: Earth, Wind, Fire, and Pollution: Aerosol Nutrient Sources and Impacts on Ocean Biogeochemistry, Annu. Rev. Mar. Sci., 14, 303–330, https://doi.org/10.1146/annurev-marine-031921-013612, 2022.
Hamilton, D. S., Baker, A. R., Iwamoto, Y., Gassó, S., Bergas-Masso, E., Deutch, S., Dinasquet, J., Kondo, Y., Llort, J., Myriokefalitakis, S., Perron, M. M. G., Wegmann, A., and Yoon, J.-E.: An aerosol odyssey: Navigating nutrient flux changes to marine ecosystems, Elementa: Science of the Anthropocene, 11, 00037, https://doi.org/10.1525/elementa.2023.00037, 2023.
Hsu, S.-C., Wong, G. T. F., Gong, G.-C., Shiah, F.-K., Huang, Y.-T., Kao, S.-J., Tsai, F., Candice Lung, S.-C., Lin, F.-J., Lin, I. I., Hung, C.-C., and Tseng, C.-M.: Sources, solubility, and dry deposition of aerosol trace elements over the East China Sea, Mar. Chem., 120, 116–127, https://doi.org/10.1016/j.marchem.2008.10.003, 2010.
Ito, A.: Atmospheric Processing of Combustion Aerosols as a Source of Bioavailable Iron, Environ. Sci. Tech. Let., 2, 70–75, https://doi.org/10.1021/acs.estlett.5b00007, 2015.
Ito, A., Myriokefalitakis, S., Kanakidou, M., Mahowald, N. M., Scanza, R. A., Hamilton, D. S., Baker, A. R., Jickells, T., Sarin, M., Bikkina, S., Gao, Y., Shelley, R. U., Buck, C. S., Landing, W. M., Bowie, A. R., Perron, M. M. G., Guieu, C., Meskhidze, N., Johnson, M. S., Feng, Y., Kok, J. F., Nenes, A., and Duce, R. A.: Pyrogenic iron: The missing link to high iron solubility in aerosols, Science Advances, 5, eaau7671, https://doi.org/10.1126/sciadv.aau7671, 2019.
Ito, A., Ye, Y., Baldo, C., and Shi, Z.: Ocean fertilization by pyrogenic aerosol iron, npj Climate and Atmospheric Science, 4, 30, https://doi.org/10.1038/s41612-021-00185-8, 2021.
Jickells, T. D., An, Z. S., Andersen, K. K., Baker, A. R., Bergametti, G., Brooks, N., Cao, J. J., Boyd, P. W., Duce, R. A., Hunter, K. A., Kawahata, H., Kubilay, N., laRoche, J., Liss, P. S., Mahowald, N., Prospero, J. M., Ridgwell, A. J., Tegen, I., and Torres, R.: Global Iron Connections Between Desert Dust, Ocean Biogeochemistry, and Climate, Science, 308, 67–71, https://doi.org/10.1126/science.1105959, 2005.
Kajino, M., Hagino, H., Fujitani, Y., Morikawa, T., Fukui, T., Onishi, K., Okuda, T., Kajikawa, T., and Igarashi, Y.: Modeling Transition Metals in East Asia and Japan and Its Emission Sources, GeoHealth, 4, e2020GH000259, https://doi.org/10.1029/2020GH000259, 2020.
Kang, D. and Wang, H.: Analysis on the decadal scale variation of the dust storm in North China, Sci. China Ser. D, 48, 2260–2266, https://doi.org/10.1360/03yd0255, 2005.
Kang, L., Huang, J., Chen, S., and Wang, X.: Long-term trends of dust events over Tibetan Plateau during 1961–2010, Atmos. Environ., 125, 188–198, https://doi.org/10.1016/j.atmosenv.2015.10.085, 2016.
Kurisu, M., Sakata, K., Uematsu, M., Ito, A., and Takahashi, Y.: Contribution of combustion Fe in marine aerosols over the northwestern Pacific estimated by Fe stable isotope ratios, Atmos. Chem. Phys., 21, 16027–16050, https://doi.org/10.5194/acp-21-16027-2021, 2021.
Lana, A., Bell, T. G., Simó, R., Vallina, S. M., Ballabrera-Poy, J., Kettle, A. J., Dachs, J., Bopp, L., Saltzman, E. S., Stefels, J., Johnson, J. E., and Liss, P. S.: An updated climatology of surface dimethlysulfide concentrations and emission fluxes in the global ocean, Global Biogeochem. Cy., 25, GB1004, https://doi.org/10.1029/2010GB003850, 2011.
Li, J. and Chen, S.-H.: Dust impacts on Mongolian cyclone and cold front in East Asia: a case study during 18–22 March 2010, Frontiers in Environmental Science, 11, 1167232, https://doi.org/10.3389/fenvs.2023.1167232, 2023.
Li, W., Xu, L., Liu, X., Zhang, J., Lin, Y., Yao, X., Gao, H., Zhang, D., Chen, J., Wang, W., Harrison, R. M., Zhang, X., Shao, L., Fu, P., Nenes, A., and Shi, Z.: Air pollution–aerosol interactions produce more bioavailable iron for ocean ecosystems, Science Advances, 3, e1601749, https://doi.org/10.1126/sciadv.1601749, 2017.
Lin, C.-J., Pan, L., Streets, D. G., Shetty, S. K., Jang, C., Feng, X., Chu, H.-W., and Ho, T. C.: Estimating mercury emission outflow from East Asia using CMAQ-Hg, Atmos. Chem. Phys., 10, 1853–1864, https://doi.org/10.5194/acp-10-1853-2010, 2010.
Little, S. H., Vance, D., Walker-Brown, C., and Landing, W. M.: The oceanic mass balance of copper and zinc isotopes, investigated by analysis of their inputs, and outputs to ferromanganese oxide sediments, Geochim. Cosmochim. Ac., 125, 673–693, https://doi.org/10.1016/j.gca.2013.07.046, 2014.
Liu, M., Matsui, H., Hamilton, D. S., Lamb, K. D., Rathod, S. D., Schwarz, J. P., and Mahowald, N. M.: The underappreciated role of anthropogenic sources in atmospheric soluble iron flux to the Southern Ocean, npj Climate and Atmospheric Science, 5, 28, https://doi.org/10.1038/s41612-022-00250-w, 2022.
Longhini, C. M., Sá, F., and Neto, R. R.: Review and synthesis: iron input, biogeochemistry, and ecological approaches in seawater, Environ. Rev., 27, 125–137, https://doi.org/10.1139/er-2018-0020, 2019.
Luo, L., Bai, X., Liu, S., Wu, B., Liu, W., Lv, Y., Guo, Z., Lin, S., Zhao, S., Hao, Y., Hao, J., Zhang, K., Zheng, A., and Tian, H.: Fine particulate matter (PM2.5/PM1.0) in Beijing, China: Variations and chemical compositions as well as sources, J. Environ. Sci., 121, 187–198, https://doi.org/10.1016/j.jes.2021.12.014, 2022.
Mackey, K. R. M., Post, A. F., McIlvin, M. R., Cutter, G. A., John, S. G., and Saito, M. A.: Divergent responses of Atlantic coastal and oceanic Synechococcus to iron limitation, P. Natl. Acad. Sci. USA, 112, 9944–9949, https://doi.org/10.1073/pnas.1509448112, 2015.
Mahowald, N. M., Baker, A. R., Bergametti, G., Brooks, N., Duce, R. A., Jickells, T. D., Kubilay, N., Prospero, J. M., and Tegen, I.: Atmospheric global dust cycle and iron inputs to the ocean, Global Biogeochem. Cy., 19, , GB4025, https://doi.org/10.1029/2004GB002402, 2005.
Mahowald, N. M., Engelstaedter, S., Luo, C., Sealy, A., Artaxo, P., Benitez-Nelson, C., Bonnet, S., Chen, Y., Chuang, P. Y., Cohen, D. D., Dulac, F., Herut, B., Johansen, A. M., Kubilay, N., Losno, R., Maenhaut, W., Paytan, A., Prospero, J. M., Shank, L. M., and Siefert, R. L.: Atmospheric Iron Deposition: Global Distribution, Variability, and Human Perturbations, Annu. Rev. Mar. Sci., 1, 245–278, https://doi.org/10.1146/annurev.marine.010908.163727, 2009.
Mahowald, N. M., Kloster, S., Engelstaedter, S., Moore, J. K., Mukhopadhyay, S., McConnell, J. R., Albani, S., Doney, S. C., Bhattacharya, A., Curran, M. A. J., Flanner, M. G., Hoffman, F. M., Lawrence, D. M., Lindsay, K., Mayewski, P. A., Neff, J., Rothenberg, D., Thomas, E., Thornton, P. E., and Zender, C. S.: Observed 20th century desert dust variability: impact on climate and biogeochemistry, Atmos. Chem. Phys., 10, 10875–10893, https://doi.org/10.5194/acp-10-10875-2010, 2010.
Mahowald, N. M., Hamilton, D. S., Mackey, K. R. M., Moore, J. K., Baker, A. R., Scanza, R. A., and Zhang, Y.: Aerosol trace metal leaching and impacts on marine microorganisms, Nat. Commun., 9, 2614, https://doi.org/10.1038/s41467-018-04970-7, 2018.
Matsui, H., Mahowald, N. M., Moteki, N., Hamilton, D. S., Ohata, S., Yoshida, A., Koike, M., Scanza, R. A., and Flanner, M. G.: Anthropogenic combustion iron as a complex climate forcer, Nat. Commun., 9, 1593, https://doi.org/10.1038/s41467-018-03997-0, 2018.
Morel, F. M. M. and Price, N. M.: The Biogeochemical Cycles of Trace Metals in the Oceans, Science, 300, 944–947, https://doi.org/10.1126/science.1083545, 2003.
Morel, F. M. M., Reinfelder, J. R., Roberts, S. B., Chamberlain, C. P., Lee, J. G., and Yee, D.: Zinc and carbon co-limitation of marine phytoplankton, Nature, 369, 740–742, https://doi.org/10.1038/369740a0, 1994.
National Centers for Environmental Prediction/National Weather Service/NOAA/U.S. Department of Commerce: NCEP FNL Operational Model Global Tropospheric Analyses, continuing from July 1999, Research Data Archive at the National Center for Atmospheric Research, Computational and Information Systems Laboratory [data set], https://doi.org/10.5065/D6M043C6, 2000.
Nuester, J., Vogt, S., Newville, M., Kustka, A., and Twining, B.: The Unique Biogeochemical Signature of the Marine Diazotroph Trichodesmium, Front. Microbiol., 3, 22179, https://doi.org/10.3389/fmicb.2012.00150, 2012.
Oakes, M., Ingall, E. D., Lai, B., Shafer, M. M., Hays, M. D., Liu, Z. G., Russell, A. G., and Weber, R. J.: Iron Solubility Related to Particle Sulfur Content in Source Emission and Ambient Fine Particles, Environ. Sci. Technol., 46, 6637–6644, https://doi.org/10.1021/es300701c, 2012.
Okubo, A., Takeda, S., and Obata, H.: Atmospheric deposition of trace metals to the western North Pacific Ocean observed at coastal station in Japan, Atmos. Res., 129–130, 20–32, https://doi.org/10.1016/j.atmosres.2013.03.014, 2013.
Pan, Y., Liu, J., Zhang, L., Cao, J., Hu, J., Tian, S., Li, X., and Xu, W.: Bulk Deposition and Source Apportionment of Atmospheric Heavy Metals and Metalloids in Agricultural Areas of Rural Beijing during 2016–2020, Atmosphere, 12, 283, https://doi.org/10.3390/atmos12020283, 2021.
Pan, Y. P. and Wang, Y. S.: Atmospheric wet and dry deposition of trace elements at 10 sites in Northern China, Atmos. Chem. Phys., 15, 951–972, https://doi.org/10.5194/acp-15-951-2015, 2015.
Pinedo-González, P., Hawco, N. J., Bundy, R. M., Armbrust, E. V., Follows, M. J., Cael, B. B., White, A. E., Ferrón, S., Karl, D. M., and John, S. G.: Anthropogenic Asian aerosols provide Fe to the North Pacific Ocean, P. Natl. Acad. Sci. USA, 117, 27862–27868, https://doi.org/10.1073/pnas.2010315117, 2020.
Pleim, J. and Ran, L.: Surface Flux Modeling for Air Quality Applications, Atmosphere, 2, 271–302, https://doi.org/10.3390/atmos2030271, 2011.
Pleim, J. E., Ran, L., Saylor, R. D., Willison, J., and Binkowski, F. S.: A New Aerosol Dry Deposition Model for Air Quality and Climate Modeling, J. Adv. Model. Earth Sy., 14, e2022MS003050, https://doi.org/10.1029/2022MS003050, 2022.
Reff, A., Bhave, P. V., Simon, H., Pace, T. G., Pouliot, G. A., Mobley, J. D., and Houyoux, M.: Emissions Inventory of PM2.5 Trace Elements across the United States, Environ. Sci. Technol., 43, 5790–5796, https://doi.org/10.1021/es802930x, 2009.
Rodriguez, I. B. and Ho, T.-Y.: Diel nitrogen fixation pattern of Trichodesmium: the interactive control of light and Ni, Sci. Rep.-UK, 4, 4445, https://doi.org/10.1038/srep04445, 2014.
Sakata, M. and Asakura, K.: Atmospheric dry deposition of trace elements at a site on Asian-continent side of Japan, Atmos. Environ., 45, 1075–1083, https://doi.org/10.1016/j.atmosenv.2010.11.043, 2011.
Sarwar, G., Gantt, B., Foley, K., Fahey, K., Spero, T. L., Kang, D., Mathur, R., Foroutan, H., Xing, J., Sherwen, T., and Saiz-Lopez, A.: Influence of bromine and iodine chemistry on annual, seasonal, diurnal, and background ozone: CMAQ simulations over the Northern Hemisphere, Atmos. Environ., 213, 395–404, https://doi.org/10.1016/j.atmosenv.2019.06.020, 2019.
Schmidt, K., Schlosser, C., Atkinson, A., Fielding, S., Venables, H. J., Waluda, C. M., and Achterberg, E. P.: Zooplankton Gut Passage Mobilizes Lithogenic Iron for Ocean Productivity, Curr. Biol., 26, 2667–2673, https://doi.org/10.1016/j.cub.2016.07.058, 2016.
Shaked, Y., Xu, Y., Leblanc, K., and Morel, F. M. M.: Zinc availability and alkaline phosphatase activity in Emiliania huxleyi: Implications for Zn-P co-limitation in the ocean, Limnol. Oceanogr., 51, 299–309, https://doi.org/10.4319/lo.2006.51.1.0299, 2006.
Shao, J., Chen, Q., Wang, Y., Lu, X., He, P., Sun, Y., Shah, V., Martin, R. V., Philip, S., Song, S., Zhao, Y., Xie, Z., Zhang, L., and Alexander, B.: Heterogeneous sulfate aerosol formation mechanisms during wintertime Chinese haze events: air quality model assessment using observations of sulfate oxygen isotopes in Beijing, Atmos. Chem. Phys., 19, 6107–6123, https://doi.org/10.5194/acp-19-6107-2019, 2019.
Shi, J.-H., Zhang, J., Gao, H.-W., Tan, S.-C., Yao, X.-H., and Ren, J.-L.: Concentration, solubility and deposition flux of atmospheric particulate nutrients over the Yellow Sea, Deep-Sea Res. Pt. II, 97, 43–50, https://doi.org/10.1016/j.dsr2.2013.05.004, 2013.
Shi, Z., Krom, M. D., Bonneville, S., and Benning, L. G.: Atmospheric Processing Outside Clouds Increases Soluble Iron in Mineral Dust, Environ. Sci. Technol., 49, 1472–1477, https://doi.org/10.1021/es504623x, 2015.
Shi, Z., Endres, S., Rutgersson, A., Al-Hajjaji, S., Brynolf, S., Booge, D., Hassellöv, I.-M., Kontovas, C., Kumar, R., Liu, H., Marandino, C., Matthias, V., Moldanová, J., Salo, K., Sebe, M., Yi, W., Yang, M., and Zhang, C.: Perspectives on shipping emissions and their impacts on the surface ocean and lower atmosphere: An environmental-social-economic dimension, Elementa: Science of the Anthropocene, 11, 00052, https://doi.org/10.1525/elementa.2023.00052, 2023.
Sholkovitz, E. R., Sedwick, P. N., Church, T. M., Baker, A. R., and Powell, C. F.: Fractional solubility of aerosol iron: Synthesis of a global-scale data set, Geochim. Cosmochim. Ac., 89, 173–189, https://doi.org/10.1016/j.gca.2012.04.022, 2012.
Simon, H., Beck, L., Bhave, P. V., Divita, F., Hsu, Y., Luecken, D., Mobley, J. D., Pouliot, G. A., Reff, A., Sarwar, G., and Strum, M.: The development and uses of EPA's SPECIATE database, Atmos. Pollut. Res., 1, 196–206, https://doi.org/10.5094/APR.2010.026, 2010.
Sunda, W.: Feedback Interactions between Trace Metal Nutrients and Phytoplankton in the Ocean, Front. Microbiol., 3, 21530, https://doi.org/10.3389/fmicb.2012.00204, 2012.
Takano, S., Tanimizu, M., Hirata, T., and Sohrin, Y.: Isotopic constraints on biogeochemical cycling of copper in the ocean, Nat. Commun., 5, 5663, https://doi.org/10.1038/ncomms6663, 2014.
Tao, J., Zhang, L., Zhang, R., Wu, Y., Zhang, Z., Zhang, X., Tang, Y., Cao, J., and Zhang, Y.: Uncertainty assessment of source attribution of PM2.5 and its water-soluble organic carbon content using different biomass burning tracers in positive matrix factorization analysis – a case study in Beijing, China, Sci. Total Environ., 543, 326–335, https://doi.org/10.1016/j.scitotenv.2015.11.057, 2016.
Tao, J., Zhang, L., Cao, J., Zhong, L., Chen, D., Yang, Y., Chen, D., Chen, L., Zhang, Z., Wu, Y., Xia, Y., Ye, S., and Zhang, R.: Source apportionment of PM2.5 at urban and suburban areas of the Pearl River Delta region, south China – With emphasis on ship emissions, Sci. Total Environ., 574, 1559–1570, https://doi.org/10.1016/j.scitotenv.2016.08.175, 2017.
Tian, H. Z., Zhu, C. Y., Gao, J. J., Cheng, K., Hao, J. M., Wang, K., Hua, S. B., Wang, Y., and Zhou, J. R.: Quantitative assessment of atmospheric emissions of toxic heavy metals from anthropogenic sources in China: historical trend, spatial distribution, uncertainties, and control policies, Atmos. Chem. Phys., 15, 10127–10147, https://doi.org/10.5194/acp-15-10127-2015, 2015.
Tortell, P. D., Rau, G. H., and Morel, F. M. M.: Inorganic carbon acquisition in coastal Pacific phytoplankton communities, Limnol. Oceanogr., 45, 1485–1500, https://doi.org/10.4319/lo.2000.45.7.1485, 2000.
U.S. EPA: CMAQ Model Version 5.3 Input Data – 1/1/2016 – 12/31/2016 12 km CONUS (V1), UNC Dataverse [data set], https://doi.org/10.15139/S3/MHNUNE, 2019.
U.S. EPA: CMAQ (5.4), Zenodo [code], https://doi.org/10.5281/zenodo.4081737, 2020.
Wang, F. J., Chen, Y., Guo, Z. G., Gao, H. W., Mackey, K. R., Yao, X. H., Zhuang, G. S., and Paytan, A.: Combined effects of iron and copper from atmospheric dry deposition on ocean productivity, Geophys. Res. Lett., 44, 2546–2555, https://doi.org/10.1002/2016GL072349, 2017.
Wang, K., Tian, H., Hua, S., Zhu, C., Gao, J., Xue, Y., Hao, J., Wang, Y., and Zhou, J.: A comprehensive emission inventory of multiple air pollutants from iron and steel industry in China: Temporal trends and spatial variation characteristics, Sci. Total Environ., 559, 7–14, https://doi.org/10.1016/j.scitotenv.2016.03.125, 2016.
Wang, Y., Cheng, K., Wu, W., Tian, H., Yi, P., Zhi, G., Fan, J., and Liu, S.: Atmospheric emissions of typical toxic heavy metals from open burning of municipal solid waste in China, Atmos. Environ., 152, 6–15, https://doi.org/10.1016/j.atmosenv.2016.12.017, 2017.
Wei, Z., Wang, L. T., Chen, M. Z., and Zheng, Y.: The 2013 severe haze over the Southern Hebei, China: PM2.5 composition and source apportionment, Atmos. Pollut. Res., 5, 759–768, https://doi.org/10.5094/APR.2014.085, 2014.
Whitfield, M.: Interactions between phytoplankton and trace metals in the ocean, in: Advances in Marine Biology, Academic Press, 1–128, https://doi.org/10.1016/S0065-2881(01)41002-9, 2001.
Wuttig, K., Heller, M. I., and Croot, P. L.: Reactivity of Inorganic Mn and Mn Desferrioxamine B with O2, , and H2O2 in Seawater, Environ. Sci. Technol., 47, 10257–10265, https://doi.org/10.1021/es4016603, 2013a.
Wuttig, K., Wagener, T., Bressac, M., Dammshäuser, A., Streu, P., Guieu, C., and Croot, P. L.: Impacts of dust deposition on dissolved trace metal concentrations (Mn, Al and Fe) during a mesocosm experiment, Biogeosciences, 10, 2583–2600, https://doi.org/10.5194/bg-10-2583-2013, 2013b.
Xu, L., Pye, H. O. T., He, J., Chen, Y., Murphy, B. N., and Ng, N. L.: Experimental and model estimates of the contributions from biogenic monoterpenes and sesquiterpenes to secondary organic aerosol in the southeastern United States, Atmos. Chem. Phys., 18, 12613–12637, https://doi.org/10.5194/acp-18-12613-2018, 2018.
Xuan, J.: Emission inventory of eight elements, Fe, Al, K, Mg, Mn, Na, Ca and Ti, in dust source region of East Asia, Atmos. Environ., 39, 813–821, https://doi.org/10.1016/j.atmosenv.2004.10.029, 2005.
Yamamoto, A., Hajima, T., Yamazaki, D., Noguchi Aita, M., Ito, A., and Kawamiya, M.: Competing and accelerating effects of anthropogenic nutrient inputs on climate-driven changes in ocean carbon and oxygen cycles, Science Advances, 8, eabl9207, https://doi.org/10.1126/sciadv.abl9207, 2022.
Yang, T., Chen, Y., Zhou, S., and Li, H.: Impacts of Aerosol Copper on Marine Phytoplankton: A Review, Atmosphere, 10, 414, https://doi.org/10.3390/atmos10070414, 2019.
Ying, Q., Feng, M., Song, D., Wu, L., Hu, J., Zhang, H., Kleeman, M. J., and Li, X.: Improve regional distribution and source apportionment of PM2.5 trace elements in China using inventory-observation constrained emission factors, Sci. Total Environ., 624, 355–365, https://doi.org/10.1016/j.scitotenv.2017.12.138, 2018.
Yuan, Y., Zhang, Y., Mao, J., Yu, G., Xu, K., Zhao, J., Qian, H., Wu, L., Yang, X., Chen, Y., and Ma, W.: Diverse changes in shipping emissions around the Western Pacific ports under the coeffect of the epidemic and fuel oil policy, Sci. Total Environ., 879, 162892, https://doi.org/10.1016/j.scitotenv.2023.162892, 2023.
Zhai, J., Yu, G., Zhang, J., Shi, S., Yuan, Y., Jiang, S., Xing, C., Cai, B., Zeng, Y., Wang, Y., Zhang, A., Zhang, Y., Fu, T.-M., Zhu, L., Shen, H., Ye, J., Wang, C., Tao, S., Li, M., Zhang, Y., and Yang, X.: Impact of Ship Emissions on Air Quality in the Greater Bay Area in China under the Latest Global Marine Fuel Regulation, Environ. Sci. Technol., 57, 12341–12350, https://doi.org/10.1021/acs.est.3c03950, 2023.
Zhang, H., Li, R., Dong, S., Wang, F., Zhu, Y., Meng, H., Huang, C., Ren, Y., Wang, X., Hu, X., Li, T., Peng, C., Zhang, G., Xue, L., Wang, X., and Tang, M.: Abundance and Fractional Solubility of Aerosol Iron During Winter at a Coastal City in Northern China: Similarities and Contrasts Between Fine and Coarse Particles, J. Geophys. Res.-Atmos., 127, e2021JD036070, https://doi.org/10.1029/2021JD036070, 2022.
Zhang, J., Zhou, X., Wang, Z., Yang, L., Wang, J., and Wang, W.: Trace elements in PM2.5 in Shandong Province: Source identification and health risk assessment, Sci. Total Environ., 621, 558–577, https://doi.org/10.1016/j.scitotenv.2017.11.292, 2018.
Zhang, T., Liu, J., Xiang, Y., Liu, X., Zhang, J., Zhang, L., Ying, Q., Wang, Y., Wang, Y., Chen, S., Chai, F., and Zheng, M.: Quantifying anthropogenic emission of iron in marine aerosol in the Northwest Pacific with shipborne online measurements, Sci. Total Environ., 912, 169158, https://doi.org/10.1016/j.scitotenv.2023.169158, 2024.
Zhang, Y., Yu, Q., Ma, W., and Chen, L.: Atmospheric deposition of inorganic nitrogen to the eastern China seas and its implications to marine biogeochemistry, J. Geophys. Res.-Atmos., 115, D00K10, https://doi.org/10.1029/2009JD012814, 2010.
Zhang, Y., Mahowald, N., Scanza, R. A., Journet, E., Desboeufs, K., Albani, S., Kok, J. F., Zhuang, G., Chen, Y., Cohen, D. D., Paytan, A., Patey, M. D., Achterberg, E. P., Engelbrecht, J. P., and Fomba, K. W.: Modeling the global emission, transport and deposition of trace elements associated with mineral dust, Biogeosciences, 12, 5771–5792, https://doi.org/10.5194/bg-12-5771-2015, 2015.
Zhao, J., Zhang, Y., Patton, A. P., Ma, W., Kan, H., Wu, L., Fung, F., Wang, S., Ding, D., and Walker, K.: Projection of ship emissions and their impact on air quality in 2030 in Yangtze River delta, China, Environ. Pollut., 263, 114643, https://doi.org/10.1016/j.envpol.2020.114643, 2020.
Zhao, J., Sarwar, G., Gantt, B., Foley, K., Henderson, B. H., Pye, H. O. T., Fahey, K. M., Kang, D., Mathur, R., Zhang, Y., Li, Q., and Saiz-Lopez, A.: Impact of dimethylsulfide chemistry on air quality over the Northern Hemisphere, Atmos. Environ., 244, 117961, https://doi.org/10.1016/j.atmosenv.2020.117961, 2021a.
Zhao, J., Zhang, Y., Xu, H., Tao, S., Wang, R., Yu, Q., Chen, Y., Zou, Z., and Ma, W.: Trace Elements From Ocean-Going Vessels in East Asia: Vanadium and Nickel Emissions and Their Impacts on Air Quality, J. Geophys. Res.-Atmos., 126, e2020JD033984, https://doi.org/10.1029/2020JD033984, 2021b.
Zhao, S., Tian, H., Luo, L., Liu, H., Wu, B., Liu, S., Bai, X., Liu, W., Liu, X., Wu, Y., Lin, S., Guo, Z., Lv, Y., and Xue, Y.: Temporal variation characteristics and source apportionment of metal elements in PM2.5 in urban Beijing during 2018–2019, Environ. Pollut., 268, 115856, https://doi.org/10.1016/j.envpol.2020.115856, 2021.
Zou, H.-X., Pang, Q.-Y., Zhang, A.-Q., Lin, L.-D., Li, N., and Yan, X.-F.: Excess copper induced proteomic changes in the marine brown algae Sargassum fusiforme, Ecotox. Environ. Safe., 111, 271–280, https://doi.org/10.1016/j.ecoenv.2014.10.028, 2015.
Zou, Z., Zhao, J., Zhang, C., Zhang, Y., Yang, X., Chen, J., Xu, J., Xue, R., and Zhou, B.: Effects of cleaner ship fuels on air quality and implications for future policy: A case study of Chongming Ecological Island in China, J. Clean. Prod., 267, 122088, https://doi.org/10.1016/j.jclepro.2020.122088, 2020.