the Creative Commons Attribution 4.0 License.
the Creative Commons Attribution 4.0 License.
 | 05 Jul 2024
The marinada fall wind in the eastern Ebro sub-basin: physical mechanisms and role of the sea, orography and irrigation
Maria Antonia Jimenez
Joan Cuxart
Daniel Martinez-Villagrasa
Aaron Boone
Patrick Le Moigne
During the warm months of the year in Catalonia, the marine air overcomes the coastal mountain range and reaches the eastern Ebro sub-basin. This phenomenon is called marinada and has recently been thoroughly characterized for the first time by Jiménez et al. (2023), based on surface climatological data. However, the main physical mechanisms involved in its arrival and propagation remain to be discovered. This study aims to understand how the marinada is formed and how it interacts with the already developed atmospheric boundary layer. Surface and atmospheric observations are used in combination with the coupled surface–atmosphere model Meso-NH to reveal the mechanisms at play. It is shown that the marinada is generated by the advection of a cool marine air mass over the Catalan Pre-coastal Range by the action of the sea breeze and the upslope wind. This marine air mass then flows into the Ebro basin, creating what is known as the marinada. The characteristics and dynamics of the marinada allow it to be classified as a fall wind. It is also shown that the arrival, propagation and decay of the marinada is strongly dependent on the larger-scale weather situation: westerlies or thermal low. The current study provides a consistent framework for understanding the marinada, paving the way for better modeling and prediction of the phenomenon.
- Article
(19212 KB) - Full-text XML
- BibTeX
- EndNote


Regional wind patterns significantly influence many aspects of the environment in which societies live. In the face of growing environmental challenges, understanding these wind dynamics is crucial for a deeper comprehension of the complex systems of our planet. More than just a meteorological curiosity, regional winds affect essential aspects such as extreme weather events, agriculture, human thermal comfort, air quality and energy production. Unraveling the details of these local wind patterns improves our ability to accurately model, predict and adapt to weather and climate change.
In terms of climate change, the Mediterranean region is expected to be a high-stakes region, with significant changes in weather patterns and the hydrological cycle, resulting in high risks for humans and ecosystems (Ali and Cramer, 2022). Mesoscale winds in the Mediterranean region can be caused by a variety of conditions – synoptic weather situation, local or large-scale relief, interaction with the sea, etc. – or by a combination of these factors.
As the Mediterranean region experiences dry and hot summers, sea breezes are particularly common in coastal areas during the warm months of the year. Sea breezes are due to the daytime differential heating between the land and the sea, resulting in a lower pressure over the heated land surface than over the sea, and finally in a pressure gradient force (PGF) that accelerates the winds towards the land (Segal and Arritt, 1992; Miller et al., 2003; Crosman and Horel, 2010; Cuxart et al., 2014). The sea breeze systems typically consist of a stable low tropospheric zone with subsidence over the sea, a convective internal boundary layer over the land and a sea breeze front ahead (Miller et al., 2003; Crosman and Horel, 2010). The penetration length of the sea breeze can be within the range of 15 to 85 km depending on the topographic features of the coastal region and the synoptic wind if it has developed (Simpson et al., 1977; Crosman and Horel, 2010; Pokhrel and Lee, 2011; Poljak et al., 2014). In addition to the change in wind direction that characterizes the arrival of the sea breeze, the sea breeze often coincides with a drop in temperature and an increase in humidity (Simpson et al., 1977; Crosman and Horel, 2010). In the Barcelona region in Catalonia, the characteristics of the sea breezes were studied by Redaño et al. (1991). The authors showed that the sea breeze typically starts between 05:00 and 06:00 UTC (07:00 to 08:00 LST) and reaches its maximum speed between 12:00 and 13:00 UTC. This maximum wind speed ranges from 8 to 12 m s−1 for 80 % of the sea breezes events. The wind direction during the day is also described. It starts from the southeast at the onset of the sea breeze and gradually turns to the southwest under the influence of the Coriolis force.
In addition to sea breezes, orographically induced winds also play a role in many meteorological phenomena in the Mediterranean region, which is surrounded by several mountain ranges. At local and regional scales, slopes strongly influence the winds and circulations, mainly through slope winds (Orville, 1964; Haiden, 2003; Serafin and Zardi, 2010; De Wekker and Kossmann, 2015). The main driving force for upslope (downslope) winds is the PGF due to surface heating (cooling) (Haiden, 2003; Serafin and Zardi, 2010). Since they share the same driving mechanism, sea breezes and slope flows can interact. The interaction between the two depends on the steepness of the slope and the stability of the atmosphere (Porson et al., 2007). For eastern Spain in summer, a region with moderate slopes and strong shallow convection activity, Miao et al. (2003) showed with a study case that the upslope flow has the potential to enhance the inland wind. In particular, it increases the depth of the sea breeze and accelerates the landward wind but also limits the penetration of the sea breeze at the range crest. The authors also investigated the influence of soil parameters on the sea breeze and showed that a very arid soil with dry vegetation could help the sea breeze penetrate up to 75 km inland, while a moist and vegetated land type limits the inland sea breeze extension to 20 km.
On a regional scale, differences in the properties of air masses are also drivers of the low tropospheric winds. In particular, differences in temperature and moisture between two different air masses lead to differences in air density and later to pressure gradients at the interface between air masses. This density difference has been identified as a driver of several downslope winds, such as the Santa Ana wind in California (Hughes and Hall, 2010), the bora wind in Croatia (Jurčec, 1981; Smith, 1987; Grisogono and Belusic, 2008), or the mistral wind in southern France (Pettré, 1981; Drobinski et al., 2017). When the density difference is the main driver, such downslope winds are called fall winds, as in the case of Santa Ana winds or weak to moderate bora wind events (Smith, 1987; Hughes and Hall, 2010). Although it belongs to the family of gravity flows (Mahrt, 1982), fall wind is used in contrast to katabatic wind, a term mainly applied to gravity flows whose potential temperature deficit is due to surface radiative cooling (Poulos and Zhong, 2008).
These fall winds have in common a strong temperature inversion cap over an almost homogeneous cold layer, and this inversion cap can be used to determine the height of the flow (Pettré, 1981; Smith, 1987; Grisogono and Belusic, 2008; Hughes and Hall, 2010). The inversion cap separates the flow pouring down the slope from the pre-existing atmospheric boundary layer (ABL), and the distinction between a lower-flowing air mass and the ABL ultimately allows hydraulic theory to be used to understand the phenomena studied (Durran, 2003; Yu et al., 2005; Grisogono and Belusic, 2008).
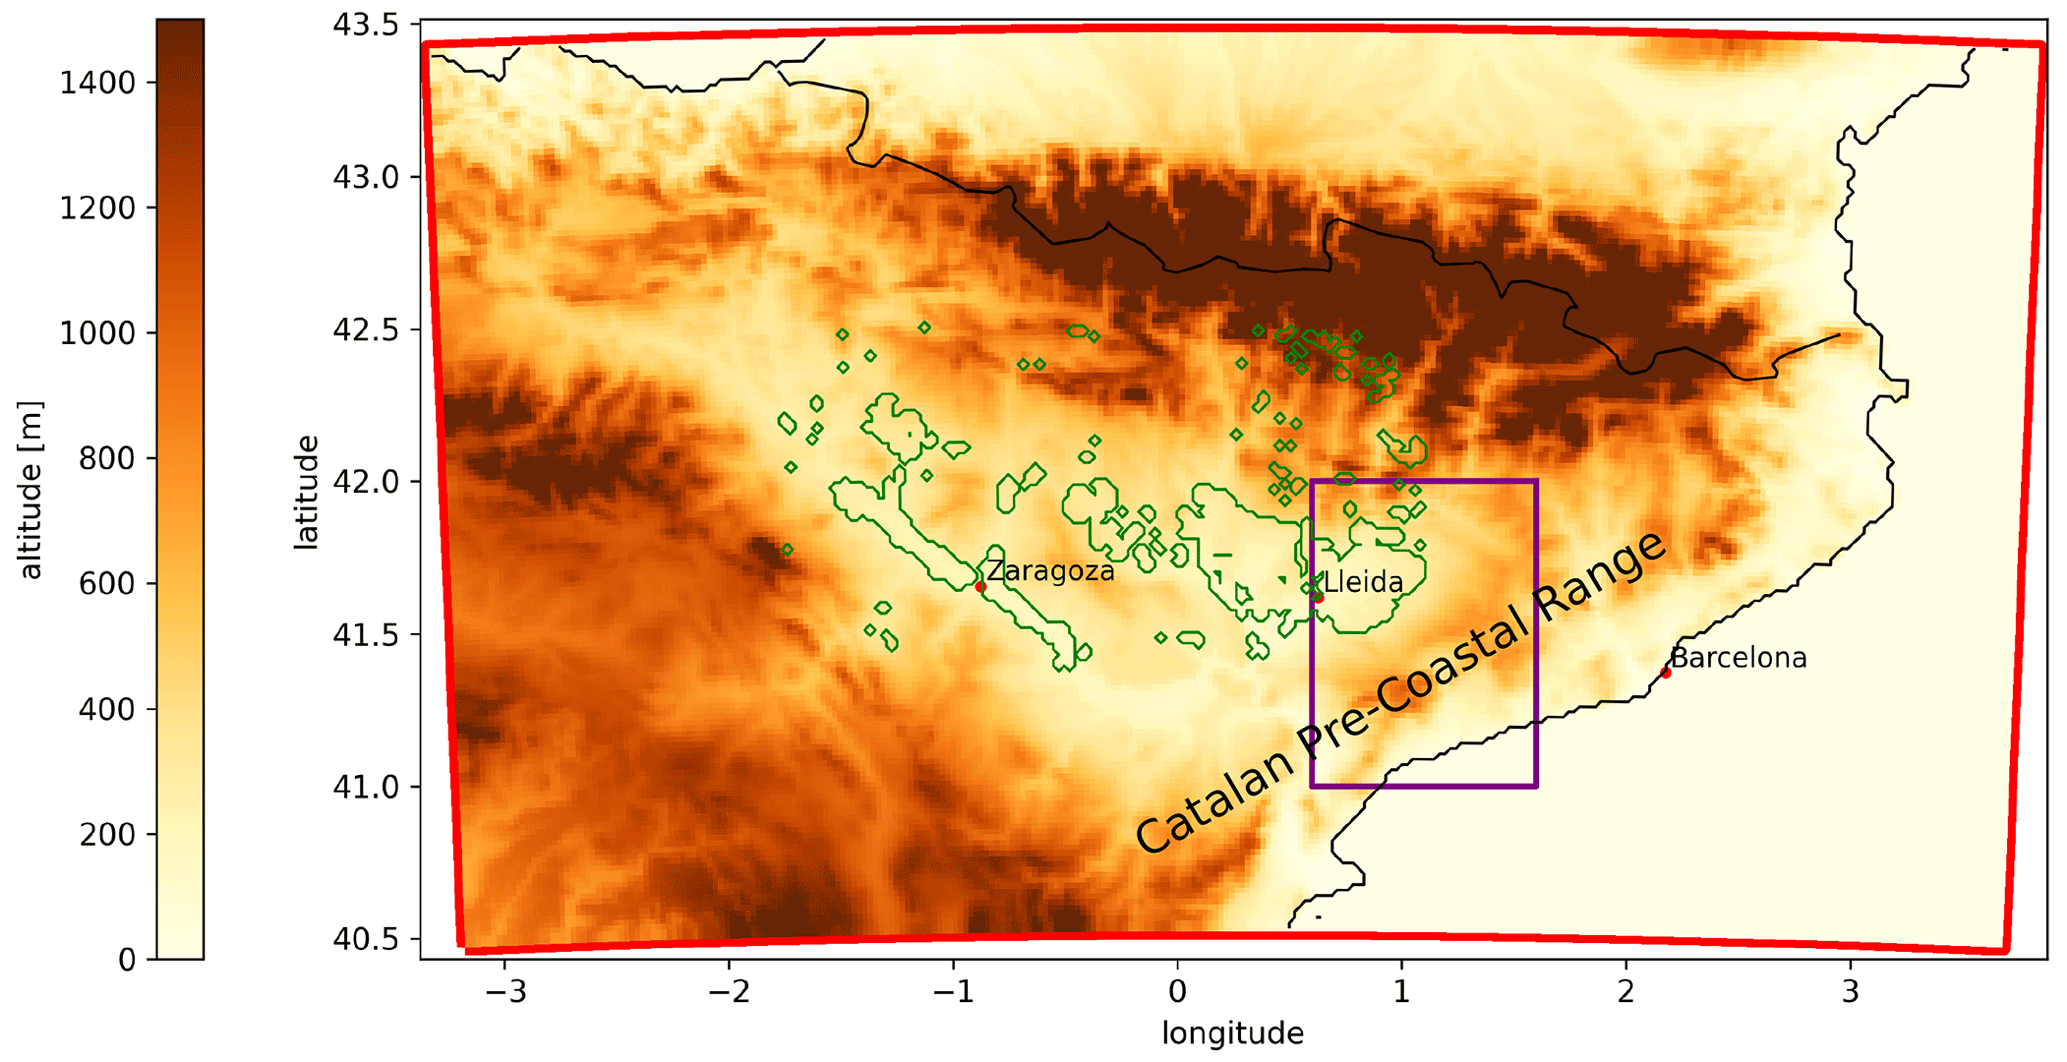
Figure 1Domain of the model. The black lines represent the coastline or country borders, and the green lines delineate the areas of the Ebro basin irrigated. The purple rectangle delineates the study area for the marinada.
With its proximity to the sea and the mountains, northeastern Spain has the potential to generate the three types of wind mentioned above. In particular, the Ebro basin is the largest watershed of northeastern Spain, and its orography influences largely the climate and wind patterns of the region. The Ebro basin is surrounded by mountain ranges, as shown in Fig. 1. It is separated from the Mediterranean Sea to the east by a medium-height mountain range known as the Catalan Pre-coastal Range (CPR). These mountain ranges prevent rainfall from reaching the Ebro basin, resulting in a semi-arid climate. Due to the longitudinal shape of the basin and the presence of the Pyrenees to the north, the winds are channeled into the basin and two wind directions dominate: northwest and southeast (Jiménez et al., 2009). Along the axis of Zaragoza–Reus is the lowest part of the basin, which actually follows the Ebro River, and where the channeling effect of the winds is most pronounced. When the northwesterly wind is strong, this wind is called cierzo (Masson and Bougeault, 1996; Jiménez et al., 2009; Ortega et al., 2022). Based on the HadISD observational dataset, Ortega et al. (2022) estimated that the cierzo occurs about one-third of the time in the western part of the Ebro basin, around Zaragoza. Considering all wind intensities, westerly to northwesterly winds account for up to 60 % at Zaragoza (Ortega et al., 2022). In addition to westerly winds, south-southeasterly winds also occur, most often associated with a thermal low over the Iberian Peninsula. The Iberian thermal low develops when the peninsula is intensely heated, usually in summer. Hoinka and De Castro (2003) found that thermal lows develop on up to 45 % of the days in July and August. This low-pressure center accelerates the wind inland and can induce a counterclockwise circulation on the sides of the Iberian Peninsula, which corresponds to a south-southeast wind in the Ebro basin (Favà et al., 2019).
The Segre sub-basin is the northeastern part of the Ebro basin and shares the main wind patterns with the rest of the Ebro basin, but with some differences. The westerly winds are weaker than in Zaragoza and come mainly from the west-southwest. Between 12:00 and 15:00 UTC, Jiménez et al. (2023) showed that 60 % of the winds come from the west to southwest sector. The influence of local slope flows is also more pronounced in this region (Martínez et al., 2008; Cuxart et al., 2012). Martínez et al. (2008) showed that east to southeast flows are often observed at night in the Lleida region on about 40 % of the nights in summer. These easterly flows are also observed by Cuxart et al. (2012) in the same area. Both studies suggest that this wind is a gravity wind coming from the CPR.
Further east, closer to the CPR, a similar south-easterly wind is known locally as the marinada (Jiménez et al., 2023). This wind is stronger than the one observed around Lleida, and it has been recently thoroughly characterized by Jiménez et al. (2023). The marinada is a cool and humid wind that blows in the Segre sub-basin in late summer afternoons. It corresponds to the entry of a marine air mass into the Ebro basin and is known by the local population as the wind that relieves the summer heat. Its characterization by Jiménez et al. (2023) was carried out using near-surface observations within the Segre sub-basin. However, a lack of atmospheric observations has prevented a characterization of its vertical extent. In addition, the processes that lead to the marinada are not yet fully understood. Jiménez et al. (2023) hypothesizes that the marinada is a branch of the sea breeze that reaches up to 70 km inland by overcoming the CPR. This long penetration length of a sea breeze is usually a relatively rare phenomenon (Simpson et al., 1977), especially when coastal mountains are present (Miao et al., 2003). Therefore, the interaction between the marinada and the sea breeze should be further investigated.
The aim of this paper is to characterize the marinada over its entire height and to investigate the dynamic processes behind it. New observations from the Land surface Interactions with the Atmosphere over the Iberian Semi-arid Environment (LIAISE) campaign (Boone et al., 2019) are used in combination with a mesoscale meteorological model to improve the understanding of the marinada phenomenon. The study area is also extended towards the coast to better understand the role of the sea breeze in the marinada.
Following this introduction, the next section describes the observational material, the two case studies selected and the coupled surface–atmosphere model used for the study. The third section focuses on the results obtained. In particular, the afternoon marinada seen on the Ebro basin side is linked to the sea breeze that occurs earlier on the coast. Then, four different stages of the marinada are identified and detailed for the two case studies. Finally, the influence of irrigation on the marinada is shown. The fourth section discusses the results and is followed by the conclusion.
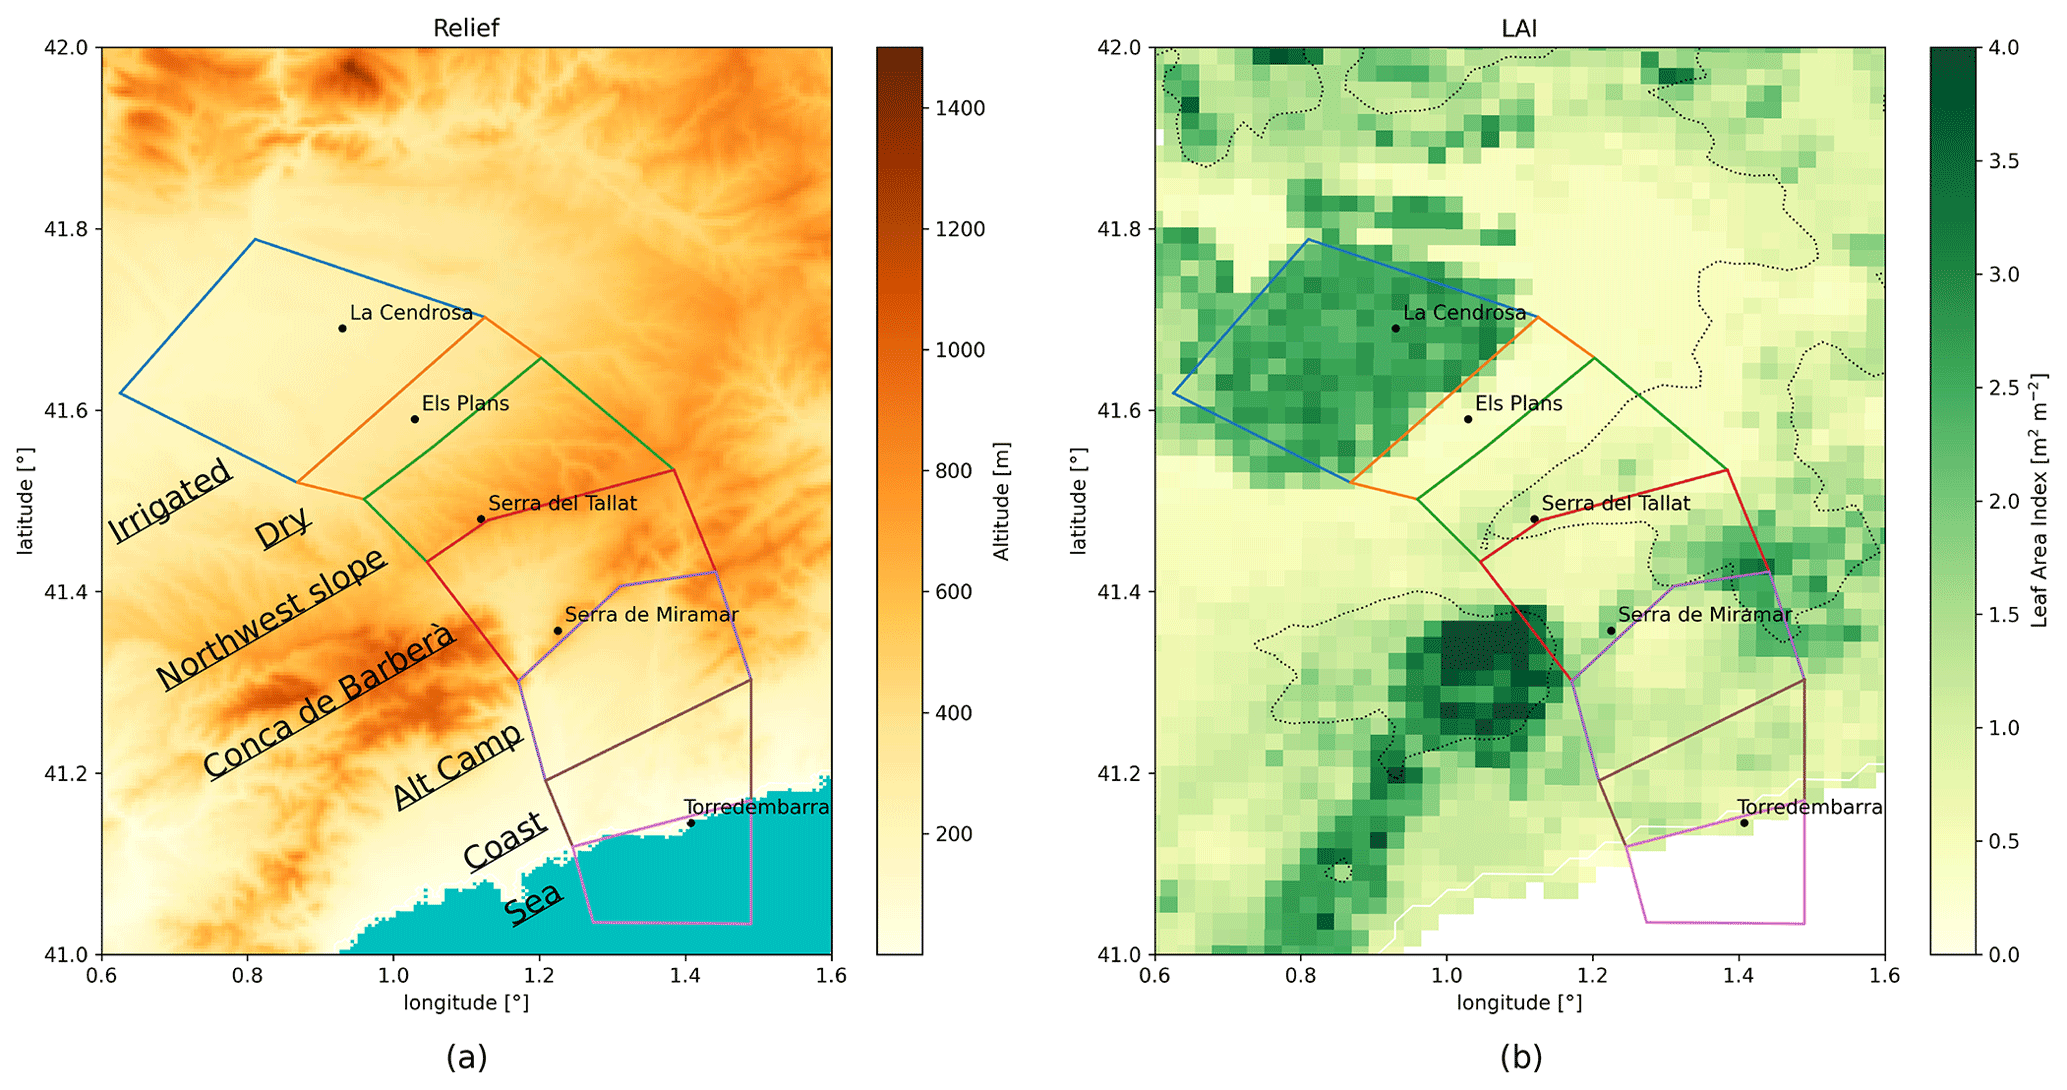
Figure 2Topographic properties of the study area, corresponding to the purple rectangle of Fig. 1. Orography is shown in panel (a) and leaf area index from the model in panel (b). The different areas described in Table 1 are shown as colored polygons, with the area names underlined in panel (a). The dotted line in panel (b) follows the 600 m elevation isoline.
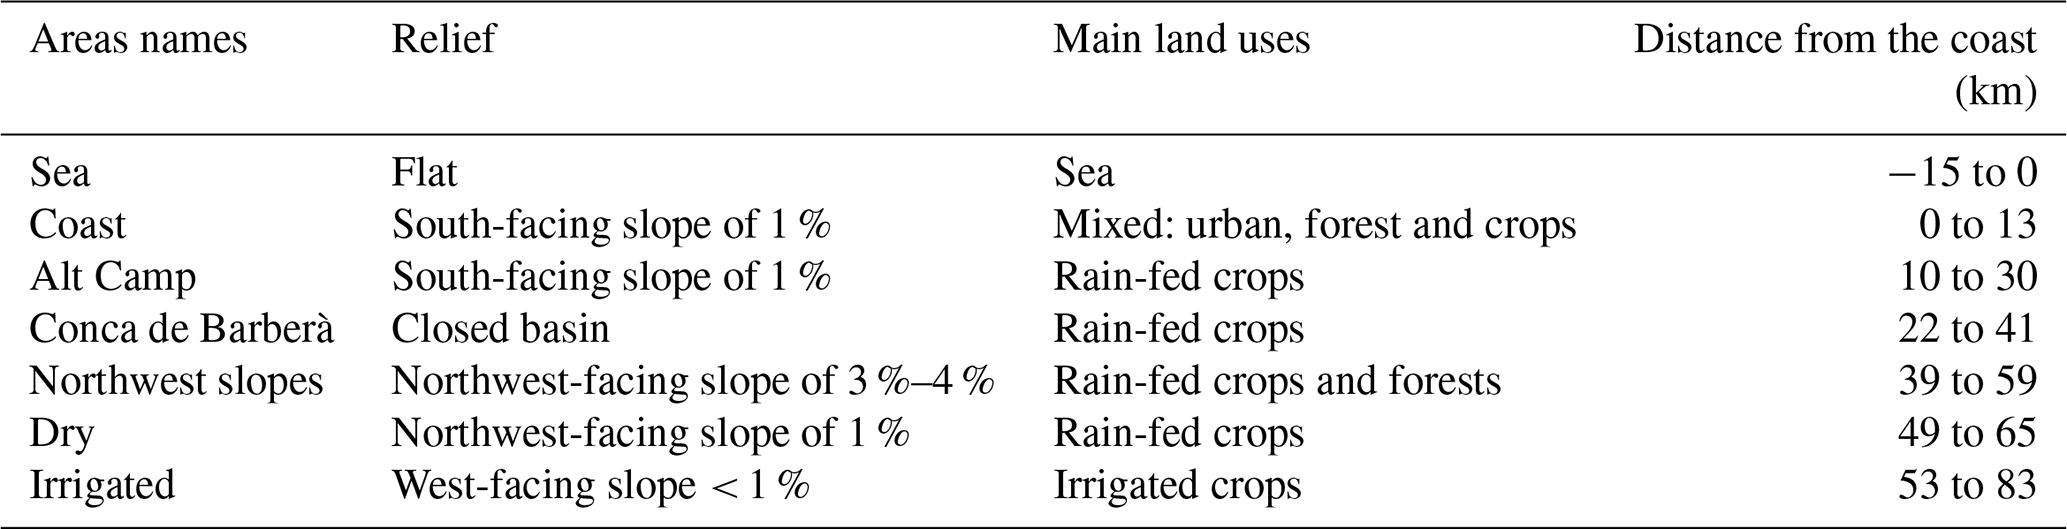
Table 1Table of the study sub-regions shown in Fig. 2 and their topographical characteristics.
2.1 Observational data
To study the surface behavior of the marinada, the network of automatic weather stations (AWSs) of the Catalan Meteorological Service (or Servei Meteorològic de Catalunya (SMC)) is used (Servei Meteorològic de Catalunya, 2011). The SMC AWS network is fairly dense, with stations typically 15 km apart. They include temperature and humidity measurements at 1.5 (above ground level) and wind measurements at 10 or 2 , as some stations were installed primarily for agro-meteorological purposes. Observations are aggregated into 30 min data and made available on the SMC website. The extensive coverage of this network provides a good representation of the spatiotemporal behavior of the marinada over the course of the day at the surface. The SMC AWSs used in the study are mapped in Fig. A1 and listed in Table A1.
For the irrigated and dry zones in the Segre sub-basin, a wide range of observations is available for the last 2 weeks of July 2021, thanks to the special observation period of the international LIAISE campaign (Boone et al., 2019). The aim of this campaign is to study the impact of anthropization on surface–atmosphere interactions and the water cycle in semi-arid environments. The many observations collected during this campaign are available in the open-access LIAISE database (AERIS, 2021). Although the marinada study was not one of the main objectives of the LIAISE campaign, a substantial number of measurements can be used to study it. Furthermore, the marinada was a phenomenon that was present on most days of the special observation period of the campaign and needs to be well characterized and understood for a proper analysis of the LIAISE data. This work particularly uses data from a mast, radiosondes and a wind profiler at Els Plans (Fig. 2). The mast at Els Plans was 50 m high and was equipped with several temperature, humidity and wind sensors at different heights (Price, 2023a). To facilitate comparison with the SMC network, the 10 m observations are used here. Radiosondes with temperature, humidity and wind sensors were launched hourly during the daytime along the special observation period (14 to 30 July) (Price, 2023b), some days until late in the day, allowing the marinada study on these days. An ultra-high-frequency (UHF) radar is also installed at Els Plans, and the wind profile can be obtained up to 2000 (Lothon, 2022).
2.2 Study area
The marinada has already been investigated for its behavior observed at the surface with the SMC stations and for its part located in the eastern Ebro basin (Jiménez et al., 2023), i.e., the Segre sub-basin. To gain a better understanding of the origin of the marinada, the study area considered here has been extended to include the coastal area. For the purposes of this study, this region is divided into several relatively homogeneous parts in terms of topographic features. Starting from the sea and moving inland, we find the sub-regions described in Table 1 and located in Fig. 2a. These zones allow us to highlight different influences and processes on the atmosphere depending on the corresponding surface.
The area of interest for the marinada study can be schematically divided into three zones: a coastal zone near Torredembarra (“sea” and “coast” in Fig. 2a); an agricultural plain to the east of Lleida in the Ebro basin (“irrigated” and “dry” in Fig. 2a); and the CPR, which separates the two previous zones and runs on a southwest–northeast axis (“northwest slopes”, “Conca de Barberà” and “Alt Camp” in Fig. 2a). The Conca de Barberà is an area at a lower altitude than the rest of the CPR, making it a privileged path for the wind. It is bordered to the northwest by the Serra del Tallat and to the southeast by the Serra de Miramar. The Serra del Tallat is a low mountain sub-range to the west of which the Ebro basin begins. The part of the Ebro basin studied here is called the Segre sub-basin and corresponds to the areas designated as “northwest slopes”, “dry” and “irrigated” in Table 1 and Fig. 2a.
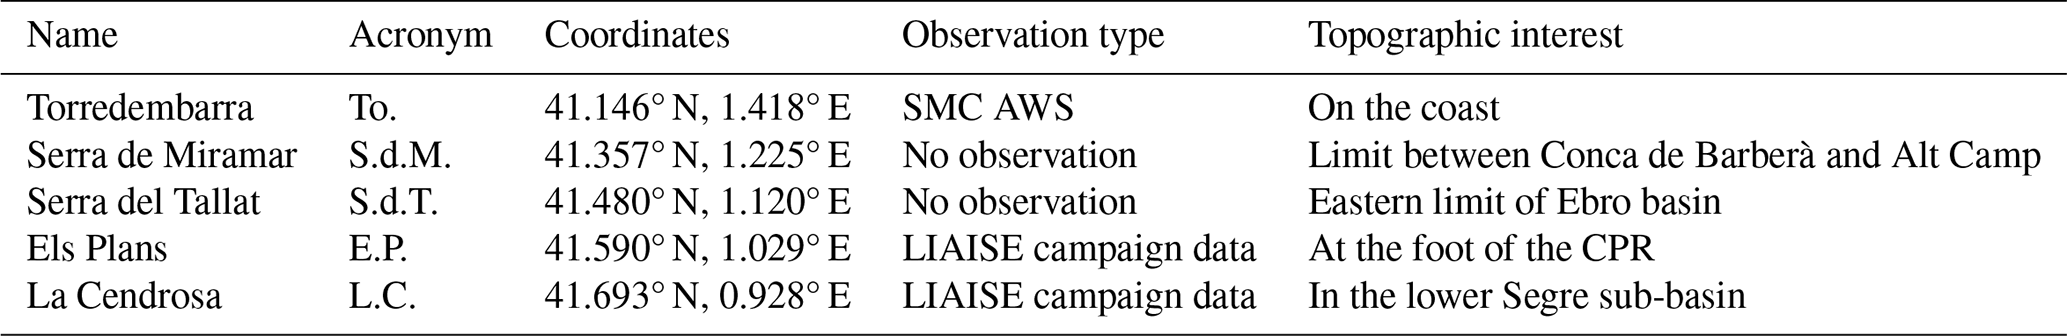
To describe the evolution of the marinada across these sub-regions, a transect going from the sea to the Segre sub-basin is also used. The chosen transect passes through five points of interest, from the sea to the Ebro basin: Torredembarra, Serra de Miramar, Serra del Tallat, Els Plans and La Cendrosa. These points of interest are also shown in Fig. 2 and are summarized in Table 2. These sites correspond to key locations for characterizing the marinada. Specifically, La Cendrosa and Els Plans sites are reference sites in the irrigated and dry areas, respectively, with a 50 m mast and radiosoundings at each.
Table 2Points of interest along the Torredembarra–La Cendrosa transect. The La Cendrosa and Els Plans sites had other in situ instruments for studying the surface, which are not of interest for the marinada study.
2.3 Weather situation of the two case study days
In this case, two study days are considered: 16 and 21 July 2021. These 2 d correspond to two synoptic weather situations common in summer in this part of Catalonia, and marinada was present on both of these days, as shown in Jiménez et al. (2023). Table 3 summarizes the weather situations of the 2 d studied.
The 16th represents a case of northwesterly flow in the Ebro valley. At 500 hPa, a ridge of high pressure stretches between Spain and England, while a low-pressure system settles over Switzerland. This creates a north-northwest wind at 500 hPa over Catalonia. At the surface, the wind is channeled into the Ebro basin, giving it a westerly component in the lower layers over the study region. This type of westerly wind situation is very common in the Ebro valley in summer (Capel Molina, 1999; Martínez et al., 2008), and the cierzo is a special case of these westerly winds (Ortega et al., 2022).
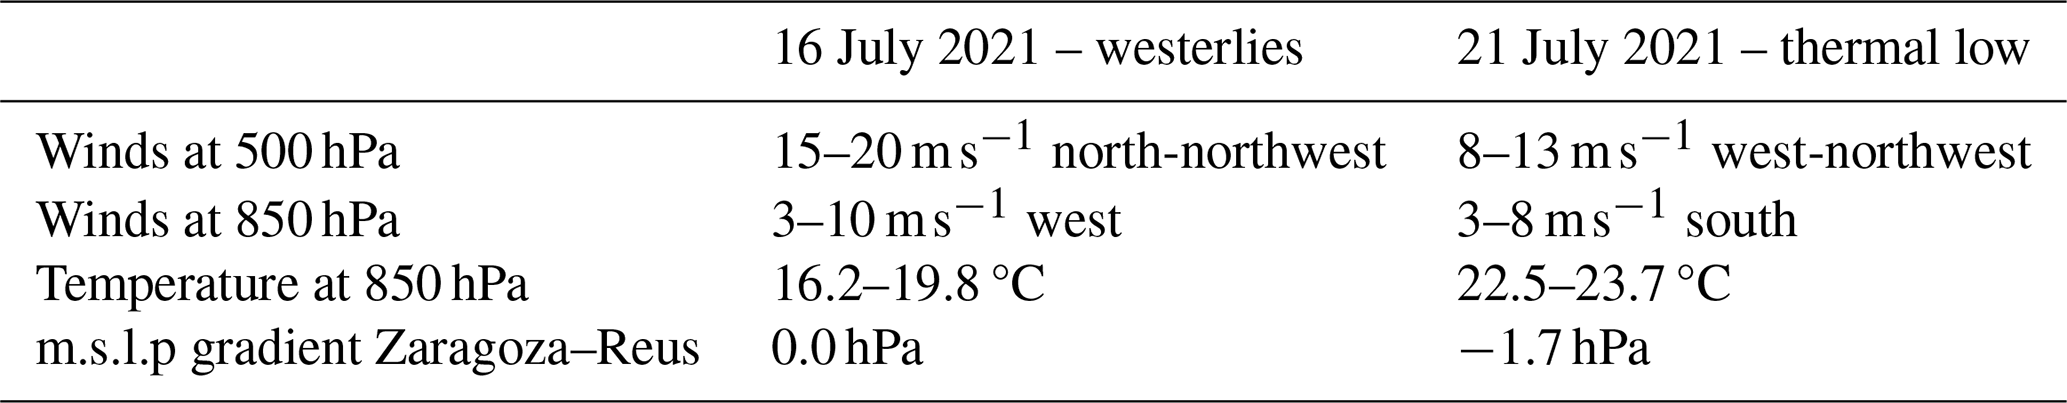
Table 3Weather situation of the two case study days. Winds and temperatures data are obtained from the Meso-NH runs for the grid point located over Lleida. The mean sea level pressure (m.s.l.p) gradient between Zaragoza and Reus is obtained from the AWSs of the respective airports. Wind speed and temperature ranges are based on 12:00 and 18:00 UTC.
The day of the 21st corresponds to a thermal low over the Iberian Peninsula (Hoinka and De Castro, 2003). At 500 hPa, the high- and low-pressure centers are quite far apart, and a flow of about 10 m s−1 blows in from the northwest. In the lower layers, the warming of the Ebro valley induces a mean sea-level pressure gradient of −1.7 hPa between Zaragoza and Reus, respectively in the central Ebro basin and on the coast, as described in Jiménez et al. (2023) and Tudurí et al. (2003). This pressure gradient facilitates the existence of a southeasterly flow, which is then largely influenced by other diurnal mesoscale winds in the lower layers. Over the central part of the Iberian Peninsula a thermal low develops, leading to southerly flow in eastern Spain and reinforcing the southeasterly flow in the Ebro valley. This type of weather situation is rarer than westerly winds but is also common in summer in the region of interest (Favà et al., 2019; Jiménez et al., 2023). At 850 hPa, winds over the Ebro River blow from the southeast, but over the Catalan coast the wind blows from the southwest. The Segre sub-basin is located between these two flows, and the 850 hPa wind is weak, varying from southeast to southwest during the day.
The present study details in depth the marinada dynamics for 16 July and then highlights the main differences with the 21 July.
2.4 Model setup
2.4.1 Overview of the surface–atmosphere coupled model
To complement the above-mentioned observational data, a coupled surface–atmosphere limited-area model is used to delve into the processes at play during marinada formation. The atmospheric model is Meso-NH v5.5.1 (Lac et al., 2018) and is coupled to the SURFEX v8.1 surface model (Masson et al., 2013). This model has already been used and shown to be satisfactory for coupled mesoscale simulations in the study area (Lunel et al., 2024). The model is run with a horizontal resolution of 2 km × 2 km and covers the entire Ebro basin as well as the Pyrenees. The domain is shown in Fig. 1. Since irrigation is not represented in the atmospheric analyses used for initialization, but it is added to the current model, a 2-week spin-up period is run in order to cool down and humidify the air in the Ebro basin. After the spin-up, from 14 to 22 July, the model runs are continuous for each distinct irrigation parameterization detailed in Sect. 2.4.2. The time step of the model is 3 s in order to respect the Courant–Friedrichs–Lewy condition (Courant et al., 1956) between vertical layers in the convective updrafts.
The Meso-NH atmospheric model has 88 vertical layers from 0 to 16 000 , with a tighter mesh near the ground and a stretched mesh at higher altitudes. The first level is at 2 and the lowest 60 levels are below 2000 m, allowing fine simulation of the ABL. The atmosphere is initialized every 6 h and then forced to its boundaries by analyses from the European Centre for Medium-Range Weather Forecasts (ECMWF) model. The turbulence is calculated using a 1D scheme (Cuxart et al., 2000) and the mixing length of Bougeault and Lacarrère (1989). The eddy-diffusivity Kain–Fritsch parameterization is used for shallow convection (Pergaud et al., 2009). The radiation model employed in this study is a composite model that combines the Morcrette (1991) scheme for shortwave fluxes and the Mlawer et al. (1997) scheme for longwave fluxes. This radiation model is run at 5 min intervals to ensure a gradual temporal evolution of incident radiation throughout the course of the day. The aerosol content within the model is calibrated to replicate the characteristics of a semi-arid region, with an optical aerosol thickness set at 0.2.
The surface model SURFEX is a collaborative software package that is currently being maintained and further developed at CNRM (Centre National de Recherches Météorologiques) and LAERO (Laboratoire d'Aérologie), in partnership with other international collaborators from the ACCORD consortium (A Consortium for COnvection-scale modelling Research and Development – http://www.umr-cnrm.fr/accord/, last access: 2 July 2024), who contribute to its enhancements (Masson et al., 2013). SURFEX offers a variety of model options tailored to different surface types. The four main surface types in SURFEX are seas, lakes, urban areas and natural land. Each of them calls a different model. In this particular study, we employ straightforward parameterizations to model the sea and the lakes. These parameterizations utilize prescribed sea surface temperatures sourced from the forcing files and a roughness length determined by the Charnock formula (Charnock, 1955). Urban areas, though relatively sparse in the region under consideration, are modeled using the town energy balance (TEB) approach as described by Masson (2000). The predominant land cover type in the region of interest consists of natural land. This natural land is sub-classified into 12 plant functional types, allowing a separate representation for different land surface types, from bare soil to forest. To model these different functional types the Interaction Soil–Biosphere–Atmosphere (ISBA) model is used (Noilhan and Planton, 1989; Noilhan and Mahfouf, 1996). ISBA is configured with 14 vertical soil layers, with the deepest being 12 m below the surface. Soil characteristics are derived using a pedotransfer function (Cosby et al., 1984), which relies on soil texture information obtained from the database of Nachtergaele et al. (2010). Water and heat transfer are then simulated using a diffusive approach, allowing for the direct application of Fourier and Darcy laws as described by Decharme et al. (2011). The land-use classifications are derived from the Ecoclimap-II database (Faroux et al., 2013), which is based on satellite data spanning the period from 1999 to 2005. Leaf area index (LAI) and albedo values are also extracted from this database, providing typical values for the end of July. Surface roughness characteristics are similarly obtained from the land-use classes. Photosynthetic activity and its impact on transpiration are represented through the ISBA–A–gs model (Calvet et al., 1998).
2.4.2 Irrigation representation
In addition to these typical ISBA model parameters, ISBA is modified to represent irrigation. The importance of this representation in this particular area has been demonstrated by Lunel et al. (2024). The changes made to the model are twofold.
The first concerns the modification of the land surface characteristics in the irrigated zone. In Ecoclimap-II, each grid point corresponding to an irrigated area is identified and its surface characteristics are modified. In the irrigated grid point, the percentage of irrigated fields is set to 90 %, with the rest divided between rocks, grass, shrubs, trees and C3 crops. C3 crops are plants with a C3 pathway for photosynthesis, such as wheat and soybeans. Ecoclimap-II LAI values were found to be underestimated within the irrigated zone for the month of July when compared to direct satellite LAI data (not shown). To correct for this bias and make the surface feature more consistent with the satellite data, the LAI value is randomly set between 2 and 3 for each irrigated grid point. The randomness of the value makes it possible to maintain some heterogeneity in the zone. The LAI map is shown in Fig. 2b.
The second change concerns soil moisture. The modification of the soil moisture is only applied to the areas identified as irrigated in Ecoclimap-II. Here three different parameterizations are applied.
-
NOIRR. The first parameterization does not add water artificially. Irrigation is in this case only represented by the increase of LAI in the irrigated area. Soil moisture values are initialized using the ECMWF analysis at a 2 km resolution. Since the soil moisture is in this case very low, close to the wilting point, the modeled evapotranspiration is also low, and the turbulent heat fluxes from the surface to the atmosphere are similar to those of a non-irrigated area. This parameterization will therefore be referred to as NOIRR.
-
THOLD_IRR. The second parameterization for soil moisture represents the irrigation through a fixed amount of water added when the soil moisture reaches a given threshold. The threshold is based on the soil water index (SWI) weighted by the root fraction (WSWI) defined by Eqs. (1) and (2). When the WSWI goes below 0.5, irrigation is triggered.
where is the current volumetric soil moisture in layer i, is the volumetric soil moisture at wilting point, and is the volumetric soil moisture at field capacity, all in m3 m−3. RootFraci is the proportion of the plant roots present in layer i.
The water amount applied is 30 mm at each irrigation event. The soil moisture heterogeneity in the irrigated area on the morning of the 16th is obtained with a 15 d spin-up.
-
FC_IRR. The last parameterization maintains the soil moisture of each soil layer at field capacity throughout the simulation. This is achieved by hard-coding the soil moisture into the model rather than adding water through a physically meaningful process. The validity of such a parameterization is developed in Sect. 4.
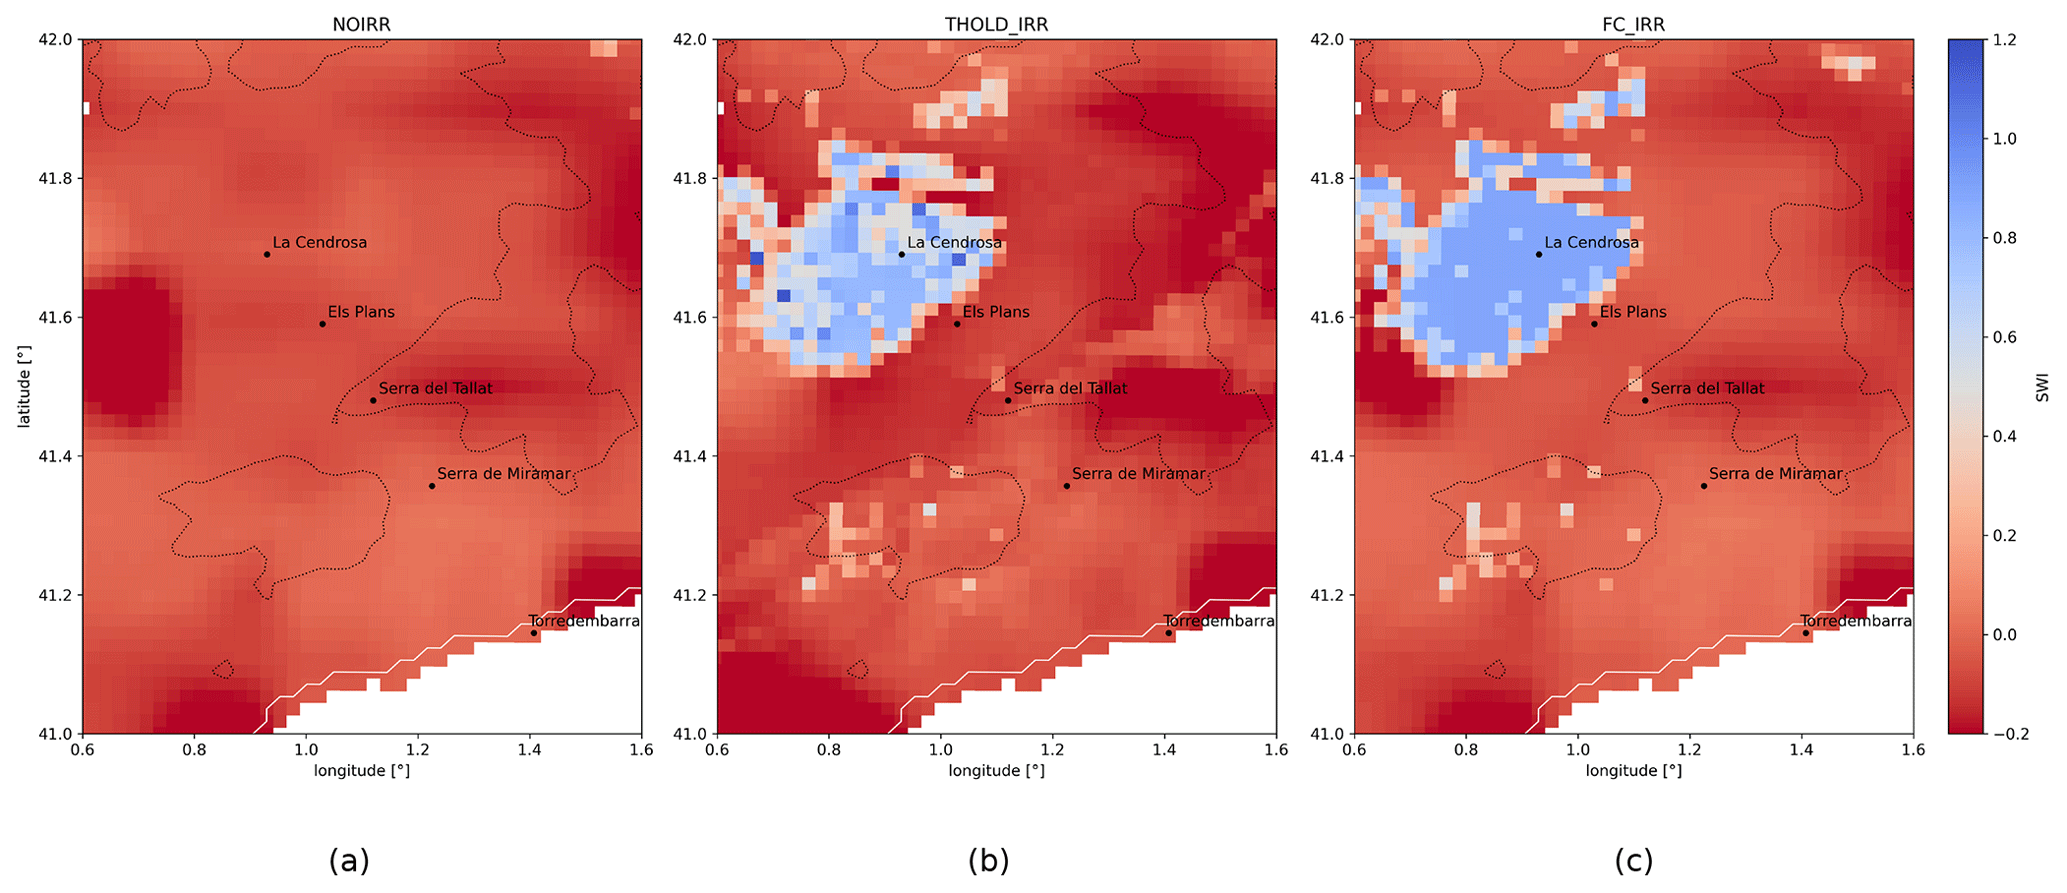
Figure 3Maps of soil wetness index (SWI) on the study area for the three different irrigation parameterizations on 16 July 2021, at 12:00 UTC. The dotted lines follow the 600 m elevation isoline.
Outside of the irrigated area, soil moisture values are initialized using the SWI values from the ECMWF analysis. The soil data from the ECMWF analysis have been shown to give good results when used with Meso-NH–SURFEX (Noual et al., 2023). By the morning of 16 July, simulated soil moisture levels are close to the wilting point across the rain-fed areas. The soil moisture maps resulting from each parameterization are shown in Fig. 3. The parameterization FC_IRR is used in Sect. 3.1 to 3.4, and the three parameterizations are compared and discussed in Sect. 3.5.
2.5 Hydraulic theory and Froude number
As stated in Sect. 1, the hydraulic theory can be used to analyze downslope winds. In particular the Froude number will be used in the following to identify and distinguish flow regimes.
The Froude number is the ratio of the flow kinetic energy to the external gravitational field. Depending on the field to which it is applied, different equations can be considered. In the present case, the definition used is that of Yu et al. (2005) and Heinemann (1999) and is given in Eq. (3).
where htop is the height of the top of the jet, Um is the mean wind speed in the layer below htop, θtop is the potential temperature at htop, θmy is the mean potential temperature below htop, and g is the gravitational acceleration.
To fit the present case, htop must be chosen to be above the temperature inversion cap of the downslope flow to account for stability due to potential temperature stratification. It must also be above the jet nose, i.e., the maximum wind speed in the jet. Finally, the following definition is retained, which allows these two conditions to be met in most cases: htop is the height above the jet where the wind speed is equal to 70 % of the jet's maximum wind speed. Using a lower percentage of the wind speed reduces the chances of finding an altitude that meets this definition, as the wind speed does not always decrease very much in the upper layer. On the other hand, using a higher percentage threshold does not allow the temperature inversion cap to be fully captured.
The value of the Froude number can be directly interpreted in terms of the flow regime.
-
Fr > 1 – supercritical regime. The fluid is driven only by gravity, is faster than the wave speed and is not affected by the downstream conditions.
-
Fr < 1 – subcritical regime. The fluid is driven by the downstream conditions, and the flow is slower, more turbulent and deeper.
The spatially rapid transition from supercritical to subcritical flow is accompanied by a so-called hydraulic jump. It corresponds to the conversion of kinetic energy into potential energy and turbulence and leads to a rise in the height of the flow.
The hydraulic analysis of the marinada is done in Sect. 3.3.
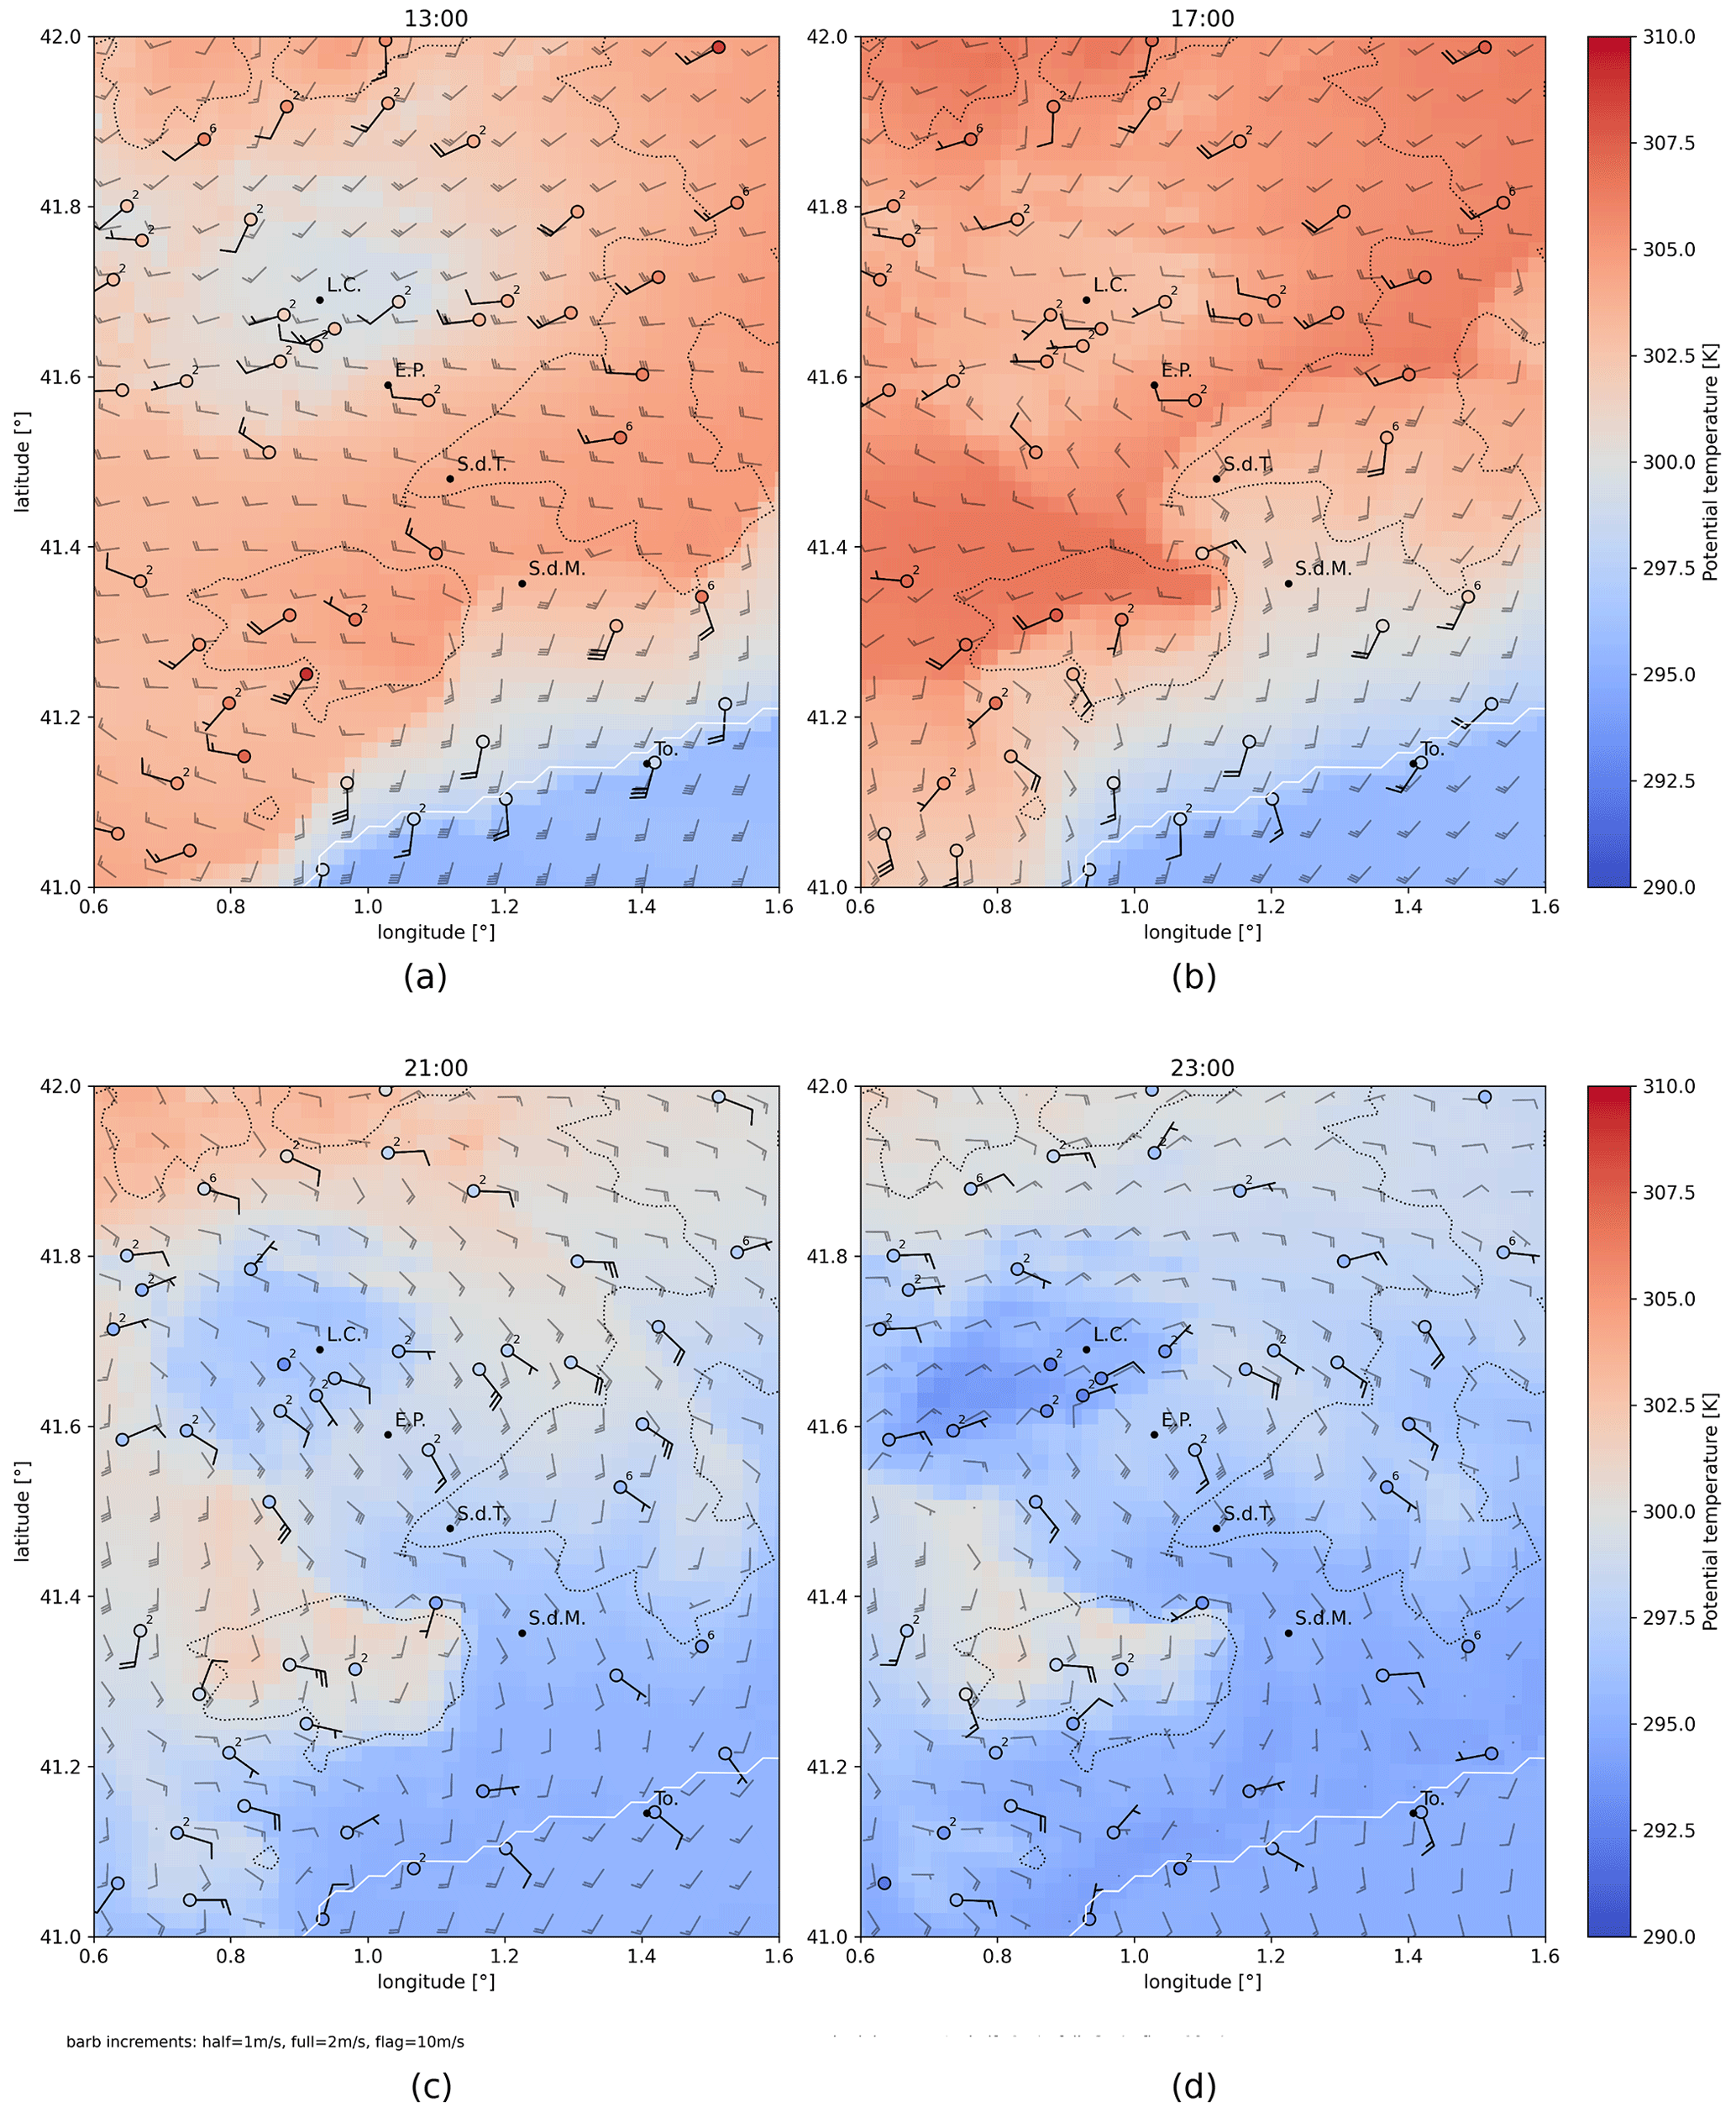
Figure 4Maps of observed and modeled potential temperature and wind along the course of 16 July 2021 for the four stages of the marinada. At 13:00 UTC is the sea breeze stage (a), at 17:00 UTC is the marinada onset (b), at 21:00 UTC is the mature marinada (c), and at 23:00 UTC is the marinada decay (d). The color map represents the potential temperature at 2 , and the semi-transparent wind barbs represent the 10 wind speed modeled by Meso-NH. The observations are taken from the SMC network and are shown with opaque barbs and colored points. For each station the color inside the circle represents the potential temperature measured on the same scale as for the model color map. The measured winds are shown at the available measuring height. When this measuring height is not 10 m, the actual height is indicated as a subscript. The thin dotted line represents the iso-altitude line at 600 m. The white line is the coastline. The acronyms L.C., E.P., S.d.T., S.d.M., and To. stand, respectively, for La Cendrosa, Els Plans, Serra del Tallat, Serra de Miramar, and Torredembarra.
3.1 Spatial and temporal evolution of the marinada at the surface
The current study uses the SMC AWS observations to compare the spatiotemporal evolution of the model's wind, temperature and humidity variables at the surface with the observations. The 16 July 2021 is chosen to be studied first as it is the most common weather situation for the region. It is contrasted with a thermal-low situation in Sect. 3.4. According to the temporal evolution of the marinada, the day can be divided into four phases. These four phases are shown in Fig. 4 and in Appendices A2 and A3 and are classified as follows.
-
Sea breeze. This phase lasts from 08:00 to 16:00 UTC on 16 July 2021. During this period, a typical sea breeze develops. The sea breeze is characterized by a change in wind direction shortly after sunrise. Before sunrise the wind blows from the northwest along the coast, but between 08:00 and 12:00 UTC the wind turns progressively southerly at all AWSs along the coast (Appendix A2). In the afternoon, the surface wind turns southwesterly, like the Barcelona sea breeze (Redaño et al., 1991). This breeze is associated with the arrival of a cooler (Fig. 4a) and more humid air mass (Appendix A3).
The configuration of the slope in the Alt Camp sub-region is very likely to contribute to the acceleration of the wind inland through the upslope flow mechanism, as in the Valencian region studied by Miao et al. (2003). Meanwhile, the wind in the Segre sub-basin is west to southwest, corresponding to the upslope wind direction on this side of the CPR and the westerly conditions. The temperature increases continuously in this area. The boundary between the marine and continental air masses, i.e., the sea breeze front, gradually moves inland during the morning and early afternoon until it is over the CPR at 16:00 UTC. The wind speed at 10 is between 4 and 6 m s−1.
-
Marinada onset. Between 16:00 and 20:00 UTC the marine air mass carries on its progression into the Ebro basin as shown in Fig. 4b and Appendix A3. The marine air mass in the Ebro basin and the wind associated with it is called the marinada. The advance of the marinada front is associated with stronger winds than in stage 1. Temperature decreases and humidity increases rapidly behind the marinada front. The model reproduces the observed patterns, but with a slightly warmer and drier marine air mass. At this stage it can be seen that the orography plays a major role as an obstacle to the progression of the marine air. The marine air mass enters the Ebro basin preferentially over areas of low elevation. This study focuses on the entrance of the Conca de Barberà, where the marinada front is more easily distinguishable. A transect from Torredembarra to La Cendrosa is used later in this article to analyze the progression and behavior of the marine air mass. This transect also passes by Serra de Miramar, Serra del Tallat and Els Plans.
-
Mature marinada. From 20:00 to 22:00 UTC, the front is no longer distinguishable at the surface as seen in Fig. 4c. The fresh and moist marine air mass has reached the whole of the low Segre sub-basin. The temperature decrease during this phase corresponds to the normal radiative cooling of an evening transition, and the specific humidity remains constant. The wind over the Segre sub-basin is well established with an average south-southeasterly direction.
-
End of marinada. From 22:00 UTC, the wind over the irrigated area starts to veer east-northeast (Fig. 4d). This is the normal direction of a downslope wind coming from the northeastern part of the CPR towards the bottom of the basin. The effect of the marine air mass is less pronounced, and the winds that develop have the characteristics of katabatic flows that follow the local slopes. These local winds have already been described and studied in this region by Martínez et al. (2008) and Cuxart et al. (2012).
For each of the four phases, the model is well able to reproduce the observed patterns of near-surface temperature, humidity and wind. This makes it possible to rely on the models to study in detail the processes involved in the life cycle of the marinada.
3.2 Processes involved in the marinada event under the influence of westerlies (16 July 2021)
The simulation results are used in the following to investigate the physical mechanisms involved during the marinada in more detail. This section focuses on 16 July 2021, a day with westerly winds, i.e., the most common weather situation encountered in the region.
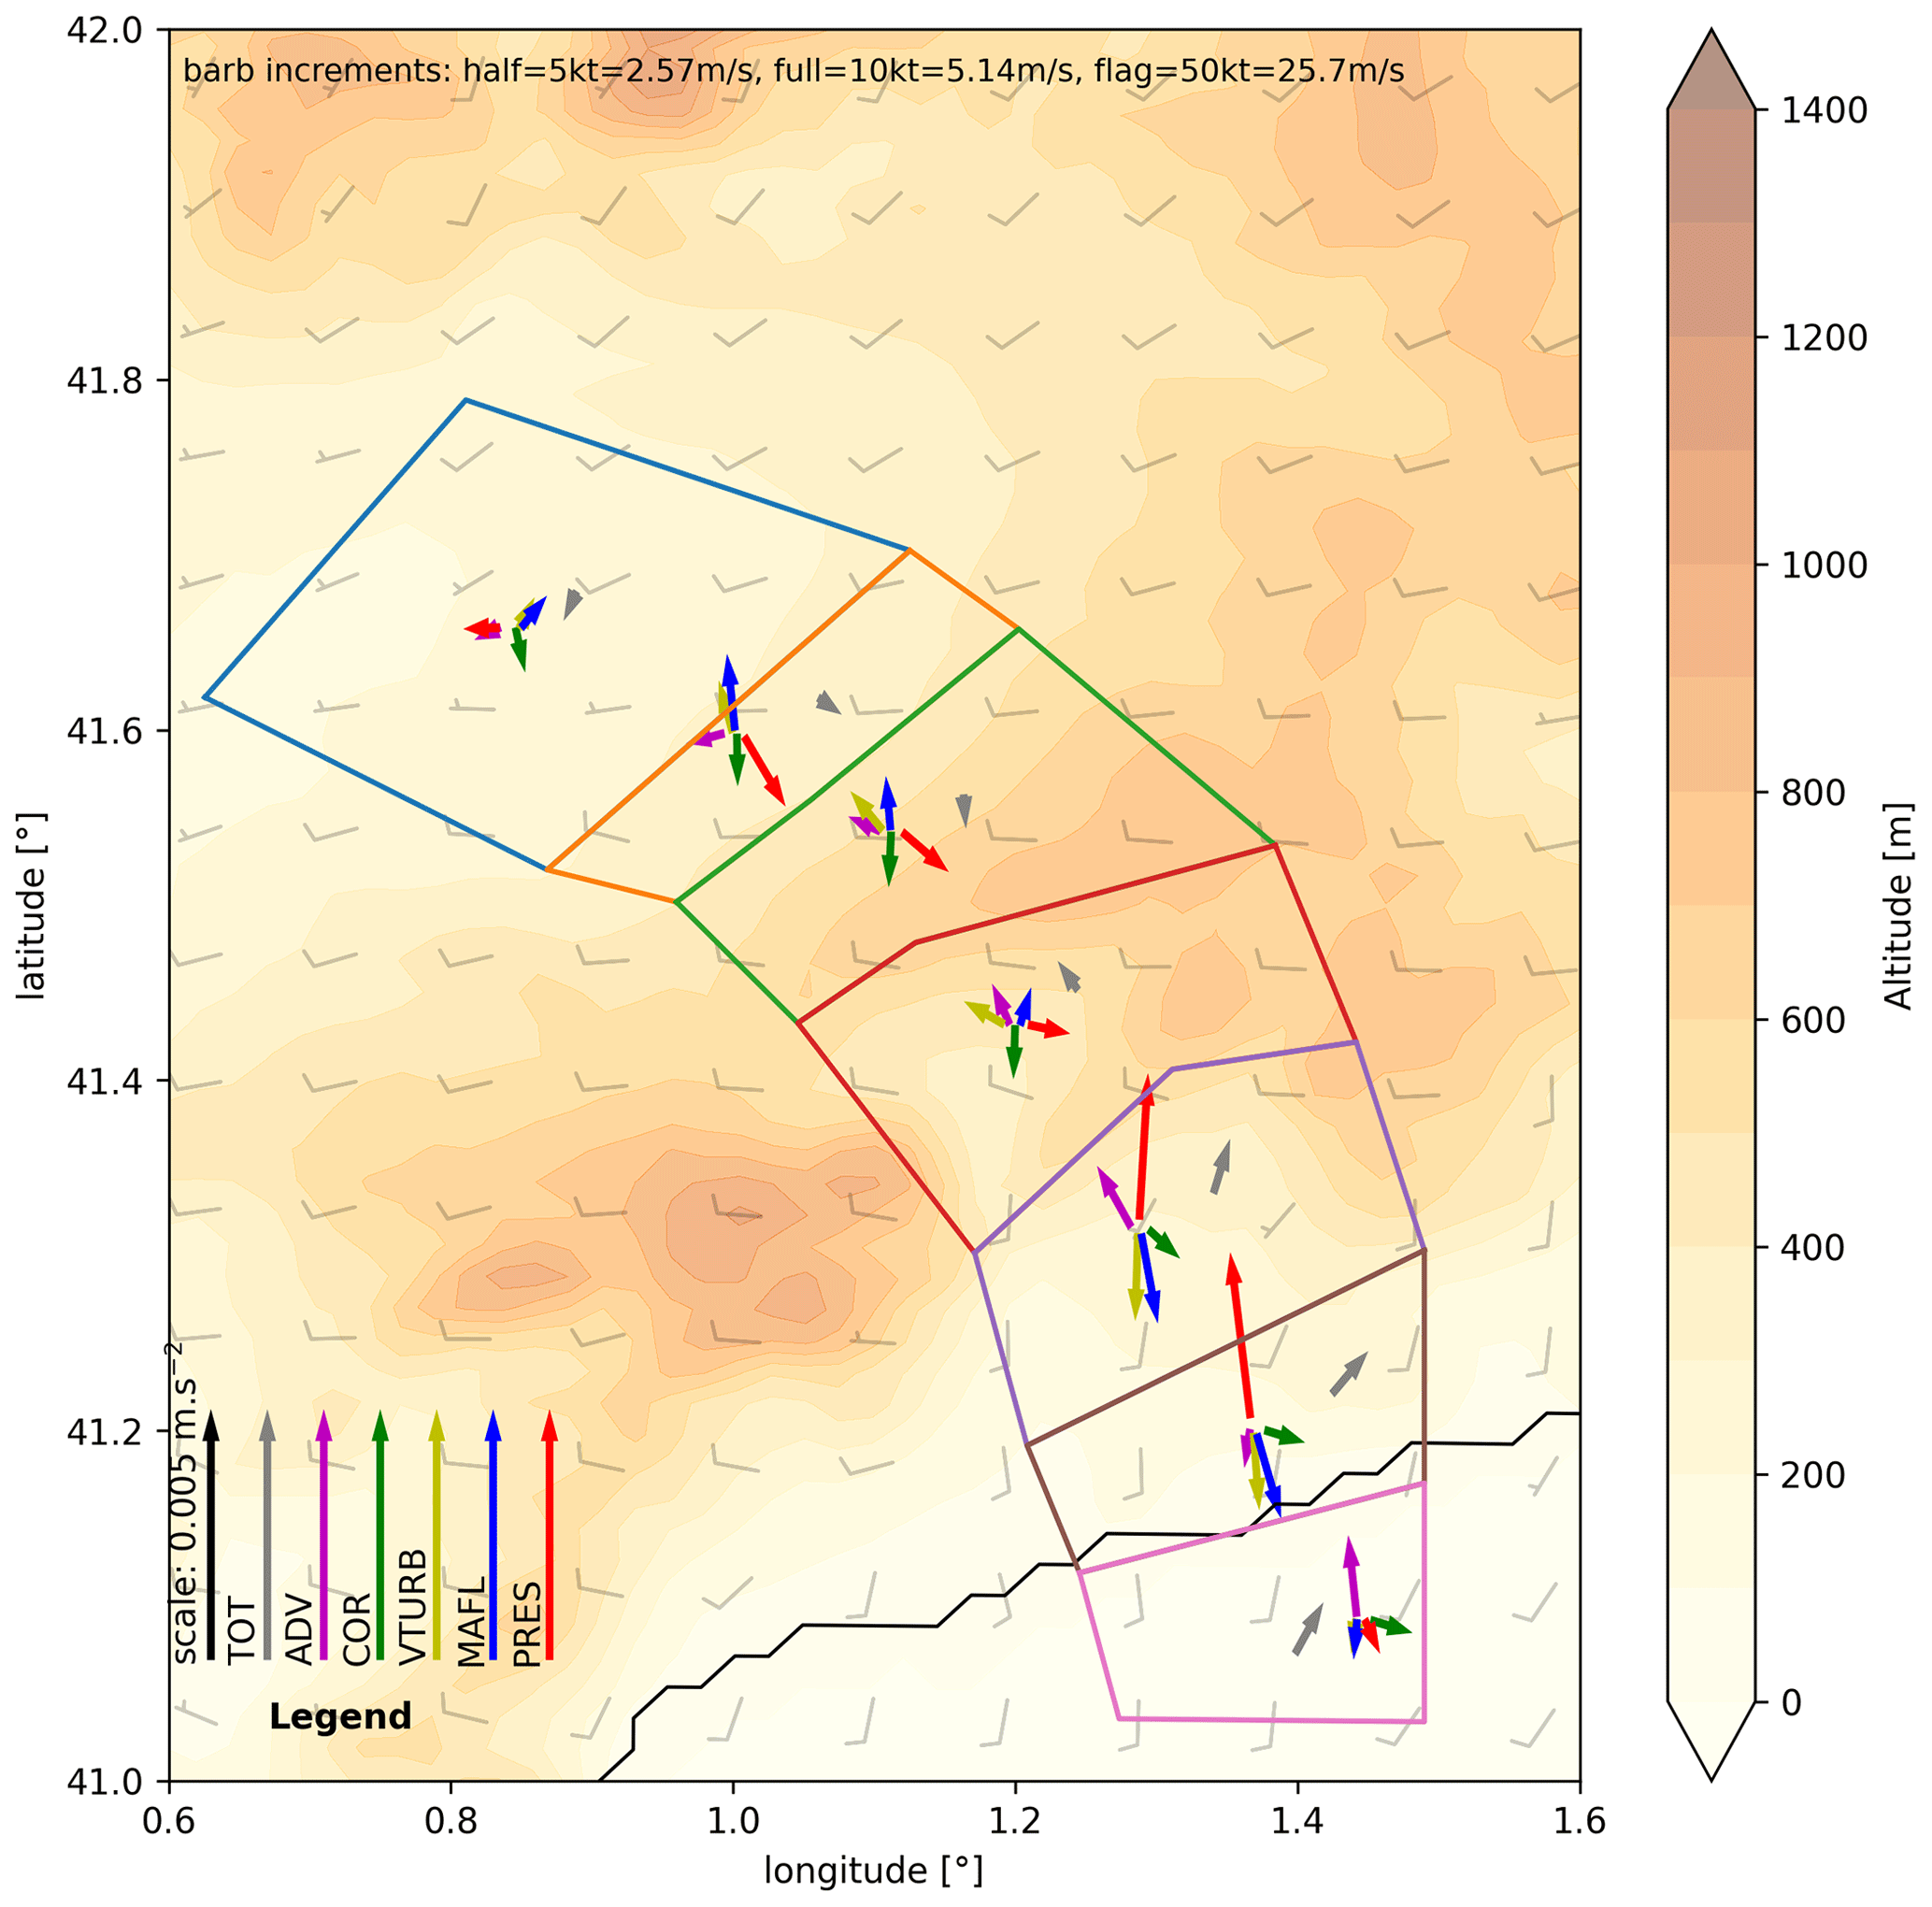
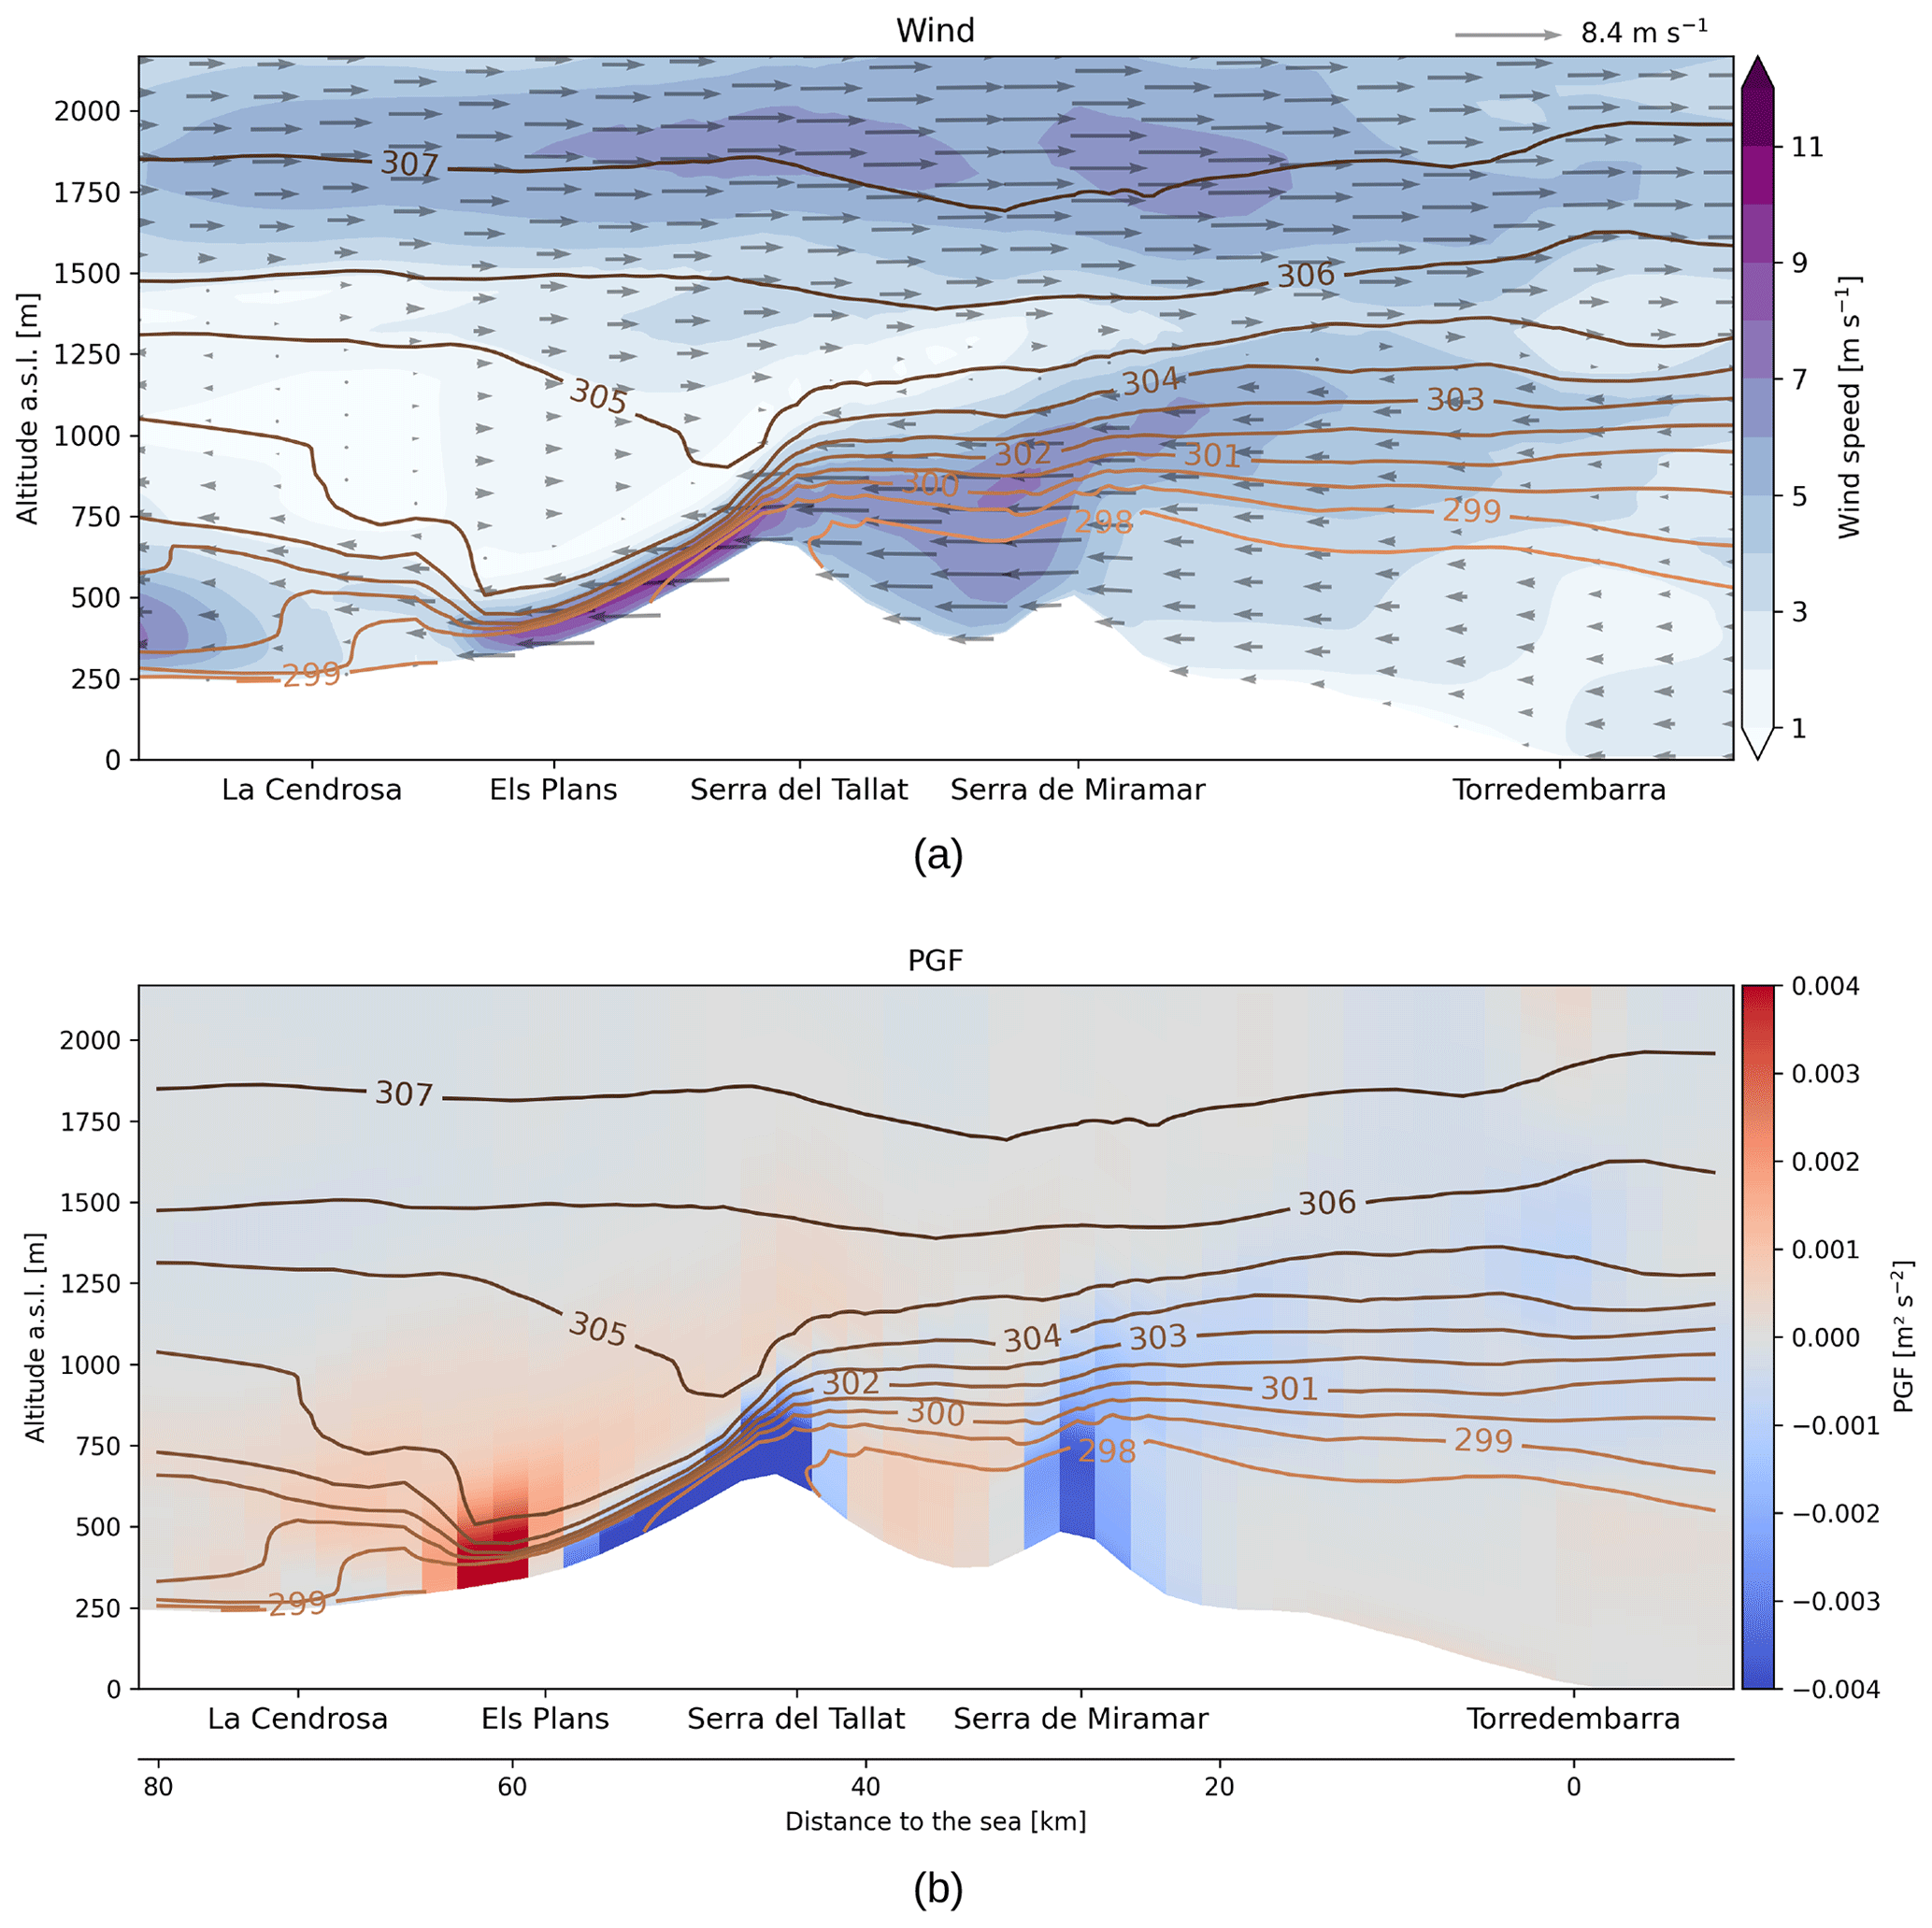
Figure 5Acceleration terms of horizontal winds for 16 July 2021, at 12:00 UTC. The arrows represent the acceleration term applied to the wind averaged between 50 and 300 and over the area of homogeneous features described in Table 1. The term's naming in the legend follows the naming system of Meso-NH: ADV, COR, VTURB, MAFL, and PRES correspond, respectively, to horizontal advection, Coriolis force, vertical turbulence, mass flux parameterization, and pressure gradient force (PGF). TOT stands for total and represents the total mean acceleration applied to the wind per area. Other terms not related to physical processes like numerical diffusion and relaxation are minor contributors and are omitted here. The semi-transparent wind barbs show the mean horizontal wind every three grid points and averaged between 50 and 300 The background color map represents the relief of the region.
3.2.1 The sea breeze phase (08:00–16:00 UTC)
During the first stage of the day, the marine air mass is progressively brought over the CPR. Since the model fairly reproduces the behavior observed, it can be used to explore in depth the processes at play during this first phase. To this end, the momentum source terms influencing the wind components, i.e., the acceleration terms, can be retrieved from the model. These acceleration terms are shown in Fig. 5 for 16 July 2021 at 12:00 UTC. These acceleration terms are averaged spatially according to the polygons defined in Fig. 2 and Table 1 and vertically between 50 and 300 This height range is selected in order to capture the acceleration terms in the well-mixed ABL. It allows us to evaluate the role of the different processes on the dynamics of the marine air mass. Figure 5 shows that the dominant acceleration term is the PGF, followed by the parameterizations for mass flux and vertical turbulence. By studying the value and direction of the PGF term, it is possible to highlight the main process at work in each sub-region.
Over the sea, advection dominates and the other terms are small. The sea acts as a provider of fresh and moist air to the lower layers of the atmosphere but does not significantly influence the wind.
On the coast and in Alt Camp, the PGF value is high, tends to accelerate the air inland and is the main process at play to explain the wind tendency. In the coastal area, the direction and intensity of the PGF are typical of the sea breezes in this region (Cuxart et al., 2014). It confirms that the marine air mass is first brought to land by a sea breeze. In Alt Camp, the PGF is also the main term at play and is directed uphill, towards the north. This is typical of the PGF of an upslope wind (Serafin and Zardi, 2010). This upslope acceleration is in the same direction as the sea breeze acceleration, so the two terms merge.
In Conca de Barberà, no term dominates the others, and the terms are globally low. The orientation of this valley is mainly on a southwest–northeast axis, orthogonal to the propagation of the marinada, so the valley slope winds are unlikely to influence the marinada.
On the northwest slopes and in the dry area, a medium PGF is oriented towards the southeast, opposing the marinada progression. This PGF is oriented upslope and is also orthogonal to the irrigated–dry land heterogeneity. As for the coast and Alt Camp areas, the PGF is a combination of the surface heterogeneity and the upslope acceleration. Contribution of irrigation in this PGF is actually explored and detailed below in Sect. 3.5.
The irrigated area behaves like the sea, with low acceleration terms. It acts as a provider of fresh and humid air for low atmospheric layers but does not significantly influence the wind.
It can be seen that the PGF terms are somewhat symmetrical in relation to the mountain range. The mass flux and vertical turbulence terms are systematically in the opposite direction to the PGF term. These two terms represent the vertical mixing of scalar and vector variables between layers of the atmosphere. Since the sea breeze has a maximum wind speed between 20 and 50 , which decreases with altitude in the ABL above, vertical mixing spreads the wind momentum upward and acts as a globally decelerating term between 50 and 300
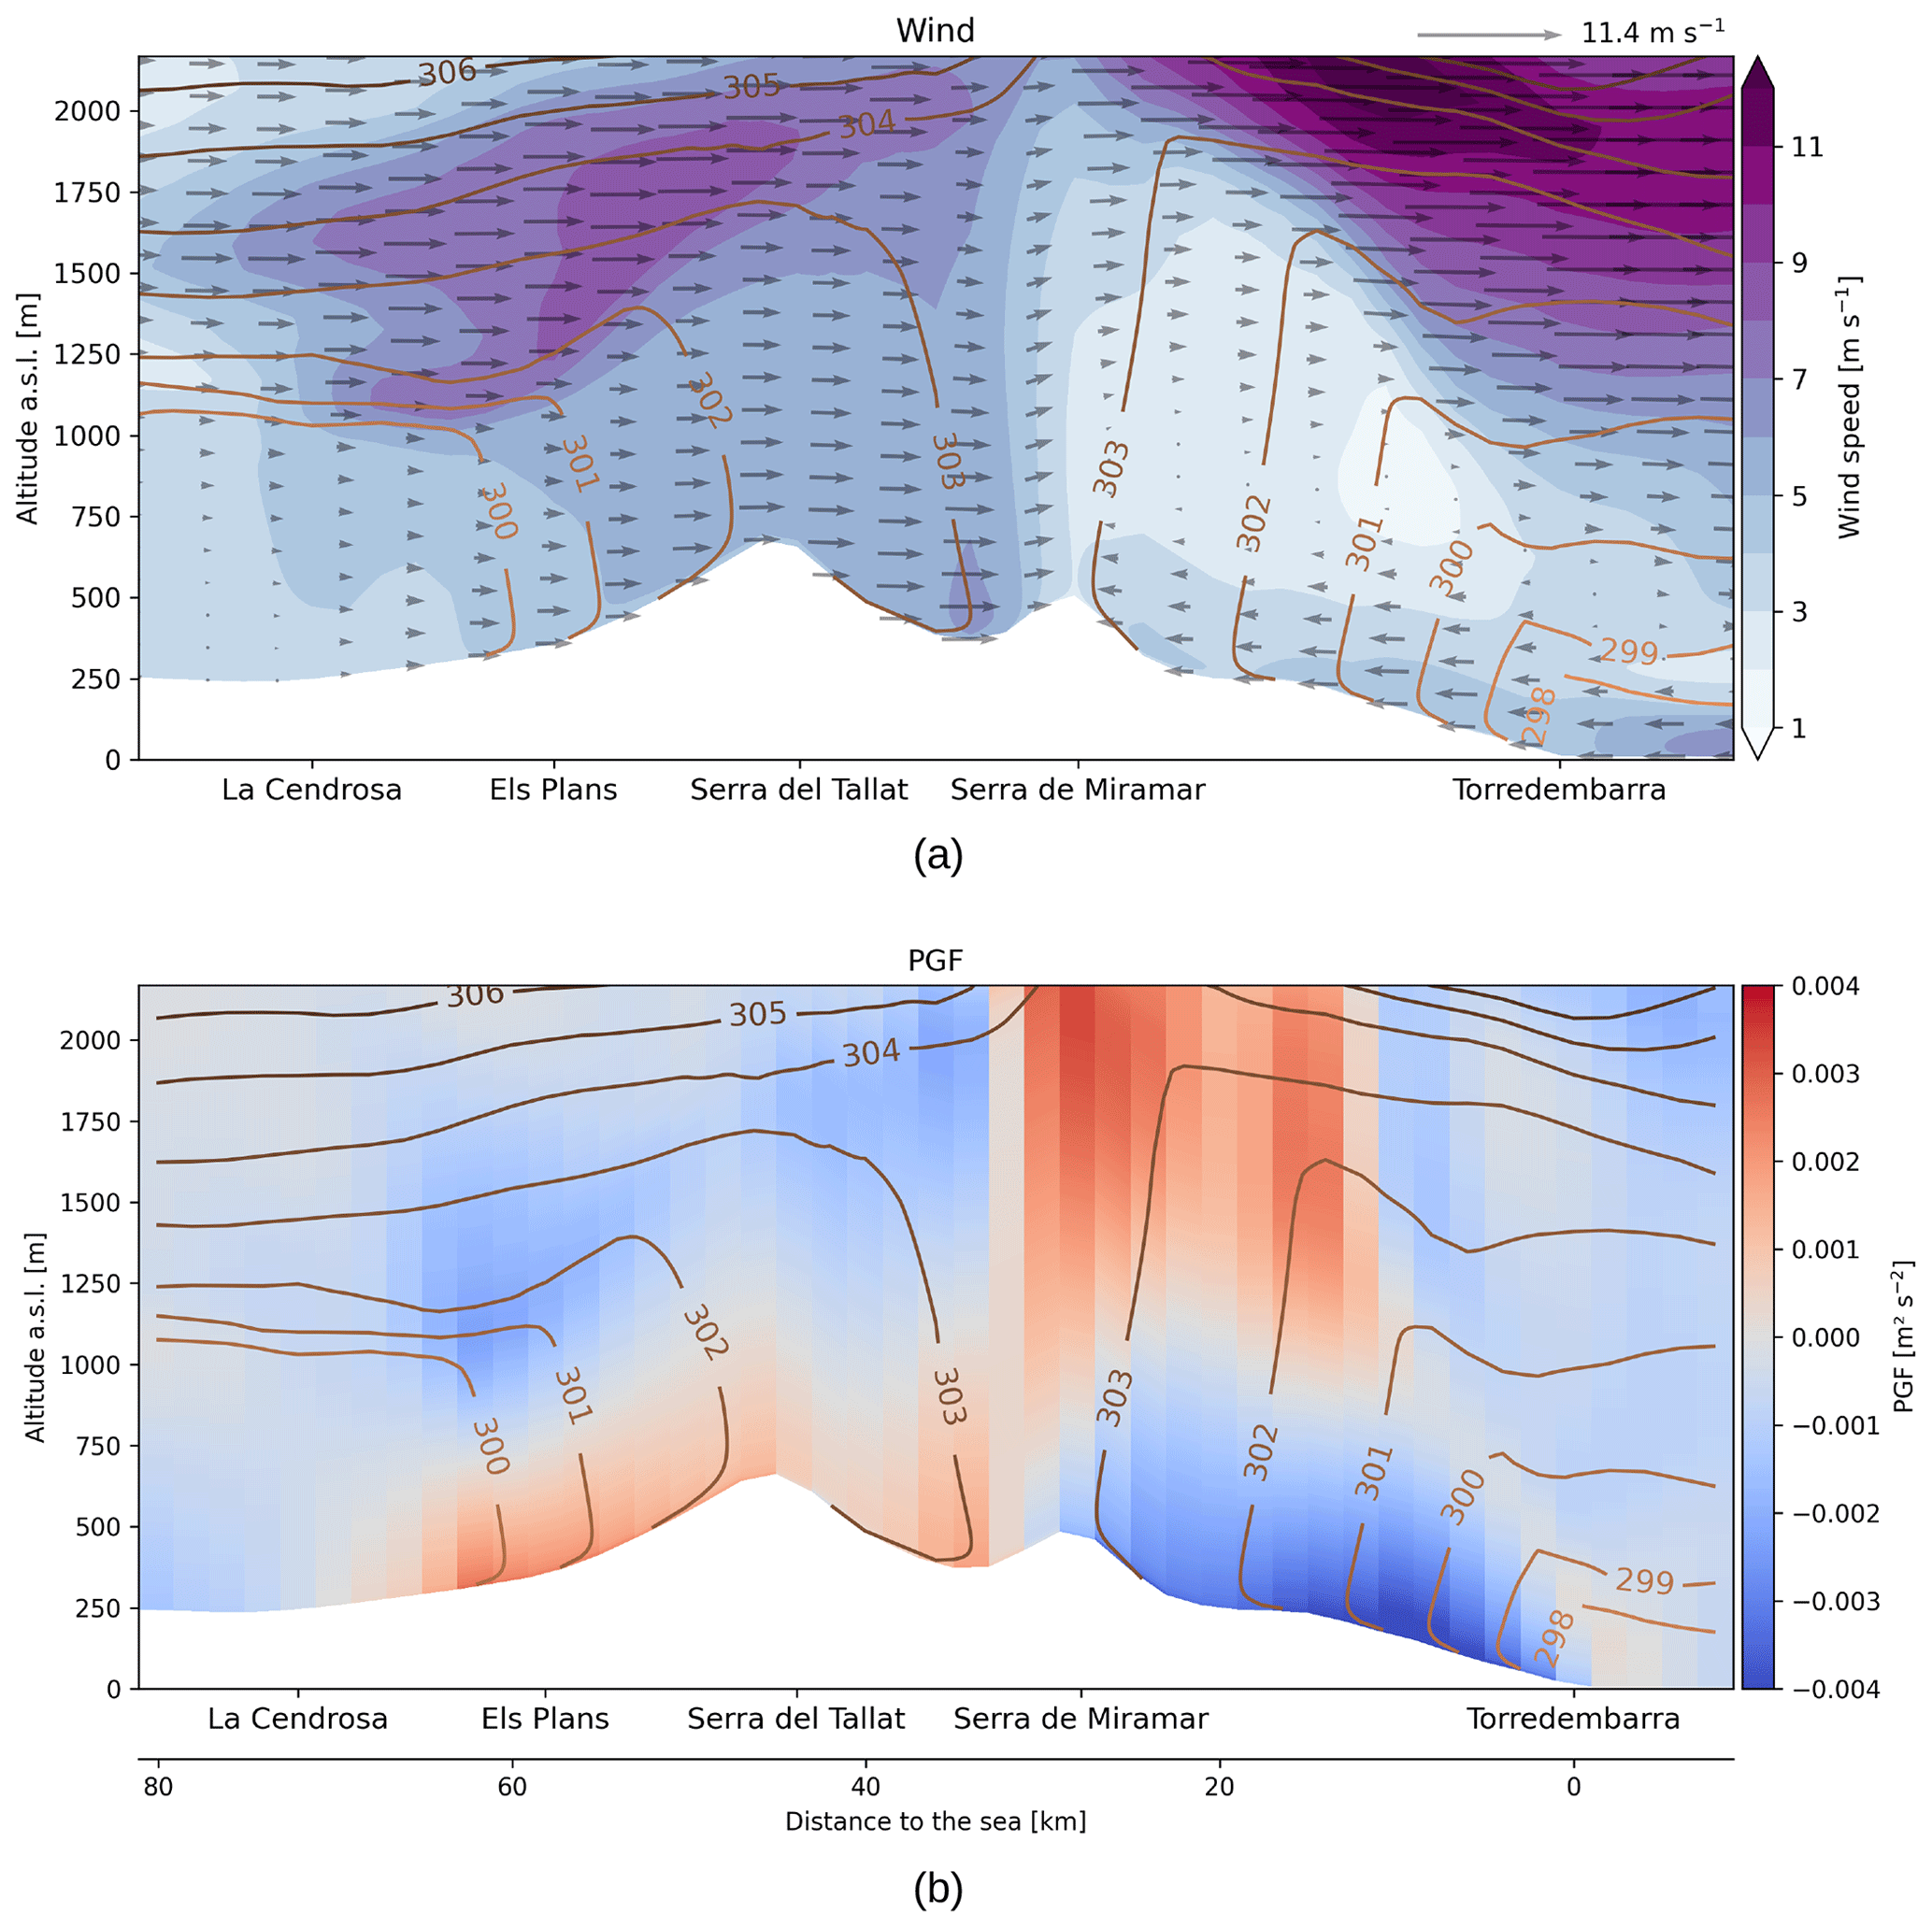
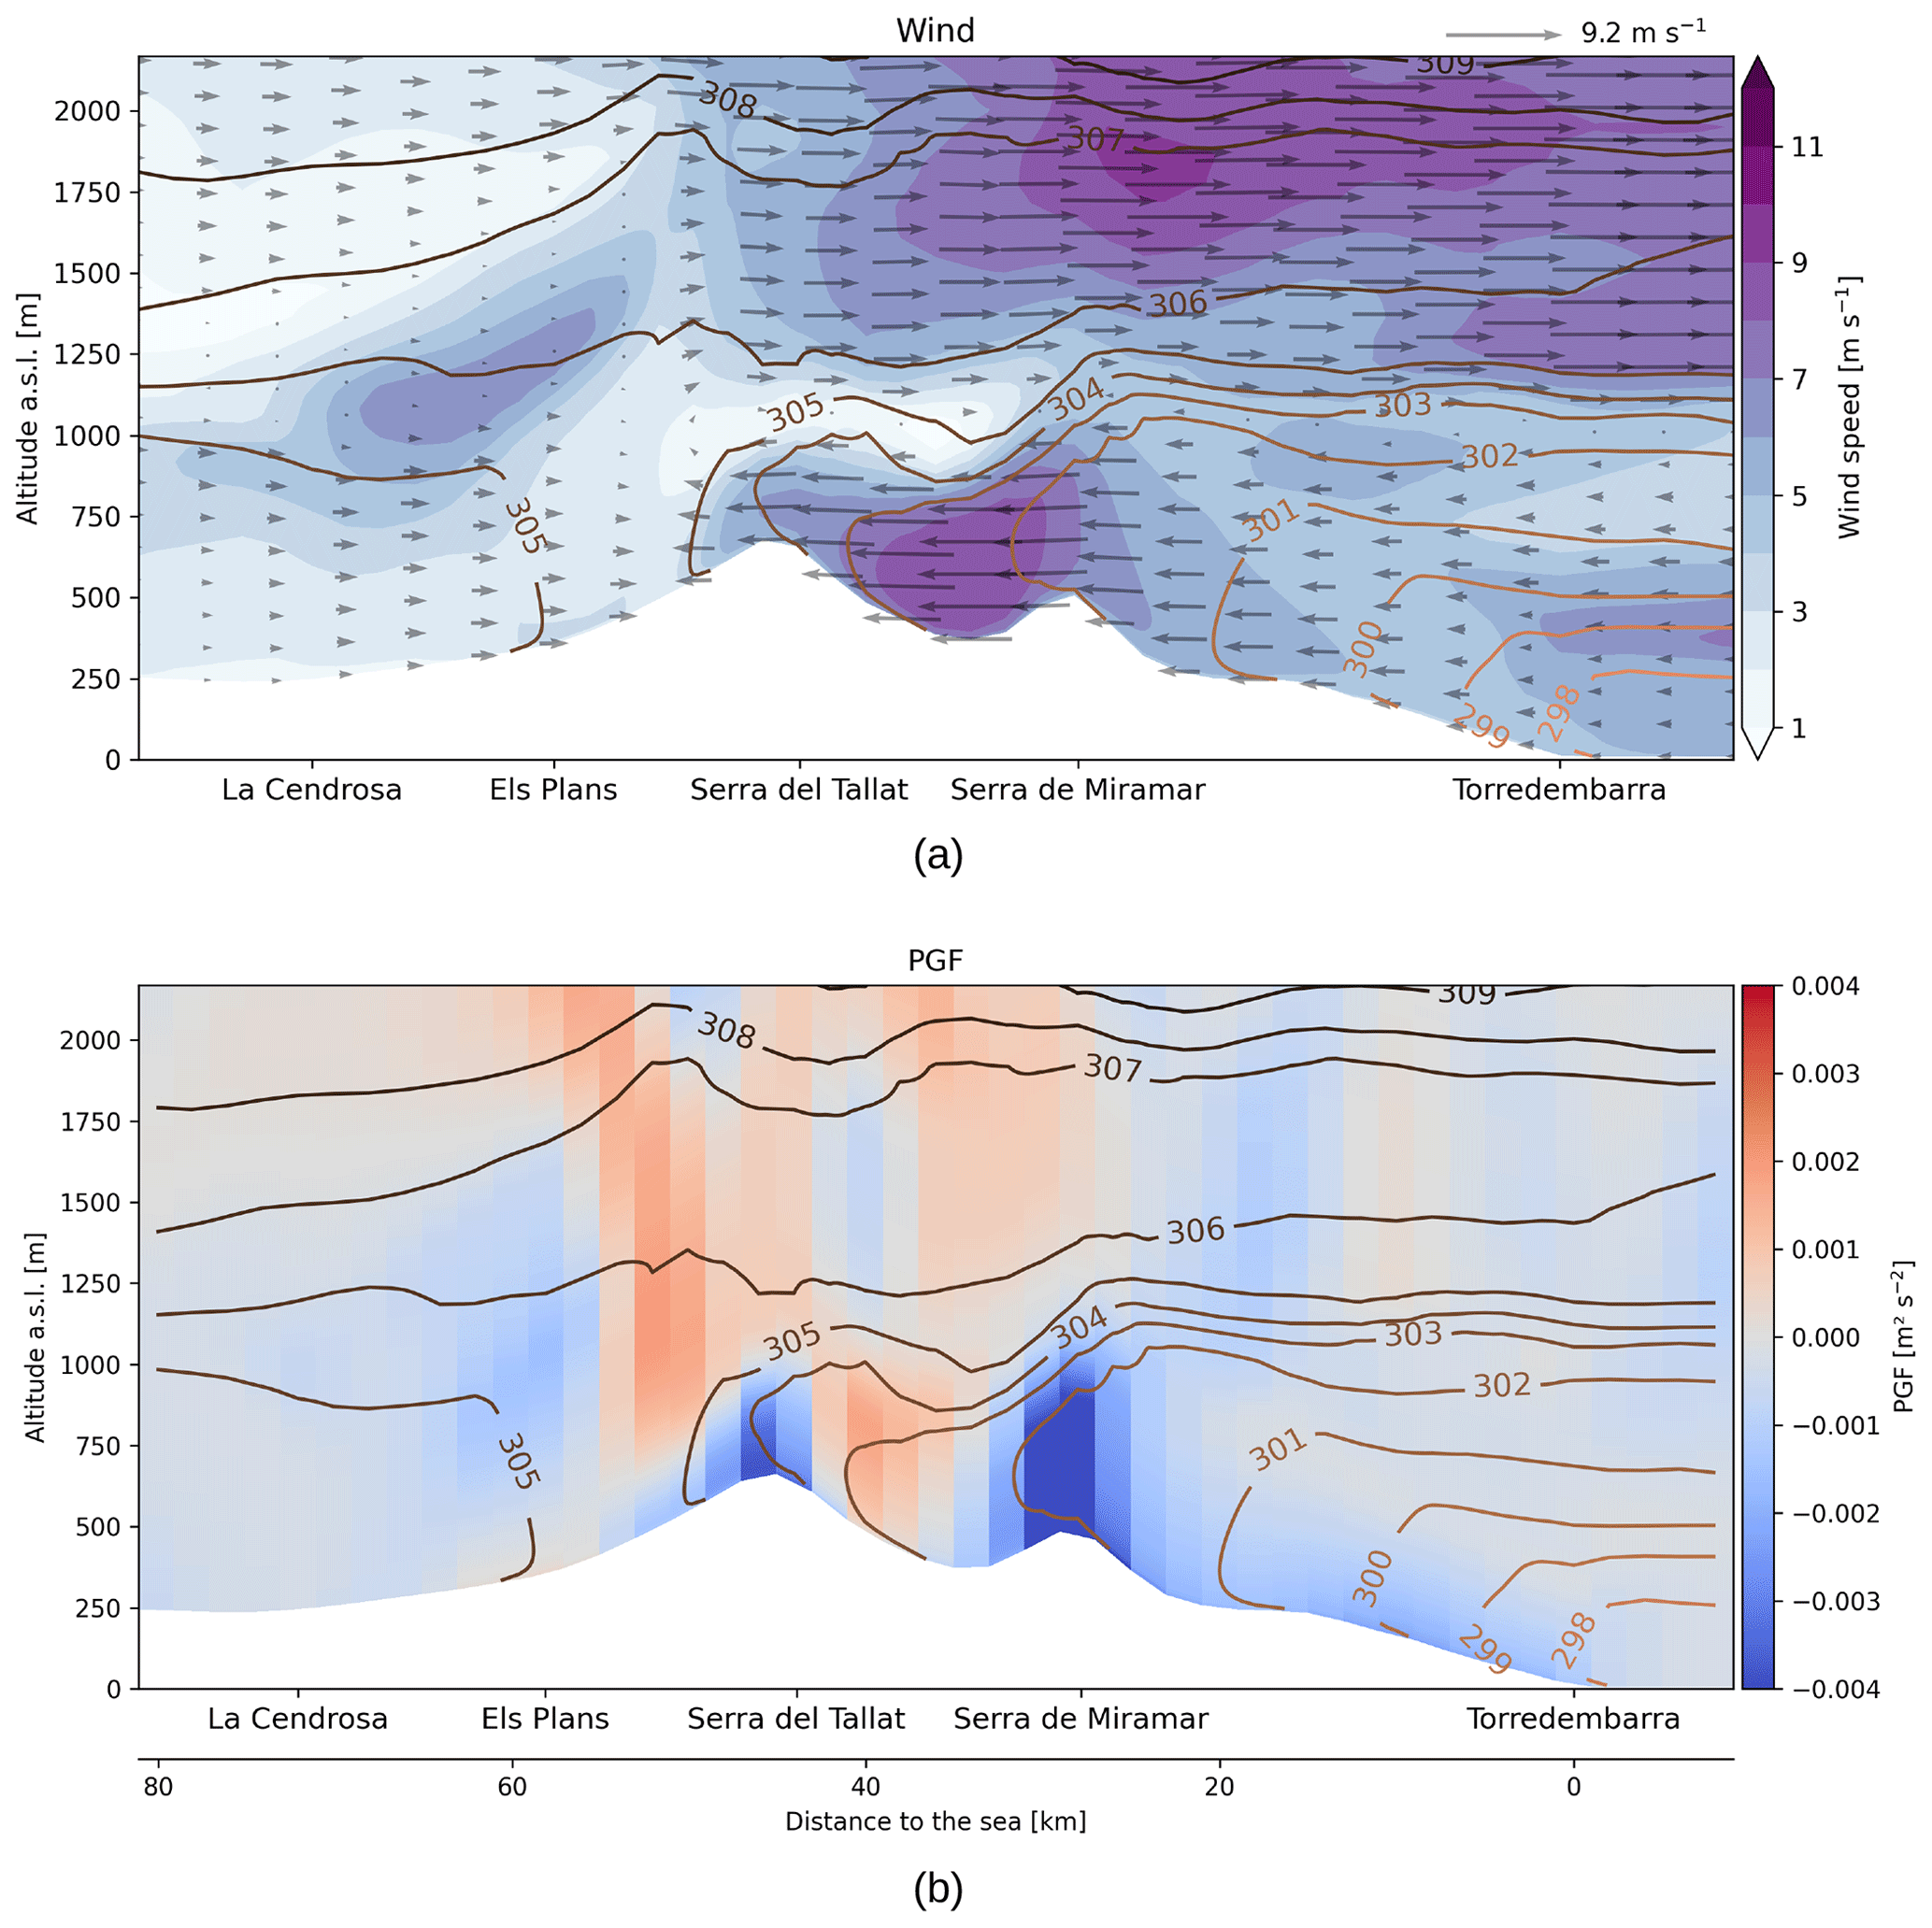
Figure 6Cross sections of horizontal pressure gradient force and wind speed on 16 July 2021, at 12:00 UTC. The color map of panel (a) represents the horizontal absolute wind speed, and the arrows represent the projection of the 3D wind into the plane of the cross section. The color map of panel (b) is the horizontal pressure gradient force projected into the plane of the cross section. The red color means that the acceleration is toward the right of the graph, i.e., the sea, and the blue color represents an acceleration towards the left of the graph, i.e., the Ebro basin. The isolines of the two graphs represent the virtual potential temperature in kelvin.
To investigate the vertical structure of the PGF and marine air mass, cross sections can be plotted along the transect La Cendrosa–Torredembarra as shown in Fig. 6. It shows that the marine air mass entering inland has properties of a sea breeze, with significant low level winds and a cooler potential temperature close to the shoreline (Torredembarra) than inland (Serra de Miramar). The PGF properties described above are found in Fig. 6 as well, with the symmetry in relation to the mountain range. The ABL top, characterized by the uniformity of potential temperature, is about 800 in the Ebro basin and reaches an altitude of 1500 m above Serra de Miramar. This high ABL top is facilitated by the wind convergence at the front of the marine air mass.
During the next hours of this first stage, the marine air mass carries on its progression over the CPR, helped by the sea breeze and by the upslope wind, until the front arrives at Serra del Tallat. From this moment on, the marinada begins.
3.2.2 The marinada onset (16:00–20:00 UTC)
The first phase brought the cold and humid marine air mass over the CPR. Although this air mass was heated by the surface as it moved inland, it is still cooler than the surrounding air, with a virtual potential temperature between 302 and 304 K over the CPR, as can be seen in Fig. 7. In the Ebro basin, the air has been heated throughout the day, and the virtual potential temperature at 17:00 UTC is higher, around 305 K. Since the density is inversely proportional to the virtual potential temperature, the marine air mass is also denser than the Ebro basin air mass.
The density gradient between the two air masses induces a pressure gradient, resulting in an acceleration towards the northwest. At 17:00 UTC, the acceleration actually takes place over Serra de Miramar and over Serra del Tallat, the boundaries of Conca de Barberà.
The first accelerates the wind into the Conca de Barberà. The acceleration brings the wind closer to the surface and thins the ABL to a depth of 500 m. This denser layer follows the terrain up the southeastern slopes of the Serra del Tallat, generating a counter-gradient in the middle of the Conca de Barberà (Fig. 7). However, this counter-gradient is weak compared to the PGF over Serra de Miramar and only slightly slows down the wind.
Secondly, the Serra del Tallat acts like the Serra de Miramar, further accelerating the wind towards the northwest, i.e., into the Ebro basin. The result is a downslope wind on the northwest side of the CPR. The main driver of this downslope wind is the PGF, which in this case is not due to surface cooling but to the higher density of the marine air mass. Therefore, this wind belongs to the category of fall winds, and this fall wind is called marinada.
Since the general wind is westerly before the arrival of the marinada, the boundary between the marinada and the Ebro basin air mass is clear. This boundary is referred to as the marinada front. The marinada propagates into the Ebro basin at a speed of about 1.5 to 3 m s−1 from 16:00 to 20:00 UTC (Appendix A2). The propagation of the front is relatively slow compared to the wind speed inside the marinada. This slow propagation is due to the counteracting westerly winds, which cause significant convergence at the marinada front and convert some of the near-surface horizontal momentum into vertical momentum in an updraft. The vertical wind speed in the frontal updraft at 500 ranges from 0.4 to 0.6 m s−1 between 16:00 and 18:00 UTC. By 20:00 UTC the marinada has reached the whole of the Segre sub-basin, i.e., the western part of the Ebro basin, and the marinada enters its third phase: the mature phase.
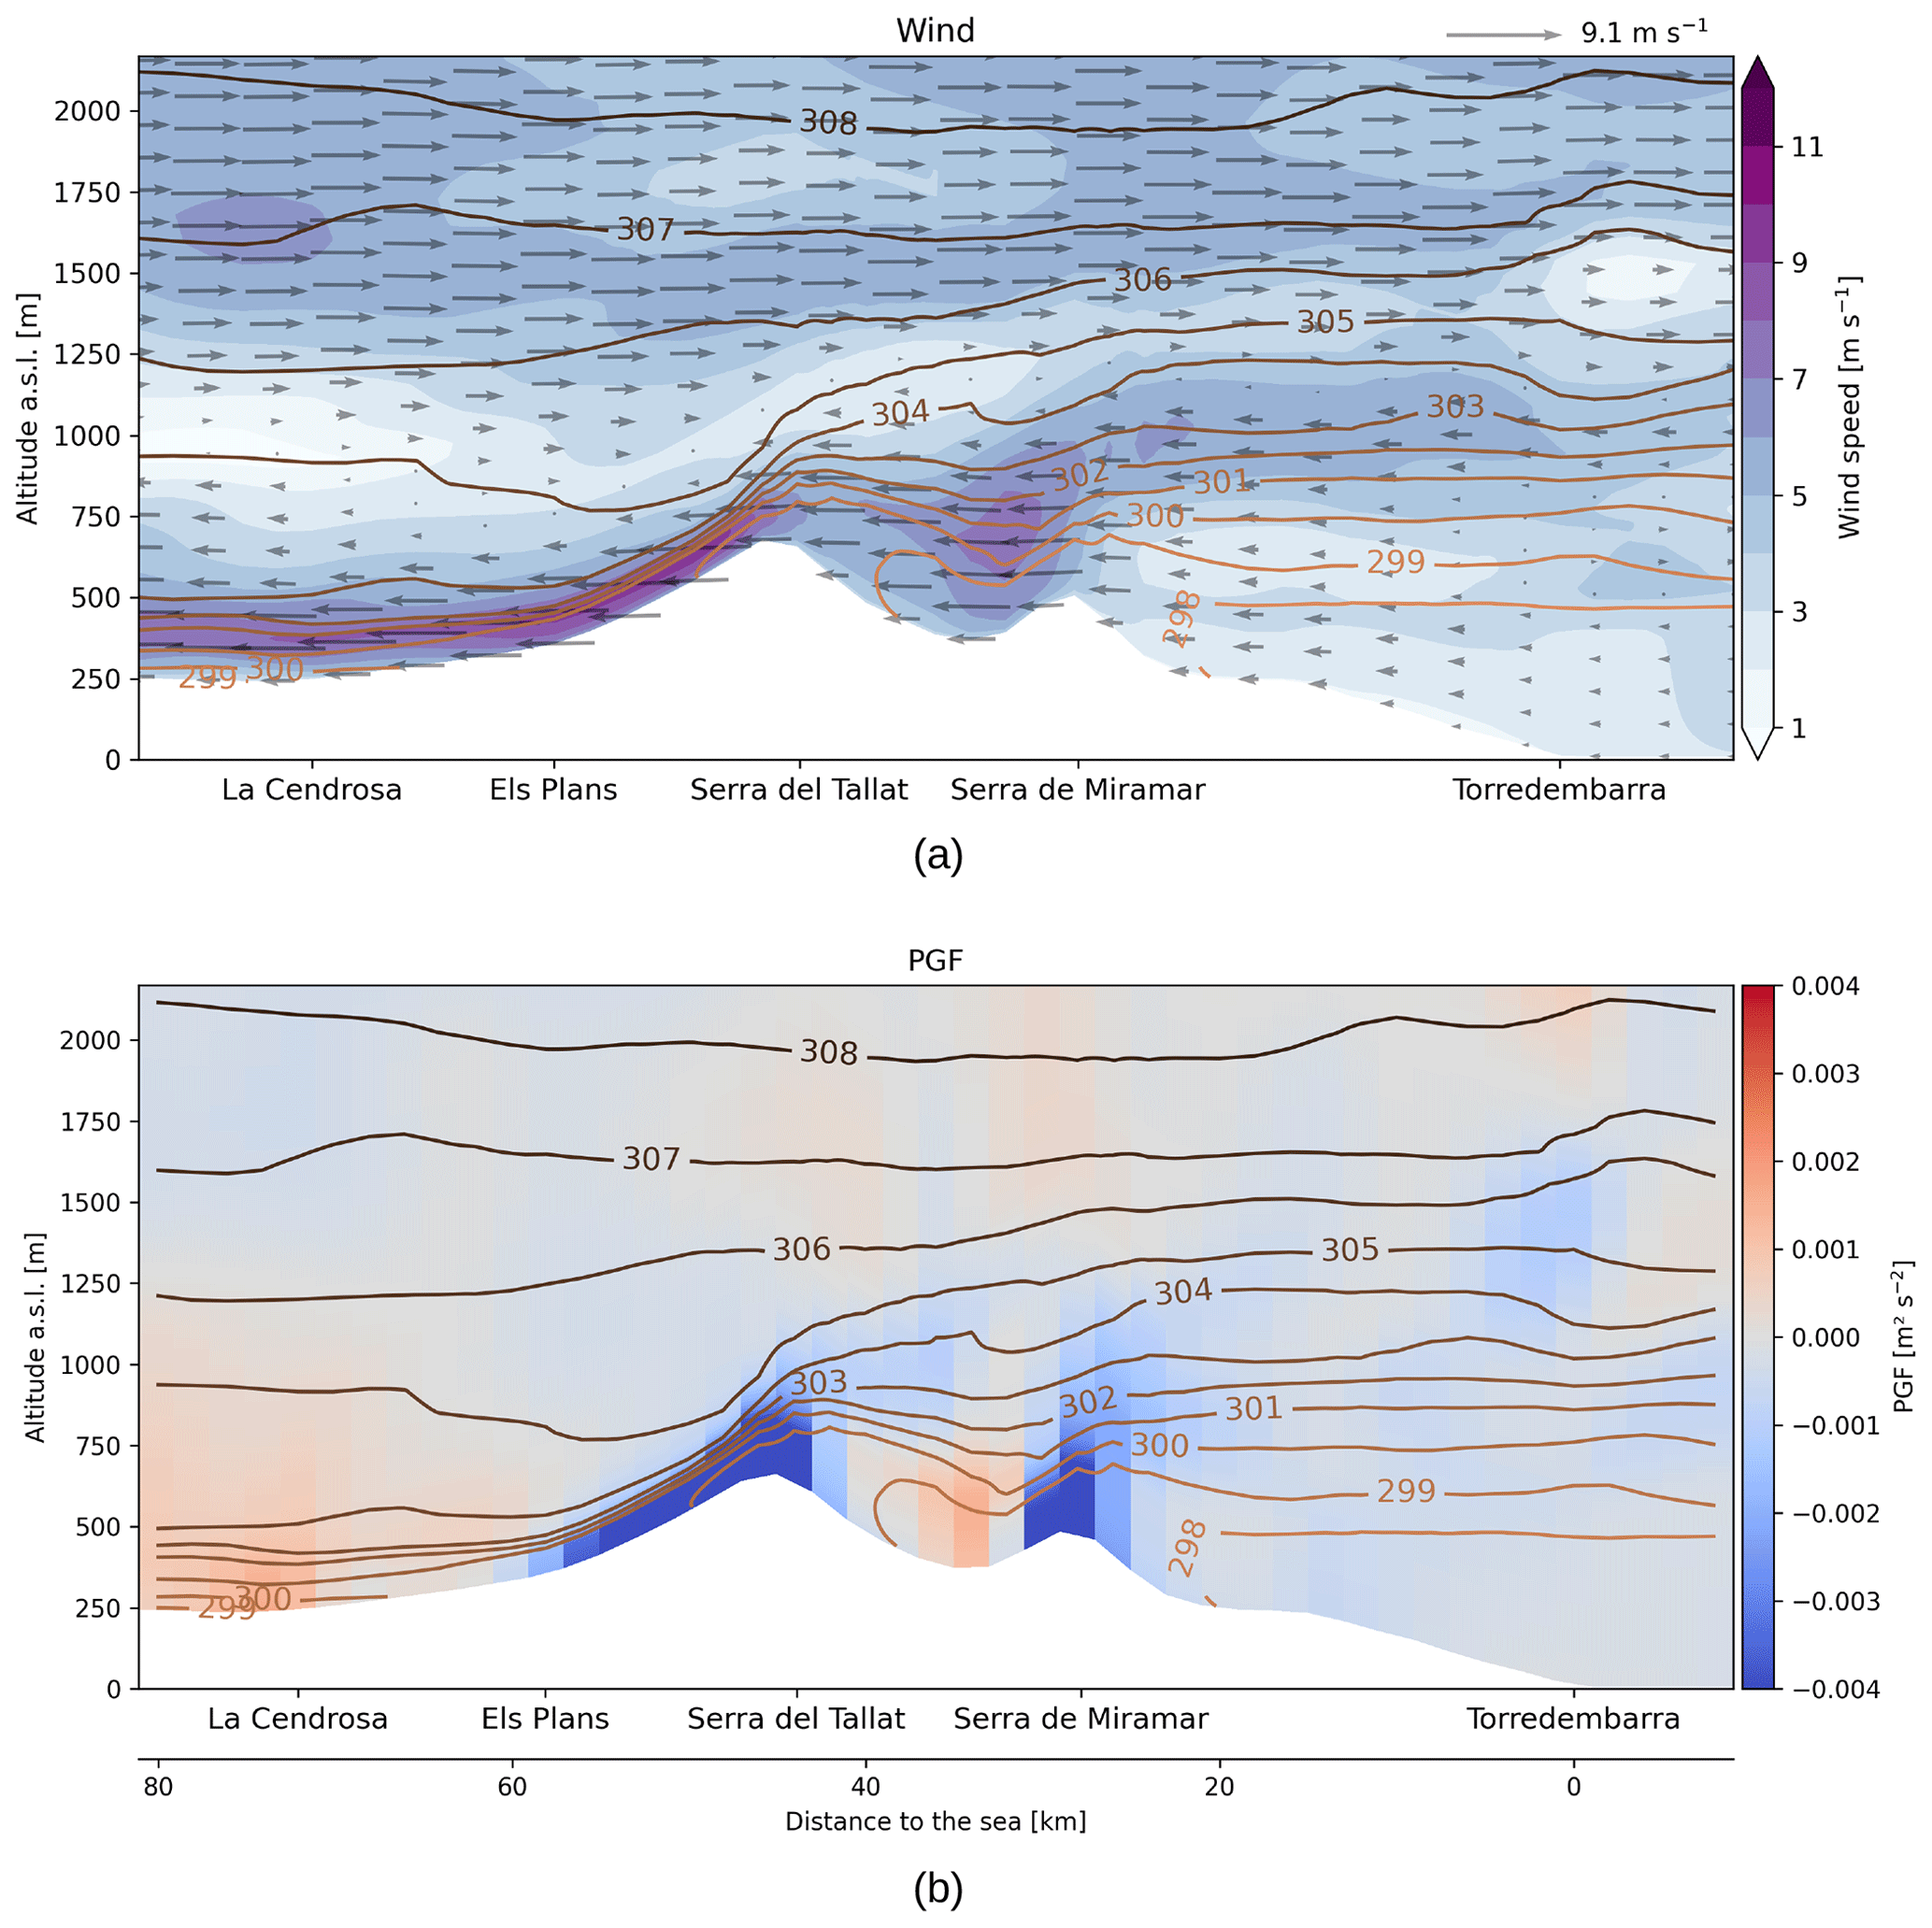
3.2.3 The mature phase of the marinada (20:00–22:00 UTC)
During this phase the marinada blows continuously throughout the whole of the Segre sub-basin. As shown in Fig. 8, the wind acceleration is still partly due to the acceleration over Serra de Miramar but mainly to the component over Serra del Tallat and its northwestern slope. Due to the higher density of the marinada air mass, the cold air mass and its wind remain close to the ground. Acceleration over the northwest slope follows the same behavior, and PGF values are particularly high in the lowest 200 The thinning and acceleration of the marine air flow corresponds to the transition from the subcritical to the supercritical regime from a hydraulic analysis perspective. This hydraulic perspective is developed in the next section.
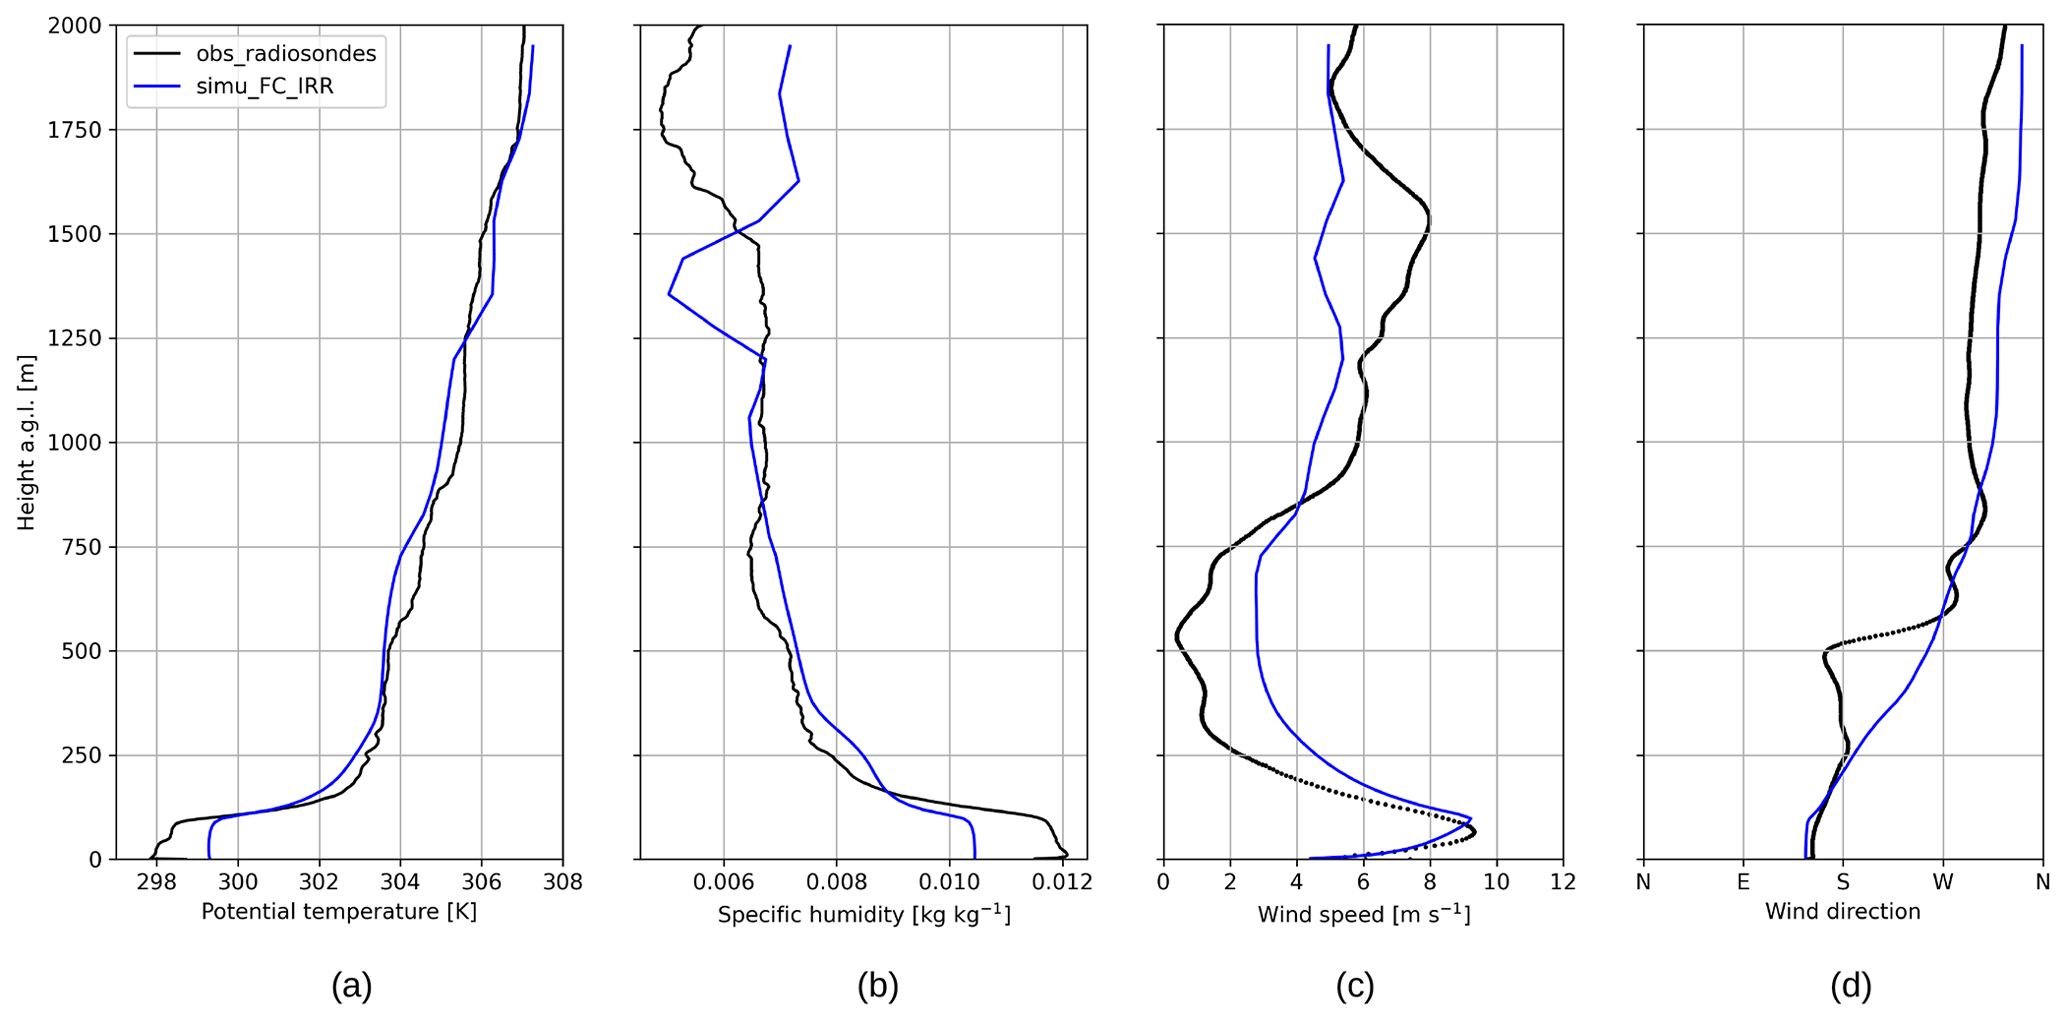
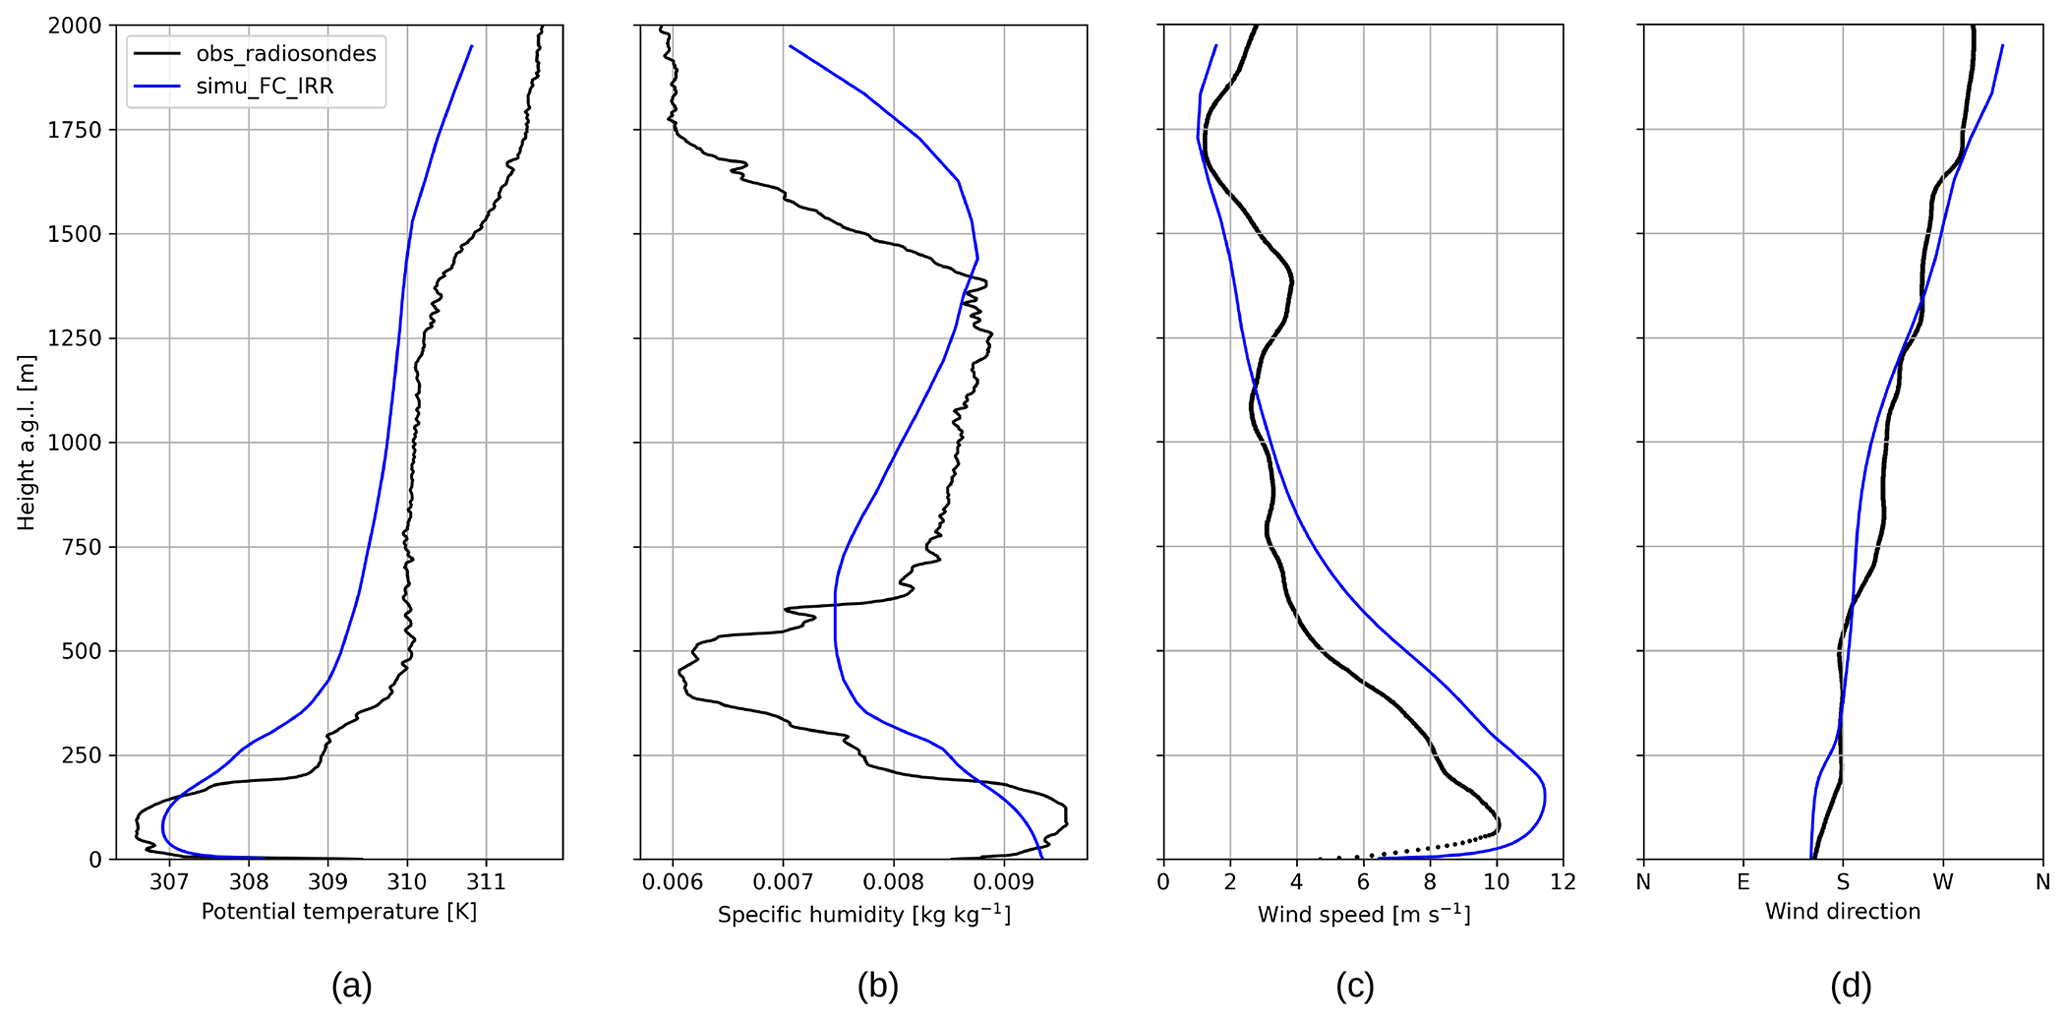
Figure 9Vertical profiles of potential temperature (a), specific humidity (b), wind speed (c), and wind direction (d) above Els Plans on 16 July 2021 at 21:00 UTC. In black are the observations from the radiosonde released from the ground at 21:00 UTC. In blue are the model vertical profiles.
The radiosonde released from Els Plans at 21:00 UTC, shown in Fig. 9, confirms the main features simulated by the Meso-NH model. In particular, the jet of the marinada is clearly visible, located at 70 and 100 in the observations and model, and with maximum wind speeds of 9.2 and 9.3 m s−1, respectively. This jet height and strength is similar to the Santa Ana fall winds (Jiang et al., 2022). The potential temperature profile shows a uniformly cold air in the first 100 , ruling out the idea that this wind is driven by a surface cooling effect as in katabatic winds. The radiosounding also shows a clear wind veering in the lower 500 m, with a south-southeast orientation and a sharp transition to the residual layer above, where the general westerly wind is present. The model shows a smoother transition from the marinada layer to the residual layer between 250 and 500 The wind direction changes smoothly from south to west, and the wind speed is overestimated by the model above 200 m, with a modeled wind speed of about 3 m s−1 versus an observed wind speed of about 1 m s−1. This is probably due to an overestimated entrainment phenomenon at the entrainment zone between the marinada air mass and the residual layer. The modeled and observed potential temperature profiles are in good agreement with respect to the depth of the cold air mass and the stratification of the residual layer (Fig. 9a). The vertical potential temperature gradient between the marinada and the residual layer is slightly underestimated by the model, resulting in a weaker temperature inversion cap and hence a thicker entrainment layer. The specific humidity profile is less accurately reproduced by the model, although the moisture signature of the marinada is present in both the observations and the model. Comparing the characteristics of the marinada at 50 and the Ebro basin air mass at 250 with the radiosonde observations, the marinada is 5 K cooler and 4 g kg−1 more humid than the Ebro basin air mass in which it flows. The model shows a temperature and humidity difference of 4 K and 2 g kg−1, respectively, and reproduces the wind in the lowest layer particularly well.
3.2.4 The marinada decay phase (22:00–24:00 UTC)
During the mature phase of the marinada, the air mass from the Segre sub-basin is gradually replaced by cooler and wetter air. This cool advection, combined with the surface radiative cooling, decreases the air potential temperature in the Segre sub-basin. For instance at 50 above La Cendrosa, the air temperature is reduced by 4.5 K between 20:00 and 22:00 UTC. At 22:00 UTC, this cooling effect begins to affect the dynamics of the marinada. Figure 10 shows a rise in the virtual temperature isolines over La Cendrosa, an indication of the air mass cooling. This cooling leads to a reduction in the PGF, which until then had accelerated the wind towards the northwest, and even induces a PGF opposite to the marinada in the lower part of the Segre sub-basin, thus slowing down the marinada.
At 22:00 UTC, the surface begins to be cooler than the marine air mass over Els Plans (not shown). The resulting nocturnal cooling of the lower atmosphere now contributes to the downslope PGF and helps to maintain the marinada over the northwestern slopes of Serra del Tallat.
Nevertheless, the opposite PGF in the low Segre sub-basin is stronger than the downslope PGF, and the marinada is progressively confined to the northwestern slope of Serra del Tallat (Fig. 10) at 23:00 UTC, until being replaced by weaker local katabatic winds around midnight (not shown).
3.3 Hydraulic theory perspective
A fall wind such as the marinada has most of the characteristics of an open channel flow, and the hydraulic theory can be used to analyze it, as mentioned in the Introduction. The Froude number described in Sect. 2.5 is used below for this purpose.
The jet height associated with the marinada and Froude number are plotted along the Torredembarra–La Cendrosa transect in Fig. 11.
This figure (Fig. 11) shows that the jet height diagnostic htop described in Sect. 2.5 captures well the jet over the CPR and the Ebro basin and does not interpret the sea breeze east of Serra de Miramar as a jet, which was one of the purposes of the definition considered for htop. Note that the jet height diagnostic detects two jets over Torredembarra: a residual sea breeze at 17:00 UTC and a very weak jet on 17 July at 01:00 UTC. Neither of these jets is of interest for the marinada study.
At all times, the jet forms to the west of Serra de Miramar. Between Serra de Miramar and Serra del Tallat, i.e., in the Conca de Barberà, the jet gets progressively closer to the surface. The jet then reaches its minimum height on the northwestern slope of the CPR, before thickening in the lower part of the Segre sub-basin.
During the marinada onset phase, at 17:00 UTC, the Froude number ranges from 1 to 12, indicating that the jet flow is supercritical, from Serra de Miramar to the marinada front, which is located between Els Plans and Serra del Tallat at this time. This supercritical regime confirms that Serra de Miramar plays a role in accelerating the marine air mass towards the northwest. During the mature and decaying phases, the flow over the Conca de Barberà is subcritical, which means that the flow is mainly driven by the flow behavior downstream, i.e., the marinada in the Segre sub-basin. The marinada phenomenon corresponds to the supercritical flow west of Serra del Tallat. At 21:00 UTC, this flow is supercritical from Serra del Tallat to La Cendrosa. The marinada flows freely in the Segre sub-basin. At 23:00 UTC, the Segre sub-basin has cooled down, and the cool air mass slows down the marinada. The height of the marinada htop suddenly increases between Els Plans and La Cendrosa, and the Froude number drops below 1, meaning that the flow becomes subcritical. This corresponds to a hydraulic jump. As the Segre basin becomes cooler, the subcritical zone gradually extends to the southeast, and the marinada is confined to the northwestern slope of Serra del Tallat. The supercritical regime associated with the marinada at all stages confirms the gravity-driven nature of the marinada.
The flow characteristics are also shown at 01:00 UTC on 17 July. At this time, the Froude number reaches a maximum of 3, and the jet height diagnostic does not capture the jet on all of the northwestern slopes. This flow is a remnant of the marinada mixed with a katabatic wind due to surface cooling. In this article it is considered that this wind is no longer the marinada.
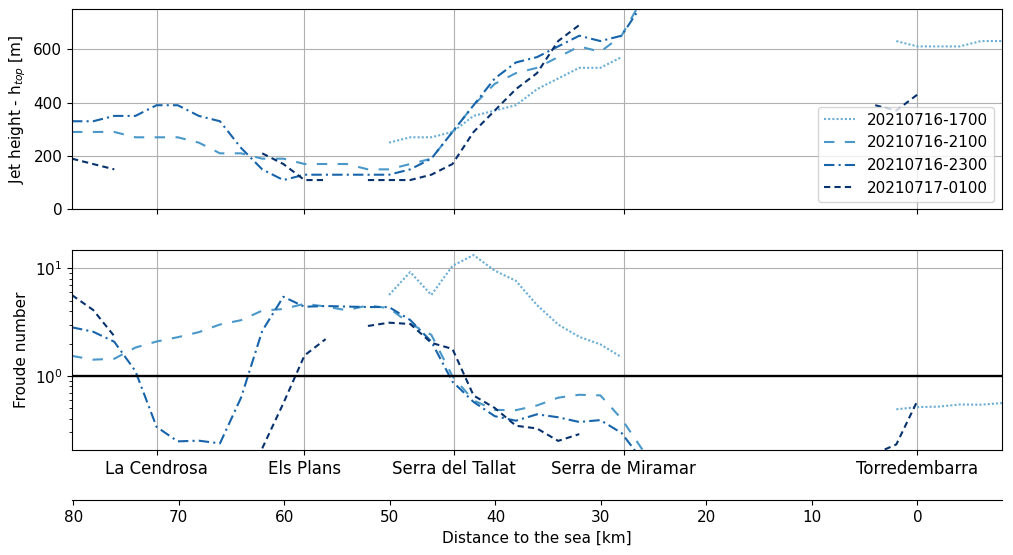
Figure 11Marinada height and Froude number on 16 July 2021 at different times of the marinada.
3.4 Processes involved in the marinada event under the influence of thermal low (21 July 2021)
The processes at play on 21 July are globally similar to those on 16 July. The PGF corresponding to the sea breeze and that corresponding to the upslope winds are very similar in terms of direction and magnitude. Nevertheless the large-scale weather situation over the region leads to differences in the characteristics of the marinada. At 500 hPa the pressure gradient is weak over the Iberian Peninsula, and the wind blows the from west-northwest (Table 3). Low tropospheric large-scale winds do not have a prevailing direction over the Segre sub-basin as for 16 July. Heating of the Iberian Peninsula is enhanced by the absence of large-scale advection, and ascending vertical motions are responsible for the formation of a thermal low located southwest of the Ebro basin. This thermal low generates a southeast to northwest wind in the first lower kilometer of the troposphere in the Ebro basin. This is the direction of the marinada, and this thermal-low wind therefore helps the progression of the marine air mass into the Ebro basin. The first phase of the marinada is therefore not mainly driven by the sea breeze as on the 16th but also by the general wind induced by the thermal low.
This causes the marine air mass to arrive earlier over the CPR than on 16 July 2021. The marinada starts to flow into the Ebro basin starting around 12:00 UTC in the model and around 13:30 UTC in the observations.
Figure 12 shows the comparison of 16 and 21 July for the evolution of wind, potential temperature and specific humidity close to the surface over the 2 d. On the 21 July the model performs less well than on 16 July for the arrival time at marinada, resulting in differences in terms of wind, potential temperature, and specific humidity throughout the day.
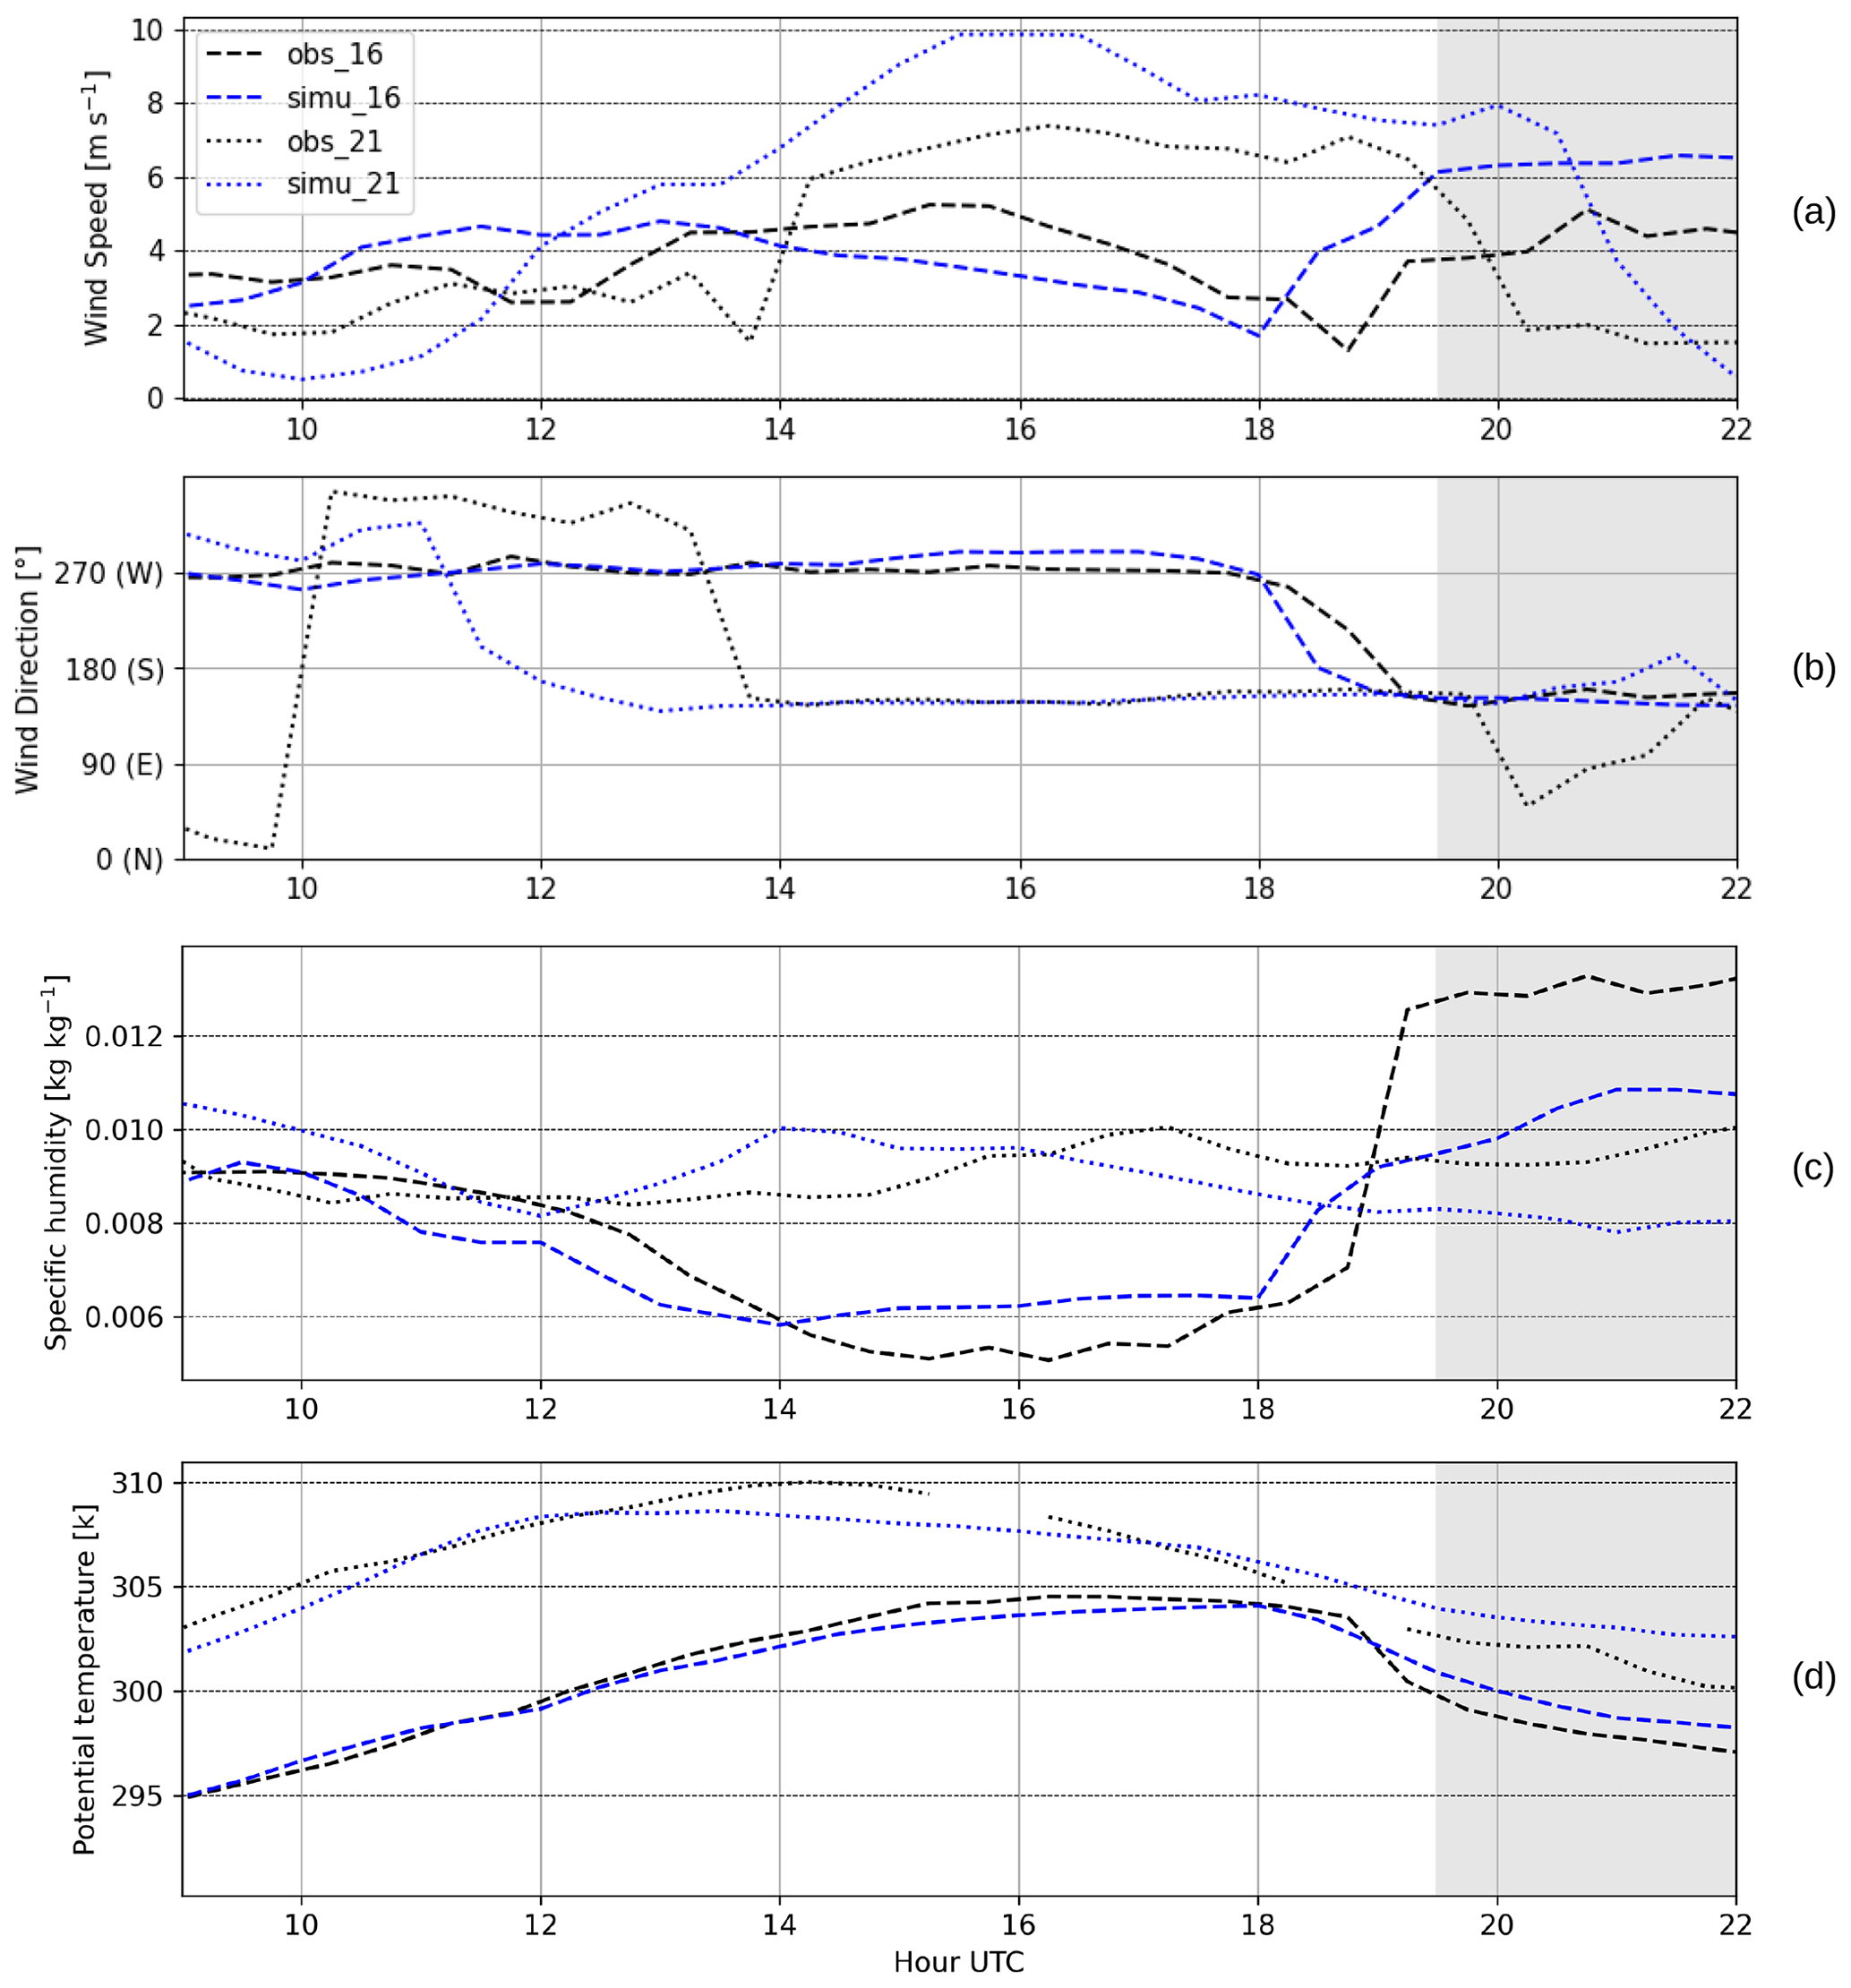
Figure 12Time series of wind speed (a), wind direction (b), specific humidity (c), and potential temperature (d) for the 16 and 21 July 2021 at Els Plans. In black are the observations and in blue are the simulation outputs. All data are considered at 10
On 21 July, the wind direction before the arrival of the marinada is northwest at Els Plans. This northwesterly direction, opposite to the southeasterly general wind, is due to an irrigation-induced breeze circulation, as shown by Lunel et al. (2024). However, this irrigation breeze is not strong enough to counteract the arrival of the marinada, and the veering to the southeast finally allows the arrival time of the marinada to be estimated. As the general wind does not counteract the marinada, the wind speed is higher on 21 July than on 16 July. The potential temperature is also globally higher on 21 July than on 16 July. This is one of the conditions for the development of the thermal low (Jiménez et al., 2023). Also, since the marinada arrives in the middle of the day on the 21st, its arrival coincides with the strong daytime surface warming, and the marinada air mass is warmed and mixed with higher layers as it descends into the Segre basin. This mixing effect influences the evolution of temperature and humidity variables throughout the day. In particular, the arrival of the marinada on the 21 July does not lead to such a sharp decrease (increase) in the potential temperature (specific humidity) as on the 16 July. The marinada onset phase lasts between 12:00 and 16:00 UTC on 21 July.
Differences in the marinada characteristics between 16 and 21 are also found in the vertical structure during the mature phase of the marinada, as shown in Figs. 9 and 13. The mature phase is between 16:00 and 20:00 UTC on 21 July. The wind direction profile shows that there is no westerly wind in the lower troposphere. Also, according to the potential temperature profile, the troposphere is neutral over the marinada and up to 1400 on 21 July, whereas the troposphere is more stratified on 16 July. This neutral stratification is probably a residual of the ABL present prior to the arrival at marinada. The potential temperature gradient between the marinada and the overlying direct layer is about 3 K on the 21 July, compared to 5 K on the 16 July. This weaker potential temperature cap, combined with the still active thermal convection, results in a deeper marinada on 21 July. The height of the marinada, diagnosed by the jet height htop described in Sect. 3.2.4, is 365 m and 450 m, respectively, according to the observation and the model. Despite the higher jet height htop, the Froude number diagnostics show very similar behaviors between 16 and 21 July for the onset and mature phase of the marinada, i.e., the flow changes from subcritical to supercritical as it passes Serra del Tallat (not shown). There is also a hydraulic jump at the end of the mature phase at 20:00 UTC between La Cendrosa and Els Plans (not shown). This allows us to confirm that the marinada can also be classified as a fall wind on the 21 July 2021.
3.5 Influence of irrigation
The previous sections have shown that the marinada is a local mesoscale wind driven by the topography of the region. First, the sea–land heterogeneity and the southeastern slopes of the CPR lead to sea breeze and upslope wind circulations that bring a cool and moist air mass over the CPR. The north-western slope of the CPR then accelerates the dense marine air mass into the Segre sub-basin. Secondly, it has been shown that the characteristics of the marinada also depend on the strength of shallow convection due to surface heating, which in turn depends on the timing of the marinada onset and the presence or absence of westerlies. These influencing surface features are natural. Another land surface feature is important to consider and should be studied further as it is anthropogenic: irrigation.
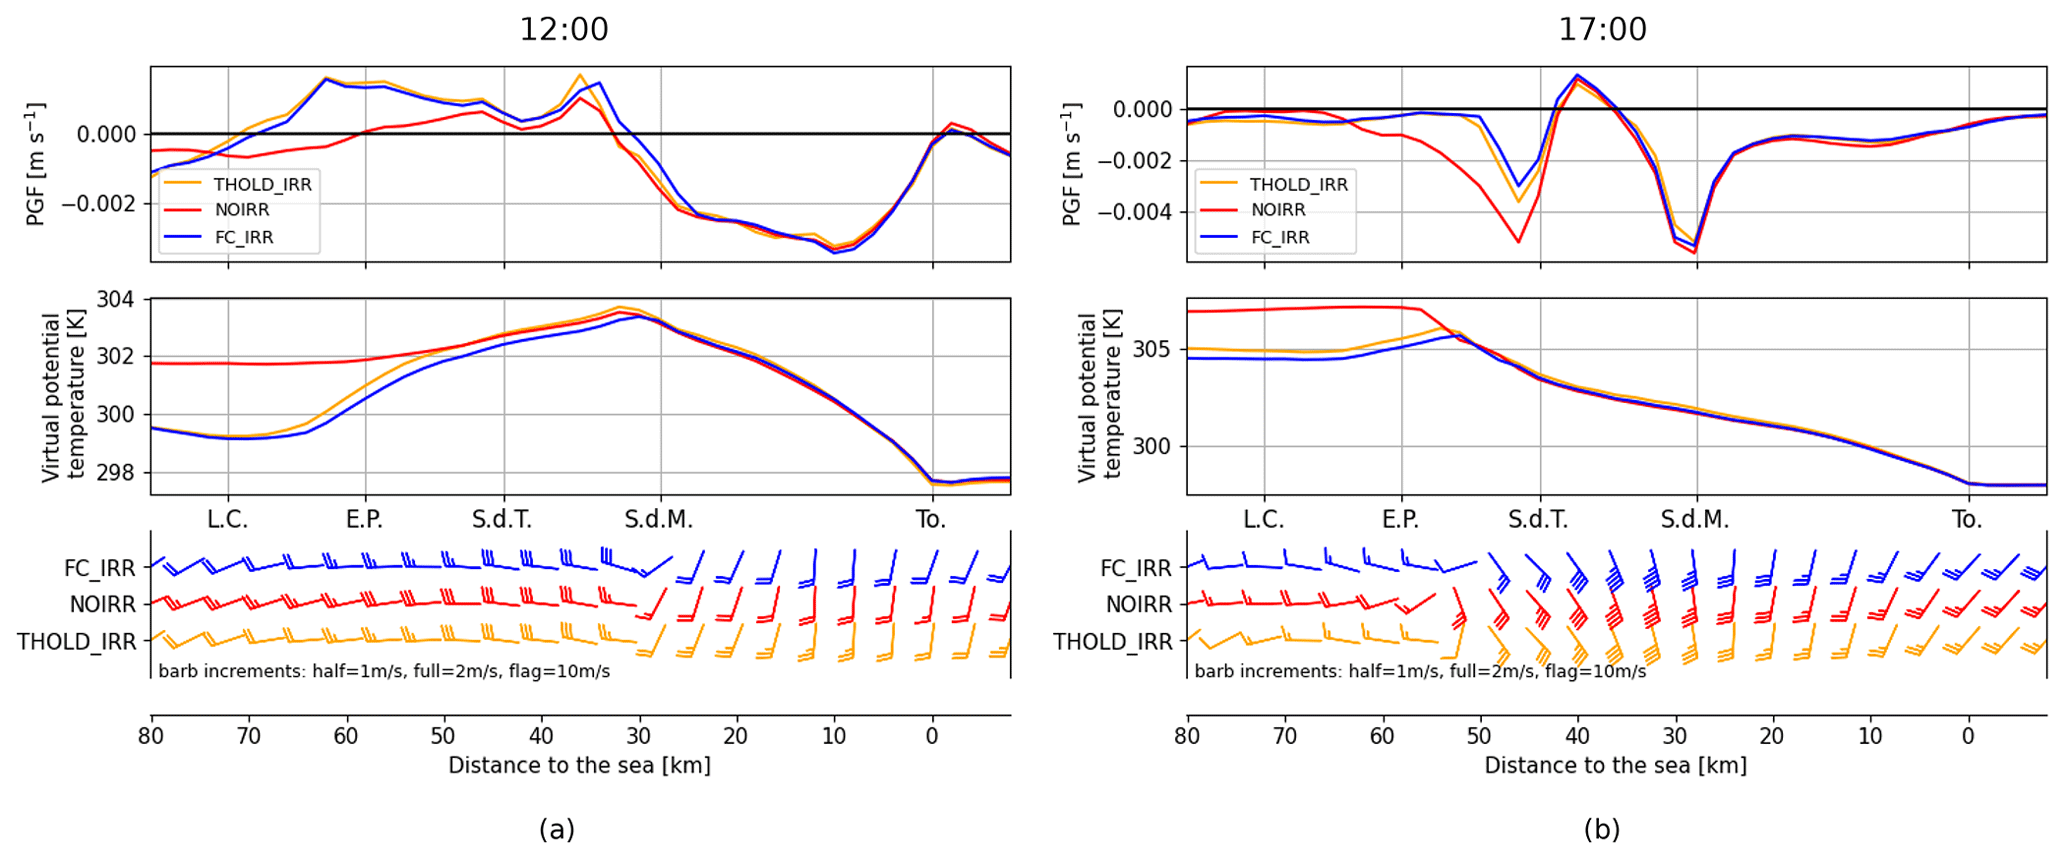
Figure 14Pressure gradient force (PGF), virtual potential temperature and wind along the La Cendrosa–Torredembarra transect for 16 July 2021 at 12:00 UTC (a) and 17:00 UTC (b). The values are averaged vertically between 50 and 300
3.5.1 Influence on PGF and air density
To investigate the influence of irrigation, the three different model configurations described in Sect. 2.4.2 are run for 16 July. Figure 14 shows a comparison of the results for PGF and potential temperature in the well-mixed boundary layer, i.e., between 50 and 300 As irrigation is mainly concentrated in the Ebro basin, its effect is mainly found to the west of the CPR.
During the first phase, at 12:00 UTC, the PGF due to irrigation heterogeneity and the slope acceleration can be dissociated thanks to the non-irrigated run NOIRR. It is found that most of the positive PGF, i.e., the acceleration towards the southeast, on the Ebro basin side is due to the irrigated–rainfed heterogeneity. The boundary between irrigated and rainfed is between La Cendrosa and Els Plans, where the PGF is maximum at 12:00 UTC. This PGF is about 1.5 mm s−2 and decreases progressively towards the east until it reaches 1.0 mm s−2 at Serra del Tallat. On the southeast side of the CPR, the PGF is symmetrically opposite, and the absolute PGF has a maximum of 3.5 mm s−2 and decreases to 2 mm s−2 at Serra del Miramar. The negative sign means that the acceleration is towards the northwest. Since the CPR slopes on both sides are about the same steepness, the upslope PGF must be of the same magnitude. Thus, similar to the Ebro basin side, the inland acceleration between Torredembarra and Serra de Miramar is mainly due to the coastal sea breeze.
The potential temperature is strongly influenced by irrigation in the Ebro basin. Above La Cendrosa, irrigation reduces the potential temperature between 50 and 300 by 2.5 K at 12:00 UTC and 2 K at 17:00 UTC. The decrease in virtual potential temperature above Els Plans due to irrigation is also shown for 17:00 UTC along the vertical profile in Fig. 15a. At 17:00 UTC, the effect of the irrigation parameterization can be seen. Since THOLD_IRR represents a soil that dries periodically, the mean surface latent heat flux over the irrigated field is lower for THOLD_IRR, the sensible heat flux is higher and the potential temperature is finally higher than for FC_IRR. This higher potential temperature is equivalent to a lower density of the air in the ABL, and it affects the PGF at the boundary between the Ebro basin and the marine air masses. For this reason, over Serra del Tallat, the intensity of the PGF at 17:00 UTC depends on the irrigation representation; no irrigation (NOIRR) or weaker irrigation (THOLD_IRR) leads to higher absolute PGF (Fig. 14).
3.5.2 Impact on arrival time and wind speed
The differences in PGF during the first and second phases of the marinada then induce effects on its characteristics. The irrigation PGF during the first phase induces a higher wind speed for the westerly winds. These winds slow down the arrival of the marine air mass over the CPR and thus delay the onset of the marinada. Table 4 shows the arrival of the marinada at Els Plans for the three models and for 16 and 21 July. As already discussed in Sect. 3.4, the model as a whole represents a marinada that arrives too early in the Segre sub-basin. However, without the irrigation representation in the model, the marinada arrives even earlier. The difference between THOLD_IRR and FC_IRR is less than the uncertainty in the arrival time determination.
Table 4Arrival time of the marinada front at Els Plans, observed and modeled with the three different irrigation parameterizations. The determination of the arrival time is done with the wind veering from west (180 to 360°) to southeast (160 to 140°) for 16 July on 10 min data.
To better understand the reasons why the model simulates marinadas that are too early, more observations would be needed over the regions of Conca de Barberà and Alt Camp. This would allow a better characterization of the biases between model and reality in the ABL during the first phase, i.e., the sea breeze phase (Sect. 3.2.1). Without these observations at the first phase, it is difficult to draw conclusions regarding the reasons for the difference in arrival time at the second stage.
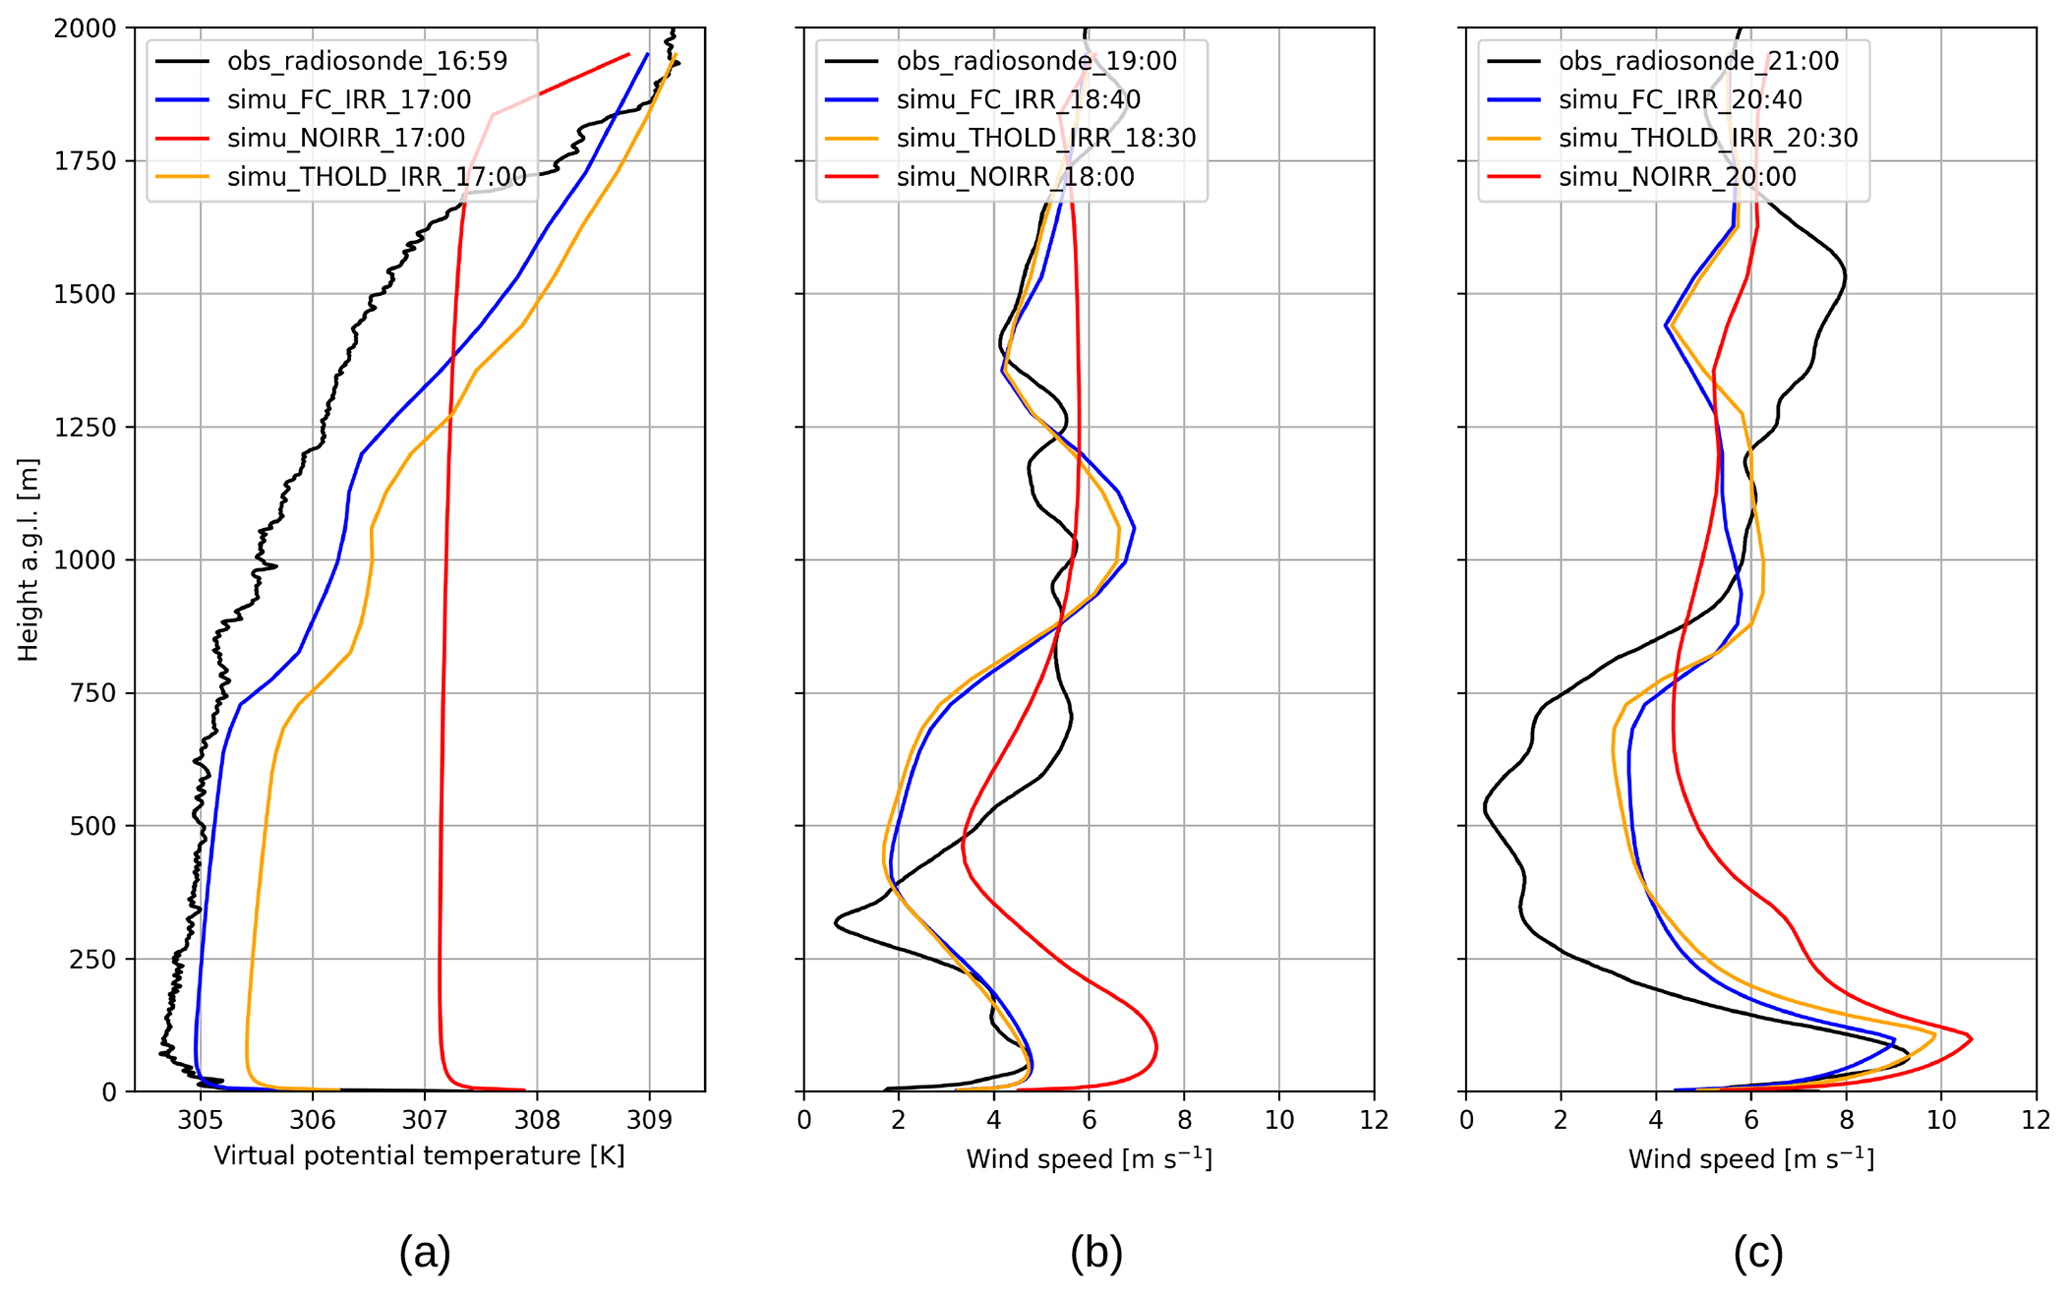
Figure 15Vertical profile of the virtual potential temperature at Els Plans on 16 July 2021, before the marinada arrival at 17:00 UTC (a) and of the wind speed right after the marinada arrival (b) and 2 h 00 min later (c). As the marinada arrival is different in the model runs, the time considered is different for each model in panels (b) and (c), and the corresponding time is given in the legend.
During the marinada onset, the PGF induced by irrigation at La Cendrosa still acts as a decelerating force for the marinada, but the PGF due to density differences between the two air masses also plays a role. The more irrigated the Segre sub-basin is, the weaker the density PGF is, and the slower the marinada wind speed should be. Figure 15 shows the vertical profiles at Els Plans of potential temperature before the marinada and of wind speed just after the arrival of the marinada and 2 h later during the mature marinada phase. It systematically overestimates the wind speed in the lower layers of the troposphere (up to 750–1000 ). The irrigated runs perform better in this sense. In the mature phase, FC_IRR has a lower wind speed than THOLD_IRR, as expected from the density PGF value of each run. In comparison with the radiosoundings, the two models perform similarly well, with a slight negative bias for FC_IRR and a slight positive bias for THOLD_IRR.
These results show that adding irrigation to the simulation improves the virtual potential temperature profile, timing and wind speed of the marinada wind. It can also be assessed that the irrigation parameterization that gives the best result for the marinada modeling is FC_IRR, i.e., a simple parameterization where the soil is always very wet. Increasing the complexity of the irrigation parameterization by allowing the soil to dry out does not necessarily lead to a better modeling of the mesoscale meteorological winds and scalar variables. The possible reasons for this are discussed in Sect. 4.
The current study focuses on understanding the marinada, a local mesoscale wind that is common in summer in Catalonia. It uses a combination of observational and model data to elucidate the physical mechanisms involved in the formation of the marinada. The investigation is carried out through case studies on 2 d in July 2021, representing two different summer weather situations for the region. These two situations correspond to the two main weather situations in the eastern Ebro basin according to the statistical analysis of Jiménez et al. (2023) (westerlies and thermal low). The two case studies take place during the special observation period of the LIAISE campaign, which allows us to validate the model outputs with a larger number of observations. Observational data from the LIAISE campaign and from the SMC network allow us to confirm the overall good behavior of the model, providing confidence in the process analysis derived from the model diagnostics.
From the atmospheric characteristics and the wind momentum source terms obtained by the model, the main driving forces leading to the formation of the marinada are revealed. Among the different momentum source terms, the pressure gradient force (PGF) occupies a prominent position. It is shown to be the most influential term among the others and can be related to surface–atmosphere interactions. The study divides the phenomenon into four distinct stages. In the first stage, the coastal breeze acts together with the upslope wind to bring a cool and humid marine air mass over the Catalan Pre-coastal Range (CPR). During this time, the air mass in the Segre sub-basin is warmed. The difference in potential temperature and density between the two neighboring air masses, assisted by the slope that descends towards the Segre sub-basin, leads to a strong acceleration in the first few hundred meters above the ground, creating the marinada. It is also shown that, at this stage, irrigation delays the arrival time of the marinada in the Segre sub-basin. After its arrival, the marinada blows continuously for about 2 h in the Segre sub-basin. Characteristics such as height of the marinada, wind speed, potential temperature and humidity profile are shown to be influenced by the convective activity and by the presence of irrigation. After some time, the marinada has cooled the air of the Segre sub-basin by advection and another pressure gradient force appears, associated with a hydraulic jump and in the opposite direction to the marinada. This PGF eventually leads to the marinada decay. The characteristics and drivers described at each stage clearly show that the marinada can be classified as a fall wind.
Fall winds are well known, but they are generally driven by synoptic-scale winds and air masses, such as the mistral, the bora or the Santa Ana winds. The marinada fall wind is specific in this sense, as it is driven by the local winds that lead to the advection of a dense air mass over a mountain range.
Nevertheless, it shares some characteristics with fall winds. In particular, the height of the jet corresponds well with the Santa Ana wind (Jiang et al., 2022). The marinada is influenced by the air temperature of the Ebro basin, just as the bora is influenced by the sea surface temperature. Specifically, the warmer the air on the lee side, the stronger the wind (Enger and Grisogono, 1998).
The influence of irrigation on the air temperature of the Ebro basin is a well-known feature of irrigation (Lobell et al., 2008; Sorooshian et al., 2011; Sridhar, 2013; Lawston et al., 2020). Interestingly, between the two irrigation parameterizations available, the simplest one gives better results compared to the radiosoundings. The fact that the marinada is better modeled by a simplistic irrigation parameterization such as FC_IRR than by a more realistic one such as THOLD_IRR is also not entirely new. Shrestha et al. (2018) found that this might be due to the root distribution profile in the soil in the surface model. Since SURFEX uses exponential root distributions, which are not representative of semi-arid areas such as the Ebro basin, the plants are too sensitive to the soil moisture of the top soil layers and the surface sensible heat flux is rapidly overestimated once the soil starts to dry. Similarly, root water uptake is oversimplified in the model, for example, by ignoring root hydraulic resistance, which affects the modeled plant transpiration. The simplicity of the model and its high sensitivity to top layer desiccation means that more water has to be added in the model than is needed in reality for the modeled plants to transpire at full potential. This can explain why the rather realistic amount of irrigation water of the THOLD_IRR parameterization is not sufficient to cool the temperature adequately compared to the observation. The parameterization with soil moisture held at field capacity had shown similarly good results in Lunel et al. (2024).
The framework developed here makes it possible to hypothesize a number of trends in the evolution of the marinada over the next few decades. With climate change, land temperatures are expected to increase faster than sea temperatures in the coming decades (Sutton et al., 2007), so the temperature difference between the inland Ebro basin and the marine air mass may also increase, leading to more frequent and stronger marinadas. This assumption is in line with the increase in the frequency of marinada events in the last 20 years observed by Jiménez et al. (2023). Also, the heavy irrigation currently applied to the Segre sub-basin could be reduced due to the limited water resources in the region, as seen in the summer of 2023 for the first time since the construction of the Canal d'Urgell (Confederación Hidrográfica del Ebro, 2023). The reduction in irrigation, both in terms of water volume and total irrigated area, will most likely lead to stronger winds.
In summary, this study sheds new light on a local summer wind of Catalonia, the marinada. Until now, the physical mechanisms leading to its formation were unknown. This study shows that the marinada can be understood as a fall wind whose cold air mass is carried over the mountain range by local winds, i.e., sea breeze and upslope wind.
The current study investigated the marinada, a local wind of the northeastern Ebro basin in Catalonia, in northeastern Spain. This wind is important for the inhabitants of the Segre sub-basin, as it brings more windy and cooler conditions in the late afternoon in summer. The study focused on unraveling the dynamics governing its formation and spatiotemporal characteristics, thanks to the combined use of observations and simulations, in order to improve the modeling and forecasting capabilities associated with this meteorological phenomenon.
The marinada is identified as a fall wind and distinguishes itself by the fact that the cold air mass is brought over the mountain range by local winds. In a first stage, the sea breeze and the upslope wind act together to suck marine air onto the Catalan Pre-coastal Range (CPR). The difference in air mass density between the marine air and the warm air from the Ebro basin causes the wind to accelerate into the Ebro basin, creating what is known as the marinada. The top of the marinada is between 100 and 400 m above ground level, depending on the weather and convective activity. Inside the marinada the air is between 2 and 5 K colder than the surrounding air mass. The marinada undergoes decay once a sufficient amount of cold air is introduced into the Ebro basin, generating a counter pressure gradient force (PGF) that decelerates the marinada. This decay process can be studied by hydraulic analysis, conceptualizing the marinada as a supercritical flow flowing over the northeastern slopes of the CPR. The marinada decay then corresponds to an hydraulic jump in the lower part of the Segre sub-basin. Irrigation was found to be a significant factor in the behavior of the marinada. It affects its behavior by delaying its arrival and slowing down the internal wind speed.
This study builds a consistent framework to understand the marinada. By doing so, this work lays a foundation for a deeper understanding of the marinada, providing insights into its intricacies under varying weather scenarios and irrigation conditions. The knowledge gained paves the way for more accurate modeling and prediction of this phenomenon, offering valuable implications for both short-term weather forecasts and long-term climate projections.
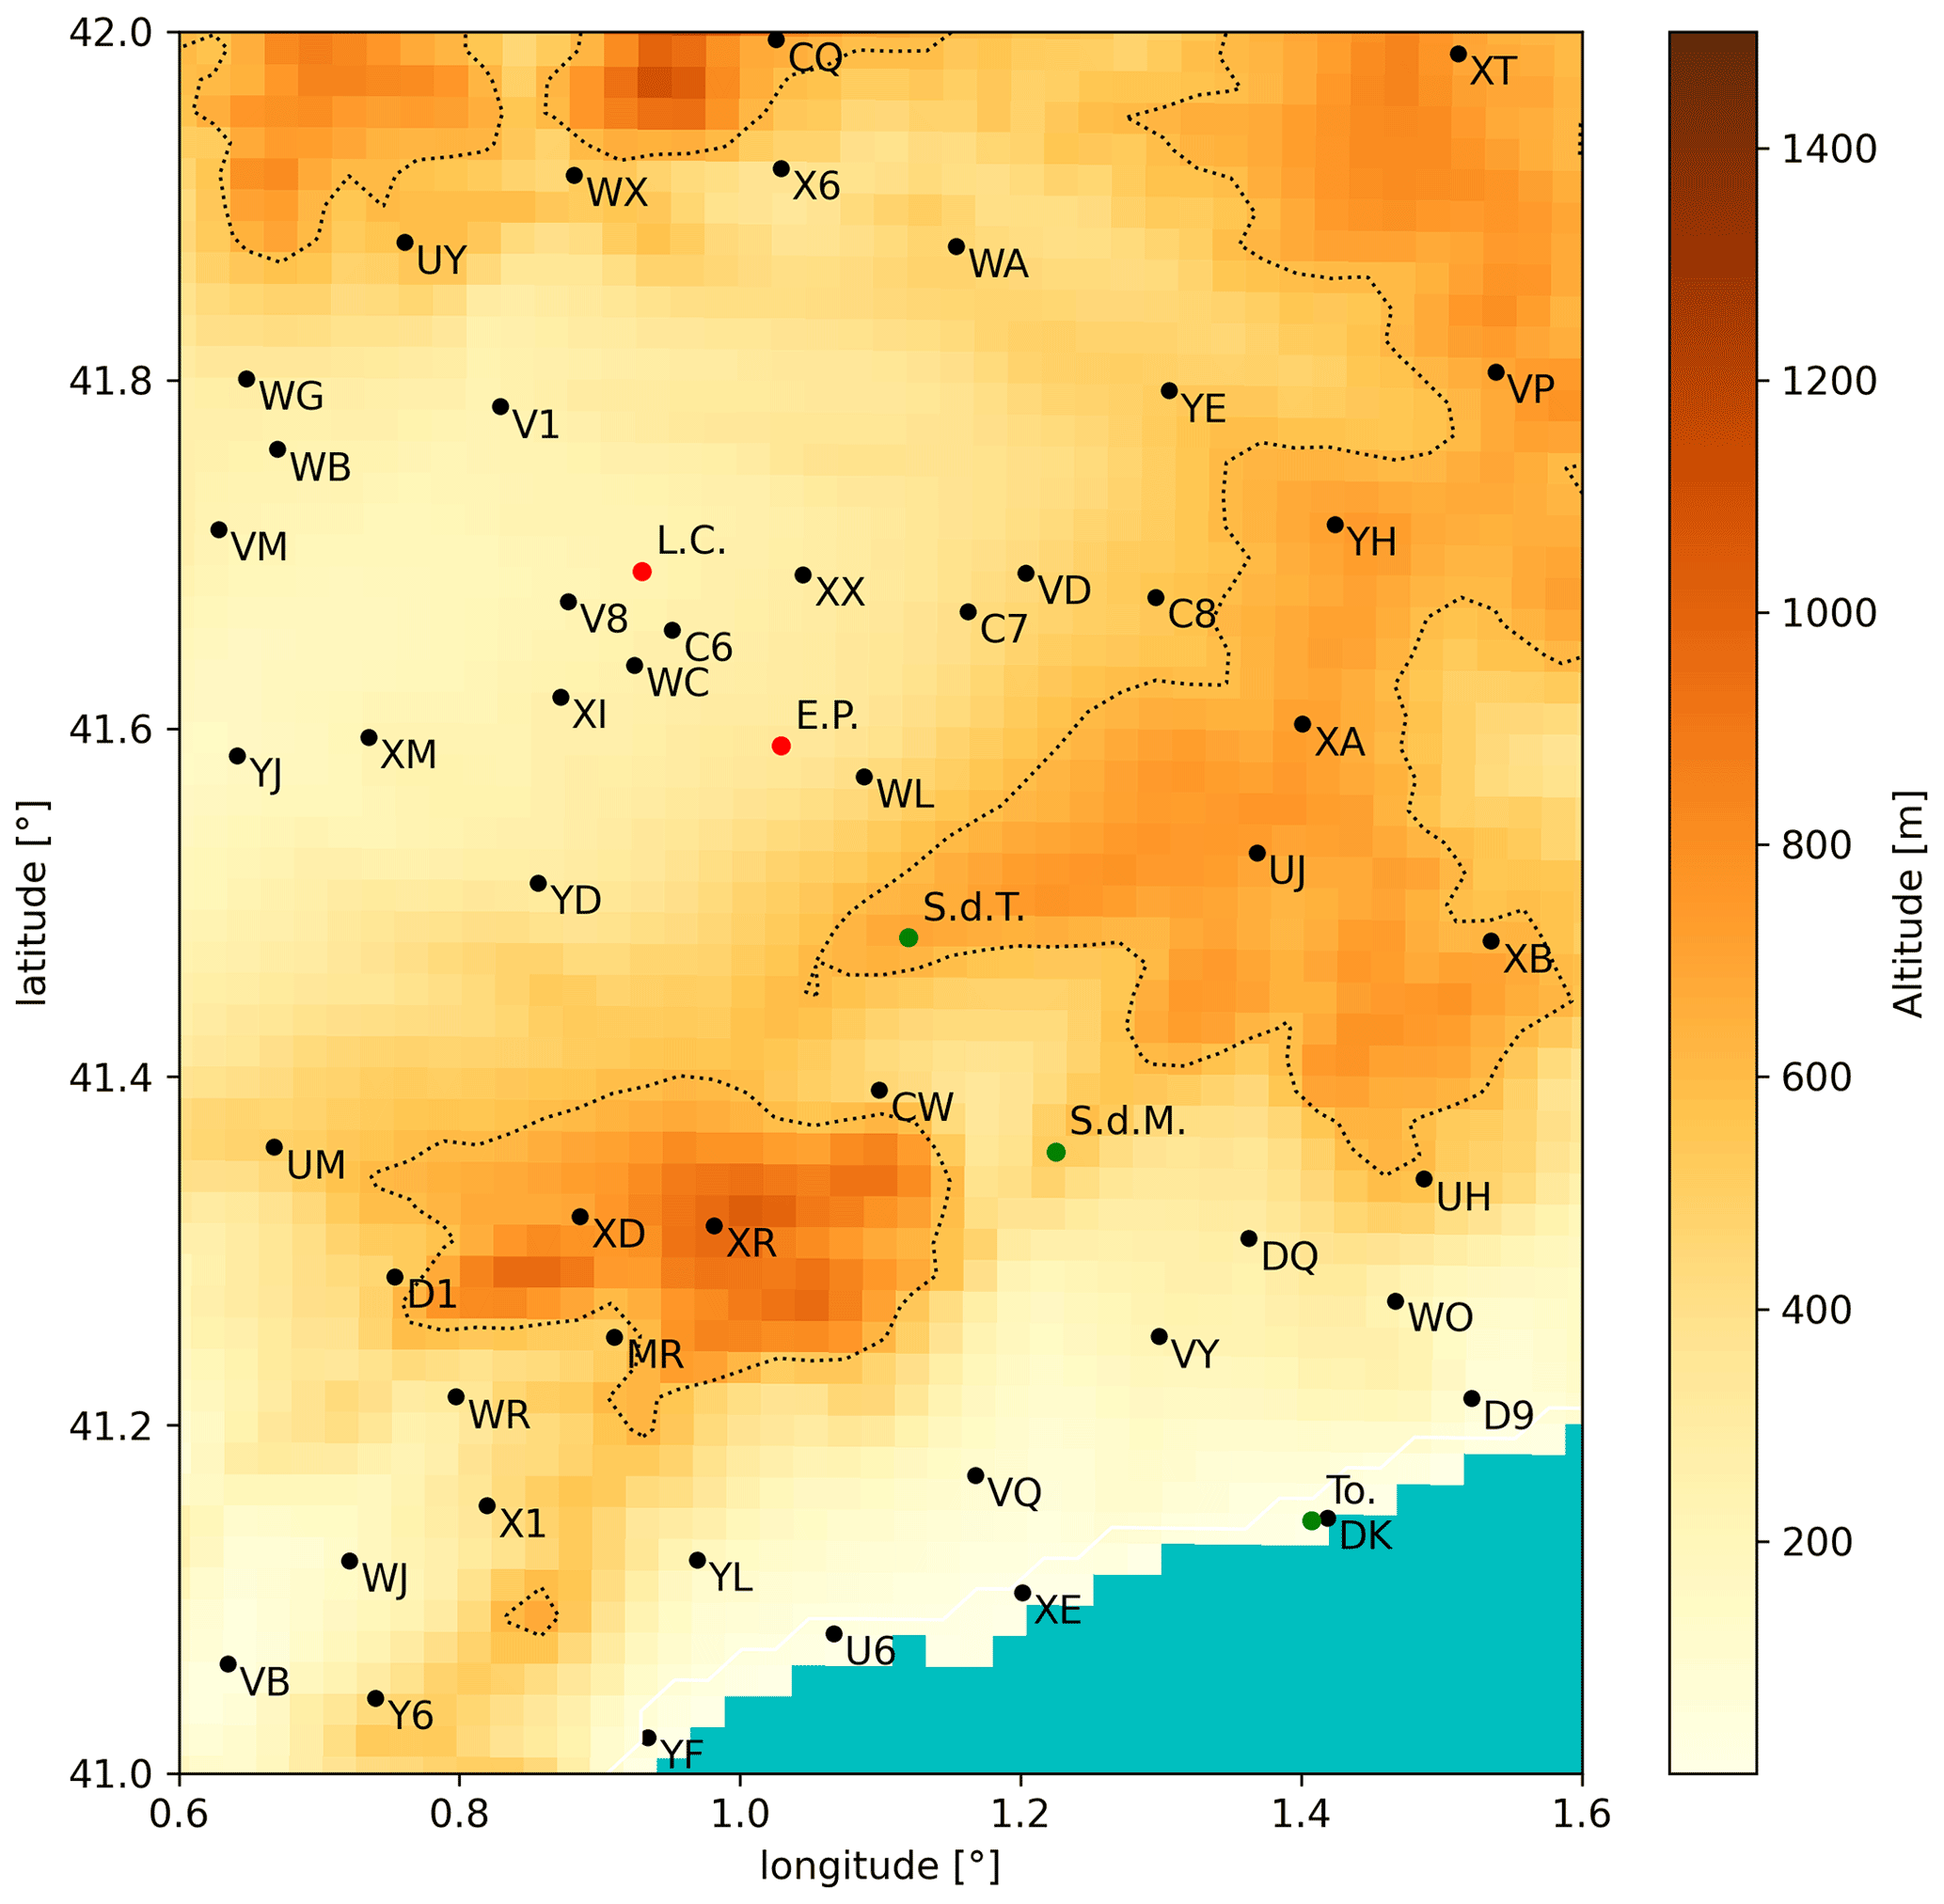
Figure A1Station locations. The black dots are the SMC automatic weather stations considered in the study and gathered in Table A1. The red dots are the two LIAISE observation sites of La Cendrosa (L.C.) and Els Plans (E.P.). The green dots are reference points for locating topographical features on cross sections. They are mountains, like Serra del Tallat (S.d.T.) and Serra de Miramar (S.d.M.), and the coastal town of Torredembarra (To.). The thin dotted line represents the iso-altitude line at 600 m.
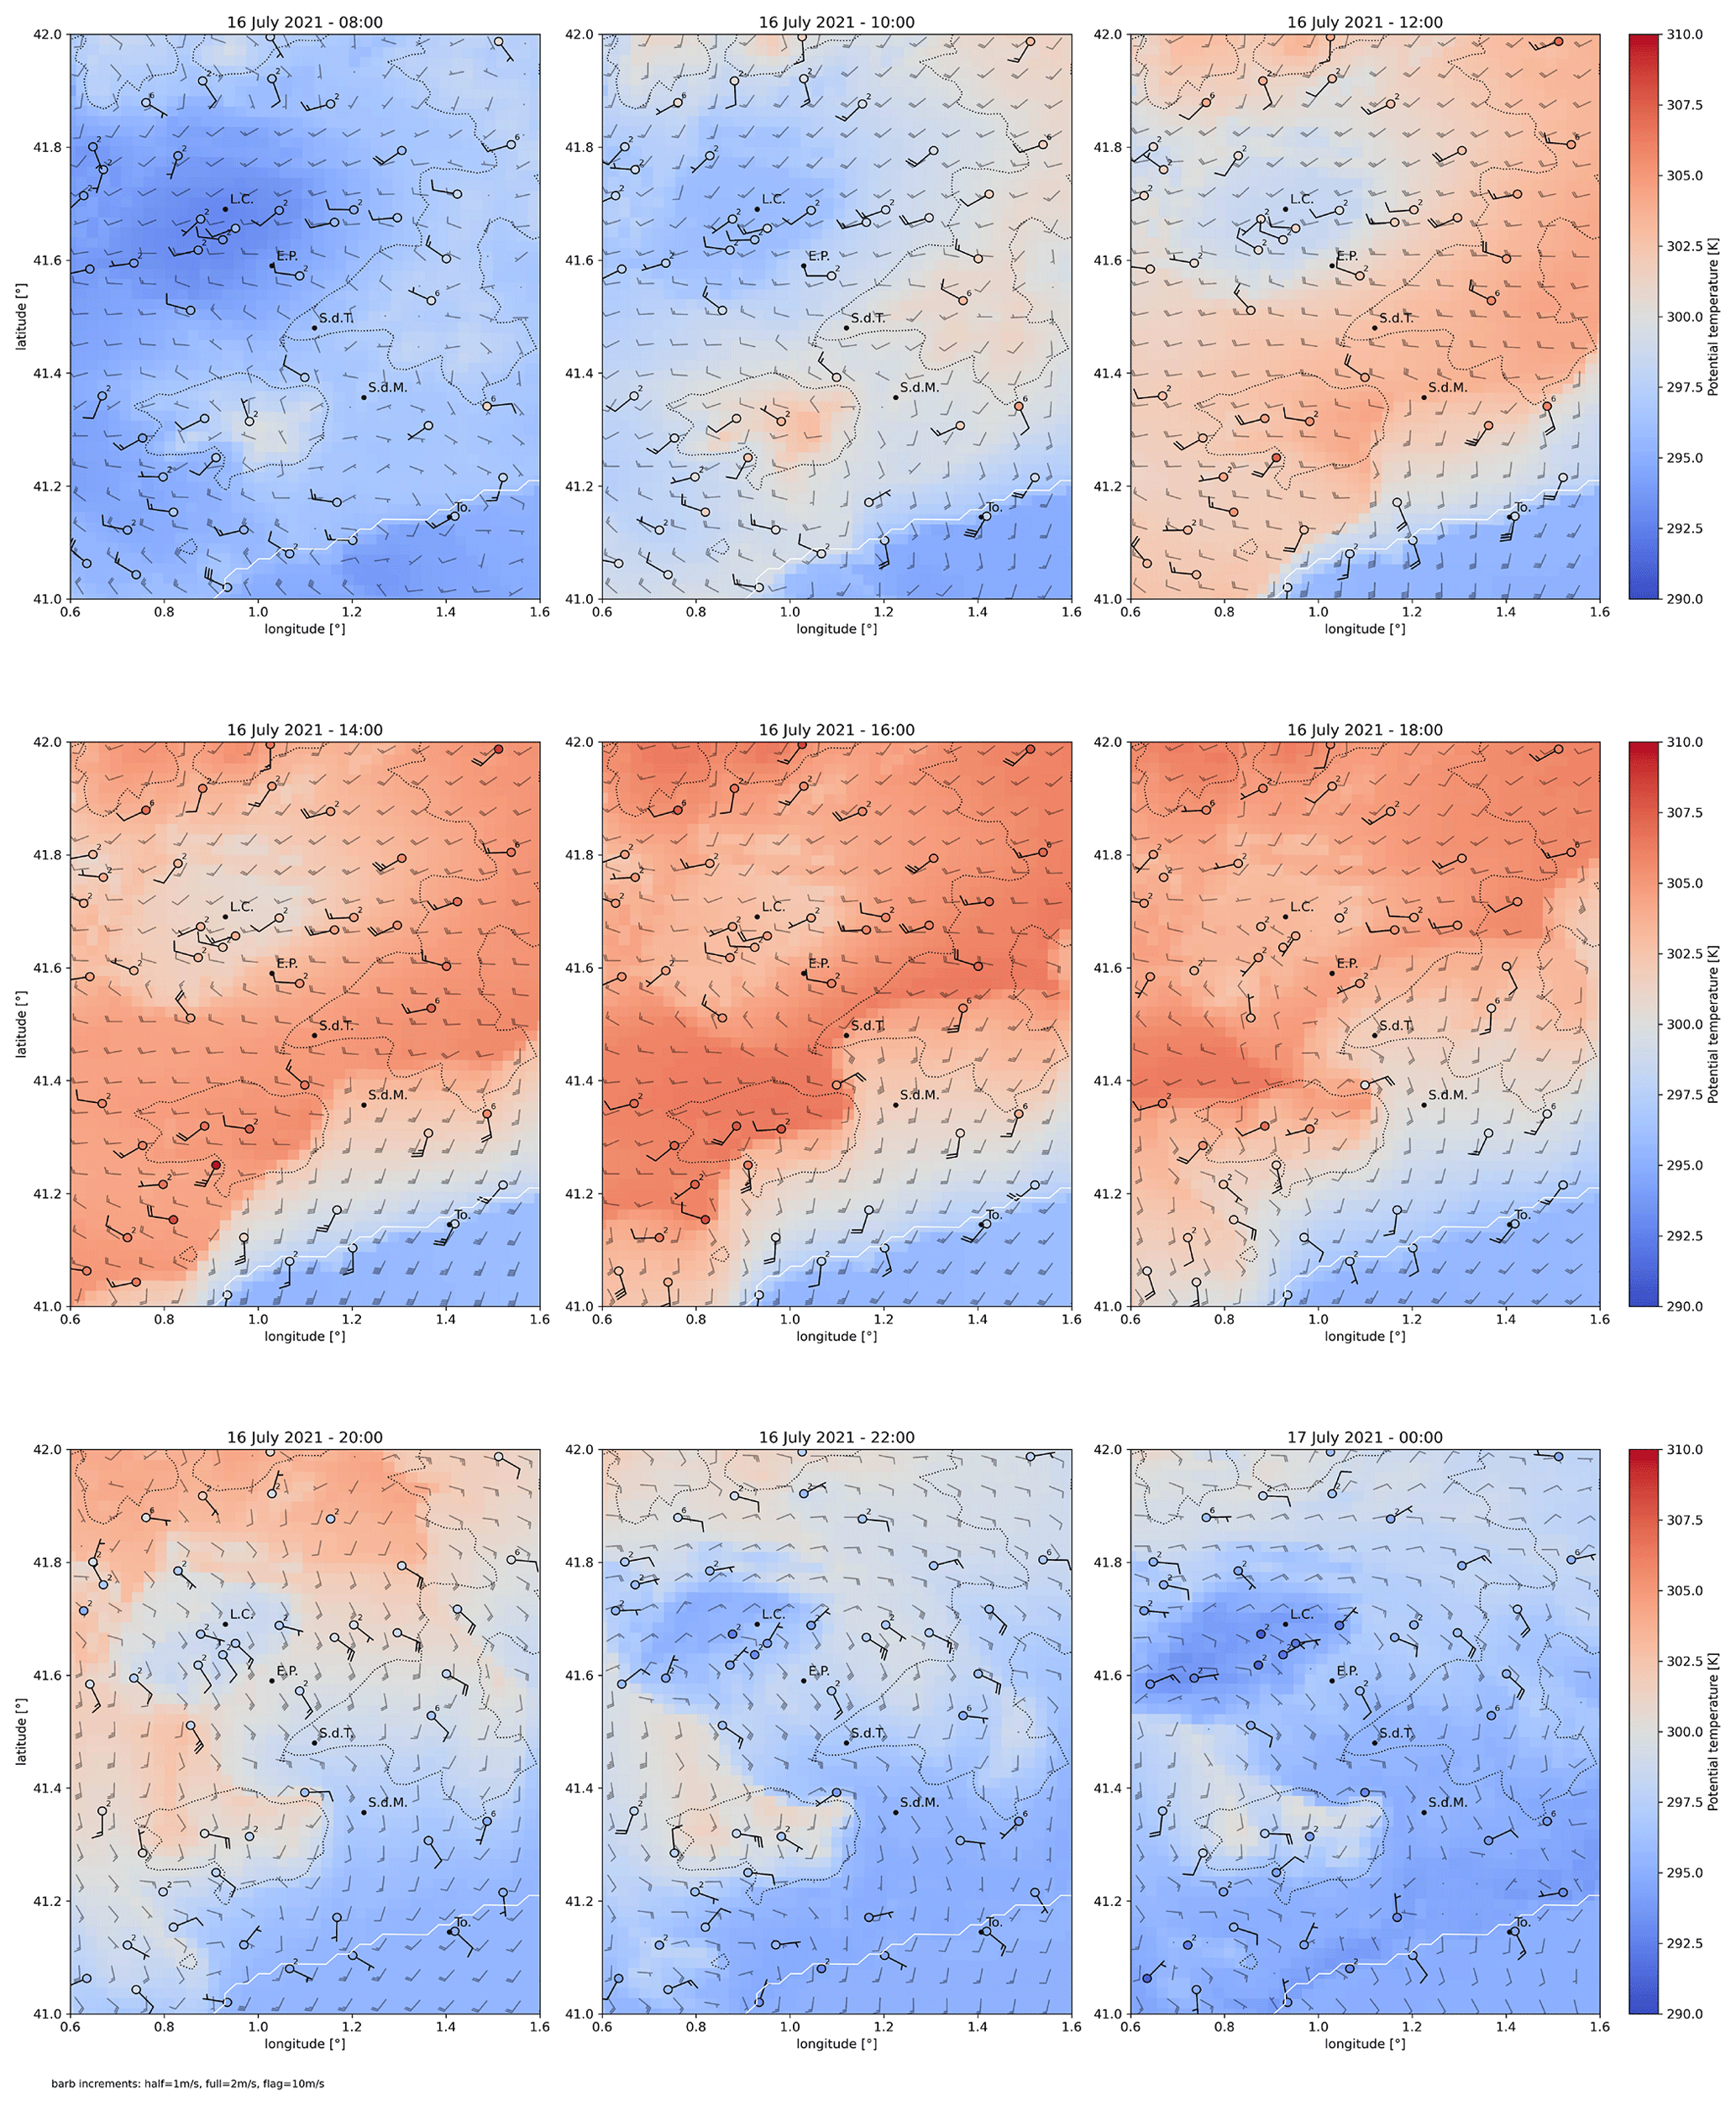
Figure A2Maps of observed and modeled potential temperature and wind along the course from 08:00 UTC on 16 July 2021 to 00:00 UTC on 17 July 2021. The color map represents the potential temperature at 2 , and the semi-transparent wind barbs represent the 10 wind speed modeled by Meso-NH. The observations are taken from the SMC network and are shown with opaque barbs and colored points. For each station the color inside the circle represents the potential temperature measured on the same scale as for the model color map. The measured winds are shown at the available measuring height. When this measuring height is not 10 m, the actual height is indicated as a subscript. The thin dotted line represents the iso-altitude line at 600 m. The white line is the coastline. The acronyms L.C., E.P., S.d.T., S.d.M., and To. stand, respectively, for La Cendrosa, Els Plans, Serra del Tallat, Serra de Miramar, and Torredembarra.
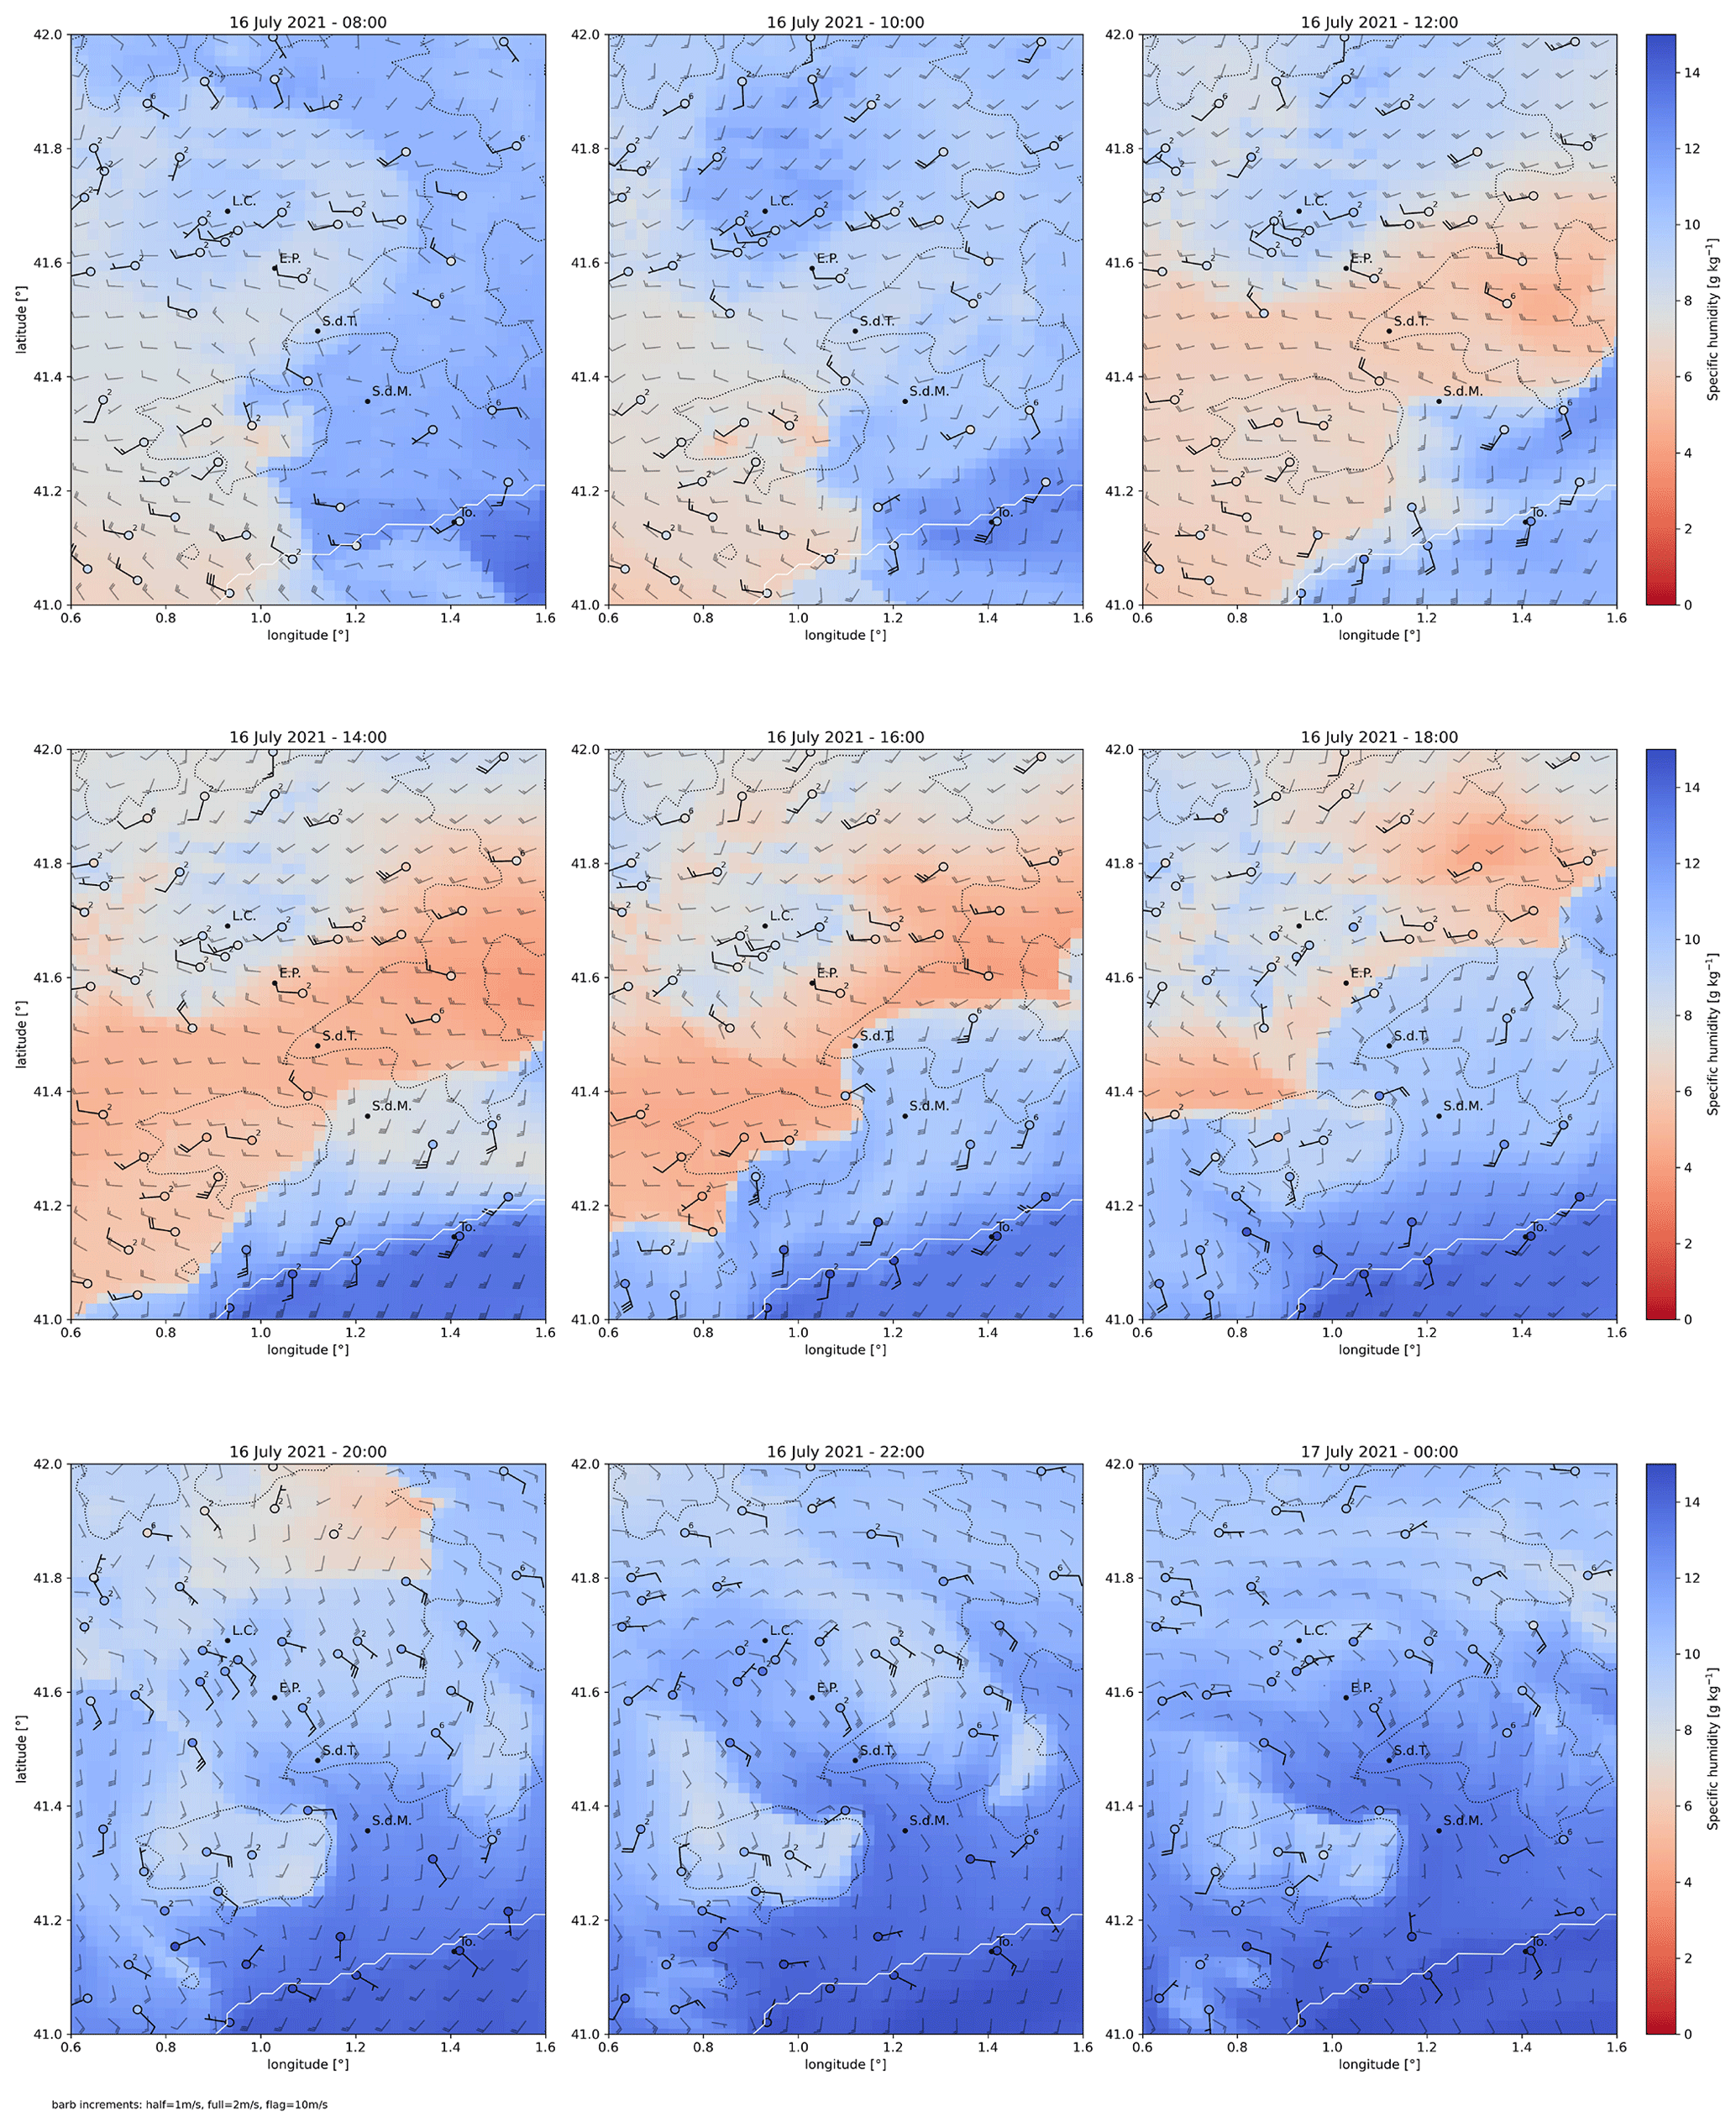
Figure A3As in Fig. A2 but with specific humidity instead of potential temperature.
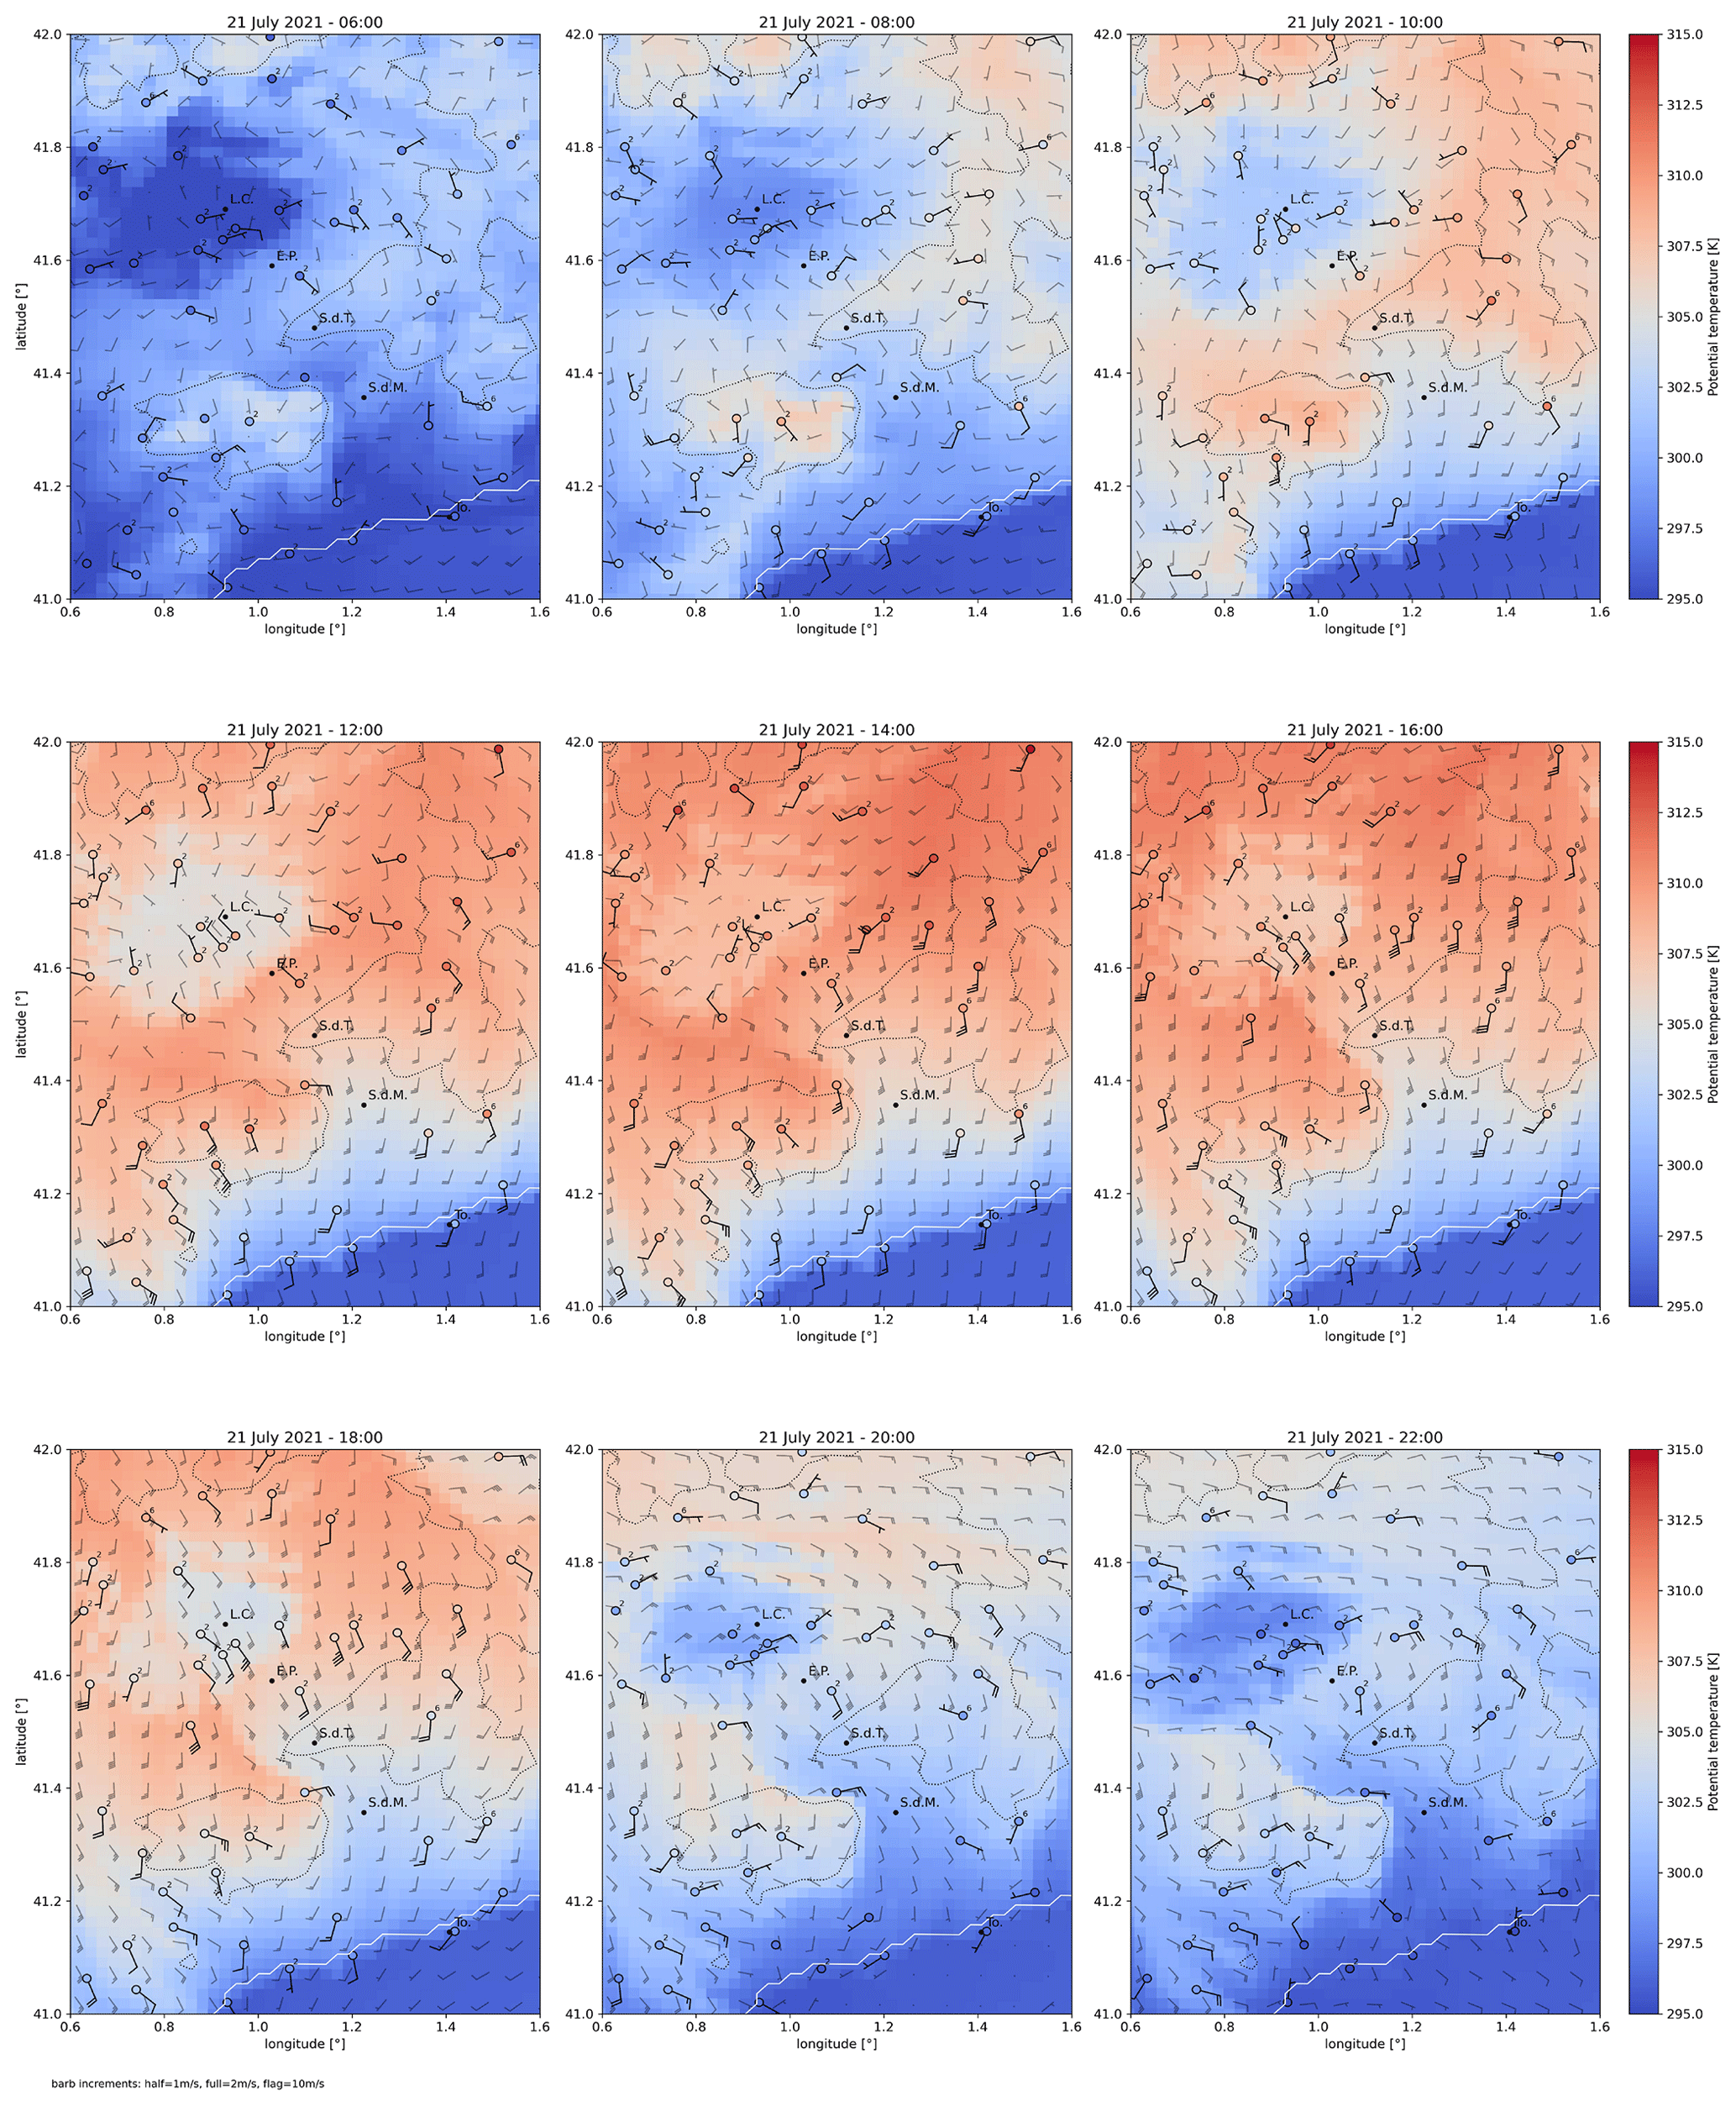
Figure A4As in Fig. A2 but for 21 July 2021.
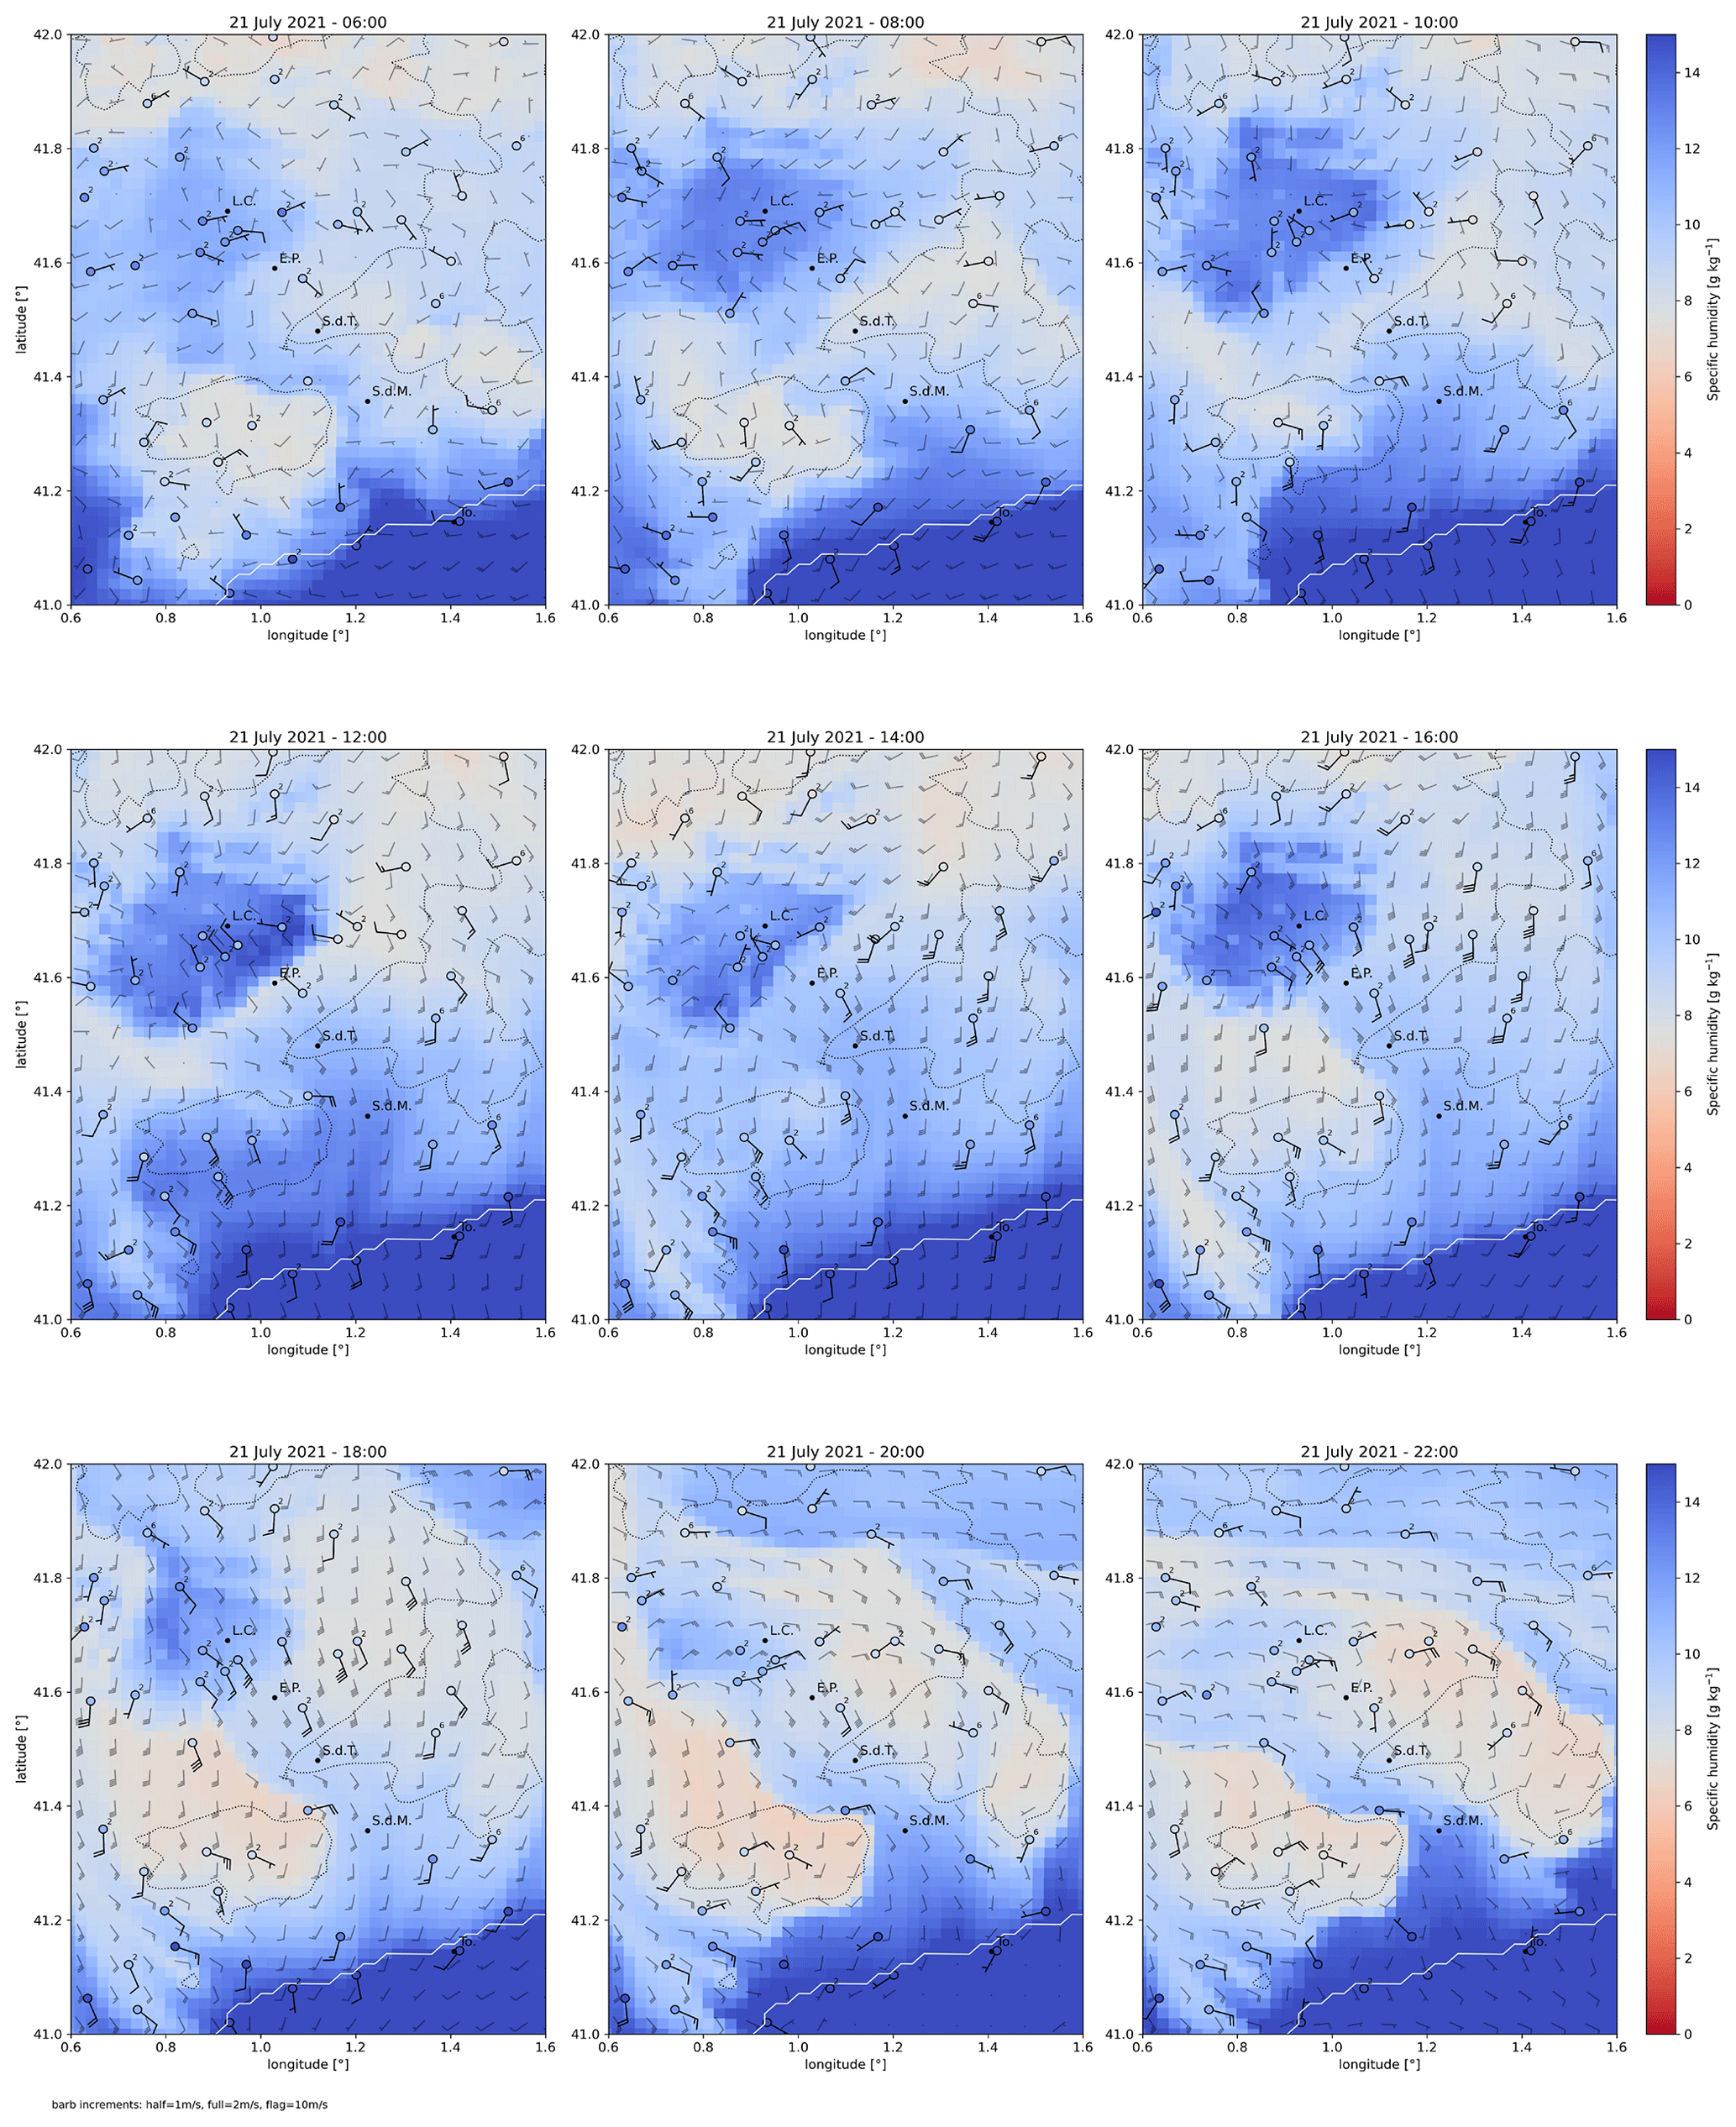
Figure A5As in Fig. A3 but for 21 July 2021.
Table A1List of automatic weather stations (AWSs) from the Servei Meteorològic de Catalunya (SMC) used in the study.
The observational data sets analyzed in this study are available in the LIAISE database, accessible at https://liaise.aeris-data.fr/page-catalogue/ (AERIS, 2021). The surface–atmosphere coupled model Meso-NH is open source and available at http://mesonh.aero.obs-mip.fr/ (Lac et al., 2018). The generated model output data supporting the results of this study are available from the corresponding author upon reasonable request.
TL performed the simulation, processed the experimental and model data, performed the analysis, and wrote the manuscript. MAJ, JC and DMV supervised the research and helped in interpreting the results. All authors discussed the results and commented on the manuscript.
The contact author has declared that none of the authors has any competing interests.
Publisher's note: Copernicus Publications remains neutral with regard to jurisdictional claims made in the text, published maps, institutional affiliations, or any other geographical representation in this paper. While Copernicus Publications makes every effort to include appropriate place names, the final responsibility lies with the authors.
The authors would like to thank Josep Ramon Miró Cubells for providing the AWS data from the Servei Meteorològic de Catalunya. The authors would also like to thank the UK Met Office and in particular Jeremy Price, Martin Best and Jennifer Brooke for setting up the Els Plans site and providing the corresponding in situ and radiosounding data.
This work was partially funded by the international mobility grant from the Toulouse Graduate School of Earth and Space Science (TESS) and by the French component of the LIAISE project, HILIAISE, Agence Nationale de la Recherche (ANR) grant no. ANR-19-CE01-0017. This work is also part of the research projects RTI2018-098693-B-C31 and PID2021-124006OB-I00 funded by MCIN/AEI/10.13039/501100011033 and by the European Regional Development Fund (ERDF; A way of making Europe).
This paper was edited by Michael Tjernström and reviewed by two anonymous referees.
AERIS: LIAISE Database, AERIS [data set], https://liaise.aeris-data.fr/page-catalogue/ (last access: 2 July 2024), 2021. a, b
Ali, E. and Cramer, W.: CCP 4 Mediterranean Region, IPCC, Tech. rep., Intergovernmental Panel on Climate Change, https://doi.org/10.1017/9781009325844.021, 2022. a
Boone, A., Best, M., Cuxart, J., Polcher, J., Quintana, P., Bellvert, J., Brooke, J., Canut-Rocafort, G., and Price, J.: Land Surface Interactions with the Atmosphere over the Iberian Semi-Arid Environment (LIAISE), GEWEX News, 29, 8–10, 2019. a, b
Bougeault, P. and Lacarrère, P.: Parameterization of Orography-Induced Turbulence in a Mesobeta-Scale Model, Mon. Weather Rev., 117, 1872–1890, https://doi.org/10.1175/1520-0493(1989)117<1872:POOITI>2.0.CO;2, 1989. a
Calvet, J.-C., Noilhan, J., Roujean, J.-L., Bessemoulin, P., Cabelguenne, M., Olioso, A., and Wigneron, J.-P.: An interactive vegetation SVAT model tested against data from six contrasting sites, Agr. Forest Meteorol., 92, 73–95, 1998. a
Capel Molina, J.: La presión atmosférica y los vientos del Monzón Ibérico en la Península Ibérica: Reflexiones sobre el Monzón Ibérico, Nimbus: Revista de climatología, meteorología y paisaje, 4, 5–60, 1999. a
Charnock, H.: Wind Stress on a Water Surface, Q. J. Roy. Meteorol. Soc., 81, 639–640, https://doi.org/10.1002/qj.49708135027, 1955. a
Confederación Hidrográfica del Ebro: Índices mensuales de Sequia, https://www.chebro.es/fr/web/guest/indices-mensuales (last access: 2 July 2024), 2023. a
Cosby, B. J., Hornberger, G. M., Clapp, R. B., and Ginn, T. R.: A Statistical Exploration of the Relationships of Soil Moisture Characteristics to the Physical Properties of Soils, Water Resour. Res., 20, 682–690, https://doi.org/10.1029/WR020i006p00682, 1984. a
Courant, R., Friedrichs, K., and Lewy, H.: On the partial difference equations of mathematical physics, AEC Research and Development Report, NYO-7689, 1956. a
Crosman, E. T. and Horel, J. D.: Sea and Lake Breezes: A Review of Numerical Studies, Bound.-Lay. Meteorol., 137, 1–29, https://doi.org/10.1007/s10546-010-9517-9, 2010. a, b, c, d
Cuxart, J., Bougeault, P., and Redelsperger, J.-L.: A turbulence scheme allowing for mesoscale and large-eddy simulations, Q. J. Roy. Meteorol. Soc., 126, 1–30, https://doi.org/10.1256/qj.03.130, 2000. a
Cuxart, J., Cunillera, J., Jiménez, M. A., Martínez, D., Molinos, F., and Palau, J. L.: Study of Mesobeta Basin Flows by Remote Sensing, Bound.-Lay. Meteorol., 143, 143–158, https://doi.org/10.1007/s10546-011-9655-8, 2012. a, b, c
Cuxart, J., Jiménez, M. A., Prtenjak Telišman, M., and Grisogono, B.: Study of a sea-breeze case through momentum, temperature, and turbulence budgets, J. Appl. Meteorol. Clim., 53, 2589–2609, https://doi.org/10.1175/JAMC-D-14-0007.1, 2014. a, b
De Wekker, S. F. and Kossmann, M.: Convective boundary layer heights over mountainous terrain—A review of concepts, Front. Earth Sci., 3, 1–22, https://doi.org/10.3389/feart.2015.00077, 2015. a
Decharme, B., Boone, A., Delire, C., and Noilhan, J.: Local evaluation of the Interaction between Soil Biosphere Atmosphere soil multilayer diffusion scheme using four pedotransfer functions, J. Geophys. Res.-Atmos., 116, 1–29, https://doi.org/10.1029/2011JD016002, 2011. a
Drobinski, P., Alonzo, B., Basdevant, C., Cocquerez, P., Doerenbecher, A., Fourrié, N., and Nuret, M.: Lagrangian dynamics of themistral during the HyMeX SOP2, J. Geophys. Res., 122, 1387–1402, https://doi.org/10.1002/2016JD025530, 2017. a
Durran, D.: Downslope Winds, in: Encyclopedia of Atmospheric Sciences, Academic Press, Oxford, 644–650, https://doi.org/10.1016/b0-12-227090-8/00288-8, 2003. a
Enger, L. and Grisogono, B.: The response of bora-type flow to sea surface temperature, Q. J. Roy. Meteorol. Soc., https://doi.org/10.1002/qj.49712454810, 1998. a
Faroux, S., Kaptué Tchuenté, A. T., Roujean, J.-L., Masson, V., Martin, E., and Le Moigne, P.: ECOCLIMAP-II/Europe: a twofold database of ecosystems and surface parameters at 1 km resolution based on satellite information for use in land surface, meteorological and climate models, Geosci. Model Dev., 6, 563–582, https://doi.org/10.5194/gmd-6-563-2013, 2013. a
Favà, V., Curto, J. J., and Llasat, M. C.: Changes in summer temperatures and rainfall in the northeastern Iberian Peninsula in the late 1960s and the weakening of the Iberian thermal low, Meteorol. Atmos. Phys., 131, 1367–1386, https://doi.org/10.1007/s00703-018-0643-0, 2019. a, b
Grisogono, B. and Belusic, D.: A review of recent advances in understanding the meso and microscale properties of the severe Bora wind, Tellus A, 61, 1–16, https://doi.org/10.1111/j.1600-0870.2008.00369.x, 2008. a, b, c
Haiden, T.: On the pressure field in the slope wind layer, J. Atmos. Sci., 60, 1632–1635, https://doi.org/10.1175/1520-0469(2003)60<1632:OTPFIT>2.0.CO;2, 2003. a, b
Heinemann, G.: The KABEG'97 field experiment: An aircraft-based study of Katabatic wind dynamics over the Greenland ice sheet, Bound.-Lay. Meteorol., 93, 75–116, https://doi.org/10.1023/A:1002009530877, 1999. a
Hoinka, K. P. and De Castro, M.: The Iberian Peninsula thermal low, Q. J. Roy. Meteor. Soc., 129, 1491–1511, https://doi.org/10.1256/qj.01.189, 2003. a, b
Hughes, M. and Hall, A.: Local and synoptic mechanisms causing Southern California's Santa Ana winds, Clim. Dynam., 34, 847–857, https://doi.org/10.1007/s00382-009-0650-4, 2010. a, b, c
Jiang, Q., Wang, Q., and Gabersek, S.: Mesoscale Variability of Surface Ducts During Santa Ana Wind Episodes, J. Geophys. Res.-Atmos., 127, e2022JD036698, https://doi.org/10.1029/2022JD036698, 2022. a, b
Jiménez, P. A., González-Rouco, J. F., Montávez, J. P., García-Bustamante, E., and Navarro, J.: Climatology of wind patterns in the northeast of the Iberian Peninsula, Int. J. Climatol., 29, 501–525, https://doi.org/10.1002/joc.1705, 2009. a, b
Jiménez, M. A., Grau, A., Martinez-Villagrasa, D., and Cuxart, J.: Characterisation of the marine-air intrusion Marinada in the Eastern Ebro subbasin, Int. J. Climatol., 43, 7682–7699, https://doi.org/10.1002/joc.8287, 2023. a, b, c, d, e, f, g, h, i, j, k, l, m
Jurčec, V.: On mesoscale characteristics of bora conditions in Yugoslavia, Pure Appl. Geophys., 119, 640–657, https://doi.org/10.1007/BF00878165, 1981. a
Lac, C., Chaboureau, J.-P., Masson, V., Pinty, J.-P., Tulet, P., Escobar, J., Leriche, M., Barthe, C., Aouizerats, B., Augros, C., Aumond, P., Auguste, F., Bechtold, P., Berthet, S., Bielli, S., Bosseur, F., Caumont, O., Cohard, J.-M., Colin, J., Couvreux, F., Cuxart, J., Delautier, G., Dauhut, T., Ducrocq, V., Filippi, J.-B., Gazen, D., Geoffroy, O., Gheusi, F., Honnert, R., Lafore, J.-P., Lebeaupin Brossier, C., Libois, Q., Lunet, T., Mari, C., Maric, T., Mascart, P., Mogé, M., Molinié, G., Nuissier, O., Pantillon, F., Peyrillé, P., Pergaud, J., Perraud, E., Pianezze, J., Redelsperger, J.-L., Ricard, D., Richard, E., Riette, S., Rodier, Q., Schoetter, R., Seyfried, L., Stein, J., Suhre, K., Taufour, M., Thouron, O., Turner, S., Verrelle, A., Vié, B., Visentin, F., Vionnet, V., and Wautelet, P.: Overview of the Meso-NH model version 5.4 and its applications, Geosci. Model Dev., 11, 1929–1969, https://doi.org/10.5194/gmd-11-1929-2018, 2018 (code available at: http://mesonh.aero.obs-mip.fr/, last access: 2 July 2024). a, b
Lawston, P. M., Santanello, J. A., Hanson, B., and Arsensault, K.: Impacts of irrigation on summertime temperatures in the pacific northwest, Earth Interact., 24, 1–26, https://doi.org/10.1175/EI-D-19-0015.1, 2020. a
Lobell, D., Bala, G., Mirin, A., Phillips, T., Maxwell, R., and Rotman, D.: Regional Differences in the Influence of Irrigation on Climate, J. Climate, 22, 2248–2255, https://doi.org/10.1175/2008JCLI2703.1, 2008. a
Lothon, M.: LIAISE_ELS-PLANS_LAERO_UHFWindProfiler-LowMode_L2, Aeris [data set], https://doi.org/10.25326/363, 2022. a
Lunel, T., Boone, A. A., and Moigne, P. L.: Irrigation Strongly Influences Near-Surface Conditions and Induces Breeze Circulation: Observational and Model-Based Evidence, Q. J. Roy. Meteor. Soc., online first, https://doi.org/10.1002/qj.4736, 2024. a, b, c, d
Mahrt, L.: Momentum balance of gravity flows, J. Atmos. Sci., 39, 2701–2711, https://doi.org/10.1175/1520-0469(1982)039<2701:MBOGF>2.0.CO;2, 1982. a
Martínez, D., Cuxart, J., and Cunillera, J.: Conditioned climatology for stably stratified nights in the Lleida area, Journal of Weather and Climate of the Western Mediterranean, 5, 13–24, 2008. a, b, c, d
Masson, V.: A Physically-Based Scheme For The Urban Energy Budget In Atmospheric Models, Bound.-Lay. Meteorol., 94, 357–397, https://doi.org/10.1023/A:1002463829265, 2000. a
Masson, V. and Bougeault, P.: Numerical Simulation of a Low-level Wind created Complex Orography: A Cierzo Case Study, Mon. Weather Rev., 124, 701–715, https://doi.org/10.1175/1520-0493(1996)124<0701:NSOALL>2.0.CO;2, 1996. a
Masson, V., Le Moigne, P., Martin, E., Faroux, S., Alias, A., Alkama, R., Belamari, S., Barbu, A., Boone, A., Bouyssel, F., Brousseau, P., Brun, E., Calvet, J.-C., Carrer, D., Decharme, B., Delire, C., Donier, S., Essaouini, K., Gibelin, A.-L., Giordani, H., Habets, F., Jidane, M., Kerdraon, G., Kourzeneva, E., Lafaysse, M., Lafont, S., Lebeaupin Brossier, C., Lemonsu, A., Mahfouf, J.-F., Marguinaud, P., Mokhtari, M., Morin, S., Pigeon, G., Salgado, R., Seity, Y., Taillefer, F., Tanguy, G., Tulet, P., Vincendon, B., Vionnet, V., and Voldoire, A.: The SURFEXv7.2 land and ocean surface platform for coupled or offline simulation of earth surface variables and fluxes, Geosci. Model Dev., 6, 929–960, https://doi.org/10.5194/gmd-6-929-2013, 2013. a, b
Miao, J. F., Kroon, L. J., Vilà-Guerau de Arellano, J., and Holtslag, A. A.: Impacts of topography and land degradation on the sea breeze over eastern Spain, Meteorol. Atmos. Phys., 84, 157–170, https://doi.org/10.1007/s00703-002-0579-1, 2003. a, b, c
Miller, S. T., Keim, B. D., Talbot, R. W., and Mao, H.: Sea breeze: Structure, forecasting, and impacts, Rev. Geophys., 41, 1011, https://doi.org/10.1029/2003RG000124, 2003. a, b
Mlawer, E. J., Taubman, S. J., Brown, P. D., Iacono, M. J., and Clough, S. A.: Radiative transfer for inhomogeneous atmospheres: RRTM, a validated correlated-k model for the longwave, J. Geophys. Res.-Atmos., 102, 16663–16682, https://doi.org/10.1029/97jd00237, 1997. a
Morcrette, J.-J.: Radiation and cloud radiative properties in the European Centre for Medium Range Weather Forecasts forecasting system, J. Geophys. Res.-Atmos., 96, 9121–9132, https://doi.org/10.1029/89JD01597, 1991. a
Nachtergaele, F., van Velthuizen, H., Verelst, L., Batjes, N. H., Dijkshoorn, K., van Engelen, V. W. P., Fischer, G., Jones, A., and Montanarela, L.: The harmonized world soil database, in: Proceedings of the 19th World Congress of Soil Science, Soil Solutions for a Changing World, Brisbane, Australia, 1–6 August 2010, pp. 34–37, 2010. a
Noilhan, J. and Mahfouf, J.-F.: The ISBA land surface parameterisation scheme, Global Planet. Change, 13, 145–159, 1996. a
Noilhan, J. and Planton, S.: A Simple Parameterization of Land Surface Processes for Meteorological Models, Mon. Weather Rev., 117, 536–549, https://doi.org/10.1175/1520-0493(1989)117<0536:ASPOLS>2.0.CO;2, 1989. a
Noual, G., Brunet, Y., Moigne, P. L., and Lac, C.: Simulating the effects of regional forest cover changes on mid-latitude boundary-layer clouds, J. Geophys. Res.-Atmos., 128, e2023JD038477, https://doi.org/10.1029/2023JD038477, 1–46, 2023. a
Ortega, M., Sánchez, E., Gutiérrez, C., Molina, M. O., and López-Franca, N.: Regional winds over the Iberian Peninsula (Cierzo, Levante and Poniente) from high-resolution COSMO-REA6 reanalysis, Int. J. Climatol., 43, 1016–1033, https://doi.org/10.1002/joc.7860, 2022. a, b, c, d
Orville, H. D.: On Mountain Upslope Winds, J. Atmos. Sci., 21, 622–633, https://doi.org/10.1175/1520-0469(1964)021<0622:OMUW>2.0.CO;2, 1964. a
Pergaud, J., Masson, V., Malardel, S., and Couvreux, F.: A parameterization of dry thermals and shallow cumuli for mesoscale numerical weather prediction, Bound.-Lay. Meteorol., 132, 83–106, https://doi.org/10.1007/s10546-009-9388-0, 2009. a
Pettré, P.: On the Problem of Violent Valley Winds, J. Atmos. Sci., 39, 542–554, https://doi.org/10.1175/1520-0469(1982)039<0542:OTPOVV>2.0.CO;2, 1981. a, b
Pokhrel, R. and Lee, H.: Estimation of the effective zone of sea/land breeze in a coastal area, Atmos. Pollt. Res., 2, 106–115, https://doi.org/10.5094/APR.2011.013, 2011. a
Poljak, G., Prtenjak, M. T., Kvakić, M., Strelec Mahović, N., and Babić, K.: Wind patterns associated with the development of daytime thunderstorms over Istria, Ann. Geophys., 32, 401–420, https://doi.org/10.5194/angeo-32-401-2014, 2014. a
Porson, A., Steyn, D. G., and Schayes, G.: Sea-breeze scaling from numerical model simulations, part II: Interaction between the sea breeze and slope flows, Bound.-Lay. Meteorol., 122, 31–41, https://doi.org/10.1007/s10546-006-9092-2, 2007. a
Poulos, G. and Zhong, S. S.: An observational history of small-scale katabatic winds in mid-latitudes, Geography Compass, 2, 1798–1821, https://doi.org/10.1111/j.1749-8198.2008.00166.x, 2008. a
Price, J.: LIAISE_ELS-PLANS_UKMO_MTO-30MIN_L2, Aeris [data set], https://doi.org/10.25326/430, 2023a. a
Price, J.: LIAISE_ELS-PLANS_UKMO_radiosondes_L1, Aeris [data set], https://doi.org/10.25326/429, 2023b. a
Redaño, A., Cruz, J., and Lorente, J.: Main features of the sea-breeze in Barcelona, Meteorol. Atmos. Phys., 46, 175–179, https://doi.org/10.1007/BF01027342, 1991. a, b
Segal, M. and Arritt, R. W.: Nonclassical mesoscale circulations caused by surface sensible heat- flux gradients, B. Am. Meteorol. Soc., 73, 1593–1604, https://doi.org/10.1175/1520-0477(1992)073<1593:NMCCBS>2.0.CO;2, 1992. a
Serafin, S. and Zardi, D.: Structure of the atmospheric boundary layer in the vicinity of a developing upslope flow system: A numerical model study, J. Atmos. Sci., 67, 1171–1185, https://doi.org/10.1175/2009JAS3231.1, 2010. a, b, c
Servei Meteorològic de Catalunya: Les Estacions Meteorològiques Automàtiques (EMA), Tech. rep., Generalitat de Catalunya, Departament de Territori i Sostenibilitat, B-18309-2011, 2011. a
Shrestha, P., Kurtz, W., Vogel, G., Schulz, J. P., Sulis, M., Hendricks Franssen, H. J., Kollet, S., and Simmer, C.: Connection Between Root Zone Soil Moisture and Surface Energy Flux Partitioning Using Modeling, Observations, and Data Assimilation for a Temperate Grassland Site in Germany, J. Geophys. Res.-Biogeo., 123, 2839–2862, https://doi.org/10.1029/2016JG003753, 2018. a
Simpson, J. E., Mansfield, D. A., and Milford, J. R.: Inland penetration of sea-breeze fronts, Q. J. Roy. Meteor. Soc., 103, 47–76, https://doi.org/10.1002/qj.49710343504, 1977. a, b, c
Smith, R. B.: Aerial Observations of the Yugoslavian Bora, J. Atmos. Sci., 44, 269–297, https://doi.org/10.1175/1520-0469(1987)044<0269:AOOTYB>2.0.CO;2, 1987. a, b, c
Sorooshian, S., Li, J., Hsu, K.-l., and Gao, X.: How significant is the impact of irrigation on the local hydroclimate in California's Central Valley? Comparison of model results with ground and remote-sensing data, J. Geophys. Res.-Atmos., 116, D06102, https://doi.org/10.1029/2010JD014775, 2011. a
Sridhar, V.: Tracking the Influence of Irrigation on Land Surface Fluxes and Boundary Layer Climatology, Journal of Contemporary Water Research and Education, 152, 79–93, https://doi.org/10.1111/j.1936-704x.2013.03170.x, 2013. a
Sutton, R. T., Dong, B., and Gregory, J. M.: Land/sea warming ratio in response to climate change: IPCC AR4 model results and comparison with observations, Geophys. Res. Lett., 34, 2–6, https://doi.org/10.1029/2006GL028164, 2007. a
Tudurí, E., Romero, R., López, L., García, E., Sánchez, J. L., and Ramis, C.: The 14 July 2001 hailstorm in northeastern Spain: Diagnosis of the meteorological situation, Atmos. Res., 67–68, 541–558, https://doi.org/10.1016/S0169-8095(03)00072-3, 2003. a
Yu, Y., Cai, X., King, J. C., and Renfrew, I. A.: Numerical Simulations of Katabatic Jumps in Coats Land, Antartica, Bound.-Lay. Meteorol., 114, 413–437, https://doi.org/10.1007/s10546-004-9564-1, 2005. a, b