the Creative Commons Attribution 4.0 License.
the Creative Commons Attribution 4.0 License.
 | 02 Jul 2024
Constraining non-methane VOC emissions with TROPOMI HCHO observations: impact on summertime ozone simulation in August 2022 in China
Shuzhuang Feng
Tianlu Qian
Mengwei Jia
Songci Zheng
Jiansong Chen
Fang Ying
Weimin Ju
Non-methane volatile organic compounds (NMVOC), serving as crucial precursors of O3, have a significant impact on atmospheric oxidative capacity and O3 formation. However, both anthropogenic and biogenic NMVOC emissions remain subject to considerable uncertainty. Here, we extended the Regional multi-Air Pollutant Assimilation System (RAPAS) using the ensemble Kalman filter (EnKF) algorithm to optimize NMVOC emissions in China in August 2022 by assimilating TROPOspheric Monitoring Instrument (TROPOMI) HCHO retrievals. We also simultaneously optimize NOx emissions by assimilating in situ NO2 observations to address the chemical feedback among VOCs–NOx–O3. Furthermore, a process-based analysis was employed to quantify the impact of NMVOC emission changes on various chemical reactions related to O3 formation and depletion. NMVOC emissions exhibited a substantial reduction of 50.2 %, especially in the middle and lower reaches of the Yangtze River, revealing a prior overestimation of biogenic NMVOC emissions due to an extreme heat wave. Compared to the forecast with prior NMVOC emissions, the forecast with posterior emissions significantly improved HCHO simulations, reducing biases by 75.7 %, indicating a notable decrease in posterior emission uncertainties. The forecast with posterior emissions also effectively corrected the overestimation of O3 in forecasts with prior emissions, reducing biases by 49.3 %. This can be primarily attributed to a significant decrease in the RO2+NO reaction rate and an increase in the NO2+OH reaction rate in the afternoon, thus limiting O3 generation. Sensitivity analyses emphasized the necessity of considering both NMVOC and NOx emissions for a comprehensive assessment of O3 chemistry. This study enhances our understanding of the effects of NMVOC emissions on O3 production and can contribute to the development of effective emission reduction policies.
- Article
(13269 KB) - Full-text XML
-
Supplement
(7798 KB) - BibTeX
- EndNote


Since the Chinese government implemented the Air Pollution Prevention and Control Action Plan in 2013, there has been a notable reduction in NOx emissions (Zheng et al., 2018). However, despite these advancements, the issue of O3 pollution persists and, in certain cases, has shown signs of worsening (Ren et al., 2022). The increase in O3 concentration can be attributed not only to adverse meteorological conditions but also predominantly to unbalanced joint control of non-methane volatile organic compounds (NMVOCs) and nitrogen oxides (NOx; Li et al., 2020). NMVOCs are vital precursors of O3 and have a substantial impact on atmospheric oxidation capacity, thereby altering the lifetimes of other pollutants. Accurately quantifying NMVOC emissions holds significant importance in investigating their impact on O3 chemistry and in formulating emission reduction policies.
Anthropogenic NMVOC emissions have traditionally been estimated using a bottom-up method. However, the accuracy and timeliness of these estimations face challenges owing to the scarcity of local measurements for emission factors, the incompleteness and unreliability of activity data, and the diverse range of species and technologies involved (Cao et al., 2018; Hong et al., 2017). Furthermore, uncertainties arise in model-ready NMVOC emissions due to spatial and temporal allocations using various “proxy” data for different source sectors (Li et al., 2017a). Li et al. (2021) reported substantial discrepancies among emission estimates in various studies, ranging 23 % to 56 %. Biogenic NMVOC emissions are typically estimated using models like the Model of Emissions of Gases and Aerosols from Nature (MEGAN; Guenther et al., 2012) and the Biogenic Emission Inventory System (BEIS; Pierce et al., 1998). NMVOC emissions result from the multiplication of plant-specific standard emission rates by dimensionless activity factors. Nonetheless, apart from inaccuracies in the distribution of plant functional types, empirical parameterization, especially concerning responses to temperature and drought stress, can introduce substantial uncertainties (Angot et al., 2020; Seco et al., 2022; Jiang et al., 2018). Warneke et al. (2010) determined isoprene emission rates through field measurements and conducted a comparison to MEGAN and BEIS estimates, revealing a notable tendency for MEGAN to overestimate emissions while BEIS consistently underestimated them. Similarly, Marais et al. (2014) found that MEGAN's isoprene emission estimates were 5–10 times higher than the canopy-scale flux measurements obtained from African field campaigns.
A top-down approach utilizing observed data has been developed for estimating VOC emissions. For instance, techniques based on aircraft- and ground-based field measurements such as the source–receptor relationships algorithm with Lagrangian particle dispersion model (Fang et al., 2016), mixed layer gradient techniques (Mo et al., 2020), eddy covariance flux measurements (Yuan et al., 2015), and the box model (Wang et al., 2020) have been employed to complement or verify bottom-up results. However, these approaches do not comprehensively consider the complex nonlinear chemical reactions and transport processes that VOCs undergo in the atmosphere. Formaldehyde (HCHO) and glyoxal (CHOCHO) in the atmosphere serve as crucial oxidization intermediates for various VOCs (Hong et al., 2021; Liu et al., 2012). Satellite-based observations can readily detect their presence in the form of vertical column density (VCD) from space, making them widely utilized for estimating NMVOC emissions. A commonly used approach assumes that the observed columns are locally linearly correlated with VOC emission rates (Palmer et al., 2006; Liu et al., 2012). However, this approach does not consider the spatial offset resulting from chemistry reactions and transport processes. Chaliyakunnel et al. (2019) conducted a Bayesian analysis to derive an optimal estimate of VOC emissions using HCHO measurements over the Indian subcontinent. Their results indicated that biogenic VOC emissions modeled by MEGAN v2.1 were overestimated by approximately 30 %–60 %, whereas anthropogenic VOC emissions derived from the REanalysis of the TROpospheric chemical composition (RETRO) inventory were underestimated by 13 %–16 %. Cao et al. (2018) employed the GEOS-Chem model and its adjoint, incorporating tropospheric HCHO and CHOCHO column data from the GOME-2A and Ozone Monitoring Instrument (OMI) satellites as constraints, to quantify Chinese NMVOC emissions. They demonstrated a low bias in the MEGAN model, in contrast to the significant overestimation shown in Bauwens et al. (2016), especially in southern China.
Several investigations have been conducted to explore the implications of inverted VOC emissions on surface O3. For instance, using the Eulerian box model, Zhou et al. (2023) employed concurrent VOC measurements to constrain anthropogenic VOC emissions. This led to improved simulations of VOCs and O3, with a reduction in high emissions by 15 %–36 % in the Pearl River Delta (PRD) region. Local model biases in simulating the oxidation of NMVOCs and O3 are closely related to uncertainties in NOx emissions (Wolfe et al., 2016; Chan Miller et al., 2017). To tackle these critical questions, Kaiser et al. (2018) applied an adjoint algorithm to estimate isoprene emission over the southeast US by downwardly adjusting anthropogenic NOx emissions by 50 % to rectify NO2 simulations. Their findings indicated that isoprene emissions from MEGAN v2.1 were overestimated by an average of 40 %, slightly lower than the 50 % reduction in Bauwens et al. (2016). Souri et al. (2020) simultaneously optimized NMVOC and NOx emissions utilizing Ozone Mapping and Profiler Suite (OMPS-NM) HCHO and OMI NO2 retrievals in east Asia. They found that predominantly anthropogenic NMVOC emissions from the mosaic Asian anthropogenic emission inventory (MIX-Asia) 2010 increased over the North China Plain (NCP), whereas predominantly biogenic NMVOC emissions from MEGAN v2.1 decreased over southern China after the adjustment. Unfortunately, the posterior simulations exacerbated the overestimation of O3 levels in northern China.
Most studies regarding the inversion of NMVOC emissions or its impact on O3 neglected the uncertainties associated with NOx-dependent production or loss of NMVOC oxidation and O3. An iteratively nonlinear joint inversion of NOx and NMVOCs using multi-species observations is expected to minimize the uncertainties in their emissions and is well-suited to address the intricate relationship among VOCs–NOx–O3. In this study, we extended the Regional multi-Air Pollutant Assimilation System (RAPAS) with the ensemble Kalman filter (EnKF) assimilation algorithm to enhance the optimization of NMVOC emissions over China, utilizing the TROPOspheric Monitoring Instrument (TROPOMI) HCHO retrievals with high spatial coverage and resolution. To more accurately quantify the impact of NMVOC emissions on O3, NOx emissions were simultaneously adjusted using nationwide in situ NO2 observations. Process analysis was subsequently employed to quantify various chemical pathways associated with O3 formation and loss. Through a top-down constraint on both types of emission, this study aims to offer a more scientific insight into the consequences of optimizing NMVOC emissions on O3 and to contribute to the development of appropriate emission reduction policies.
2.1 Data assimilation system
The RAPAS system (Feng et al., 2023) has been developed based on a regional chemical transport model (CTM) and on ensemble square root filter (EnSRF) assimilation modules (Whitaker and Hamill, 2002), which are employed to simulate atmospheric compositions and infer anthropogenic emissions by assimilating surface observations, respectively (Feng et al., 2022, 2020). The inversion process follows a two-step procedure within each inversion window, in which the emissions are inferred first and then input into the Community Multiscale Air Quality Modeling System (CMAQ) to simulate initial conditions of the next window. Meanwhile, the optimized emissions are transferred to the next window as prior emissions. The two-step inversion strategy facilitates error propagation and iterative emission optimization, which have proven the superiority and robustness of our system in estimating emissions (Feng et al., 2023). In this study, we extended the data frame to include the assimilation of TROPOMI HCHO retrievals to optimize NMVOC emissions. Concise descriptions of the forecast model, data assimilation approach, and experimental settings follow.
2.1.1 Atmospheric transport model
The Weather Research and Forecasting (WRF v4.0) model (Skamarock and Klemp, 2008) and the CMAQ (v5.0.2; Byun and Schere, 2006) were applied to simulate meteorological conditions and atmospheric chemistry, respectively. WRF simulations were conducted with a 27 km horizontal resolution, covering the entire mainland of China on a grid of 225×165 cells (Fig. 1). The CMAQ was run over the same domain but with the removal of three grid cells on each side of the WRF domain. The vertical settings in WRF and CMAQ were the same as in Feng et al. (2020). To account for the rapid expansion of urbanization, we updated underlying surface information for urban and built-up land using the MODIS Land Cover Type product (MCD12C1) Version 6.1 from 2022. Chemical lateral boundary conditions for NO, NO2, HCHO, and O3 were extracted from the output of the global CTM (i.e., the Whole Atmosphere Community Climate Model, WACCM) with a resolution of 0.9°×1.25° at 6 h intervals (Marsh et al., 2013). Meanwhile, boundary conditions for the other NMVOCs were obtained directly from background profiles. In the first data assimilation (DA) window, initial chemical conditions (excluding NMVOCs) were also derived from the WACCM outputs, whereas in subsequent windows, they were derived through forward simulation using optimized emissions from the previous window. Table S1 in the Supplement lists the detailed physical and chemical configurations. To assess the impact of updated NMVOC emissions on O3 production efficiency, we further decoupled the contribution of the primary chemical processes from the O3 levels using the CMAQ integrated reaction rate (IRR) analysis.
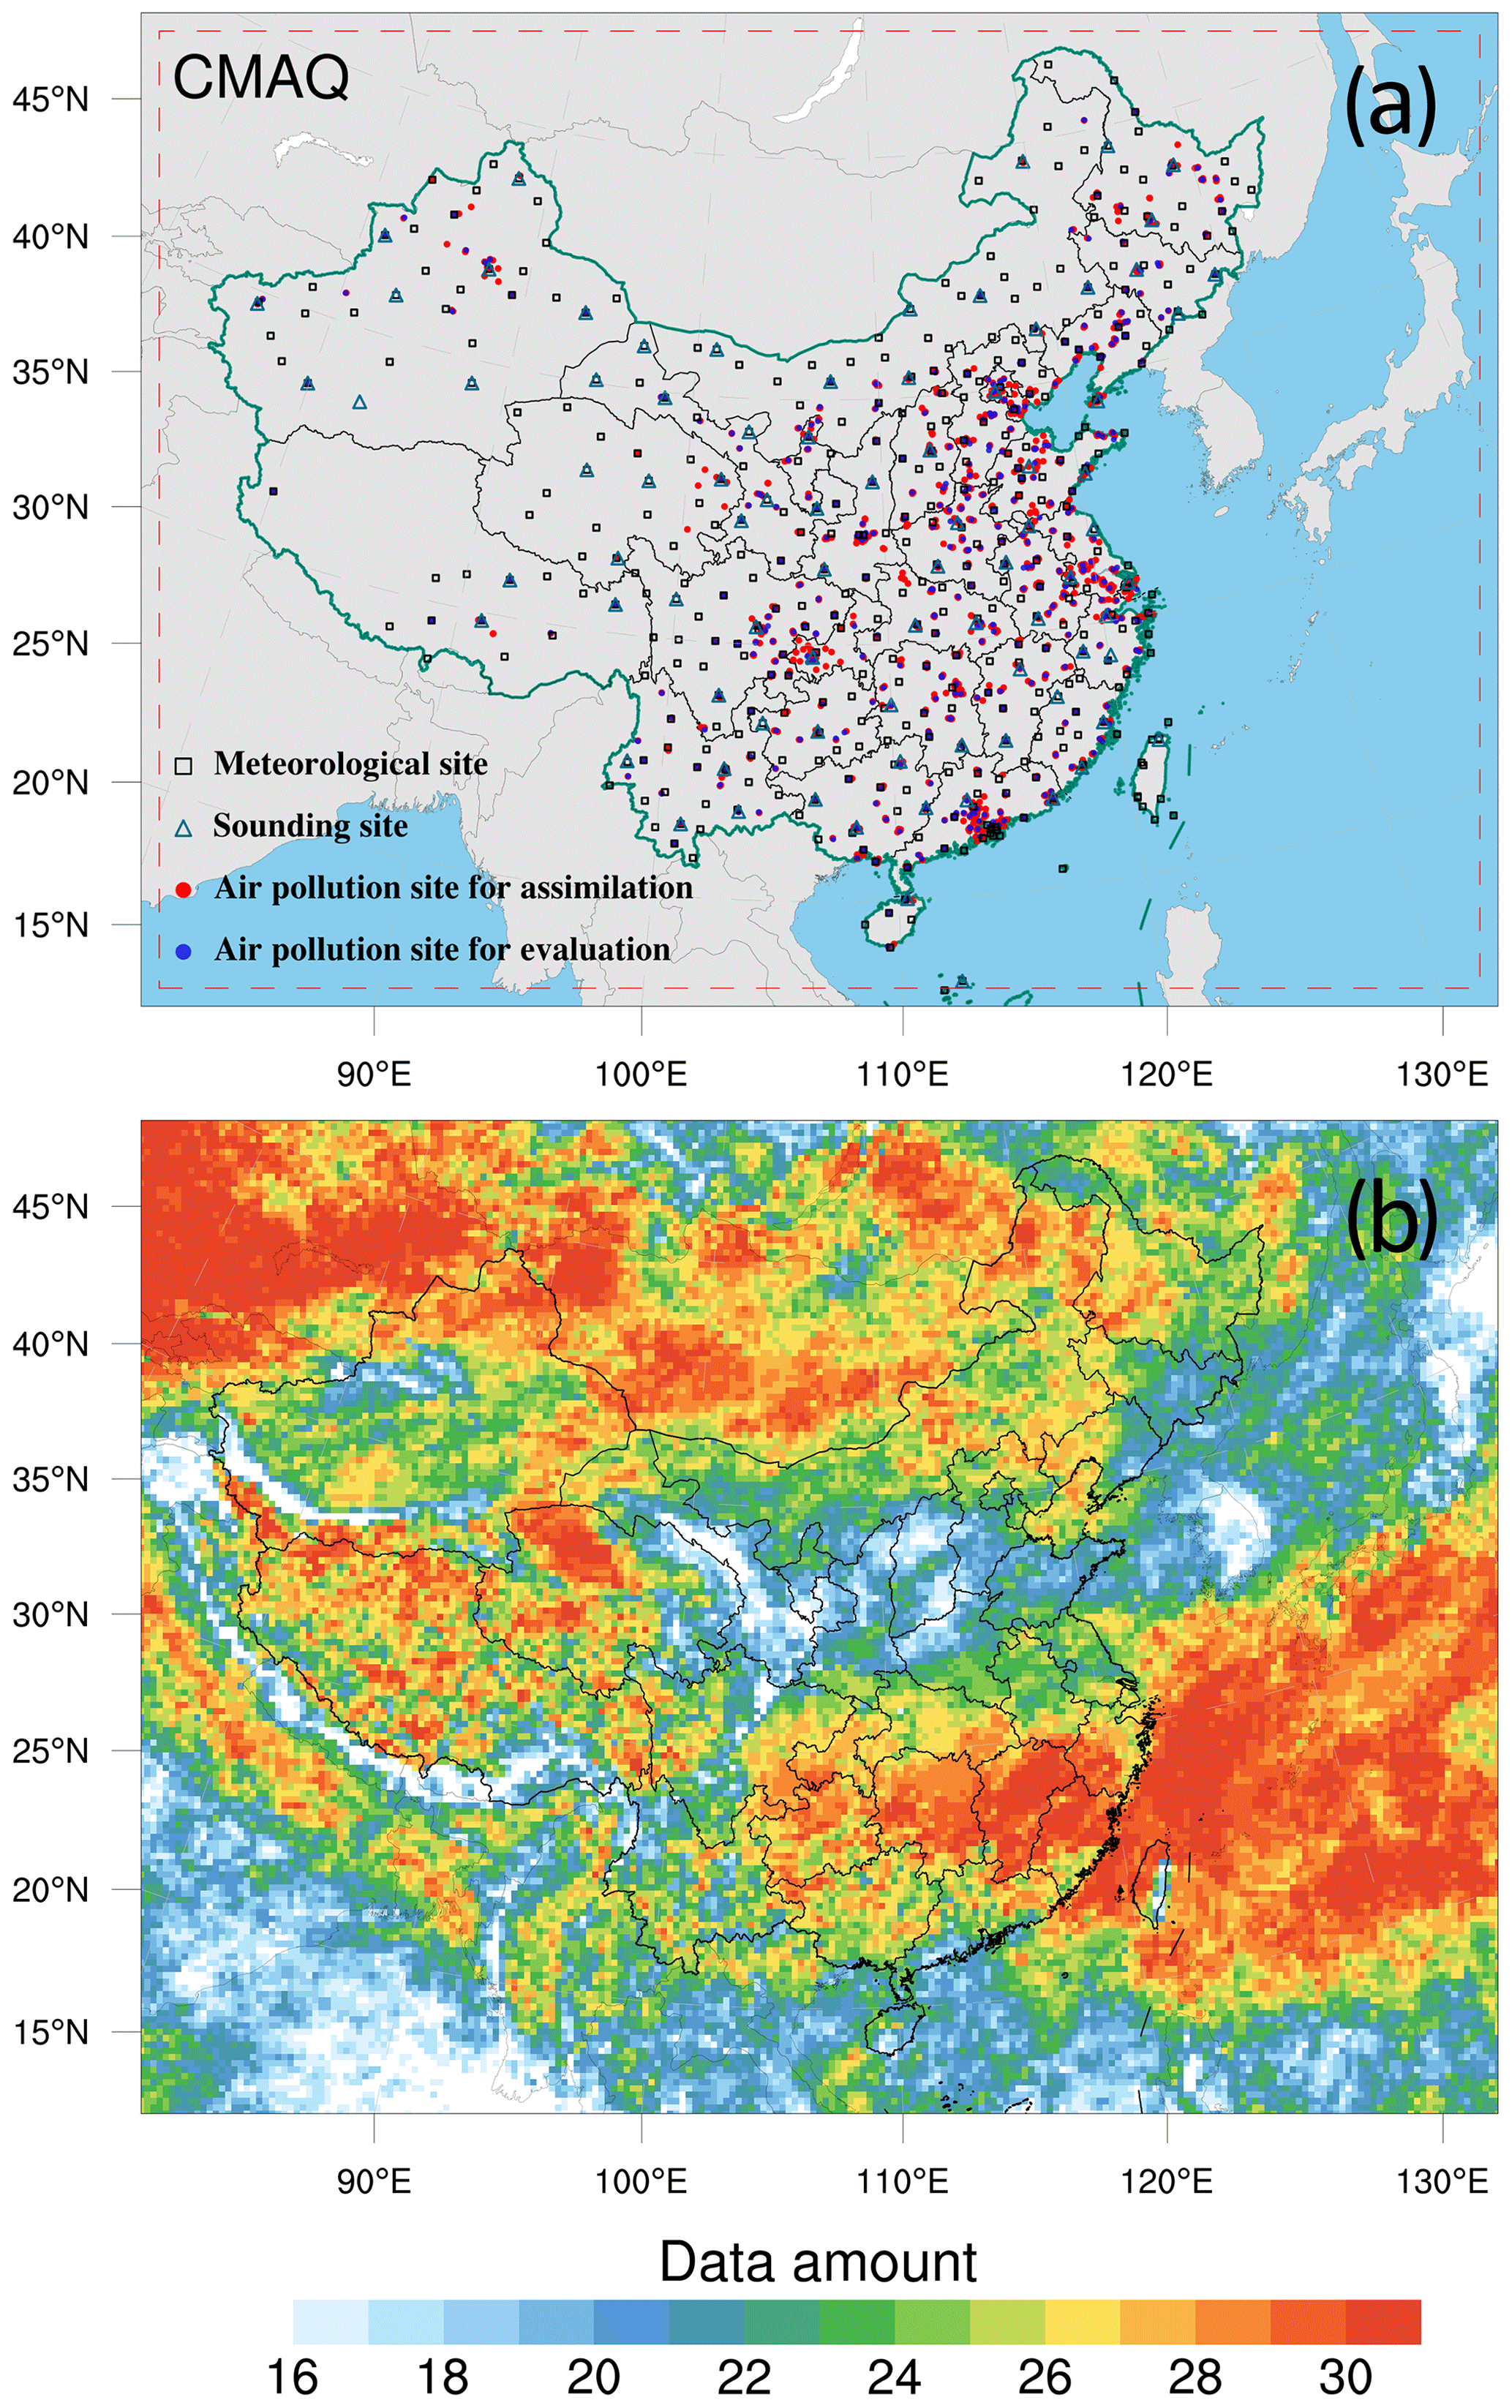
Figure 1Model domain and observation network (a) and number of TROPOMI HCHO data retrievals during August 2022 in each grid (b). The dashed red frame delineates the CMAQ computational domain; black squares denote surface meteorological measurement sites; navy triangles indicate sounding sites (Text S1 in the Supplement); and red and blue dots represent air pollution measurement sites, where red dots are used for assimilation and blue dots for independent evaluation.
2.1.2 EnKF assimilation algorithm
The emissions are constrained using the ensemble square root filter (EnSRF) algorithm introduced by Whitaker and Hamill (2002). This approach fully accounts for temporal and geographical variations in both the transportation and the chemical reactions within the emission estimates. During the forecast step, the background ensembles are derived by applying perturbation to the prior emissions. The perturbed samples are typically drawn from Gaussian distributions with a mean of zero and a standard deviation equal to the prior emission uncertainty in each grid cell. Ensemble runs of the CMAQ were subsequently performed to propagate the background errors with each ensemble sample of state vectors.
In the analysis step, the ensemble mean of the analyzed state is regarded as the best estimate of emissions, which is obtained by updating the background ensemble mean through the following equations:
where y is the observational vector; H represents the observation operator mapping model space to observation space; the expression quantifies the disparities between simulated and observed concentrations; PbHT illustrates how uncertainties in emissions relate to uncertainties in simulated concentrations; and the Kalman gain matrix K, dependent on background error covariance Pb and observation error covariance R, determines the relative contributions to the updated analysis.
State variables for emissions include NOx and NMVOCs. To reduce the degree of freedom in the analysis and avoid the difficulty associated with estimating spatiotemporal variations in background errors for individual species, we focus on optimizing the lumped total NMVOC emissions. During the forecast step, we differentiate individual NMVOC species emissions from the total NMVOC emissions using bottom-up statistical information. For a consistent comparison between simulations and observations, model-simulated NO2 was diagnosed at the time and location of surface NO2 measurements, whereas model-simulated HCHO was horizontally sampled to align with TROPOMI HCHO VCD retrievals, and subsequently integrated vertically.
In this study, the DA window was set to 1 d and daily TROPOMI HCHO columns were utilized as observational constraints in our inversion framework. The ensemble size was set to 50 to strike a balance between computational cost and inversion accuracy. To reduce the impact of unrealistic long-distance error correlations, the Gaspari–Cohn function (Gaspari and Cohn, 1999) was utilized as covariance localization to ensure the meaningful influence of observations on state variables within a specified cutoff radius while mitigating their negative impacts on distant state variables. The optimal localization scale is interconnected with factors such as the assimilation window, the dynamic system, and the lifetime of chemical species. Given an average wind speed of 2.8 m s−1 (Table S2 in the Supplement) and a DA window of 1 d, the localization scales for NO2 and HCHO, both characterized as highly reactive species with lifespans of just a few hours, were set to 150 and 100 km, respectively.
2.2 Observation data and errors
Considering the availability of HCHO data, we utilized daily offline retrievals of tropospheric HCHO columns from Sentinel-5P (S5P) L3 TROPOMI data obtained through the Google Earth Engine (De Smedt et al., 2018). The S5P satellite follows a near-polar sun-synchronous orbit at an altitude of 824 km with a 17 d repeating cycle. It crosses the Equator at 13:30 local solar time (LST) on the ascending node. The spatial resolution at nadir was refined to 3.5 km×5.5 km on 6 August 2019. Following the recommendations in the S5P HCHO product user manual, we filtered the source data to exclude pixels with a qa_value less than 0.5 for HCHO column number density and 0.8 for aerosol index (AER_AI). The remaining high-quality pixels with minimal snow/ice or cloud interference are averaged to 27 km grids. Figure 1b illustrates the coverage and number of TROPOMI HCHO data retrievals in August 2022 after processing. Although the distribution of filtered data exhibits spatial nonuniformity, most grid cells have observational coverage for over half of the time, particularly in the southern region of China where NMVOC emissions are higher. Based on validation against a global network of 25 ground-based Fourier transform infrared spectroscopy (FTIR) column measurements (Vigouroux et al., 2020), TROPOMI overestimates HCHO emissions by 25 % ( ) in clean regions and underestimates by 30 % ( ) in polluted regions. Therefore, we set the measurement error to 30 %. To evaluate the effect of observational data retrieval errors in emission estimates, we conducted a sensitivity experiment in which HCHO columns were empirically bias-corrected according to the error characteristics described above (Fig. S1 in the Supplement). The posterior emissions increased by 12.8 % compared to those in the base experiment (EMDA), indicating that the existing retrieval error in HCHO measurements likely exerts an influence on the estimation of NMVOC emissions. The representation error can be disregarded because the model resolution significantly surpasses that of the TROPOMI pixels.
To address the chemical feedback among VOCs–NOx–O3, we also simultaneously optimized NOx emissions by assimilating in situ NO2 observations. The extensively covered high-precision monitoring network can provide sufficient constraints for emission inversion (Fig. 1a). Hourly averaged surface NO2 observations were obtained from national air quality control stations from the Ministry of Ecology and Environment of the People's Republic of China (https://air.cnemc.cn:18007/, last access: 5 May 2023). In cases where multiple stations were located within the same grid, a random site was chosen for validation while the remaining sites were averaged to mitigate the impact of error correlation (Houtekamer and Zhang, 2016) for assimilation. In total, 1276 stations were chosen for assimilation and an additional 425 independent stations were selected for verification (Fig. 1a). The observation error covariance matrix R incorporates contributions from both measurement errors and representation errors. The measurement error is defined as ε0=1.0 + 0.005×Π0, where Π0 represents the observed NO2 concentration. Following the approach of Elbern et al. (2007) and Feng et al. (2018), the representative error is defined as , where γ is a tunable parameter (here, γ=0.5), Δl is the grid spacing (27 km), and L is the radius (here, L=0.5) of the observation's influence area. The total observation error (r) was defined as . The observation errors are assumed to be uncorrelated, such that R is a diagonal matrix.
2.3 Prior emissions and uncertainties
The prior anthropogenic NOx and NMVOC emissions for China were obtained from the most recent Multi-resolution Emission Inventory for China from 2020 (MEIC, http://www.meicmodel.org/, last access: 8 May 2023; Zhang et al., 2009). For anthropogenic emissions outside China, we utilized the mosaic Asian anthropogenic emission inventory (MIX) for base year 2010 (Li et al., 2017b). The daily emission inventory, which was arithmetically averaged from the combined monthly emission inventory, was employed as the first guess. Ship emissions were derived from the shipping emission inventory model (SEIM) for 2017, which was calculated based on the observed vessel automatic identification system (Liu et al., 2017). Biomass burning emissions were retrieved from the Global Fire Emissions Database version 4.1 (GFED v4, https://www.globalfiredata.org/, last access: 8 May 2023; van der Werf et al., 2017; Mu et al., 2011). Biogenic NOx and NMVOC emissions were calculated using the Model of Emissions of Gases and Aerosols from Nature (MEGAN) developed by Guenther et al. (2012).
As previously mentioned, the optimized emissions are transferred to the next DA window as prior emissions for iterative inversion. For biogenic emissions, they are decomposed into hourly scales, based on the daily varying temporal profiles in MEGAN as model inputs. Daily emission variations will largely dominate the uncertainty in emissions. Taking into account compensation for model errors and avoiding filter divergence, we consistently applied an uncertainty of 25 % to each model grid of NOx emissions at each DA window, as in Feng et al. (2020). NMVOC emissions typically exhibit greater uncertainties compared to NOx emissions (Li et al., 2017b). Based on model evaluation, the uncertainty in NMVOC emissions was set to 40 % (Kaiser et al., 2018; Souri et al., 2020; Cao et al., 2018). A sensitivity experiment involving a doubling of the prior uncertainty (80 %) revealed that the differences in posterior NMVOC emissions amounted to a mere 0.2 % (Fig. S2 in the Supplement). The implementation of a two-step inversion strategy allows for the timely correction of residual errors from the previous assimilation window in the current window, thus ensuring that the RAPAS system has relatively low dependence on prior uncertainty settings. This study also addresses uncertainties in emissions for CO, SO2, primary PM2.5, and coarse PM10 to consider the chemical feedback between different species following Feng et al. (2023).
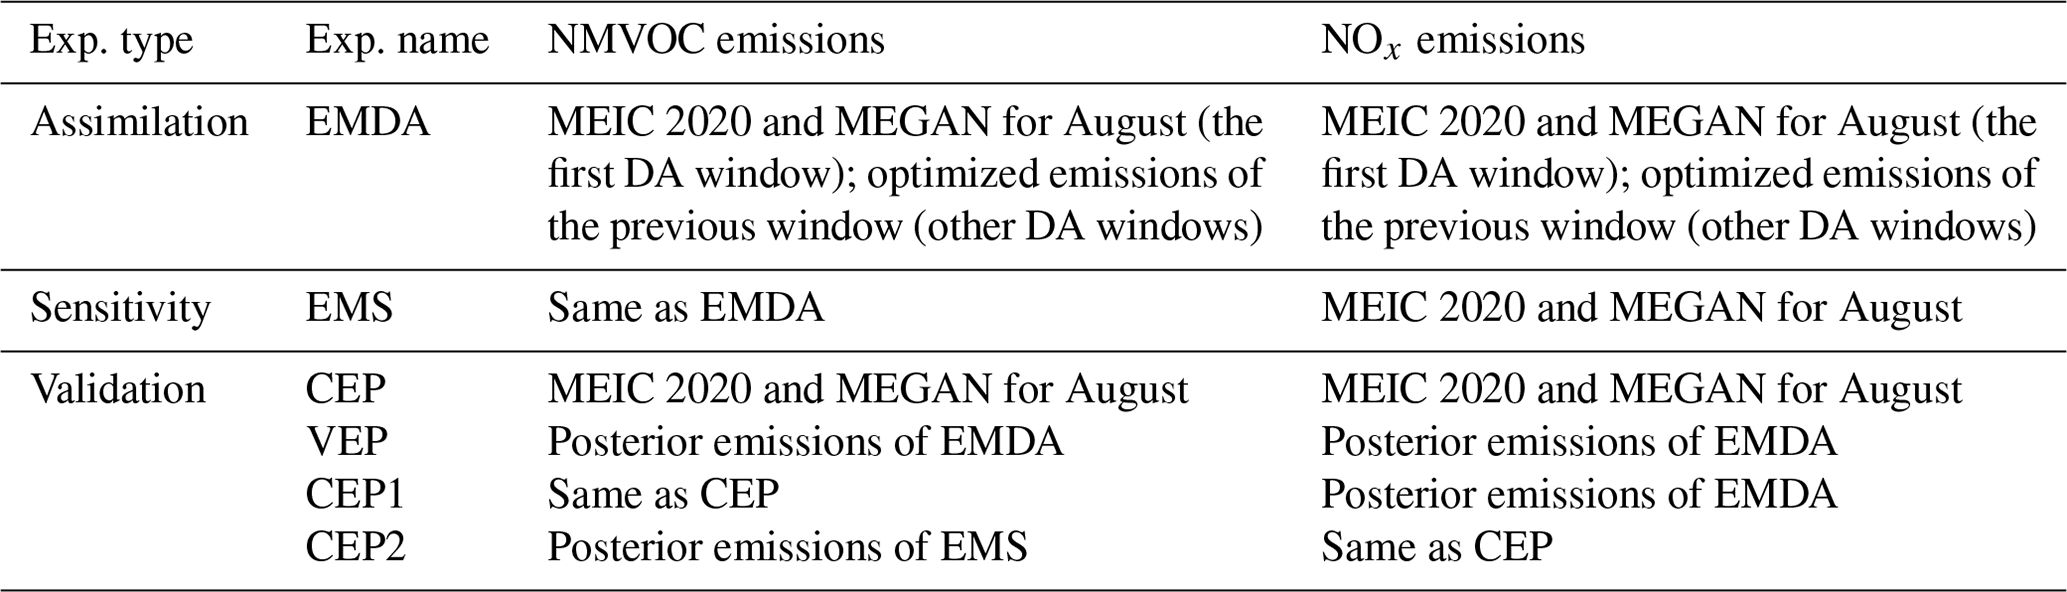
During the summer of 2022, southern China experienced severe heat wave conditions. The combination of high temperatures and drought had a pronounced effect on vegetation growth and NMVOC emissions, thereby influencing O3 production (Wang et al., 2023). Consequently, we opted to focus on August 2022, as it presented an ideal period for testing the capabilities of our DA system. Before implementing the emission inversion, a relatively perfect initial field is generated at 00:00 UTC on 1 August 2022 by conducting a 5 d simulation with 6 h interval 3D-Var data assimilation. Subsequently, daily emissions are continuously updated over the entire month of August (EMDA). Additionally, we designed a sensitivity experiment (EMS) to illustrate the significance of optimizing NOx emissions in quantifying VOC–O3 chemical reactions. In this experiment, NOx emissions were not optimized. To validate the posterior emissions of NOx and NMVOCs in EMDA, we compared two parallel forward simulation experiments, denoted CEP and VEP, corresponding to prior and posterior emission scenarios, respectively, against NO2 and HCHO measurements. To investigate the impact of optimizing NMVOC emissions on the secondary production and loss of surface O3, a forward simulation experiment (CEP1) was conducted with the prior NMVOC emissions and the posterior NOx emissions. Another forward modeling experiment (CEP2) used the posterior emissions of EMS to evaluate its performance. All experiments employ identical meteorological fields, as well as the same gas-phase and aerosol modules. Table 1 summarizes the different emission inversion and validation experiments conducted in this study.
Table 1The assimilation, sensitivity, and validation experiments conducted in this study.
4.1 Inverted emissions
Figure 2 shows the spatial distribution of temporally averaged prior and posterior NMVOC emissions along with the differences in NMVOC emissions. Hotspots of prior NMVOC emissions were prevalent across much of central and southern China. However, posterior NMVOC emissions were predominantly concentrated in the NCP, Yangtze River Delta (YRD), PRD, and Sichuan Basin (SCB), areas characterized by high levels of anthropogenic activity. High emissions are also located in parts of central and southern China with a warm climate favorable for emitting biogenic NMVOCs. Employing TROPOMI HCHO observations as constraints led to widespread decreases of approximately 60 %–70 % over these areas, indicating substantial biogenic NMVOC emissions. In northwestern China, there was a moderate increase in NMVOC emissions.
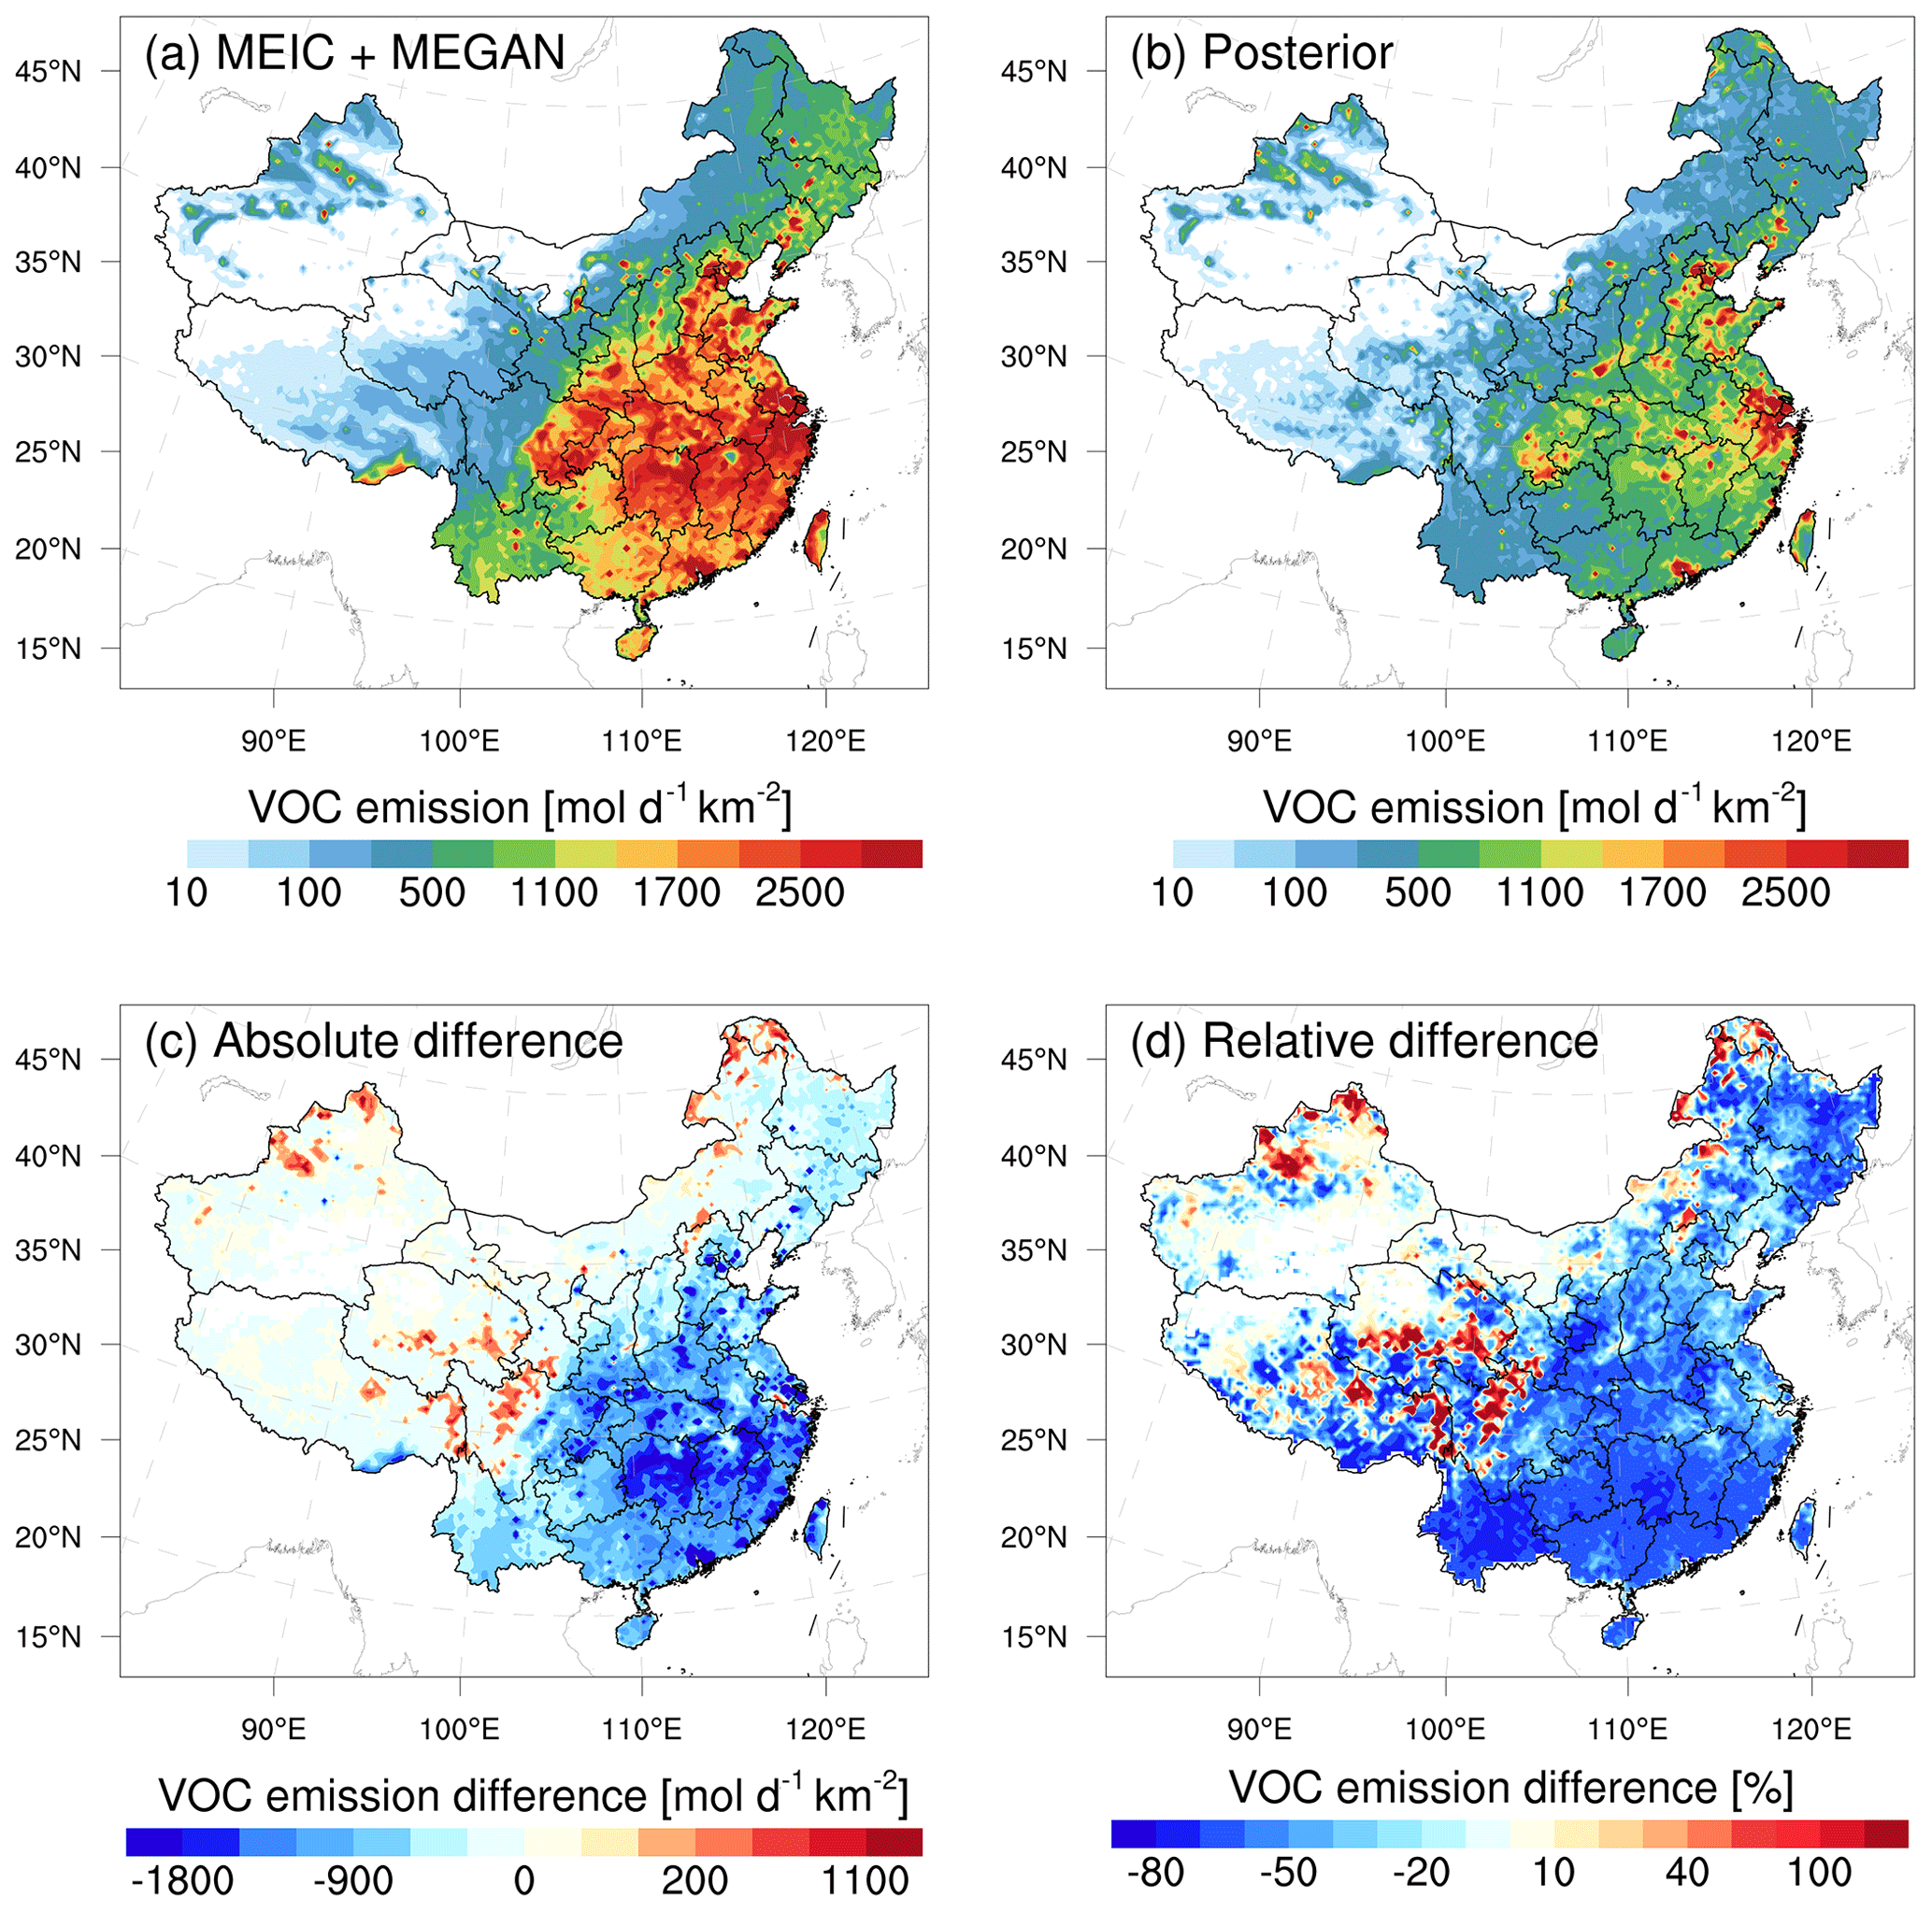
Figure 2Spatial distribution of the time-averaged (a) prior emissions (MEIC 2020 + MEGAN), (b) posterior emissions, (c) absolute difference (posterior minus prior), and (d) relative difference in NMVOCs over China.
Potential significant TROPOMI retrieval errors in polluted regions could exacerbate the emission decreases (Text S2 in the Supplement). Additionally, uncertainties in MEGAN parameterization have significant implications for NMVOC emission estimations, particularly concerning the responses of vegetation in MEGAN to temperature and drought stress (Angot et al., 2020; Jiang et al., 2018). Zhang et al. (2021) highlighted that the temperature-dependent activity factor noticeably increases with rising temperatures in MEGAN. P. Wang et al. (2021) pointed out that the lack of a drought scheme is one of the factors causing the overestimation of isoprene emissions in MEGAN. Opacka et al. (2022) optimized the empirical parameter in the MEGAN v2.1 soil moisture stress algorithm, resulting in significant reductions in isoprene emissions and providing better agreement between modeled and observed HCHO temporal variability in the central US. During the study period, China experienced severe heat wave conditions, which may have further hindered MEGAN's ability to effectively capture the impacts of high temperatures and drought on vegetation, thus resulting in significant overestimation in NMVOC emissions (Wang et al., 2022). Ultimately, the biogenic NMVOC emissions decreased by 53.7 %, which was higher than the 43.4 % decrease in anthropogenic NMVOC emissions (Fig. S3 in the Supplement). Overall, the large magnitude of emission decrease of 50.2 % in our inversion is comparable to studies in southern China (Bauwens et al., 2016; Zhou et al., 2023), the southeastern US (Kaiser et al., 2018), Africa (Marais et al., 2014), India (Chaliyakunnel et al., 2019), Amazonia (Bauwens et al., 2016), and parts of Europe (Curci et al., 2010) but opposite to the large-scale emission increase over China in Cao et al. (2018). For NOx (Fig. S4 in the Supplement), the nationwide total emissions decreased by 10.2 %, with the main reductions concentrated in the NCP and YRD, in parts of central China, and in most key urban areas.
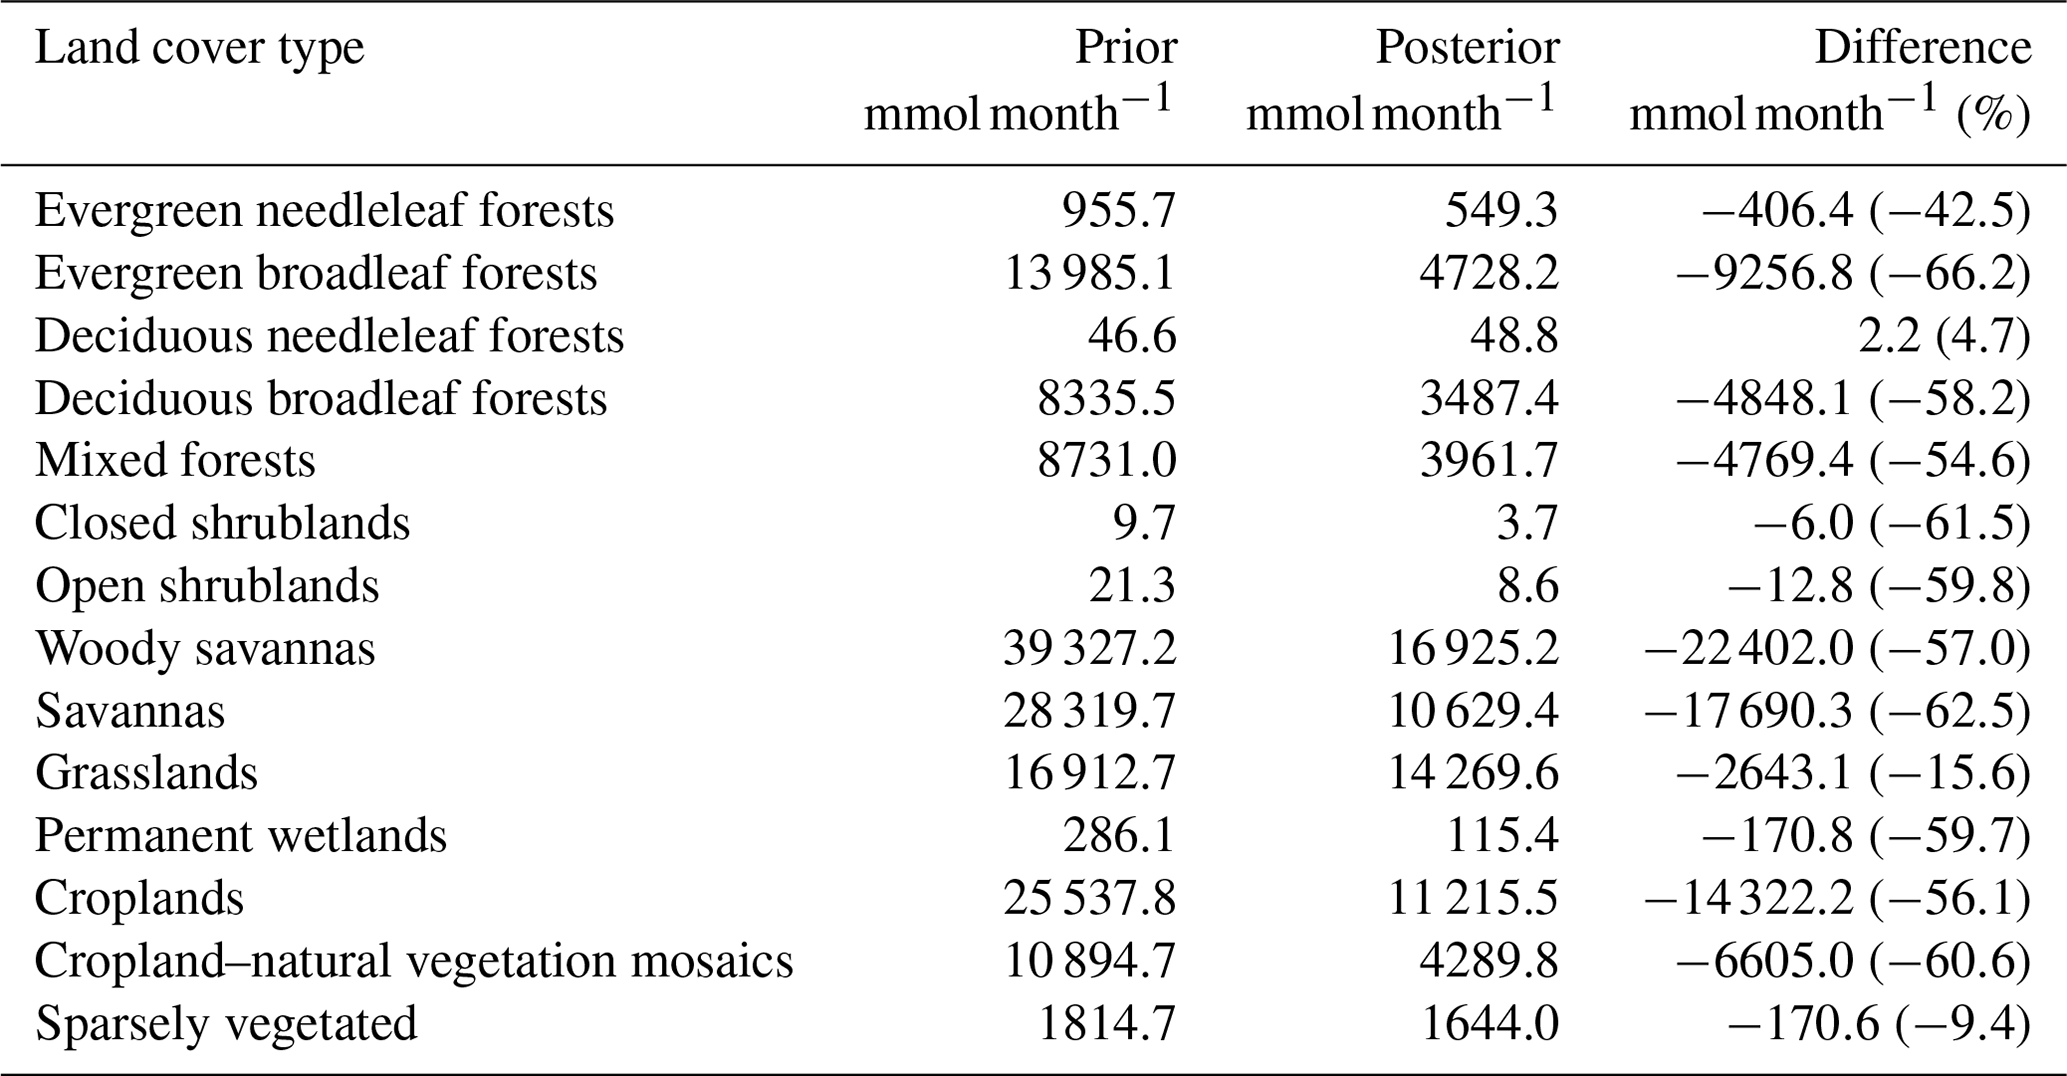
Table 2 shows the changes in emissions of biogenic NMVOCs across different land cover types (Fig. S5 in the Supplement) after inversion. The most significant reduction in biogenic emissions occurred within woody savannas, accounting for 26.9 % of the overall reduction, followed by savannas and croplands, accounting for 21.2 % and 17.2 %, respectively. Among all vegetation types, the broadleaf evergreen forests, recognized as the primary source of isoprene emission (H. Wang et al., 2021), presented the greatest uncertainty, with NMVOC emissions experiencing a significant reduction of 66.2 %. Standard emission rates in MEGAN are derived from leaf- or canopy-scale flux measurements and extrapolated globally across regions sharing similar land cover characteristics based on very limited observations (Guenther et al., 1995). This methodology introduces biases due to the large variability in emission rates among plant species.
Table 2Prior and posterior biogenic NMVOC emissions, as well as the differences in different land cover types.
4.2 Evaluations for posterior emissions
The NOx emissions were first evaluated by indirectly comparing the forward simulated NO2 concentrations with measurements. As shown in Fig. S6 in the Supplement, the CEP with prior emissions exhibited positive biases in eastern China and negative biases in western China. However, when posterior emissions were used in the VEP, a substantial improvement in simulation performance was observed. Biases were limited to within ±3 µg m−3, and correlation coefficients exceeded 0.7 across the entire region. Figure 3 presents the simulated HCHO VCDs using prior and posterior NMVOC emissions, along with their associated biases. Both experiments showed high VCDs over central and eastern China, especially in the YRD and SCB. However, the CEP displayed substantial overestimation across most of mainland China, with the largest bias reaching 12×1015 in central China. Conversely, the VEP demonstrated notable improvements in both the magnitude and spatial distribution of simulated HCHO columns after the inversion compared to TROPOMI retrievals. More than 84 % of the areas exhibited biases of less than 1×10¹⁵ , and no significant spatial variation was observed. Overall, the biases in simulated HCHO VCDs decreased by 75.7 % after the inversion. These results emphasize the efficiency of our system in reducing uncertainty in both NOx and NMVOC emissions.
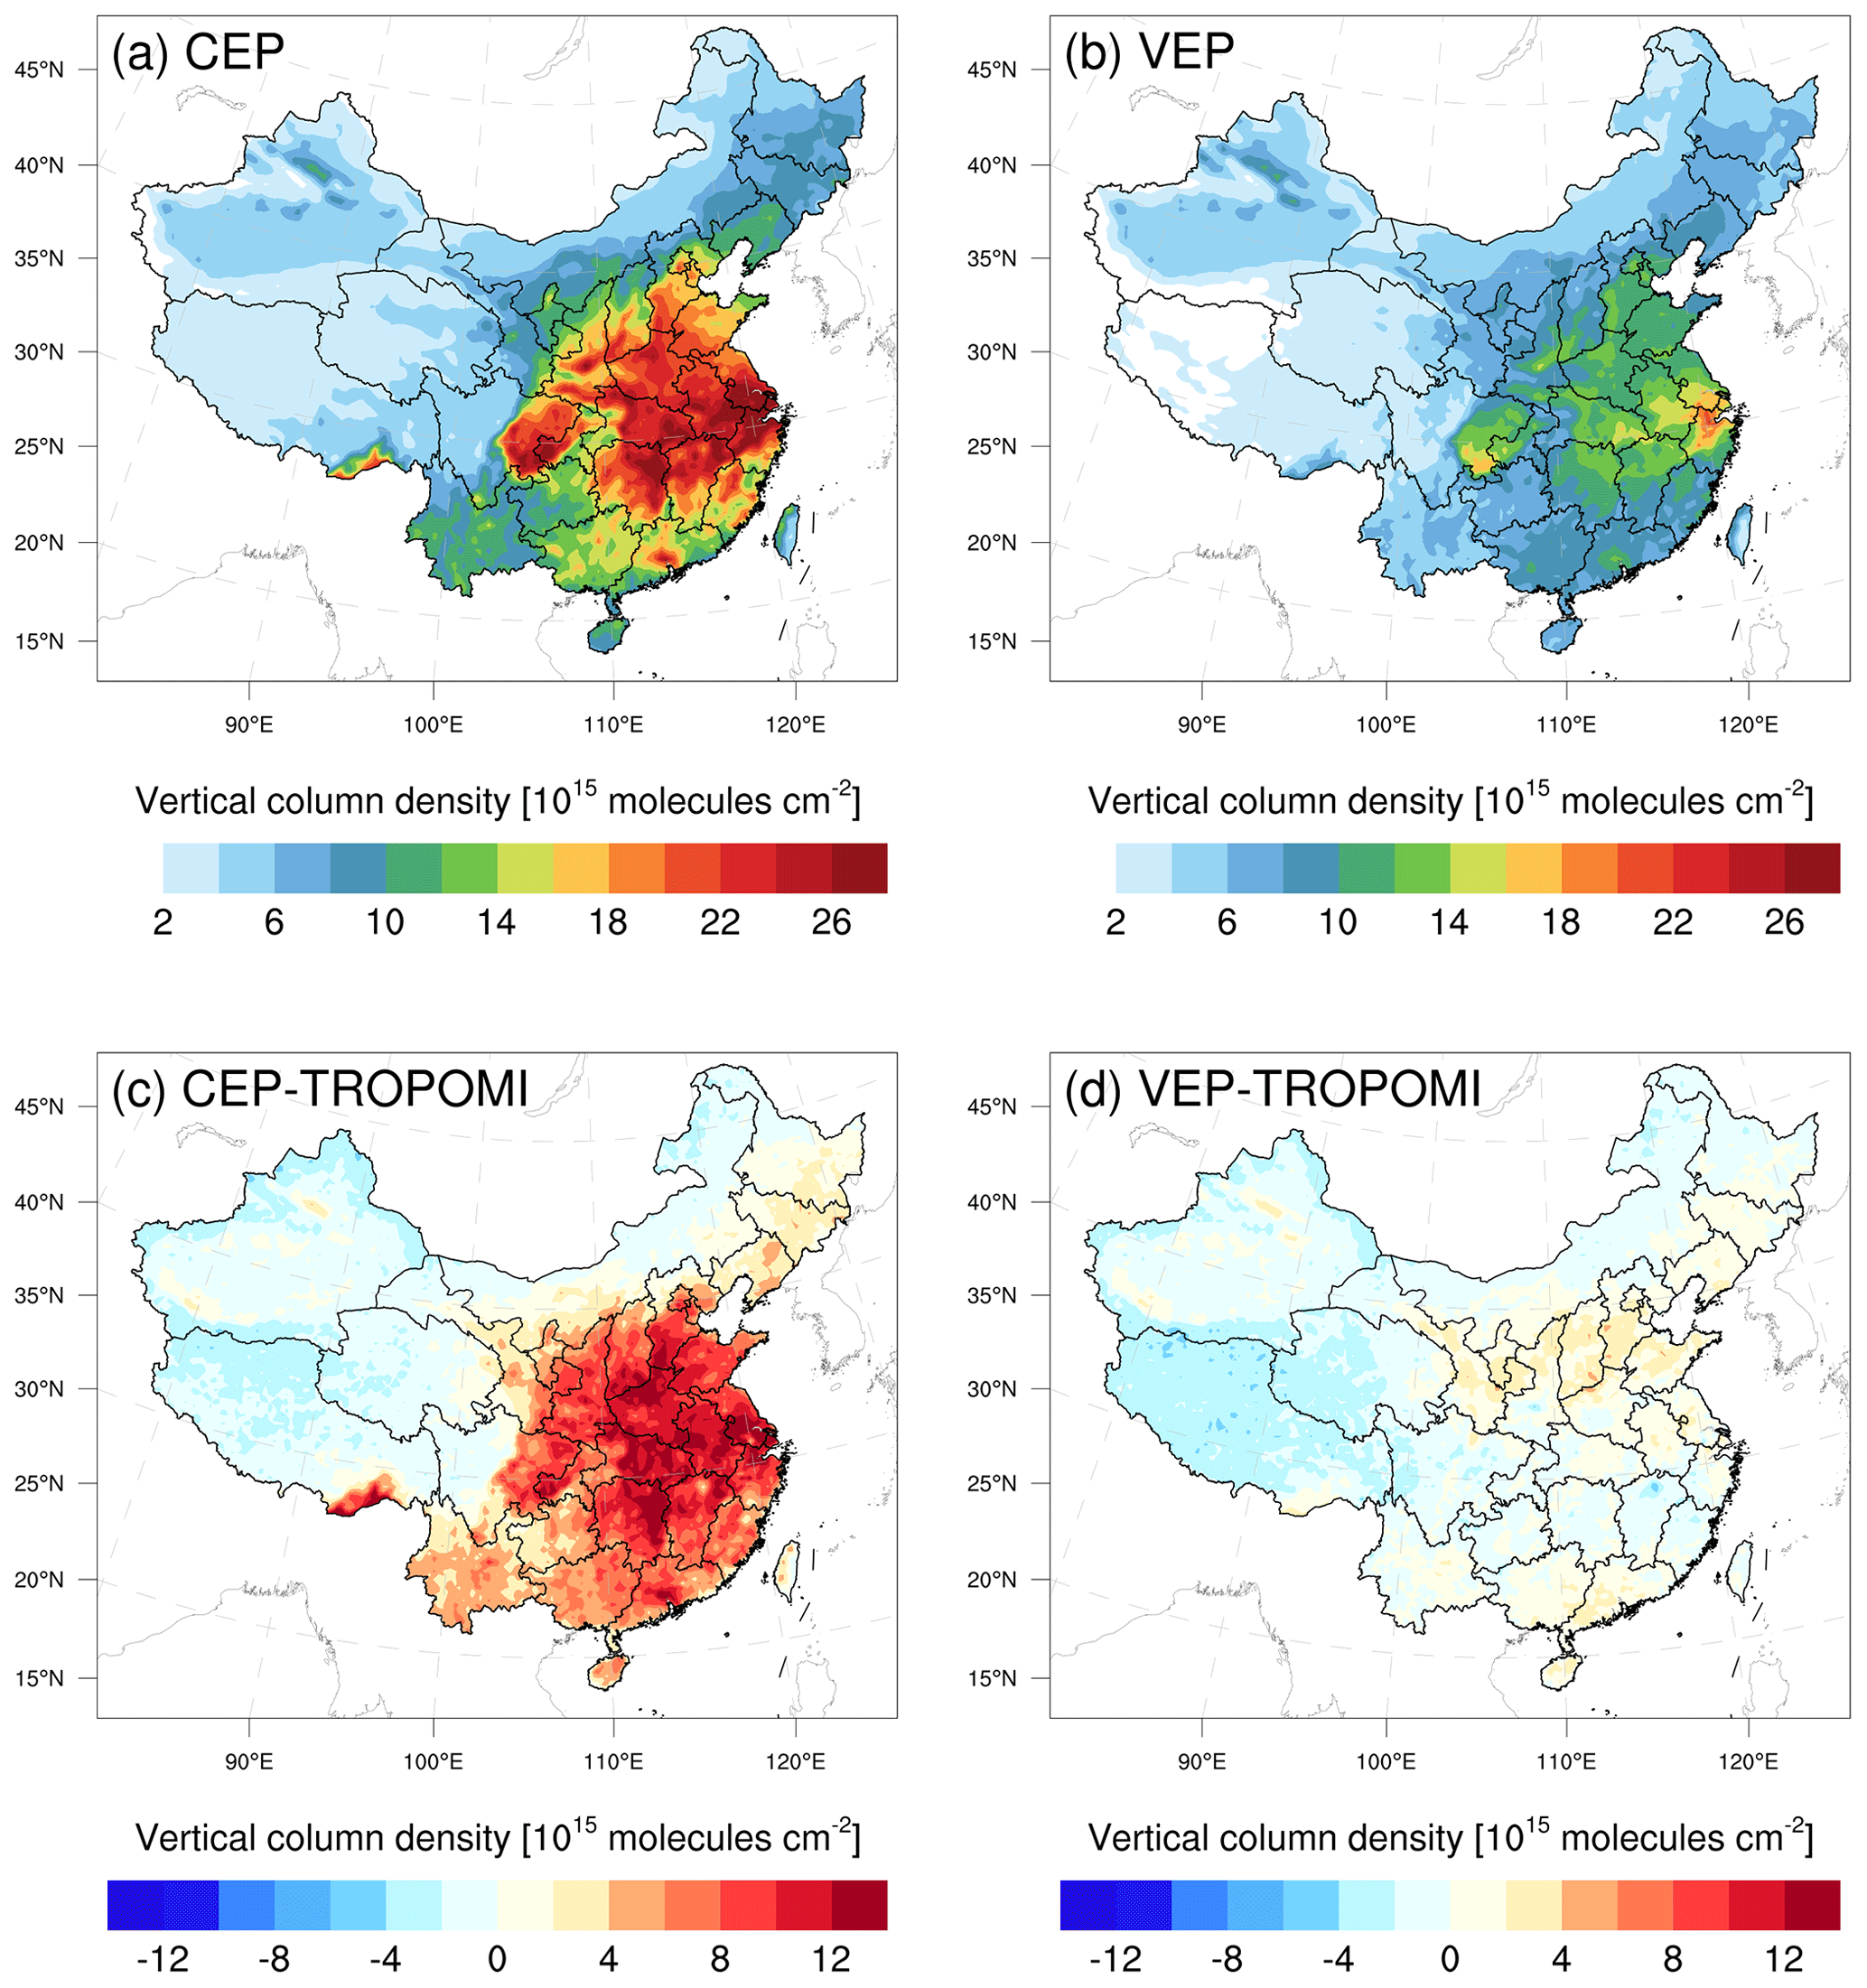
Figure 3Simulated HCHO vertical column densities using prior (a) and posterior (b) NMVOC emissions, along with their biases (c and d) versus TROPOMI measurements. All model results were sampled at TROPOMI overpass time.
4.3 Implications for surface O3
Figure 4 shows the spatial distribution of the mean bias (BIAS), root mean square error (RMSE), and correlation coefficient (CORR) for simulated O3 concentrations in the CEP1 and VEP experiments compared to assimilated observations. Beyond the northwestern region of China, the CEP1 exhibited significant overestimation throughout the entire area, with a BIAS of 20.5 µg m−3. In the VEP, the modeled O3 chemical production was alleviated, especially in the southern regions of China where NMVOC emissions significantly decreased. Overall, observation-constrained NMVOC emissions resulted in a 49.3 % decrease in the BIAS, bringing it down to 10.4 µg m−3. Additionally, the RMSE showed noticeable improvement due to the assimilation of HCHO observation, reducing the value from 30.9 to 23.3 µg m−3. Despite a significant reduction in NMVOC emissions after inversion, notable overestimations persisted in northern provinces such as Liaoning, Hebei, Shanxi, and Shaanxi. This may be attributed to limited NMVOC constraints resulting from insufficient observations during the study period (Figs. 1b and 3d). The remaining discrepancies between simulations and observations can be attributed to the combined results of intricate urban–rural sensitivity regimes and O3 photochemistry reactions, which may not be comprehensively represented by the CMAQ, masking any potential improvement expected from the constrained emissions (See Sect. 4.4). The CORR was comparable between the CEP1 and VEP experiments, reflecting the fact that the CMAQ effectively simulated the temporal variation in O3 concentrations. The biases at the independent sites were similar to those at the assimilated sites (Fig. S7 in the Supplement). In comparison to CEP1, the decreasing ratios in BIAS and RMSE in the VEP were 46.7 % and 23.4 %, respectively.
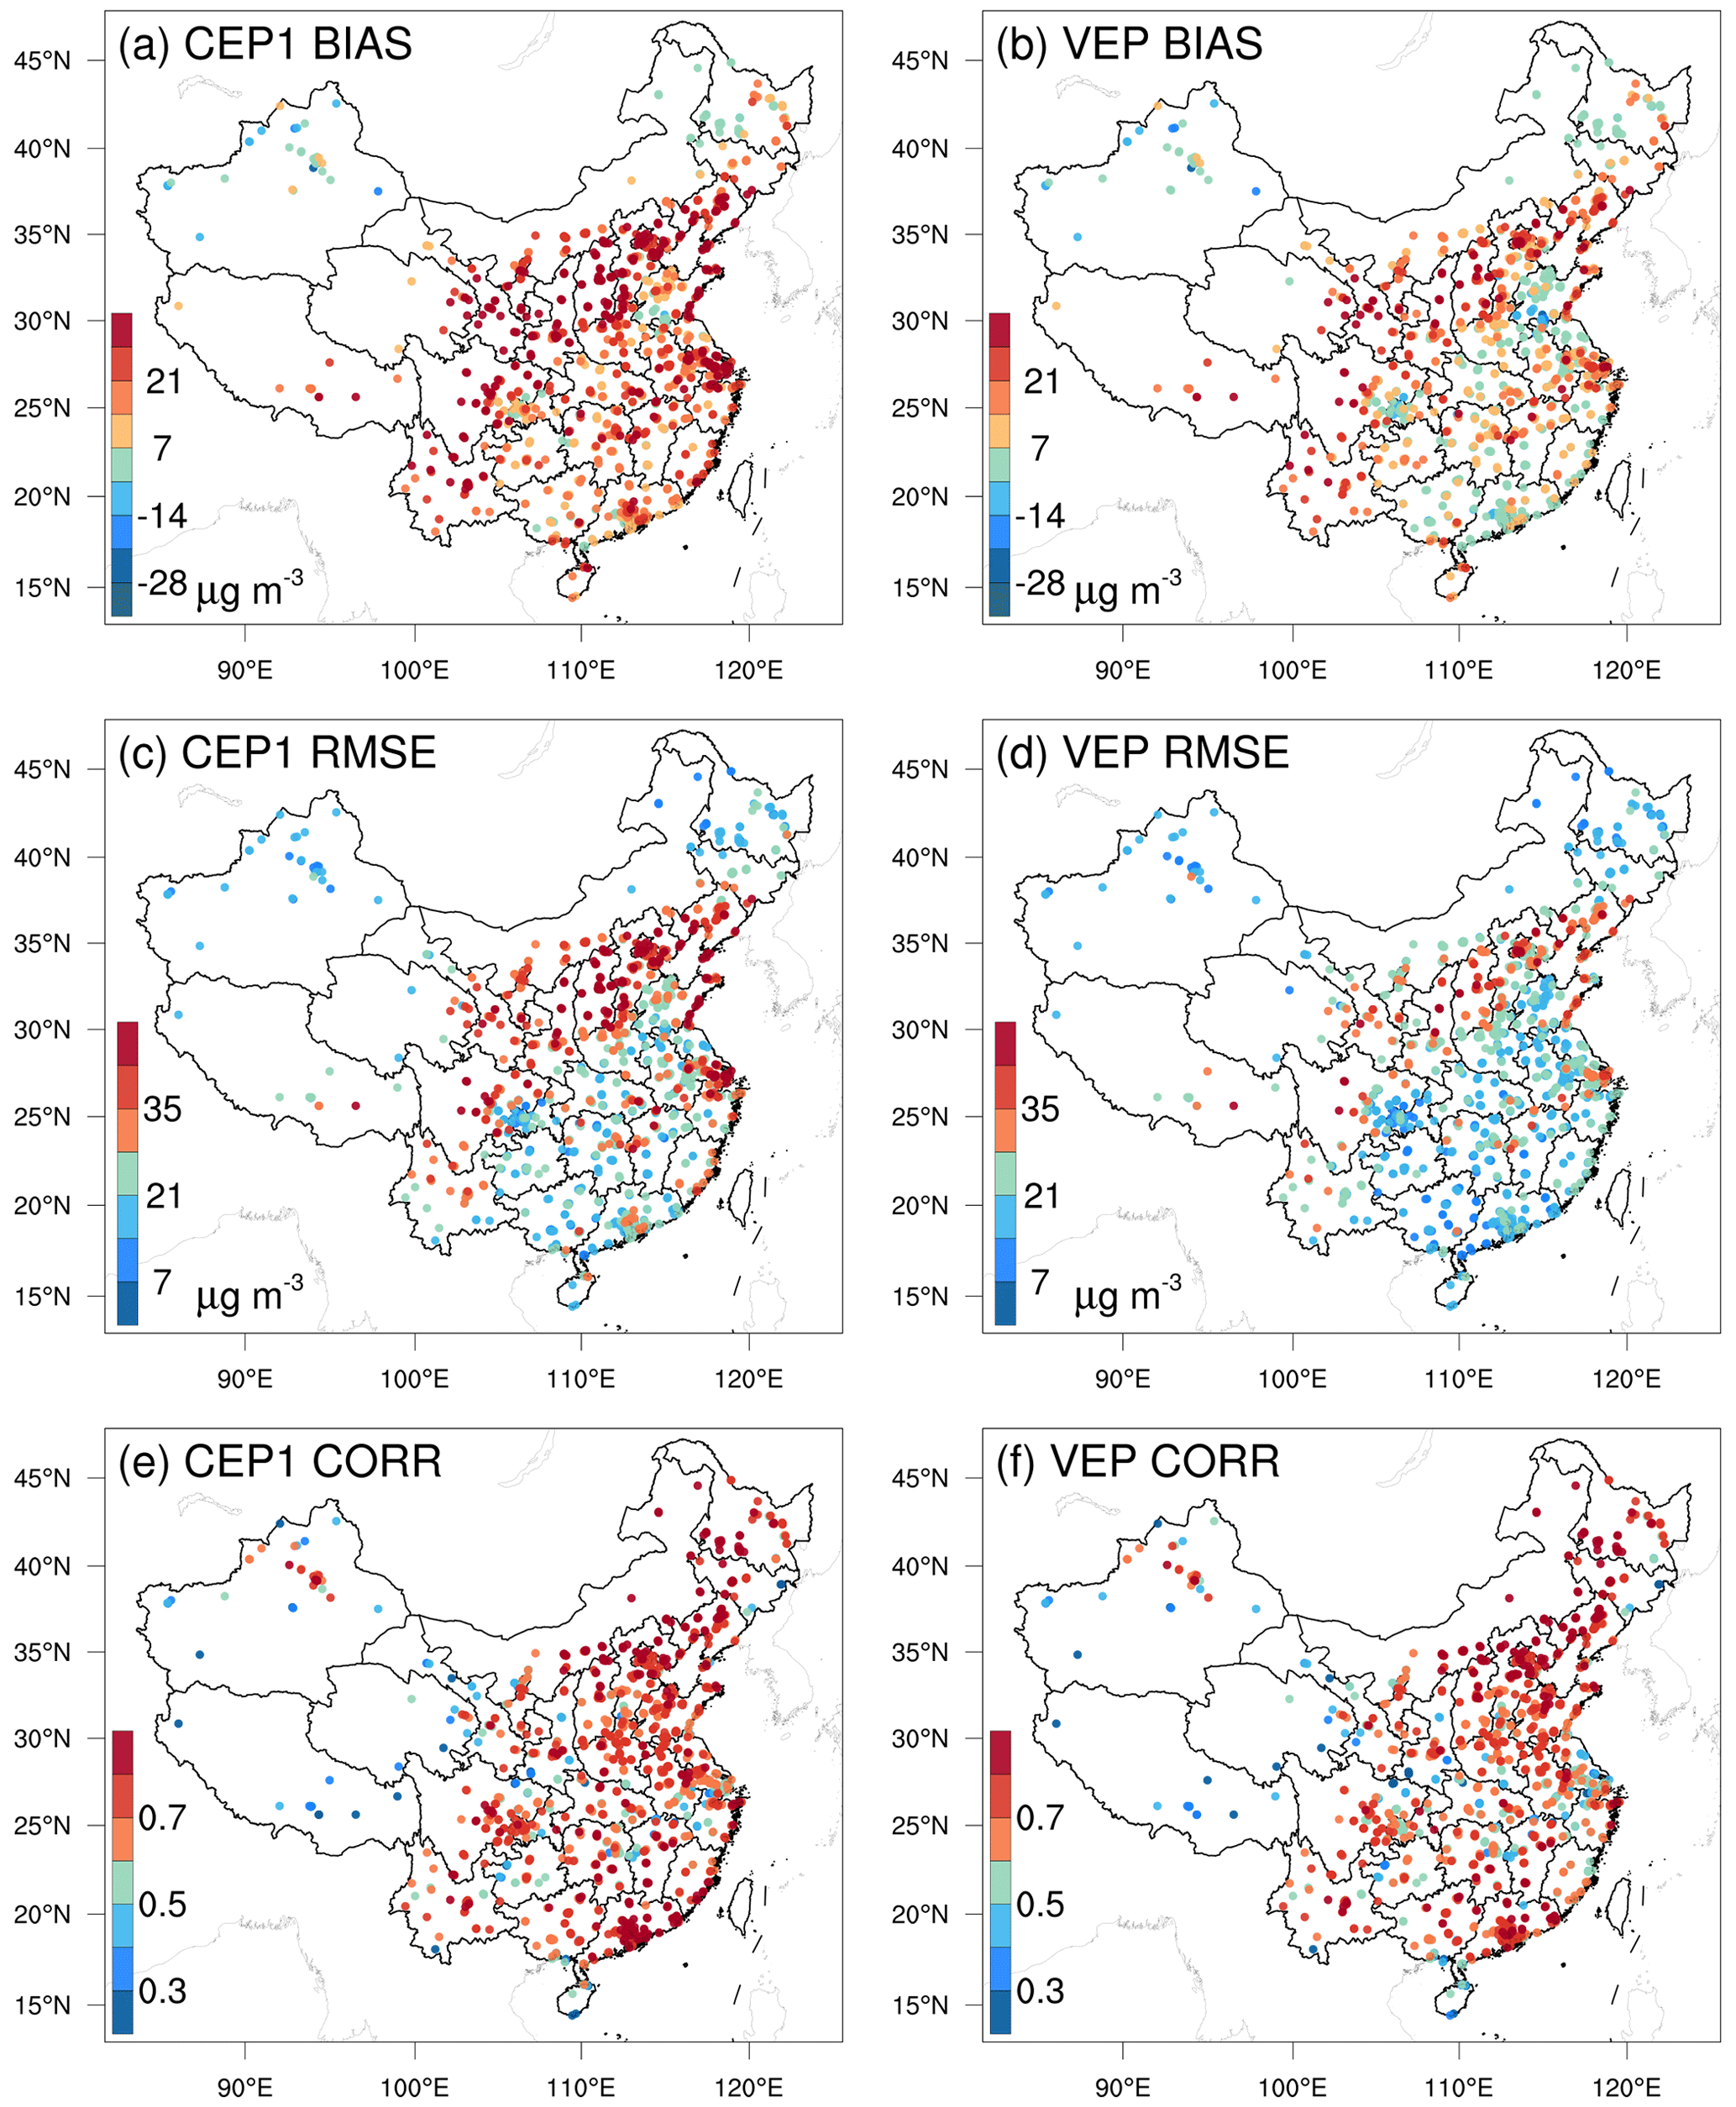
Figure 4Spatial distribution of mean bias (BIAS; a and b), root mean square error (RMSE; c and d), and correlation coefficient (CORR; e and f) for simulated O3 using prior (a, c, and e, CEP1) and posterior (b, d, and f, VEP) emissions versus assimilated observations.
Figure 5 shows the time series of simulated and observed hourly O3 concentrations and their RMSEs, verified against surface monitoring sites. The VEP achieved better representations of diurnal O3 variations compared with those in the CEP1, especially excelling in reproducing elevated O3 concentrations at noon. Constraining the NMVOC emissions also led to better model simulations in terms of RMSE throughout the entire study period. The time-averaged BIAS and RMSE decreased from 20.6 and 37.3 µg m−3 to 10.6 and 31.0 µg m−3, respectively. We also evaluated the simulation results for seven key cities (i.e., Beijing, Shanghai, Guangzhou, Wuhan, Chongqing, Yinchuan, and Changchun, which represent key cities in North, East, South, Central, Southwest, Northwest, and Northeast China, respectively), and the biases in the VEP with posterior emissions all showed a significant reduction (Fig. S8 in the Supplement). Overall, the assimilation of HCHO column observations effectively reduced NMVOC emission uncertainties and consequently improved simulations of HCHO and O3. These improvements hold promise for further research into the implications of emission optimizations on regional O3 photochemistry.
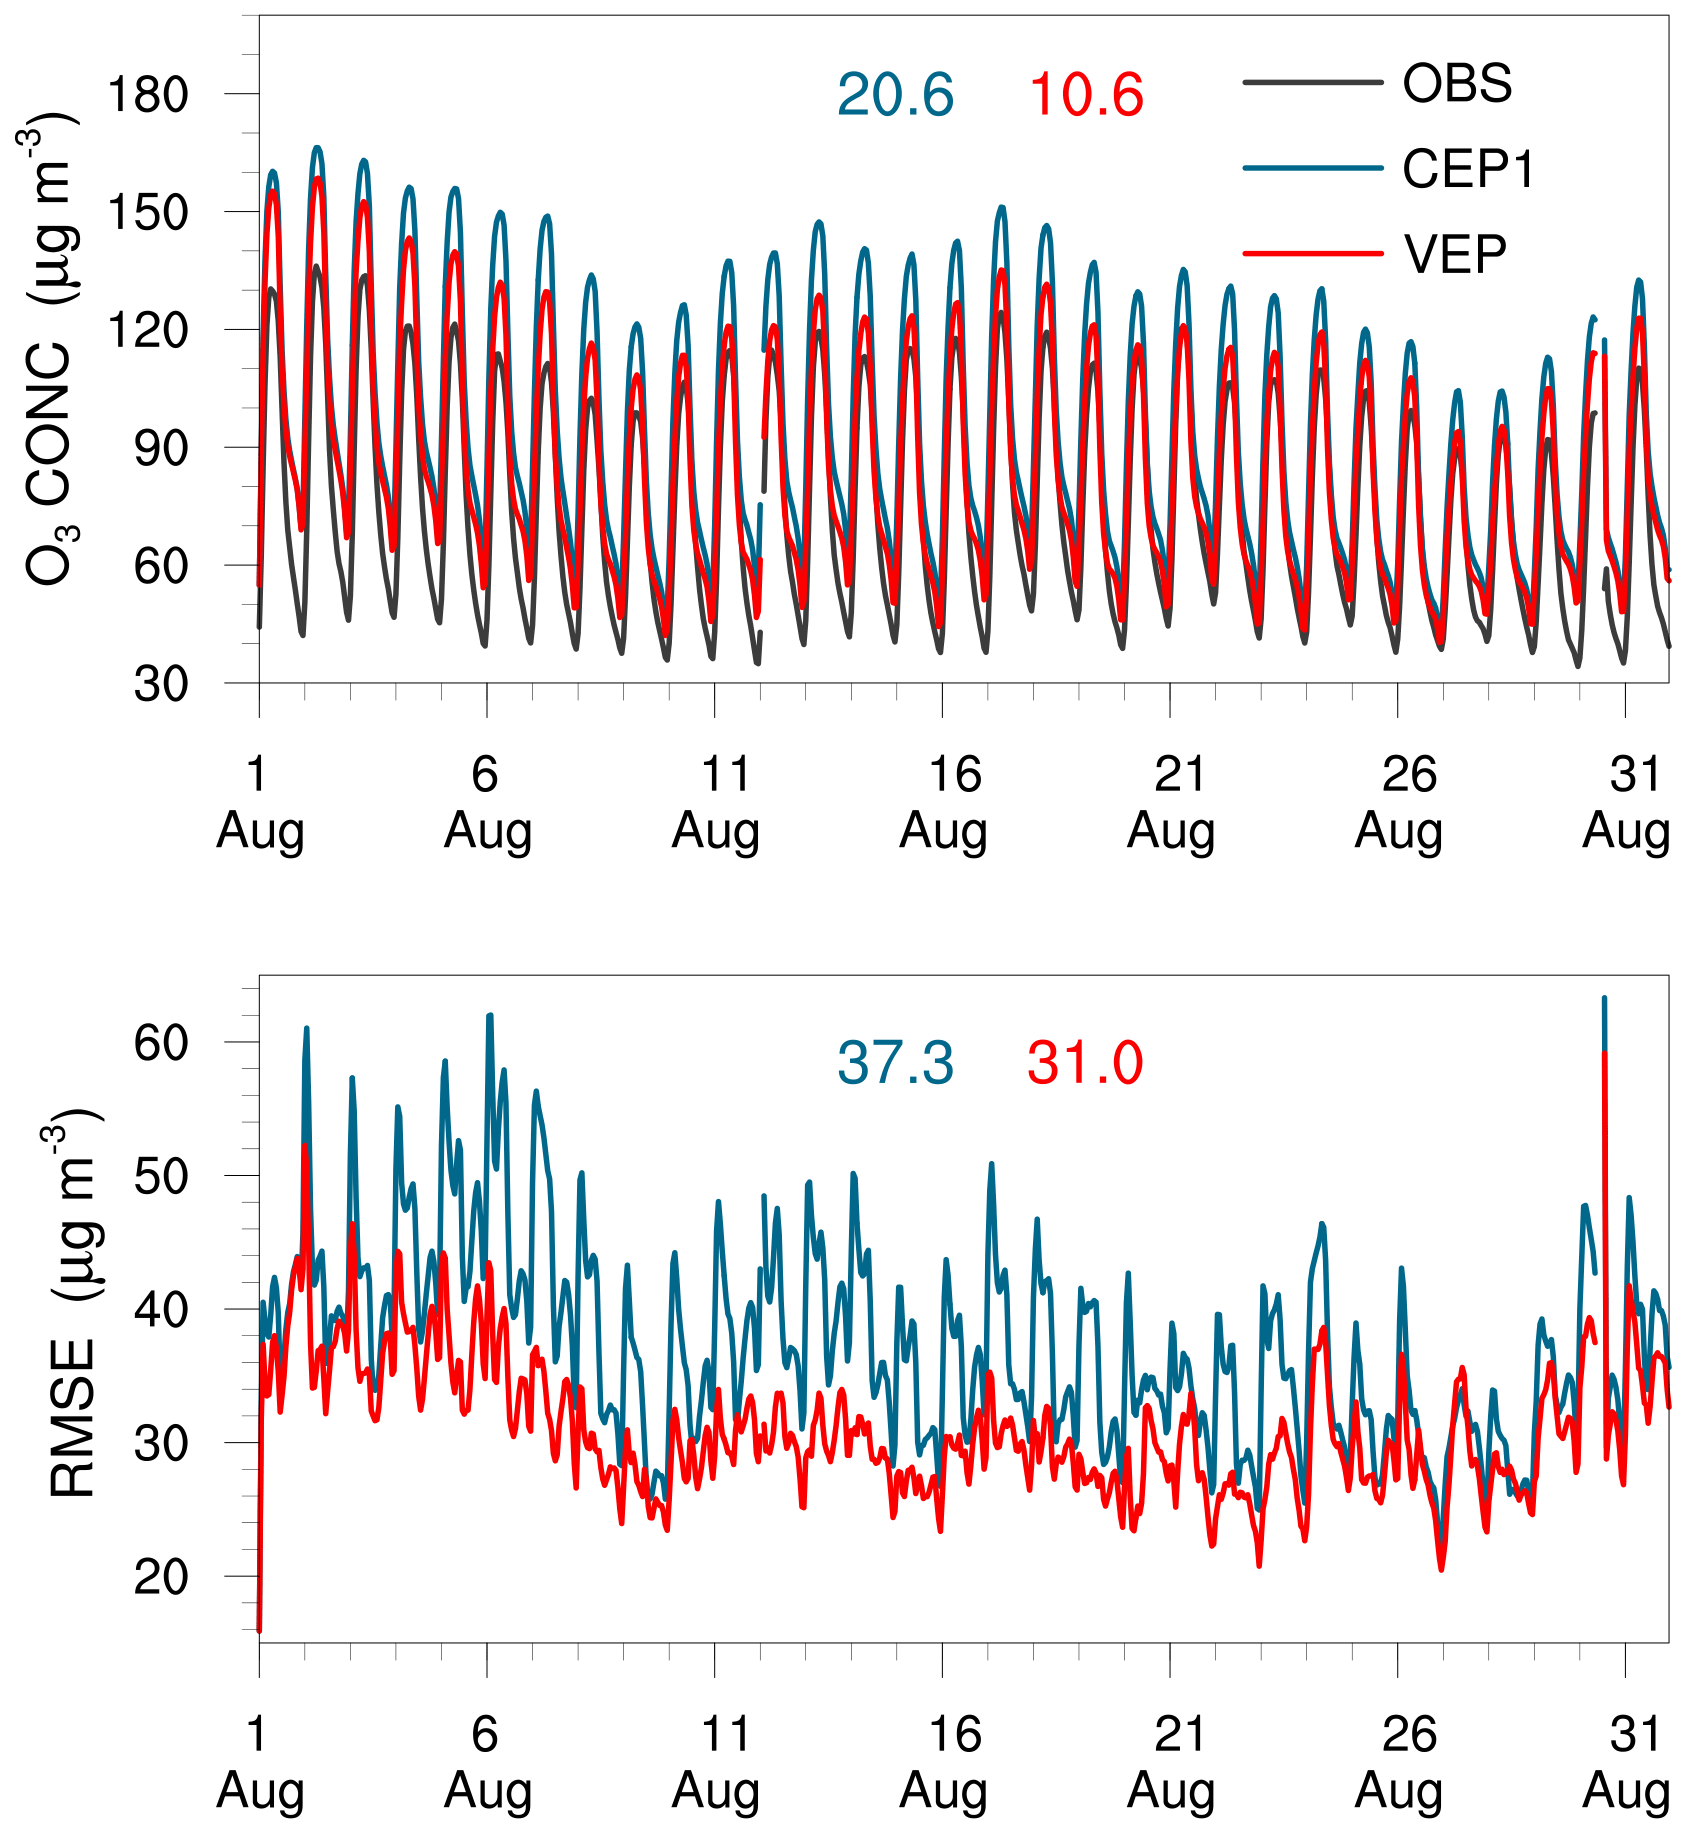
Figure 5Time series comparison of hourly surface O3 concentrations (µg m−3) and RMSE (µg m−3) from the CEP1 and VEP experiments versus all observations at 1701 monitoring sites. The blue and red values on the graph represent the time-averaged statistics in the CEP1 and VEP experiments, respectively.
As crucial O3 precursors, the abundance of NMVOCs plays a significant role in modulating O3 production. Here we employed the IRRs to elucidate changes related to O3 production and loss stemming from constrained NOx and NMVOC emissions at the surface. Figure 6 illustrates comparisons of the simulated maximum daily 8 h average (MDA8) surface O3 levels and net reaction rates before and after the inversion. The CEP1 exhibited an overestimation of O3 levels, with a BIAS of 22.6 % compared to observed O3 concentrations. This overestimation corresponded to the high net chemical rates of O3 in these areas (Fig. S9 in the Supplement). After inversion, O3 net rates decreased in most regions. Consequently, the VEP experiment yielded results that closely aligned with observations, with a BIAS of 9.2 %. Referring to Fig. 6e and f, differences in production rates of O3 closely track the changes in the NMVOC emissions (Fig. 2). The discrepancies in specific regions may be attributed to the complex nonlinear relationships associated with O3 and its precursors, which depend on prevailing chemical regimes and regional transport. Additionally, changes in O3 production predominantly drive the overall decrease in O3 concentrations, outweighing changes in O3 loss.
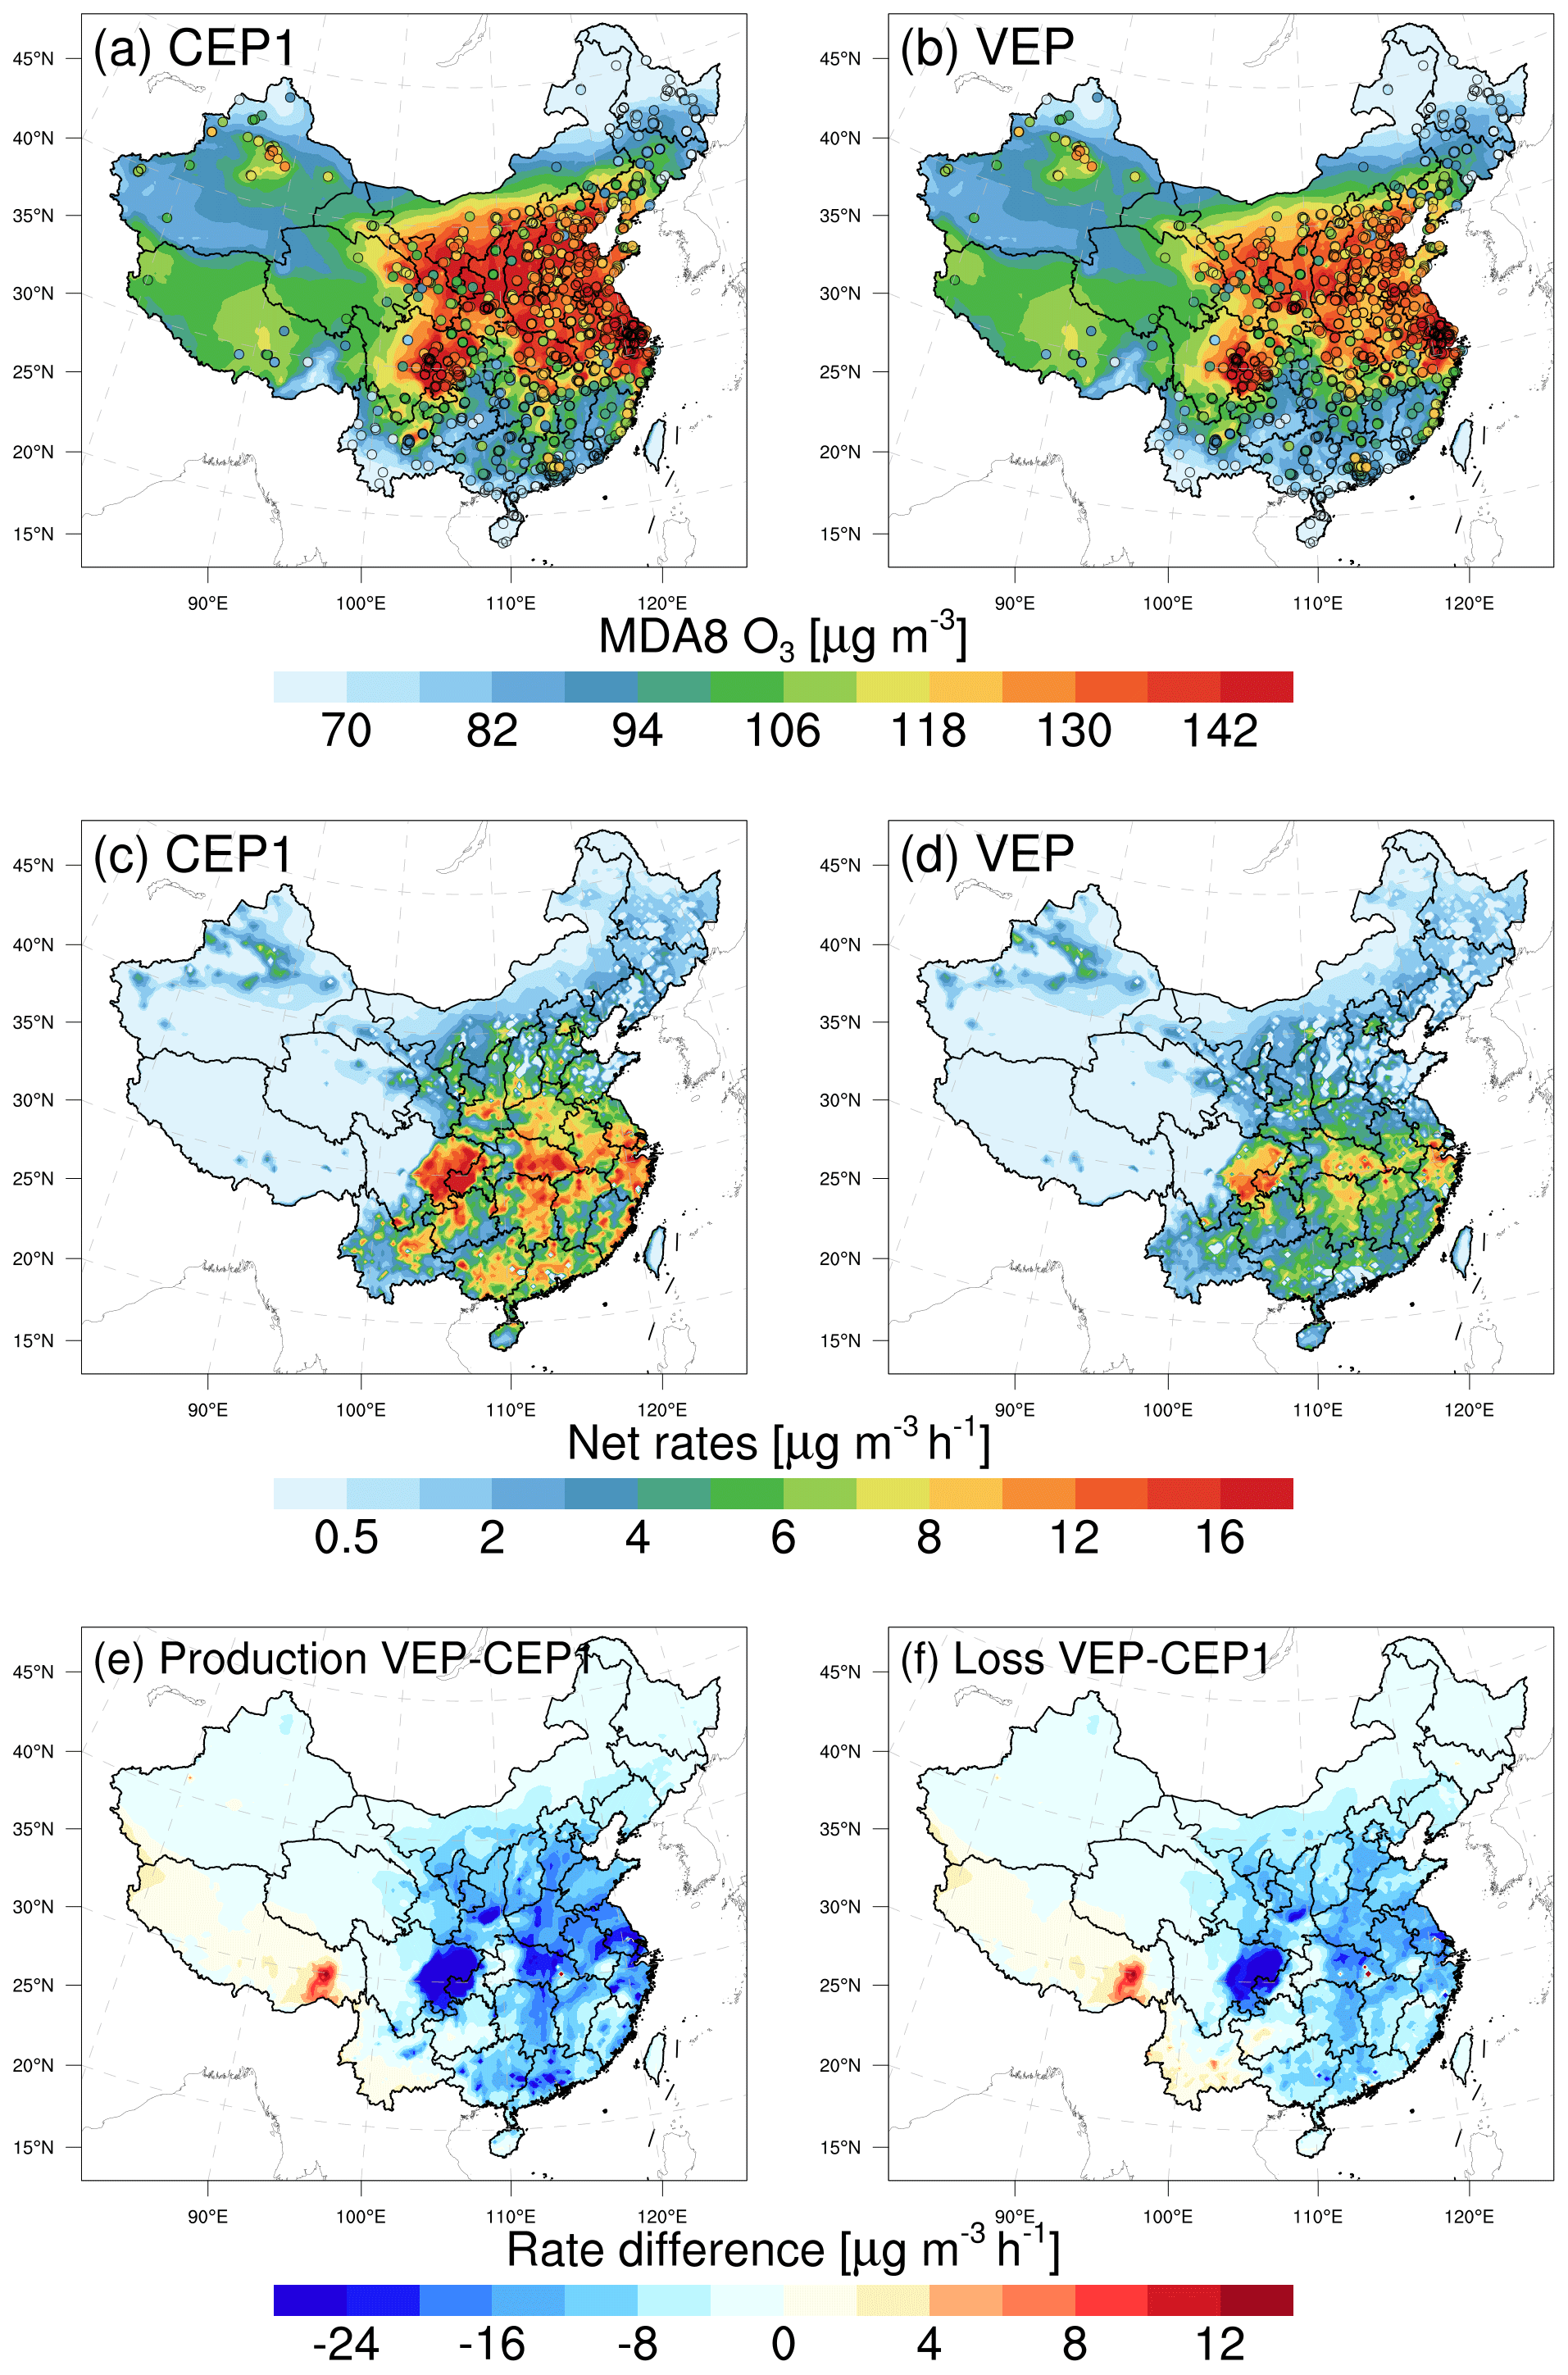
Figure 6Comparisons of (a, b) simulated maximum daily 8 h average (MDA8) O3 concentrations, (c, d) net reaction rates, and (e, f) differences in production and loss rates between CEP1 and VEP experiments at the surface. Surface MDA8 O3 values (circles) from the national air quality control stations were overlaid in (a) and (b).
Figure 7 shows the differences in the six principal pathways responsible for O3 loss and formation when comparing simulations employing prior and posterior emissions. The reactions of HO2+NO and RO2+NO are treated as the pathways leading to O3 formation, whereas O3 loss involves reactions including NO2+OH, O3+HO2, O3+NMVOCs, and O1D+H2O (Wang et al., 2019). Our analysis was focused on the time frame from 12:00 to 18:00 according to China standard time (CST). The differences were computed by subtracting the simulation with posterior emissions from that with prior emissions. Following emission, NMVOCs undergo rapid oxidation by atmospheric hydroxyl (OH) radicals. Due to the substantial decrease in NMVOC emissions, there was a reduction in the production of hydroperoxy radicals (HO2) and organic peroxy radicals (RO2; Fig. S10 in the Supplement). Consequently, this reduction in levels, coupled with their reaction with NO, resulted in diminished O3 production (Fig. 7a and b). A strong correlation was observed between changes in O3 production via the RO2+NO reaction and NMVOC emissions (Fig. 2), consistent with the findings of Souri et al. (2020). Typically, in NMVOC-rich environments, a decrease in NMVOC emissions boosts OH concentrations. Consequently, we noted an enhancement in the NO2+OH reaction in the eastern and central regions of China. In response to heightened HOx concentrations over these areas, increased O3 loss through the O3+HOx pathway was observed. Furthermore, we detected a substantial decrease in O3 loss through reactions with NMVOCs, especially in southern China where substantial isoprene emissions are prevalent. This reduction was primarily attributable to the decrease in NMVOC and O3 levels. While the NMVOC + O3 reaction proceeds at a substantially slower rate than that of NMVOC + OH, this specific chemical pathway remains significant in oxidizing NMVOCs and forming HOx in forested areas (Paulson and Orlando, 1996). The difference in O1D+H2O is primarily driven by the decrease in O3 photolysis. Although the rate of O3 loss decreases in some chemical pathways, overall, the rate of O3 production dominates the changes in O3 concentration.
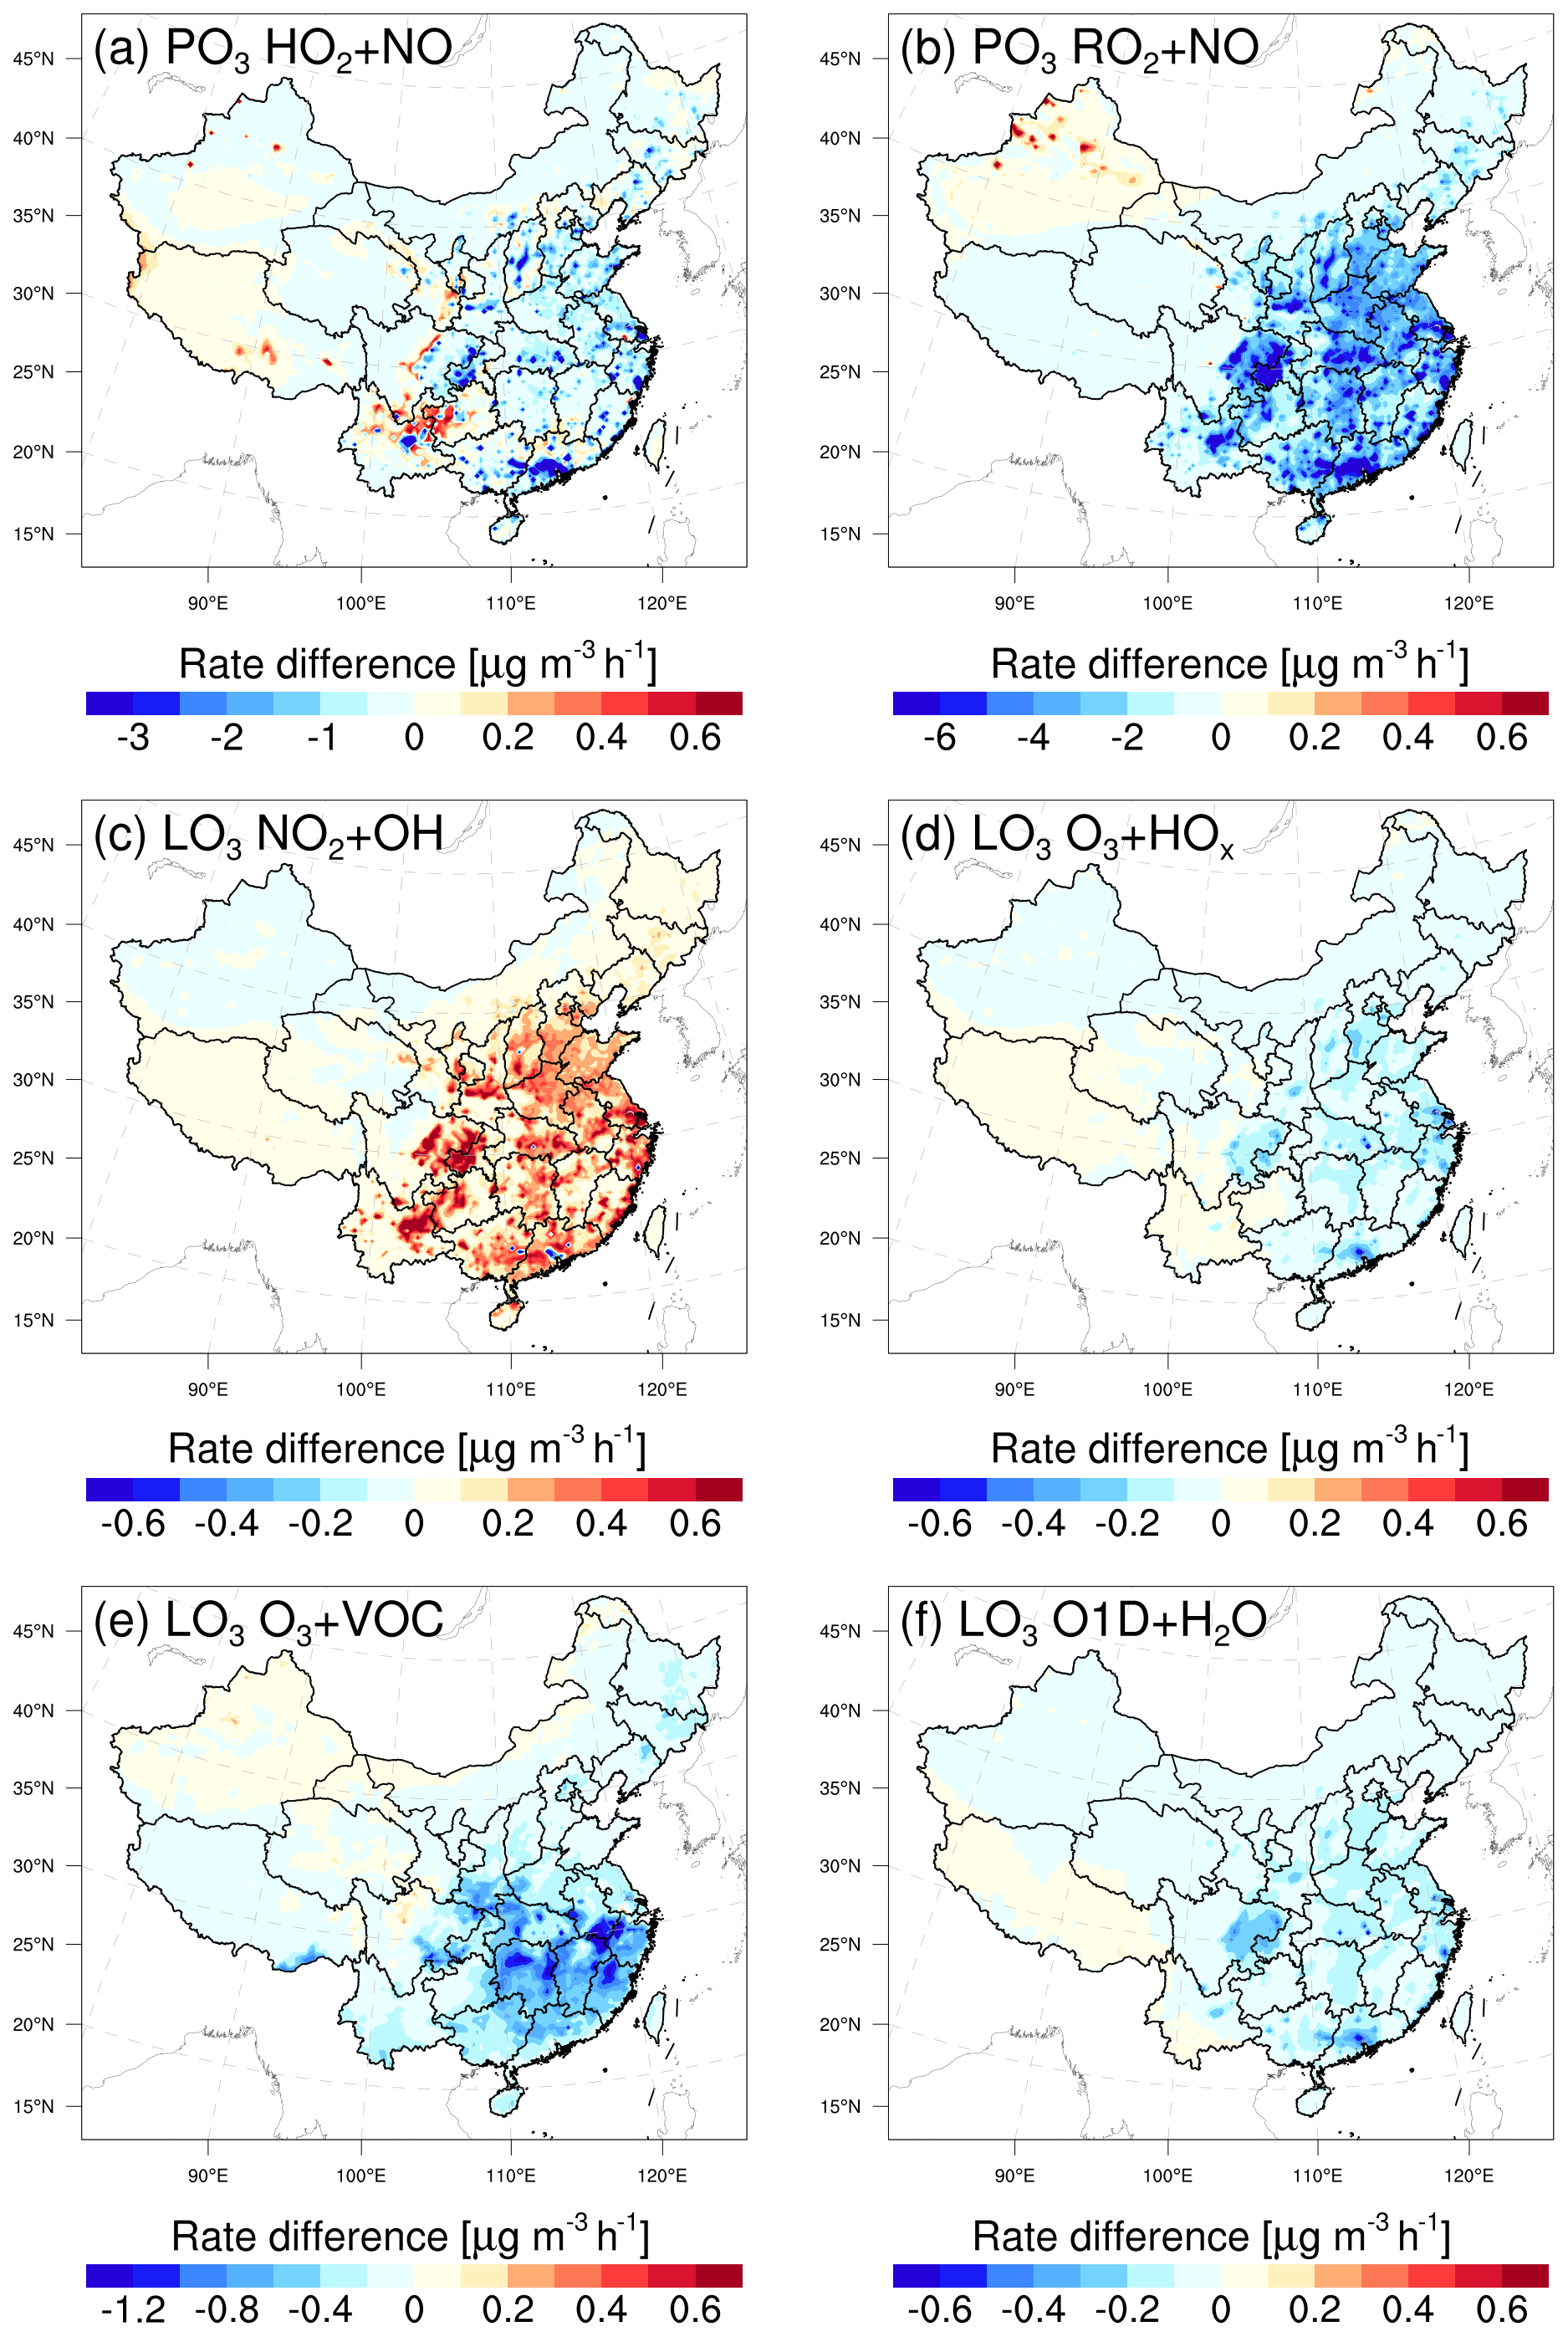
Figure 7Differences in six major pathways of O3 production and loss between the CEP1 and VEP experiments at the surface. Time period: August 2022, 12:00–18:00 CST. PO3 and LO3 represent the pathways of O3 formation and loss, respectively.
4.4 Discussions
O3 simulations over China have a tendency to be overestimated in studies involving chemical transport modeling. For example, by intercomparing 14 state-of-the-art CTMs with O3 observations within the framework of the Model Intercomparison Study for Asia (MICS-Asia) III, Li et al. (2019) identified a substantial overestimation of annual surface O3 in east Asia, ranging from 20 to 60 µg m−3. Notably, the NCP exhibited substantial overestimations, with most models overestimating O3 by 100 %–200 % in May–October. Despite our optimization of O3 precursor emissions, the posterior simulations still exhibit some degree of overestimation (Fig. 4), suggesting that there may indeed be an effect of systematic bias, such as meteorological fields, spatial resolution, model treatments of nonlinear photochemistry, and other physical processes. The WRF can generally reproduce meteorological conditions sufficiently in terms of temporal variation and magnitude over China (Fig. S11 in the Supplement), with small biases of −0.5 °C, −5.3 %, 0.3 m s−1, and −42.4 m for temperature at 2 m, relative humidity at 2 m, wind speed at 10 m, and planetary boundary layer height, respectively. However, due to the relatively coarse spatial resolution, NO titration effects in urban areas may not be well represented in the model, which can lead to an overestimation of O3 in these areas. Additionally, model-inherent errors arising from model structure, parameterization, and the simplification or lack of chemical mechanisms inevitably affect the O3 simulations. For example, Li et al. (2018) reported that heterogeneous reactions of nitrogen compounds could weaken the atmospheric oxidation capacity and thus reduce surface O3 concentration by 20–40 µg m−3 for polluted regions over China. These reactions have not been fully incorporated in CMAQ chemical mechanisms. However, there is still a lack of reasonable and effective algorithms for addressing model errors through assimilation (Houtekamer and Zhang, 2016). O3 concentration and NOx (VOC) emissions are positively correlated in NOx- (VOC-)limited regions and negatively correlated in VOC- (NOx-)limited regions (Tang et al., 2011). Therefore, the uncertainty in NOx emissions can affect the model diagnosis of O3–NOx–VOC sensitivity, thereby introducing substantial model errors in the HCHO yield from VOC oxidation. In the base inversion experiment (EMDA), we simultaneously assimilated NO2 and HCHO observations to optimize NOx and NMVOC emissions. To evaluate the impact of optimized NOx emissions on O3–VOC chemistry, EMS disregarded the uncertainty in NOx and focused on optimizing NMVOC emissions. Compared to the EMDA, in areas where NOx is significantly overestimated, NMVOC emissions in the EMS have correspondingly decreased (Fig. 8b). This might be due to the fact that under high NOx conditions, HCHO production occurs promptly, thereby compensating for the substantial amount of HCHO already present in the atmosphere by reducing emissions (Chan Miller et al., 2017). Figure S12 in the Supplement shows comparisons of concentrations and RMSE between the simulations using posterior emissions from EMS and EMDA experiments. Compared to VEP, CEP2 showed a larger RMSE, highlighting the necessity for simultaneous optimization of NOx emissions when evaluating the impact of NMVOC emission optimization on O3. Additionally, CEP2 using prior NOx emissions exhibited lower O3 levels over parts of NCP and YRD as well as over some urban areas (Fig. 8c) but with larger biases and RMSEs (Fig. 8d). The reduction in NMVOC emissions contributed to a partial decrease in O3 concentration. More significantly, these areas typically align with VOC-limited mechanisms (Wang et al., 2019; W. Wang et al., 2021). Therefore, the overestimation of NOx emissions (Fig. S4) excessively inhibits O3 accumulation due to the titration effect, thereby disrupting the evaluation of NMVOC contributions to O3. This substantial disparity also seriously affects O3 source apportionment, precursor-sensitive area delineation, and emission reduction policy formulation.
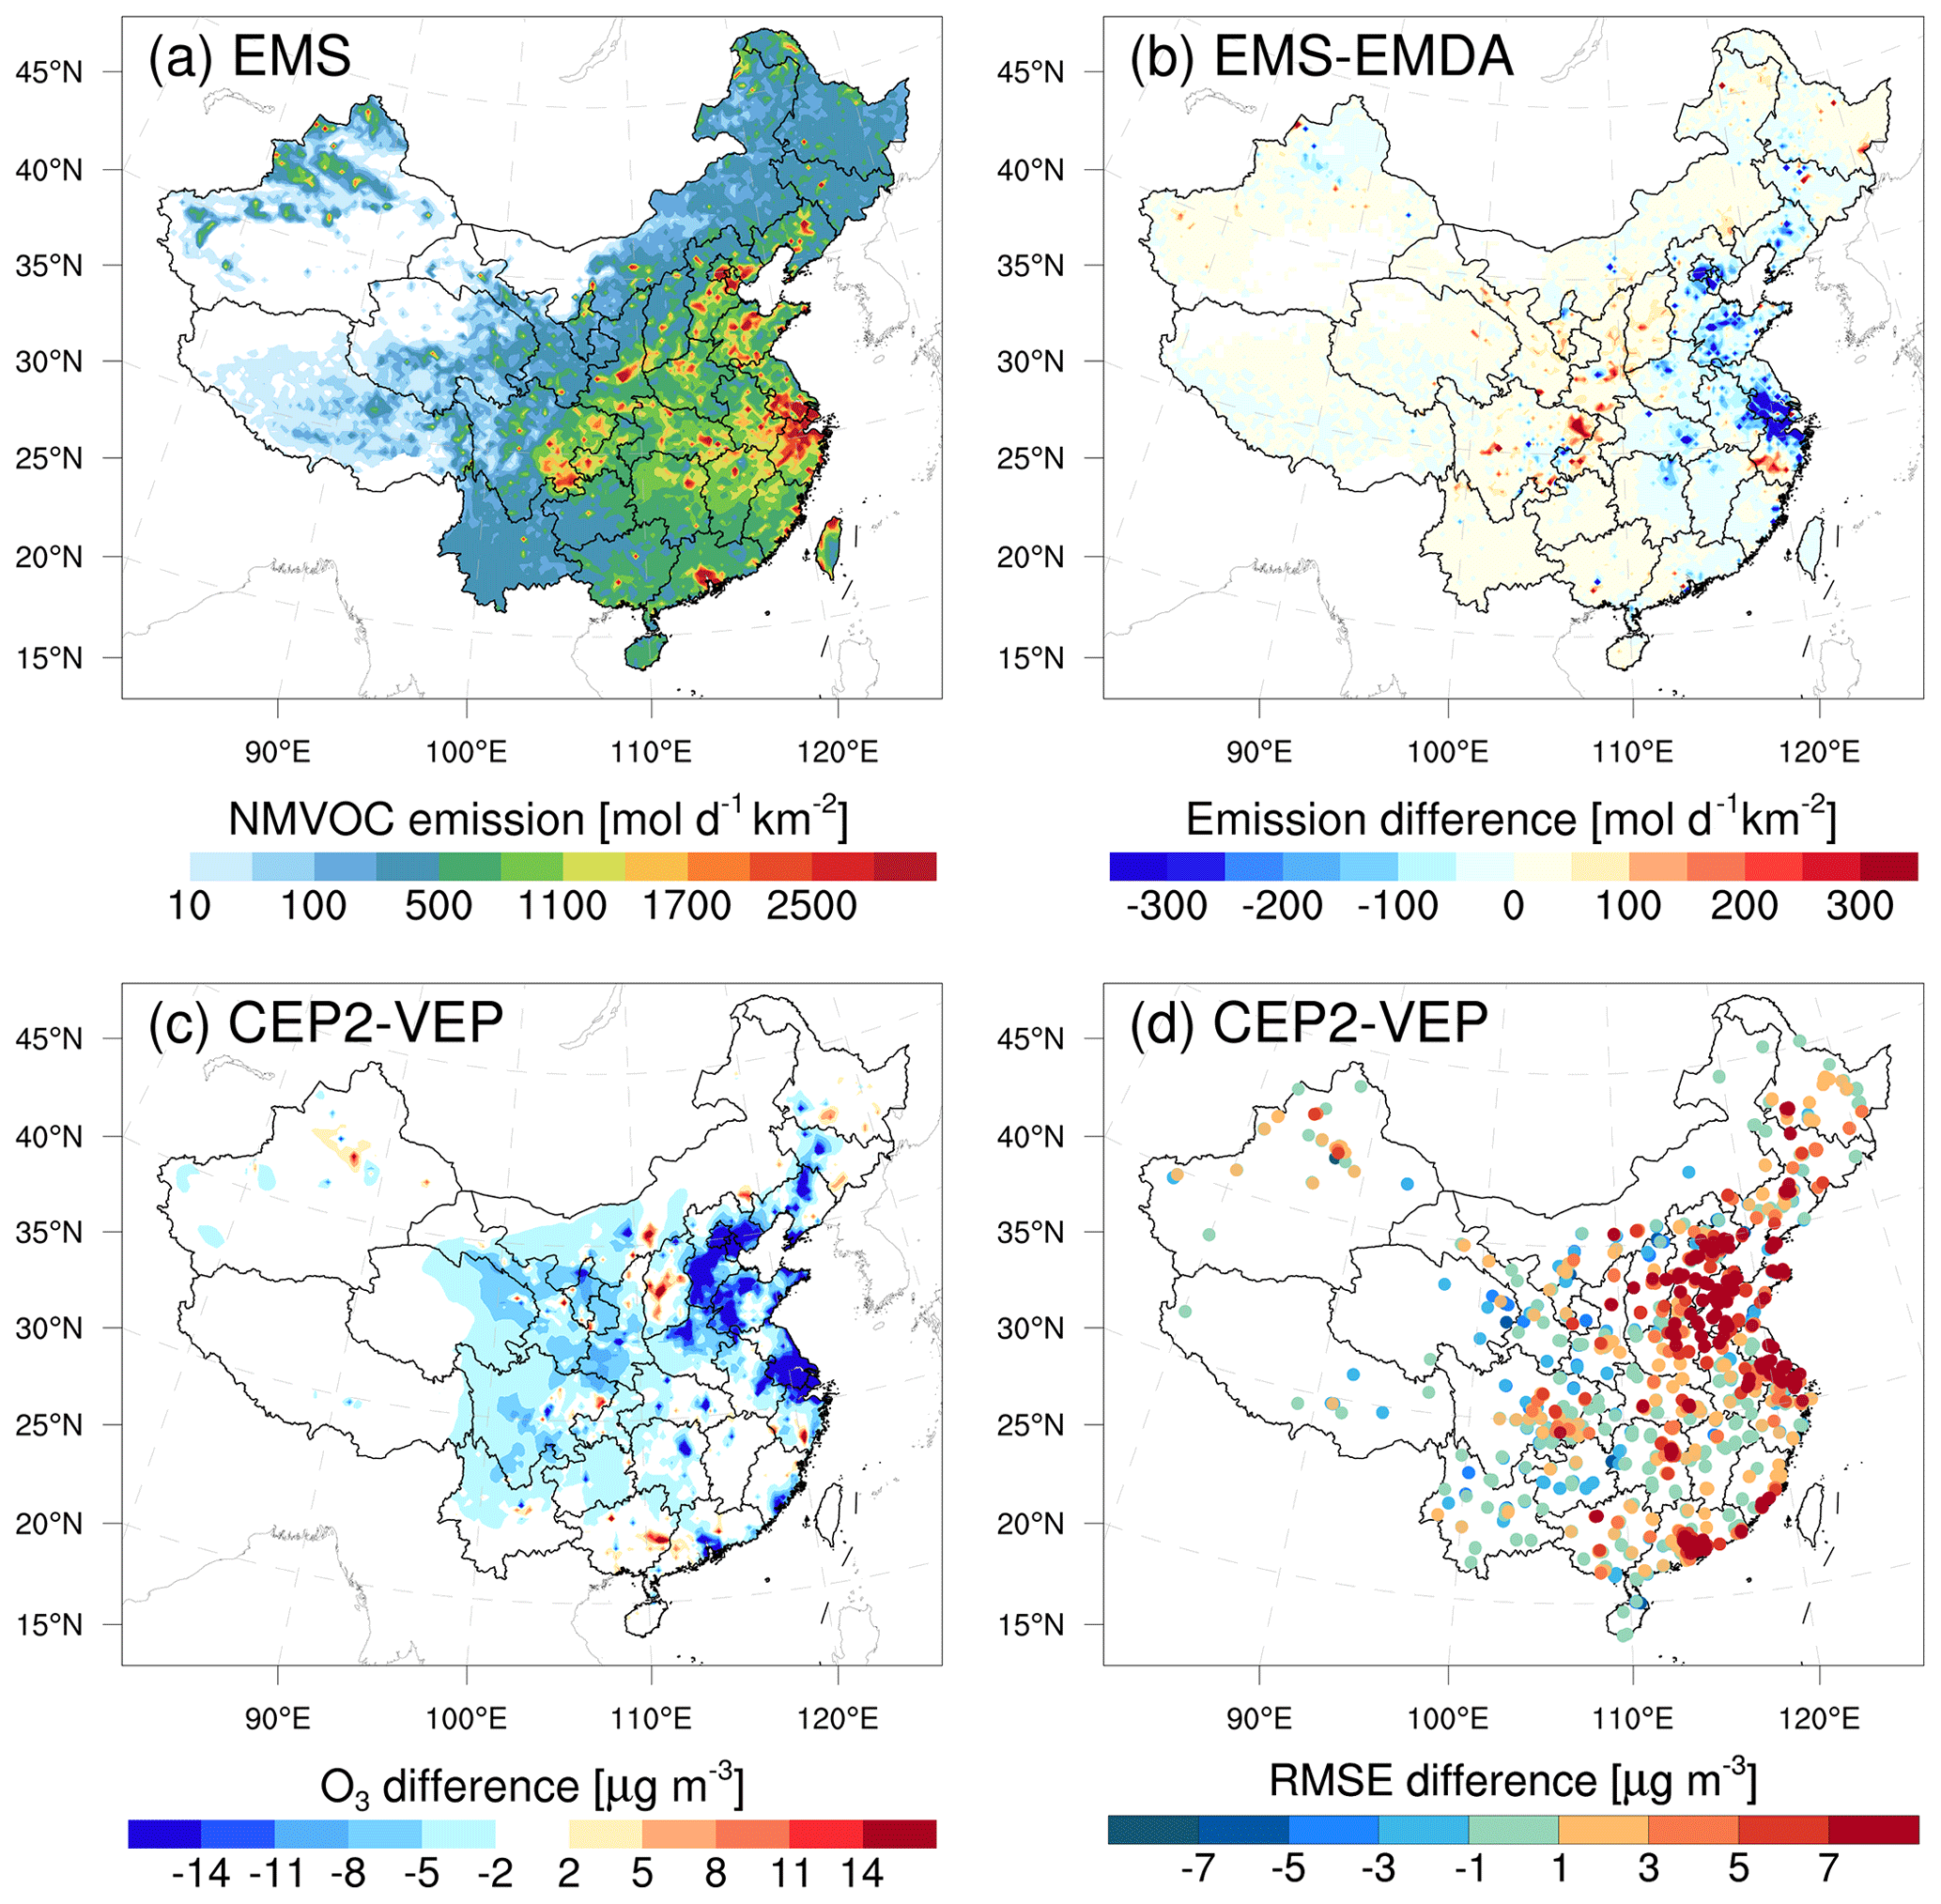
Figure 8Spatial distribution of (a) posterior emissions in the EMS experiment, (b) differences in posterior emissions between EMS and EMDA, and differences in (c) simulated O3 concentrations and (d) RMSE between CEP2 and VEP experiments. EMS did not optimize NOx emissions compared to EMDA.
In this study, we extended the RAPAS assimilation system with the EnKF assimilation algorithm to optimize NMVOC emissions using TROPOMI HCHO retrievals. Taking the MEIC 2020 for anthropogenic emissions and MEGAN v2.1 output for biogenic sources as a priori emissions, NMVOC emissions over China in August 2022 were inferred. Importantly, we implicitly took the chemical feedback among VOCs–NOx–O3 into account by simultaneously adjusting NOx emissions using nationwide in situ NO2 observations. Furthermore, we quantified the impact of NMVOC emission inversion on surface O3 pollution using the CMAQ-IRR.
The application of TROPOMI HCHO observations as constraints led to a substantial reduction of 50.2 % compared to the prior emissions for NMVOCs in August 2022. A domain-wide significant decrease was found over areas of central and southern China with abundant forests, especially with the broadleaf evergreen forests, implying a considerable overestimation of biogenic NMVOC emissions. Observation-constrained emissions significantly improved the performance of surface NO2 and HCHO column simulations, reducing biases by 97.4 % and 75.7 %, respectively. This highlights the effectiveness of RAPAS in reducing uncertainty in NOx and NMVOC emissions. Isolating the impact of NOx emission changes, the posterior NMVOC emissions significantly mitigated the overestimation in prior O3 simulations, resulting in a 49.3 % decrease in surface O3 biases. This is mainly attributed to a substantial decrease in the RO2+NO reaction rate (a major pathway for O3 production) and an increase in the NO2+OH reaction rate (a major pathway for O3 loss) during the afternoon, resulting in a decrease in the simulated MDA8 surface O3 concentrations of approximately 15 µg m−3.
Sensitivity inversions demonstrate the robustness of top-down emissions to variations in prior uncertainty settings, yet they are sensitive to HCHO column biases, highlighting the importance of comprehensive validation studies utilizing available remote-sensing data and, if possible, airborne validation campaigns. Moreover, we found that, in comparison to optimizing NMVOC emissions alone, the joint optimization of NMVOC and NOx emissions can significantly improve the overall performance of O3 simulations. Ignoring errors in NOx emissions introduces uncertainty in quantifying the impact of NMVOC emissions on surface O3, especially in areas where overestimated NOx emissions can unrealistically amplify titration effects, highlighting the necessity of simultaneous optimization of NOx emissions.
The observations used for assimilation and the optimized emissions from this study can be accessed at https://doi.org/10.5281/zenodo.10079006 (Feng and Jiang, 2023).
The supplement related to this article is available online at: https://doi.org/10.5194/acp-24-7481-2024-supplement.
SF and FJ conceived and designed the research. SF developed the data assimilation code, analyzed data, and prepared the paper with contributions from all co-authors. FJ supervised and assisted in conceptualization and writing. TQ, NW, MJ, SZ, JC, FY, and WJ reviewed and commented on the paper.
The contact author has declared that none of the authors has any competing interests.
Publisher's note: Copernicus Publications remains neutral with regard to jurisdictional claims made in the text, published maps, institutional affiliations, or any other geographical representation in this paper. While Copernicus Publications makes every effort to include appropriate place names, the final responsibility lies with the authors. Regarding the maps used in this paper, please note that Figs. 1–4, 6–8, and the key figure contain disputed territories.
This work is supported by the National Key R&D Program of China (grant no. 2022YFB3904801), the National Natural Science Foundation of China (grant nos. 42305116 and 42377102), the Natural Science Foundation of Jiangsu Province of China (grant no. BK20230801), and the Hangzhou Agricultural and Social Development Scientific Research Project (grant no. 202203B29). The authors also gratefully acknowledge the use of the High-Performance Computing Center (HPCC) blade cluster system of Nanjing University for the performance of the numerical calculations in this paper.
This research has been supported by the National Key Research and Development Program of China (grant no. 2022YFB3904801), the National Natural Science Foundation of China (grant no. 42305116 and 42377102), the Natural Science Foundation of Jiangsu Province (grant no. BK20230801), and the Hangzhou Science and Technology Bureau (grant no. 202203B29).
This paper was edited by Zhibin Wang and reviewed by two anonymous referees.
Angot, H., McErlean, K., Hu, L., Millet, D. B., Hueber, J., Cui, K., Moss, J., Wielgasz, C., Milligan, T., Ketcherside, D., Bret-Harte, M. S., and Helmig, D.: Biogenic volatile organic compound ambient mixing ratios and emission rates in the Alaskan Arctic tundra, Biogeosciences, 17, 6219–6236, https://doi.org/10.5194/bg-17-6219-2020, 2020.
Bauwens, M., Stavrakou, T., Müller, J.-F., De Smedt, I., Van Roozendael, M., van der Werf, G. R., Wiedinmyer, C., Kaiser, J. W., Sindelarova, K., and Guenther, A.: Nine years of global hydrocarbon emissions based on source inversion of OMI formaldehyde observations, Atmos. Chem. Phys., 16, 10133–10158, https://doi.org/10.5194/acp-16-10133-2016, 2016.
Byun, D. and Schere, K. L.: Review of the governing equations, computational algorithms, and other components of the models-3 Community Multiscale Air Quality (CMAQ) modeling system, Appl. Mech. Rev., 59, 51–77, https://doi.org/10.1115/1.2128636, 2006.
Cao, H., Fu, T.-M., Zhang, L., Henze, D. K., Miller, C. C., Lerot, C., Abad, G. G., De Smedt, I., Zhang, Q., van Roozendael, M., Hendrick, F., Chance, K., Li, J., Zheng, J., and Zhao, Y.: Adjoint inversion of Chinese non-methane volatile organic compound emissions using space-based observations of formaldehyde and glyoxal, Atmos. Chem. Phys., 18, 15017–15046, https://doi.org/10.5194/acp-18-15017-2018, 2018.
Chaliyakunnel, S., Millet, D. B., and Chen, X.: Constraining Emissions of Volatile Organic Compounds Over the Indian Subcontinent Using Space-Based Formaldehyde Measurements, J. Geophys. Res.-Atmos., 124, 10525–10545, https://doi.org/10.1029/2019JD031262, 2019.
Chan Miller, C., Jacob, D. J., Marais, E. A., Yu, K., Travis, K. R., Kim, P. S., Fisher, J. A., Zhu, L., Wolfe, G. M., Hanisco, T. F., Keutsch, F. N., Kaiser, J., Min, K.-E., Brown, S. S., Washenfelder, R. A., González Abad, G., and Chance, K.: Glyoxal yield from isoprene oxidation and relation to formaldehyde: chemical mechanism, constraints from SENEX aircraft observations, and interpretation of OMI satellite data, Atmos. Chem. Phys., 17, 8725–8738, https://doi.org/10.5194/acp-17-8725-2017, 2017.
Curci, G., Palmer, P. I., Kurosu, T. P., Chance, K., and Visconti, G.: Estimating European volatile organic compound emissions using satellite observations of formaldehyde from the Ozone Monitoring Instrument, Atmos. Chem. Phys., 10, 11501–11517, https://doi.org/10.5194/acp-10-11501-2010, 2010.
De Smedt, I., Theys, N., Yu, H., Danckaert, T., Lerot, C., Compernolle, S., Van Roozendael, M., Richter, A., Hilboll, A., Peters, E., Pedergnana, M., Loyola, D., Beirle, S., Wagner, T., Eskes, H., van Geffen, J., Boersma, K. F., and Veefkind, P.: Algorithm theoretical baseline for formaldehyde retrievals from S5P TROPOMI and from the QA4ECV project, Atmos. Meas. Tech., 11, 2395–2426, https://doi.org/10.5194/amt-11-2395-2018, 2018.
Elbern, H., Strunk, A., Schmidt, H., and Talagrand, O.: Emission rate and chemical state estimation by 4-dimensional variational inversion, Atmos. Chem. Phys., 7, 3749–3769, https://doi.org/10.5194/acp-7-3749-2007, 2007.
Fang, X., Shao, M., Stohl, A., Zhang, Q., Zheng, J., Guo, H., Wang, C., Wang, M., Ou, J., Thompson, R. L., and Prinn, R. G.: Top-down estimates of benzene and toluene emissions in the Pearl River Delta and Hong Kong, China, Atmos. Chem. Phys., 16, 3369–3382, https://doi.org/10.5194/acp-16-3369-2016, 2016.
Feng, S. and Jiang, F.: Non-methane volatile organic compound emissions over China estimated using TROPOMI HCHO retrievals, Zenodo [data set], https://doi.org/10.5281/zenodo.10079006, 2023.
Feng, S., Jiang, F., Jiang, Z., Wang, H., Cai, Z., and Zhang, L.: Impact of 3DVAR assimilation of surface PM2.5 observations on PM2.5 forecasts over China during wintertime, Atmos. Environ., 187, 34–49, https://doi.org/10.1016/j.atmosenv.2018.05.049, 2018.
Feng, S., Jiang, F., Wang, H., Wang, H., Ju, W., Shen, Y., Zheng, Y., Wu, Z., and Ding, A.: NOx Emission Changes Over China During the COVID-19 Epidemic Inferred From Surface NO2 Observations, Geophys. Res. Lett., 47, e2020GL090080, https://doi.org/10.1029/2020gl090080, 2020.
Feng, S., Jiang, F., Wang, H., Shen, Y., Zheng, Y., Zhang, L., Lou, C., and Ju, W.: Anthropogenic emissions estimated using surface observations and their impacts on PM2.5 source apportionment over the Yangtze River Delta, China, Sci. Total Environ., 828, 154522, https://doi.org/10.1016/j.scitotenv.2022.154522, 2022.
Feng, S., Jiang, F., Wu, Z., Wang, H., He, W., Shen, Y., Zhang, L., Zheng, Y., Lou, C., Jiang, Z., and Ju, W.: A Regional multi-Air Pollutant Assimilation System (RAPAS v1.0) for emission estimates: system development and application, Geosci. Model Dev., 16, 5949–5977, https://doi.org/10.5194/gmd-16-5949-2023, 2023.
Gaspari, G. and Cohn, S. E.: Construction of correlation functions in two and three dimensions, Q. J. Roy. Meteor. Soc., 125, 723–757, https://doi.org/10.1256/smsqj.55416, 1999.
Guenther, A., Hewitt, C. N., Erickson, D., Fall, R., Geron, C., Graedel, T., Harley, P., Klinger, L., Lerdau, M., Mckay, W. A., Pierce, T., Scholes, B., Steinbrecher, R., Tallamraju, R., Taylor, J., and Zimmerman, P.: A global model of natural volatile organic compound emissions, J. Geophys. Res.-Atmos., 100, 8873–8892, https://doi.org/10.1029/94JD02950, 1995.
Guenther, A. B., Jiang, X., Heald, C. L., Sakulyanontvittaya, T., Duhl, T., Emmons, L. K., and Wang, X.: The Model of Emissions of Gases and Aerosols from Nature version 2.1 (MEGAN2.1): an extended and updated framework for modeling biogenic emissions, Geosci. Model Dev., 5, 1471–1492, https://doi.org/10.5194/gmd-5-1471-2012, 2012.
Hong, C., Zhang, Q., He, K., Guan, D., Li, M., Liu, F., and Zheng, B.: Variations of China's emission estimates: response to uncertainties in energy statistics, Atmos. Chem. Phys., 17, 1227–1239, https://doi.org/10.5194/acp-17-1227-2017, 2017.
Hong, Q., Liu, C., Hu, Q., Zhang, Y., Xing, C., Su, W., Ji, X., and Xiao, S.: Evaluating the feasibility of formaldehyde derived from hyperspectral remote sensing as a proxy for volatile organic compounds, Atmos. Res., 264, 105777, https://doi.org/10.1016/j.atmosres.2021.105777, 2021.
Houtekamer, P. L. and Zhang, F.: Review of the Ensemble Kalman Filter for Atmospheric Data Assimilation, Mon. Weather Rev., 144, 4489–4532, https://doi.org/10.1175/mwr-d-15-0440.1, 2016.
Jiang, X., Guenther, A., Potosnak, M., Geron, C., Seco, R., Karl, T., Kim, S., Gu, L., and Pallardy, S.: Isoprene emission response to drought and the impact on global atmospheric chemistry, Atmos. Environ., 183, 69–83, https://doi.org/10.1016/j.atmosenv.2018.01.026, 2018.
Kaiser, J., Jacob, D. J., Zhu, L., Travis, K. R., Fisher, J. A., González Abad, G., Zhang, L., Zhang, X., Fried, A., Crounse, J. D., St. Clair, J. M., and Wisthaler, A.: High-resolution inversion of OMI formaldehyde columns to quantify isoprene emission on ecosystem-relevant scales: application to the southeast US, Atmos. Chem. Phys., 18, 5483–5497, https://doi.org/10.5194/acp-18-5483-2018, 2018.
Li, B., Ho, S. S. H., Li, X., Guo, L., Chen, A., Hu, L., Yang, Y., Chen, D., Lin, A., and Fang, X.: A comprehensive review on anthropogenic volatile organic compounds (VOCs) emission estimates in China: Comparison and outlook, Environ. Int., 156, 106710, https://doi.org/10.1016/j.envint.2021.106710, 2021.
Li, J., Chen, X., Wang, Z., Du, H., Yang, W., Sun, Y., Hu, B., Li, J., Wang, W., Wang, T., Fu, P., and Huang, H.: Radiative and heterogeneous chemical effects of aerosols on ozone and inorganic aerosols over East Asia, Sci. Total Environ., 622–623, 1327–1342, https://doi.org/10.1016/j.scitotenv.2017.12.041, 2018.
Li, J., Nagashima, T., Kong, L., Ge, B., Yamaji, K., Fu, J. S., Wang, X., Fan, Q., Itahashi, S., Lee, H.-J., Kim, C.-H., Lin, C.-Y., Zhang, M., Tao, Z., Kajino, M., Liao, H., Li, M., Woo, J.-H., Kurokawa, J., Wang, Z., Wu, Q., Akimoto, H., Carmichael, G. R., and Wang, Z.: Model evaluation and intercomparison of surface-level ozone and relevant species in East Asia in the context of MICS-Asia Phase III – Part 1: Overview, Atmos. Chem. Phys., 19, 12993–13015, https://doi.org/10.5194/acp-19-12993-2019, 2019.
Li, K., Jacob, D. J., Shen, L., Lu, X., De Smedt, I., and Liao, H.: Increases in surface ozone pollution in China from 2013 to 2019: anthropogenic and meteorological influences, Atmos. Chem. Phys., 20, 11423–11433, https://doi.org/10.5194/acp-20-11423-2020, 2020.
Li, M., Liu, H., Geng, G., Hong, C., Liu, F., Song, Y., Tong, D., Zheng, B., Cui, H., Man, H., Zhang, Q., and He, K.: Anthropogenic emission inventories in China: a review, Natl. Sci. Rev., 4, 834–866, https://doi.org/10.1093/nsr/nwx150, 2017a.
Li, M., Zhang, Q., Kurokawa, J.-I., Woo, J.-H., He, K., Lu, Z., Ohara, T., Song, Y., Streets, D. G., Carmichael, G. R., Cheng, Y., Hong, C., Huo, H., Jiang, X., Kang, S., Liu, F., Su, H., and Zheng, B.: MIX: a mosaic Asian anthropogenic emission inventory under the international collaboration framework of the MICS-Asia and HTAP, Atmos. Chem. Phys., 17, 935–963, https://doi.org/10.5194/acp-17-935-2017, 2017b.
Liu, H., Liu, Z., and Lu, F.: A Systematic Comparison of Particle Filter and EnKF in Assimilating Time-Averaged Observations, J. Geophys. Res.-Atmos., 122, 13155–13173, https://doi.org/10.1002/2017jd026798, 2017.
Liu, Z., Wang, Y., Vrekoussis, M., Richter, A., Wittrock, F., Burrows, J. P., Shao, M., Chang, C.-C., Liu, S.-C., Wang, H., and Chen, C.: Exploring the missing source of glyoxal (CHOCHO) over China, Geophys. Res. Lett., 39, L10812, https://doi.org/10.1029/2012GL051645, 2012.
Marais, E. A., Jacob, D. J., Guenther, A., Chance, K., Kurosu, T. P., Murphy, J. G., Reeves, C. E., and Pye, H. O. T.: Improved model of isoprene emissions in Africa using Ozone Monitoring Instrument (OMI) satellite observations of formaldehyde: implications for oxidants and particulate matter, Atmos. Chem. Phys., 14, 7693–7703, https://doi.org/10.5194/acp-14-7693-2014, 2014.
Marsh, D. R., Mills, M. J., Kinnison, D. E., Lamarque, J.-F., Calvo, N., and Polvani, L. M.: Climate Change from 1850 to 2005 Simulated in CESM1(WACCM), J. Climate, 26, 7372–7391, https://doi.org/10.1175/JCLI-D-12-00558.1, 2013.
Mo, Z., Huang, S., Yuan, B., Pei, C., Song, Q., Qi, J., Wang, M., Wang, B., Wang, C., Li, M., Zhang, Q., and Shao, M.: Deriving emission fluxes of volatile organic compounds from tower observation in the Pearl River Delta, China, Sci. Total Environ., 741, 139763, https://doi.org/10.1016/j.scitotenv.2020.139763, 2020.
Mu, M., Randerson, J. T., van der Werf, G. R., Giglio, L., Kasibhatla, P., Morton, D., Collatz, G. J., DeFries, R. S., Hyer, E. J., Prins, E. M., Griffith, D. W. T., Wunch, D., Toon, G. C., Sherlock, V., and Wennberg, P. O.: Daily and 3-hourly variability in global fire emissions and consequences for atmospheric model predictions of carbon monoxide, J. Geophys. Res.-Atmos., 116, D24303, https://doi.org/10.1029/2011jd016245, 2011.
Opacka, B., Müller, J.-F., Stavrakou, T., Miralles, D. G., Koppa, A., Pagán, B. R., Potosnak, M. J., Seco, R., De Smedt, I., and Guenther, A. B.: Impact of Drought on Isoprene Fluxes Assessed Using Field Data, Satellite-Based GLEAM Soil Moisture and HCHO Observations from OMI, Remote Sens.-Basel, 14, rs4092021, https://doi.org/10.3390/rs14092021, 2022.
Palmer, P. I., Abbot, D. S., Fu, T.-M., Jacob, D. J., Chance, K., Kurosu, T. P., Guenther, A., Wiedinmyer, C., Stanton, J. C., Pilling, M. J., Pressley, S. N., Lamb, B., and Sumner, A. L.: Quantifying the seasonal and interannual variability of North American isoprene emissions using satellite observations of the formaldehyde column, J. Geophys. Res.-Atmos., 111, D12315, https://doi.org/10.1029/2005JD006689, 2006.
Paulson, S. E. and Orlando, J. J.: The reactions of ozone with alkenes: An important source of HOx in the boundary layer, Geophys. Res. Lett., 23, 3727–3730, https://doi.org/10.1029/96GL03477, 1996.
Pierce, T., Geron, C., Bender, L., Dennis, R., Tonnesen, G., and Guenther, A.: Influence of increased isoprene emissions on regional ozone modeling, J. Geophys. Res.-Atmos., 103, 25611–25629, https://doi.org/10.1029/98JD01804, 1998.
Ren, J., Guo, F., and Xie, S.: Diagnosing ozone–NOx–VOC sensitivity and revealing causes of ozone increases in China based on 2013–2021 satellite retrievals, Atmos. Chem. Phys., 22, 15035–15047, https://doi.org/10.5194/acp-22-15035-2022, 2022.
Seco, R., Holst, T., Davie-Martin, C. L., Simin, T., Guenther, A., Pirk, N., Rinne, J., and Rinnan, R.: Strong isoprene emission response to temperature in tundra vegetation, P. Natl. Acad. Sci. USA, 119, e2118014119, https://doi.org/10.1073/pnas.2118014119, 2022.
Skamarock, W. C. and Klemp, J. B.: A time-split nonhydrostatic atmospheric model for weather research and forecasting applications, J. Comput. Phys., 227, 3465–3485, https://doi.org/10.1016/j.jcp.2007.01.037, 2008.
Souri, A. H., Nowlan, C. R., González Abad, G., Zhu, L., Blake, D. R., Fried, A., Weinheimer, A. J., Wisthaler, A., Woo, J.-H., Zhang, Q., Chan Miller, C. E., Liu, X., and Chance, K.: An inversion of NOx and non-methane volatile organic compound (NMVOC) emissions using satellite observations during the KORUS-AQ campaign and implications for surface ozone over East Asia, Atmos. Chem. Phys., 20, 9837–9854, https://doi.org/10.5194/acp-20-9837-2020, 2020.
Tang, X., Zhu, J., Wang, Z. F., and Gbaguidi, A.: Improvement of ozone forecast over Beijing based on ensemble Kalman filter with simultaneous adjustment of initial conditions and emissions, Atmos. Chem. Phys., 11, 12901–12916, https://doi.org/10.5194/acp-11-12901-2011, 2011.
van der Werf, G. R., Randerson, J. T., Giglio, L., van Leeuwen, T. T., Chen, Y., Rogers, B. M., Mu, M., van Marle, M. J. E., Morton, D. C., Collatz, G. J., Yokelson, R. J., and Kasibhatla, P. S.: Global fire emissions estimates during 1997–2016, Earth Syst. Sci. Data, 9, 697–720, https://doi.org/10.5194/essd-9-697-2017, 2017.
Vigouroux, C., Langerock, B., Bauer Aquino, C. A., Blumenstock, T., Cheng, Z., De Mazière, M., De Smedt, I., Grutter, M., Hannigan, J. W., Jones, N., Kivi, R., Loyola, D., Lutsch, E., Mahieu, E., Makarova, M., Metzger, J.-M., Morino, I., Murata, I., Nagahama, T., Notholt, J., Ortega, I., Palm, M., Pinardi, G., Röhling, A., Smale, D., Stremme, W., Strong, K., Sussmann, R., Té, Y., van Roozendael, M., Wang, P., and Winkler, H.: TROPOMI–Sentinel-5 Precursor formaldehyde validation using an extensive network of ground-based Fourier-transform infrared stations, Atmos. Meas. Tech., 13, 3751–3767, https://doi.org/10.5194/amt-13-3751-2020, 2020.
Wang, H., Yan, R., Xu, T., Wang, Y., Wang, Q., Zhang, T., An, J., Huang, C., Gao, Y., Gao, Y., Li, X., Yu, C., Jing, S., Qiao, L., Lou, S., Tao, S., and Li, Y.: Observation Constrained Aromatic Emissions in Shanghai, China, J. Geophys. Res.-Atmos., 125, e2019JD031815, https://doi.org/10.1029/2019JD031815, 2020.
Wang, H., Wu, Q., Guenther, A. B., Yang, X., Wang, L., Xiao, T., Li, J., Feng, J., Xu, Q., and Cheng, H.: A long-term estimation of biogenic volatile organic compound (BVOC) emission in China from 2001–2016: the roles of land cover change and climate variability, Atmos. Chem. Phys., 21, 4825–4848, https://doi.org/10.5194/acp-21-4825-2021, 2021.
Wang, H., Lu, X., Seco, R., Stavrakou, T., Karl, T., Jiang, X., Gu, L., and Guenther, A. B.: Modeling Isoprene Emission Response to Drought and Heatwaves Within MEGAN Using Evapotranspiration Data and by Coupling With the Community Land Model, J. Adv. Model. Earth Sy., 14, e2022MS003174, https://doi.org/10.1029/2022MS003174, 2022.
Wang, J., Yan, R., Wu, G., Liu, Y., Wang, M., Zeng, N., Jiang, F., Wang, H., He, W., Wu, M., Ju, W., and Chen, J. M.: Unprecedented decline in photosynthesis caused by summer 2022 record-breaking compound drought-heatwave over Yangtze River Basin, Sci. Bull., 68, 2160–2163, https://doi.org/10.1016/j.scib.2023.08.011, 2023.
Wang, N., Lyu, X., Deng, X., Huang, X., Jiang, F., and Ding, A.: Aggravating O3 pollution due to NOx emission control in eastern China, Sci. Total Environ., 677, 732–744, https://doi.org/10.1016/j.scitotenv.2019.04.388, 2019.
Wang, P., Liu, Y., Dai, J., Fu, X., Wang, X., Guenther, A., and Wang, T.: Isoprene Emissions Response to Drought and the Impacts on Ozone and SOA in China, J. Geophys. Res.-Atmos., 126, e2020JD033263, https://doi.org/10.1029/2020JD033263, 2021.
Wang, W., van der A, R., Ding, J., van Weele, M., and Cheng, T.: Spatial and temporal changes of the ozone sensitivity in China based on satellite and ground-based observations, Atmos. Chem. Phys., 21, 7253–7269, https://doi.org/10.5194/acp-21-7253-2021, 2021.
Warneke, C., de Gouw, J. A., Del Negro, L., Brioude, J., McKeen, S., Stark, H., Kuster, W. C., Goldan, P. D., Trainer, M., Fehsenfeld, F. C., Wiedinmyer, C., Guenther, A. B., Hansel, A., Wisthaler, A., Atlas, E., Holloway, J. S., Ryerson, T. B., Peischl, J., Huey, L. G., and Hanks, A. T. C.: Biogenic emission measurement and inventories determination of biogenic emissions in the eastern United States and Texas and comparison with biogenic emission inventories, J. Geophys. Res.-Atmos., 115, D00F18, https://doi.org/10.1029/2009JD012445, 2010.
Whitaker, J. S. and Hamill, T. M.: Ensemble data assimilation without perturbed observations, Mon. Weather Rev., 130, 1913–1924, https://doi.org/10.1175/1520-0493(2002)130<1913:Edawpo>2.0.Co;2, 2002.
Wolfe, G. M., Kaiser, J., Hanisco, T. F., Keutsch, F. N., de Gouw, J. A., Gilman, J. B., Graus, M., Hatch, C. D., Holloway, J., Horowitz, L. W., Lee, B. H., Lerner, B. M., Lopez-Hilifiker, F., Mao, J., Marvin, M. R., Peischl, J., Pollack, I. B., Roberts, J. M., Ryerson, T. B., Thornton, J. A., Veres, P. R., and Warneke, C.: Formaldehyde production from isoprene oxidation across NOx regimes, Atmos. Chem. Phys., 16, 2597–2610, https://doi.org/10.5194/acp-16-2597-2016, 2016.
Yuan, B., Kaser, L., Karl, T., Graus, M., Peischl, J., Campos, T. L., Shertz, S., Apel, E. C., Hornbrook, R. S., Hills, A., Gilman, J. B., Lerner, B. M., Warneke, C., Flocke, F. M., Ryerson, T. B., Guenther, A. B., and de Gouw, J. A.: Airborne flux measurements of methane and volatile organic compounds over the Haynesville and Marcellus shale gas production regions, J. Geophys. Res.-Atmos., 120, 6271–6289, https://doi.org/10.1002/2015JD023242, 2015.
Zhang, M., Zhao, C., Yang, Y., Du, Q., Shen, Y., Lin, S., Gu, D., Su, W., and Liu, C.: Modeling sensitivities of BVOCs to different versions of MEGAN emission schemes in WRF-Chem (v3.6) and its impacts over eastern China, Geosci. Model Dev., 14, 6155–6175, https://doi.org/10.5194/gmd-14-6155-2021, 2021.
Zhang, Q., Streets, D. G., Carmichael, G. R., He, K. B., Huo, H., Kannari, A., Klimont, Z., Park, I. S., Reddy, S., Fu, J. S., Chen, D., Duan, L., Lei, Y., Wang, L. T., and Yao, Z. L.: Asian emissions in 2006 for the NASA INTEX-B mission, Atmos. Chem. Phys., 9, 5131–5153, https://doi.org/10.5194/acp-9-5131-2009, 2009.
Zheng, B., Tong, D., Li, M., Liu, F., Hong, C., Geng, G., Li, H., Li, X., Peng, L., Qi, J., Yan, L., Zhang, Y., Zhao, H., Zheng, Y., He, K., and Zhang, Q.: Trends in China's anthropogenic emissions since 2010 as the consequence of clean air actions, Atmos. Chem. Phys., 18, 14095–14111, https://doi.org/10.5194/acp-18-14095-2018, 2018.
Zhou, B., Guo, H., Zeren, Y., Wang, Y., Lyu, X., Wang, B., and Wang, H.: An Observational Constraint of VOC Emissions for Air Quality Modeling Study in the Pearl River Delta Region, J. Geophys. Res.-Atmos., 128, e2022JD038122, https://doi.org/10.1029/2022JD038122, 2023.