the Creative Commons Attribution 4.0 License.
the Creative Commons Attribution 4.0 License.
 | 26 Jun 2024
Revealing the significant acceleration of hydrofluorocarbon (HFC) emissions in eastern Asia through long-term atmospheric observations
Haklim Choi
Alison L. Redington
Hyeri Park
Jooil Kim
Rona L. Thompson
Jens Mühle
Peter K. Salameh
Christina M. Harth
Ray F. Weiss
Alistair J. Manning
Hydrofluorocarbons (HFCs) are powerful anthropogenic greenhouse gases (GHGs) with high global-warming potentials (GWPs). They have been widely used as refrigerants, insulation foam-blowing agents, aerosol propellants, and fire suppression agents. Since the mid-1990s, emissions of HFCs have been increasing rapidly as they are used in many applications to replace ozone-depleting chlorofluorocarbons (CFCs) and hydrochlorofluorocarbons (HCFCs) whose consumption and production have been phased out under the Montreal Protocol (MP). Due to the high GWP of HFCs, the Kigali Amendment to the MP requires the phasedown of production and consumption of HFCs to gradually achieve an 80 %–85 % reduction by 2047, starting in 2019 for non-Article 5 (developed) countries with a 10 % reduction against each defined baseline and later schedules for Article 5 (developing) countries. In this study, we have examined long-term high-precision measurements of atmospheric abundances of five major HFCs (HFC-134a, HFC-143a, HFC-32, HFC-125, and HFC-152a) at Gosan station, Jeju Island, South Korea, from 2008 to 2020. Background abundances of HFCs gradually increased, and the inflow of polluted air masses with elevated abundances from surrounding source regions were detected over the entire period. From these pollution events, we inferred regional and country-specific HFC emission estimates using two independent Lagrangian particle dispersion models and Bayesian inversion frameworks (FLEXPART-FLEXINVERT+ and NAME-InTEM). The spatial distribution of the derived “top-down” (measurement based) emissions for all HFCs shows large fluxes from megacities and industrial areas in the region. Our most important finding is that HFC emissions in eastern China and Japan have sharply increased from 2016 to 2018. The contribution of East Asian HFC emissions to the global total increased from 9 % (2008–2014) to 13 % (2016–2020). In particular, HFC emissions in Japan (Annex I country) rose rapidly from 2016 onward, with accumulated total inferred HFC emissions being ∼ 114 Gg yr−1, which is ∼ 76 Gg yr−1 higher for 2016–2020 than the “bottom-up” (i.e., based on activity data and emission factors) emissions of ∼ 38 Gg yr−1 reported to the United Nations Framework Convention on Climate Change (UNFCCC). This is likely related to the increase in domestic demand in Japan for refrigerants and air-conditioning-system-related products and incomplete accounting. A downward trend of HFC emissions that started in 2019 reflects the effectiveness of the F-gas policy in Japan. Eastern China and South Korea, though not obligated to report to the UNFCCC, voluntarily reported emissions, which also show differences between top-down and bottom-up emission estimates, demonstrating the need for atmospheric measurements, comprehensive data analysis, and accurate reporting for precise emission management. Further, the proportional contribution of each country's CO2-equivalent HFC emissions has changed over time, with HFC-134a decreasing and HFC-125 increasing. This demonstrates the transition in the predominant HFC substances contributing to global warming in each country.
- Article
(5605 KB) - Full-text XML
-
Supplement
(2145 KB) - BibTeX
- EndNote


Hydrofluorocarbons (HFCs) were introduced to replace stratospheric ozone-depleting substances (ODSs) such as chlorofluorocarbons (CFCs) and hydrochlorofluorocarbons (HCFCs), whose production and consumption are regulated under the Montreal Protocol (UNEP, 1987). HFCs are widely used in industrial applications such as air conditioning, refrigeration, foam blowing, and fire extinguishers. HFCs do not contain ozone-depleting chlorine atoms. However, HFCs are potent anthropogenic greenhouse gases (GHGs) with global-warming potentials (GWPs) about hundreds to thousands of times higher than that of carbon dioxide (CO2) (Liang et al., 2022).
Due to their high GWP, HFCs have been included in the Kyoto Protocol, which aims to reduce greenhouse gas emissions (Breidenich et al., 1998). Additionally, nations in the Annex I group that have made the commitment to mitigate climate change (within their jurisdiction and capacity to do so) must provide yearly emission statistics to the UNFCCC (United Nations Framework Convention on Climate Change). However, the Kyoto Protocol was not ratified by all countries (only Annex I countries), so it was superseded by the Paris Agreement (Paris Agreement, 2015). The Kigali Amendment to the Montreal Protocol was adopted in 2015, with the goal of gradually reducing HFC production and consumption globally to attain an 80 %–85 % decrease by 2047. Under the Amendment, Parties to the Montreal Protocol are divided into four groups (non-Article 5 earlier starts, non-Article 5 later starts, Article 5 Group 1, and Article 5 Group 2), and each sets a baseline for HFCs and proceeds with a phasedown under the Kigali Amendment. Non-Article 5 early starts and later starts countries began phasing down in 2019 and 2020 in order to reach an 85 % reduction in 2036. In addition, Article 5 Group 1 and 2 Parties have reduction targets of 80 % by 2045 and 85 % by 2047, with reductions starting at 10 % in 2029 and 2032, respectively. This phasedown schedule for Article 5 countries is relatively lenient compared to non-Article 5 countries. Reliable HFC emission estimates are required to monitor the phasedown under the Kigali Amendment.
There are two ways to quantify HFC emissions: (1) bottom-up, where emissions are determined by applying emission factors based on each sector's production/consumption (activity data) – these are reported by developed countries as national emission inventory (NEI) data to the UNFCCC; some developing countries also compile NEI but do not report to the UNFCCC; (2) top-down, where emissions are inferred from direct measurements of atmospheric abundances combined with inverse modeling or interspecies-correlation methods. Understanding these two complementary approaches and evaluating potential discrepancies between them are essential to reducing uncertainty in quantifying surface emissions on global and national scales. Rigby et al. (2014) demonstrated that global HFC emissions estimated from the Advanced Global Atmospheric Gases Experiment (AGAGE; Prinn et al., 2018) observation network and the national inventories reported to the UNFCCC from Annex I countries were in relatively good agreement until the early 1990s, but then the gap between the two estimates widened as global top-down emissions continued to increase, while the bottom-up emissions reported by Annex I countries plateaued after the late 1990s. In 2011, global top-down emissions were approximately 2 times the bottom-up emissions reported by Annex I to the UNFCCC. These discrepancies have persisted and the gaps are still growing (Velders et al., 2022). This gap may reflect differences in reported emissions from Annex I countries, as well as the impact of continued increases in emissions from non-Annex I countries.
To understand where global emissions arise, it is necessary to estimate emissions on national and regional scales (Weiss and Prinn, 2011). Previous regional studies demonstrated that there is reasonable consistency between bottom-up and top-down emission estimates in Europe (Graziosi et al., 2017) and the United States (Hu et al., 2017). This suggests that the discrepancies at the global scale are less likely to be caused by significant underreporting from Annex I countries but rather arise from unreported emissions from developing countries, even though some gaps exist for specific HFCs in some Annex I countries (Lunt et al., 2015; Manning et al., 2021).
According to the statistical summary from Flerlage et al. (2021), many studies have been conducted worldwide to estimate regional-scale HFC emissions. Nevertheless, regions such as Latin America and the Caribbean (LAC), Africa, and India suffer from a dearth of observation stations and top-down estimation studies. In eastern Asia, which contributes significantly to global HFC emissions, top-down and bottom-up studies targeting the whole of China (Yao et al., 2019 and Fang et al., 2016) as well as specific regions in China such as the Yangtze River Delta (Pu et al., 2020), Greater Pearl River Delta (Zeng et al., 2020), North China Plain (Ding et al., 2023), and big cities (Yi et al., 2023) have been conducted. Until the early 2010s, many studies estimated HFC emissions for a limited period of time in the eastern Asia region (Japan, South Korea, North Korea, and Taiwan), excluding China (Fortems-Cheiney et al., 2015; Li et al., 2011; Lunt et al., 2015; Stohl et al., 2010). However, no recent research has been conducted over a sufficiently long period before and after the Kigali Amendment to investigate HFC emissions in eastern Asia based on high-frequency regional background observations. Hence, there has been a lack of recent research on HFCs, culminating in a dearth of information on current HFC emission trends in eastern Asia. As the reduction of HFC emission is gradually being achieved globally under the Kigali Amendment, it is necessary to continuously monitor and identify long-term HFC emission trends in eastern Asia (non-Article 5 earlier starts: Japan; Article 5 Group 1 countries: China, South Korea, North Korea, and Taiwan).
Therefore, we present a high-precision, high-frequency measurement record of the five most abundant HFCs (HFC-134a, HFC-32, HFC-125, HFC-143a, and HFC-152a; Table 1) observed at Gosan station, Jeju Island, South Korea, from 2008 to 2020, and analyze long-term temporal variations. We use the long-term observations to estimate regional top-down emissions at the country level in eastern Asia using a Bayesian inversion approach. We compare these to bottom-up inventories reported to the UNFCCC and the Emission Database for Global Atmospheric Research (EDGAR) version 7 (Crippa et al., 2021) by each country to better understand recent HFC emissions in eastern Asia and how they may be affected by the Kyoto Protocol, the Paris Agreement, and the Kigali Amendment.
2.1 Instrumentation
Atmospheric abundances (mole fractions) of HFCs were measured at Gosan (GSN, 33.3° N, 126.2° E; 72 m a.s.l.) at the southwestern cliff of Jeju Island, using a Medusa gas chromatographic system with cryogenic preconcentration and mass spectrometric detection (Miller et al., 2008; Arnold et al., 2012; Prinn et al., 2018). Gosan is an ideal location for determining regional emissions because of the minimal influence from local anthropogenic sources combined with inflow of strongly polluted air masses from surrounding regions such as China, Japan, and Korea interspersed with periods of inflow of relatively unpolluted air masses from the Northern and Southern Hemisphere.
The Medusa system has been measuring more than 50 halogenated substances with high-precision, including the five most abundant HFCs studied here, approximately every 2 h (12 times a day) with a 20 min sampling duration since 2008 as a part of the AGAGE. The number of samples from 2008 to 2020 is approximately 26 000 for each HFC substance.
The observed atmospheric abundances of HFCs are reported on calibration scales maintained by the Scripps Institution of Oceanography (SIO and SIO-05 for HFC-134a and HFC-152a; SIO-07 for HFC-32 and HFC-143a; and SIO-14 for HFC-125). The measurement precision (1σ) for HFC species determined through repeated analyses (n=12) of ambient working standards is better than 2 % (i.e., precision for HFC-134a <1 %, HFC-32 <5 % (improving from ∼ 5 % in 2008 to <2 % by 2017), HFC-125 <1 %, HFC-143a <2 %, and HFC-152a <2 %).
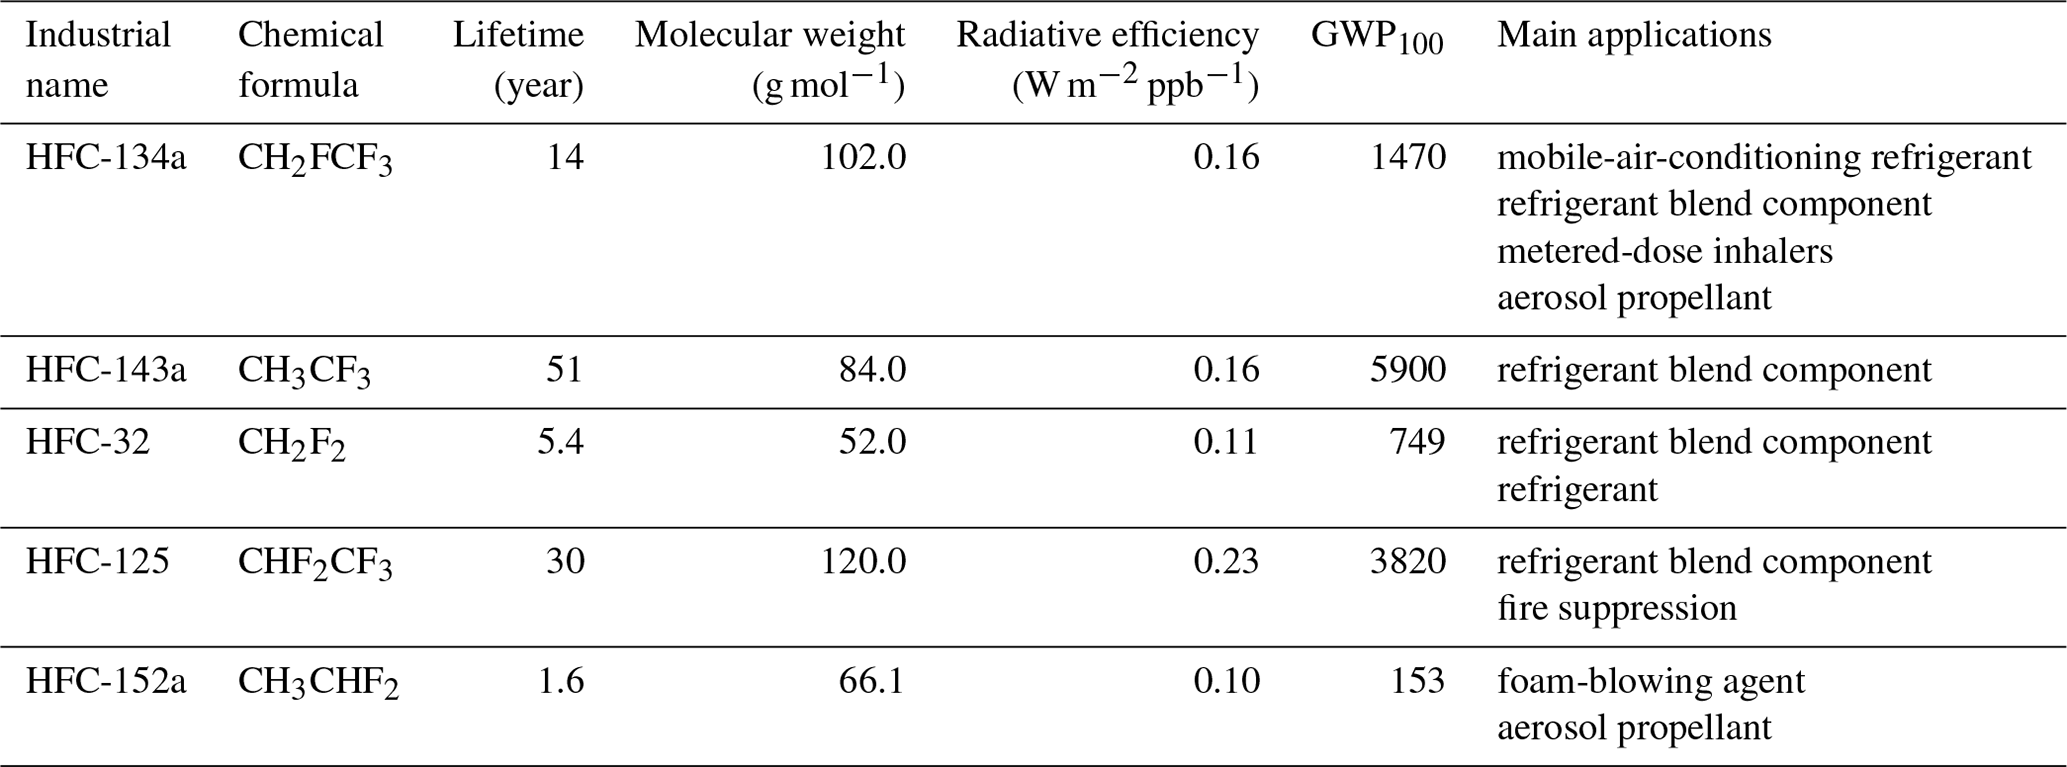
Table 1Detailed information, lifetime, molecular weight, radiative efficiency, 100-year global-warming potential, and applications (Liang and Rigby et al., 2022, for the five most abundant hydrofluorocarbons, HFC-134a, HFC-143a, HFC-32, HFC-125, and HFC-152a).
2.2 Inversion frameworks for estimating regional HFC emissions
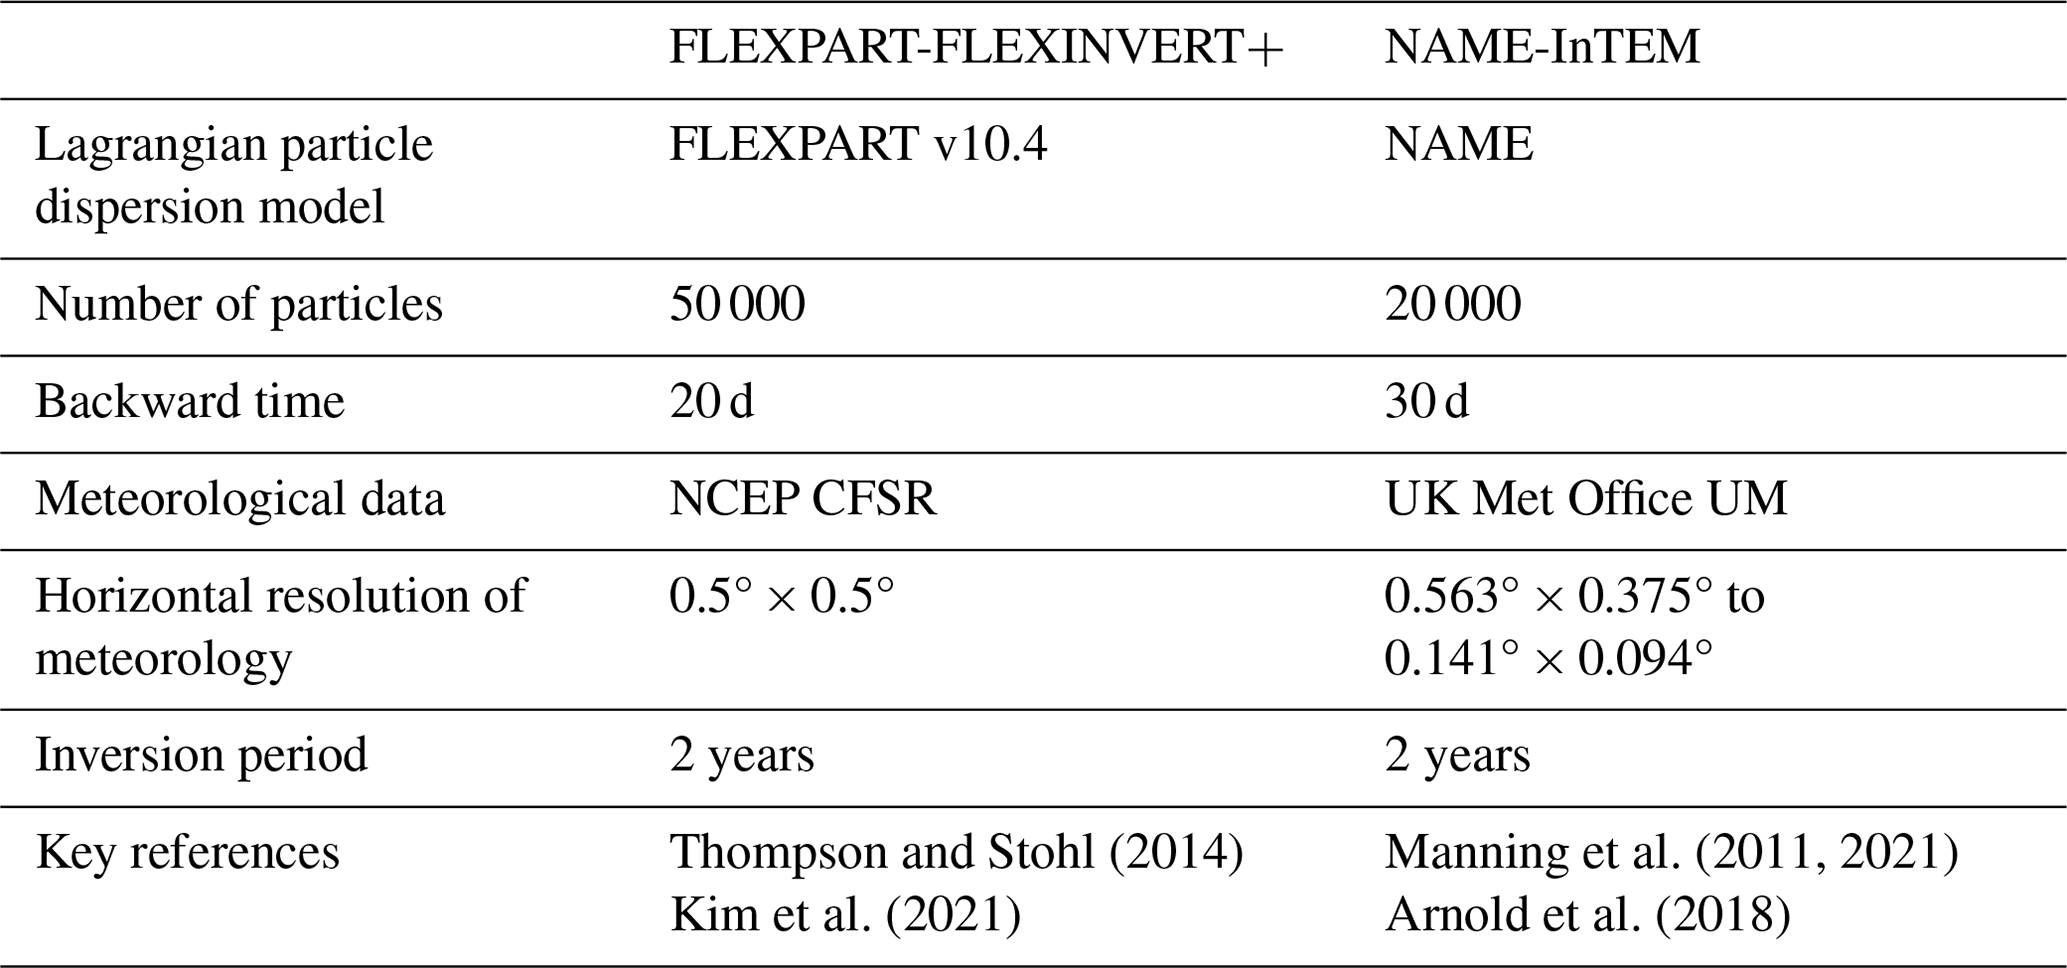
Several Bayesian inversion models based on Lagrangian particle dispersion models (LPDMs) have been developed to estimate regional- or national-scale emissions from high-precision atmospheric measurements, and many studies have quantified annual emissions of trace gases through intercomparison of inversion methods (Rigby et al., 2019; Park et al., 2021). Therefore, to get a better understanding of annual HFC emissions, their uncertainties, and variability inferred from observation at Gosan, we have used two fully independent Bayesian inversion frameworks, FLEXINVERT+ (Thompson and Stohl, 2014) and the Inversion Technique for Emission Modelling (InTEM; Manning et al., 2011) coupled with the FLEXible PARTicle dispersion model (FLEXPART; Pisso et al., 2019) and the Numerical Atmospheric dispersion Modelling Environment (NAME; Jones et al., 2007), respectively. The two inversion frameworks use different meteorological data and LPDMs, and their inversion methods differ in terms of prior information and uncertainties, background concentrations, model domain, and other parameters (Table 2). Both frameworks can estimate trace gas emissions using a range of temporal resolutions. In this study, for both inversion frameworks we chose to use a 2-year temporal matrix of the observation data as an assimilation time window, which increased the sensitivity through a more extended temporal window than compared to a 1-year window (which is commonly used for synthetic gases), and to resolve the emissions with 1-year resolution. The longer assimilation window provides smoother, more realistic annual variation in emissions. The emissions are derived using a 2-year inversion period advanced in steps of 1 year. The annual emissions shown are the average of the two inversions that include that year, with the exception of 2008 and 2020, which are based on a single 2-year inversion. Hereafter, the emissions and uncertainty ranges presented in this study are each of mean values without weighting to represent the results derived independently from the two inversion frameworks. The configuration of each inversion framework is outlined in Table 2, and the description of each inversion framework is provided in the following.
Table 2The details of construction for two independent Bayesian inversion frameworks, FLEXPART-FLEXINVERT+ and NAME-InTEM.
2.2.1 FLEXPART-FLEXINVERT+
A detailed description of FLEXPART-FLEXINVERT+, including the theoretical approach, and the presetting process applied in this study are given in Kim et al. (2021). Here, we present a brief overview of the inverse methods.
The origin of the air masses observed at 2 h intervals at Gosan and their path of diffusion were traced using FLEXPART v10.4 (Pisso et al., 2019), an LPDM, using the National Centers for Environmental Prediction (NCEP) Climate Forecast System Reanalysis (CFSR; Saha et al., 2014) with a horizontal resolution of 0.5° × 0.5° and a 1 h temporal resolution as input. To simulate the transport and dispersion of atmospheric particles, we released 50 000 particles at Gosan and tracked their movement backward in time for 20 d. The footprint sensitivities, a source–receptor relationship matrix, which indicates how spatially sensitive the observations at Gosan are to emissions at any given source location, were estimated at the same spatial resolution (0.5° × 0.5°) as the input NCEP CFSR meteorological data.
FLEXINVERT+ is a Bayesian inversion model coupled with the FLEXPART model, which is designed to estimate surface fluxes from continuous observation time-series data. The Bayesian approach improves the accuracy of the estimated surface fluxes by accounting for uncertainties in the system. This method estimates the optimal posterior state within the model domain from the prior information and atmospheric observation time series considering each uncertainty by minimizing the cost function (J(p)) as follows:
where p and p0 are the state vector and its prior information, and y is the measured enhancement that is determined as the elevated mole fraction over the background state. T is the transpose of a matrix. The regional background condition, which is called baseline, is determined by separating the pollution signals according to a statistical classification method developed in AGAGE (O'Doherty et al., 2001; see Sect. 3.1 for details). B and R are prior and observation error covariance matrices, respectively. H is the atmospheric chemistry transport function (via continuity equation).
In applying the temporally observed data at Gosan to the inversion framework, we use all measured enhancements with an interval of about 2 h, without temporal averaging. The total error (σtot) applied to each enhancement point is determined by applying the error propagation method to the three components related to instrument, background, and model.
where σinst is the instrumental precision of each HFC compound based on the repeatability measurement for the working tank. The working tank is filled with clean air on-site at Gosan station on a clear, rainless day. It is utilized for drift correction of the detector. σbkg is the monthly standard deviation of background mole fraction, which was determined to define the enhancement. The mean and standard deviation of the monthly background mole fractions were assumed to be at the midpoint of each month, the 15th, and then linearly interpolated for each observation point. σmodel denotes the model representation error, which corresponds to a value of approximately 3 % of the background mole fraction.
As shown in Eq. (1) in a Bayesian approach, the spatial distribution and quantitative amount of prior information, as well as its associated uncertainty, can affect the final optimized posterior results. The spatial distribution of prior emissions of each HFC was spatially weighted by the global population density (CIESIN, 2015) based on global HFC emissions estimated for 2008 by Rigby et al. (2014). We established regional emissions for 2008 from previous studies (Stohl et al., 2010, for HFC-134a and Li et al., 2011, for other HFCs) for the highly sensitive regions of eastern Asia, such as eastern China, Japan, South Korea, North Korea, and Taiwan. The emissions allocated to individual regions for each HFC are summarized in Table S1. These prior emissions defined for 2008 were applied equally to all years. To account for the uncertainty in initial emissions, we constructed an ensemble of emission distributions, magnitudes, and uncertainties comprising 27 datasets. These datasets were generated based on various conditions, including three types of initial emission distributions (population distribution, Asia flattened, and eastern Asia flattened), three quantitatively scaled emission levels (×0.5, × 1, and ×2), and three initial uncertainty levels (100 %, 200 %, and 300 %). Flattened means that each grid cell was evenly distributed to have the same value for a specific area (e.g., each country or eastern China) (refer to Fig. S1 for further details about spatial distribution).
2.2.2 NAME-InTEM
To ensure the consistency and accuracy of estimated emissions for each HFC, this study simultaneously utilizes NAME-InTEM, a well-established inversion model that has been widely applied in previous research to estimate emissions of various greenhouse gases. InTEM, a Bayesian inversion model with a non-negative least squares solver, uses the NAME Lagrangian dispersion model developed by the UK Met Office to trace the movement and dispersion of air trajectories. In this study, NAME is employed to track the trajectory of air movement over the past 30 d by releasing 20 000 particles per hour from the location of Gosan station. Similar to FLEXPART-FLEXINVERT+, NAME-InTEM constructs a spatial distribution of HFC prior emissions based on the population density (but not uniformly flattened for a certain region) and sets the prior uncertainty to 100 %.
InTEM estimate emissions also used the same Gosan observation data. The inversion process performs 24 iterations repeatedly for the same time period whilst removing eight randomly selected blocks of 5 d within the temporal window to improve the estimates of uncertainty. For more detailed information regarding the model and methodology, see Arnold et al. (2018) and Manning et al. (2021).
3.1 Long-term measurements of atmospheric HFCs at Gosan
Long-term, high-frequency atmospheric HFC mole fractions observed during 2008–2020 at Gosan are illustrated in Fig. 1. The regional background mole fraction of each HFC was determined by applying AGAGE's statistical algorithm via Gaussian filtering (O'Doherty et al., 2001) to separate pollution signals within a 121 d temporal window (±60 d from each observation time).
The increasing trend of background mole fractions was continuous and evident for all HFCs. The annual average background mole fractions of HFC-134a and HFC-143a have linearly and continuously increased from 53.3 ± 3.0 and 9.5 ± 0.5 ppt in 2008 to 120.5 ± 3.7 and 27.3 ± 0.3 ppt in 2020, respectively. HFC-32 and HFC-125 have shown steeper, exponential increases in background mole fractions from 3.3 ± 0.2 and 7.4 ± 0.5 ppt in 2008 to 29.1 ± 2.0 and 35.7 ± 1.5 ppt in 2020, respectively. In contrast, HFC-152a showed a relatively moderate increase from 8.2 ± 1.5 ppt in 2008 to 10.0 ± 2.0 ppt in 2020, reflecting its short lifetime of 1.6 years. These increases in HFC background mole fractions in eastern Asia are similar to the global trends presented in Montzka et al. (2018) and Liang et al. (2022).
For all HFCs, we observe a seasonal drop of background mole fractions due to the Asian summer monsoon bringing relatively clean air masses from the tropical Pacific to Gosan (Li et al., 2018). Several gaps in the observations were caused by instrumental shutdowns due to typhoons or technical problems (Choi et al., 2022).
On top of the increasing HFC background mole fractions, pollution signals have been observed throughout the entire period, and their magnitudes have also progressively increased as shown in Fig. 2, which implies persistent, increasing HFC emissions from nearby anthropogenic sources in eastern Asia.
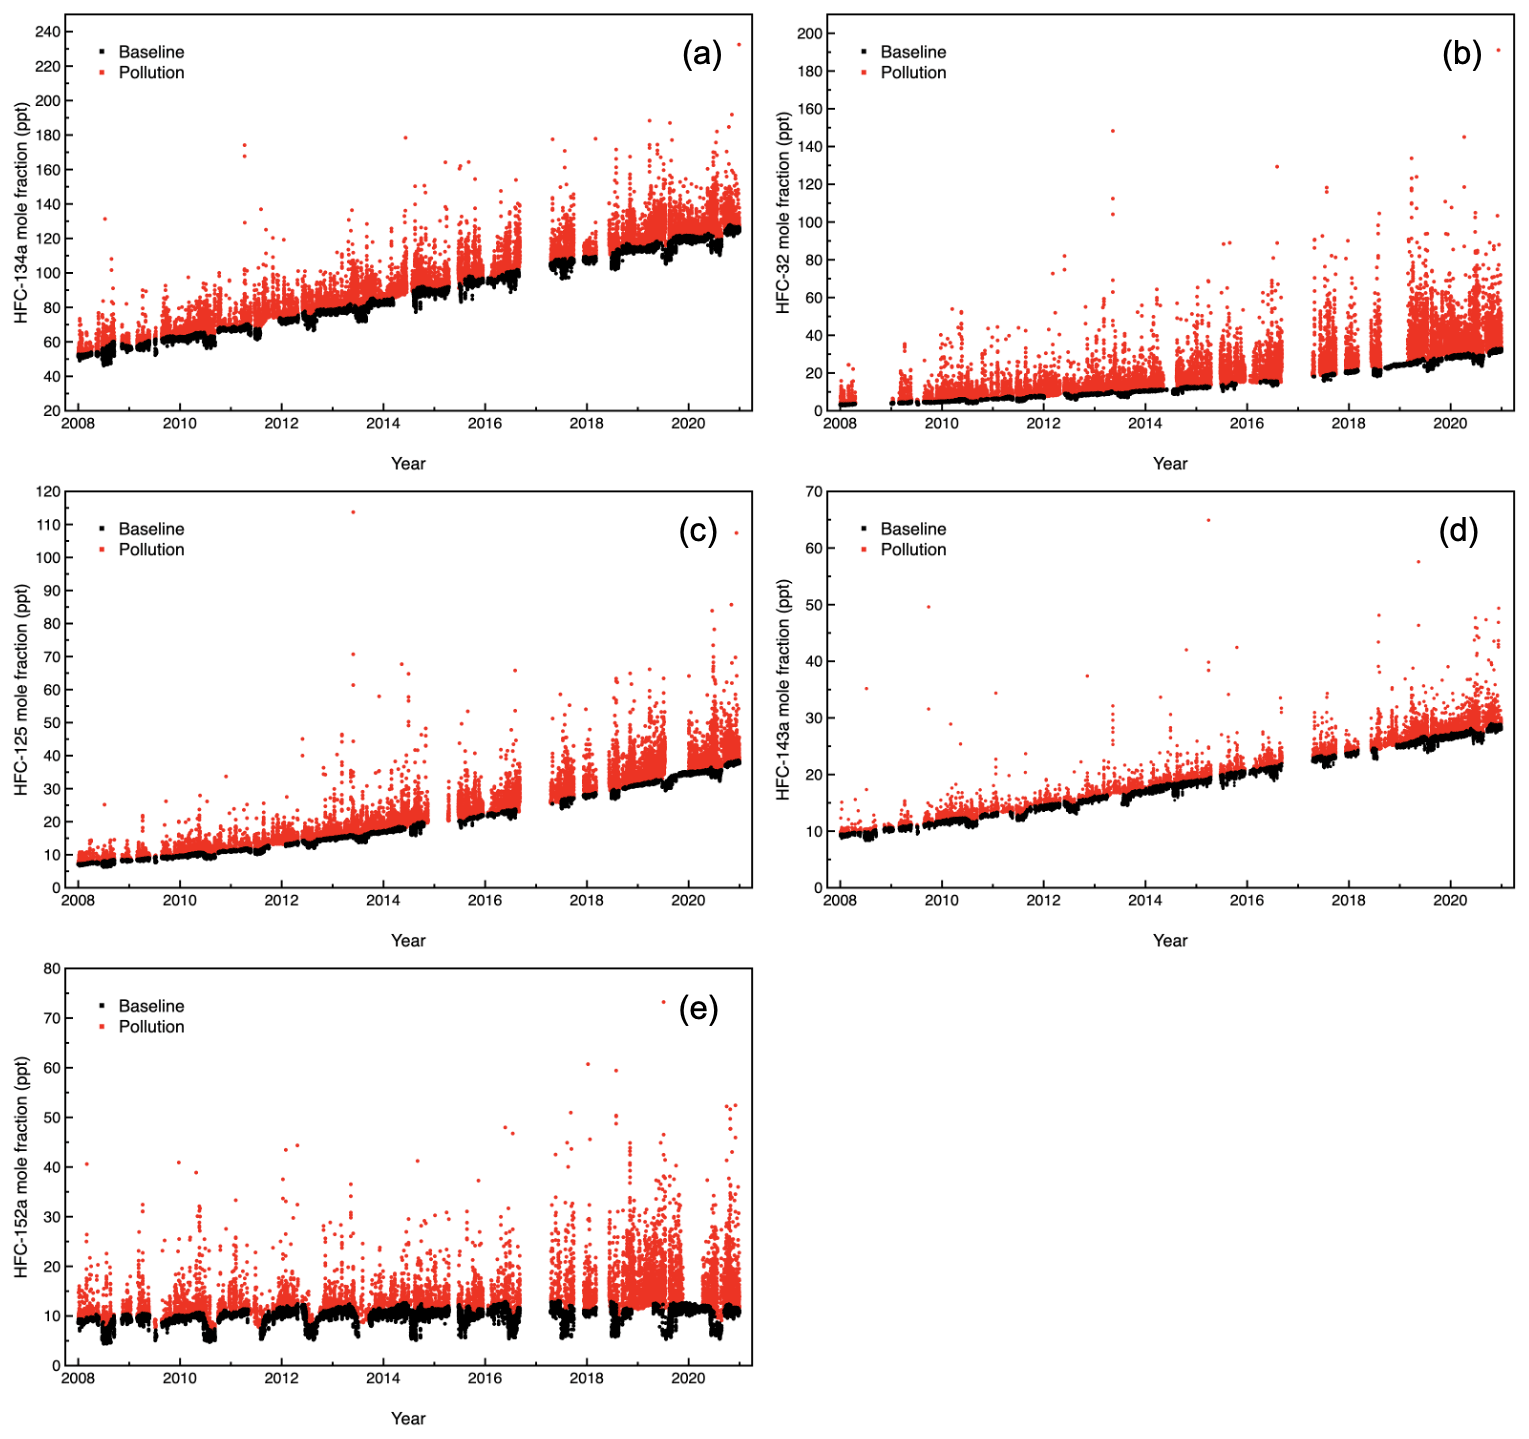
Figure 1Atmospheric HFC mole fractions measured at Gosan from 2008 to 2020, showing (a) HFC-134a, (b) HFC-32, (c) HFC-125, (d) HFC-143a, and (e) HFC-152a. The baseline data (black) are selected using the AGAGE statistical method (O'Doherty et al., 2001) to determine polluted data (red) which are elevated above the baseline data.
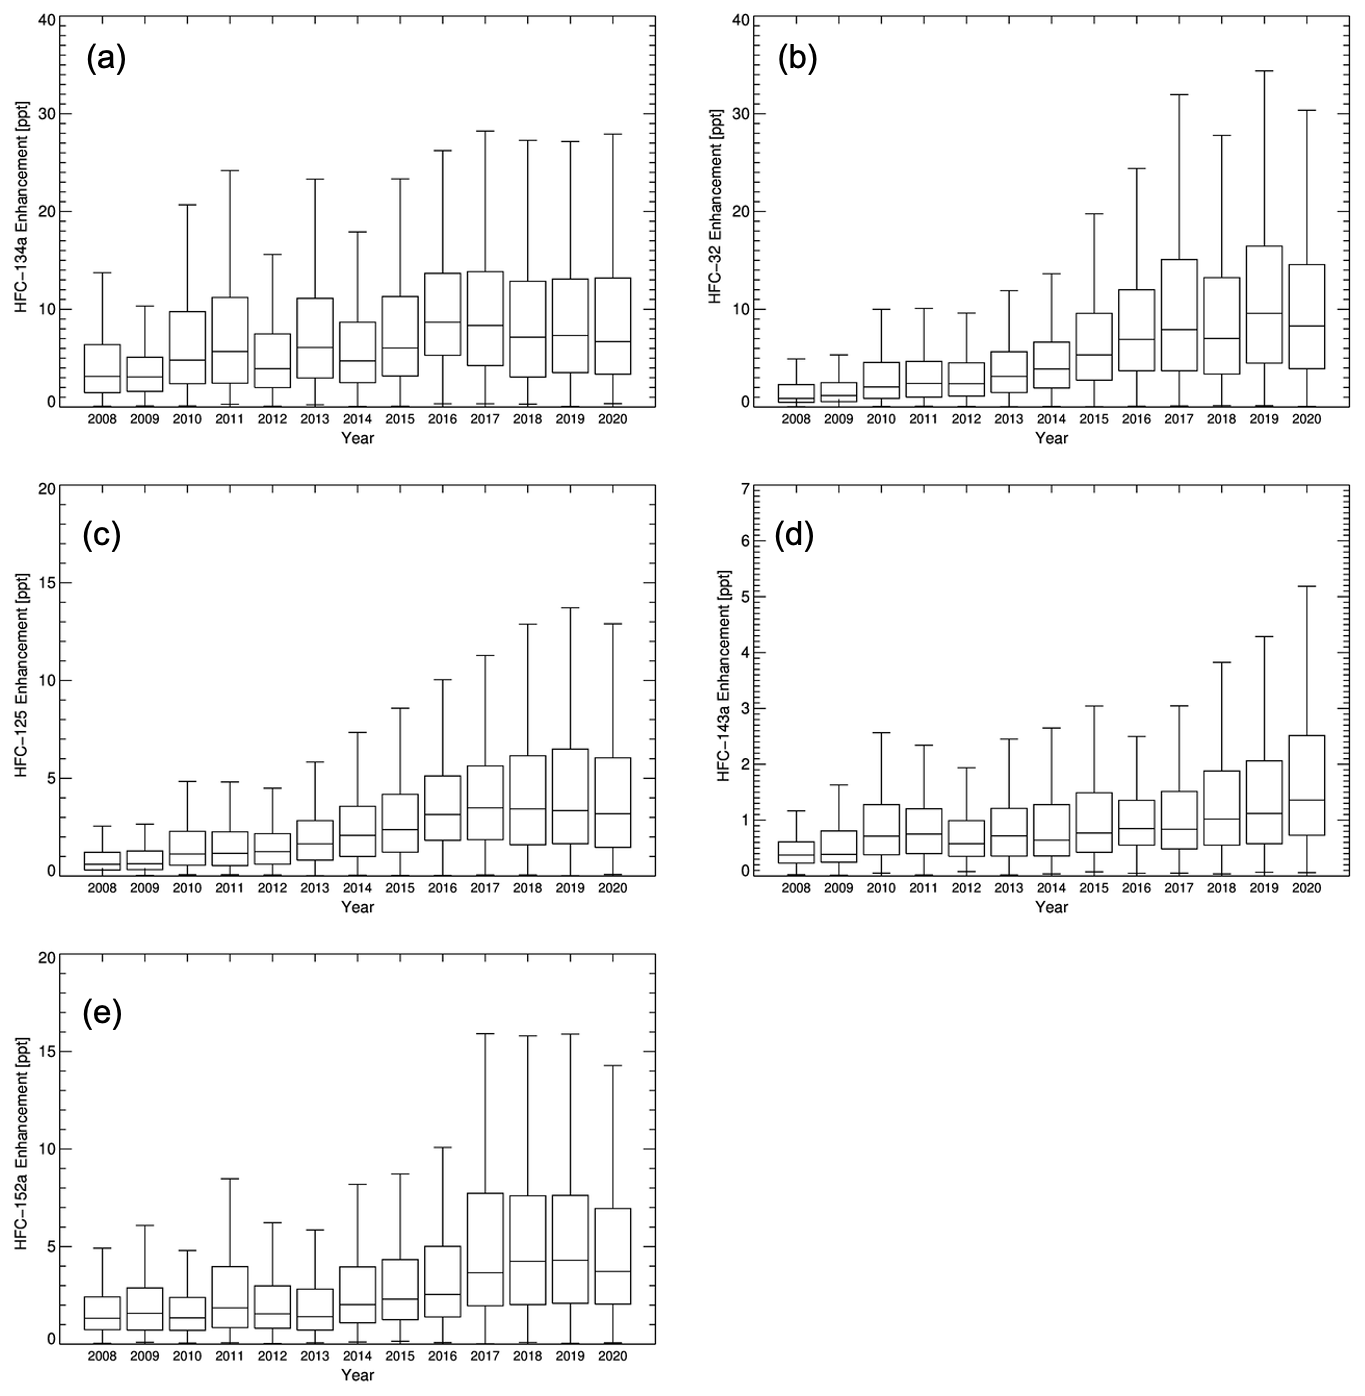
Figure 2Box–whisker plots of annual mole fraction enhancements above baseline for each HFC from 2008 to 2020, showing (a) HFC-134a, (b) HFC-32, (c) HFC-125, (d) HFC-143a, and (e) HFC-152a. The box encompasses the interquartile range (IQR), which is defined as the 25th–75th percentiles, while the whiskers represent the maximum and minimum enhancements. The solid lines indicate the median value of the data.
3.2 Top-down emission estimates of HFCs in eastern Asia
The HFC emission estimate from 2008 to 2020 in eastern Asia reveals distinct phases of changes. HFC emissions gradually increased or remained relatively constant until 2015. However, between 2016 and 2018, there was a sharp increase in emissions, especially evident in eastern China and Japan, primarily affected by HFC-134a, HFC-32, and HFC-125. Since 2019, the HFC emission trend in Japan has shifted towards stabilization or reduction, suggesting the onset of more stringent regulatory impacts. Contrastingly, although the emissions in South Korea, North Korea, and Taiwan are lower compared to China and Japan, there has been an increase over the years, with a noticeable acceleration in South Korea's emissions.
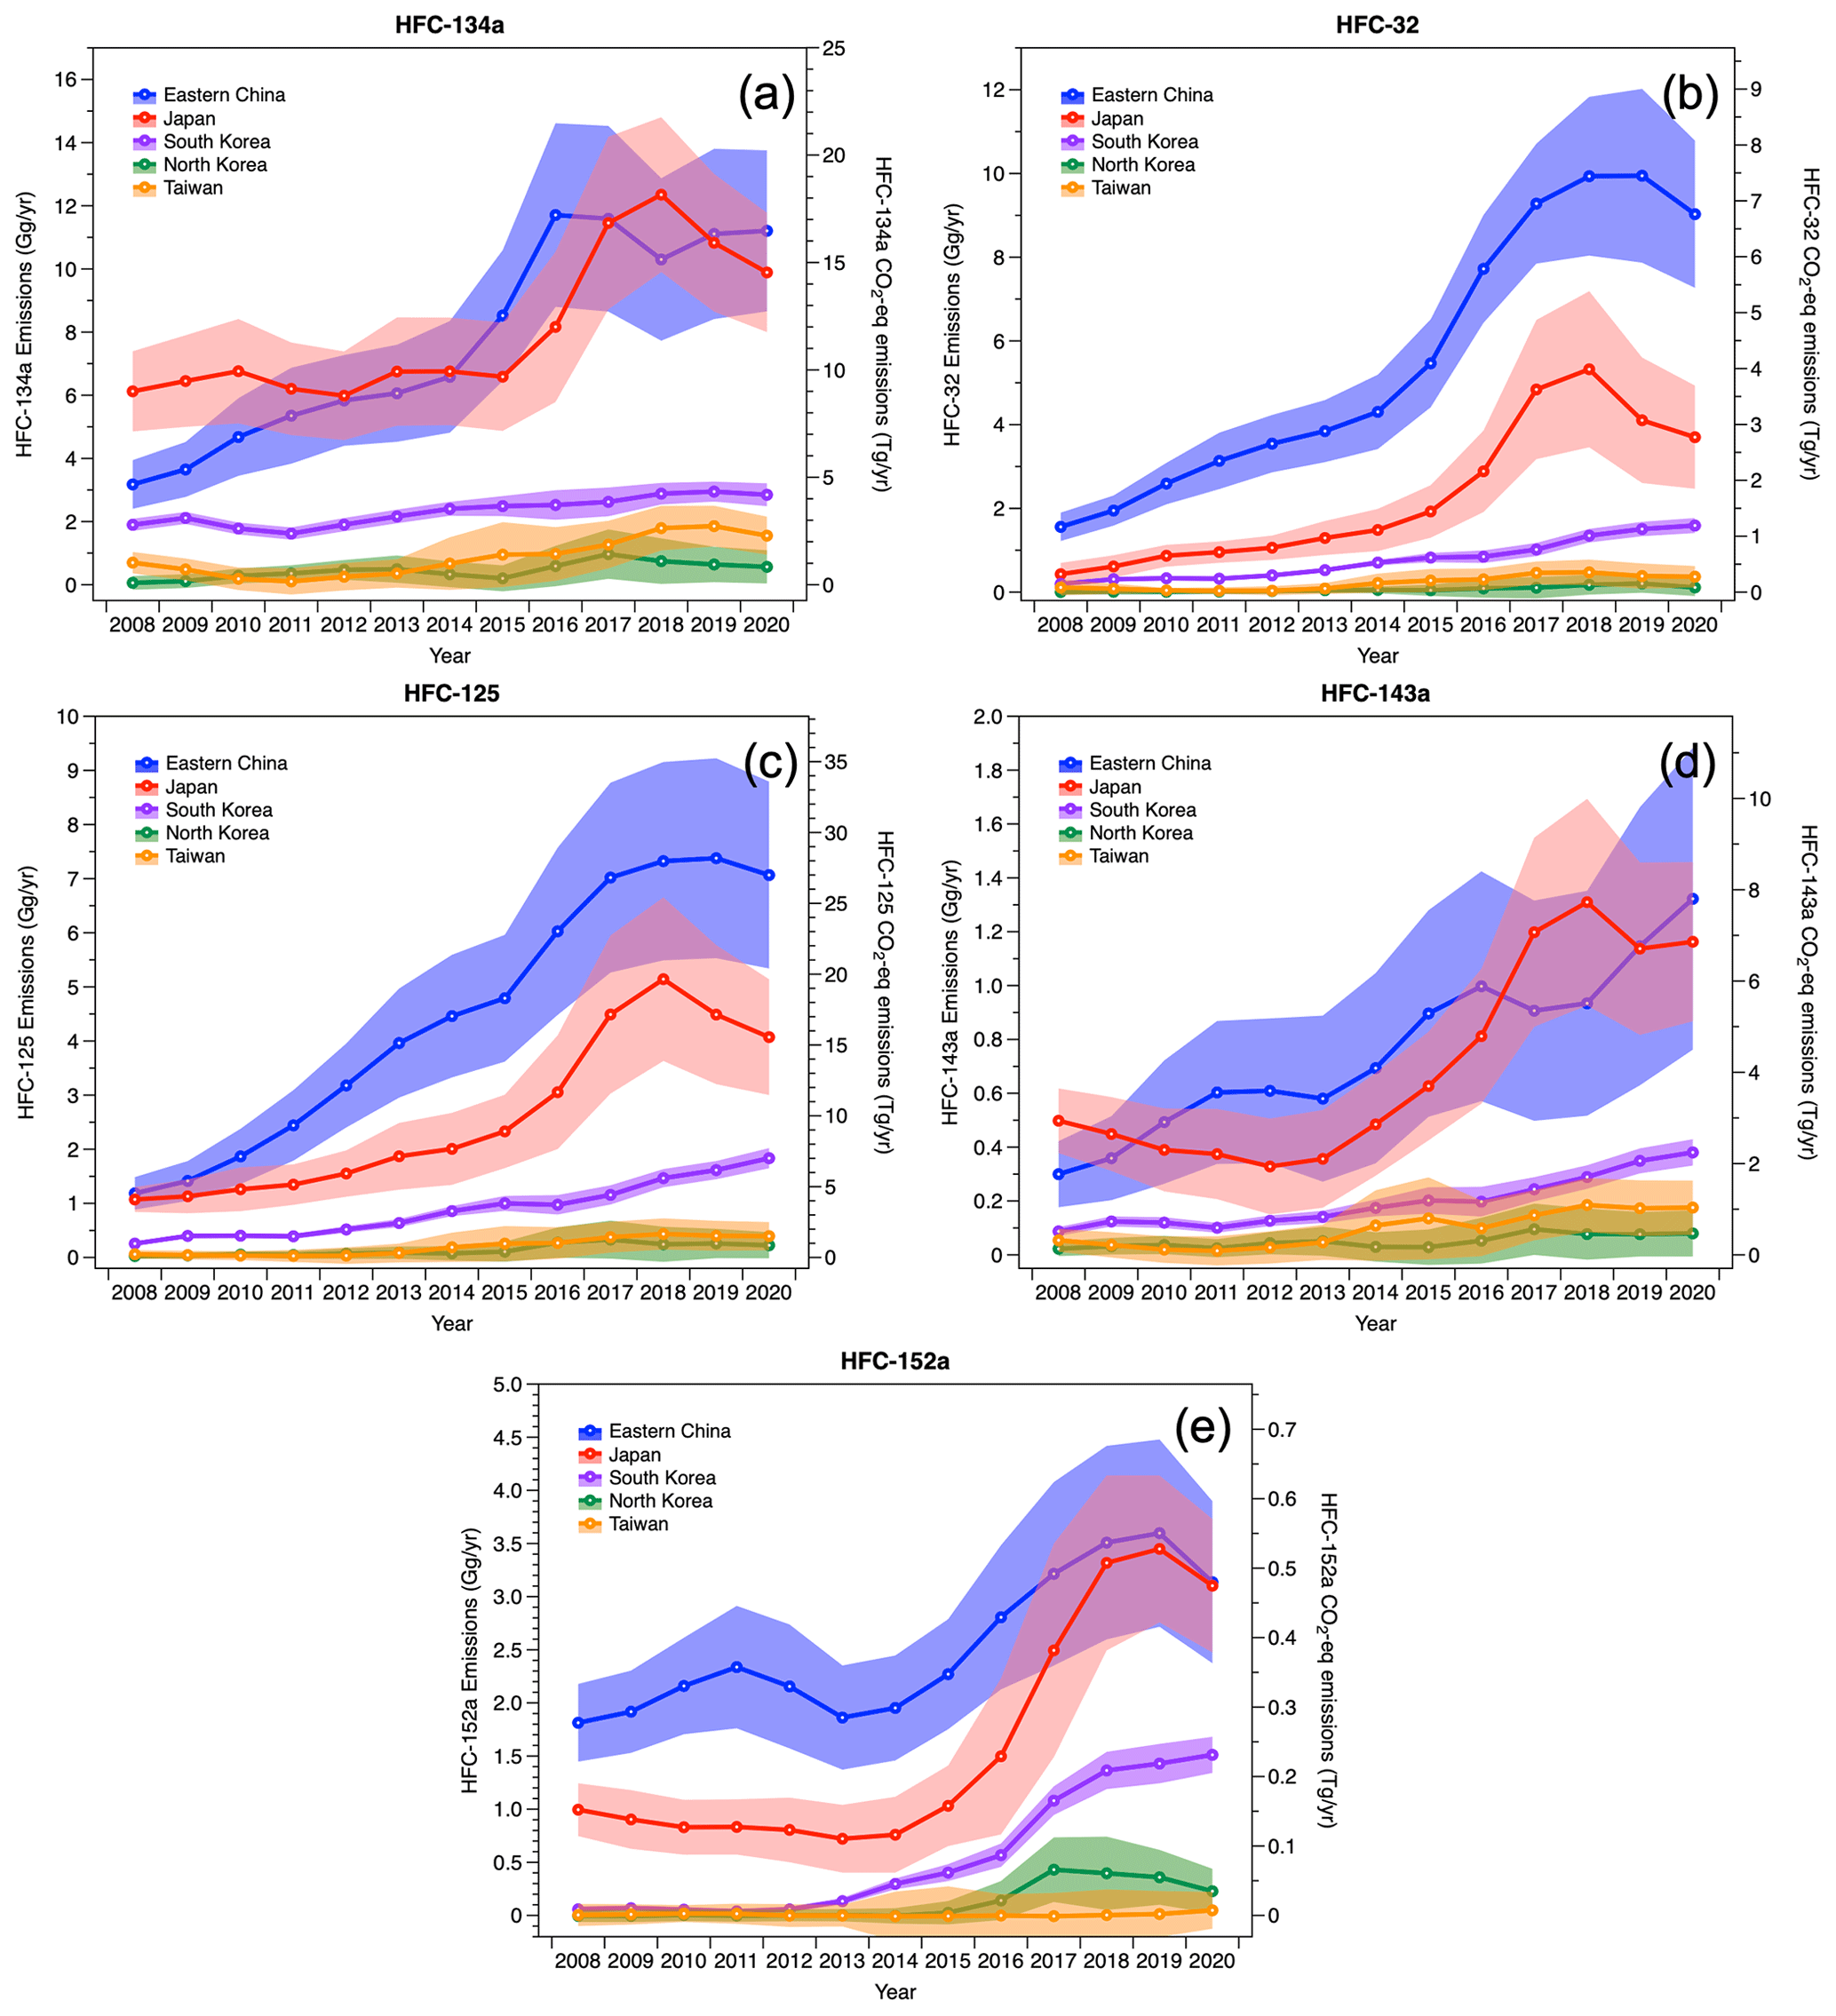
Figure 3Top-down estimates of annual HFC emissions in eastern Asia for (a) HFC-134a, (b) HFC-32, (c) HFC-125, (d) HFC-143a, and (e) HFC-152a. Annual emissions (solid lines) and uncertainty ranges (shading) are defined as the average of inversion posterior and 1σ uncertainty derived from FLEXPART-FLEXINVERT+ and NAME-InTEM. Each HFC emission result derived for individual models is shown in Figs. S2 to S6.
3.2.1 HFC-134a
HFC-134a is the most abundant HFC in the atmosphere. It has been mainly used since the mid-1990s as a refrigerant in mobile-air-conditioner systems (MACs) primarily as a replacement for CFC-12, and it is also used in inhalers, in a blend component for stationary air-conditioning and commercial refrigeration, and as an aerosol propellant (Montzka et al., 2018; Liang et al., 2022).
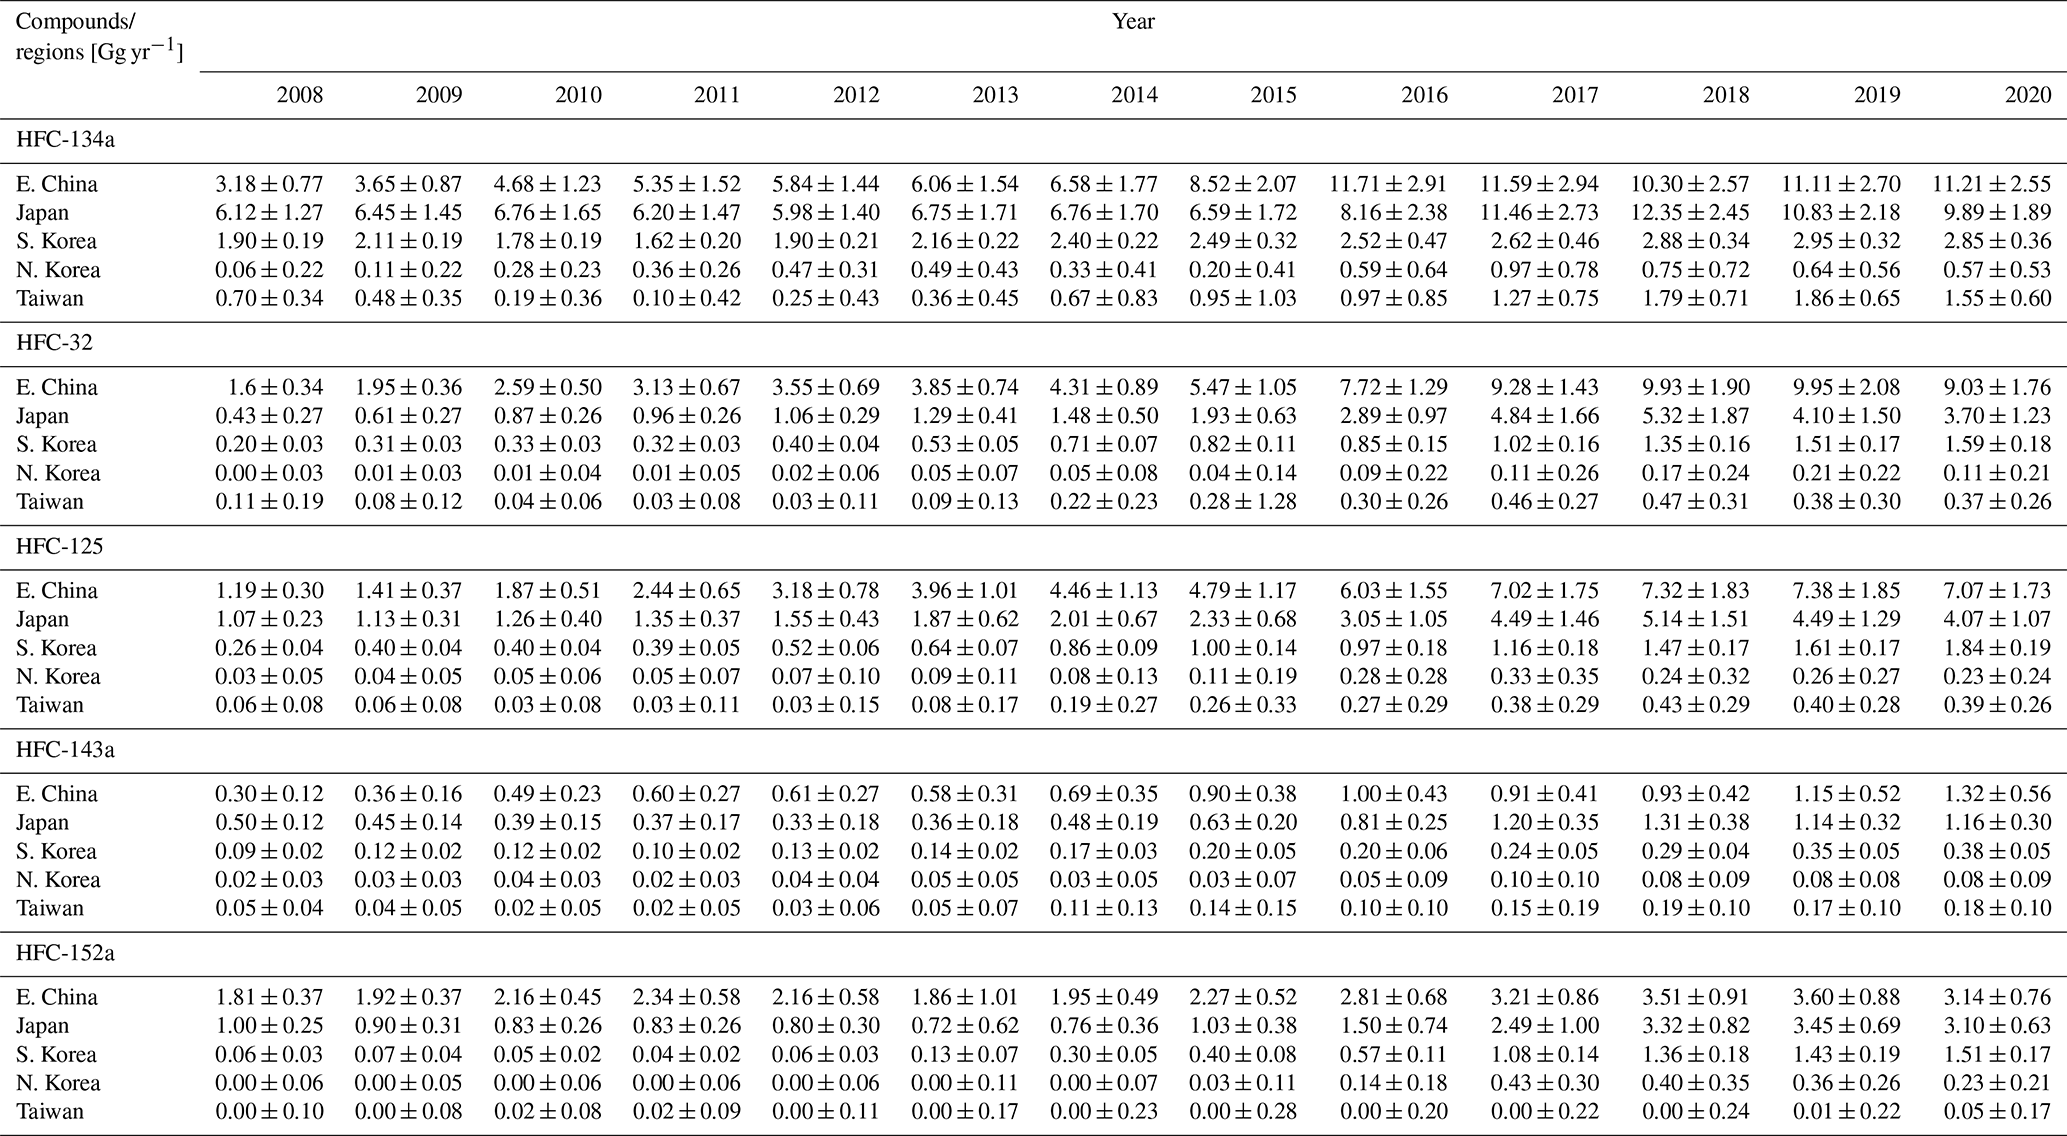
As shown in Fig. 3 and Table 3, HFC-134a emissions in eastern China presented the most dramatic growth in eastern Asia, with a slow increase from 3.2 ± 0.8 Gg yr−1 in 2008 to 6.6 ± 1.8 Gg yr−1 in 2014 (on average 5.0 ± 1.3 Gg yr−1) and then a rapid rise after 2015, reaching a peak of 11.7 ± 2.9 Gg yr−1 in 2016. From 2016, the emissions plateaued, and from 2016 to 2018 they remained relatively constant at an average of 11.2 ± 0.6 Gg yr−1. Interestingly, in Japan, the annual HFC-134a emissions remained relatively constant at 6.5 ± 0.3 Gg yr−1 from 2008 to 2015 but showed a sharp increase after 2016, reaching 12.4 ± 2.5 Gg yr−1 in 2018, and then decreased since 2019. Until 2010, Japan had emitted more HFC-134a than eastern China, but since 2011, emissions from Japan and eastern China have become similar. While the emissions from South Korea, North Korea, and Taiwan are relatively small, they have also been steadily increasing. North Korea and Taiwan account for 5 % to 10 % of the emissions from eastern China and Japan, with Taiwan's emissions particularly increasing to reach 60 % of South Korea's emissions by the late 2010s (Fig. S2).
Table 3Annual averages of HFC emission estimates derived from FLEXPART-KNU and NAME-InTEM.
The rise in HFC-134a emissions in eastern Asia was attributed to the increased adoption of HFC-134a in response to economic and industrial growth in East Asian countries following the phaseout of CFC-12, whose production and consumption was banned by the Montreal Protocol. This is also consistent with a significant decline in CFC-12 emissions since the late 2000s in eastern Asia (Park et al., 2021).
There are significant and growing gaps between the top-down emission estimates and bottom-up estimates in eastern China, Japan, and South Korea. The annual HFC-134a emission estimates for each country are slightly different from the national inventories reported to the UNFCCC (data available at the UNFCCC greenhouse gas inventory website, https://di.unfccc.int, last access: 24 May 2023) and the EDGAR-v7 (Fig. 4). UNFCCC reports are based on national statistical data that follow Intergovernmental Panel on Climate Change (IPCC) methodologies, while EDGAR uses a uniform methodology to provide globally consistent gridded estimates from various comprehensive datasets. Therefore, this may lead to discrepancies due to different assumptions and data sources. China reported the national HFC-134a emissions to the UNFCCC for 3 years – 2010, 2012, and 2014 – and the reported emissions had increased over the years. Comparing the reported emissions for the whole of China, downscaled by population density (35 % for eastern China), to those estimated by the top-down method in this study, we find that they were almost identical within the uncertainty range in 2010, but differences increased to 4.2 and 8.1 Gg yr−1 in 2012 and 2014, respectively (top-down emissions accounted for 58 % and 44 % of the reported inventories, respectively). Japan reported to the UNFCCC that its HFC-134a emissions gradually and slowly decreased from ∼ 2.8 Gg yr−1 in 2008 to ∼ 2.3 Gg yr−1 in 2019. However, the inferred top-down emissions for 2008–2015 were almost twice as large when annual emissions remained constant, and the discrepancies increased further with the sharp rise in the inferred emissions from 2016 onward. In contrast, for South Korea, HFC-134a emissions estimated in the national inventory were on average 3.7 Gg yr−1 higher than the inferred top-down emissions over the entire period (top-down emissions were about 38 % of the bottom-up inventories).
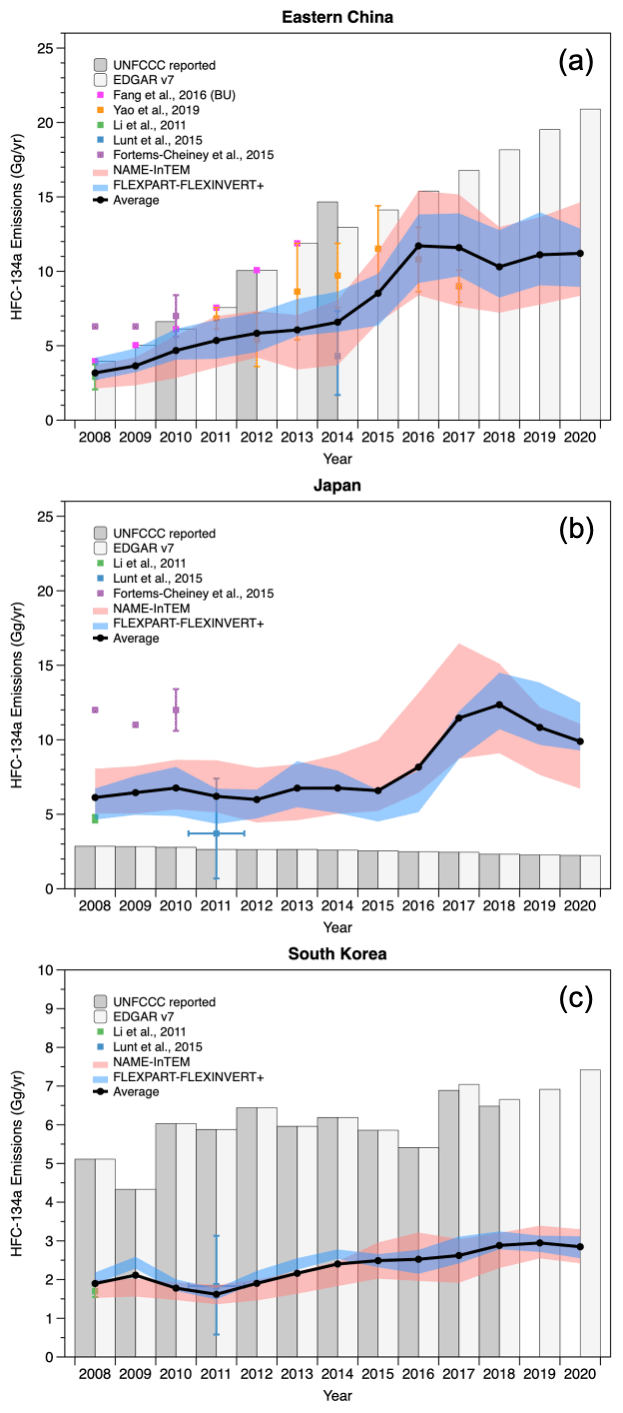
Figure 4The annual HFC-134a emissions for eastern (a) China, (b) Japan, and (c) South Korea derived from FLEXPART-FLEXINVERT+ (in blue shaded) and NAME-InTEM (in red shaded), and average values of both inversion framework results (black solid line), respectively. Each country's HFC-134a emissions were compared with the inventories reported to the UNFCCC (dark gray bars), EDGAR v7 (light gray bars), and other studies. Note that comparison group emissions for China have been downscaled relative to population density for eastern China from reported or derived emissions for the whole of China.
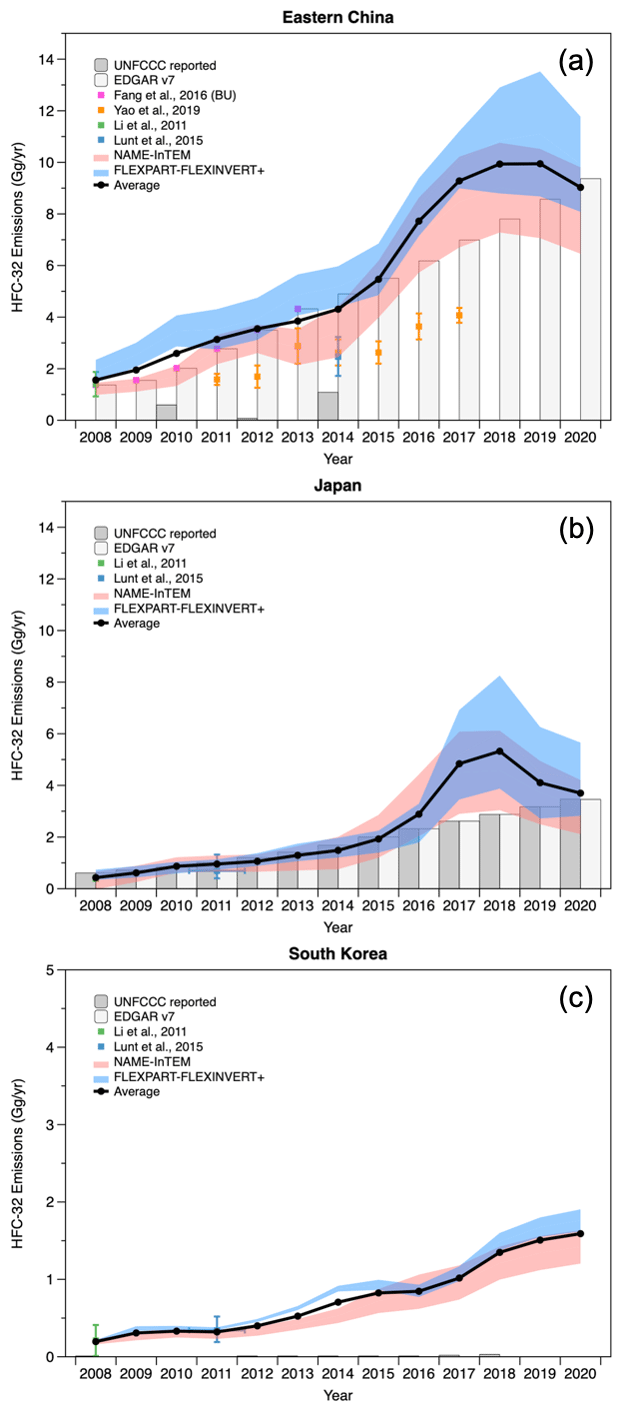
3.2.2 HFC-32
Until recently, HFC-32 was primarily used as a blend with HFC-125 (50 % of HFC-32 and 50 % of HFC-125) in the air-conditioning refrigerant R-410A, which is an alternative to the ozone-depleting HCFC-22 (R-22). HFC-32 (R-32) is also used as a stand-alone refrigerant in commercial and residential air conditioners due to the GWP of one-third that of R-410A. HFC-32 abundance gas been increasing substantially in recent years. HFC-32 emissions in eastern China increased from 1.6 Gg yr−1 in 2008 to a peak of 10 Gg yr−1 in 2019 and slightly decreased to 9 Gg yr−1 in 2020. Eastern China has been emitting the largest amount of HFC-32 in the study region. As shown in Fig. 5, these annual HFC-32 emissions are similar to those reported in EDGAR v7. In contrast, downscaling the reported emissions for China for 2010, 2012, and 2014 to eastern China using population density indicates much lower emissions of <1 Gg yr−1, in stark contrast to the significant emissions derived here. For Japan, the second-highest emitter of HFC-32 in eastern Asia, top-down emissions gradually increased from 0.4 to 1.9 Gg yr−1 between 2008 and 2015, with a peak of 5.3 Gg yr−1 in 2018, followed by a decline since 2019. These top-down emissions match fairly well the reported inventory to the UNFCCC for the period of 2008–2015, but the inventory does not show the rise in emissions during 2016–2019, and in 2020 there is a good match again. South Korea emissions have steadily increased from 0.2 to 1.6 Gg yr−1 from 2008 to 2020, an 8-fold increase. North Korea and Taiwan emissions were less than 0.5 Gg yr−1 for the overall period. From 2008 to 2012, emissions were almost negligible, close to zero, but began to gradually increase starting in 2013. This trend is similar to that of HFC-125 (Figs. S3 and S4).
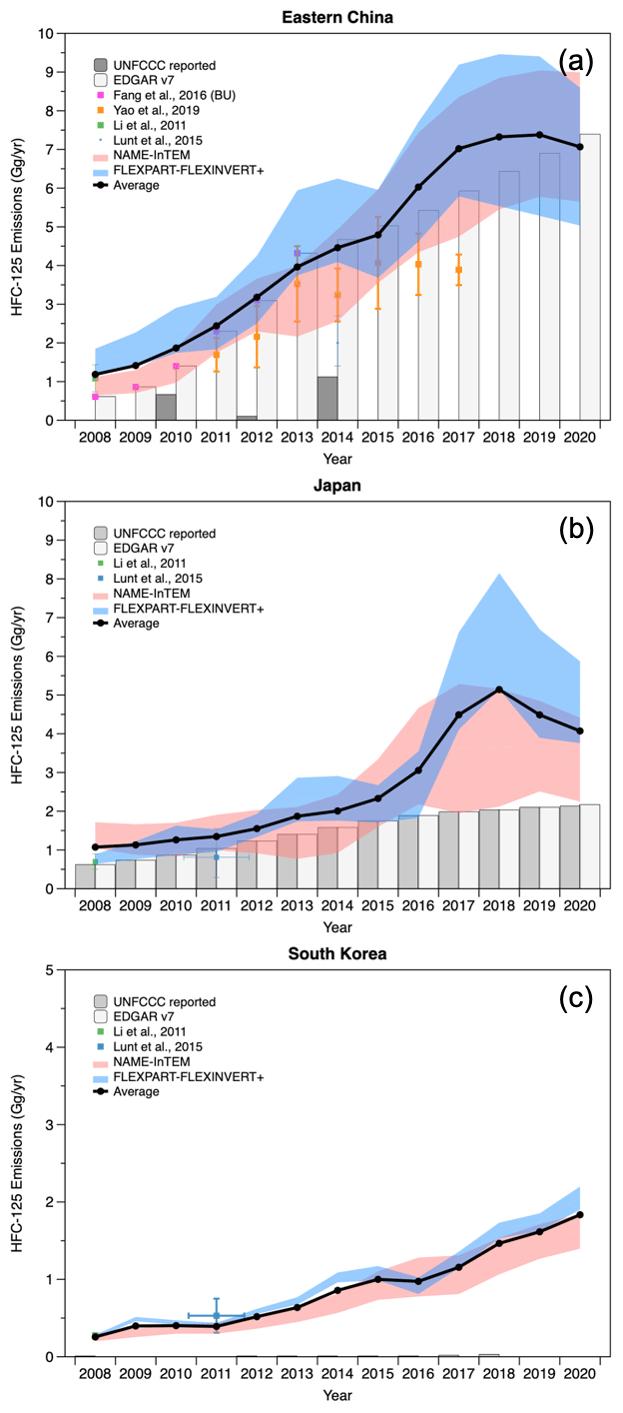
3.2.3 HFC-125
As mentioned, HFC-125 is primarily used in refrigerant blends, foremost R-410A, a mixture with HFC-32. HFC-125 is also contained in other refrigerant blends, such as R-404A, R-407A, R-407C, and R-407F. The changes in annual HFC-125 emissions from year to year for each country were very similar to those of HFC-32 emissions, suggesting that emissions of HFC-32 and HFC-125 are primarily driven by the use of R-410A. HFC-125 emissions in eastern China increased rapidly from 1.2 Gg yr−1 in 2008 to a peak of 7.4 Gg yr−1 in 2019, with a slight decline to 7.1 Gg yr−1 in 2020 (Fig. 6a). These inferred top-down emissions are much larger than the inventory emissions reported to the UNFCCC for 2010, 2012, and 2014 (when downscaled to eastern China), similar to the discrepancies for HFC-32, but top-down emissions are in good agreement with EDGAR-v7. Between 2008 and 2015, Japan's HFC-125 emissions showed a slight increase from 1.1 to 2.3 Gg yr−1, followed by a rapid increase in the emissions reaching 5.1 Gg yr−1 in 2018, and a decline thereafter (Fig. 6b). Comparing the emissions reported to the UNFCCC with the top-down emissions inferred here (Fig. 6), a close agreement within the uncertainty was observed between 2008 and 2015, similar to HFC-32. However, top-down emissions rose significantly above reported emissions during 2016–2018, with the maximum gap of 3.1 Gg yr−1 in 2018 when inferred emissions were ∼ 2.5 times higher than reported emissions. The discrepancy declined somewhat in 2019 and 2020. South Korea showed a steady increase from 2008 to 2020 (0.3 to 1.8 Gg yr−1) (Fig. 6c). Emissions from North Korea were relatively constant from 2008–2015, with an average of 0.06 ± 0.03 Gg yr−1, followed by an increase in 2016–2017 and then a slight decline to ∼ 0.24 Gg yr−1 during 2018–2020. The emissions in Taiwan were almost negligible until 2012 but have been gradually increasing since 2013 (Fig. S4).
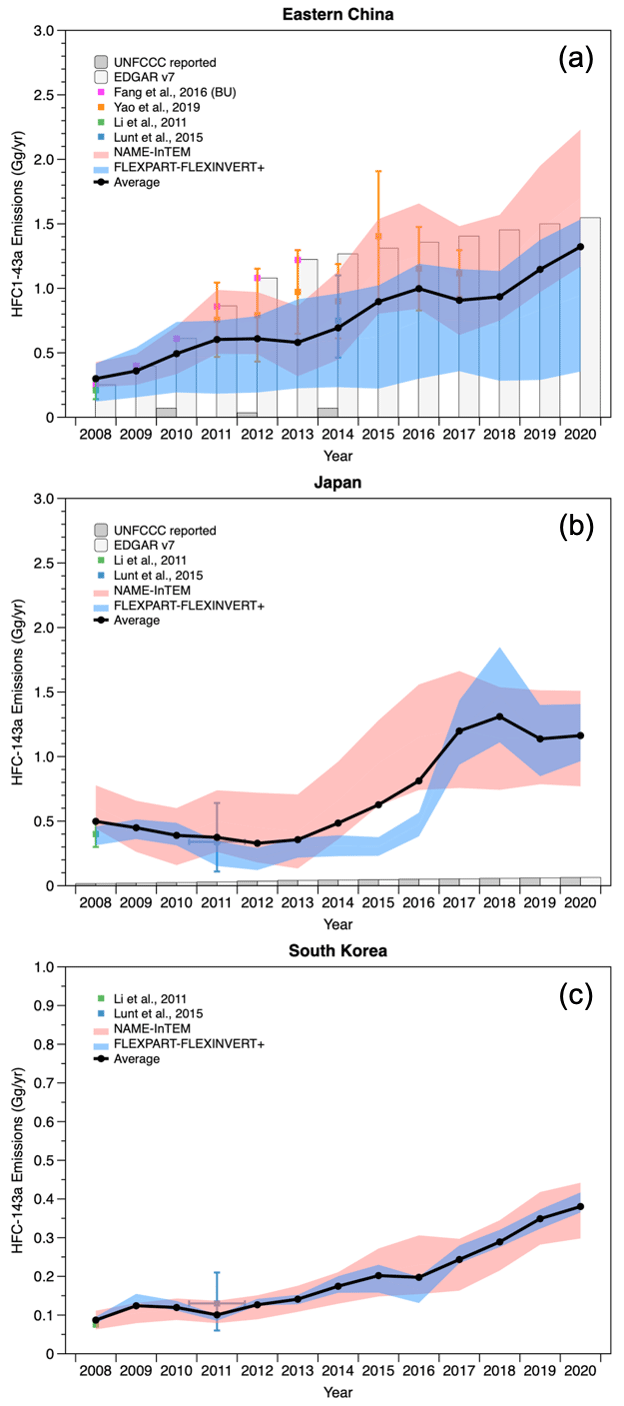
3.2.4 HFC-143a
HFC-143a is used in refrigeration blends such as R-404A (44 % of HFC-125, 52 % of HFC-143a, and 4 % of HFC-134a), an alternative refrigerant to the ozone-depleting R-502 (48.8 % of HCFC-22 and 51.2 % of CFC-115). R-404A is mainly used in low- and medium-temperature refrigeration such as commercial refrigeration and supermarket display cases. Among the five HFCs discussed here, HFC-143a is the least emitted in eastern Asia, but emissions have continuously increased from 2008 to 2020 in most countries: China (0.3 to 1.3 Gg yr−1), South Korea (0.1 to 0.4 Gg yr−1), North Korea (0.02 to 0.08 Gg yr−1), and Taiwan (0.05 to 0.18 Gg yr−1) (Figs. 7 and S5). HFC-143a emissions in Japan declined gradually from 0.5 to 0.33 Gg yr−1 between 2008 and 2012 but rapidly increased, peaking at 1.3 Gg yr−1 by 2018, followed by a stabilization. In contrast, Japan reported very low emissions increasing from 2008 to 2020 (0.02 to 0.06 Gg yr−1) to the UNFCCC, showing a significant discrepancy (Fig. 7). Similarly, Chinese emissions reported to the UNFCCC downscaled to eastern China were much lower than the top-down emissions inferred here.
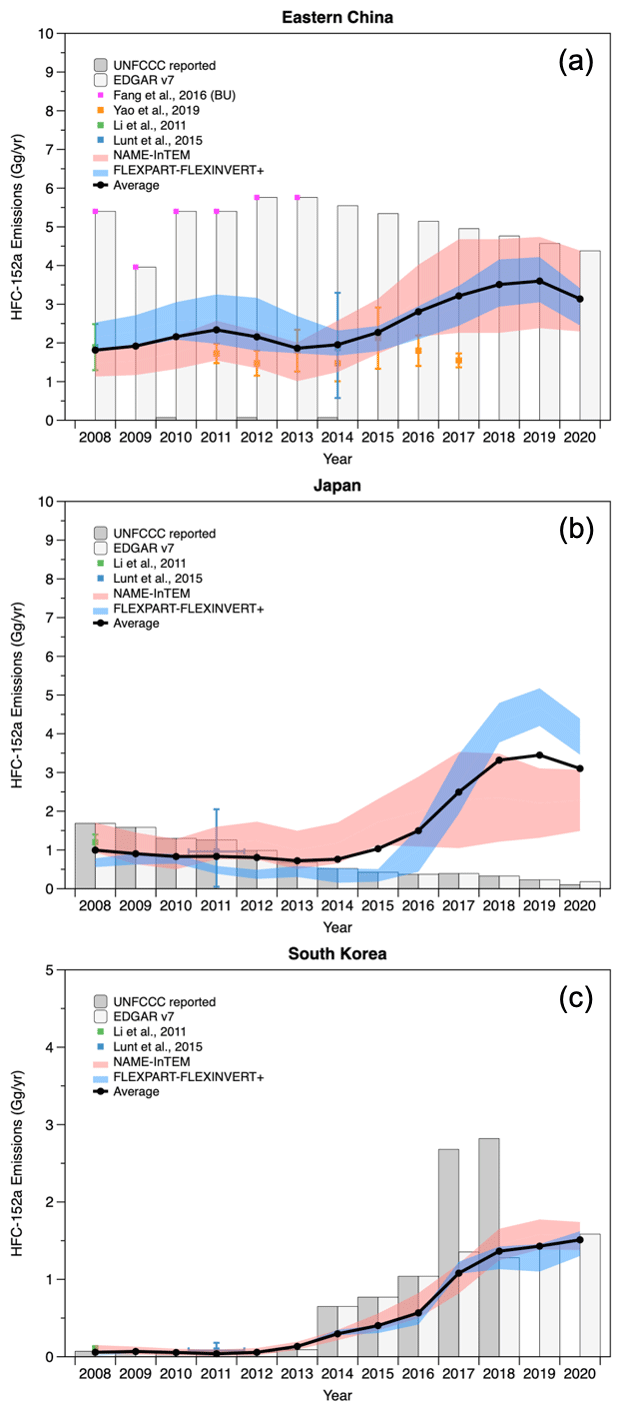
3.2.5 HFC-152a
HFC-152a, which has the lowest GWP (148) among HFCs in this study, is primarily used as an aerosol propellant and insulation foam-blowing agent (Montzka et al., 2018; Liang et al., 2022). In eastern China, HFC-152a emissions were relatively constant from 2008 to 2014, on average 2.0 ± 0.2 Gg yr−1 with slight fluctuations, and then gradually increased from 2015 towards to 3.6 Gg yr−1 in 2019, before declining in 2020 (Fig. 8a). Although eastern China shows the highest HFC-152a emissions in eastern Asia, the rate of increase in its emissions was relatively low compared to that of other HFCs. However, similar to other HFCs, Chinese emissions reported to the UNFCCC downscaled to eastern China were much lower, almost close to zero, again revealing large discrepancies (Fig. 8). On the other hand, EDGAR estimated much higher emissions during that period (almost twice the top-down emissions). HFC-152a emissions in Japan were almost constant from 2008–2014 at 0.8 ± 0.1 Gg yr−1 and then increased very steeply after 2015, reaching 3.4 Gg yr−1 in 2019 before declining in 2020 (Fig. 8b). After the rapid increase in Japan emissions since 2015, emissions of Japan and eastern China became nearly identical during 2017–2020. Japanese bottom-up emissions reported to the UNFCCC were declining in contrast to our top-down inferred emissions. The gap (top-down minus bottom-up) has widened from −0.6 Gg yr−1 in 2008 to 3.2 Gg yr−1 in 2019. HFC-152a emissions in South Korea from 2008 to 2012 were negligible, with an average of 0.06 ± 0.01 Gg yr−1 (Fig. 8c). However, a significant increase in emissions was found from 2013 to 2018, reaching 1.4 Gg yr−1 in 2018, followed by a slower increase. As a result, South Korea had the highest emission growth rate of HFC-152a among all countries. During the period 2008–2013, when South Korea's inferred emissions were near zero, there was a good match with emissions reported to the UNFCCC, but after 2014, the inferred emissions are only about 50 % of the emissions reported to the UNFCCC; that is, UNFCCC reported emissions seem to be too high. North Korea had almost no HFC-152a emissions until 2015, followed by a slight increase and a plateau since 2017, averaging 0.4 ± 0.1 Gg yr−1. Taiwan emitted negligible amounts of HFC-152a (Fig. S6).
3.3 Spatial distributions of HFC emissions in eastern Asia
As described in Sect. 3.1, estimating national-scale emissions via atmospheric inversion plays an important role in discovering and recognizing gaps in the bottom-up inventory, which is determined by sectoral reports, statistics, emission factors, and other activity data (Lunt et al., 2015). Ideally this will help to improve bottom-up inventories and inventory methods. Even more insights into sources can be gained by examining the spatial distribution of gridded emissions from Bayesian inversion frameworks (Kunik et al., 2019).
The spatial distribution of HFC emissions showed significant emission increases likely stemming from increased use (Fig. 9). For instance, HFC-134a, primarily used as a refrigerant for MAC systems, exhibits higher emissions in densely populated, large cities (e.g., Beijing, Shanghai, and Nanjing). On the other hand, HFC-32 and HFC-125, which are used as components of refrigerant blends for air-conditioning systems, show higher emissions in regions and provinces such as Shangdong and Anhui with high levels of economic, commercial, and industrial activities. Likewise, HFC-143a, utilized for low- and medium-temperature ranges such as refrigerated transport and supermarket freezers/refrigerators, displays higher emissions in areas with considerable economic, commercial, and logistics transportation activities like Shanghai. Lastly, HFC-152a, predominantly used as a foam-blowing agent and aerosol propellant, exhibits higher emissions in regions near the province of Shangdong with significant industrial activities. In addition, although not included in the HFC emissions for eastern China presented in this study, distinct post-2015 increases in emissions of all HFCs, except HFC-143a, were also revealed in the Changchun and Harbin regions of northeast China. Furthermore, China is the largest producer and exporter of HFCs in the world (Fang et al., 2016), and given the presence of many production plants in eastern China with the capacity to produce various HFC species simultaneously, it is necessary to consider the possibility of an increase in fugitive emissions resulting from the growing HFC production in eastern China (Li et al., 2014; Velders et al., 2022). South Korea (Greater Seoul and Busan) and Japan (Kansai, Kanto, and Chubu regions) showed a noticeable increase in all HFC emissions as well.
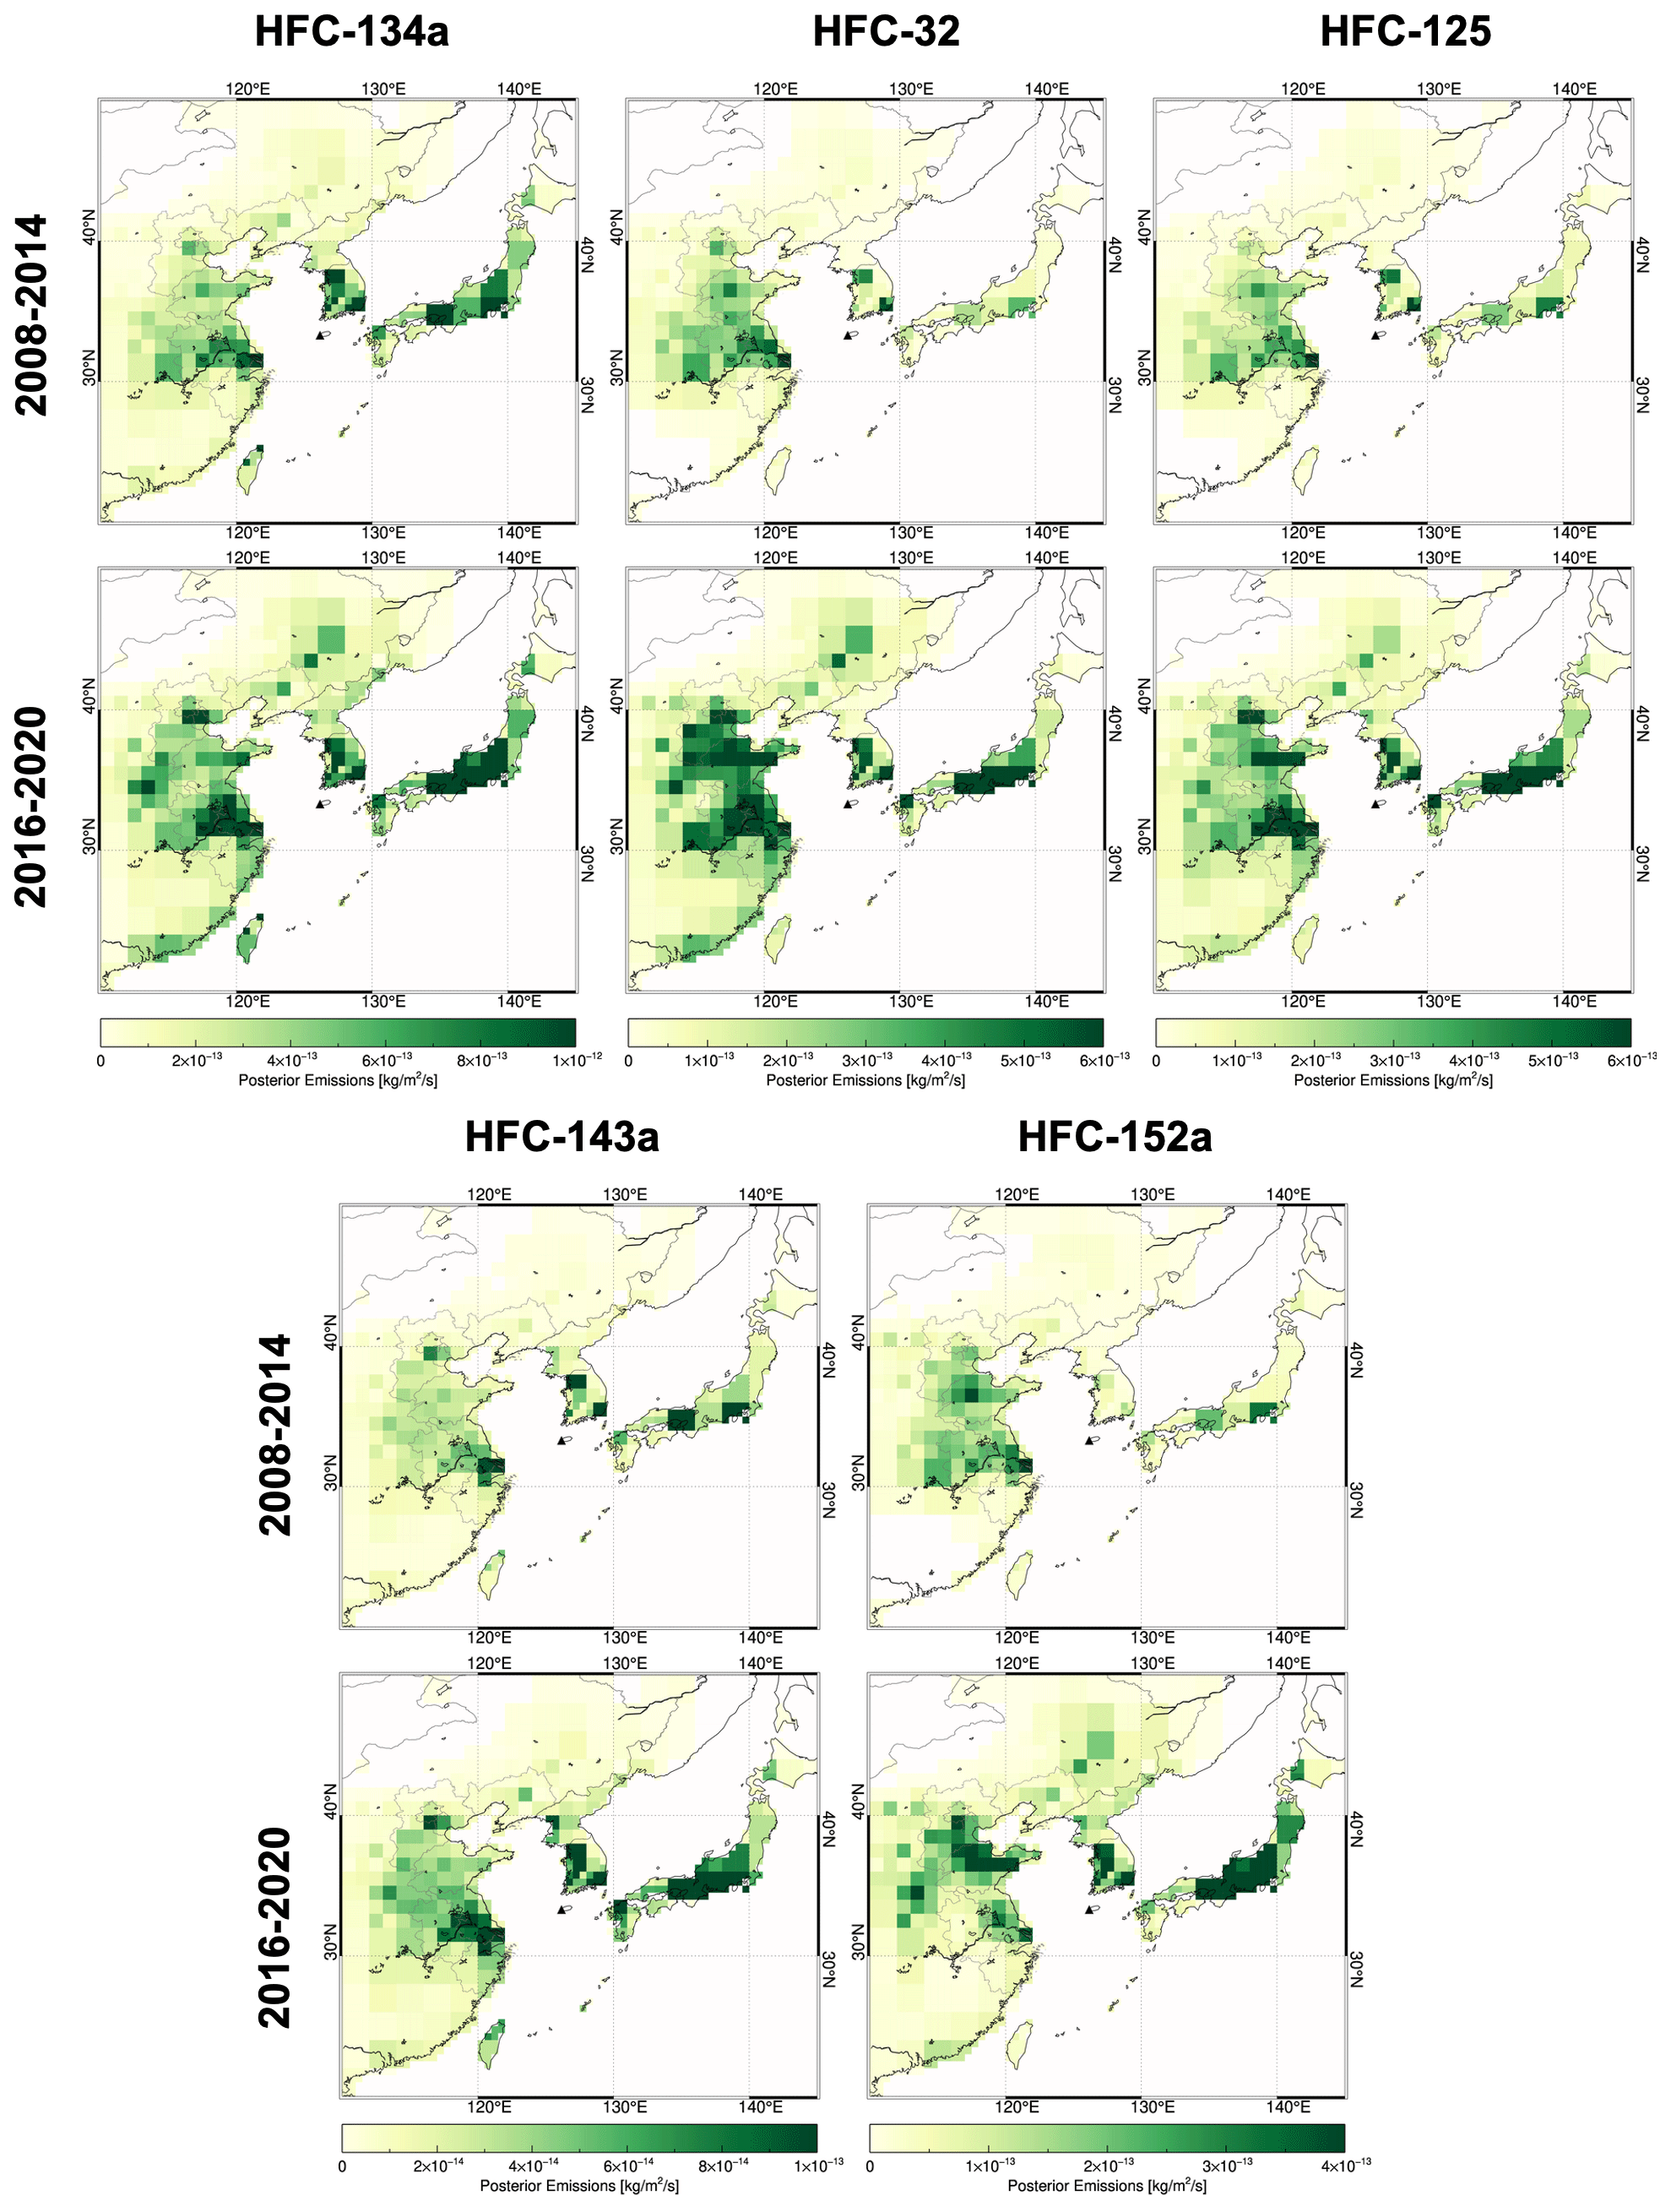
Figure 9HFC emission distributions for 2008–2014 and 2016–2020 derived by FLEXPART-FLEXINVERT+. The results of NAME-InTEM are shown in Fig. S7.
3.4 Aggregated HFC emissions in eastern Asia and proportional contributions by each country
Total national emissions of the five most abundant HFCs in eastern Asia in terms of carbon dioxide equivalent emissions (using GWP100) increased from 20.7 ± 5.2 Gg yr−1 (35.3 ± 8.3 CO2 eq. Tg yr−1) in 2008 to a peak of 71.3 ± 17.1 Gg yr−1 (127.8 ± 28.6 CO2 eq. Tg yr−1) in 2018, before declining to 65.6 ± 14.4 Gg yr−1 (121.0 ± 24.9 CO2 eq. Tg yr−1) in 2020 (Fig. 10). The increase in total HFC emissions in eastern Asia during 2008–2018 was driven by Japan and eastern China in particular, with eastern China emitting about 1.1 Gg yr−1 (4.1 CO2 eq. Tg yr−1) of total HFCs less than Japan in 2008. However, since 2010, the emissions of eastern China have exceeded those of Japan. From 2019 onwards, total HFC emissions in eastern Asia started to decline as a result of the stagnation in emission growth in eastern China since 2016 and the gradual decline of total HFC emissions in Japan, despite the continued growth in emissions in South Korea.
Figure 10b shows that in terms of CO2-equivalent emissions (GWP100), HFC-125 and HFC-134a contribute the most to the total emissions in eastern Asia. Although HFC-143a is emitted in the smallest quantity, due to its highest GWP of 5900 among the five HFCs, it showed a larger warming impact compared to HFC-32, which is emitted in higher quantities but has a lower GWP of 749. On the other hand, despite its increasing emissions, the impact of HFC-152a on global warming is negligible due to the relatively low GWP of 148.
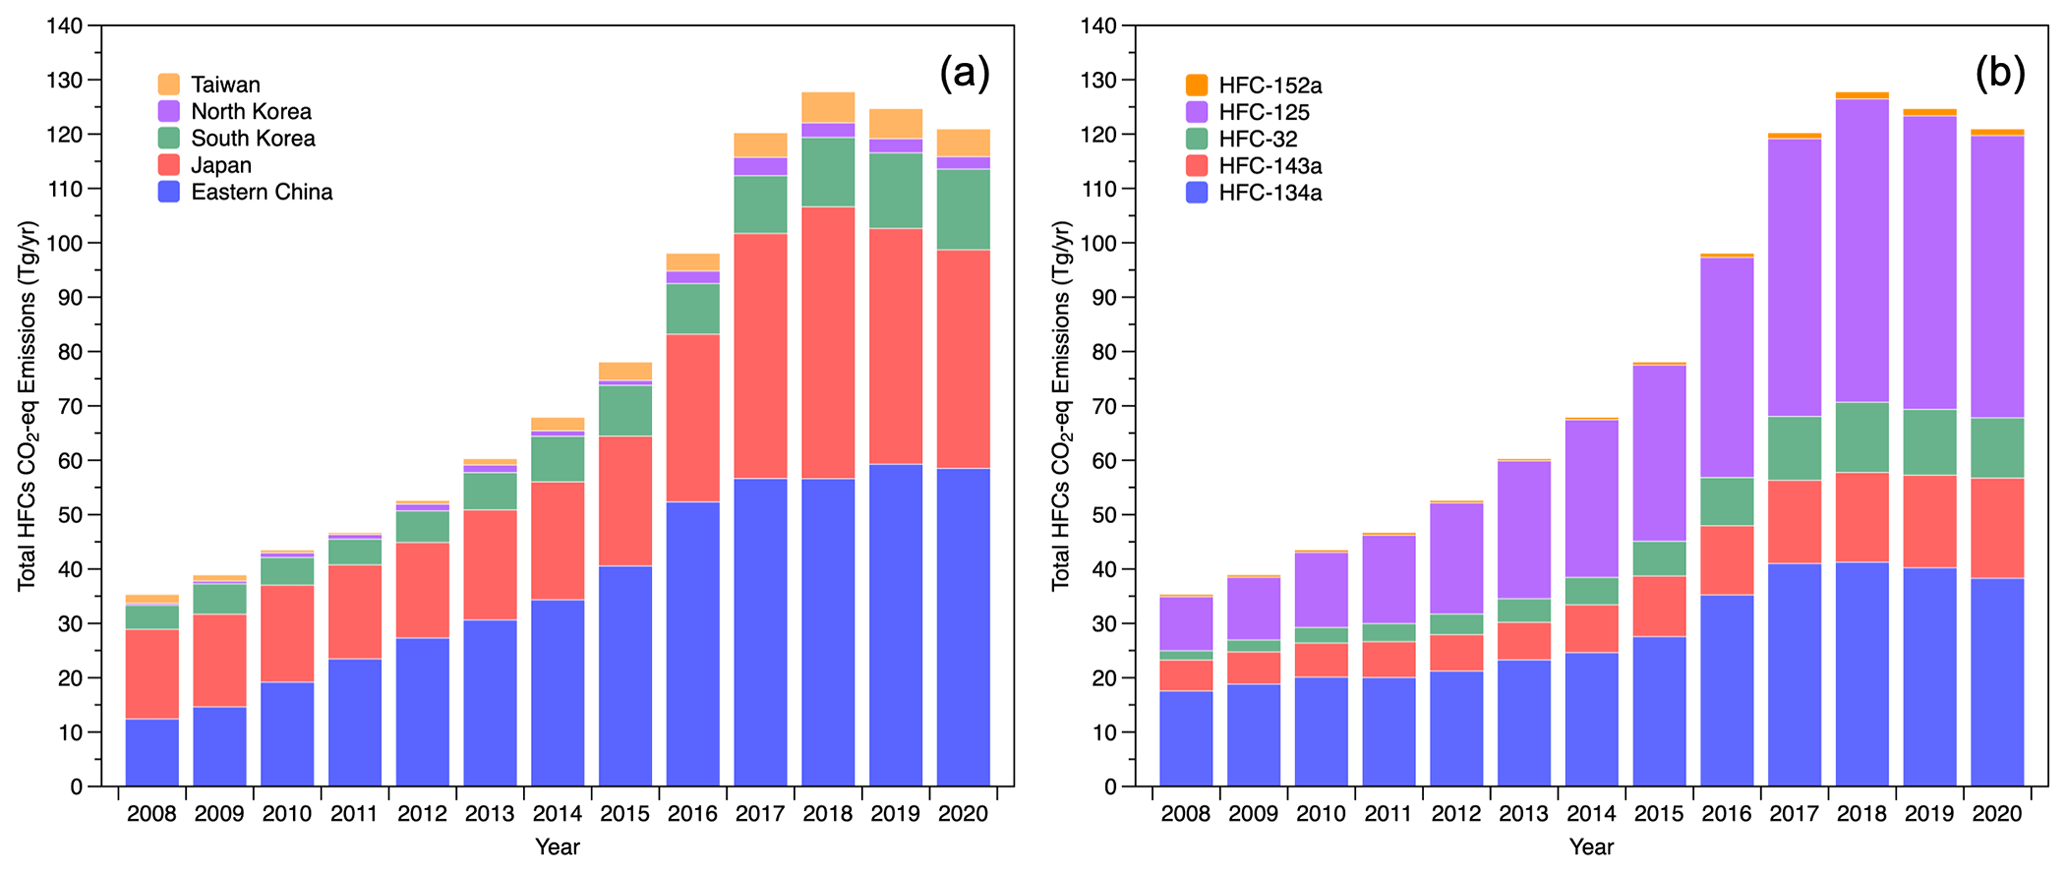
Figure 10Total HFC CO2 eq. emissions (in Tg yr−1) in eastern Asia for (a) each region and (b) each HFC.
In addition to identifying the total HFC emissions of each country, the variation in the proportion of each HFC in total HFC emissions by country can be important information for establishing a regulation policy to mitigate GHGs. For example, if a country has a significant proportion of a specific HFC, it can proactively identify the underlying causes, implement measures to restrict its usage, enhance recycling efficiency, or explore alternative options.
In particular, as an Annex I country, Japan has a more proactive plan to reduce HFC emissions than other countries in eastern Asia. In April 2015, the Japanese government implemented a revised F-gas law, introducing new policies to restrict the utilization of fluorinated refrigerants throughout the entire life cycle, including manufacturing, usage, and disposal of fluorocarbons and products containing them. This expansion in scope shifted the focus from solely recovering and destroying F gases to encompassing various stages, such as manufacturing, maintenance, leak checking, and the promotion of low-GWP or non-fluorocarbon refrigerants in designated products. Target GWPs and target years have been determined for each product category, and the transition to low-GWPs is underway, starting with residential air conditioners in 2018 and continuing through the mid-2020s for all categories. Therefore, we calculated the change in the proportion of each HFC's emissions in each region's total HFC CO2-equivalent emissions for 2008, 2014, and 2020 (Fig. 11). The HFC emission results in mass perspective are presented in Fig. S8.
CO2-equivalent HFC emissions show a different proportion than that of mass (see Supplement). In 2008, more than half of the total HFC emissions in eastern Asia were accounted for by HFC-134a, which had the largest portion in each country except North Korea. However, since then the emissions of HFC-125, which has the highest GWP among the five HFCs, have increased rapidly, and in 2020, HFC-125 became the most dominant HFC in terms of its contribution to global warming. These changes have been more pronounced in South Korea and Japan, where the proportion of HFC-125 has increased by approximately 2-fold in South Korea from 22 % in 2008 to 47 % in 2020, while HFC-134a has decreased by almost half from 63 % to 28 %. Similarly, in Japan, HFC-125 increased from 25 % to 39 %, while HFC-134a decreased from 54 % to 36 %. In contrast, in eastern China, the changes in the percentage of each HFC over the years have been relatively small, though the changes to HFC-134a and HFC-125 are still substantial at about 10 %. Since Japan's F-gas law was revised and the transition to low GWP began in 2018, it is crucial to monitor the changes in the proportion of low-GWP HFCs as well as the total amount of HFC emissions. The changes in the proportion of HFCs can be reflected by each country's industrial structure and policies. Based on this, it may be effective for each country to develop and transition to environmentally friendly alternatives, specifically targeting the reduction of HFC-125 and HFC-134a, to respond to global warming. The changes in the proportion of HFCs can be reflected by each country's industrial structure and policies, and based on this, it may be effective for each country to pursue policies to develop and transition to environmentally friendly alternatives, focusing on HFC-125 and HFC-134a, to respond to global warming.
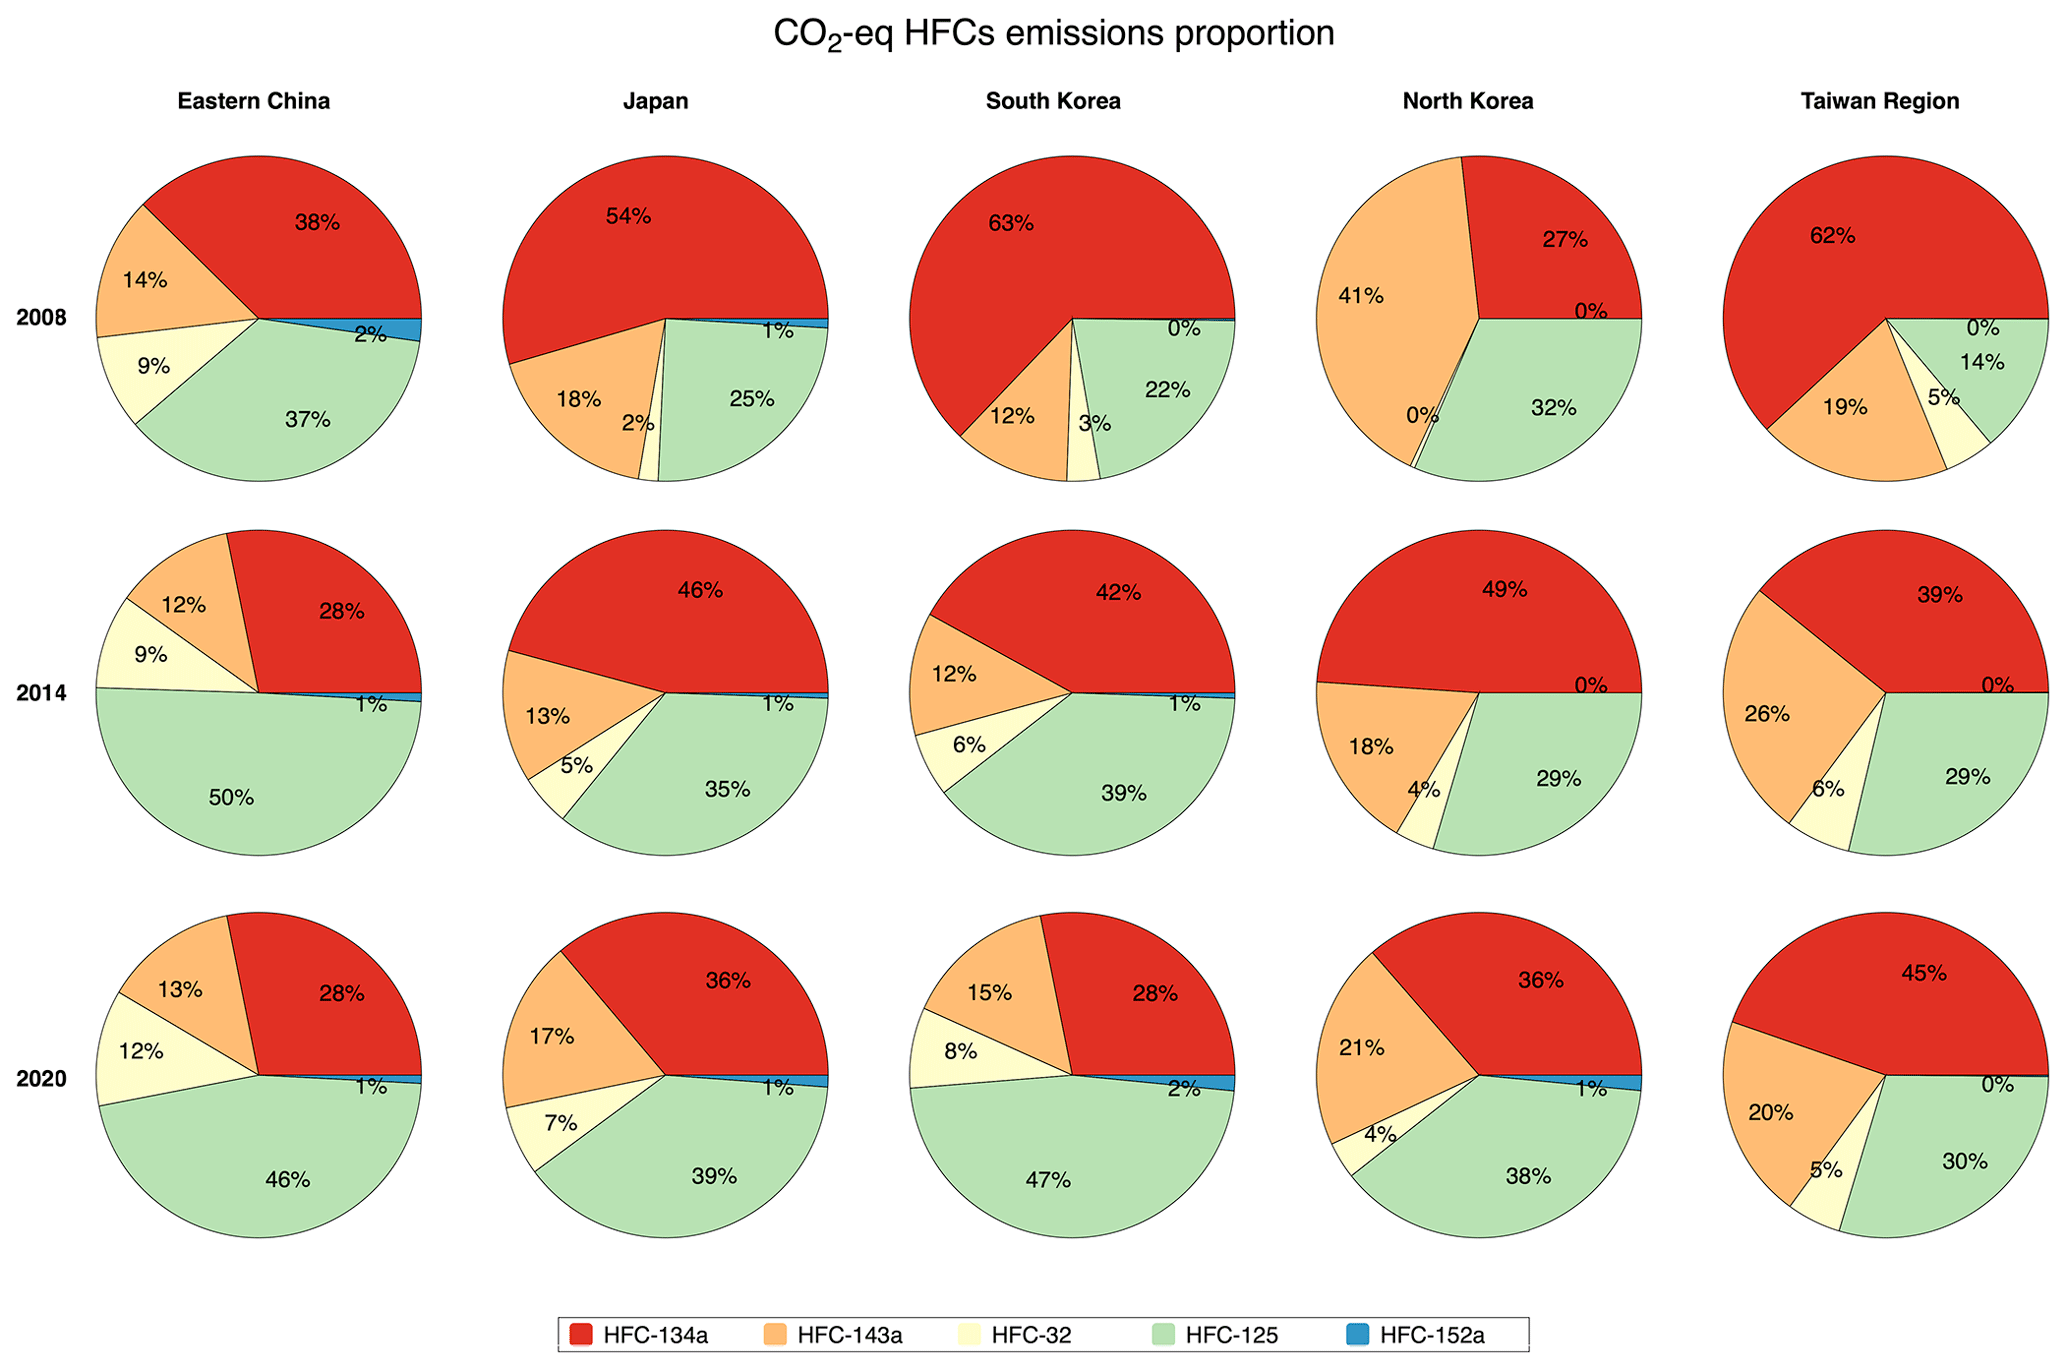
Figure 11The proportion of each HFC CO2-equivalent emission in each country for 2008, 2014, and 2020.
3.5 Emission contribution of eastern Asia in a global perspective
As shown in Fig. 12, global total HFC emissions (Liang et al., 2022) that were derived based on the observations from the AGAGE network using the AGAGE 12-box model (Rigby et al., 2013) have steadily increased from 249.0 ± 21.6 Gg yr−1 (436.8 ± 30.8 CO2 eq. Tg yr−1) in 2008 to 495.2 ± 50.9 Gg yr−1 (961.2 ± 89.4 CO2 eq. Tg yr−1) in 2020. On the other hand, aggregated HFC emissions reported to the UNFCCC by Annex I countries have increased more slowly, with very small fluctuation from 128.5 Gg yr−1 (256.0 CO2 eq. Tg yr−1) in 2008 to 159.4 Gg yr−1 (342.1 CO2 eq. Tg yr−1) in 2020. (Average total HFC emissions from 2008–2020 are ∼ 149.6 ± 10.0 Gg yr−1 (286.7 ± 26.4 CO2 eq. Tg yr−1).) As a result, the unreported emissions, which correspond to gaps between the global top-down and reported bottom-up (UNFCCC) emissions from Annex I countries, increased from 120.5 Gg yr−1 (180.8 ± 30.8 CO2 eq. Tg yr−1) in 2008 to 335.9 Gg yr−1 (561.7 ± 82.1 CO2 eq. Tg yr−1) in 2020, indicating that the increasing trend in unreported emissions, as noted in previous studies (Rigby et al., 2014 and Velders et al., 2022), continues through to 2020.
The contribution of eastern Asia's total HFC CO2 eq. emissions to global emissions was relatively constant for 2008–2014, with a mean of 8.9 ± 0.7 %, and then increased rapidly to a peak of 14.4 % in 2018 and then slightly declined to 12.6 % in 2020 (Fig. 12). This indicates that the growth rate of HFC emissions in eastern Asia has been faster than that globally since 2015. Of these, HFC emissions from non-Annex I countries in eastern Asia (i.e., eastern China, South Korea, North Korea, Taiwan) have significantly contributed to global unreported emissions. The proportion has steadily increased from 10.5 % in 2008, peaked at 14.7 % in 2016, and then slightly decreased to 13.1 % in 2020, and it accounts for 13.3 % of the unreported accumulated HFC emissions during the period of 2008–2020. It is clear that substantial emissions from other regions, not reporting to the UNFCCC and/or not being covered by atmospheric measurements, must exist.
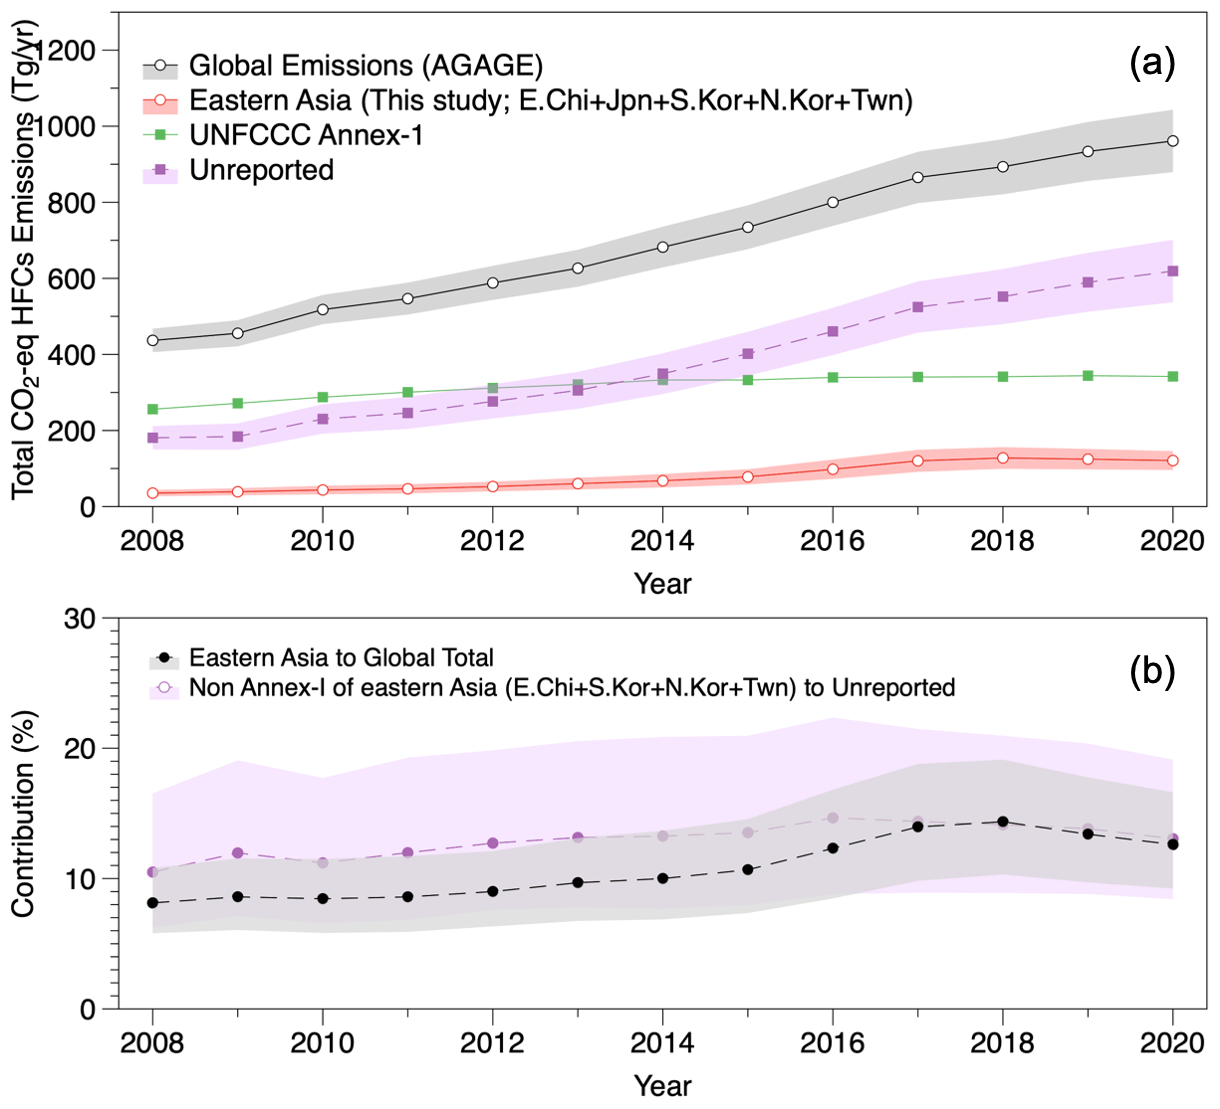
Figure 12(a) Annual global total emissions of HFCs derived from atmospheric observations of the AGAGE program from 2008 to 2020 (black), inferred regional emissions in eastern Asia (red), (b) proportional contributions of HFC emissions in eastern Asia to the global total, and contributions from non-Annex I countries in eastern Asia to unreported emissions (results for individual HFCs are shown in Figs. S9 to S14). The abbreviations E.Chi, Jpn, S.Kor, N.Kor, and Twn refer to eastern China, Japan, South Korea, North Korea, and Taiwan, respectively.
HFCs are potent anthropogenic greenhouse gases that contribute to global warming and continue to be emitted due to industrial growth. However, a phasedown of consumption and production started under the Kigali Amendment. We analyzed high-precision atmospheric mole fractions of the five most abundant HFCs (HFC-134a, HFC-32, HFC-125, HFC-143a, and HFC-152a) measured at the Gosan station, South Korea, from 2008 to 2020 to understand the temporal trends of HFC emissions in eastern Asia. The background mole fractions of most HFCs continue to increase (with a slight increase for HFC-152a), and this suggests that there are ongoing emissions from surrounding sources within this region (notably, the enhancement magnitudes of most HFCs show rapid growth). From the observations, we inferred annual HFC emission estimates for eastern China, western Japan, South Korea, North Korea, and Taiwan by using the two independent Bayesian inversion frameworks, FLEXPART-FLEXINVERT+ and UK Met Office's NAME-InTEM, and compared to bottom-up inventories reported to the UNFCCC and EDGAR-v7 (for the comparable countries and substances). All HFC emissions have shown a notable rapid increase in eastern Asia.
Our most notable findings are the following.
- i.
Rapid increase in HFC emissions in eastern Asia.
HFC emissions in eastern Asia were 2–3 times (HFC-134a, HFC143a, and HFC-152a) and 5–6 times (HFC-32 and HFC-125) higher in 2020 than in 2008, with emission growth driven predominantly in eastern China, Japan, and South Korea. Emissions of HFCs have an accelerating upward trend after 2015 and have subsequently decreased since for 2019–2020. Based on the average spatial distribution of HFC emissions between 2008 and 2014 compared to 2016 and 2020, the increased emissions are associated with HFC production facilities as well as the usage of each HFC compound over megacities and industrially and commercially active regions. The annual quantification of HFC emissions indicates that HFC-134a and HFC-143a emissions from eastern China and Japan are similar. However, for HFC-32 and HFC-125, eastern China's emissions are twice those of Japan. For HFC-152a, Japan's emissions amounted to half of eastern China's emissions up to 2015, but following a rapid increase in emissions from Japan after 2016, both countries have similar levels of emissions from 2018 onwards. In the case of South Korea, all HFC emissions have shown a steady annual increase. Although quantitative emissions of South Korea are small compared to eastern China and Japan, per capita emissions in South Korea are approximately 0.3–0.5 times that of Japan and 0.7–2.3 times that of China, which is not negligible. Before the acceleration started in 2015, total HFC emissions from eastern Asia accounted for ∼ 9 % of global emissions, while post-2015 this proportion increased to ∼ 13 %. Additionally, these total cumulative HFC emissions of non-Annex I countries in eastern Asia from 2008 to 2020 accounted for approximately 13 % of the unreported emissions, highlighting the significance of eastern Asia as a region from a global perspective. Throughout the entire period, HFC-134a has been the most emitted compound in eastern Asia among the five most abundant HFCs. However, considering its contribution to CO2 eq. emissions from a global-warming perspective, the emissions of HFC-125, which has a higher GWP, showed a rapid increase and surpassed the global-warming impact of HFC-134a emissions.
- ii.
Unexpected increase in HFC emissions in the late 2010s and a recent decline in Japan.
Japan, an Annex I country, has taken a more advanced approach to reducing HFC emissions than other countries in eastern Asia by revising Japan's F-gas law. However, contrary to the expectation that recent emissions of HFCs in Japan would be maintained or decreased, the current trends in HFC emissions in Japan, as derived from this study, remained relatively constant (or increased very slowly) before 2015 and sharply increased after 2015 until the peak in 2018. The reason for this unexpected increase in emissions of HFCs is not clear but may be related to the recent increase in sales of refrigerants in the domestic market of Japan, as compiled by the Japan Refrigeration and Air conditioning Industry Association (JRAIA). As shown in Fig. S14, from 2015 to 2019, compared to 2008, there was a notable increase in domestic demand for commercial air conditioners (31 %), refrigerators (30 %), spot air conditioners (130 %), and residential air conditioners (27 %), as well as an increase in demand for transportation refrigeration and freezer units (36 %) and bus air conditioners (7 %). The high consumption rates for the mid-to-late 2010s in the various refrigerant-usage sectors may imply that large quantities of outdated equipment had been disposed of and replaced, likely resulting in an unexpected increase in HFC emissions in Japan. Nevertheless, the downward trend in Japan's HFC emissions since 2019 may also reflect the effectiveness of Japan's F-gas policy, which restricts the use of fluorinated refrigerants and products made with them at each stage of manufacture and use.
- iii.
Discrepancies between the observation-derived top-down emissions and the reported bottom-up inventories.
As an Annex I country, Japan has an obligation to report its annual HFC emissions to the UNFCCC. The reported inventories of HFC-134a and HFC-143a by Japan to the UNFCCC were slightly lower than the observation-derived top-down estimates. In contrast, HFC-32, HFC-125, and HFC-152a presented relatively similar emissions within the uncertainty range with the reported inventories up to 2015. However, after 2015, there are increasing differences. Furthermore, while HFC-152a estimates reported to the UNFCCC showed a decrease in emissions over time, the top-down emission estimates exhibited a sharp increase. Despite not being obligated to report, China and South Korea have voluntarily reported national emissions of specific substances to the UNFCCC for a limited number of years. In contrast to Japan, the top-down emissions for China and South Korea for HFC-134a were approximately half of reported bottom-up inventories, and for other HFCs (except for HFC-152a of South Korea), reported emissions were either very low or not available due to a lack of the statistical information of production or consumption. In particular, the reason for the very low reported (or not reported) emissions of HFC-32, HFC-125, and HFC-143a in South Korea is that the national inventory compilation does not yet consider the amount of HFCs contained in blended refrigerants such as R-410A and R-404A (the Government of the Republic of Korea, 2021). Therefore, the consideration of blended refrigerant components is also necessary when estimating the bottom-up emissions of each HFC. These indicate the importance of comprehensive data collection and accurate reporting to ensure precise estimation and management of emissions, both in developed countries where some emissions may be overlooked and in developing countries where the establishment of robust bottom-up emission estimation requires accurate information on production and consumption. Furthermore, the significant discrepancies between top-down and bottom-up approaches in Japan for specific substances or periods were revealed, it becomes necessary to compare and evaluate the reported emissions from other developed countries with the emissions that have been reported or will be reported.
Despite the continuing upward trend in HFC emissions in eastern Asia, the decline in Japan since 2019 likely reflects the effectiveness of Japan's F-gas policy, while the decline in eastern China in 2020 can perhaps be attributed to the lockdown measures implemented in response to the COVID-19 pandemic. As such, the variation of HFC emissions in eastern Asia is increasingly significant for global hydrofluorocarbon emissions and their impact on mitigating future climate change. Indeed, it is crucial to address the growing demand for HFCs in eastern Asia countries in a way that balances economic growth with the need for a gradual reduction in HFC emissions. To this end, policies are being formulated and implemented to promote the transition to low-GWP alternatives and improve energy efficiency in the industrial sector in various countries. Overall, the regulation and phasedown of HFC emissions is an important effort to comply with the Kigali Amendment and combat climate change. Therefore, we will continue to monitor atmospheric abundance of HFCs and estimate quantitative emissions at the regional scale to understand the changing trends of HFC emissions in each country in eastern Asia.
Data used in this study are available from the AGAGE (Advanced Global Atmospheric Gases Experiment) database (https://agage2.eas.gatech.edu/data_archive/agage/gc-ms-medusa/, AGAGE, 2023). NAME and InTEM are available for research use from the UK Met Office and subject to license.
The supplement related to this article is available online at: https://doi.org/10.5194/acp-24-7309-2024-supplement.
HC and SP designed the study; HC, ALR, JM, RLT, and AJM interpreted the analyzed results; HC, ALR, RLT, JM, SP, and JK wrote and revised the manuscript; HC, SP, and HP carried out the measurement of HFCs at Gosan; JM, PKS, CMH, and RFW supported the calibration and long-term precision for the observations at Gosan.
The contact author has declared that none of the authors has any competing interests.
Publisher’s note: Copernicus Publications remains neutral with regard to jurisdictional claims made in the text, published maps, institutional affiliations, or any other geographical representation in this paper. While Copernicus Publications makes every effort to include appropriate place names, the final responsibility lies with the authors.
This research was supported by the National Research Foundation of Korea (NRF) grant funded by the Korean government (Ministry of Science and ICT, MSIT; grant nos. 2021R1I1A1A01045062 and RS-2023-00229318). Support for contributions by Jooil Kim, Jens Mühle, Christina M. Harth, Peter K. Salameh, and Ray F. Weiss came from the National Aeronautics and Space Administration (grant nos. NNX16AC96G and NNX16AC97G). Alison L. Redington and Alistair J. Manning were supported by the Met Office Hadley Centre Climate Programme funded by UK government departments BEIS and Defra.
This research has been supported by the National Research Foundation of Korea (grant nos. 2021R1I1A1A01045062 and RS-2023-00229318), the National Aeronautics and Space Administration (grant nos. NNX16AC96G and NNX16AC97G), and the Met Office (UK government departments BEIS and Defra).
This paper was edited by Anne Perring and reviewed by two anonymous referees.
AGAGE: Index of/data_archive/agage/gc-ms-medusa, AGAGE [data set], https://agage2.eas.gatech.edu/data_archive/agage/gc-ms-medusa/, last access: May 2023.
Arnold, T., Mühle, J., Salameh, P. K., Harth, C. M., Ivy, D. J., and Weiss, R. F.: Automated measurement of nitrogen trifluoride in ambient air, Anal. Chem., 84, 4798–4804, https://doi.org/10.1021/ac300373e, 2012.
Arnold, T., Manning, A. J., Kim, J., Li, S., Webster, H., Thomson, D., Mühle, J., Weiss, R. F., Park, S., and O'Doherty, S.: Inverse modelling of CF4 and NF3 emissions in East Asia, Atmos. Chem. Phys., 18, 13305–13320, https://doi.org/10.5194/acp-18-13305-2018, 2018.
Breidenich, C., Magraw, D., Rowley, A., and Rubin, J. W.: The Kyoto protocol to the United Nations framework convention on climate change, Am. J. Int. Law, 92, 315–331, 1998.
Choi, H., Park, M.-K., Fraser, P. J., Park, H., Geum, S., Mühle, J., Kim, J., Porter, I., Salameh, P. K., Harth, C. M., Dunse, B. L., Krummel, P. B., Weiss, R. F., O'Doherty, S., Young, D., and Park, S.: Top-down and bottom-up estimates of anthropogenic methyl bromide emissions from eastern China, Atmos. Chem. Phys., 22, 5157–5173, https://doi.org/10.5194/acp-22-5157-2022, 2022.
CIESIN: Gridded population of the world, version 4 (GPWv4): population density, Cent. Int. Earth Sci. Inf. Network-CIESIN-Columbia Univ. NASA Socioecon. Data Appl. Cent. (SEDAC), https://doi.org/10.7927/H4DZ068D, 2015.
Crippa, M., Guizzardi, D., Solazzo, E., Muntean, M., Schaaf, E., Monforti-Ferrario, F., Banja, M., Olivier, J., Grassi, G., and Rossi, S.: GHG emissions of all world countries, Publ. Off. Eur. Union, https://publications.jrc.ec.europa.eu/repository/handle/JRC126363 (last access: 24 June 2024), 2021.
Ding, S., Wu, J., Wang, J., Ma, T., Zhang, D., Hu, D., and Zhang, Y.: Establishment of HFC-134a Emission Inventory in the North China Plain from 1995 to 2020, Atmosphere (Basel), 14, 501, https://doi.org/10.3390/atmos14030501, 2023.
Fang, X., Velders, G. J. M., Ravishankara, A. R., Molina, M. J., Hu, J., and Prinn, R. G.: Hydrofluorocarbon (HFC) emissions in China: an inventory for 2005–2013 and projections to 2050, Environ. Sci. Technol., 50, 2027–2034, 2016.
Flerlage, H., Velders, G. J. M., and de Boer, J.: A review of bottom-up and top-down emission estimates of hydrofluorocarbons (HFCs) in different parts of the world, Chemosphere, 283, 131208, https://doi.org/10.1016/j.chemosphere.2021.131208, 2021.
Fortems-Cheiney, A., Saunois, M., Pison, I., Chevallier, F., Bousquet, P., Cressot, C., Montzka, S. A., Fraser, P. J., Vollmer, M. K., and Simmonds, P. G.: Increase in HFC-134a emissions in response to the success of the Montreal Protocol, J. Geophys. Res.-Atmos., 120, 11–728, 2015.
Graziosi, F., Arduini, J., Furlani, F., Giostra, U., Cristofanelli, P., Fang, X., Hermanssen, O., Lunder, C., Maenhout, G., and O'Doherty, S.: European emissions of the powerful greenhouse gases hydrofluorocarbons inferred from atmospheric measurements and their comparison with annual national reports to UNFCCC, Atmos. Environ., 158, 85–97, 2017.
Hu, L., Montzka, S. A., Lehman, S. J., Godwin, D. S., Miller, B. R., Andrews, A. E., Thoning, K., Miller, J. B., Sweeney, C., and Siso, C.: Considerable contribution of the Montreal Protocol to declining greenhouse gas emissions from the United States, Geophys. Res. Lett., 44, 8075–8083, 2017.
Jones, A., Thomson, D., Hort, M., and Devenish, B.: The U. K. Met Office's next-generation atmospheric dispersion model, NAME III, in: Air Pollution Modeling and its Application XVII, Proceedings of the 27th NATO/CCMS International Technical Meeting on Air Pollution Modelling and its Application, edited by: Borrego C. and Norman A.-L., Springer, 580–589, https://doi.org/10.1007/978-0-387-68854-1, 2007.
Kim, J., Thompson, R., Park, H., Bogle, S., Mühle, J., Park, M. K., Kim, Y., Harth, C. M., Salameh, P. K., Schmidt, R., Ottinger, D., Park, S. and Weiss, R. F.: Emissions of Tetrafluoromethane (CF4) and Hexafluoroethane (C2F6) From East Asia: 2008 to 2019, J. Geophys. Res.-Atmos., 126, e2021JD034888, https://doi.org/10.1029/2021JD034888, 2021.
Kunik, L., Mallia, D. V, Gurney, K. R., Mendoza, D. L., Oda, T., and Lin, J. C.: Bayesian inverse estimation of urban CO2 emissions: Results from a synthetic data simulation over Salt Lake City, UT, Elem. Sci. Anthr., 7, 36, https://doi.org/10.1525/elementa.375, 2019.
Li, S., Kim, J., Kim, K. R., Mühle, J., Kim, S. K., Park, M. K., Stohl, A., Kang, D. J., Arnold, T., Harth, C. M., Salameh, P. K., and Weiss, R. F.: Emissions of halogenated compounds in east asia determined from measurements at Jeju Island, Korea, Environ. Sci. Technol., 45, 5668–5675, https://doi.org/10.1021/es104124k, 2011.
Li, S., Kim, J., Park, S., Kim, S. K., Park, M. K., Mühle, J., Lee, G., Lee, M., Jo, C. O., and Kim, K. R.: Source identification and apportionment of halogenated compounds observed at a remote site in East Asia, Environ. Sci. Technol., 48, 491–498, https://doi.org/10.1021/es402776w, 2014.
Li, S., Park, S., Lee, J. Y., Ha, K. J., Park, M. K., Jo, C. O., Oh, H., Mühle, J., Kim, K. R., Montzka, S. A., O'Doherty, S., Krummel, P. B., Atlas, E., Miller, B. R., Moore, F., Weiss, R. F. and Wofsy, S. C.: Chemical evidence of inter-hemispheric air mass intrusion into the Northern Hemisphere mid-latitudes, Sci. Rep., 8, 4669, https://doi.org/10.1038/s41598-018-22266-0, 2018.
Liang, Q., Rigby, M., Fang, X., Godwin, D., Mühle, J., Saito, T., Stanley, K. M., Velders, G. J. M., Bernath, P., Derek, N., Reimann, S., Simpson, I. J., and Western, L.: Chapter 2: Hydrofluorocarbons (HFCs), in: Scientific Assessment of Ozone Depletion: 2022, World Meteorological Organization, Geneva, https://ozone.unep.org/sites/default/files/2023-02/Scientific-Assessment-of-Ozone-Depletion-2022.pdf (last access: 8 February 2023), 2022.
Lunt, M. F., Rigby, M., Ganesan, A. L., Manning, A. J., Prinn, R. G., O'Doherty, S., Mühle, J., Harth, C. M., Salameh, P. K., and Arnold, T.: Reconciling reported and unreported HFC emissions with atmospheric observations, P. Natl. Acad. Sci. USA, 112, 5927–5931, 2015.
Manning, A. J., O'Doherty, S., Jones, A. R., Simmonds, P. G., and Derwent, R. G.: Estimating UK methane and nitrous oxide emissions from 1990 to 2007 using an inversion modeling approach, J. Geophys. Res.-Atmos., 116, D02305, https://doi.org/10.1029/2010JD014763, 2011.
Manning, A. J., Redington, A. L., Say, D., O'Doherty, S., Young, D., Simmonds, P. G., Vollmer, M. K., Mühle, J., Arduini, J., Spain, G., Wisher, A., Maione, M., Schuck, T. J., Stanley, K., Reimann, S., Engel, A., Krummel, P. B., Fraser, P. J., Harth, C. M., Salameh, P. K., Weiss, R. F., Gluckman, R., Brown, P. N., Watterson, J. D., and Arnold, T.: Evidence of a recent decline in UK emissions of hydrofluorocarbons determined by the InTEM inverse model and atmospheric measurements, Atmos. Chem. Phys., 21, 12739–12755, https://doi.org/10.5194/acp-21-12739-2021, 2021.
Miller, B. R., Weiss, R. F., Salameh, P. K., Tanhua, T., Greally, B. R., Mühle, J., and Simmonds, P. G.: Medusa: A sample preconcentration and GC/MS detector system for in situ measurements of atmospheric trace halocarbons, hydrocarbons, and sulfur compounds, Anal. Chem., 80, 1536–1545, https://doi.org/10.1021/ac702084k, 2008.
Montzka, S. A., Velders, G. J. M., Krummel, P. B., Mühle, J., Orkin, V. L., Park, S., Shah, N., and Walter-Terrinoni, H.: Hydrofluorocarbons (HFC's) Chapter 2 in Scientific Assessment of Ozone Depletion: 2018, Global Ozone Research and Monitoring Project Report No. 58, World Meteorological Organization, Geneva, Switzerland, https://ozone.unep.org/sites/default/files/2019-05/SAP-2018-Assessment-report.pdf (last access: 24 June 2024), 2018.
O'Doherty, S., Simmonds, P. G., Cunnold, D. M., Wang, H. J., Sturrock, G. A., Fraser, P. J., Ryall, D., Derwent, R. G., Weiss, R. F., Salameh, P., Miller, B. R. and Prinn, R. G.: In situ chloroform measurements at Advanced Global Atmospheric Gases Experiment atmospheric research stations from 1994 to 1998, J. Geophys. Res.-Atmos., 106, 20429–20444, https://doi.org/10.1029/2000JD900792, 2001.
Paris Agreement: Paris agreement, in report of the conference of the parties to the United Nations framework convention on climate change (21st session, 2015: Paris), Getzville, NY, USA, vol. 4, p. 2017, HeinOnline, 2015.
Park, S., Western, L. M., Saito, T., Redington, A. L., Henne, S., Fang, X., Prinn, R. G., Manning, A. J., Montzka, S. A., Fraser, P. J., Ganesan, A. L., Harth, C. M., Kim, J., Krummel, P. B., Liang, Q., Mühle, J., O'Doherty, S., Park, H., Park, M. K., Reimann, S., Salameh, P. K., Weiss, R. F. and Rigby, M.: A decline in emissions of CFC-11 and related chemicals from eastern China, Nature, 590, 433–437, https://doi.org/10.1038/s41586-021-03277-w, 2021.
Pisso, I., Sollum, E., Grythe, H., Kristiansen, N. I., Cassiani, M., Eckhardt, S., Arnold, D., Morton, D., Thompson, R. L., Groot Zwaaftink, C. D., Evangeliou, N., Sodemann, H., Haimberger, L., Henne, S., Brunner, D., Burkhart, J. F., Fouilloux, A., Brioude, J., Philipp, A., Seibert, P., and Stohl, A.: The Lagrangian particle dispersion model FLEXPART version 10.4, Geosci. Model Dev., 12, 4955–4997, https://doi.org/10.5194/gmd-12-4955-2019, 2019.
Prinn, R. G., Weiss, R. F., Arduini, J., Arnold, T., DeWitt, H. L., Fraser, P. J., Ganesan, A. L., Gasore, J., Harth, C. M., Hermansen, O., Kim, J., Krummel, P. B., Li, S., Loh, Z. M., Lunder, C. R., Maione, M., Manning, A. J., Miller, B. R., Mitrevski, B., Mühle, J., O'Doherty, S., Park, S., Reimann, S., Rigby, M., Saito, T., Salameh, P. K., Schmidt, R., Simmonds, P. G., Steele, L. P., Vollmer, M. K., Wang, R. H., Yao, B., Yokouchi, Y., Young, D., and Zhou, L.: History of chemically and radiatively important atmospheric gases from the Advanced Global Atmospheric Gases Experiment (AGAGE), Earth Syst. Sci. Data, 10, 985–1018, https://doi.org/10.5194/essd-10-985-2018, 2018.
Pu, J., Xu, H., Yao, B., Yu, Y., Jiang, Y., Ma, Q., and Chen, L.: Estimate of hydrofluorocarbon emissions for 2012–16 in the Yangtze River Delta, China, Adv. Atmos. Sci., 37, 576–585, 2020.
Rigby, M., Prinn, R. G., O'Doherty, S., Montzka, S. A., McCulloch, A., Harth, C. M., Mühle, J., Salameh, P. K., Weiss, R. F., Young, D., Simmonds, P. G., Hall, B. D., Dutton, G. S., Nance, D., Mondeel, D. J., Elkins, J. W., Krummel, P. B., Steele, L. P., and Fraser, P. J.: Re-evaluation of the lifetimes of the major CFCs and CH3CCl3 using atmospheric trends, Atmos. Chem. Phys., 13, 2691–2702, https://doi.org/10.5194/acp-13-2691-2013, 2013.
Rigby, M., Prinn, R. G., O'doherty, S., Miller, B. R., Ivy, D., Mühle, J., Harth, C. M., Salameh, P. K., Arnold, T., and Weiss, R. F.: Recent and future trends in synthetic greenhouse gas radiative forcing, Geophys. Res. Lett., 41, 2623–2630, 2014.
Rigby, M., Park, S., Saito, T., Western, L. M., Redington, A. L., Fang, X., Henne, S., Manning, A. J., Prinn, R. G., Dutton, G. S., Fraser, P. J., Ganesan, A. L., Hall, B. D., Harth, C. M., Kim, J., Kim, K. R., Krummel, P. B., Lee, T., Li, S., Liang, Q., Lunt, M. F., Montzka, S. A., Mühle, J., O'Doherty, S., Park, M. K., Reimann, S., Salameh, P. K., Simmonds, P., Tunnicliffe, R. L., Weiss, R. F., Yokouchi, Y., and Young, D.: Increase in CFC-11 emissions from eastern China based on atmospheric observations, Nature, 569, 546–550, https://doi.org/10.1038/s41586-019-1193-4, 2019.
Saha, S., Moorthi, S., Wu, X., Wang, J., Nadiga, S., Tripp, P., Behringer, D., Hou, Y.-T., Chuang, H., and Iredell, M.: The NCEP climate forecast system version 2, J. Climate, 27, 2185–2208, 2014.
Stohl, A., Kim, J., Li, S., O'Doherty, S., Mühle, J., Salameh, P. K., Saito, T., Vollmer, M. K., Wan, D., Weiss, R. F., Yao, B., Yokouchi, Y., and Zhou, L. X.: Hydrochlorofluorocarbon and hydrofluorocarbon emissions in East Asia determined by inverse modeling, Atmos. Chem. Phys., 10, 3545–3560, https://doi.org/10.5194/acp-10-3545-2010, 2010.
The Government of the Republic of Korea: Fourth Biennial Update Report of the Republic of Korea, https://unfccc.int/documents/418616 (last access: 28 November 2023), 2021.
Thompson, R. L. and Stohl, A.: FLEXINVERT: an atmospheric Bayesian inversion framework for determining surface fluxes of trace species using an optimized grid, Geosci. Model Dev., 7, 2223–2242, https://doi.org/10.5194/gmd-7-2223-2014, 2014.
United Nations Environ Programme (UNEP): The Montreal protocol on substances that deplete the ozone layer, United Nations Environment Programme, Nairobi, Kenya, 1987.
Velders, G. J. M., Daniel, J. S., Montzka, S. A., Vimont, I., Rigby, M., Krummel, P. B., Muhle, J., O'Doherty, S., Prinn, R. G., Weiss, R. F., and Young, D.: Projections of hydrofluorocarbon (HFC) emissions and the resulting global warming based on recent trends in observed abundances and current policies, Atmos. Chem. Phys., 22, 6087–6101, https://doi.org/10.5194/acp-22-6087-2022, 2022.
Weiss, R. F. and Prinn, R. G.: Quantifying greenhouse-gas emissions from atmospheric measurements: A critical reality check for climate legislation, Philos. T. Roy. Soc. A, 369, 1925–1942, https://doi.org/10.1098/rsta.2011.0006, 2011.
Yao, B., Fang, X., Vollmer, M. K., Reimann, S., Chen, L., Fang, S., and Prinn, R. G.: China's hydrofluorocarbon emissions for 2011–2017 inferred from atmospheric measurements, Environ. Sci. Technol. Lett., 6, 479–486, 2019.
Yi, L., Xiang, X., Zhao, X., Xu, W., Jiang, P., and Hu, J.: Atmospheric Observation and Emission of HFC-134a in China and Its Four Cities, Environ. Sci. Technol., 57, 4732–4740, 2023.
Zeng, L., Dang, J., Guo, H., Lyu, X., Simpson, I. J., Meinardi, S., Wang, Y., Zhang, L., and Blake, D. R.: Long-term temporal variations and source changes of halocarbons in the Greater Pearl River Delta region, China, Atmos. Environ., 234, 117550, https://doi.org/10.1016/j.atmosenv.2020.117550, 2020.