the Creative Commons Attribution 4.0 License.
the Creative Commons Attribution 4.0 License.
 | 24 Jun 2024
Simulations of primary and secondary ice production during an Arctic mixed-phase cloud case from the Ny-Ålesund Aerosol Cloud Experiment (NASCENT) campaign
Robert Oscar David
Paraskevi Georgakaki
Julie Thérèse Pasquier
Georgia Sotiropoulou
Trude Storelvmo
The representation of Arctic clouds and their phase distributions, i.e., the amount of ice and supercooled water, influences predictions of future Arctic warming. Therefore, it is essential that cloud phase is correctly captured by models in order to accurately predict the future Arctic climate. Ice crystal formation in clouds happens through ice nucleation (primary ice production) and ice multiplication (secondary ice production). In common weather and climate models, rime splintering is the only secondary ice production process included. In addition, prescribed number concentrations of cloud condensation nuclei or cloud droplets and ice-nucleating particles are often overestimated in Arctic environments by standard model configurations. This can lead to a misrepresentation of the phase distribution and precipitation formation in Arctic mixed-phase clouds, with important implications for the Arctic surface energy budget. During the Ny-Ålesund Aerosol Cloud Experiment (NASCENT), a holographic probe mounted on a tethered balloon took in situ measurements of number and mass concentrations of ice crystals and cloud droplets in Svalbard, Norway, during fall 2019 and spring 2020. In this study, we choose one case study from this campaign that shows evidence of strong secondary ice production and use the Weather Research and Forecasting (WRF) model to simulate it at a high vertical and spatial resolution. We test the performance of different microphysical parametrizations and apply a new state-of-the-art secondary ice parametrization. We find that agreement with observations highly depends on the prescribed cloud condensation nuclei/cloud droplet and ice-nucleating particle concentrations and requires an enhancement of secondary ice production processes. Lowering mass mixing ratio thresholds for rime splintering inside the Morrison microphysics scheme is crucial to enable secondary ice production and thereby match observations for the right reasons. In our case, rime splintering is required to initiate collisional breakup. The simulated contribution from collisional breakup is larger than that from droplet shattering. Simulating ice production correctly for the right reasons is a prerequisite for reliable simulations of Arctic mixed-phase cloud responses to future temperature or aerosol perturbations.
- Article
(6639 KB) - Full-text XML
- BibTeX
- EndNote


Given that the Arctic is the fastest-warming region on Earth, understanding the drivers of Arctic climate change, and in particular the role of clouds in this warming, has been of special interest (e.g., Serreze and Barry, 2011; Wendisch et al., 2017, 2019). Cloud phase is an important parameter in Arctic clouds as it influences both their radiative properties and their lifetime and thereby controls their climatic impact (e.g., Morrison et al., 2012). Mixed-phase clouds, i.e., clouds consisting of both ice crystals and supercooled liquid water droplets, can form at temperatures between approximately −38 and 0 °C. In the Arctic, these clouds frequently occur in every season and are especially common at low and middle levels (Shupe et al., 2006; de Boer et al., 2009; Shupe, 2011; Gierens et al., 2020). In order for ice to form in the mixed-phase cloud temperature regime, a special subset of aerosol known as ice-nucleating particles (INPs) is required. INPs act as a catalyst for water to freeze at temperatures above −38 °C (the homogeneous freezing temperature of water; Vali et al., 2015). Previous studies suggest that ice formation and thereby also the phase partitioning between liquid and ice is strongly affected by the availability of INPs (Jackson et al., 2012; Solomon et al., 2018; Norgren et al., 2018; Carlsen and David, 2022; Creamean et al., 2022). However, the degree to which the phase composition is determined by INPs is still an ongoing topic of research and investigation in field campaigns (e.g., Pasquier et al., 2022a).
There are different mechanisms through which INPs can nucleate ice, namely immersion, contact, condensation, or deposition freezing (Vali et al., 2015). Immersion freezing occurs when an INP is immersed in a liquid droplet and initiates freezing (Vali et al., 2015). Condensation freezing is similar to immersion freezing except that the INP acts as a cloud condensation nuclei (CCN) and nucleates ice as soon as bulk water condenses on its surface. Contact freezing occurs when an INP triggers a supercooled cloud droplet to freeze upon collision (Diehl et al., 2002; Yang et al., 2020). Lastly, deposition freezing occurs when water vapor directly nucleates into ice on an INP (Vali et al., 2015); however more recent studies have shown that deposition freezing may actually occur due to bulk water condensing in nanoscale cracks or pores, i.e., pore condensation and freezing (e.g., David et al., 2019b, 2020; Marcolli, 2014; Campbell and Christenson, 2018). Although condensation freezing is considered a separate ice-nucleation process, it is debatable whether it is microphysically different from deposition/pore condensation and freezing and immersion freezing (Kanji et al., 2017).
While these heterogeneous ice-nucleation processes, together with homogeneous nucleation, are commonly summarized as primary ice production processes, there has long been evidence for the existence of additional processes enhancing the number of ice crystals in clouds. Field measurements show that ice crystal number concentrations (ICNC) can significantly exceed INP concentrations (INPC) in clouds by up to 5 orders of magnitude (e.g., Auer et al., 1969; Beard, 1992; Cantrell and Heymsfield, 2005; Korolev and Leisner, 2020; Wieder et al., 2022a; Järvinen et al., 2022; Ladino et al., 2017). To explain this discrepancy, a number of so-called secondary ice production (SIP) processes for the multiplication of ice from existing frozen particles have been proposed. These processes include the collisional breakup of ice crystals (BR), rime splintering (RS; also called the Hallett–Mossop process), droplet shattering when freezing (DS), and sublimation fragmentation in subsaturated cloud regions (SF; e.g., Field et al., 2017; Korolev and Leisner, 2020). The existence of additional SIP processes has been proposed, but these have yet to be named and confirmed (Knight, 2012). RS occurs when liquid droplets (diameter < 13 µm) or drops (> 25 µm) rime on ice crystals but is only believed to be active in the temperature range between −8 and −3 °C (Hallett and Mossop, 1974; Mossop, 1978; Field et al., 2017). BR, caused by ice-ice collisions; DS, i.e., splinter production during the freezing of large droplets; and SF have been observed outside of this temperature range (Lauber et al., 2018; Korolev and Leisner, 2020; Keinert et al., 2020; Lauber et al., 2021, and references therein) and thus have the potential to significantly increase ICNC throughout the entire mixed-phase temperature range (Karalis et al., 2022).
Nevertheless, RS is generally the only SIP process that is part of the standard microphysics schemes available for both numerical weather prediction and climate models (e.g., Field et al., 2017; Zhao et al., 2021; Atlas et al., 2022). Many previous studies of model–observation comparisons therefore do not include additional SIP processes (Prenni et al., 2007; Luo et al., 2008; Barton et al., 2012; Young et al., 2017; Schemann and Ebell, 2020). These include, for example, the extensive modeling of Arctic stratocumulus clouds performed by Solomon et al. (2009) for cases in the Mixed-Phase Arctic Cloud Experiment (M-PACE) campaign that took place in 2004 (Verlinde et al., 2007). They tested several one- and two-moment schemes, all without SIP apart from RS, inside the Weather Research and Forecasting model (WRF; Skamarock et al., 2019) and found an underestimation of the number of small ice crystals. However, more recent studies have started including DS and BR to address the lack of SIP processes in models. Fu et al. (2019), for instance, studied a case from the same campaign using the Milbrandt and Yau microphysics scheme (Milbrandt and Yau, 2005) with different SIP configurations including tests for DS and BR. They found that BR did not contribute significantly in their case, while DS enhanced ICNC by roughly a factor of 2. Also, Sotiropoulou et al. (2021) and Georgakaki et al. (2022) implemented BR and DS, respectively, into the Morrison microphysics scheme (Morrison et al., 2009) in the WRF model following the parametrizations by Phillips et al. (2017, 2018). Sotiropoulou et al. (2021) found that including BR improved the representation of ICNC in the model considerably compared to field observations of Antarctic clouds. Georgakaki et al. (2022) found that including BR also increases the simulated ICNC in Alpine mixed-phase clouds and thereby leads to better agreement with observations, while DS did not significantly contribute to the simulated ICNC.
In our study, we use the WRF model including the modified Morrison microphysics scheme from Sotiropoulou et al. (2021) and Georgakaki et al. (2022) for a case study from a campaign in the Svalbard archipelago where information about the presence of SIP is available from field measurements (Pasquier et al., 2022b). The Ny-Ålesund Aerosol Cloud Experiment (NASCENT) study took place from September 2019 to August 2020 in Ny-Ålesund, Svalbard (78.9° N, 11.9° E; Pasquier et al., 2022a). One of its central objectives was to determine under which conditions INPs or secondary ice production (SIP) dominantly affects the phase partitioning inside Arctic mixed-phase clouds. For a deeper understanding of this dependency, we complement the observations performed with a regional modeling study here. The main objective of this study is to simulate ice production that is in agreement with observations, in terms of both numbers and processes. We are particularly interested in whether the model can simulate an ICNC as high as was observed when using measured INPC and added SIP processes.
A description of the observations used is given in Sect. 2, while modeling methods follow in Sect. 3. Section 4 comprises results and discussion before the conclusions are presented in Sect. 5.
We first present the relevant measurements from the campaign and then describe the meteorological situation of the chosen case study.
2.1 Instruments and measurements
In this study, we utilize the extensive suite of aerosol and cloud measurements conducted during the NASCENT campaign (Pasquier et al., 2022a), which took place over an entire year (fall 2019–2020) in and around the Norwegian research village Ny-Ålesund (78.9° N, 11.9° E). The measurements we use here are concentrations of aerosols suitable to act as CCN and INPs measured at the ground, as well as number and mass concentrations of ice crystals and cloud droplets measured in cloud from the HOlographic imager for Microscopic Objects (HOLIMO) on board the tethered balloon system HoloBalloon (Ramelli et al., 2020).
The CCN concentration (CCNC) was assessed from the concentration of aerosols larger than 70 nm, as particles of these sizes can be used as a proxy for CCN (Koike et al., 2019; Pasquier et al., 2022a).
To quantify the INP concentrations, aerosols were sampled through an inlet in a container installed at the balloon launch site using (1) the Horizontal Ice Nucleating Chamber (HINC; Lacher et al., 2017; Mahrt et al., 2018) and (2) a high-flow-rate liquid impinger (Bertin Coriolis-u), with subsequent analysis using the DRoplet Ice Nuclei Counter Zurich (DRINCZ; David et al., 2019a; Wieder et al., 2022b). Both techniques measure INPs in the immersion mode (Li et al., 2022). It is important to note that due to the efficiency of the liquid impinger, only aerosols larger than 500 nm could be assessed for their ice-nucleating ability in DRINCZ. However, previous studies have shown that aerosols larger than 500 nm make up the largest fraction of the INP population (DeMott et al., 2010; Mason et al., 2015). HoloBalloon itself, or more precisely the HOLIMO3B on board it, provided hydrometeor number and size concentrations measured at altitudes up to 850 m. The technical setup and pixel size restrict the detection of small particles to diameters larger than 6 µm and smaller than 2 mm (Ramelli et al., 2020). The holographic imager sampled a 15.5 cm3 volume of cloud at a rate of 6 Hz during the flights (Pasquier et al., 2022a, supplement). For this study, we use the hydrometeor number and size concentrations accumulated over 30, 60, or 300 s that were published in Pasquier et al. (2022c). All of the recorded hydrometeors larger than 25 µm were classified as either liquid droplets or ice particles using supervised machine learning (Touloupas et al., 2020). Meanwhile, all particles smaller than 25 µm were automatically classified as liquid droplets, as a reliable phase classification based on particle shape from HoloBalloon is limited to particles larger than this threshold (Lauber, 2020). Therefore, the retrieved ICNC is a lower estimate, strictly speaking. The phase-separated number size distributions were used to calculate the liquid water content (LWC) and ice water content (IWC). For the IWC, the effective mass–dimensional relationship reported in Cotton et al. (2013) was used. The associated uncertainties when using this approach are discussed in Heymsfield et al. (2010).
2.2 Case study
In this study, we focus on the 12 November 2019 cloud event from the NASCENT campaign, when there was observational evidence for a large contribution of secondary ice production to overall ice formation in the cloud (Pasquier et al., 2022a, b). Pasquier et al. (2022a, b) determined this by following the approach presented in Korolev et al. (2020), where the concentration of small pristine ice crystals with diameters < 100 µm is used as a way to identify regions where recent ice formation occurred. If the observed concentration of the newly formed ice crystals is larger than the INPC, it is likely that SIP was occurring. Still, this assumption includes the caveat that the actual INPC might be larger than measured since INPs in the contact mode were not assessed. For a more detailed description of the application during the NASCENT campaign, see Pasquier et al. (2022b).
On 12 November, a warm front influenced the weather around Ny-Ålesund (Fig. A1). The surface temperature varied between −3 and 0 °C, the dominant wind direction was southwesterly, and there was a persistent mixed-phase cloud lasting until around 21:00 UTC. As the cloud top rose from ca. 1300 to 2000 during the day, the cloud top temperature decreased from around −11 to −14 °C. The cloud base varied between 200 and 600 , and there were several periods of precipitation resulting in about 2.4 mm of total precipitation (Pasquier et al., 2022a).
HoloBalloon performed three flights during 12 November 2019: 10:00–11:00, 12:15–14:00, and 14:45–17:00 UTC. The HoloBalloon measurement time spent at certain altitudes was not uniformly distributed; rather, the majority of the sampling time was spent close to the maximum altitude of the flight, leading to the highest robustness of the measurements inside the main body of the cloud. The estimated CCNC on 12 November of around 9 cm−3 is within a factor of 2 of the observed cloud droplet number concentration (CDNC) that varied between 5 and 15 cm−3, indicating that droplet formation was CCN limited (Motos et al., 2023). Such low concentrations were also commonly observed in earlier studies of CDNC in aerosol-limited regions (e.g., Mauritsen et al., 2011; Moore et al., 2013). The INP measurements made by DRINCZ during the day were fitted and reported as a function of temperature in Eq. (1) (Pasquier et al., 2022a, Fig. 7).
The fit is several orders of magnitude lower than other parametrizations commonly used in weather and climate models that are often developed based on mineral dust or measurements from urban mid-latitude areas (e.g., Tobo et al., 2020), but it is on a similar order of magnitude to the INPC on other days during the NASCENT campaign (Li et al., 2022) as well as to results from field campaigns in other Arctic and remote coastal sites (e.g., Hartmann et al., 2020; McCluskey et al., 2018; DeMott et al., 2016; Sze et al., 2023).
The reported CCNC and INP fit are used to replace default values in the model. This permits better quantification of heterogeneous cloud particle formation, and also guides us towards better agreement of the modeled cloud particle concentrations with observations through the correct processes. Details about the model setup and implementation of measured aerosol properties follow in the next section.
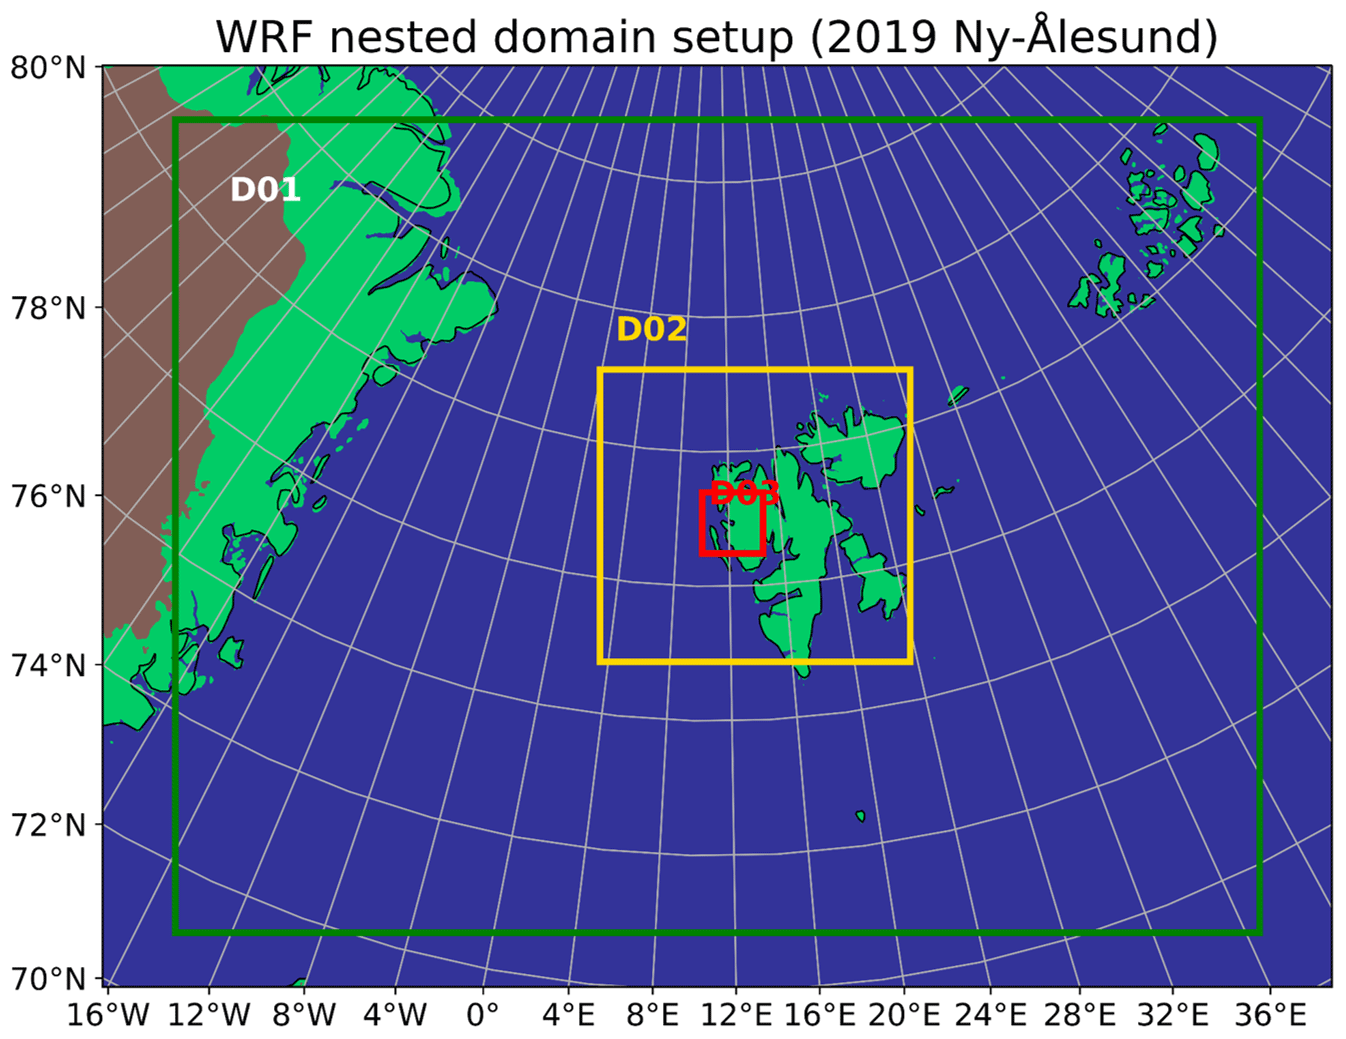
Figure 1The three nested domains D01, D02, and D03 in the WRF model are shown by the green, yellow, and red boxes, respectively. The associated horizontal resolutions are 15, 5, and 1 km.
All of the simulations presented here were conducted with the WRF model. To account for the different microphysics schemes investigated, two model versions were used, namely version 4.2.1 for simulations with the Milbrandt and Yau (MY) microphysics scheme (Milbrandt and Yau, 2005) and version 4.0.1 for simulations with the Morrison (Morr) microphysics scheme (Morrison et al., 2009; Skamarock et al., 2019). The simulations with the Morr scheme were conducted with this version of WRF so that the modified Morr scheme with the secondary ice production processes implemented by Sotiropoulou et al. (2021) and Georgakaki et al. (2022) could be used. We used a nested setup with three domains, where the outermost domain had a resolution of 15 km, the middle domain had a 5 km resolution, and the inner domain had a 1 km resolution. The geographical extent of the domains is shown in Fig. 1, where the innermost domain spans 100 km × 100 km. The number of vertical levels between the surface and 50 hPa was set to 172, 93 of which are below 3 km in altitude. This high vertical resolution was chosen to ensure that processes at cloud top and base were resolved in sufficient detail. All of the simulations were initiated on 11 November 2019 at 12:00 UTC and had a duration of 36 h with a time step of 30 s. The first 12 h of the simulations were used as a spinup. We initialized and nudged the model using reanalysis data from ERA5 on pressure levels at 00:00, 06:00, 12:00, and 18:00 UTC on the two outermost domains (Hersbach et al., 2018a, b). Grid nudging was performed for the two horizontal wind components, temperature, and specific humidity. No nudging was performed at the surface. As is by default in WRF, the nudging strength was 0.0003 s−1, and nudging lasted for 60 min with a ramp-down at the end of the period. Longwave and shortwave radiation were treated by the CAM scheme (NCAR Community Atmosphere Model; Collins et al., 2004), and for boundary layer processes we used the YSU scheme (Yonsei University; Hong et al., 2006). The cumulus parametrization for deep and shallow convection on sub-grid scales was only turned on in the largest domain, and here we used the scale-aware Grell–Freitas ensemble scheme (Grell and Freitas, 2014).
The described settings for domain size, resolution, run duration, time step, nudging, radiation, and convection parametrizations are the same for all runs. Changes are only made inside the microphysics schemes and will be explained below.
3.1 Microphysics parametrizations
To investigate the sensitivity of cloud properties such as CDNC, ICNC, LWC, and IWC to different microphysical parametrizations and to the prescribed CCN and INPC, we perform similar sets of simulations with two different microphysics schemes that are described in more detail in the following subsections. Both schemes are double-moment schemes, but only the MY scheme predicts the CDNC from a prescribed CCNC and ambient supersaturation, while the Morr double-moment scheme uses a prescribed CDNC and is therefore actually only single-moment for cloud droplets. Additionally, MY has the largest number of hydrometeor classes, including cloud droplets, cloud ice, rain, snow, graupel, and hail, while Morr in its default setup does not include hail. The reasons for focusing most of the study on simulations with the Morr scheme were that the MY scheme failed to produce a suitable control simulation due to excessive graupel production when CCN and INP concentrations were adapted to observed values (see Sect. 4.3) and, more importantly, that we wanted to apply and test the new SIP implementation recently developed for the Morr scheme by Sotiropoulou et al. (2021) and Georgakaki et al. (2022).
Milbrandt and Yau scheme
In the MY scheme, CCNC and INPC are characterized individually. The default CCNC when there are negligible vertical motions or downdrafts is 200 cm−3 for continental aerosol and 80 cm−3 when maritime aerosol is selected. By default, continental aerosol is assumed, and the corresponding value is used across the entire domain. During updrafts, the number of activated CCN is parametrized following Cohard and Pinty (2000), which takes into account local temperature, updraft speed, and pressure.
The three possible pathways for primary ice production are heterogeneous ice nucleation, homogeneous freezing of cloud droplets, and freezing of rain drops (parametrized after Bigg, 1953). For heterogeneous ice nucleation, a switch enables either (1) the empirical parametrization from Meyers et al. (1992) for deposition, condensation freezing, and contact freezing parametrized following Young (1974) or (2) the parametrization from Cooper (1986) for deposition nucleation and no contact nucleation. As a default, option 1 (Meyers condensation/deposition nucleation and Young contact freezing) is active. Once primary ice has formed, the only SIP process included is RS (Hallett and Mossop, 1974). Ice mass may also increase from riming.
Cohard and Pinty (2000)Meyers et al. (1992)Young (1974)Bigg (1953)Pasquier et al. (2022a)Young (1974)Table 1Overview of simulations for 12 November 2019 with the Milbrandt and Yau microphysics (MY) scheme. The default scheme has two parametrizations for CCNC depending on the ambient vertical velocity w.
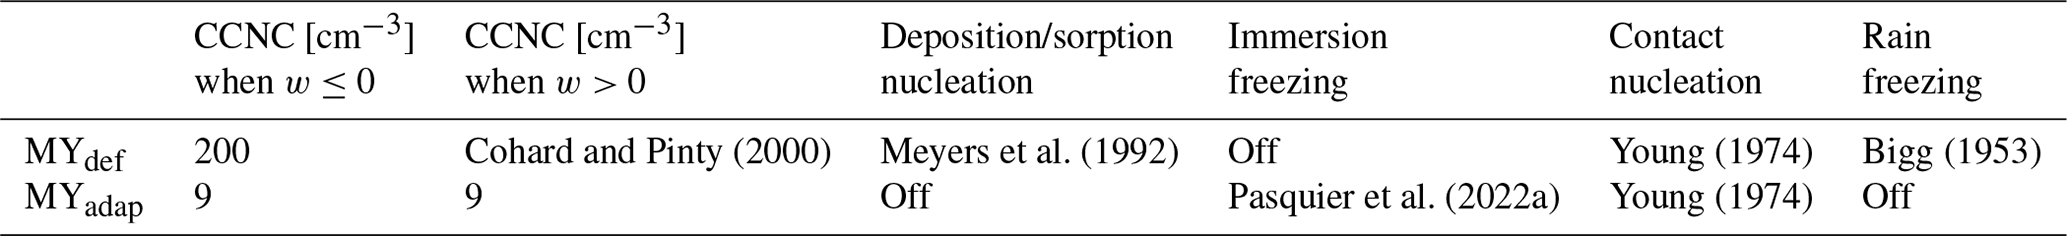
Table 2Overview of runs for 12 November 2019 with the Morrison double-moment microphysics scheme (Morr). The parameters changed during different model runs were CDNC, INPC in primary ice production processes, and lower threshold values for mixing ratios during rime splintering. In addition, we implemented the secondary ice processes in the Morr microphysics scheme introduced by Sotiropoulou et al. (BR; 2021) and Georgakaki et al. (DS; 2022).
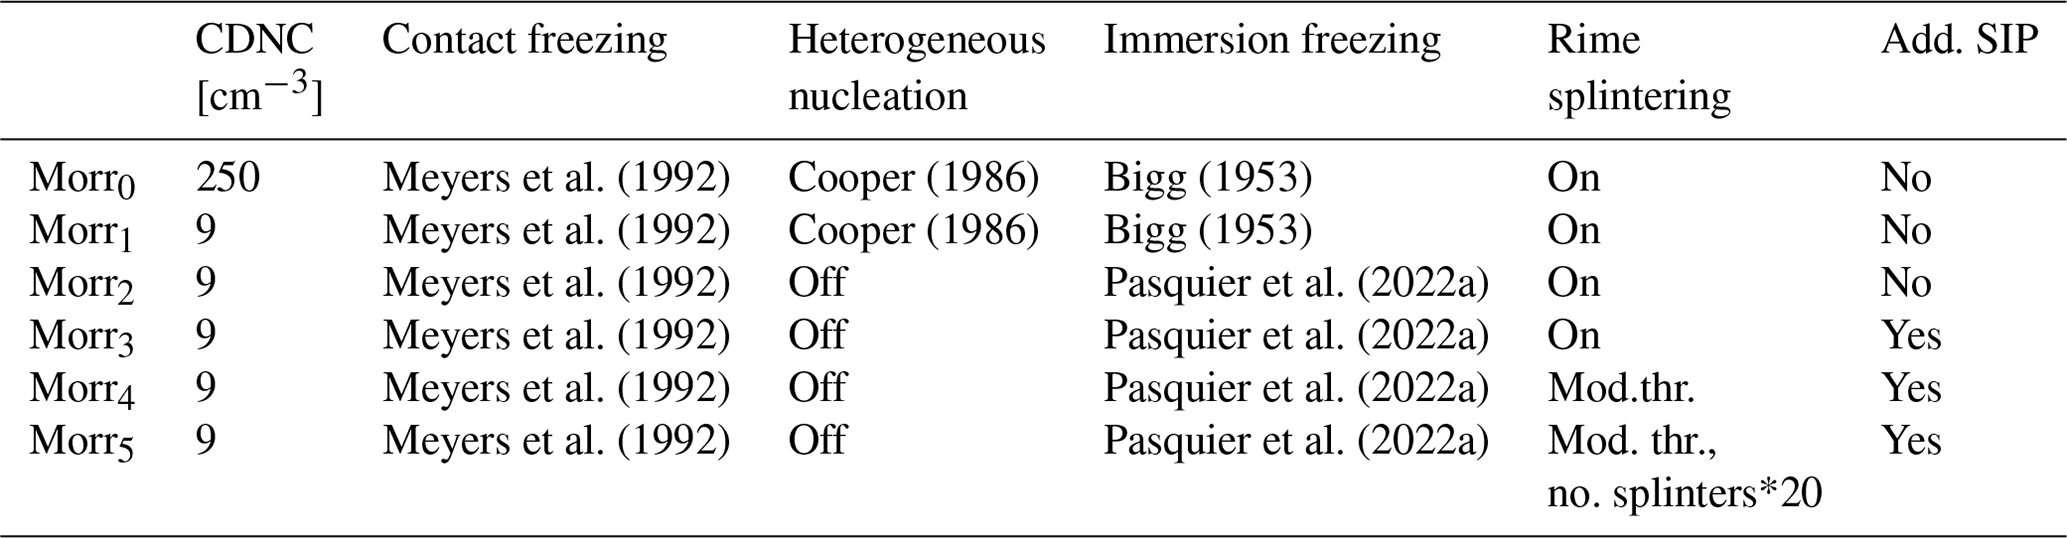
Mod.thr. – modified thresholds.
To assess the effect of changing the given aerosol parametrizations towards a more realistic representation of the environmental conditions in our case, we compare two simulations performed with the MY scheme. The first simulation uses the default parametrizations only (MYdef). In the second simulation, both the CCNC and INPC are adapted to match the estimated values during 12 November (MYadap) as follows: the CCNC is set to 9 cm−3 during updrafts, downdrafts and negligible vertical motions. Regarding heterogeneous ice nucleation, we chose to retain the default option (option 1) as it includes contact nucleation, which previous studies have shown is more important in Arctic mixed-phase clouds than deposition freezing (Morrison et al., 2005b, e.g.,) and is not active in option 2. We replace the formula for deposition/condensation freezing by Meyers et al. (1992) with the fit for INPC in the immersion mode given in Eq. (1) (Pasquier et al., 2022a). This is because immersion freezing is seen as the most common process for ice nucleation in mixed-phase clouds in the Arctic and in general in supercooled layers warmer than −27 °C (de Boer et al., 2010, 2011; Westbrook and Illingworth, 2011). For contact freezing, we use the parametrization by Young (1974), as no measurements of INPs in the contact freezing mode were conducted. For a further discussion of the treatment of contact nucleation, see the following section on the Morr scheme. Additionally, we turn off the freezing of rain drops in the model, as this process should only happen either because of an immersed INP or upon collisions with an ice particle (both of which are already accounted for). All important parameter differences between the two simulations are given in Table 1.
Morrison scheme
The Morr scheme is described in Morrison et al. (2009) and builds on an older version published in 2005 (Morrison et al., 2005a). It is a double-moment scheme for the hydrometeor species rain, ice, snow, and graupel but only single-moment for cloud droplets as the CDNC is a predefined number. It also contains a switch to include hail as a separate category, but this is not applied in this study.
In order for the Morr scheme to accurately represent the observed cloud properties for the correct physical reasons, several adaptations to the Morr scheme were tested and combined. The entire sequence of adaptations is shown in Fig. 2 and Table 2.
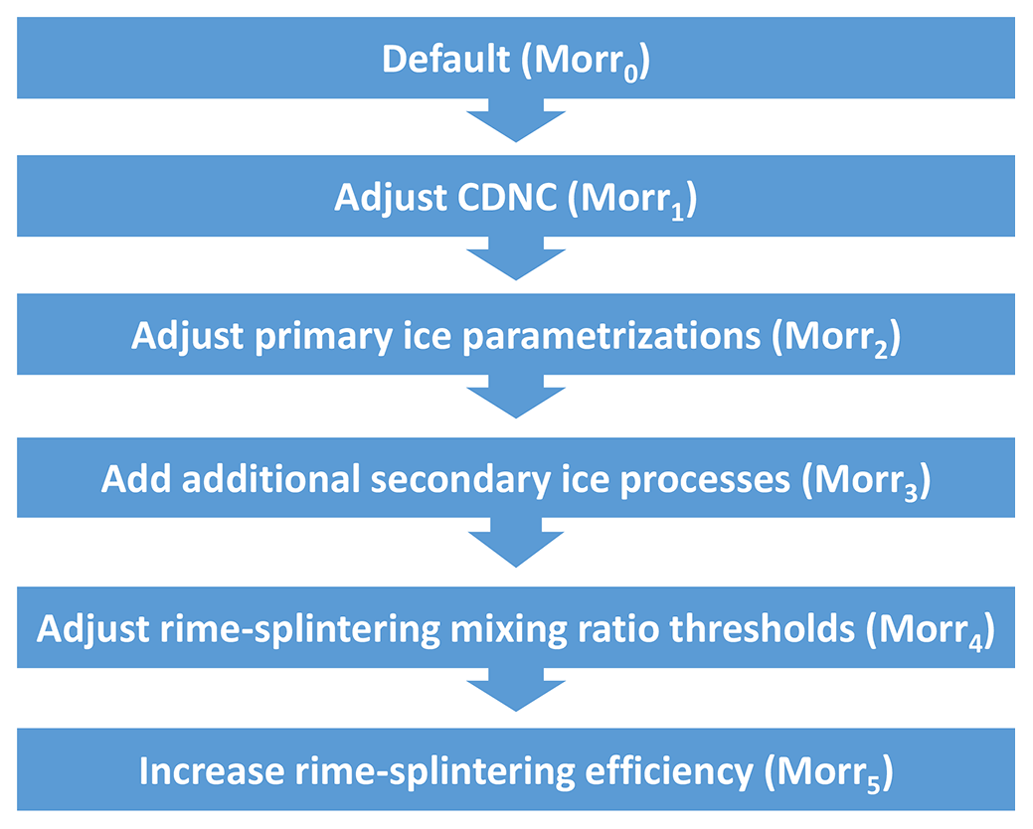
Figure 2From default to final simulation: the different rows illustrate the steps from the default version of the Morrison scheme towards a version that represents cloud ice correctly. Adjusting the CDNC and primary ice parametrizations is done by matching concentrations to observed values of CCNC and INPC. The modifications regarding secondary ice processes are necessary in order to make SIP as efficient in the model as was observed in this case.
Table 3Mixing ratio thresholds in that have to be overcome (kg kg−1) in order for rime splintering to happen in the Morrison microphysics scheme.
First, we adjusted the CDNC from the default value of 250 cm−3 (Morr0) to 9 cm−3 (Morr1), to match the observations within a factor of 2 (5–15 cm−3 observed; Pasquier et al., 2022a). Next, we adjusted primary ice production (Morr2). Regarding processes involving INPs, the scheme contains the following: contact freezing parametrized after Meyers et al. (1992), deposition nucleation after Cooper (1986), and immersion freezing of cloud droplets and rain as parameterized by Bigg (1953). It is important to clarify here that Meyers et al. (1992) presented different parametrizations for deposition/condensation freezing and for contact freezing, and the formula used here is not the one mentioned during the description of the MY scheme above for condensation/deposition freezing. As the INP concentration during the NASCENT campaign was measured in the immersion mode, we use Eq. (1) retrieved in Ny-Ålesund (Pasquier et al., 2022a) to replace the formula by Bigg (1953) for the immersion freezing of cloud droplets. Along with this change, we introduce the following condition to limit ice nucleation by INPC: new ice crystals are only nucleated if supercooled cloud droplets are present and if the number of INPs at the given temperature exceeds the number of ice particles present. This limitation is necessary to prevent infinite ice nucleation, as the scheme is not aerosol aware, and INPs nucleated earlier in the cloud are not removed (Kärcher and Marcolli, 2021). Before, i.e., in the default scheme (Morr0), the maximum number of ice crystals newly formed through immersion freezing was limited only by the number of available droplets. However, a limitation based on the number of ice crystals exists for deposition nucleation in the default scheme. As such, we effectively combine these two limitations (ice crystal and cloud droplet number) now for immersion freezing.
Based on the same rationale as for MY, we disable immersion freezing of rain and deposition nucleation but keep the default formula by Meyers et al. (1992) active for contact nucleation. Even though the extent to which contact freezing is actually occurring in the atmosphere is questionable (Ladino Moreno et al., 2013; Marcolli et al., 2016; Nagare et al., 2016), a sensitivity test with the Morr scheme (not shown) revealed that without contact freezing active and with immersion freezing parametrized after Pasquier et al. (2022a) as the only heterogeneous ice nucleation process, simulated ice crystal concentrations were far lower than the observed ones. Agreement could not be achieved by adding SIP the way it is done in this study. Therefore, we decided to keep contact freezing active (see also Sect. 4.5). In summary, Morr2 and MYadap contain comparable microphysical adjustments.
In Morr3, we keep all of the previous adjustments from Morr2 and add the SIP processes BR and DS following the parametrizations by Phillips et al. (2017, 2018) implemented into the Morr scheme for WRF by Sotiropoulou et al. (2021) and Georgakaki et al. (2022). As a result of implementing the BR parametrization following Phillips et al. (2017), the rimed fraction of snow and ice particles has to be prescribed, and here we use a rimed fraction of 0.4 in all simulations that include BR (Morr3, Morr4, and Morr5). This corresponds to heavily rimed particles and was found to give reasonable results in Sotiropoulou et al. (2021) even though the value in nature is highly variable. We also note that in the scheme by Georgakaki et al. (2022), DS was allowed to be triggered by the freezing of rain drops in addition to during freezing induced by ice/snow/graupel–rain collisions (true SIP). Here, as we do not allow for immersion freezing of rain (but only cloud droplets), DS only includes events triggered by collisions.
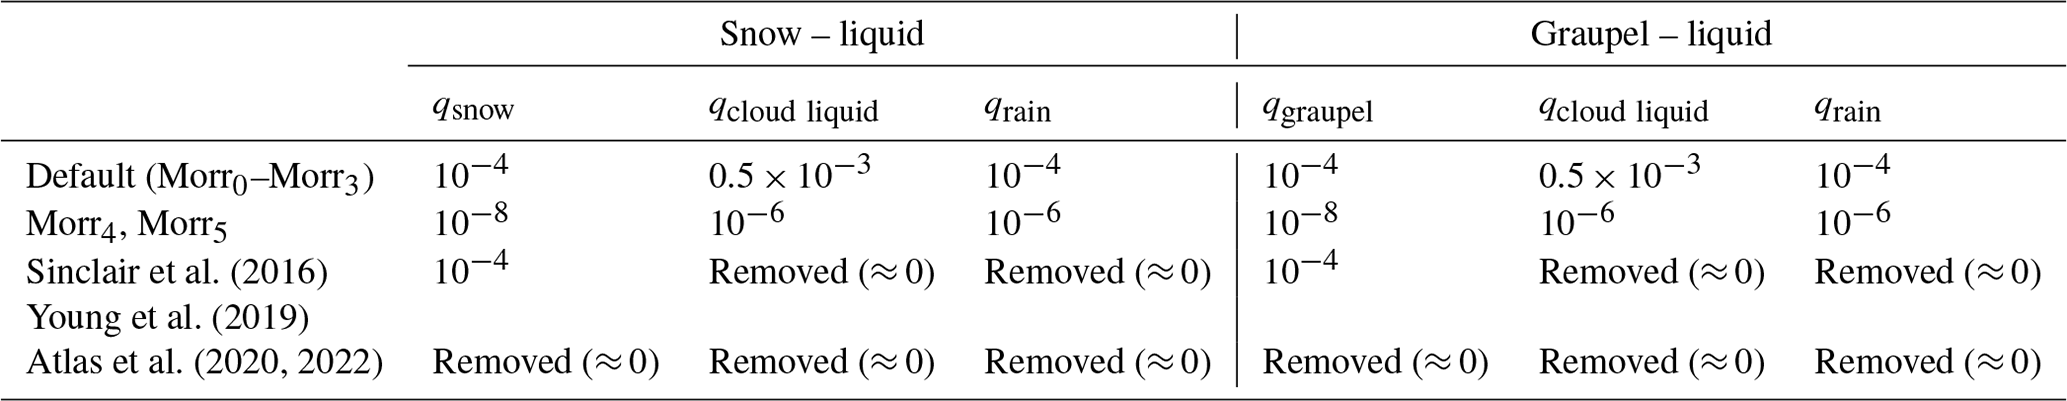
Motivated by the results from Morr3, we continued by adjusting the mixing ratio thresholds required for RS to occur (Morr4) and finally the numbers of splinters created per RS event (Morr5). We found that RS was not active in Morr3 because the required mixing ratios for RS were never exceeded, and none of the newly implemented SIP mechanisms were triggered in a sufficient number to increase ICNC either (see Sect. 4.4, Appendix C). However, the required mixing ratios for BR and DS used by Sotiropoulou et al. (2021) and Georgakaki et al. (2022) were actually much lower than the ones given by Morrison et al. (2009) for RS. In that light, we adapted the thresholds for RS to occur. In particular, we lowered the snow and graupel water mixing ratio thresholds to match those required for BR during snow–snow and graupel–graupel collisions (10−8 kg kg−1) and lowered the cloud liquid and rainwater mixing ratios to those required for DS induced by rain–ice crystal collisions (10−6 kg kg−1). Earlier high-resolution modeling studies over the Southern Ocean and the Antarctic showed an improvement in the representation of low-level mixed-phase clouds in models when removing the RS thresholds in the Morr scheme (Sinclair et al., 2016; Young et al., 2019; Atlas et al., 2020, 2022; Sotiropoulou et al., 2021). Sinclair et al. (2016) and Young et al. (2019) removed only the thresholds for liquid mixing ratios, while Atlas et al. (2022) explicitly recommend completely removing all mass thresholds. The mixing ratio threshold values used in the different studies are given in Table 3.
A further discussion of the changes in RS efficiency follows in Sect. 4.5.
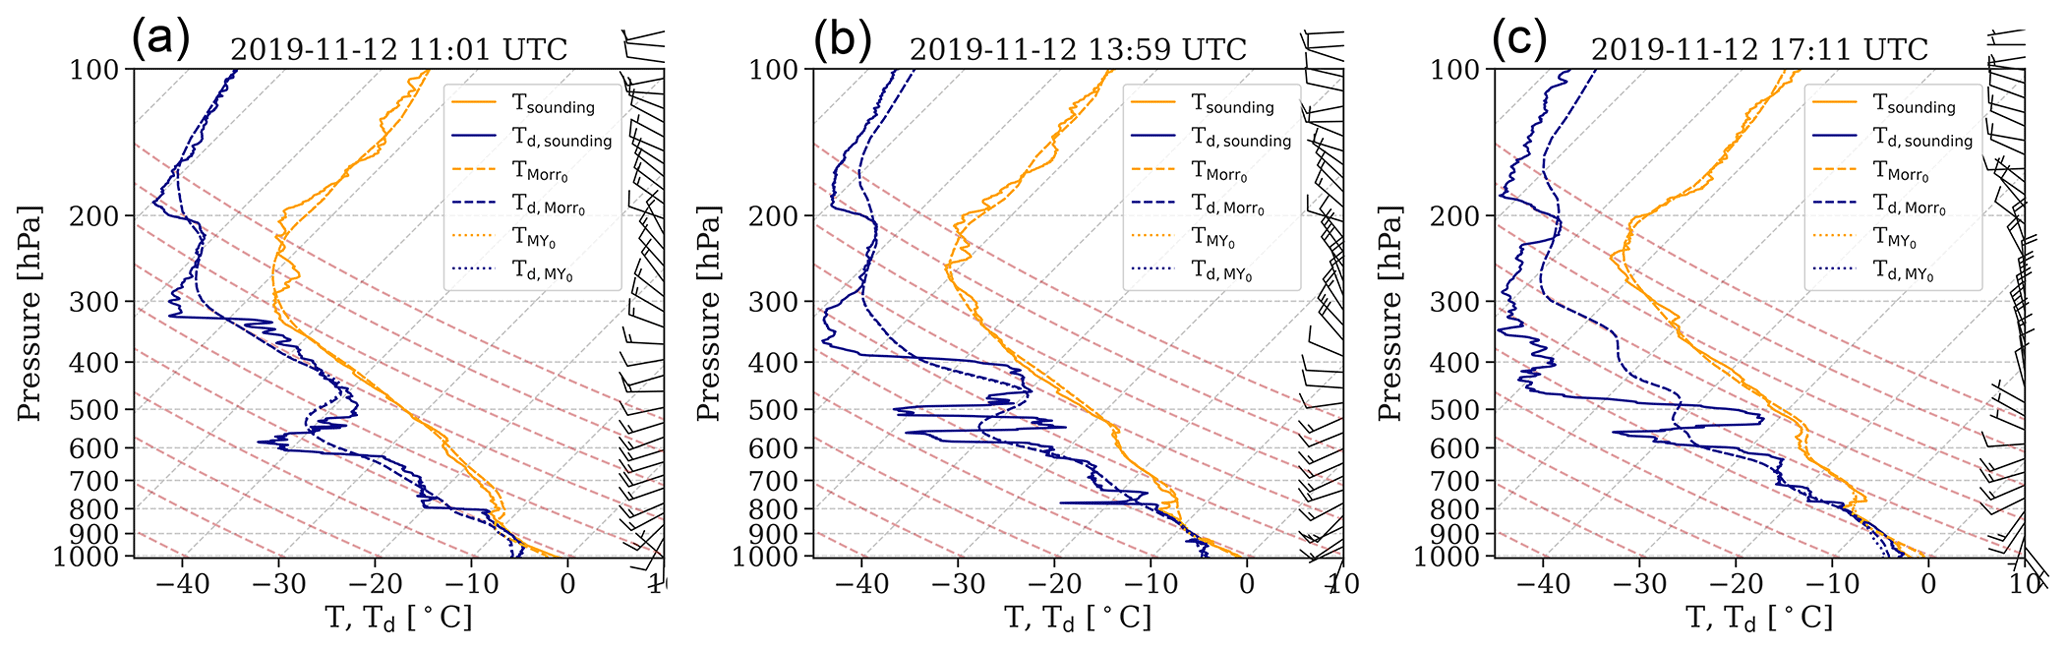
Figure 3Simulated and radiosonde profiles of temperature (orange) and dew point temperature (blue) over Ny-Ålesund: here the radiosoundings at (a) 11:00 UTC, (b) 14:00 UTC, and (c) 17:00 UTC (solid lines) are shown along with the simulations MYdef (dotted) and Morr0 (dashed) at the same times. During the majority of altitudes and times, the profiles for MYdef are not distinguishable, as its values are identical to those of Morr0. For illustration of the meteorological situation, we additionally show the wind barbs from the sounding observations.
3.2 Model–observation comparison methodology
Before comparing observed and simulated cloud properties, we test the model's ability to simulate the observed environment by comparing meteorological variables. For that, ambient and dew point temperature from the three radiosondes launched on 12 November are compared with the simulations at the closest grid point and time step. To then compare the observed and simulated hydrometeor concentrations, we take the model grid point that is closest to the location of HoloBalloon and average the simulated cloud properties over the given flight. To ensure that our results were robust, we also calculated these averages including a few neighboring grid points, but this did not alter the results (not shown). To match the data acquisition from HoloBalloon, we only distinguish between liquid and ice and sum up cloud and rain droplets into one liquid category (Pasquier et al., 2022a). Hence, the total LWC and CDNC always refer hereafter to the combined liquid category. Similarly, all ice particles are merged into one ice category characterized by total IWC and ICNC; these include ice crystals, snow, and graupel in the Morr and MY schemes, as well as hail in MY. When comparing LWC, IWC, CDNC, and ICNC with the values measured in situ, we bin the observational data into 100 m intervals between 0 and 800 m altitude centered around 50 m, 150 m, etc. The cloud extended to higher altitudes than the tethered balloon was able to reach; therefore, a direct comparison is limited to the part of the cloud below 800 m. Finally, we compare the simulated and observed precipitation accumulated over the 24 h of 12 November 2019, as well as downward longwave radiation at the surface. Total precipitation was measured using a single-fenced gauge, while the downward longwave radiation measurements were performed and provided by the French–German AWIPEV Research Base (Maturilli, 2019). As solid- and mixed-phase precipitation is known to be underestimated when using single-fenced gauges (Wolff et al., 2015; Kochendorfer et al., 2017; Nitu et al., 2018), we adjust for this undercatch. In a simple estimate, we add 24 % to the measured total precipitation, which is the average undercatch reported for single-Alter-shielded gauges by Kochendorfer et al. (2017).
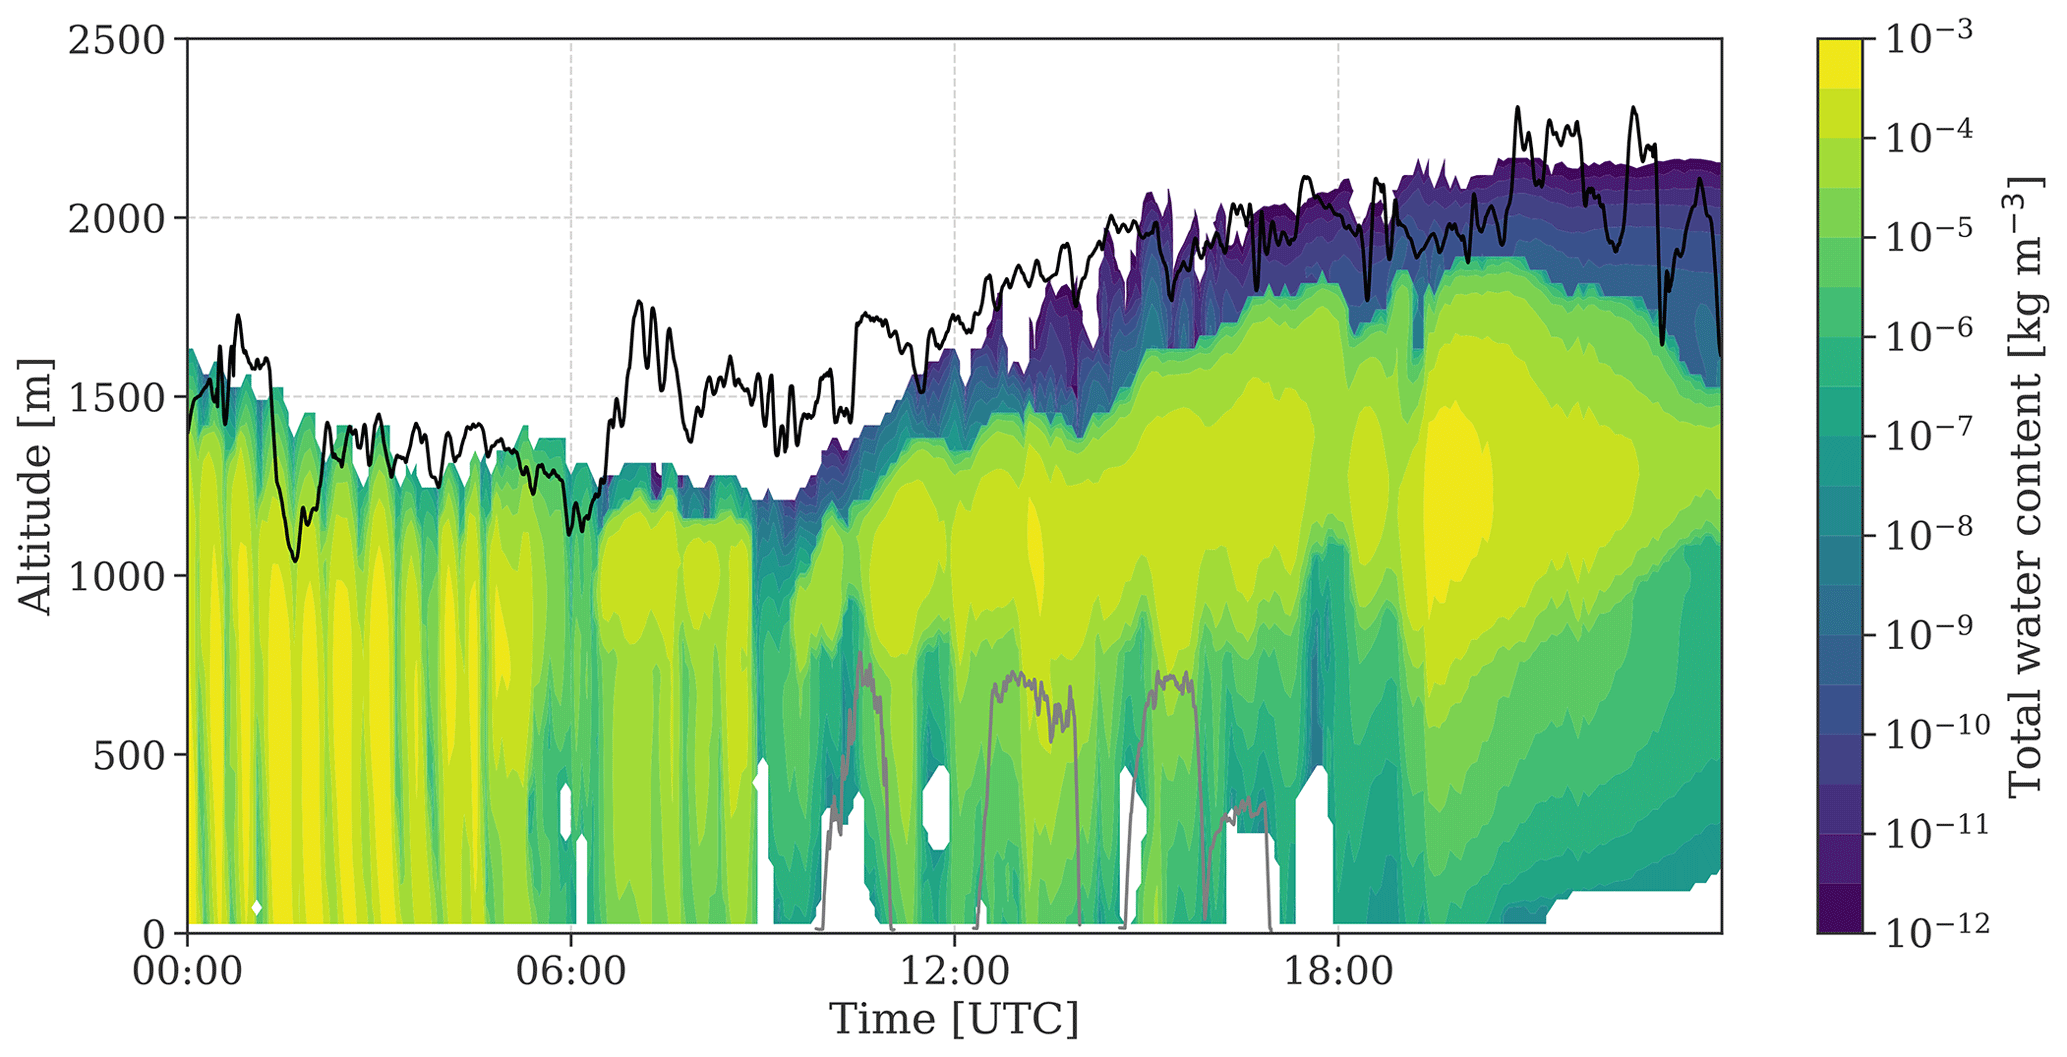
Figure 4Total water content on 12 November as modeled by the final simulation, Morr5. The macrophysical shape of the cloud agrees well with observations of radar reflectivity (see Pasquier et al., 2022b, Fig. 3c). The black lines show the observed cloud top as retrieved from radar measurements (Ebell et al., 2022), while the three flights performed by HoloBalloon are shown as grey lines.
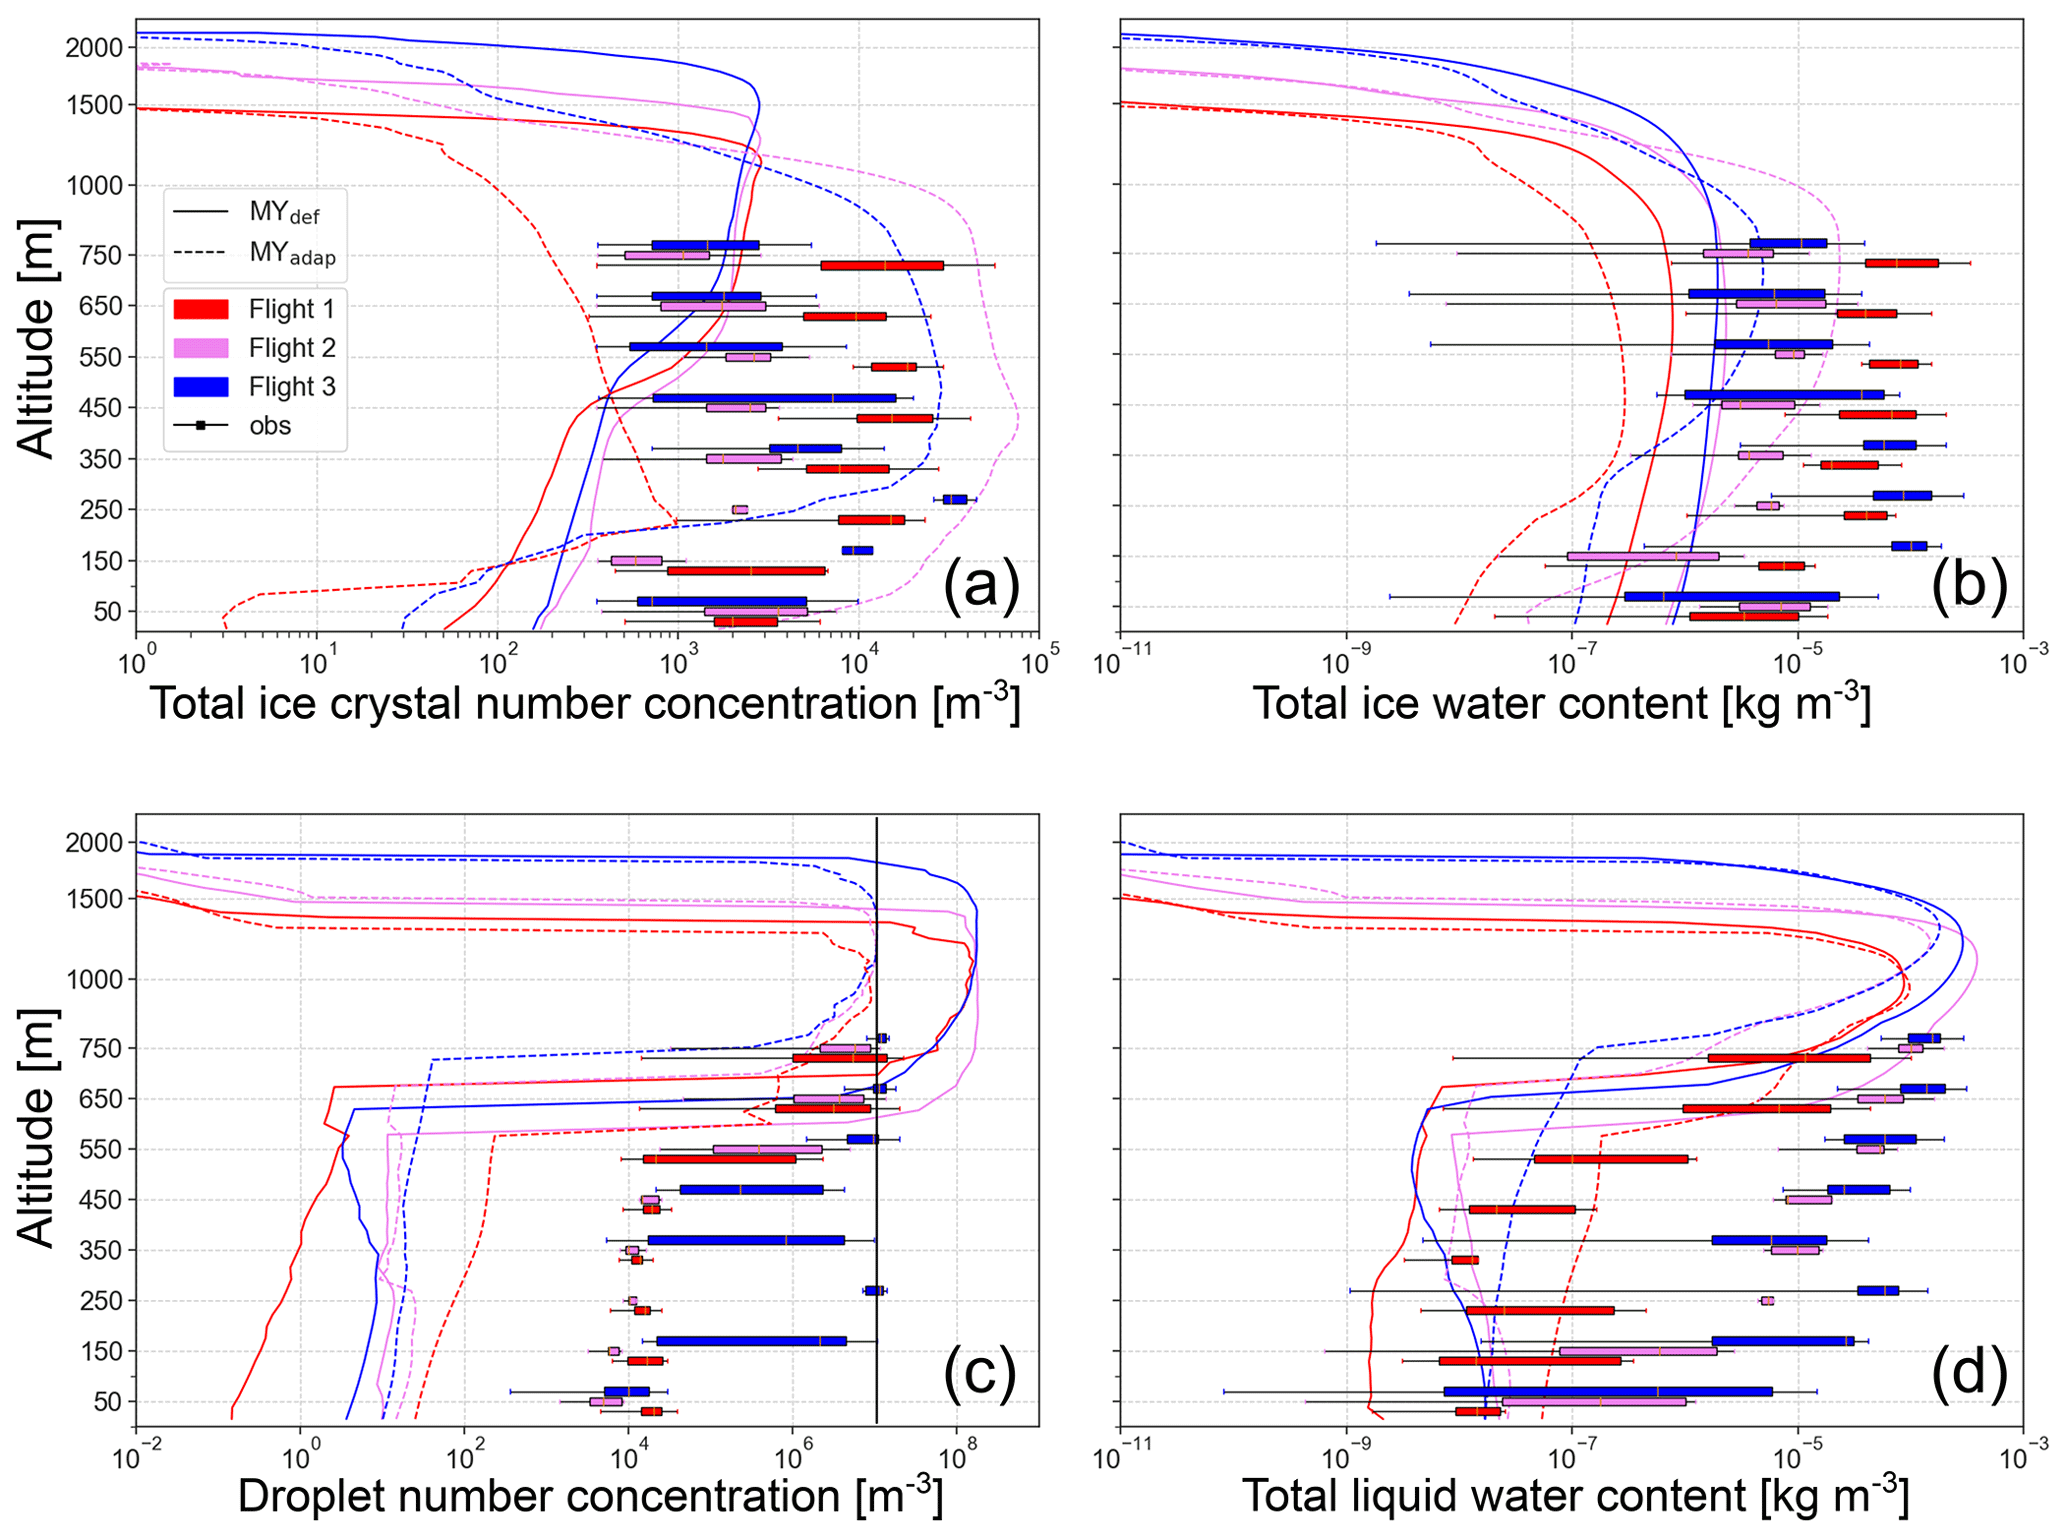
Figure 5(a) Total ICNC, (b) IWC, (c) CDNC, and (d) LWC on 12 November 2019 from the two simulations with the MY microphysics scheme. The different colors indicate the different balloon flights: flight 1 (10:00–11:00 UTC) in red, flight 2 (12:15–14:00 UTC) in violet, and flight 3 (14:45–17:00 UTC) in blue. The different line styles indicate different simulations (solid line for MYdef and dashed line for MYadap). The bar diagrams show observations put together in 100 m bins between 0 and 800 m altitude, centered around 50, 150 m, etc. Note that the y axis is linear from the surface up to 800 m and logarithmic above to highlight the region where measurements are available. The vertical black line in (c) illustrates the constant CDNC used in the Morr simulations.
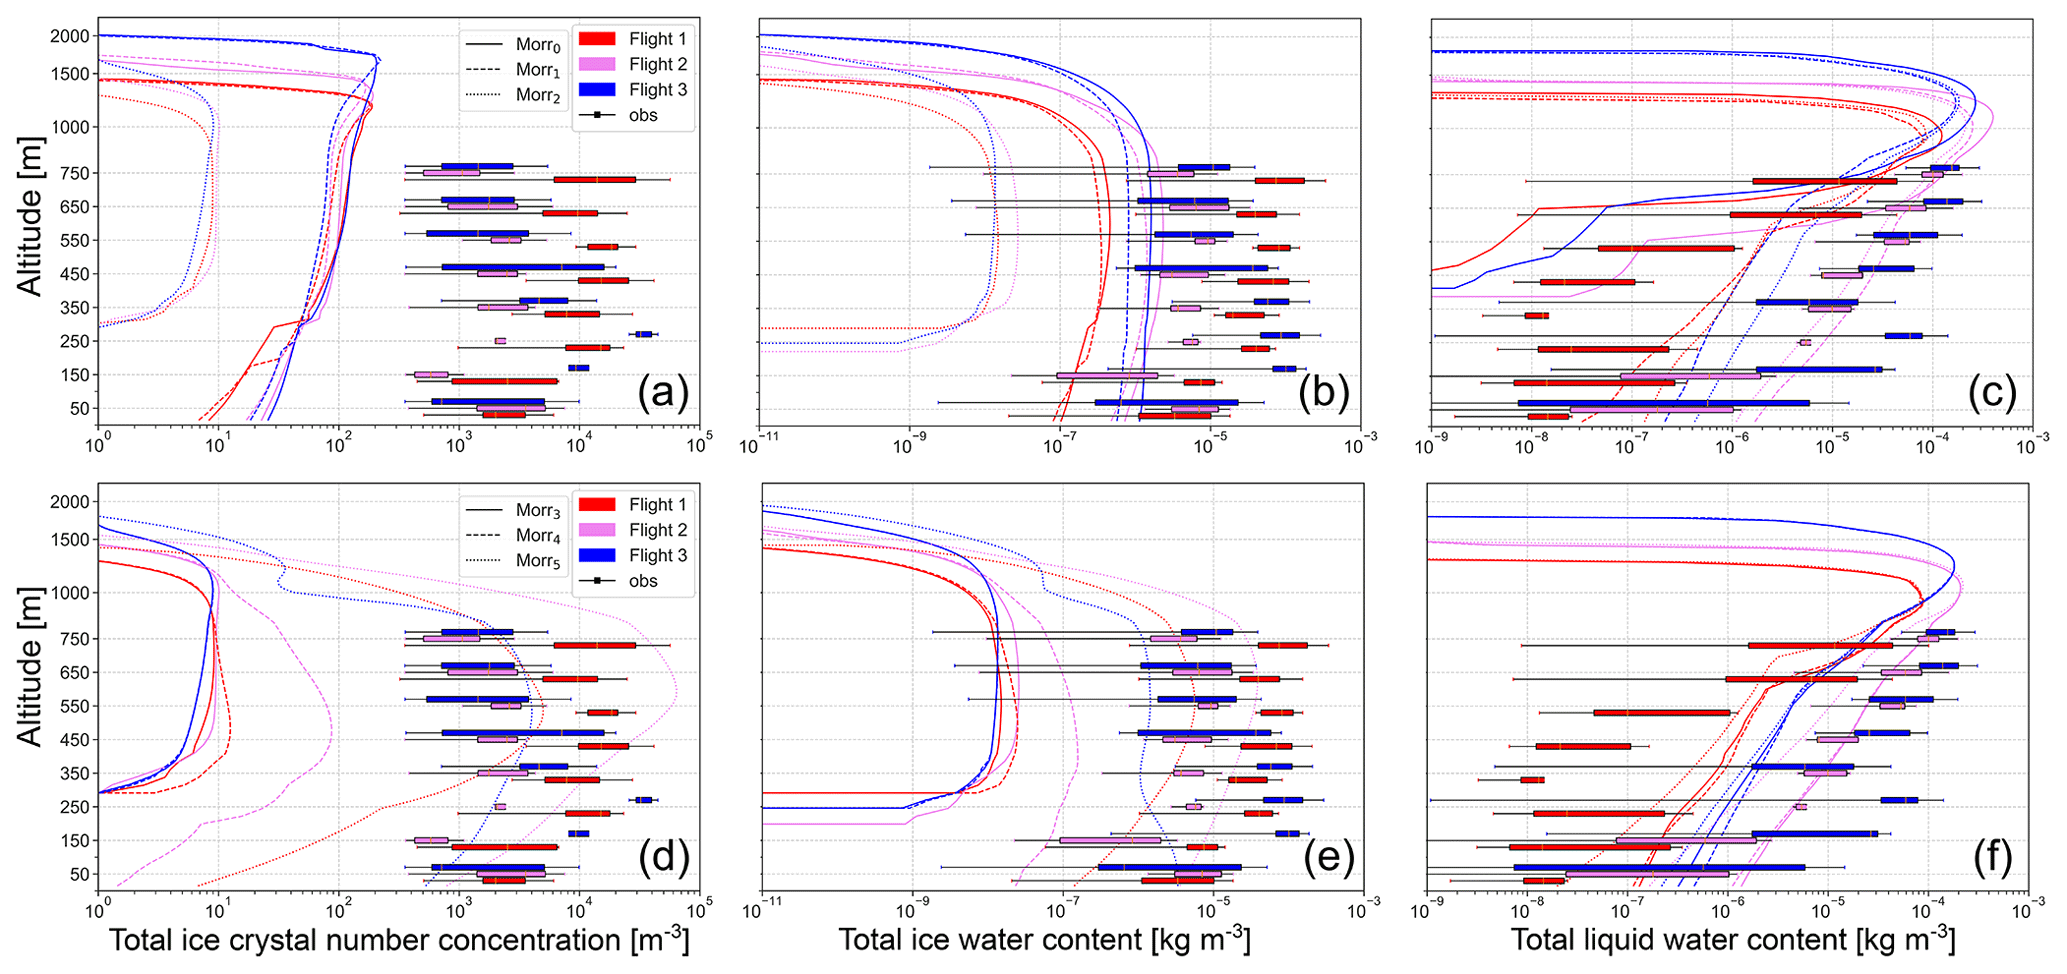
Figure 6Same as Fig. 5 but for the simulations with the Morrison microphysics scheme and without showing droplet number concentration as this was predefined in the Morr scheme. Panels (a–c) show the simulations Morr0–Morr2, while (d–f) show the simulations Morr3–Morr5. The three balloon flights are marked by different colors; the simulations are distinguishable by line style. The profiles from Morr2 (a–c, dotted line) and Morr3 (d–f, solid line) look identical.
Before comparing the influence of the various microphysical parameterization changes in the model, we verify the performance of the model nudging by comparing the simulated meteorological conditions with radiosonde observations (Fig. 3). It should be noted that the radiosonde observations are incorporated into the Global Telecommunication System and thus into ERA5 data, so no large differences should be expected. The simulated temperature profiles over Ny-Ålesund from the MYdef and Morr0 simulations match the 11:00, 14:00, and 17:00 UTC radiosonde temperatures very well (mean deviation of 0.76 °C for both MY and Morr; see Fig. 3). The simulations also capture the dew point temperature profile well (mean deviation of 2.56 °C for MY and 2.55 °C for Morr), especially at lower altitudes up to 750 hPa where the cloud was present during the simulations (0.97 °C mean deviation for MY, 0.90 °C for Morr). With the simulated meteorological conditions validated when using the two microphysics schemes, we now assess the simulated macrophysical structure of the cloud before comparing the results from the MY and Morr schemes against each other. Finally, we discuss the impact of the changes within the respective microphysics schemes.
4.1 Cloud macrophysics
Before diving into the analysis of microphysical cloud properties, we show that the simulations and radar observations of the macroscopic evolution of the cloud on 12 November agree well (Fig. 4). Throughout the day, the observed and simulated cloud tops rise from ca. 1300 m at 06:00 UTC to around 2000 m at 18:00 UTC. This is true for the simulations with both microphysics schemes, and relative to the increase in cloud top height throughout the day, variations in cloud top height between the different simulations are small (Figs. 5 and 6). This indicates that the changes in cloud microphysical properties discussed in subsequent sections are primarily caused by differences in the specific microphysics schemes and not by accompanying changes in cloud structure.
The simulated IWC and ICNC extend to higher altitudes than the LWC (and CDNC) during all flights, indicating an ice-topped mixed-phase cloud (liquid only below ca. 1300 m vs. ice until 1450 m during the first flight and ca. 1800 m vs. 2000 m during the third flight; see Figs. 5 and 6). This result is in agreement with the Cloudnet classification (available from the Cloudnet data portal) that also identifies the cloud as ice topped (Ebell et al., 2022). Previous observational studies have frequently observed liquid-topped mixed-phase clouds in the Arctic (de Boer et al., 2009; Morrison et al., 2012, e.g.,). Therefore, the ice at cloud top in this case study may be a result of local effects (e.g., orography) or of the synoptic situation.
4.2 Microphysics scheme intercomparison
In order to assess the influence of the MY and Morr schemes on the simulated cloud microphysics, we compare the results of the simulations using the two schemes in their default configurations (MYdef and Morr0, as described in Sect. 3.1). When compared with the HoloBalloon measurements, it becomes clear that the LWC is captured well by both simulations near the maximum flight altitude of HoloBalloon (see Figs. 5d and 6c). However, both MYdef and Morr0 are unable to reproduce the LWC below 650 m, except for MYdef during flight 1 (Figs. 5d and 6c), while MYdef also underestimates CDNC in this altitude region (Fig. 5c). Simultaneously, MYdef and Morr0 underestimate IWC, particularly during the first flight. While the IWC magnitude is wrong in the simulations, they both have an almost-constant value throughout the atmospheric layer considered, which is consistent with the observations. MYdef is in slightly better agreement with the observed ICNC than Morr0 is, but both simulations maintain too few ice crystals near the surface. This comparison suggests that relative to the observations, the ice crystal aggregation may be too efficient in the default schemes, MYdef and Morr0, as evidenced by the near-constant IWC and rapid decrease in ICNC towards the surface relative to the observations (Figs. 5a, b and 6a, b). The influence of constraining these two microphysical parametrizations with aerosol observations and the cause of these systematic biases in the default versions are discussed in the following sections.
4.3 Simulations using the Milbrandt and Yau microphysics scheme
As described in the previous section, MYdef struggles to maintain enough LWC and CDNC below 650 m (Fig. 5c and d). The underestimation of liquid at lower altitudes is not overcome when the CCNC is adapted to observed values in MYadap, but the representation is improved slightly, especially during flight 1. Meanwhile, agreement between observed and simulated LWC is good around 750 m (Fig. 5d). Additionally, taking the lowest part of the sounding comparison below 900 hPa into account (Fig. 3), this indicates that at least during parts of the day the simulated water vapor pressure is too low just above the surface. Thus, the lifting condensation level, where dew point and absolute temperature are equal, is located too high in the model, which is visible from the soundings at 11:00 and 17:00 UTC (Fig. 3a and c). Nonetheless, at 14:00 UTC there is no such discrepancy between simulated and observed dew point at the lowest altitudes (Fig. 3b).
Compared to the CDNC and LWC, variations in the ICNC and IWC are much larger between the two simulations. In MYadap, the ICNC increases from MYdef and even surpasses the observed ICNC (Fig. 5a). This is quite surprising, as the INPC is significantly reduced in MYadap relative to MYdef. Upon further investigation, we find that the majority of the ICNC (and IWC) in MYadap is comprised of graupel (see Fig. B1), which is similar to the simulation in Pasquier et al. (2022a) but was not present in the observations. To determine the major cause for this increase in graupel concentrations between MYdef and MYadap, we systematically performed simulations with only certain changes included during each and found that the change in CCNC during updrafts is the determining factor for the increase in graupel amount. We therefore conclude that the CCNC changes lead to changes in the cloud droplet size distribution that make riming more efficient. In a simulation where all adaptions given in Table 1 are included except the CCNC during updrafts, which is kept parameterized following Cohard and Pinty (2000), the ICNC decreases and is lower than in MYdef, consistent with what we expected from lowering INP concentrations. In that case, the ICNC was 2 to 3 orders of magnitude lower than observed and not dominated by graupel (Fig. B2). These results show that MYdef simulated the observed ICNC reasonably well but for the wrong reasons, i.e., because of higher CCNC and INPC than were observed. Instead, we expect SIP to be the missing process needed to simulate the cloud microphysical properties correctly and for the right reasons. Before conducting an assessment of the effectiveness of SIP in the next section using the Morr scheme, we elaborate on the relevance of looking at the differences between flights as well as at agreement between simulated and observed precipitation and radiation.
Both the observations and simulations show variations in hydrometeor concentrations between flights representing different environmental conditions throughout the day. This increases the credibility of the study's results even though the scope is limited to one day. The inter-flight spread in MYadap, however, reveals that this simulation does not correctly capture the changes in ICNC, IWC, and LWC between flight 1 and the subsequent flights.
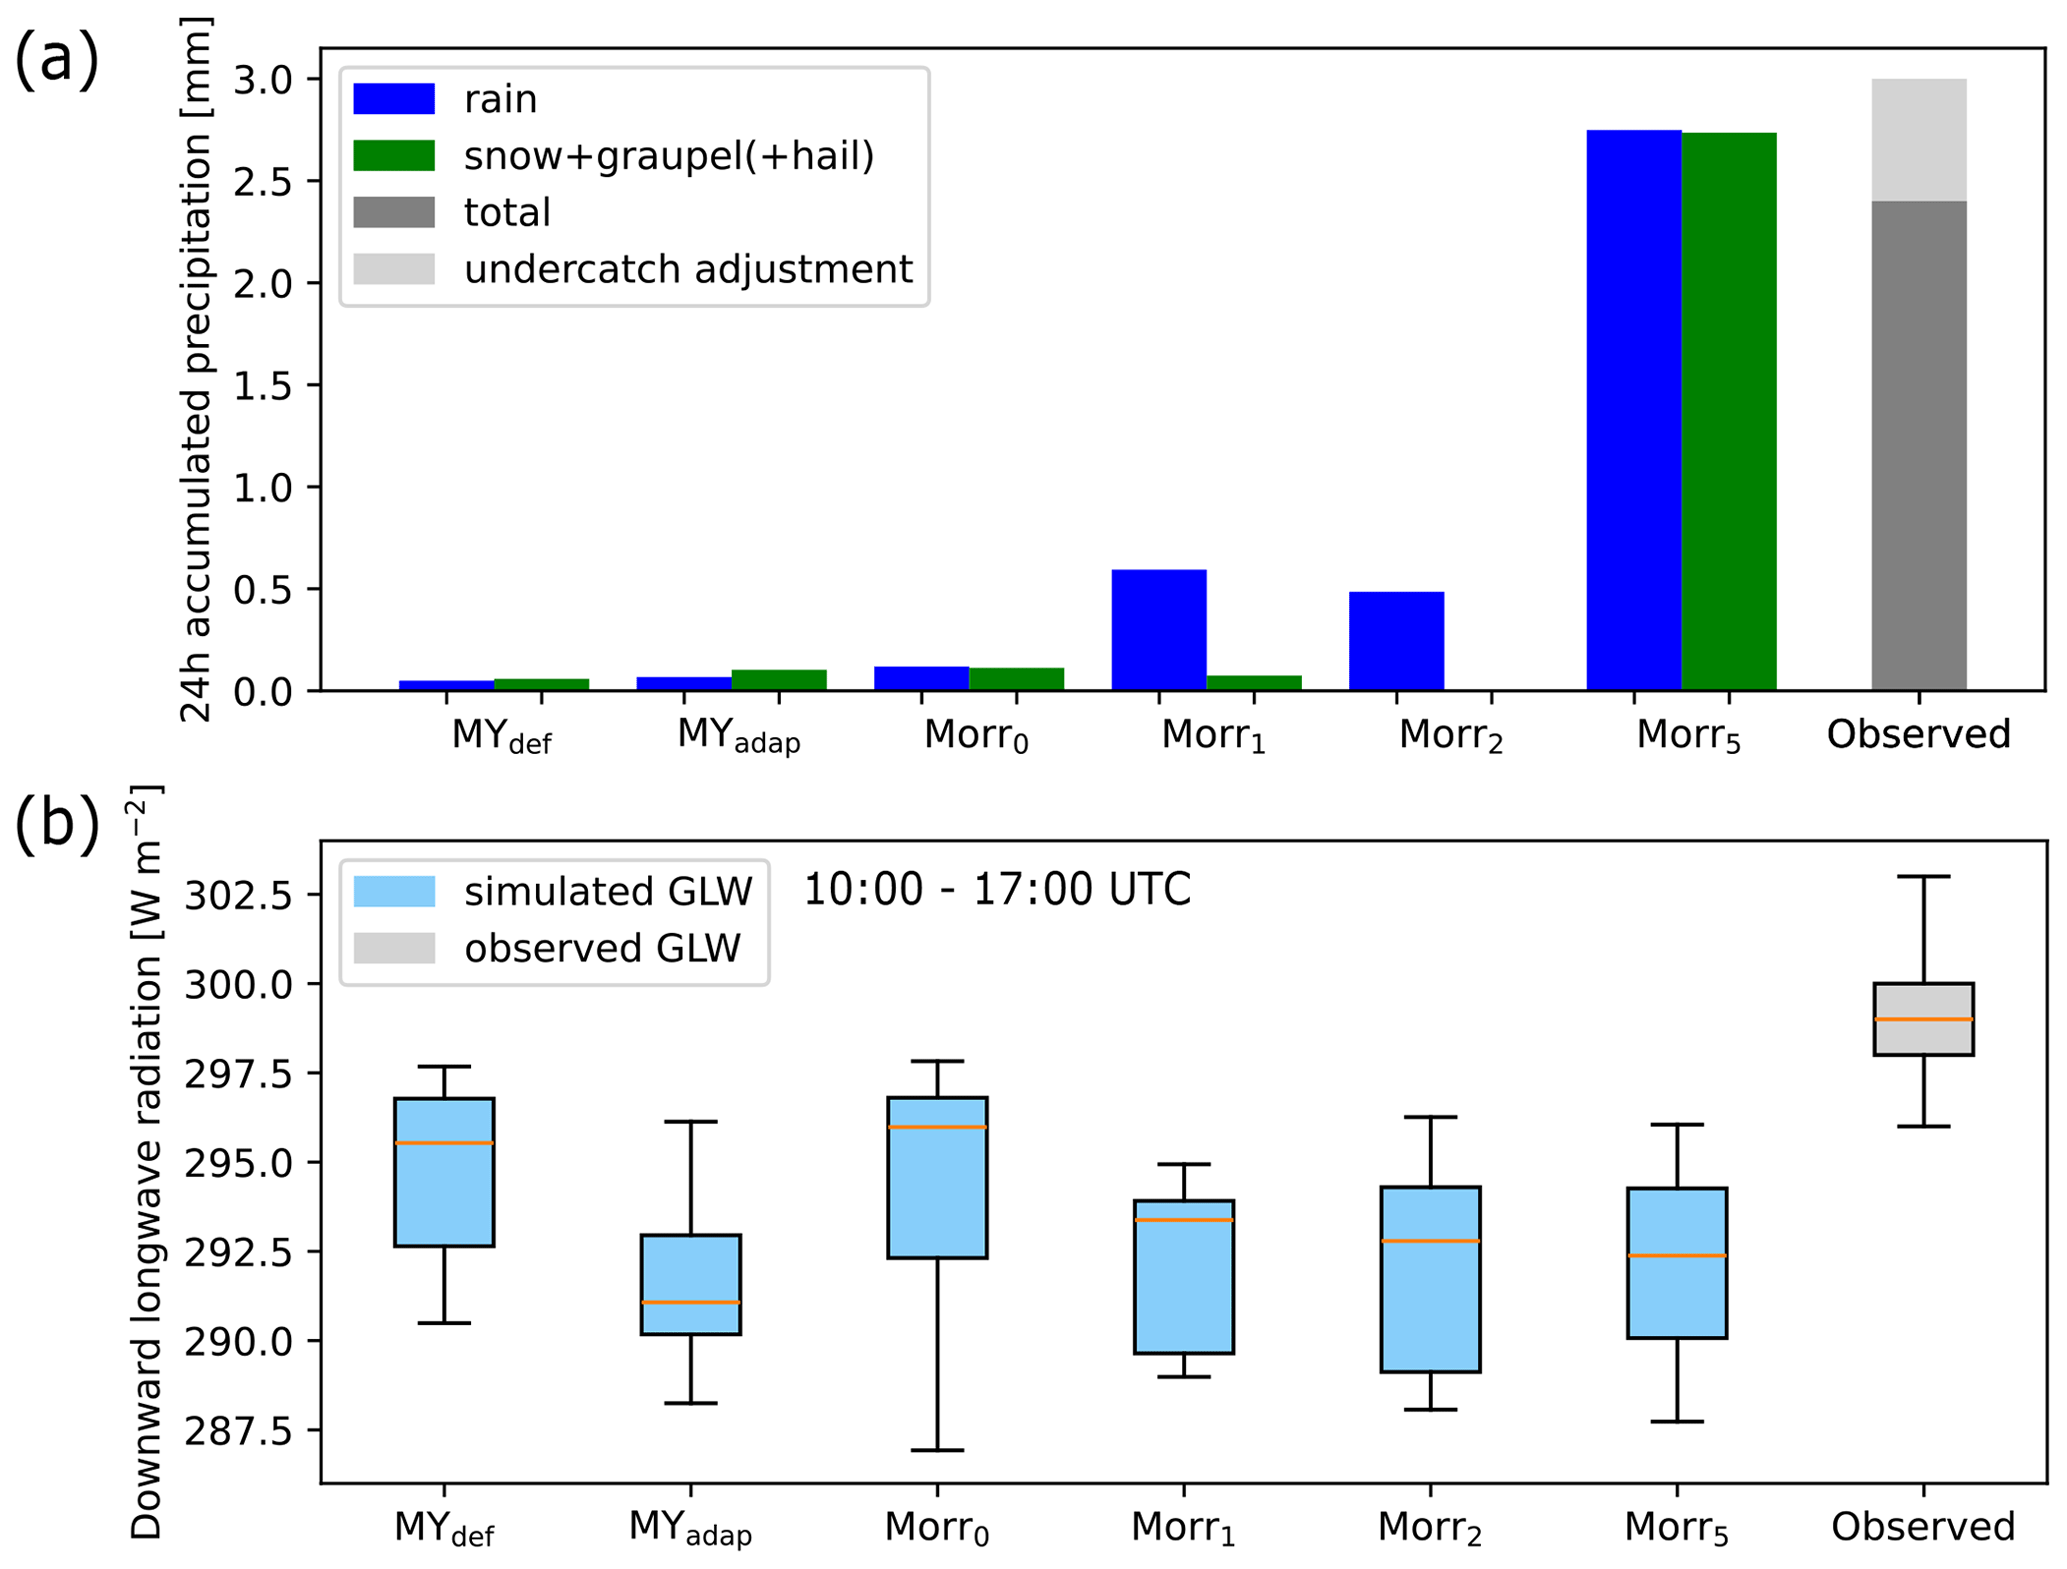
Figure 7(a) Accumulated precipitation on 12 November (24 h) divided into liquid (blue) and frozen (green) fractions and (b) downward longwave radiation at the surface (GLW) between 10:00 and 17:00 UTC. Values are shown for the two simulations with the MY scheme, MYdef and MYadap; selected simulations with the Morr scheme; and observations (total precipitation shown in grey). As the observed precipitation was measured using a single-fenced gauge, there is likely an undercatch in the amount. Here, we adjust for that by adding 24 % following Kochendorfer et al. (2017, see Sect. 3.2). In the radiation panel (b), the orange lines illustrate the median, the boxes extend from the first to the third quartile of the data, and the whisker endpoints mark the farthest point inside 1.5 times the interquartile range from the box. The observed GLW was measured from the French–German AWIPEV Research Base (Maturilli, 2019).
In addition to hydrometeor profiles, we assess the precipitation that accumulated over 24 h. The lack of simulated CDNC near the surface and the stronger reduction in ICNC and IWC towards the surface compared to the observations lead to a strong underestimation of precipitation in both simulations (Fig. 7a).
Downward longwave radiation at the surface during the balloon flight times (10:00–17:00 UTC) is lower than observations in both simulations and lower in MYadap than in MYdef (Fig. 7b). The overall underestimation of downward longwave radiation may be explained by a stronger simulated reduction in cloud water content towards the surface and thus a higher and colder cloud base on average, but the detailed explanation remains uncertain.
Overall, our results show that the simulations with the MY scheme struggle to represent observed precipitation and observed CDNC and LWC at lower altitudes. Even though simulated ICNC and IWC agree better with observations, this is due to a higher CCNC and INPC than observed in MYdef and due to graupel production simulated too high in MYadap, whereas we expect a strong SIP to be the missing element.
4.4 Simulations using the Morrison microphysics scheme
In this section, we show the results from six simulations with the Morr scheme starting with the default version, Morr0. Regarding ICNC, the maximum simulated value in Morr0 is around 200 m−3 and thus, depending on flight number and altitude, at least 1 order of magnitude below the observations (Fig. 6a). Also, the liquid part of the cloud has a base at ca. 400 m, in contrast to the observations that measured liquid hydrometeors all the way to the surface (see Fig. 6c). This disagreement in LWC towards the surface is fixed by adapting the CDNC to the observed value of 9 cm−3 as was done in the Morr1 simulation, which apart from the updated CDNC has the same settings as Morr0. The reduced CDNC also results in an increase in the liquid precipitation simulated, from 0.12 mm in Morr0 to 0.59 mm in Morr1, during 24 h on 12 November (Fig. 7a). This can be explained by fewer and larger droplets that are more rapidly converted to rain and fall out. However, it is important to note that in both Morr0 and Morr1, the majority of the precipitation is simulated during the early morning hours of 12 November and not during daytime when the balloon flights took place (not shown). Meanwhile, as expected, the IWC and ICNC are not impacted and remain on the same order of magnitude as in Morr0. Adapting the CDNC to the observed value results in a slight decrease in snowfall but not by as much as the rainfall increases, leading to an increase in total precipitation (Fig. 7a).
When adapting the primary ice production via the INP concentration fit retrieved from the campaign measurements (as described in Sect. 3.1) in Morr2, the total ICNC and IWC decrease substantially, as expected. Ice (number and mass) no longer reaches the surface, and even above ca. 300 m the ICNC and IWC decrease by approximately 1 and 2 orders of magnitude, respectively. This results in the suppression of the simulated snowfall at the surface but also in a slight decrease in the total accumulated precipitation, to 0.48 mm (Fig. 7a).
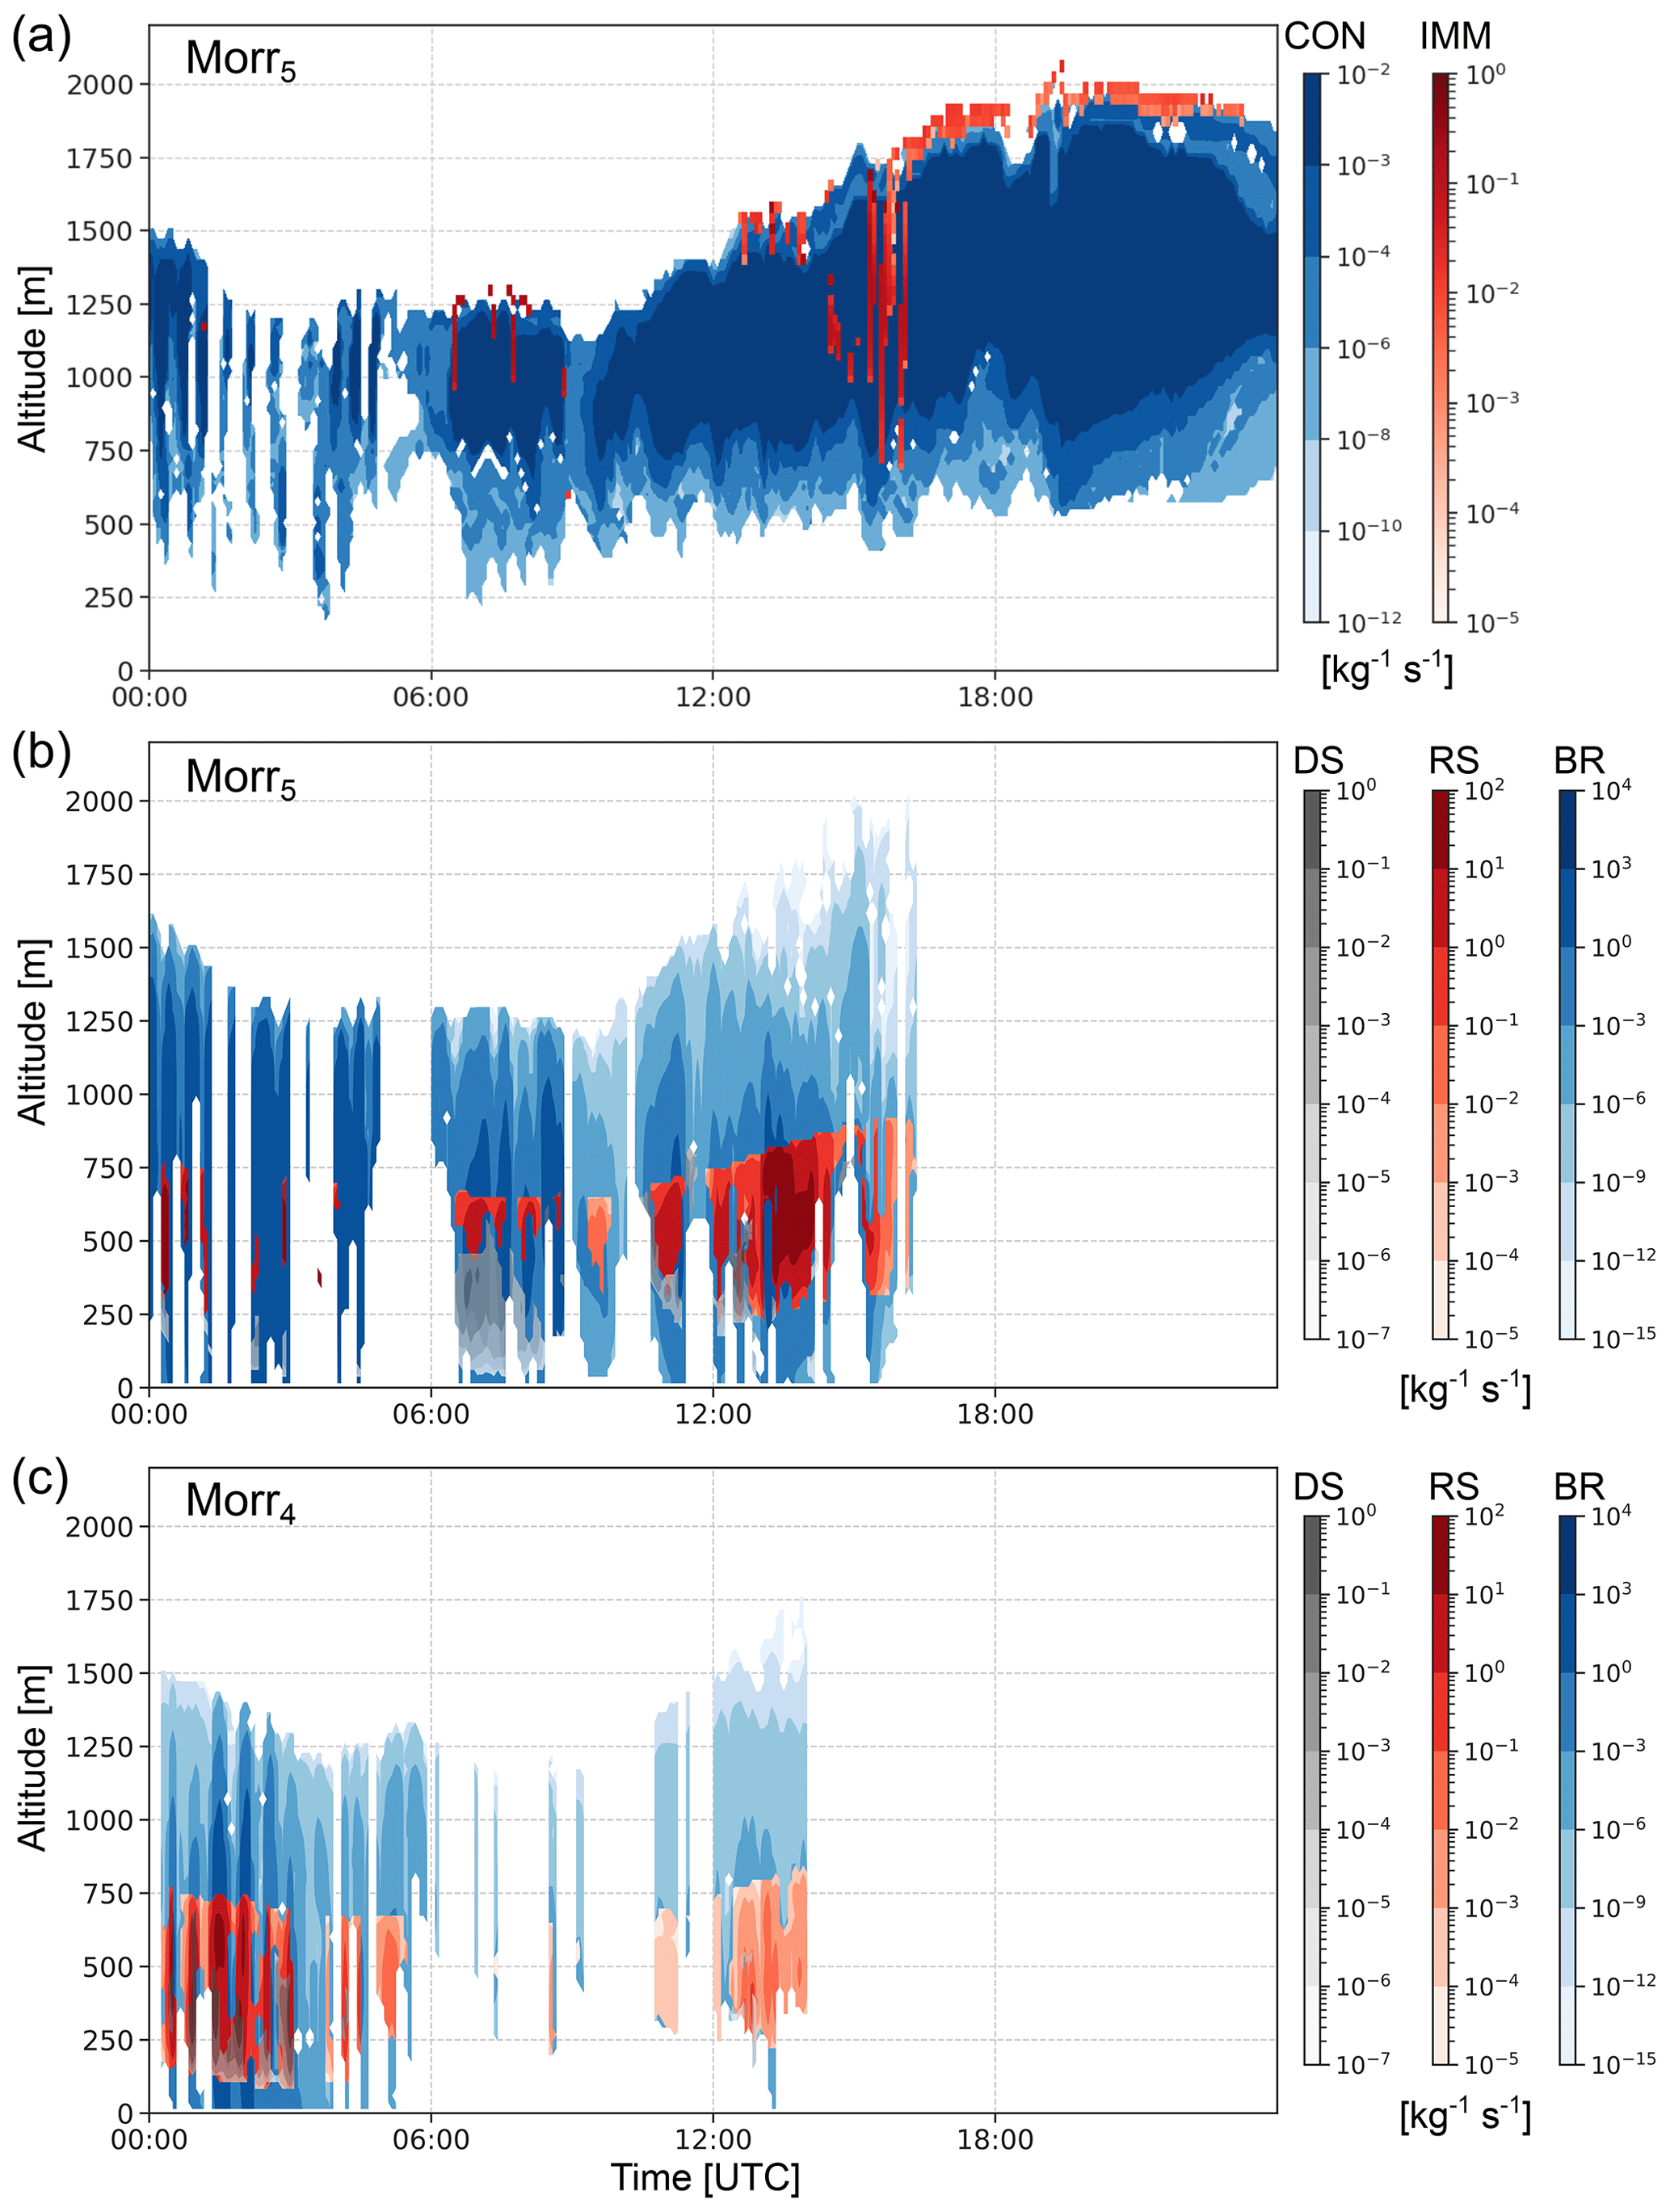
Figure 8Ice crystal number concentration tendencies of (a) contact freezing (CON; in blue) and immersion freezing (IMM; on top in red) and (b, c) collisional breakup (BR; in blue), rime splintering (RS; on top in red), and droplet shattering (DS; on top in grey). DS is shown partly transparent to visualize the fact that BR is generally active simultaneously. Panels (a) and (b) show the Morr5 simulation, while panel (c) shows the SIP tendencies for the Morr4 simulation.
We expect that the decrease in ICNC from modifying heterogeneous nucleation will be counteracted by increasing SIP in Morr3 following Sotiropoulou et al. (2021) and Georgakaki et al. (2022). However, this does not reduce the large discrepancy between the simulated and observed ICNC, and the results of Morr3 are in fact very similar to those of Morr2 (Fig. 6a and d). To understand why implementing SIP in the simulation does not lead to substantial differences between Morr2 and Morr3, we examined the process tendencies from the model output in Morr3 (similar to Fig. 8 where this is shown for Morr4 and Morr5). This allows us to quantify the contribution of the different processes, i.e., primary and secondary ice production processes, to the number of ice crystals formed.
In Morr3 as well as in the following simulations, we see that immersion freezing is mainly active at cloud top where the coldest temperatures occur, while contact freezing dominates inside the cloud (shown for Morr5 in Fig. 8a). Meanwhile, in terms of SIP, RS did not occur in Morr3 over Ny-Ålesund, even though a large portion of the cloud was within the RS temperature range and riming was occurring. BR occurred occasionally in Morr3 but produced fewer ice crystals than primary ice production, and DS occurred only sporadically but did not yield a substantial contribution to ice production (not shown).
Even though additional processes were implemented in Morr3, they did not increase the ICNC compared to Morr2, and the simulated ICNC still differed from the observations, as evidence of SIP was observed by HoloBalloon (Pasquier et al., 2022b). To investigate this discrepancy, we first adapted the required mixing ratio thresholds for RS to occur and then increased the number of splinters produced during RS in the following section (Sect. 4.5).
4.5 Role of secondary ice
Contrary to our expectations, activating the SIP processes added to the Morr scheme by Sotiropoulou et al. (2021) did not immediately increase the ICNC. To investigate this surprising finding, we first lowered the thresholds required for RS to occur. Specifically, we set the cloud liquid/rainwater and snow/graupel water mixing ratio thresholds to 10−8 and 10−6 kg kg−1, respectively (see Table 3). The impact of lowering these thresholds is investigated in Morr4 and results in a flight-dependent change in the ICNC. Because graupel concentrations were negligible compared to snow in simulations with the Morr scheme, we focus on splintering events involving snow. Then, for RS to be able to occur in the model at a given time and altitude, the temperature must be within the given range (−8 °C °C), the snow water mixing ratio threshold must be overcome and, either the cloud liquid mixing ratio threshold or the rainwater mixing ratio threshold must be overcome. The altitude regions and flights in which the individual conditions and the joint condition are fulfilled are given in Table C1. This overview explains the differences in the simulated impact of the RS process during different flights well. We find that the simulated snow water mixing ratio and the temperature are most influential in defining the RS active region, whereas the liquid water mixing ratio thresholds do not substantially limit the region further. As a result, during flights 1 and 2, the simulated ICNC increases by a factor of up to 2 and up to 10, respectively, while during flight 3 hardly any change in ICNC is simulated (see Fig. 6d, simulations Morr3 and Morr4). The latter is because the simulated snow water mixing ratio does not overcome the threshold at any altitude during the third flight. It should be noted that this is in contradiction to the observations, as HOLIMO measured the most SIP during flight 3. Along with RS, BR also became active during flights 1 and 2. Meanwhile, Morr4 only showed a very minor contribution to the increase in ICNC from DS, and only during flight 2 (Fig. 8c). We discuss the relative importance of the different SIP mechanisms after presenting the results of the last adaption made in the scheme regarding the number of splinters produced during RS.
Previous studies have shown that the efficiency of the RS process increases in the presence of large cloud droplets (e.g., Mossop, 1978). As relatively large cloud droplets were observed during this case (Pasquier et al., 2022b, a), here we assess the impact of increasing the number of splinters produced by the RS process by a factor of 20 in the Morr5 simulation (see Sect. 3.1). We justify this step by considering that cloud droplets in Arctic pristine conditions may be larger and may lead to more splinters.
Even though the mixing ratio thresholds are not modified between Morr4 and Morr5, increasing the number of splinters generated influences the total ICNC during all flights. This increase in ICNC leads to a subsequent increase in BR, which in combination with the initial increase in ICNC from RS leads to a total increase in ICNC by up to 3 orders of magnitude, with BR making up a large share of that increase (Fig. 8b). This effectively leads to a “cascading” process of ice production, as was observed in field observations (Lawson et al., 2015; Pasquier et al., 2022b).
When comparing the observed and simulated SIP mechanisms, the observations indicate a more prominent contribution of SIP from DS (Pasquier et al., 2022a). In contrast, Morr5 simulates that DS is not a determining factor in the increase in ICNC and is only active at altitudes below 500 m/near cloud base (Fig. 8b). However, as the in situ observations were made near cloud base, the fact that Morr5 also simulates a contribution from DS in this region indicates that even though the model underestimates the contribution from DS, it is simulating it in the correct place. Additionally, it should be noted that near cloud base, where DS was observed and simulated, the temperatures were within the RS range. This, in combination with the observed frozen/fragmented droplets and rimed columns/lollipop ice (Pasquier et al., 2022a), makes it difficult to disentangle the true contributions of RS and DS from the measurements.
Nevertheless, our result which showed that DS had a minor effect on the simulated ICNC is in agreement with the modeling study of wintertime alpine mixed-phase clouds by Georgakaki et al. (2022), which was conducted with the same modified Morrison microphysics scheme in WRF. This suggests a bias toward low DS activity in this scheme. As a possible key to alter this bias, two studies using the Morr microphysics scheme in global models suggest that if a different size representation (i.e., a bin representation for the radius instead of a bulk representation of the particle mass) is used for cloud droplets during the treatment of DS, the magnitude of DS increases (Zhao et al., 2021; Sotiropoulou et al., 2024).
BR played the largest role in increasing ICNC, not only in our case but also in those of Georgakaki et al. (2022) and Sotiropoulou et al. (2021). However, Georgakaki et al. (2022) found that in their case ice crystals falling from above were important in initiating BR, which was not the case here. Sotiropoulou et al. (2021) also found that even with RS completely deactivated, BR alone was able to represent the observed ICNCs in Antarctic summer clouds. At the same time, they admit that primary ice production might have been overestimated in their setup.
In our simulations with constrained CCNC and INPC and thus a more realistic representation of primary ice production, we chose to reduce the thresholds for RS instead of removing them, as Sotiropoulou et al. (2021) hypothesized that removing all mass thresholds for RS overestimated RS. As previously stated, when the number of splinters is also increased relative to the default parametrization, our simulation results match the observed ICNC very well (Fig. 6d). This result is in accordance with Young et al. (2019), who also found the best agreement between model and observations when removing the RS liquid mixing ratio threshold and when making RS 10 times more efficient in Arctic clouds. This may be due to the high concentration of large droplets observed in this case and typically found in the Arctic. When comparing the patterns in spatial and temporal extent of the SIP active regions for BR, RS, and DS (Fig. 8b and c), it becomes clear that the higher number of splinters from RS in Morr5 also strongly affects the activity of BR and DS. For example, during flight 3 where RS was not simulated in Morr4 (Fig. 8c), SIP still became active enough to represent the observed ICNC in Morr5 after increasing the number of splinters produced (Fig. 6f, dotted blue line). Overall, the activity of RS, BR, and DS in time changes, e.g., due to the advection of ice particles between grid boxes, and a higher ICNC is maintained, again favoring more SIP in turn. Finally, our results show that in situations with constrained CCNC and INPC, maintaining some thresholds for RS works well when the number of splinters is also increased relative to the default parametrization.
As for the MY simulations, we assess the accumulated precipitation over 24 h, and here, we find a clear improvement in the representation in Morr5, especially of solid precipitation (Fig. 7a). While highly underestimated in Morr0, now total precipitation is even overestimated, likely due to an amount of supercooled drizzle that is too high. However, the phase assessment of precipitation from observations is uncertain and of a qualitative type only, as it is based on the notes of the campaign crew, which do not cover the whole 24 h period. Looking at the downward longwave radiation during the flights, the variations in the median are small between the simulations Morr1, Morr2, and Morr5, which all show lower values than Morr0 (Fig. 7b). This hints at the fact that the CDNC modification is influencing the radiation the most in our case. However, the reason for the underestimation compared to observations remains unclear.
Overall, Morr5 clearly represents the best match with observations of ICNC and IWC, even though the relative importance of BR and DS does not necessarily reflect the observations. It should also be noted that contact freezing is still active in this simulation. Assuming that this process is not as important in nature as was simulated, the strength of SIP would need to be increased further. Morr5 is the only simulation that produces as high of an ICNC as was observed, and it still represents LWC well and better than the default Morr scheme (Morr0). In addition, it performs best in simulating enough precipitation. The combination of implemented and enhanced SIP processes is able to reproduce the observed ICNC and IWC during all flights, although the environmental conditions and the amount of IWC produced through primary ice production vary. Therefore, we consider Morr5 a successful attempt to represent an Arctic mixed-phase cloud with a realistic distribution of primary and secondary ice production.
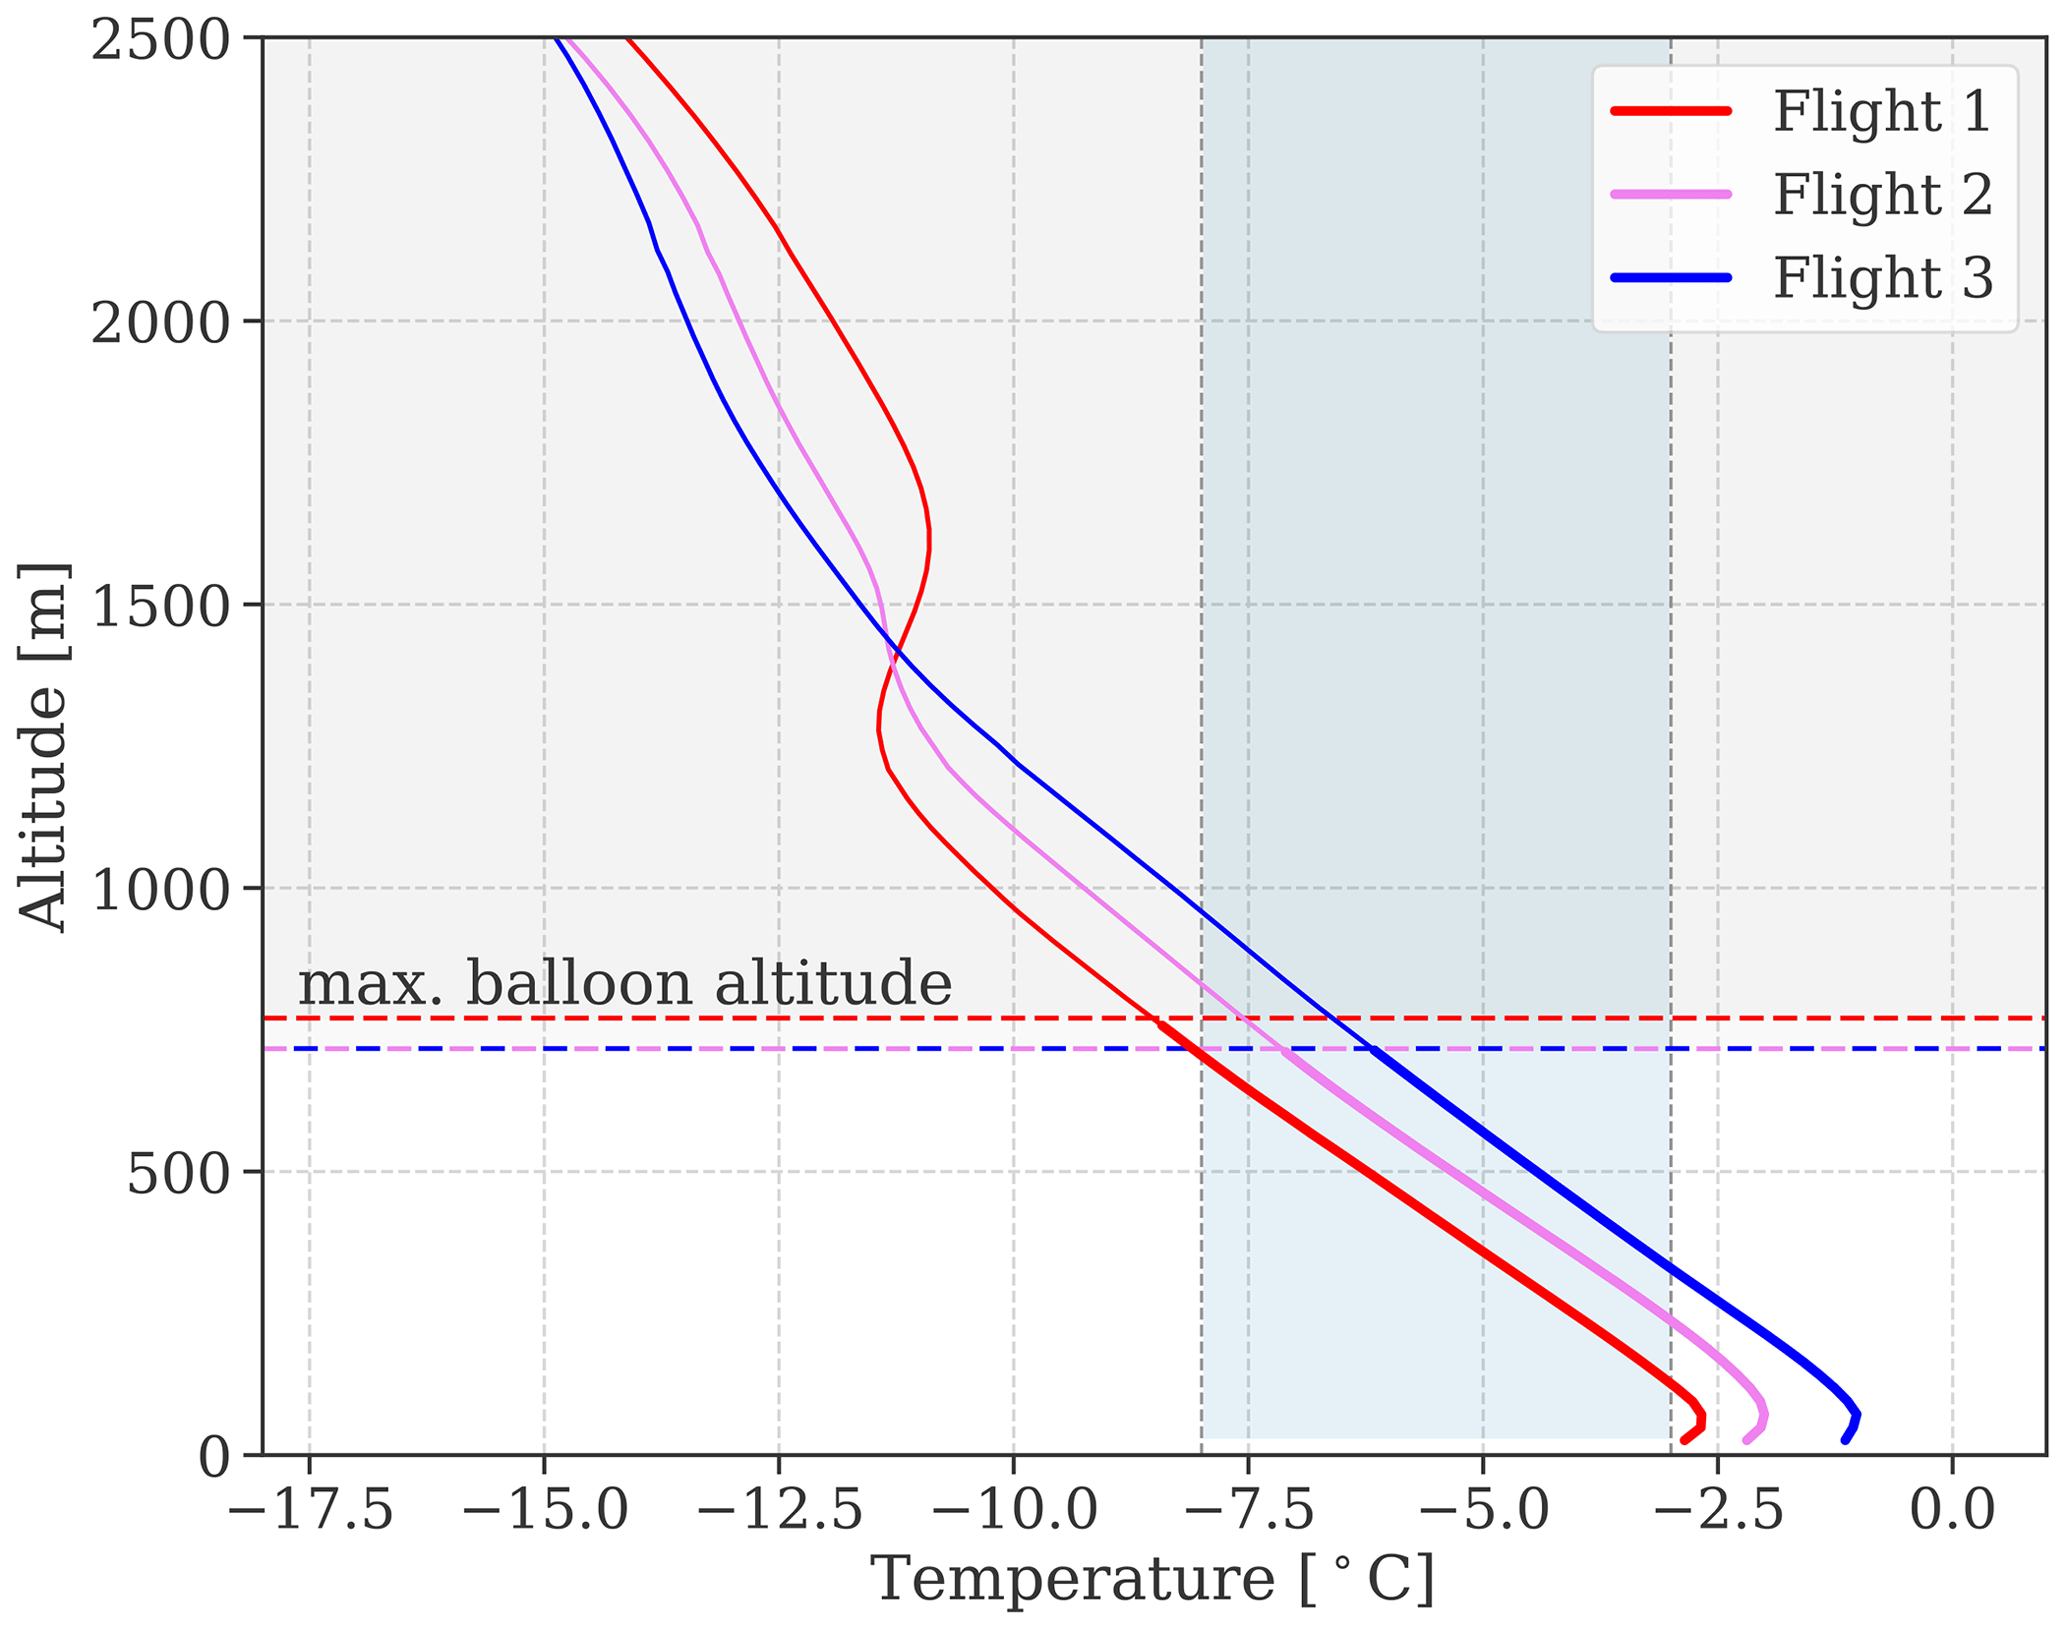
Figure 9Temperature profiles from the model simulations averaged over the three flight times on 12 November. Here, the profiles from simulation Morr4 are shown, but the choice of simulation does not play a role as the profiles do not vary across simulations. Temperatures below −38 °C, i.e., suitable for homogeneous freezing, are reached above ca. 6300 m (not shown). The vertical dashed lines and shading indicate the temperature range where rime splintering is permitted (−8 to −3 °C), while the colored horizontal dashed lines indicate the maximum flight altitudes.
This study shows that generalized out-of-the-box cloud microphysics schemes, i.e., MY and Morr, fail to correctly represent the vertical structure of ice and liquid water content of Arctic mixed-phase clouds. While these schemes do reproduce the observed maximum values reasonably well, we find that this occurs for the wrong reasons due to compensating errors. In the default schemes, the number of aerosols available for nucleating cloud particles is often unrealistically high for Arctic conditions, and the overly efficient primary ice production compensates for the lack of secondary ice production. As shown here, in the pristine Arctic environment of Ny-Ålesund, Svalbard, the low-level mixed-phase cloud observed on 12 November 2019 is well represented in the WRF model by the default MY and Morr schemes in terms of macrophysical shape and water content, but the ICNC and the amount of precipitation from the cloud are underestimated. When the concentrations of aerosols suitable to nucleate cloud particles are adapted to observed values in the MY scheme, the ICNC increases but is dominated by graupel, which was not observed but was already pointed out in Pasquier et al. (2022a). This increase in graupel is caused by the lowered CCNC during updrafts, indicating that the MY scheme fails to represent ice production accurately in environments with very low CCNC. Meanwhile, the underestimation of liquid water towards the surface and of precipitation is not altered when aerosol concentrations are changed. In the Morr scheme, however, the simulation matches the observed ICNC and precipitation well: when the concentrations of cloud nucleating aerosols are adapted to observed values, rime splintering is made more efficient, and further secondary ice processes are added. As the simulated primary ice production includes contact freezing, which is not observationally constrained and is generally thought to be of limited importance, it must be considered an upper bound for the plausible primary ICNC contribution in this case. If we instead assume that contact freezing was significantly less important in our case than was assumed in the simulations, or even not active at all, the already greatly enhanced secondary ice production would have to be even further enhanced in order for agreement between simulated and observed ICNC to be achieved.
The lack of modeled secondary ice production in the default Morr scheme is due to both missing processes (in our case mainly collisional breakup) and snow, cloud liquid, and rainwater mixing ratio thresholds that are too high for rime splintering to occur. Based on the earlier studies by Atlas et al. (2020, 2022); Sotiropoulou et al. (2021, 2020) and the finding in our case that the snow, cloud liquid, and rainwater mixing ratios never reached the thresholds required for rime splintering to happen in the default scheme, we recommend lowering these mixing ratio thresholds. The fact that the occurrence of rime splintering was needed in order to activate further SIP processes and ultimately represent observed ICNC further supports this recommendation. Otherwise, the thresholds restrict the occurrence of rime splintering to clouds with a higher ice and liquid water content than is often observed in the Arctic. Additionally, we increase the number of splinters produced and find that an increase by a factor of 20 yields good agreement with observed ice crystal number concentrations. Based on this and on the findings of Young et al. (2019), we hypothesize that this is justified in clean Arctic environments with relatively large droplets, but further laboratory and field studies relating the number of splinters produced by rime splintering to both mixing ratios and droplet sizes are required to confirm or reject this hypothesis. In addition to the ICNC profiles, the simulated precipitation is also considerably improved when aerosols and SIP processes are represented more realistically. The adapted schemes show a lower downward longwave radiation than default schemes, and the changes are likely mainly related to CCNC/CDNC changes. Thus, the misrepresentation of ice production might not lead to a bias in how much heat is trapped between the cloud and the surface, but due to an overall underestimation compared to observations, conclusions regarding downward longwave radiation remain uncertain.
Even though the changes made between the default simulation Morr0 and the final simulation Morr5 have been validated using the case study on 12 November with observational evidence for strong SIP, the applied modifications are meant to be of a general nature and should not hinder the application to cases where no SIP was observed. Also, the performance across different microphysical conditions between the flights already suggests that the modified scheme is applicable in different conditions. The correct representation of hydrometeor profiles and precipitation for the right reason is a prerequisite for model simulations to be used as baselines to investigate cloud responses to aerosol perturbations and future warming.
The following figure taken from Pasquier et al. (2022a, Fig. S2) illustrates the meteorological situation around Svalbard on the morning of 12 November 2019.
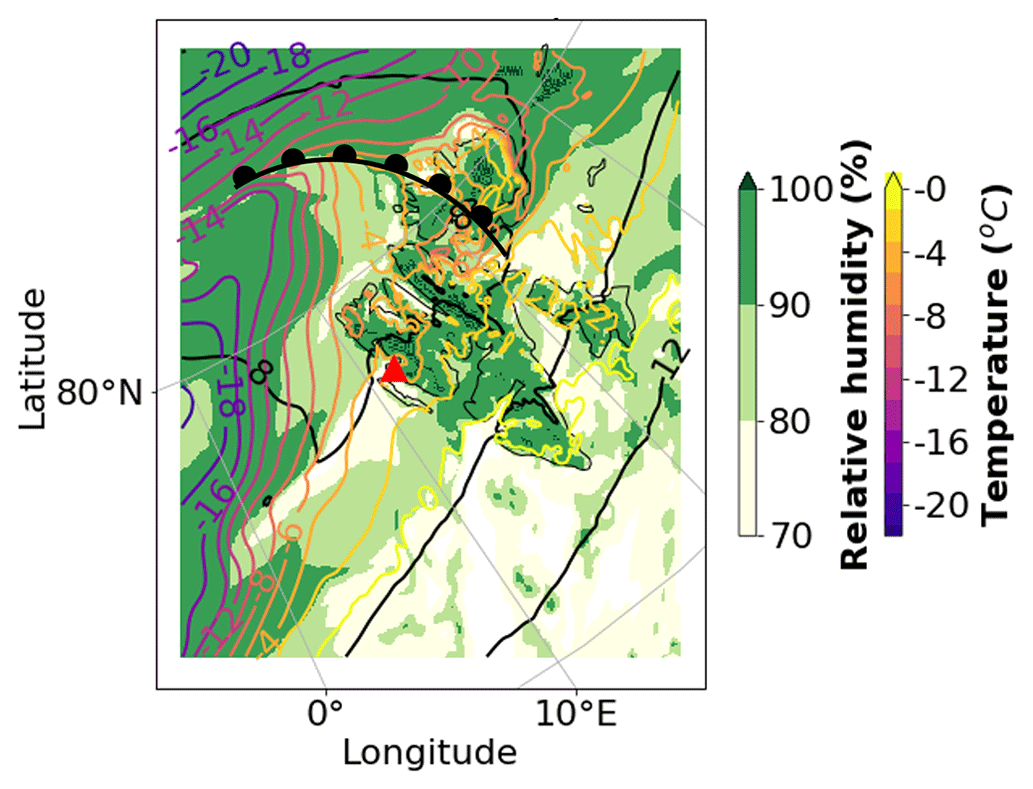
Figure A1Map showing the synoptic situation with the estimated location of the warm front on 12 November at 06:00 UTC (figure taken from Pasquier et al., 2022a, Fig. S2, produced using MetCoOp Ensemble Prediction System (MEPS) model data from Hellmuth and Hofer, 2019). The relative humidity and the temperature at 1000 hPa are indicated by green shading and colored lines, respectively. The red triangle shows the location of Ny-Ålesund.
As mentioned in Sect. 4.3, the surprisingly high amount of graupel in MYadap (see Fig. B1) was not produced when all changes between MYdef and MYadap were made, with the exception of fixing the CCNC during updrafts to the observed value. Instead, the default parametrization by Cohard and Pinty (2000) was used here. The results of this simulation are marked as MYCP00 in Fig. B2.
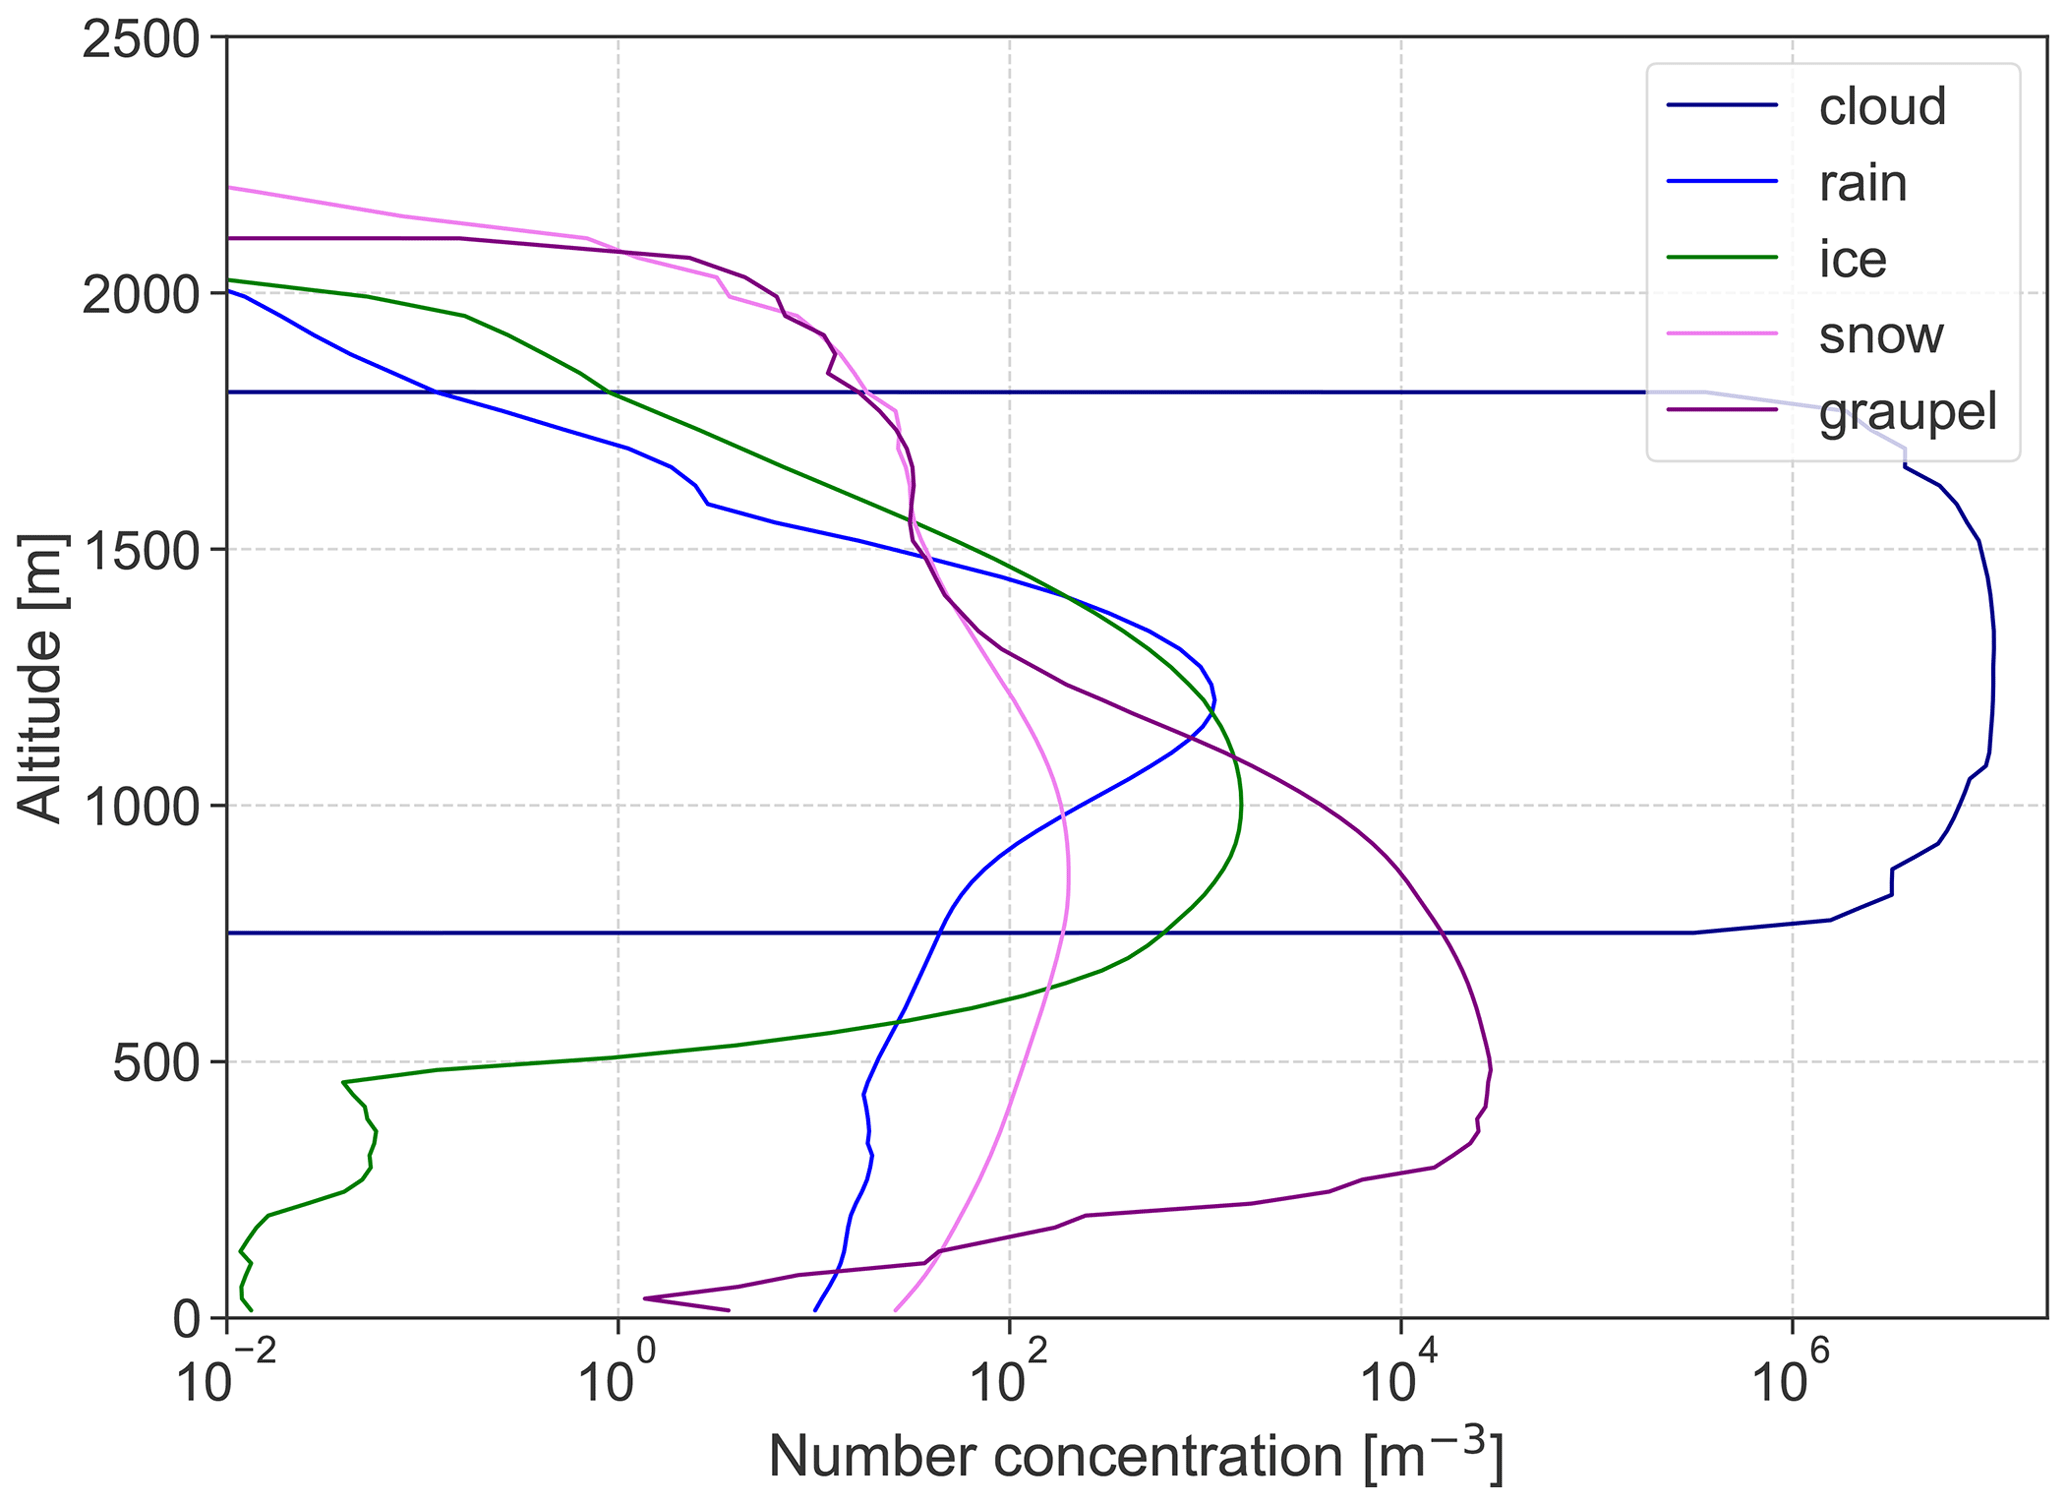
Figure B1Number concentrations of individual hydrometeor categories in simulation MYadap during the third flight.
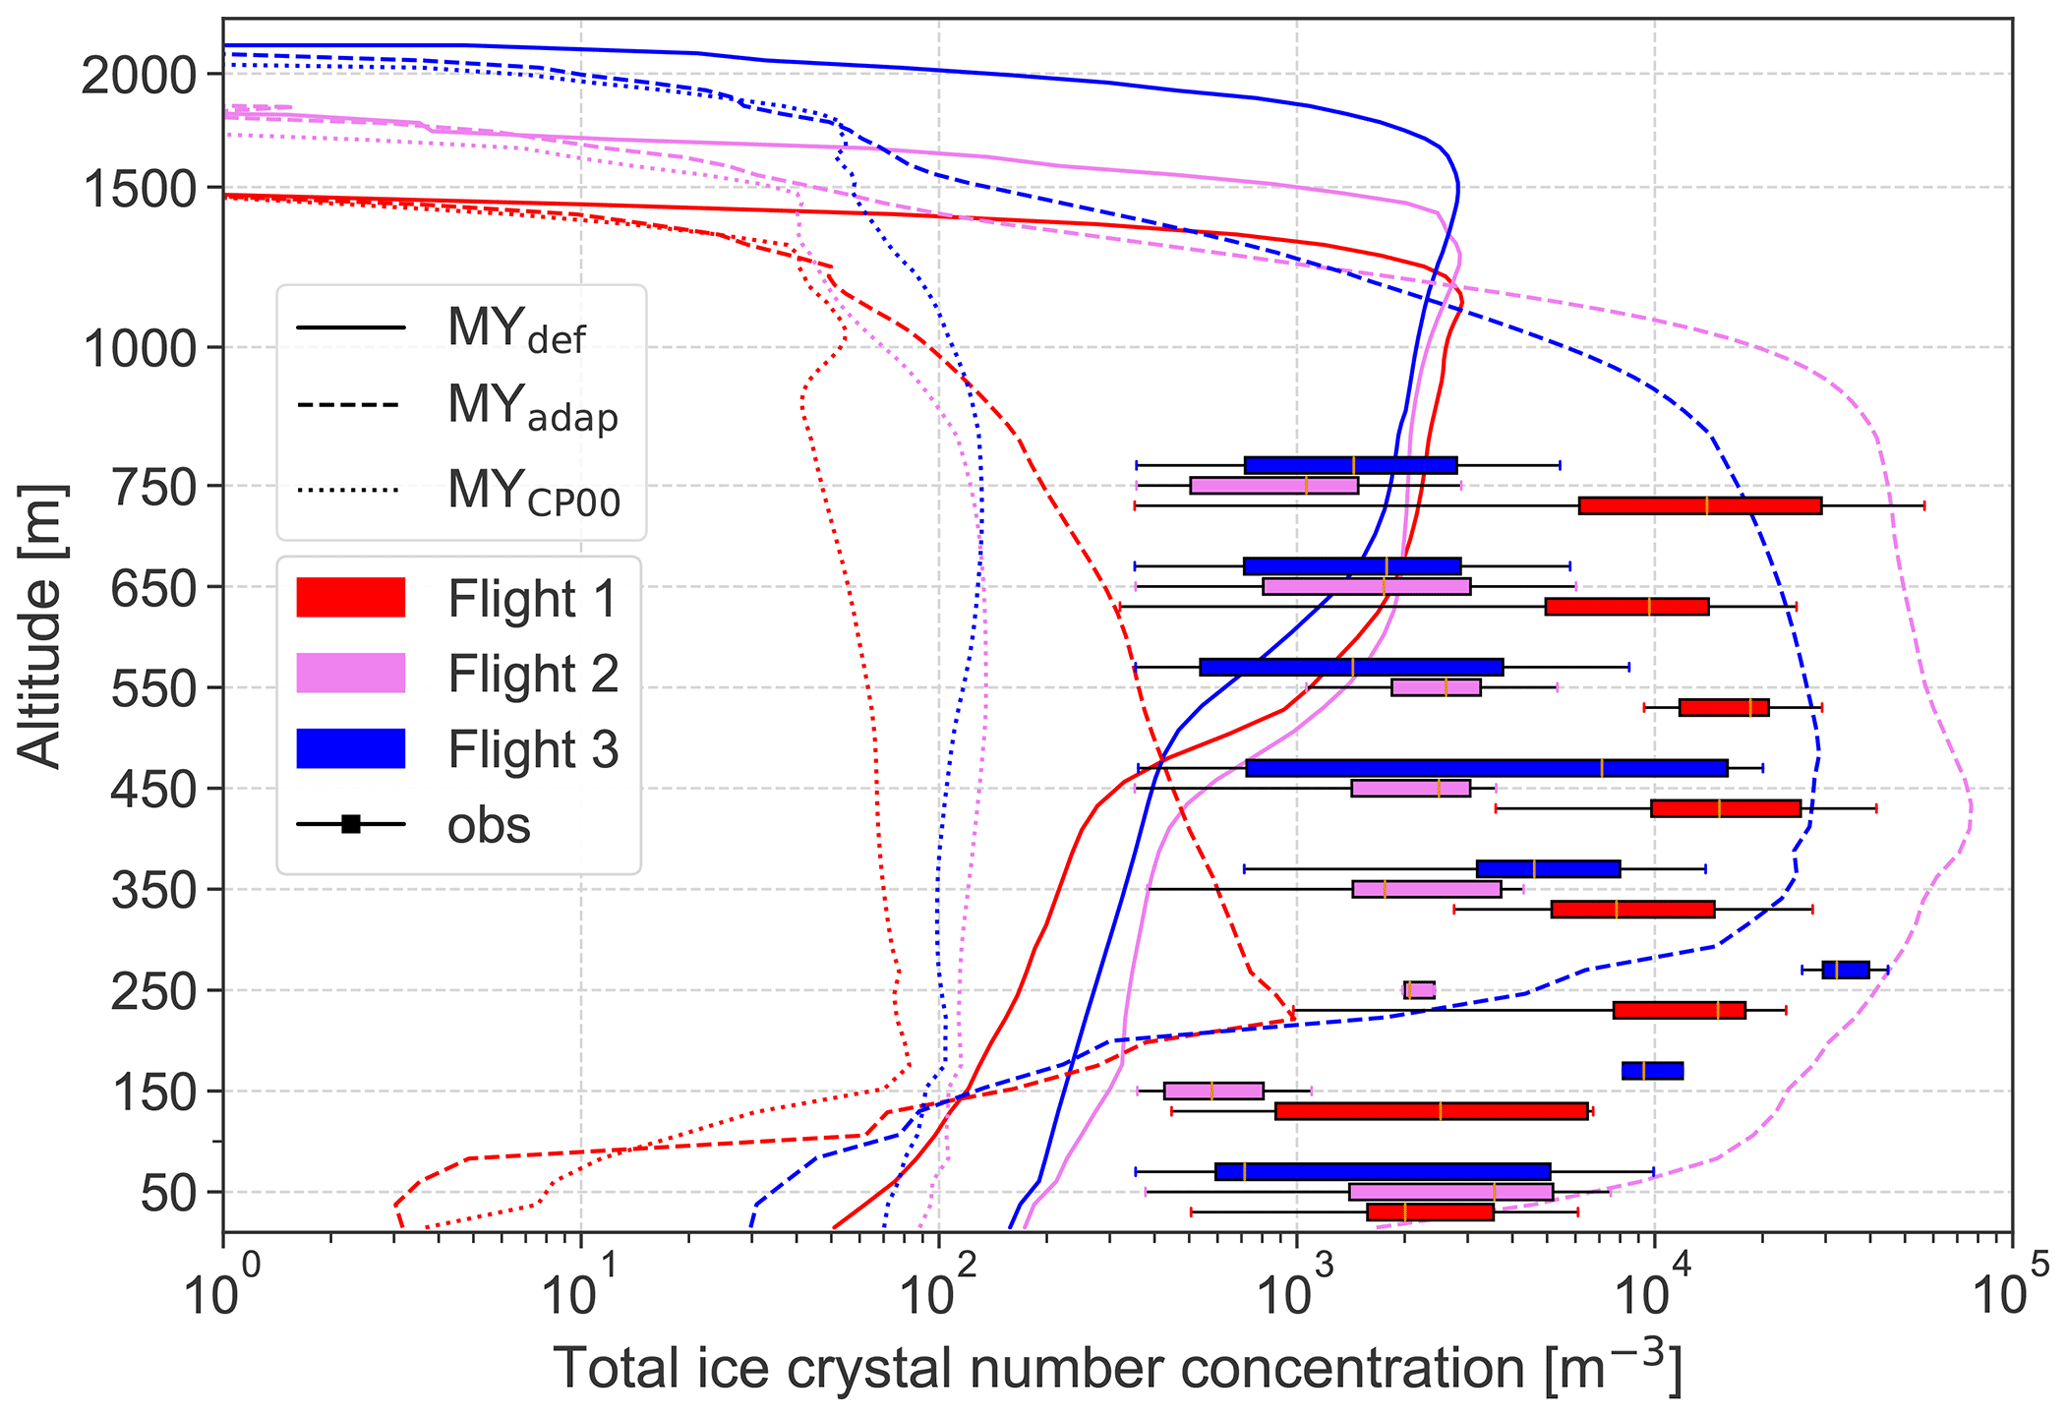
Figure B2ICNC for the simulations MYdef, MYadap, and MYCP00, which is identical to MYadap apart from the CCNC during updrafts. The ICNC is much lower when CCNC during updrafts is parametrized according to Cohard and Pinty (2000) than when it is set to 9 cm−3.
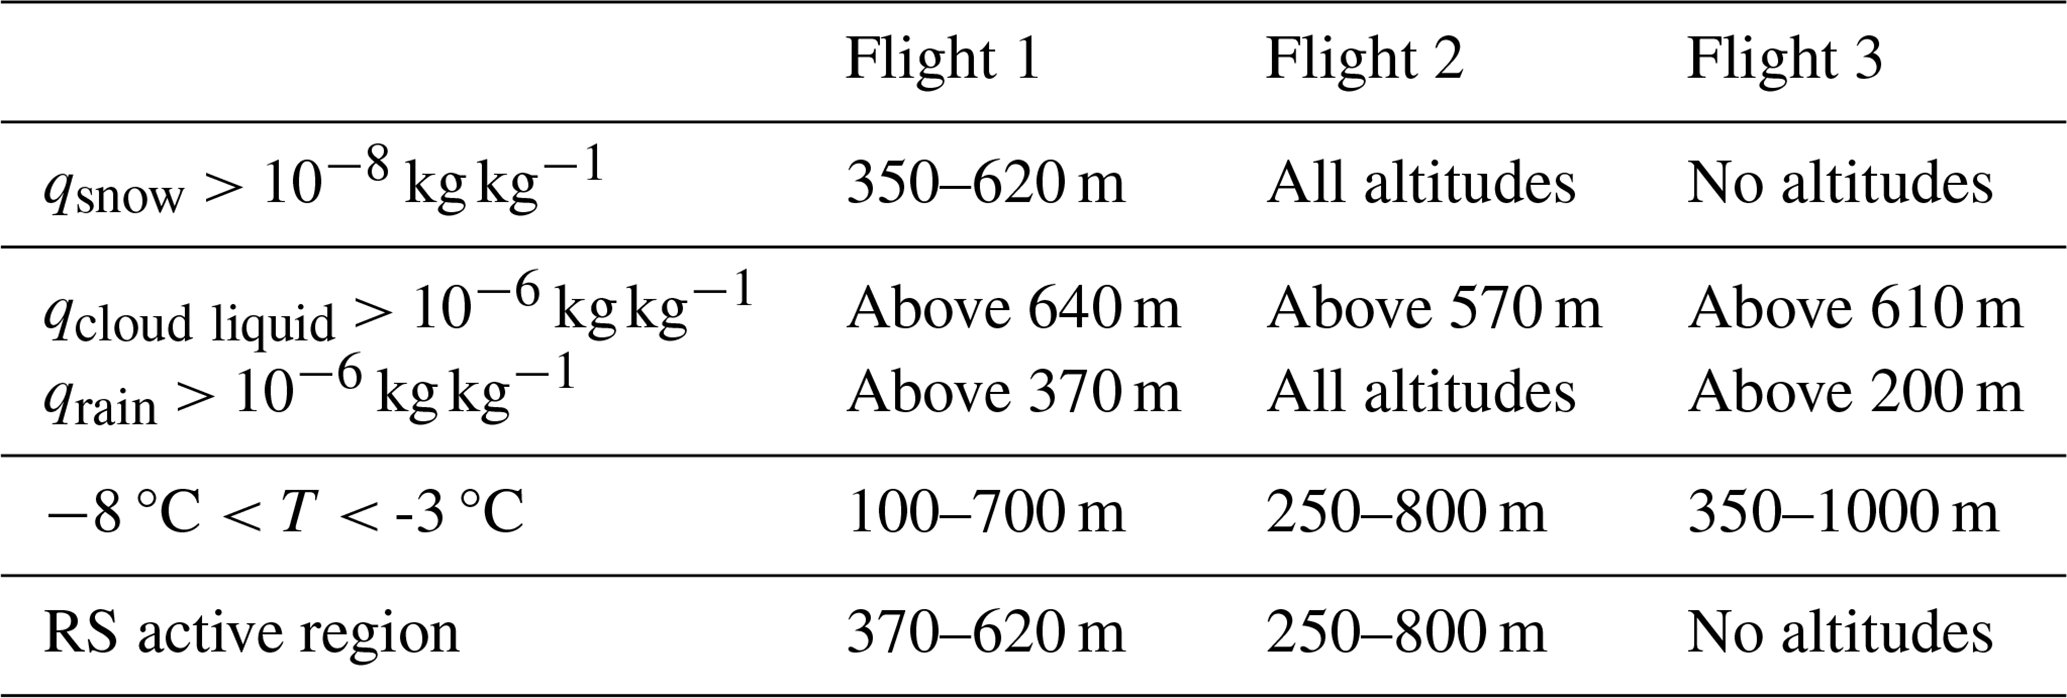
Whether lowering the required mixing ratio thresholds from simulation Morr3 to Morr4 has an effect on the simulated ICNC during one flight depends on whether the new thresholds are overcome during the time of this flight. To reveal the regions where the lowered mixing ratio thresholds for RS in Morr4 actually enable RS, we show the altitude regions where the individual thresholds are overcome and where the joint condition (see Sect. 4.5) is met in Table C1. During flight 1, the flight-time-averaged snow mixing ratio in Morr4 just overcame the updated threshold (by less than 50 %) at altitudes between 350 and 620 m. At the same time, the temperature criterion was met between 100 and 700 m in altitude, and the rain mixing ratio exceeded the threshold above 370 m. Thus, the altitude region where RS involving snow and rain was active during flight 1 is located between 370 and 620 m. RS involving snow and cloud droplets did not occur during flight 1 as the cloud liquid mixing ratio threshold was not overcome in the altitude region where the amount of snow was sufficiently high. During flight 2, both the snow and rain mixing ratios clearly exceeded the thresholds at all altitudes. Therefore, the impact of lowering the required mixing ratio thresholds is mostly captured during the second flight. The ice part of the cloud now extends to the surface as observed. Similar to during flight 1, the temperature profile leads to RS primarily increasing the ICNC towards cloud base where the cloud is warm enough for RS to be active (Fig. 9). During the third flight, however, the flight-averaged snow water mixing ratio was even lower than in the first flight and did not reach the threshold. This explains the lack of difference in ICNC between Morr3 and Morr4 for the third flight.
Table C1Regions where criteria for RS are met in Morr4. In order for RS to happen, the threshold for the snow mixing ratio qsnow has to be overcome, the temperature must be inside the given range, and the cloud water mixing ratio qcloud liquid and/or rainwater mixing ratio qrain must overcome the threshold. The combination of these limitations results in the RS active region given in the lowest row.
The HoloBalloon data are available from https://doi.org/10.5281/zenodo.7402285 (Pasquier et al., 2022c). Radiosounding observations are available from https://thredds.met.no (last access: 17 June 2024) and https://doi.org/10.1594/PANGAEA.914973 (Maturilli, 2020). Observations of surface radiation from Ny-Ålesund are available from the World Radiation Monitoring Center – Baseline Surface Radiation Network (Maturilli et al., 2019). The modified Morrison scheme is available on request.
BS performed all model simulations, led the analysis, and wrote the paper. ROD and TS contributed to the paper and took part in the development of the methods and the discussion of the results. GS and PG provided the code for added SIP in the Morr scheme and assisted in setting it up. JTP provided the measurement data, and ROD also participated in the measurement campaign. PG, JTP, and GS commented on the final version of the paper.
The contact author has declared that none of the authors has any competing interests.
Publisher's note: Copernicus Publications remains neutral with regard to jurisdictional claims made in the text, published maps, institutional affiliations, or any other geographical representation in this paper. While Copernicus Publications makes every effort to include appropriate place names, the final responsibility lies with the authors.
The simulations were performed on resources provided by Sigma2 – the National Infrastructure for High-Performance Computing and Data Storage in Norway. We would like to thank everyone from ETH Zürich and other institutions who were part of the NASCENT campaign for sharing their dataset. We acknowledge ACTRIS and the Finnish Meteorological Institute for providing the cloud classification, which is available for download at https://cloudnet.fmi.fi (last access: 17 June 2024). The cloud radar data for Ny-Ålesund were provided by the University of Cologne and the ceilometer and microwave radiometer data by the Alfred Wegener Institute, Helmholtz Centre for Polar and Marine Research.
This research has been supported by the European Research Council, EU H2020 European Research Council (grant no. 758005), the European Research Council, EU HORIZON EUROPE European Research Council (grant no. 101045273), the European Union's Horizon research and innovation programme (grant agreement 821205) (FORCeS), and EEARO-NO-2019-0423/IceSafari, contract no. 31/2020, under the NO grants 2014–2021 of EEA Grants/Norway Grants.
This paper was edited by Aurélien Podglajen and reviewed by two anonymous referees.
Atlas, R. L., Bretherton, C. S., Blossey, P. N., Gettelman, A., Bardeen, C., Lin, P., and Ming, Y.: How Well Do Large-Eddy Simulations and Global Climate Models Represent Observed Boundary Layer Structures and Low Clouds Over the Summertime Southern Ocean?, J. Adv. Model. Earth Sy., 12, e2020MS002205, https://doi.org/10.1029/2020MS002205, 2020. a, b, c
Atlas, R. L., Bretherton, C. S., Khairoutdinov, M. F., and Blossey, P. N.: Hallett-Mossop Rime Splintering Dims Cumulus Clouds Over the Southern Ocean: New Insight From Nudged Global Storm-Resolving Simulations, AGU Advances, 3, e2021AV000454, https://doi.org/10.1029/2021AV000454, e2021AV000454 2021AV000454, 2022. a, b, c, d, e
Auer, A. H., Veal, D. L., and Marwitz, J. D.: Observations of Ice Crystal and Ice Nuclei Concentrations in Stable Cap Clouds, J. Atmos. Sci., 26, 1342–1343, 1969. a
Barton, N. P., Klein, S. A., Boyle, J. S., and Zhang, Y. Y.: Arctic synoptic regimes: Comparing domain-wide Arctic cloud observations with CAM4 and CAM5 during similar dynamics, J. Geophys. Res.-Atmos., 117, D15205, https://doi.org/10.1029/2012JD017589, 2012. a
Beard, K. V.: Ice initiation in warm-base convective clouds: An assessment of microphysical mechanisms, Atmos. Res., 28, 125–152, https://doi.org/10.1016/0169-8095(92)90024-5, 1992. a
Bigg, E.: The formation of atmospheric ice crystals by the freezing of droplets, Q. J. Roy. Meteor. Soc., 79, 510–519, 1953. a, b, c, d, e, f
Campbell, J. M. and Christenson, H. K.: Nucleation- and Emergence-Limited Growth of Ice from Pores, Phys. Rev. Lett., 120, 165701, https://doi.org/10.1103/PhysRevLett.120.165701, 2018. a
Cantrell, W. and Heymsfield, A.: Production of Ice in Tropospheric Clouds: A Review, B. Am. Meteorol. Soc., 86, 795–808, https://doi.org/10.1175/BAMS-86-6-795, 2005. a
Carlsen, T. and David, R. O.: Spaceborne Evidence That Ice-Nucleating Particles Influence High-Latitude Cloud Phase, Geophys. Res. Lett., 49, e2022GL098041, https://doi.org/10.1029/2022GL098041, 2022. a
Cohard, J.-M. and Pinty, J.-P.: A comprehensive two-moment warm microphysical bulk scheme. I: Description and tests, Q. J. Roy. Meteor. Soc., 126, 1815–1842, https://doi.org/10.1002/qj.49712656613, 2000. a, b, c, d, e
Collins, W. D., Rasch, P. J., Boville, B. A., Hack, J. J., McCaa, J. R., Williamson, D. L., Kiehl, J. T., Briegleb, B., Bitz, C., Lin, S.-J., Zhang, M., and Dai, Y.: Description of the NCAR community atmosphere model (CAM 3.0), NCAR Tech. Note NCAR/TN-464+ STR, 226, https://doi.org/10.5065/D63N21CH, 2004. a
Cooper, W. A.: Ice Initiation in Natural Clouds, American Meteorological Society, Boston, MA, https://doi.org/10.1007/978-1-935704-17-1_4, pp. 29–32, 1986. a, b, c, d
Cotton, R. J., Field, P. R., Ulanowski, Z., Kaye, P. H., Hirst, E., Greenaway, R. S., Crawford, I., Crosier, J., and Dorsey, J.: The effective density of small ice particles obtained from in situ aircraft observations of mid-latitude cirrus, Q. J. Roy. Meteor. Soc., 139, 1923–1934, https://doi.org/10.1002/qj.2058, 2013. a
Creamean, J. M., Barry, K., Hill, T. C. J., Hume, C., DeMott, P. J., Shupe, M. D., Dahlke, S., Willmes, S., Schmale, J., Beck, I., Hoppe, C. J. M., Fong, A., Chamberlain, E., Bowman, J., Scharien, R., and Persson, O.: Annual cycle observations of aerosols capable of ice formation in central Arctic clouds, Nat. Commun., 13, 3537, https://doi.org/10.1038/s41467-022-31182-x, 2022. a
David, R. O., Cascajo-Castresana, M., Brennan, K. P., Rösch, M., Els, N., Werz, J., Weichlinger, V., Boynton, L. S., Bogler, S., Borduas-Dedekind, N., Marcolli, C., and Kanji, Z. A.: Development of the DRoplet Ice Nuclei Counter Zurich (DRINCZ): validation and application to field-collected snow samples, Atmos. Meas. Tech., 12, 6865–6888, https://doi.org/10.5194/amt-12-6865-2019, 2019a. a
David, R. O., Marcolli, C., Fahrni, J., Qiu, Y., Sirkin, Y. A. P., Molinero, V., Mahrt, F., Brühwiler, D., Lohmann, U., and Kanji, Z. A.: Pore condensation and freezing is responsible for ice formation below water saturation for porous particles, P. Natl. Acad. Sci. USA, 116, 8184–8189, https://doi.org/10.1073/pnas.1813647116, 2019b. a
David, R. O., Fahrni, J., Marcolli, C., Mahrt, F., Brühwiler, D., and Kanji, Z. A.: The role of contact angle and pore width on pore condensation and freezing, Atmos. Chem. Phys., 20, 9419–9440, https://doi.org/10.5194/acp-20-9419-2020, 2020. a
de Boer, G., Eloranta, E. W., and Shupe, M. D.: Arctic Mixed-Phase Stratiform Cloud Properties from Multiple Years of Surface-Based Measurements at Two High-Latitude Locations, J. Atmos. Sci., 66, 2874–2887, https://doi.org/10.1175/2009JAS3029.1, 2009. a, b
de Boer, G., Hashino, T., and Tripoli, G. J.: Ice nucleation through immersion freezing in mixed-phase stratiform clouds: Theory and numerical simulations, Atmos. Res., 96, 315–324, https://doi.org/10.1016/j.atmosres.2009.09.012, 2010. a
de Boer, G., Morrison, H., Shupe, M. D., and Hildner, R.: Evidence of liquid dependent ice nucleation in high-latitude stratiform clouds from surface remote sensors, Geophys. Res. Lett., 38, https://doi.org/10.1029/2010GL046016, 2011. a
DeMott, P. J., Prenni, A. J., Liu, X., Kreidenweis, S. M., Petters, M. D., Twohy, C. H., Richardson, M. S., Eidhammer, T., and Rogers, D. C.: Predicting global atmospheric ice nuclei distributions and their impacts on climate, P. Natl. Acad. Sci. USA, 107, 11217–11222, https://doi.org/10.1073/pnas.0910818107, 2010. a
DeMott, P. J., Hill, T. C. J., McCluskey, C. S., Prather, K. A., Collins, D. B., Sullivan, R. C., Ruppel, M. J., Mason, R. H., Irish, V. E., Lee, T., Hwang, C. Y., Rhee, T. S., Snider, J. R., McMeeking, G. R., Dhaniyala, S., Lewis, E. R., Wentzell, J. J. B., Abbatt, J., Lee, C., Sultana, C. M., Ault, A. P., Axson, J. L., Martinez, M. D., Venero, I., Santos-Figueroa, G., Stokes, M. D., Deane, G. B., Mayol-Bracero, O. L., Grassian, V. H., Bertram, T. H., Bertram, A. K., Moffett, B. F., and Franc, G. D.: Sea spray aerosol as a unique source of ice nucleating particles, P. Natl. Acad. Sci. USA, 113, 5797–5803, https://doi.org/10.1073/pnas.1514034112, 2016. a
Diehl, K., Matthias-Maser, S., Jaenicke, R., and Mitra, S.: The ice nucleating ability of pollen:: Part II. Laboratory studies in immersion and contact freezing modes, Atmos. Res., 61, 125–133, https://doi.org/10.1016/S0169-8095(01)00132-6, 2002. a
Ebell, K., Maturilli, M., and O'Connor, E.: Classification data from Ny-Ålesund on 12 November 2019, https://hdl.handle.net/21.12132/1.9f70b333642f41ab (last access: 17 June 2024), 2022. a, b
Field, P. R., Lawson, R. P., Brown, P. R. A., Lloyd, G., Westbrook, C., Moisseev, D., Miltenberger, A., Nenes, A., Blyth, A., Choularton, T., Connolly, P., Buehl, J., Crosier, J., Cui, Z., Dearden, C., DeMott, P., Flossmann, A., Heymsfield, A., Huang, Y., Kalesse, H., Kanji, Z. A., Korolev, A., Kirchgaessner, A., Lasher-Trapp, S., Leisner, T., McFarquhar, G., Phillips, V., Stith, J., and Sullivan, S.: Secondary Ice Production: Current State of the Science and Recommendations for the Future, Meteor. Mon., 58, 7.1–7.20, https://doi.org/10.1175/AMSMONOGRAPHS-D-16-0014.1, 2017. a, b, c
Fu, S., Deng, X., Shupe, M. D., and Xue, H.: A modelling study of the continuous ice formation in an autumnal Arctic mixed-phase cloud case, Atmos. Res., 228, 77–85, https://doi.org/10.1016/j.atmosres.2019.05.021, 2019. a
Georgakaki, P., Sotiropoulou, G., Vignon, É., Billault-Roux, A.-C., Berne, A., and Nenes, A.: Secondary ice production processes in wintertime alpine mixed-phase clouds, Atmos. Chem. Phys., 22, 1965–1988, https://doi.org/10.5194/acp-22-1965-2022, 2022. a, b, c, d, e, f, g, h, i, j, k, l, m
Gierens, R., Kneifel, S., Shupe, M. D., Ebell, K., Maturilli, M., and Löhnert, U.: Low-level mixed-phase clouds in a complex Arctic environment, Atmos. Chem. Phys., 20, 3459–3481, https://doi.org/10.5194/acp-20-3459-2020, 2020. a
Grell, G. A. and Freitas, S. R.: A scale and aerosol aware stochastic convective parameterization for weather and air quality modeling, Atmos. Chem. Phys., 14, 5233–5250, https://doi.org/10.5194/acp-14-5233-2014, 2014. a
Hallett, J. and Mossop, S.: Production of secondary ice particles during the riming process, Nature, 249, 26–28, 1974. a, b
Hartmann, M., Adachi, K., Eppers, O., Haas, C., Herber, A., Holzinger, R., Hünerbein, A., Jäkel, E., Jentzsch, C., van Pinxteren, M., Wex, H., Willmes, S., and Stratmann, F.: Wintertime Airborne Measurements of Ice Nucleating Particles in the High Arctic: A Hint to a Marine, Biogenic Source for Ice Nucleating Particles, Geophys. Res. Lett., 47, e2020GL087770, https://doi.org/10.1029/2020GL087770, 2020. a
Hellmuth, F. and Hofer, S.: Weathermaps from MEPS latest runs, GitHub, https://github.com/franzihe/Weathermap (last access: 17 June 2024), 2019. a
Hersbach, H., Bell, B., Berrisford, P., Biavati, G., Horányi, A., Muñoz Sabater, J., Nicolas, J., Peubey, C., Radu, R., Rozum, I., Schepers, D., Simmons, A., Soci, C., Dee, D., and Thépaut, J.-N.: ERA5 hourly data on pressure levels from 1979 to present, Copernicus Climate Change Service (C3S) Climate Data Store (CDS), https://doi.org/10.24381/cds.bd0915c6 (last access: 19 March 2021), 2018a. a
Hersbach, H., Bell, B., Berrisford, P., Biavati, G., Horányi, A., Muñoz Sabater, J., Nicolas, J., Peubey, C., Radu, R., Rozum, I., Schepers, D., Simmons, A., Soci, C., Dee, D., and Thépaut, J.-N.: ERA5 hourly data on single levels from 1979 to present, Copernicus Climate Change Service (C3S) Climate Data Store (CDS), https://doi.org/10.24381/cds.adbb2d47 (last access: 21 April 2021), 2018b. a
Heymsfield, A. J., Schmitt, C., Bansemer, A., and Twohy, C. H.: Improved Representation of Ice Particle Masses Based on Observations in Natural Clouds, J. Atmos. Sci., 67, 3303–3318, https://doi.org/10.1175/2010JAS3507.1, 2010. a
Hong, S.-Y., Noh, Y., and Dudhia, J.: A new vertical diffusion package with an explicit treatment of entrainment processes, Mon. Weather Rev., 134, 2318–2341, 2006. a
Jackson, R. C., McFarquhar, G. M., Korolev, A. V., Earle, M. E., Liu, P. S. K., Lawson, R. P., Brooks, S., Wolde, M., Laskin, A., and Freer, M.: The dependence of ice microphysics on aerosol concentration in arctic mixed-phase stratus clouds during ISDAC and M-PACE, J. Geophys. Res.-Atmos., 117, D15207, https://doi.org/10.1029/2012JD017668, 2012. a
Järvinen, E., McCluskey, C. S., Waitz, F., Schnaiter, M., Bansemer, A., Bardeen, C. G., Gettelman, A., Heymsfield, A., Stith, J. L., Wu, W., D'Alessandro, J. J., McFarquhar, G. M., Diao, M., Finlon, J. A., Hill, T. C. J., Levin, E. J. T., Moore, K. A., and DeMott, P. J.: Evidence for Secondary Ice Production in Southern Ocean Maritime Boundary Layer Clouds, J. Geophys. Res.-Atmos., 127, e2021JD036411, https://doi.org/10.1029/2021JD036411, 2022. a
Kärcher, B. and Marcolli, C.: Aerosol–cloud interactions: the representation of heterogeneous ice activation in cloud models, Atmos. Chem. Phys., 21, 15213–15220, https://doi.org/10.5194/acp-21-15213-2021, 2021. a
Kanji, Z. A., Ladino, L. A., Wex, H., Boose, Y., Burkert-Kohn, M., Cziczo, D. J., and Krämer, M.: Overview of Ice Nucleating Particles, Meteor. Mon., 58, 1.1–1.33, https://doi.org/10.1175/AMSMONOGRAPHS-D-16-0006.1, 2017. a
Karalis, M., Sotiropoulou, G., Abel, S. J., Bossioli, E., Georgakaki, P., Methymaki, G., Nenes, A., and Tombrou, M.: Effects of secondary ice processes on a stratocumulus to cumulus transition during a cold-air outbreak, Atmos. Res., 277, 106302, https://doi.org/10.1016/j.atmosres.2022.106302, 2022. a
Keinert, A., Spannagel, D., Leisner, T., and Kiselev, A.: Secondary Ice Production upon Freezing of Freely Falling Drizzle Droplets, J. Atmos. Sci., 77, 2959–2967, https://doi.org/10.1175/JAS-D-20-0081.1, 2020. a
Knight, C. A.: Ice Growth from the Vapor at −5 °C, J. Atmos. Sci., 69, 2031–2040, https://doi.org/10.1175/JAS-D-11-0287.1, 2012. a
Kochendorfer, J., Nitu, R., Wolff, M., Mekis, E., Rasmussen, R., Baker, B., Earle, M. E., Reverdin, A., Wong, K., Smith, C. D., Yang, D., Roulet, Y.-A., Buisan, S., Laine, T., Lee, G., Aceituno, J. L. C., Alastrué, J., Isaksen, K., Meyers, T., Brækkan, R., Landolt, S., Jachcik, A., and Poikonen, A.: Analysis of single-Alter-shielded and unshielded measurements of mixed and solid precipitation from WMO-SPICE, Hydrol. Earth Syst. Sci., 21, 3525–3542, https://doi.org/10.5194/hess-21-3525-2017, 2017. a, b, c
Koike, M., Ukita, J., Ström, J., Tunved, P., Shiobara, M., Vitale, V., Lupi, A., Baumgardner, D., Ritter, C., Hermansen, O., Yamada, K., and Pedersen, C. A.: Year-Round In Situ Measurements of Arctic Low-Level Clouds: Microphysical Properties and Their Relationships With Aerosols, J. Geophys. Res.-Atmos., 124, 1798–1822, https://doi.org/10.1029/2018JD029802, 2019. a
Korolev, A. and Leisner, T.: Review of experimental studies of secondary ice production, Atmos. Chem. Phys., 20, 11767–11797, https://doi.org/10.5194/acp-20-11767-2020, 2020. a, b, c
Korolev, A., Heckman, I., Wolde, M., Ackerman, A. S., Fridlind, A. M., Ladino, L. A., Lawson, R. P., Milbrandt, J., and Williams, E.: A new look at the environmental conditions favorable to secondary ice production, Atmos. Chem. Phys., 20, 1391–1429, https://doi.org/10.5194/acp-20-1391-2020, 2020. a
Lacher, L., Lohmann, U., Boose, Y., Zipori, A., Herrmann, E., Bukowiecki, N., Steinbacher, M., and Kanji, Z. A.: The Horizontal Ice Nucleation Chamber (HINC): INP measurements at conditions relevant for mixed-phase clouds at the High Altitude Research Station Jungfraujoch, Atmos. Chem. Phys., 17, 15199–15224, https://doi.org/10.5194/acp-17-15199-2017, 2017. a
Ladino, L. A., Korolev, A., Heckman, I., Wolde, M., Fridlind, A. M., and Ackerman, A. S.: On the role of ice-nucleating aerosol in the formation of ice particles in tropical mesoscale convective systems, Geophys. Res. Lett., 44, 1574–1582, https://doi.org/10.1002/2016GL072455, 2017. a
Ladino Moreno, L. A., Stetzer, O., and Lohmann, U.: Contact freezing: a review of experimental studies, Atmos. Chem. Phys., 13, 9745–9769, https://doi.org/10.5194/acp-13-9745-2013, 2013. a
Lauber, A.: In-situ observations of ice multiplication in clouds using a holographic imager and a deep learning algorithm for the classification of cloud particles, PhD thesis, ETH Zürich, https://doi.org/10.3929/ethz-b-000474830, 2020. a
Lauber, A., Kiselev, A., Pander, T., Handmann, P., and Leisner, T.: Secondary Ice Formation during Freezing of Levitated Droplets, J. Atmos. Sci., 75, 2815–2826, https://doi.org/10.1175/JAS-D-18-0052.1, 2018. a
Lauber, A., Henneberger, J., Mignani, C., Ramelli, F., Pasquier, J. T., Wieder, J., Hervo, M., and Lohmann, U.: Continuous secondary-ice production initiated by updrafts through the melting layer in mountainous regions, Atmos. Chem. Phys., 21, 3855–3870, https://doi.org/10.5194/acp-21-3855-2021, 2021. a
Lawson, R. P., Woods, S., and Morrison, H.: The Microphysics of Ice and Precipitation Development in Tropical Cumulus Clouds, J. Atmos. Sci., 72, 2429–2445, https://doi.org/10.1175/JAS-D-14-0274.1, 2015. a
Li, G., Wieder, J., Pasquier, J. T., Henneberger, J., and Kanji, Z. A.: Predicting atmospheric background number concentration of ice-nucleating particles in the Arctic, Atmos. Chem. Phys., 22, 14441–14454, https://doi.org/10.5194/acp-22-14441-2022, 2022. a, b
Luo, Y., Xu, K.-M., Morrison, H., and McFarquhar, G.: Arctic Mixed-Phase Clouds Simulated by a Cloud-Resolving Model: Comparison with ARM Observations and Sensitivity to Microphysics Parameterizations, J. Atmos. Sci., 65, 1285–1303, https://doi.org/10.1175/2007JAS2467.1, 2008. a
Mahrt, F., Marcolli, C., David, R. O., Grönquist, P., Barthazy Meier, E. J., Lohmann, U., and Kanji, Z. A.: Ice nucleation abilities of soot particles determined with the Horizontal Ice Nucleation Chamber, Atmos. Chem. Phys., 18, 13363–13392, https://doi.org/10.5194/acp-18-13363-2018, 2018. a
Marcolli, C.: Deposition nucleation viewed as homogeneous or immersion freezing in pores and cavities, Atmos. Chem. Phys., 14, 2071–2104, https://doi.org/10.5194/acp-14-2071-2014, 2014. a
Marcolli, C., Nagare, B., Welti, A., and Lohmann, U.: Ice nucleation efficiency of AgI: review and new insights, Atmos. Chem. Phys., 16, 8915–8937, https://doi.org/10.5194/acp-16-8915-2016, 2016. a
Mason, R. H., Si, M., Li, J., Chou, C., Dickie, R., Toom-Sauntry, D., Pöhlker, C., Yakobi-Hancock, J. D., Ladino, L. A., Jones, K., Leaitch, W. R., Schiller, C. L., Abbatt, J. P. D., Huffman, J. A., and Bertram, A. K.: Ice nucleating particles at a coastal marine boundary layer site: correlations with aerosol type and meteorological conditions, Atmos. Chem. Phys., 15, 12547–12566, https://doi.org/10.5194/acp-15-12547-2015, 2015. a
Maturilli, M.: Basic and other measurements of radiation at station Ny-Ålesund (2019-11), PANGAEA, https://doi.org/10.1594/PANGAEA.909940, in: Maturilli, M. (2020): Basic and other measurements of radiation at station Ny-Ålesund (2006-05 et seq), Alfred Wegener Institute – Research Unit Potsdam, PANGAEA, https://doi.org/10.1594/PANGAEA.914927, 2019. a, b
Maturilli, M.: High resolution radiosonde measurements from station Ny-Ålesund (2019-11), PANGAEA, https://doi.org/10.1594/PANGAEA.911039, Alfred Wegener Institute – Research Unit Potsdam, PANGAEA [data set], https://doi.org/10.1594/PANGAEA.914973, 2020. a
Mauritsen, T., Sedlar, J., Tjernström, M., Leck, C., Martin, M., Shupe, M., Sjogren, S., Sierau, B., Persson, P. O. G., Brooks, I. M., and Swietlicki, E.: An Arctic CCN-limited cloud-aerosol regime, Atmos. Chem. Phys., 11, 165–173, https://doi.org/10.5194/acp-11-165-2011, 2011. a
McCluskey, C. S., Ovadnevaite, J., Rinaldi, M., Atkinson, J., Belosi, F., Ceburnis, D., Marullo, S., Hill, T. C. J., Lohmann, U., Kanji, Z. A., O'Dowd, C., Kreidenweis, S. M., and DeMott, P. J.: Marine and Terrestrial Organic Ice-Nucleating Particles in Pristine Marine to Continentally Influenced Northeast Atlantic Air Masses, J. Geophys. Res.-Atmos., 123, 6196–6212, https://doi.org/10.1029/2017JD028033, 2018. a
Meyers, M. P., DeMott, P. J., and Cotton, W. R.: New primary ice-nucleation parameterizations in an explicit cloud model, J. Appl. Meteorol. Clim., 31, 708–721, 1992. a, b, c, d, e, f, g, h, i, j, k, l
Milbrandt, J. and Yau, M.: A multimoment bulk microphysics parameterization. Part II: A proposed three-moment closure and scheme description, J. Atmos. Sci., 62, 3065–3081, https://doi.org/10.1175/JAS3535.1, 2005. a, b
Moore, R. H., Karydis, V. A., Capps, S. L., Lathem, T. L., and Nenes, A.: Droplet number uncertainties associated with CCN: an assessment using observations and a global model adjoint, Atmos. Chem. Phys., 13, 4235–4251, https://doi.org/10.5194/acp-13-4235-2013, 2013. a
Morrison, H., Curry, J., and Khvorostyanov, V.: A new double-moment microphysics parameterization for application in cloud and climate models. Part I: Description, J. Atmos. Sci., 62, 1665–1677, 2005a. a
Morrison, H., Shupe, M. D., Pinto, J. O., and Curry, J. A.: Possible roles of ice nucleation mode and ice nuclei depletion in the extended lifetime of Arctic mixed-phase clouds, Geophys. Res. Lett., 32, L18801, https://doi.org/10.1029/2005GL023614, 2005b. a
Morrison, H., Thompson, G., and Tatarskii, V.: Impact of cloud microphysics on the development of trailing stratiform precipitation in a simulated squall line: Comparison of one-and two-moment schemes, Mon. Weather Rev., 137, 991–1007, 2009. a, b, c, d
Morrison, H., De Boer, G., Feingold, G., Harrington, J., Shupe, M. D., and Sulia, K.: Resilience of persistent Arctic mixed-phase clouds, Nat. Geosci., 5, 11–17, 2012. a, b
Mossop, S. C.: The influence of drop size distribution on the production of secondary ice particles during graupel growth, Q. J. Roy. Meteor. Soc., 104, 323–330, https://doi.org/10.1002/qj.49710444007, 1978. a, b
Motos, G., Freitas, G., Georgakaki, P., Wieder, J., Li, G., Aas, W., Lunder, C., Krejci, R., Pasquier, J. T., Henneberger, J., David, R. O., Ritter, C., Mohr, C., Zieger, P., and Nenes, A.: Aerosol and dynamical contributions to cloud droplet formation in Arctic low-level clouds, Atmos. Chem. Phys., 23, 13941–13956, https://doi.org/10.5194/acp-23-13941-2023, 2023. a
Nagare, B., Marcolli, C., Welti, A., Stetzer, O., and Lohmann, U.: Comparing contact and immersion freezing from continuous flow diffusion chambers, Atmos. Chem. Phys., 16, 8899–8914, https://doi.org/10.5194/acp-16-8899-2016, 2016. a
Nitu, R., Roulet, Y.-A., Wolff, M., Earle, M., Reverdin, A., Smith, C., Kochendorfer, J., Morin, S., Rasmussen, R., Wong, K., Alastrué, J., Arnold, L., Baker, B., Buisán, S., Collado, J., Colli, M., Collins, B., Gaydos, A., Hannula, H.-R., Hoover, J., Joe, P., Kontu, A., Laine, T., Lanza, L., Lanzinger, E., Lee, G., Lejeune, Y., Leppänen, L., Mekis, E., Panel, J.-M., Poikonen, A., Ryu, S., Sabatini, F., Theriault, J., Yang, D., Genthon, C., van den Heuvel, F., Hirasawa, N., Konishi, H., Motoyoshi, H., Nakai, S., Nishimura, K., Senese, A., and Yamashita, K.: WMO Solid Precipitation Intercomparison Experiment (SPICE) (2012–2015), Tech. Rep. Instruments and Observing Methods (IOM) Report No. 131, World Meteorological Organization, Geneva, Switzerland, https://library.wmo.int/idurl/4/56317 (last access: 17 June 2024), 2018. a
Norgren, M. S., de Boer, G., and Shupe, M. D.: Observed aerosol suppression of cloud ice in low-level Arctic mixed-phase clouds, Atmos. Chem. Phys., 18, 13345–13361, https://doi.org/10.5194/acp-18-13345-2018, 2018. a
Pasquier, J. T., David, R. O., Freitas, G., Gierens, R., Gramlich, Y., Haslett, S., Li, G., Schäfer, B., Siegel, K., Wieder, J., Adachi, K., Belosi, F., Carlsen, T., Decesari, S., Ebell, K., Gilardoni, S., Gysel-Beer, M., Henneberger, J., Inoue, J., Kanji, Z. A., Koike, M., Kondo, Y., Krejci, R., Lohmann, U., Maturilli, M., Mazzolla, M., Modini, R., Mohr, C., Motos, G., Nenes, A., Nicosia, A., Ohata, S., Paglione, M., Park, S., Pileci, R. E., Ramelli, F., Rinaldi, M., Ritter, C., Sato, K., Storelvmo, T., Tobo, Y., Traversi, R., Viola, A., and Zieger, P.: The Ny-Ålesund Aerosol Cloud Experiment (NASCENT): Overview and First Results, B. Am. Meteorol. Soc., 103, E2533–E2558, https://doi.org/10.1175/BAMS-D-21-0034.1, 2022a. a, b, c, d, e, f, g, h, i, j, k, l, m, n, o, p, q, r, s, t, u, v, w, x, y, z
Pasquier, J. T., Henneberger, J., Ramelli, F., Lauber, A., David, R. O., Wieder, J., Carlsen, T., Gierens, R., Maturilli, M., and Lohmann, U.: Conditions favorable for secondary ice production in Arctic mixed-phase clouds, Atmos. Chem. Phys., 22, 15579–15601, https://doi.org/10.5194/acp-22-15579-2022, 2022b. a, b, c, d, e, f, g, h
Pasquier, J. T., Henneberger, J., Ramelli, F., Wieder, J., Gierens, R., Ebell, K., Li, G., David, R. O., and Carlsen, T.: Data from the NASCENT campaign used in the publications: “Conditions favorable for secondary ice production in Arctic mixed-phase clouds” and “Understanding the history of two complex ice crystal habits deduced from a holographic imager”, Zenodo [data set], https://doi.org/10.5281/zenodo.7402285, 2022c. a, b
Phillips, V. T. J., Yano, J.-I., Formenton, M., Ilotoviz, E., Kanawade, V., Kudzotsa, I., Sun, J., Bansemer, A., Detwiler, A. G., Khain, A., and Tessendorf, S. A.: Ice Multiplication by Breakup in Ice–Ice Collisions. Part II: Numerical Simulations, J. Atmos. Sci., 74, 2789–2811, https://doi.org/10.1175/JAS-D-16-0223.1, 2017. a, b, c
Phillips, V. T. J., Patade, S., Gutierrez, J., and Bansemer, A.: Secondary Ice Production by Fragmentation of Freezing Drops: Formulation and Theory, J. Atmos. Sci., 75, 3031–3070, https://doi.org/10.1175/JAS-D-17-0190.1, 2018. a, b
Prenni, A. J., Harrington, J. Y., Tjernström, M., DeMott, P. J., Avramov, A., Long, C. N., Kreidenweis, S. M., Olsson, P. Q., and Verlinde, J.: Can Ice-Nucleating Aerosols Affect Arctic Seasonal Climate?, B. Am. Meteorol. Soc., 88, 541–550, https://doi.org/10.1175/BAMS-88-4-541, 2007. a
Ramelli, F., Beck, A., Henneberger, J., and Lohmann, U.: Using a holographic imager on a tethered balloon system for microphysical observations of boundary layer clouds, Atmos. Meas. Tech., 13, 925–939, https://doi.org/10.5194/amt-13-925-2020, 2020. a, b
Schemann, V. and Ebell, K.: Simulation of mixed-phase clouds with the ICON large-eddy model in the complex Arctic environment around Ny-Ålesund, Atmos. Chem. Phys., 20, 475–485, https://doi.org/10.5194/acp-20-475-2020, 2020. a
Serreze, M. C. and Barry, R. G.: Processes and impacts of Arctic amplification: A research synthesis, Global Planet. Change, 77, 85–96, https://doi.org/10.1016/j.gloplacha.2011.03.004, 2011. a
Shupe, M. D.: Clouds at Arctic Atmospheric Observatories. Part II: Thermodynamic Phase Characteristics, J. Appl. Meteorol. Clim., 50, 645–661, https://doi.org/10.1175/2010JAMC2468.1, 2011. a
Shupe, M. D., Matrosov, S. Y., and Uttal, T.: Arctic Mixed-Phase Cloud Properties Derived from Surface-Based Sensors at SHEBA, J. Atmos. Sci., 63, 697–711, https://doi.org/10.1175/JAS3659.1, 2006. a
Sinclair, V. A., Moisseev, D., and von Lerber, A.: How dual-polarization radar observations can be used to verify model representation of secondary ice, J. Geophys. Res.-Atmos., 121, 10,954–10,970, https://doi.org/10.1002/2016JD025381, 2016. a, b, c
Skamarock, W. C., Klemp, J. B., Dudhia, J., Gill, D. O., Liu, Z., Berner, J., Wang, W., Powers, J. G., Duda, M. G., Barker, D. M., and Huang, X.-Y.: A description of the advanced research WRF model version 4, National Center for Atmospheric Research: Boulder, CO, USA, https://doi.org/10.5065/1dfh-6p97, p. 145, 2019. a, b
Solomon, A., Morrison, H., Persson, O., Shupe, M. D., and Bao, J.-W.: Investigation of Microphysical Parameterizations of Snow and Ice in Arctic Clouds during M-PACE through Model–Observation Comparisons, Mon. Weather Rev., 137, 3110–3128, https://doi.org/10.1175/2009MWR2688.1, 2009. a
Solomon, A., de Boer, G., Creamean, J. M., McComiskey, A., Shupe, M. D., Maahn, M., and Cox, C.: The relative impact of cloud condensation nuclei and ice nucleating particle concentrations on phase partitioning in Arctic mixed-phase stratocumulus clouds, Atmos. Chem. Phys., 18, 17047–17059, https://doi.org/10.5194/acp-18-17047-2018, 2018. a
Sotiropoulou, G., Sullivan, S., Savre, J., Lloyd, G., Lachlan-Cope, T., Ekman, A. M. L., and Nenes, A.: The impact of secondary ice production on Arctic stratocumulus, Atmos. Chem. Phys., 20, 1301–1316, https://doi.org/10.5194/acp-20-1301-2020, 2020. a
Sotiropoulou, G., Vignon, É., Young, G., Morrison, H., O'Shea, S. J., Lachlan-Cope, T., Berne, A., and Nenes, A.: Secondary ice production in summer clouds over the Antarctic coast: an underappreciated process in atmospheric models, Atmos. Chem. Phys., 21, 755–771, https://doi.org/10.5194/acp-21-755-2021, 2021. a, b, c, d, e, f, g, h, i, j, k, l, m, n, o, p
Sotiropoulou, G., Lewinschal, A., Georgakaki, P., Phillips, V., Patade, S., Ekman, A. M. L., and Nenes, A.: Sensitivity of Arctic clouds to ice microphysical processes in the NorESM2 climate model, J. Climate, https://doi.org/10.1175/JCLI-D-22-0458.1, 2024. a
Sze, K. C. H., Wex, H., Hartmann, M., Skov, H., Massling, A., Villanueva, D., and Stratmann, F.: Ice-nucleating particles in northern Greenland: annual cycles, biological contribution and parameterizations, Atmos. Chem. Phys., 23, 4741–4761, https://doi.org/10.5194/acp-23-4741-2023, 2023. a
Tobo, Y., Uetake, J., Matsui, H., Moteki, N., Uji, Y., Iwamoto, Y., Miura, K., and Misumi, R.: Seasonal Trends of Atmospheric Ice Nucleating Particles Over Tokyo, J. Geophys. Res.-Atmos., 125, e2020JD033658, https://doi.org/10.1029/2020JD033658, 2020. a
Touloupas, G., Lauber, A., Henneberger, J., Beck, A., and Lucchi, A.: A convolutional neural network for classifying cloud particles recorded by imaging probes, Atmos. Meas. Tech., 13, 2219–2239, https://doi.org/10.5194/amt-13-2219-2020, 2020. a
Vali, G., DeMott, P. J., Möhler, O., and Whale, T. F.: Technical Note: A proposal for ice nucleation terminology, Atmos. Chem. Phys., 15, 10263–10270, https://doi.org/10.5194/acp-15-10263-2015, 2015. a, b, c, d
Verlinde, J., Harrington, J. Y., McFarquhar, G. M., Yannuzzi, V. T., Avramov, A., Greenberg, S., Johnson, N., Zhang, G., Poellot, M. R., Mather, J. H., Turner, D. D., Eloranta, E. W., Zak, B. D., Prenni, A. J., Daniel, J. S., Kok, G. L., Tobin, D. C., Holz, R., Sassen, K., Spangenberg, D., Minnis, P., Tooman, T. P., Ivey, M. D., Richardson, S. J., Bahrmann, C. P., Shupe, M., DeMott, P. J., Heymsfield, A. J., and Schofield, R.: The Mixed-Phase Arctic Cloud Experiment, B. Am. Meteorol. Soc., 88, 205–222, https://doi.org/10.1175/BAMS-88-2-205, 2007. a
Wendisch, M., Brückner, M., Burrows, J., Crewell, S., Dethloff, K., Ebell, K., Lüpkes, C., Macke, A., Notholt, J., Quaas, J., Rinke, A., and Tegen, I.: Understanding causes and effects of rapid warming in the Arctic, Eos, 98, https://doi.org/10.1029/2017EO064803, 2017. a
Wendisch, M., Macke, A., Ehrlich, A., Lüpkes, C., Mech, M., Chechin, D., Dethloff, K., Velasco, C. B., Bozem, H., Brückner, M., Clemen, H.-C., Crewell, S., Donth, T., Dupuy, R., Ebell, K., Egerer, U., Engelmann, R., Engler, C., Eppers, O., Gehrmann, M., Gong, X., Gottschalk, M., Gourbeyre, C., Griesche, H., Hartmann, J., Hartmann, M., Heinold, B., Herber, A., Herrmann, H., Heygster, G., Hoor, P., Jafariserajehlou, S., Jäkel, E., Järvinen, E., Jourdan, O., Kästner, U., Kecorius, S., Knudsen, E. M., Köllner, F., Kretzschmar, J., Lelli, L., Leroy, D., Maturilli, M., Mei, L., Mertes, S., Mioche, G., Neuber, R., Nicolaus, M., Nomokonova, T., Notholt, J., Palm, M., van Pinxteren, M., Quaas, J., Richter, P., Ruiz-Donoso, E., Schäfer, M., Schmieder, K., Schnaiter, M., Schneider, J., Schwarzenböck, A., Seifert, P., Shupe, M. D., Siebert, H., Spreen, G., Stapf, J., Stratmann, F., Vogl, T., Welti, A., Wex, H., Wiedensohler, A., Zanatta, M., and Zeppenfeld, S.: The Arctic Cloud Puzzle: Using ACLOUD/PASCAL Multiplatform Observations to Unravel the Role of Clouds and Aerosol Particles in Arctic Amplification, B. Am. Meteorol. Soc., 100, 841–871, https://doi.org/10.1175/BAMS-D-18-0072.1, 2019. a
Westbrook, C. D. and Illingworth, A. J.: Evidence that ice forms primarily in supercooled liquid clouds at temperatures > −27 °C, Geophys. Res. Lett., 38, L14808, https://doi.org/10.1029/2011GL048021, 2011. a
Wieder, J., Ihn, N., Mignani, C., Haarig, M., Bühl, J., Seifert, P., Engelmann, R., Ramelli, F., Kanji, Z. A., Lohmann, U., and Henneberger, J.: Retrieving ice-nucleating particle concentration and ice multiplication factors using active remote sensing validated by in situ observations, Atmos. Chem. Phys., 22, 9767–9797, https://doi.org/10.5194/acp-22-9767-2022, 2022a. a
Wieder, J., Mignani, C., Schär, M., Roth, L., Sprenger, M., Henneberger, J., Lohmann, U., Brunner, C., and Kanji, Z. A.: Unveiling atmospheric transport and mixing mechanisms of ice-nucleating particles over the Alps, Atmos. Chem. Phys., 22, 3111–3130, https://doi.org/10.5194/acp-22-3111-2022, 2022b. a
Wolff, M. A., Isaksen, K., Petersen-Øverleir, A., Ødemark, K., Reitan, T., and Brækkan, R.: Derivation of a new continuous adjustment function for correcting wind-induced loss of solid precipitation: results of a Norwegian field study, Hydrol. Earth Syst. Sci., 19, 951–967, https://doi.org/10.5194/hess-19-951-2015, 2015. a
Yang, F., Cantrell, W. H., Kostinski, A. B., Shaw, R. A., and Vogelmann, A. M.: Is Contact Nucleation Caused by Pressure Perturbation?, Atmosphere, 11, 1, https://doi.org/10.3390/atmos11010001, 2020. a
Young, G., Connolly, P. J., Jones, H. M., and Choularton, T. W.: Microphysical sensitivity of coupled springtime Arctic stratocumulus to modelled primary ice over the ice pack, marginal ice, and ocean, Atmos. Chem. Phys., 17, 4209–4227, https://doi.org/10.5194/acp-17-4209-2017, 2017. a
Young, G., Lachlan-Cope, T., O'Shea, S. J., Dearden, C., Listowski, C., Bower, K. N., Choularton, T. W., and Gallagher, M. W.: Radiative Effects of Secondary Ice Enhancement in Coastal Antarctic Clouds, Geophys. Res. Lett., 46, 2312–2321, https://doi.org/10.1029/2018GL080551, 2019. a, b, c, d, e
Young, K. C.: The role of contact nucleation in ice phase initiation in clouds, J. Atmos. Sci., 31, 768–776, 1974. a, b, c, d
Zhao, X., Liu, X., Phillips, V. T. J., and Patade, S.: Impacts of secondary ice production on Arctic mixed-phase clouds based on ARM observations and CAM6 single-column model simulations, Atmos. Chem. Phys., 21, 5685–5703, https://doi.org/10.5194/acp-21-5685-2021, 2021. a, b
- Abstract
- Introduction
- Observations
- Modeling setup and methods
- Results and discussion
- Conclusions
- Appendix A: Weather map
- Appendix B: Impact of adapting updraft CCNC in the MY scheme
- Appendix C: Impact of RS mixing ratio threshold changes on simulated ICNC
- Code and data availability
- Author contributions
- Competing interests
- Disclaimer
- Acknowledgements
- Financial support
- Review statement
- References