the Creative Commons Attribution 4.0 License.
the Creative Commons Attribution 4.0 License.
 | 20 Jun 2024
Emission characteristics of reactive organic gases (ROGs) from industrial volatile chemical products (VCPs) in the Pearl River Delta (PRD), China
Sihang Wang
Xianjun He
Ru Cui
Yubin Chen
Caihong Wu
Chaomin Wang
Yibo Huangfu
Xiao-Bing Li
Boguang Wang
Min Shao
Volatile chemical products (VCPs) have become an important source of reactive organic gases (ROGs) in urban areas worldwide. Industrial activities can also utilize a large number of VCPs and emit many organic gases into the atmosphere. Due to multiple sampling and measurement challenges, only a subset of ROG species is usually measured for many industrial VCP sources. This study aims to investigate the emissions of ROGs from five industrial VCP sources in the Pearl River Delta (PRD) region of China, including the shoemaking, plastic surface coating, furniture coating, printing, and ship coating industries. A more comprehensive speciation of ROG emissions from these industrial VCP sources was developed by the combination of proton-transfer-reaction time-of-flight mass spectrometer (PTR-ToF-MS) and the gas chromatography–mass spectrometer/flame ionization detector (GC–MS/FID). Our study identified oxygenated ROG species (OVOCs) as representative ROGs emitted from these sources, which are highly related to specific chemicals used during industrial activities. Moreover, mass spectra similarity analysis revealed significant dissimilarities among the ROG emissions from industrial activities, indicating substantial variations between different industrial VCP sources. Except for the ship coating industry utilizing solvent-borne coatings, the proportions of OVOCs range from 67 % to 96 % in total ROG emissions and 72 % to 97 % in total OH reactivity (OHR) for different industrial sources, while the corresponding contributions of OVOCs in the ship coating industry are only 16 ± 3.5 % and 15 ± 3.6 %. The industrial VCP sources associated with solvent-borne coatings exhibited a higher ozone formation potential (OFP), reaching as high as 5.5 and 2.7 g O3 g−1 ROGs for the ship coating and furniture coating industries, primarily due to contributions from aromatics. We find that a few species can contribute the majority of the ROG emissions and also their OHR and OFP from various industrial VCP sources. Our results suggest that ROG treatment devices may have limited effectiveness for all ROGs, with treatment efficiencies ranging from −12 % to 68 %. Furthermore, we found that ambient measurements in industrial areas have been significantly impacted by industrial VCP sources, and ROG pairs (e.g., methyl ethyl ketone (MEK) C8 aromatics ratio) can be utilized as reliable evidence by using high-time-resolution ROG measurements from PTR-ToF-MS. Our study demonstrated the importance of measuring a large number of ROGs using PTR-ToF-MS for characterizing ROG emissions from industrial VCP sources.
- Article
(6208 KB) - Full-text XML
-
Supplement
(1917 KB) - BibTeX
- EndNote


With the successful control of vehicular emissions, emissions from volatile chemical products (VCPs) have become an increasingly significant source in cities all around the world (Sun et al., 2018; McDonald et al., 2018; Li et al., 2019; Khare and Gentner, 2018; Seltzer et al., 2022; Sasidharan et al., 2023). Reactive organic gases (ROGs), organic gases other than methane, from VCP emissions can contribute substantially to both anthropogenic secondary organic aerosols (SOAs) and ozone (O3) in urban environments (Seltzer et al., 2022; Khare et al., 2022; Sasidharan et al., 2023; Coggon et al., 2021; Gkatzelis et al., 2021b; Qin et al., 2021). With the development of economy and industrialization, the emissions of industrial VCPs contribute to approximately 25 %–45 % of ROG emissions in China (Ou et al., 2015; Wei et al., 2011; Huang et al., 2011; Sha et al., 2021; Zhou et al., 2020b). To effectively control atmospheric pollution in urban areas and surrounding regions, it becomes imperative to gain a comprehensive understanding of the emission characteristics of ROGs from industrial VCP sources.
Extensive research has been conducted to investigate ROG emissions from industrial VCP sources, mainly focusing on sampling within manufacturing workshops and exhaust stacks (Zheng et al., 2013; Yuan et al., 2010; Wang et al., 2014). Previous studies have demonstrated that the use of individual chemicals (i.e., coatings, inks, and adhesives) significantly impact ROG emissions (Gkatzelis et al., 2021a; Zheng et al., 2013; He et al., 2022a), and these chemicals used for the printing, furniture, and shoemaking industries have seen rapid growth and widespread adoption in recent years (Gkatzelis et al., 2021a; McDonald et al., 2018; Seltzer et al., 2022; Coggon et al., 2021). Consequently, the diverse emission sources and emission factors from industrial VCP sources have contributed to large uncertainties (Mo et al., 2021; Zhong et al., 2018). To mitigate the emissions of most primary pollutants, stricter emission standards have been implemented along with advancements in ROG treatment technologies in China. Specifically, water-borne VCPs has substituted solvent-borne VCPs in several industries, such as printing, interior wall coating, and automotive manufacturing. However, the replacement in the steel structures, automotive plastic parts manufacturing, and ship building industries remains below 3 % (Mo et al., 2021; Li et al., 2019; Shi et al., 2023; Wang et al., 2023). As a result, the emission characteristics of ROGs from industrial VCP sources may undergo changes in response to the ongoing development of VCPs and ROG treatment technologies. It is imperative to regularly update the understanding of ROG emission characteristics associated with industrial VCP sources.
The emissions of oxygenated ROG species (OVOCs) have been identified as significant components in industrial VCP emissions (Chang et al., 2022; Mo et al., 2021; Sha et al., 2021). For instance, it has been found that more than 80 % of total ROG emissions for the shoemaking and printing industries are attributed to OVOC emissions (Zheng et al., 2013). This notable contributions of OVOCs, such as acetone, methyl ethyl ketone (MEK), ethyl acetate, and isopropanol, can be primarily attributed to the use of individual industrial chemicals (Zheng et al., 2013; J. Wu et al., 2020). Traditionally, the collection of ROGs involved the use of canisters or Tedlar bags, and their analysis was conducted using gas chromatography–mass spectrometer/flame ionization detector (GC–MS/FID) techniques, with a primary focus on hydrocarbon emissions (Yuan et al., 2010; Wang et al., 2014). Previous studies commonly employed 2,4-dinitrophenylhydrazine (DNPH) cartridges for collection and analyzed them using high-performance liquid chromatography (HPLC) to detect carbonyl species such as aldehydes and ketones. However, this approach is both time-consuming and susceptible to contaminations (Mo et al., 2016; Han et al., 2019).
Due to the intricate chemical compositions of industrial VCPs, it is essential to characterize ROG emissions with higher mass resolution. Proton-transfer-reaction time-of-flight mass spectrometer (PTR-ToF-MS) has been extensively utilized for the identification of VCP sources. More evidence shows that the contribution of VCP sources to anthropogenic ROG emissions is gradually becoming more prominent. For instance, ROG emissions from VCPs contribute 50 %–80 % of anthropogenic ROG emissions in US cities (Gkatzelis et al., 2021b; McDonald et al., 2018). The large fractions (∼ 50 %) of ROGs have been attributed to a VCP-dominated source in Guangzhou, highlighting its importance in urban environments (Li et al., 2022). Through high-resolution mass analysis, tracer compounds for various VCP categories have been identified (Gkatzelis et al., 2021a; Coggon et al., 2018; Stockwell et al., 2021). In addition, OVOCs such as acetates, acrylates, alcohols (e.g., benzyl alcohol), glycols (e.g., propylene glycol, ethylene glycol), and glycol ethers have been found to make significant contributions to VCP emissions (Seltzer et al., 2021; Li and Cocker, 2018; Li et al., 2018; Khare et al., 2022). With the ability to measure whole mass spectra and offer high-resolution mass spectrometry, PTR-ToF-MS enables more comprehensive detection of a wide range of ROGs (Cappellin et al., 2012; Yuan et al., 2017; Huangfu et al., 2021). By employing parameterization methods to determine instrument sensitivity, more ROGs can be quantified from the obtained mass spectra (Sekimoto et al., 2017; C. Wu et al., 2020). Furthermore, previous studies have demonstrated that higher alkanes, including acyclic, cyclic, and bicyclic alkanes, can be measured using PTR-ToF-MS with NO+ chemical ionization (NO+ PTR-ToF-MS) (Inomata et al., 2014; Koss et al., 2016; Wang et al., 2020; Chen et al., 2022). Higher alkanes are significant species in vehicle and combustion emissions (Gao et al., 2023; Liu et al., 2021; Y. Zhao et al., 2018), and they were not included in previous measurements of industrial VCP sources. Thus, by combining hydrocarbons measured by an offline GC–MS/FID, PTR-ToF-MS shows promise as a method for developing more comprehensive speciation relevant to industrial VCP emissions (Gao et al., 2023).
In this study, we applied PTR-ToF-MS, employing H3O+ and NO+ chemical ionization along with a GC–MS/FID to comprehensively measure ROG emissions from five industrial VCP sources, including the shoemaking, plastic surface coating, furniture coating, printing, and ship coating industries, in the Pearl River Delta (PRD) region of China. We investigated emission characteristics of ROGs across these industries and utilized the dataset to analyze the contributions of different ROG components to total ROG emissions, OH reactivity (OHR), ozone formation potential (OFP), and volatility in various industrial VCP sources. Furthermore, we conducted intercomparisons of the mass spectra characterizations of ROG emissions, which revealed significant variations in ROG emissions from industrial VCP sources.
2.1 Tested industrial VCP sources and sampling methods
Based on comprehensive analysis of written data, consultation with relevant experts, and thorough on-site investigations, we selected five representative factories and industries from various industrial VCP sources. The selection criteria for these industries were based on relevant emission inventory research conducted in the PRD region of China (Zhong et al., 2018). Sampling methods focused on capturing ROG emissions generated during the main manufacturing processes, such as the spraying of coatings and the use of adhesives in factories. Both online measurements and offline sampling were carried out in semi-open workshops and using ROG treatment devices (i.e., before and after emission treatment, generally located at the front and rear sampling ports of the ROG treatment devices) in factories (Table S1 in the Supplement).
Typically, workshop waste gases are routed through collection devices (e.g., gas-collecting hoods, airtight partitions) and then processed in ROG treatment devices (e.g., ultraviolet (UV)-ray oxidation, activated carbon adsorption, combustion, and biodegradation). These treated gases are then released into the atmosphere through exhaust stacks. ROG treatment devices play a crucial role in reducing ROG emissions by employing recovery and destruction technologies (Wang et al., 2023; Kamal et al., 2016). Recovery processes involve enriching and separating VOCs by means of temperature or pressure changes and selective absorbents, while destruction processes convert VOCs into harmless substances such as CO2 and H2O through combustion (Wang et al., 2023). In this study, we evaluate two types of ROG treatment devices: activated carbon adsorption combined with UV photolysis devices (installed in the shoemaking, plastic surface coating, furniture coating, and printing industries) and catalytic combustion devices (installed in the printing and ship coating industries).
During the campaign, a mobile monitoring vehicle was equipped with online measurement equipment and strategically parked near emissions from the sampling ports of both workshops and ROG treatment devices (Fig. S1 in the Supplement). A CO H2O gas analyzer (LI-840A, LI-COR Inc., USA) was used to measure the concentrations of CO2 and H2O. To ensure continuous sampling, air from various factories was drawn through a length of perfluoroalkoxy (PFA) Teflon tubing, ranging from 10 to 100 m, at a controlled flow rate of 6 L min−1 facilitated by an external pump. The use of long tubing was assessed through laboratory tests, which showed that the tubing had a negligible and minor influence on most ROG species. This confirmed the feasibility of measurement using long PFA tubing; more detail can be found elsewhere (Li et al., 2023).
2.2 ROG measurements
In this study, ROGs were measured using a proton-transfer-reaction quadrupole-interface time-of-flight mass spectrometer (PTR-QiToF-MS) (IONICON Analytik, Innsbruck, Austria) (Sulzer et al., 2014) and a combination of canister sampling and an offline GC–MS/FID analysis system (canister GC–MS/FID). A more comprehensive speciation of ROGs was achieved by analyzing hydrocarbons by canister GC–MS/FID, quantifying all signals using H3O+ PTR-ToF-MS and supplementing with acyclic, cyclic, and bicyclic alkanes from NO+ ionization of PTR-ToF-MS. The selection of overlapping ROGs was similar to a previous study (Table S2) (Gao et al., 2023).
To capture the real-time emission characteristics of ROGs from industrial VCP sources, the mass spectra of PTR-ToF-MS were recorded every 10 s. Prior to each test, background measurements of the instrument were carried out by passing sampling air through a custom-built platinum catalytical converter that had been preheated to 365 °C for 1 min. Throughout the campaign, the PTR-ToF-MS instrument automatically alternated between two reagent ions (H3O+ and NO+) every 10 min. Detailed setting parameters for H3O+ and NO+ chemical modes in this instrument can be found in previous studies (C. Wu et al., 2020; Wang et al., 2020; He et al., 2022b). The Tofware software package (version 3.0.3, Tofwerk AG, Switzerland) was employed to facilitate accurate data analysis (Stark et al., 2015).
Calibration for ROGs measured by PTR-ToF-MS were carried out both in the laboratory and during the campaign. The PTR-ToF-MS instrument was regularly calibrated using a 23-component gas standard (SPECTRA, Linde) throughout the campaign. During the later period of the campaign, two gas standards (Apel-Riemer Environmental Inc.) were used for the calibration of other ROGs, specifically for acyclic and cyclic alkanes using NO+ chemical ionization (Wang et al., 2020; Chen et al., 2022; Wang et al., 2022). A total of 11 organic acids and nitrogen-containing compounds were calibrated using the liquid calibration unit (LCU; IONICON Analytik, Innsbruck, Austria) (Tables S3–S5). In order to account for the humidity dependence of some ROGs in the PTR-ToF-MS instrument (Yuan et al., 2017; Koss et al., 2018), humidity-dependence curves established in the laboratory were utilized for correction (C. Wu et al., 2020; He et al., 2022b; Wang et al., 2022). Sensitivities of uncalibrated species were determined based on the kinetics of proton-transfer reactions of H3O+ with ROGs (Fig. S2) (Cappellin et al., 2012; Sekimoto et al., 2017), with an associated uncertainty of approximately 50 % for the concentrations of uncalibrated species.
Simultaneously, offline sampling was conducted near the sampling ports of workshops and ROG treatment devices. Whole air samples were collected using canisters for the determination of hydrocarbons in industrial VCP sources and analyzed by an offline GC–MS/FID system. The GC–MS/FID system was calibrated using photochemical assessment monitoring stations (PAMS) and TO-15 standard mixtures, which enabled the identification and quantification of a total of 94 hydrocarbons. More information about this instrument and the dataset for canister sampling and the offline GC–MS/FID system can be found elsewhere (Li et al., 2020).
2.3 Calibrations of esters and isopropanol based on H3O+ and NO+ ionization
Since ester species (including acetates and acrylates) play a significant role in industrial VCP sources, it is important to accurately quantify their concentrations (Khare et al., 2022). Previous studies have demonstrated that ethyl acetate exhibits notable fragmentation, resulting in interference at 61 (e.g., C2H4O2H+) and 43 (e.g., C2H2OH+) (Haase et al., 2012; de Gouw and Warneke, 2007; Rogers et al., 2006; Fortner et al., 2009). Therefore, we employed the PTR-ToF-MS instrument to directly measure high-purity ester chemicals and identify the characteristic product ions produced by esters under H3O+ and NO+ chemical ionization. Several common esters, including methyl acetate, ethyl acetate, isopropyl acetate, and vinyl acetate, were selected to investigate instrument fragmentation under different ionizations. As shown in Table S6, it is intriguing to observe that high-molecular-weight acetates tend to exhibit more fragmentation, resulting in interference at 61 (e.g., C2H4O2H+) and 43 (e.g., C2H2OH+). Methyl acetate (95 %) and ethyl acetate (72 %) displayed limited fragmentation in the instrument, while isopropyl acetate accounted for only 13 % of the C5H10O2H+ ions. Additionally, esters with different chemical structures may undergo distinct modes of fragmentation, for example, vinyl acetate primarily fragmented to produce interfering fragments at 43 (e.g., C2H2OH+) with a fraction of 78 %. Furthermore, considering the PTR-ToF-MS mass spectra from various industrial VCP sources, it is conceivable that other ester compounds might also contribute to these mass channels, emphasizing the need for cautious consideration of 61 (e.g., C2H4O2H+) and 43 (e.g., C2H2OH+) signals measured by H3O+ PTR-ToF-MS in industrial VCP sources. The use of NO+ chemical ionization exhibits various reaction pathways with ROGs (Wang et al., 2020; Chen et al., 2022), which can partially mitigate interference from fragment ions (Table S6). The identified results of acetates based on NO+ ionization demonstrated considerable improvements for methyl acetate (83 %) and ethyl acetate (80 %), whereas vinyl acetate exhibited more fragmentation, with the largest contribution (47 %) at 43 (e.g., C2H2OH+).
Additionally, it is challenging to calibrate isopropanol in H3O+ PTR-ToF-MS, since alcohols split off water during ionization (Buhr et al., 2002). To overcome this challenge, we implemented daily calibrations of isopropanol under ambient humidity conditions throughout the campaign (Fig. S3). NO+ PTR-ToF-MS was also employed to calibrate isopropanol by identifying the characteristic product ions produced under NO+ ionization (Table S6). The dominating product ion of isopropanol was observed at 59 (e.g., C3H7O+) (88 %), which corresponds to acetone (C3H6OH+) ions in H3O+ PTR-ToF-MS. Although the dominant product ion for acetone under NO+ ionization was observed at 88 (e.g., C3H6O(NO)+) (77 %), the interfere at 59 (e.g., C3H6OH+) (23 %) was not insignificant. Therefore, the concentration of isopropanol measured by NO+ PTR-ToF-MS in this campaign has eliminated the influence of acetone. Finally, the comparison between PTR-ToF-MS with H3O+ and with NO+ chemical ionization is shown in Figs. S4–S5. Previous studies have shown good agreement between measurements obtained using PTR-ToF-MS with H3O+ and NO+ chemical ionization in ambient measurements (Wang et al., 2020). However, a slightly weaker correlation was observed in industrial VCP sources, potentially due to the large changes for different species between the switch of the two reagent ions. Our results demonstrated that NO+ PTR-ToF-MS can also provide a complementary approach for characterizing ester species and isopropanol in ambient air and emission sources.
2.4 Mass spectra similarity analysis
We conducted a comprehensive comparison of various ROG emission sources by regarding the entire range of species in mass spectra as dimensions in a vector and calculating the cosine angle (θ) similarity (Humes et al., 2022; Ulbrich et al., 2009; Kostenidou et al., 2009). The angle θ between the two mass spectra (MSa and MSb) is given by the following:
The θ angle between two mass spectra is divided into four groups, including 0–15, 15–30, 30–50, and > 50°, which correspond to excellent consistency, good consistency, many similarities, and poor consistency, respectively. Due to the distinct ionization methods of the instruments, our classification of angle similarity is not as strict as that reported in previous studies (Kostenidou et al., 2009; Zhu et al., 2021), as these previous studies utilize the similarity analysis on mass spectra of an aerosol mass spectrometer (AMS) obtained from electron ionization, leading to very similar mass spectra for different sources.
3.1 Time-resolved ROG emissions from industrial VCP sources
Time series of several ROGs measured by H3O+ PTR-ToF-MS from five industrial VCP sources are shown in Figs. 1 and S6. More information on these sources can be found in Sect. S1 in the Supplement. Online measurements were carried out in semi-open workshops (workshop emissions) and from ROG treatment devices (i.e., emissions before and after treatment). As the waste gas was directly discharged into the ambient air from exhaust stacks, the after-treatment emissions can be regarded as stack emissions (Zheng et al., 2013). The average concentrations of eight representative ROGs, including aromatics, ketones, alcohols, and esters, between workshop emissions and stack emissions for all factories is presented in Fig. S7. The evaluation of the ROG treatment efficiency is based on the analysis of emission characteristics before and after treatment in the ROG treatment devices, which is discussed in greater detail in Sect. 3.3. Along with the typical ROGs, the PTR-ToF-MS instrument measured a wide range of ions in abundance in the mass spectra. Figure 2 displays mass spectra representing the average concentrations of stack emissions from five industrial VCP sources for all detected ROGs. These ROGs measured by the PTR-ToF-MS instrument were categorized based on their chemical formula, namely hydrocarbon species (CxHy), OVOCs (CxHyO1, CxHyO2, and CxHyO≥ 3), species containing nitrogen and/or sulfur atoms (N/S-containing), species containing siloxanes (Si-containing), and other ions (others).
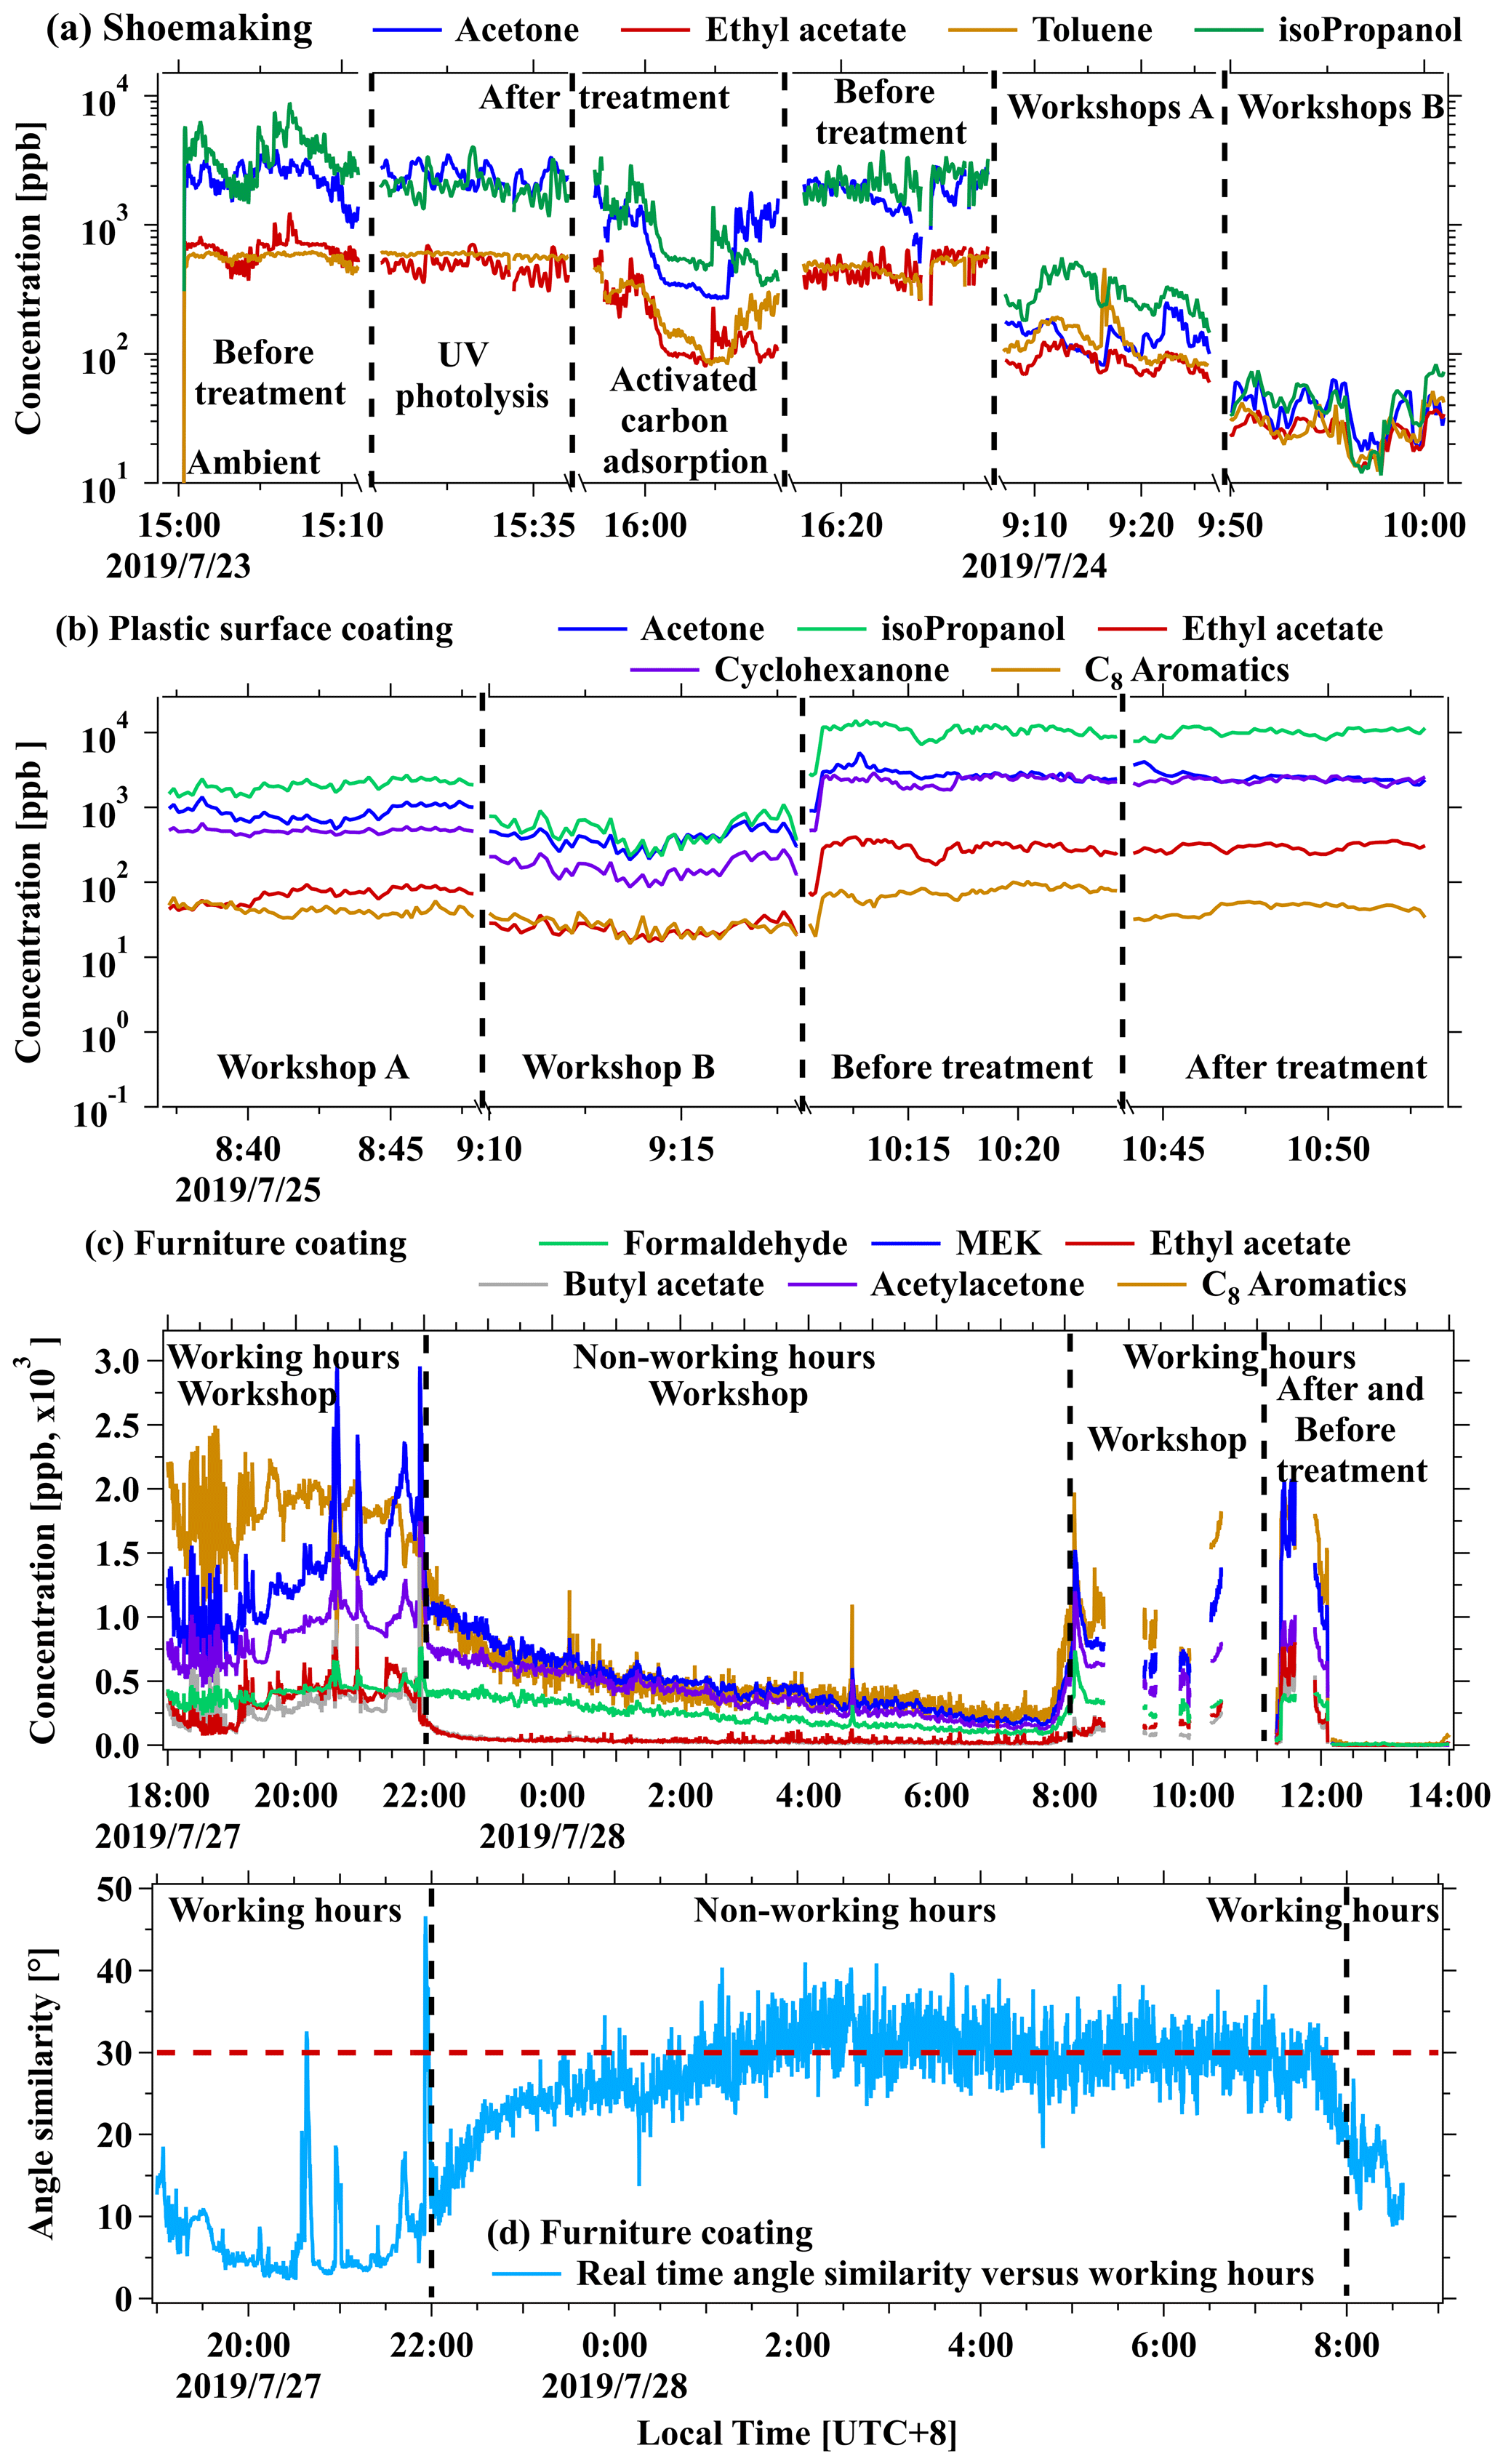
Figure 1Real-time concentrations of representative ROGs from workshops, before and after the ROG treatment devices, (a) in the shoe making industry, (b) in the plastic surface coating industry, and (c) during working hours or non-working hours in the furniture coating industry. (d) The θ angles of mass spectra among real-time concentrations versus average concentration during working time (19:00–22:00 LT) in the furniture coating industry.
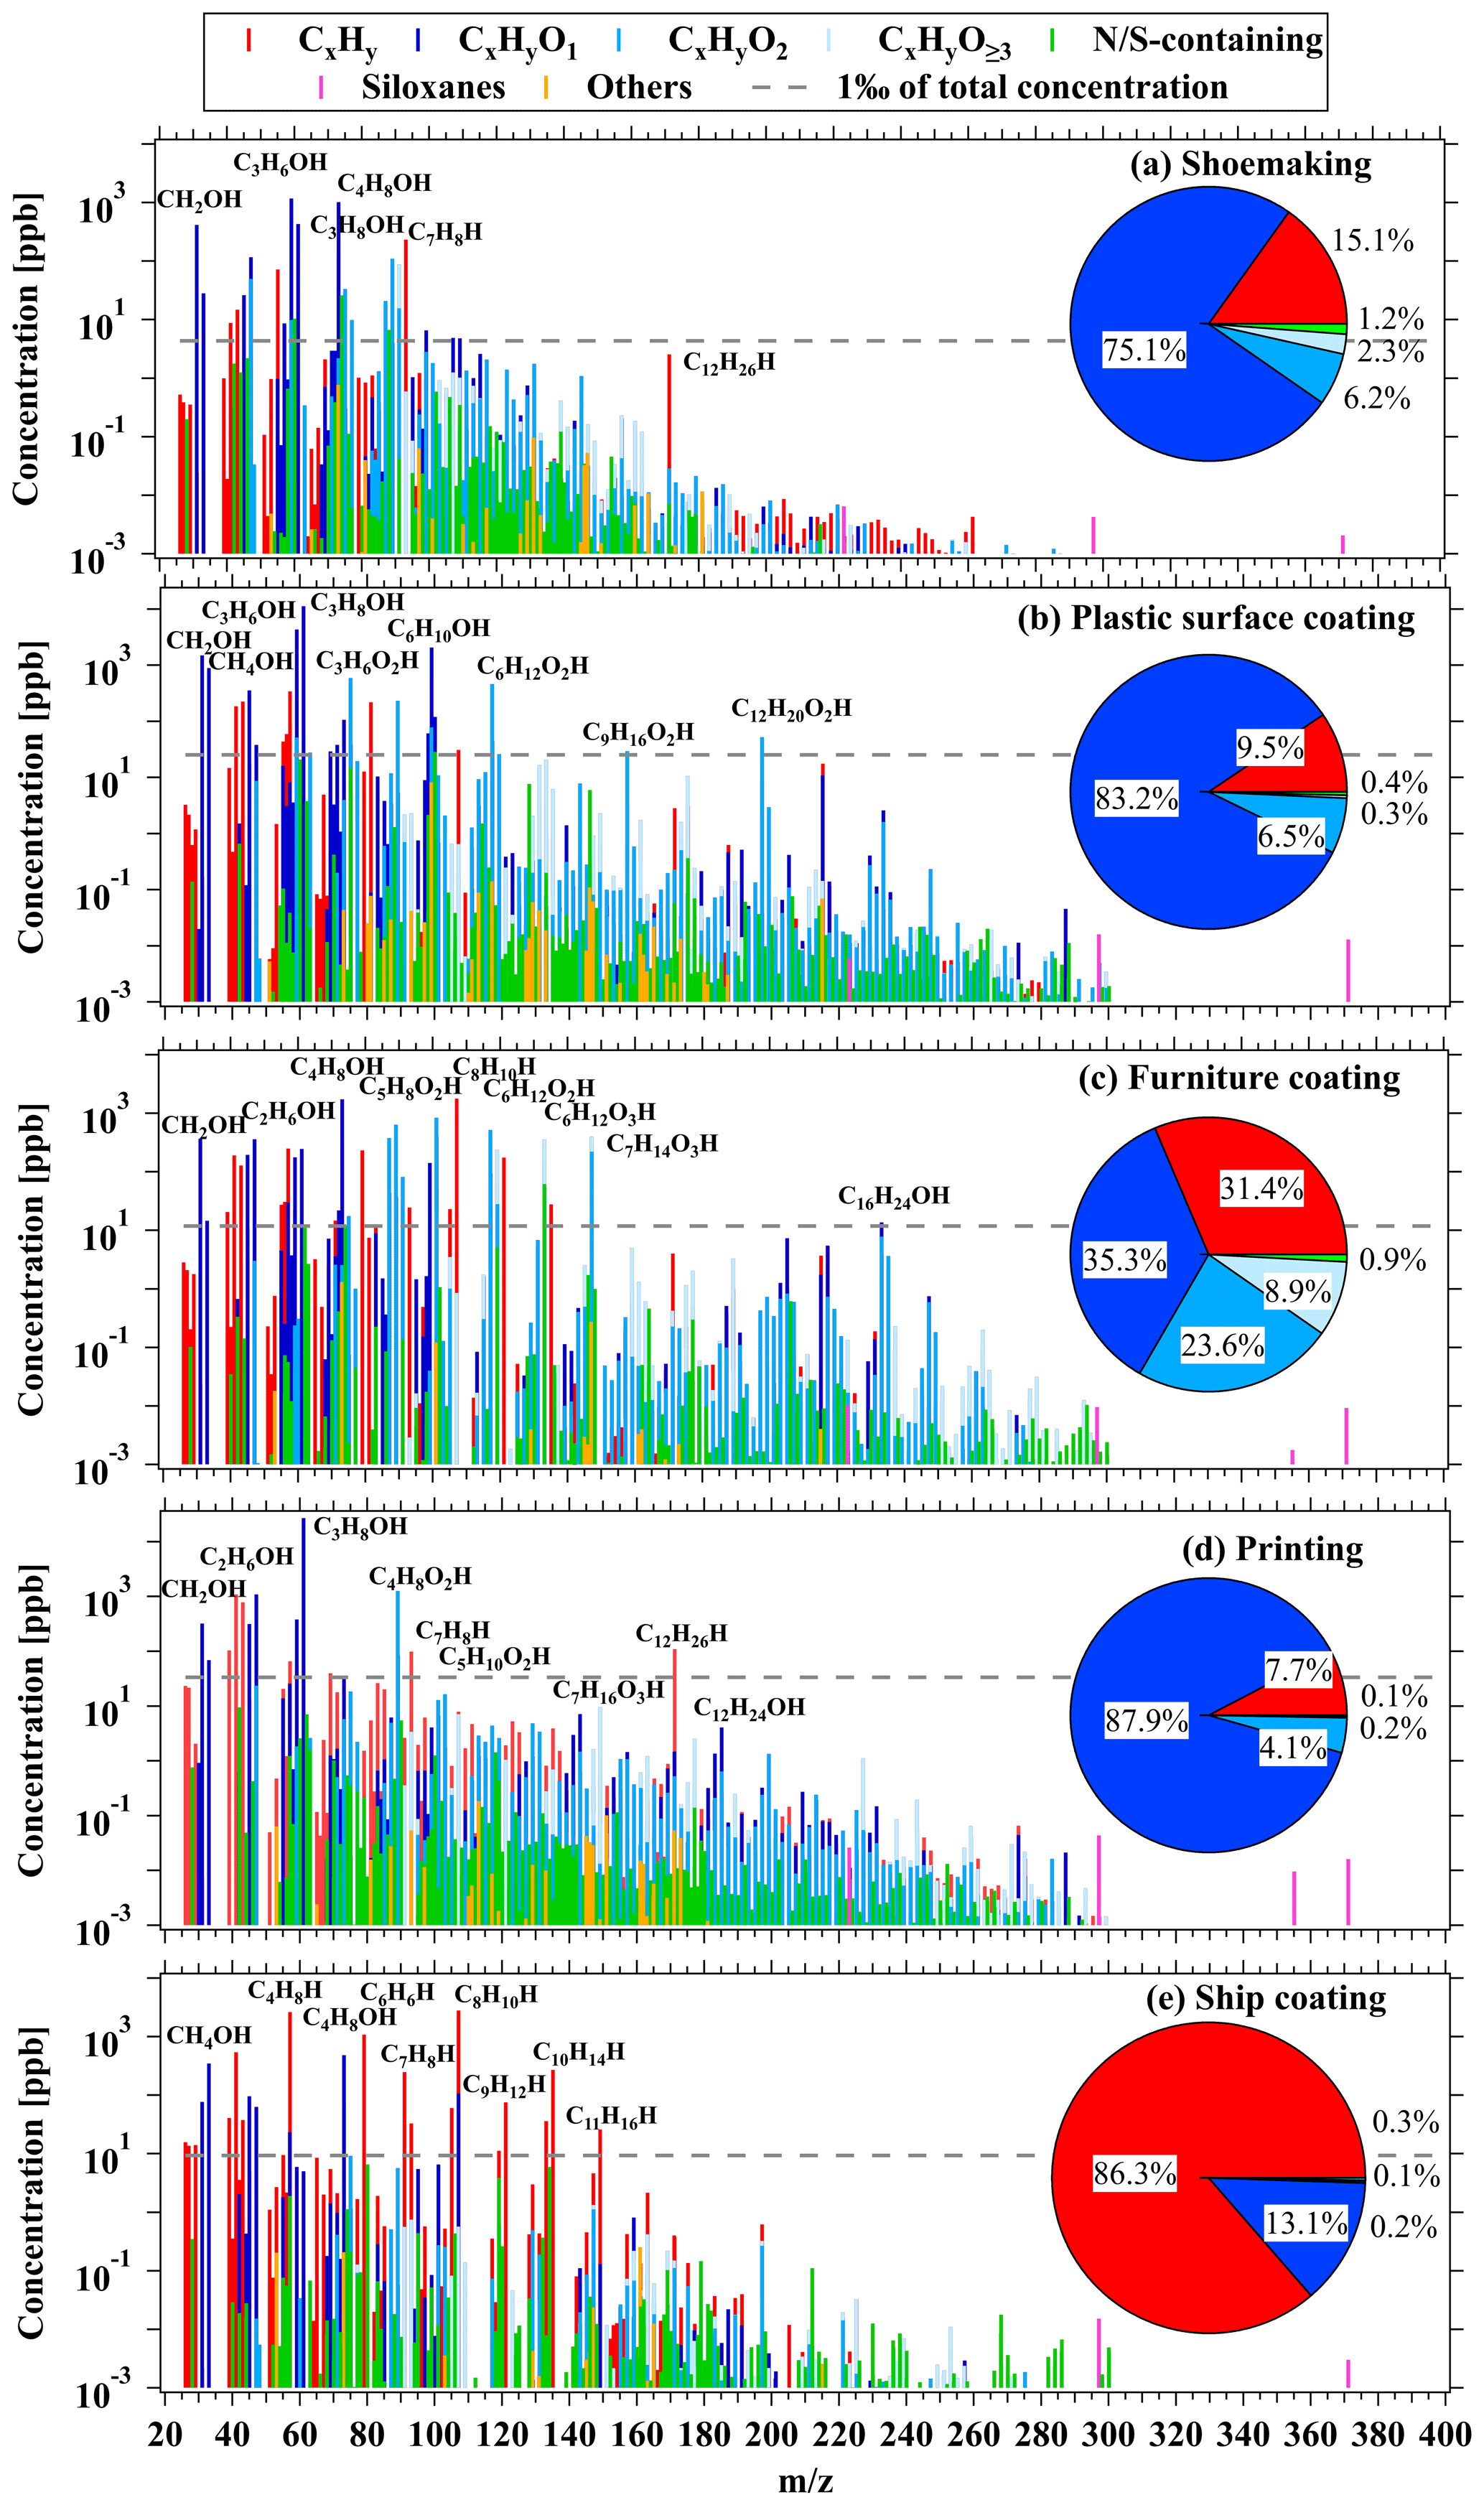
Figure 2Average concentrations and fractions of ROGs measured by PTR-ToF-MS from stack emissions in the (a) shoemaking, (b) plastic surface coating, (c) furniture coating, (d) printing, and (e) ship coating industries.
3.1.1 Emission characteristics from industrial VCP sources
A. Shoemaking industry
Real-time concentrations of toluene, acetone, ethyl acetate, and isopropanol from the shoemaking industry are displayed in Fig. 1a. The variable manufacturing process conditions are demonstrated by inconsistent emission levels in the workshops. This variation may be attributed to different emission intensities during different periods. Notably, the significant emissions from the shoemaking industry are primarily attributed to a few low-molecular-weight OVOCs (Fig. 2a), including acetone, MEK, isopropanol, and formaldehyde, followed by a fraction of hydrocarbon species (e.g., toluene). Our results align with previous findings (Zheng et al., 2013; R. Zhao et al., 2018), emphasizing that raw chemicals used during industrial activities play crucial roles in determining the constituents of the industrial VCP emissions.
B. Plastic surface coating industry
Significant variations in ROG concentrations were also observed from the plastic surface coating industry (Fig. 1b). These variations could be attributed to different manufacturing process conditions and to the use of different chemicals in workshops as well. As shown in Fig. 2b, OVOCs contribute significantly to emissions from this industry. Representative OVOCs for CxHyO1 ions consist of isopropanol, acetone, formaldehyde, methanol, and cyclohexanone. CxHyO2 ions refer to acetates and acrylates such as C3H6O2 (e.g., methyl acetate), C6H12O2 (e.g., butyl acetate), C9H16O2 (e.g., allyl hexanoate), and C12H20O2 (e.g., linalyl acetate). Notably, there are some differences to the main components compared to previous results (Zhong et al., 2017), which may be attributed to the substitution of solvent-borne chemicals with water-borne chemicals in industrial VCPs.
C. Furniture coating industry
Due to the wide variety of industrial coatings used in the furniture coating industry, numerous ROGs can be observed in the measured mass spectra (Fig. 2c). Notably, CxHyO2 (24 %) and CxHyO3 (9 %) ions contribute significantly in this industry. Among the identified species, C8 aromatics exhibit the highest concentrations, consistent with previous research from industries utilizing solvent-borne coatings (Yuan et al., 2010; J. Wu et al., 2020; Wang et al., 2014). Other OVOCs such as MEK, ethanol, and formaldehyde for CxHyO1 ions; C6H12O2 (e.g., butyl acetate) and C5H8O2 (e.g., methyl methacrylate, acetylacetone) for CxHyO2 ions; and C6H12O3 (e.g., propylene glycol methyl ether acetate; PGMEA) and C7H14O3 (e.g., butyl lactate) for CxHyO3 ions may be associated with emissions from water-borne coatings. This finding underscores the importance of considering high-molecular-weight OVOCs in this industry, further emphasizing the ability of PTR-ToF-MS to better characterize these important OVOCs that serve as raw chemicals for industrial VCPs.
Moreover, by employing online PTR-ToF-MS technology, we can gain deeper insights into the emission characteristics of ROGs during both working and non-working hours. We conducted an analysis of ROG emissions in a furniture coating factory during non-working hours (from 22:00 to 08:00 the next day) and compared them with emissions during working hours (Fig. 1c). Most ROGs exhibited a gradual decrease in concentration during non-working hours, with the exception of formaldehyde, which maintained a constant concentration. Notably, the concentrations of other typical ROGs, such as MEK and C8 aromatics, were 2–5 times lower during non-working hours compared to working hours. This observation suggests that ROGs may still be emitted even when the painting activities in the factory are halted, with night-time emissions accounting for approximately 20 % of total daily emissions. The θ angles of mass spectra between real-time concentrations versus working hours show that ROG emissions have many similarities during both working and non-working hours (Fig. 1d; θ < 30° at most times). Additionally, the poor similarity observed between real-time concentrations in workshops during non-working hours and those in the outside air suggests that outside air has minimal influence on ROG emissions during non-working hours (Fig. S8). Given that some ROGs were still more abundant and continued to be released into the atmosphere even during non-working hours (e.g., from the volatilization of chemicals), the ROG emissions in factories during non-working hours should not be ignored.
D. Printing industry
The real-time concentrations of typical ROGs measured from the printing industry are shown in Fig. S6a, with an emphasis on the performance of two different ROG treatment devices, namely activated carbon adsorption combined with ultraviolet (UV)-ray photolysis devices and catalytic combustion devices (specifically, regenerative thermal oxidizer (RTO) devices) installed in this factory. Isopropanol was found to have the highest concentration in the printing industry (Fig. 2d), which is consistent with previous studies (Zheng et al., 2013). The higher concentrations of other typical species, such as C4H8O2 (e.g., ethyl acetate), C5H10O2 (e.g., isopropyl acetate), and C7H16O3 (e.g., dipropylene glycol methyl ether; DPM), substantiate the correlation between ROG emissions and industrial inks utilized in the printing industry. It was found that ROG treatment devices exhibit varying treatment efficiencies for ROGs, particularly for OVOCs (such as isopropanol and ethanol), that may not have been effectively removed by these treatment devices.
E. Ship coating industry
In comparison to other industrial VCP sources, the ship coating industry exhibits the highest emissions of hydrocarbons (86 %), specifically C6–C11 aromatics (Fig. 2e; also in Fig. S6b, Sect. S1). This may be attributed to the utilization of solvent-borne industrial coatings for ship coating remaining prevalent due to stringent requirements for anti-rust and anti-corrosion properties (Malherbe and Mandin, 2007). A few OVOCs, such as methanol and MEK, were identified as significant emissions. These results confirm that ROG emissions from solvent-borne coatings, predominantly composed of C8 aromatics, continue to be the primary contributors in the ship coating industry, which is consistent with a previous study conducted in the PRD region (Zhong et al., 2017).
3.1.2 Comparison of ROG composition from industrial VCP sources
The quantification of the proportions of different ion categories measured by the PTR-ToF-MS instrument across various industrial VCP sources is shown in Figs. 2 and S9. OVOCs make up the largest fractions in the printing (94 %), plastic surface coating (90 %), shoemaking (84 %), and furniture coating (68 %) industries, while they only account for 13 % of emissions from the ship coating industry. The fractions of different OVOC groups exhibit a general decline from CxHyO1 to CxHyO≥ 3, and OVOCs with more than two oxygen atoms are present in small proportions (0.3 %–8.5 %) in all industrial VCP sources except for the furniture coating industry (33 %), indicating few emissions of these species. However, although these OVOCs with two or more oxygen atoms do not contribute significantly to the overall emissions, some of them may serve as tracer compounds for particular emission sources as they were only detected in a single source. Previous studies have identified octamethylcyclotetrasiloxane (D4 siloxane), Texanol (C12H24O3), and parachlorobenzotrifluoride (PCBTF; C7H4ClF3) as tracer compounds for individual chemicals (adhesives and coatings) in US cities (Gkatzelis et al., 2021a). We also observed that the concentrations of Texanol and PCBTF emitted by relevant industrial VCP sources were unique and almost non-existent in other sources. Texanol was only detected in samples from the plastic surface coating and furniture coating industries that utilize water-borne coatings. Similarly, PCBTF was only found in samples from the ship coating and furniture coating industries that use solvent-borne coatings. These findings suggest that Texanol and PCBTF may be applicable as tracer compounds for industrial VCPs in China. On the contrary, D4 siloxane was not found to be specific to emissions from adhesive-related industries (i.e., shoemaking industry) (Fig. 2), indicating that D4 siloxane may not be an appropriate tracer compound for identifying industrial VCPs in China.
3.2 Distributions of ROG emissions, OHR, OFP, and volatility
We compared the mass spectra of these industrial VCP sources and calculated the similarity of the θ angles (Fig. 3, Table S7). The ROGs showed a diverse similarity among different types of industrial VCP sources. Only the plastic surface coating industry versus the printing industry demonstrated good consistency (27°), while other mass spectra exhibited poor consistency (θ > 60°). Combined with mass spectra of vehicular emissions (Wang et al., 2022), the θ angle similarities among the mass spectra of industrial VCP sources (62–90°) were worse than those of vehicular emissions (41–75°) (Fig. 3). It is interesting to observe that the θ angle similarity among the mass spectra in different workshops in the printing and ship coating industries ranged from 1.6 to 9.0° (Table S8), similar to the mass spectra in various emission standards for gasoline vehicles (4.9–17°) (Table S9). Conversely, the θ angle similarity among the mass spectra of workshops in other industrial VCP sources ranged from 13 to 60°, indicating significant differences in ROG emissions from industrial VCP sources. These substantial differences indicate that ROG emissions from industrial VCPs are more complex and diverse than vehicular emissions. Consequently, a more accurate classification of industrial VCP emissions is necessary, as they cannot be directly unified as a single class of emission sources.
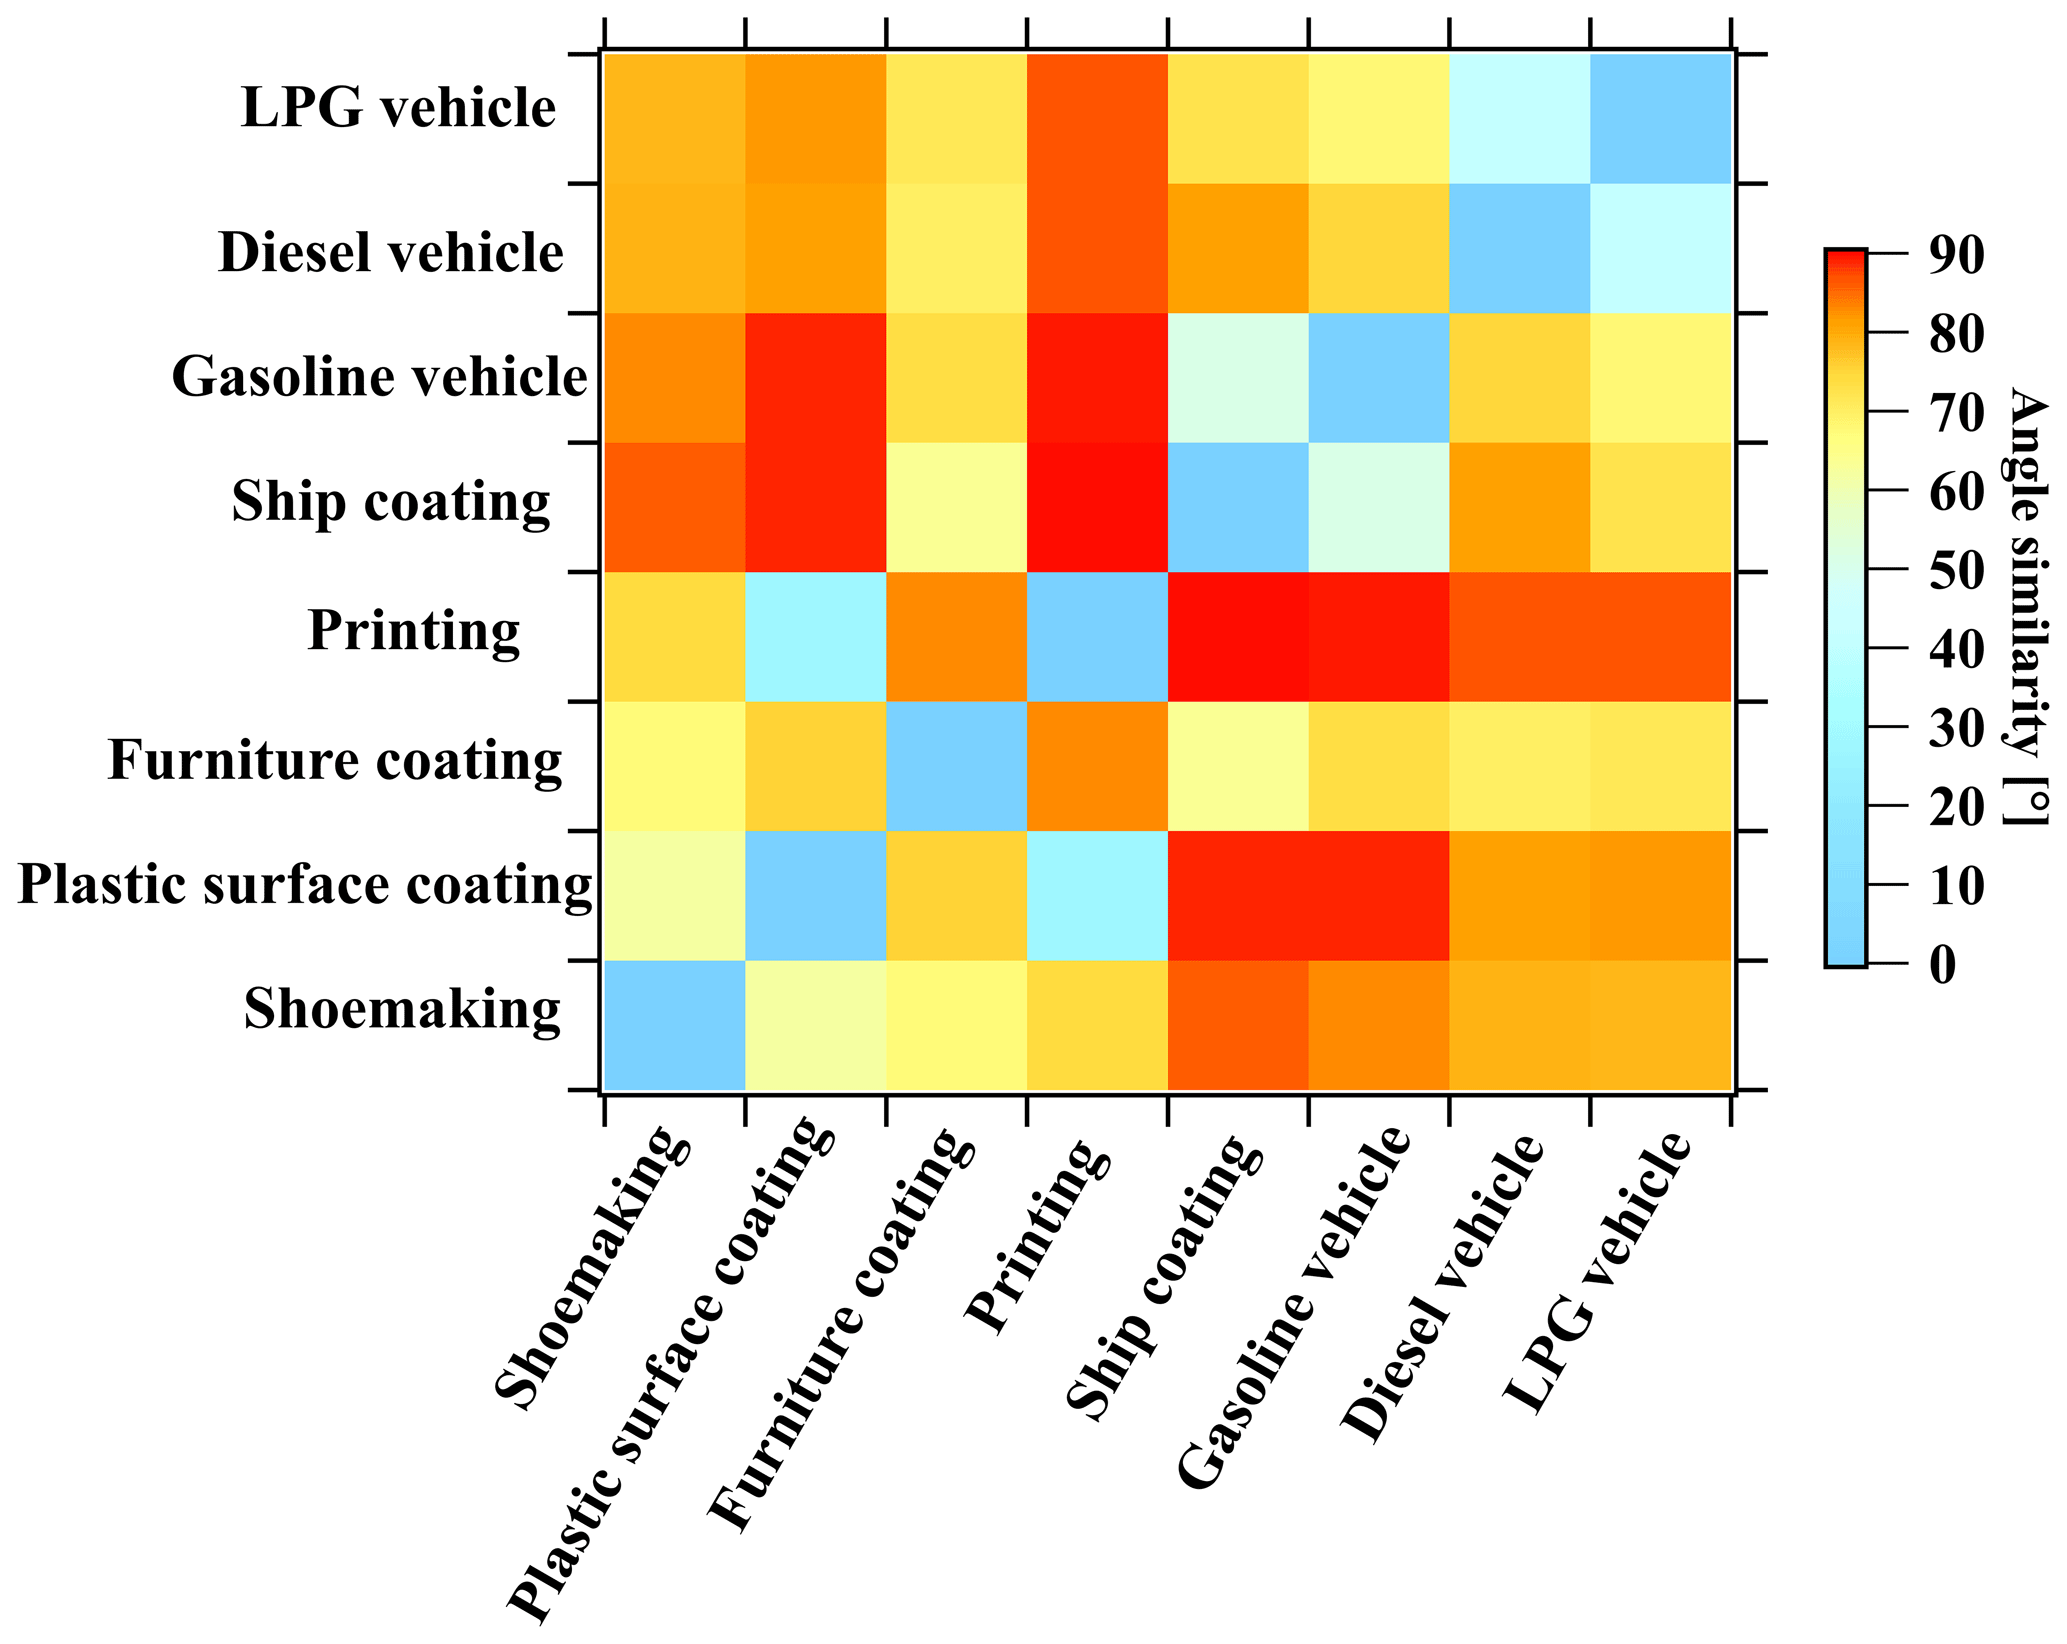
Figure 3The θ angles among the mass spectra of industrial VCP sources in this study and vehicular emissions from a previous study (Wang et al., 2022).
The combination of PTR-ToF-MS and canister GC–MS/FID measurements allowed for more comprehensive speciation of ROG emissions from industrial VCP sources. This comprehensive approach enabled the determination of the fractions of ROGs in total ROG emissions for various industrial VCP sources (Table S10, Fig. S5; details in Sect. S2). Additionally, the reactivity of ROGs plays a crucial role in characterizing the contributions of different ROGs to atmospheric chemical reactions and the formation of secondary pollutants (C. Wu et al., 2020; Yang et al., 2016). The overall OHR of ROGs was calculated to comprehend the role of ROGs emitted by industrial VCP sources. The calculation only employed ROGs with known reaction rate constants with the OH radical, which were taken from previous studies (Atkinson and Arey, 2003; Atkinson et al., 2004, 2006; Koss et al., 2018; C. Wu et al., 2020; Zhao et al., 2016). The fractions of ROGs in the total OHR of ROGs can be determined for various industrial VCP sources (Table S11). ROGs are grouped into categories, including OVOCs, N/S-containing, and heavy aromatics and monoterpenes measured by H3O+ PTR-ToF-MS; higher alkanes (including C10–C20 acyclic, cyclic, and bicyclic cycloalkanes) measured by NO+ PTR-ToF-MS; and alkanes, alkenes, aromatics, and halohydrocarbons measured by canister GC–MS/FID.
OVOCs contributed significantly to total ROG emissions (Fig. 4a), and fractions of OVOCs in total ROG emissions are comparable to previous studies (Fig. 5). Notably, OVOCs account for 67 % of total ROG emissions from the shoemaking industry, which is slightly lower than findings from other studies in the PRD region (Zheng et al., 2013) but higher than those reported in previous studies (Zhou et al., 2020a; Zhao et al., 2018a). The fractions of OVOCs in total ROG emissions from the plastic surface coating, printing, and furniture coating industries are 96 ± 0.2 %, 85 ± 6.5 %, and 77 %, respectively. Compared to previous studies (Zhong et al., 2017; Zheng et al., 2013; Fang et al., 2019; Zhao et al., 2018a; Wang et al., 2019; Zhou et al., 2020a; Zhao et al., 2021), determined OVOC fractions for these industrial VCP sources are much higher (Fig. 5), which may be related to two reasons: (1) more OVOC species are detected in this study, and (2) water-borne coatings and inks are more widely employed in recent years, which may enhance OVOC fractions. Moreover, OVOCs account for 16 ± 3.5 % of total ROG emissions from the ship coating industry by using the solvent-borne coatings, and the fraction is also higher than findings from a previous study (Zhong et al., 2017). Additionally, OVOCs also contribute to the largest fraction in total OHR of ROGs from all industrial VCP sources (72 %–97 %) except for the ship coating industry (15 ± 3.6 %) (Fig. 4b). In contrast to the important contribution of OVOCs, the fractions of hydrocarbons measured by canister GC–MS/FID only made considerable contributions to specific industrial VCP sources (Fig. 4). For instance, aromatics were found to be the major contributors to both total ROG emissions and OHR in the ship coating industry, making up 74 ± 6.1 % and 79 ± 4.8 %, respectively. Alkanes measured by canister GC–MS/FID only make contributions in the shoemaking industry, comprising 26 % of the total ROG emissions. Overall, the total OHR of ROGs was dominated by OVOCs and aromatics, and the contributions of other species were in the range of 1.8 %–21 % (Fig. 4b). These results stress the importance of measuring a broad range of OVOCs using PTR-ToF-MS in characterizing ROG emissions from industrial VCP sources.
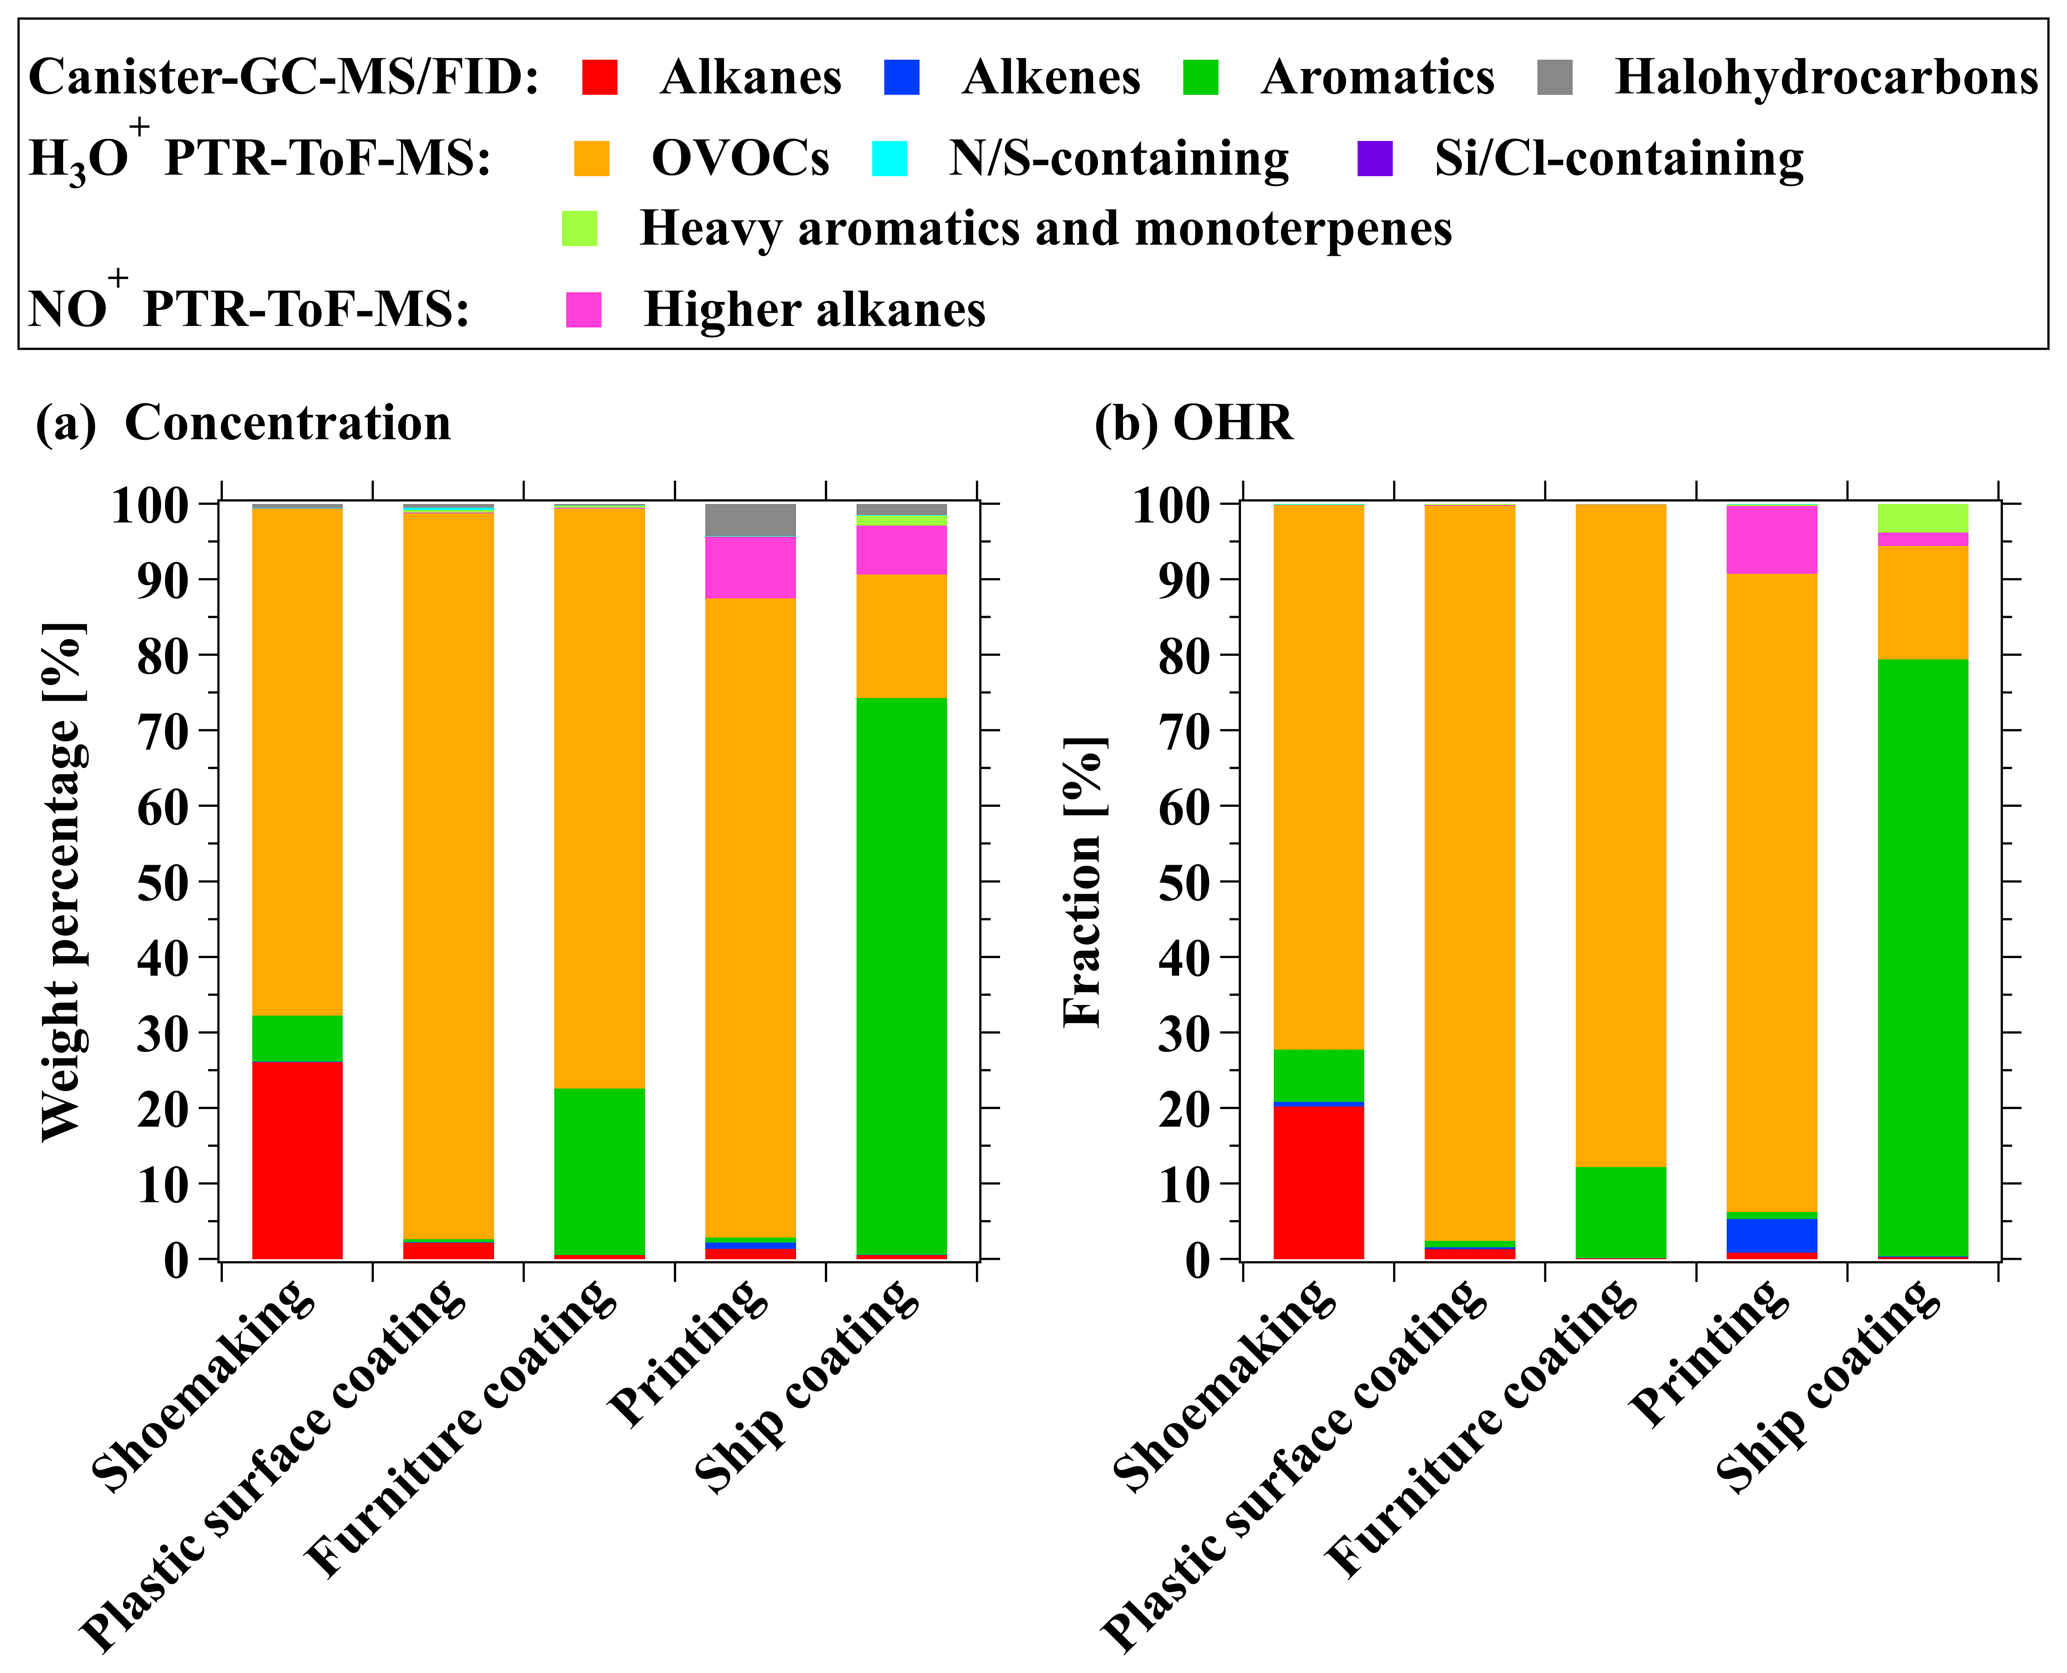
Figure 4Fractions of (a) concentrations and (b) OHR for ROG components to total ROGs from stack emissions in the shoemaking, plastic surface coating, furniture coating, printing, and ship coating industries.
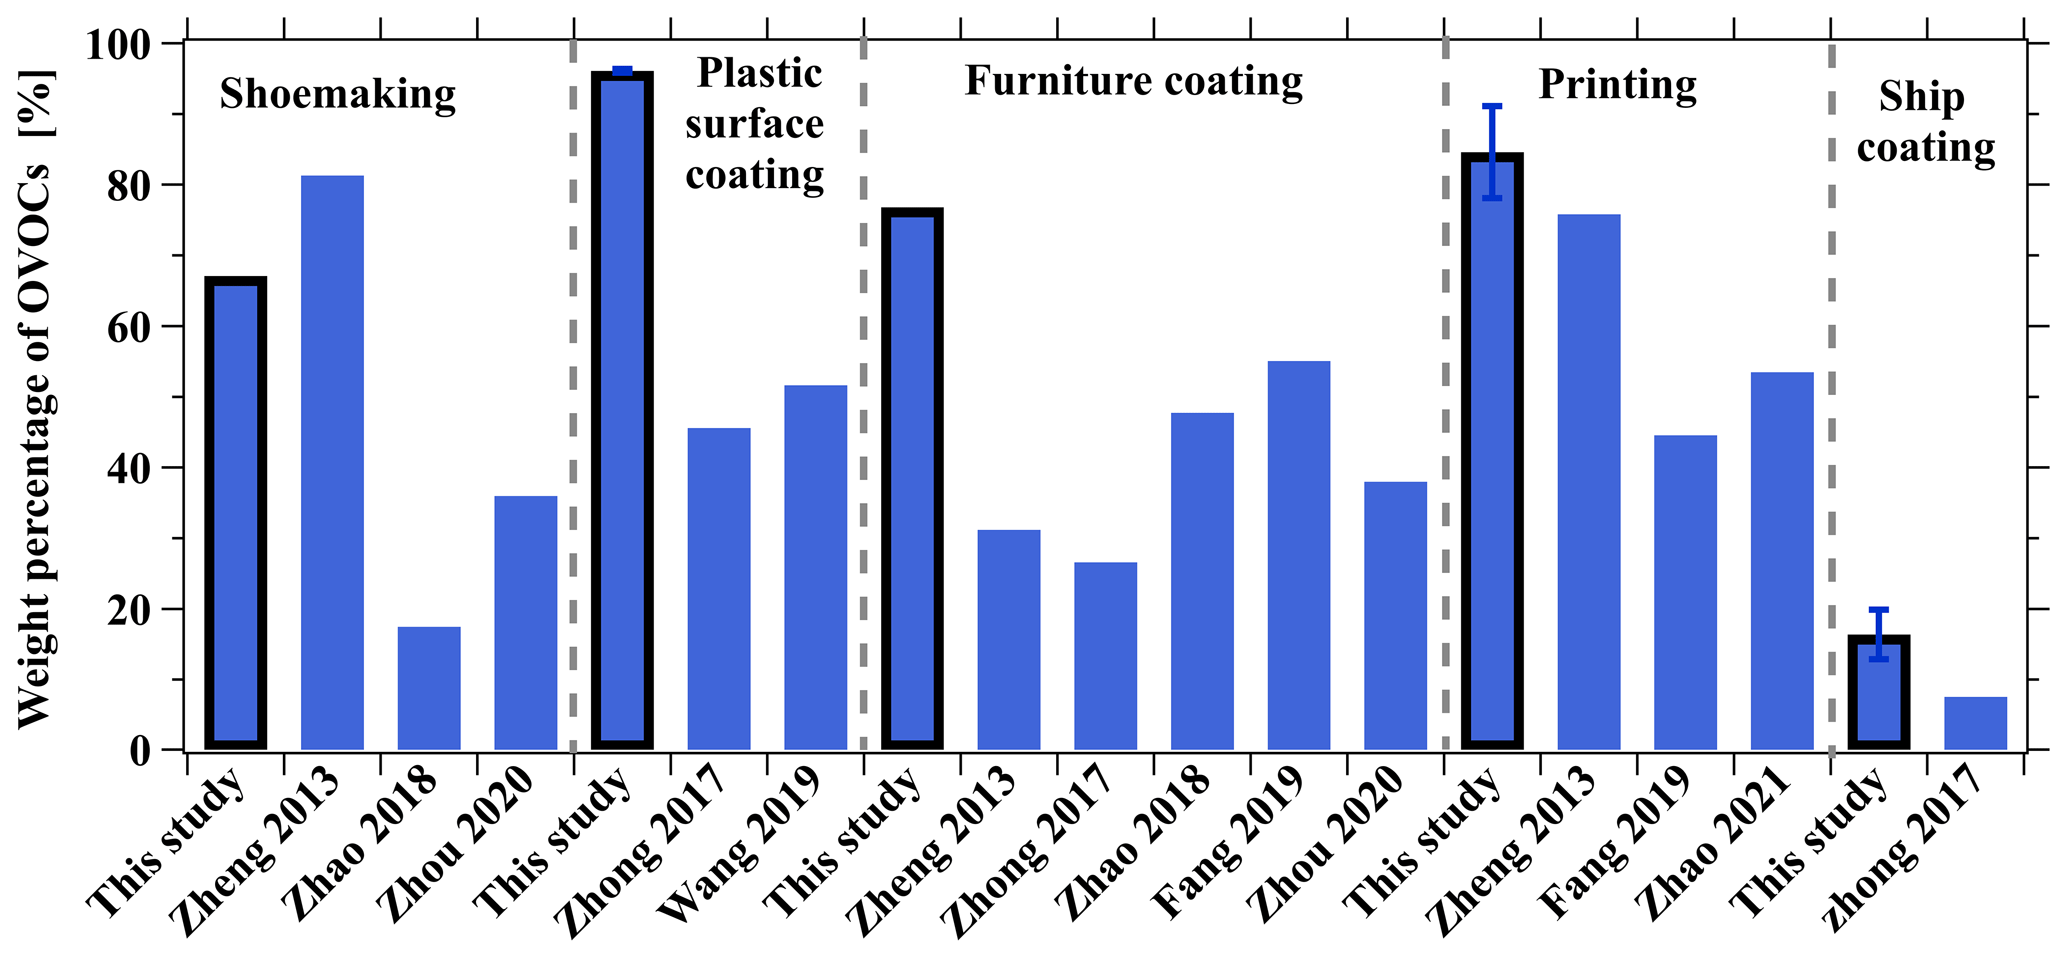
Figure 5Comparison of OVOC fractions determined from stack emissions of industrial VCP sources in this study and those in previous studies. Error bars represent the standard deviations of the weight percentage of OVOCs.
The application of NO+ PTR-ToF-MS provided the opportunity for detecting emissions of higher alkanes from industrial VCP sources. We show that the contribution of higher alkanes can be significant for VCP sources. Specifically, the printing industry demonstrates a noteworthy presence of higher alkanes, accounting for 27 ± 2.7 % and 8.2 ± 2.4 % in workshop and stack emissions, respectively (Table S10). This can be attributed to the use of lubricating oil, a primary component of industrial inks, which contains substantial amounts of alkanes (Liang et al., 2018). Furthermore, emissions from forklifts transporting products in printing workshops also contribute to the emission of higher alkanes (Li et al., 2021), suggesting that non-road vehicles may contribute to the emissions from industrial VCP factories. In addition, the fractions of higher alkanes in stack emissions are lower than in workshops, suggesting that ROG treatment devices effectively reduce emissions of higher alkanes.
To facilitate making controlling strategies of ozone, we determine the OFP from a unity of emissions from different sources for comparison (Yuan et al., 2010; Na and Pyo Kim, 2007), which represent the ability to form ozone from ROG sources on a relative basis (Fig. 6), and calculate this using the following equation:
where OFPi is the estimated ozone formation amount when 1 g ROGs is emitted from source i, fji is the mass fraction of species j in source i, and MIRj is the maximum incremental reactivity (MIR) of species j (Carter, 2010). Among the industrial VCP sources considered, the ship coating industry exhibited the highest OFP, reaching as high as 5.5 g O3 g−1 ROGs, followed by the furniture coating industry, with a value of 2.7 g O3 g−1 ROGs. The OFP for other industrial VCP sources ranged from 0.79 to 1.4 g O3 g−1 ROGs. Among all industrial VCP sources, aromatics (ranging from 4.2 % to 91 %) and OVOCs (ranging from 6.7 % to 94 %) were identified as the primary contributors to OFP. Compared to vehicular emissions, the OFP from the ship coating and furniture coating industries is significantly higher (Fig. 6), suggesting that these sources should be controlled as a priority. Given the higher reactivity value for the ship coating industry relative to other sources, it is evident that controlling ROG emissions from solvent-borne industrial chemicals would have a more substantial impact on reducing ozone formation compared to other sources. Moreover, it is important to note that the emissions of solvent-borne chemicals surpass those of vehicles, while water-borne chemicals have lower emissions compared to vehicles. This observation implies that the substitution of solvent-borne chemicals with water-borne chemicals in China holds considerable importance in mitigating and controlling ozone pollution.
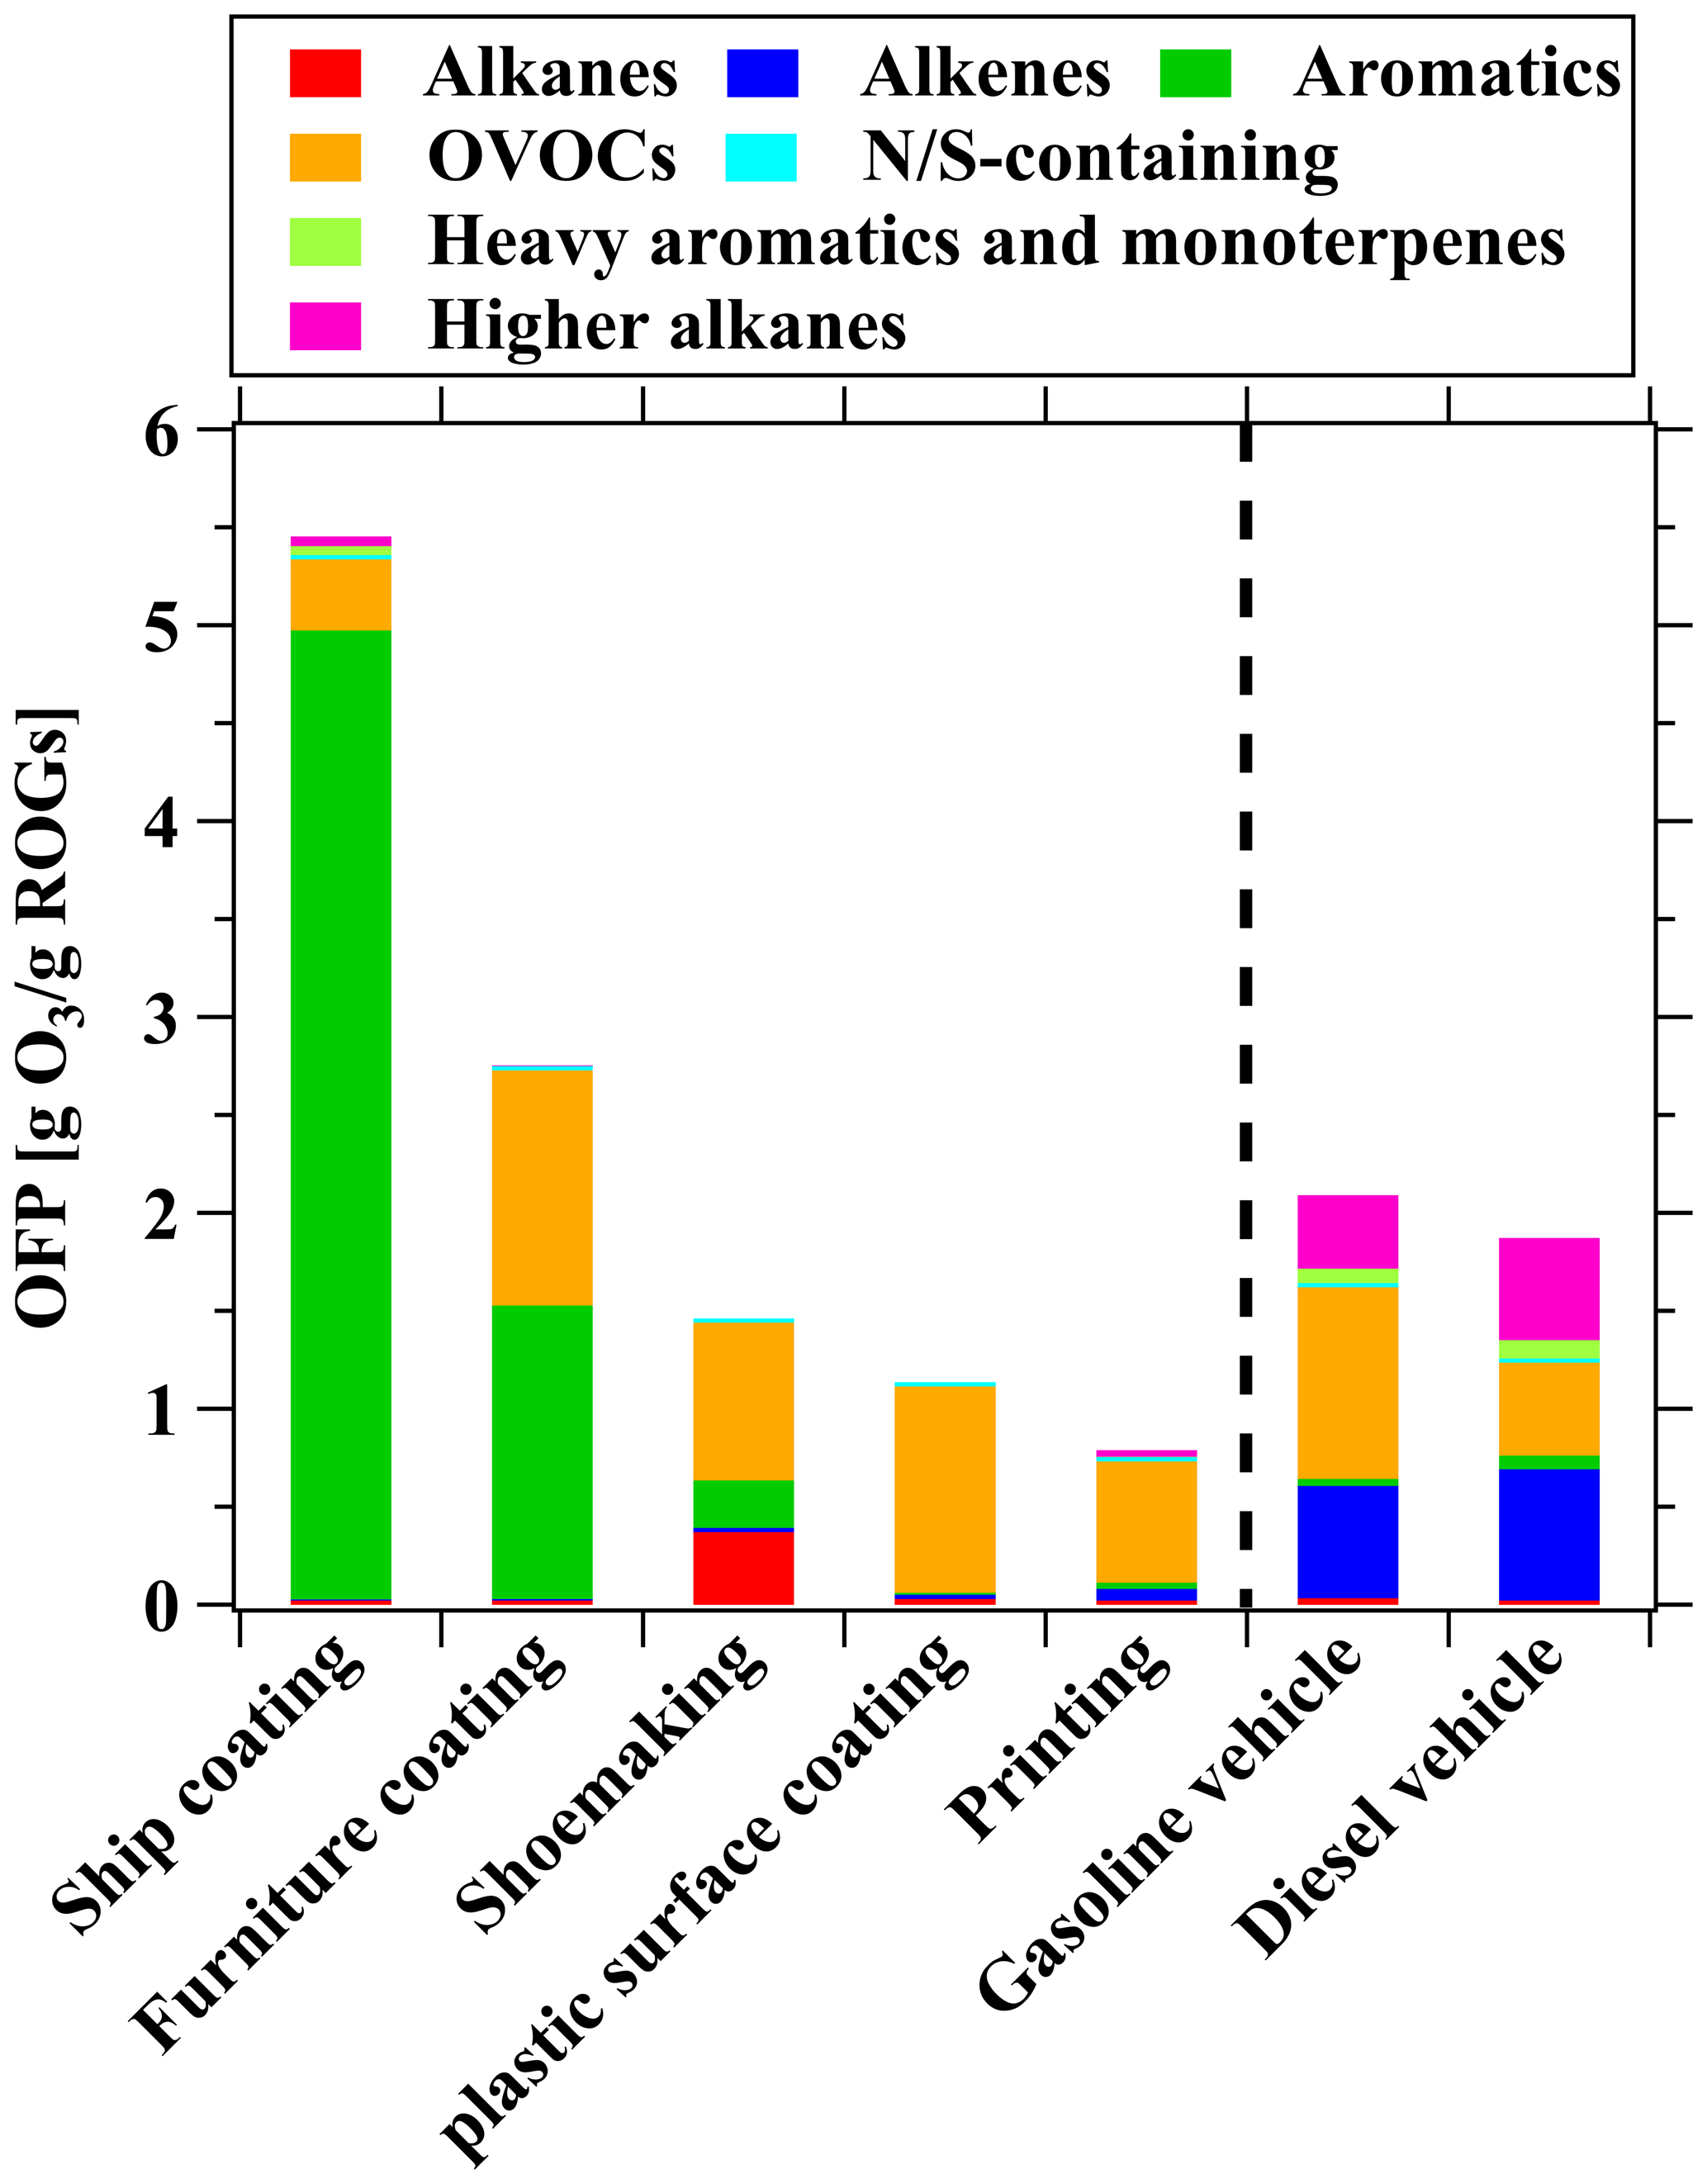
Figure 6Comparison of OFP among various industrial VCP sources in this study and vehicular emissions from a previous study (Wang et al., 2022).
We further compare centralization for species among different ROG sources by determining the contribution from the top 10 species in terms of concentrations, OHR, and OFP (Figs. 7 and S10; also in Table S12). We show that the top 10 ROGs account for over 50 % of ROG emissions, OHR, and OFP (Fig. 7). With the exception of the furniture coating industry, the fractions of the top 10 species in total emissions, OHR, and OFP from industrial VCP sources were in range of 89 %–96 %. The lower fractions (ranging from 69 % to 86 %) of the top 10 species in the furniture coating industry may be a result of the wider range of industrial coatings (i.e., both solvent-borne and water-borne coatings) utilized in this industry. ROGs emitted from industrial VCP sources are apparently more centralized compared to vehicular emissions (ranging from 51 % to 87 %). Additionally, the cumulative fractions of the top 100 species in overall ROG emissions, OHR, and OFP in various industrial VCP sources are further indicated by the highly centralization of ROG emissions from various emission sources (Fig. S10). More than half of the top 10 species in ROG emissions, OHR, and OFP from industrial VCP sources were OVOCs (Table S13). Among them, isopropanol made a notable contribution to the printing, plastic surface coating, and shoemaking industries. Other OVOCs such as MEK, acetone, and ethyl acetate contributed to total ROG emissions in each industry, while formaldehyde and acetaldehyde contributed to total OHR and OFP. It should be noted that the proportions of C13, C14, and C15 cycloalkanes from the printing industry (accounting for 6.3 % of ROG emissions) and the proportion of C11 aromatics from the ship coating industry (accounting for 1.0 % of ROG emissions) are not negligible. Additionally, acetylacetone is a common species with broad industrial applications and contributes importantly to the formation of secondary pollutants in polluted environments (Ji et al., 2018). Although it only contributes 8.7 % to total emissions from the furniture coating industry, its fraction in terms of total OHR can be as high as 30 %. These findings demonstrate that previously underreported ROGs should receive greater attention in future research.
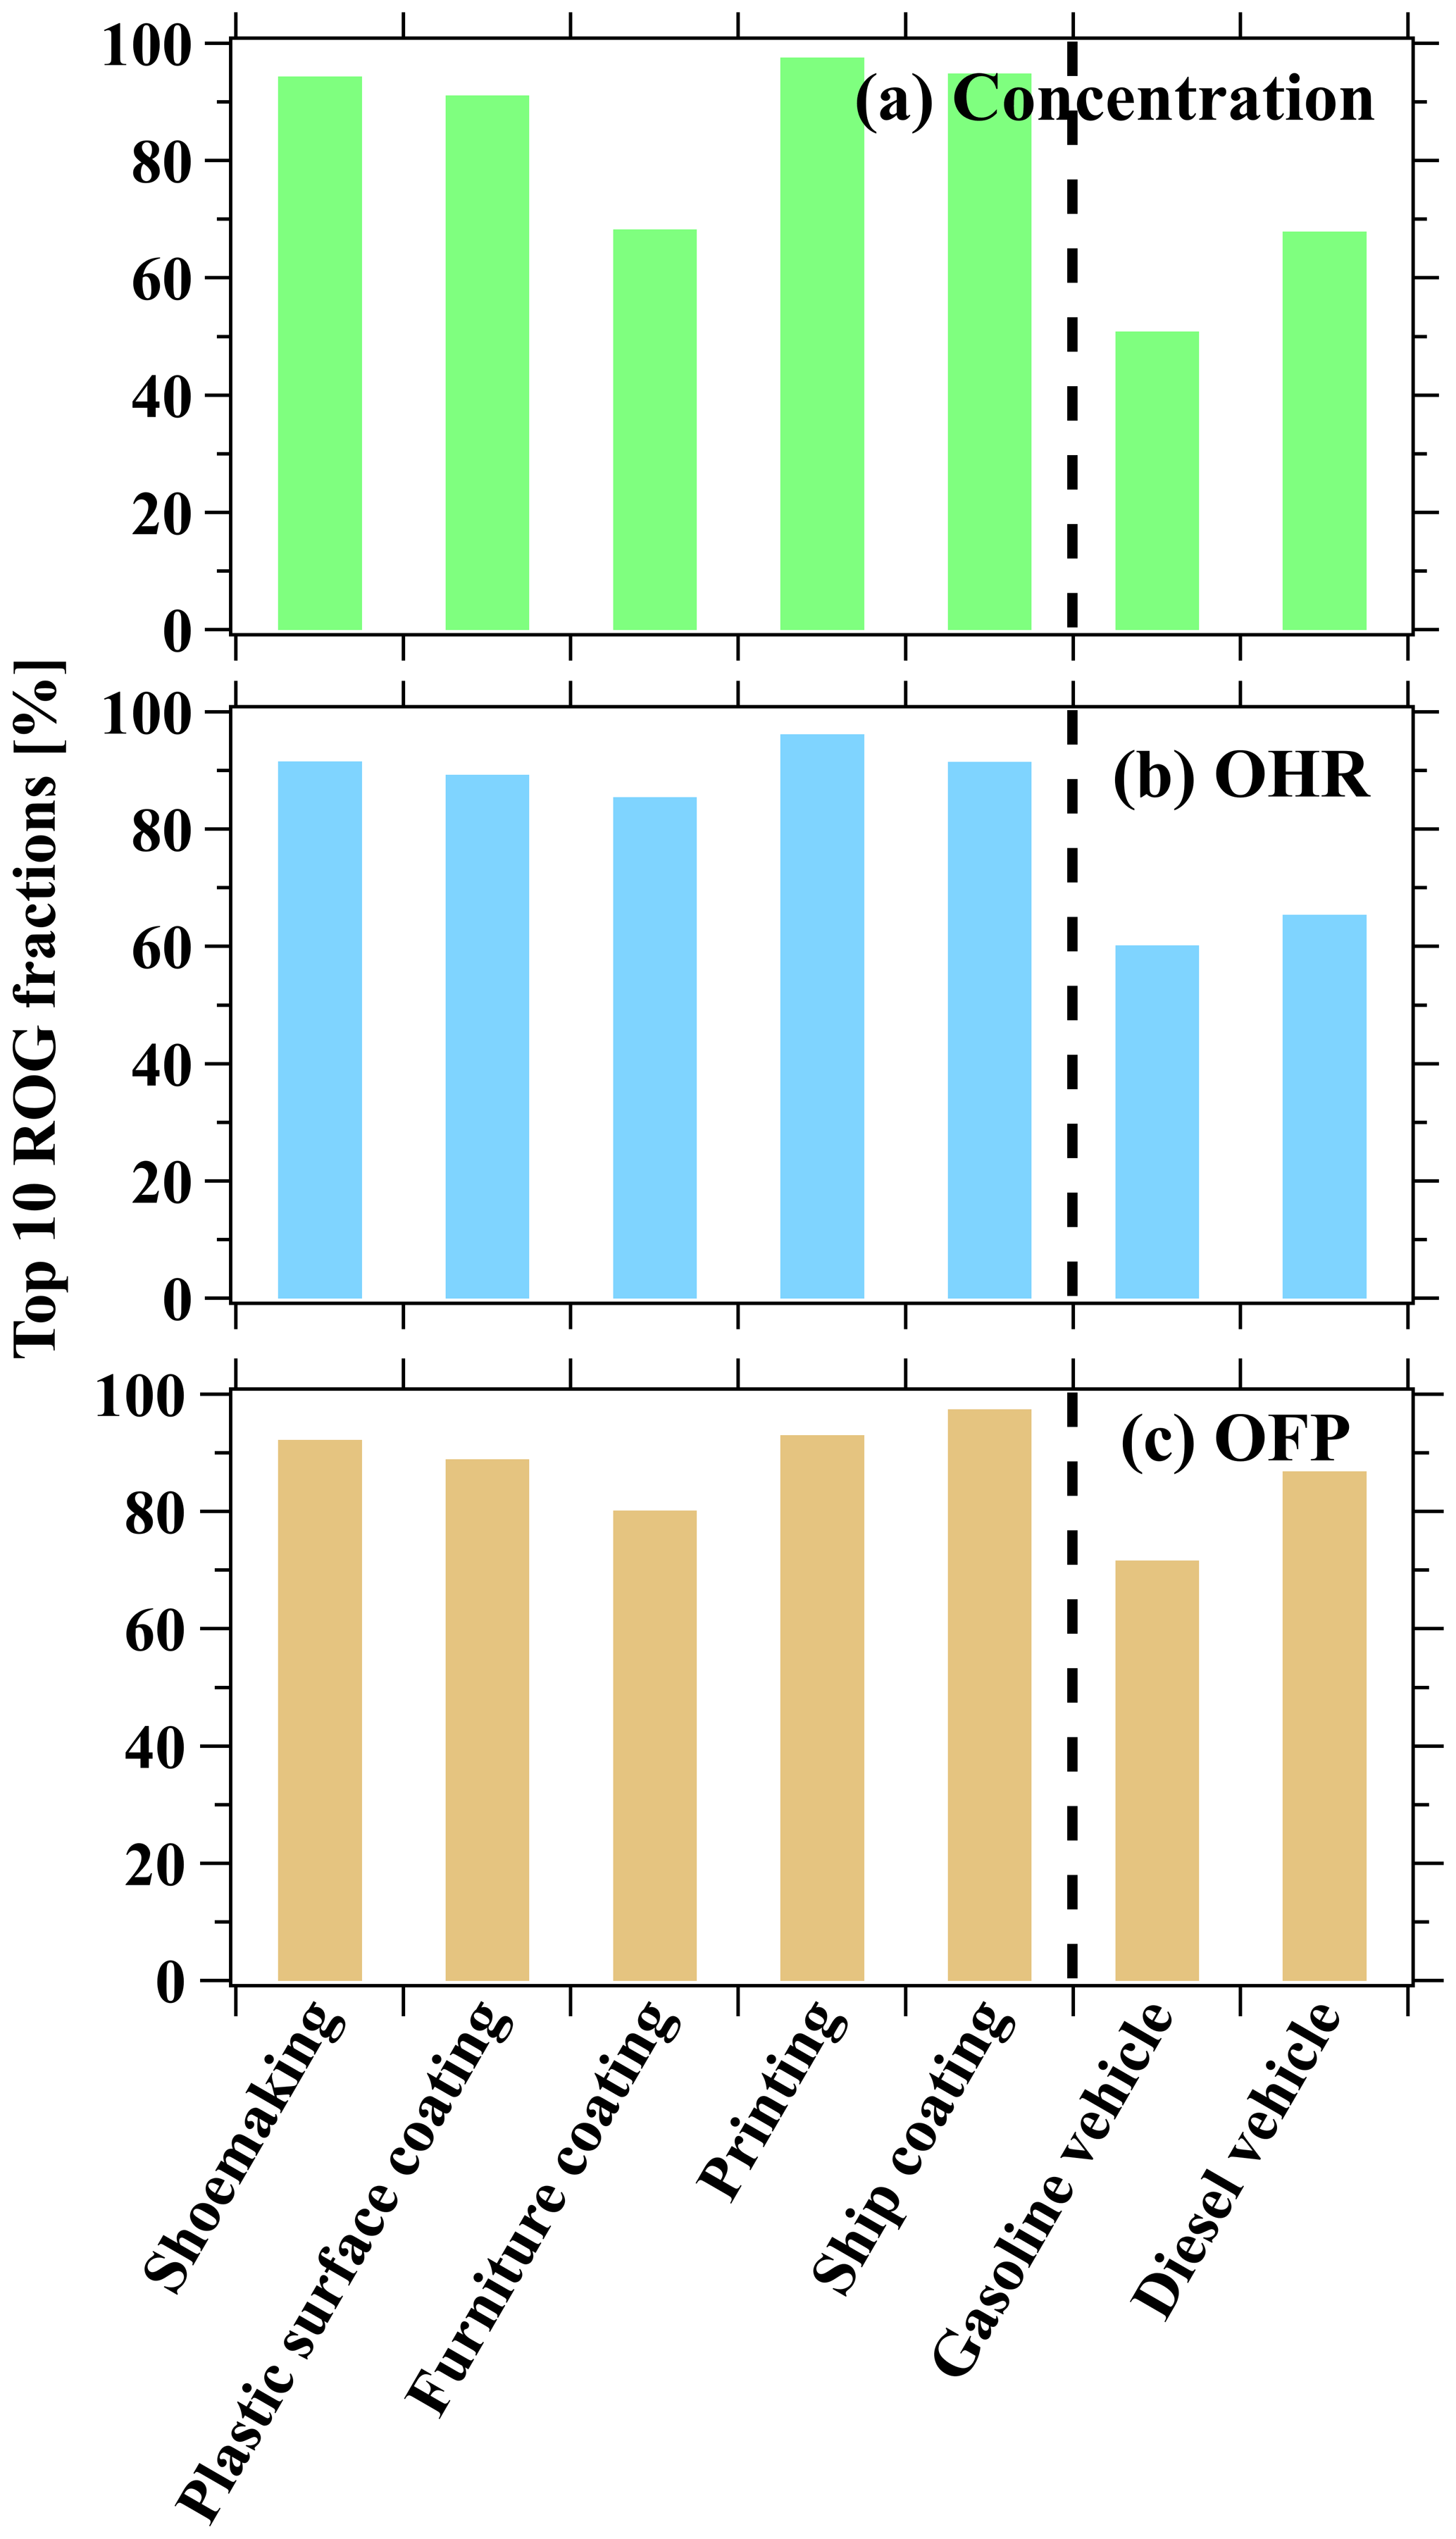
Figure 7Accumulated fractions of the top 10 species in total (a) ROG emissions, (b) OHR, and (c) OFP from industrial VCP sources in this study and vehicular emissions from a previous study (Wang et al., 2022).
The updated measurements of OVOC emissions by using PTR-ToF-MS substantially improve our understanding of the emissions of industrial VCP sources. The effective saturation concentrations (C*) of high-molecular-weight OVOCs were found to be lower, corresponding to intermediate-volatility organic compounds (IVOCs) and semi-volatile organic compounds (SVOCs). Since these S/I-VOCs are crucial precursors for SOAs in urban environments (Zhao et al., 2014), it is important to comprehend their contributions from the emissions of industrial VCP sources across various volatility classes, including volatile organic compounds (VOCs), IVOCs, and SVOCs (Guenther et al., 2012; Li et al., 2016). Figure 8 illustrates the distribution of ROG species in a two-dimensional volatility basis set (2D-VBS) space for various industrial VCP sources, categorized based on volatility bins (Li et al., 2016; Donahue et al., 2011). It is worth noting that the volatility distributions exhibit substantial variation across industrial VCP sources (Fig. 8a). Generally, VOCs constitute the predominant fraction of emissions from industrial VCP sources, accounting for 59 % to 98 % of the total emissions. The fractions of IVOCs are largest in the printing industry (40 %) compared to the range of 2.1 %–9.6 % in other industrial VCP sources. Conversely, the contribution of SVOCs from industrial VCP sources is negligible in our study, accounting for less than 1 %. Considering the importance of S/I-VOCs in SOA formation, particularly with the increasing adoption of improved online mass spectrometry technologies, the S/I-VOC emissions from industrial VCP sources should be paid more attention in future research.
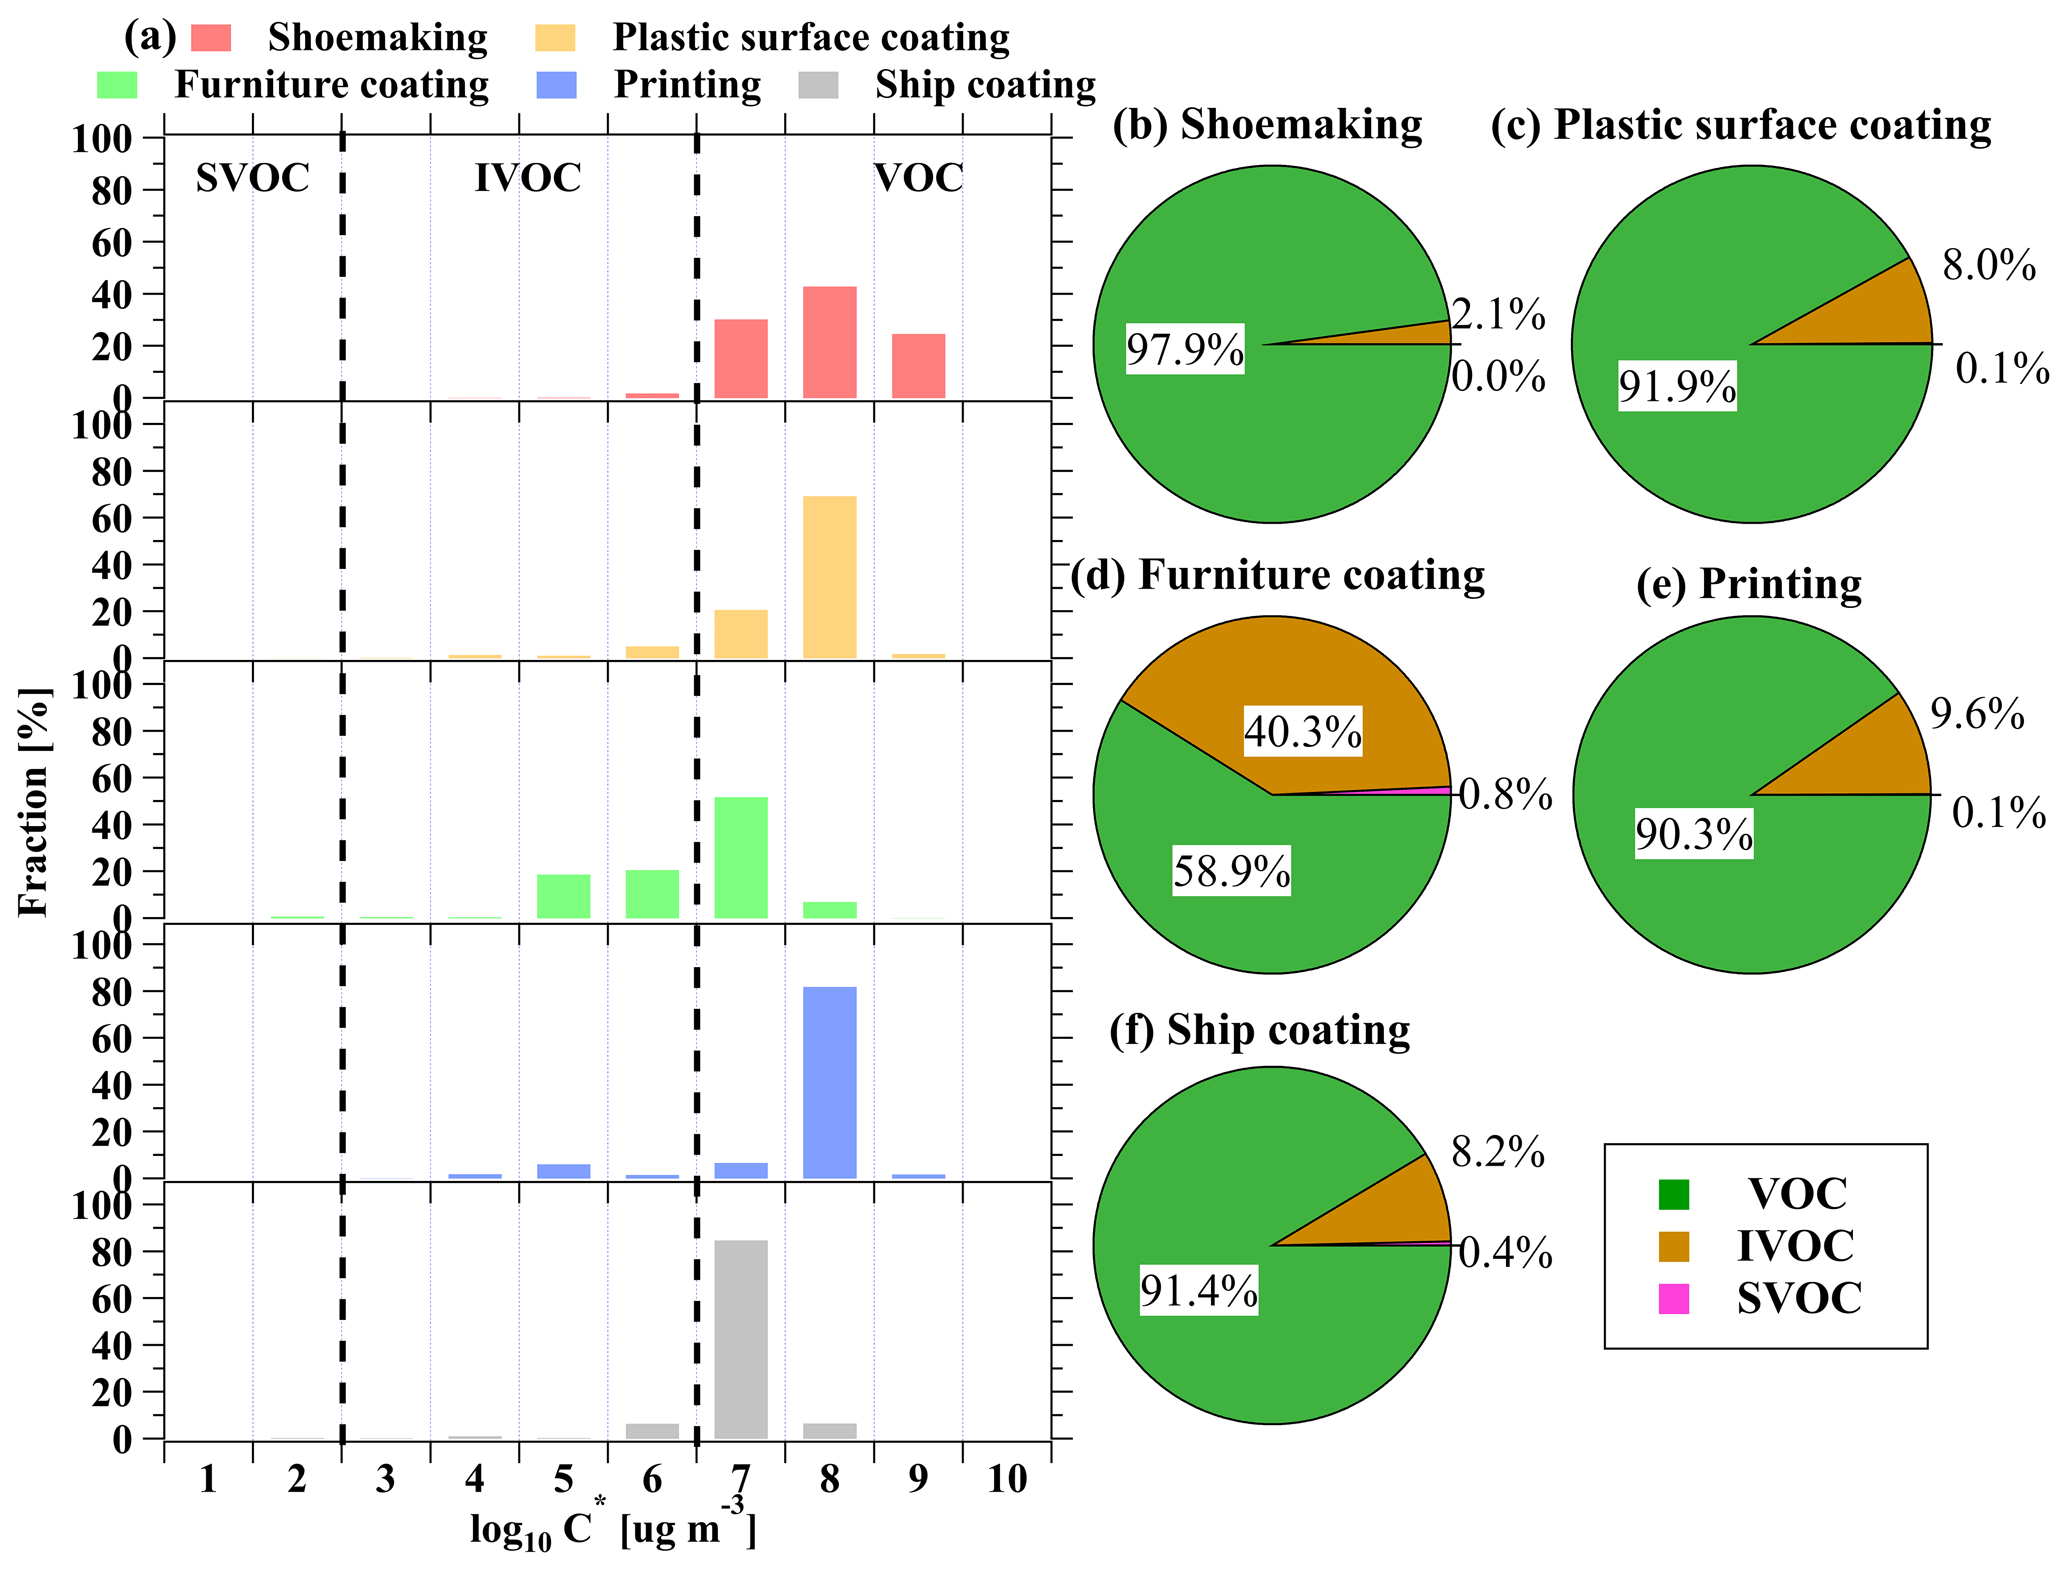
Figure 8(a) Volatility-binned fractions from stack emissions of various industrial VCP sources and volatility-binned fractions from different ROG categories in the (b) shoemaking, (c) plastic surface coating, (d) furniture coating, (e) printing, and (f) ship coating industries.
3.3 Evaluate ROG treatment efficiency in industrial VCP sources
The analysis of the PTR-ToF-MS mass spectra offers valuable insights into the impact of ROG emissions from industrial VCP sources. This comprehensive information provided by PTR-ToF-MS also allows a systematic comparison of emissions before and after the treatment of ROGs. The scatterplot of the concentrations of various ROGs before and after treatment in industrial VCP sources is shown in Figs. 9 and S11. The observed treatment efficiency, represented by a slope gradient of 1, did not reach the desired levels, ranging from −12 % to 68 %. Among the industrial VCP sources investigated, the shoemaking industry exhibited the highest treatment efficiency (slope of 0.32) with the activated carbon adsorption combined with the UV photolysis device. This remarkable efficiency can be attributed to the large-scale nature of the factory and meticulous regulation of the ROG treatment devices. Following closely behind is the printing industry, utilizing catalytic combustion devices, with a slightly higher efficacy (slope of 0.67) than another treatment device in the same factory (slope of 0.80). Nonetheless, it is evident that the treatment efficiency has not reached the desired levels for all ROG groups (Fig. S11), which is possibly due to the challenges associated with effectively removing the majority of ROG emissions using current treatment technologies. Additionally, we also observed that some OVOCs may be generated as byproducts after the implementation of treatment devices. For instance, the concentrations of CH2O2 (e.g., formic acids), C4H6O3 (e.g., propylene carbonate), and C9H18O (e.g., nonanal) were found to be higher after the application of activated carbon adsorption combined with UV photolysis devices (Fig. 9d). Similarly, the concentrations of C3H4O (e.g., acrolein) and C12H18O4 (e.g., dibutyl squarate) were also higher following the utilization of catalytic combustion devices (Fig. 9e). Therefore, it is crucial to consider the potential contribution of these ROGs when assessing the emissions released into the atmosphere. The lowest treatment efficiency of ROGs was obtained in the furniture coating industry (slope of 1.12). This treatment device demonstrates inefficiency for all ROG groups (Fig. S11). The inadequate performance of the ROG treatment devices in this specific facility may be attributed to a number of possible reasons, e.g., delayed replacement of activated carbon and other adsorption materials, and the implementation of the UV photolysis device could potentially result in the generation of more ROGs as byproducts.
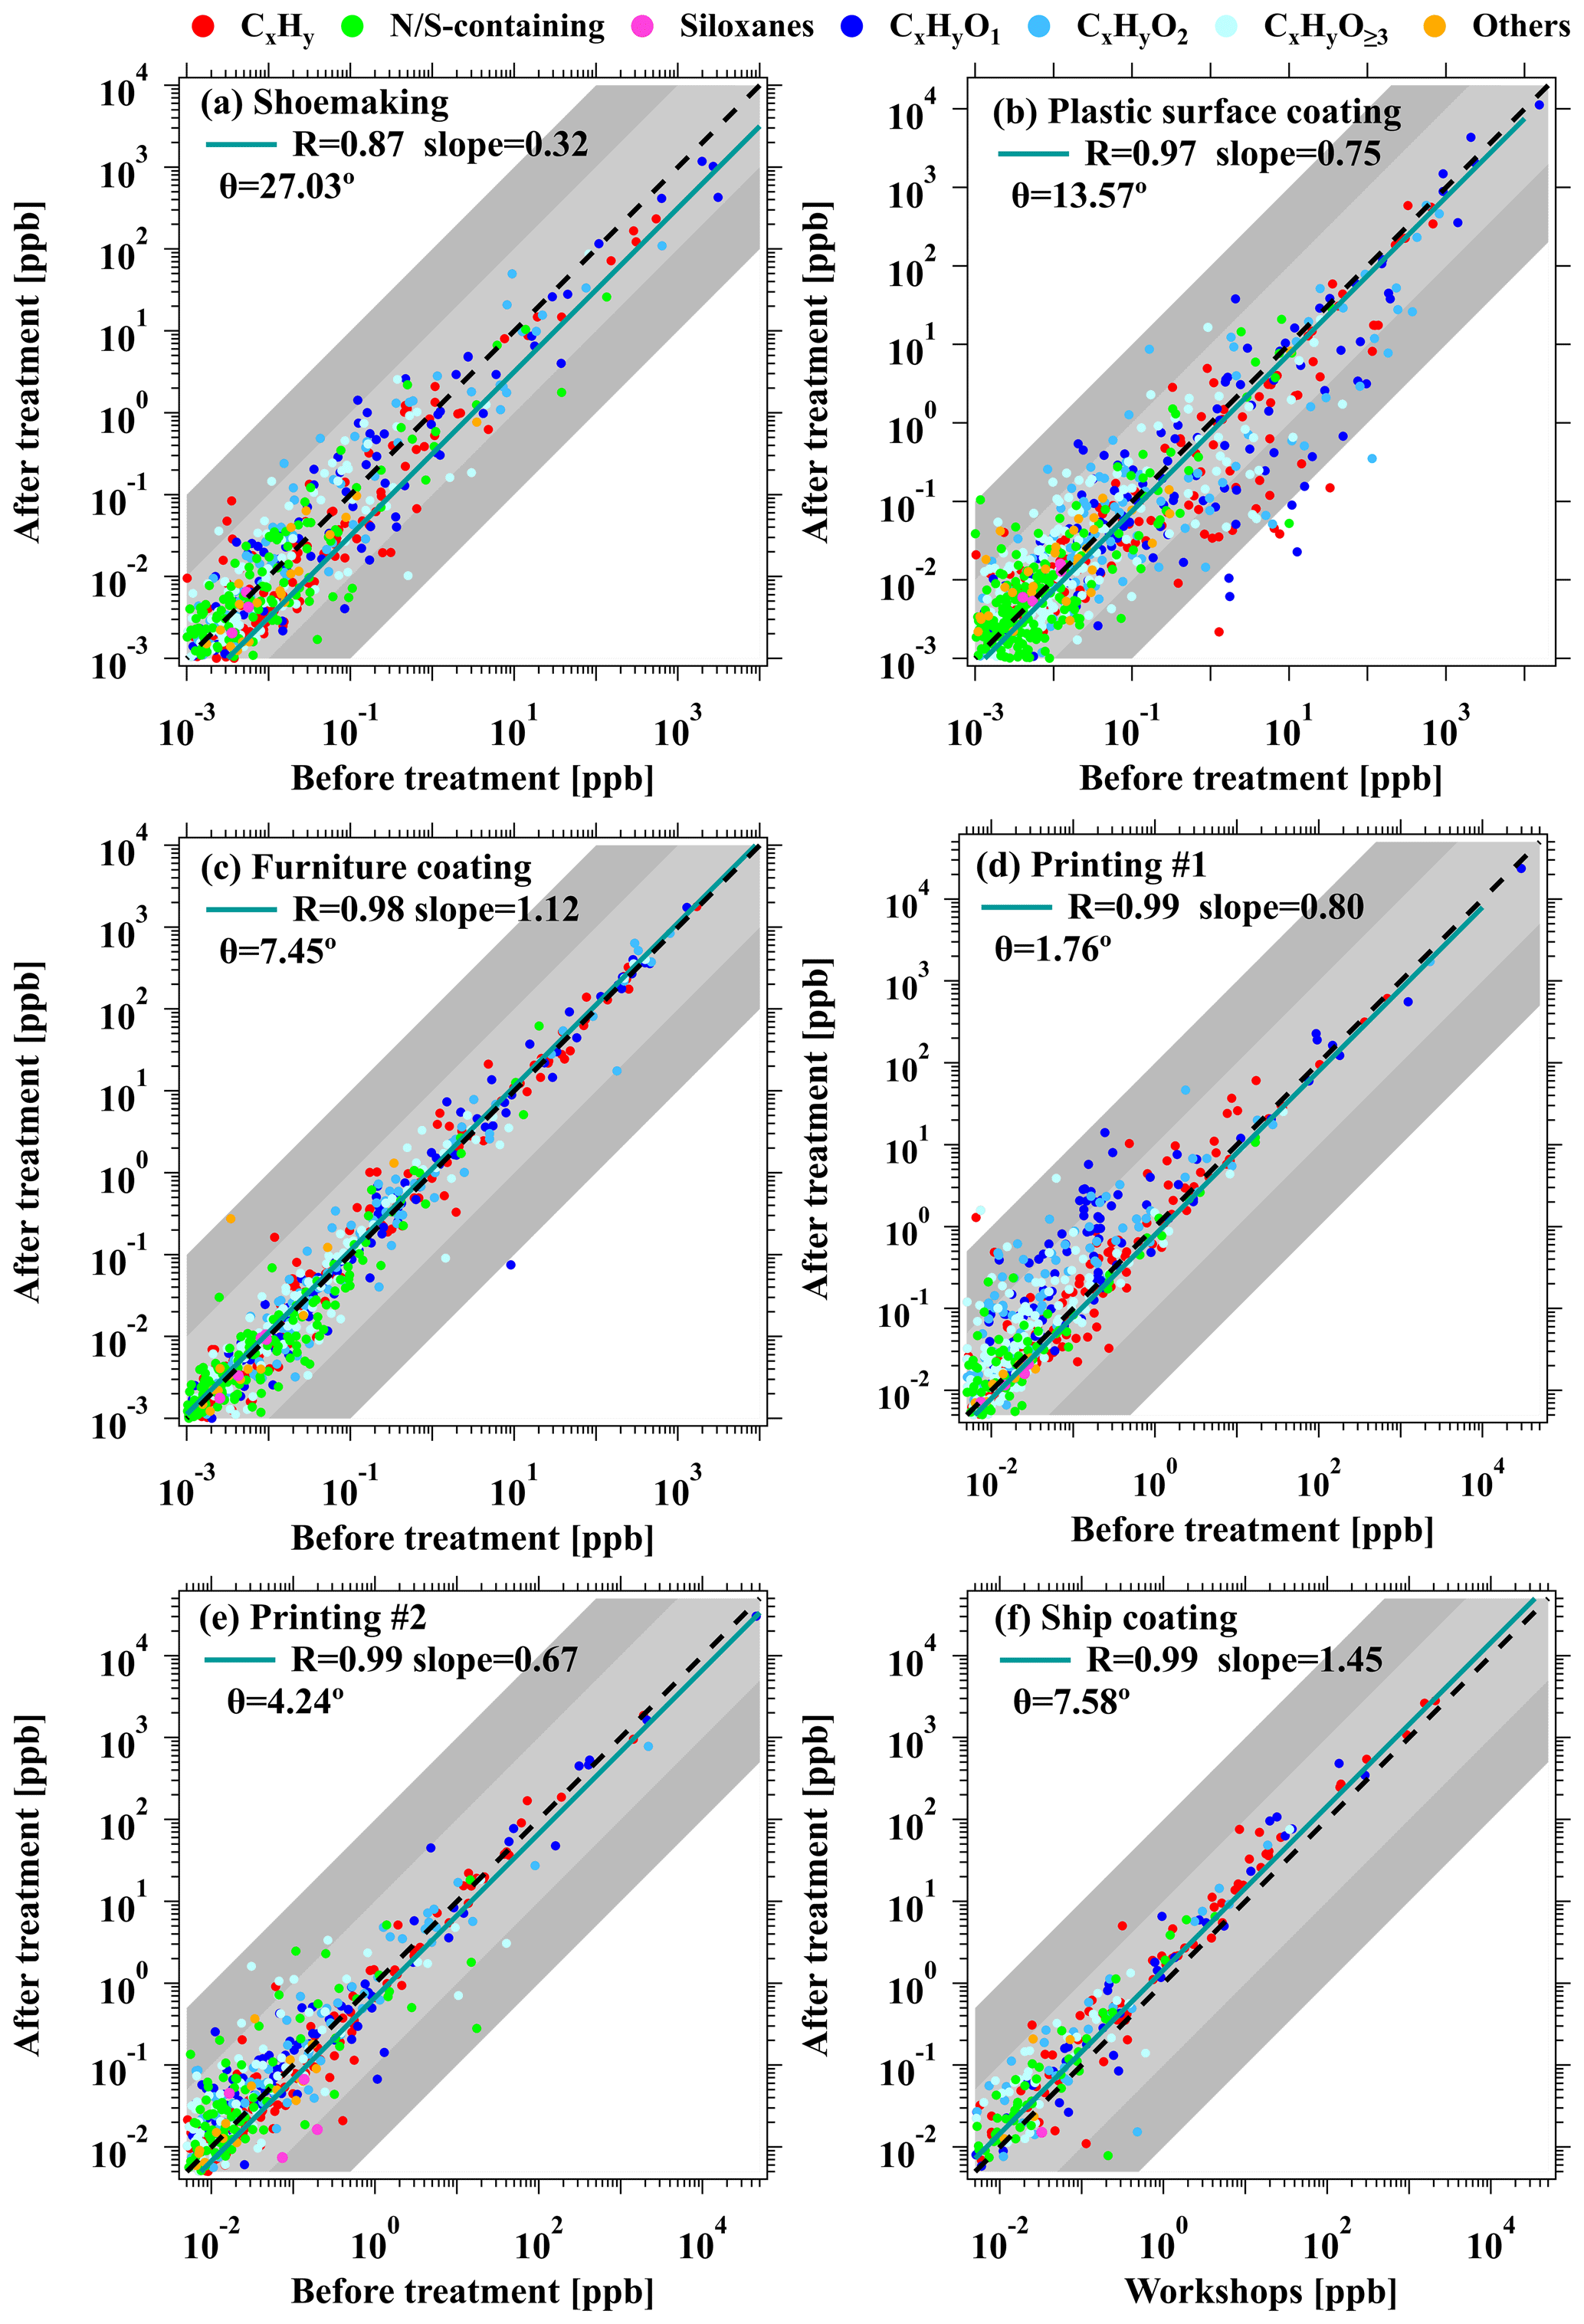
Figure 9Scatterplots of ROG concentrations before and after treatment with activated carbon adsorption + UV photolysis in the (a) shoemaking, (b) plastics surface coating, (c) furniture coating, and (d) printing industries. Scatterplots of ROG concentrations before and after treatment with catalytic combustion in (e) the printing industry and ROG concentrations between workshops and after treatment with catalytic combustion in (f) the ship coating industry. The green lines are the fitted results for all data points. The dashed black lines represent a 1:1 ratio, and the shaded areas represent ratios of a factor of 10 and 100.
Furthermore, the θ angles between the mass spectra of ROG from workshops before and after ROG treatment devices for various industrial VCP sources were calculated and summarized in Fig. S12 (also in Table S13). A comparison between the correlation of mass spectra among workshops versus after treatment devices (ranging from 6.2 to 49°) and workshops versus before treatment devices (ranging from 4.2 to 41°) demonstrated a poorer correlation in the former case. The similarities between workshops and stack emissions in the shoemaking industry were lower compared to other industrial VCP sources. This discrepancy can potentially be attributed to the inclusion of ROG emissions from non-VCP-usage manufacturing processes (e.g., sole injection molding) in the collection process of ROG treatment devices. Additionally, the similarity of θ angles between the mass spectra from before and after ROG treatment devices in various industrial VCP sources also provided insight into the efficacy of the devices in removing ROGs (Fig. 9). The θ angles in ROG treatment devices from five industrial VCP sources were found to range from 1.8 to 27°, indicating good consistency between the mass spectra before and after treatment of ROGs. This alignment suggests that the chemical compositions of ROG emissions remain comparable before and after treatment (R ≥ 0.87), implying that the relative proportions of various ROG components are not significantly affected by ROG treatment devices in these industrial VCP sources.
3.4 Impact of industrial VCP sources on ambient air
To gain deeper insights into the atmospheric impact of emissions from industrial VCP sources, an in situ measurement was carried out at a monitoring station near the furniture coating industry, located 2 km northeast of the industry site. The measurement was conducted using a PTR-ToF-MS instrument (Kore Inc., UK), which enabled the quantification of various common ROGs. More information about this instrument and dataset for in situ measurement can be found elsewhere (Gonzalez-Mendez et al., 2016; Song et al., 2023). Concordant with expectations, the average concentrations of representative ROGs generally demonstrate a discernible decline from the furniture coating industry (including stack emission and workshops during working and non-working hours) to the ambient measurement (Fig. 10). Considerable emissions of C8 aromatics and MEK are generated from the furniture coating industry, while their concentrations in the ambient air are orders of magnitude lower than those observed in the industry. However, ambient concentrations of OVOCs, specifically MEK (6.8 ± 8.2 ppb) and ethyl acetate (7.5 ± 5.9vppb), are still significantly higher than in clean environments and are among the highest measured concentrations in the literature (C. Wu et al., 2020; He et al., 2022b; Khare et al., 2022; Yang et al., 2022). It is confirmed that OVOCs should be paid attention to in industrialized urban areas, thereby further substantiating the significance of OVOC emissions from industrial VCP sources in atmospheric pollution. These results stress the invaluable insights provided by PTR-ToF-MS in comprehensively characterizing ROG compositions in both emission sources and urban air.
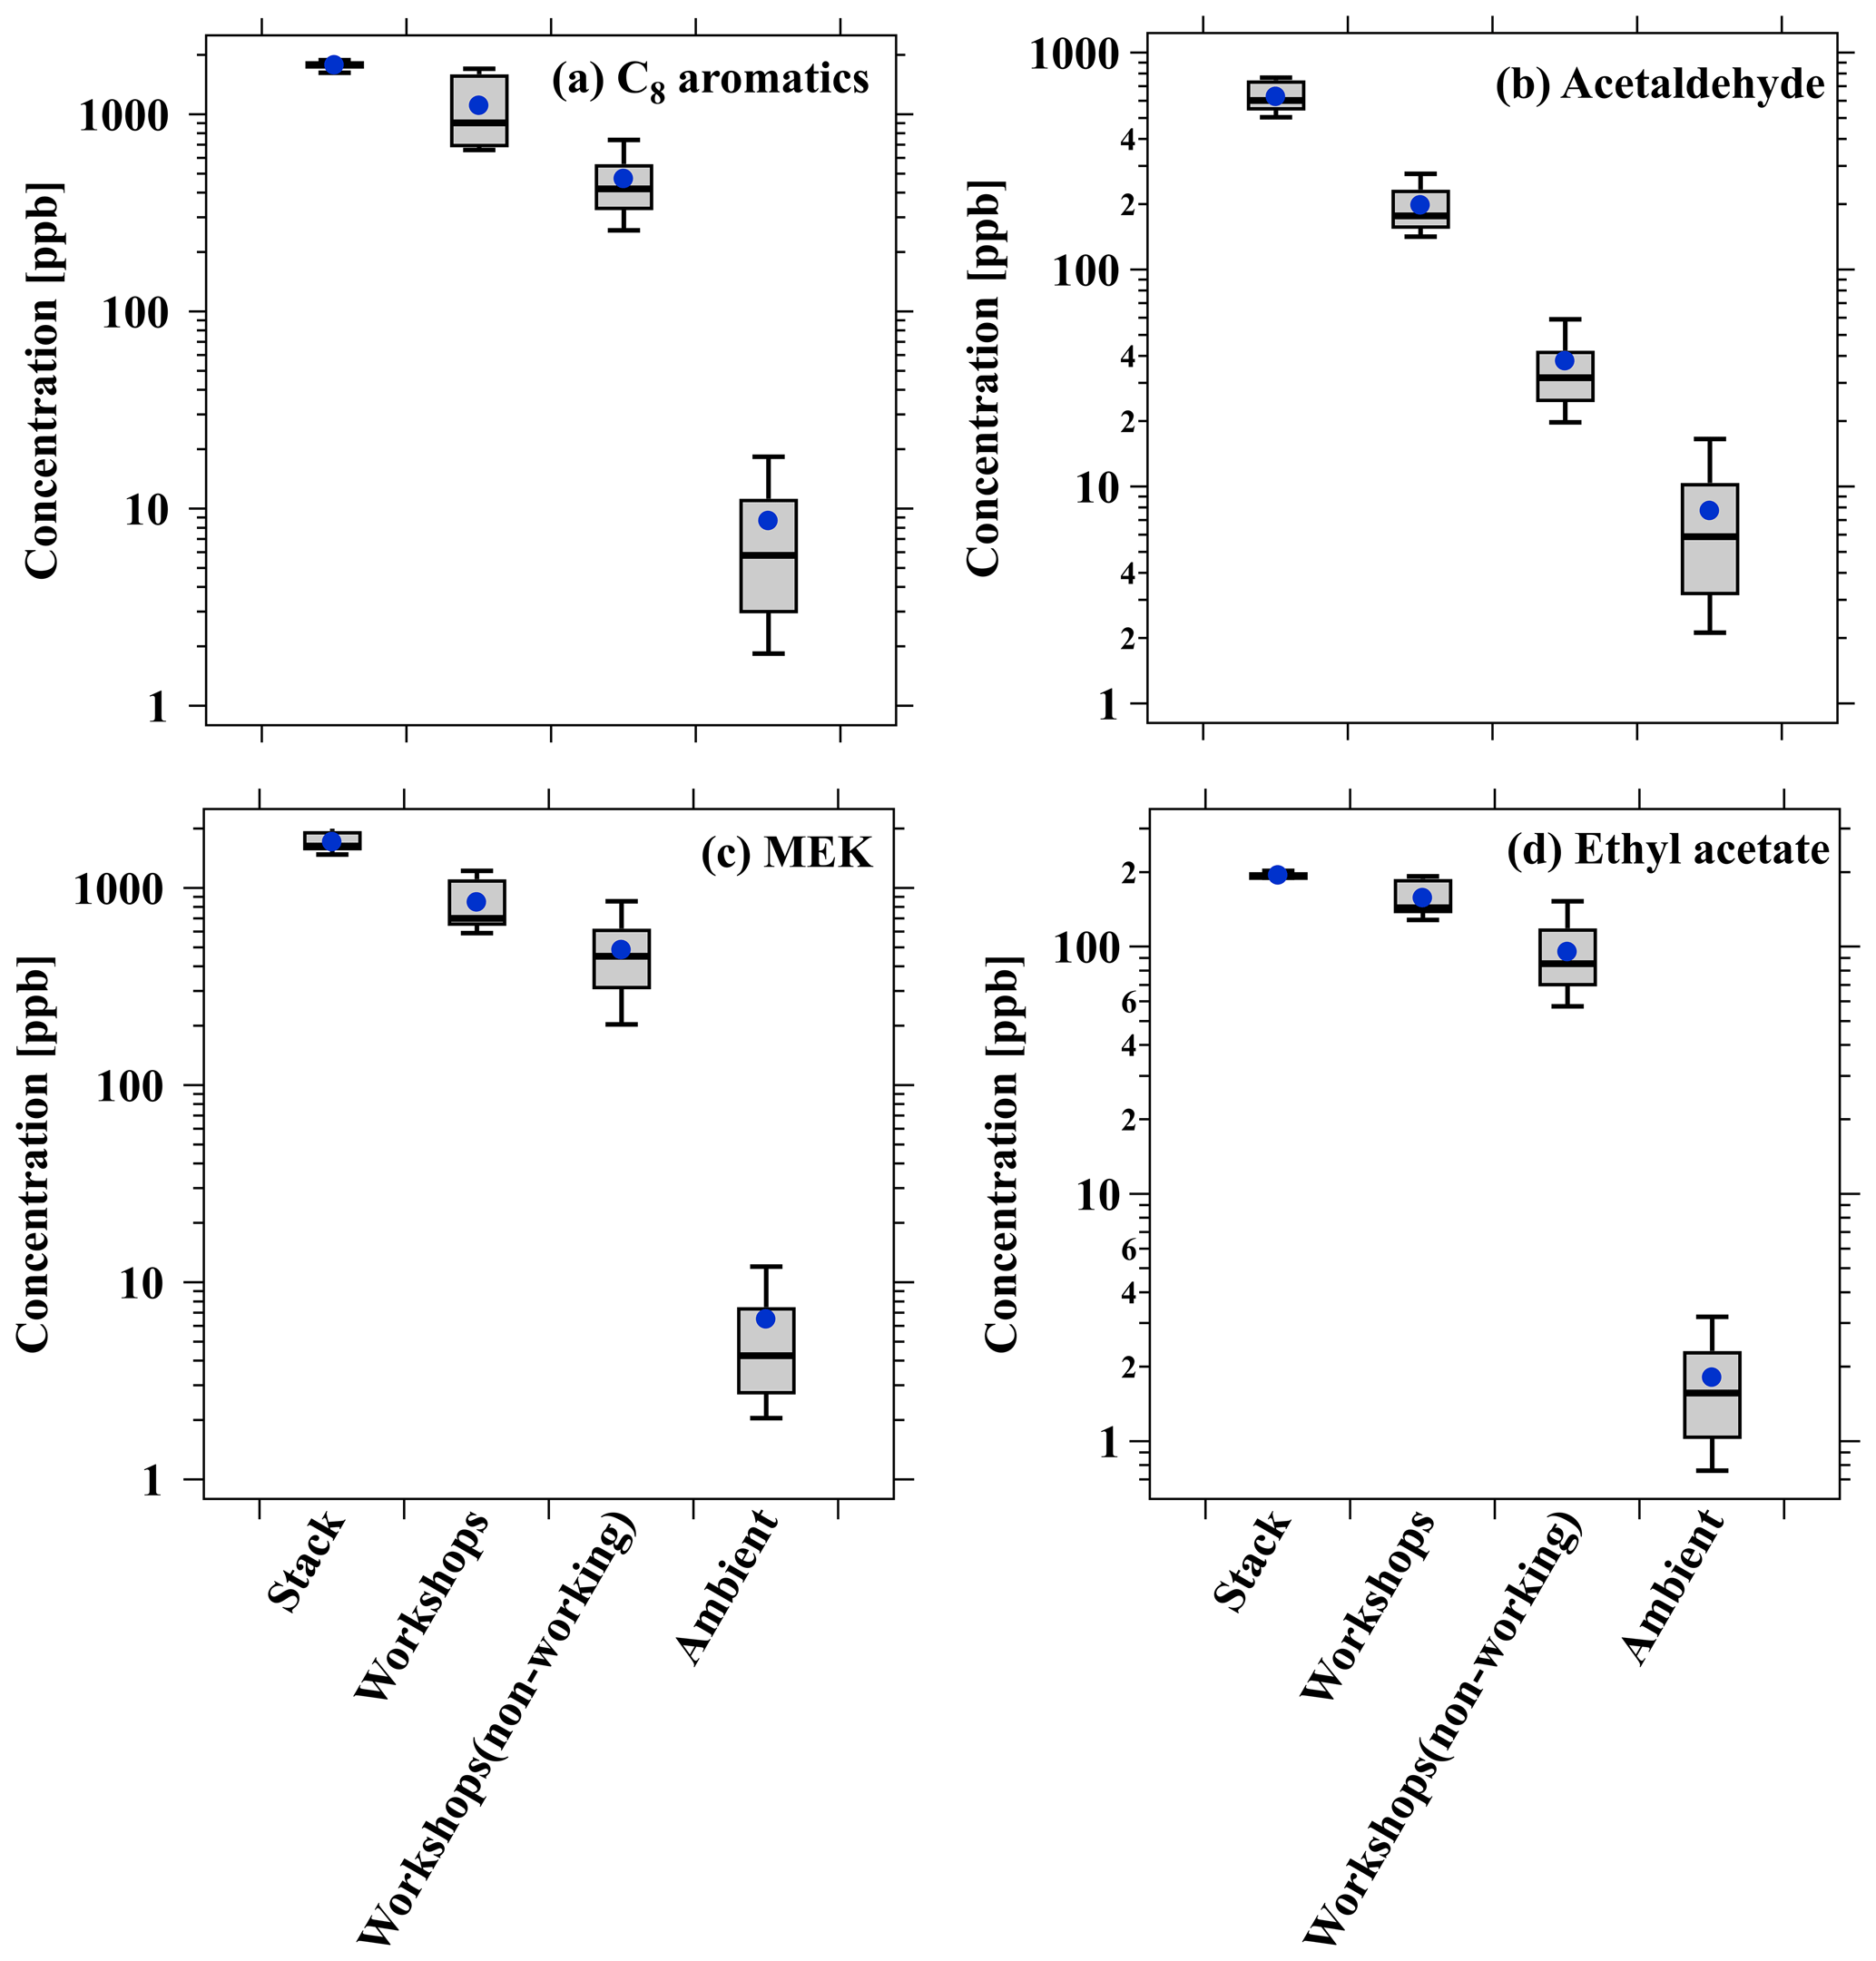
Figure 10Boxplots of (a) C8 aromatics, (b) acetaldehyde, (c) MEK, and (d) ethyl acetate concentrations across the stack, workshops during working and non-working hours in the furniture coating industry, and ambient measurement near the industry, respectively.
The preceding discussions illustrate that the emission characteristics of ROGs significantly vary among industrial VCP sources. As a result, the ratio of ROG pairs can be used to distinguish emissions of industrial VCP sources. MEK and C8 aromatics emerge as key species in industrial VCP emissions, and the reaction rate constants of C8 aromatics with OH radicals ( cm3 molec.−1 s−1) are higher than MEK (cm3 molec.−1 s−1) (Atkinson and Arey, 2003; C. Wu et al., 2020). Figure 11 illustrates the correlation of MEK with C8 aromatics in stack emission, workshops during working hours and non-working hours in the furniture coating industry, and ambient measurement near the industry. Positive correlations between MEK and C8 aromatics are observed in both emission sources and ambient measurements, indicating a shared source for these compounds. Additionally, the observed ratios of MEK to C8 aromatics in ambient measurements are also comparable with the ratios of MEK to C8 aromatics measured in emissions from the furniture coating industry (0.97 ppb ppb−1 for stack emissions and 0.75 ppb ppb−1 for workshop emissions), suggesting that industrial VCP emissions (specifically furniture coating) may account for the enhancement of MEK and C8 aromatics in this industrial area. The peak concentration of MEK exceeding 200 ppb from the ambient measurements are among the highest in the literature (Fig. 11). Therefore, we conducted a comparison of MEK and C8 aromatics concentrations in this study with those in clean environments (urban, rural, forest, and coastal sites) from previous studies (Fig. S13) (C. Wu et al., 2020; Coggon et al., 2024; Yuan et al., 2012; Seco et al., 2011; Acton et al., 2016; Tan et al., 2021; He et al., 2022b). The results indicate that ambient measurements in industrial areas have been significantly impacted by industrial VCP sources, and the MEK C8 aromatics ratio can serve as good evidence by using high-time-resolution ROG measurements from PTR-ToF-MS.
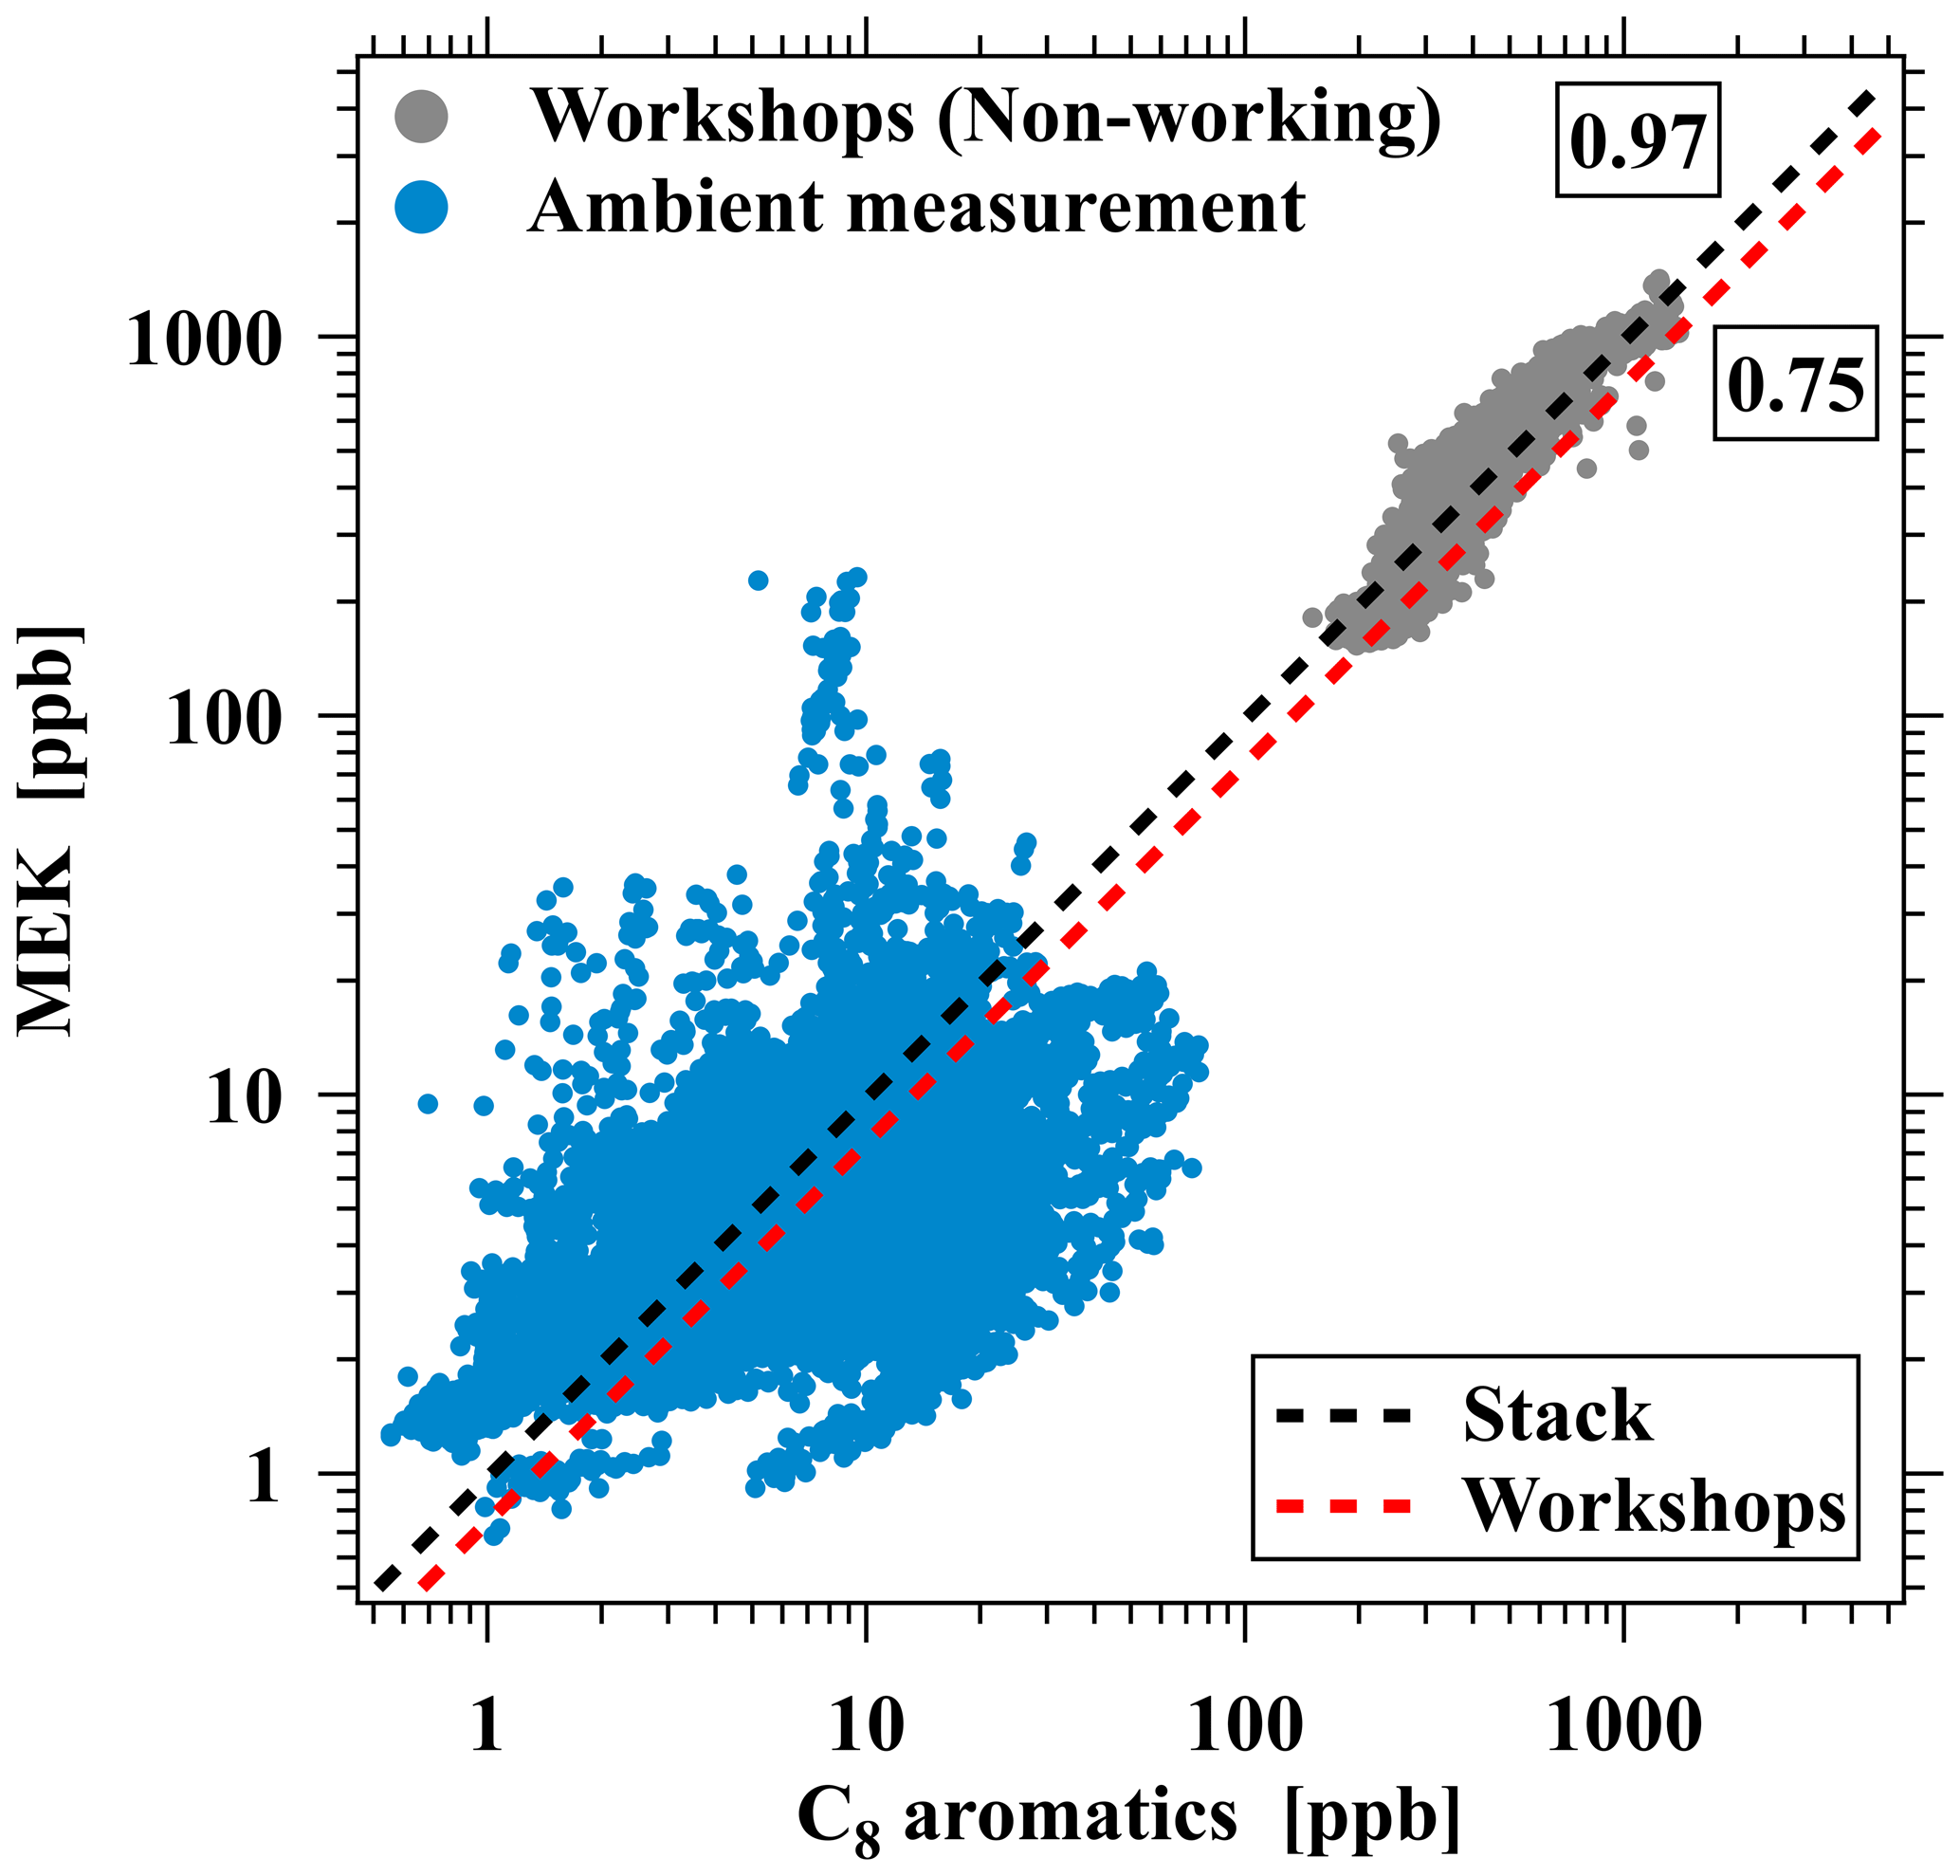
Figure 11Scatterplot of MEK versus C8 aromatics concentrations from workshops during non-working hours in the furniture coating industry and ambient measurement near the industry. The dashed black and red lines represent ratios of ROG pairs for stack and workshop emissions in the furniture coating industry.
In this work, we conducted a field campaign to measure more comprehensive speciation of ROG emissions from industrial VCP sources, including the shoemaking, plastic surface coating, furniture coating, printing, and ship coating industries. To achieve this, we employed PTR-ToF-MS in combination with canister GC–MS/FID techniques. Our study demonstrated that OVOCs have been identified as representative ROGs emitted from these sources, which are highly related to specific chemicals used during industrial activities. Furthermore, we performed a mass spectra similarity analysis to compare the ROG emissions across different emission sources. The poor consistency of the similarity between the mass spectra in emission sources indicated substantial differences between industrial VCP sources, as they cannot be directly categorized as a single class of emission sources.
In addition, the fractions of ROGs in total ROG emissions and OHR are determined by combining measurements from canister GC–MS/FID and PTR-ToF-MS. Except for the ship coating industry utilizing solvent-borne coatings, the proportions of OVOCs range from 67 % to 96 % in total ROG emissions and 72 % to 97 % in total OHR for different industrial sources. The large fraction of OVOCs may be related to two reasons: (1) more OVOC species are detected in this study, and (2) water-borne coatings and inks are more widely employed in recent years, which may enhance OVOC fractions. This highlights the importance of measuring these OVOC emissions from industrial VCP sources. The industrial VCP sources associated with solvent-borne coatings exhibited a higher OFP, reaching as high as 5.5 and 2.7 g O3 g−1 ROGs for the ship coating and furniture coating industries, primarily due to contributions from aromatics, suggesting that these sources should be controlled as a priority. The fractions of the 10 most abundant species in total ROG emissions, OHR, and OFP indicate the high centralization of ROG emissions from various emission sources.
Our results suggest that ROG treatment devices may have limited effectiveness in removing ROGs, with treatment efficiencies ranging from −12 % to 68 %. In addition, more attention should be paid to OVOCs in industrialized urban areas due to the substantial impact of industrial VCP sources. Our study demonstrated that ROG pairs (e.g., MEK C8 aromatics ratio) can be utilized as reliable evidence for indicating the impact of industrial VCP sources on ambient measurements in industrial areas.
This study highlights the significant role of OVOCs in ROG emissions from industrial VCP sources, particularly those utilizing water-borne chemicals. As a result, these industrial VCP sources may significantly contribute to the primary emissions of OVOCs in urban regions. The current emission inventories do not fully account for the emissions of many ROGs, which can compromise the predictive accuracy of air quality models in urban areas. In this study, a broader range of ROG species was quantified using PTR-ToF-MS measurements, which highlights the effectiveness of PTR-ToF-MS in characterizing ROG emissions from industrial VCP sources.
Data are available from the authors upon request.
The supplement related to this article is available online at: https://doi.org/10.5194/acp-24-7101-2024-supplement.
BY designed the research. BY and SW organized industrial VCP source measurements. SW, XH, RC, CaW, and ChW contributed to data collection. SW performed the data analysis, with contributions from XS and YC. SW and BY prepared the article with contributions from YH, XBL, BW, and MS. All the authors reviewed the article.
The contact author has declared that none of the authors has any competing interests.
Publisher's note: Copernicus Publications remains neutral with regard to jurisdictional claims made in the text, published maps, institutional affiliations, or any other geographical representation in this paper. While Copernicus Publications makes every effort to include appropriate place names, the final responsibility lies with the authors.
The authors would like to thank the personnel involved in data collection and instrument maintenance during the filed campaign.
This work was supported by the National Key R&D Program of China (grant nos. 2022YFC3700604, 2023YFC3706201) and the National Natural Science Foundation of China (grant nos. 42230701, 42121004 and 42205094). This work was also supported by the Outstanding Innovative Talents Cultivation Funded Programs for Doctoral Students of Jinan University (grant no. 2022CXB028).
This paper was edited by Qiang Zhang and reviewed by two anonymous referees.
Acton, W. J. F., Schallhart, S., Langford, B., Valach, A., Rantala, P., Fares, S., Carriero, G., Tillmann, R., Tomlinson, S. J., Dragosits, U., Gianelle, D., Hewitt, C. N., and Nemitz, E.: Canopy-scale flux measurements and bottom-up emission estimates of volatile organic compounds from a mixed oak and hornbeam forest in northern Italy, Atmos. Chem. Phys., 16, 7149–7170, https://doi.org/10.5194/acp-16-7149-2016, 2016.
Atkinson, R. and Arey, J.: Atmospheric Degradation of Volatile Organic Compounds, Chem. Rev., 103, 4605–4638, https://doi.org/10.1021/cr0206420, 2003.
Atkinson, R., Baulch, D. L., Cox, R. A., Crowley, J. N., Hampson, R. F., Hynes, R. G., Jenkin, M. E., Rossi, M. J., and Troe, J.: Evaluated kinetic and photochemical data for atmospheric chemistry: Volume I - gas phase reactions of Ox, HOx, NOx and SOx species, Atmos. Chem. Phys., 4, 1461–1738, https://doi.org/10.5194/acp-4-1461-2004, 2004.
Atkinson, R., Baulch, D. L., Cox, R. A., Crowley, J. N., Hampson, R. F., Hynes, R. G., Jenkin, M. E., Rossi, M. J., Troe, J., and IUPAC Subcommittee: Evaluated kinetic and photochemical data for atmospheric chemistry: Volume II – gas phase reactions of organic species, Atmos. Chem. Phys., 6, 3625–4055, https://doi.org/10.5194/acp-6-3625-2006, 2006.
Buhr, K., van Ruth, S., and Delahunty, C.: Analysis of volatile flavour compounds by Proton Transfer Reaction-Mass Spectrometry: fragmentation patterns and discrimination between isobaric and isomeric compounds, Int. J. Mass Spectrom., 221, 1–7, https://doi.org/10.1016/S1387-3806(02)00896-5, 2002.
Cappellin, L., Karl, T., Probst, M., Ismailova, O., Winkler, P. M., Soukoulis, C., Aprea, E., Mark, T. D., Gasperi, F., and Biasioli, F.: On quantitative determination of volatile organic compound concentrations using proton transfer reaction time-of-flight mass spectrometry, Environ. Sci. Technol., 46, 2283–2290, https://doi.org/10.1021/es203985t, 2012.
Carter, W. P.: Development of the SAPRC-07 chemical mechanism, Atmos. Environ., 44, 5324–5335, 2010.
Chang, X., Zhao, B., Zheng, H., Wang, S., Cai, S., Guo, F., Gui, P., Huang, G., Wu, D., Han, L., Xing, J., Man, H., Hu, R., Liang, C., Xu, Q., Qiu, X., Ding, D., Liu, K., Han, R., Robinson, A. L., and Donahue, N. M.: Full-volatility emission framework corrects missing and underestimated secondary organic aerosol sources, One Earth, 5, 403–412, https://doi.org/10.1016/j.oneear.2022.03.015, 2022.
Chen, Y., Yuan, B., Wang, C., Wang, S., He, X., Wu, C., Song, X., Huangfu, Y., Li, X.-B., Liao, Y., and Shao, M.: Online measurements of cycloalkanes based on NO+ chemical ionization in proton transfer reaction time-of-flight mass spectrometry (PTR-ToF-MS), Atmos. Meas. Tech., 15, 6935–6947, https://doi.org/10.5194/amt-15-6935-2022, 2022.
Coggon, M. M., McDonald, B. C., Vlasenko, A., Veres, P. R., Bernard, F., Koss, A. R., Yuan, B., Gilman, J. B., Peischl, J., Aikin, K. C., DuRant, J., Warneke, C., Li, S. M., and de Gouw, J. A.: Diurnal Variability and Emission Pattern of Decamethylcyclopentasiloxane (D5) from the Application of Personal Care Products in Two North American Cities, Environ. Sci. Technol., 52, 5610–5618, https://doi.org/10.1021/acs.est.8b00506, 2018.
Coggon, M. M., Gkatzelis, G. I., McDonald, B. C., Gilman, J. B., Schwantes, R. H., Abuhassan, N., Aikin, K. C., Arend, M. F., Berkoff, T. A., Brown, S. S., Campos, T. L., Dickerson, R. R., Gronoff, G., Hurley, J. F., Isaacman-VanWertz, G., Koss, A. R., Li, M., McKeen, S. A., Moshary, F., Peischl, J., Pospisilova, V., Ren, X., Wilson, A., Wu, Y., Trainer, M., and Warneke, C.: Volatile chemical product emissions enhance ozone and modulate urban chemistry, P. Natl. Acad. Sci. USA, 118, e2026653118, https://doi.org/10.1073/pnas.2026653118, 2021.
Coggon, M. M., Stockwell, C. E., Claflin, M. S., Pfannerstill, E. Y., Xu, L., Gilman, J. B., Marcantonio, J., Cao, C., Bates, K., Gkatzelis, G. I., Lamplugh, A., Katz, E. F., Arata, C., Apel, E. C., Hornbrook, R. S., Piel, F., Majluf, F., Blake, D. R., Wisthaler, A., Canagaratna, M., Lerner, B. M., Goldstein, A. H., Mak, J. E., and Warneke, C.: Identifying and correcting interferences to PTR-ToF-MS measurements of isoprene and other urban volatile organic compounds, Atmos. Meas. Tech., 17, 801–825, https://doi.org/10.5194/amt-17-801-2024, 2024.
de Gouw, J. and Warneke, C.: Measurements of volatile organic compounds in the earth's atmosphere using proton-transfer-reaction mass spectrometry, Mass Spectrom. Rev., 26, 223–257, https://doi.org/10.1002/mas.20119, 2007.
Donahue, N. M., Epstein, S. A., Pandis, S. N., and Robinson, A. L.: A two-dimensional volatility basis set: 1. organic-aerosol mixing thermodynamics, Atmos. Chem. Phys., 11, 3303–3318, https://doi.org/10.5194/acp-11-3303-2011, 2011.
Fang, L., Liu, W., Chen, D., Li, G., Wang, D., Shao, X., and Nie, L.: Source Profiles of Volatile Organic Compounds (VOCs) from Typical Solventbased Industries in Beijing, Environmental Science, 40, 4395–4403, https://doi.org/10.13227/j.hjkx.201901128, 2019 (in Chinese).
Fortner, E. C., Zheng, J., Zhang, R., Berk Knighton, W., Volkamer, R. M., Sheehy, P., Molina, L., and André, M.: Measurements of Volatile Organic Compounds Using Proton Transfer Reaction – Mass Spectrometry during the MILAGRO 2006 Campaign, Atmos. Chem. Phys., 9, 467–481, https://doi.org/10.5194/acp-9-467-2009, 2009.
Gao, Y., Wang, H., Yuan, L., Jing, S., Yuan, B., Shen, G., Zhu, L., Koss, A., Li, Y., Wang, Q., Huang, D. D., Zhu, S., Tao, S., Lou, S., and Huang, C.: Measurement report: Underestimated reactive organic gases from residential combustion – insights from a near-complete speciation, Atmos. Chem. Phys., 23, 6633–6646, https://doi.org/10.5194/acp-23-6633-2023, 2023.
Gkatzelis, G. I., Coggon, M. M., McDonald, B. C., Peischl, J., Aikin, K. C., Gilman, J. B., Trainer, M., and Warneke, C.: Identifying Volatile Chemical Product Tracer Compounds in U.S. Cities, Environ. Sci. Technol., 55, 188–199, https://doi.org/10.1021/acs.est.0c05467, 2021a.
Gkatzelis, G. I., Coggon, M. M., McDonald, B. C., Peischl, J., Gilman, J. B., Aikin, K. C., Robinson, M. A., Canonaco, F., Prevot, A. S. H., Trainer, M., and Warneke, C.: Observations Confirm that Volatile Chemical Products Are a Major Source of Petrochemical Emissions in U.S. Cities, Environ. Sci. Technol., 55, 4332–4343, https://doi.org/10.1021/acs.est.0c05471, 2021b.
Gonzalez-Mendez, R., Watts, P., Olivenza-Leon, D., Reich, D. F., Mullock, S. J., Corlett, C. A., Cairns, S., Hickey, P., Brookes, M., and Mayhew, C. A.: Enhancement of Compound Selectivity Using a Radio Frequency Ion-Funnel Proton Transfer Reaction Mass Spectrometer: Improved Specificity for Explosive Compounds, Anal. Chem., 88, 10624–10630, https://doi.org/10.1021/acs.analchem.6b02982, 2016.
Guenther, A. B., Jiang, X., Heald, C. L., Sakulyanontvittaya, T., Duhl, T., Emmons, L. K., and Wang, X.: The Model of Emissions of Gases and Aerosols from Nature version 2.1 (MEGAN2.1): an extended and updated framework for modeling biogenic emissions, Geosci. Model Dev., 5, 1471–1492, https://doi.org/10.5194/gmd-5-1471-2012, 2012.
Haase, K. B., Keene, W. C., Pszenny, A. A. P., Mayne, H. R., Talbot, R. W., and Sive, B. C.: Calibration and intercomparison of acetic acid measurements using proton-transfer-reaction mass spectrometry (PTR-MS), Atmos. Meas. Tech., 5, 2739–2750, https://doi.org/10.5194/amt-5-2739-2012, 2012.
Han, C., Liu, R., Luo, H., Li, G., Ma, S., Chen, J., and An, T.: Pollution profiles of volatile organic compounds from different urban functional areas in Guangzhou China based on GC/MS and PTR-TOF-MS: Atmospheric environmental implications, Atmos. Environ., 214, 116843, https://doi.org/10.1016/j.atmosenv.2019.116843, 2019.
He, X., Che, X., Gao, S., Chen, X., Pan, M., Jiang, M., Zhang, S., Jia, H., and Duan, Y.: Volatile organic compounds emission inventory of organic chemical raw material industry, Atmos. Pollut. Res., 13, 101276, https://doi.org/10.1016/j.apr.2021.101276, 2022a.
He, X., Yuan, B., Wu, C., Wang, S., Wang, C., Huangfu, Y., Qi, J., Ma, N., Xu, W., Wang, M., Chen, W., Su, H., Cheng, Y., and Shao, M.: Volatile organic compounds in wintertime North China Plain: Insights from measurements of proton transfer reaction time-of-flight mass spectrometer (PTR-ToF-MS), J. Environ. Sci., 114, 98–114, https://doi.org/10.1016/j.jes.2021.08.010, 2022b.
Huang, C., Chen, C. H., Li, L., Cheng, Z., Wang, H. L., Huang, H. Y., Streets, D. G., Wang, Y. J., Zhang, G. F., and Chen, Y. R.: Emission inventory of anthropogenic air pollutants and VOC species in the Yangtze River Delta region, China, Atmos. Chem. Phys., 11, 4105–4120, https://doi.org/10.5194/acp-11-4105-2011, 2011.
Huangfu, Y., Yuan, B., Wang, S., Wu, C., He, X., Qi, J., de Gouw, J., Warneke, C., Gilman, J. B., Wisthaler, A., Karl, T., Graus, M., Jobson, B. T., and Shao, M.: Revisiting Acetonitrile as Tracer of Biomass Burning in Anthropogenic-Influenced Environments, Geophys. Res. Lett., 48, e2020GL092322, https://doi.org/10.1029/2020gl092322, 2021.
Humes, M. B., Wang, M., Kim, S., Machesky, J. E., Gentner, D. R., Robinson, A. L., Donahue, N. M., and Presto, A. A.: Limited Secondary Organic Aerosol Production from Acyclic Oxygenated Volatile Chemical Products, Environ. Sci. Technol., 56, 4806–4815, https://doi.org/10.1021/acs.est.1c07354, 2022.
Inomata, S., Tanimoto, H., and Yamada, H.: Mass Spectrometric Detection of Alkanes Using NO+ Chemical Ionization in Proton-transfer-reaction Plus Switchable Reagent Ion Mass Spectrometry, Chem. Lett., 43, 538–540, https://doi.org/10.1246/cl.131105, 2014.
Ji, Y., Zheng, J., Qin, D., Li, Y., Gao, Y., Yao, M., Chen, X., Li, G., An, T., and Zhang, R.: OH-Initiated Oxidation of Acetylacetone: Implications for Ozone and Secondary Organic Aerosol Formation, Environ. Sci. Technol., 52, 11169–11177, https://doi.org/10.1021/acs.est.8b03972, 2018.
Kamal, M. S., Razzak, S. A., and Hossain, M. M.: Catalytic oxidation of volatile organic compounds (VOCs) – A review, Atmos. Environ., 140, 117–134, https://doi.org/10.1016/j.atmosenv.2016.05.031, 2016.
Khare, P. and Gentner, D. R.: Considering the future of anthropogenic gas-phase organic compound emissions and the increasing influence of non-combustion sources on urban air quality, Atmos. Chem. Phys., 18, 5391–5413, https://doi.org/10.5194/acp-18-5391-2018, 2018.
Khare, P., Krechmer, J. E., Machesky, J. E., Hass-Mitchell, T., Cao, C., Wang, J., Majluf, F., Lopez-Hilfiker, F., Malek, S., Wang, W., Seltzer, K., Pye, H. O. T., Commane, R., McDonald, B. C., Toledo-Crow, R., Mak, J. E., and Gentner, D. R.: Ammonium adduct chemical ionization to investigate anthropogenic oxygenated gas-phase organic compounds in urban air, Atmos. Chem. Phys., 22, 14377–14399, https://doi.org/10.5194/acp-22-14377-2022, 2022.
Koss, A. R., Warneke, C., Yuan, B., Coggon, M. M., Veres, P. R., and de Gouw, J. A.: Evaluation of NO+ reagent ion chemistry for online measurements of atmospheric volatile organic compounds, Atmos. Meas. Tech., 9, 2909–2925, https://doi.org/10.5194/amt-9-2909-2016, 2016.
Koss, A. R., Sekimoto, K., Gilman, J. B., Selimovic, V., Coggon, M. M., Zarzana, K. J., Yuan, B., Lerner, B. M., Brown, S. S., Jimenez, J. L., Krechmer, J., Roberts, J. M., Warneke, C., Yokelson, R. J., and de Gouw, J.: Non-methane organic gas emissions from biomass burning: identification, quantification, and emission factors from PTR-ToF during the FIREX 2016 laboratory experiment, Atmos. Chem. Phys., 18, 3299–3319, https://doi.org/10.5194/acp-18-3299-2018, 2018.
Kostenidou, E., Lee, B.-H., Engelhart, G. J., Pierce, J. R., and Pandis, S. N.: Mass Spectra Deconvolution of Low, Medium, and High Volatility Biogenic Secondary Organic Aerosol, Environ. Sci. Technol., 43, 4884–4889, https://doi.org/10.1021/es803676g, 2009.
Li, C., Cui, M., Zheng, J., Chen, Y., Liu, J., Ou, J., Tang, M., Sha, Q., Yu, F., Liao, S., Zhu, M., Wang, J., Yao, N., and Li, C.: Variability in real-world emissions and fuel consumption by diesel construction vehicles and policy implications, Sci. Total Environ., 786, 147256, https://doi.org/10.1016/j.scitotenv.2021.147256, 2021.
Li, G., Jiang, B., Wang, S., Li, C., Yuan, B., Wang, B., and Zhanyi, Z.: Determination of 118 Volatile Organic Compounds in Source Emission by Canister Sampling-Preconcentration/Gas Chromatography–Mass Spectrometry, Journal of Instrumental Analysis, 39, 1441–1450, 2020 (in Chinese).
Li, L. and Cocker, D. R.: Molecular structure impacts on secondary organic aerosol formation from glycol ethers, Atmos. Environ., 180, 206–215, https://doi.org/10.1016/j.atmosenv.2017.12.025, 2018.
Li, M., Zhang, Q., Zheng, B., Tong, D., Lei, Y., Liu, F., Hong, C., Kang, S., Yan, L., Zhang, Y., Bo, Y., Su, H., Cheng, Y., and He, K.: Persistent growth of anthropogenic non-methane volatile organic compound (NMVOC) emissions in China during 1990–2017: drivers, speciation and ozone formation potential, Atmos. Chem. Phys., 19, 8897–8913, https://doi.org/10.5194/acp-19-8897-2019, 2019.
Li, W., Li, L., Chen, C.-l., Kacarab, M., Peng, W., Price, D., Xu, J., and Cocker, D. R.: Potential of select intermediate-volatility organic compounds and consumer products for secondary organic aerosol and ozone formation under relevant urban conditions, Atmos. Environ., 178, 109–117, https://doi.org/10.1016/j.atmosenv.2017.12.019, 2018.
Li, X.-B., Yuan, B., Wang, S., Wang, C., Lan, J., Liu, Z., Song, Y., He, X., Huangfu, Y., Pei, C., Cheng, P., Yang, S., Qi, J., Wu, C., Huang, S., You, Y., Chang, M., Zheng, H., Yang, W., Wang, X., and Shao, M.: Variations and sources of volatile organic compounds (VOCs) in urban region: insights from measurements on a tall tower, Atmos. Chem. Phys., 22, 10567–10587, https://doi.org/10.5194/acp-22-10567-2022, 2022.
Li, X.-B., Zhang, C., Liu, A., Yuan, B., Yang, H., Liu, C., Wang, S., Huangfu, Y., Qi, J., Liu, Z., He, X., Song, X., Chen, Y., Peng, Y., Zhang, X., Zheng, E., Yang, L., Yang, Q., Qin, G., Zhou, J., and Shao, M.: Assessment of long tubing in measuring atmospheric trace gases: applications on tall towers, Environmental Science: Atmospheres, 3, 506–520, https://doi.org/10.1039/d2ea00110a, 2023.
Li, Y., Pöschl, U., and Shiraiwa, M.: Molecular corridors and parameterizations of volatility in the chemical evolution of organic aerosols, Atmos. Chem. Phys., 16, 3327–3344, https://doi.org/10.5194/acp-16-3327-2016, 2016.
Liang, Z., Chen, L., Alam, M. S., Zeraati Rezaei, S., Stark, C., Xu, H., and Harrison, R. M.: Comprehensive chemical characterization of lubricating oils used in modern vehicular engines utilizing GC × GC-TOFMS, Fuel, 220, 792–799, https://doi.org/10.1016/j.fuel.2017.11.142, 2018.
Liu, Y., Li, Y., Yuan, Z., Wang, H., Sha, Q., Lou, S., Liu, Y., Hao, Y., Duan, L., Ye, P., Zheng, J., Yuan, B., and Shao, M.: Identification of two main origins of intermediate-volatility organic compound emissions from vehicles in China through two-phase simultaneous characterization, Environ. Pollut., 281, 117020, https://doi.org/10.1016/j.envpol.2021.117020, 2021.
Malherbe, L. and Mandin, C.: VOC emissions during outdoor ship painting and health-risk assessment, Atmos. Environ., 41, 6322–6330, https://doi.org/10.1016/j.atmosenv.2007.02.018, 2007.
McDonald, B. C., de Gouw, J. A., Gilman, J. B., Jathar, S. H., Akherati, A., Cappa, C. D., Jimenez, J. L., Lee-Taylor, J., Hayes, P. L., McKeen, S. A., Cui, Y. Y., Kim, S.-W., Gentner, D. R., Isaacman-VanWertz, G., Goldstein, A. H., Harley, R. A., Frost, G. J., Roberts, J. M., Ryerson, T. B., and Trainer, M.: Volatile chemical products emerging as largest petrochemical source of urban organic emissions, Science, 359, 760–764, https://doi.org/10.1126/science.aaq0524, 2018.
Mo, Z., Shao, M., and Lu, S.: Compilation of a source profile database for hydrocarbon and OVOC emissions in China, Atmos. Environ., 143, 209–217, https://doi.org/10.1016/j.atmosenv.2016.08.025, 2016.
Mo, Z., Cui, R., Yuan, B., Cai, H., McDonald, B. C., Li, M., Zheng, J., and Shao, M.: A mass-balance-based emission inventory of non-methane volatile organic compounds (NMVOCs) for solvent use in China, Atmos. Chem. Phys., 21, 13655–13666, https://doi.org/10.5194/acp-21-13655-2021, 2021.
Na, K. and Pyo Kim, Y.: Chemical mass balance receptor model applied to ambient C2–C9 VOC concentration in Seoul, Korea: Effect of chemical reaction losses, Atmos. Environ., 41, 6715–6728, https://doi.org/10.1016/j.atmosenv.2007.04.054, 2007.
Ou, J., Zheng, J., Li, R., Huang, X., Zhong, Z., Zhong, L., and Lin, H.: Speciated OVOC and VOC emission inventories and their implications for reactivity-based ozone control strategy in the Pearl River Delta region, China, Sci. Total Environ., 530–531, 393–402, https://doi.org/10.1016/j.scitotenv.2015.05.062, 2015.
Qin, M., Murphy, B. N., Isaacs, K. K., McDonald, B. C., Lu, Q., McKeen, S. A., Koval, L., Robinson, A. L., Efstathiou, C., Allen, C., and Pye, H. O. T.: Criteria pollutant impacts of volatile chemical products informed by near-field modelling, Nature Sustainability, 4, 129–137, https://doi.org/10.1038/s41893-020-00614-1, 2021.
Rogers, T. M., Grimsrud, E. P., Herndon, S. C., Jayne, J. T., Kolb, C. E., Allwine, E., Westberg, H., Lamb, B. K., Zavala, M., Molina, L. T., Molina, M. J., and Knighton, W. B.: On-road measurements of volatile organic compounds in the Mexico City metropolitan area using proton transfer reaction mass spectrometry, Int. J. Mass Spectrom., 252, 26–37, https://doi.org/10.1016/j.ijms.2006.01.027, 2006.
Sasidharan, S., He, Y., Akherati, A., Li, Q., Li, W., Cocker, D., McDonald, B. C., Coggon, M. M., Seltzer, K. M., Pye, H. O. T., Pierce, J. R., and Jathar, S. H.: Secondary Organic Aerosol Formation from Volatile Chemical Product Emissions: Model Parameters and Contributions to Anthropogenic Aerosol, Environ. Sci. Technol., 57, 11891–11902, https://doi.org/10.1021/acs.est.3c00683, 2023.
Seco, R., Peñuelas, J., Filella, I., Llusià, J., Molowny-Horas, R., Schallhart, S., Metzger, A., Müller, M., and Hansel, A.: Contrasting winter and summer VOC mixing ratios at a forest site in the Western Mediterranean Basin: the effect of local biogenic emissions, Atmos. Chem. Phys., 11, 13161–13179, https://doi.org/10.5194/acp-11-13161-2011, 2011.
Sekimoto, K., Li, S.-M., Yuan, B., Koss, A., Coggon, M., Warneke, C., and de Gouw, J.: Calculation of the sensitivity of proton-transfer-reaction mass spectrometry (PTR-MS) for organic trace gases using molecular properties, Int. J. Mass Spectrom., 421, 71–94, https://doi.org/10.1016/j.ijms.2017.04.006, 2017.
Seltzer, K. M., Pennington, E., Rao, V., Murphy, B. N., Strum, M., Isaacs, K. K., and Pye, H. O. T.: Reactive organic carbon emissions from volatile chemical products, Atmos. Chem. Phys., 21, 5079–5100, https://doi.org/10.5194/acp-21-5079-2021, 2021.
Seltzer, K. M., Murphy, B. N., Pennington, E. A., Allen, C., Talgo, K., and Pye, H. O. T.: Volatile Chemical Product Enhancements to Criteria Pollutants in the United States, Environ. Sci. Technol., 56, 6905–6913, https://doi.org/10.1021/acs.est.1c04298, 2022.
Sha, Q., Zhu, M., Huang, H., Wang, Y., Huang, Z., Zhang, X., Tang, M., Lu, M., Chen, C., Shi, B., Chen, Z., Wu, L., Zhong, Z., Li, C., Xu, Y., Yu, F., Jia, G., Liao, S., Cui, X., Liu, J., and Zheng, J.: A newly integrated dataset of volatile organic compounds (VOCs) source profiles and implications for the future development of VOCs profiles in China, Sci. Total Environ., 793, 148348, https://doi.org/10.1016/j.scitotenv.2021.148348, 2021.
Shi, Y., Xi, Z., Lv, D., Simayi, M., Liang, Y., Ren, J., and Xie, S.: Sector-based volatile organic compound emission characteristics and reduction perspectives for coating materials manufacturing in China, J. Clean. Prod., 394, 136407, https://doi.org/10.1016/j.jclepro.2023.136407, 2023.
Song, X., Yuan, B., Wang, S., He, X., Li, X., Peng, Y., Chen, Y., Qi, J., Cai, J., Huang, S., Hu, D., Wei, W., Liu, K., and Shao, M.: Compositional Characteristics of Volatile Organic Compounds in Typical Industrial Areas of the Pearl River Delta: Importance of Oxygenated Volatile Organic Compounds, Environmental Science, 44, 1336–1345, https://doi.org/10.13227/j.hjkx.202204104, 2023 (in Chinese).
Stark, H., Yatavelli, R. L. N., Thompson, S. L., Kimmel, J. R., Cubison, M. J., Chhabra, P. S., Canagaratna, M. R., Jayne, J. T., Worsnop, D. R., and Jimenez, J. L.: Methods to extract molecular and bulk chemical information from series of complex mass spectra with limited mass resolution, Int. J. Mass Spectrom., 389, 26–38, https://doi.org/10.1016/j.ijms.2015.08.011, 2015.
Stockwell, C. E., Coggon, M. M., Gkatzelis, G. I., Ortega, J., McDonald, B. C., Peischl, J., Aikin, K., Gilman, J. B., Trainer, M., and Warneke, C.: Volatile organic compound emissions from solvent- and water-borne coatings – compositional differences and tracer compound identifications, Atmos. Chem. Phys., 21, 6005–6022, https://doi.org/10.5194/acp-21-6005-2021, 2021.
Sulzer, P., Hartungen, E., Hanel, G., Feil, S., Winkler, K., Mutschlechner, P., Haidacher, S., Schottkowsky, R., Gunsch, D., Seehauser, H., Striednig, M., Jürschik, S., Breiev, K., Lanza, M., Herbig, J., Märk, L., Märk, T. D., and Jordan, A.: A Proton Transfer Reaction-Quadrupole interface Time-Of-Flight Mass Spectrometer (PTR-QiTOF): High speed due to extreme sensitivity, Int. J. Mass Spectrom., 368, 1–5, https://doi.org/10.1016/j.ijms.2014.05.004, 2014.
Sun, W., Shao, M., Granier, C., Liu, Y., Ye, C. S., and Zheng, J. Y.: Long-Term Trends of Anthropogenic SO2, NOx, CO, and NMVOCs Emissions in China, Earth's Future, 6, 1112–1133, https://doi.org/10.1029/2018ef000822, 2018.
Tan, Y., Han, S., Chen, Y., Zhang, Z., Li, H., Li, W., Yuan, Q., Li, X., Wang, T., and Lee, S.-c.: Characteristics and source apportionment of volatile organic compounds (VOCs) at a coastal site in Hong Kong, Sci. Total Environ., 777, 146241, https://doi.org/10.1016/j.scitotenv.2021.146241, 2021.
Ulbrich, I. M., Canagaratna, M. R., Zhang, Q., Worsnop, D. R., and Jimenez, J. L.: Interpretation of organic components from Positive Matrix Factorization of aerosol mass spectrometric data, Atmos. Chem. Phys., 9, 2891–2918, https://doi.org/10.5194/acp-9-2891-2009, 2009.
Wang, C., Yuan, B., Wu, C., Wang, S., Qi, J., Wang, B., Wang, Z., Hu, W., Chen, W., Ye, C., Wang, W., Sun, Y., Wang, C., Huang, S., Song, W., Wang, X., Yang, S., Zhang, S., Xu, W., Ma, N., Zhang, Z., Jiang, B., Su, H., Cheng, Y., Wang, X., and Shao, M.: Measurements of higher alkanes using NO+ chemical ionization in PTR-ToF-MS: important contributions of higher alkanes to secondary organic aerosols in China, Atmos. Chem. Phys., 20, 14123–14138, https://doi.org/10.5194/acp-20-14123-2020, 2020.
Wang, H., Qiao, Y., Chen, C., Lu, J., Dai, H., Qiao, L., Lou, S., Huang, C., Li, L., Jing, S., and Wu, J.: Source Profiles and Chemical Reactivity of Volatile Organic Compounds from Solvent Use in Shanghai, China, Aerosol Air Qual. Res., 14, 301–310, https://doi.org/10.4209/aaqr.2013.03.0064, 2014.
Wang, H., Sun, S., Nie, L., Zhang, Z., Li, W., and Hao, Z.: A review of whole-process control of industrial volatile organic compounds in China, J. Environ. Sci., 123, 127–139, https://doi.org/10.1016/j.jes.2022.02.037, 2023.
Wang, R., Zhang, C., Ding, H., LV, S., Ding, Y., Wang, H., and Wang, B.: Emission characteristics of volatile organic compounds (VOCs) from the production processes of plastic parts in electronic manufacturing industry, Acta Scientiae Circumstantiae, 39, 4–12, https://doi.org/10.13671/j.hjkxxb.2018.0243, 2019 (in Chinese).
Wang, S., Yuan, B., Wu, C., Wang, C., Li, T., He, X., Huangfu, Y., Qi, J., Li, X.-B., Sha, Q., Zhu, M., Lou, S., Wang, H., Karl, T., Graus, M., Yuan, Z., and Shao, M.: Oxygenated volatile organic compounds (VOCs) as significant but varied contributors to VOC emissions from vehicles, Atmos. Chem. Phys., 22, 9703–9720, https://doi.org/10.5194/acp-22-9703-2022, 2022.
Wei, W., Wang, S., Hao, J., and Cheng, S.: Projection of anthropogenic volatile organic compounds (VOCs) emissions in China for the period 2010–2020, Atmos. Environ., 45, 6863–6871, https://doi.org/10.1016/j.atmosenv.2011.01.013, 2011.
Wu, C., Wang, C., Wang, S., Wang, W., Yuan, B., Qi, J., Wang, B., Wang, H., Wang, C., Song, W., Wang, X., Hu, W., Lou, S., Ye, C., Peng, Y., Wang, Z., Huangfu, Y., Xie, Y., Zhu, M., Zheng, J., Wang, X., Jiang, B., Zhang, Z., and Shao, M.: Measurement report: Important contributions of oxygenated compounds to emissions and chemistry of volatile organic compounds in urban air, Atmos. Chem. Phys., 20, 14769–14785, https://doi.org/10.5194/acp-20-14769-2020, 2020a.
Wu, J., Gao, S., Chen, X., Yang, Y., Fu, Q.-y., Che, X., and Jiao, Z.: Source Profiles and Impact of Volatile Organic Compounds in the Coating Manufacturing Industry, Environmental Science, 41, 1582–1588, https://doi.org/10.13227/j.hjkx.201908203, 2020b (in Chinese).
Yang, G., Huo, J., Wang, L., Wang, Y., Wu, S., Yao, L., Fu, Q., and Wang, L.: Total OH Reactivity Measurements in a Suburban Site of Shanghai, J. Geophys. Res.-Atmos., 127, e2021JD035981, https://doi.org/10.1029/2021JD035981, 2022.
Yang, Y., Shao, M., Wang, X., Nölscher, A. C., Kessel, S., Guenther, A., and Williams, J.: Towards a quantitative understanding of total OH reactivity: A review, Atmos. Environ., 134, 147–161, https://doi.org/10.1016/j.atmosenv.2016.03.010, 2016.
Yuan, B., Shao, M., Lu, S., and Wang, B.: Source profiles of volatile organic compounds associated with solvent use in Beijing, China, Atmos. Environ., 44, 1919–1926, https://doi.org/10.1016/j.atmosenv.2010.02.014, 2010.
Yuan, B., Shao, M., Gouw, J. D., Parrish, D. D., Lu, S., Wang, M., Zeng, L., Zhang, Q., Song, Y., and Zhang, J.: Volatile organic compounds (VOCs) in urban air: How chemistry affects the interpretation of positive matrix factorization (PMF) analysis, J. Geophys. Res.-Atmos., 117, D24302, https://doi.org/10.1029/2012JD018236, 2012.
Yuan, B., Koss, A. R., Warneke, C., Coggon, M., Sekimoto, K., and de Gouw, J. A.: Proton-Transfer-Reaction Mass Spectrometry: Applications in Atmospheric Sciences, Chem. Rev., 117, 13187–13229, https://doi.org/10.1021/acs.chemrev.7b00325, 2017.
Zhao, J., Yao, X., Sun, M., Xu, Y., Wang, S., Cao, D., and Liu, J.: Emission characteristics of volatile organic compounds from typical solvent use industries in Tianjin, Environmental Pollution & Control, 43, 539–545, https://doi.org/10.15985/j.cnki.1001-3865.2021.05.002, 2021 (in Chinese).
Zhao, R., Huang, L., Zhang, J., and Ouyang, F.: Emissions characteristics of volatile organic compounds (VOCs) from typical industries of solvent use in Chengdu City, Acta Scientiae Circumstantiae, 38, 1147–1154, https://doi.org/10.13671/j.hjkxxb.2017.0362, 2018a (in Chinese).
Zhao, Y., Hennigan, C. J., May, A. A., Tkacik, D. S., de Gouw, J. A., Gilman, J. B., Kuster, W. C., Borbon, A., and Robinson, A. L.: Intermediate-volatility organic compounds: a large source of secondary organic aerosol, Environ. Sci. Technol., 48, 13743–13750, https://doi.org/10.1021/es5035188, 2014.
Zhao, Y., Nguyen, N. T., Presto, A. A., Hennigan, C. J., May, A. A., and Robinson, A. L.: Intermediate Volatility Organic Compound Emissions from On-Road Gasoline Vehicles and Small Off-Road Gasoline Engines, Environ. Sci. Technol., 50, 4554–4563, https://doi.org/10.1021/acs.est.5b06247, 2016.
Zhao, Y., Lambe, A. T., Saleh, R., Saliba, G., and Robinson, A. L.: Secondary Organic Aerosol Production from Gasoline Vehicle Exhaust: Effects of Engine Technology, Cold Start, and Emission Certification Standard, Environ. Sci. Technol., 52, 1253–1261, https://doi.org/10.1021/acs.est.7b05045, 2018b.
Zheng, J., Yu, Y., Mo, Z., Zhang, Z., Wang, X., Yin, S., Peng, K., Yang, Y., Feng, X., and Cai, H.: Industrial sector-based volatile organic compound (VOC) source profiles measured in manufacturing facilities in the Pearl River Delta, China, Sci. Total Environ., 456–457, 127–136, https://doi.org/10.1016/j.scitotenv.2013.03.055, 2013.
Zhong, Z., Sha, Q., Zheng, J., Yuan, Z., Gao, Z., Ou, J., Zheng, Z., Li, C., and Huang, Z.: Sector-based VOCs emission factors and source profiles for the surface coating industry in the Pearl River Delta region of China, Sci. Total Environ., 583, 19–28, https://doi.org/10.1016/j.scitotenv.2016.12.172, 2017.
Zhong, Z., Zheng, J., Zhu, M., Huang, Z., Zhang, Z., Jia, G., Wang, X., Bian, Y., Wang, Y., and Li, N.: Recent developments of anthropogenic air pollutant emission inventories in Guangdong province, China, Sci. Total Environ., 627, 1080–1092, https://doi.org/10.1016/j.scitotenv.2018.01.268, 2018.
Zhou, Z., Deng, Y., Zhou, X., Wu, K., Tan, Q., Yin, D., Song, D., Chen, Q., and Zeng, W.: Source Profiles of Industrial Emission-Based VOCs in Chengdu, Environmental Science, 41, 3042–3055, https://doi.org/10.13227/j.hjkx.201912203, 2020a (in Chinese).
Zhou, Z., Tan, Q., Deng, Y., Song, D., Wu, K., Zhou, X., Huang, F., Zeng, W., and Lu, C.: Compilation of emission inventory and source profile database for volatile organic compounds: A case study for Sichuan, China, Atmos. Pollut. Res., 11, 105–116, https://doi.org/10.1016/j.apr.2019.09.020, 2020b.
Zhu, W., Guo, S., Zhang, Z., Wang, H., Yu, Y., Chen, Z., Shen, R., Tan, R., Song, K., Liu, K., Tang, R., Liu, Y., Lou, S., Li, Y., Zhang, W., Zhang, Z., Shuai, S., Xu, H., Li, S., Chen, Y., Hu, M., Canonaco, F., and Prévôt, A. S. H.: Mass spectral characterization of secondary organic aerosol from urban cooking and vehicular sources, Atmos. Chem. Phys., 21, 15065–15079, https://doi.org/10.5194/acp-21-15065-2021, 2021.