the Creative Commons Attribution 4.0 License.
the Creative Commons Attribution 4.0 License.
 | 18 Jun 2024
A mechanism of stratospheric O3 intrusion into the atmospheric environment: a case study of the North China Plain
Yuehan Luo
Tianliang Zhao
Kai Meng
Qingjian Yang
Yongqing Bai
Kai Yang
Weikang Fu
Chenghao Tan
Yifan Zhang
Yanzhe Zhang
Zhikuan Li
Stratosphere-to-troposphere transport results in the stratospheric intrusion (SI) of O3 into the free troposphere through the folding of the tropopause. However, the mechanism of SI that influences the atmospheric environment through the cross-layer transport of O3 from the stratosphere and free troposphere to the atmospheric boundary layer has not been elucidated thoroughly. In this study, an SI event over the North China Plain (NCP; 33–40° N, 114–121° E) during 19–20 May 2019 was chosen to investigate the mechanism of the cross-layer transport of stratospheric O3 and its impact on the near-surface O3 based on multi-source reanalysis, observation data, and air quality modeling. The results revealed a mechanism of stratospheric O3 intrusion into the atmospheric environment induced by an extratropical cyclone system. The SI with downward transport of stratospheric O3 to the near-surface layer was driven by the extratropical cyclone system, with vertical coupling of the upper westerly trough, the middle of the northeast cold vortex (NECV), and the lower extratropical cyclone, in the troposphere. The deep trough in the westerly jet aroused the tropopause folding, and the lower-stratospheric O3 penetrated the folded tropopause into the upper and middle troposphere; the westerly trough was cut off to form a typical cold vortex in the upper and middle troposphere. The compensating downdrafts of the NECV further pushed the downward transport of stratospheric O3 in the free troposphere; the NECV activated an extratropical cyclone in the lower troposphere; and the vertical cyclonic circulation governed the stratospheric O3 from the free troposphere across the boundary layer top, invading the near-surface atmosphere. In this SI event, the average contribution of stratospheric O3 to near-surface O3 was accounted for at 26.77 %. The proposed meteorological mechanism of the vertical transport of stratospheric O3 into the near-surface atmosphere, driven by an extratropical cyclone system, could improve the understanding of the influence of stratospheric O3 on the atmospheric environment, with implications for the coordinated control of atmospheric pollution.
- Article
(4187 KB) - Full-text XML
-
Supplement
(1497 KB) - BibTeX
- EndNote


The prominence of tropospheric O3 pollution is growing increasingly conspicuous in China (Chen et al., 2021; Li et al., 2020; Luo et al., 2022). The widely studied photochemical reactions and regional transports are the principal sources of tropospheric O3 in air pollution. Many studies have ascertained the mechanism of these factors in relation to tropospheric O3 and proposed targeted control strategies for O3 pollution (Ding et al., 2019; Li et al., 2019, 2020; Liu et al., 2021; Verstraeten et al., 2015). In addition, approximately 90 % of the atmospheric-column O3 abundance is concentrated in the stratosphere. The stratosphere intrusion (SI), with the downward cross-layer transport of stratospheric O3, is also considered to be an essential natural source of tropospheric O3 (Bourqui and Trepanier, 2010; Chen, et al., 2023a; Holton et al., 1995; Wild, 2007), which has been non-comprehensively understood together with the effect mechanism and the degree of change in the atmospheric environment.
Under specific configurations of atmospheric circulation, stratospheric O3 could invade downwards through the tropopause, along with the dry and cold stratospheric air, with high potential vorticity (PV), increasing the tropospheric O3 concentrations with a contribution of about 300–700 Tg O3 yr−1 (Stevenson et al., 2006; Wild, 2007). As the primary pathway of stratosphere–troposphere transport (STT), SI is achieved by multiple synoptic-scale and mesoscale processes (Stohl et al., 2003). Ordinarily, SI is closely associated with the subtropical westerly jet, cutoff-low pressures, tropopause folding, trough–ridge systems, tropical cyclones, convection systems, etc. (Chen et al., 2022, 2023b; Ding and Wang, 2006; Holton et al., 1995; Jiang et al., 2015; Zhao et al., 2021a). The deeply folded tropopause in the subtropical westerly jet, with a cold front passing the western United States, induced near-surface O3 increases (Langford et al., 2012). The widespread subsidence movement in the south of the subtropical jet in March 2010 brought about a significant increase in O3 in the low troposphere in Hong Kong (Zhao et al., 2021a). In June 2014, the peripheral downdrafts in the deep convection of the large-scale tropical cyclone Hagibis directly drove the STT of O3, prompting the stratospheric O3 transport downwards and causing rapid abnormal enhancements in surface O3 (Jiang et al., 2015).
SI exhibits greater prominence in the mid-latitudes with the prevailing subtropical westerly jet. In the mid-latitudes of the Northern Hemisphere, approximately 20 %–30 % of the O3 reserve in the troposphere is sourced from the stratosphere (Lelieveld and Dentener, 2000). SI events were observed frequently in the western United States, the eastern Mediterranean, the Middle East, and East Asia (Akritidis et al., 2016; Langford et al., 2009; Lefohn et al., 2011; X. Wang et al., 2020). In parts of the US, the contribution of SI to surface O3 is almost comparable to that of local O3 precursor emissions (Lin et al., 2012; Pfister et al., 2008). In China, the tropospheric O3 exhibited an annual increase of 0.78 % yr−1 on account of the SI processes (Verstraeten et al., 2015). The SI caused by a landing typhoon sharply increased the surface O3 by 32 % in the North China Plain (NCP) (Meng et al., 2022a). Evidently, the artificial uncontrollability of the SI impact on surface O3 complicates the prevention and control of ambient O3 pollution. Therefore, clarifying the influencing mechanism of SI in relation to surface O3 could improve our knowledge on the formation and/or causes of ambient O3 pollution, which is of great concern for the effective prevention of O3 pollution.
It is generally recognized that the SI processes are closely associated with subtropical westerly jet activities (Archer and Caldeira, 2008; Langford et al., 2012). The abnormal disturbances of the jet streams, which are the principal reason for the tropopause folding, could further develop to form a cold vortex over the mid-upper troposphere in mid-high latitudes (Martin, 2021; Satyamurty and Seluchi, 2007). The cold vortex regulates the weather and climate in the mid-high latitudes (Xue et al., 2022; Yang and Zhang, 2017) and triggers vigorous convection, resulting in a variety of disastrous weather conditions and anomalous climates (Tao et al., 2023; Xue et al., 2022). The northeast cold vortex (NECV) is a typical cold, low vortex system in East Asia (Lian et al., 2016; Xie and Bueh, 2017). The pronounced 500 hPa trough–ridge system of the subtropical westerly jet from the Caspian Sea to eastern China is considered to be the precursor of the NECV (Gong et al., 2022). Furthermore, on account of the existence of the upper-level jet together with the NECV, a significant horizontal-wind vertical shear is aroused between the mid-lower stratosphere and the NECV, potentially inducing the stratosphere–troposphere exchange of air mass. The overall impact of the NECV-resulting mass exchange at the tropopause is the net import of O3 from the stratosphere to the troposphere (Chen et al., 2014a, b). However, numerous existing studies on the cold vortex system focus on its causal factors in terms of formation and structure, as well as its effects on precipitation and extreme weather (Fu et al., 2014; Gao and Gao, 2018; Lian et al., 2016; Tao et al., 2023; Xue et al., 2022); the mechanism of the cold vortex in mid-high latitudes that drives the vertical cross-layer transport of stratospheric O3 and the atmospheric environmental impact still lack unambiguous insights and are in need of thorough investigation.
Therefore, this study targeted the SI event driven by a typical NECV observed over the NCP during 19–20 May 2019 to investigate the mechanism of stratospheric O3 intrusion affecting the atmospheric environment. Multi-source reanalysis data and the Weather Research and Forecasting model coupled with Chemistry (WRF-Chem) with integrated process analysis (IPR) are jointly applied to delve into the mechanism of the cold vortex system triggering SI and the degree of the SI effect on surface O3. This study aims to elucidate the mechanism of the vertical-structure configuration of cold vortex systems in mid-high latitudes driving O3 cross-layer transport and to quantify the influence on surface O3, refining the systematic understanding of the stratosphere–free troposphere–atmospheric boundary layer (ABL) transport of air pollutants, with implications for the improvement of the response capabilities in relation to changes in the atmospheric environment.
2.1 Observational and reanalysis data
The 3D meteorological data in this study were obtained from the 0.25° ERA5 reanalysis product (https://apps.ecmwf.int/datasets/, last access: 14 June 2024) released by the European Centre for Medium-Range Weather Forecasts (ECMWF). According to previous studies, meteorological variables – such as air temperature, wind, and humidity – of ERA5 reanalysis data show good performance in both the stratosphere and troposphere (Hersbach et al., 2020). The ground meteorological data were collected from 639 meteorological stations of the China Meteorological Observation Network for the NCP and the surrounding regions. The data of 3D O3 concentrations were provided by the Modern-Era Retrospective Analysis for Research and Applications version 2 (MERRA-2, https://gmao.gsfc.nasa.gov/reanalysis/MERRA-2/data_access/ICFM9), with a horizontal resolution of 0.5° × 0.625° and a temporal resolution of 3 h, to characterize the vertical transport of the stratospheric O3. The MERRA-2 data set assimilates total column ozone (TCO) satellite retrievals from ozone monitoring instruments and stratospheric O3 vertical profiles from microwave limb sounders after 2004 (Gelaro et al., 2017; Levelt et al., 2006; Waters et al., 2006). The MERRA-2 O3 enables the study of SI events because it is consistent with ozonesondes and could realistically represent the temporal and spatial variations of O3, especially in the lower stratosphere and near the tropopause (Wargan et al., 2015, 2017). Hourly observed surface O3 and CO concentrations are retrieved from 440 observation sites of the National Air Quality Monitoring Network (http://www.mee.gov.cn/, last access: 14 June 2024), with quality controlling based on China's National Standard of Air Quality Observation. To evaluate the reproducibility of the WRF-Chem simulations for the stratospheric O3 intrusion, the portion (O3S) of tropospheric O3 concentrations originating from the stratosphere was applied for a comparison with our simulation results. The stratospheric tracer tagging method in global chemistry models was used to track the transport of stratospheric O3 to the troposphere by releasing stratospheric tracers (Barth et al., 2012; Chang et al., 2023). The tracer was set to 1 above the tropopause, and only physically transported and chemically decayed in the troposphere without chemical productions (Chang et al., 2023; Ni et al., 2019). The O3S in the troposphere was calculated by multiplying the concentrations of O3 within the tropopause and the stratospheric tracers. The O3S used in this study was obtained from the ECMWF Atmospheric Composition Reanalysis 4 (EAC4, https://ads.atmosphere.copernicus.eu/cdsapp#!/dataset, last access: 14 June 2024) reanalysis data set, with a spatial resolution of 0.75° and a temporal resolution of 3 h, vertically divided into 60 model layers from 1000 to 1 hPa. The EAC4 data set produces optimized atmospheric chemical reanalysis results by assimilating multiple observations of atmospheric components and is widely used in the field of atmospheric environment (Inness, et al., 2019).
2.2 Modeling setup and configuration
The meteorology–chemical online coupled model WRF-Chem with IPR was applied in this study. WRF-Chem has been demonstrated to perform well in the simulation and analysis of SI cases (Chang et al., 2023; Ni et al., 2019; Zhao et al., 2021a). The 5 d simulations covering three nested domains started on 16 May 2019, with horizontal resolutions of 81, 27, and 9 km. The initial and lateral boundary meteorological conditions at 6 h intervals are derived from ERA5 reanalysis data, and the Multi-resolution Emission Inventory of China (MEIC, http://meicmodel.org/, last access: 14 June 2024) provided the anthropogenic emission data. The domain settings are presented in Fig. S1 in the Supplement, and the physical and chemical parameterization schemes used in the simulations are listed in Table S1.
Since the stratospheric chemistry is not included in the WRF-Chem, an upper boundary condition (UBC) scheme derived from the Whole Atmosphere Community Climate Model was used to provide the initial and boundary chemical conditions for the stratosphere in the model (Barth et al., 2012). The UBC scheme could generate all key chemical species in the stratosphere, enabling the WRF-Chem to simulate the stratospheric intrusion processes more accurately (Barth et al., 2012; Lamarque et al., 2012; Zhao et al., 2021a). To diagnose the impact of stratospheric O3 on surface O3 during the SI caused by the cold vortex system, two simulation experiments were devised. The control experiment, referred to as CASESTRO3, utilized the upper boundary conditions of stratospheric O3 in the WRF-Chem model (Barth et al., 2012). This setup simulated the actual meteorological and atmospheric chemical conditions during the SI. The sensitivity experiment (CASEnoSTRO3) used physical and chemical configurations identical to those in CASESTRO3. The stratospheric O3 of the UBC scheme in CASEnoSTRO3 was turned off by setting O3 concentrations to zero above the tropopause. The differences in the O3 simulations between the experiments CASESTRO3 and CASEnoSTRO3 are used to assess the quantitative effect of the stratospheric O3 sources on surface O3 in the SI event.
2.3 Modeling validation
The observed meteorological and chemical parameters, including air temperature at 2 m (T2), wind speed at 10 m (WS10), relative humidity at 2 m (RH2), and O3 concentrations, were used to assess the model performance in CASESTRO3 (Fig. S2). We calculated the averages of the meteorological elements and O3 concentrations observed at all stations in the innermost domain and the averages of the simulated meteorological elements and O3 concentrations of the model grids corresponding to the station locations to conduct the modeling validation. It can be found that the simulated T2, RH2, and WS10 generally agree well with the observations: the indices of agreement (IOAs) are 0.92, 0.99, and 0.90, respectively, and the correlation coefficients (R) are higher than 0.92; thus, they all meet the usability criteria (Wei et al., 2019; Zhang et al., 2018). Hourly observed and simulated O3 concentrations are shown in Fig. S2d. The R, MB (mean bias), RMSE (root mean square error), and IOA of the O3 are 0.88, −8.25 %, 14.37, and 0.90, respectively, indicating that our simulation reasonably reproduced the variations in O3 in CASESTRO3. In Fig. S3, the differences in the simulated surface O3 between CASESTRO3 and CASEnoSTRO3, which indicate the contribution of stratospheric O3 to the near-surface atmosphere, were compared with the O3S of EAC4 reanalysis data, and it was concluded that the simulations roughly captured the temporal and spatial variations in the stratospheric O3 reaching the near-surface layer during the SI. All these evaluations indicate that our simulations performed well in reproducing the variations in O3 and in the meteorological parameters during the SI process.
3.1 Vertical configuration triggers O3 cross-layer transport
The tropopause can be used to identify the top of the troposphere and marks a separation of the troposphere from the stratosphere in terms of both thermal structure and chemical composition. SI events are characterized by the downward transport of stratospheric O3-rich air, coinciding with high PV and low humidity across the tropopause and into the troposphere (Zhao et al., 2021b). The height with PV equal to 2 is widely used to indicate the position of the dynamical tropopause at mid-latitudes (Holton et al., 1995). The tropopause over the NCP presented the obvious variation over 18–20 May 2019 (Fig. S4), especially in terms of the tropopause folding, with the contour at PV = 2 curving extremely downwards to below 400 hPa over the NCP region on 19 May 2019 (Fig. S4b). Figure 1 shows the latitudinal and meridional vertical structures of the dynamical tropopause on 19 May 2019 over the NCP. The tropopause noticeably folded over the area of 39–42° N and 110–120° E, dropping down to 500–600 hPa. In the tropopause-folding region, strong downdrafts penetrated from the lower stratosphere into the near-surface layer, and the strong vertical velocity – reaching up to 0.2 m s−1 – was inclined to drive the downward transport of the stratospheric O3 into the troposphere (Fig. 1). Correspondingly, the vertical O3 distribution presented a tongue pattern, with the O3 concentrations exceeding 200 ppb being poured into the troposphere along with the dry and cold air from the stratosphere (Fig. S4b), indicating the impact of the SI on O3 in the ambient atmosphere.
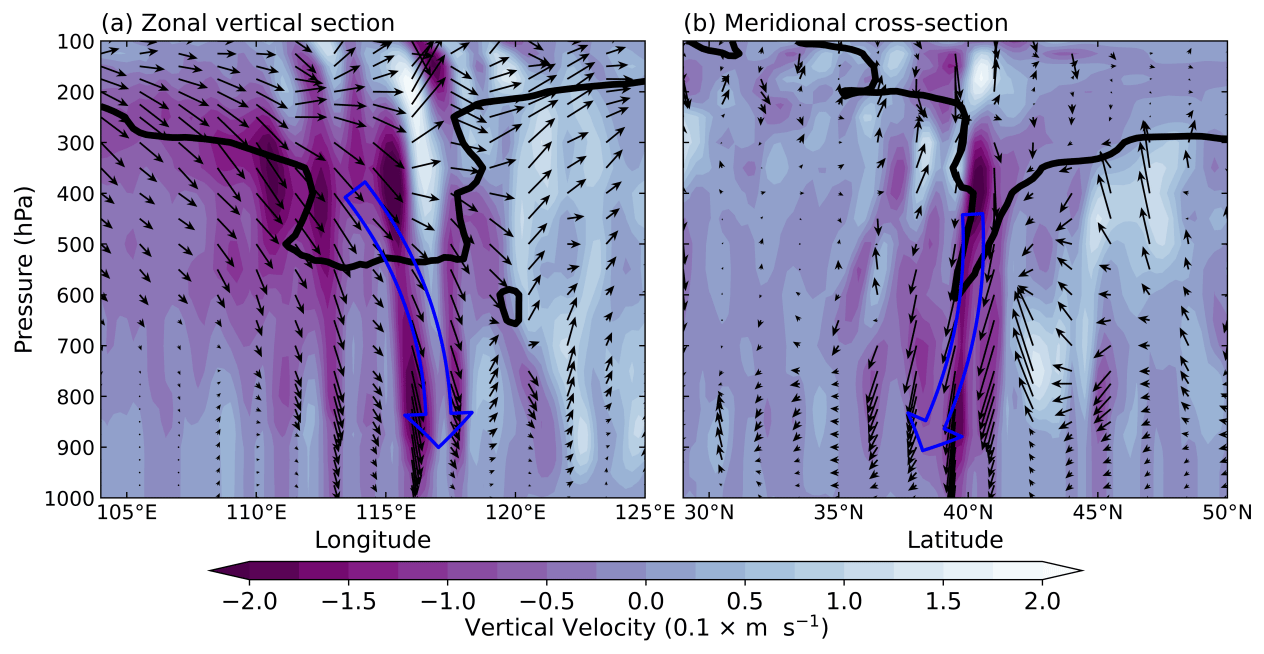
Figure 1The vertical sections of the vertical velocity (color contours; 0.1 m s−1) and wind vectors of the components U and V, with W × 50 from the ERA5 data being averaged (a) over 32–40° N and (b) over 114–121° E in the NCP region on 19 May 2019. Solid black lines indicate the dynamical tropopause marked with the isolines at PV = 2. The hollow blue arrows indicate the downdraft flows of SI in the troposphere.
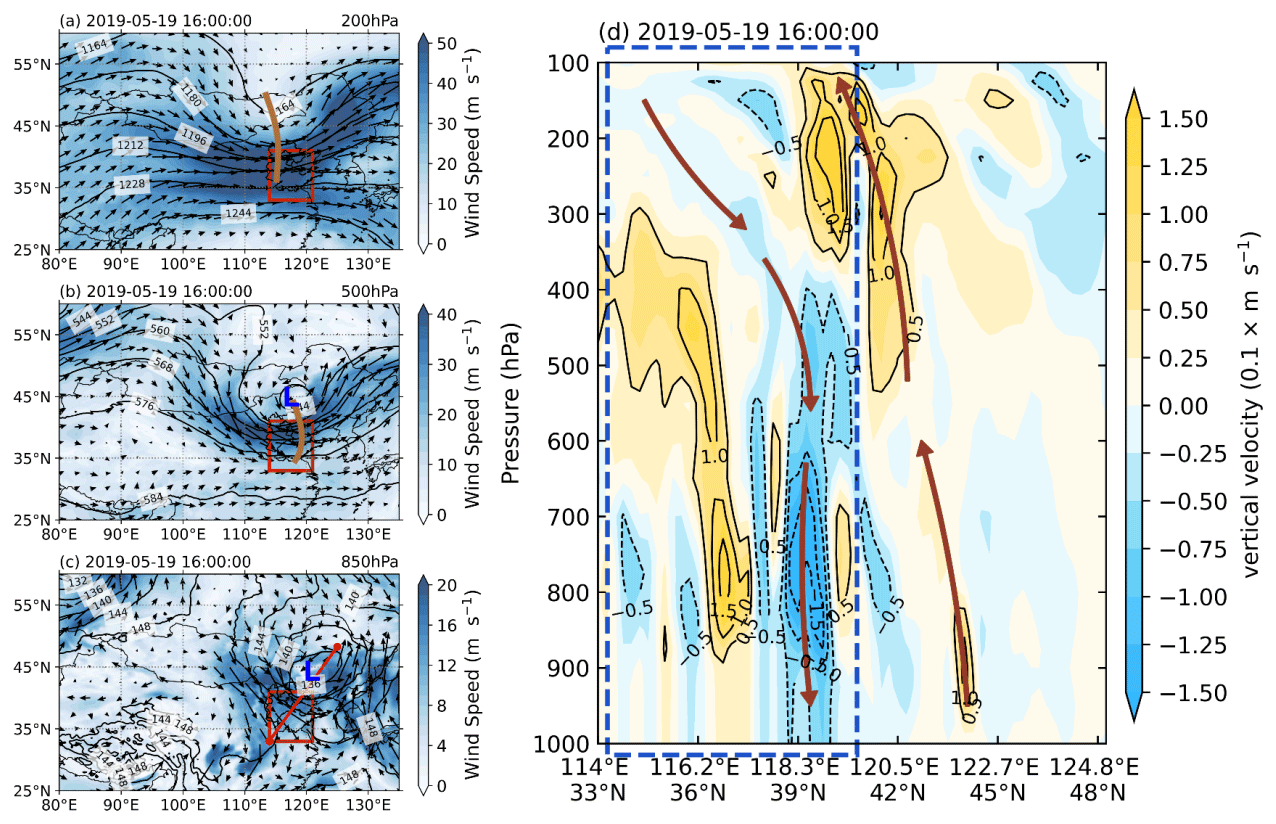
Figure 2Atmospheric circulation patterns of horizontal wind vectors from the ERA5 data at (a) 200 hPa, (b) 500 hPa, and (c) 850 hPa, with brown lines indicating the troughs in the westerlies; (d) vertical cross-sections of vertical velocity (color contours; 0.1 m s−1) along the straight red lines in panel (c) at 16:00 LST on 19 May 2019. The solid red boxes in panels (a)–(c) and the dotted blue box in panel (d) mark the NCP region. The solid red line in panel (c) is perpendicular to the northwestern wind direction over the NCP region, passing through the extratropical cyclone center at 850 hPa, and the brown lines with arrows in panel (d) indicate vertical transport directions between the lower stratosphere and the lower troposphere.
Figures 2a–c and S5 present the upper-, middle-, and lower-tropospheric atmospheric circulations at 200, 500, and 850 hPa, along with the temporal variations during the NECV period. At 16:00 LST (local standard time using the 24 h system) on 18 May 2019, the shallow troughs were located over 95–100° E in the subtropical westerly jets at 200 and 500 hPa (Fig. S5). The subtropical westerly jets evolved from zonal to meridional patterns, with the trough moving eastwards and deepening southwards in the westerly wave fluctuations, and the prominently deepening troughs moved to the northern NCP on 19 May (Fig. 2a–b). The deepening troughs in the upper and middle troposphere at 200 and 500 hPa were cut off, forming the cyclonic cold vortex system – the NECV – during 19–20 May 2019 (Figs. 2 and S5). The NCP was situated at the periphery of the NECV with the compensating downdrafts, which could drive the vertical transport downwards in the free troposphere (Fig. 2). Moreover, the NECV in the upper and middle troposphere induced the extratropical cyclone in the lower troposphere at 850 hPa on 19 May 2019, and the strong northwestern horizontal wind prevailed behind the extratropical cyclone in the NCP (Fig. 2). On 20 May, the NECV moved northeastwards and lost control of the NCP (Fig. S5). Figure 2d presents the section of the vertical velocity from the NCP to the center of the extratropical cyclone (solid red line in Fig. 2c) on 19 May. The intense rising motions were present near the center of the NECV and the extratropical cyclone, ranging from the near-surface layer (1000 hPa) up to 100 hPa. The sinking branch of the vertical circulation of the cold vortex and the lower-tropospheric cyclone from the upper troposphere (200–400 hPa) to the near-surface layer was situated over the NCP (Fig. 2d), governing the downward transport of the stratospheric O3 to the near-surface layer. Specifically, the atmospheric circulation presented the vertical configuration in the troposphere with the upper westerly trough, middle NECV, and lower extratropical cyclone. The downdraft branch of the system opened up a vertical transport channel from the lower stratosphere to the surface, allowing stratospheric O3 to invade the surface.
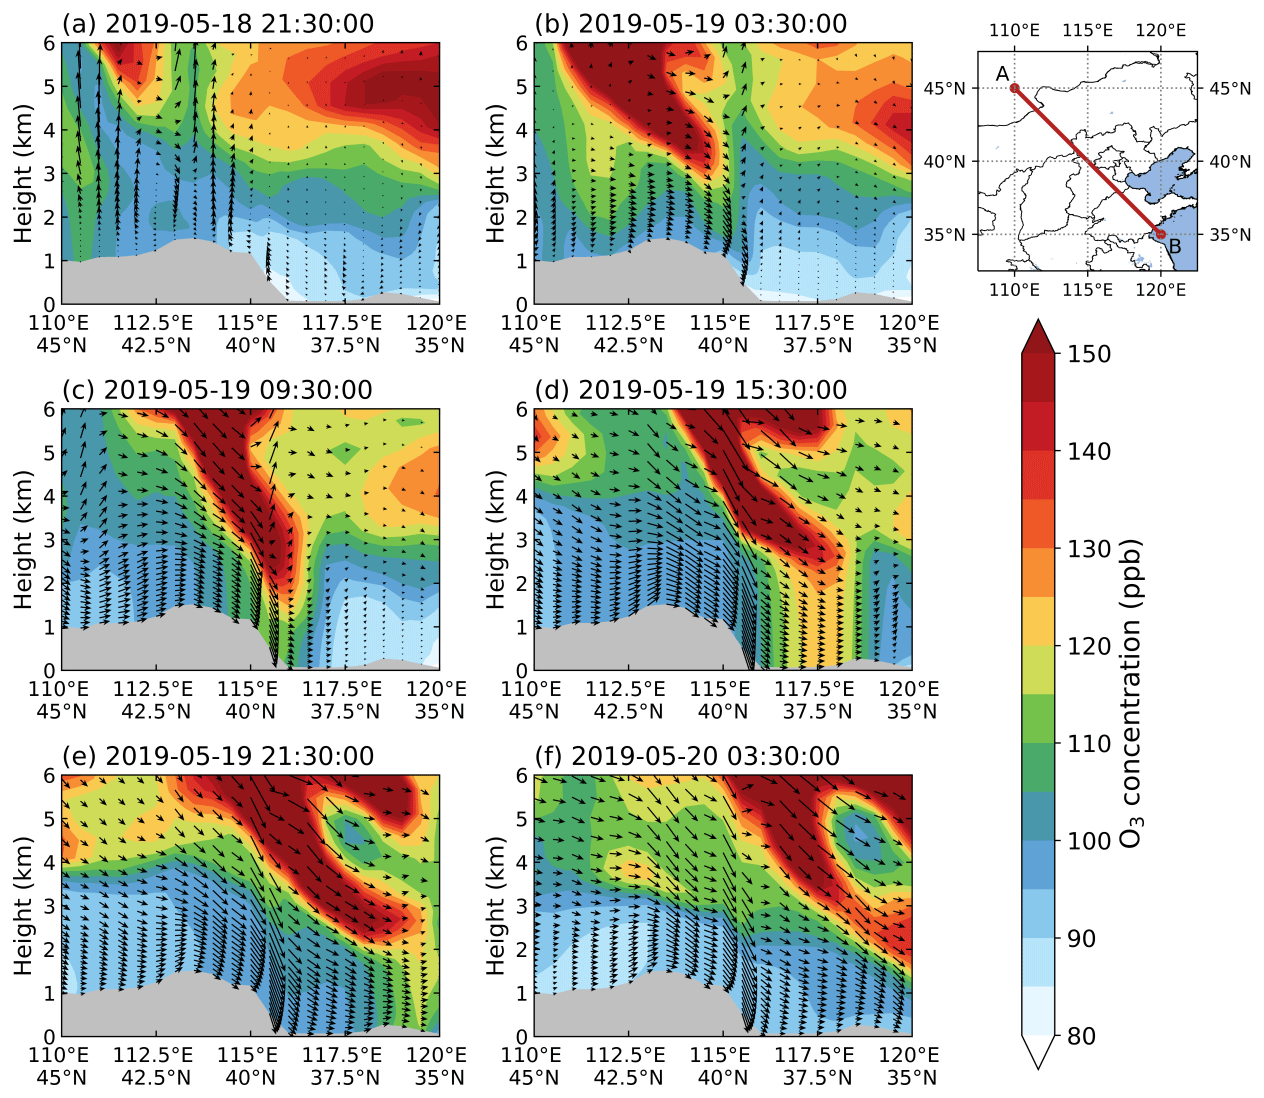
Figure 3Vertical sections of O3 concentrations (ppb) and composite wind vectors from the MERRA-2 data along the line AB in the middle and the lower troposphere over the NCP, with the topography being marked by gray areas. The line AB crosses the entire NCP along the northwestern wind direction.
In the middle and lower troposphere, the downdrafts appeared over the northwest of the NCP and were gradually reinforced with the development of the cold vortex and the induced extratropical cyclone (Fig. 3). The mountain airflow on the lee slopes of the plateau and the mountains in the western NCP could also contribute to strengthening the subsidence motion in the lower troposphere (Ning et al., 2018). Strong downdrafts in the lower troposphere, in combination with the high turbulent diffusion in the convective boundary layer during the daytime, could force the tongue plume with O3 > 150 ppb to cross the boundary layer top, extending to the near-surface layer from 09:30 to 15:30 LST on 19 May (Fig. 3c and d). Horizontally, the strong northwestern wind at the rear of the NECV and the near-surface cyclone caused the O3-rich tongue plume to bend from the northwest to the southeast of the NCP (Figs. 2c and 3). Therefore, the stratospheric O3 reached the surface of the northwestern NCP in the morning, gradually drifted along the direction of the airflow, and then reached the southeastern NCP at night on 19 May 2019 (Fig. 3c–e). In this vertical configuration of atmospheric circulations of the upper westerly trough, the middle NECV, and the lower extratropical cyclone from the lower stratosphere to the near-surface layer (Fig. 2), the deep westerly trough with strong vertical wind shear triggered the downward folding of the tropopause, which was expected to cause the O3-rich air mass in the stratosphere to pour into the middle and upper troposphere (Figs. 2–3). Subsequently, the compensating downdrafts at the periphery of the cold vortex circulation effectively transported the highly concentrated O3 from the upper troposphere downwards to the lower troposphere. The descending branch of the extratropical cyclone in the lower troposphere further promoted the transport of stratospheric O3 from the free troposphere to the ABL in the lower troposphere.
3.2 Impact of the SI on near-surface O3
To investigate the impact of stratospheric O3 on near-surface O3 as a result of the SI, the observed near-surface O3 concentrations, the wind fields, and the 24 h changes in air temperature at 950 hPa are shown in Fig. 4. Before the NECV formed on May 18, strong cold air was centered in the northeast–southwest zone in north China, connecting with a slight cooling in the northwestern NCP, which was reflected by the 24 h changes in air temperature at 950 hPa (Fig. 4a). Meanwhile, a strong warm easterly airflow prevailed over the eastern and southern NCP with lower O3 concentrations, and the high O3 concentrations existed over the convergence zone between weak and strong easterly winds in the northwestern NCP region. With the NECV formation on 19 May, the extratropical cyclone in the lower troposphere was activated in the northern NCP and in northeastern China, and the northwestern airflows at the rear of cyclone pushed the cold air mass southeastwards and prompted the downstream spread of high-level O3 in the northwestern NCP (Fig. 4b). On 20 May, the NCP region was beyond the NECV's control, with decreasing O3 concentrations (Fig. 4c).
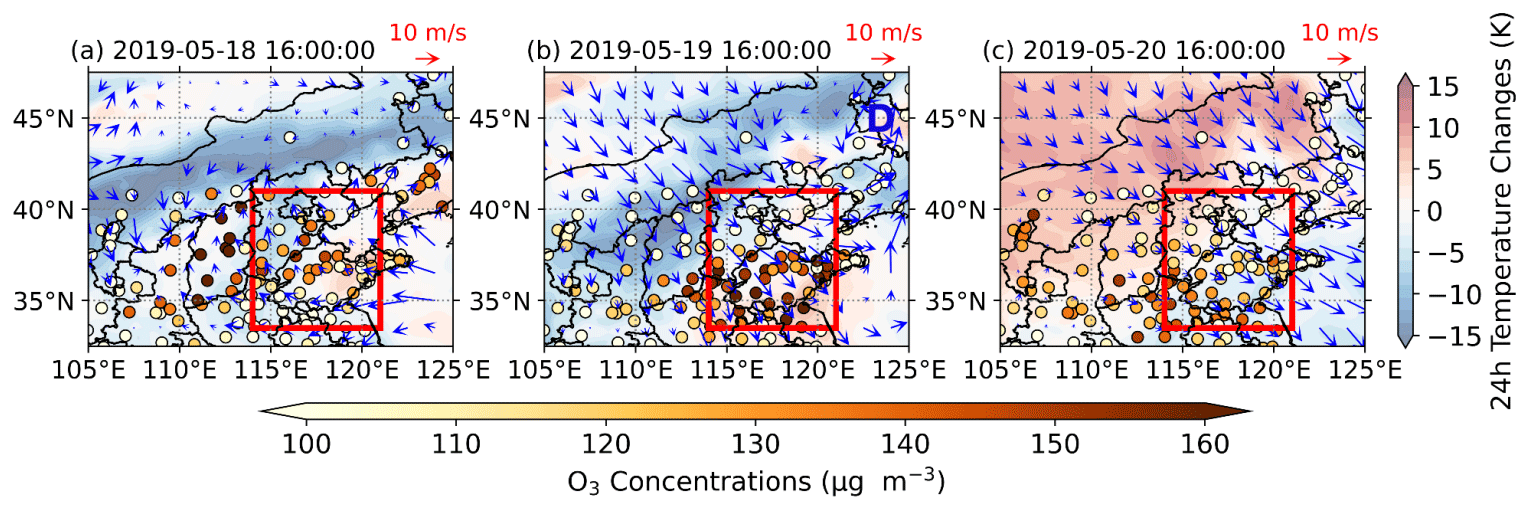
Figure 4Horizontal wind vectors and 24 h changes in air temperature (shaded colors) at 950 hPa from the ERA5 data and the observed near-surface O3 concentrations (color dots) at 16:00 LST on (a) 18 May, (b) 19 May, and (c) 20 May 2019. The red rectangles cover roughly the NCP region.
Figure 5 shows the temporal variations in near-surface O3, as well as in CO concentrations and meteorological variables, over the NCP. Due to the impact of cold air on the NCP, the rising air temperature required for the stronger photochemical reaction was not observed on 19 May 2019 (Fig. 5a). Precipitation in the NCP region could scavenge the O3 precursors (Fig. 5a), which could modify the photochemical O3 production (Sato et al., 2006; Yoo et al., 2014). Also, the dense cloud cover could reduce the solar radiation suppressing the O3 production from photochemical reactions (Fig. 5b). Since the stratosphere is rich in O3 and poor in CO, the homology between CO and O3 is commonly regarded to be an indicator for the identification of the source of O3 (Moody et al., 1995; Parrish et al., 1998; Voulgarakis et al., 2011). The negative correlation between CO and O3 implies that O3 is derived from the vertical downward STT. As can be found from Fig. 5c, with the formation of tropopause folding and the cold vortex on 19 May (Fig. S2), the regional CO concentrations in the NCP decreased rapidly, reaching nearly half of the initial level. Meanwhile, O3 concentrations increased slightly. Remarkably, the opposite variations between CO and O3, combined with the rapidly decreasing T2 and relative humidity (RH2), could reflect the stratospheric O3-rich air intrusion into the ground and the redistribution of surface O3 in the NCP region (Fig. 5a and c). In addition, triggered by the cold vortex in the upper and middle troposphere (Fig. 2), the extratropical cyclone dramatically increased the near-surface wind speed (WS10) over the NCP (Fig. 5b), with the maximum regional averaged wind speed exceeding 7 m s−1. The strong northwestern winds of the cyclone could have enhanced the diffusion of O3, beneficial to the decrease in local near-surface O3 concentrations in the SI event. Although stratospheric O3 intensely invaded the near-surface layer over the NCP region, the near-surface O3 was strongly diffused downstream by the northwestern wind. Meanwhile, the horizontal diffusion also prevented O3 from the stratosphere from accumulating over the NCP (Figs. 2a–c and 4). Also, the routine ground observations cannot distinguish whether O3 comes from the stratosphere or local generation. However, the near-surface O3 observed on 19 May was slightly higher than that of the previous day under such facilitated diffusion conditions (Fig. 5c), which proves that the SI exerted additional contributions on the near-surface O3 over the NCP region. Additionally, the changes in observed meteorological and environmental elements from the representative sites of SJZ (Shijiazhuang) and JN (Jinan) in the NCP (the red dots in Fig. S3) were examined in Fig. S6. The results showed the distinct characteristics, compared with the regional averages, of the diurnal cycles of O3 concentrations having been disturbed, with the O3 peaking by the SI event. The SJZ in the northwestern NCP received stratospheric O3 earlier and reached the spike at 10:00 LST on 19 May. Then the O3 concentrations gradually decreased under the influence of strong winds but still maintained a high level in the early morning of 20 May. The JN in the southeastern NCP was affected by the stratospheric intrusion later. While under meteorological conditions conducive to the dissipation of pollutants (wind speed up to 8 m s−1), higher O3 concentrations than the previous day were still observed, reflecting the additional contribution of stratosphere intrusion to near-surface O3.
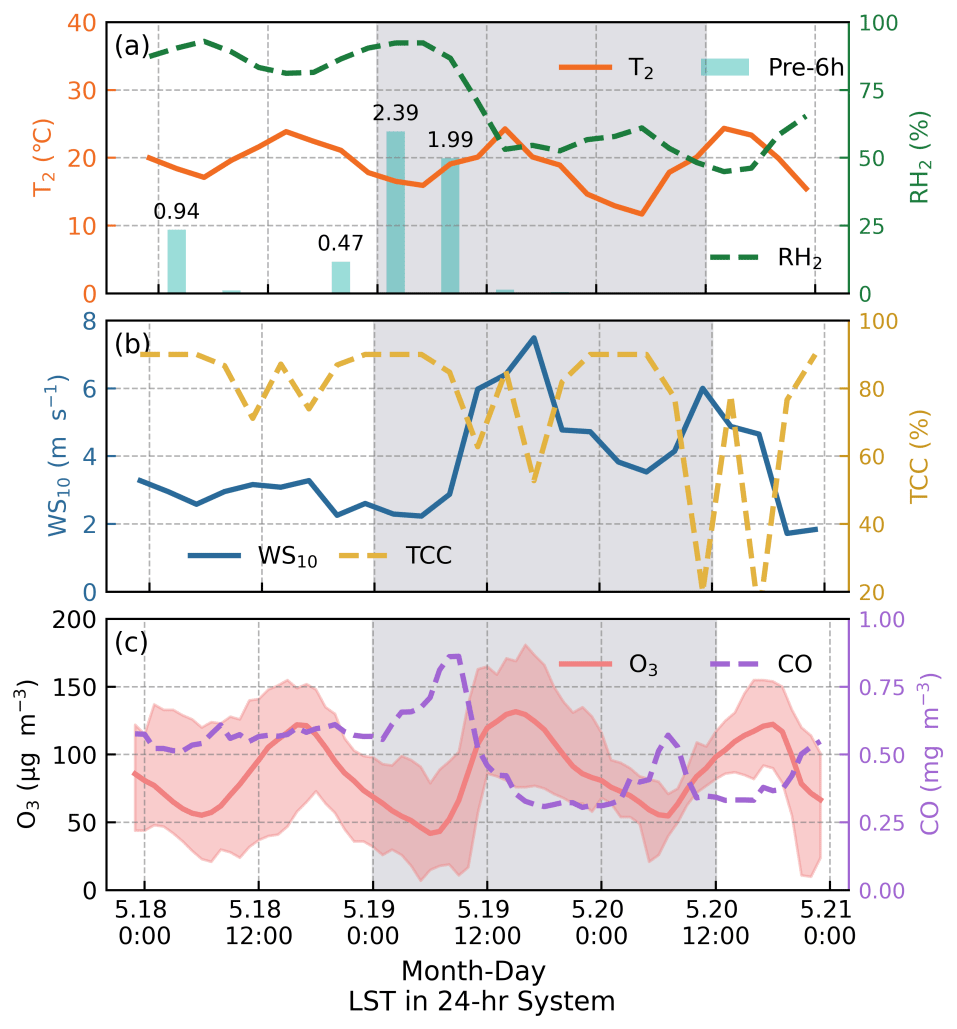
Figure 5Temporal variations in regionally averaged (a) T2, accumulated precipitation of 6 h (pre-6h, units: mm), and RH2; (b) WS10 and total cloud cover (TCC); and (c) near-surface O3 and CO concentrations from the observations in the NCP region. The shaded areas mark the periods of the SI in relation to the near-surface layer.
Overall, (1) the vertical configuration of the abnormal disturbance of the subtropical westerly jet induced a deep westerly trough between lower stratosphere and upper troposphere, and the strong downdrafts on the south side of the trough triggered the tropopause folding, allowing stratospheric O3 to invade into the upper and middle troposphere (Blackmon et al., 1977). (2) The deepening troughs were cut off, forming the cold vortex in the upper and middle troposphere; specifically, the sinking branch of the cold-vortex vertical circulation drove stratospheric O3 to continue to be transported downwards to the lower troposphere. (3) The cold vortex excited an extratropical cyclone in the lower troposphere, and the compensating downdrafts on the periphery of the cyclone could push O3 from the stratosphere to invade the near-surface layer, which could be a mechanism of stratospheric O3 intrusion affecting the atmospheric environment in the following study.
Quantification of the influence of NECV-driven SI on near-surface O3 is crucial to deepen the understanding of SI processes in O3 pollution. To quantify the contribution of stratospheric O3 to the near-surface layer during the SI event, we adopted the WRF-Chem model with IPR. The IPR can be used to quantitatively analyze the contributions of physical and chemical processes to O3. Five principal processes are considered in WRF-Chem, including subgrid convection (CONV), chemical conversion (CHEM), vertical mixing (VMIX), horizontal advection (ADVH), and vertical advection (ADVZ) (Yang et al., 2022). The ADVH and the ADVZ are caused by the delivery of horizontal and vertical winds, and the ADVZ can be used to characterize the intrusion of the stratospheric O3 into the ABL.
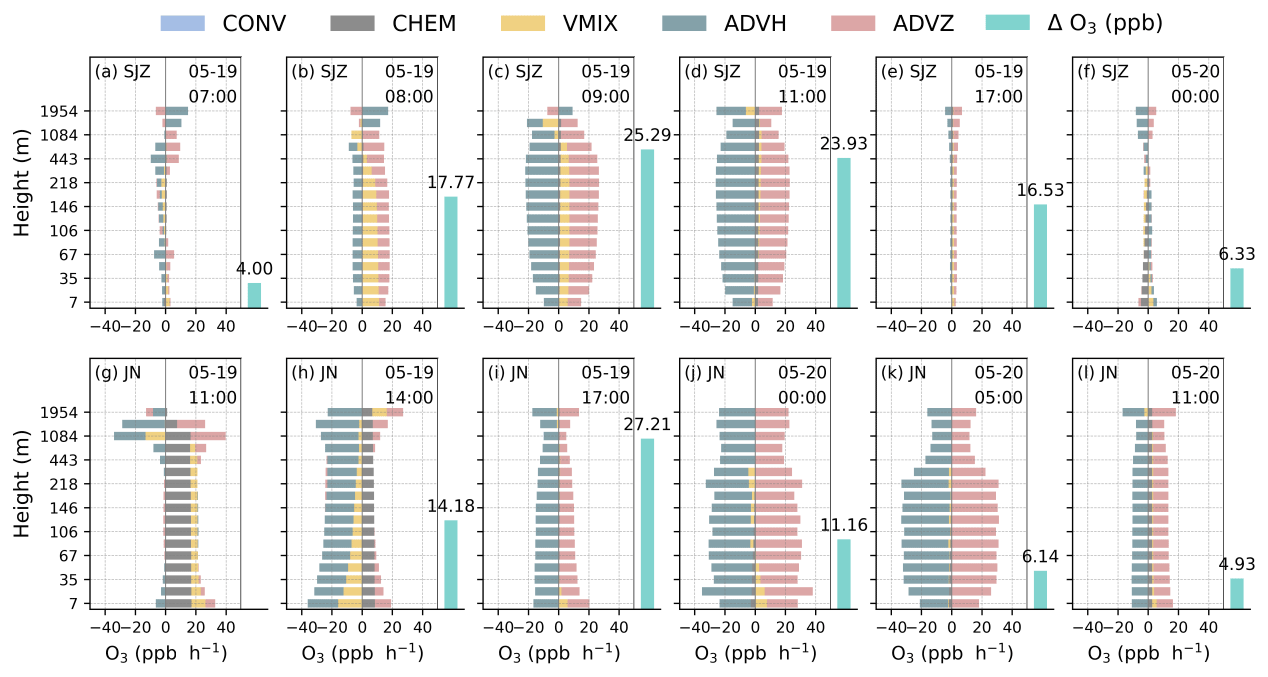
Figure 6Temporal variations in the contributions of atmospheric physical and chemical processes to O3, as seen in the simulation CASESTRO3, in the ABL for the representative cities of SJZ and JN in the NCP during the SI event.
In this study, we selected two sites, namely SJZ and JN (the red dots in Fig. S3) in the northern and southern NCP, respectively, as representatives to analyze the results of the IPR (Fig. 6). It is noteworthy that the ADVH and ADVZ presented generally opposite contributions in complementary ways, and the positive ADVZ contributions dominated the enhancements of near-surface O3, indicating the vertical O3 transport of the SI associated with the extratropical cyclone induced by the NECV (Figs. 3–6). The compensating subsidence branch of the extratropical cyclone further drove the stratospheric O3 across the top of the ABL to the near-surface layer, which is reflected with significant positive contributions by ADVZ to O3 within the ABL in SJZ and JN. Particularly in the early morning of 20 May, the contribution of ADVZ to JN peaked at 38.3 ppb h−1 (Fig. 6). However, the negative ADVH contributions reflected the diffusion of O3 by the intense horizontal winds in the cyclone system. Even at the beginning of the SI, the negative effects of ADVH in relation to O3 were greater than the positive effects of ADVZ. Compared with the vertical transport of O3 by the ADVZ process, the horizontal O3 transport driven by ADVH occurred earlier, which further demonstrated that the extratropical cyclone formed first and then drove the O3 originating from stratosphere to penetrate the top of the ABL, moving downwards to the near-surface layer.
The simulation results provided evidence that the surface extratropical cyclone excited by the NECV delivered stratospheric O3 to the near-surface layer, increasing the near-surface O3 concentrations, while the extratropical cyclone caused atmospheric horizontal motions that removed the local O3. In particular, although the intrusion of stratospheric O3 has the potential to augment surface O3 levels, rapid dispersion and removal facilitated by the peripheral horizontal winds of the cyclone mitigated this impact. Therefore, there was a strong intrusion of stratospheric O3 into the near-surface layer during the SI process without surface O3 concentrations exceeding the hourly standard of O3 pollution of 200 µg m−3 over the NCP (Fig. 5c). Furthermore, SJZ received stratospheric O3 in the near-surface layer earlier than JN, and the surface stratospheric O3 in these two sites peaked in the morning and evening on 19 May, respectively (Fig. 6c and i). This phenomenon confirmed the results in Sect. 3.1, which show that stratospheric O3 is injected into the near-surface layer in the northern NCP and that the northwestern wind of the cyclone drives the O3 to drift downstream in a southeastern direction.
3.3 Contribution of stratospheric O3 from SI to NCP
In this section, the simulations of the control experiment CASESTRO3 and the sensitivity experiment CASEnoSTRO3 with the model WRF-Chem were applied to examine the atmospheric environmental effects of the stratospheric O3, with a quantitative assessment of the contribution of stratospheric O3 from the SI event. Since stratospheric O3 was turned off in the simulation of CASEnoSTRO3, the impact of the stratospheric O3 during the SI event on the tropospheric O3 could be assessed with a consideration of the differences between the chemical simulations of CASESTRO3 and CASEnoSTRO3. Figure 7 illustrated the temporal lag changes of difference peaks in the vertical O3 transport contributions to O3 concentrations in the vertical altitude layers of 12–16, 2–12, and 0–2 km to shed some light on the SI of stratospheric O3 contributions from the lower stratosphere through the upper and middle troposphere and into the lower troposphere, including the ABL. During the SI event, the vertical O3 transport contributions peaked in the lower stratosphere (12–16 km) at 00:00 LST on 19 May; this occurred about 9 h later in the upper and middle troposphere (2–12 km) and a further 12 h later in the lower troposphere (0–2 km), influencing the atmospheric environment (Fig. 7). The appearance times of these three peaks were delayed with the decreasing heights, reflecting that the SI occurrence could sequentially elevate the contributions of downward O3 transport in the lower stratosphere, the free troposphere, and the ABL in the vertical cross-layer transport process of stratospheric O3 during the SI event.
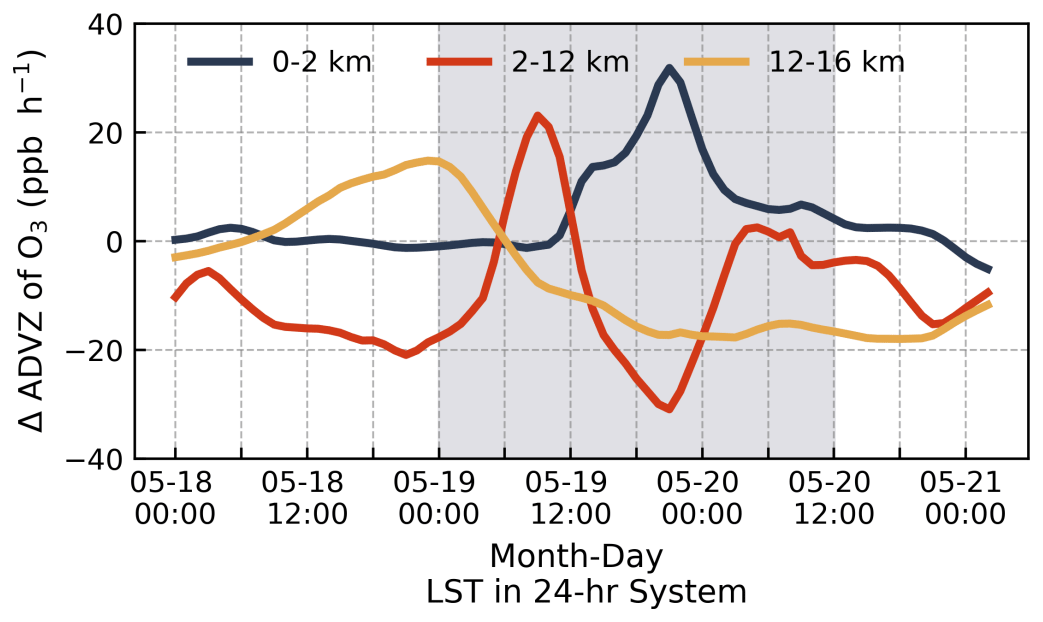
Figure 7The temporal variations in vertical transport rates of stratospheric O3 (Δ ADVZ) in the vertical layers of 0–2 km (lower troposphere), 2–12 km (middle and upper troposphere), and 12–16 km (lower stratosphere), along with the differences between the CASESTRO3 and CASEnoSTRO3 simulations using the WRF-Chem during 18–20 May 2019. The shaded area marks the SI period.
The relative contributions of stratospheric O3 to near-surface O3 were calculated by dividing the absolute contributions from the simulated near-surface O3 differences between CASESTRO3 and CASEnoSTRO3 by the surface O3 concentrations simulated in CASESTRO3. Figure 8 presents the temporal variations in the stratospheric O3 contributions to the near-surface layer in major urban sites in the NCP. As can be found, the intrusion of stratospheric O3 sharply increased the relative contributions of O3 originating from the stratosphere in the northern part of the NCP, and the contribution of the stratospheric O3 to near-surface O3 rapidly peaked at the beginning of the SI and then gradually decreased to about 20 % under the diffusion of horizontal wind (Fig. 8). This means that, although the horizontal diffusion caused no remarkable increment in observed O3 over the NCP during this SI event (Fig. 5), stratospheric O3 contributed a relatively high percentage to the near-surface atmospheric environment. The maximum contributions of stratospheric O3 to near-surface O3 in these major cities ranged from 43 % to 58 %, with the averaged contributions being from 28 % to 35 % during this SI event (Fig. 8). On average, over the NCP region, this SI event made an absolute contribution of 9.61 ppb to the near-surface O3, accounting for 26.77 % in terms of the relative contribution. Compared with the others results, the stratospheric O3 contribution in our study was lower, but the relative proportion was higher (Chang et al., 2023; Meng et al., 2022a, b; H. Wang et al., 2020), which could be related to the synoptic and atmospheric environmental conditions during cold-vortex activity. Moreover, the peak moments of stratospheric O3 contributions are delayed from north to south, reflecting the fact that the northwestern wind of horizontal circulation caused the downward stratospheric O3 tongue to bend from northeast to southwest.
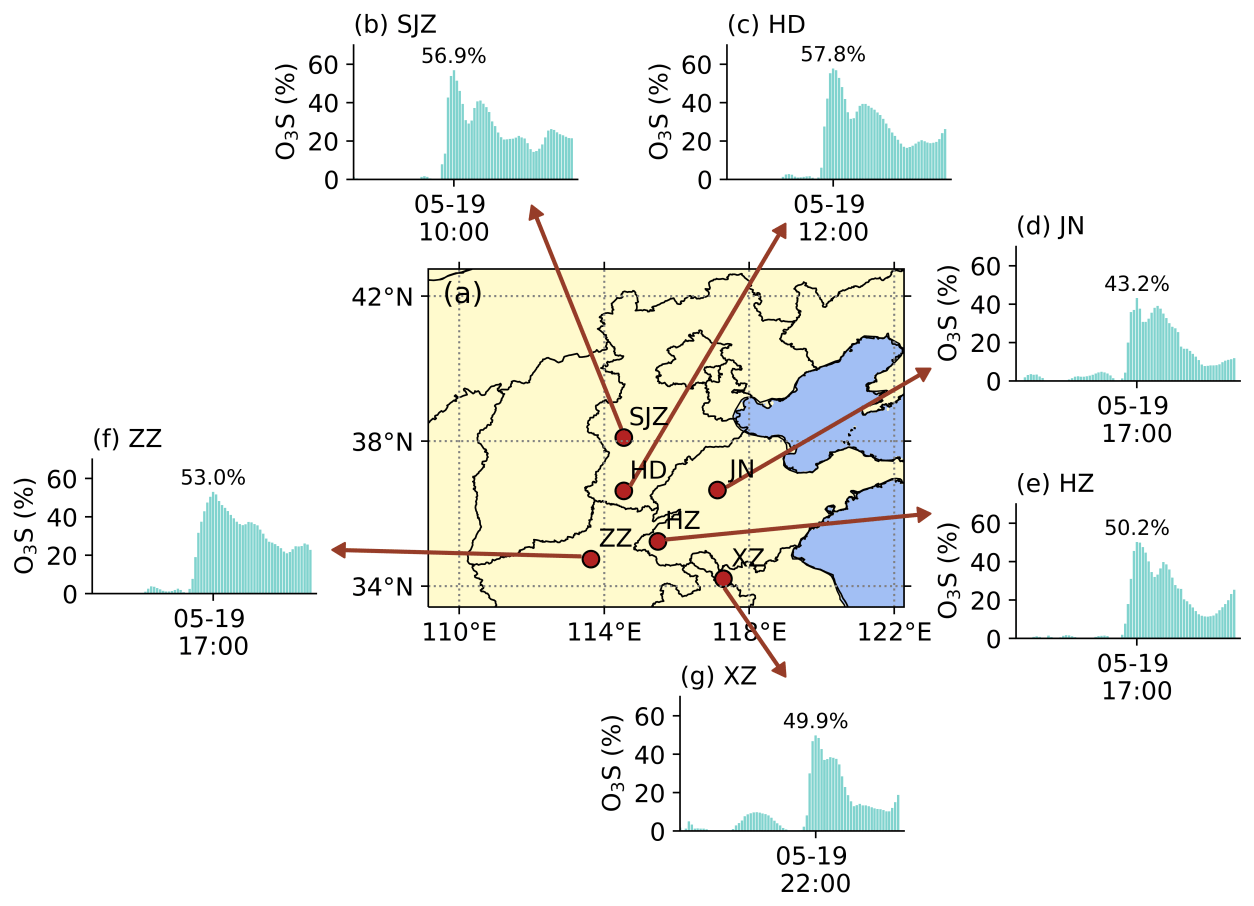
Figure 8Temporal variations of the simulated contribution of stratospheric O3 to near-surface O3 in the urban sites of Shijiazhuang (SJZ), Handan (HD), Jinan (JN), Heze (HZ), Zhengzhou (ZZ), and Xuzhou (XZ) over the NCP. The values annotated on the bars are the maximum contributions of the stratospheric O3 occurring at the moments (month-day, hour:minute) marked on the x axis.
The SI events could trigger the transport of O3 from the stratosphere to the free troposphere. The SI events frequently happen around the subtropical westerlies, and the cold vortexes regulating weather and climate in mid-high latitudes are closely related to the westerly development. However, the mechanism of SI effects on the atmospheric environment with the cross-layer transport of O3 from the stratosphere through the free troposphere to the atmospheric boundary layer has not been elucidated thoroughly. In this study, an SI process triggered by a typical cold vortex over northern China was taken as an example to deeply investigate the driving mechanism of the vertical-structure configuration of atmospheric circulation in the mid-high latitudes in relation to the cross-layer transport of stratospheric O3 to the near-surface atmosphere and to quantify the impact of SI on the near-surface O3, jointly adopting the multi-source reanalysis and observation data of meteorology and the environment and the numerical modeling of regional air quality.
This study revealed a mechanism of stratospheric O3 intrusion into the troposphere based on a case study of northern China. The SI with downward transport of stratospheric O3 to the near-surface layer was driven by an extratropical cyclone system, with the vertical coupling of the upper westerly trough, the middle NECV, and the lower extratropical cyclone in the troposphere (Fig. 9). At first, the disturbances in the westerly jet stream aroused a deep trough in the lower stratosphere and upper troposphere. The vertical shear of the jet stream on the southern side of the trough caused broad-scale subsidence and then induced the folding of the tropopause down to 500–600 hPa. The O3-rich air from the lower stratosphere penetrated the folded tropopause into the upper and middle troposphere. As the upper trough moved eastwards and deepened southwards, the westerly trough was cut off in the upper and middle troposphere, forming a typical cold vortex (NECV) in northern China. The compensating downdrafts of the NECV pushed the stratospheric O3 in the upper and middle troposphere to be further transport downwards. Simultaneously, the NECV in the upper and middle troposphere activated an extratropical cyclone in the lower troposphere, and the downdraft on the periphery of the vertical cyclonic circulation caused the stratospheric O3 from the free troposphere to break through the boundary layer top, invading the near-surface atmosphere.
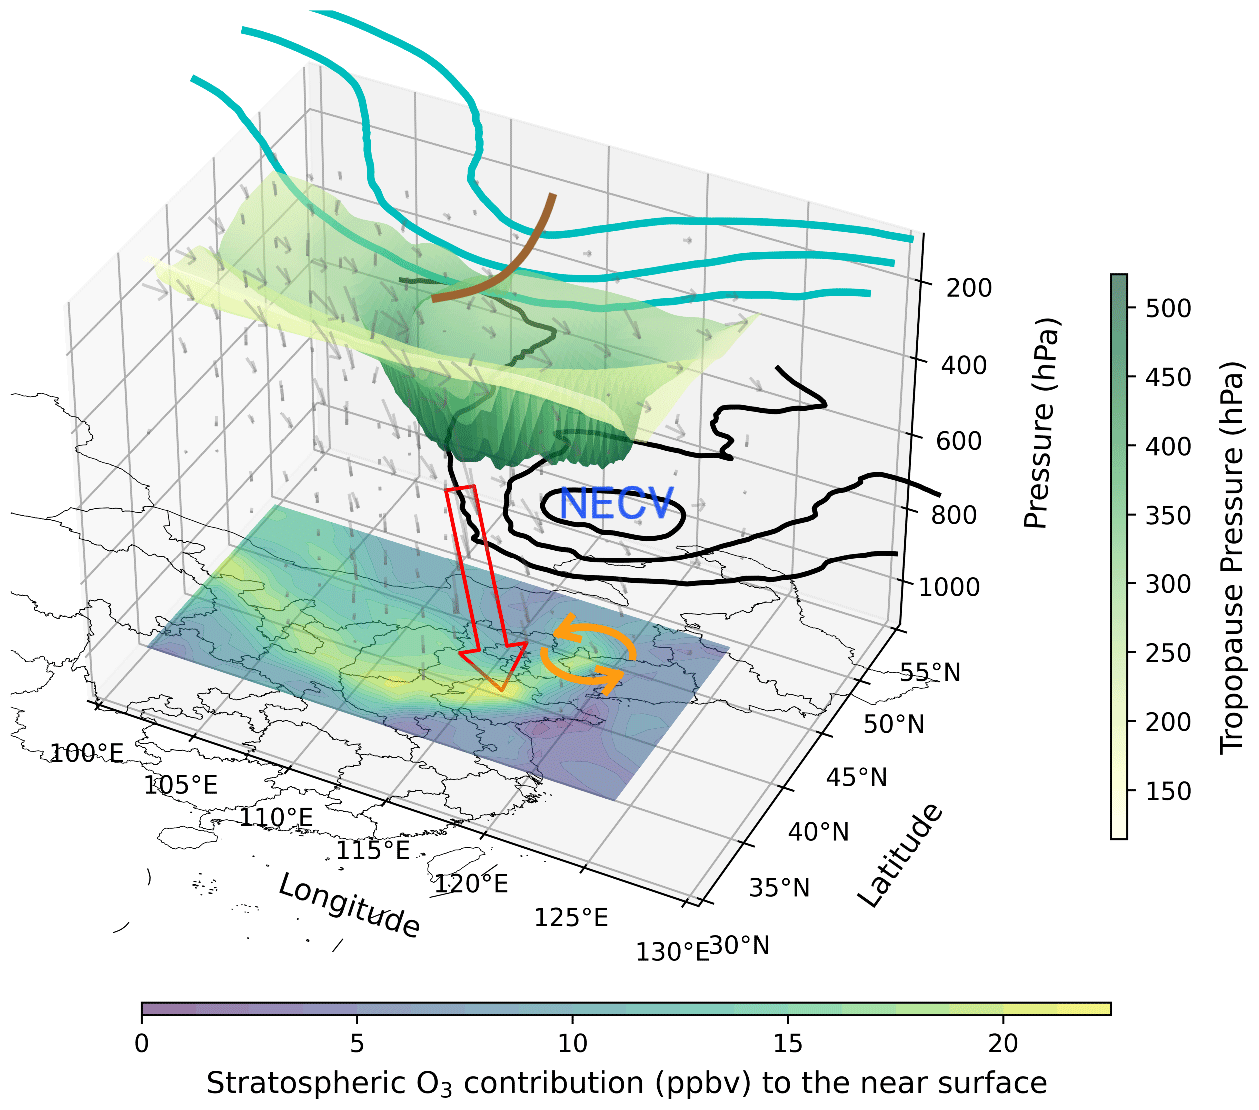
Figure 9Conceptual diagram of the downward O3 transport (red arrow) of the SI to the near-surface layer, as driven by the vertical configuration of the upper westerly trough, the middle NECV, and the lower extratropical cyclone in the troposphere. The upper 3D surface indicates the folded tropopause in relation to the vertical air pressure, and the solid green and black lines represent the westerly trough and the NECV, with the geopotential height contours of 200 and 500 hPa in the upper and middle troposphere, respectively. The orange cycle arrows indicate the extratropical cyclone in the lower troposphere. The shaded colors on the surface indicate the stratospheric O3 contribution to the near-surface layer (ppb).
Based on the simulation experiments, we quantified the contribution of stratospheric O3 to near-surface O3 during the SI process. The stratospheric O3 intrusions were strengthened sequentially in the lower stratosphere, the middle and upper troposphere, and the lower troposphere through vertical transport, reflecting the fact that the stratospheric O3 was indeed progressively transported downwards from the lower stratosphere to the lower troposphere, influencing the atmospheric environment. In this SI event, the average contribution of stratospheric O3 to near-surface O3 was 9.61 ppb over the NCP region, accounting for 26.77 % in terms of near-surface O3 levels.
Our study illustrated the meteorological mechanism of the vertical transport of stratospheric O3 into the near-surface atmosphere, as driven by an extratropical cyclone system, improving our understanding of the influence of stratospheric O3 on the atmospheric environment. The findings have significant implications for a comprehensive understanding of the cross-layer transport of air pollutants, specifically in relation to the coordinated control of atmospheric pollution complexes. A future study on the mechanism of stratospheric O3 intrusion into the atmospheric environment will be conducted with climatic analysis of long-term observations of meteorology and the environment combined with fine simulations of atmospheric chemical and physical processes to generalize the meteorological mechanism of stratospheric O3 intrusion together with the climatology of stratospheric O3 contributions to changes in the atmospheric environment.
Code and data used in this paper can be provided upon request to Yuehan Luo (lyh_nuist@qq.com) or Tianliang Zhao (tlzhao@nuist.edu.cn).
The supplement related to this article is available online at: https://doi.org/10.5194/acp-24-7013-2024-supplement.
YL, TZ, and KM conceived the analysis and modeling of the study. YL designed the graphics and wrote the paper, with help from TZ, KM, JH, and QY. YB, KY, WF, and CT were involved in the scientific discussion. All the authors commented on the paper.
The contact author has declared that none of the authors has any competing interests.
Publisher’s note: Copernicus Publications remains neutral with regard to jurisdictional claims made in the text, published maps, institutional affiliations, or any other geographical representation in this paper. While Copernicus Publications makes every effort to include appropriate place names, the final responsibility lies with the authors.
The authors are sincerely grateful to the National Meteorological Information Center of China, the China National Environmental Monitoring Center, MERRA-2, and ECMWF for providing open-access environmental and meteorological data. We also wish to thank the two anonymous reviewers for their constructive comments that improved the clarity of the manuscript.
This research has been supported by the National Key Research and Development Program of China (grant no. 2022YFC3701204) and the National Natural Science Foundation of China (grant no. 42275196).
This paper was edited by Leiming Zhang and reviewed by two anonymous referees.
Akritidis, D., Pozzer, A., Zanis, P., Tyrlis, E., Škerlak, B., Sprenger, M., and Lelieveld, J.: On the role of tropopause folds in summertime tropospheric ozone over the eastern Mediterranean and the Middle East, Atmos. Chem. Phys., 16, 14025–14039, https://doi.org/10.5194/acp-16-14025-2016, 2016.
Archer, C. L. and Caldeira, K.: Historical trends in the jet streams, Geophys. Res. Lett., 35, L08803, https://doi.org/10.1029/2008GL033614, 2008.
Barth, M. C., Lee, J., Hodzic, A., Pfister, G., Skamarock, W. C., Worden, J., Wong, J., and Noone, D.: Thunderstorms and upper troposphere chemistry during the early stages of the 2006 North American Monsoon, Atmos. Chem. Phys., 12, 11003–11026, https://doi.org/10.5194/acp-12-11003-2012, 2012.
Blackmon, M. L., Wallace, J. M., Lau, N.-C., and Mullen, S. L.: An observational study of the northern hemisphere wintertime circulation, J. Atmos. Sci., 34, 1040–1053, https://doi.org/10.1175/1520-0469(1977)034<1040:AOSOTN>2.0.CO;2, 1977.
Bourqui, M. S. and Trépanier, P. Y.: Descent of deep stratospheric intrusions during the IONS August 2006 campaign, J. Geophys. Res.-Atmos,, 115, D18301, https://doi.org/10.1029/2009JD013183, 2010.
Chang, F., Li, J., Li, N., and Liao, H.: Stratospheric intrusion may aggravate widespread ozone pollution through both vertical and horizontal advections in eastern China during summer, Front. Environ. Sci., 10, 2756, https://doi.org/10.3389/fenvs.2022.1115746, 2023.
Chen, D., Chen, Z. Y., and Lü, D. R.: Simulation of the generation of stratospheric gravity waves in upper-tropospheric jet stream accompanied with a cold vortex over Northeast China, Chinese J. Geophys.-Ch., 57, 10–20, https://doi.org/10.6038/cjg20140102, 2014a.
Chen, D., Lü, D., and Chen, Z.: Simulation of the stratosphere-troposphere exchange process in a typical cold vortex over Northeast China, Sci. China Earth Sci., 57, 1452–1463, https://doi.org/10.1007/s11430-014-4864-x, 2014b.
Chen, X., Jiang, Z., Shen, Y., Li, R., Fu, Y., Liu, J., Han, H., Liao, H., Cheng, X., Jones, D B. A.,Worden, H., and Abad, G. G.: Chinese regulations are Working – why is surface ozone over industrialized areas still high? Applying lessons from northeast US air quality evolution, Geophys. Res. Lett., 48, e2021GL092816, https://doi.org/10.1029/2021GL092816, 2021.
Chen, Z., Liu, J., Qie, X., Cheng, X., Shen, Y., Yang, M., Jiang, R., and Liu, X.: Transport of substantial stratospheric ozone to the surface by a dying typhoon and shallow convection, Atmos. Chem. Phys., 22, 8221–8240, https://doi.org/10.5194/acp-22-8221-2022, 2022.
Chen, Z., Xie, Y., Liu, J., Shen, L., Cheng, X., Han, H., Yang, M., Shen, Y., Zhao, T., and Hu, J.: Distinct seasonality in vertical variations of tropospheric ozone over coastal regions of southern China, Sci. Total Environ., 874, 162423, https://doi.org/10.1016/j.scitotenv.2023.162423, 2023a.
Chen, Z., Liu, J., Cheng, X., Yang, M., and Shu, L.: Stratospheric influences on surface ozone increase during the COVID-19 lockdown over northern China, npj Clim. Atmos. Sci., 6, 76, https://doi.org/10.1038/s41612-023-00406-2, 2023b.
Ding, A. and Wang, T.: Influence of stratosphere-to-troposphere exchange on the seasonal cycle of surface ozone at Mount Waliguan in western China, Geophys. Res. Lett., 33, L03803, https://doi.org/10.1029/2005gl024760, 2006.
Ding, D., Xing, J., Wang, S., Chang, X., and Hao, J.: Impacts of Emissions and Meteorological Changes on China's Ozone Pollution in the Warm Seasons of 2013 and 2017, Front. Environ. Sci. Eng., 13, 1–9, https://doi.org/10.1007/s11783-019-1160-1, 2019.
Fu, S. M., Sun, J. H., and Qi, L. L.: Study on the Evolution of a Northeast China Cold Vortex during the Spring of 2010, Atmospheric and Oceanic Science Letters, 7, 149–156, https://doi.org/10.3878/j.issn.1674-2834.13.0077, 2014.
Gao, J. and Gao, H.: Influence of the northeast cold vortex on flooding in Northeast China in summer 2013, J. Meteorol. Res., 32, 172–180, https://doi.org/10.1007/s13351-018-7056-3, 2018.
Gelaro, R., McCarty, W., Suárez, M. J., Todling, R., Molod, A., Takacs, L., Randles, C. A., Darmenov, A., Bosilovich, M. G., Reichle, R., Wargan, K., Coy, L., Cullather, R., Draper, C., Akella, S., Buchard, V., Conaty, A., Silva, A. M., Gu, W., Kim, G., Koster, R., Lucchesi, R., Merkova, D., Nielsen, J. E., Partyka, G., Pawson, S., Putman, W., Rienecker, M., Schubert, S. D., Sienkiewicz, M., and Zhao, B.: The modern-era retrospective analysis for research and applications, version 2 (MERRA-2), J. Climate, 30, 5419–5454, https://doi.org/10.1175/JCLI-D-16-0758.1, 2017.
Gong, Y., Yin, J., Wang, S., Yang, S., Li, D., and Pan, X.: Climatology of Northeast China cold vortices during the warm season: A comparison of ERA5 and MERRA-2 reanalyses, Int. J. Climatol., 42, 7071–7086, https://doi.org/10.1002/joc.7630, 2022.
Hersbach, H., Bell, B., Berrisford, P., Hirahara, S., Horányi, A., Muñoz-Sabater, J., Nicolas, J., Peubey, C., Radu, R., Schepers, D., Simmons, A., Soci, C., Abdalla, S., Abellan, X., Balsamo, G., Bechtold, P., Biavati, G., Bidlot, J., Bonavita, M., Chiara, G. D., Dahlgren, P., Dee, D., Diamantakis, M., Dragani, R., Flemming, J., Forbes, R., Fuentes, M., Geer, A., Haimberger, L., Healy, S., Hogan, R. J., Hólm, E., Janisková, M., Keeley, S., Laloyaux, P., Lopez, P., Lupu, C., Radnoti, G., Rosnay, P. D., Rozum, I., Vamborg, F., Villaume, S., and Thépaut, J. N.: The ERA5 global reanalysis, Q. J. Roy. Meteor. Soc., 146, 1999–2049, https://doi.org/10.1002/qj.3803, 2020.
Holton, J. R., Haynes, P. H., McIntyre, M. E., Douglass, A. R., Rood, R. B., and Pfister, L.: Stratosphere-troposphere exchange, Rev. Geophys., 33, 403–439, https://doi.org/10.1029/95RG02097, 1995.
Inness, A., Ades, M., Agustí-Panareda, A., Barré, J., Benedictow, A., Blechschmidt, A.-M., Dominguez, J. J., Engelen, R., Eskes, H., Flemming, J., Huijnen, V., Jones, L., Kipling, Z., Massart, S., Parrington, M., Peuch, V.-H., Razinger, M., Remy, S., Schulz, M., and Suttie, M.: The CAMS reanalysis of atmospheric composition, Atmos. Chem. Phys., 19, 3515–3556, https://doi.org/10.5194/acp-19-3515-2019, 2019.
Jiang, Y. C., Zhao, T. L., Liu, J., Xu, X. D., Tan, C. H., Cheng, X. H., Bi, X. Y., Gan, J. B., You, J. F., and Zhao, S. Z.: Why does surface ozone peak before a typhoon landing in southeast China?, Atmos. Chem. Phys., 15, 13331–13338, https://doi.org/10.5194/acp-15-13331-2015, 2015.
Lamarque, J.-F., Emmons, L. K., Hess, P. G., Kinnison, D. E., Tilmes, S., Vitt, F., Heald, C. L., Holland, E. A., Lauritzen, P. H., Neu, J., Orlando, J. J., Rasch, P. J., and Tyndall, G. K.: CAM-chem: description and evaluation of interactive atmospheric chemistry in the Community Earth System Model, Geosci. Model Dev., 5, 369–411, https://doi.org/10.5194/gmd-5-369-2012, 2012.
Langford, A. O., Aikin, K. C., Eubank, C. S., and Williams, E. J.: Stratospheric contribution to high surface ozone in Colorado during springtime. Geophys. Res. Lett., 36, L12801, https://doi.org/10.1029/2009GL038367, 2009.
Langford, A. O., Brioude, J., Cooper, O. R., Senff, C. J., Alvarez, R. J., Hardesty, R. M., Johnson, B. J., and Oltmans, S. J.: Stratospheric influence on surface ozone in the Los Angeles area during late spring and early summer of 2010, J. Geophys. Res., 117, D00V06, https://doi.org/10.1029/2011jd016766, 2012.
Lefohn, A. S., Wernli, H., Shadwick, D., Limbach, S., Oltmans, S. J., and Shapiro, M.: The importance of stratospheric-tropospheric transport in affecting surface ozone concentrations in the western and northern tier of the United States, Atmos. Environ., 45, 4845–4857, https://doi.org/10.1016/j.atmosenv.2011.06.014, 2011.
Lelieveld, J. and Dentener, F. J.: What controls tropospheric ozone?. J. Geophys. Res.-Atmos., 105, 3531–3551, https://doi.org/10.1029/1999JD901011, 2000.
Levelt, P. F., Van Den Oord, G. H., Dobber, M. R., Malkki, A., Visser, H., De Vries, J., Stammes, P., Lundell, J. O. V., and Saari, H.: The ozone monitoring instrument. IEEE T. Geosci. Remote, 44, 1093–1101, https://doi.org/10.1109/TGRS.2006.872333, 2006.
Li, K., Jacob, D. J., Liao, H., Zhu, J., Shah, V., Shen, L., Bates, K. H., Zhang, Q., and Zhai, S.: A two-pollutant strategy for improving ozone and particulate air quality in China, Nat. Geosci., 12, 906–910, https://doi.org/10.1038/s41561-019-0464-x, 2019.
Li, K., Jacob, D. J., Shen, L., Lu, X., De Smedt, I., and Liao, H.: Increases in surface ozone pollution in China from 2013 to 2019: anthropogenic and meteorological influences, Atmos. Chem. Phys., 20, 11423–11433, https://doi.org/10.5194/acp-20-11423-2020, 2020.
Lian, Y., Shen, B., Li, S., Liu, G., and Yang, X.: Mechanisms for the formation of Northeast China cold vortex and its activities and impacts: An overview, J. Meteorol. Res., 30, 881–896, https://doi.org/10.1007/s13351-016-6003-4, 2016.
Lin, M., Fiore, A. M., Cooper, O. R., Horowitz, L. W., Langford, A. O., Levy, H., Johnson, B. J., Naik, V., Oltmans, S. J., and Senff, C. J.: Springtime high surface ozone events over the western United States: Quantifying the role of stratospheric intrusions, J. Geophys. Res.-Atmos., 117, D00V22, https://doi.org/10.1029/2012JD018151, 2012.
Liu, Z., Doherty, R. M., Wild, O., Hollaway, M., and O'Connor, F. M.: Contrasting chemical environments in summertime for atmospheric ozone across major Chinese industrial regions: the effectiveness of emission control strategies, Atmos. Chem. Phys., 21, 10689–10706, https://doi.org/10.5194/acp-21-10689-2021, 2021.
Luo, Y., Zhao, T., Yang, Y., Zong, L., Kumar, K. R., Wang, H., Meng, K., Zhang, L., Lu, S., and Xin, Y.: Seasonal changes in the recent decline of combined high PM2.5 and O3 pollution and associated chemical and meteorological drivers in the Beijing-Tianjin-Hebei region, China, Sci. Total Environ., 838, 156312, https://doi.org/10.1016/j.scitotenv.2022.156312, 2022.
Martin, J. E.: Recent trends in the waviness of the Northern Hemisphere wintertime polar and subtropical jets, J. Geophys. Res.-Atmos., 126, e2020JD033668, https://doi.org/10.1029/2020JD033668, 2021.
Meng, K., Zhao, T., Xu, X., Hu, Y., Zhao, Y., Zhang, L., Pang, Y., Ma, X., Bai, Y., Zhao, Y., and Zhen, S.: Anomalous surface O3 changes in North China Plain during the northwestward movement of a landing typhoon, Sci. Total Environ., 820, 153196, https://doi.org/10.1016/j.scitotenv.2022.153196, 2022a.
Meng, K., Zhao, T., Xu, X., Zhang, Z., Bai, Y., Hu, Y., Zhao, Y., Zhang, X., and Xin, Y.: Influence of stratosphere-to-troposphere transport on summertime surface O3 changes in North China Plain in 2019, Atmos. Res., 276, 106271, https://doi.org/10.1016/j.atmosres.2022.106271, 2022b.
Moody, J. L., Oltmans, S. J., Levy, H., and Merrill, J. T.: Transport climatology of tropospheric ozone: Bermuda, 1988–1991, J. Geophys. Res.-Atmos., 100, 7179–7194, https://doi.org/10.1029/94JD02830, 1995.
Ni, Z. Z., Luo, K., Gao, X., Gao, Y., Fan, J. R., Fu, J. S., and Chen, C. H.: Exploring the stratospheric source of ozone pollution over China during the 2016 Group of Twenty summit, Atmos. Pollut. Res., 10, 1267–1275, https://doi.org/10.1016/j.apr.2019.02.010, 2019.
Ning, G., Wang, S., Ma, M., Ni, C., Shang, Z., Wang, J., and Li, J.: Characteristics of air pollution in different zones of Sichuan Basin, China, Sci. Total Environ., 612, 975–984, https://doi.org/10.1016/j.scitotenv.2017.08.205, 2018.
Parrish, D. D., Trainer, M., Holloway, J. S., Yee, J. E., Warshawsky, M. S., Fehsenfeld, F. C., Forbes, G. L., and Moody, J. L.: Relationships between ozone and carbon monoxide at surface sites in the North Atlantic region, J. Geophys. Res.-Atmos., 103, 13357–13376, https://doi.org/10.1029/98JD00376, 1998.
Pfister, G. G., Emmons, L. K., Hess, P. G., Lamarque, J. F., Thompson, A. M., and Yorks, J. E.: Analysis of the summer 2004 ozone budget over the United States using Intercontinental Transport Experiment Ozonesonde Network Study (IONS) observations and Model of Ozone and Related Tracers (MOZART-4) simulations, J. Geophys. Res.-Atmos., 113, D23306, https://doi.org/10.1029/2008JD010190, 2008.
Sato, E., Matsumoto, K., Okochi, H., and Igawa, M.: Scavenging effect of precipitation on volatile organic compounds in ambient atmosphere, B. Chem. Soc. Jpn., 79, 1231–1233, https://doi.org/10.1246/bcsj.79.1231, 2006.
Satyamurty, P. and Seluchi, M. E.: Characteristics and structure of an upper air cold vortex in the subtropics of South America, Meteorol. Atmos. Phys., 96, 3–4, doi:203-220.10.1007/s00703-006-0207-6, 2007.
Stevenson, D. S., Dentener, F. J., Schultz, M. G., Ellingsen, K., Van Noije, T. P. C., Wild, O., Zeng, G., Amann, M., Atherton, C. S., Bell, N., Bergmann, D. J., Bey, I., Butler, T., Cofala, J., Collins, W. J., Derwent, R. G., Doherty, R. M., Drevet, J., Eskes, H. J., Fiore, A. M., Gauss, M., Hauglustaine, D. A., Horowitz, L. W., Isaksen, I. S. A., Krol, M. C., Lamarque, J. F., Lawrence, M. G., Montanaro, V., Muller, J. F., Pitari, G., Prather, M. J., Pyle, J. A., Rast, S., Rodriguez, J. M., Sanderson, M. G., Savage, N. H., Shindell, D. T., Strahan, S. E., Sudo, K., and Szopa, S.: Multimodel ensemble simulations of present-day and near-future tropospheric ozone, J. Geophys. Res.-Atmos., 111, D08301, https://doi.org/10.1029/2005JD006338, 2006.
Stohl, A., Wernli, H., James, P., Bourqui, M., Forster, C., Liniger, M. A., Seibert, P., and Sprenger, M.: A new perspective of stratosphere-troposphere exchange, B. Am. Meteorol. Soc., 84, 1565–1574, https://doi.org/10.1175/BAMS-84-11-1565, 2003.
Tao, W., Zheng, L., Hao, Y., and Liu, G.: An Extreme Gale Event in East China under the Arctic Potential Vorticity Anomaly through the Northeast China Cold Vortex, Adv. Atmos. Sci., 40, 2169–2182, https://doi.org/10.1007/s00376-023-2255-y, 2023.
Verstraeten, W. W., Neu, J. L., Williams, J. E., Bowman, K. W., Worden, J. R., and Boersma, K. F.: Rapid increases in tropospheric ozone production and export from China, Nat. Geosci., 8, 690–695, https://doi.org/10.1038/ngeo2493, 2015.
Voulgarakis, A., Telford, P. J., Aghedo, A. M., Braesicke, P., Faluvegi, G., Abraham, N. L., Bowman, K. W., Pyle, J. A., and Shindell, D. T.: Global multi-year O3-CO correlation patterns from models and TES satellite observations, Atmos. Chem. Phys., 11, 5819–5838, https://doi.org/10.5194/acp-11-5819-2011, 2011.
Wang, H., Wang, W., Huang, X., and Ding, A.: Impacts of stratosphere-to-troposphere-transport on summertime surface ozone over eastern China, Sci. Bull., 65, 276–279, https://doi.org/10.1016/j.scib.2019.11.017, 2020.
Wang, X., Wu, Y., Randel, W., and Tilmes, S.: Stratospheric contribution to the summertime high surface ozone events over the Western United States, Environ. Res. Lett., 15, 1040a6, https://doi.org/10.1088/1748-9326/abba53, 2020.
Wargan, K., Pawson, S., Olsen, M. A., Witte, J. C., Douglass, A. R., Ziemke, J. R., Strahan, S. E., and Nielsen, J. E.: The global structure of upper troposphere-lower stratosphere ozone in GEOS-5: A multiyear assimilation of EOS Aura data, J. Geophys. Res.-Atmos., 120, 2013–2036, https://doi.org/10.1002/2014JD022493, 2015.
Wargan, K., Labow, G., Frith, S., Pawson, S., Livesey, N., and Partyka, G.: Evaluation of the Ozone Fields in NASA's MERRA-2 Reanalysis, J. Climate, 30, 2961–2988, https://doi.org/10.1175/JCLI-D-16-0699.1, 2017.
Waters, J. W., Froidevaux, L., Harwood, R. S., Jarnot, R. F., Pickett, H. M., Read, W. G., Siegel, P. H., Cofield, R. E., Filipiak, M. J., Flower, D. A., Holden, J. R., Lau, G. K., Livesey, N. J., Manney, G. L., Pumphrey, H. C., Santee, M. L., Wu, D. L., Cuddy, D. T., Lay, R. R., Loo, M. S., Perun, V. S., Schwartz, M. J., Stek, P. C., Thurstans, R. P., Boyles, M. A., Chandra, K. M., Chavez, M. C., Chen, G. S., Chudasama, B. V., Dodge, R., Fuller, R. A., Girard, M. A., Jiang, J. H., Jiang, Y., Knosp, B. W., LaBelle, R. C., Lam, J. C., Lee, K. A., Miller, D., Oswald, J. E., Patel, N. C., Pukala, D. M., Quintero, O., Scaff, D. M., Snyder, W. V., Tope, M. C., Wagner, P. A., and Walch, M. J.: The earth observing system microwave limb sounder (EOS MLS) on the Aura satellite, IEEE T. Geosci. Remote, 44, 1075–1092, https://doi.org/10.1109/TGRS.2006.873771, 2006.
Wei, W., Li, Y., Ren, Y., Cheng, S., and Han, L.: Sensitivity of summer ozone to precursor emission change over Beijing during 2010–2015: A WRF-Chem modeling study, Atmos. Environ., 218, 116984, https://doi.org/10.1016/j.atmosenv.2019.116984, 2019.
Wild, O.: Modelling the global tropospheric ozone budget: exploring the variability in current models, Atmos. Chem. Phys., 7, 2643–2660, https://doi.org/10.5194/acp-7-2643-2007, 2007.
Xie, Z. and Bueh, C.: Cold vortex events over Northeast China associated with the Yakutsk-Okhotsk blocking, Int. J. Climatol., 37, 381–398, https://doi.org/10.1002/joc.4711, 2017.
Xue, D., Zhang, Y., Wang, P., Sun, F., and Yin, J.: Distinct influences of cold vortex over Northeast China on local precipitation in early summer and midsummer, Clim. Dynam., 59, 3701–3716, https://doi.org/10.1007/s00382-022-06291-4, 2022.
Yang, H., Chen, L., Liao, H., Zhu, J., Wang, W., and Li, X.: Impacts of aerosol–photolysis interaction and aerosol–radiation feedback on surface-layer ozone in North China during multi-pollutant air pollution episodes, Atmos. Chem. Phys., 22, 4101–4116, https://doi.org/10.5194/acp-22-4101-2022, 2022.
Yang, L. M. and Zhang, Y. H.: Summary of current research on Central Asian vortex, Advances in Climate Change Research, 8, 3–11, https://doi.org/10.1016/j.accre.2017.03.002, 2017.
Yoo, J. M., Lee, Y. R., Kim, D., Jeong, M. J., Stockwell, W. R., Kundu, P. K., Oh, S. M., Shin, D. B., and Lee, S. J.: New indices for wet scavenging of air pollutants (O3, CO, NO2, SO2, and PM10) by summertime rain, Atmos. Environ., 82, 226–237, https://doi.org/10.1016/j.atmosenv.2013.10.022, 2014.
Zhang, L., Zhao, T., Gong, S., Kong, S., Tang, L., Liu, D., Wang, Y., Jin, L., Shan, Y., Tan, C., Zhang, Y., and Guo, X.: Updated emission inventories of power plants in simulating air quality during haze periods over East China, Atmos. Chem. Phys., 18, 2065–2079, https://doi.org/10.5194/acp-18-2065-2018, 2018.
Zhao, K., Hu, C., Yuan, Z., Xu, D., Zhang, S., Luo, H., Wang, T., and Jiang, R.: A modeling study of the impact of stratospheric intrusion on ozone enhancement in the lower troposphere over the Hong Kong regions, China, Atmos. Res., 247, 105158, https://doi.org/10.1016/j.atmosres.2020.105158, 2021a.
Zhao, K., Huang, J., Wu, Y., Yuan, Z., Wang, Y., Li, Y., Ma, X., Liu, X., Ma, W., Wang, Y., and Zhang, X.: Impact of Stratospheric Intrusions on Ozone Enhancement in the Lower Troposphere and Implication to Air Quality in Hong Kong and Other South China Regions, J. Geophys. Res.-Atmos., 126, e2020JD033955, https://doi.org/10.1029/2020JD033955, 2021b.