the Creative Commons Attribution 4.0 License.
the Creative Commons Attribution 4.0 License.
 | 06 Jun 2024
Technical note: Influence of different averaging metrics and temporal resolutions on the aerosol pH calculated by thermodynamic modeling
Haoqi Wang
Xiao Tian
Wanting Zhao
Jiacheng Li
Haoyu Yu
Yinchang Feng
Aerosol pH is commonly used to characterize the acidity of aqueous aerosols and is of significant scientific interest due to its close relationship with atmospheric processes. The estimation of ambient aerosol pH usually relies on the thermodynamic modeling approach. In existing chemical transport model and field observation studies, the temporal resolution of the chemical and meteorological data given as input to thermodynamic models varies substantially, ranging from less than an hour to a year, because of the inconsistency in the resolution of the original data and the aggregation of time-series data in some studies. Furthermore, the average value of the aerosol pH are represented by diverse metrics of central tendency in existing studies. This study attempts to evaluate the potential discrepancies in the calculated average aerosol pH that arise from differences in both the averaging metric and the temporal resolution, based on the ISORROPIA-II thermodynamic model and example datasets prepared by the GEOS-Chem chemical transport model simulation. Overall, we find that the variation in the temporal resolution of input data may lead to a change of up to more than two units in the average pH, and the averaging metrics calculated based on the pH values of individual samples may be about two units higher than the averaging metrics calculated based on the activity of hydrogen ions. Accordingly, we recommend that the chosen averaging metrics and temporal resolutions should be stated clearly in future studies to ensure comparability of the average aerosol pH between models and/or observations.
- Article
(1357 KB) - Full-text XML
-
Supplement
(2129 KB) - BibTeX
- EndNote


Aerosol acidity, typically characterized by the pH, stands as a crucial property of aqueous aerosols, as it influences various physical and chemical processes (Tilgner et al., 2021). Aerosol pH can influence aerosol mass by regulating the gas–particle partitioning of semi-volatile acids and bases such as HCl-Cl−, HNO3-NO, and NH3-NH (B. Zhang et al., 2021; Nah et al., 2018; Ding et al., 2019) as well as by moderating the production of secondary components through multiphase reactions (Pye et al., 2013; Cheng et al., 2016). Aerosol pH can also affect the solubilization of trace metals such as copper and iron and therefore has implications for human health risks and nutrient cycling in ecosystems (Meskhidze et al., 2003; Lippmann, 2014; Vasilakos et al., 2018; Wu et al., 2023).
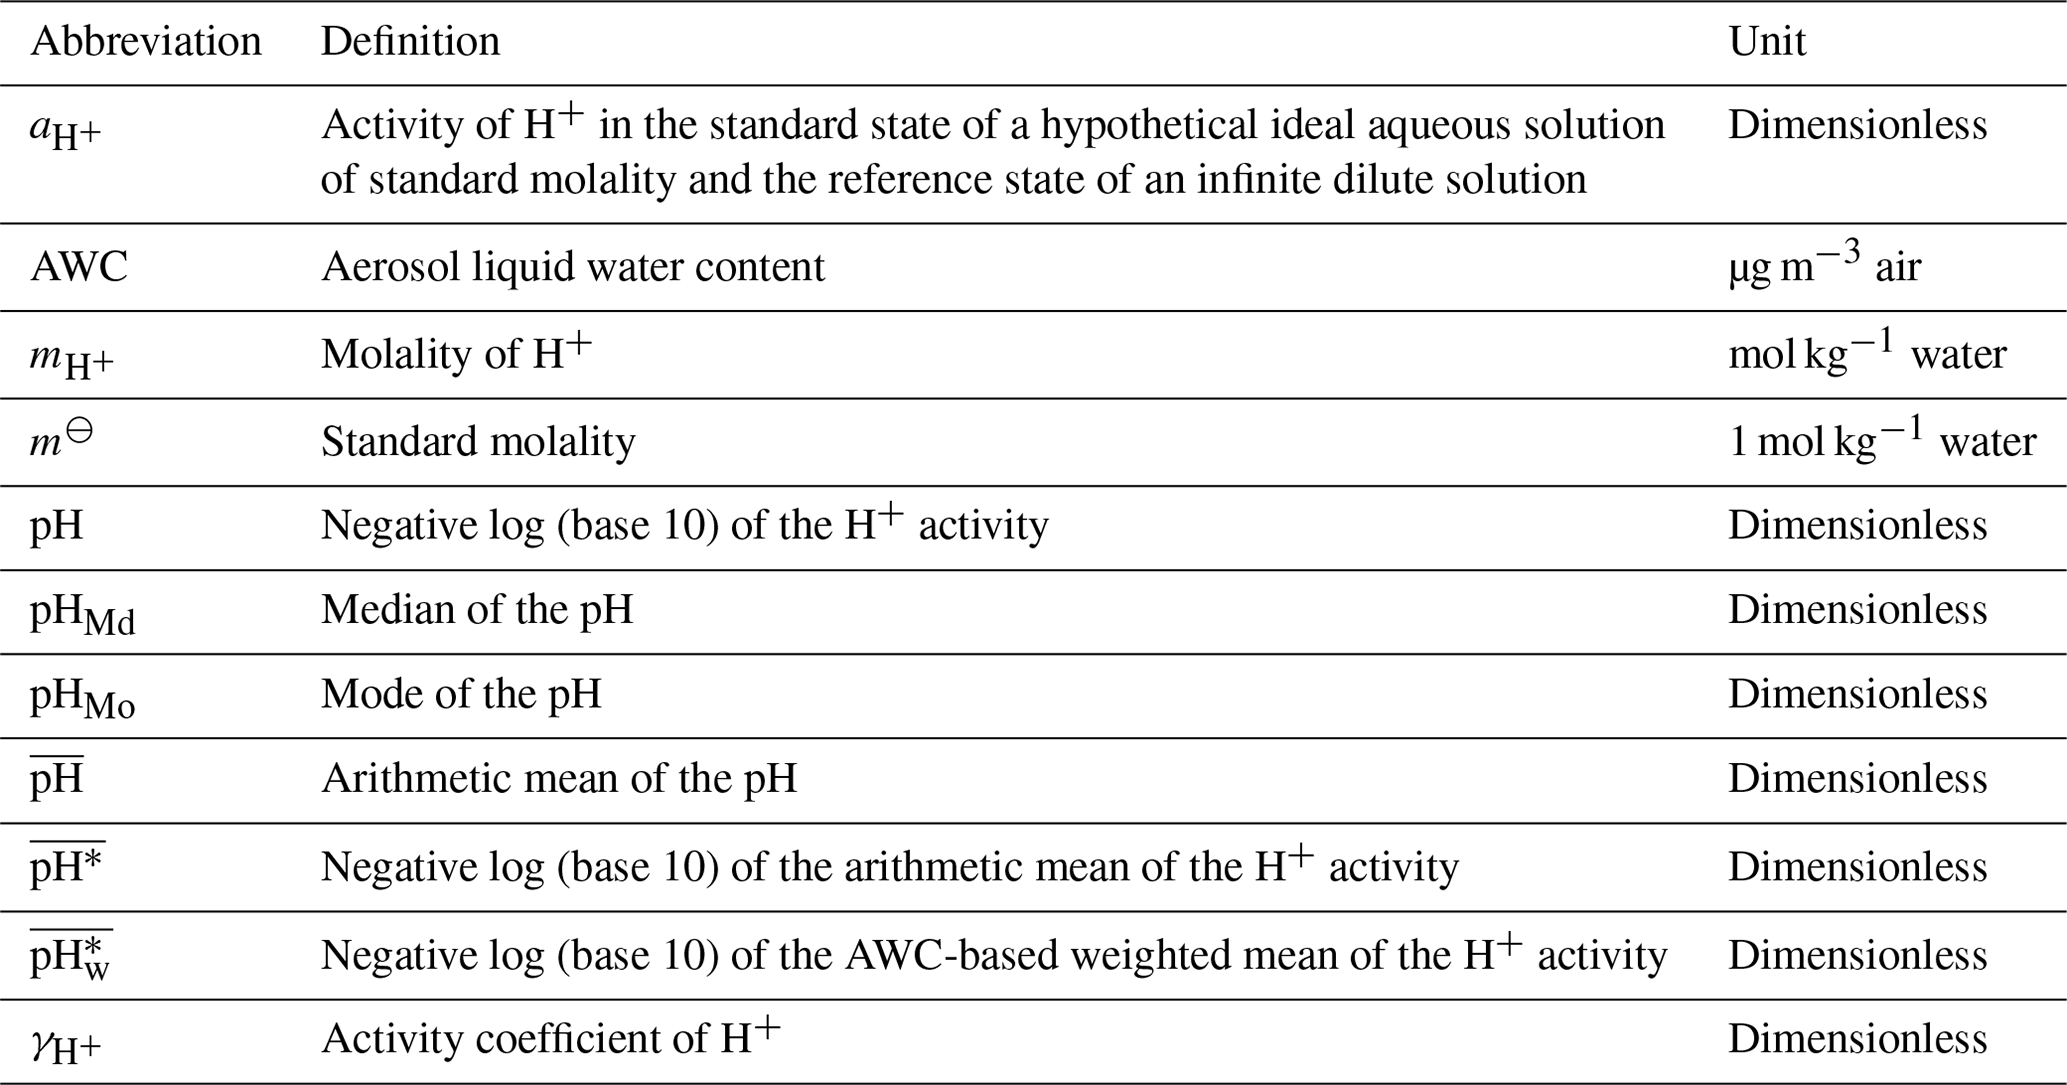
The definition of pH is the negative log (base 10) of hydrogen ion (H+) activity on a molality basis according to the International Union of Pure and Applied Chemistry (IUPAC, https://goldbook.iupac.org/terms/view/P04524, last access: 15 February 2024), as shown in Eq. (1):
where is the activity of H+ (dimensionless), m⊖ is the standard molality (1 mol kg−1 water), and and indicate the molality (mol kg−1 water) and the activity coefficient (dimensionless) of H+, respectively. pH is also frequently defined based on the standard state of 1 mol H+ dm−1 solution (i.e., molarity based) or the standard state of a hypothetical pure H+ solution (i.e., mole fraction based). Jia et al. (2018) comprehensively compared the aerosol pH values quantified at the three different scales (i.e., molarity, molality, and mole fraction). They found that the difference between the mole-fraction-based and the molality-based pH values is a constant equal to 1.74. There is a minor difference (< 0.25 units) between the molarity-based pH and the molality-based pH values owing to the effects of temperature, pressure, and the composition and density of aerosols.
Generally, the method used to estimate the pH values of ambient aerosols depends upon the thermodynamic modeling approach used, since a commonly accepted direct measurement method is still lacking, despite some recent significant advances (Weber et al., 2016; Li and Kuwata, 2023; Li et al., 2023; Cui et al., 2021; Ault, 2020). Thermodynamic models can predict the gas–particle, solid–liquid, and liquid–liquid equilibria, the liquid-phase activity coefficients, the mass transfer of semi-volatile species, the aerosol liquid-water content (AWC, µg m−3 air), and the pH (Pye et al., 2020). The input data for thermodynamic modeling should include the total (gas plus particle) chemical compositions (e.g., HCl + Cl−, HNO3 + NO, and NH3 + NH) and meteorological variables (relative humidity (RH) and temperature (T)). The E-AIM, AIOMFAC-GLE, MOSAIC, and ISORROPIA-II thermodynamic models are the box models most commonly used to calculate the aerosol pH. They differ in the chemical species they treat, their computational complexity and rigor, and the solution methods used for activity coefficients. MOSAIC and ISORROPIA-II are computationally efficient when applied in three-dimensional chemical transport models such as WRF-Chem, WRF-CMAQ, and GEOS-Chem (Pye et al., 2020).
Many studies have calculated the aerosol pH using the thermodynamic modeling approach (see a brief summary in Table S1 in the Supplement). The chemical and meteorological input data were obtained from either three-dimensional chemical transport model simulations or field observations. In these studies, the temporal resolution of the input data varied substantially, ranging from less than an hour to a year. The original time resolutions of field observations range from tens of minutes to 1 week. Chemical transport model simulations usually have time resolutions of less than an hour. Some studies may aggregate the time series of the original chemical and meteorological data to a lower resolution (monthly, seasonally, or yearly) before running thermodynamic models, while the others use the original dataset as model input.
The average of the aerosol pH dataset obtained from thermodynamic modeling is represented by diverse measures of central tendency in existing studies (Table S1). A common metric is the arithmetic mean, denoted by and calculated with Eq. (2). The symbols n and i are the number of samples in the dataset and the ith sample, respectively. Another two metrics, (the pH based on the arithmetic mean of ) and (the pH based on the AWC-weighted mean of ), have also been employed in previous studies to represent the center of the aerosol pH dataset, as described in Eqs. (3) and (4), respectively. Similar to , the pH based on the volume-weighted mean of [H+] has usually been considered when averaging the cloud/fog water pH and precipitation pH (Möller and Zierath, 1986; Sun et al., 2010; Straub et al., 2012; Shah et al., 2020).
Since the pH and are both non-conservative quantities upon mixing individual samples, different averaging metrics and different temporal resolutions may lead to disparate values, posing potential challenges when comparing the reported average pH across studies. However, such discrepancies have not been addressed with sufficient care. The objective of this technical note is thus to quantitatively assess averaged aerosol pH values obtained using different metrics and different temporal resolutions. The rest of this article is structured as follows. In the “Methods” section (Sect. 2), we describe the preparation of the evaluation datasets (Sect. 2.1), which include the relevant chemical and meteorological variables and are obtained from the GEOS-Chem chemical transport model simulations. Statistical methods and analytical tools are then provided in Sect. 2.2. In the “Results and discussion” section (Sect. 3), we first present the probability distributions of aerosol pH and AWC from the evaluation dataset and estimate the differences among averaging metrics (Sect. 3.1). Section 3.2 provides theoretical explanations for the calculated differences between the averaging metrics. We then evaluate the discrepancies in the average aerosol pH caused by using different temporal resolutions (Sect. 3.3). Finally, the conclusions of this study are given in Sect. 4.
2.1 Evaluation datasets
The datasets were obtained from atmospheric simulations with the three-dimensional GEOS-Chem chemical transport model (version 14.1.1, DOI: https://doi.org/10.5281/zenodo.7696632, The International GEOS-Chem User Community, 2023). The North China Plain (33–41° N, 114.375–120° E; Fig. S1), where multiple studies on aerosol pH have been conducted because of the concern about haze events, was chosen as the modeling region. The vertical grid spanned from the surface to the mesosphere, encompassing 47 hybrid sigma/pressure levels. A horizontal resolution of 0.625° (longitude) × 0.5° (latitude) was used, and the boundary conditions were supplied by a global simulation with a coarser resolution of 5° × 4°. Meteorological input was from the MERRA-2 (Modern-Era Retrospective Analysis for Research and Applications, Version 2) product provided by the Goddard Earth Observing System (GEOS) of NASA's Global Modeling and Assimilation Office (Gelaro et al., 2017). The simulation period covered the winter season from December 2018 to February 2019, and the summer season was from June to August 2019. The detailed settings of the emission databases and chemical mechanisms are shown in Text S1 in the Supplement. The modeled concentrations of fine aerosol components (SO, NO, NH, elemental carbon, and organic materials) were evaluated with the Tracking Air Pollution in China (TAP) dataset (Geng et al., 2017; Liu et al., 2022; Wang et al., 2012; S. Wang et al., 2020). TAP is a reanalysis data product that amalgamates surface observations, remote sensing, emission inventories, and model simulations to construct a near-real-time dataset of aerosol and gas pollutant concentrations over China. We found reasonable agreement between our GEOS-Chem model simulation results and the TAP reanalysis dataset (Fig. S2).
The ISORROPIA-II model (version 2.2) was used in GEOS-Chem to calculate the thermodynamic equilibrium processes for the H+-NH-K+-Ca2+-Mg2+-Na+-OH−-SO-NO-Cl−-H2O inorganic aerosol system (Fountoukis and Nenes, 2007; Pye et al., 2009). The model assumed that was always equal to unity. The calculation of pH was simplified as shown in Eq. (5):
where and xwater indicate the molar fractions of H+ and aerosol liquid water, respectively. m⊖ is the standard molality (1 mol kg−1 water), and 55.509 is the molality of water (Peng et al., 2019).
During the application of ISORROPIA-II, we assumed that the aerosol was internally mixed, forming a single aqueous phase encompassing the inorganic species and with no phase separations that could affect pH (Guo et al., 2017). In the mode calculations, meteorological data (T and RH), gaseous concentrations (HCl, HNO3, and NH3), and aerosol concentrations (SO, NO, NH, Cl−, fine-sized dust, and fine-sized sea salt) were called by the ISORROPIA-II routines. Fine-sized dust was used to estimate Ca2+ and Mg2+, and fine-sized sea salt was used to estimate Na+ and Cl− (Wang et al., 2019). We chose the forward mode (i.e., the total gas + aerosol concentrations were used as model inputs) and assumed that the aerosol was in the metastable state. It has been suggested that calculations using only the aerosol-phase composition as model input (i.e., the reverse mode) are sensitive to observational errors for ionic species and thus should be avoided (Hennigan et al., 2015). The assumed particle phase state, either stable or metastable, does not significantly affect pH calculations (Song et al., 2018).
Two datasets from the GEOS-Chem simulation outputs were used in this study. The first dataset (see Sects. 3.1 and 3.2) encompassed the aerosol pH, AWC, meteorological data (T and RH), gaseous concentrations (HCl, HNO3, and NH3), and aerosol concentrations (SO, NO, NH, fine-sized dust, fine-sized sea salt, and PM2.5) at the surface layer during the 2018/2019 winter for the North China Plain. The AWC and aerosol pH values were calculated online within the GEOS-Chem model using the incorporated ISORROPIA-II thermodynamic module. The dataset had a temporal resolution of 3 h, consistent with that for the meteorological input data for GEOS-Chem. Following previous studies (Guo et al., 2016; Haskins et al., 2018), we selected the data with RH values between 25 % and 95 % to meet the metastable assumption set by ISORROPIA-II and to avoid the large uncertainty associated with very high RH. After filtering, this dataset contained approximately 100 000 individual samples. The second dataset consisted of the chemical and meteorological data in the Beijing grid (centered at 40° N, 116.25° E) extracted from the first dataset. This dataset had the same temporal resolution of 3 h and included 720 samples for the 2018/2019 winter season. It could be considered as a pseudo-observation dataset analogous to what was reported by a field campaign.
2.2 Statistical analysis
We computed the following five data metrics describing the central tendency of a pH dataset: pHMd (median of the pH), pHMo (mode of the pH), (arithmetic mean of the pH), (pH based on the arithmetic mean of ), and (pH based on the AWC-weighted mean of ). As per statistical definitions, pHMd and pHMo represent the value of the 50th percentile and the most frequently occurring value of the dataset, respectively. The algorithms for calculating , , and have been provided in Eqs. (2)–(4), respectively. The probability density functions of aerosol pH and AWC were calculated using the kernel smoothing function (via ksdensity and mvksdensity), a feature within the Statistics Toolbox of the MATLAB R2021b software. Prior to data processing, AWC was logarithmized. The ksdensity function was employed to calculate the probability density functions of aerosol pH and AWC, respectively. Meanwhile, the mvksdensity function was employed to calculate the joint probability density function of the two variables. The data metrics for averaging the pH were calculated utilizing Microsoft Excel 2016. In the calculations, a bandwidth of 0.1 was set to preserve important features of the distribution while suppressing noise.
To derive comprehensive distributional parameters from the available dataset and to construct appropriate confidence intervals to minimize statistical randomness, we used the bootstrap approach (a statistical resampling technique, implemented through the datasample function of the Statistics and Machine Learning Toolbox of the MATLAB R2021b software). In this study, our original dataset in winter comprised 105 403 sets of data (Sect. 3.1). We extracted 1000 new datasets, with 10 000 sets of data in each. We also conducted a similar sampling for the Beijing pseudo-observation data (720 sets of data; Sect. 3.3). Each dataset underwent 720 samplings, and a total of 1000 new datasets were collected. For each new dataset, , pHMd, pHMo, , and were calculated separately.
3.1 Distributions of aerosol pH and aerosol water content
We present the probability distributions of the aerosol pH and AWC for the winter season in Fig. 1a and c, respectively, as well as their joint probability distribution in Fig. 1b. It can be seen that the distributions of aerosol pH and AWC are not independent (Yuan and Shou, 2022). Mechanistic studies have revealed that AWC is a primary contributor to pH shifts. Zheng et al. (2020) proposed a multiphase-buffer theory suggesting that AWC could considerably regulate the peak buffer pH of the individual buffering agent (i.e., conjugate acid–base pairs NH NH3, HSO SO, and HNO3 NO). The distribution of AWC was characterized as being similar to a skewed log-normal distribution, with noticeable differences between its arithmetic mean (53.3 µg m−3), median (6.8 µg m−3), and mode (0.5 µg m−3). The properties of hygroscopic components in aerosols and the positive feedback between the primary hygroscopic components (SNA: sulfate, nitrate, and ammonium) and aerosol water content lead to an exponential response of AWC to changes in relative humidity (Liu et al., 2023; T. Zhang et al., 2021; Y. Wang et al., 2020). Simultaneously, the ambient relative humidity typically exhibits a skewed normal distribution (Yuan et al., 2020). These factors collectively shape the probability distribution of AWC.
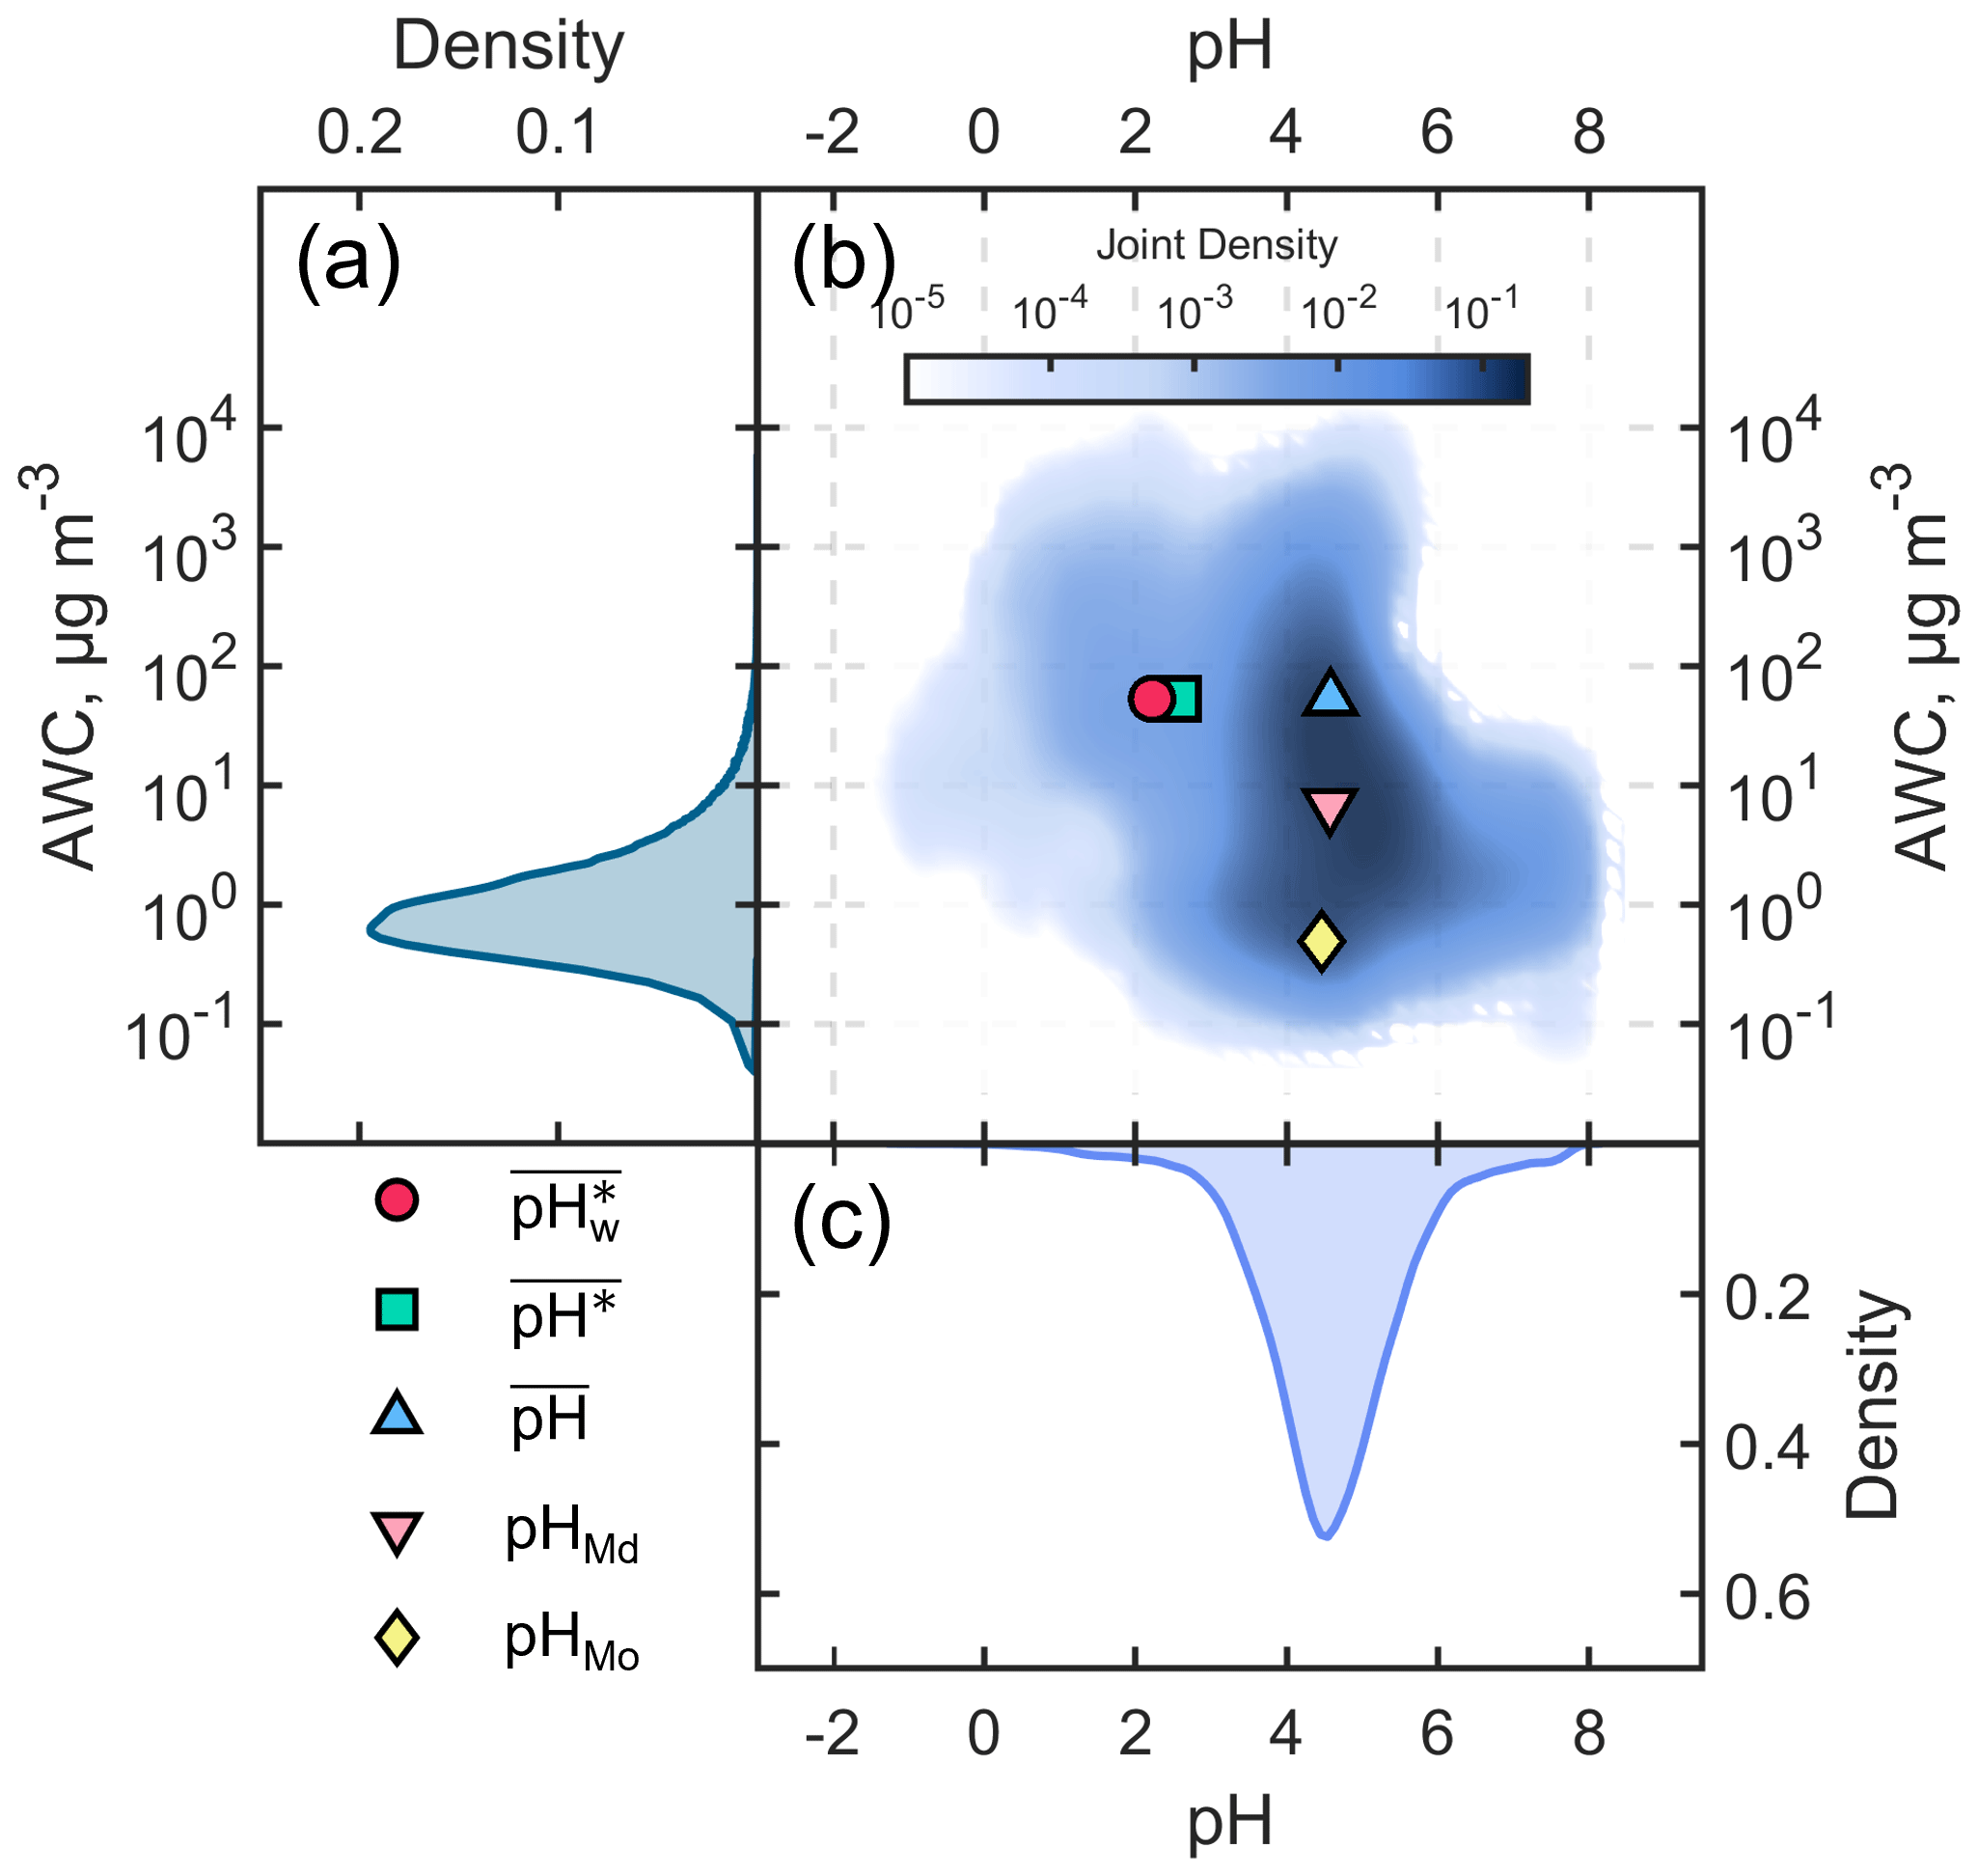
Figure 1Probability distributions of the (a) aerosol water content (AWC, µg m−3) and (c) aerosol pH in the North China Plain during the winter season from December 2018 to February 2019; (b) the corresponding joint probability distribution of AWC and aerosol pH. The blue triangle indicates and , the pink inverted triangle indicates pHMd and AWCMd, the yellow diamond indicates pHMo and AWCMo, the green square indicates and , and the red circle indicates and .
On the other hand, the distribution of aerosol pH approximated a skewed normal distribution, and there were only very small differences (< 0.1 unit) among its arithmetic mean (, 4.6), median (pHMd, 4.6), and mode (pHMo, 4.5). However, the calculated (the arithmetic mean of the pH based on ) was 2.6, close to 2 units lower than the above three metrics, indicating a deviation of around 2 orders of magnitude in the activity of hydrogen ions. followed a skewed log-normal distribution. Based on the AM–GM inequality (i.e., that the geometric mean does not exceed the arithmetic mean), it can be deduced that is always less than or equal to . For example, assume that the aerosol was strongly acid (e.g., pH = 1, which means that is 10−1) for half a day and the aerosol was weakly acidic (i.e., pH = 5, which means that is 10−5) for the remaining time. In this case, is 3 , while is 1.3 , as it is evident that is less than . (the AWC-weighted mean) differed from by only about 0.4 units.
We employed the bootstrap approach to measure the dispersion for , pHMd, pHMo, , and . We extracted 1000 new datasets, each comprising 10 000 sets of data, and calculated , pHMd, pHMo, , and for each new dataset separately. The results of the statistical analysis are shown in Fig. 2. The results indicated that the means of , pHMd, pHMo, , and were 4.6, 4.6, 4.5, 2.6, and 2.2, respectively, which were consistent with our original dataset. Additionally, the results exhibited high stability, with minimal differences in interquartile distances, namely 0.13, 0.19, 0.02, 0.02, and 0.38, respectively.
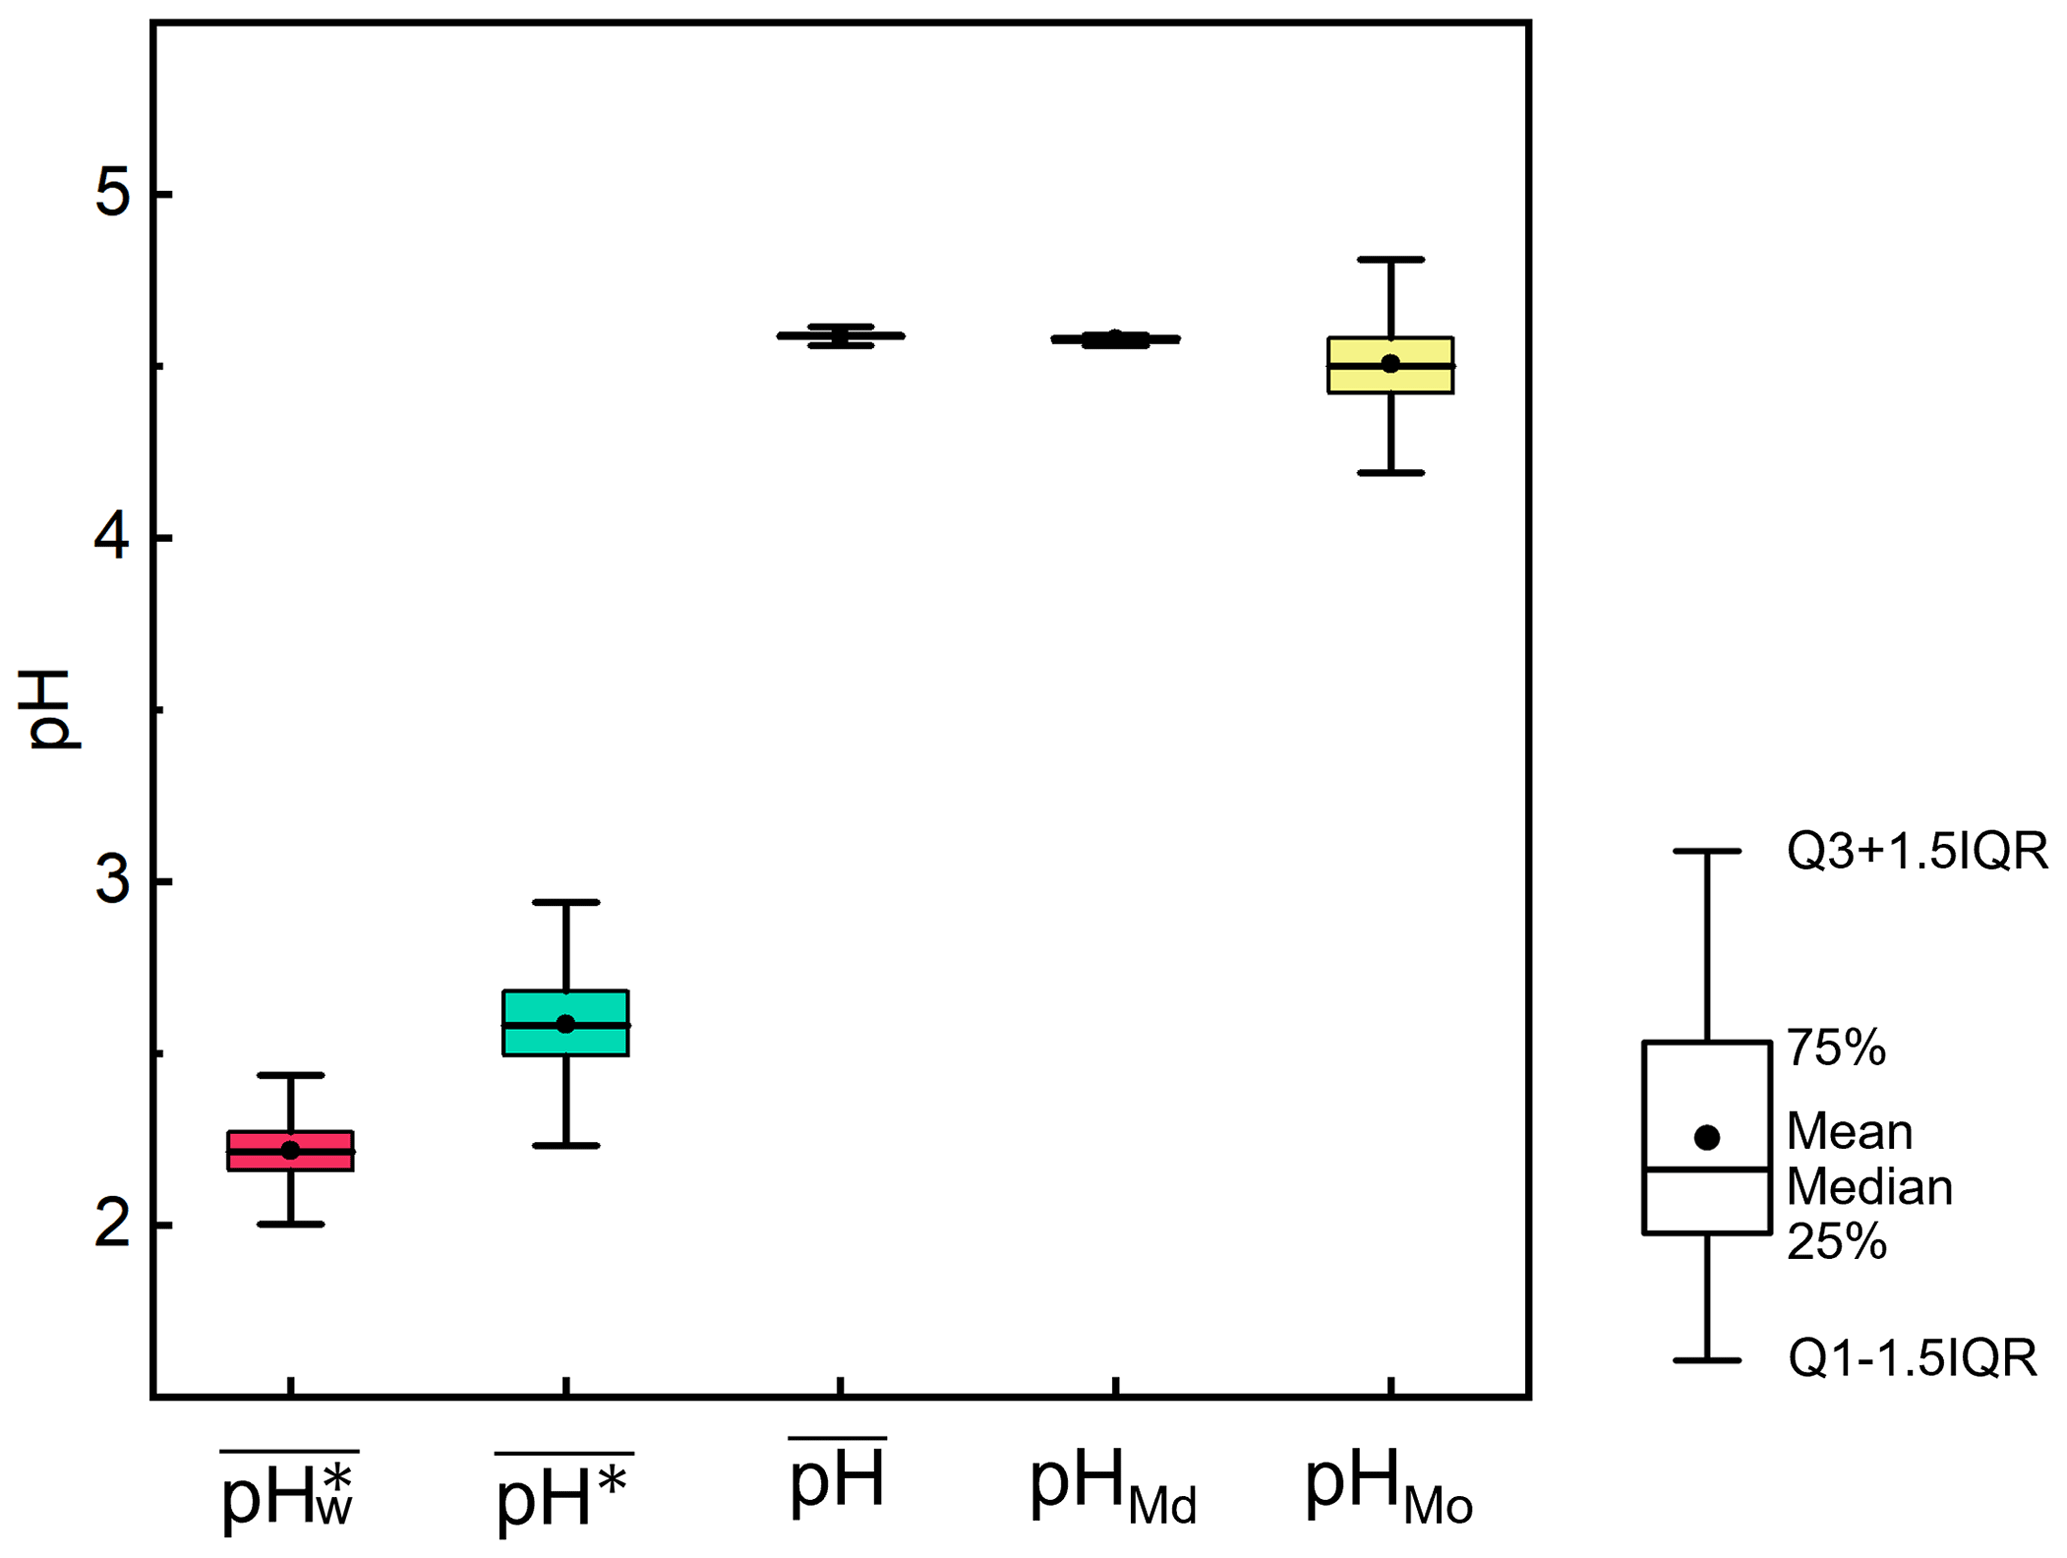
Figure 2Dispersion in the calculations of , pHMd, pHMo, , and in the North China Plain during winter 2018, based on bootstrapping. The results were extracted from 1000 new datasets, each containing 10 000 sets of data. For each box with whiskers, the point indicates the mean, the top whisker represents the sum of the upper quartile and 1.5 times the interquartile range (IQR), the bottom whisker represents the sum of the lower quartile and 1.5 times the IQR, the top of the box indicates the 75th percentile, the line in the middle of the box represents the 50th percentile, and the bottom of the box represents the 25th percentile.
Indeed, it is noteworthy that the aforementioned discrepancies were notably diminished during the summer season. Figure S3 illustrates the probability distributions of aerosol pH and AWC during the summer season, as well as their joint probability distribution. The joint distribution in summer was the opposite to the winter results, with a higher pH observed at high AWC values and a lower pH at low AWC values. This is because summer months are typically cleaner, with AWC predominantly influenced by RH. The resulting high AWC has a diluting effect on acidic components, leading to higher pH levels. The quantitative results for , pHMd, pHMo, , and were 2.6, 2.7, 3.0, 2.0, and 2.4, respectively. The main reason for the lower pH in summer compared to winter is the temperature difference (Text S2). While and remained lower than , the difference was significantly smaller in summer compared to winter. The smaller range of pH also contributed to the proximity of the three statistics.
The significant bias between the averaging metrics calculated based on the pH values of individual samples (, pHMd, and pHMo) and those based on the hydrogen ion activities of individual samples ( and ) may have important implications for the understanding of atmospheric processes regulated by aerosol pH (Pye et al., 2020). For instance, the phase partitioning of HNO3–NO and NH3–NH could lead to a complete transition between the gaseous and particulate phases upon changing the pH by 2 units in their sensitive regimes (Chen et al., 2016, 2018).
3.2 Variation of aerosol pH with relative humidity
In order to further explain the discrepancies among different aerosol pH averaging metrics in winter season, we calculated the trends in , , , pHMd, and pHMo with increasing RH bin (Fig. 3a). As shown, , pHMd, and pHMo had similar gradually decreasing trends with RH. and , however, showed a different pattern from the above three metrics. Interestingly, there were significant drops in and when RH increased from 30 % to 50 %, after which they remained nearly constant within the RH range from 50 % to 90 %. Figure S4 shows the joint probability distribution of AWC and aerosol pH (mirroring Fig. 1b) for RH intervals of 10 %. The characteristic skewed log-normal distributions of RH in the range of 40 % to 90 % showed a right-skewed pH probability distribution. Conversely, RH = 30 % was aligned closer to a log-normal distribution, with pH exhibiting a symmetrical distribution. This explains the variation in the differences in aerosol pH between statistical metrics across different RH levels in Fig. 3a.
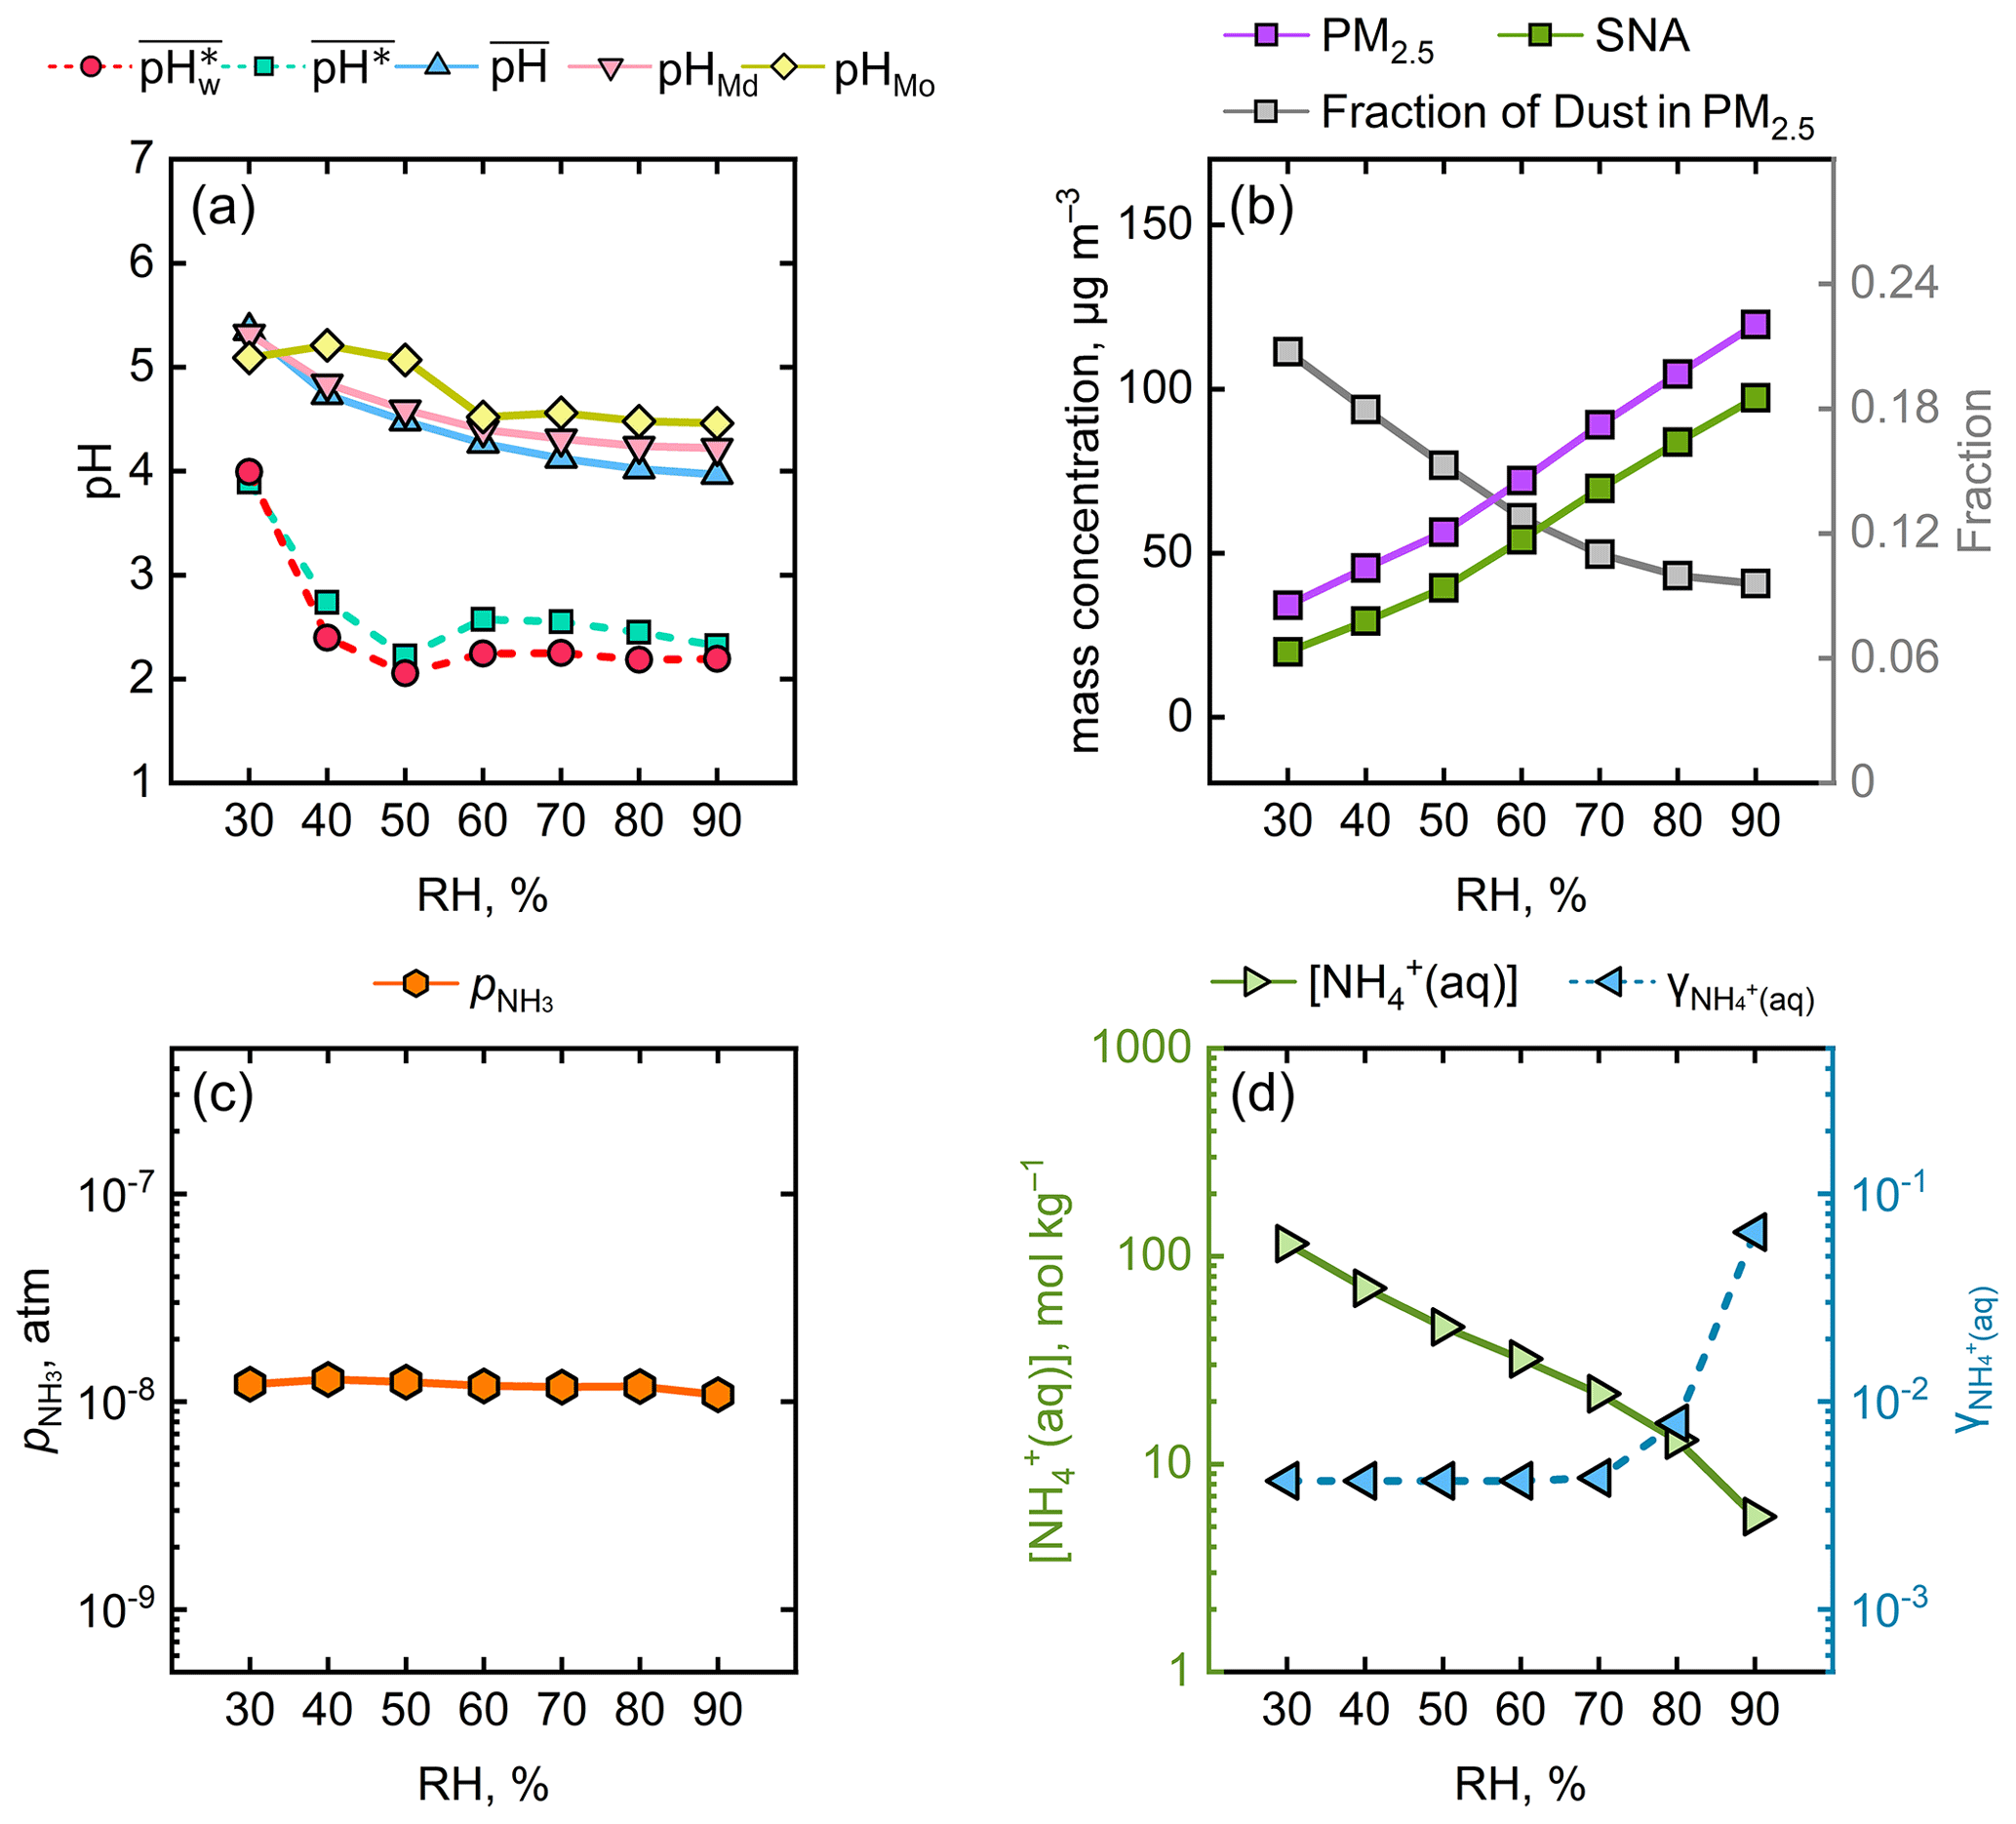
Figure 3Variations in several chemical and physical parameters as a function of RH. (a) , , , pHMd, and pHMo. (b) The fractions of SNA (the sum of sulfate, nitrate, and ammonium) and dust in PM2.5. (c) (atm). (d) (mol kg−1) and . The range of RH was 25 %–95 %, and the parameters were averaged at 10 % RH intervals.
We investigated the changes in the proportions of secondary inorganic aerosols (SNA: NH, SO, and NO) and dust in PM2.5 under different RH conditions. As depicted in Fig. 3b, in general, the elevation of RH was accompanied by an increase in the fraction of SNA and a decrease in that of dust. The large proportion of dust at low RH (∼ 30 %) is believed to enhance the aerosol pH (Guo et al., 2018). As the RH escalated to around 50 %, the SNA proportion experienced a rapid ascent and the dust proportion concurrently underwent a precipitous decline, which explained the decrease in aerosol pH. The relatively stable variation from 50 % to 90 % RH could be explained by the multiphase-buffering theory (Zheng et al., 2020, 2022). The theoretical equation derived from the multiphase-buffering theory (see Text S2) suggests that when the aerosol pH is predominantly moderated by the buffering of the conjugate acid–base pair NH3 NH, the aerosol pH can be simplified to a function of (the partial pressure of gaseous NH3), (the molality of NH in aerosol water), and (the activity coefficient of ). Figure 3c illustrates that is nearly constant under varying RH. Figure 3d shows that displayed a downward trend with elevated RH, whereas exhibited an upward trend, particularly in the 70 %–90 % RH range. Overall, considering the alterations in , , and , it was understandable that appeared to show minor variations from 50 %–90 % RH. Additionally, it should be noted that the reason for the consistent trends in and with RH is that, in most cases, there was more H+ production when AWC was high and vice versa, as seen in both Fig. 1 and Fig. 3a. This led to the discrepancies between the and , as the aerosol water content was masked.
3.3 Influence of the time resolution of the input data on the averaged aerosol pH
In our summary of aerosol pH calculations using the thermodynamic modeling approach and the data from chemical-transport model simulations and field observations (Table S1), we found that the temporal resolution of the input data varied substantially, ranging from less than an hour to a year. This inconsistency might have arisen from differences between the native resolutions of field sampling and the model or from the use of data aggregation in various studies. Differences in the temporal resolution of the data used to calculate the pH may lead to disparate results, making it inappropriate to directly compare the average aerosol pH values from different studies. In order to assess the impact of the temporal resolution, we applied the pseudo-observation data in Beijing for the winter season from December 2018 to February 2019 as inputs to the ISORROPIA-II thermodynamic model. The measures of dispersion for this site are shown in Fig. S5. The original input data with a 3 h resolution, including both chemical and meteorological variables, were aggregated into daily, weekly, monthly, and seasonal time steps. The results for , , , , pHMd, and pHMo calculated based on the corresponding ISORROPIA-II output are listed in Table 1.
Table 1Comparison of , , , , pHMd, and pHMo calculated based on different temporal resolutions.
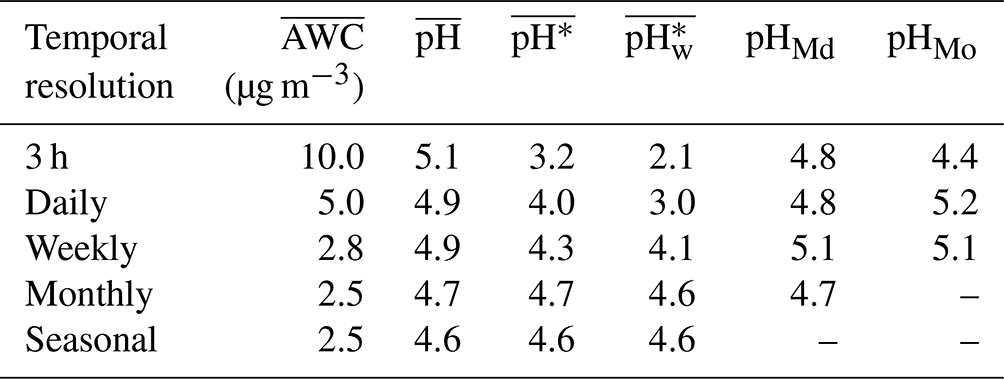
The alteration of the temporal resolution exerted distinct degrees of influence on , , , , pHMd, and pHMo. showed an overall declining trend as the time resolution became lower. This was mainly due to the fact that AWC had a general exponential relationship with RH, and thus the high AWC values were largely averaged out when averaging RH at a lower resolution. The maximum deviations for , , pHMd, and pHMo were 0.5, 1.5, 1.4, and 0.3 units, respectively. In particular, it should be noted that there was a maximum deviation of 2.5 units in , suggesting a fluctuation in the activity of H+ of more than 2 orders of magnitude. The discrepancy in was partly due to rapid and transient fluctuations in AWC during variations in meteorological conditions. tended to lower as the temporal resolution got rougher, which is an opposite trend to that of . The results indicated that comparing the average aerosol pH metrics with non-uniform temporal resolutions might lead to erroneous conclusions.
Here, we use a simple example to illustrate the potential effect of the temporal resolution of the input data on multiphase chemistry reaction rates. It is well known that the rate of sulfate production from the oxidation of SO2 by dissolved O3 in the aqueous phase is pH dependent (Seinfeld and Pandis, 2016). The Beijing pseudo-observation data were applied with both 3 h resolution and daily resolution to assess the sole effect of deviations in aerosol pH on this sulfate formation pathway. The mean levels of SO2 (3.8 ppb), O3 (15.1 ppb), and T (269.8 K) during the study period (December 2018–February 2019) were used in the calculations. More detailed formulas are provided in Tables S2 and S3. It can be seen from Fig. S6 that the calculations using the daily-resolution data resulted in many rapid sulfate production occurrences that were not captured otherwise. We also investigated the sulfate formation rate vs. AWC and vs. pH to isolate the effect of AWC (Fig. S6b–e). This example shows that the aerosol pH had a greater effect on the rate of sulfate production than AWC, and aerosol pH had a linear relationship with . The mean sulfate formation rate calculated based on the 3 h resolution data for this winter period was 1.57 µg m−3, while the corresponding value calculated based on the daily-resolution data was merely 0.72 µg m−3, a factor of 2 smaller, indicating the significance of the temporal resolution when estimating this chemical pathway.
In the present study, we evaluated the discrepancies in the average aerosol pH that arose from differences in the averaging metric and temporal resolution based on thermodynamic modeling and evaluation datasets from a chemical-transport model. Among the five metrics investigated, i.e., , pHMd, pHMo, , and , the first three metrics (calculated based on the pH values of individual samples) were found to be ∼ 2 units higher than the last two (which are based on the values of individual samples) in winter, although there were only minor differences within each group. In summer, however, the differences were small for all five metrics. Changes in the temporal resolution of the input data for the thermodynamic models exerted distinct degrees of influence on the five metrics, with a maximum deviation of > 2 units in . The variation in was partly due to the fluctuations in aerosol water content.
Previous studies have highlighted the importance of maintaining consistency in terms of the assumed standard states (Jia et al., 2018), the thermodynamic model used, and the calculation method adopted (e.g., an open vs. a closed system and a metastable vs. a stable state) (Hennigan et al., 2015; Song et al., 2018) when comparing pH results across studies. This technical note underscores the importance of avoiding the default use of the arithmetic mean as the sole measure of average. Additionally, it is also essential to consider the uncertainties introduced by the chosen averaging approach and temporal resolution, which should be described clearly in future studies to ensure the comparability of aerosol pH between models and/or observations. Using this study as an example, pH results for the 2018/2019 winter in the North China Plain were derived at 3 h resolution through GEOS-Chem simulations. Measures of central tendency included the arithmetic mean (, 4.6), median (pHMd, 4.6), and mode (pHMo, 4.5), the arithmetic mean based on (, 2.6), and the volume-weighted mean based on AWC and (, 2.2). For further details, refer to the “Code and data availability” section.
From an atmospheric chemical perspective, may offer a more accurate representation of the average aerosol pH state. However, significant changes in pH can induce shifts in reaction rates, and any averaging method may fail to capture the reaction dynamics over extended timescales. Therefore, when utilizing pH datasets for theoretical calculations of reaction rates, we advocate for the utilization of hourly-resolution data over data with a longer time resolution.
The standard GEOS-Chem model is available at https://doi.org/10.5281/zenodo.7696632 (The International GEOS-Chem User Community, 2023). The data are available at https://doi.org/10.5281/zenodo.11480367 (Song, 2024).
The supplement related to this article is available online at: https://doi.org/10.5194/acp-24-6583-2024-supplement.
SS initiated the study. HW and XT carried out the analysis and wrote the initial draft. All authors helped interpret the data, provided feedback, and commented on the manuscript.
The contact author has declared that none of the authors has any competing interests.
Publisher’s note: Copernicus Publications remains neutral with regard to jurisdictional claims made in the text, published maps, institutional affiliations, or any other geographical representation in this paper. While Copernicus Publications makes every effort to include appropriate place names, the final responsibility lies with the authors.
We would like to express our gratitude to Li Zhang (Nankai University) and Xuan Wang (City University of Hong Kong) for their valuable discussions. We also extend our thanks to the editors and anonymous reviewers for their constructive comments and suggestions, which greatly enhanced the quality of this paper.
This research has been supported by the National Natural Science Foundation of China (grant no. 42205109), the Natural Science Foundation of Tianjin City (grant no. 22JCYBJC01330), the TianHe Qingsuo open research fund of TSYS in 2022, and the National Supercomputing Center of Tianjin.
This paper was edited by Guangjie Zheng and reviewed by two anonymous referees.
Ault, A. P.: Aerosol Acidity: Novel Measurements and Implications for Atmospheric Chemistry, Acc. Chem. Res, 53, 1703–1714, https://doi.org/10.1021/acs.accounts.0c00303, 2020.
Chen, Y., Cheng, Y., Ma, N., Wolke, R., Nordmann, S., Schüttauf, S., Ran, L., Wehner, B., Birmili, W., van der Gon, H. A. C. D., Mu, Q., Barthel, S., Spindler, G., Stieger, B., Müller, K., Zheng, G.-J., Pöschl, U., Su, H., and Wiedensohler, A.: Sea salt emission, transport and influence on size-segregated nitrate simulation: a case study in northwestern Europe by WRF-Chem, Atmos. Chem. Phys., 16, 12081–12097, https://doi.org/10.5194/acp-16-12081-2016, 2016.
Chen, Y., Wolke, R., Ran, L., Birmili, W., Spindler, G., Schröder, W., Su, H., Cheng, Y., Tegen, I., and Wiedensohler, A.: A parameterization of the heterogeneous hydrolysis of N2O5 for mass-based aerosol models: improvement of particulate nitrate prediction, Atmos. Chem. Phys., 18, 673–689, https://doi.org/10.5194/acp-18-673-2018, 2018.
Cheng, Y., Zheng, G., Wei, C., Mu, Q., Zheng, B., Wang, Z., Gao, M., Zhang, Q., He, K., Carmichael, G., Pöschl, U., and Su, H.: Reactive nitrogen chemistry in aerosol water as a source of sulfate during haze events in China, Sci. Adv., 2, e1601530, https://doi.org/10.1126/sciadv.1601530, 2016.
Cui, X., Tang, M., Wang, M., and Zhu, T.: Water as a probe for pH measurement in individual particles using micro-Raman spectroscopy, Anal. Chim. Acta, 1186, 339089, https://doi.org/10.1016/j.aca.2021.339089, 2021.
Ding, J., Zhao, P., Su, J., Dong, Q., Du, X., and Zhang, Y.: Aerosol pH and its driving factors in Beijing, Atmos. Chem. Phys., 19, 7939–7954, https://doi.org/10.5194/acp-19-7939-2019, 2019.
Fountoukis, C. and Nenes, A.: ISORROPIA II: a computationally efficient thermodynamic equilibrium model for K+–Ca2+–Mg2+––Na+–––Cl−–H2O aerosols, Atmos. Chem. Phys., 7, 4639–4659, https://doi.org/10.5194/acp-7-4639-2007, 2007.
Gelaro, R., McCarty, W., Suárez, M. J., Todling, R., Molod, A., Takacs, L., Randles, C. A., Darmenov, A., Bosilovich, M. G., Reichle, R., Wargan, K., Coy, L., Cullather, R., Draper, C., Akella, S., Buchard, V., Conaty, A., da Silva, A. M., Gu, W., Kim, G., Koster, R., Lucchesi, R., Merkova, D., Nielsen, J. E., Partyka, G., Pawson, S., Putman, W., Rienecker, M., Schubert, S. D., Sienkiewicz, M., and Zhao, B.: The Modern-Era Retrospective Analysis for Research and Applications, Version 2 (MERRA-2), J. Climate, 30, 5419–5454, https://doi.org/10.1175/JCLI-D-16-0758.1, 2017.
Geng, G., Zhang, Q., Tong, D., Li, M., Zheng, Y., Wang, S., and He, K.: Chemical composition of ambient PM2.5 over China and relationship to precursor emissions during 2005–2012, Atmos. Chem. Phys., 17, 9187–9203, https://doi.org/10.5194/acp-17-9187-2017, 2017.
Guo, H., Sullivan, A. P., Campuzano-Jost, P., Schroder, J. C., Lopez-Hilfiker, F. D., Dibb, J. E., Jimenez, J. L., Thornton, J. A., Brown, S. S., Nenes, A., and Weber, R. J.: Fine particle pH and the partitioning of nitric acid during winter in the northeastern United States, J. Geophys. Res.-Atmos, 121, 10355–10376, https://doi.org/10.1002/2016jd025311, 2016.
Guo, H., Weber, R. J., and Nenes, A.: High levels of ammonia do not raise fine particle pH sufficiently to yield nitrogen oxide-dominated sulfate production, Sci. Rep.-UK, 7, 12109, https://doi.org/10.1038/s41598-017-11704-0, 2017.
Guo, H., Nenes, A., and Weber, R. J.: The underappreciated role of nonvolatile cations in aerosol ammonium-sulfate molar ratios, Atmos. Chem. Phys., 18, 17307–17323, https://doi.org/10.5194/acp-18-17307-2018, 2018.
Haskins, J. D., Jaeglé, L., Shah, V., Lee, B. H., Lopez-Hilfiker, F. D., Campuzano-Jost, P., Schroder, J. C., Day, D. A., Guo, H., Sullivan, A. P., Weber, R., Dibb, J., Campos, T., Jimenez, J. L., Brown, S. S., and Thornton, J. A.: Wintertime Gas-Particle Partitioning and Speciation of Inorganic Chlorine in the Lower Troposphere Over the Northeast United States and Coastal Ocean, J. Geophys. Res.-Atmos, 123, 12897–12916, https://doi.org/10.1029/2018JD028786, 2018.
Hennigan, C. J., Izumi, J., Sullivan, A. P., Weber, R. J., and Nenes, A.: A critical evaluation of proxy methods used to estimate the acidity of atmospheric particles, Atmos. Chem. Phys., 15, 2775–2790, https://doi.org/10.5194/acp-15-2775-2015, 2015.
Jia, S., Wang, X., Zhang, Q., Sarkar, S., Wu, L., Huang, M., Zhang, J., and Yang, L.: Technical note: Comparison and interconversion of pH based on different standard states for aerosol acidity characterization, Atmos. Chem. Phys., 18, 11125–11133, https://doi.org/10.5194/acp-18-11125-2018, 2018.
Li, M., Kan, Y., Su, H., Pöschl, U., Parekh, S. H., Bonn, M., and Cheng, Y.: Spatial homogeneity of pH in aerosol microdroplets, Chem, 9, 1036–1046, https://doi.org/10.1016/j.chempr.2023.02.019, 2023.
Li, W. and Kuwata, M.: Detecting pH of Sub-Micrometer Aerosol Particles Using Fluorescent Probes, Environ. Sci. Technol., 57, 8701–8707, https://doi.org/10.1021/acs.est.3c01517, 2023.
Lippmann, M.: Toxicological and epidemiological studies of cardiovascular effects of ambient air fine particulate matter (PM2.5) and its chemical components: Coherence and public health implications, Crit. Rev. Toxicol., 44, 299–347, https://doi.org/10.3109/10408444.2013.861796, 2014.
Liu, S., Geng, G., Xiao, Q., Zheng, Y., Liu, X., Cheng, J., and Zhang, Q.: Tracking Daily Concentrations of PM2.5 Chemical Composition in China since 2000, Environ. Sci. Technol., 56, 16517–16527, https://doi.org/10.1021/acs.est.2c06510, 2022.
Liu, Y. C., Wu, Z. J., Qiu, Y. T., Tian, P., Liu, Q., Chen, Y., Song, M., and Hu, M.: Enhanced Nitrate Fraction: Enabling Urban Aerosol Particles to Remain in a Liquid State at Reduced Relative Humidity, Geophys. Res. Lett., 50, e2023GL105505, https://doi.org/10.1029/2023GL105505, 2023.
Meskhidze, N., Chameides, W. L., Nenes, A., and Chen, G.: Iron mobilization in mineral dust: Can anthropogenic SO2 emissions affect ocean productivity?, Geophys. Res. Lett., 30, 2085, https://doi.org/10.1029/2003GL018035, 2003.
Möller, D. and Zierath, R.: On the composition of precipitation water and its acidity, Tellus B, 38B, 44–50, https://doi.org/10.1111/j.1600-0889.1986.tb00086.x, 1986.
Nah, T., Guo, H., Sullivan, A. P., Chen, Y., Tanner, D. J., Nenes, A., Russell, A., Ng, N. L., Huey, L. G., and Weber, R. J.: Characterization of aerosol composition, aerosol acidity, and organic acid partitioning at an agriculturally intensive rural southeastern US site, Atmos. Chem. Phys., 18, 11471–11491, https://doi.org/10.5194/acp-18-11471-2018, 2018.
Peng, X., Vasilakos, P., Nenes, A., Shi, G., Qian, Y., Shi, X., Xiao, Z., Chen, K., Feng, Y., and Russell, A. G.: Detailed Analysis of Estimated pH, Activity Coefficients, and Ion Concentrations between the Three Aerosol Thermodynamic Models, Environ. Sci. Technol., 53, 8903–8913, https://doi.org/10.1021/acs.est.9b00181, 2019.
Pye, H. O. T., Liao, H., Wu, S., Mickley, L. J., Jacob, D. J., Henze, D. K., and Seinfeld, J. H.: Effect of changes in climate and emissions on future sulfate-nitrate-ammonium aerosol levels in the United States, J. Geophys. Res.-Atmos, 114, D01205, https://doi.org/10.1029/2008JD010701, 2009.
Pye, H. O. T., Pinder, R. W., Piletic, I. R., Xie, Y., Capps, S. L., Lin, Y., Surratt, J. D., Zhang, Z., Gold, A., Luecken, D. J., Hutzell, W. T., Jaoui, M., Offenberg, J. H., Kleindienst, T. E., Lewandowski, M., and Edney, E. O.: Epoxide Pathways Improve Model Predictions of Isoprene Markers and Reveal Key Role of Acidity in Aerosol Formation, Environ. Sci. Technol., 47, 11056–11064, https://doi.org/10.1021/es402106h, 2013.
Pye, H. O. T., Nenes, A., Alexander, B., Ault, A. P., Barth, M. C., Clegg, S. L., Collett Jr., J. L., Fahey, K. M., Hennigan, C. J., Herrmann, H., Kanakidou, M., Kelly, J. T., Ku, I.-T., McNeill, V. F., Riemer, N., Schaefer, T., Shi, G., Tilgner, A., Walker, J. T., Wang, T., Weber, R., Xing, J., Zaveri, R. A., and Zuend, A.: The acidity of atmospheric particles and clouds, Atmos. Chem. Phys., 20, 4809–4888, https://doi.org/10.5194/acp-20-4809-2020, 2020.
Seinfeld, J. H. and Pandis, S. N.: Atmospheric chemistry and physics: from air pollution to climate change, John Wiley & Sons, Inc., Hoboken, New Jersey, USA, ISBN 978-1118947401, 2016.
Shah, V., Jacob, D. J., Moch, J. M., Wang, X., and Zhai, S.: Global modeling of cloud water acidity, precipitation acidity, and acid inputs to ecosystems, Atmos. Chem. Phys., 20, 12223–12245, https://doi.org/10.5194/acp-20-12223-2020, 2020.
Song, S.: shaojiesong/GC14.1.1_output_for_pH: First release (publish), Zenodo [data set], https://doi.org/10.5281/zenodo.11480367, 2024.
Song, S., Gao, M., Xu, W., Shao, J., Shi, G., Wang, S., Wang, Y., Sun, Y., and McElroy, M. B.: Fine-particle pH for Beijing winter haze as inferred from different thermodynamic equilibrium models, Atmos. Chem. Phys., 18, 7423–7438, https://doi.org/10.5194/acp-18-7423-2018, 2018.
Straub, D. J., Hutchings, J. W., and Herckes, P.: Measurements of fog composition at a rural site, Atmos. Environ., 47, 195–205, https://doi.org/10.1016/j.atmosenv.2011.11.014, 2012.
Sun, M., Wang, Y., Wang, T., Fan, S., Wang, W., Li, P., Guo, J., and Li, Y.: Cloud and the corresponding precipitation chemistry in south China: Water-soluble components and pollution transport, J. Geophys. Res.-Atmos, 115, D22303, https://doi.org/10.1029/2010JD014315, 2010.
The International GEOS-Chem User Community: geoschem/geoschem: GEOS-Chem 14.1.1 (Version 14.1.1), Zenodo [code], https://doi.org/10.5281/zenodo.7696632, 2023.
Tilgner, A., Schaefer, T., Alexander, B., Barth, M., Collett Jr., J. L., Fahey, K. M., Nenes, A., Pye, H. O. T., Herrmann, H., and McNeill, V. F.: Acidity and the multiphase chemistry of atmospheric aqueous particles and clouds, Atmos. Chem. Phys., 21, 13483–13536, https://doi.org/10.5194/acp-21-13483-2021, 2021.
Vasilakos, P., Russell, A., Weber, R., and Nenes, A.: Understanding nitrate formation in a world with less sulfate, Atmos. Chem. Phys., 18, 12765–12775, https://doi.org/10.5194/acp-18-12765-2018, 2018.
Wang, S., Su, H., Chen, C., Tao, W., Streets, D. G., Lu, Z., Zheng, B., Carmichael, G. R., Lelieveld, J., Pöschl, U., and Cheng, Y.: Natural gas shortages during the “coal-to-gas” transition in China have caused a large redistribution of air pollution in winter 2017, P. Natl. Acad. Sci. USA, 117, 31018–31025, https://doi.org/10.1073/pnas.2007513117, 2020.
Wang, S. W., Zhang, Q., Streets, D. G., He, K. B., Martin, R. V., Lamsal, L. N., Chen, D., Lei, Y., and Lu, Z.: Growth in NOx emissions from power plants in China: bottom-up estimates and satellite observations, Atmos. Chem. Phys., 12, 4429–4447, https://doi.org/10.5194/acp-12-4429-2012, 2012.
Wang, X., Jacob, D. J., Eastham, S. D., Sulprizio, M. P., Zhu, L., Chen, Q., Alexander, B., Sherwen, T., Evans, M. J., Lee, B. H., Haskins, J. D., Lopez-Hilfiker, F. D., Thornton, J. A., Huey, G. L., and Liao, H.: The role of chlorine in global tropospheric chemistry, Atmos. Chem. Phys., 19, 3981–4003, https://doi.org/10.5194/acp-19-3981-2019, 2019.
Wang, Y., Chen, Y., Wu, Z., Shang, D., Bian, Y., Du, Z., Schmitt, S. H., Su, R., Gkatzelis, G. I., Schlag, P., Hohaus, T., Voliotis, A., Lu, K., Zeng, L., Zhao, C., Alfarra, M. R., McFiggans, G., Wiedensohler, A., Kiendler-Scharr, A., Zhang, Y., and Hu, M.: Mutual promotion between aerosol particle liquid water and particulate nitrate enhancement leads to severe nitrate-dominated particulate matter pollution and low visibility, Atmos. Chem. Phys., 20, 2161–2175, https://doi.org/10.5194/acp-20-2161-2020, 2020.
Weber, R. J., Guo, H., Russell, A. G., and Nenes, A.: High aerosol acidity despite declining atmospheric sulfate concentrations over the past 15 years, Nat. Geosci., 9, 282–285, https://doi.org/10.1038/ngeo2665, 2016.
Wu, D., Zheng, H., Li, Q., Wang, S., Zhao, B., Jin, L., Lyu, R., Li, S., Liu, Y., Chen, X., Zhang, F., Wu, Q., Liu, T., Jiang, J., Wang, L., Li, X., Chen, J., and Hao, J.: Achieving health-oriented air pollution control requires integrating unequal toxicities of industrial particles, Nat. Commun., 14, 6491, https://doi.org/10.1038/s41467-023-42089-6, 2023.
Yuan, A. E. and Shou, W.: Data-driven causal analysis of observational biological time series, eLife, 11, e72518, https://doi.org/10.7554/eLife.72518, 2022.
Yuan, J., Stein, M. L., and Kopp, R. E.: The Evolving Distribution of Relative Humidity Conditional Upon Daily Maximum Temperature in a Warming Climate, J. Geophys. Res.-Atmos, 125, e2019JD032100, https://doi.org/10.1029/2019JD032100, 2020.
Zhang, B., Shen, H., Liu, P., Guo, H., Hu, Y., Chen, Y., Xie, S., Xi, Z., Skipper, T. N., and Russell, A. G.: Significant contrasts in aerosol acidity between China and the United States, Atmos. Chem. Phys., 21, 8341–8356, https://doi.org/10.5194/acp-21-8341-2021, 2021.
Zhang, T., Shen, Z. X., Su, H., Liu, S. X., Zhou, J. M., Zhao, Z. Z., Wang, Q. Y., Prévôt, A. S. H., and Cao, J. J.: Effects of Aerosol Water Content on the formation of secondary inorganic aerosol during a Winter Heavy PM2.5 Pollution Episode in Xi'an, China, Atmos. Environ., 252, 118304, https://doi.org/10.1016/j.atmosenv.2021.118304, 2021.
Zheng, G., Su, H., Wang, S., Andreae, M., Pöschl, U., and Cheng, Y.: Multiphase buffer theory explains contrasts in atmospheric aerosol acidity, Science, 369, 1374–1377, https://doi.org/10.1126/science.aba3719, 2020.
Zheng, G. J., Su, H., and Cheng, Y. F.: Revisiting the Key Driving Processes of the Decadal Trend of Aerosol Acidity in the U.S., ACS Environ. Au, 2, 346–353, https://doi.org/10.1021/acsenvironau.1c00055, 2022.