the Creative Commons Attribution 4.0 License.
the Creative Commons Attribution 4.0 License.
 | 17 Jan 2024
Impact of urban land use on mean and heavy rainfall during the Indian summer monsoon
Renaud Falga
Chien Wang
Northern India has undergone intense urbanization since the middle of the 20th century. The impact of such drastic land-use change on the regional weather and climate remains to be assessed. In this work, we study the impact of the modification of land use – from vegetation to urban – on the Indian summer monsoon rainfall as well as on other meteorological variables. We use the regional Meso-scale Non-Hydrostatic (Meso-NH) model coupled with an urban module (the Town Energy Balance model) to perform monthlong sensitivity simulations centered around Kolkata, the most urbanized area in northeastern India. Paired simulations, one with and another without urban settings, have been performed to identify the impacts related to urbanization through both thermodynamic and kinetic effects. We find that the perturbation induced by urban land use enhances the mean rainfall over the model domain, principally by intensifying the convective activity through thermodynamic perturbation, leading to a 14.4 % increase in the monthly mean rainfall. The urban area also induces a 15.0 % rainfall increase during two modeled periods of heavy precipitation caused by low-pressure systems. In addition, the modeling results demonstrate that the urban area not only generally acts as a rainfall enhancer, particularly during nighttime, but also induces the generation of a specific storm in one modeled case that would not have formed in the absence of the urban area. The initiation of this storm over the city was primarily due to the urban terrain's disturbance of the near-surface wind flow, leading to a surge in dynamically produced turbulent kinetic energy (TKE). The thermal production of TKE over the nighttime urban boundary layer, on the other hand, serves as a contributing factor to the storm formation.
- Article
(2871 KB) - Full-text XML
-
Supplement
(828 KB) - BibTeX
- EndNote


During the 20th century, India witnessed major land-use and land-cover (LULC) modifications. Specifically, urban and agricultural land covers were greatly expanded, especially between the 1950s and the 1980s, at the expense of forests and grasslands (Tian et al., 2014). Such modifications to the LULC have had an impact on the local and regional climate, in particular on the monsoon rainfall, including extreme precipitation (Niyogi et al., 2018). In particular, potential environmental and climate impacts of urbanization have received special attention from the scientific community over the past few decades (Qian et al., 2022). Urbanization-related LULC change has been shown to have a significant influence on precipitation over, around, and downwind of the cities (Liu and Niyogi, 2019).
Urbanization can affect the local and regional climate via two distinct paths: (1) the emission of anthropogenic aerosols and (2) the thermodynamic and kinetic perturbation induced by the modification of land use. The former path, i.e., the urban aerosol emissions, can modify the local surface energy balance by decreasing the amount of incoming solar radiation reaching the surface and by increasing the amount of radiation absorbed by the boundary-layer atmosphere (e.g., Yu et al., 2006). Such emissions can also perturb precipitation patterns via the modification of cloud microphysical properties, also known as the “aerosol indirect effect” (Twomey, 1977), which has a significant impact around urban areas (e.g., Van Den Heever and Cotton, 2007). While the effects of anthropogenic aerosols on the monsoon rainfall are believed to be important (e.g., Wang et al., 2009; Bollasina et al., 2011), we focus on the second path, or the effects associated with the modification of LULC, in this study.
Urban land use could alter the water cycle and precipitation through various effects on temperature, circulation, and moisture content. The most commonly recognized impact of urban areas on local climate is the temperature modification that they induce, in comparison with the rural background. This effect is known as the “urban heat island” (UHI) and has been fairly well documented (e.g., Oke, 1982; Taha, 1997; Arnfeild, 2003). The reasons for the existence of the UHI effect include the decrease in surface albedo and thermal capacity as well as the increase in thermal conductivity of urban buildup in comparison to vegetation (Mohajerani et al., 2017). This means that the incoming solar radiation is stored more efficiently in human-made materials. The UHI effect is also known to be maximized during the night (e.g., Nakamura and Oke, 1988), due to the release of heat stored in buildings during the day. Furthermore, vegetation tends to have a cooling effect on its surrounding environment via the evapotranspiration process. When liquid water evaporates, the energy required to break the hydrogen bonds between the water molecules is taken from the surrounding environment (surface and surrounding air), which has a local cooling effect. Therefore, the suppression of vegetation and the associated evapotranspiration in urban areas can enhance the UHI effect (Chapman et al., 2018). Overall, the increase in surface temperature induced by the UHI effect has been shown to enhance the convective activity and, in turn, the local precipitation (Han and Baik, 2008).
Another effect of urban areas on local meteorology is the modification of wind patterns. The first known effect is the increase in surface roughness in the city, which induces a deceleration of winds close to the surface. This can induce an increase in wind shear and, thus, an enhancement of turbulent mixing in the planetary boundary layer (Hildebrand and Ackerman, 1984), which have both been shown to have the potential to invigorate thunderstorms (Weisman and Klemp, 1982). There has been some observational evidence that urban areas have an impact on thunderstorm paths as well as intensities (Niyogi et al., 2011; Shepherd et al., 2013). In fact, certain analyses using observations have suggested that some thunderstorms might have been initiated by the urban area itself in the Atlanta region (Bornstein and Lin, 2000; Dixon and Mote, 2003). Shem and Shepherd (2009) attempted to verify these hypotheses using the Weather Research and Forecasting (WRF) model. They showed that the urban area did have a significant impact on the thunderstorm, but the results regarding storm initiation were inconclusive.
Nevertheless, the extent and drivers of various potential effects of urban settings on the water cycle proposed in previous work depended on a wide variety of local factors, including meteorological and geographical features. For example, by acting as a low-level heat source, the UHI effect was shown to induce a low-level convergence of winds, creating a mechanically forced “dome-shaped” convection over the city (Fan et al., 2017). However, this type of convection might not be sustained in an environment with strong background winds, such as monsoonal trade winds. The presence of strong winds might result in an important heat transport that could reduce the strength of the UHI effect (Baik et al., 2001). Hence, the impact of urban land use on precipitation in a large-scale, highly energetic system like the monsoon is yet to be fully understood.
While the mean rainfall of the Indian summer monsoon (ISM) is believed to have decreased throughout the 20th century and then reversed since the beginning of the 21st century (Jin and Wang, 2017), there is a general agreement among the scientific community that extreme rainfall events could have increased in India during the past monsoon seasons (e.g., Goswami et al., 2006; Dash et al., 2009; Roxy et al., 2017; Falga and Wang, 2022). Furthermore, some studies based on data analysis have linked this rise in rainfall extremes to intense urbanization, either by comparing the pre-urbanization and post-urbanization trends (Shastri et al., 2015; Vittal et al., 2013) or by analyzing the precipitation at different urban locations (Kishtawal et al., 2010; Bisht et al., 2018; Swain et al., 2023a). Mitra et al. (2011) identified certain observational evidence regarding the urban impact on the pre-monsoonal precipitation in Kolkata. However, there have been only a limited number of studies using advanced models to examine the impact of urban land use on monsoon rainfall. Lei et al. (2008) highlighted the need for suited parameterization of urban areas in models in order to accurately simulate the heavy rainfall rates of a particular storm case in Mumbai, and they offered conclusions on the important impact of urbanization on extremes. In addition to their observational study, Swain et al. (2023b) also recently used the WRF model to show that the urbanization could induce an intensification of rainfall in the Bhubaneshwar region, located in northeastern India. Li et al. (2017) also studied the projected impacts of LULC changes in the region and found that an urbanization-increase scenario would lead to an increase in temperature and rainfall.
It is worth noting that urbanization appears as a local factor that interacts with larger-scale dynamic factors. For example, the Indian monsoon is known to be highly influenced by geographic particularities, including orography on the west coast and the Tibetan Plateau in the northern part of the country, the latter of which can influence aerosol concentrations, circulation, and precipitation (Liu et al., 2022). Thermodynamic considerations over the Indian Ocean can also explain rainfall sensitivity to large-scale conditions, especially in northern India which is directly affected by the Bay of Bengal (e.g., Sheehan et al., 2023). Thus, urbanization appears as a local perturbation with feedback to these large-scale features.
In a previous effort, we used a machine learning approach to show the correlation between the long-term trends of changes in LULC and those of extreme rainfall events (Falga and Wang, 2022). Specifically, the urbanization trend becomes a key player among various types of LULC in the above correlation in northeastern India. Hence, in this study, we seek to use a modeling approach to identify the causal relationship between urbanization and both mean and heavy rainfall during the ISM in a highly urbanized area in northeastern India: Kolkata. Instead of focusing on a single storm passing over the city, we simulate the whole month of July 2011, thereby covering several rainfall systems over the modeled area. This approach allows us to develop a more comprehensive understanding of what happens after a storm passes over a city and to determine if the rainfall enhancement due to the urban areas is consistent among different cases. The lengthy simulations also enable us to highlight some key features of the urban perturbations in Kolkata, such as the diurnal cycles of the UHI effect, surface fluxes, and rainfall perturbations.
In the following, we first present the model setup and the data used in our modeling (Sect. 2). We then discuss several general characteristics of the perturbation of urban settings and its consequent effects on rainfall (Sect. 3). In Sect. 4, we present the detailed analysis results that show how urban settings can even induce a nighttime storm, in addition to enhancing rainfall. In Sect. 5, we discuss the potential influence of synoptic-scale conditions on rainfall modification. Finally, Sect. 6 summarizes our findings.
2.1 The model
We utilize a regional meteorological model, the Meso-scale Non-Hydrostatic (Meso-NH) model (Lac et al., 2018), in this study. Meso-NH has been developed jointly by Laboratoire d'Aérologie (UMR 5560 UPS/CNRS) and the French National Meteorological Research Centre (CNRM, UMR 3589 CNRS/Météo-France). The model includes a two-moment microphysical module for liquid, ice, and multiple aerosols (LIMA; Vié et al., 2016) to predict the evolution of various hydrometeors and aerosols. The European Center for Medium-Range Weather Forecasts (ECMWF) radiation scheme is included to simulate short- and longwave radiation (Hogan and Bozzo, 2018). The simulations use an eddy diffusivity mass flux scheme (Pergaud et al., 2009) to parameterize the shallow convection. Deep convection and associated physiochemical processes in our configuration are explicitly resolved.
In this study, the Surface Externalisée (SURFEX) scheme is used for surface fluxes and land–surface interaction processes (Masson et al., 2013). SURFEX is a surface modeling platform developed by Météo-France, in which each model grid is separated into four tiles – Nature, Sea, Lakes, and Town – and each one of these tiles uses a different parameterization. In particular, the Town Energy Balance (TEB) model (Masson, 2000) is used on the Town tile to calculate the energy and water fluxes between the urban grids and the atmosphere. The TEB is an urban canopy model that takes an important number of physical processes into account, including building-scale processes, while also managing to maintain an accurate representation of the 3D geometry of the city. Three different surface types are defined – roads, streets, and walls – and distinct energy budgets are computed for each of these surface types. Some geometrical parameters like building height, width, or orientation are constant within a grid cell. The TEB model has been demonstrated to be able to accurately simulate the thermodynamic effect of urban areas like the UHI effect (Lemonsu et al., 2002) or modification of the surface energy balance (Pigeon et al., 2008).
2.2 Model domain and configuration
The Meso-NH model has been configured to have a horizontal resolution of 900 m and 62 stretched vertical layers, with a vertical spacing of 10 m near the surface that is gradually maximized to 1000 m at the top of the model domain. Such a spatial resolution configuration allows us to directly resolve deep convection without parameterization. The model domain covers a 360 km × 360 km area centered around Kolkata. In order to assess the impact of the urban area on its immediate surroundings, we have also defined a smaller region in the proximity of Kolkata (noted as “Kolkata area” in the rest of the paper) that covers an 80 km × 80 km area. The spatial coverage of the domain, the urban fractions used in the “Urban” run, and the boundary used to delimit the Kolkata area are shown in Fig. 1.
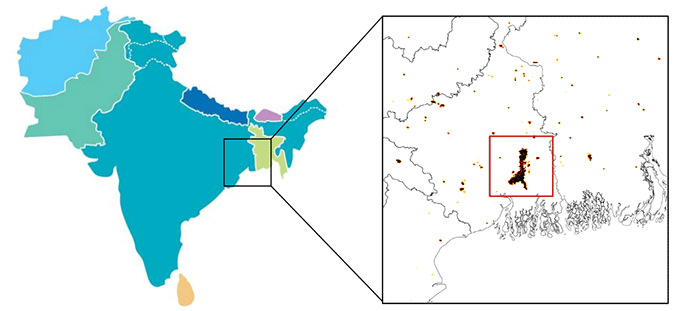
Figure 1Model domain used in the simulations. The urban fractions in the domain (in dark colors) as well as the boundary defining the Kolkata area (red square) have been plotted. In the reference run, the urban areas have been replaced by the surrounding vegetation, i.e., grassland. The whole domain is a square shape and the length of one side is 360 km.
We have performed a set of two sensitivity simulations using Meso-NH coupled with the TEB model. The first simulation (hereby referred to as the Urban run) uses recent, realistic land-use data obtained from the ECOCLIMAP-II database (Faroux et al., 2013). In the second control simulation (referred to as the No-Urban run), the urban land-use settings are replaced by the local surrounding vegetation, i.e., grassland. The configurations of these two simulations are otherwise identical.
The modeled period in all simulations is the whole month of July 2011. The choice of the year of 2011 was made based on both climatological considerations and the availability of supporting data. This year is found to be an overall “average” year over the past decades in terms of extreme rainfall events during the Indian summer monsoon seasons, meaning that both the frequency and intensity of rainfall extremes were close to their climatological mean values over the recent decades (Falga and Wang, 2022).
As initial and lateral boundary conditions, we use ECMWF Integrated Forecasting System (IFS) data (ECMWF, 2021). The boundary conditions are introduced through time-sequence coupling files every 6 h. The 12-hourly prescribed sea surface temperature (SST) values obtained from the ERA5 reanalysis data (Hersbach et al., 2020) are also used to drive the simulations. As the aerosol effect on precipitation is not a research focus here, we have prescribed constant aerosol concentrations in all simulations (300 aerosols cm−3 for each of the three cloud condensation nuclei, CCN, modes).
2.3 Model comparison with ERA5 reanalysis data
When comparing our modeled rainfall with ERA5 reanalysis data, we find that the model largely reproduces the evolution of the domain-averaged hourly rainfall time series in ERA5 (Fig. 2). Specifically, the two major heavy-rainfall periods shown in the reanalysis data, which occurred from 1 to 5 July and from 18 to 22 July, respectively, are both simulated successfully by our model. While the precipitation intensity in the first period seems to be somewhat overestimated by the model, the quantity in the latter period matches the ERA5 data quite well. Note that the discrepancies between the model and reanalysis could come from either the difference in spatial resolution between our model and ERA5 or the simplified representation of aerosols in our model.
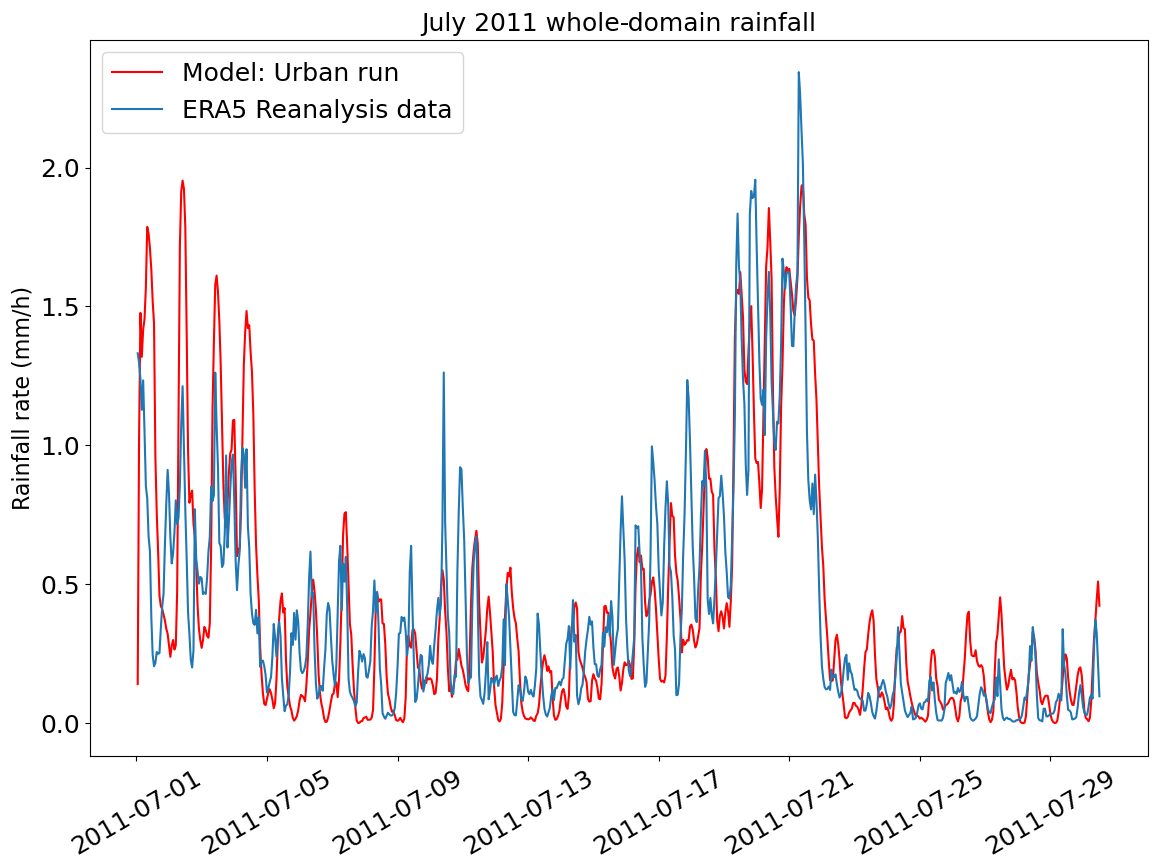
Figure 2Domain-averaged rainfall time series of our modeled Urban run (in red) and the ERA5 reanalysis data (in blue).
Note that the intention of this study is not to exactly simulate the observed rainfall but rather to investigate the sensitivity of the simulated precipitation to land-use modification. Therefore, we need to ensure that the simulated rainfall is able to reproduce large-scale features, rather than exact rainfall at specific locations. The ERA5 reanalysis provides consistent and high-resolution data for the whole modeled month over the model domain; thus, comparison with ERA5 appears suited to our study.
3.1 Characteristic urban impacts on physical features
The monthlong simulations provide us with an opportunity to understand how certain physical features are affected by the urban setting on each individual day, but they also increase the statistical significance of such effects throughout the entire modeled time frame. As mentioned previously, certain characteristics of the urban impact on the regional meteorology and climate strongly depend on local factors. Hence, the effects of Kolkata on some local meteorological features and their diurnal cycles have been studied first (Fig. 3). For instance, we find that the Kolkata area induces a clear perturbation in the diurnal cycles of surface heat fluxes, both sensible and latent, as shown in Fig. 3a. The differences between the Urban and No-Urban runs are most evident during the day for both fluxes, with the largest difference occurring at noon, when the incoming solar radiation reaches its maximum. Specifically, the surface sensible heat flux is higher in the Urban run, due to a lower albedo and heat capacity as well as a higher heat conductivity in the urban area, leading to a higher surface temperature during the day. On the other hand, reduced vegetation in the Urban run results in lower evapotranspiration, which explains the higher latent heat flux in the No-Urban run. When it evaporates to vapor, water takes energy from the surrounding environment, thereby inducing a local cooling. However, the temperature of the water does not change, and the energy required for evaporation is stored within the water vapor in the form of latent heat. This explains why the latent heat flux above vegetation is higher than above dry surfaces. Therefore, a weaker latent heat flux is an indication of decreased evaporation, and the UHI effect is further strengthened by such a reduction in the latent heat flux. Despite the opposite signs attached to the differences in the sensible and latent heat fluxes, both favor a higher temperature in the Urban run, and their combined effects cause an intense positive surface temperature difference between Urban and No-Urban runs that can reach over 10 K at noon (not shown here).
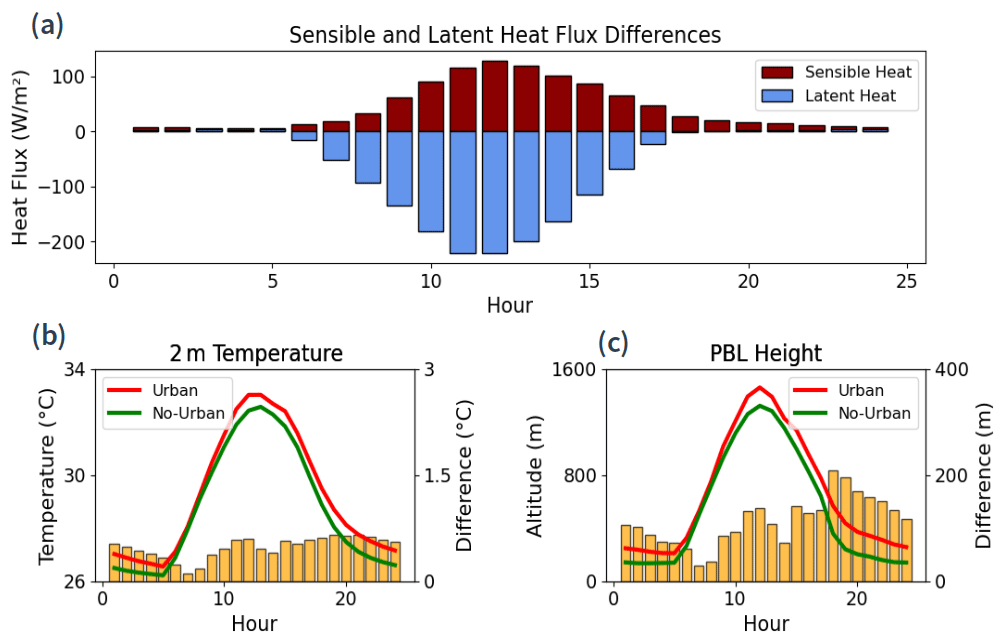
Figure 3Monthly mean diurnal cycles of (a) surface sensible and latent heat flux differences (Urban – No-Urban), (b) 2 m temperature, and (c) planetary boundary layer (PBL) height. The solid lines in panels (b) and (c) show the actual diurnal cycles, while the orange bar plots show the associated differences (Urban – No-Urban). In panel (a), only the differences are shown. All of these variables are calculated within the grid cells where Kolkata is located.
While the surface temperature difference can reach high values, the variable most often used to calculate the UHI intensity is the difference in the 2 m temperature. This difference is often relatively smaller and reflects the actual temperature difference experienced between the city and rural background well. In our simulations, on average, the UHI effect, defined as the difference in the 2 m temperature over Kolkata between the Urban and No-Urban runs, reaches its highest value of 0.65 K at 19:00 LT (local time), or at the end of the day (Fig. 3b). After 19:00 LT, despite the air temperature dropping in both simulations, the UHI effect remains relatively constant until midnight, with UHI values still being as high as 0.55 K at midnight. This is due to the physical properties of urban buildup, which allows heat to be stored during the day and released during the night. The UHI intensity starts to decrease more rapidly after midnight before reaching its minimal value of about 0.1 K at 07:00 LT, when most of the heat stored the previous day has been released.
The diurnal cycle of the UHI effect shows a similarity to that of the planetary boundary layer (PBL) height (Fig. 3c), as both are directly affected by incoming solar radiation. The PBL starts to develop in the morning, when the vertical mixing begins to strengthen, and stabilizes at sunset. By enhancing the surface temperatures, urban areas cause a rise in the vertical temperature gradient and buoyancy, which further increase turbulent mixing as well as local convective activity and, thus, the PBL height. The PBL heights in both the Urban and No-Urban runs peak at 12:00 LT (Fig. 3c). The PBL height in the No-Urban run then quickly decreases as the vertical air mixing weakens with the reduction in the incoming solar radiation; in contrast, the PBL height remains relatively higher in the Urban run. In fact, the difference in the PBL height between the Urban and No-Urban run is the highest at the end of the day (around 18:00 LT). Just like the UHI effect, the difference in the PBL height remains evident throughout the night, and the nighttime PBL is as much as twice as deep in the Urban run compared with the No-Urban run, suggesting that vertical mixing within the PBL remains relatively active during the night over the urban area.
3.2 Characteristic urban impacts on rainfall statistics
To assess the general characteristics of the urban impact on the rainfall statistics, the averaged diurnal cycles of rainfall within Kolkata and the surrounding area (the red square shown in Fig. 1) over the modeled month as well as the monthly mean rainfall in both simulations have been calculated (Fig. 4). We have chosen to display the precipitation results in this 80 km by 80 km area because the effects of urban areas on rainfall are believed to be quite localized. In their meta-analysis, Liu and Niyogi (2019) showed that the rainfall modification happened on average about 50 km downwind of the city and approximately 40 km around and upwind of the city. Therefore, the size of the Kolkata area appears to be suited to and in agreement with previous studies regarding the analysis of rainfall modification. Note that the differences remain fairly small when looking at rainfall modification across the whole domain, as the urban effect outside of the Kolkata area appears to be negligible. It should also be noted that this is not due to a potential rainfall reduction occurring outside of the Kolkata area that would offset the enhancement in the aforementioned region but rather owing to the absence of significant differences anywhere else in the domain, thereby dimming the effect of Kolkata on the whole-domain rainfall.
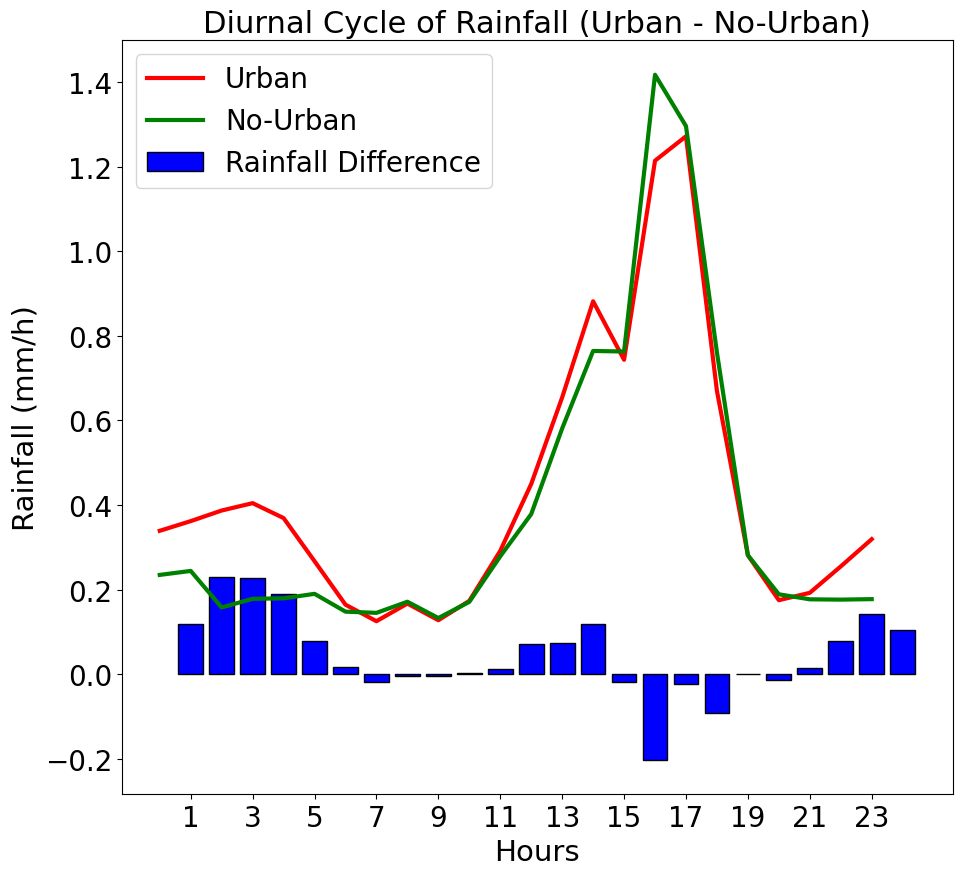
Figure 4Rainfall diurnal cycles. The diurnal cycles of rainfall for the Urban and No-Urban simulations are shown in red and green, respectively. The blue bar plot corresponds to the differences (Urban – No-Urban) in these diurnal cycles.
The diurnal cycles of rainfall show the same type of behavior as the 2 m temperature described previously, although with a peak occurring a few hours later (see Fig. 4). The Urban and No-Urban simulations have a maximum rainfall in the afternoon (at 17:00 and 16:00 LT, respectively), meaning that more intense precipitation happens during afternoon when the convection is strong. However, while the precipitation amount decreases throughout the night in the No-Urban run, it remains relatively high in the Urban run, such that the maximum precipitation difference between the two is found at 02:00 LT. At this time, the average rainfall is 86 % more intense in the Urban simulation compared with the No-Urban simulation. In the previous subsection, we found that the nighttime UHI caused a higher nocturnal PBL, indicating less atmospheric stability in the Urban run and favoring the possibility of rainfall occurrence. Therefore, the analysis of diurnal cycles of rainfall further confirms this nighttime instability in the urban boundary layer, as the rainfall enhancement by the urban area is much more evident during the night.
From monthly mean rainfall (Fig. S1 in the Supplement), defined as the temporally averaged rainfall over the simulated month for each grid cell of the Kolkata area, we find that the mean value in the No-Urban simulation (Fig. S1a, right panel) is about 2.30 mm (6 h)−1, while the mean rainfall of 2.63 mm (6 h)−1 in the Urban simulation is significantly higher (Fig. S1a, left panel), corresponding to an overall monthly increase of 14.4 %. This rainfall enhancement due to the urban setting appears to be even more intense over the city itself. When looking at the model grids within Kolkata, the mean rainfall is 22.8 % higher in the Urban than in the No-Urban run. The probability density functions (PDFs) corresponding to these two rainfall maps (Fig. S1b) show a clear shift in the Urban rainfall towards the higher-value side.
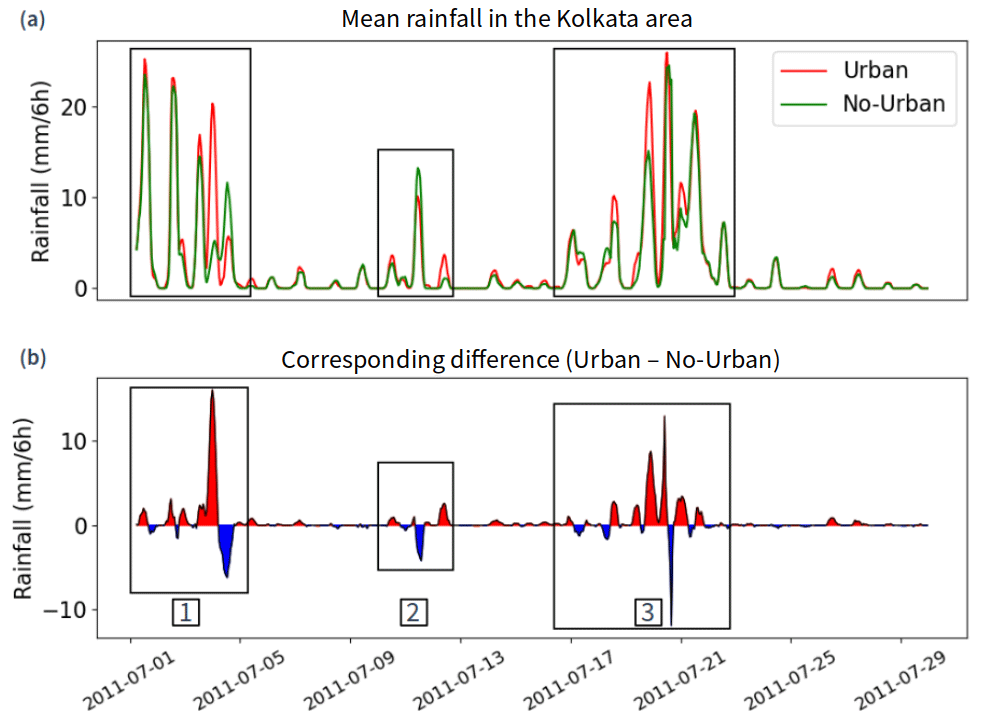
Figure 5Time series of mean rainfall, averaged over the Kolkata area. Panel (a) shows the time series of precipitation. The corresponding differences (Urban – No-Urban) are plotted in panel (b). The red or blue shading in panel (b) corresponds to times when the mean rainfall is higher in the Urban or No-Urban run, respectively. Three distinct heavy-rainfall systems passing over the area have been highlighted and numbered for clarity (black rectangles).
In order to better understand the time evolution of precipitation and the underlying processes involved in the urbanization-related rainfall modification, we have calculated the time series of rainfall for both simulations, averaged over the Kolkata area (Fig. 5; note that the values shown are 6 h accumulated rainfall, not the hourly values). During the month of July 2011, three distinct heavy-rainfall periods have been identified (black rectangles in Fig. 5). During the first and third periods, lasting from 1 to 5 July and from 18 to 22 July, respectively, the mean rainfall over Kolkata was significantly enhanced due to the urban setting, reflected in an average increase of 14.9 % and 15.0 % in the Urban compared with the No-Urban run during the respective first and third periods. As will be further discussed in Sect. 5, both of these periods were associated with a synoptic-scale low-pressure system. In contrast, during the second period (10–13 July), rainfall is much less intense than that during the two other periods, and both rainfall reduction and enhancement due to the urban setting appeared consecutively in the area, although the overall rainfall modification is almost negligible (+0.5 % increase). Therefore, we will focus on the first and third periods in the following discussions.
We have also assessed the modification induced by urban land use on two different extreme precipitation event indicators: the 99th percentile and the maximum rainfall. The former corresponds to the hourly 99th percentile of the 8100 grid cells' rainfall values in the Kolkata area. For the latter, we keep only the hourly maximum value in the area. The time series of the differences (Urban – No-Urban) are shown in Fig. S2. The 99th percentile indicator in the Urban run shows an average increase of 7.4 % in comparison with the No-Urban run. For the maximum rainfall, the average increase reaches 14.8 %.
Most of the time during the simulated month, the urban area acts as a “rainfall enhancer”, meaning that the precipitation in the Urban run is simply higher than that in the No-Urban run (Fig. 5). However, the fourth rainfall peak in the first heavy-rainfall period (see the first black box in Fig. 5) appears to be particularly interesting: the mean rainfall is very intense in the Urban run, whereas it is close to zero in the No-Urban run. This corresponds to the highest positive rainfall difference between these two runs (Fig. 5b), which starts at 22:00 LT on 3 July and ends at 10:00 LT on 4 July. In comparison, the three preceding rainfall peaks all come from diurnal convective precipitation: the incoming solar radiation causes the convection and rain to be initiated during the day, but precipitation stops at nighttime when the boundary layer becomes stable. Indeed, the 6 h accumulated rainfall maxima all happened at 18:00 LT in these three cases. This type of diurnal convective rainfall is slightly higher in the Urban run, with the rainfall maximum for all three peaks being about 10 % higher. This further confirms that the urban area does increase the convective activity, as shown in Sect. 3. However, note that, even though the rainfall is enhanced by the urban area, the heavy precipitation is present in both of the simulations, which shows that the main drivers of the rainfall during these first 3 d were other factors, such as the solar radiation and the important moisture availability (this last point is further discussed in Sect. 5). On the other hand, the fourth rainfall peak represents a system that was initiated in the proximity of Kolkata in the Urban run at the end of the third day, with most of the rain falling during the night in the Kolkata area. This storm would not have formed if the city was absent, as the rainfall in the No-Urban run during the corresponding time was extremely light. In fact, the rainfall is more than 3 times more intense in the Urban run than in the No-Urban run (about 240 % more intense over the whole night). When compared with the previous 10 % enhancement of the rainfall, the difference between the different peaks becomes evident. Therefore, the processes involved in the rainfall modification at this time differ from the three previous rainfall peaks. Consequently, while we refer to the rainfall modification as “enhancement” or “reduction” during the rest of the simulation, this fourth rainfall peak corresponds to an “initiation” of a heavy-rainfall event by the city. Investigating the physical processes involved would enable us to better understand how this nighttime storm formed over Kolkata due to the urban setting.
4.1 Storm initiation and consequent evolution
Figure 6 shows the storm during its beginning, evolution, and propagation stages (note that the left and right panels correspond to the hourly rainfall in the Urban and the No-Urban runs, respectively). At 22:00 LT, before the storm reaches the city, a precipitation zone has already appeared slightly west of Kolkata in the Urban run, but nothing has happened in the No-Urban run (Fig. 6a, e). At this point, the precipitation remains relatively light (less than 10 mm h−1). This moderate-intensity cloud system then propagates east before reaching Kolkata around midnight, or 2 h later. A total of 3 h later, at 01:00 LT (Fig. 6b, f), when the cloud system reaches Kolkata, the rainfall has greatly intensified in the Urban run, with hourly rates increasing up to more than 100 mm h−1 (Fig. 6b). In contrast, as seen in Fig. 6f, this storm is absent in the No-Urban run. After leaving the urban proximity, at 05:00 LT (Fig. 6c, g) and 10:00 LT (Fig. 6d, h), the storm propagates south-southwest in the Urban run before its dissipation in the Bay of Bengal. The approximate storm path is shown in each panel of the Urban simulation using dashed red lines. In contrast, no corresponding system developed in the No-Urban run.
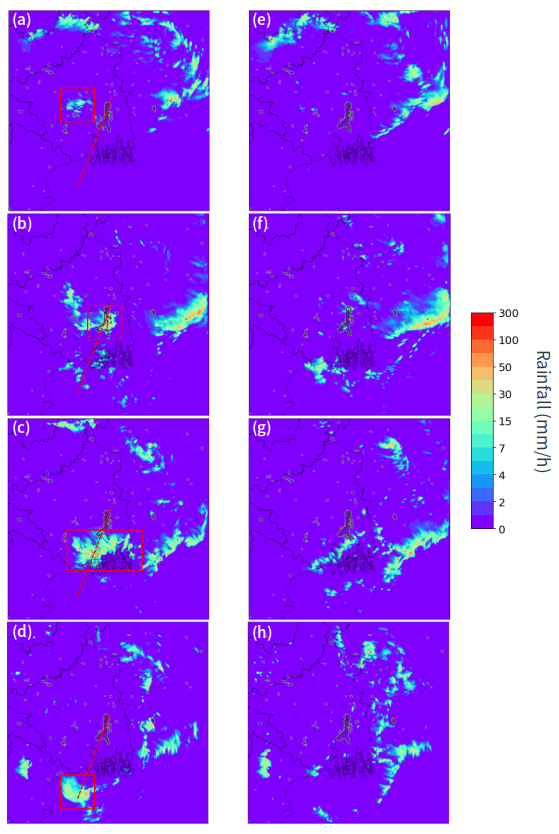
Figure 6Storm development and propagation. Panels (a) and (e), (b) and (f), (c) and (g), and (d) and (h) correspond to the hourly simulated rainfall in the domain at 22:00, 01:00, 05:00, and 10:00 LT, respectively, in the (a–d) Urban run and (e–h) No-Urban run. The delimitation of the storm initiated in the Urban run is shown in red (a–d). The dashed red line shows the trajectory of the storm, which is where we calculated the cross section shown in Fig. 7. Note that the color scale here is not linear.
We have also compared the detailed thermodynamic and dynamic structures of both the Urban and No-Urban simulations for the moments just prior to and after the initiation of the storm. The relatively straight trajectory of this storm allowed us to select a cross section to analyze certain 3D variables aligning almost perfectly with the storm path.
Figure 7 shows the distributions of the equivalent potential temperature (θe) anomalies, wind patterns, and the total condensed water (TCW) along the storm path over the selected cross sections (see the dashed red lines in Fig. 6) for both simulations at three different time steps: 22:00, 02:00, and 05:00 LT. θe is a useful variable for studying atmospheric thermodynamics and stability in a humid environment, such as that during the ISM season. It is similar to the standard potential temperature except that it includes the temperature change due to the release of latent heat via condensation, thereby providing information about both the temperature and humidity content of the atmosphere. Therefore, the cross sections shown in Fig. 7 provide us with insight into the evolution of circulation, humidity, and atmospheric stability immediately before, at, and after storm initiation. Note that the θe anomalies here are calculated at each grid of the cross section by subtracting the vertically averaged θe value of the grid cell from the values in the column. Hence, a positive anomaly at the surface means that the surface value of θe is higher than its vertical average and indicates that θe decreases with height, which is an indicator of instability.
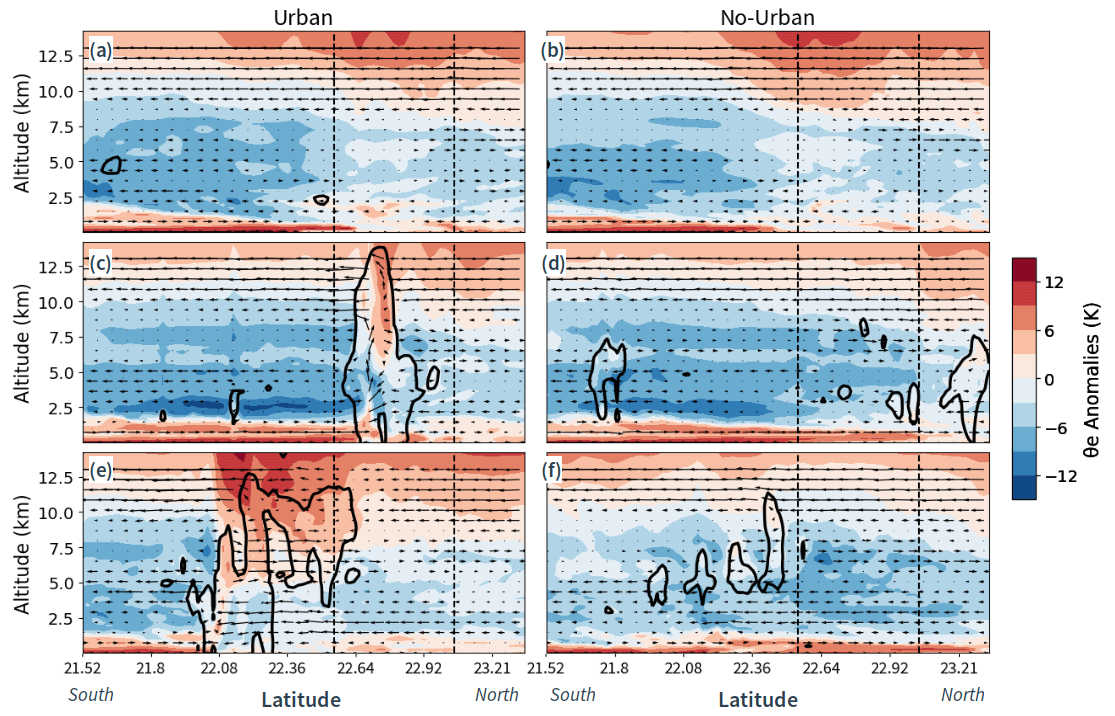
Figure 7Cross section of the equivalent potential temperature anomalies. Panels (a), (c), and (e) show the anomalies along the storm path in the Urban run at three different time steps: 22:00, 01:00, and 05:00 LT. Panels (b), (d), and (f) show the same time steps but for the No-Urban run. The projected 2D wind field is plotted on the cross sections, and we also plotted the TCW contour (TCW = 0.3 g kg−1). The right part of the figure corresponds to the north end of the cross section, and the storm propagates southward in the Urban run (towards the left of the figure). Kolkata is delimited by the black vertical dashed lines. The θe anomalies here are calculated at each grid of the cross section by subtracting the vertically averaged θe value of the grid cell from the values in the column, thereby providing insight into the vertical profiles.
At 22:00 LT, just before the storm is initiated, from near the surface up to an altitude of approximately 1 km, strong and steady winds blow from the ocean to the land (from south to north), which is a typical wind pattern occurring during the summer monsoon season (Fig. 7a, b). The corresponding strong positive θe anomalies suggest that these southerly winds brought moist and unstable air to the continent. Then, 3 h later, when the humid and unstable flow reaches the city (dashed black lines), the positive θe anomaly propagates upward in the Urban run, the air is lifted, and convection is initiated in this simulation (Fig. 7c). This convection is rather deep, as the updrafts eventually reach an altitude of about 13 km. The shape of the forming storm can be seen from the contour of TCW. After the storm passes the city, a mid-tropospheric return flow leads to the storm moving southward, as seen in Fig. 7e. Right after the passage of the storm, the instability of the atmosphere is reduced, which is reflected in the weakening positive anomalies in the lower atmosphere and a close-to-zero vertical gradient of θe, which is an indicator of a well-mixed atmosphere. In contrast, despite the same moist and unstable low-level southerly flow reaching Kolkata at 22:00 LT in the No-Urban run (Fig. 7b), no updrafts developed thereafter at 02:00 LT, and the flow just continued to propagate northward (Fig. 7d). This suggests that the PBL perturbation induced by the urban land use allowed deep convection to be initiated in the Urban run, while the analysis of θe and wind patterns at a larger scale indicates that the warm and moist air mass was advected from the Bay of Bengal to the land by the low-level monsoonal winds. The processes of this surface perturbation will be further analyzed in the Kolkata area in the following subsection to determine both the kinetic and thermodynamic factors that played an important role in this storm initiation.
4.2 Evolution of turbulent kinetic energy and storm initiation
As convective storms usually develop at a sub-hourly timescale, the original hourly output set from our simulations is not ideal for performing a detailed analysis. Therefore, we have conducted an additional set of two 28 h (i.e., Urban and No-Urban, respectively) simulations between 12:00 LT on 3 July and 16:00 LT on 4 July, with an output every 5 min, initiated using the outputs from 12:00 LT on 3 July from the first set of two simulations.
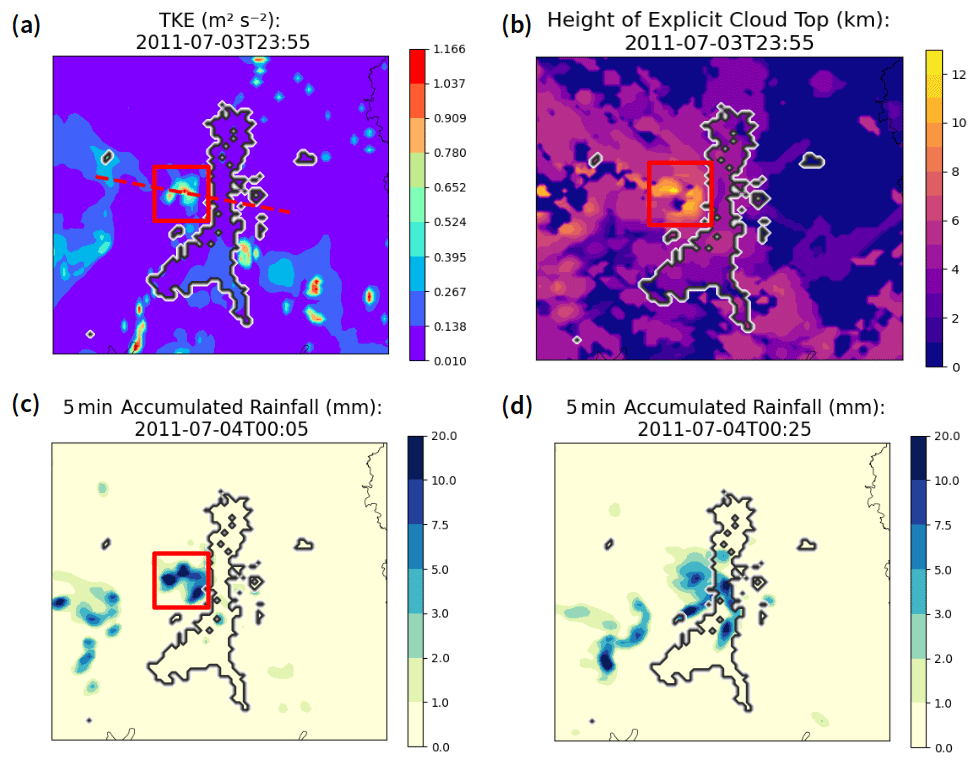
Figure 8Map of TKE in the Kolkata area (a), showing the peak in the TKE produced by the dynamic effect (red square) when the rainfall system reaches the city. The dashed red lines represent the path of the second cross section. The explicit cloud-top height at the same time step is shown in panel (b). Panels (c) and (d) present the 5 min accumulated rainfall 10 min and 30 min after the burst, respectively. Panel (c) corresponds to the rainfall accumulated between 00:00 and 00:05 LT on 4 July, whereas panel (d) corresponds to the rainfall accumulated between 00:20 and 00:25 LT on the same day.
As mentioned in the previous subsection, deep convection was initiated in the proximity of Kolkata. It developed from an existing moderate-rainfall system that formed slightly west of the city at around 22:00 LT (Fig. 6a). This system then propagated eastward and reached Kolkata shortly before midnight. The more frequent outputs have clearly revealed that the rainfall system slowed down upon its arrival in the proximity of the urban area, as if the city acted as a barrier. The system arrived in the proximity of the city and started to slow down at about 23:30 LT. Along with this deceleration, there was a sharp increase in the turbulent kinetic energy (TKE) at the surface, with a maximum value at 23:55 LT (Fig. 8a). In Meso-NH, the evolution of the TKE e is calculated by closing the prognostic TKE equation:
where u is the wind, θv is the virtual temperature, ρdref is the volumetric mass of dry air for the model reference state, and L is the characteristic length scale of the sub-grid eddies. In this equation, the terms on the right-hand side of the equation represent the advection of TKE (first term), the shear production (second term), the buoyancy production (third term), the diffusion (fourth term), and the dissipation (fifth term), respectively. Therefore, there are two distinct production sources of TKE: thermal (the third term) and dynamic (the second term). The former corresponds to the buoyancy flux, i.e., fluctuations induced by thermodynamic instability, while the latter refers to the effects related to friction and wind shear. Evidently, the above-identified TKE burst was dynamically produced, as the thermal contribution to TKE was negative (Fig. S3). This increase in surface TKE was accompanied by an increase in cloud-top height and the triggering of deep convection, with the cloud system reaching 13 km of altitude at the moment of the burst, right above the location of the TKE sudden increase (Fig. 8b). During that time, the rainfall intensified, and the intense precipitation over the city appears to have been initiated at this place, with heavy rainfall appearing just 10 min after the TKE burst (Fig. 8c), before spreading all over the city (Fig. 8d). This result highlights the important role of the surface roughness of the city in disturbing the wind pattern near the surface, creating a TKE burst in the modeled case and, thus, inducing storm development.
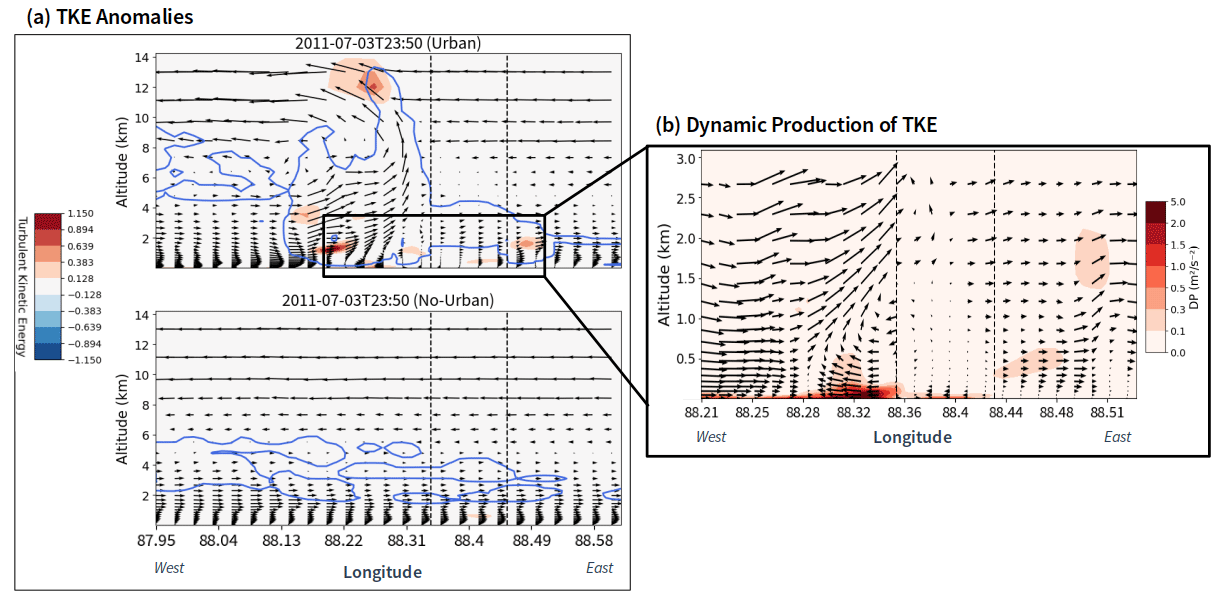
Figure 9Circulations along the west-to-east cross section and TKE anomalies (a) in the Urban (top panel) and No-Urban (bottom panel) simulations at 23:50 LT on 3 July. The portion of the cross section in which Kolkata is located is indicated using vertical dashed black lines. The blue contour represents the TCW contour (TCW = 0.3 g kg−1). A zoomed in view of the first 3 km of atmosphere has been plotted in panel (b), in which the colors represent the dynamic production of TKE, i.e., the TKE induced by wind shear and friction. The values represent the dynamic production of TKE between 23:45 and 23:50 LT on 3 July.
To further understand the local wind patterns corresponding to the TKE burst induced by urban terrain, we have analyzed the circulation along a second cross section, this time following the direction of the moderate-rainfall system (west to east) and cutting Kolkata perpendicularly (see the dashed lines in Fig. 8a). We have also plotted the TKE anomalies along this new cross section. The TKE anomalies (Fig. 9a) have been calculated at each vertical level by subtracting the spatial mean of the TKE of the level in the Kolkata area from the values of TKE, as follows:
where the last term is equal to the horizontal-mean TKE of level z within the Kolkata area. Therefore, these anomalies provide information on the values of TKE with respect to their horizontal surroundings, and hence on the horizontal propagation of the system.
The analysis confirms that the city acts as a kinetic barrier in the Urban simulation (Fig. 9), forces the surface flow to stop upon arrival in the proximity of Kolkata (delimited by the dashed black lines in Fig. 9), and generates a dynamic production of TKE near the surface (Fig. 9b). This causes the air mass to be lifted, resulting in intense updrafts, eventually leading to the cloud system developing up until about 13 km of altitude. Note that the situation at preceding time steps also shows the same type of circulation pattern, where the city seems to induce a mechanical lifting. As a sharp contrast to the results of the Urban run, the flow remains steady in the No-Urban run, passing through the city. Furthermore, we believe that this barrier effect was enhanced by the geometry of the city. Indeed, Kolkata has an unusually long shape, and the distance from its northern extremity to the southern extremity is about 50 kilometers. Therefore, when the light-rain system propagated towards the city in a direction almost exactly perpendicular to the city, the barrier effect disturbed the surface wind patterns across the whole western boundary of the city, at a distance of several dozens of kilometers. This eventually led to the TKE burst occurring in the proximity of the middle of this western boundary.
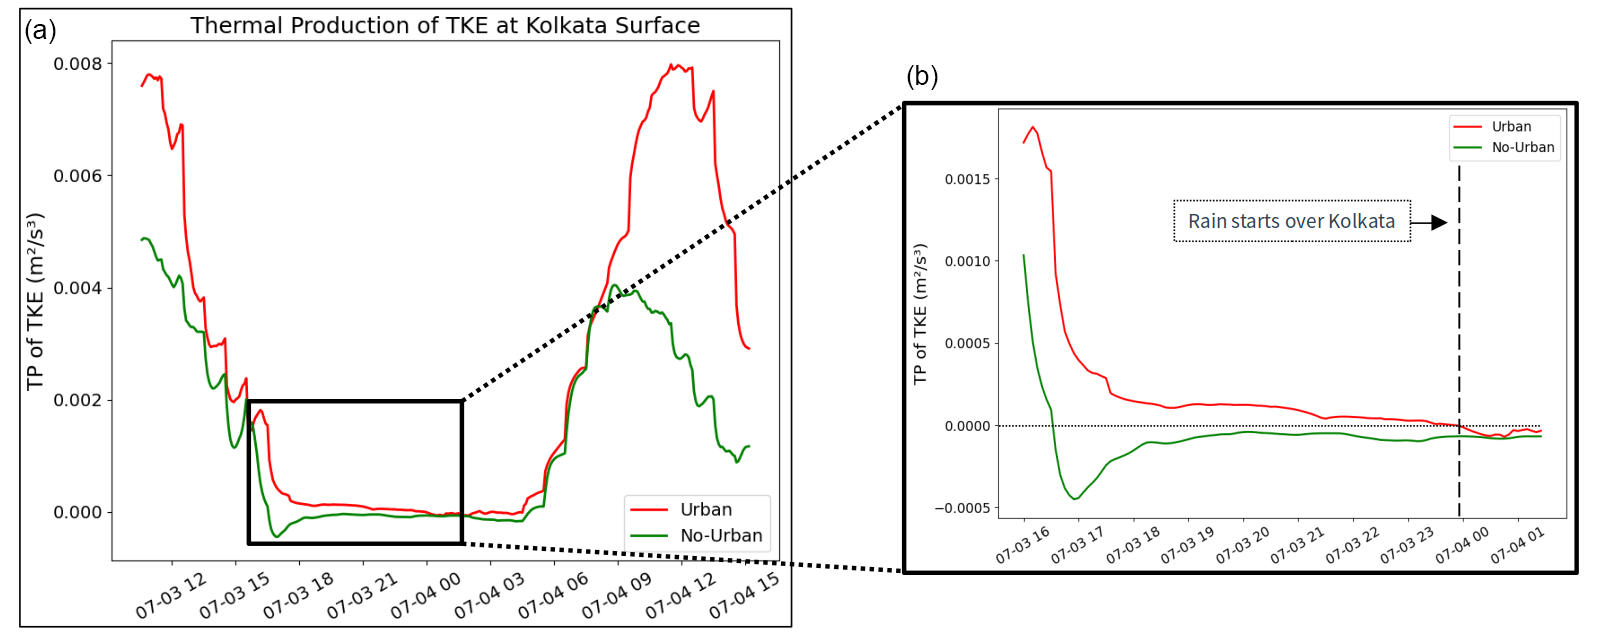
Figure 10Thermal production (TP) of TKE at the surface of Kolkata for the Urban (red) and No-Urban (green) simulations. Panel (b) corresponds to a focus on the night that the storm was initiated above Kolkata. The vertical dashed black line indicates when the rain began over the city.
Although the kinetic barrier effect of the city described here seems to be the direct reason for storm initiation over Kolkata, the thermodynamic effect might have also contributed to the process. As mentioned above, TKE has two distinct potential production sources: dynamic and thermal. While the dynamic contribution can only be positive, meaning that the TKE can only be increased by the turbulent modification of the flow, the thermal contribution can take both positive and negative values. This production term is positive when the buoyancy is positive, i.e., when the thermodynamic conditions allow for turbulent mixing in the atmosphere. It takes negative values, however, when the atmosphere is thermodynamically stable and the buoyancy is negative. Usually, the buoyancy is positive during the day, when the solar heating at the surface generates convection, and becomes negative at night, when the heating stops and the atmosphere stabilizes. However, as discussed in Sect. 3 of this paper, the thermal properties of urban areas create a perturbation in the nighttime stability that could lead to the buoyancy staying positive during the night. As expected, this has been revealed by the thermal production of TKE at the city surface during the whole 28 h derived with frequent outputs (Fig. 10). The thermal production is stronger during the day and is intensified by the UHI effect in the Urban run. However, it is important to note what happens at the end of the day on 3 July. During the few hours preceding storm initiation (from 16:00 LT to midnight), the thermal production of TKE remains positive in the Urban run until the storm starts over Kolkata, thereby keeping the PBL unstable and, thus, benefiting convection development. In the No-Urban run, however, this production becomes negative at around 16:30 LT. This shows that turbulent mixing and convection were still present throughout the night over Kolkata in the Urban run, whereas the atmosphere quickly stabilized in the No-Urban run.
The main reason why instability and convection would contribute to storm development is that, in a humid environment, the low-level humidity would be lifted from the ground to the upper layers of atmosphere, which would enhance the condensation processes at cloud base. To check if this occurs, we have analyzed the vertical profiles of water vapor mixing ratios in the Kolkata area for both simulations (Fig. S4). During the few hours prior to the storm, the humidity amounts between 200 and 400 m of altitude (right above the nocturnal boundary layer) are indeed enhanced in the Urban simulation. This enhanced humidity content could have amplified the condensation process and invigorated the storm.
4.3 Rainfall reduction after the storm
There is a fifth peak in rainfall during the first heavy-rainfall period (1–5 July), which appears to be more intense in the No-Urban run, as indicated by the negative blue peak in Fig. 6b. Just like the first three peaks, this intense rainfall is associated with diurnal convection under favorable synoptic conditions (i.e., a low-pressure system, which will be discussed in the next section). However, the Urban run appears to have induced a rainfall reduction this time, instead of a rainfall enhancement. In order to understand what caused this rainfall reduction with respect to the urban setting, averaged convective available potential energy (CAPE) and precipitable water in the Kolkata area have been derived for the entire first heavy-rainfall period from 1 to 5 July (Fig. 11). CAPE is a measure of the available energy susceptible to being converted into kinetic energy in the clouds in the form of updrafts and is, thus, a good metric of the potential of heavy-rainfall events. Precipitable water, on the other hand, represents the available water in the atmosphere for precipitation. It corresponds to the amount of precipitation that would occur if all of the water vapor in a vertical column was to condense and precipitate and is, therefore, closely linked to the vertically integrated moisture content. The CAPE results suggest that, when the 3 July storm starts to form, the values of averaged CAPE over the Kolkata area are nearly identical in both simulations and that the difference between them is almost zero (first vertical dashed black line in Fig. 11b). However, after the storm passes over Kolkata (the storm time window is delimited by the dashed black lines), CAPE is rather low in the Urban run, as it has been consumed by the nocturnal storm initiated in the city. In contrast, CAPE continues to increase throughout the night in the No-Urban run, as the precipitation remains light in that case, and the energy is, thus, still accumulating. Hence, when the diurnal convective precipitation is initiated the next day after the previous storm, the CAPE is much higher in the No-Urban case than in the Urban case (3288 J kg−1 and 1877 J kg−1, respectively, or 75 % higher in the No-Urban run).
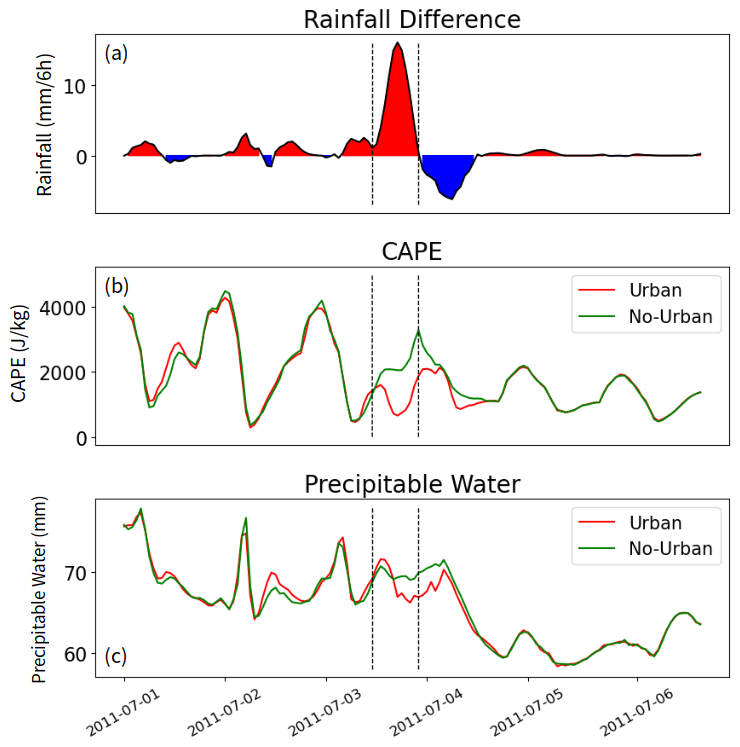
Figure 11Rainfall difference, CAPE, and precipitable water time series. The rainfall difference (Urban – No-Urban) during the first perturbation is plotted in panel (a), while the corresponding CAPE and precipitable water time series, calculated in the Kolkata area, are plotted in panels (b) and (c), respectively. The passing of the storm (initiated in Kolkata) over the area is indicated using vertical dashed black lines.
Regarding the precipitable water, a similar type of behavior is found (Fig. 11c). At the initiation time of the nighttime storm, the amount of precipitable water in the Kolkata area is identical in both simulations. When the storm starts, we see that the precipitable water in the Kolkata area in the Urban run quickly decreases due to water consumption by the storm. As a result, at the end of the storm and when precipitation starts on the fourth simulated day, the precipitable water is evidently lower in the Urban run than the No-Urban run.
Therefore, the significant rainfall reduction after the urbanization-related nocturnal storm is explained by the consumption of CAPE as well as available moisture by the storm. Nevertheless, the overall rainfall difference between the two runs during the first heavy-rainfall period remains in favor of the Urban run.

Figure 12Mean sea level pressure (hPa) during the first (a) and third (b) perturbations, derived from the ERA5 reanalysis dataset. The associated simulated moisture convergence flux in our domain, integrated over the first 3 km of atmosphere, is shown in panel (c). The two perturbations are indicated using vertical dashed black lines.
Our analysis indicates that the first and the third heavy-rainfall periods shown in Fig. 6 are both associated with a synoptic-scale low-pressure system. The low-pressure system corresponding to the first heavy-rainfall period appears to be located in the north of India along the Himalayan foothills (Fig. 12a) and induces persistent precipitation in our domain, with an average rainfall rate of 7.2 mm (6 h)−1. The low-pressure system corresponding to the third period, however, seems to be located in northeastern India, right above our domain (Fig. 12b), producing even more intense overall precipitation of 9.5 mm (6 h)−1 on average between 19 and 22 July. It is the difference in the locations of the associated low-pressure systems that seems to have caused a rainfall difference between the two heavy-rainfall periods.
From 1 to 5 July, the monsoonal winds blow from the Arabian Sea towards what appears to be a trough located in the Himalayan foothills, before arriving in northeastern India. Part of the moisture brought by the northwesterly wind is advected into our domain, and the convective precipitation systems that we simulated during this period propagate southeast. On the other hand, from 19 to 22 July, the low-pressure system is located right over our domain. Most of the moisture is directly advected from the Bay of Bengal, leading to a more intense moisture convergence flux in comparison to the first period (Fig. 12c), creating a more humid condition, and leading to more intense rainfall. For comparison, the average moisture convergence flux (indicated by the dashed black lines in Fig. 12c) is 0.23 for the first period and 0.35 for the third one.
In the 3 d time span of the last heavy-rainfall period, the rain hardly ever stopped in either of the simulations. Under such unstable conditions, it is unlikely that the urban area would specifically induce the formation of storms, as the rain-producing systems are essentially driven and regulated by the low-pressure system. However, during the first period, perhaps due to a relatively weak and distant low-pressure system, the kinetic perturbation and thermodynamically unstable conditions over the urban area could have initiated the storm in the Urban simulation, given the sufficient moisture transport from the northwest of the domain.
Note that, despite the absence of any urbanization-initiated storms in the third heavy-rainfall period, rainfall was still intensified by the urban area. The most notable difference happened during the night of 19 July, between 20:00 LT on 19 July and 08:00 LT on 20 July: the average rain rate was about 8.8 mm (6 h)−1 in the No-Urban run, whereas it was over 13.5 mm (6 h)−1 in the Urban run, corresponding to a 54 % increase caused by urban land use. We find that this increase was preceded by an anomalously high UHI effect, which led to a surge in the surface moist static energy (MSE), a good indicator of the convective activity, particularly of the ISM (Fig. S5), implying that the intense UHI effect likely caused the maximum rainfall enhancement over this heavy-rainfall period. Furthermore, right after the abovementioned rainfall peak, we notice an even more intense positive difference peak (Fig. S5c), immediately followed by a negative difference peak. This is simply an indicator of a phase shift in a rainfall system: both peaks in the Urban and No-Urban run correspond to the same system but were initiated a bit earlier in the former simulation. Overall, the rainfall difference is small for this system.
In this paper, we have assessed the impact of urban land use on precipitation during the ISM in the Kolkata area. By simulating the month of July 2011 with and without urban land use, we find that the overall mean rainfall was increased by over 14 % due to the urban setting in an 80 km × 80 km area surrounding Kolkata. In general, we find that the enhancement introduced by urban LULC effects is consistent during two heavy-rainfall periods corresponding to synoptic low-pressure systems positioned at different locations.
The UHI effect appears as the most consistent perturbation during the whole modeled month. Its close link with the increase in the PBL height suggests that the convection is enhanced by this thermal amplification. While the diurnal convective rainfall (07:00–19:00 LT) enhancement can reach almost 10 % on some days, such as the first 3 modeled days, the overall diurnal rainfall modification is not evident when analyzing the whole month of July 2011. Just like the UHI, the modification of rainfall by the urban area is, however, higher and more persistent during nighttime. In particular, the two most intense rainfall modification cases happened during the night, specifically, the night of 3 July, when the urbanization-initiated storm occurred, and the night of 19 July, during the third heavy-rainfall period, which was preceded by an anomalously high UHI effect. The close relationship between the UHI effect, PBL heights, and rainfall enhancement suggests that thermodynamic effects are the main drivers of rainfall modification on the whole modeled timescale. Our results are in general agreement with several previous studies that also highlighted the importance of the thermodynamic effects of urban land use on heavy rainfall in this region (Li et al., 2017; Swain et al., 2023b).
Nevertheless, our modeling study has also provided additional insights into the urban kinetic effects on monsoon precipitation, revealed using a modeled storm initiation case over the city of Kolkata, where the dynamic production of TKE due to urban terrain played a critical role. In-depth analyses on this storm suggest that the reasons behind this urbanization-initiated storm case include the following:
-
a sufficient large-scale moisture transport from the Arabian Sea all the way through northeastern India;
-
an additional warm and moist surface flow from the Bay of Bengal; and
-
a sudden burst of dynamically produced TKE due to urban terrain at the city border, with a well-prepared unstable nocturnal PBL due to the UHI effect.
Specifically regarding the last point, TKE is greatly enhanced as the surface wind flow decelerates upon arrival at the city, thereby increasing wind shear and turbulence. Deep convection was initiated shortly after that, and the heavy rainfall started at the location of the TKE surge. It was also found that the nighttime urban atmosphere was still positively buoyant, thus contributing to this storm initiation. Additionally, we believe that the geometry of the city and the orientation of the initial rainfall system could have influenced the storm generation. The initial system was propagating perpendicularly to the orientation of the city, meaning that the surface winds decelerated across the whole western border of the city, eventually leading to the TKE burst.
There have been studies showing that thunderstorm formation was more intense around urban areas and that urbanization might have impacts on storm life cycles and intensities. Here, for the first time, we have been able to simulate a case of storm initiation over a city, thereby providing a detailed description of the mechanisms behind this generation. Furthermore, the city-generated storms could be a physical explanation for the observed increase in the frequency of ISM extreme precipitation events during the past century, which had previously been linked to urbanization. Additional work would need to be done in order to assess the dependency of urban storm formation on external factors such as interannual variability or synoptic conditions. Regional climate modeling analyses could also provide confirmation of this hypothesis.
The simulations were performed using the Meso-NH model (version 5.5), which is freely available under the CeCILL-C license agreement at http://mesonh.aero.obs-mip.fr/mesonh55 (Lac et al., 2018).
The IFS data for the month of July 2011 have been provided by the European Centre for Medium-Range Weather Forecasts and are published under a Creative Commons Attribution 4.0 International (CC BY 4.0) license. They can be accessed via https://www.ecmwf.int/en/forecasts/dataset/operational-archive (ECMWF, 2021). The ECOCLIMAP data have been produced by the French National Meteorological Research Center (CNRM) under a CeCILL-C license and are available from https://opensource.umr-cnrm.fr/projects/ecoclimap/wiki (Faroux et al., 2013). The ERA5 reanalysis data used to compare the model results are openly accessible via the Copernicus Climate Data Store: https://doi.org/10.24381/cds.adbb2d47 (Hersbach et al., 2023).
The supplement related to this article is available online at: https://doi.org/10.5194/acp-24-631-2024-supplement.
RF and CW designed the modeling strategy. RF performed and analyzed the simulations. RF and CW wrote the paper.
The contact author has declared that neither of the authors has any competing interests.
Publisher's note: Copernicus Publications remains neutral with regard to jurisdictional claims made in the text, published maps, institutional affiliations, or any other geographical representation in this paper. While Copernicus Publications makes every effort to include appropriate place names, the final responsibility lies with the authors.
This work is a part of the Make Our Planet Great Again project and is funded by the Agence nationale de la recherche (ANR) of France under the Programme d’Investissements d’Avenir (ANR-18-MOPGA-003 EUROACE) and co-funded by the Toulouse III – Paul Sabatier University. We appreciate the computational support provided by the Institute for Development and Resources in Intensive Scientific Computing (IDRIS) and the Grand Équipement National de Calcul Intensif (GENCI) for the numerical simulations in this work. Renaud Falga wishes to thank the Meso-NH team, especially Quentin Rodier for his help with the forcing meteorological data, Juan Escobar for debugging the model and Christelle Barthe for her advice on how to use Meso-NH. The authors are also grateful to Marie Minvielle and Antoine Verrelle for their help using and adapting the ECOCLIMAP data for the purpose of our research. Moreover, we wish to thank Madhusmita Swain and an anonymous reviewer for their insightful comments and suggestions that allowed us to significantly improve the paper.
This research has been supported by the Agence nationale de la recherche (grant no. ANR-18-MPGA003) and co-funded by the Toulouse III – Paul Sabatier University.
This paper was edited by Jianping Huang and reviewed by Madhusmita Swain and one anonymous referee.
Arnfeild, A. J.: Two decades of urban climate research: A review of turbulence, exchanges of energy and water, and the urban heat island, Int. J. Climatol., 23, 1–26, https://doi.org/10.1002/joc.859, 2003.
Baik, J. J., Kim, Y. H., and Chun, H. Y.: Dry and Moist Convection Forced by an Urban Heat Island, J. Appl. Meteorol., 40,1462-1475, https://doi.org/10.1175/1520-0450(2001)040<1462:DAMCFB>2.0.CO;2, 2001.
Bisht, D. S., Chatterjee, C., Raghuwanshi, N. S., and Venkataramana, S.: Spatio-temporal trends of rainfall across Indian river basins, Theor. Appl. Climatol., 132, 419–436, https://doi.org/10.1007/s00704-017-2095-8, 2018.
Bollasina, M. A., Ming, Y., and Ramaswamy, V.: Anthropogenic aerosols and the weakening of the South Asian summer monsoon, Science, 334, 502–505, https://doi.org/10.1126/science.1204994, 2011.
Bornstein, R. and Lin, Q. L.: Urban heat islands and summertime convective thunderstorms in Atlanta: three case studies, Atmos. Environ., 34, 507–516, https://doi.org/10.1016/S1352-2310(99)00374-X, 2000.
Chapman, S., Thatcher, M., Salazar, A., Watson, J. E. M., and McAlpine, C. A.: The effect of urban density and vegetation cover on the heat island of a subtropical city, J. Appl. Meteorol., 2531–2550, https://doi.org/10.1175/JAMC-D-17-0316.1, 2018.
Dash, S. K., Kulkarni, M. A., Mohanty, U. C., and Prasad, K.: Changes in the characteristics of rain events in India, J. Geophys. Res., 114, D10109, https://doi.org/10.1029/2008JD010572, 2009.
Dixon, P. G. and Mote, T. L.: Patterns and causes of Atlanta's urban heat island-initiated precipitation, J. Appl. Meteorol., 1273–1284, https://doi.org/10.1175/1520-0450(2003)042<1273:PACOAU>2.0.CO;2, 2003.
ECMWF: IFS Documentation CY47R3 – Part IV Physical processes, European Center for Medium-Range Weather Forecasts, https://doi.org/10.21957/eyrpir4vj, 2021 (data available at: https://www.ecmwf.int/en/forecasts/dataset/operational-archive, last access: May 2023).
Falga, R. and Wang, C.: The rise of Indian summer monsoon precipitation extremes and its correlation with long-term changes of climate and anthropogenic factors, Sci. Rep.-UK, 12, 11985, https://doi.org/10.1038/s41598-022-16240-0, 2022.
Fan, Y., Li, Y., Bejan, A., Wang, Y., and Yang, X. Y.: Horizontal extent of the urban heat dome flow, Sci. Rep.-UK, 7, 11681, https://doi.org/10.1038/s41598-017-09917-4, 2017.
Faroux, S., Kaptué Tchuenté, A. T., Roujean, J.-L., Masson, V., Martin, E., and Le Moigne, P.: ECOCLIMAP-II/Europe: a twofold database of ecosystems and surface parameters at 1 km resolution based on satellite information for use in land surface, meteorological and climate models, Geosci. Model Dev., 6, 563–582, https://doi.org/10.5194/gmd-6-563-2013, 2013 (data available at: https://opensource.umr-cnrm.fr/projects/ecoclimap/wiki, last access: 15 January 2024).
Goswami, B. N., Venugopal, V., Sengupta, D., Madhusoodanan, M. S., and Xavier, P. K.: Increasing trends of extreme rain events over India in a warming environment, Science, 314, 1442–1445, https://doi.org/10.1126/science.1132027, 2006.
Han, J. Y. and Baik, J. J.: A theoretical and numerical study of urban heat island–induced circulation and convection, J. Atmos. Sci., 65, 1859–1877, https://doi.org/10.1175/2007JAS2326.1, 2008.
Hersbach, H., Bell, B., Berrisford, P., Hirahara, S., Horányi, A., Muñoz-Sabater, J., Nicolas, J., Peubey, C., Radu, R., Schepers, D., Simmons, A., Soci, C., Abdalla, S., Abellan, X., Balsamo, G., Bechtold, P., Biavati, G., Bidlot, J., Bonavita, M., De Chiara, G., Dahlgren, P., Dee, D., Diamantakis, M., Dragani, R., Flemming, J., Forbes, R., Fuentes, M., Geer, A., Haimberger, L., Healy, S., Hogan, R. J., Hólm, E., Janisková, M., Keeley, S., Laloyaux, P., Lopez, P., Lupu, C., Radnoti, G., de Rosnay, P., Rozum, I., Vamborg, F., Villaume, S., and Thépaut, J.-N.: The ERA5 global reanalysis, Q. J. Roy. Meteor. Soc., 146, 1999–2049, https://doi.org/10.1002/qj.3803, 2020.
Hersbach, H., Bell, B., Berrisford, P., Biavati, G., Horányi, A., Muñoz Sabater, J., Nicolas, J., Peubey, C., Radu, R., Rozum, I., Schepers, D., Simmons, A., Soci, C., Dee, D., and Thépaut, J.-N.: ERA5 hourly data on single levels from 1940 to present, Copernicus Climate Change Service (C3S) Climate Data Store (CDS) [data set], https://doi.org/10.24381/cds.adbb2d47, 2023.
Hildebrand, P. H. and Ackerman, B.: Urban effects on the convective boundary layer, J. Atmos. Sci., 42, 76–91, https://doi.org/10.1175/1520-0469(1984)041<0076:UEOTCB>2.0.CO;2, 1984.
Hogan, R. J. and Bozzo, A.: A flexible and efficient radiation scheme for the ECMWF model, J. Adv. Model Earth Sy., 10, 1990–2008, https://doi.org/10.1029/2018MS001364, 2018.
Jin, Q. and Wang, C.: A revival of Indian summer monsoon rainfall since 2002, Nat. Clim. Change, 7, 587–594, https://doi.org/10.1038/nclimate3348, 2017.
Kishtawal, C. M., Niyogi, D., Tewari, M., Pielke, R. A., and Shepherd, J. M.: Urbanization signature in the observed heavy rainfall climatology over India, Int. J. Climatol., 30, 1908–1916, https://doi.org/10.1002/joc.2044, 2010.
Lac, C., Chaboureau, J.-P., Masson, V., Pinty, J.-P., Tulet, P., Escobar, J., Leriche, M., Barthe, C., Aouizerats, B., Augros, C., Aumond, P., Auguste, F., Bechtold, P., Berthet, S., Bielli, S., Bosseur, F., Caumont, O., Cohard, J.-M., Colin, J., Couvreux, F., Cuxart, J., Delautier, G., Dauhut, T., Ducrocq, V., Filippi, J.-B., Gazen, D., Geoffroy, O., Gheusi, F., Honnert, R., Lafore, J.-P., Lebeaupin Brossier, C., Libois, Q., Lunet, T., Mari, C., Maric, T., Mascart, P., Mogé, M., Molinié, G., Nuissier, O., Pantillon, F., Peyrillé, P., Pergaud, J., Perraud, E., Pianezze, J., Redelsperger, J.-L., Ricard, D., Richard, E., Riette, S., Rodier, Q., Schoetter, R., Seyfried, L., Stein, J., Suhre, K., Taufour, M., Thouron, O., Turner, S., Verrelle, A., Vié, B., Visentin, F., Vionnet, V., and Wautelet, P.: Overview of the Meso-NH model version 5.4 and its applications, Geosci. Model Dev., 11, 1929–1969, https://doi.org/10.5194/gmd-11-1929-2018, 2018 (code available at: http://mesonh.aero.obs-mip.fr/mesonh55, last access: May 2023).
Lei, M., Niyogi, D., Kishtawal, C., Pielke Sr., R. A., Beltrán-Przekurat, A., Nobis, T. E., and Vaidya, S. S.: Effect of explicit urban land surface representation on the simulation of the 26 July 2005 heavy rain event over Mumbai, India, Atmos. Chem. Phys., 8, 5975–5995, https://doi.org/10.5194/acp-8-5975-2008, 2008.
Lemonsu, A. and Masson, V.: Simulation of a summer urban breeze over Paris, Bound.-Lay. Meteorol., 104, 463–490, https://doi.org/10.1023/A:1016509614936, 2002.
Li, X., Mitra, C., Dong, L., and Yang, Q. C.: Understanding land use change impacts on microclimate using Weather Research and Forecasting (WRF) model, Phys. Chem. Earth, 103, 115–126, https://doi.org/10.1016/j.pce.2017.01.017, 2017.
Liu, J. and Niyogi, D.: Meta-analysis of urbanization impact on rainfall modification, Sci. Rep.-UK, 9, 7301, https://doi.org/10.1038/s41598-019-42494-2, 2019.
Liu, Y., Huang, J., Wang, T., Li., J., Yan, H., and He, Y.: Aerosol-cloud interactions over the Tibetan Plateau: An overview, Earth Sci. Rev., 234, 104216, https://doi.org/10.1016/j.earscirev.2022.104216, 2022.
Masson, V.: A physically-based scheme for the urban energy balance in atmospheric models, Bound.-Lay. Meteorol., 94, 357–397, https://doi.org/10.1023/A:1002463829265, 2000.
Masson, V., Le Moigne, P., Martin, E., Faroux, S., Alias, A., Alkama, R., Belamari, S., Barbu, A., Boone, A., Bouyssel, F., Brousseau, P., Brun, E., Calvet, J.-C., Carrer, D., Decharme, B., Delire, C., Donier, S., Essaouini, K., Gibelin, A.-L., Giordani, H., Habets, F., Jidane, M., Kerdraon, G., Kourzeneva, E., Lafaysse, M., Lafont, S., Lebeaupin Brossier, C., Lemonsu, A., Mahfouf, J.-F., Marguinaud, P., Mokhtari, M., Morin, S., Pigeon, G., Salgado, R., Seity, Y., Taillefer, F., Tanguy, G., Tulet, P., Vincendon, B., Vionnet, V., and Voldoire, A.: The SURFEXv7.2 land and ocean surface platform for coupled or offline simulation of earth surface variables and fluxes, Geosci. Model Dev., 6, 929–960, https://doi.org/10.5194/gmd-6-929-2013, 2013.
Mitra, C., Shepherd, J. M., and Jordan, T.: On the relationship between the premonsoonal rainfall climatology and urban land cover dynamics in Kolkata city, India, Int. J. Climatol., 32, 1443–1454, https://doi.org/10.1002/joc.2366, 2011.
Mohajerani, A., Bakaric, J., and Jeffrey-Bailey, T.: The urban heat island effect, its causes, and mitigation, with reference to the thermal properties of asphalt concrete, J. Environ. Manage., 197, 522–538, https://doi.org/10.1016/j.jenvman.2017.03.095, 2017.
Nakamura, Y. and Oke, T. R.: Wind, temperature and stability conditions in an east-west oriented urban canyon, Atmos. Environ., 22, 2691–2700, https://doi.org/10.1016/0004-6981(88)90437-4, 1988.
Niyogi, D., Pyle, P., Lei, M., Pal Arya, S., Kishtawal, C. M., Shepherd, M., Chen, F., and Wolfe, B.: Urban modification of thunderstorms: an observational storm climatology and model case study for the Indianapolis urban region, J. Appl. Meteorol. Clim., 50, 1129–1144, https://doi.org/10.1175/2010JAMC1836.1, 2011.
Niyogi, D., Subramanian, S., Mohanty, U. C., Kishtawal, C. M., Ghosh, S., Nair, U. S., Ek, M., and Rajeevan, M.: The impact of land cover and land use change on the Indian monsoon region hydroclimate, Land-Atmospheric Research Applications in South and Southeast Asia, 553–575, https://doi.org/10.1007/978-3-319-67474-2_25, 2018.
Oke, T. R.: The energetic basis of the urban heat island, Q. J. Roy. Meteor. Soc., 108, 1–24, https://doi.org/10.1002/qj.49710845502, 1982.
Pergaud, J., Masson, V., Malardel, S., and Couvreux, F.: A Parameterization of dry thermals and shallow cumuli for mesoscale numerical weather prediction, Bound.-Lay. Meteorol., 132, 83–106, https://doi.org/10.1007/s10546-009-9388-0, 2009.
Pigeon, G., Moscicki, M. A., Voogt, J. A., and Masson, V.: Simulation of fall and winter surface energy balance over a dense urban area using the TEB scheme, Meteorol. Atmos. Phys., 102, 159–171, https://doi.org/10.1007/s00703-008-0320-9, 2008.
Qian, Y., Chakraborty, T. C., Li, J. F., Li, D., He, C. L., Sarangi, C., Chen, F., Yang, X. C., and Leung, L. R.: Urbanization impact on regional climate and extreme weather: current Understanding, uncertainties, and future research directions, Adv. Atmos. Sci., 39, 819–860, https://doi.org/10.1007/s00376-021-1371-9, 2022.
Roxy, M. K., Ghosh, S., Pathak, A., Athulya, R., Mujumdar, M., Murtugudde, R., Terray, P., and Rajeevan, M.: A threefold rise in widespread extreme rain events over central India, Nat. Commun., 8, 708, https://doi.org/10.1038/s41467-017-00744-9, 2017.
Shastri, H., Paul, S., and Ghosh, S.: Impacts of urbanization on Indian summer monsoon rainfall extremes, J. Geophys. Res., 120, 496–516, https://doi.org/10.1002/2014JD022061, 2015.
Sheehan, P. M. F., Matthews, A. J., Webber, B. G. M., Sanchez-Franks, A., Klingaman, N. P., and Vinayachandran, P. N.: On the Influence of the Bay of Bengal's Sea Surface Temperature Gradients on Rainfall of the South Asian Monsoon, J. Climate, 36, 6499–6513, https://doi.org/10.1175/JCLI-D-22-0288.1, 2023.
Shem, W. and Shepherd, M.: On the impact of urbanization on summertime thunderstorms in Atlanta: Two numerical model case studies, Atmos. Res., 92, 172–189, https://doi.org/10.1016/j.atmosres.2008.09.013, 2009.
Shepherd, J. M.: Impacts of urbanization on precipitation and storms: physical insights and vulnerabilities, in: Climate Vulnerability: understanding and addressing threats to essential resources, Elsevier, 109–115, https://doi.org/10.1016/B978-0-12-384703-4.00503-7, 2013. .
Swain, M., Nadimpalli, R., Mohanty, U. C., Guhathakurta, P., Gupta, A., Kaginalkar, A., Chen, F., and Niyogi, D.: Delay in timing and spatial reorganization of rainfall due to urbanization-analysis over India's smart city Bhubaneswar, Comp. Urban Sci., 3, 8, https://doi.org/10.1007/s43762-023-00081-2, 2023a.
Swain, M., Nadimpalli, R., Das, A. K., Mohanty, U. C., and Niyogi, D.: Urban modification of heavy rainfall: a model case study for Bhubaneswar urban region, Comp. Urban Sci., 3, 2, https://doi.org/10.1007/s43762-023-00080-3, 2023b.
Taha, H.: Urban climates and heat islands: albedo, evapotranspiration, and anthropogenic heat, Energ. Buildings, 25, 99–103, https://doi.org/10.1016/S0378-7788(96)00999-1, 1997.
Tian, H., Banger, K., Tao, B., and Dadhwal, V. K.: History of land use in India during 1880–2010: Large-scale land transformation reconstructed from satellite data and historical achieves, Glob. Planet. Change, 121, 76–88, https://doi.org/10.1016/j.gloplacha.2014.07.005, 2014.
Twomey, S.: The influence of pollution on the shortwave albedo of clouds, J. Atmos. Sci., 34, 1149–1152, https://doi.org/10.1175/1520-0469(1977)034<1149:TIOPOT>2.0.CO;2, 1977.
Van Den Heever, S. and Cotton, W. R.: Urban Aerosol Impacts on Downwind Convective Storms, J. Appl. Meteorol. Clim., 46, 828–850, https://doi.org/10.1175/JAM2492.1, 2007.
Vié, B., Pinty, J.-P., Berthet, S., and Leriche, M.: LIMA (v1.0): A quasi two-moment microphysical scheme driven by a multimodal population of cloud condensation and ice freezing nuclei, Geosci. Model Dev., 9, 567–586, https://doi.org/10.5194/gmd-9-567-2016, 2016.
Vittal, H., Karmakar, S., and Ghosh, S.: Diametric changes in trends and patterns of extreme rainfall over India from pre-1950 to post-1950, Geophys. Res. Lett., 40, 1–6, https://doi.org/10.1002/grl.50631, 2013.
Wang, C., Kim, D., Ekman, A. M. L., Barth, M. C., and Rasch, P. J.: Impact of anthropogenic aerosols on Indian summer monsoon, Geophys. Res. Lett., 36, https://doi.org/10.1029/2009GL040114, 2009.
Weisman, M. L. and Klemp, J. B.: The dependence of numerically simulated convective storms on vertical wind shear and buoyancy, Mon. Weather Rev., 110, 504–520, https://doi.org/10.1175/1520-0493(1982)110<0504:TDONSC>2.0.CO;2, 1982.
Yu, H., Kaufman, Y. J., Chin, M., Feingold, G., Remer, L. A., Anderson, T. L., Balkanski, Y., Bellouin, N., Boucher, O., Christopher, S., DeCola, P., Kahn, R., Koch, D., Loeb, N., Reddy, M. S., Schulz, M., Takemura, T., and Zhou, M.: A review of measurement-based assessments of the aerosol direct radiative effect and forcing, Atmos. Chem. Phys., 6, 613–666, https://doi.org/10.5194/acp-6-613-2006, 2006.
- Abstract
- Introduction
- Model setup and data
- Urban impacts on monthly meteorological features
- The in-depth analysis of an urbanization-initiated heavy-rainfall event
- Discussion on the potential influence of the synoptic-scale conditions
- Summary
- Code availability
- Data availability
- Author contributions
- Competing interests
- Disclaimer
- Acknowledgements
- Financial support
- Review statement
- References
- Supplement