the Creative Commons Attribution 4.0 License.
the Creative Commons Attribution 4.0 License.
 | 07 May 2024
Droplet collection efficiencies inferred from satellite retrievals constrain effective radiative forcing of aerosol–cloud interactions
Charlotte M. Beall
Po-Lun Ma
Matthew W. Christensen
Johannes Mülmenstädt
Adam Varble
Kentaroh Suzuki
Takuro Michibata
Process-oriented observational constraints for the anthropogenic effective radiative forcing due to aerosol–cloud interactions (ERFaci) are highly desirable because the uncertainty associated with ERFaci poses a significant challenge to climate prediction. The contoured frequency by optical depth diagram (CFODD) analysis supports the evaluation of model representation of cloud liquid-to-rain conversion processes because the slope of a CFODD, generated from joint MODerate Resolution Imaging Spectroradiometer (MODIS)-CloudSat cloud retrievals, provides an estimate of cloud droplet collection efficiency in single-layer warm liquid clouds. Here, we present an updated CFODD analysis as an observational constraint on the ERFaci due to warm rain processes and apply it to the U.S. Department of Energy's Energy Exascale Earth System Model version 2 (E3SMv2). A series of sensitivity experiments shows that E3SMv2 droplet collection efficiencies and ERFaci are highly sensitive to autoconversion, i.e., the rate of mass transfer from cloud liquid to rain, yielding a strong correlation between the CFODD slope and the shortwave component of ERFaci (ERFaciSW; Pearson's ). E3SMv2's CFODD slope (0.20 ± 0.04) is in agreement with observations (0.20 ± 0.03). The strong sensitivity of ERFaciSW to the CFODD slope provides a useful constraint on highly uncertain warm rain processes, whereby ERFaciSW, constrained by MODIS-CloudSat, is estimated by calculating the intercept of the linear association between the ERFaciSW and the CFODD slopes, using the MODIS-CloudSat CFODD slope as a reference.
- Article
(4026 KB) - Full-text XML
-
Supplement
(2584 KB) - BibTeX
- EndNote


Single-layer, low marine warm clouds cover 25 % of the ocean surface (Charlson et al., 1987) and exert a strong cooling effect on climate due to their reflectivity (Hartmann et al., 1992; Hartmann and Short, 1980; Ramanathan et al., 1989). Aerosols modulate multiple radiative properties of low-level warm clouds, including droplet number concentration (Nd), liquid water path (LWP), geometric, cloud fraction, and lifetime, and their net impact on the cloud radiative forcing is the most uncertain component of the climate system (e.g., Stevens and Feingold, 2009; Christensen et al., 2020; Glassmeier et al., 2021). Though aerosols also exert a significant influence on ice and mixed-phase clouds, aerosol–cloud interactions (ACIs) make their largest contribution to global radiative forcing via liquid water clouds (Bellouin et al., 2020).
In marine warm cloud regimes, an increase in aerosol concentrations typically leads to increasing Nd. Given constant condensed water content, enhanced aerosol concentrations increase cloud albedo due to higher concentrations of smaller cloud droplets through the so-called “Twomey effect” (Twomey, 1974). However, the cooling effect of increased Nd can be offset or enhanced by competing aerosol-mediated cloud properties such as cloud fraction and LWP. For example, increased numbers of smaller droplets can diminish cloud fraction by reducing cloud droplet sedimentation (Bretherton et al., 2007) and increasing cloud-top evaporation and dry air entrainment (Wang et al., 2003). On the other hand, aerosols can also increase cloud fraction and vertical extent by suppressing precipitation (Albrecht, 1989; Pincus and Baker, 1994). Christensen et al. (2020) demonstrated that the impact of aerosol on low-level cloud areal coverage depends on the stability of the atmosphere: in thermodynamically stable lower tropospheric conditions, increased aerosol results in increased cloud fraction, lifetime, and Nd, whereas in unstable conditions, entrainment and evaporation offset Twomey effects, resulting in relatively smaller changes to cloud radiative properties.
Earth system models (ESMs) are relied upon for estimating the global effective radiative forcing of aerosol–cloud interactions (ERFaci) due to the dearth of observations from the pre-industrial era. ESM estimates are challenged, however, by the lack of observational constraints on ERFaci and the cloud processes that modulate ERFaci, which must be parameterized due to the computational expense of explicitly resolving them. Mülmenstädt et al. (2020) proposed a renewed focus on process-oriented observational constraints as a solution to “equifinality”, whereby differing representations of cloud processes can reproduce observed state variables such as LWP and cloud fraction. The problem of equifinality renders many global long-term observations of state variables useless for constraining ERFaci on their own. Mülmenstädt et al. (2020) argue that constraints based on cloud process observations are thus highly desirable as an alternative approach to state-variable-based constraints because mitigating bias in a cloud process representation will improve estimates of the response of the process to aerosols. Process-oriented constraints on ERFaci are useful for quantifying the sensitivity of ERFaci to a specific process or constraining the component of ERFaci that is affected by a process, rather than for constraining ERFaci overall (Mülmenstädt and Feingold, 2018). Recent examples of process-based diagnostics include the Earth System Model Aerosol-Cloud Diagnostics Package (ESMAC Diags) (Tang et al., 2022, 2023), which supports the evaluation of aerosol activation processes, and Varble et al. (2023), who demonstrated multiple model–observation comparison approaches that target processes affecting cloud albedo susceptibility using geostationary satellite data and surface-based observations. Christensen et al. (2023) applied ground-based measurements, satellite retrievals, and meteorological reanalysis products in a Lagrangian framework to evaluate multiple aerosol–cloud processes in E3SM, including cloud condensation nuclei deposition via precipitation and the temporal response in Nd to aerosol perturbations.
In response to the demand for process-oriented constraints on warm liquid cloud processes, we present a constraint on the shortwave component of ERFaci (ERFaciSW) due to autoconversion, a parameterization representing the transfer of liquid mass and number from the cloud to rain category, based on satellite cloud retrievals. For the past 12 years, prior studies have applied the contoured frequency by optical depth diagram (CFODD) analysis (Nakajima et al., 2010; Suzuki et al., 2010) to evaluate model representation of warm rain processes because the slopes of CFODDs, generated from spaceborne radar reflectivity profiles (CloudSat) (e.g., Marchand et al., 2008) and cloud property retrievals from the Moderate Resolution Imaging Spectroradiometer (MODIS) (e.g., Platnick et al., 2017), provide an estimate of cloud droplet collection efficiency in warm liquid clouds (Suzuki et al., 2010). Here, we demonstrate how an updated CFODD analysis can be applied to constrain ERFaci due to autoconversion using the U.S. Department of Energy's Energy Exascale Earth System Model version 2 (E3SMv2) and the relationship between CFODD slopes and ERFaciSW in single-layer warm liquid clouds (SLWCs).
To support the application of CFODD analysis as a constraint on ERFaciSW, we modified the warm rain diagnostics (WRDs) subroutine (Michibata et al., 2019a) that was recently implemented in the Cloud Feedback Model Intercomparison Project (CFMIP) Observations Simulator Package (COSPv2.0), a software package that supports climate model evaluation against satellite observations (Michibata et al., 2019b; Swales et al., 2018). The WRDs support evaluation of model warm rain processes in single-layer warm liquid clouds (SLWCs) based on joint statistics from MODIS and CloudSat. The first diagnostic provides the fractional occurrence of SLWCs, classified as non-precipitating, drizzling, or raining clouds based on CloudSat column maximum radar reflectivity. The second diagnostic is the CFODD, which is the probability density function (PDF) of radar reflectivity as a function of in-cloud optical depth (ICOD), where ICOD is the optical depth integrated from the cloud top downward to each vertical layer and represents an in-cloud vertical coordinate (Nakajima et al., 2010; Suzuki et al., 2010). The CFODD shows how vertical cloud microphysical structures transition from non-precipitating to precipitating as a function of cloud-top effective radius (Re), and the slope of reflectivity change with ICOD provides an estimate of droplet collection efficiency factor (Suzuki et al., 2010). Previous studies have used CFODDs to demonstrate that pollution decreases droplet collection efficiency, suppressing rainfall near the cloud base (Mangla et al., 2020; Michibata et al., 2014; Suzuki et al., 2013), and to evaluate model cloud liquid-to-rain conversion processes against satellite observations (Suzuki et al., 2015; Jing et al., 2019; Michibata and Suzuki, 2020). Takahashi et al. (2021) proposed an updated CFODD analysis in which Re thresholds are defined by quartile distributions of SLWC samples rather than the traditional CFODD Re thresholds to focus evaluation on warm rain process representation rather than the bias in Re distribution. Modifications to the WRDs in the present study include additional diagnostics that provide SLWC sampling statistics to illuminate how sample size affects CFODD results, the implementation of a CloudSat ground-clutter mask in the simulated WRDs, and updates to SLWC selection criteria for better consistency between observations and satellite simulators. The updated CFODD analysis is demonstrated here as a constraint on the component of ERFaciSW that is affected by droplet collection efficiency due to autoconversion.
The WRDs and their implementation in COSPv2.0 were described in Michibata et al. (2019b). The WRDs are designed to run online with the host model, accumulating time step statistics for warm rain cloud processes for subcolumns to mitigate the risk of data-processing bottlenecks associated with outputting large data volumes. COSPv2.0 generates ensembles of stochastic subcolumns from model grid box mean variables to emulate model subgrid variability and to resolve discrepancies in spatial resolution between observations and the model grid (Swales et al., 2018).
To generate observational reference data for model evaluation, Michibata et al. (2019b) used the MODIS and CloudSat products 2B-TAU R04 (Polonsky, 2008) and 2B-GEOPROF R04 (Mace et al., 2007; Marchand et al., 2008), respectively, for SLWC detection between June 2006 and April 2011. The SLWC detection is described in Supplement Table S1 and includes CloudSat reflectivity dBZ, MODIS liquid cloud optical thickness (COT) > 0.3, and cloud top temperature ≥ 273 K. Model-simulated SLWCs are detected using COSPv2.0-simulated CloudSat reflectivity and multiple MODIS cloud properties, including ice water path (IWP), liquid water path (LWP), cloud-top effective radius (Re), and cloud optical thickness (COT) (Table S1). For the SLWC fractional occurrence (frequency) diagnostic, SLWCs are binned by precipitation intensity according to the maximum column CloudSat reflectivity (Zmax), where non-precipitating, drizzling, and raining SLWCs correspond to dBZe, −15 dBZ dBZe, and Zmax≥0 dBZe, respectively. The SLWC fractional occurrence diagnostic features the frequency of each precipitation type relative to the total SLWC population.
To support the evaluation of liquid cloud collection efficiencies and cloud to rain transition processes, CFODDs are constructed from the PDFs of CloudSat reflectivity profiles binned by ICOD. ICOD (τd) is parameterized as a function of MODIS COT (τc) by invoking the adiabatic condensation growth model to vertically slice the column COT into each layer (Suzuki et al., 2010). The relationship between τd and τc is as follows:
where h is height and H is the geometric height of the cloud. The detailed derivation of the ICOD coordinate is provided in Suzuki et al. (2010). The slope of the resulting 2D-PDF diagnostic is modulated by droplet collection efficiency, with a steeper slope implying higher efficiency. The CFODD shows where (with ICOD on the y axis as a vertical coordinate) the droplet collection efficiency increases and the transition from non-precipitating to drizzling and raining occurs using the radar reflectivity as a proxy for the precipitation rate as described above (e.g., Muhlbauer et al., 2014). CFODDs are also typically binned by Re to reveal how droplet collection efficiency changes with droplet size (Suzuki et al., 2010; Takahashi et al., 2021; Jing et al., 2017).
In this study, CFODD slopes are estimated using RANdom SAmple Consensus (RANSAC) robust linear regression (Fischler et al., 1987). RANSAC was chosen for performing linear regression due to the right-skewed distribution of CFODD data sets. The regression was applied to the MODIS-CloudSat profiles and E3SMv2 output at 4 ≤ ICOD ≤ 20 and Z<20 dBZ. For E3SMv2 output, the regression was applied to approximated source CloudSat reflectivity and ICOD data estimated from time-mean CFODD frequencies. The reflectivity and ICOD thresholds were chosen to reduce the effect of the Mie scattering regime where the radar reflectivity can be saturated and to restrict analysis to profiles where the uncertainty of MODIS COT retrievals is lower as error can be higher in optically thin liquid clouds (e.g., COT < 4) (Platnick et al., 2017). The uncertainty in the RANSAC slope calculation is estimated by “bootstrapping” (i.e., repeatedly performing RANSAC regressions on 1 000 random subsamples of 80 %) the CFODD data set to generate a distribution of slope estimates. The 1σ error and 95 % confidence intervals were calculated from this distribution. The residual threshold applied for RANSAC outlier detection was 0.1 and 0.5 times the median absolute error (MAE) for MODIS-CloudSat and E3SMv2, respectively. Data points with MAE exceeding the residual threshold are excluded from the linear regression in RANSAC.
2.1 E3SMv2
Several updates to the WRDs are described in Sect. 2.2, the impacts of which are demonstrated through an application of the updated WRDs to the U.S. Department of Energy's Energy Exascale Earth System Model v2 (E3SMv2). The atmosphere component of the model, E3SM Atmosphere Model v2 (EAMv2), is described in detail in Golaz et al. (2022b). Like its predecessor EAMv1, EAMv2 predicts stratiform and shallow cumulus cloud macrophysics through the Cloud Layers Unified by Binormals (CLUBB) parameterization, which unifies the treatment of planetary boundary layer turbulence, shallow convection, and cloud macrophysics through a higher-order turbulence closure scheme (Bogenschutz et al., 2013; Golaz et al., 2002b; Larson, 2017; Larson and Golaz, 2005). CLUBB diagnoses cloud fraction and cloud liquid water from a joint double-Gaussian PDF. Ice and liquid cloud fractions in CLUBB are analytically diagnosed by integrating saturated proportions of the joint PDF (Guo et al., 2015).
Cloud microphysics is represented with the “Morrison and Gettelman version 2” (MG2) scheme (Gettelman and Morrison, 2015). MG2 prognoses the mass mixing ratios and number concentrations of cloud liquid, ice, and precipitation hydrometeors. The coupled MG2 cloud microphysics and CLUBB higher-order turbulence parametrization explicitly provides values for hydrometer mass and number mixing ratios as well as cloud fraction. Deep convection is represented by the Zhang and McFarlane (1995) (ZM) scheme. As convective cloud fraction is not parameterized in the mass-flux-based ZM scheme, it is diagnosed from the cloud mass flux for cloud radiation calculation (Hack et al., 1993). The total cloud fraction in EAMv2 combines CLUBB, deep convective cloud fractions, and ice cloud fraction following Park et al. (2014). The four-mode version of the Modal Aerosol Module (MAM4) is used to predict aerosol properties and processes (Liu et al., 2012, 2016; Wang et al., 2020).
EAMv2 runs on 72 vertical atmospheric levels with a top level at 0.1 hPa (Rasch et al., 2019; Xie et al., 2018). However, distinct from its predecessor EAMv1, EAMv2 has two separate parameterized physics and dynamics grids (Hannah et al., 2021), with average horizontal grid spacings of ∼ 165 km and ∼ 110 km, respectively.
A 6-year E3SMv2 simulation with transient, present-day forcing was run between 2006 and 2011 with online COSPv2.0 for comparison with A-Train observations of SLWCs, allowing 1 additional year (2005) for model spin-up. To facilitate comparison with observations, large-scale winds were constrained via the “nudging” technique (Lin et al., 2016; Ma et al., 2014; Zhang et al., 2014), in which horizontal and vertical winds are relaxed toward the Modern Era-Retrospective Analysis for Research and Applications, Version 2 (MERRA2) reanalysis data (Gelaro et al., 2017) with a 6 h timescale. MERRA2 data are read every 3 h and linearly interpolated to model times. COSPv2.0 is called at every time step (0.5 h) and run with 10 subcolumns. We observed little change in CFODD results for increased numbers of subcolumns of 20 to 50.
2.2 COSPv2.0
Cloud-observing instrument simulators support the evaluation of model cloud representation by translating grid box mean model variables (e.g., cloud fraction, hydrometeor mass mixing ratio, precipitation) into quantities that are measured by a cloud sensor (e.g., reflectivity). COSPv2.0 includes multiple cloud-observing satellite simulators and has been used extensively to diagnose issues in model cloud representation (Cesana and Chepfer, 2012; Kay et al., 2016; Song et al., 2018a; Zhang et al., 2010). Recently, Zhang et al. (2022) used the COSPv2.0 CALIPSO simulator to demonstrate that changes to the Wegener–Bergeron–Findeisen process in EAMv2 decreased an ice cloud fraction low bias in the Arctic compared to EAMv1 but did not correct excesses of supercooled liquid.
There are known limitations to COSPv2.0 that affect its application to E3SM for cloud representation evaluation. The subgrid distribution of cloud variables generated by COSPv2.0 does not match E3SM subgrid variability. Hydrometeor species are distributed homogeneously across the subcolumns generated by COSPv2.0 via the subcolumn generator, Subgrid Cloud Overlap Profile Sampler (SCOPS) (Klein and Jakob, 1999), such that the ensemble of subcolumns reproduces the grid box cloud fraction but not the subgrid distribution of liquid and ice within the simulated clouds (Dewald, 2021). Song et al. (2018b) demonstrated that the default “homogeneous hydrometeor scheme” from SCOPS results in the overestimation of radar reflectivity in warm liquid clouds, thus resulting in the overestimation of precipitating clouds since maximum column reflectivity is often used to distinguish precipitating clouds (as in the WRDs). Errors in simulated satellite retrievals have also been attributed to SCOPS overlap assumptions (Hillman et al., 2018). Such a bias from SCOPS can result in the unfair observational evaluation of a host model such as E3SMv2. Inconsistencies in microphysical assumptions between the host model and COSP pose another challenge. While many microphysical assumptions in COSPv2.0 can be configured for agreement with E3SMv2 microphysics (MG2), some inconsistencies remain, including gamma distribution shape parameters for hydrometeor size distributions and hydrometeor vertical overlap assumptions (Wang et al., 2021). Next-generation E3SM development includes efforts to improve agreement in the subgrid variability and microphysical assumptions involved in forward-simulating satellite retrievals. Other issues include the simplified treatment of satellite cloud detection in simulators. For example, the CloudSat cloud profiling radar (CPR) cloud mask value threshold ≥ 30 is applied for cloud detection in the WRDs' A-Train analysis to indicate “good” or “strong” echo with high confidence detection (see next section and Supplement Table S1). The CPR cloud mask confidence levels consider signal-to-noise ratios, horizontal averaging, and spatial continuity (Marchand et al., 2008), but as this cloud mask is not available in COSPv2.0, CloudSat cloud detection is simulated by applying a reflectivity threshold of dBZ.
The WRDs rely on COSPv2.0-simulated MODIS and CloudSat retrievals. The WRDs in COSPv2.0 work as follows: first, COSPv2.0 takes in model atmospheric state and cloud variables, including temperature, pressure, water vapor, and hydrometeor mass mixing ratios; hydrometeor Re; large-scale stratiform cloud fraction; convective cloud fraction; and precipitation rate. The COSPv2.0 subcolumn generator SCOPS then produces subgrid distributions of clouds and precipitation for better comparison with smaller-scale satellite pixel measurements. SCOPS subcolumns are homogenous, discrete samples generated such that a sufficiently large ensemble reproduces the model column profile of bulk cloud properties (Webb et al., 2001; Swales et al., 2018). SCOPS assigns each subcolumn a type (large-scale stratiform, convective, or clear-sky) according to the host model's convective and large-scale stratiform cloud fraction. Cloud properties such as hydrometeor mass mixing ratios and Re are distributed homogeneously across the subcolumns by cloud type (i.e., all stratiform cloud subcolumns are assigned the same stratiform ice and liquid mixing ratios as SCOPS only takes total convective and stratiform cloud fraction as input and does not consider stratiform liquid and ice cloud fraction in its default configuration). “Maximum-random” cloud overlap is applied to subcolumns, consistent with the model parameterizations. The MODIS and CloudSat simulators apply simplified versions of their respective retrieval algorithms to each subcolumn, emulating MODIS retrievals of cloud properties, radar reflectivity, and lidar backscatter, respectively. Grid box mean values are estimated from accumulated subcolumn statistics. The WRDs take as inputs the MODIS retrievals of LWP, IWP, COT, and Re, as well as subgrid CloudSat reflectivity profiles, simulated by the grid box mean. The simulated MODIS COT represents in-cloud mean, as do the other MODIS variables used in the WRDs (e.g., LWP, Re). For example, the MODIS liquid COT is computed by averaging the MODIS liquid COT in cloudy subcolumns across the grid box. In E3SMv2-COSP, the same in-cloud stratiform COT value from the E3SMv2 radiative transfer module is distributed across all the subcolumns designated as stratiform cloud by SCOPS, as described above. These values and cloud/clear-sky designations for each subcolumn are used as input to the MODIS simulator to calculate the in-cloud MODIS liquid COT. Subcolumn-level SLWC reflectivity profiles are used as input to the WRDs, also with cloud properties homogenously distributed across the subcolumns of a given classification. Thus, in E3SM-COSP, the SLWC samples within a grid box that have the same subcolumn classification (i.e., stratiform liquid or stratiform rain) will have the same simulated MODIS COT and CloudSat reflectivity profile.
Deviations from the original WRDs implemented in COSPv2.0 (Michibata et al., 2019b) include the application of the simulated CloudSat ground-clutter filter (available in COSPv2.0 but not applied to the WRDs previously) for better comparison with CloudSat retrievals and the elimination of the “fracout” input used in the SLWC detection scheme from SCOPS. Fracout is the subcolumn-level cloud classification by vertical level from SCOPS, where each level of each subcolumn is designated as large-scale stratiform, convective, or clear-sky. This input was removed from the WRDs' SLWC detection algorithm because of the lack of comparable cloud-type designation in the observations and CloudSat simulator and because fracout vertical cloud profiles were observed to deviate significantly from CloudSat reflectivity profiles (i.e., fracout indicates clear-sky where CloudSat reflectivity indicates cloud, or vice versa).
2.3 Satellite data
The MOD06-1KM-AUX R05 product (Platnick et al., 2017), which provides MODIS Collection 6 retrievals at 1 km resolution along the CloudSat footprint, supplied the six MODIS cloud retrievals required for the SLWC detection described in Suzuki et al. (2010): LWP, IWP, Re, COT, cloud top pressure, and cloud layer number. Standard MODIS products from the 2.1 µm channel were used for Re, consistent with the simulated MODIS Re used in the WRDs. Atmospheric temperature profiles were obtained from ECMWF-AUX R05 (Partain and Cronk, 2017), which includes temperature profiles from the European Centre for Medium-Range Weather Forecasts (ECMWF) model (Dee et al., 2011) interpolated to the CloudSat footprint. 2B-GEOPROF R05 provided the CloudSat reflectivity profiles, the cloud profiling radar (CPR) cloud mask and echo top characterization at 1.8 km resolution (Marchand et al., 2008). The detection of SLWCs and CFODD analysis in the present study follows Suzuki et al. (2010) (see Supplement Table S1 for details) with one exception: a COT threshold was decreased from 15 to 0.3. This had a substantial impact on cloud occurrence (Fig. 1; described next) and is consistent with the COT threshold implemented in the COSPv2.0 WRDs. The decreased COT threshold also increases the weight of optically thin SLWCs, as the linear regression is applied to the CFODD source data directly (i.e., the ICOD and reflectivity profiles).
2.4 Autoconversion sensitivity experiments and ERFaci
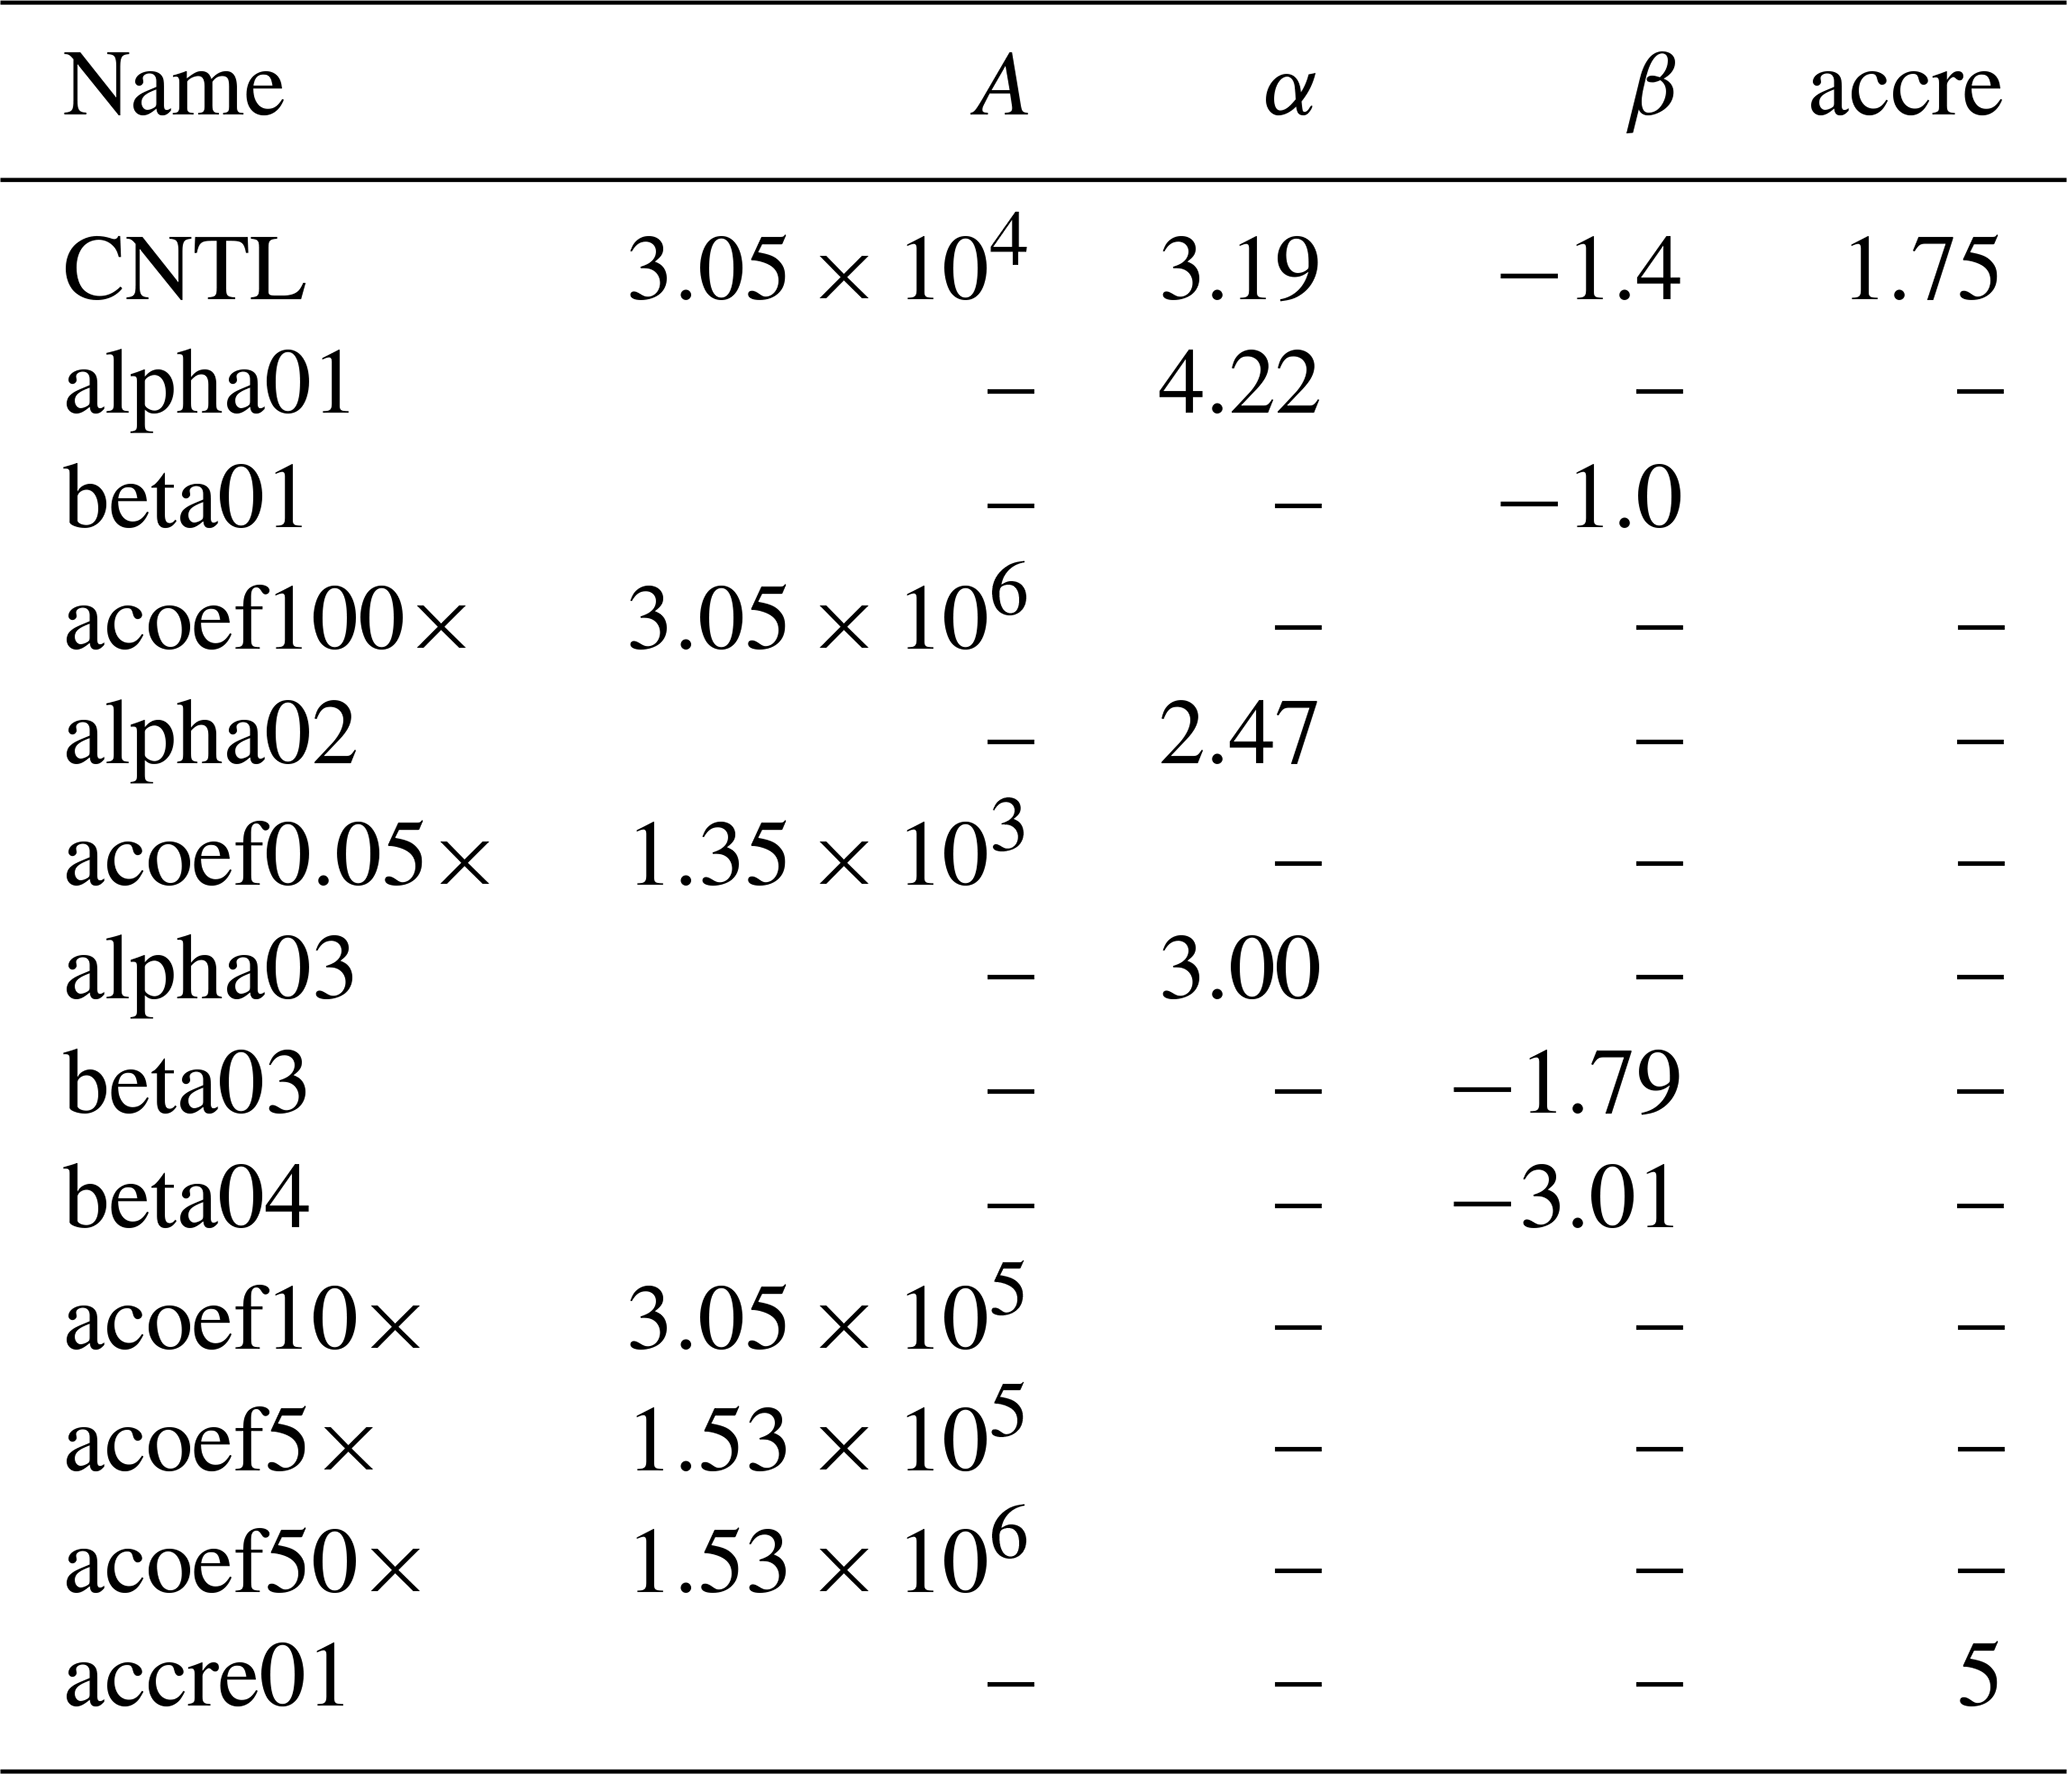
The autoconversion parameterization in E3SMv2 is a modified Khairoutdinov and Kogan (2000) scheme (hereafter KK2000) in which coefficients were updated in response to large uncertainties in different cloud regimes and to improve fidelity in climate simulations. The KK2000 autoconversion scheme is , where qr is the rainwater mixing ratio, Qc is the cloud water mixing ratio; Nd is the cloud droplet number concentration; and A, α, and β are the modified coefficients.
To develop a constraint on the ERFaci due to autoconversion, we performed multiple pairs of simulations featuring pre-industrial (PI) and present-day (PD) aerosol emissions. In each pair of simulations, one of the three coefficients (A, α, or β) was modified to its KK2000 value, a value reported by Wood (2005), a value from Kogan (2013), or a value within a range bounded by the three studies. The Kogan (2013) coefficient values were derived from a large-eddy simulation (LES) with bin-resolved microphysics for cumulus clouds, whereas the focus of Wood (2005) and KK2000 was stratocumulus clouds from observational and LES perspectives, respectively. One additional experiment on the KK2000 parameterization for the accretion rate was performed, the formulation of which is , where Qr is the rainwater mixing ratio, F1 represents subgrid Qc variability, ρ is air density, and F2 is an accretion rate enhancement factor. F2 was increased by a factor of ∼ 3 in the accretion sensitivity experiment. F2 is considered a tunable parameter in E3SM (Ma et al., 2022). The experiment details are provided in Table 1.
Table 1KK2000 coefficient and accretion enhancement factor values applied in 12 sensitivity experiments. Dashes (“–”) indicate that the coefficient value was unchanged from the default E3SMv2 parameterization (equal to the “CNTL” simulation value).
ERFaci for each pair of simulations was calculated following the Ghan (2013) method, where ERFaci . Fclean is the radiative flux at the top of atmosphere (TOA) neglecting the absorption and scattering of aerosols, and Fclear,clean is the radiative flux at the TOA neglecting both clouds and the absorption and scattering of aerosols. The Δ indicates the PD − PI difference. While the PD − PI approach is a common strategy for estimating ERFaci, Christensen et al. (2023) demonstrated that it may yield a different estimate than the PD approach, where components of ERFaci (LWP adjustment, Nd adjustment, and cloud fraction adjustment) are estimated by regressions of cloud properties multiplied by the anthropogenic aerosol fraction. We calculate ERFaci for SLWCs only, binned by the MODIS Re range corresponding to the CFODD analysis.
A constraint on ERFaciSW was calculated from the linear regression between E3SMv2 CFODD slopes and ERFaciSW, using the MODIS-CloudSat CFODD slope as a reference. A 95 % confidence interval for the linear fit was estimated by bootstrapping the linear regression within the uncertainty in the CFODD slopes. CFODD slope values were randomly sampled 1000 times within their 1σ error and repeatedly regressed with ERFaciSW. The original data (i.e., RANSAC CFODD slope values and corresponding ERFaciSW values) were additionally resampled with replacement to generate a distribution of coefficients for the ordinary least squares (OLS) regression. The 95 % confidence interval for the linear fit was then calculated from the combined linear regression coefficient distributions to reflect uncertainty from both the OLS fit and the CFODD slopes.
The first diagnostic in the original WRDs featured relative frequencies of SLWCs by precipitation intensity in both the A-Train reference data and the COSPv2.0 output (e.g., Fig. 1m–o). We have updated this diagnostic using all-sky frequencies and by decreasing the lower MODIS COT threshold from 15 to 0.3 for consistency with the WRDs implemented in COSPv2.0 (Fig. 1a–l). SLWCs featured in Fig. 1 and all following figures and analyses are ocean-only due to higher uncertainties in MODIS retrievals over land (Platnick et al., 2017).
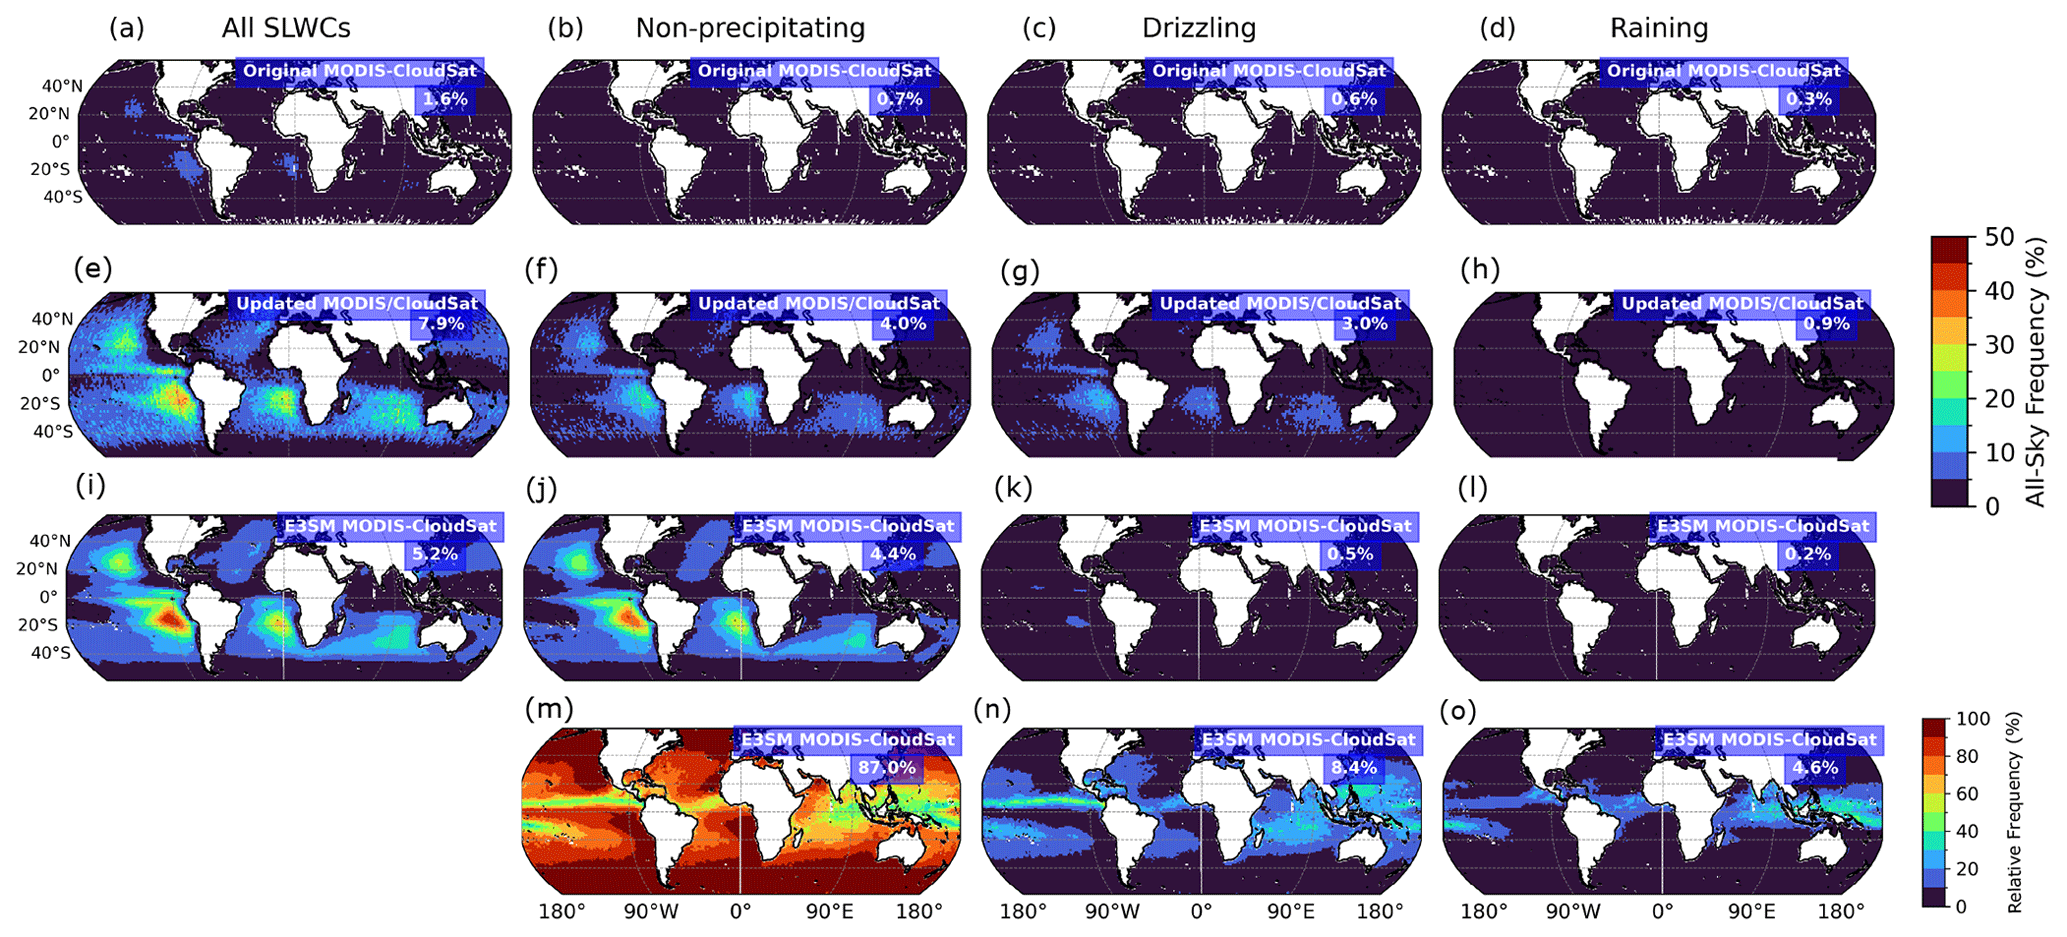
Figure 1All-sky frequencies of total SLWCs June 2006–April 2011, non-precipitating ( dBZe), drizzling (−15 dBZ dBZe), and raining (Zmax≥0 dBZe) ocean-only SLWCs according to original reference analysis of MODIS and CloudSat observations (Michibata et al., 2019a, b) (a–d), updated reference MODIS and CloudSat analysis (e–h), and E3SMv2-COSPv2.0 (i–l). Figures (m–o) show frequencies of non-precipitating, drizzling, and raining SLWCs relative to the total SLWCs simulated by E3SMv2. Values in blue boxes indicate global ocean-only grid-weighted mean frequency. SLWCs were undersampled in original reference A-Train analysis by a factor of ∼ 5. Compared to the original reference A-Train data, the updated analysis demonstrates that E3SM underrepresents total SLWC and that precipitating SLWCs are underrepresented by a factor of 6 compared to observations.
Figure 1 also shows that decreasing the lower MODIS COT threshold from 15 to 0.3 in the updated A-Train analysis (Sect. 2.3) increased total SLWC sampling 5-fold (global ocean mean; see Sect. 2.3) compared to the original CFODD analysis in Michibata et al. (2019a) and Michibata et al. (2019b). The increase in SLWC sampling in the reference data affects multiple outcomes of the model evaluation; in this case, E3SMv2 underrepresents (rather than overrepresents) total SLWCs, and the SLWCs that are missing from E3SMv2 are entirely the precipitating SLWC populations. The underrepresentation of precipitating SLWCs in E3SMv2-COSP indicates that any bias from SCOPS towards increased precipitation in warm liquid clouds is relatively minor (Sect. 2.2; Song et al., 2018). Not all the differences between the original and updated reference data can be explained by the change in COT threshold, however, as we were unable to reproduce the original CFODD data with the updated satellite products used in this study. Figures S1 and S2 show that increasing the lower COT threshold from 0.3 to 15 yields SLWC frequencies that are much closer to the original reference data (+25 %) than the updated reference data, but significant differences remain in the CFODDs.
The effects of the increased SLWC sampling in the A-Train reference data also significantly affected the CFODDs and thus the comparison between A-Train and E3SMv2 droplet collection efficiencies. Figure 2 shows CloudSat reflectivity frequency binned by ICOD for the original A-Train reference data (Fig. 2a–c), the updated A-Train reference data ( d–f) and E3SMv2 ( j–l) and RANSAC robust linear regression slopes at 4 ≤ ICOD ≤ 20. In comparisons with various other linear regression techniques, we found that RANSAC best supported the comparison of CFODD slopes between E3SMv2 and observations because of the right-skewed distribution of CloudSat reflectivities at 0 ≤ ICOD ≤ 20 in E3SMv2 CFODDs (Fig. 2j–l). RANSAC minimizes the median absolute error (MAE) and is less sensitive to strong outliers in the dimension of the predicted variable (Ze in this case) compared to other linear regression techniques.
The updated A-Train CFODD distributions are significantly different than the original CFODD distributions (2D-Kolmogorov–Smirnov test, p ≪ 0.05). Compared to updated A-Train CFODDs, the E3SMv2 CFODDs show decreased droplet collection efficiencies and an increased range of reflectivities near the cloud top in all size bins, indicating that regardless of Re, SLWCs are drizzling and raining near the cloud top with significantly higher frequency than SLWCs in observations but have decreased collection efficiency below cloud top compared to MODIS-CloudSat.
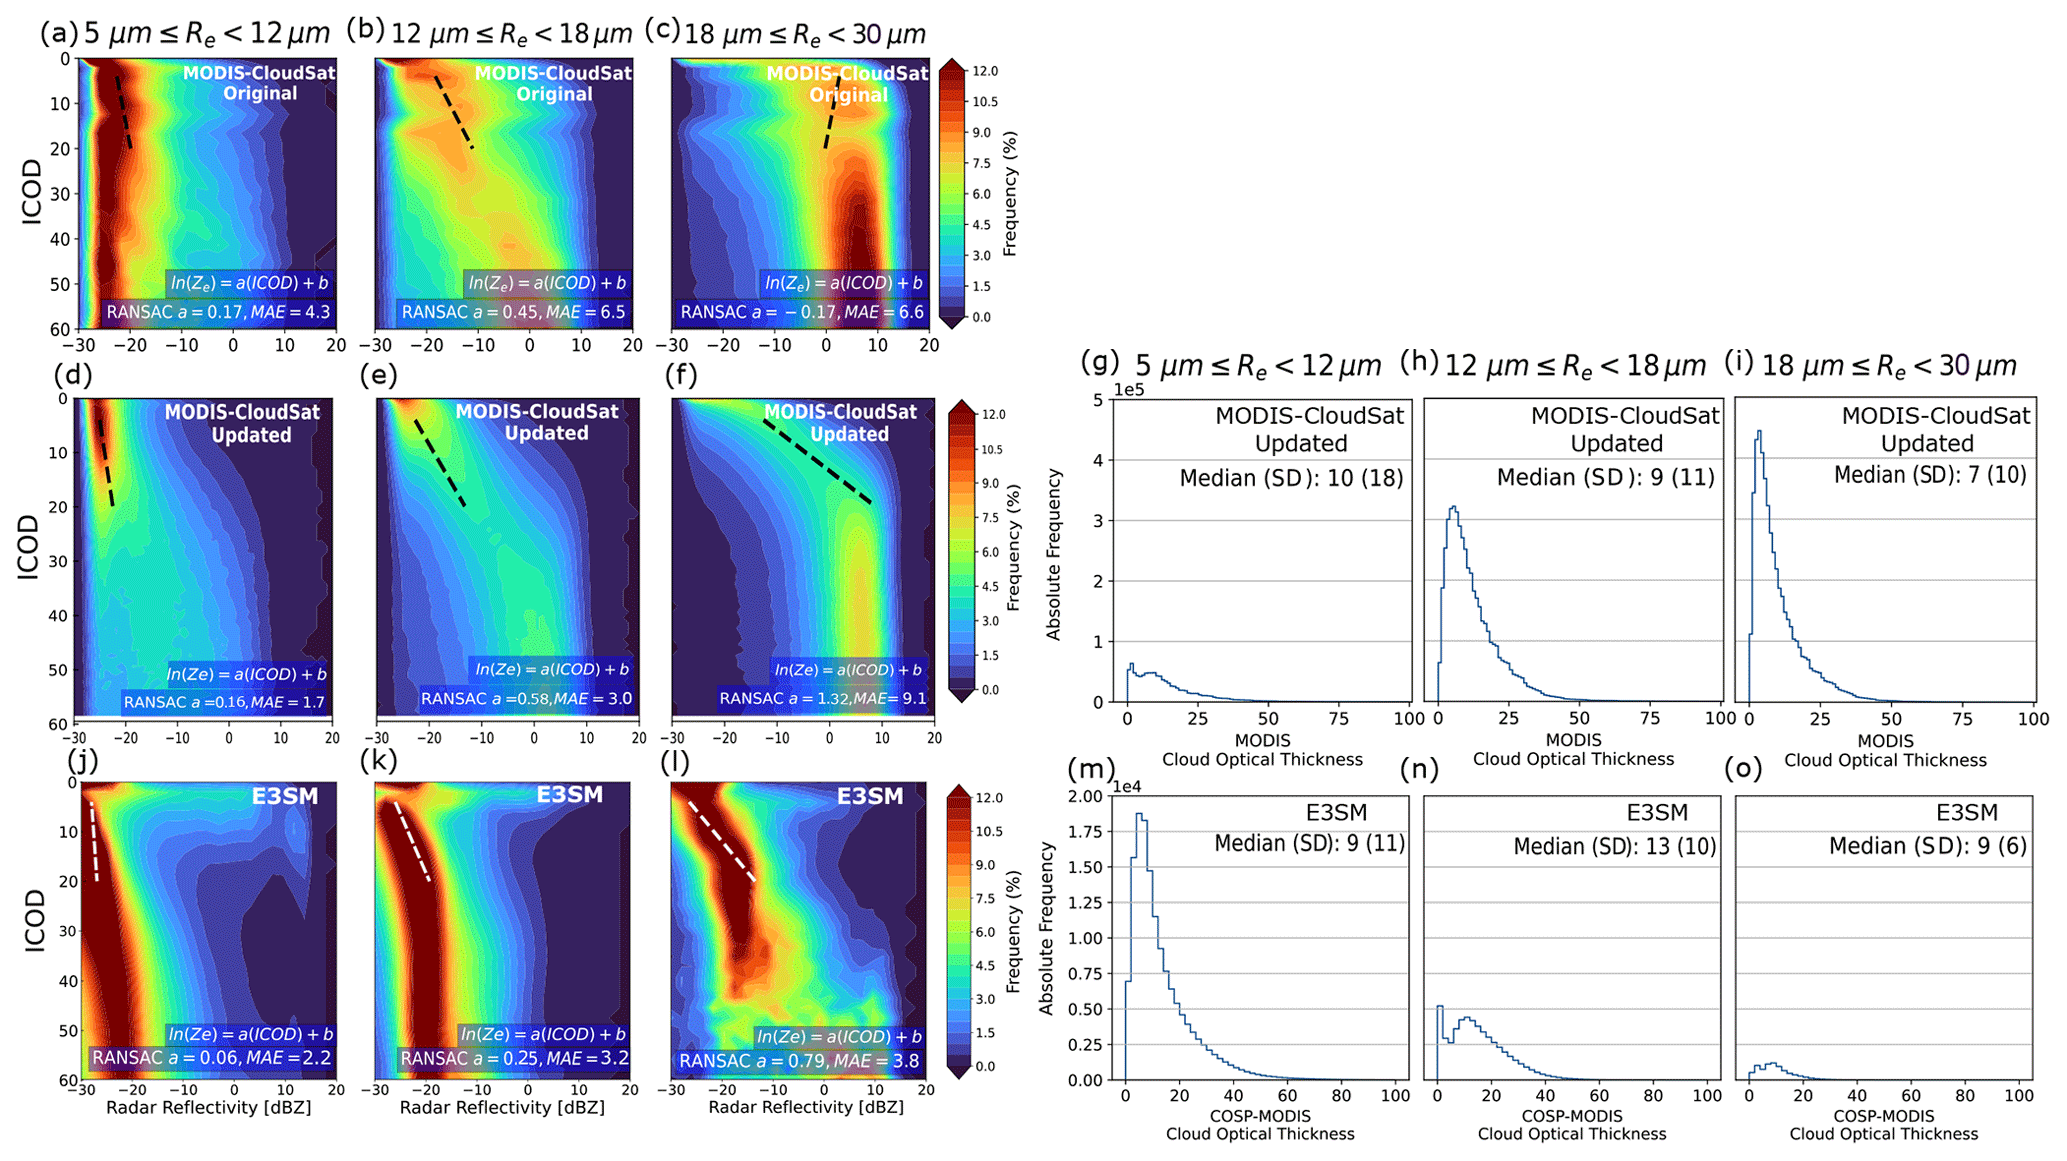
Figure 2Contoured frequency by optical depth diagrams (CFODDs) for SLWCs (June 2006–April 2011) binned by MODIS cloud top effective radius (Re) from original reference MODIS-CloudSat observations analysis (a–c), updated reference MODIS-CloudSat observations analysis (d–f), and E3SMv2 (j–l). RANdom SAmple Consensus (RANSAC) linear regressions were applied to the CFODD at 4 ≤ ICOD ≤ 20 to estimate droplet collection efficiencies. RANSAC slopes and median absolute error (MAE) values are shown in blue boxes. Droplet collection efficiencies increase with MODIS Re as expected, except for the largest Re size bin in the original reference data (Fig. S2c). Panels (g)–(i) and (m)–(o) show absolute frequencies of SLWCs by MODIS COT, demonstrating that E3SMv2 overrepresents SLWCs with small Re relative to medium and large Re, compared to observations.
The high reflectivities near the cloud top are pronounced in the subset of E3SMv2 SLWCs with 4 < MODIS COT < 20 (Fig. S3), indicating that the high reflectivity at low ICOD in Fig. 2j–l is not just a product of a subset of precipitating, optically thin SLWCs but that layers near the cloud top in deeper SLWCs are also precipitating. The reflectivity profiles used to generate the CFODD come from the CloudSat simulator, which was not modified for this study. Examples of simulated CloudSat reflectivity profiles in SLWCs with Ze>0 dBZ near cloud top are shown in Fig. S4. The source of this issue and its implications for E3SMv2 representation of liquid cloud properties warrant further investigation that is beyond the scope of the present study.
Figure 2 shows absolute frequencies of SLWCs binned by MODIS COT in each CFODD Re bin for the updated A-Train analysis (Fig. 2g–i) and E3SMv2 only (Fig. 2m–o). Note this information was unavailable in the original reference data (Michibata et al., 2019a). Compared to COT distributions in the updated A-Train analysis, E3SMv2 shows decreasing SLWC frequency with Re and an underrepresentation of SLWCs with large Re, which aligns with the underrepresentation of precipitating SLWCs in Fig. 1. Figure 2o also shows that few SLWCs with large Re have a COT > 20, indicating that the CFODD reflectivity profile in Fig. 2l at ICOD > 20 is comprised of few samples. The SLWC COT PDFs have been implemented in the WRDs to support the interpretation of CFODD statistics.
4.1 CFODD analysis to constrain ERFaci due to warm rain processes
To demonstrate the potential of the CFODD analysis described above for constraining ERFaciSW due to warm rain processes, we performed 12 experiments featuring variations in E3SMv2's autoconversion and accretion parameterizations, computing ERFaciSW for the SLWC samples represented in each CFODD and the corresponding Re bin (hereafter “ERFaciSW_SLWCs”) following Ghan (2013; see Sect. 2.4). In each experiment, a single coefficient of either the KK2000 autoconversion or accretion parameterization was perturbed, each of which is treated as a tunable parameter in E3SMv2. The uncertain KK2000 coefficients, coupled with parameterization simplifications (e.g., bulk moments and assumed droplet size distributions), result in uncertainties and biases in the model representation of raindrop formation and growth. The experiments are described in Table 1, and the CFODDs for each experiment are shown in Fig. S5.
Figure 3 shows a strong negative correlation between E3SMv2 ERFaciSW_SLWCs with “small” or “medium” Re (i.e., 5≤Re<18 µm) and the corresponding combined 5≤Re<18 µm CFODD slope (Pearson's R = −0.91). SLWCs with large Re (18≤Re<30 µm) were excluded from the analysis in Fig. 3 because this population represents a negligible fraction of total SLWCs in E3SMv2 (see Fig. S6), resulting in poor sampling statistics and larger regression uncertainties. As CFODD slopes represent an estimate of droplet collection efficiency, Fig. 3 demonstrates that ERFaciSW strengthens (increases in magnitude) with increasing droplet collection efficiency in E3SMv2 SLWCs with Re between 5 and 18 µm. One possible physical explanation for the relationship between autoconversion, droplet collection efficiency, and ERFaciSW is that increased autoconversion rates increase the susceptibility of clouds to precipitation suppression by aerosols. For a given optical depth, SLWCs with lower LWP and/or higher Nd will precipitate more when the autoconversion rate is increased. A larger population of precipitating SLWCs results in increased susceptibility to precipitation suppression by aerosols overall. When aerosols suppress precipitation (e.g., Suzuki et al., 2013), LWP and/or cloud fraction may be enhanced, resulting in brighter clouds and stronger ERFaciSW. The relationship between aerosols, LWP, and cloud fraction (Albrecht, 1989), however, is highly uncertain, varies regionally (Sato et al., 2018), and is influenced by processes that are buffered over multiple spatiotemporal scales (Stevens and Feingold, 2009). Additionally, E3SMv2's CFODD slope (“CNTL” simulation) agrees with MODIS-CloudSat within uncertainty, indicating that droplet collection efficiency is well-represented according to CFODD analysis.

Figure 3Linear regression between E3SMv2 ERFaciSW_SLWCs and CFODD slopes, generated from SLWCs with MODIS Re between 5 and 18 µm, in 12 PD autoconversion and accretion sensitivity experiments. ERFaciSW_SLWCs values reflect the SLWCs represented in the corresponding CFODD (i.e., with Re corresponding to the CFODD Re bin). Results show a strong negative correlation between E3SMv2 ERFaciSW_SLWCs and CFODD slopes. We constrain the ERFaciSW by predicting the ERFaciSW_SLWCs value at the reference MODIS-CloudSat 5≤Re<18 µm CFODD slope (dashed purple line) from the linear regression (intercept shown in blue box). Error bars represent 1σ error estimated from RANSAC-fit bootstrapping (Sect. 2). Grey and pink shaded regions indicate the 68 % and 95 % confidence intervals for the MODIS-CloudSat CFODD slope, respectively. Labels indicate the sensitivity experiment names (Table 1).
In Fig. 3, we constrain ERFaciSW due to autoconversion uncertainties using the linear regression between the simulated CFODD slopes and ERFaciSW_SLWCs. ERFaciSW and ERFaciSW_SLWCs values were calculated following Ghan et al. (2013), which considers the difference in TOA radiative flux between the PD and PI experiments, neglecting the direct forcing of aerosols (see Sect. 2.4 for details). The constrained value of ERFaciSW_SLWCs is estimated at the intercept of the linear relationship with the observed MODIS-CloudSat CFODD slope (Fig. 4). We find that the ERFaciSW_SLWCs predicted by the linear regression at the MODIS-CloudSat slope value (−0.066 ± 0.06 W m−2) approaches agreement with the ERFaciSW_SLWCs value predicted by the E3SMv2 CNTL simulation (−0.077 W m−2), particularly considering the additional uncertainties imposed by the limited number of sensitivity experiments that are not represented in the regression's 95 % confidence interval. The agreement between the constrained and predicted value of ERFaciSW_SLWCs indicates that the ERFaciSW due to autoconversion is well-represented in E3SMv2 according to CFODD analysis.
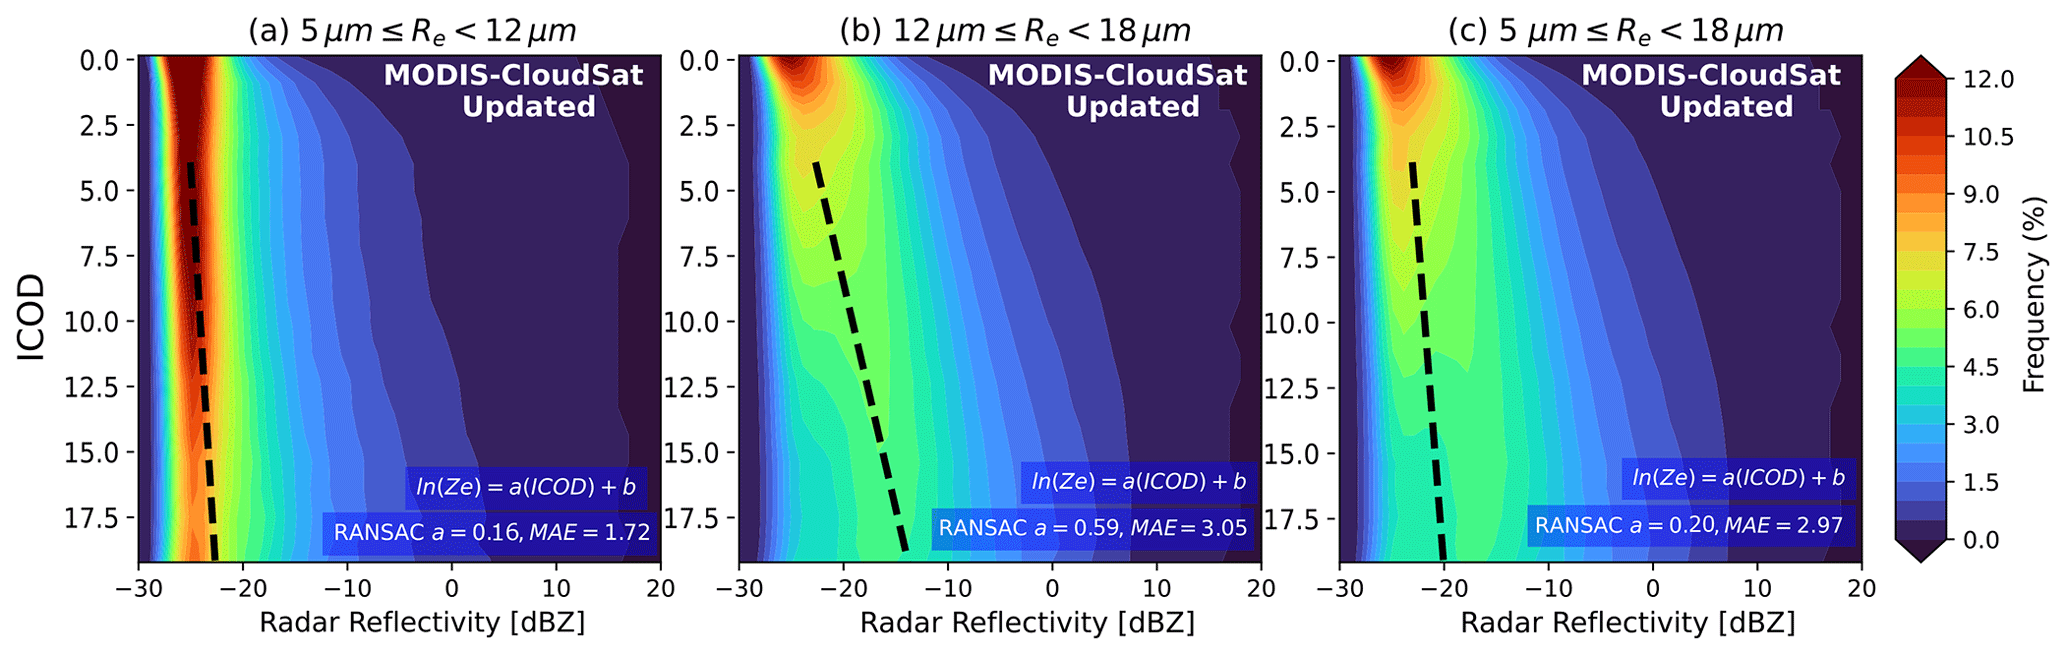
Figure 4CFODDs for subset of SLWCs with max CloudSat reflectivity < 20 dBZ and COT < 20 (June 2006–April 2011) binned by MODIS Re from updated reference MODIS-CloudSat observations analysis (a–b) and with combined “small” and “medium” Re SLWCs in (c). RANSAC linear regressions were applied to the CFODD at 4 ≤ ICOD ≤ 20 to estimate droplet collection efficiencies. RANSAC slopes and median absolute error (MAE) values are shown in blue boxes.
As ERFaciSW is the result of many cloud processes, the updated CFODD analysis should be interpreted as a constraint on the component of ERFaciSW that is modulated by droplet collection efficiency due to autoconversion. In other words, the updated CFODD analysis shows the change in ERFaciSW one would expect if the bias in ERFaciSW due to a specific process representation affecting droplet collection efficiency were eliminated. Base cloud processes that are independent of aerosol also contribute significantly to ERFaci estimates (Mülmenstädt et al., 2020). Autoconversion perturbations affect base cloud state (e.g., LWP, cloud fraction) and could, for example, cause stronger ERFaci by increasing cloud amount rather than increasing the impact of ACI on SW radiative forcing. Jing et al. (2019) evaluated different autoconversion parameterization schemes in an ESM using the CFODD analysis described in Michibata et al. (2019b) and found that the autoconversion scheme that yielded the best warm rain representation predicted a significantly stronger ERFaci that exceeded the uncertainty range of the Intergovernmental Panel on Climate Change (IPCC) AR5 and canceled out much of the warming trend of the last century. The conflict between process representation and ERFaci predictions in Jing et al. (2019) underscores a challenge with process-based constraints: improving the representation of a process can result in adverse outcomes to climate prediction due to compensating biases in the model. This challenge is particularly troublesome for constraints on processes like autoconversion that affect the base cloud state because decreasing autoconversion rates can increase total cloud quantity, which can yield stronger ERFaci. Thus, a decreased autoconversion rate may improve precipitation outcomes in an ESM that presents the common “too frequent” warm rain bias (e.g., Stephens et al., 2010), yet cause improbably strong ERFaci. However, our results show that decreased autoconversion rates result in weaker ERFaciSW_SLWCs (Fig. 3), demonstrating that the base cloud state issue presented in prior studies of autoconversion is not a dominant factor contributing to the ERFaciSW of warm rain processes in E3SMv2.
Figure 5a shows the linear relationship between ERFaciSW_SLWCs normalized by the PI SW cloud radiative effect (SWCRE), which represents the fraction of ERFaci that is independent from base cloud state changes, and CFODD slope. The correlation coefficient in Fig. 5a (Pearson's R=0.74) is decreased compared to Fig. 3 (Pearson's ). However, comparing the negative correlations between CFODD slope and PI SLWC cloud fraction (Fig. 5b; Pearson's ) and LWP (Fig. 5c; Pearson's ) with Fig. 3, the ERFaciSW_SLWCs increases in magnitude as LWP and cloud fraction decrease, further demonstrating that the contribution of base cloud state to ERFaciSW_SLWCs is relatively minor. The decreased correlation coefficient in Fig. 5a could also be influenced by poor sampling statistics in the “acoef100×” experiment. The acoef100× was the only one of six experiments involving perturbations of the A coefficient in KK2000 (Table 1; Sect. 2.4) in which the CFODD slope did not increase with an increase in magnitude of the “A” coefficient. Given the significant decrease in SLWC cloud fraction in this experiment compared to the others (Fig. 5b, Table S2), the CFODD slope result may be affected by insufficient sample size, an additional uncertainty in the CFODD linear regression that is not reflected in the bootstrapping-based uncertainty estimate (Sect. 2).
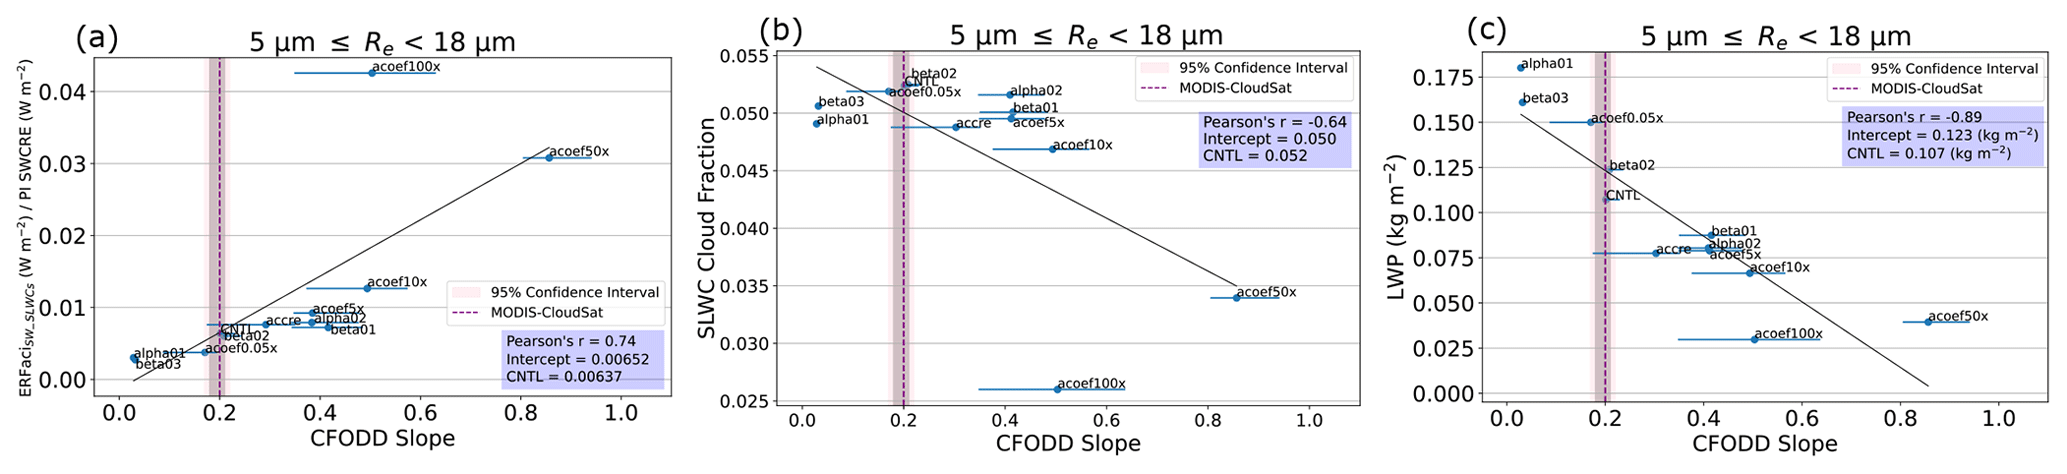
Figure 5Linear regression between (a) E3SMv2 ERFaciSW_SLWCs normalized by SWCRE, (b) SLWC cloud fraction, (c) SLWC LWP, and CFODD slopes in 12 PD autoconversion and accretion sensitivity experiments, calculated for SLWCs with MODIS Re between 5 and 18 µm. ERFaciSW_SLWCs values reflect the SLWCs represented in the corresponding CFODD (i.e., with Re corresponding to 5<Re<18 µm). Error bars represent 1σ error estimated from RANSAC-fit bootstrapping (Sect. 2). Grey and pink shaded regions indicate the 68 % and 95 % confidence intervals for the MODIS-CloudSat CFODD slope, respectively. Labels indicate the sensitivity experiment names (Table 1).
While we derive a constraint on ERFaciSW using the combined small and medium Re CFODDs, when the Re subsets are considered individually, they show distinct contributions to ERFaciSW_SLWCs. Figure S7 shows that SLWCs with small Re have a negative ERFaciSW_SLWCs but that SLWCs in the medium and large Re subsets have positive ERFaciSW_SLWCs values. This indicates that the dominant effect of aerosols on shortwave radiative forcing in the medium and large SLWC subsets is decreased cloud fraction, which is reflected in the decreased SLWC sample sizes in the PD simulations compared to PI (Figs. S8, S9). The negative linear relationship between ERFaciSW_SLWCs and CFODD slope in the medium and large Re subsets indicates that increasing droplet collection efficiency partially counteracts the decrease in cloud fraction due to aerosol. The small Re SLWCs, however, show a positive correlation between ERFaciSW and CFODD slope, indicating that ERFaciSW weakens as autoconversion rates increase, likely due to decreased precipitation suppression susceptibility in this subset. The combined small and medium CFODD and ERFaciSW_SLWCs, therefore, represent the convolution of two populations with differing ERFaciSW sensitivities to autoconversion perturbations. We chose to constrain ERFaciSW using the combined small and medium CFODDs and ERFaciSW_SLWCs due to the correlation performance and the dearth of large Re SLWCs in E3SMv2. However, constraints for ERFaciSW could potentially be derived for each individual Re subset or various combinations thereof depending on the distribution of SLWCs among the Re size bins and their contribution to the host model's ERFaci. Considering that constrained ERFaciSW increases in magnitude with increasing Re in Fig. S7, the shortwave component of ERFaci is significantly larger than the longwave in CMIP6 models (Smith et al., 2020), and E3SMv2's total ERFaci (−1.50 W m−2) is relatively strong compared to the IPCC AR6 “very likely” range (−1.0 ± 0.7 W m−2) (Forster et al., 2021), the underrepresentation of SLWCs with large Re in E3SMv2 represents a compensating bias, without which the total ERFaci would be even stronger compared to IPCC AR6.
4.2 Limitations of CFODD-based constraint on ERFaci
There are multiple limitations to the CFODD analysis that should be considered in its application as a constraint on ERFaci. First, droplet collection is not explicitly represented in ESMs with bulk microphysical schemes, such as E3SMv2, but is instead implicit in an amalgamation of processes and drop size distribution parameterizations controlling the evolution of the cloud and precipitation. Delving into the impact of these individual processes on CFODD-based constraint on ERFaci is a good target for future work, while autoconversion modulation of ERFaci was the primary focus here. Furthermore, simulated radar reflectivity is highly sensitive to particle size distribution assumptions in the forward simulator (e.g., Bodas-Salcedo et al., 2011; Wang et al., 2021). The host model, therefore, could represent warm rain microphysical processes with high fidelity but still produce biased CFODD profiles when compared with observations. In COSPv2.0, the CloudSat simulator calculates size distributions from an assumed distribution (e.g., log-normal, gamma, exponential) as well as mass mixing ratios, precipitation fluxes, and grid box mean Re from the host model. Default COSPv2.0 size distributions were used in this study (i.e., log-normal for large-scale stratiform and convective cloud liquid and exponential for large-scale stratiform and convective cloud rain). The CFODD analysis itself is subject to multiple uncertainties, including the use of simple adiabatic and condensational growth assumptions to scale MODIS COT to ICOD. These assumptions result in a vertical distribution of optical depth, mass concentrations, and particle size that may not reflect reality. For example, in the CFODD, particle size and mass concentration are assumed to monotonically increase with height, yet particle sizes may decrease near the cloud top due to evaporation and entrainment in the real cloud (Suzuki et al., 2010). The uncertainties from assumed hydrometeor size distributions and CFODD construction should be carefully considered when using the CFODD to evaluate model droplet collection efficiencies against observations and in the application as an ERFaci constraint. Simulated reflectivity biases affect the evaluation of the model CFODD slope against the observational CFODD slope and thus affect the estimation of ERFaci bias.
A few additional limitations on CFODD analysis are imposed by biases in E3SMv2 SLWC representation. The ERFaci constraint is restricted to the small and medium Re CFODDs because of the underrepresentation of SLWCs with large Re. SLWCs with medium Re are also underrepresented in E3SMv2, further limiting the CFODD analysis of E3SMv2 ERFaci because process perturbations are limited to the extent that they do not significantly reduce the number of SLWCs with medium Re. The high reflectivity near cloud top at ICOD < 4 in E3SMv2 CFODDs presents another limitation. SLWCs with COT < 4 represent a significant fraction of the SLWC population in both A-Train and E3SMv2 (Fig. 2), so including optically thin SLWCs in the linear regression would likely affect the CFODD slope and droplet collection efficiency estimates.
Despite these limitations and the uncertainty associated with estimates of droplet collection efficiency from simulated radar reflectivity, CFODD analysis offers a highly desired process-oriented constraint on ERFaci due to warm rain processes. In E3SMv2, the CFODD slope exhibits the expected behavior in response to autoconversion perturbations: slope increases with perturbations that increase the autoconversion rate and decreases with perturbations that decrease the autoconversion rate. Our results also show that the model ERFaciSW is highly sensitive to the processes that the CFODD represents, enabling the constraint on ERFaciSW against the CFODD slope derived from MODIS-CloudSat cloud retrievals. Prior studies have demonstrated that radar reflectivity biases can be partially mitigated by bringing the forward simulator into better agreement with the host model's microphysics parameterization and subgrid variability (Song et al., 2018b; Wang et al., 2021). Modified versions of COSP featuring improved consistency with E3SM are to be implemented in future E3SM model versions, which will decrease the uncertainties associated with CFODD analysis of E3SM.
In this study, we present an updated CFODD analysis and demonstrate how it can be applied to ESMs as a process-oriented constraint on ERFaci and find that E3SMv2's ERFaciSW agrees with the MODIS-CloudSat constrained value within uncertainty. Demonstrated here as a constraint on the component of ERFaciSW that is modulated by autoconversion, CFODD analysis represents a highly desirable constraint on a process, circumventing the equifinality issue that bedevils atmospheric-state-variable-based approaches (Mülmenstädt et al., 2020). Limitations of CFODD-based constraints on ERFaci include the implicit representation of droplet collection efficiency in many ESMs (including E3SMv2), the sensitivity of simulated radar reflectivity to droplet size distribution representations, and simplified assumptions applied to construct the CFODD (e.g., adiabatic-condensational growth). While this study focuses on autoconversion, future studies should apply CFODD analysis to other microphysical processes that affect droplet collection efficiency (e.g., accretion, droplet breakup, evaporation) to generate additional ERFaci constraints.
Several updates to the WRDs package in COSPv2.0 were made to support the application of CFODD analysis to ESMs. In addition to the original WRDs featuring relative frequencies of SLWCs by precipitation intensity and the CFODD by Re, we have implemented additional diagnostics in the WRDs that include all-sky SLWC frequency maps and MODIS SLWC COT distributions for CFODD sampling statistics. Other updates include the estimation of CFODD slopes using RANdom SAmple Consensus robust linear regression and changes to the SLWC detection schemes for better comparison between observations and satellite simulators.
In addition to the modifications of the WRDs described above, the MODIS and CloudSat observational reference data have been updated for consistency with COSPv2.0 SLWC detection. SLWC detection is increased 5-fold in the updated reference data. The increase in SLWC sampling also significantly affected the CFODD distributions and, consequently, the A-Train reference droplet collection efficiency at large Re (18 µm ≤ Re<30 µm). The updated WRDs showed that droplet collection efficiencies in E3SMv2 are decreased compared to observations and SLWCs with small MODIS Re (5 µm ≥ Re>12 µm) are overrepresented. The E3SMv2 CFODD results also show reflectivities exceeding 0 dBZ near cloud top at 2 < ICOD < 4 yet relatively low reflectivities at ICOD > 5. The unreasonably high reflectivities near cloud top may indicate artifacts due to inconsistencies between E3SMv2 outputs and COSPv2.0 inputs to the CloudSat simulator. This issue motivates further investigation in future studies involving applications of the CloudSat simulator to E3SM. The updates described herein have increased the WRDs' utility for evaluating model warm rain process representation and support the analysis needed to derive a constraint on ERFaci from CFODD analysis. Through an evaluation of E3SMv2, we demonstrate that the updated WRDs illuminate specific biases in SLWC representation and provide contextual sampling statistics that are critical for interpreting CFODD results for future applications of this observational constraint on ERFaci.
The CloudSat and MODIS data products are available from the CloudSat Data Processing Center at CIRA/Colorado State University (https://www.cloudsat.cira.colostate.edu/, NASA, 2023). The reference A-Train data used in this study are available here: https://doi.org/10.5281/zenodo.8384180 (Beall et al., 2023a). The modified source code of COSPv2.0 is available here: https://doi.org/10.5281/zenodo.8371120 (Beall et al., 2023b). The Python package for the two-dimensional Kolmogorov–Smirnov test applied in this study is available here: https://github.com/syrte/ndtest/tree/master (ndtest, 2024). The Python package scikit-learn was used for robust linear regression analysis (https://scikit-learn.org/stable/, last access: 28 June 2023, Grisel et al., 2024).
The supplement related to this article is available online at: https://doi.org/10.5194/acp-24-5287-2024-supplement.
CMB led the project, developed the additional warm rain diagnostics in this study, performed the model simulations, and wrote the manuscript. PLM provided critical project guidance and support for modeling and analysis. MWC led the A-Train observations analysis and provided guidance in the development of additional warm rain diagnostics. AV provided input on CFODD analysis applications. JM provided guidance on ERFaci analysis. TM and KS provided guidance in the application of on warm rain diagnostics. All authors contributed to writing the manuscript.
At least one of the (co-)authors is a member of the editorial board of Atmospheric Chemistry and Physics. The peer-review process was guided by an independent editor, and the authors also have no other competing interests to declare.
Publisher’s note: Copernicus Publications remains neutral with regard to jurisdictional claims made in the text, published maps, institutional affiliations, or any other geographical representation in this paper. While Copernicus Publications makes every effort to include appropriate place names, the final responsibility lies with the authors.
We would like to thank the anonymous reviewers for the thoughtful discussion and insightful feedback. The Pacific Northwest National Laboratory (PNNL) is operated for the DOE by the Battelle Memorial Institute under contract DE-AC05-76RL01830. The research used high-performance computing resources from the PNNL Research Computing; the BER Earth System Modeling program's computing cluster located at PNNL; and resources of the National Energy Research Scientific Computing Center (NERSC), a U.S. Department of Energy Office of Science User Facility located at Lawrence Berkeley National Laboratory, operated under contract no. DE-AC02-05CH11231, using NERSC awards ALCC-ERCAP0025938 and BER-ERCAP0024471.
The study was supported as part of the Enabling Aerosol–cloud interactions at GLobal convection-permitting scalES (EAGLES) project (project no. 74358) sponsored by the United States Department of Energy (DOE), Office of Science, Office of Biological and Environmental Research (BER), Earth System Model Development (ESMD) program area. KS and TM were supported by the Japan Society for the Promotion of Science KAKENHI (grant no. JP19H05669), MEXT program for the Advanced Studies of Climate Change Projection (SENTAN) (grant no. JPMXD0722680395), and the Environment Research and Technology Development Fund (S-20) (grant no. JPMEERF21S12004) of the Environmental Restoration and Conservation Agency. TM was supported by the JST FOREST Program (grant no. JPMJFR206Y), and the Japan Society for the Promotion of Science KAKENHI (grant no. JP23K13171).
This paper was edited by Graham Feingold and reviewed by two anonymous referees.
Albrecht, B. A.: Aerosols, Cloud Microphysics, and Fractional Cloudiness, Science, 245, 1227–1230, https://doi.org/10.1126/science.245.4923.1227, 1989.
Beall, C. M., Ma, P.-L., Christensen, M. W., Mülmenstädt, J., Varble, A., Suzuki, K., and Michibata, T.: Dataset for “Droplet collection efficiencies inferred from satellite retrievals constrain effective radiative forcing of aerosol-cloud interactions”, Zenodo [data set], https://doi.org/10.5281/zenodo.8384180, 2023a.
Beall, C. M., Ma, P.-L., Michibata, T., Swales, D., Guzman, R., Pincus, R., Bodas, A., and Hillman, B. R.: cbeall123/COSPv2.0: UpdatedWRDs (v1.0.0), Zenodo [code], https://doi.org/10.5281/zenodo.8371120, 2023b.
Bellouin, N., Quaas, J., Gryspeerdt, E., Kinne, S., Stier, P., Watson-Parris, D., Boucher, O., Carslaw, K. S., Christensen, M., Daniau, A.-L., Dufresne, J.-L., Feingold, G., Fiedler, S., Forster, P., Gettelman, A., Haywood, J. M., Lohmann, U., Malavelle, F., Mauritsen, T., McCoy, D. T., Myhre, G., Mülmenstädt, J., Neubauer, D., Possner, A., Rugenstein, M., Sato, Y., Schulz, M., Schwartz, S. E., Sourdeval, O., Storelvmo, T., Toll, V., Winker, D., and Stevens, B.: Bounding Global Aerosol Radiative Forcing of Climate Change, Rev. Geophys., 58, e2019RG000660, https://doi.org/10.1029/2019RG000660, 2020.
Bodas-Salcedo, A., Webb, M. J., Bony, S., Chepfer, H., Dufresne, J.-L., Klein, S. A., Zhang, Y., Marchand, R., Haynes, J. M., Pincus, R., and John, V. O.: COSP: Satellite simulation software for model assessment, Bull. Am. Meteorol. Soc., 92, 1023–1043, https://doi.org/10.1175/2011BAMS2856.1, 2011.
Bogenschutz, P. A., Gettelman, A., Morrison, H., Larson, V. E., Craig, C., and Schanen, D. P.: Higher-Order Turbulence Closure and Its Impact on Climate Simulations in the Community Atmosphere Model, J. Clim., 26, 9655–9676, https://doi.org/10.1175/JCLI-D-13-00075.1, 2013.
Bretherton, C. S., Blossey, P. N., and Uchida, J.: Cloud droplet sedimentation, entrainment efficiency, and subtropical stratocumulus albedo, Geophys. Res. Lett., 34, L03813, https://doi.org/10.1029/2006GL027648, 2007.
Cesana, G. and Chepfer, H.: How well do climate models simulate cloud vertical structure? A comparison between CALIPSO-GOCCP satellite observations and CMIP5 models, Geophys. Res. Lett., 39, L20803, https://doi.org/10.1029/2012GL053153, 2012.
Charlson, R. J., Lovelock, J. E., Andreae, M. O., and Warren, S. G.: Oceanic phytoplankton, atmospheric sulphur, cloud albedo and climate, Nature, 326, 655–661, https://doi.org/10.1038/326655a0, 1987.
Christensen, M. W., Stephens, G. L., and Lebsock, M. D.: Exposing biases in retrieved low cloud properties from CloudSat: A guide for evaluating observations and climate data, J. Geophys. Res., 118, 12120–12131, https://doi.org/10.1002/2013JD020224, 2013.
Dee, D. P., Uppala, S. M., Simmons, A. J., Berrisford, P., Poli, P., Kobayashi, S., Andrae, U., Balmaseda, M. A., Balsamo, G., Bauer, P., Bechtold, P., Beljaars, A. C. M., van de Berg, L., Bidlot, J., Bormann, N., Delsol, C., Dragani, R., Fuentes, M., Geer, A. J., Haimberger, L., Healy, S. B., Hersbach, H., Hólm, E. V., Isaksen, L., Kållberg, P., Köhler, M., Matricardi, M., McNally, A. P., Monge-Sanz, B. M., Morcrette, J.-J., Park, B.-K., Peubey, C., de Rosnay, P., Tavolato, C., Thépaut, J.-N., and Vitart, F.: The ERA-Interim reanalysis: configuration and performance of the data assimilation system, Q. J. Roy. Meteorol. Soc., 137, 553–597, https://doi.org/10.1002/qj.828, 2011.
DeWald, C. M.: Observations of Ice-Nucleating Particles Near Marine and Major Dust Source Regions, Ph.D. thesis, UC San Diego, ProQuest ID: DeWald_ucsd_0033D_20885, 2021.
Fischler, M. A. and Bolles, R. C.: Random Sample Consensus: A Paradigm for Model Fitting with Applications to Image Analysis and Automated Cartography, in: Readings in Computer Vision, edited by: Fischler, M. A. and Firschein, O., Morgan Kaufmann, San Francisco (CA), 726–740, https://doi.org/10.1016/B978-0-08-051581-6.50070-2, 1987.
Forster, P., Storelvmo, T., Armour, K. C., Collins, W., Dufresne, J. L., Frame, D. J., Lunt, D. J., Mauritsen, T., Palmer, M. D., Watanabe, M., Wild, M., and Zhang, H.: The Earth’s Energy Budget, Climate Feedbacks, and Climate Sensitivity, in: Climate Change 2021: The Physical Science Basis. Contribution of Working Group I to the Sixth Assessment Report of the Intergovernmental Panel on Climate Change edited by: Masson-Delmotte, V., Zhai, P., Pirani, A., Connors, S. L., Péan, C., Berger, S., Caud, N., Chen, Y., Goldfarb, L., Gomis, M. I., Huang, M., Leitzell, K., Lonnoy, E., Matthews, J. B. R., Maycock, T. K., Waterfield, T., Yelekçi, O., Yu, R., and Zhou, B.: Cambridge University Press, Cambridge, United Kingdom and New York, NY, USA, 923–1054, https://doi.org/10.1017/9781009157896.009, 2021.
Gelaro, R., McCarty, W., Suárez, M. J., Todling, R., Molod, A., Takacs, L., Randles, C. A., Darmenov, A., Bosilovich, M. G., Reichle, R., Wargan, K., Coy, L., Cullather, R., Draper, C., Akella, S., Buchard, V., Conaty, A., da Silva, A. M., Gu, W., Kim, G.-K., Koster, R., Lucchesi, R., Merkova, D., Nielsen, J. E., Partyka, G., Pawson, S., Putman, W., Rienecker, M., Schubert, S. D., Sienkiewicz, M., and Zhao, B.: The Modern-Era Retrospective Analysis for Research and Applications, Version 2 (MERRA-2), J. Clim., 30, 5419–5454, https://doi.org/10.1175/JCLI-D-16-0758.1, 2017.
Gettelman, A., Morrison, H., Santos, S., Bogenschutz, P., and Caldwell, P., M. : Advanced Two-Moment Bulk Microphysics for Global Models. Part II: Global Model Solutions and Aerosol-Cloud Interactions, J. Clim., 28, 1288–1307, https://doi.org/10.1175/JCLI-D-14-00103.1, 2015.
Ghan, S. J.: Technical Note: Estimating aerosol effects on cloud radiative forcing, Atmos. Chem. Phys., 13, 9971–9974, https://doi.org/10.5194/acp-13-9971-2013, 2013.
Glassmeier, F., Hoffmann, F., Johnson, J. S., Yamaguchi, T., Carslaw, K. S., and Feingold, G.: Aerosol-cloud-climate cooling overestimated by ship-track data, Science, 371, 485–489, https://doi.org/10.1126/science.abd3980, 2021.
Golaz, J.-C., Larson, V. E., and Cotton, W. R.: A PDF-Based Model for Boundary Layer Clouds. Part I: Method and Model Description, J. Atmos. Sci., 59, 3540–3551, https://doi.org/10.1175/1520-0469(2002)059<3540:APBMFB>2.0.CO;2, 2002.
Golaz, J. C., Larson, V. E., and Cotton, W. R.: A PDF-based model for boundary layer clouds, Part I: Method and model description, J. Atmos. Sci., 59, 3540–3551, https://doi.org/10.1175/1520-0469(2002)059<3540:APBMFB>2.0.CO;2, 2022a.
Golaz, J.-C., Van Roekel, L. P., Zheng, X., Roberts, A. F., Wolfe, J. D., Lin, W., Bradley, A. M., Tang, Q., Maltrud, M. E., Forsyth, R. M., Zhang, C., Zhou, T., Zhang, K., Zender, C. S., Wu, M., Wang, H., Turner, A. K., Singh, B., Richter, J. H., Qin, Y., Petersen, M. R., Mametjanov, A., Ma, P.-L., Larson, V. E., Krishna, J., Keen, N. D., Jeffery, N., Hunke, E. C., Hannah, W. M., Guba, O., Griffin, B. M., Feng, Y., Engwirda, D., Di Vittorio, A. V., Dang, C., Conlon, L. M., Chen, C.-C.-J., Brunke, M. A., Bisht, G., Benedict, J. J., Asay-Davis, X. S., Zhang, Y., Zhang, M., Zeng, X., Xie, S., Wolfram, P. J., Vo, T., Veneziani, M., Tesfa, T. K., Sreepathi, S., Salinger, A. G., Reeves Eyre, J. E. J., Prather, M. J., Mahajan, S., Li, Q., Jones, P. W., Jacob, R. L., Huebler, G. W., Huang, X., Hillman, B. R., Harrop, B. E., Foucar, J. G., Fang, Y., Comeau, D. S., Caldwell, P. M., Bartoletti, T., Balaguru, K., Taylor, M. A., McCoy, R. B., Leung, L. R., and Bader, D. C.: The DOE E3SM Model Version 2: Overview of the Physical Model and Initial Model Evaluation. J. Adv. Model. Earth Sy., 14, e2022MS003156, https://doi.org/10.1029/2022MS003156, 2022b.
Grisel, O., Mueller, A., Gramfort, L.A., Louppe, G., Fan, T.J., Prettenhofer, P., Blondel, M., Niculae, V., Nothman, J., Lemaitre, G., Joly, A., Estève, L., Boisberranger, J., Vanderplas, J., Kumar, M., Qin, H., Hug, N.,Varoquaux, N., Layton, R., Jalali, A., Rajagopalan, R.V., Schoenberger, J., Jerphanion, J., Yurchak, R., Liu, L., Lorentzen, C., Dupré la Tour, T., Li, W., and Marmo, C.: scikit-learn/scikit-learn: Scikit-learn 1.4.2 (1.4.2), Zenodo [software], https://doi.org/10.5281/zenodo.10951361, 2024.
Guo, H., Golaz, J. C., Donner, L. J., Wyman, B., Zhao, M., and Ginoux, P.: CLUBB as a unified cloud parameterization: Opportunities and challenges, Geophys. Res. Lett., 42, 4540–4547, https://doi.org/10.1002/2015GL063672, 2015.
Hack, J., Boville, B., Briegleb, B., Kiehl, J., and Williamson, D.: Description of the NCAR Community Climate Model (CCM2), UCAR/NCAR Technical Note, https://doi.org/10.5065/d6qz27xv, 1993.
Hannah, W. M., Bradley, A. M., Guba, O., Tang, Q., Golaz, J.-C., and Wolfe, J.: Separating Physics and Dynamics Grids for Improved Computational Efficiency in Spectral Element Earth System Models, J. Adv. Model. Earth Syst., 13, e2020MS002419, https://doi.org/10.1029/2020MS002419, 2021.
Hartmann, D. L. and Short, D. A.: On the Use of Earth Radiation Budget Statistics for Studies of Clouds and Climate, J. Atmos. Sci., 37, 1233–1250, https://doi.org/10.1175/1520-0469(1980)037<1233:OTUOER>2.0.CO;2, 1980.
Hartmann, D. L., Ockert-Bell, M. E., and L. Michelsen, M.: The Effect of Cloud Type on Earth's Energy Balance: Global Analysis, J. Clim., 5, 1281–1304, https://doi.org/10.1175/1520-0442(1992)005<1281:TEOCTO>2.0.CO;2, 1992.
Hillman, B. R., Marchand, R. T., and Ackerman, T. P.: Sensitivities of Simulated Satellite Views of Clouds to Subgrid-Scale Overlap and Condensate Heterogeneity, J. Geophys. Res.-Atmos., 123, 7506–7529, https://doi.org/10.1029/2017JD027680, 2018.
Jing, X., Suzuki, K., Guo, H., Goto, D., Ogura, T., Koshiro, T., and Mülmenstädt, J.: A Multimodel Study on Warm Precipitation Biases in Global Models Compared to Satellite Observations, J. Geophys. Res.-Atmos., 122, 11806–811824, https://doi.org/10.1002/2017JD027310, 2017.
Jing, X., Suzuki, K., and Michibata, T.: The Key Role of Warm Rain Parameterization in Determining the Aerosol Indirect Effect in a Global Climate Model, J. Clim., 32, 4409–4430, https://doi.org/10.1175/JCLI-D-18-0789.1, 2019.
Kay, J. E., Wall, C., Yettella, V., Medeiros, B., Hannay, C., Caldwell, P., and Bitz, C.: Global climate impacts of fixing the Southern Ocean shortwave radiation bias in the Community Earth System Model (CESM), J. Clim., 29, 4617–4636, https://doi.org/10.1175/JCLI-D-15-0358.1, 2016.
Khairoutdinov, M. and Kogan, Y.: A New Cloud Physics Parameterization in a Large-Eddy Simulation Model of Marine Stratocumulus, Mon. Weather Rev., 128, 229–243, https://doi.org/10.1175/1520-0493(2000)128<0229:ANCPPI>2.0.CO;2, 2000.
Klein, S. A. and Jakob, C.: Validation and Sensitivities of Frontal Clouds Simulated by the ECMWF Model, Mon. Weather Rev., 127, 2514–2531, https://doi.org/10.1175/1520-0493(1999)127<2514:VASOFC>2.0.CO;2, 1999.
Kogan, Y.: A Cumulus Cloud Microphysics Parameterization for Cloud-Resolving Models, J. Atmos. Sci., 70, 1423–1436, https://doi.org/10.1175/JAS-D-12-0183.1, 2013.
Larson, V. E.: CLUBB-SILHS: A parameterization of subgrid variability in the atmosphere, arXiv:1711.03675, http://arxiv.org/abs/1711.03675 (last access: 16 April 2024), 2017.
Larson, V. E. and Golaz, J.-C.: Using Probability Density Functions to Derive Consistent Closure Relationships among Higher-Order Moments, Mon. Weather Rev., 133, 1023–1042, https://doi.org/10.1175/MWR2902.1, 2005.
Lin, G., Wan, H., Zhang, K., Qian, Y., and Ghan, S. J.: Can nudging be used to quantify model sensitivities in precipitation and cloud forcing?, J. Adv. Model. Earth Syst., 8, 1073–1091, https://doi.org/10.1002/2016MS000659, 2016.
Liu, X., Easter, R. C., Ghan, S. J., Zaveri, R., Rasch, P., Shi, X., Lamarque, J.-F., Gettelman, A., Morrison, H., Vitt, F., Conley, A., Park, S., Neale, R., Hannay, C., Ekman, A. M. L., Hess, P., Mahowald, N., Collins, W., Iacono, M. J., Bretherton, C. S., Flanner, M. G., and Mitchell, D.: Toward a minimal representation of aerosols in climate models: description and evaluation in the Community Atmosphere Model CAM5, Geosci. Model Dev., 5, 709–739, https://doi.org/10.5194/gmd-5-709-2012, 2012.
Liu, X., Ma, P.-L., Wang, H., Tilmes, S., Singh, B., Easter, R. C., Ghan, S. J., and Rasch, P. J.: Description and evaluation of a new four-mode version of the Modal Aerosol Module (MAM4) within version 5.3 of the Community Atmosphere Model, Geosci. Model Dev., 9, 505–522, https://doi.org/10.5194/gmd-9-505-2016, 2016.
Ma, P. L., Rasch, P. J., Fast, J. D., Easter, R. C., Gustafson Jr, W. I., Liu, X., Ghan, S. J., and Singh, B.: Assessing the CAM5 physics suite in the WRF-Chem model: implementation, resolution sensitivity, and a first evaluation for a regional case study, Geosci. Model Dev., 7, 755–778, https://doi.org/10.5194/gmd-7-755-2014, 2014.
Ma, P. L., Harrop, B. E., Larson, V. E., Neale, R. B., Gettelman, A., Morrison, H., Wang, H., Zhang, K., Klein, S. A., Zelinka, M. D., Zhang, Y., Qian, Y., Yoon, J. H., Jones, C. R., Huang, M., Tai, S. L., Singh, B., Bogenschutz, P. A., Zheng, X., Lin, W., Quaas, J., Chepfer, H., Brunke, M. A., Zeng, X., Mülmenstädt, J., Hagos, S., Zhang, Z., Song, H., Liu, X., Pritchard, M. S., Wan, H., Wang, J., Tang, Q., Caldwell, P. M., Fan, J., Berg, L. K., Fast, J. D., Taylor, M. A., Golaz, J. C., Xie, S., Rasch, P. J., and Leung, L. R.: Better calibration of cloud parameterizations and subgrid effects increases the fidelity of the E3SM Atmosphere Model version 1, Geosci. Model Dev., 15, 2881–2916, https://doi.org/10.5194/gmd-15-2881-2022, 2022.
Mace, G.: Level 2 GEOPROF Product Process Description and Interface Control Document Algorithm version 5.3, CloudSat Project, CIRA, Colorado State University, Fort Collins, 44 pp., https://www.cloudsat.cira.colostate.edu/cloudsat-static/info/dl/2b-geoprof/2B-GEOPROF_PDICD.P_R04.20070628.pdf (last access: 12 April 2024), 2007.
Mangla, R., Indu, J., and Lakshmi, V.: Evaluation of convective storms using spaceborne radars over the Indo-Gangetic Plains and western coast of India, Meteorol. Appl., 27, e1917, https://doi.org/10.1002/met.1917, 2020.
Marchand, R., Mace, G. G., Ackerman, T., and Stephens, G.: Hydrometeor Detection Using Cloudsat – An Earth-Orbiting 94-GHz Cloud Radar, J. Atmos. Ocean. Technol., 25, 519–533, https://doi.org/10.1175/2007JTECHA1006.1, 2008.
Michibata, T. and Suzuki, K.: Reconciling Compensating Errors Between Precipitation Constraints and the Energy Budget in a Climate Model, Geophys. Res. Lett., 47, e2020GL088340, https://doi.org/10.1029/2020GL088340, 2020.
Michibata, T., Kawamoto, K., and Takemura, T.: The effects of aerosols on water cloud microphysics and macrophysics based on satellite-retrieved data over East Asia and the North Pacific, Atmos. Chem. Phys., 14, 11935–11948, https://doi.org/10.5194/acp-14-11935-2014, 2014.
Michibata, T., Suzuki, K., Ogura, T., and Jing, X.: Data for the publication “Incorporation of inline warm rain diagnostics into the COSP2 satellite simulator for process-oriented model evaluation”, Zenodo, https://doi.org/10.5281/zenodo.3370823, 2019a.
Michibata, T., Suzuki, K., Ogura, T., and Jing, X.: Incorporation of inline warm rain diagnostics into the COSP2 satellite simulator for process-oriented model evaluation, Geosci. Model Dev., 12, 4297–4307, https://doi.org/10.5194/gmd-12-4297-2019, 2019b.
Muhlbauer, A., McCoy, I. L., and Wood, R.: Climatology of stratocumulus cloud morphologies: microphysical properties and radiative effects, Atmos. Chem. Phys., 14, 6695–6716, https://doi.org/10.5194/acp-14-6695-2014, 2014.
Mülmenstädt, J. and Feingold, G.: The Radiative Forcing of Aerosol–Cloud Interactions in Liquid Clouds: Wrestling and Embracing Uncertainty, Curr. Clim. Change Rep., 4, 23–40, https://doi.org/10.1007/s40641-018-0089-y, 2018.
Mülmenstädt, J., Nam, C., Salzmann, M., Kretzschmar, J., L'Ecuyer, T. S., Lohmann, U., Ma, P.-L., Myhre, G., Neubauer, D., Stier, P., Suzuki, K., Wang, M., and Quaas, J.: Reducing the aerosol forcing uncertainty using observational constraints on warm rain processes, Sci. Adv., 6, eaaz6433, https://doi.org/10.1126/sciadv.aaz6433, 2020.
Nakajima, T. Y., Suzuki, K., and Stephens, G. L.: Droplet Growth in Warm Water Clouds Observed by the A-Train, Part II: A Multisensor View, J. Atmos. Sci., 67, 1897–1907, https://doi.org/10.1175/2010JAS3276.1, 2010.
NASA: CloudSat Database, NASA [data set], http://www.cloudsat.cira.colostate.edu, last access: 28 June 2023.
ndtest: Multi-dimensional statistical tests with python, GitHub [software], https://github.com/syrte/ndtest/, last access: 16 April 2024.
Park, S., Bretherton, C. S., and Rasch, P. J.: Integrating Cloud Processes in the Community Atmosphere Model, Version 5, J. Clim., 27, 6821–6856, https://doi.org/10.1175/JCLI-D-14-00087.1, 2014.
Partain, P. and Cronk, H.: CloudSat ECMWF-AUX auxillary data product process description and interface control document. California Institute of Techology Jet Propulsion Laboratory Doc., 15 pp., https://www.cloudsat.cira.colostate.edu/, (last access: 24 January 2024), 2017.
Pincus, R. and Baker, M. B.: Effect of precipitation on the albedo susceptibility of clouds in the marine boundary layer, Nature, 372, 250–252, https://doi.org/10.1038/372250a0, 1994.
Platnick, S., Meyer, K. G., King, M. D., Wind, G., Amarasinghe, N., Marchant, B., Arnold, G. T., Zhang, Z., Hubanks, P. A., Holz, R. E., Yang, P., Ridgway, W. L., and Riedi, J.: The MODIS Cloud Optical and Microphysical Products: Collection 6 Updates and Examples From Terra and Aqua, IEEE Trans. Geosci. Remote Sens., 55, 502–525, https://doi.org/10.1109/TGRS.2016.2610522, 2017.
Polonsky, I.: Level 2 cloud optical depth product process description and interface control document, CloudSat Project, CIRA, Colorado State University, Fort Collins, 21 pp., https://www.cloudsat.cira.colostate.edu/cloudsat-static/info/dl/2b-tau/2B-TAU_PDICD.P_R04.20080220.pdf (last access: 12 April 2024), 2008.
Ramanathan, V., Cess, R. D., Harrison, E. F., Minnis, P., Barkstrom, B. R., Ahmad, E., and Hartmann, D.: Cloud-Radiative Forcing and Climate: Results from the Earth Radiation Budget Experiment, Science, 243, 57–63, https://doi.org/10.1126/science.243.4887.57, 1989.
Rasch, P. J., Xie, S., Ma, P. L., Lin, W., Wang, H., Tang, Q., Burrows, S. M., Caldwell, P., Zhang, K., Easter, R. C., Cameron-Smith, P., Singh, B., Wan, H., Golaz, J. C., Harrop, B. E., Roesler, E., Bacmeister, J., Larson, V. E., Evans, K. J., Qian, Y., Taylor, M., Leung, L. R., Zhang, Y., Brent, L., Branstetter, M., Hannay, C., Mahajan, S., Mametjanov, A., Neale, R., Richter, J. H., Yoon, J.-H., Zender, C. S., Bader, D., Flanner, M., Foucar, J. G., Jacob, R., Keen, N., Klein, S. A., Liu, X., Salinger, A. G., Shrivastava, M., and Yang, Y.: An Overview of the Atmospheric Component of the Energy Exascale Earth System Model, J. Adv. Model. Earth Sy., 11, 2377–2411, https://doi.org/10.1029/2019MS001629, 2019.
Sato, Y., Goto, D., Michibata, T., Suzuki, K., Takemura, T., Tomita, H., and Nakajima, T.: Aerosol effects on cloud water amounts were successfully simulated by a global cloud-system resolving model, Nat. Commun., 9, 985, https://doi.org/10.1038/s41467-018-03379-6, 2018.
Smith, C. J., Kramer, R. J., Myhre, G., Alterskjær, K., Collins, W., Sima, A., Boucher, O., Dufresne, J.-L., Nabat, P., Michou, M., Yukimoto, S., Cole, J., Paynter, D., Shiogama, H., O'Connor, F. M., Robertson, E., Wiltshire, A., Andrews, T., Hannay, C., Miller, R., Nazarenko, L., Kirkevåg, A., Olivié, D., Fiedler, S., Lewinschal, A., Mackallah, C., Dix, M., Pincus, R., and Forster, P. M.: Effective radiative forcing and adjustments in CMIP6 models, Atmos. Chem. Phys., 20, 9591–9618, https://doi.org/10.5194/acp-20-9591-2020, 2020.
Song, H., Zhang, Z., Ma, P.-L., Ghan, S. J., and Wang, M.: An Evaluation of Marine Boundary Layer Cloud Property Simulations in the Community Atmosphere Model Using Satellite Observations: Conventional Subgrid Parameterization versus CLUBB, J. Clim., 31, 2299–2320, https://doi.org/10.1175/JCLI-D-17-0277.1, 2018a.
Song, H., Zhang, Z., Ma, P.-L., Ghan, S., and Wang, M.: The importance of considering sub-grid cloud variability when using satellite observations to evaluate the cloud and precipitation simulations in climate models, Geosci. Model Dev., 11, 3147–3158, https://doi.org/10.5194/gmd-11-3147-2018, 2018b.
Stephens, G. L., L'Ecuyer, T., Forbes, R., Gettelmen, A., Golaz, J.-C., Bodas-Salcedo, A., Suzuki, K., Gabriel, P., and Haynes, J.: Dreary state of precipitation in global models, J. Geophys. Res.-Atmos., 115, D24211, https://doi.org/10.1029/2010JD014532, 2010.
Stevens, B. and Feingold, G.: Untangling aerosol effects on clouds and precipitation in a buffered system, Nature, 461, 607–613, https://doi.org/10.1038/nature08281, 2009.
Suzuki, K., Nakajima, T. Y., and Stephens, G. L.: Particle Growth and Drop Collection Efficiency of Warm Clouds as Inferred from Joint CloudSat and MODIS Observations, J. Atmos. Sci., 67, 3019–3032, https://doi.org/10.1175/2010JAS3463.1, 2010.
Suzuki, K., Stephens, G., Bodas-Salcedo, A., Wang, M., Golaz, J.-C., Yokohata, T., and Koshiro, T.: Evaluation of the Warm Rain Formation Process in Global Models with Satellite Observations, J. Atmos. Sci., 72, 3996–4014, https://doi.org/10.1175/JAS-D-14-0265.1, 2015.
Suzuki, K., Stephens, G. L., and Lebsock, M. D.: Aerosol effect on the warm rain formation process: Satellite observations and modeling, J. Geophys. Res.-Atmos., 118, 170–184, https://doi.org/10.1002/jgrd.50043, 2013.
Swales, D. J., Pincus, R., and Bodas-Salcedo, A.: The Cloud Feedback Model Intercomparison Project Observational Simulator Package: Version 2, Geosci. Model Dev., 11, 77–81, https://doi.org/10.5194/gmd-11-77-2018, 2018.
Takahashi, H., Bodas-Salcedo, A., and Stephens, G.: Warm Cloud Evolution, Precipitation, and Their Weak Linkage in HadGEM3: New Process-Level Diagnostics Using A-Train Observations, J. Atmos. Sci., 78, 2075–2087, https://doi.org/10.1175/JAS-D-20-0321.1, 2021.
Tang, S., Fast, J. D., Zhang, K., Hardin, J. C., Varble, A. C., Shilling, J. E., Mei, F., Zawadowicz, M. A., and Ma, P. L.: Earth System Model Aerosol–Cloud Diagnostics (ESMAC Diags) package, version 1: assessing E3SM aerosol predictions using aircraft, ship, and surface measurements, Geosci. Model Dev., 15, 4055–4076, https://doi.org/10.5194/gmd-15-4055-2022, 2022.
Tang, S., Varble, A. C., Fast, J. D., Zhang, K., Wu, P., Dong, X., Mei, F., Pekour, M., Hardin, J. C., and Ma, P.-L.: Earth System Model Aerosol–Cloud Diagnostics (ESMAC Diags) package, version 2: assessing aerosols, clouds, and aerosol–cloud interactions via field campaign and long-term observations, Geosci. Model Dev., 16, 6355–6376, https://doi.org/10.5194/gmd-16-6355-2023, 2023.
Twomey, S.: Pollution and the planetary albedo, Atmos. Environ., 8, 1251–1256, https://doi.org/10.1016/0004-6981(74)90004-3, 1974.
Varble, A. C., Ma, P. L., Christensen, M. W., Mülmenstädt, J., Tang, S., and Fast, J.: Evaluation of liquid cloud albedo susceptibility in E3SM using coupled eastern North Atlantic surface and satellite retrievals, Atmos. Chem. Phys., 23, 13523–13553, https://doi.org/10.5194/acp-23-13523-2023, 2023.
Wang, H., Easter, R. C., Zhang, R., Ma, P. L., Singh, B., Zhang, K., Ganguly, D., Rasch, P. J., Burrows, S. M., Ghan, S. J., Lou, S., Qian, Y., Yang, Y., Feng, Y., Flanner, M., Leung, R. L., Liu, X., Shrivastava, M., Sun, J., Tang, Q., Xie, S., and Yoon, J. H.: Aerosols in the E3SM Version 1: New Developments and Their Impacts on Radiative Forcing, J. Adv. Model. Earth Sy., 12, e2019MS001851, https://doi.org/10.1029/2019MS001851, 2020.
Wang, J., Fan, J., Houze Jr., R. A., Brodzik, S. R., Zhang, K., Zhang, G. J., and Ma, P.-L.: Using radar observations to evaluate 3-D radar echo structure simulated by the Energy Exascale Earth System Model (E3SM) version 1, Geosci. Model Dev., 14, 719–734, https://doi.org/10.5194/gmd-14-719-2021, 2021.
Wang, S., Wang, Q., and Feingold, G.: Turbulence, Condensation, and Liquid Water Transport in Numerically Simulated Nonprecipitating Stratocumulus Clouds, J. Atmos. Sci., 60, 262–278, https://doi.org/10.1175/1520-0469(2003)060<0262:TCALWT>2.0.CO;2, 2003.
Webb, M., Senior, C., Bony, S., and Morcrette, J. J.: Combining ERBE and ISCCP data to assess clouds in the Hadley Centre, ECMWF and LMD atmospheric climate models, Clim. Dynam., 17, 905–922, https://doi.org/10.1007/s003820100157, 2001.
Wood, R.: Drizzle in Stratiform Boundary Layer Clouds, Part II: Microphysical Aspects, J. Atmos. Sci., 62, 3034–3050, https://doi.org/10.1175/JAS3530.1, 2005.
Xie, S., Lin, W., Rasch, P. J., Ma, P.-L., Neale, R., Larson, V. E., Qian, Y., Bogenschutz, P. A., Caldwell, P., Cameron-Smith, P., Golaz, J.-C., Mahajan, S., Singh, B., Tang, Q., Wang, H., Yoon, J.-H., Zhang, K., and Zhang, Y.: Understanding Cloud and Convective Characteristics in Version 1 of the E3SM Atmosphere Model, J. Adv. Model. Earth Syst., 10, 2618–2644, https://doi.org/10.1029/2018MS001350, 2018.
Zhang, G. J. and McFarlane, N. A.: Sensitivity of climate simulations to the parameterization of cumulus convection in the Canadian climate centre general circulation model, Atmos.-Ocean, 33, 407–446, https://doi.org/10.1080/07055900.1995.9649539, 1995.
Zhang, K., Wan, H., Liu, X., Ghan, S. J., Kooperman, G. J., Ma, P. L., Rasch, P. J., Neubauer, D., and Lohmann, U.: Technical Note: On the use of nudging for aerosol–climate model intercomparison studies, Atmos. Chem. Phys., 14, 8631–8645, https://doi.org/10.5194/acp-14-8631-2014, 2014.
Zhang, M., Xie, S., Liu, X., Lin, W., Zheng, X., Golaz, J.-C., and Zhang, Y.: Cloud Phase Simulation at High Latitudes in EAMv2: Evaluation Using CALIPSO Observations and Comparison With EAMv1, J. Geophys. Res.-Atmos., 127, e2022JD037100, https://doi.org/10.1029/2022JD037100, 2022.
Zhang, Y., Klein, S. A., Boyle, J., and Mace, G. G.: Evaluation of tropical cloud and precipitation statistics of Community Atmosphere Model version 3 using CloudSat and CALIPSO data, J. Geophys. Res.-Atmos., 115, D12205, https://doi.org/10.1029/2009JD012006, 2010.