the Creative Commons Attribution 4.0 License.
the Creative Commons Attribution 4.0 License.
 | 07 May 2024
A better representation of volatile organic compound chemistry in WRF-Chem and its impact on ozone over Los Angeles
Rebecca H. Schwantes
Matthew Coggon
Colin Harkins
Jordan Schnell
Havala O. T. Pye
Barry Baker
Zachary Moon
Ravan Ahmadov
Eva Y. Pfannerstill
Bryan Place
Paul Wooldridge
Benjamin C. Schulze
Caleb Arata
Anthony Bucholtz
John H. Seinfeld
Carsten Warneke
Chelsea E. Stockwell
Kristen Zuraski
Michael A. Robinson
J. Andrew Neuman
Patrick R. Veres
Jeff Peischl
Steven S. Brown
Allen H. Goldstein
Ronald C. Cohen
Brian C. McDonald
The declining trend in vehicle emissions has underscored the growing significance of volatile organic compound (VOC) emissions from volatile chemical products (VCPs). However, accurately representing VOC chemistry in simplified chemical mechanisms remains challenging due to its chemical complexity including speciation and reactivity. Previous studies have predominantly focused on VOCs from fossil fuel sources, leading to an underrepresentation of VOC chemistry from VCP sources. We developed an integrated chemical mechanism, RACM2B-VCP, that is compatible with WRF-Chem and is aimed at enhancing the representation of VOC chemistry, particularly from VCP sources, within the present urban environment. Evaluation against the Air Quality System (AQS) network data demonstrates that our model configured with RACM2B-VCP reproduces both the magnitude and spatial variability of O3 and PM2.5 in Los Angeles. Furthermore, evaluation against comprehensive measurements of O3 and PM2.5 precursors from the Reevaluating the Chemistry of Air Pollutants in California (RECAP-CA) airborne campaign and the Southwest Urban NOx and VOC Experiment (SUNVEx) ground site and mobile laboratory campaign confirm the model's accuracy in representing NOx and many VOCs and highlight remaining biases. Although there exists an underprediction in the total VOC reactivity of observed VOC species, our model with RACM2B-VCP exhibits good agreement for VOC markers emitted from different sectors, including biogenic, fossil fuel, and VCP sources. Through sensitivity analyses, we probe the contributions of VCP and fossil fuel emissions to total VOC reactivity and O3. Our results reveal that 52 % of the VOC reactivity and 35 % of the local enhancement of MDA8 O3 arise from anthropogenic VOC emissions in Los Angeles. Significantly, over 50 % of this anthropogenic fraction of either VOC reactivity or O3 is attributed to VCP emissions. The RACM2B-VCP mechanism created, described, and evaluated in this work is ideally suited for accurately representing ozone for the right reasons in the present urban environment where mobile, biogenic, and VCP VOCs are all important contributors to ozone formation.
- Article
(5974 KB) - Full-text XML
-
Supplement
(18074 KB) - BibTeX
- EndNote


Volatile organic compounds (VOCs) are a major contributor to air pollution in urban areas, and some VOCs are harmful to human health (Shuai et al., 2018; Alford and Kumar, 2021). Through reactions with hydroxyl radicals (OH) and nitrogen oxides (NOx), VOCs fuel the formation of ozone (O3) and secondary organic aerosols (SOA). Short- and long-term exposure to O3 and SOA have been linked to numerous adverse health effects, including cardiovascular and respiratory diseases (e.g., Chen et al., 2007; Baltensperger et al., 2008). As North American cities have seen frequent exceedances of O3 and particulate matter (EPA, 2016), VOCs have been targeted for reduction as a means of improving air quality in urban areas.
Mobile sources have historically been the largest emitter of VOCs in urban areas, but emissions from vehicles have declined due to control strategies. California started implementing regulations reducing emissions of VOCs from vehicles early and aggressively. Since 1970 the California Air Resources Board (CARB) mandated automobile manufacturers meet the nation's initial motor vehicle emission standards, aiming to control VOC and NOx emissions. As a result, VOCs in Los Angeles have decreased by almost 2 orders of magnitude during the past 5 decades (Warneke et al., 2012). However, the declining rate of VOCs has slowed in recent years (Kim et al., 2022), indicating a larger contribution of VOCs emitted from non-mobile sources. VOCs such as isoprene and monoterpene are predominantly emitted from biogenic sources (Guenther et al., 1995), which is expected to increase as a response to urban greening programs and as temperatures rise in the future due to climate change (Livesley et al., 2016; Connop et al., 2016; Gu et al., 2021). Additionally, volatile chemical product (VCP) sources, including solvents, adhesives, cleaning agents, pesticides, and personal care products, constitute half of the fossil fuel VOC emissions in industrialized cities (McDonald et al., 2018b). While a missing OH reactivity of 8–10 s−1 was identified at the Pasadena ground site during the CalNex campaign in 2010, approximately 50 % of the missing OH reactivity is estimated to be due to emissions of unmeasured VCPs (Hansen et al., 2021).
The increasing contribution of VOCs from non-mobile sources alters the response of local ozone formation to VOC budgets. Qin et al. (2021) shows that VCP sources produce 41 % of the total photochemical organic PM2.5 and 17 % of the maximum daily 8 h average ozone in the summer in Los Angeles. Similarly, Coggon et al. (2021) shows that VCPs accounted for more than 50 % of the total anthropogenic VOC contribution to ozone in New York City. The effect of biogenic VOCs from urban vegetation on ground-level ozone has been observed in cities such as Berlin (Churkina et al., 2017) and Beijing (Ma et al., 2019). It is worth emphasizing the temperature dependence of ozone can also be altered. Nussbaumer and Cohen (2020) showed that in Los Angeles, VOCs can be categorized into two groups, one that was more independent of temperature and has been effectively controlled and one that is temperature-dependent, which is now a much larger component of the remaining VOC. While O3 is determined by the relative ratio of NOx and VOCs, the response of temperature effects on ozone is nonlinear. For instance, Nussbaumer and Cohen (2020) found a lower temperature dependence of ozone in 2014–2019 than in 1997–1998.
Representing VOC chemistry in model simulations is challenging due to the number of VOC species and corresponding reactions. It is impossible to incorporate the explicit mechanisms of all VOCs into the 3D chemical transport model due to computational expense. To simplify this, the 3D chemical transport model uses a limited number of individual species or surrogates, where a group of species with similar structure and OH reactivity are lumped together into a surrogate. Previous chemical mechanisms have been simplified to primarily focus on representing the VOC chemistry from mobile sources in detail, given that emissions were historically dominated by mobile sources (Middleton et al., 1990). Consequently, an updated mechanism incorporating more complex chemistry is necessary to accurately represent the varying VOC mixture and VOC chemistry in the present urban environment. Coggon et al. (2021) used the RACM-ESRL-VCP mechanism, which added updates to oxygenated VOC chemistry relevant to VCPs to the RACM-ESRL mechanism (Stockwell et al., 1997; Geiger et al., 2003; Kim et al., 2009; Ahmadov et al., 2012). Several advancements have been made beyond the RACM-ESRL mechanism. As an example, RACM2 (Goliff et al., 2013) was created to update ketones, aromatics, and biogenically emitted compounds. RACM2_Berkeley2.0 included updates to the isoprene oxidation mechanism and monoterpene chemistry, as well as an extended mechanism for organic nitrates (Browne et al., 2014; Zare et al., 2018).
In our study, we developed an updated chemical mechanism based on the RACM2_Berkeley2.0 mechanism, named RACM2B-VCP, which aims to better represent VOCs and VOC chemistry in the present urban environment. By starting with the RACM2_Berkeley2.0 mechanism, mobile VOCs are reasonably represented with the updates in RACM2, and biogenic VOCs are represented well with the updates in RACM2_Berkeley2.0. This work builds from this past work to add improved VCP chemistry to create RACM2B-VCP, an integrated chemical mechanism ideally suited for the present urban environment where mobile, biogenic, and VCP VOCs all need to be accurately represented in order to simulate ozone correctly for the right reasons. We evaluate the RACM2B-VCP mechanism by comparing it against a more simplified but established mechanism RACM-ESRL-VCP and against airborne, mobile, and ground measurements. Due to advancements in VOC measurement techniques, unique VOC tracers emitted by VCPs can now be directly measured (Gkatzelis et al., 2020). By adding these VCP VOC tracers explicitly into the RACM2B-VCP mechanism and comparing them directly to observations, we are able to better constrain emission inventories and identify gaps in our understanding of VCP emissions and chemistry than is possible with more condensed mechanisms. Additionally, because the RACM2B-VCP mechanism is more complex than the RACM-ESRL-VCP mechanism, more tracers for mobile and biogenic emissions and their oxidation products are available to directly compare against observations, which enables a more complete evaluation of VOC emissions and chemistry in general. We also utilize the RACM2B-VCP mechanism to investigate the temperature dependence of ozone, which will provide insights into ozone pollution scenarios in the warming future due to climate change. In this work, we describe the development of the RACM2B-VCP chemical mechanism in Sect. 2, the WRF-Chem configuration in Sect. 3, and the observations used for model evaluations in Sect. 4. We then evaluate how WRF-Chem simulation represents O3, PM2.5 (Sect. 5), NOx, CO, VOCs (Sect. 6), PAN, and speciated aerosols (Sect. 7). Lastly, we investigate the impact of VCP emissions and other anthropogenic VOC emissions on VOC reactivity and O3 (Sect. 8).
The RACM2B-VCP mechanism is based on the RACM2_Berkeley2.0 mechanism (Browne et al., 2014; Zare et al., 2018), and includes 8 new species (Table S1) and 25 new reactions. In addition, 43 existing reactions are updated to reflect the latest understanding of kinetics and chemistry. The following sections describe the key updates made to RACM2B-VCP.
2.1 Representation of VCP VOC chemistry
Oxygenated VOCs, including methanol, ethanol, isopropanol, ethylene glycol, propylene glycol, glycerol, and acetone, compose a large fraction of VCP emissions. The RACM2_Berkeley2.0 mechanism already includes the degradation of ethanol, methanol, acetone, and ethylene glycol. We add isopropanol, propylene glycol, and glycerol as new species into RACM2B-VCP. The products of OH reactions and the reaction coefficients are the same as those in RACM-ESRL-VCP, which is described in Coggon et al. (2021). Each species serves as a surrogate for other oxygenated VOCs emitted from VCPs, which are largely composed of glycols and glycol ethers. A description of the lumping schemes is provided in the supplemental information of Coggon et al. (2021).
VOC tracers linked to specific VCP categories have been identified in Gkatzelis et al. (2020); therefore, we implement four tracers as separate species in order to validate the VCP emissions as model inputs. These four tracers are D4-siloxane, D5-siloxane, p-dichlorobenzene (PDCBZ) and p-chlorobenzotrifluoride (PCBTF). D4-siloxane and D5-siloxane are predominantly emitted from adhesives and personal care products, respectively. Alton and Browne (2020) and Alton and Browne (2022) determined the kinetics and products of oxidation by the OH radical. The oxidation products of both D4-siloxane and D5-siloxane are C3 and higher alcohols (ROH). D5-siloxane has a higher reactivity towards OH radicals and has a reaction constant of 2.1 × 10⁻¹² cm3 molec.−1 s−1. In contrast, the reaction constant of D4-siloxane with OH is 1.3 × 10⁻¹² cm3 molec.−1 s−1. P-dichlorobenzene and p-chlorobenzotrifluoride are treated as tracers for insecticides and solvent-based coatings, respectively. We assume their products with OH reactions are the same as species with the closest functional structure. We assume that p-dichlorobenzene oxidation by OH yields the same products as benzene, and the reaction constant is 3.2 × 10⁻¹³ cm3 molec.−1 s−1 (Atkinson and Arey, 2003). The p-chlorobenzotrifluoride oxidation by OH yields the same products as toluene, and the reaction constant is 2.5 × 10⁻¹³ cm3 molec.−1 s−1 (Atkinson and Arey, 2003). The addition of reactions associated with the VCP VOC chemistry in the RACM2B-VCP mechanism is summarized in Table S2.
2.2 Implementation of Tropospheric Ultraviolet and Visible photolysis scheme
The Tropospheric Ultraviolet and Visible (TUV) radiation model version 5.3.2 (Madronich and Flocke, 1997) is used for photolysis parameterization. While this TUV scheme had previously only been coupled with MOZART mechanisms in WRF-Chem (ACOM, 2021), we add the capability to link it to both RACM-ESRL-VCP and RACM2B-VCP mechanisms. The photolysis reactions in both mechanisms are mapped with an optional scaling factor to photolysis rate constants already incorporated into the TUV lookup table. The mapping between RACM-ESRL-VCP and TUV is described in Table S3, and the mapping between RACM2B-VCP and TUV is described in Tables S4 and S5. For instance, the hydroperoxy aldehydes (HPALD1 and HPALD2) are not included in the TUV lookup table. We assume that the hydroperoxy aldehydes photolyze with the cross sections of methacrolein (Wennberg et al., 2018) and the quantum yield estimated by Liu et al. (2017). The organic nitrates, including ethanal nitrate (ETHLN), propanone nitrate (PROPNN), methacrolein nitrate (MACRN), and methyl vinyl ketone nitrate (MVKN), are mapped to nitrate organic aerosol (NOA) in TUV based on scaling from MCM v3.3.1 as done in Schwantes et al. (2020). All hydroxy nitrates are assumed to photolyze with the same rate of CH2OHCH2ONO2 computed in TUV.
2.3 Implementation of secondary organic aerosol (SOA) scheme
Both RACM-ESRL-VCP and RACM2B-VCP mechanisms use the MADE (Modal Aerosol Dynamics for Europe) aerosol scheme (Ackermann et al., 1998). The RACM2_Berkeley2.0 mechanism inherits the SORGAM parameterization for secondary organic aerosol (SOA) (Schell et al., 2001). This parameterization has been proven to substantially underestimate the SOA production and the abundance of organic aerosol (OA) in urban plumes (McKeen et al., 2007). We choose to replace this outdated SOA parameterization with the new SOA_VBS parameterization (Ahmadov et al., 2012) that is used in the RACM-ESRL-VCP mechanism. This SOA scheme is based on the volatility basis set and categorizes each SOA class into four volatility bins. The VOCs forming SOA are divided into two groups, anthropogenic and biogenic. We re-speciate the RACM2B-VCP species to the Ahmadov et al. (2012) scheme as shown in Table S6 but keep the same general structure and SOA yields. We note that the SOA scheme in both RACM-ESRL-VCP and RACM2B-VCP likely overestimates SOA from mobile emissions due to producing SOA from both aromatic VOCs (e.g., toluene) and their oxidation products (e.g., cresol) and underestimates SOA from VCPs, which are generally not considered as SOA precursors in this scheme. Future work will update this SOA scheme to more accurately represent SOA formation from biogenic, mobile, and VCP sources.
2.4 Implementation of aerosol uptake coefficients
Aerosol uptake has been proven to be a significant loss pathway for gas-phase organic nitrates from lab and field studies (Day et al., 2010; Darer et al., 2011; Hu et al., 2011; Jacobs et al., 2014; Fry et al., 2013; Teng et al., 2017). It has recently been applied to several mechanisms used in 3D chemical transport models (Schwantes et al., 2020; Zare et al., 2018, 2019; Bates and Jacob, 2019; Müller et al., 2019). In the RACM2_Berkeley2.0 mechanism, the uptake of isoprene nitrates and monoterpene nitrates are described by constant reaction rates. These reaction rates are determined using an estimated fraction of tertiary vs. non-tertiary nitrate (Zare et al., 2018) and a timescale of 3 h for tertiary nitrates, where the latter is based on a laboratory chamber study (Boyd et al., 2015). Here, we update them to a parameterization using the uptake coefficient (γ), aerosol surface area, and aerosol diameter, with the same approach as applied to the MOZART-T1 mechanism in WRF-Chem (Emmons et al., 2020). To account for the difference in the solubility, we apply an uptake coefficient of 0.005 for isoprene nitrates and 0.01 for all monoterpene nitrates following Fisher et al. (2016). Even though monoterpene nitrates are likely to lead to SOA production (Zare et al., 2019; Pye et al., 2015), we attribute the products of aerosol uptake of organic nitrates to gas-phase nitric acid and do not account for the particle phase hydrolysis afterward.
The aerosol uptake of inorganic species is also important (Jacob, 2000). RACM2_Berkeley2.0 accounts for the N2O5 uptake, forming HNO3, with a constant reaction rate. We update the N2O5 uptake and also add the aerosol uptakes of NO3, NO2, and HO2. Following Jacob (2000), we define the N2O5 uptake with of 0.1, the NO3 uptake with of 10−3 and the NO2 uptake with of 10−4. We also define the product of NO3 to HNO3, and the products of NO2 to HONO and HNO3. However, we note that other studies suggest different uptake coefficients and products for N2O5 (Brown and Stutz, 2012; Chang et al., 2016; McDuffie et al., 2018), NO3 (Brown and Stutz, 2012), and NO2 (VandenBoer et al., 2013, 2015). The aerosol uptake of HO2 is highly uncertain. Despite evidence in some studies suggesting that HO2 uptake does not occur (e.g., Tan et al., 2020), Jacob (2000) recommended that the product of HO2 uptake is H2O2, and it limits the efficiency as an HO2 sink as H2O2 photolyzes to regenerate OH and from there HO2. Mao et al. (2013) proposed a catalytic mechanism to rapidly convert HO2 to H2O in aqueous aerosols with transition metal ions (Cu and Fe). The alternative H2O formation serves as a dominant HO2 loss pathway in remote environments such as the Arctic (Mao et al., 2010). Previous studies have reported a wide scattering of HO2 uptake coefficients , ranging from 0.1 (Christian et al., 2017) to 1.0 (Emmons et al., 2015). In RACM2B-VCP, we decided to take H2O as the product of HO2 uptake and an uptake coefficient of 0.1, which is consistent with the treatment of HO2 uptake in GEOS-Chem (Christian et al., 2017) and CAM-Chem (Gaubert et al., 2020). All uptake coefficients of both organic nitrates and inorganic species are summarized in Table S7.
2.5 Implementation of eucalyptol and updates to reactions rate
We add a new species ECLP to represent eucalyptol. The monoterpenes measured from the proton-transfer-reaction mass spectrometer (PTR-MS) instrument could be biased high due to the interference of eucalyptol (Kari et al., 2018). Furthermore, eucalyptol has been shown to be an important contributor to monoterpenoid emissions in the LA Basin (Van Rooy et al., 2021). Monoterpenes are measured at 137.13, which may include fragments of monoterpenoids and monoterpene alcohols whose parent mass is 155.14 (C10H18O, e.g., eucalyptol). We account for the reaction of eucalyptol with OH; the products are the same as HC8 surrogate species and the rate constant is 1.1 × 10⁻¹¹ cm3 molec.−1 s−1 (Corchnoy and Atkinson, 1990). Compared to alpha-pinene and limonene, whose reaction rates with OH are 5.2 × 10⁻¹¹ cm3 molec.−1 s−1 and 1.6 × 10⁻¹⁰ cm3 molec.−1 s−1 at the temperature of 300 K, eucalyptol has much lower reactivity. RACM2B-VCP now has three monoterpene–monoterpenoid surrogates that span an OH reactivity of an order of magnitude, which is especially important for evaluating total monoterpenes against aircraft observations where some more reactive monoterpenes have already declined due to chemical loss.
We also update the inorganic reaction rate to the most recent reaction rates from JPL Evaluation Number 19 (Burkholder et al., 2020). The changes are summarized in Table S8. The only exception is the reaction of O(3P) + NO2 → NO + O2, we use the reaction rates from JPL Evaluation Number 18 since JPL Evaluation Number 19 combines the reactions of O(3P) + NO2 → NO + O2 and O(3P) + NO2 → NO3.
Both chemical mechanisms, RACM-ESRL-VCP and RACM2B-VCP, are incorporated into the 3D chemical transport model, Weather Research and Forecasting with Chemistry v4.2.2 (WRF-Chem). WRF-Chem was set up with a horizontal spatial resolution of 4 km × 4 km and 50 vertical layers in California and Nevada (Fig. S1) during the summer of 2021. It is a nested-domain simulation with the initial conditions constrained by a preceding 12 km × 12 km model simulation covering the Contiguous US. We use the static boundary condition described in McDonald et al. (2018b). The model configuration is explained further in Li et al. (2021) and summarized here.
The meteorological fields in the 12 km model run are initiated with the North American Mesoscale Forecast System (NAM) model. In the 4 km model run, we utilize the meteorological fields from the High-Resolution Rapid Refresh (HRRR) model due to a higher spatial resolution (3 km) than NAM (12 km). The MYNN–EDMF planetary boundary layer and shallow-cloud scheme (Olson et al., 2019; Angevine et al., 2020) are used. This scheme includes vertical mixing of chemical species consistent with its mixing of physical variables.
The anthropogenic emissions here are from the FIVE-VCP-NEI17NRT inventory. This inventory is described by McDonald et al. (2018a, b) and Coggon et al. (2021) and updated by He et al. (2024) with near-real-time (NRT) scaling factors capturing changes in emissions in the 2019–2021 time frame, such as those due to the COVID-19 pandemic. Mobile source emissions are from the Fuel Based Inventory for Vehicle Emissions (FIVE) and are updated using fuel sales. VCP emissions are calculated using a mass balance of US chemical product manufacturing for 2010 (McDonald et al., 2018a; Coggon et al., 2021) and updated using economic activity scaling factors. Other sectors in the inventory are from the U.S. Environmental Protection Agency's (EPA) 2017 National Emissions Inventory (NEI) and, where applicable, updated with near-real-time scaling factors calculated from energy and economic metrics relevant to specific subsectors. The emission inventories are re-speciated for both RACM-ESRL-VCP and RACM2B-VCP mechanisms. The mapping between emission inventories and species in both mechanisms is described in Table S9. Because the RACM2B-VCP mechanism has more species, the mapping is more explicit and requires fewer scaling factors. For instance, benzene is mapped to toluene in the RACM-ESRL-VCP mechanism. We need to apply a scaling factor of 0.29 to account for the difference in OH reactivity between benzene and toluene. In contrast, benzene and toluene are treated as separate species in the RACM2B-VCP mechanism. There is no need to apply the scaling as it is in RACM-ESRL-VCP, which improves the representation of aromatic oxidation and enables a more fair evaluation against observations.
The biogenic emissions are based on the Biogenic Emission Inventory System (BEIS) v3.14. We have considered urban vegetation as additional biogenic emissions and linked them to urban land cover types and leaf area index. For the biogenic emission used in both the RACM-ESRL-VCP and RACM2B-VCP mechanism, we add additional isoprene and monoterpene emissions following Scott and Benjamin (2003) with re-speciation for monoterpene in the RACM2B-VCP mechanism. Among the monoterpene emissions, we assume that 20 % is limonene and 80 % is alpha-pinene, which is the same as the previous work over the LA region (Kim et al., 2016). Besides, we update the urban biogenic emission to account for the emission of eucalyptol as included in the RACM2B-VCP mechanism. Eucalyptol constitutes a significant portion of total monoterpene emissions, ranging from 2 % and 72 % depending on the tree types (Owen and Penuelas, 2013; Van Meeningen et al., 2017; Zuo et al., 2017; Purser et al., 2021). Van Rooy et al. (2021) provided the most recent biogenic VOC observations in the Los Angeles Basin and found that eucalyptol comprises 10 % of total monoterpene emissions. Therefore, we adjust the ratio of monoterpene emissions in accordance with Van Rooy et al. (2021), with 37 % limonene, 53 % alpha-pinene, and 10 % eucalyptol for the RACM2B-VCP mechanism.
Figure 1 shows a variety of observations in LA during summertime 2021 to evaluate the WRF-Chem simulations with the RACM2-VCP mechanism, including airborne, mobile, and ground measurements. The instruments for the measurements used in our study are summarized in Table S10.
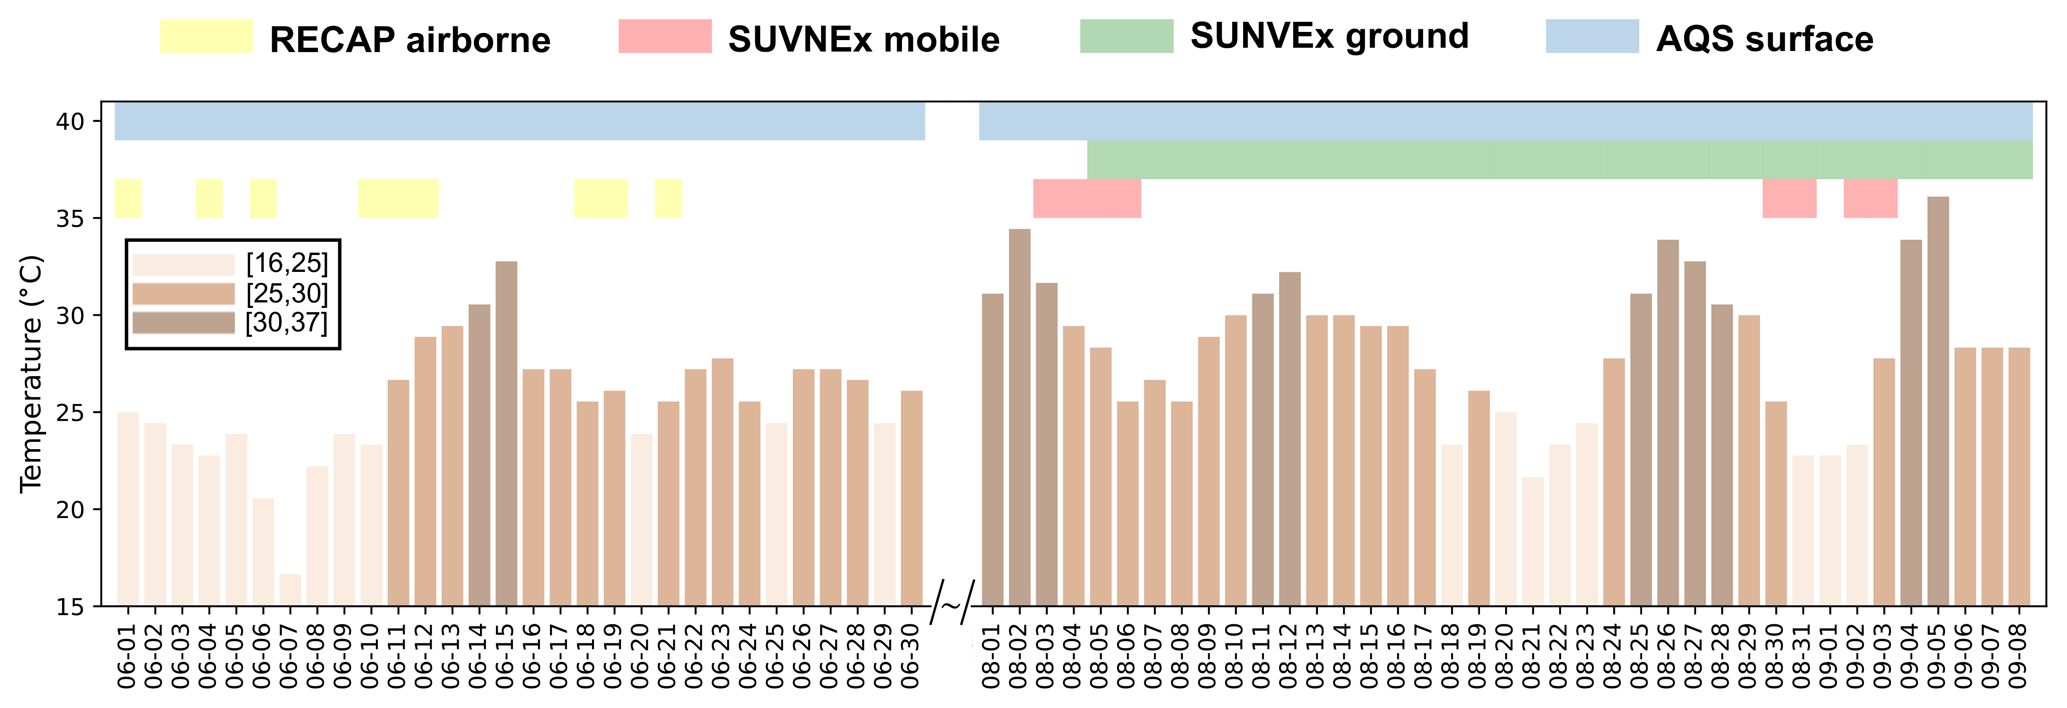
Figure 1The summary of observations used for WRF-Chem evaluation spanning 1 June to 8 September 2021. It includes 9 d of airborne measurements from the RECAP-CA field campaign in June 2021; 8 d of mobile measurements from the SUNVEx field campaign in August and September 2021; ground site measurements from SUNVEx between 5 August and 8 September 2021; and continuous surface measurements at AQS monitoring sites in June, August, and September 2021. The days are categorized into three groups based on the surface temperature at noon in Pasadena: “low temperature” between 16 to 25 °C, “median temperature” between 25 to 30 °C, and “high temperature” between 30 to 37 °C.
The airborne measurements were conducted during the RECAP-CA (Re-evaluating the Chemistry of Air Pollutants in California) field campaign. Nine flights were conducted between 11:00 to 18:00 LT (unless indicated otherwise, local time has been used throughout this work) on 1–22 June 2021, at 300–400 m a.g.l. The flight tracks are shown in Fig. S2a and are segregated into four regions following Pfannerstill et al. (2023b) and Nussbaumer et al. (2023), including Downtown LA, San Bernardino Valley, Santa Ana Valley, and Coastal LA. The instruments on board include a three-channel custom-built thermal-dissociation laser-induced fluorescence (TD-LIF) to measure NOx (Zhu et al., 2023), a Vocus PTR-ToF-MS (Proton transfer reaction time-of-flight mass spectrometer) to measure VOCs (Pfannerstill et al., 2023b), and a Picarro G2401-m cavity ring-down spectrometer (CRDS) to measure CO and CH4. The primary goal of RECAP-CA was to derive the NOx and VOC fluxes and to evaluate the emission inventory (Zhu et al., 2023; Pfannerstill et al., 2023b, a; Nussbaumer et al., 2023). In our study, we utilize the observations of CO, NOx, and VOCs during RECAP-CA to compare against the WRF-Chem simulations and to evaluate the model performance in representing NOx and VOC chemistry aloft within the mixing layer.
Additionally, the mobile laboratory and ground site measurements were conducted in August and early September 2021 as part of the SUNVEx (Southwest Urban NOx and VOC Experiment, https://csl.noaa.gov/projects/sunvex/, last access: 27 April 2024) field campaign led by the NOAA Chemical Sciences Laboratory. Four drives were made between 07:00 to 19:00 LT at the beginning of the month between 3–6 August 2021, and four other drives were made toward the end of the month between 30 August–3 September 2021. The mobile drives are shown in Fig. S2b and are segregated into the same four regions as RECAP-CA. Likewise, a ground site in Pasadena continuously monitored NOx and VOC chemistry for the whole of August and early September. Here we only include the measurements between 08:00 to 20:00 LT to assess the daytime chemistry. During the SUNVEx field campaign, VOCs were measured by a Vocus PTR-ToF-MS as described by Coggon et al. (2024). NOx and CO were measured by NOAA Picarro. In addition, at the ground site, PAN is measured by the NOAA Iodide Chemical Ionization Mass Spectrometer (CIMS), while speciated aerosols are measured by the Aerosol Mass Spectrometer (AMS).
We also utilize the hourly ozone and PM2.5 observations from the Air Quality System (AQS) monitoring network reported by the U.S. Environmental Protection Agency (EPA). Based on the measurement scale of the AQS sites reported by EPA, one site (Ontario-Route 60 Near Road, −117.62, 34.03°), representing the micro-scale environment, and another site (Pomona, −117.75, 34.07°), representing the middle-scale environment, are filtered out as WRF-Chem at 4 km cannot represent the dynamics and chemistry at the spatial scale less than 2 km. After filtering, we obtained ozone measurements at 12 sites (Table S11) and PM2.5 measurements at 5 sites (Table S12) in the LA Basin; the site map is shown in Fig. S3.
The observations cover a wide range of temperatures, allowing us to investigate how the model represents the chemistry in different temperature conditions. To normalize the temperature across the different campaigns, we use the local noontime surface temperature at the Pasadena AQS site as the indicator of daily temperature and categorize the days into three temperature bins: “low temperature” between 16 to 25 °C, “med temperature” between 25 to 30 °C, and “high temperature” between 30 to 37 °C.
O3 and PM2.5 are two critical criteria pollutants, and accurately representing them is crucial for the model's reliability. The RACM-ESRL-VCP mechanism and its predecessor, combined with the FIVE-VCP emission inventory, have demonstrated effectiveness in simulating O3 in the LA Basin (Kim et al., 2016; McDonald et al., 2018b; Kim et al., 2022). In particular, Kim et al. (2022) demonstrated that the WRF-Chem model using the RACM-ESRL mechanism successfully reproduced the diurnal variations and annual evolution of O3 observed at 16 sites from the South Coast Air Quality Management District (AQMD) monitoring network, despite a ∼ 14 % overprediction. Here, we evaluate the performance of the WRF-Chem model configured with the RACM2B-VCP mechanism in simulating O3 and PM2.5, by comparing against not only the observations from the AQS network but also the WRF-Chem simulation with the RACM-ESRL-VCP mechanism.
We first compare hourly O3 and PM2.5 from model simulations against the measurements in AQS sites. Figure 2 shows the comparison of the time series of hourly O3 in June and August at the AQS site located at Pasadena (−118.13, 34.13°). Both WRF-Chem simulations, configured with RACM-ESRL-VCP and RACM2B-VCP chemical mechanisms, capture the diurnal pattern and the day-to-day variation of O3. The WRF-Chem with RACM-ESRL-VCP mechanism yields a normalized mean bias (NMB) of 0.11 and a determination of coefficient (R2) of 0.82. Similarly, the WRF-Chem with RACM2B-VCP mechanism yields an NMB of 0.08 and an R2 of 0.83. Table S11 summarizes the comparison of hourly O3 among 12 AQS sites. The WRF-Chem with RACM-ESRL-VCP mechanism reports the NMB ranging from −0.13 to 0.27 and the R2 ranging from 0.54 to 0.89, and the WRF-Chem with RACM2B-VCP mechanism reports the NMB ranging from −0.17 to 0.22 and the R2 ranging from 0.52 to 0.90. Figure S4 shows the comparison of the time series of hourly PM2.5 in both months at the Ontario AQS site (−117.62, 34.03°), and Table S12 summarizes the comparison of hourly PM2.5 among five sites. Both WRF-Chem simulations underpredict PM2.5, the NMB is from −0.23 to −0.06 for the RACM-ESRL-VCP mechanism and is from −0.23 to −0.07 for the RACM2B-VCP mechanism. However, the model fails to capture the hourly variation of PM2.5 observed at AQS sites, with the R2 ranging from 0.03 to 0.24 for both RACM-ESRL-VCP and RACM2B-VCP mechanisms.
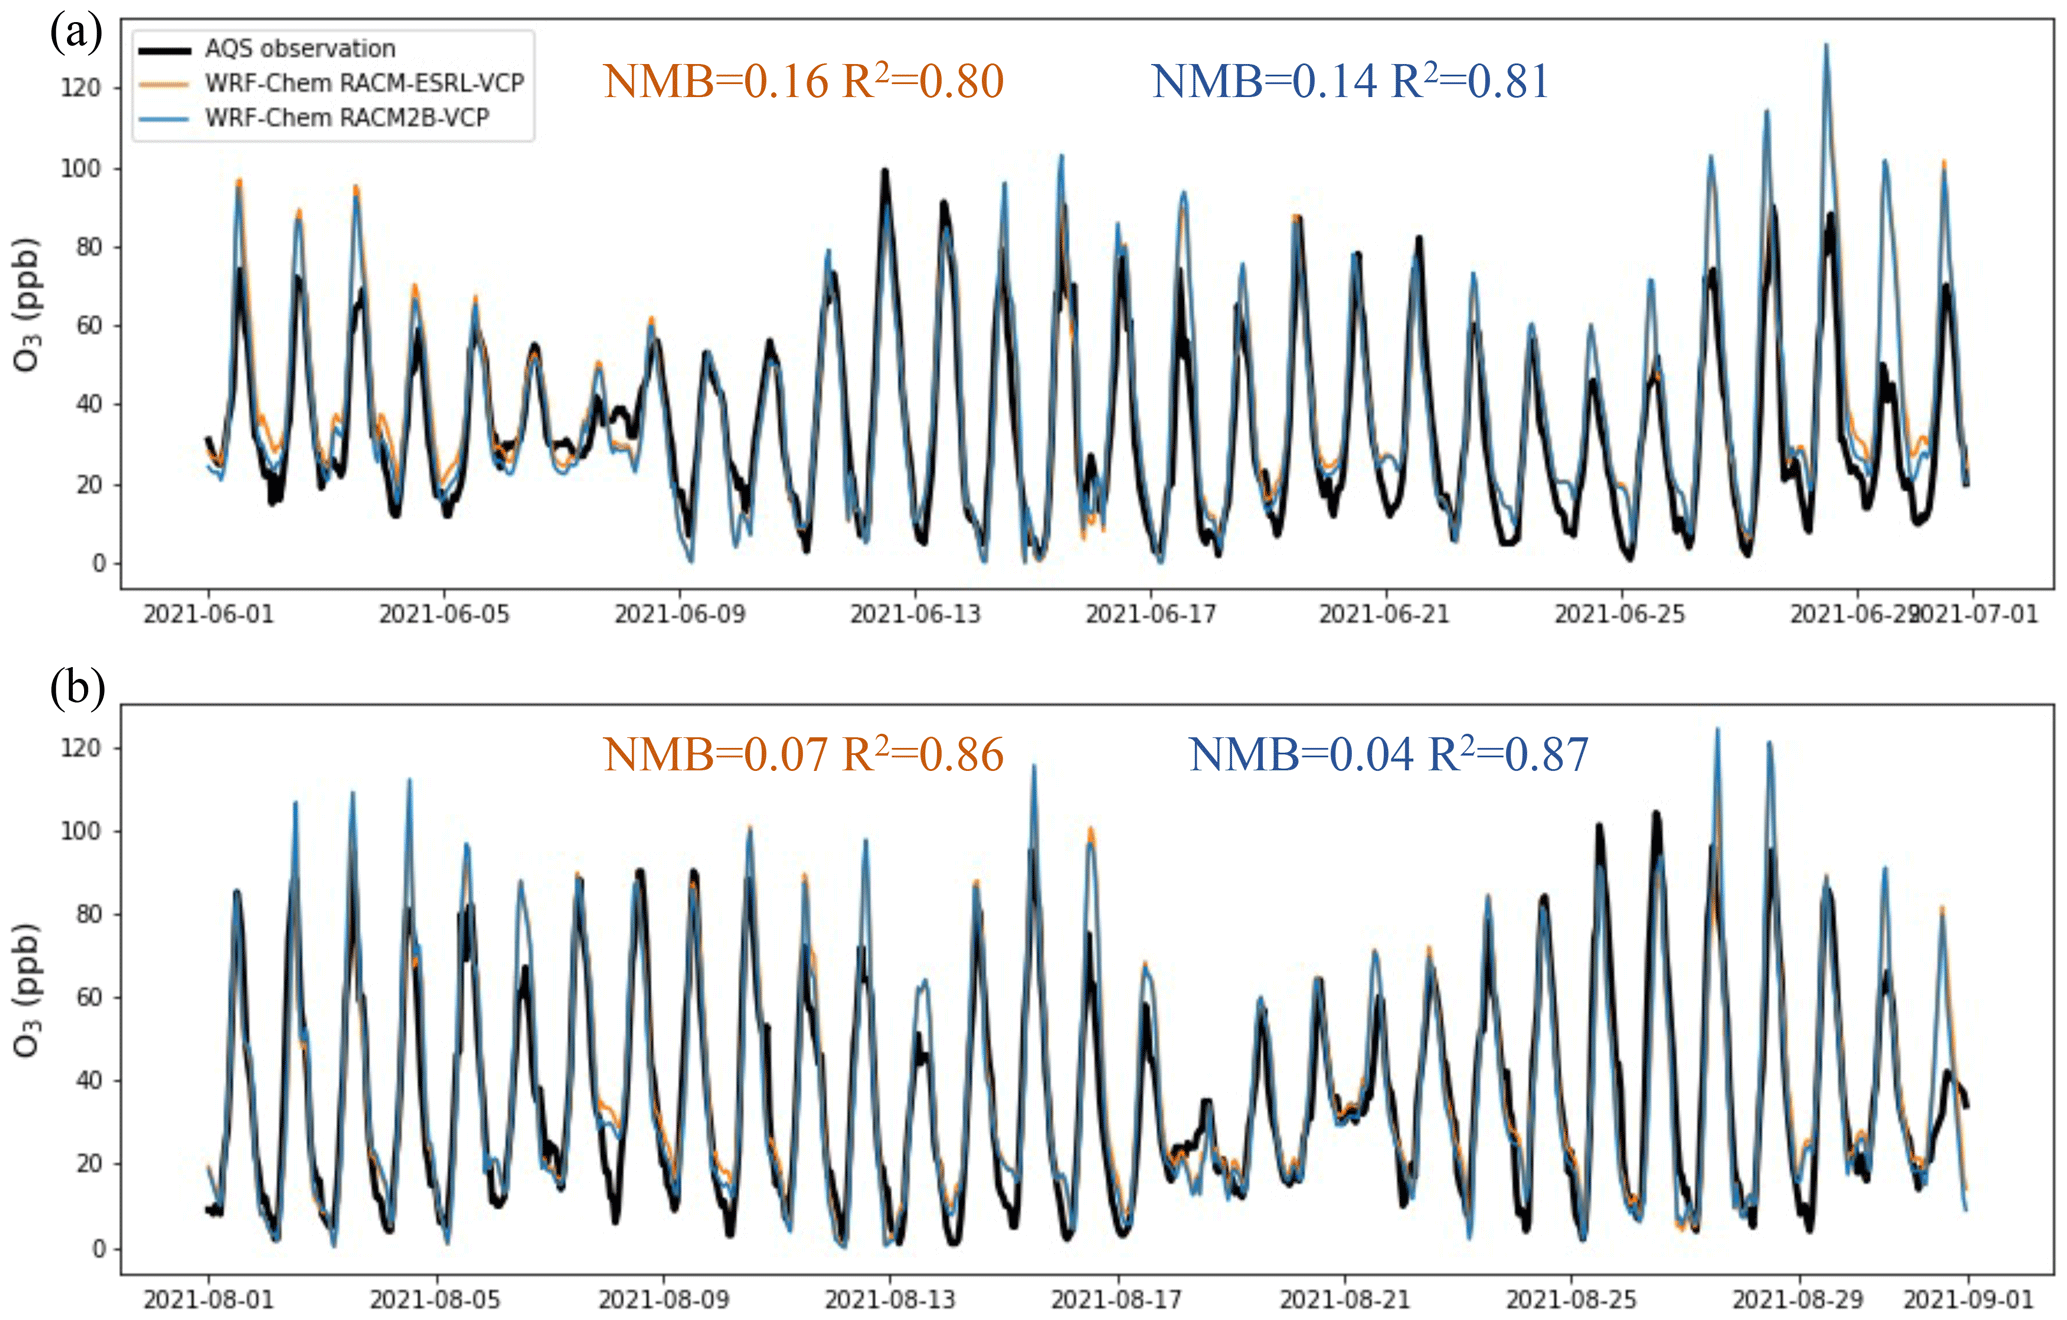
Figure 2The comparison of time series of hourly O3 between AQS and two WRF-Chem simulations, one with RACM-ESRL-VCP and another with the RACM2B-VCP chemical mechanism at the AQS site located at Pasadena (−118.13, 34.13°). The corresponding NMB and R2 between model simulations and observations of hourly O3 are shown in each plot.
We then compare O3 and PM2.5 at the timescale that is consistent with the National Ambient Air Quality Standards (NAAQS), namely MDA8 (maximum 8 h average) O3 and daily (24 h) PM2.5 concentrations. The comparison of the spatial distribution of MDA8 O3 and daily PM2.5 is shown in Fig. S5. We further categorize the sites west of longitude −117.8° as West/Central LA and the remaining sites as East Basin. The comparison is shown in Fig. 3a and c for O3 and PM2.5, respectively. Generally, the East Basin exhibited significantly higher pollution levels compared to the West/Central LA, characterized by an average difference of 25 ppb in MDA8 O3 and 2.7 µ g m−3 in daily PM2.5 based on the AQS network observations. Both WRF-Chem simulations successfully reproduce the positive gradient of pollution levels between West/Central LA and East Basin, despite an overprediction in MDA8 O3 and an underprediction in daily PM2.5. WRF-Chem with the RACM2B-VCP mechanism shows slightly better results than the RACM-ESRL-VCP mechanism with respect to NMB. The NMB in MDA8 O3 is 10.7 % and 9.3 % and the NMB in daily PM2.5 is −13 % and −11.9 % for WRF-Chem with RACM-ESRL-VCP and RACM2B-VCP mechanisms, respectively.

Figure 3The comparison of MDA8 O3 and daily PM2.5 between AQS observations (gray) and WRF-Chem simulations configured with RACM-ESRL-VCP (orange) and RACM2B-VCP (blue) chemical mechanisms, respectively. Panels (a) and (c) are the site-wise MDA8 O3 and daily PM2.5 averages. Panels (b) and (d) are the weekday–weekend difference relative to the average of MDA8 O3 (Δ MDA8 O3) and daily PM2.5 (Δ daily PM2.5). The box is the interquartile range with the line of the median value and the black dot representing the mean value across the sites in West/Central LA and East Basin. The maximum and minimum values are shown by the whiskers. The corresponding R2 between model simulations and observations of MDA8 O3 in West/Central LA and the East Basin is shown in each plot. While there are only five AQS sites with available PM2.5 observations, the R2 between model simulations and observations of daily PM2.5 is calculated for all five sites regardless of the location.
Additionally, we analyzed the weekday–weekend difference in MDA8 O3 and daily PM2.5. In the LA Basin, NOx emissions on weekends substantially decline due to reduced heavy-duty truck activities compared to weekdays (McDonald et al., 2012; Kim et al., 2016) while VOC emissions stay relatively constant. Analyzing disparities between weekdays and weekends serves as a method to evaluate how O3 and PM2.5 pollution respond to a reduction in NOx emissions. The spatial distributions of the weekday–weekend difference of MDA8 O3 and daily PM2.5 from both observations and model simulations are shown in Fig. S6. In West/Central LA, the MDA8 O3 is on average 14.1 % (9.8 %–17.8 %, minimum–maximum) lower during weekdays. The East Basin exhibits a 5.6 % (2.9 %–8.5 %) lower weekday MDA8 O3. In Fig. 3b, the model simulations are able to reproduce this weekday–weekend difference in MDA8 O3. WRF-Chem with the RACM-ESRL-VCP mechanism exhibits 6.9 % (3.7 %–10.8 %) and 2.8 % (1.9 %–3.6 %) lower MDA8 O3 in the West/Central LA and the East Basin. WRF-Chem with the RACM2B-VCP mechanism exhibits 7.8 % (4.7 %–11.8 %) and 1.7 % (1.1 %–2.4 %) lower MDA8 O3 in each region. For daily PM2.5 in Fig. 3d, we observe an opposite weekday–weekend pattern between West/Central LA and East Basin. The daily PM2.5 is 6.9 % (11.5 %–2.0 %) lower during weekdays in West/Central LA and is 8.8 % (8.2 %–9.5 %) higher during weekdays in East Basin. While both model simulations agreed well with the observations in West/Central LA (−6.6 % for RACM-ESRL-VCP and −5.9 % for RACM2B-VCP), only the model with the RACM2B-VCP mechanism could reproduce the positive weekday–weekend difference in the East Basin, albeit still underestimating the magnitude (−2.2 % for RACM-ESRL-VCP and 3.5 % for RACM2B-VCP). However, it is worth noting that this result might be biased due to the limited number of sites available for daily PM2.5 measurements, only three sites in West/Central LA and two sites in East Basin.
The model's ability to accurately simulate the temperature dependence of MDA8 O3 and daily PM2.5 is of utmost importance for accurately predicting pollutant trends in warmer climates. By segregating the data into three temperature bins defined in Sect. 4, we find significant positive temperature dependence of O3 and PM2.5 in both observations and model simulations, depicted in Fig. 4. The average MDA8 O3 increases from 48.4 ppb (12.3 ppb, standard deviation) to 56.8 ppb (19.4 ppb) on days with low temperature to days with median temperature and further increases to 63.1 ppb (18.5 ppb) on days with high temperature. WRF-Chem simulations successfully replicate the temperature patterns of MDA8 O3. An 8.3 ppb increase from low-temperature days to median-temperature days and a 4.4 ppb increase from median-temperature days to high-temperature days are found in WRF-Chem with RACM-ESRL-VCP mechanism; correspondingly, 9.4 and 6.8 ppb increases are found in WRF-Chem with the RACM2B-VCP mechanism. However, for daily PM2.5, the model failed to fully capture the temperature dependence, particularly exhibiting a low bias in median-to-high-temperature days. While the observation presents an increase of 2.55 µg m−3 in daily PM2.5 from low-temperature days to median-temperature days, WRF-Chem simulations only see an increase of 0.63–0.68 µg m−3 in daily PM2.5.
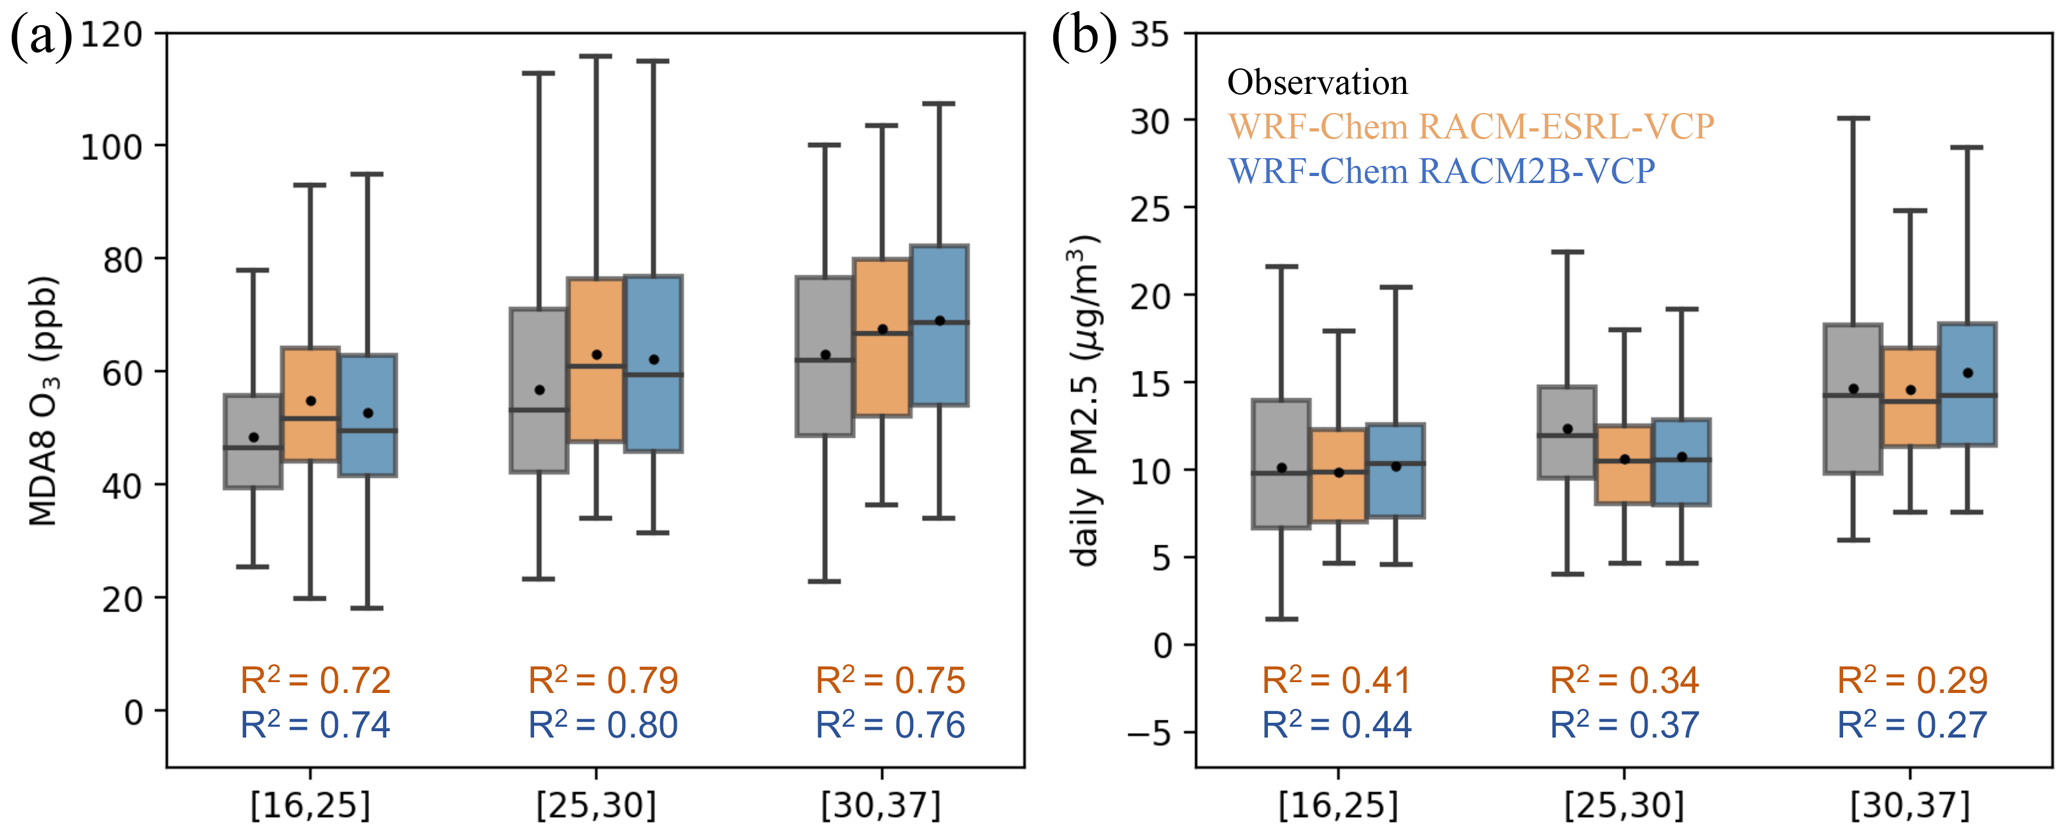
Figure 4The comparison of the temperature dependence of MDA8 O3 (a) and daily PM2.5 (b) between AQS observations (gray) and WRF-Chem simulations configured with RACM-ESRL-VCP (orange) and RACM2B-VCP (blue) chemical mechanisms, respectively. MDA8 O3 and daily PM2.5 from observations and model simulations are segregated into days with three temperature bins, as defined in Sect. 4. The variation in each bin is shown by a whisker plot, where the black dot denotes the mean value and the line denotes the median value. The corresponding R2 between model simulations and observations of MDA8 O3 and daily PM2.5 in each temperature bin is shown in each plot.
In conclusion, the model simulations demonstrated promising results for both O3 and PM2.5 in the LA Basin. The RACM2B-VCP mechanism performed as well as and sometimes better than the RACM-ESRL-VCP mechanism, highlighting its potential for air quality modeling in the region. Given the poor correlation between observation and model simulations in hourly PM2.5 (Table S12) and the underprediction of PM2.5 at higher temperatures (Fig. 4), future efforts will prioritize improving the representation of PM2.5 in the RACM2B-VCP mechanism.
Besides a direct comparison of O3, it is important to verify whether the model accurately simulates ozone formation for the right reason by evaluating modeled O3 precursors against the observations. Compared to the RACM-ESRL-VCP mechanism, the RACM2B-VCP mechanism offers a more complex representation of chemistry, making it more suitable for directly comparing to observations in order to assess the chemistry accuracy.
To conduct this evaluation, we utilize airborne measurements from the RECAP-CA field campaign and surface measurements from mobile drives during the SUNVEx field campaigns. Both flights and mobile drives sample the air mass covering four regions of the LA basin, including the coastal region, Santa Ana Valley, Downtown LA, and San Bernardino Valley. There is also a ground site at Pasadena, providing continuous ground site measurements during the SUNVEx field campaign. MELODIES MONET, a new model evaluation tool (https://melodies-monet.readthedocs.io/, last access: 27 April 2024), was used to pair the surface and aircraft observations with the model results (Baker and Pan, 2017). To address the spatial variation, we match the WRF-Chem simulation with the RACM2B-VCP chemical mechanism to the observations in time using linear interpolation and in space using linear interpolation (vertical) and the nearest neighbor algorithm (horizontal), and the comparison between observations and simulations is shown separately in these five regions. Instead of using NMB, we calculate the normalized median bias (hereinafter referred to as NMDB, Eq. 1) as the evaluation matrix.
Here and are the median of the model simulation and the observations, respectively. We use NMDB because the mobile and ground measurements can capture sharp gradients of trace gases as they pass by large emission sources, which cannot be resolved by the spatial resolution of the model (4 km). We note that NMDB reduces the influence of large local emission sources as compared to NMB, but the impact of local sources cannot be completely removed using NMDB. Table 1 summarizes the NMDB and the R2 of our studied species from the WRF-Chem simulation with the RACM2B-VCP chemical mechanism, including NOx, CO, VOCs, PAN, and aerosols, comparing them against three different observations. Overall, we show that the R2 is generally higher between model simulation and airborne measurements as compared to between model simulation and ground or mobile measurements. The R2 is the lowest compared to mobile measurements, suggesting that the model is too coarse to completely resolve the spatial variation observed in mobile drives, which by design are prone to be impacted by local emission sources.
Table 1Summary of normalized median bias (NMDB) and the R2 (in parentheses) for NOx, CO, calibrated VOCs species and VOCr, PAN, and speciated aerosols from WRF-Chem simulation configured with RACM2B-VCP mechanism, comparing them against three field campaigns, including RECAP airborne measurements, SUNVEx mobile measurements, and SUNVEx ground measurements. The comparisons of PAN and aerosols are only available against SUNVEx ground measurements. The calibrated VOCr is the sum of VOCr from each VOC species, matching each observation point. We also first calculate the median VOCr from each VOC species during the field campaign and then sum them up to the “species-breakdown calibrated VOCr” to avoid the compensating effect across multiple VOCs. not applicable –n/a.

We compare the distribution of trace gases in each of the five regions (Coastal LA, Santa Ana Valley, Downtown LA, San Bernardino Valley, and Pasadena) from the model simulation with the RACM2B-VCP mechanism against the observations. Figure 5a and b present the evaluation of NOx and CO. We exclude the measurements of NOx and CO from the mobile drives as they are too near to traffic sources that cannot be captured by the model simulation at 4 km. The observed NOx exhibits a wide spatial variation, which is consistent with the spatial pattern of CO. Downtown and the San Bernardino Valley are characterized by higher NOx concentrations with a median of 5.2 ppb, which is due to its large urban population, as well as meteorological and geographic conditions favorable for pollution accumulation during the day. The coastal region in LA has the lowest NOx concentrations, a median of 2.4 ppb, as it experiences sea breeze and features lower local NOx emissions (Nussbaumer et al., 2023). The WRF-Chem model with the RACM2B-VCP mechanism shows reasonable agreement with observed NOx and it varies by region. The best agreement is found at Santa Ana Valley with an NMDB of −4.9 %. The model overpredicts NOx by an NMDB of 30 % in Pasadena, while it underpredicts NOx in Downtown LA and the San Bernardino Valley by an NMDB of −31.1 % and −31.8 %. These biases can be at least partially explained by the fact that flights during RECAP flew near or above the highways most of the time in these two regions so the observations can be biased high compared to the 4 km grid averages. A better agreement is found for the NOx vertical profiles between WRF-Chem simulations at 1 km and observations during RECAP (Yu et al., 2023). In the meanwhile, new mega warehouses in the San Bernardino Valley are adding truck traffic that is not considered in the inventory (Nussbaumer et al., 2023). The model simulation underpredicts CO concentrations in all regions while still reproducing the spatial pattern. The NMDB is −20 % for all observations, with the largest underprediction with the NMDB of −26.4 % in Downtown LA and the lowest underprediction with the NMDB of −10.1 % in Pasadena.
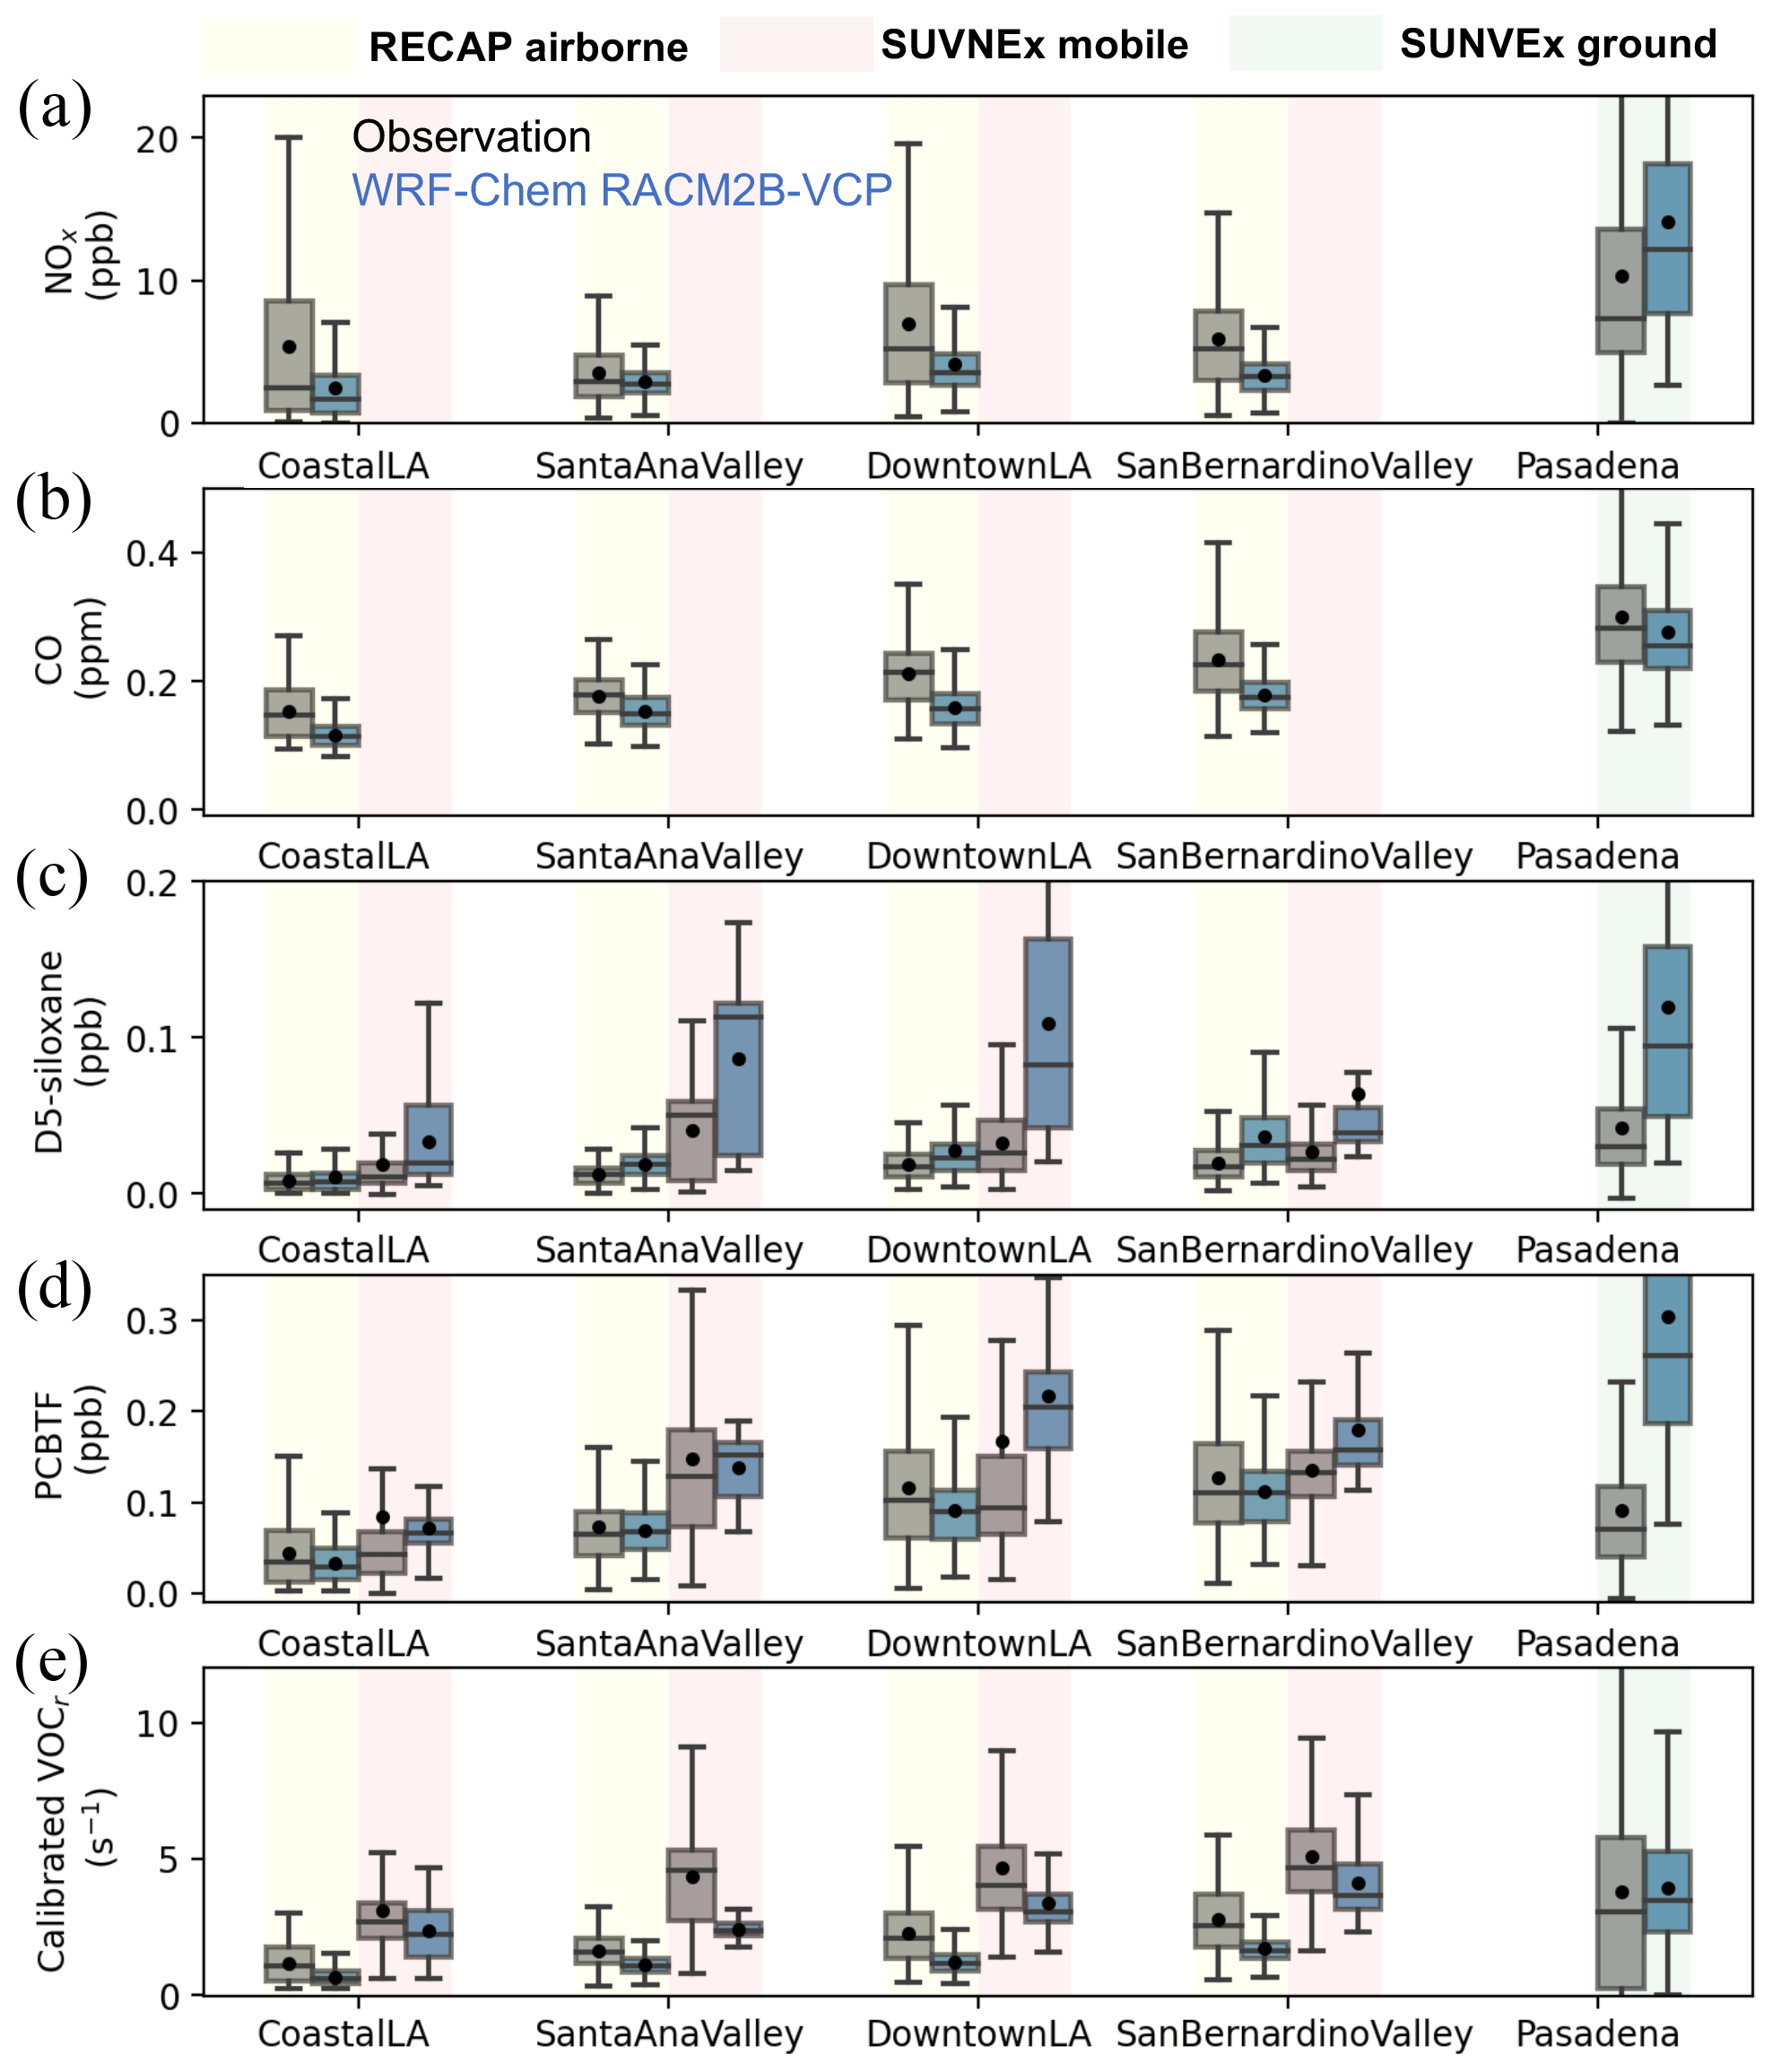
Figure 5The comparison of NOx (a), CO (b), D5-siloxane (c), PCBTF (d), and calibrated VOCr between observations and WRF-Chem simulation configured with the RACM2B-VCP chemical mechanism. The comparison to the RECAP airborne measurement is shown in yellow, the comparison to SUNVEx mobile measurements is shown in red, and the comparison to SUNVEx ground measurements is shown in green. The distribution is shown by a whisker plot, where the black dot denotes the mean value and the line denotes the median value.
The inclusion of the VCP tracers in the RACM2B-VCP mechanism allows us to compare model-predicted vs. observed concentrations of VCP markers and provide insight into VCP emissions. Two VCP tracers, D5-siloxane and PCBTF, are calibrated and reported from RECAP and SUNVEx field campaigns. Shown in Fig. 5c and d, we find that the WRF-Chem simulation with RACM2B-VCP mechanism agrees well with airborne measurements for PCBTF despite an overprediction for D5-siloxane, featuring the NMDBs of −5.4 % for PCBTF and 59.4 % for D5-siloxane. Larger biases are found between the model and measurements near the surface as the corresponding NMDBs are 144 % for D5-siloxane and 72.8 % for PCBTF. The largest bias occurs in Downtown LA, where the model overpredicts the median D5-siloxane by a factor of 2.
Next, we evaluate the VOC chemistry thoroughly using a set of calibrated VOCs from both the RECAP and SUNVEx campaigns. These VOCs are either emitted from a wide range of sources or from secondary production. In addition to D5-siloxane and PCBTF emitted from VCP sources, aromatics, including benzene, toluene, xylene, and benzaldehyde, are primary VOCs predominantly emitted from mobile sources. Isoprene and its oxidative products methacrolein (MACR) and methyl vinyl ketone (MVK) are solely from biogenic emissions. Monoterpenes are emitted from a mixture of biogenic sources and VCP products. We also measure a series of oxygenated VOCs, including methanol, ethanol, acetone, and acetaldehyde. The VOC reactivity is calculated using the concentrations, from either observations or the model simulation, times the OH reaction rate from the RACM2B-VCP chemical mechanism for each calibrated species, and the comparison of total calibrated VOC reactivity is shown in Fig. 5e. In the absence of alkanes, alkenes, and formaldehyde, the calibrated VOC reactivity comprises 58 % of the total VOC reactivity in WRF-Chem (Fig. S7). We find that the calibrated VOC reactivity is underrepresented (Fig. 5e). The NMDB is −34.9 % compared to the airborne measurements, ranging from −42.9 % in Downtown LA to −32.5 % in the Santa Ana Valley. The NMDB is −17.1 % compared to the mobile measurements, ranging from −48.2 % in the Santa Ana Valley to −17 % in the Coastal LA region. The modeled calibrated VOC reactivity is closer to the ground observations at Pasadena, with an NMDB of −4.8 %.
The underprediction of VOC reactivity becomes more pronounced and consistently apparent across the three sets of observations when assessing the individual contribution from VOC species. In Fig. 6, we first calculate the median VOC reactivity from each calibrated species, either from observations or from the model simulation, and then sum it up to the total calibrated VOC reactivity. The NMDB of summed calibrated VOC reactivity is −36.2 % for the airborne measurements, and −20.1 % for both mobile and ground measurements. The primary VOCs from traffic sources, benzene for instance, show good agreement against airborne and mobile measurements; the NMDB is −4.8 % for the airborne measurements and 18.8 % for the mobile measurements across the basin. However, WRF-Chem turns out to overpredict benzene by an NMDB of 128 % at the ground site (Fig. S8c). In other words, the measurement at one ground site at Pasadena alone is not representative of the LA basin overall. Pasadena stands out due to abundant biogenic sources, which is reflected in a 65 % contribution of total VOC reactivity from isoprene and its oxidative products. At Pasadena, the model underpredicts the isoprene by an NMDB of −24.1 % and also underpredicts the MACR+MVK by an NMDB of −31.4 %. We note consistent underprediction of monoterpene and ethanol in WRF-Chem; the largest low bias in the model is found when comparing against the airborne measurements, featuring an NMDB of −89.5 % for monoterpene and −75.4 % for ethanol. The bias is smaller near the surface as the NMDB is −45.1 % for monoterpene and −35.4 % for ethanol. Acetaldehyde also contributes to the low bias in VOC reactivity in the model. The NMDB is −48.3 % and −22.9 % for measurements from mobile drives and from the ground site at Pasadena. However, the model overpredicts acetaldehyde when compared to the airborne measurements characterized by an NMDB of 46.4 %.

Figure 6The comparison of median VOC reactivity (VOCr) from each calibrated species between observations and WRF-Chem simulation configured with RACM2B-VCP chemical mechanism. The comparison to the RECAP airborne measurement is shown in yellow, the comparison to SUNVEx mobile measurements is shown in red, and the comparison to SUNVEx ground measurements is shown in green. The black line indicates the standard deviation of summed calibrated VOCr in either observations or model simulations.
We also explore the temperature dependence of the total calibrated VOC reactivity, as depicted in Fig. 7. Strong positive temperature dependence of the calibrated VOC reactivity is evident across the three sets of observations. Although the 9 flight days during RECAP do not cover days with defined high temperatures, the calibrated VOC reactivity shows an increase from 1.39 to 2.27 s−1 from days with low temperatures to median temperatures. Both mobile and ground measurements cover days with three different temperature bins. The calibrated VOC reactivity increases from 3.83 to 5.82 s−1 in mobile measurements and from 2.7 to 6.9 s−1 in ground site measurements. It is promising to see that the model reproduces this temperature dependence despite underpredicting the calibrated VOC reactivity.
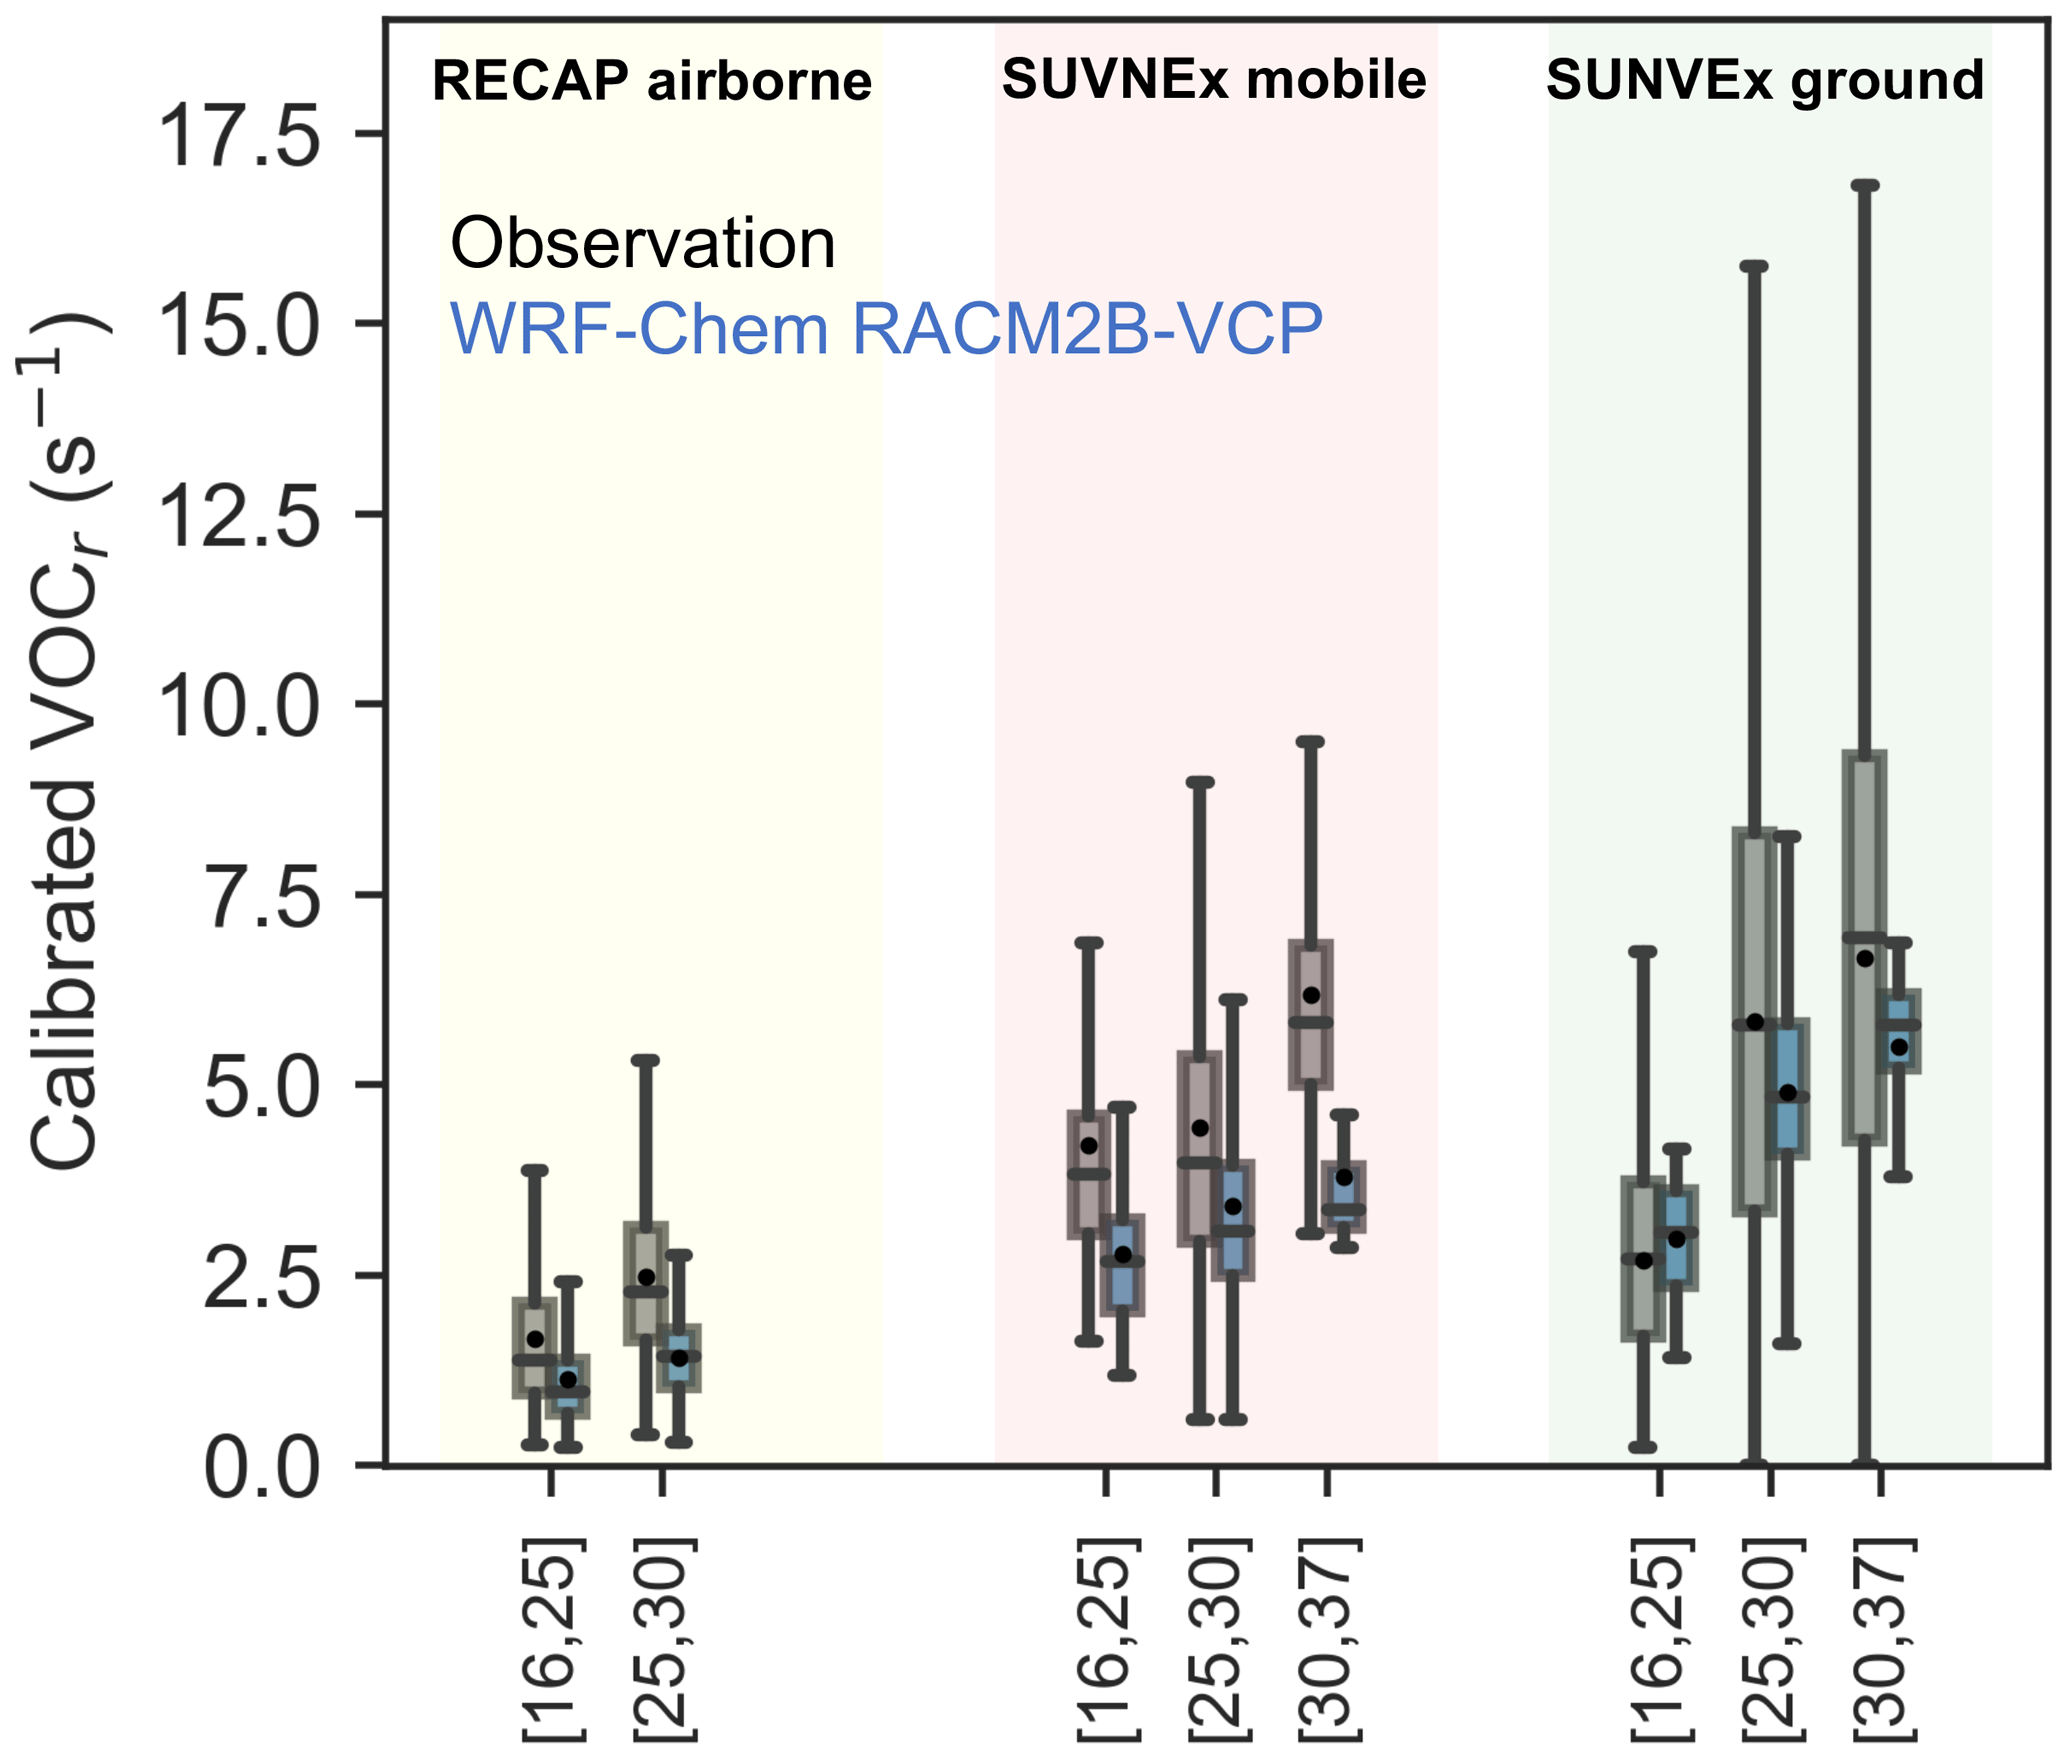
Figure 7The comparison of the temperature dependence of VOC reactivity (VOCr) between observations (gray) and WRF-Chem simulation configured with RACM2B-VCP chemical mechanism (blue). The comparison to the RECAP airborne measurement is shown in yellow, the comparison to SUNVEx mobile measurements is shown in red, and the comparison to SUNVEx ground site measurements is shown in green. The distribution is shown by a whisker plot, where the black dot denotes the mean value and the line denotes the median value.
Furthermore, Fig. S8 illustrates the temperature dependence of some key VOC species. Strong temperature dependence is evident in both observations and model simulations for species like isoprene, primarily due to temperature-dependent emissions. However, it is worth noting that temperature dependence is not solely attributed to emissions. For instance, benzene is emitted from sources that are temperature neutral in our model simulation, yet a positive temperature dependence exists in Pasadena, driven by meteorological factors. Besides isoprene, we find a strong temperature dependence of PCBTF from the observations, but this is not fully captured in the model simulations (Fig. S8e). As PCBTF is emitted from solvent-based coatings, it may imply that the temperature dependence of some VCP sources exists due to evaporation and it is not yet included in our model.
In Sect. 6, we conducted a model evaluation of trace gases observed and reported in three sets of observations. Additional measurements of peroxyacetyl nitrate (PAN) and aerosols are available in the ground site measurements. While PAN is treated as a surrogate species in the RACM-ESRL-VCP mechanism, the RACM2B-VCP mechanism separates it out from the higher carbon acyl nitrates such as peroxypropionyl nitrate (PPN), enabling a direct comparison to the observations. As shown in Fig. 8a, the model with the RACM2B-VCP mechanism underestimates PAN levels at Pasadena. The median PAN concentration is 0.79 ppb in observations and 0.48 ppb in the model, resulting in an NMDB of −0.37.
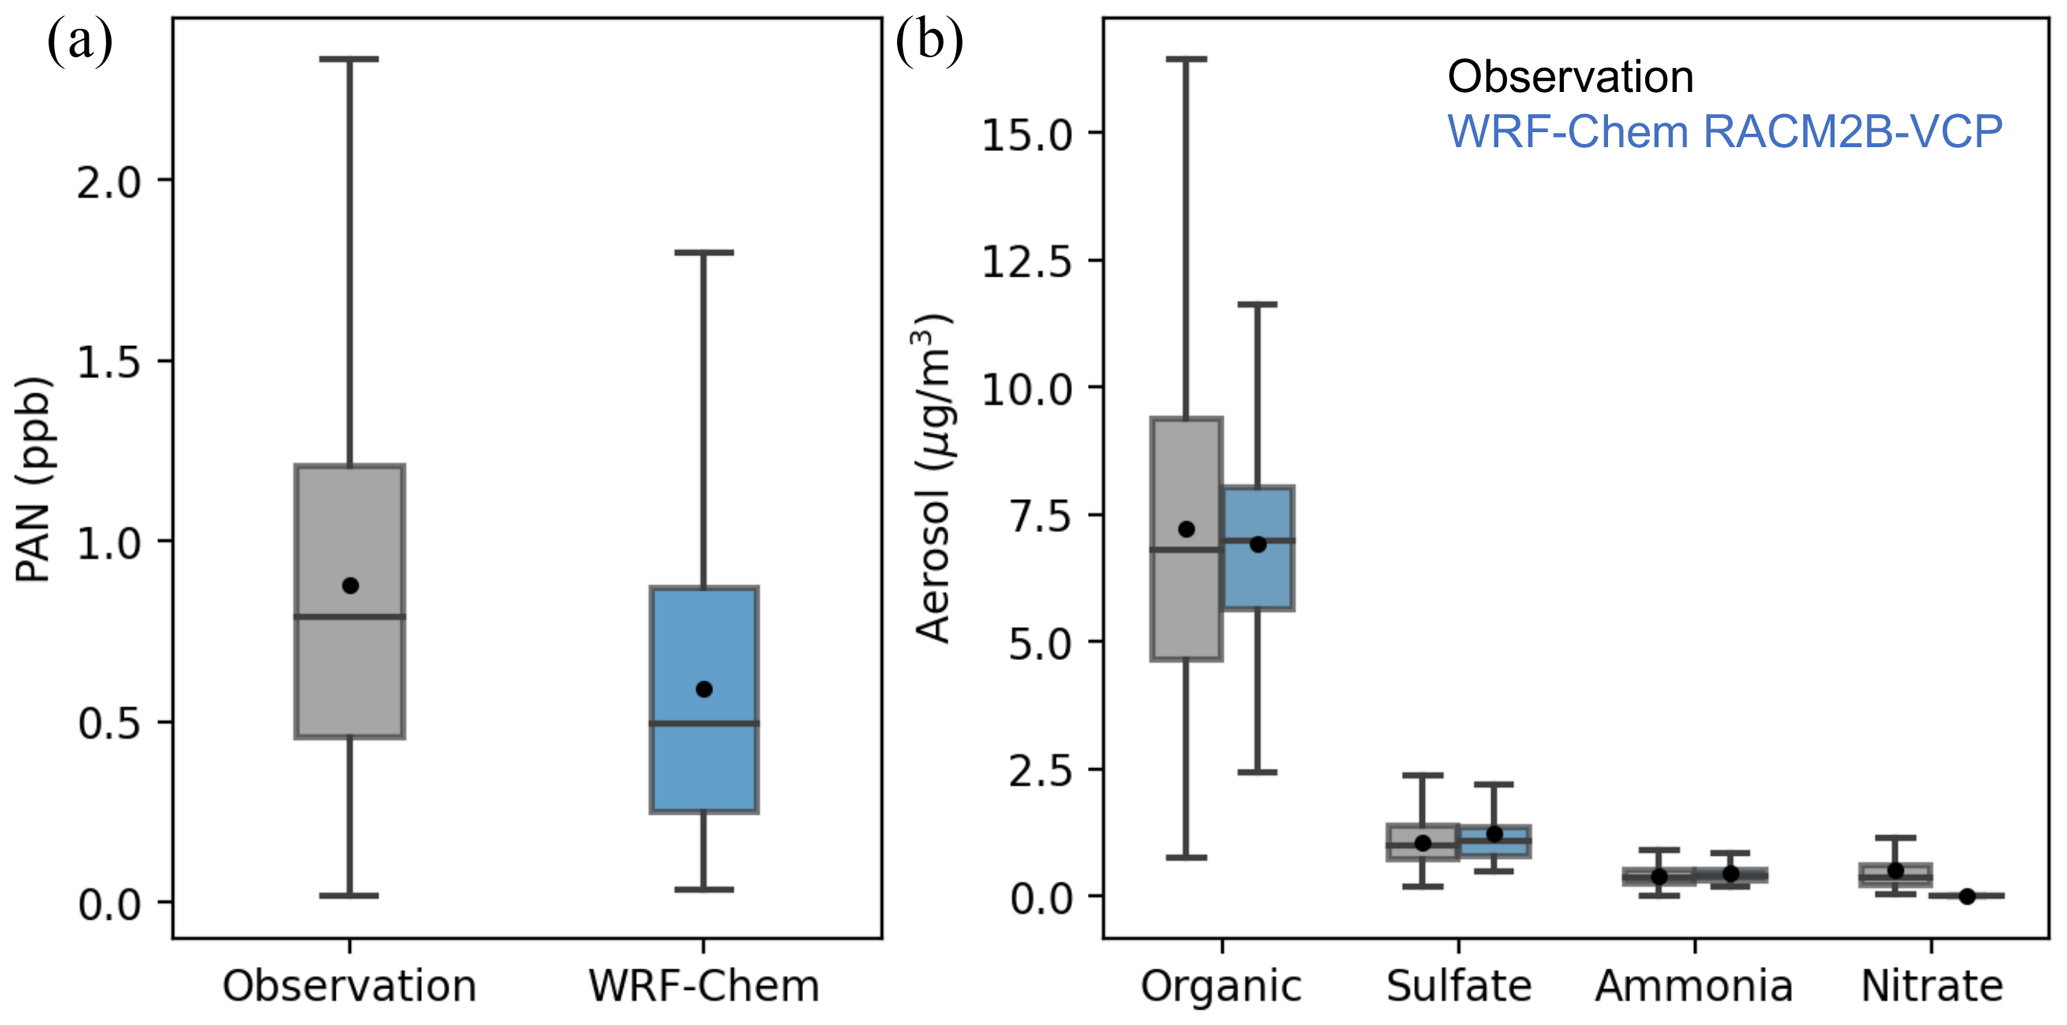
Figure 8The comparison of PAN (a) and speciated aerosols (b) between ground observations at Pasadena (gray) and WRF-Chem simulation with RACM2B-VCP mechanism (blue). The distribution is shown by a whisker plot, where the black dot denotes the mean value and the line denotes the median value.
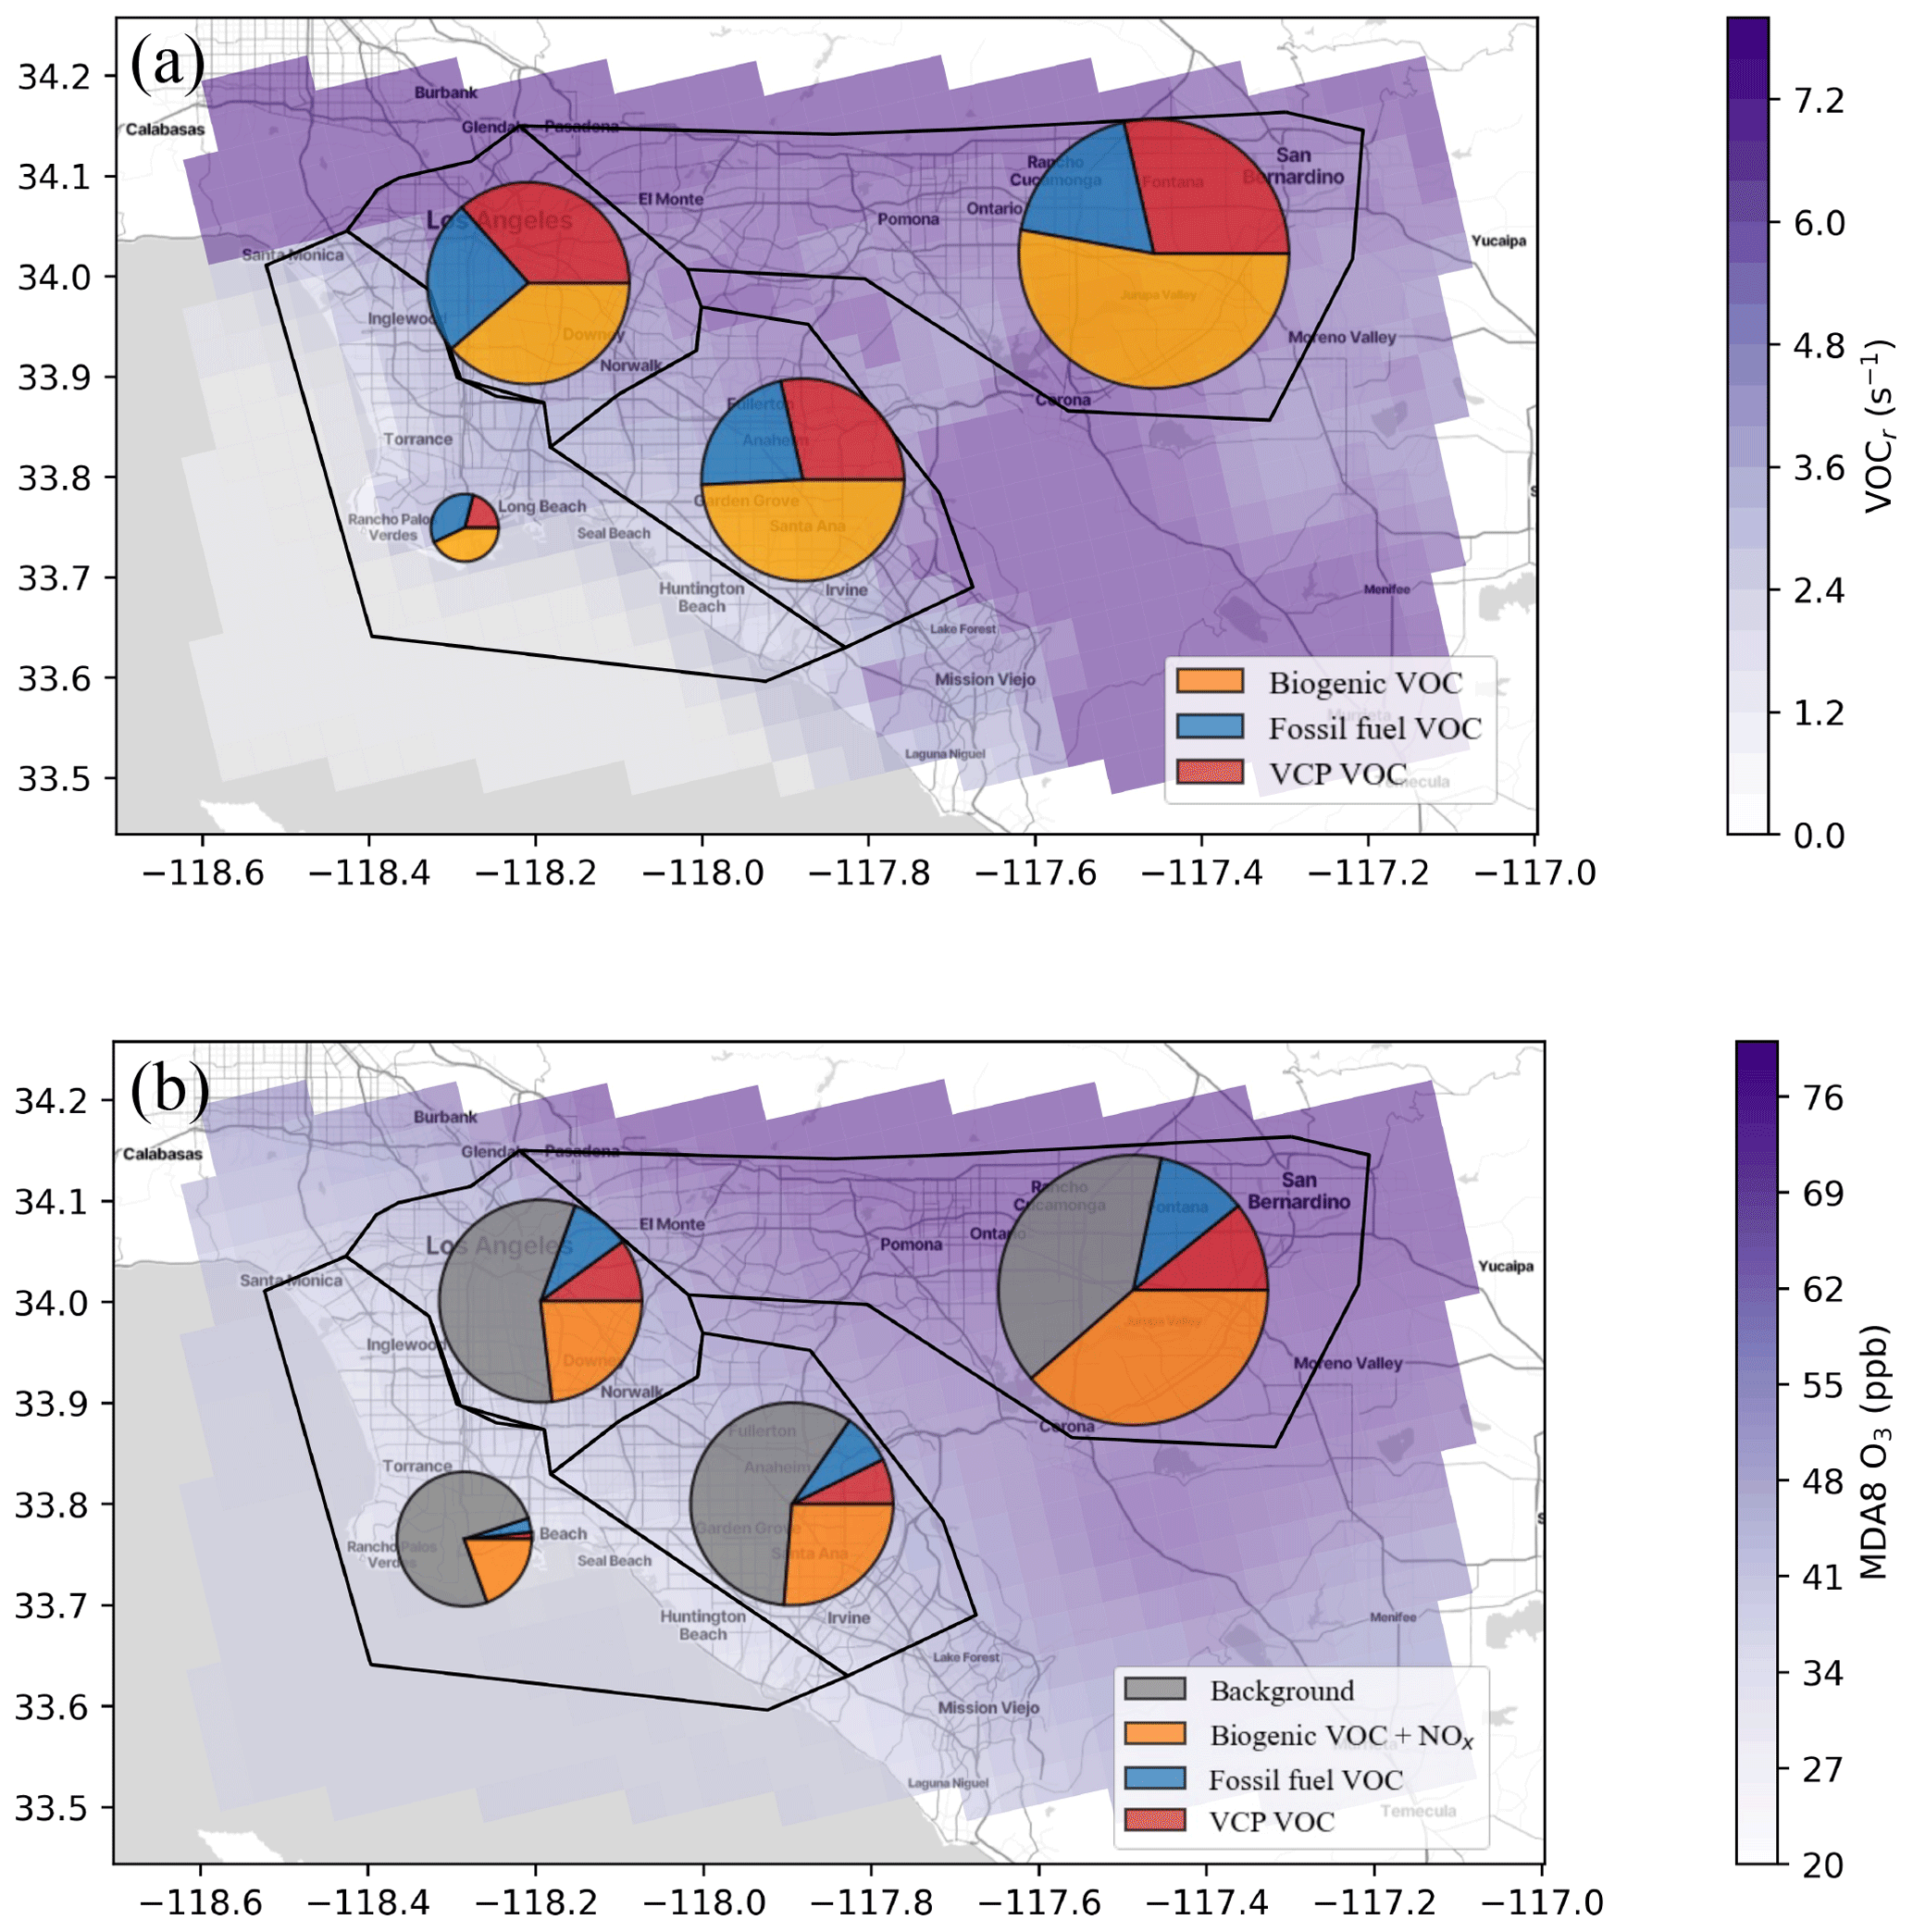
Figure 9Spatial distribution and budget analysis of (a) total VOC reactivity and (b) MDA8 O3 averaged in August 2021. Panel (a) shows the contributions of VOC emissions from VCP and fossil fuel sources to total VOC reactivity over four regions of LA, including Coastal LA, Downtown LA, the Santa Ana Valley, and the San Bernardino Valley. The total VOC reactivity is the average of 09:00 to 20:00 LT. Panel (b) shows the contribution of MDA8 O3 from VCP, fossil fuel VOC emissions, and background O3 (ppb).
We compare the aerosols in Fig. 8b, categorized into four groups: organic aerosols (OAs), sulfate aerosol, ammonium aerosol, and nitrate aerosol. OAs comprise the majority (78 %) of the aerosols observed at ground site measurements, followed by sulfate aerosol (12 %), ammonium aerosol (5.6 %), and nitrate aerosol (4.4 %). When compared to the observations, the model with the RACM2B-VCP mechanism yields excellent agreement for aerosols in the first three categories, with an NMDB of 2.9 % for OAs, 15.6 % for sulfate aerosol, and 9.4 % for ammonium aerosol. The model also reproduces the temperature dependence of OAs, as shown in Fig. S9.
However, the model with the MADE aerosol scheme fails to simulate nitrate aerosols. It contradicts the study in South Korea where the MADE aerosol scheme in WRF-Chem overpredicts nitrate aerosol (Lee et al., 2020). It suggests that the MADE aerosol scheme bias for nitrate aerosol is specific to the chemical and physical conditions in a given location and season. Accurately representing inorganic nitrates is challenging for models, as further described in the review by Xie et al. (2022) and references therein. Future work will address this nitrate aerosol bias further, especially when applying the WRF-Chem model over regions or seasons where nitrate aerosols comprise a larger fraction of the total aerosol budget than during the summer in Los Angeles (Fig. 8).
As we have fully evaluated the VOC emission and VOC chemistry from each emission sector, including fossil fuel, VCP, and biogenic sources, in this section we will explore the influence of VCP emissions on VOC reactivity and O3. We do not include PM2.5 here as the model needs to be improved to better represent the speciation for SOA formation (Sect. 2.3), the hourly variation in PM2.5 (Sect. 5), and the daily PM2.5 temperature dependence (Sect. 5) before it can be used for source apportionment analysis. In addition to the aforementioned model simulations (referred to as S0), we conducted two distinct sensitivity tests in August 2021 to gain further insights and quantify the impacts of VCP sources. In the first sensitivity simulation (S1), we only exclude the VCP source; in the second sensitivity simulation (S2), we exclude all anthropogenic VOC emissions. The vast majority of the anthropogenic emissions outside of VCP are fossil fuel VOC emissions, either from combustion or evaporation, and they will be referred to as fossil fuel VOCs from here on. The disparity between S1 and S0 delineates the extent to which VCP sources contribute, whereas the disparity between S2 and S1 elucidates the impact of fossil fuel VOC emissions in August 2021.
As depicted in Fig. 9a, anthropogenic VOC emissions account for 46 %–56 % of the total VOC reactivity across the LA region. Notably, VCP sources constitute 36 %–63 % of the anthropogenic influence. The relative contribution of VCP emissions to the total VOC reactivity varies by region, spanning from 21 % along the coastal areas of LA to 35.5 % in Downtown LA. Figure 9b shows the contribution of MDA8 ozone from these two anthropogenic VOC emissions. In addition, in our model simulation, the LA basin experiences the background O3 of 30 ppb transport outside of the model domain defined by the static boundary condition. We show a larger contribution of local O3 production moving from the coastal regions to the east, which is consistent with the positive O3 gradient as we have observed in Fig. 3a. Compared to the contribution to the total VOC reactivity, the contributions of both VCP and fossil fuel VOC emissions to MDA8 O3 are smaller. The smallest VOC emission contributions are observed along the coastal areas of LA, totaling 5.0 %, with VCP emissions responsible for 1.6 % of the MDA8 O3 enhancement. In contrast, San Bernardino exhibits the most substantial contribution from anthropogenic VOC emissions at 21.6 % in total, with VCP emissions responsible for 10.6 % of the MDA8 O3. Our findings align with the results of Coggon et al. (2021), where they ascertain that out of the 43 ppb of O3 attributed to VOC emissions in New York City, roughly half stems from anthropogenic sources. Within this anthropogenic fraction, over 50 % is attributable to VCP emissions. However, this study reports a lower contribution of VCPs to MDA8 O3 than Qin et al. (2021), where they showed that VCPs produce 17 % of MDA8 O3 (9 ± 2 ppb) in summer 2010 in Los Angeles.
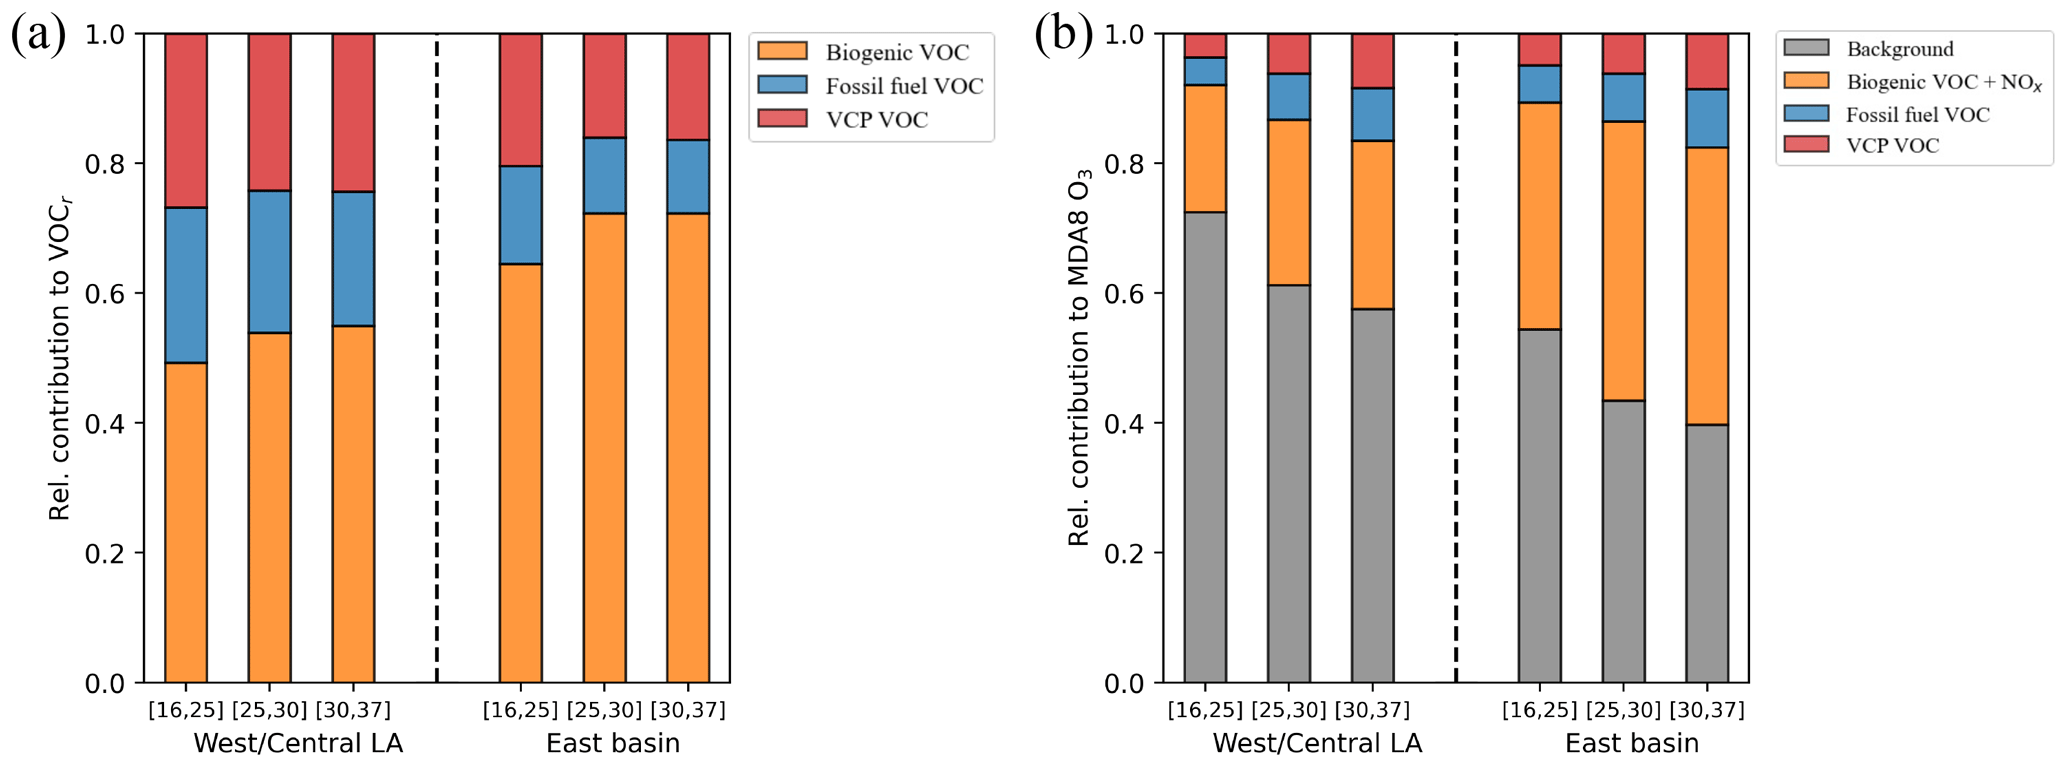
Figure 10The relative contribution of VOC emissions from VCP and fossil fuel sources to VOC reactivity (a) and MDA8 O3 (b) in West/Central LA and in East Basin under the three temperature bins defined in Fig. 1.
While we have demonstrated the capability of our WRF-Chem simulation with the RACM2B-VCP mechanism to capture the temperature dependence of VOC reactivity and O3, we conducted a more detailed investigation into the contributions of the two anthropogenic VOC emissions to VOC reactivity and O3 under various temperature conditions. Instead of segregating the study domain into four regions as shown in Fig. 9, we addressed spatial differences by dividing the study domain into West/Central LA and the East Basin, as described in Sect. 5. Within each region, we calculated the relative contributions from these anthropogenic VOC emissions in three temperature bins to the total VOC reactivity and MDA8 O3 (Figs. 10 and S10a, b). Our findings indicate that the relative contribution of anthropogenic VOC emissions to VOC reactivity decreases on hotter days, primarily due to the temperature sensitivity of VOCs emitted from biogenic sources, which increase at higher temperatures. This reduction in relative contribution to VOC reactivity is notably more pronounced in the East Basin, where biogenic sources are more abundant. The fractional ratio of VOCs from VCP and fossil fuels decreases by 1.7 % and 2.1 %, respectively.
However, we highlight that despite this reduction in VOC reactivity, the relative contribution of VOCs from these two anthropogenic emissions to MDA8 O3 increases at elevated temperatures. Specifically, the relative contribution of anthropogenic VOC emissions increases from 7.8 % to 16.4 % across the lowest to the highest temperature bins in West/Central LA and from 10.6 % to 17.5 % in the East Basin. VOCs from both VCP and fossil fuel emissions contribute equally to MDA8 O3 formation. This increasing contribution from anthropogenic VOC emissions is also evident when only considering the local enhancement of MDA8 O3 by subtracting background transport outside of the model domain (Fig. S11). The diverging trends observed in total VOC reactivity and MDA8 O3 emphasize the complexity of changes involving the chemical regimes.
In addition to total VOC reactivity and MDA8 O3, we observed a strong temperature dependence in surface NOx over LA, influenced by meteorological factors. Despite NOx emissions in LA being predominantly anthropogenic and not responsive to temperature changes in our emission inventory, hotter days tend to induce stagnation and weaker mixing, resulting in higher NOx levels at the surface. Given the entangled effects of both emissions and meteorology on NOx and VOC reactivity under different temperatures, directly mapping the relative changes in VOC reactivity to the relative contribution to O3 formation proves challenging. The combined effect of emission sources and meteorological conditions results in a larger contribution to O3 formation due to VOCs emitted from VCP and fossil fuel sources over LA at higher temperatures.
We have developed the novel chemical mechanism RACM2B-VCP for WRF-Chem, aimed at enhancing the representation of VOC chemistry in present urban areas where mobile emissions are declining and emissions from other sources like biogenics and VCPs are contributing more to VOC reactivity and ozone formation. RACM2B-VCP, an extension of the RACM2-Berkeley2 mechanism, incorporates oxygenated VOC reactions to address the influence of VCPs. The integration of the TUV photolysis scheme, a more complex SOA VBS scheme, and aerosol uptake reactions further refine the representation of photolysis, aerosols, and ozone, respectively. Additionally, we have introduced VCP tracers, D4-siloxane, D5-siloxane, p-dichlorobenzene, and PCBTF into RACM2B-VCP.
We evaluate the performance of RACM2B-VCP by comparing WRF-Chem simulations with AQS surface network data and the previous RACM-ESRL-VCP mechanism. Notably, RACM2B-VCP exhibits comparable, if not superior depending on the metric, performance in reproducing MDA8 O3 and daily PM2.5, capturing both its magnitude and spatial distribution. While the model fails to capture the hourly variation in PM2.5, future work is needed to provide better constraints on SOA such as what might be accomplished through coupling gas and aerosol-phase chemistry as in CRACMM (Pye et al., 2023). We also conduct a comprehensive assessment of the RACM2B-VCP mechanism by comparing against measurements from RECAP and SUNVEx field campaigns. While our model adeptly represents CO, NOx, and VOCs from various sectors, there remains a disparity in total measured VOC reactivity against observations. The most underpredicted VOC species are monoterpene, ethanol, and acetaldehyde, which suggest likely missing sources of VOCs.
Our study also demonstrates the notable impact of VCP emissions on both total VOC reactivity and MDA8 O3 in August 2021 averaged across the LA basin. VCP sources contribute significantly, accounting for 31 % of total VOC reactivity and contributing 6.4 % to MDA8 O3. It underscores the importance of considering VCP emissions in urban air quality management strategies. We also evaluate the relative contributions of VOCs from VCP and fossil fuel emissions to total VOC reactivity and MDA8 O3 across different temperatures. While the contribution of anthropogenic VOC emissions decreases for total VOC reactivity, both VCP and fossil fuel VOC emissions show a larger contribution to MDA8 O3 at higher temperatures, suggesting nonlinear changes in the O3 formation due to changes in the chemical regime.
Looking ahead, our study suggests the following roadmap for further refining VOC chemistry simulations:
-
updating the biogenic emission inventory, particularly over urban regions, as the model significantly underestimates monoterpene;
-
implementing a more accurate SOA scheme to better characterize the source apportionment of PM2.5, as the model fails to reproduce the hourly variation and the temperature dependence of PM2.5 from the AQS observation;
-
addressing the existing gaps between observational VOC reactivity and model predictions, thereby improving the overall model representation, as the current model still underpredicts the VOC reactivity.
The observational data from SUNVEx and RECAP field campaigns and WRF-Chem anthropogenic emission files are available at https://csl.noaa.gov/groups/csl7/measurements/2021sunvex/emissions/ (Harkins and McDonald, 2024). The analysis dataset is available at https://csl.noaa.gov/groups/csl4/modeldata/data/Zhu2023/ (Zhu et al., 2024a). The WRF-Chem source codes and the analysis codes are available at https://github.com/NOAA-CSL/WRF-Chem_CSL_Publications/tree/main/Qindan_Zhu_et_al_2024 (Zhu et al., 2024b).
The supplement related to this article is available online at: https://doi.org/10.5194/acp-24-5265-2024-supplement.
RHS and BCM supervised the research. QZ performed the analysis and prepared the manuscript. QZ conducted the model simulations with the help of RHS, BCM, CH, JS, JH, HOTP, ML, BB, ZM, RA, EYP, BP, PW, BCS, CA, AB, JS, and AHG, and RCC conducted the RECAP field campaign and provided the measurements. MC, CW, CES, LX, KZ, MAR, AN, PRV, JP, and SSB are involved in SUNVEx field campaign and provided the measurements. All authors have reviewed and edited the paper.
At least one of the (co-)authors is a member of the editorial board of Atmospheric Chemistry and Physics. The peer-review process was guided by an independent editor, and the authors also have no other competing interests to declare.
The views expressed in this document are solely those of the authors and do not necessarily reflect those of the U.S. Environmental Protection Agency (EPA). EPA does not endorse any products or commercial services mentioned in this publication. The statements, findings, conclusions, and recommendations are those of the author(s) and do not necessarily reflect the views of NOAA or the U.S. Department of Commerce.
Publisher's note: Copernicus Publications remains neutral with regard to jurisdictional claims made in the text, published maps, institutional affiliations, or any other geographical representation in this paper. While Copernicus Publications makes every effort to include appropriate place names, the final responsibility lies with the authors.
Qindan Zhu was supported by funding from the EPA STAR program and the NOAA Climate and Global Change Postdoctoral Fellowship. This RECAP field campaign was partially funded by the Presidential Early Career Award for Scientists and Engineers (PECASE) (from Brian McDonald). Eva Y. Pfannerstill was funded by a Feodor Lynen Research Fellowship from the Alexander von Humboldt Foundation. We thank Andrew Rollins for helpful discussions on the SUNVEx NOx measurements. We also thank NOAA's High Performance Computing and Communications (HPCC) program.
This research has been supported by the U.S. Environmental Protection Agency (grant no. 84001001) and the California Air Resources Board (grant nos. 20RD003 and 20AQP012). This work has been partly supported by the NOAA Cooperative Agreement with CIRES (grant nos. NA17OAR4320101 and NA22OAR4320151). Matthew Coggon, Colin Harkins, Jordan Schnell, Jian He, Meng Li, Chelsea E. Stockwell, Lu Xu, Kristen Zuraski, Michael A. Robinson, J. Andrew Neuman, and Jeff Peischl have been supported in part by NOAA cooperative agreements (grant nos. NA17OAR4320101 and NA22OAR4320151).
This paper was edited by Qi Chen and reviewed by two anonymous referees.
Ackermann, I., Hass, H., Memmesheimer, M., Ebel, A., Binkowski, F., and Shankar, U.: Modal aerosol dynamics model for Europe-Uncertainty analysis and experimental evaluation, Atmos. Environ., 32, 2981–2999, 1998. a
ACOM: Photolysis in WRF-Chem, https://www2.acom.ucar.edu/sites/default/files/documents/Instructions_photolysis_opt_4.pdf (last access: 5 November 2023), 2021. a
Ahmadov, R., McKeen, S., Robinson, A., Bahreini, R., Middlebrook, A., De Gouw, J., Meagher, J., Hsie, E.-Y., Edgerton, E., Shaw, S., and Trainer, M.: A volatility basis set model for summertime secondary organic aerosols over the eastern United States in 2006, J. Geophys. Res.-Atmos., 117, https://doi.org/10.1029/2011JD016831, 2012. a, b, c
Alford, K. L. and Kumar, N.: Pulmonary health effects of indoor volatile organic compounds – a meta-analysis, Int. J. Env. Res. Pub. He., 18, 1578, https://doi.org/10.3390/ijerph18041578, 2021. a
Alton, M. W. and Browne, E. C.: Atmospheric chemistry of volatile methyl siloxanes: Kinetics and products of oxidation by OH radicals and Cl atoms, Environ. Sci. Technol., 54, 5992–5999, 2020. a
Alton, M. W. and Browne, E. C.: Atmospheric Degradation of Cyclic Volatile Methyl Siloxanes: Radical Chemistry and Oxidation Products, ACS Environmental Au, 2, 263–274, 2022. a
Angevine, W. M., Olson, J., Gristey, J. J., Glenn, I., Feingold, G., and Turner, D. D.: Scale awareness, resolved circulations, and practical limits in the MYNN–EDMF boundary layer and shallow cumulus scheme, Mon. Weather Rev., 148, 4629–4639, 2020. a
Atkinson, R. and Arey, J.: Atmospheric degradation of volatile organic compounds, Chem. Rev., 103, 4605–4638, 2003. a, b
Baker, B. and Pan, L.: Overview of the model and observation evaluation Toolkit (MONET) version 1.0 for evaluating atmospheric transport models, Atmosphere, 8, 210, https://doi.org/10.3390/atmos8110210, 2017. a
Baltensperger, U., Dommen, J., Alfarra, M. R., Duplissy, J., Gaeggeler, K., Metzger, A., Facchini, M. C., Decesari, S., Finessi, E., Reinnig, C., Schott, M., Warneke, J., Hoffmann, T., Klatzer, B., Puxbaum, H., Geiser, M., Savi, M., Lang, D., Kalberer, M., and Geiser, T.: Combined determination of the chemical composition and of health effects of secondary organic aerosols: The POLYSOA project, J. Aerosol Med. Pulm. D., 21, 145–154, 2008. a
Bates, K. H. and Jacob, D. J.: A new model mechanism for atmospheric oxidation of isoprene: global effects on oxidants, nitrogen oxides, organic products, and secondary organic aerosol, Atmos. Chem. Phys., 19, 9613–9640, https://doi.org/10.5194/acp-19-9613-2019, 2019. a
Benjamin, S. G., Weygandt, S. S., Brown, J. M., Hu, M., Alexander, C. R., Smirnova, T. G., Olson, J. B., James, E. P., Dowell, D. C., Grell, G. A., Lin, H., Peckham, S. E., Smith, T. L., Moninger, W. R., Kenyon, J. S., and Manikin, G. S.: A North American hourly assimilation and model forecast cycle: The Rapid Refresh, Mon. Weather Rev., 144, 1669–1694, 2016.
Boyd, C. M., Sanchez, J., Xu, L., Eugene, A. J., Nah, T., Tuet, W. Y., Guzman, M. I., and Ng, N. L.: Secondary organic aerosol formation from the β-pinene+NO3 system: effect of humidity and peroxy radical fate, Atmos. Chem. Phys., 15, 7497–7522, https://doi.org/10.5194/acp-15-7497-2015, 2015. a
Brown, S. S. and Stutz, J.: Nighttime radical observations and chemistry, Chem. Soc. Rev., 41, 6405–6447, 2012. a, b
Browne, E. C., Wooldridge, P. J., Min, K.-E., and Cohen, R. C.: On the role of monoterpene chemistry in the remote continental boundary layer, Atmos. Chem. Phys., 14, 1225–1238, https://doi.org/10.5194/acp-14-1225-2014, 2014. a, b
Burkholder, J., Sander, S., Abbatt, J., Barker, J., Cappa, C., Crounse, J., Dibble, T., Huie, R., Kolb, C., Kurylo, M., Orkin, V. L., Percival, C. J., Wilmouth, D. M., and Wine, P. H.: Chemical kinetics and photochemical data for use in atmospheric studies; evaluation number 19, Tech. rep., Pasadena, CA, Jet Propulsion Laboratory, National Aeronautics and Space, 2020. a
Chang, W. L., Brown, S. S., Stutz, J., Middlebrook, A. M., Bahreini, R., Wagner, N. L., Dubé, W. P., Pollack, I. B., Ryerson, T. B., and Riemer, N.: Evaluating N2O5 heterogeneous hydrolysis parameterizations for CalNex 2010, J. Geophys. Res.-Atmos., 121, 5051–5070, 2016. a
Chen, T.-M., Kuschner, W. G., Gokhale, J., and Shofer, S.: Outdoor air pollution: ozone health effects, Am. J. Med. Sci., 333, 244–248, 2007. a
Christian, K. E., Brune, W. H., and Mao, J.: Global sensitivity analysis of the GEOS-Chem chemical transport model: ozone and hydrogen oxides during ARCTAS (2008), Atmos. Chem. Phys., 17, 3769–3784, https://doi.org/10.5194/acp-17-3769-2017, 2017. a, b
Churkina, G., Kuik, F., Bonn, B., Lauer, A., Grote, R., Tomiak, K., and Butler, T. M.: Effect of VOC emissions from vegetation on air quality in Berlin during a heatwave, Environ. Sci. Technol., 51, 6120–6130, 2017. a
Coggon, M. M., Gkatzelis, G. I., McDonald, B. C., Gilman, J. B., Schwantes, R. H., Abuhassan, N., Aikin, K. C., Arend, M. F., Berkoff, T. A., Brown, S. S., Campos, T. L., Dickerson, R. R., Gronoff, G., Hurley, J. F., Issacman-VanWertz, G., Koss, A. R., Li, M., McKeen, S. A., Moshary, F., Peischl, J., Pospisilova, V., Ren, X., Wilson, A., Wu, Y., Trainer, M., and Warneke, C.: Volatile chemical product emissions enhance ozone and modulate urban chemistry, P. Natl. Acad. Sci. USA, 118, e2026653118, https://doi.org/10.1073/pnas.2026653118, 2021. a, b, c, d, e, f, g
Coggon, M. M., Stockwell, C. E., Claflin, M. S., Pfannerstill, E. Y., Xu, L., Gilman, J. B., Marcantonio, J., Cao, C., Bates, K., Gkatzelis, G. I., Lamplugh, A., Katz, E. F., Arata, C., Apel, E. C., Hornbrook, R. S., Piel, F., Majluf, F., Blake, D. R., Wisthaler, A., Canagaratna, M., Lerner, B. M., Goldstein, A. H., Mak, J. E., and Warneke, C.: Identifying and correcting interferences to PTR-ToF-MS measurements of isoprene and other urban volatile organic compounds, Atmos. Meas. Tech., 17, 801–825, https://doi.org/10.5194/amt-17-801-2024, 2024. a
Connop, S., Vandergert, P., Eisenberg, B., Collier, M. J., Nash, C., Clough, J., and Newport, D.: Renaturing cities using a regionally-focused biodiversity-led multifunctional benefits approach to urban green infrastructure, Environmental Science & Policy, 62, 99–111, 2016. a
Corchnoy, S. B. and Atkinson, R.: Kinetics of the gas-phase reactions of hydroxyl and nitrogen oxide (NO3) radicals with 2-carene, 1, 8-cineole, p-cymene, and terpinolene, Environ. Sci. Technol., 24, 1497–1502, 1990. a
Darer, A. I., Cole-Filipiak, N. C., O’Connor, A. E., and Elrod, M. J.: Formation and stability of atmospherically relevant isoprene-derived organosulfates and organonitrates, Environ. Sci. Technol., 45, 1895–1902, 2011. a
Day, D. A., Liu, S., Russell, L. M., and Ziemann, P. J.: Organonitrate group concentrations in submicron particles with high nitrate and organic fractions in coastal southern California, Atmos. Environ., 44, 1970–1979, 2010. a
Emmons, L. K., Arnold, S. R., Monks, S. A., Huijnen, V., Tilmes, S., Law, K. S., Thomas, J. L., Raut, J.-C., Bouarar, I., Turquety, S., Long, Y., Duncan, B., Steenrod, S., Strode, S., Flemming, J., Mao, J., Langner, J., Thompson, A. M., Tarasick, D., Apel, E. C., Blake, D. R., Cohen, R. C., Dibb, J., Diskin, G. S., Fried, A., Hall, S. R., Huey, L. G., Weinheimer, A. J., Wisthaler, A., Mikoviny, T., Nowak, J., Peischl, J., Roberts, J. M., Ryerson, T., Warneke, C., and Helmig, D.: The POLARCAT Model Intercomparison Project (POLMIP): overview and evaluation with observations, Atmos. Chem. Phys., 15, 6721–6744, https://doi.org/10.5194/acp-15-6721-2015, 2015. a
Emmons, L. K., Schwantes, R. H., Orlando, J. J., Tyndall, G., Kinnison, D., Lamarque, J.-F., Marsh, D., Mills, M. J., Tilmes, S., Bardeen, C., Buchholz, R. R., Conley, A., Gettelman, A., Garcia, R., Simpson, I., Blake, D. R., Meinardi, S., and Pétron, G.: The Chemistry Mechanism in the Community Earth System Model Version 2 (CESM2), J. Adv. Model. Earth Sy., 12, e2019MS001882, https://doi.org/10.1029/2019MS001882, 2020. a
EPA: Air Pollutant Emissions Trends Data, https://www.epa.gov/air-emissions-inventories/air-pollutant-emissions-trends-data (last access: 28 October 2021), 2016. a
Fisher, J. A., Jacob, D. J., Travis, K. R., Kim, P. S., Marais, E. A., Chan Miller, C., Yu, K., Zhu, L., Yantosca, R. M., Sulprizio, M. P., Mao, J., Wennberg, P. O., Crounse, J. D., Teng, A. P., Nguyen, T. B., St. Clair, J. M., Cohen, R. C., Romer, P., Nault, B. A., Wooldridge, P. J., Jimenez, J. L., Campuzano-Jost, P., Day, D. A., Hu, W., Shepson, P. B., Xiong, F., Blake, D. R., Goldstein, A. H., Misztal, P. K., Hanisco, T. F., Wolfe, G. M., Ryerson, T. B., Wisthaler, A., and Mikoviny, T.: Organic nitrate chemistry and its implications for nitrogen budgets in an isoprene- and monoterpene-rich atmosphere: constraints from aircraft (SEAC4RS) and ground-based (SOAS) observations in the Southeast US, Atmos. Chem. Phys., 16, 5969–5991, https://doi.org/10.5194/acp-16-5969-2016, 2016. a
Fry, J. L., Draper, D. C., Zarzana, K. J., Campuzano-Jost, P., Day, D. A., Jimenez, J. L., Brown, S. S., Cohen, R. C., Kaser, L., Hansel, A., Cappellin, L., Karl, T., Hodzic Roux, A., Turnipseed, A., Cantrell, C., Lefer, B. L., and Grossberg, N.: Observations of gas- and aerosol-phase organic nitrates at BEACHON-RoMBAS 2011, Atmos. Chem. Phys., 13, 8585–8605, https://doi.org/10.5194/acp-13-8585-2013, 2013. a
Gaubert, B., Emmons, L. K., Raeder, K., Tilmes, S., Miyazaki, K., Arellano Jr., A. F., Elguindi, N., Granier, C., Tang, W., Barré, J., Worden, H. M., Buchholz, R. R., Edwards, D. P., Franke, P., Anderson, J. L., Saunois, M., Schroeder, J., Woo, J.-H., Simpson, I. J., Blake, D. R., Meinardi, S., Wennberg, P. O., Crounse, J., Teng, A., Kim, M., Dickerson, R. R., He, H., Ren, X., Pusede, S. E., and Diskin, G. S.: Correcting model biases of CO in East Asia: impact on oxidant distributions during KORUS-AQ, Atmos. Chem. Phys., 20, 14617–14647, https://doi.org/10.5194/acp-20-14617-2020, 2020. a
Geiger, H., Barnes, I., Bejan, I., Benter, T., and Spittler, M.: The tropospheric degradation of isoprene: an updated module for the regional atmospheric chemistry mechanism, Atmos. Environ., 37, 1503–1519, 2003. a
Gkatzelis, G. I., Coggon, M. M., McDonald, B. C., Peischl, J., Aikin, K. C., Gilman, J. B., Trainer, M., and Warneke, C.: Identifying volatile chemical product tracer compounds in US cities, Environ. Sci. Technol., 55, 188–199, 2020. a, b
Goliff, W. S., Stockwell, W. R., and Lawson, C. V.: The regional atmospheric chemistry mechanism, version 2, Atmos. Environ., 68, 174–185, 2013. a
Gu, S., Guenther, A., and Faiola, C.: Effects of anthropogenic and biogenic volatile organic compounds on Los Angeles air quality, Environ. Sci. Technol., 55, 12191–12201, 2021. a
Guenther, A., Hewitt, C. N., Erickson, D., Fall, R., Geron, C., Graedel, T., Harley, P., Klinger, L., Lerdau, M., McKay, W., Pierce, T., Scholes, B., Steinbrecher, R., Tallamraju, R., Taylor, J., and Zimmerman, P.: A global model of natural volatile organic compound emissions, J. Geophys. Res.-Atmos., 100, 8873–8892, 1995. a
Hansen, R., Griffith, S., Dusanter, S., Gilman, J., Graus, M., Kuster, W., Veres, P., de Gouw, J., Warneke, C., Washenfelder, R., Young, C. J., Brown, S. S., Alvarez, S. L., Flynn, J. H., Grossberg, N. E., Lefer, B., Rappenglueck, B., and Stevens, P. S.: Measurements of Total OH Reactivity During CalNex-LA, J. Geophys. Res.-Atmos., 126, e2020JD032988, https://doi.org/10.1029/2020JD032988, 2021. a
Harkins, C. and McDonald, B. C.: LA emission inventory, https://csl.noaa.gov/groups/csl7/measurements/2021sunvex/emissions/, last access: 27 April 2024.
He, J., Harkins, C., O’Dell, K., Li, M., Francoeur, C., Aikin, K. C., Anenberg, S., Baker, B., Brown, S. S., Coggon, M. M., Frost, G. J., Gilman, J. B., Kondragunta, S., Lamplugh, A., Lyu, C., Moon, Z., Pierce, B. R., Schwantes, R. H., Stockwell, C. E., Warneke, C., Yang, K., Nowlan, C. R., Abad, G. G., and McDonald, B. C.: COVID-19 perturbation on US air quality and human health impact assessment, P. Natl. Acad. Sci. USA, 3, pgad483, https://doi.org/10.1093/pnasnexus/pgad483, 2024. a
Hu, K. S., Darer, A. I., and Elrod, M. J.: Thermodynamics and kinetics of the hydrolysis of atmospherically relevant organonitrates and organosulfates, Atmos. Chem. Phys., 11, 8307–8320, https://doi.org/10.5194/acp-11-8307-2011, 2011. a
Jacob, D. J.: Heterogeneous chemistry and tropospheric ozone, Atmos. Environ., 34, 2131–2159, 2000. a, b, c
Jacobs, M. I., Burke, W. J., and Elrod, M. J.: Kinetics of the reactions of isoprene-derived hydroxynitrates: gas phase epoxide formation and solution phase hydrolysis, Atmos. Chem. Phys., 14, 8933–8946, https://doi.org/10.5194/acp-14-8933-2014, 2014. a
Kari, E., Miettinen, P., Yli-Pirilä, P., Virtanen, A., and Faiola, C. L.: PTR-ToF-MS product ion distributions and humidity-dependence of biogenic volatile organic compounds, Int. J. Mass Spectrom., 430, 87–97, 2018. a
Kim, S.-W., Heckel, A., Frost, G., Richter, A., Gleason, J., Burrows, J., McKeen, S., Hsie, E.-Y., Granier, C., and Trainer, M.: NO2 columns in the western United States observed from space and simulated by a regional chemistry model and their implications for NOx emissions, J. Geophys. Res.-Atmos., 114, https://doi.org/10.1029/2008JD011343, 2009. a
Kim, S.-W., McDonald, B., Baidar, S., Brown, S., Dube, B., Ferrare, R., Frost, G., Harley, R., Holloway, J., Lee, H.-J., Mckeen, S. A., Neuman, J. A., Nowak, J. B., Oetjen, H., Ortega, I., Pollack, I. B., Roberts, J. M., Ryerson, T. B., Scarino, A. J., Senff, C. J., Thalman, R., Trainer, M., Volkamer, R., Wagner, N., Washenfelder, R. A., Waxman, E., and Young, C. J.: Modeling the weekly cycle of NOx and CO emissions and their impacts on O3 in the Los Angeles-South Coast Air Basin during the CalNex 2010 field campaign, J. Geophys. Res.-Atmos., 121, 1340–1360, 2016. a, b, c
Kim, S.-W., McDonald, B. C., Seo, S., Kim, K.-M., and Trainer, M.: Understanding the paths of surface ozone abatement in the Los Angeles Basin, J. Geophys. Res.-Atmos., 127, e2021JD035606, https://doi.org/10.1029/2021JD035606, 2022. a, b, c
Lee, H.-J., Jo, H.-Y., Song, C.-K., Jo, Y.-J., Park, S.-Y., and Kim, C.-H.: Sensitivity of simulated PM2.5 concentrations over Northeast Asia to different secondary organic aerosol modules during the KORUS-AQ campaign, Atmosphere, 11, 1004, https://doi.org/10.3390/atmos11091004, 2020. a
Li, M., McDonald, B., McKeen, S., Eskes, H., Levelt, P., Francoeur, C., Harkins, C., He, J., Barth, M., Henze, D., Bela, M. M., Trainer, M., de Gouw, J. A., and Frost, G. J.: Assessment of Updated Fuel-Based Emissions Inventories Over the Contiguous United States Using TROPOMI NO2 Retrievals, J. Geophys. Res.-Atmos., 126, e2021JD035484, https://doi.org/10.1029/2021JD035484, 2021. a
Liu, Z., Nguyen, V. S., Harvey, J., Müller, J.-F., and Peeters, J.: Theoretically derived mechanisms of HPALD photolysis in isoprene oxidation, Phys. Chem. Chem. Phys., 19, 9096–9106, 2017. a
Livesley, S., McPherson, E. G., and Calfapietra, C.: The urban forest and ecosystem services: impacts on urban water, heat, and pollution cycles at the tree, street, and city scale, J. Environ. Qual., 45, 119–124, 2016. a
Ma, M., Gao, Y., Wang, Y., Zhang, S., Leung, L. R., Liu, C., Wang, S., Zhao, B., Chang, X., Su, H., Zhang, T., Sheng, L., Yao, X., and Gao, H.: Substantial ozone enhancement over the North China Plain from increased biogenic emissions due to heat waves and land cover in summer 2017, Atmos. Chem. Phys., 19, 12195–12207, https://doi.org/10.5194/acp-19-12195-2019, 2019. a
Madronich, S. and Flocke, S.: Theoretical estimation of biologically effective UV radiation at the Earth’s surface, in: Solar ultraviolet radiation: Modelling, measurements and effects, Springer, 23–48, https://doi.org/10.1007/978-3-662-03375-3_3, 1997. a
Mao, J., Jacob, D. J., Evans, M. J., Olson, J. R., Ren, X., Brune, W. H., Clair, J. M. St., Crounse, J. D., Spencer, K. M., Beaver, M. R., Wennberg, P. O., Cubison, M. J., Jimenez, J. L., Fried, A., Weibring, P., Walega, J. G., Hall, S. R., Weinheimer, A. J., Cohen, R. C., Chen, G., Crawford, J. H., McNaughton, C., Clarke, A. D., Jaeglé, L., Fisher, J. A., Yantosca, R. M., Le Sager, P., and Carouge, C.: Chemistry of hydrogen oxide radicals (HOx) in the Arctic troposphere in spring, Atmos. Chem. Phys., 10, 5823–5838, https://doi.org/10.5194/acp-10-5823-2010, 2010. a
Mao, J., Fan, S., Jacob, D. J., and Travis, K. R.: Radical loss in the atmosphere from Cu-Fe redox coupling in aerosols, Atmos. Chem. Phys., 13, 509–519, https://doi.org/10.5194/acp-13-509-2013, 2013. a
McDonald, B. C., Dallmann, T. R., Martin, E. W., and Harley, R. A.: Long-term trends in nitrogen oxide emissions from motor vehicles at national, state, and air basin scales, J. Geophys. Res.-Atmos., 117, https://doi.org/10.1029/2012JD018304, 2012. a
McDonald, B. C., De Gouw, J. A., Gilman, J. B., Jathar, S. H., Akherati, A., Cappa, C. D., Jimenez, J. L., Lee-Taylor, J., Hayes, P. L., McKeen, S. A., Cui, Y. Y., Kim, S. W., Gentner, D. R., Issacman-VanWertz, G., Goldstein, A. H., Harley, R. A., Frost, G. J., Roberts, J. M., Ryerson, T. B., and Trainer, M.: Volatile chemical products emerging as largest petrochemical source of urban organic emissions, Science, 359, 760–764, 2018a. a, b
McDonald, B. C., McKeen, S. A., Cui, Y. Y., Ahmadov, R., Kim, S.-W., Frost, G. J., Pollack, I. B., Peischl, J., Ryerson, T. B., Holloway, J. S., Graus, M., Warneke, C., Gilman, J. B., de Gouw, J. A., Kaiser, J., Keutsch, F. N., Hanisco, T. F., Wolfe, G. M., and Trainer, M.: Modeling ozone in the Eastern US using a fuel-based mobile source emissions inventory, Environ. Sci. Technol., 52, 7360–7370, 2018b. a, b, c, d
McDuffie, E. E., Fibiger, D. L., Dubé, W. P., Lopez-Hilfiker, F., Lee, B. H., Thornton, J. A., Shah, V., Jaeglé, L., Guo, H., Weber, R. J., Reeves, J. M., Weinheimer, A. J., Schroder, J. C., Campuzano-Jost, P., Jimenez, J. L., Dibb, J. E., Veres, P., Ebben, C., Sparks, T. L., Wooldridge, P. J., Cohen, R. C., Hornbrook, R. S., Apel, E. C., Campos, T., Hall, S. R., Ullmann, K., and Brown, S. S.: Heterogeneous N2O5 uptake during winter: Aircraft measurements during the 2015 WINTER campaign and critical evaluation of current parameterizations, J. Geophys. Res.-Atmos., 123, 4345–4372, 2018. a
McKeen, S., Chung, S., Wilczak, J., Grell, G., Djalalova, I., Peckham, S., Gong, W., Bouchet, V., Moffet, R., Tang, Y., Carmichael, G. R., Mathur, R., and Yu, S.: Evaluation of several PM2.5 forecast models using data collected during the ICARTT/NEAQS 2004 field study, J. Geophys. Res.-Atmos., 112, https://doi.org/10.1029/2006JD007608, 2007. a
Middleton, P., Stockwell, W. R., and Carter, W. P.: Aggregation and analysis of volatile organic compound emissions for regional modeling, Atmos. Environ-A. Gen., 24, 1107–1133, 1990. a
Müller, J.-F., Stavrakou, T., and Peeters, J.: Chemistry and deposition in the Model of Atmospheric composition at Global and Regional scales using Inversion Techniques for Trace gas Emissions (MAGRITTE v1.1) – Part 1: Chemical mechanism, Geosci. Model Dev., 12, 2307–2356, https://doi.org/10.5194/gmd-12-2307-2019, 2019. a
Nussbaumer, C. M. and Cohen, R. C.: The role of temperature and NO x in ozone trends in the Los Angeles Basin, Environ. Sci. Technol., 54, 15652–15659, 2020. a, b
Nussbaumer, C. M., Place, B. K., Zhu, Q., Pfannerstill, E. Y., Wooldridge, P., Schulze, B. C., Arata, C., Ward, R., Bucholtz, A., Seinfeld, J. H., Goldstein, A. H., and Cohen, R. C.: Measurement report: Airborne measurements of NOx fluxes over Los Angeles during the RECAP-CA 2021 campaign, Atmos. Chem. Phys., 23, 13015–13028, https://doi.org/10.5194/acp-23-13015-2023, 2023. a, b, c, d
Olson, J. B., Kenyon, J. S., Angevine, W., Brown, J. M., Pagowski, M., and Sušelj, K.: A description of the MYNN-EDMF scheme and the coupling to other components in WRF–ARW, https://doi.org/10.25923/n9wm-be49, 2019. a
Owen, S. M. and Penuelas, J.: Volatile isoprenoid emission potentials are correlated with essential isoprenoid concentrations in five plant species, Acta Physiol. Plant., 35, 3109–3125, 2013. a
Pfannerstill, E. Y., Arata, C., Zhu, Q., Schulze, B. C., Woods, R., Harkins, C., Schwantes, R. H., McDonald, B. C., Seinfeld, J. H., Bucholtz, A., Cohen, R. C., and Goldstein, A. H.: Comparison between Spatially Resolved Airborne Flux Measurements and Emission Inventories of Volatile Organic Compounds in Los Angeles, Environ. Sci. Technol., 57, 15533–15545, https://doi.org/10.1021/acs.est.3c03162, 2023a. a
Pfannerstill, E. Y., Arata, C., Zhu, Q., Schulze, B. C., Woods, R., Seinfeld, J. H., Bucholtz, A., Cohen, R. C., and Goldstein, A. H.: Volatile organic compound fluxes in the agricultural San Joaquin Valley – spatial distribution, source attribution, and inventory comparison, Atmos. Chem. Phys., 23, 12753–12780, https://doi.org/10.5194/acp-23-12753-2023, 2023b. a, b, c
urser, G., Drewer, J., Heal, M. R., Sircus, R. A. S., Dunn, L. K., and Morison, J. I. L.: Isoprene and monoterpene emissions from alder, aspen and spruce short-rotation forest plantations in the United Kingdom, Biogeosciences, 18, 2487–2510, https://doi.org/10.5194/bg-18-2487-2021, 2021. a
Pye, H. O., Luecken, D. J., Xu, L., Boyd, C. M., Ng, N. L., Baker, K. R., Ayres, B. R., Bash, J. O., Baumann, K., Carter, W. P., Edgerton, E., Fry, J. L., Hutzell, W. T., Schwede, D. B., and Shepson, P. B.: Modeling the current and future roles of particulate organic nitrates in the southeastern United States, Environ. Sci. Technol., 49, 14195–14203, 2015. a
Pye, H. O. T., Place, B. K., Murphy, B. N., Seltzer, K. M., D'Ambro, E. L., Allen, C., Piletic, I. R., Farrell, S., Schwantes, R. H., Coggon, M. M., Saunders, E., Xu, L., Sarwar, G., Hutzell, W. T., Foley, K. M., Pouliot, G., Bash, J., and Stockwell, W. R.: Linking gas, particulate, and toxic endpoints to air emissions in the Community Regional Atmospheric Chemistry Multiphase Mechanism (CRACMM), Atmos. Chem. Phys., 23, 5043–5099, https://doi.org/10.5194/acp-23-5043-2023, 2023. a
Qin, M., Murphy, B. N., Isaacs, K. K., McDonald, B. C., Lu, Q., McKeen, S. A., Koval, L., Robinson, A. L., Efstathiou, C., Allen, C., et al.: Criteria pollutant impacts of volatile chemical products informed by near-field modelling, Nature Sustainability, 4, 129–137, 2021. a, b
Schell, B., Ackermann, I. J., Hass, H., Binkowski, F. S., and Ebel, A.: Modeling the formation of secondary organic aerosol within a comprehensive air quality model system, J. Geophys. Res.-Atmos., 106, 28275–28293, 2001. a
Schwantes, R. H., Emmons, L. K., Orlando, J. J., Barth, M. C., Tyndall, G. S., Hall, S. R., Ullmann, K., St. Clair, J. M., Blake, D. R., Wisthaler, A., and Bui, T. P. V.: Comprehensive isoprene and terpene gas-phase chemistry improves simulated surface ozone in the southeastern US, Atmos. Chem. Phys., 20, 3739–3776, https://doi.org/10.5194/acp-20-3739-2020, 2020. a, b
Scott, K. I. and Benjamin, M. T.: Development of a biogenic volatile organic compounds emission inventory for the SCOS97-NARSTO domain, Atmos. Environ., 37, 39–49, 2003. a
Shuai, J., Kim, S., Ryu, H., Park, J., Lee, C. K., Kim, G.-B., Ultra, V. U., and Yang, W.: Health risk assessment of volatile organic compounds exposure near Daegu dyeing industrial complex in South Korea, BMC Public Health, 18, 1–13, 2018. a
Stockwell, W. R., Kirchner, F., Kuhn, M., and Seefeld, S.: A new mechanism for regional atmospheric chemistry modeling, J. Geophys. Res.-Atmos., 102, 25847–25879, 1997. a
Tan, Z., Hofzumahaus, A., Lu, K., Brown, S. S., Holland, F., Huey, L. G., Kiendler-Scharr, A., Li, X., Liu, X., Ma, N., Min, K. E., Rohrer, F., Shao, M., Wahner, A., Wang, Y., Wiedensohler, A., Wu, Y., Wu, Z., Zeng, L., Zhang, Y., and Fuchs, H.: No evidence for a significant impact of heterogeneous chemistry on radical concentrations in the North China Plain in summer 2014, Environ. Sci. Technol., 54, 5973–5979, 2020. a
Teng, A. P., Crounse, J. D., and Wennberg, P. O.: Isoprene peroxy radical dynamics, J. Am. Chem. Soc., 139, 5367–5377, 2017. a
van Meeningen, Y., Schurgers, G., Rinnan, R., and Holst, T.: Isoprenoid emission response to changing light conditions of English oak, European beech and Norway spruce, Biogeosciences, 14, 4045–4060, https://doi.org/10.5194/bg-14-4045-2017, 2017. a
Van Rooy, P., Tasnia, A., Barletta, B., Buenconsejo, R., Crounse, J. D., Kenseth, C. M., Meinardi, S., Murphy, S., Parker, H., Schulze, B., Seinfeld, J. H., Wennberg, P. O., Blake, D. R., and Barsanti, K. C.: Observations of volatile organic compounds in the Los Angeles Basin during COVID-19, ACS Earth Space Chem., 5, 3045–3055, 2021. a, b, c
VandenBoer, T. C., Brown, S. S., Murphy, J. G., Keene, W. C., Young, C. J., Pszenny, A., Kim, S., Warneke, C., de Gouw, J. A., Maben, J. R., Wagner, N. L., Riedel, T. P., Thornton, J. A., Wolfe, D. E., Dube, W. P., Ozturk, F., Brock, C. A., Grossberg, N., Lefer, B., Lerner, B., Middlebrook, A. M., and Roberts, J. M.: Understanding the role of the ground surface in HONO vertical structure: High resolution vertical profiles during NACHTT-11, J. Geophys. Res.-Atmos., 118, 10–155, 2013. a
VandenBoer, T. C., Young, C. J., Talukdar, R. K., Markovic, M. Z., Brown, S. S., Roberts, J. M., and Murphy, J. G.: Nocturnal loss and daytime source of nitrous acid through reactive uptake and displacement, Nat. Geosci., 8, 55–60, 2015. a
Warneke, C., De Gouw, J. A., Holloway, J. S., Peischl, J., Ryerson, T. B., Atlas, E., Blake, D., Trainer, M., and Parrish, D. D.: Multiyear trends in volatile organic compounds in Los Angeles, California: Five decades of decreasing emissions, J. Geophys. Res.-Atmos., 117, D00V17, https://doi.org/10.1029/2012JD017899, 2012. a
Wennberg, P. O., Bates, K. H., Crounse, J. D., Dodson, L. G., McVay, R. C., Mertens, L. A., Nguyen, T. B., Praske, E., Schwantes, R. H., Smarte, M. D., St Clair, J. M. Teng, A. P., Zhang, X., and Seinfeld, J. H.: Gas-phase reactions of isoprene and its major oxidation products, Chem. Rev., 118, 3337–3390, 2018. a
Xie, X., Hu, J., Qin, M., Guo, S., Hu, M., Wang, H., Lou, S., Li, J., Sun, J., Li, X., Sheng, L., Zhu, J., Chen, G., Yin, J., Fu, W., Huang, C., and Zhang, Y.: Modeling particulate nitrate in China: Current findings and future directions, Environment International, 166, 107369, https://doi.org/10.1016/j.envint.2022.107369, 2022. a
Yu, K. A., Li, M., Harkins, C., He, J., Zhu, Q., Verreyken, B., Schwantes, R. H., Cohen, R. C., McDonald, B. C., and Harley, R. A.: Improved Spatial Resolution in Modeling of Nitrogen Oxide Concentrations in the Los Angeles Basin, Environ. Sci. Technol., 57, 20689–20698, 2023. a
Zare, A., Romer, P. S., Nguyen, T., Keutsch, F. N., Skog, K., and Cohen, R. C.: A comprehensive organic nitrate chemistry: insights into the lifetime of atmospheric organic nitrates, Atmos. Chem. Phys., 18, 15419–15436, https://doi.org/10.5194/acp-18-15419-2018, 2018. a, b, c, d
Zare, A., Fahey, K. M., Sarwar, G., Cohen, R. C., and Pye, H. O.: Vapor-pressure pathways initiate but hydrolysis products dominate the aerosol estimated from organic nitrates, ACS Earth Space Chem., 3, 1426–1437, 2019. a, b
Zhu, Q., Place, B., Pfannerstill, E. Y., Tong, S., Zhang, H., Wang, J., Nussbaumer, C. M., Wooldridge, P., Schulze, B. C., Arata, C., Bucholtz, A., Seinfeld, J. H., Goldstein, A. H., and Cohen, R. C.: Direct observations of NOx emissions over the San Joaquin Valley using airborne flux measurements during RECAP-CA 2021 field campaign, Atmos. Chem. Phys., 23, 9669–9683, https://doi.org/10.5194/acp-23-9669-2023, 2023. a, b
Zhu, Q., Schwantes, R. H., Coggon, M., Harkins, C., Schnell, J., He, J., Pye, H. O. T., Li, M., Baker, B., Moon, Z., Ahmadov, R., Pfannerstill, E. Y., Place, B., Wooldridge, P., Schulze, B. C., Arata, C., Bucholtz, A., Seinfeld, J. H., Warneke, C., Stockwell, C. E., Xu, L., Zuraski, K., Robinson, M. A., Neuman, A., Veres, P. R., Peischl, J., Brown, S. S., Goldstein, A. H., Cohen, R. C., and McDonald, B. C.: Analysis dataset for “A better representation of volatile organic compound chemistry in WRF-Chem and its impact on ozone over Los Angeles”, https://csl.noaa.gov/groups/csl4/modeldata/data/Zhu2023/ (last access date: 29 April 2024), 2024a.
Zhu, Q., Schwantes, R. H., Coggon, M., Harkins, C., Schnell, J., He, J., Pye, H. O. T., Li, M., Baker, B., Moon, Z., Ahmadov, R., Pfannerstill, E. Y., Place, B., Wooldridge, P., Schulze, B. C., Arata, C., Bucholtz, A., Seinfeld, J. H., Warneke, C., Stockwell, C. E., Xu, L., Zuraski, K., Robinson, M. A., Neuman, A., Veres, P. R., Peischl, J., Brown, S. S., Goldstein, A. H., Cohen, R. C., and McDonald, B. C.: Analysis code and WRF-Chem source code for “A better representation of volatile organic compound chemistry in WRF-Chem and its impact on ozone over Los Angeles”, GitHub [code], https://github.com/NOAA-CSL/WRF-Chem_CSL_Publications/releases/tag/v1.0, 2024b.
Zuo, Z., Wang, B., Ying, B., Zhou, L., and Zhang, R.: Monoterpene emissions contribute to thermotolerance in Cinnamomum camphora, Trees, 31, 1759–1771, 2017. a
- Abstract
- Introduction
- Development of RACM2B-VCP chemical mechanism
- Model configuration
- Observations
- Evaluation of O3 and PM2.5 against the AQS network
- Evaluation of NOx, CO, and VOCs against RECAP-CA and SUNVEx field campaigns
- Evaluation of PAN and aerosols against ground site measurements from the SUNVEx field campaigns
- The impact of VCP emissions on VOC reactivity and O3
- Conclusions
- Code and data availability
- Author contributions
- Competing interests
- Disclaimer
- Acknowledgements
- Financial support
- Review statement
- References
- Supplement