the Creative Commons Attribution 4.0 License.
the Creative Commons Attribution 4.0 License.
 | 02 May 2024
Efficient droplet activation of ambient black carbon particles in a suburban environment
Ping Tian
Kang Hu
Yangzhou Wu
Mengyu Huang
Hui He
Jiujiang Sheng
Chenjie Yu
Dawei Hu
Deping Ding
The cloud condensation nuclei (CCN) activity of black carbon (BC) particles importantly determines their impacts on cloud microphysics and atmospheric lifetime. This process is crucially influenced by the number of hygroscopic coating materials that BC acquire during the ageing process. It remains a challenge for ambient measurements to capture this process and link this with CCN activity of BC. Here, we directly measured the droplet activation diameter (D50) and activation fraction of BC-containing (BCc) particles (Fact,BC) in suburban Beijing using coupled measurements of size-resolved number concentrations of CCN at configured water supersaturation (SS) and BCc particles. The number concentration of BCc particles was found to peak at diameter 180–210 nm after acquiring coatings, larger than that for all particles (50–150 nm). Consequently, the initially smaller BC particles become enlarged and more hygroscopic, thereby exhibiting CCN activities than other particles. The Fact,BC increased from 42 % to 69 % in number and from 67 % to 85 % in mass as SS increased from 0.1 % to 0.2 % but tended to reach a plateau when SS > 0.2 %. Notably, Fact,BC and D50 linearly correlated with equivalent photochemical age, at a rate of +2 % h−1 and −3 nm h−1, respectively. The results suggest BCc particles from anthropogenic sources can readily serve as CCN at a relatively low SS, and more than half of the BC population can be activated within a few hours, indicating that the surface-sourced BC can efficiently incorporate into clouds and potentially exert important indirect radiative impacts.
- Article
(5316 KB) - Full-text XML
-
Supplement
(1247 KB) - BibTeX
- EndNote


Black carbon (BC), a significant anthropogenic pollutant, is generated from the incomplete combustion of fossil fuels and profoundly influences the climate through direct (Ramanathan and Carmichael, 2008; Bond et al., 2013), indirect (Koch et al., 2011), and semi-direct effects (Koch and Del Genio, 2010). The climate response to BC, sensitive to its atmospheric lifetime (Hansen et al., 1997), introduces considerable uncertainty in model studies, attributed to spatial and temporal variations (Park et al., 2005; Koch et al., 2009; Lund et al., 2017).
Wet scavenging, identified as the primary removal mechanism for atmospheric BC (Jacobson, 2010), involves BC particles acting as cloud condensation nuclei (CCN) that are activated into the cloud droplets and removed through precipitation. Although freshly emitted BC particles are generally hydrophobic, they become more hygroscopic through atmospheric processing, acquiring coating materials such as sulfates, nitrates, and secondary organic aerosol compounds, or by coagulating with other particles (Dusek et al., 2006; Tritscher et al., 2011). The increased hygroscopicity of BC enhances their CCN activation efficiency (Weingartner et al., 1995). However, significant variability exists in the literature regarding the extent to which BC acts as CCN (Wu et al., 2019; Rose et al., 2011), due to the diverse properties of BC arising from its various sources and the atmospheric ageing process (Henning et al., 2012; Dalirian et al., 2018).
The κ-Köhler theory (Petters and Kreidenweis, 2007), combined with the Zdanovskii–Stokes–Robinson (ZSR) mixing rule (Pruppacher and Klett, 1997; Henning et al., 2010), has been successful in predicting the hygroscopicity of internally mixed BC, assuming a spherical core–shell structure. Chamber studies, where the physical and chemical conditions and the initially emitted particles are well controlled, indicate that the hygroscopicity of BC is determined by the fraction and hygroscopicity of the coating material (Snider et al., 2010; Friebel et al., 2019). A relatively thin soluble coating, like 2nm corresponding to about 5 % of the total volume for 250nm particles, is enough to make hydrophobic BC CCN active under typical atmospheric supersaturation (Dalirian et al., 2018). The hygroscopic properties of the coating materials can vary significantly; notably, the increase in the hygroscopicity of BC induced by inorganic aerosols (e.g. ammonium nitrate) is more pronounced than that caused by organic aerosols (Kuwata et al., 2007; Liu et al., 2013). However, laboratory experiments often fail to replicate the complexity of atmospheric conditions; thus, comprehensive field measurements are needed to capture the real-time evolution of the CCN properties of BC.
Despite advancements in understanding the physicochemical transformations of BC through field observations (Liu et al., 2017), quantifying its CCN activity under ambient conditions remains challenging due to the variability in its sources, composition, mixing state, and atmospheric processes (Zhang et al., 2008). Direct field observations indicate that a number fraction of 50 %–90 % BC can be activated into cloud or fog, depending on the actual ambient supersaturation (Motos et al., 2019a, b). More than 50 % of BC mass can be removed through the wet removal process during transport from the surface to the planetary boundary layer (PBL), as evidenced by studies in east Asian polluted areas (Kondo et al., 2016; Liu et al., 2020). However, determining true ambient supersaturation in in situ cloud observations is challenging.
The hygroscopicity of BC particles can be derived from their measured mixed state by a size-resolved soot particle aerosol mass spectrometer (SP-AMS) (Onasch et al., 2012; Wu et al., 2019) and a hygroscopic tandem differential mobility analyser (HTDMA) under subsaturation conditions. However, only a limited number of atmospheric CCN efficiency studies on BC particles have been conducted under water supersaturation conditions. Continuous-flow cloud condensation nuclei counter (CCNc) instruments can measure the CCN number concentration of bulk aerosol under well-controlled supersaturation conditions (Roberts and Nenes, 2005), but they cannot distinguish how much of the BC contributes to activation, given that BC accounts for about 10 % of the ambient aerosol. Recently, D. Hu et al. (2021) developed a novel method to directly observe the number activation ratios of BC under certain supersaturation levels, based on the size-resolved CCNc and BC measurements, revealing potential overestimation of BC hygroscopicity based on bulk chemical composition.
In this study, continuous observations of the CCN activation and hygroscopic properties of BC under water supersaturation (0.1 %, 0.2 %, and 0.3 %) were conducted during springtime at a suburban site in Beijing. The variation in the hygroscopicity of BC during different pollution levels was investigated through the classification of four distinct air mass types. The equivalent photochemical age (tage), calculated using trace-gas measurements by a proton-transfer-reactor time-of-flight mass spectrometer, was used to characterize the evolution of BC's CCN activation properties under ambient atmospheric ageing.
2.1 Measurement site and instrumental setup
The field campaign was conducted for 33 d from 29 April to 2 June 2020 at Beijing Cloud Laboratory and Observational Utilities Deployment Base (CLOUD Base) (Tian et al., 2022), approximately 65 km northeast of central Beijing. The main local emissions, which represent a typical suburban environment, originate from industrial, traffic, and residential sources. Higher pollution conditions at this site were correlated with regional transport of pollutants from the west and south, while cleaner conditions were attributed to dilution by clean air from the northwest (Hu et al., 2022).
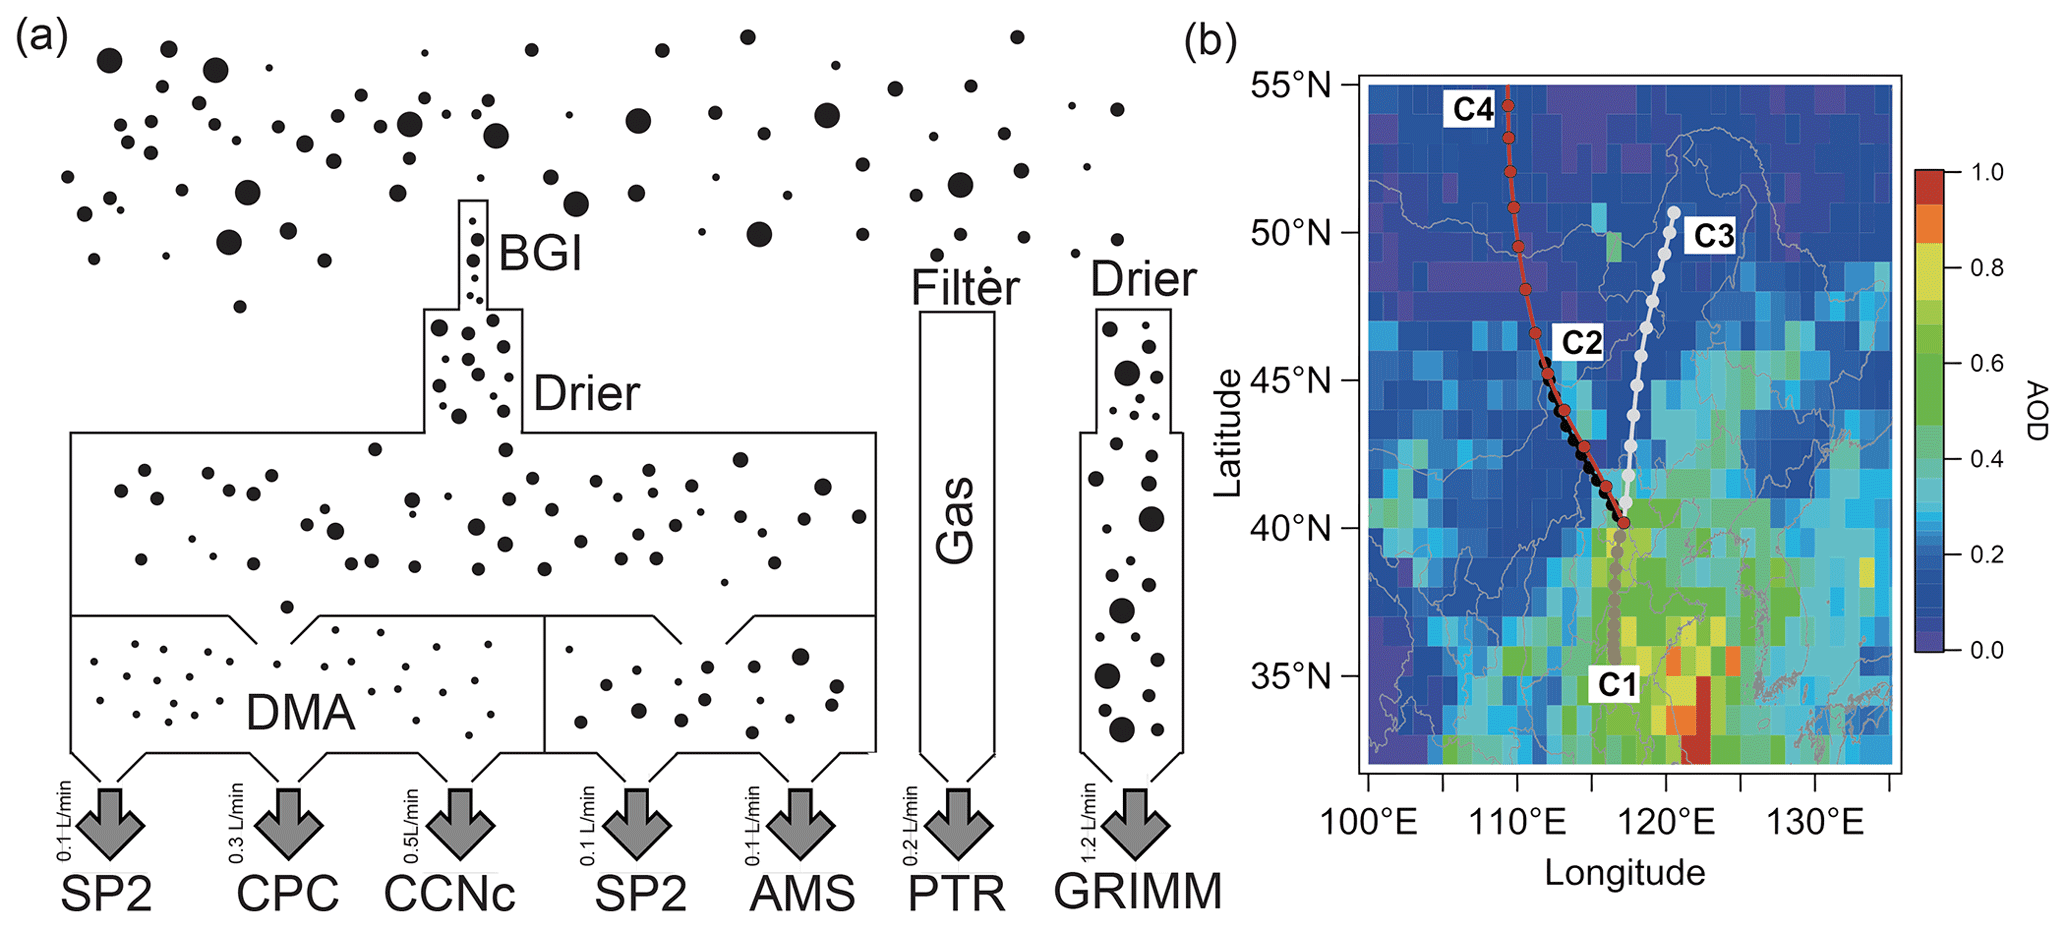
Figure 1Schematic of the experiment. (a) Experimental setup showing aerosols are sampled through a PM2.5 impactor after a dryer. Mono-dispersed aerosol was measured downstream of a differential mobility analyser (DMA), including SP2, CPC, and CCNc, and additional lines measure the poly-dispersed aerosols with the SP2 and HR-ToF-AMS. All sizes of dried aerosol are measured by a GRIMM, and the VOC concentration was measured by a PTR-TOF-AMS. (b) Mean aerosol optical depth (AOD) during the experimental month, with three lines showing the clustered 36 h backward trajectories initialized from the experimental site, where each marker is denoting 6 h transport time.
The instrument setup is shown in Fig. 1a. The bulk and size-resolved physicochemical and hygroscopic properties of aerosols were simultaneously measured during the field campaign. A cyclone PM2.5 cutoff inlet (Model: SCC1.829, BGI Inc., USA) was used to remove the coarse-mode particles (larger than 2.5 µm), and the air was dried by a Nafion tube before entering the instruments. In addition to particle measurement, volatile organic compounds (VOCs) were measured by a proton-transfer-reactor time-of-flight mass spectrometer (PTR-TOF-MS 8000; Ionicon Analytik GmbH, Innsbruck, Austria) (Fig. 1a).
2.2 Aerosol chemical components' measurements and hygroscopic growth factor calculation
The mass concentration of non-refractory submicron aerosol species, including organic aerosol (OA), chloride (Cl−), ammonium (NH), nitrate (NO), and sulfate (SO), was measured by an Aerodyne high-resolution time-of-flight AMS (HR-ToF-AMS; Aerodyne Research Inc., USA). The principles and operation of the HR-ToF-AMS have been detailed in previous publications (Jayne et al., 2000; Drewnick et al., 2005). The HR-ToF-AMS was calibrated before and after the experiment, and relative ionization efficiencies for NH (4.0) and SO (1.2) were calibrated using pure ammonium nitrate and ammonium sulfate, respectively, while default relative ionization efficiency values were used for OA (1.4), NO (1.1), and Cl− (1.3) (Middlebrook et al., 2012).
The measurements of individual refractory BC (rBC)-containing (BCc) particles and BC-free (BCf) particles were conducted using a single-particle soot photometer (SP2; DMT Inc., USA). The SP2 uses an intense 1064 nm Nd:YAG laser beam to heat BCc particles to vaporize, with the mass and diameter (Dc) of rBC particles quantified based on the intensity of the incandescence signal. The incandescence signal was calibrated using Aquadag standard (Acheson Inc., USA) and corrected for ambient BC by a factor of 0.75 before the experiment (Laborde et al., 2012). Particles exhibiting only scattering signal were classified as BCf, with their diameters determined based on the intensity of scattering signal and calibrated by polystyrene latex (PSL) spheres. Due to the distortion of the scattering signal caused by the vaporization of the coating material of BCc particles, the leading-edge-only (LEO) fitting method was employed to derive the entire size of BCc particles (Gao et al., 2007; Liu et al., 2014). As suggested by Moteki et al. (2010), for sizes smaller than 400 nm, the scattering signal measured by the SP2 predominantly influences the volume of the particle, with little influence from the morphology of BCc particles. The scattering at λ=1064 nm, which is larger than the particle size of a typical BCc particle, can minimize the geometric influence of scattering due to the complex morphology of BC. This is validated to be within 10 % accuracy for the optical size determination of BCc particles at 1064 nm (K. Hu et al., 2021). Thus, the measured optical diameter by the SP2 is assumed to be equal to the volume equivalent diameter (Dve) (K. Hu et al., 2021). Consequently, the relative bulk volume of coating to BC () was calculated as the cubic ratio of diameter of Dve and Dc (Liu et al., 2017):
where Dve is the volume equivalent diameter of the entire BCc particle, and Dc is the rBC core diameter for the ith single BCc.
The hygroscopic growth factor (κ), which depends on chemical properties such as molecular weight, dissociate, and osmotic coefficient, can be used to predict the activation properties of particles as CCN under certain supersaturation (SS) (Petters and Kreidenweis, 2007). The κ for all particles (κall) was calculated using the Zdanovskii–Stokes–Robinson (ZSR) mixing rule to account for the volume contribution from different chemical components (McDonald, 1953). The expression for κall is
where κi and εi represent the hygroscopic growth factor and volume fraction for each chemical component (i.e. (NH4)2SO4, NH4HSO4, NH4NO3, and BC, etc.).
The κ of single BCc (κBC) particles is dependent on the volume fraction and κ of the coating material, and calculated as
where the κcoating was selected to match κall, which represents the average κ of particles, and the is the volume ratio of coating material over the BC, which reflects the coating thickness of BCc particles. This selection is based on the strong correlation, within a 25 % variation, between κcoating and that of BC-free particles, as previous studies (Liu et al., 2013; Ohata et al., 2016) have demonstrated. Such a correlation is primarily attributed to the similar organic and inorganic compositions of BC-coating materials and BC-free particles (Cui et al., 2022), largely due to internal mixing of these compounds. The κBC was tested to successfully predict the CCN activation properties of BCc particles in the field in situ cloud observation (Motos et al., 2019a).
2.3 Size-resolved CCN activity of all particles and BCc particles
Atmospheric polydisperse aerosols were classified into monodisperse particles at the outlet of a differential mobility analyser (DMA; Model: 3081, TSI Inc., USA). Particles of different mobility sizes were selected by applying varying voltages to the DMA while maintaining a specific sheath flow rate (Knutson and Whitby, 1975). Instead of using the standard TSI Aerosol Instrument Manager control software, the DMA was controlled by custom-made software. This software enabled the selection of specific diameters and control over residence time at those diameters (Moore et al., 2010; Deng et al., 2011). A total of 29 mobility diameters, ranging from 29 to 612 nm at logarithmic intervals, were chosen, with each diameter maintained for 30 s. This duration was selected considering the time lag, estimated to be less than 20 s, between the instruments following the DMA (Fig. 1a). A complete size scan took approximately 15 min. The sheath and sample flow rates of the DMA were calibrated both before and after the experiment, and the mobility size selected by the DMA was validated using PSL spheres.
The monodisperse number concentrations of all condensation nuclei [CN], [CCN], and both [BCc] and [BCf] were measured using a condensation particles counter (CPC; Model 3772, TSI Inc., USA) with a flow rate of 0.30 L min−1, and a cloud condensation nucleus counter (CCNc, DMT Inc., USA) with a flow rate of 0.50 L min−1, and another SP2 with a flow rate of 0.12 L min−1, respectively (Fig. 1a). Three SSs at 0.1 %, 0.2 %, and 0.3 % were set for the CCNc, with an interval of 30 min, allowing for two size scans at each SS. The sample/sheath flow rates and the SS of the CCNc were calibrated before and after the experiment (Rose et al., 2008). Moreover, the monodisperse [CCN], [CN], and [BCc] were corrected for multiple charge effects, a correction applied from large particles (which only with one negative charge) to smaller particles, based on charging probabilities for different mobility size (Wiedensohler, 1988).
The CCN activity of all particles was determined using the size-resolved activation ratio (Fact) ([CCN] [CN]), following the method described by Moore et al. (2010). This size-resolved ratio, [CCN] [CN], indicates the fraction of CN that can serve as CCN, and it can be directly measured by the CCNc and CPC through size scanning with the DMA. The [CCN] [CN] ratio increases with particle size, reaching 1 for larger particle (e.g. greater than 300 nm), while it decreases to 0 for smaller sizes (e.g. 30 nm). The specific size at which the [CCN] [CN] ratio equals 0.5 is identified as the activation diameter (D50). This critical value is typically derived through sigmoid fitting of the size-resolved [CCN] [CN] (Rose et al., 2008).
The CCN activated number concentration of BCc [BCact] is distinguished from BCf and directly measured in this study, following the method by D. .Hu et al. (2021). This approach compares the difference between the unactivated particle number concentration ([CNunact]) and [BCc] to derive how many BCc particles are activated into CCN. [CNunact] is calculated by subtracting [CCN] from the total [CN]. [CNunact] is zero at larger particle sizes, indicating that all particles, including BCc particles, are activated. Conversely, when [CNunact] equals the total [CN], it signifies that none of the particles are activated. It is well recognized that the activation of BCc particles into CCN is more unlikely compared to BCf particles of the same diameter, due to BCc particles' lower κ (Dusek et al., 2006; Bond et al., 2013). Only when [CNunact] is smaller than [BCc] does it mean that some BCc particles have been activated into CCN. When [CNunact] is zero, it indicates that all BCc particles are activated. Thus, the [BCact] and activation ratios (Fact,BC) of BCc particles are calculated as
[BCact] is the difference between the [BCc] and [CNunact], and Fa,BC is calculated by [BCact] over the [BCc]. When [CNunact] is larger than [BCc], it indicates that none of the BCc particles could be activated, resulting in both [BCact] and Fact,BC being 0.
2.4 Determination of the photochemical age
The mass spectra of VOCs were measured using the PTR-TOF-AMS, calibrated with the CH3COCH ( 59.0490) and H3O+ ( 21.0226), following the procedures described by Bruns et al. (2016). The equivalent photochemical age (tage), a critical factor for assessing the duration of atmospheric photochemical reaction, is derived from comparing the ratios of two VOCs with different OH radical reaction rates, acknowledging that species more reactive with OH diminish more rapidly as photochemical ageing increases (Yuan et al., 2012). Despite uncertainties arising from the mixing of fresh emitted and aged air mass, this method provides valuable insights into atmospheric photochemical processing (Parrish et al., 2007). In this study, toluene and benzene were chosen for their strong correlation and differing reaction rates with OH and expressed as
where [OH] is the ambient average OH concentration (2×10⁶ molec. cm−3) obtained from the reanalysis product (available from the European Center for Medium Range Weather Forecasts: Atmospheric Composition Reanalysis 4), consistent with previous observation in Beijing (Liu et al., 2018). ktoluene and kbenzene denote the reaction rate with OH of toluene ( cm−3 mol.−1 s−1) and benzene ( cm−3 molec.−1 s−1), respectively. is the ratio of freshly emitted toluene and benzene, and the value was determined to be 2.27±0.27 according to the maximum toluene / benzene ratio during the experiment. is the ratio of measured toluene and benzene in the atmosphere. The calculation of tage was only performed during the daytime to ensure it reflects the photochemical process. The dataset of tage in this study has been successfully tested to determine the photochemical reaction or production rates of secondary OA, with further details on the calculation of [OH] and available in Wu et al. (2022).
2.5 Backward trajectory analysis
The potential source contribution to the target site was modelled using the Hybrid Single-Particle Lagrangian Integrated Trajectory Model (HYSPLIT) model. Ensemble calculations were performed with 3-hourly, 1°×1° GDAS horizontal and vertical reanalysis wind fields to retrieve 36 h backward air mass trajectories to the target site. A clustering analysis of the air mass trajectories was conducted using a systematic clustering method (Draxier and Hess, 1998), and a total of 216 trajectories were calculated. The entire observation periods were classified into four clusters (Fig. 1b). Cluster 1 (C1) represented the slowest transport values in southern polluted area, while 2 to 4 (C2–C4) originated from the northern clean areas (Fig. 1b).
3.1 Overview of aerosol physical and chemical properties
Figure 2a–d show the time series of aerosol physical and chemical properties, with the colour labels at the top representing different air mass influence periods. The statistical comparison of aerosol properties between different air mass is shown in Fig. 2e–i. Consistent with previous studies, aerosol physical–chemical properties are highly dependent on air mass (Tian et al., 2020; Zhao et al., 2020). Higher pollutant concentrations, including PM1, sulfate, nitrate, OA, and BC, were observed during the C1 period with air from the southern part of the North China Plain (NCP) (average PM1 value of 33.2±16.4 µg m−3) (Fig. 2e and f), which contains high pollutant concentrations due to the intensive emissions (Fig. 1b). When the air comes from northern cleaner part of the NCP during C3 and C4 periods (Fig. 1b), lower pollutant concentrations were observed (average PM1 value of 10.4±5.8 µg m−3) (Fig. 2a and e), suggesting that pollutants were diluted and dispersed during the fast transport process. Thus, C1 was estimated as a polluted condition, while C3 and C4 were classified as clean environments. However, C2 originated from the same direction as C4 but with shorter transportation distances, indicating slower wind speeds and less dilution of emissions. Consequently, the PM1 mass concentration (15.4±10.6 µg m−3) of C2 was higher than that in a clean environment but still 50 % lower than that of C1 and thus classified as light polluted conditions (Fig. 2e).

Figure 2Time series of (a) mass concentrations for chloride (Chl), ammonium (NH4), nitrate (NO), organic (Org), sulfate (SO), BC mass and PM1 measured by HR-TOF-AMS, SP2 and GRIMM. (b) Volume fraction of particle components for NH4HSO4, (NH4)2SO4, NH4NO3, organic carbon, and BC; (c) ; and (d) κ for all particles and BC respectively. The flag above the graph represents different clusters by different colours. Mass concentrations of (e) organic fraction and PM1 by summing HR-ToF-AMS components and BC mass from SP2, (f) BC mass, (g) , (h) κ, and (i) tage for all particles (red) and BC (black) for four clusters, with the solid circle indicating the average; in each box, the solid line and top and bottom boundaries represent the median and 75th and 25th percentiles, respectively.
During the transition from clean to pollution conditions, the mass concentrations of all chemical components experienced substantial increases, as shown in Fig. 2a. Notably, the increase in inorganic aerosols (including NH4HSO4, (NH4)2SO4, and NH4NO3) was more pronounced than that of OA (Fig. 2b), leading to lower/higher contributions of OA to all particles during polluted/clean periods (Fig. 2b and e). As κall is determined based on the volume fraction of OA and inorganic aerosol according to the ZSR internal mixing rule, this result shows distinct κall characteristics for different air mass influence periods (Fig. 2d and h).
3.2 The hygroscopicity of BCc and all particles
The κall (particle averaged hygroscopicity) value varied from 0.13 to 0.45, with an average value of 0.29 during the observation period (Fig. 2d). The κall value during the polluted C1 period (average value of 0.38) was 1.5 times larger than that during the clean C3/C4 period (average value 0.25) (Fig. 2h), attributed to the increased contribution of inorganic aerosols, known for their high hygroscopicity, under polluted conditions.
κBC is influenced by both κall and the coating thickness (reflected by ) (Eq. 3). of BCc particles during the polluted C1 period was 4.9±4.2, which is about 3–5 times larger than that during the clean C3/C4 period (Fig. 3c and g), implying a thick coating of BCc particles under polluted conditions. Due to the increase in both and κall, κBC exhibited a similar variation characteristic as κall, with higher values under polluted conditions (average value of 0.23) and lower values under clean conditions (average value of 0.11) (Fig. 2d and h). Many studies assumed that the same components between BC coatings and other substances were externally mixed with BC (Liu et al., 2013; Ohata et al., 2016), which is consistent with the assumption in this study. However, the coatings on BC may contain a higher OA fraction than other BC-free particles (Wang et al., 2020), which means the current calculation may give a higher estimation of κBCc.

Figure 3Diurnal variations of (a) PM1, (b) BC mass, (c) organic fraction, (d) , (e) κ for all particles, and (f) κ for BC for four clusters. Grey bars indicate the traffic rush hours, and the red, black, and green lines represent the C1, C2, and C3/C4 period, respectively.
exhibits a larger variation, ranging from 1.3 to 20, compared to κall, indicating a substantial influence of on κBC (Fig. 2d). This is evidenced by the maximum value of κBC correlating with that of (Fig. 2c and d) and the divergence in the maximum values of κall and κBC (Fig. 2d). The coating of BCc particles is formed by the photochemistry of VOC precursors during the atmospheric ageing process, determined by the VOC precursors and ageing time. Compared to the clean clusters, C3 and C4, the air mass movement in C1 was much slower; combined with passing the highest pollution level region, the slowly transported air mass from the polluted southern region was characterized by a longer transport time than other air mass clusters (Fig. 1b). As expected, observations from PTR-ToF-MS showed higher VOC values and a longer tage during the polluted C1 condition (Fig. S2). Figure 2i shows that the tage during the polluted C1 period (13 h) was about twice as long as that during the clean C3/C4 period (9 h), reflecting the more aged air during the polluted period.
Figure 3 shows the diurnal variation in PM1, BC mass concentration, OA fraction, , κall, and κBC for the different air mass. More pronounced diurnal patterns were found during the clean C3/C4 period, as the fast-moving clean air mass diluted the pollutant and were mainly influenced by local emissions. However, regional transport and secondary aerosol formation influenced the diurnal pattern during the C1 and C2 periods (Fig. 2a). For chemical inert BC particles, clear BC mass peaks in morning and afternoon rush hours (marked as grey bar) (Fig. 3b) were observed, which is a typical time period of heavy traffic with nascent BC emitted, but the C1 period showed continuous transport and increased BC mass loading throughout midday, even when the developed planetary boundary layer (PBL) diluted the pollutants.
Fresher BCc particles showed lowest during morning rush hours, and within a few hours the quickly increased and peaked at noon when solar radiation was strongest for the whole time period (Fig. 3d). The increase during midday was consistent with the OA fraction (Fig. 3c), suggesting that the acquired coating of BC particles might be secondary OA (SOA) through the photochemical oxidation, in line with recent studies (Cui et al., 2022; Wu et al., 2019). An enhanced OA fraction at noon due to photochemical SOA formation (Fig. 3c) resulted in a lower value of κall at noon (Fig. 3e). κBC is more influenced by ; the κBC was observed to increase after the morning rush hours due to the increase in coating on BC.

Figure 4A typical example of size-resolved number concentrations of CN, CCN, and BCc particles under supersaturation of (a) 0.1 % and (b) 0.3 %. The green lines show the un-activated number concentration, and the grey shadows indicate the activated BCc number concentrations at each size. The blue and black dots in the upper panel show the activation fraction of all particles and BCc particles. The blue and grey lines indicate the sigmoid fitting on the size-resolved activation fraction of all particles and BC respectively, with the vertical dashed lines indicate the respective activation diameters.
3.3 The CCN activation properties of all particles and BCc particles
3.3.1 Determining the D50 of BCc
The measurement of the activation properties of all particles and BCc particles into CCN is discussed in Sect. 2.3.2. Figure 4 illustrates a representative example of size-resolved activation of all particles and BCc particles at SS = 0.1 % and 0.3 %. Activation commences for all particles when [CCN] exceeds 0 (depicted by blue lines), while activation for BCc particles (indicated by black lines) begins when the [CNunact] (represent by green lines) falls below that of [BCc] (Fig. 4). The [BCact] (denoted by the grey shadow) can be derived using Eq. (4), and the size-resolved Fact,BC is calculated according to Eq. (5). It is observed that as particle size increase, BCc particles started to get activated at 0.19 µm (0.13 µm) at SS = 0.1 % (0.3 %), which is higher than all particles by 44 % (46 %). The higher D50 of BCc also indicates a lower κBC than κall.
We would like to emphasize that the principal uncertainty in the employed method arises from the assumption that κ for BCc is lower compared to other particles. This assumption is consistent with current theoretical understanding that pure BC is hydrophobic (κBC=0); although κBC increases by acquiring hygroscopic coating through atmospheric ageing (Grimonprez et al., 2018; Weingartner et al., 1997), κBC remains lower than that of other components under the same atmospheric oxidation process, based on the ZSR volume mixing rule. Most importantly, even though some internally mixing BCc particles activate into CCN prior to other chemical components, the results here likely underestimated the [BCact] and Fact,BC. Therefore, the CCN activity of BCc particles derived through this method could represent the low bound of atmospheric BCc particles.

Figure 5Temporal evolution of numbers of (a) BCc particles, (b) CN, (c) CCN, and activation diameter (D50) of BCc and CN particles under SS = 0.1 %, 0.2 %, and 0.3 %. (d) Mobility particle size distribution of CN, BCc, and CCN numbers under SS = 0.1 %, 0.2 %, and 0.3 % for different clusters. The dashed blue and grey lines in the images denote the D50 for all particles and BCc particles under different SSs, respectively. Panels (C1)–(C4) show the mean particle size distributions of CN, CCN (under the three SSs), and BCc, for the classified air mass.
3.3.2 D50 of BCc and all particles
Figure 5 illustrates the temporal evolution of the size distribution of BCc particles, CN, and CCN, respectively. The [CCN] increases during polluted conditions due to the increased concentration of BCc particles and all particles, and the [CCN] is mainly contributed by all particles (Fig. 5c). The derived D50 for BCc particles and all particles under water SS at 0.1 %, 0.2 %, and 0.3 % is shown as lines in Fig. 5a–c for the temporal evolution, and the mean value is indicated by vertical dashed lines in Fig. 5d. The mean D50 of BCc (0.17, 0.13, and 0.12 µm under SS = 0.1 %, 0.2 %, and 0.3 %) was approximately 1.4 times larger than that of all particles (0.11, 0.08, and 0.07 µm under SS = 0.1 %, 0.2 %, and 0.3 %) (Fig. 5), as expected from κ-Köhler theory (Petters and Kreidenweis, 2007) that lower/higher D50 corresponds to higher/lower κ. The higher D50 of BCc particles also suggested a lower κ, indicating that BCc should be activated in the last order.
Large variation in D50 of BCc and all particles was also observed for different air mass (Fig. 5). The D50 of all particles (0.13 µm ± 0.01 µm) and BCc (0.20 µm ± 0.01 µm) during polluted C1 period was lower than (0.15 µm ± 0.02 µm) and (0.23 µm ± 0.02 µm) during clean C3/C4 period. This is also inconsistent with the variation in κall and κBC (discussed in Sect. 3.2), suggesting the more inorganic fraction increases κall and the thick coating increases the κBC during the polluted condition.
Figure 6a and b illustrate the diurnal variation in the D50 of all particles and BCc under SS = 0.10 %, while the other two SSs at 0.20 % and 0.30 % are shown in Figs. S3 and S4. The diurnal variation was more pronounce under clean period (i.e. C3 + C4), when local emissions dominated the pollution sources. Higher D50 of all particles and BCc particles was found during the rush hours when more primary hydrophobic OA and fresh external mixed BCc emitted. The D50 of all particles and BCc particles will decrease after photochemistry oxidation and secondary OA formation and coating on BCc, which was also consistent with the variation in κall and κBC (Fig. 3).
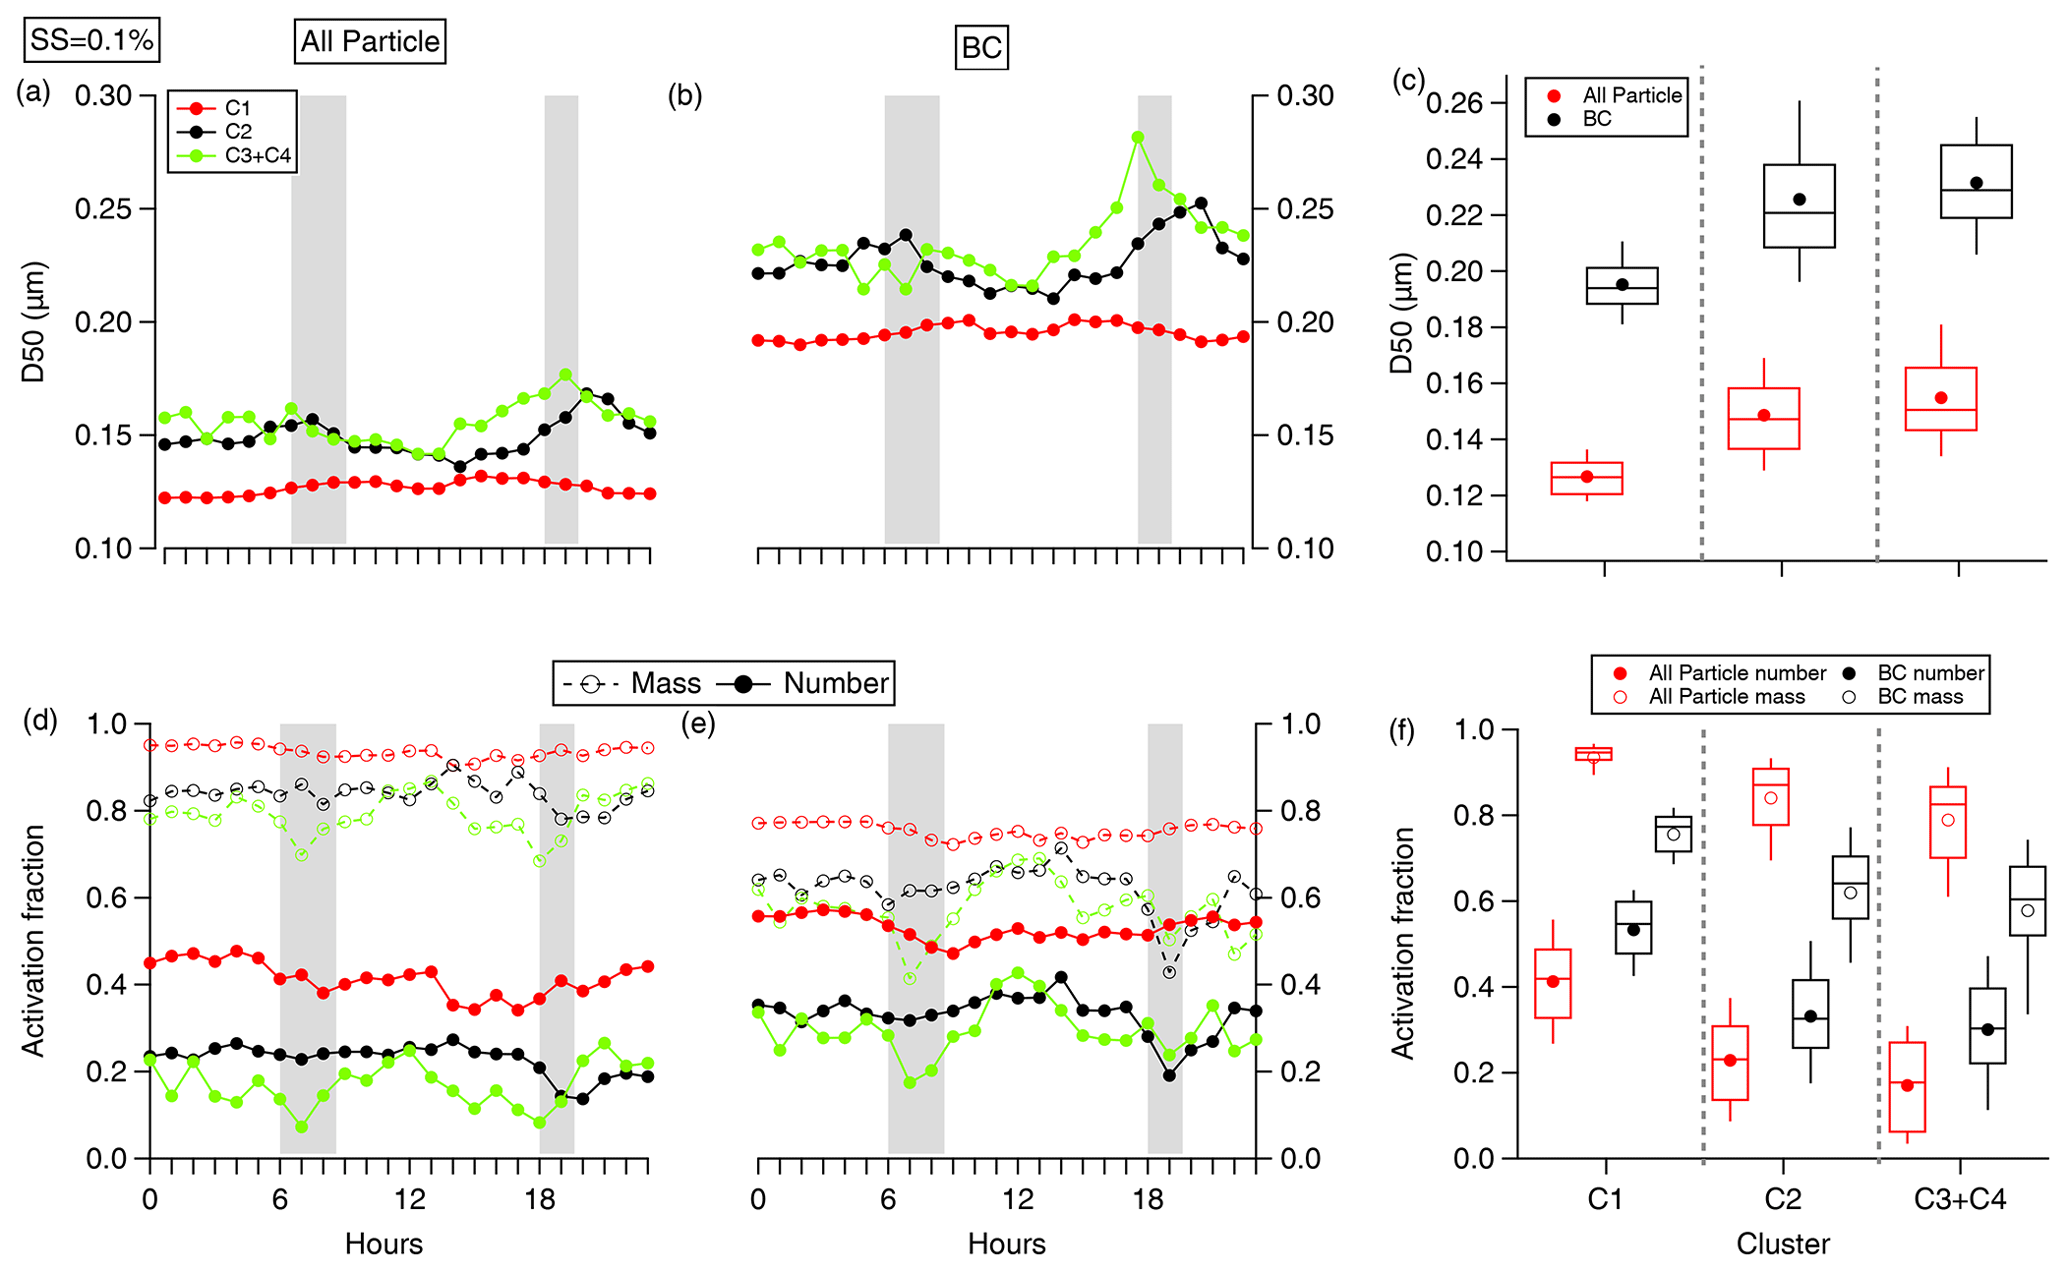
Figure 6Diurnal variations of D50 of (a) all particles and (b) BCc particles under SS = 0.1 % for different air mass clusters and (c) the statistical results of D50 for different air mass clusters, with solid circles indicating the average; in each box, the solid line and top and bottom boundaries represent the median and the 75th and 25th percentiles, respectively. (c) Diurnal variation in the activation fraction of all particles and (e) BCc particles, with the solid and dashed lines representing the number and mass fraction; the mass (number) activation fraction was calculated by summing the mass (number) of particles with diameter larger than D50 and dividing it by the total mass (number). (f) Statistical results of the activation fraction.
3.3.3 Droplet activation fraction of BCc and all particles
Figure 5d shows the averaged size distribution of BCc, CN and CCN under three SSs for different periods classified by air mass clusters (C1–C4). Notably, BCc particles had consistently larger peak size than all particles for all air mass. For example, the BCc peak ranged from 185 to 210 nm, approximately 2–4 times larger than that of all particles, which peaked from 58 to 115 nm. The more polluted air mass (C1 and C2) exhibited larger peak sizes for BCc and CN than the cleaner air mass (C3 and C4) because of the condensation process during polluted episodes when gases heavily partitioned into the aerosol phase and enlarged particle size.
Though the BC core size is smaller, after attaching on larger particles, the overall coated size is even significantly larger than BCf particles. This suggests that in typical suburban environments, BC had been significantly associated with non-BC substances through condensation and coagulation processes (Yu et al., 2022), and the bare BC without containing non-BC substances had taken a less proportion and most BCc had been enlarged during the ageing process. This is consistent with previous studies that showed that BC was associated with larger aerodynamic size than BCf particles (Pan et al., 2019; Wang et al., 2021). Previous studies also observed rapid ageing of BC in a few hours in an urban environment (Peng et al., 2016).
Figure 6d and e show the diurnal variations of Fact (in number and mass) for all particles and BCc particles under SS = 0.1 %. The other two SSs at 0.2 % and 0.3 % are shown in Figs. S2 and S3. With an SS increase from 0.1 % to 0.2 %, Fact,BC and Fact,all increased from 42 % ± 15 % to 69 % ± 15 % and from 30 % ± 15 % to 51 % ± 19 %. Figure 6f shows the statistical Fact results compared for different air mass; Fact,BC increased from 30 % to 53 % under SS = 0.1 % (Fig. 6f) with the pollution increase from C3/C4 to C1. Fact,BC shows similar variation characteristics to Fact,BC, increasing from 58 % to 76 % under SS = 0.1 % from the C3/C4 to the C1 period (Fig. 6f) and from 81 % to 89 % and from 87 % to 91 %, under SS at 0.2 % and 0.3 %, respectively. BCc particles acquire thicker hygroscopic coating through longer atmospheric ageing time during the long-range regional transport in the polluted C1 period. The hygroscopic coating not only increases κBC and leads to a lower D50 but also increases BCc size. The decrease in D50 and increase in particle size both led to an increase in Fact. Fact,BC mainly depended on the , as the D50 and size of BCc are dependent on . The diurnal variation also shows lowest Fact,BC during rush hours due to lower and increases in the daytime with increased (Fig. 6e).
Fact,BC was always higher than Fact,all under all SSs (Figs. 6, S2 and S3) due to the larger size of BCc particles compared to all particles. The mass Fact,BC was about 1.61 times higher than in number, compared with about a 2.88 difference of mass and number Fact for all particles. This is also caused by the larger size distribution of BCc particles than all particles. The large portion of all particles in small size drives Fact to be lower than BCc. Although D50 of BC is higher, the larger size distribution of BCc than all particles means BCc particles can have a higher droplet removal efficiency than BCf particles.
The fact that higher Fact,BC than BCf particles and thickly coated BCc particles contribute to CCN activation was also observed through cloud residues' observation at a mountain site in south China (Fu et al., 2022). The measured Fact was generally consistent with experiments conducted in a southern China megacity using the same method (D. Hu et al., 2021) but higher than cloud residues' observation in China (Zhang et al., 2017), which reported an average value of 33 % of Fact,BC; Fact of BCc (all particles) ranged from 5 %–45 % (7 %–60 %). We attribute the difference to the unknown ambient SS for the cloud, which has great influence on the Fact,BC. According to previous cloud residues' observation at Jungfraujoch, Fact,BC increases from 50 % to 80 % when SS increases from 0.21 % to 0.50 % (Motos et al., 2019a; Hammer et al., 2014). The ambient SS shows large variation can range from 0.01 % to 2.00 % (Hammer et al., 2014); however, it is challenging to directly observe the SS from field observation. Through this method, Fact,BC activated into droplets can be quantitatively investigated under certain ambient SS conditions; thus the results here provide a reference to investigate the lifetime of BCc particles.
3.4 Timescale for the evolution of CCN activity of BCc
The temporal evolution of parameters related to CCN activity including κ, D50 and Fact against photochemical age (tage) for BCc particles and all particles is shown in Fig. 7. It is demonstrated that the ageing time (tage) can explain the variation in all parameters for BCc particles and all particles well with a linear function (R2>0.4).
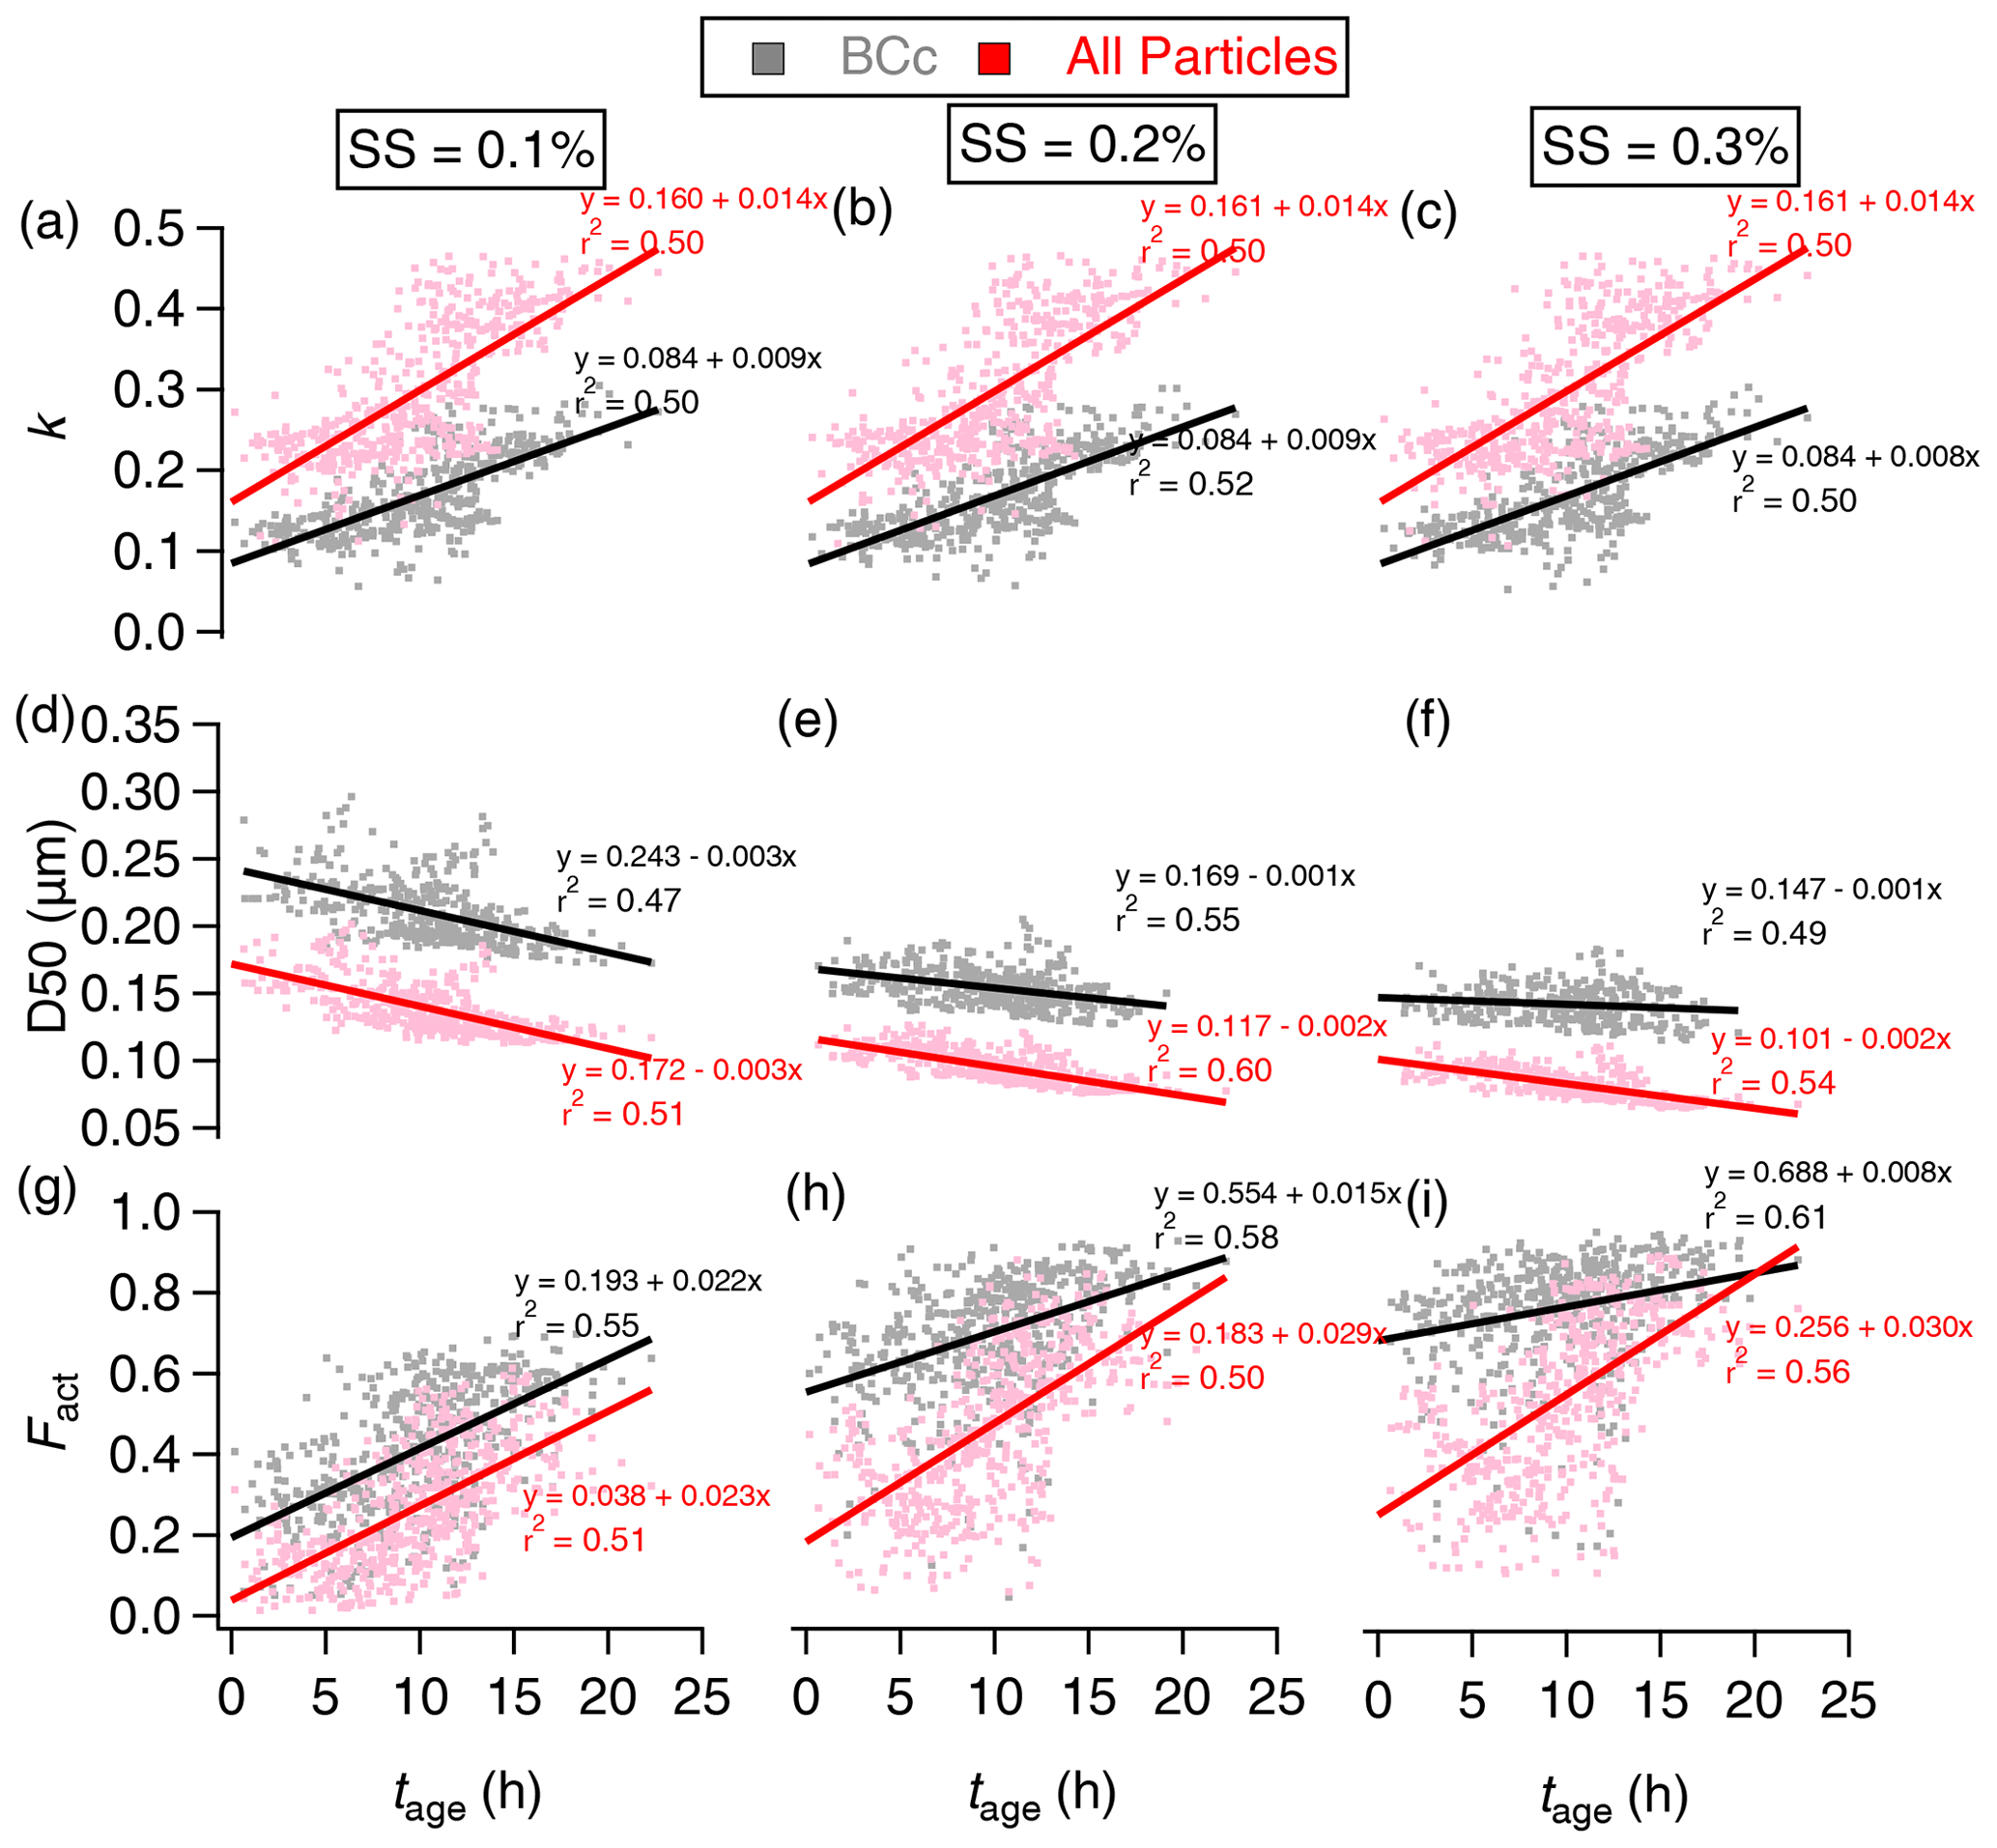
Figure 7The evolution of hygroscopicity parameter (κ) (a–c), activation diameter (D50) (d–f), and number activation fraction (Fact) (g–i) with photochemical age (tage) under SS at (a) 0.1 %, (b) 0.2 %, and (c) 0.3 %. The black and red denote the BCc particles and all particles, respectively. The lines show the least-squares lineal regression.
The volume ratio of coating over rBC () showed an increase rate of 0.14 h−1 (Fig. S4) and can be calculated as
This results in a linear increase rate for the hygroscopicity parameter. κBC showed a linear rate of 0.09 h−1 (Fig. 7a–c) at all SSs and can be calculated as
In addition, κBC also follows a linear function with tage as
This means the κ for the large proportion of non-BC is enhanced after ageing due to enhanced formation of inorganic salt and secondary organic aerosols (Wu et al., 2022). The results show it will take about 24 and 10 h to reach the global mean κ of 0.27–0.30 (Pringle et al., 2010) for BCc particles and all particles, respectively.
The ageing scale of a few hours observed here is generally consistent with previously measured BC ageing influenced by anthropogenic pollution, such as an aircraft measurement (Moteki et al., 2007) which observed the conversion timescale of BC to be a few hours in a polluted environment. The results were also comparable with previous chamber studies that investigated the κ evolution of BC (Tritscher et al., 2011; Lambe et al., 2015; Peng et al., 2017), where the increase rate of κBC (0.01 h−1) in this study was similar, but the initial κBC here (0.08–0.26) was higher than that of fresh combustion soot, as used in their results (0–0.12). These consistently showed a few hours tended to be a typical ageing timescale to convert an appreciable amount of initially hydrophobic BC into being hydrophilic and therefore CCN-active. The exact timescale may vary according to pollution levels. A higher concentration of gas precursors and favourable meteorological conditions may promote the growth rate of hygroscopic substances on BC.
Correspondingly, the D50 of BCc particles and all particles decreased with tage, with a rate of −3 and −3 nm h−1 (Fig. 7d), −1 and −2 nm h−1 (Fig. 7e), and −0.5 and −2 nm h−1 (Fig. 7f) under SS = 0.10 %, 0.20 %, and 0.30 %, respectively. The results are summarized in Table 1.
Table 1A summary of linear fitting results for the activation diameter (D50) and activation fraction (Fact) of all particles and BCc particles.

Fact,all and Fact,BC also showed linear correlation with tage. A notable higher CCN activation fraction was observed for BCc particles compared to all particles at the same tage; this was attributed to the larger coated size of BCc particles than other non-BC particles (Fig. 5). This difference between BCc particles and other particles was reduced at longer tage because the sufficient ageing time had allowed all particles to grow to similar large sizes.
After 8 h of ageing, Fact,BC increased from 35 % to 63 % as SS rose from 0.1 % to 0.2 % and then increased from 63 % to 77 % as SS increased from 0.2 % to 0.3 %. This illustrates a notable increase in Fact,BC from SS = 0.1 % to 0.20 % but a less significant change in Fact,BC from SS = 0.2 % to 0.3 %. Furthermore, the rate increase in Fact,BC with tage was 2 % h−1 at SS = 0.10 % (Fig. 7g), which was twice as large as at SS = 0.2 % (1 % h−1) (Fig. 7h) and 0.3 % (1 % h−1) (Fig. 7i). This indicated that the activation of BCc was more sensitive at lower SS (<0.2 %) but may reach a plateau when SS > 0.2 %. This is because the activation diameter at this typical SS range was close to the mode size of BCc number distribution (Fig. 5d), and a small increase of SS will cause a considerable change of fraction, which is larger than the activation diameter. The SS range from 0.1 % to 0.2 % is for the typical formation of fog and stratiform thin clouds (Hammer et al., 2014).
In this study, we conducted directly measurements of the droplet activation of BC-containing particles under water supersaturation conditions in a suburban environment. Both the hygroscopicity and CCN activation diameters reveal that the hygroscopicity of all particles and BCc particles concurrently increases with polluted levels, primarily governed by the amount of coating. As pollution intensifies, the volume ratio of coating over rBC increases from 1.8 to 4.7, causing the hygroscopicity of BCc to increase from 0.11 to 0.23. The increase in coating not only increases BCc particles' hygroscopicity but also shifts these particles to larger sizes, significantly enhancing their CCN activity. The number-activated fraction of BCc particles was 42 % under SS at 0.1 %, higher than the 30 % activation of all particles. Despite the lower hygroscopicity, the elevated activation fraction of BCc particles can be attributed to their larger size compared to all particles. It was also found that the number-activated fraction of BCc particles was more sensitive in the SS range from 0.1 % to 0.2 % (D. Hu et al., 2021), a typical range for fog and stratiform thin clouds formation. This indicates that with a small increase in SS, even for the environment with relatively low moisture and weak updraft, the BC can be activated. Considering these clouds have a lower precipitation rate, BC in these clouds may have more persistent indirect radiative impacts.
Furthermore, we successfully parameterized the evolution of hygroscopicity and CCN activation characteristics of BCc particles and all particles in relation to equivalent photochemical age. The hygroscopicity of BCc was found to be positively linearly correlated with ageing time, at a rate of 0.01 h−1, and the activation diameter was negatively correlated, at a rate of 1–3 nm h−1. Within 10 h, 65 % of BCc particles activated under SS = 0.2 % in this typical suburban environment; this is in line with a wide range of recent ambient studies showing that approximately 50 % of BC can be activated under SS = 0.1 %–0.2 %. This means these BCc particles may be efficiently incorporated into clouds by serving as CCN. This ageing process by acquiring more hygroscopic substances of BC may be particularly important in polluted environments, where the condensation and coagulation processes intensively occurred. The results here thus provide direct evidence of efficient droplet activation of BCc, and the ageing scale associated with their CCN activation can be used as a reference to validate the regional models regarding aerosol–cloud interactions of BC.
All data in this paper are available from the authors upon request (tianping@bj.cma.gov.cn).
The supplement related to this article is available online at: https://doi.org/10.5194/acp-24-5149-2024-supplement.
DD and MH led and designed the study, and PT and DL designed the study, set up the experiment, analysed the data, and wrote the paper. KH and YW conducted the field observation and contributed the data analysis. HH and JS performed the calibration of the instruments. CY and DH contributed to scientific discussion.
At least one of the (co-)authors is a member of the editorial board of Atmospheric Chemistry and Physics. The peer-review process was guided by an independent editor, and the authors also have no other competing interests to declare.
Publisher's note: Copernicus Publications remains neutral with regard to jurisdictional claims made in the text, published maps, institutional affiliations, or any other geographical representation in this paper. While Copernicus Publications makes every effort to include appropriate place names, the final responsibility lies with the authors.
This research was supported by the National Key Research and Development Program of China (2023YFC3007600) and the National Natural Science Foundation of China (42175116, 41975180, 42275087).
This research has been supported by the National Key Research and Development Program of China (grant no. 2023YFC3007600) and the National Natural Science Foundation of China (grant nos. 42175116, 41975180 and 42275087).
This paper was edited by Zhibin Wang and reviewed by Jing Wei and one anonymous referee.
Bond, T. C., Doherty, S. J., Fahey, D. W., Forster, P. M., Berntsen, T., DeAngelo, B. J., Flanner, M. G., Ghan, S., Kärcher, B., Koch, D., Kinne, S., Kondo, Y., Quinn, P. K., Sarofim, M. C., Schultz, M. G., Schulz, M., Venkataraman, C., Zhang, H., Zhang, S., Bellouin, N., Guttikunda, S. K., Hopke, P. K., Jacobson, M. Z., Kaiser, J. W., Klimont, Z., Lohmann, U., Schwarz, J. P., Shindell, D., Storelvmo, T., Warren, S. G., and Zender, C. S.: Bounding the role of black carbon in the climate system: A scientific assessment, J. Geophys. Res.-Atmos., 118, 5380–5552, https://doi.org/10.1002/jgrd.50171, 2013.
Bruns, E. A., El Haddad, I., Slowik, J. G., Kilic, D., Klein, F., Baltensperger, U., and Prevot, A. S.: Identification of significant precursor gases of secondary organic aerosols from residential wood combustion, Sci. Rep., 6, 27881, https://doi.org/10.1038/srep27881, 2016.
Cui, S., Huang, D. D., Wu, Y., Wang, J., Shen, F., Xian, J., Zhang, Y., Wang, H., Huang, C., Liao, H., and Ge, X.: Chemical properties, sources and size-resolved hygroscopicity of submicron black-carbon-containing aerosols in urban Shanghai, Atmos. Chem. Phys., 22, 8073–8096, https://doi.org/10.5194/acp-22-8073-2022, 2022.
Dalirian, M., Ylisirniö, A., Buchholz, A., Schlesinger, D., Ström, J., Virtanen, A., and Riipinen, I.: Cloud droplet activation of black carbon particles coated with organic compounds of varying solubility, Atmos. Chem. Phys., 18, 12477–12489, https://doi.org/10.5194/acp-18-12477-2018, 2018.
Deng, Z. Z., Zhao, C. S., Ma, N., Liu, P. F., Ran, L., Xu, W. Y., Chen, J., Liang, Z., Liang, S., Huang, M. Y., Ma, X. C., Zhang, Q., Quan, J. N., Yan, P., Henning, S., Mildenberger, K., Sommerhage, E., Schäfer, M., Stratmann, F., and Wiedensohler, A.: Size-resolved and bulk activation properties of aerosols in the North China Plain, Atmos. Chem. Phys., 11, 3835–3846, https://doi.org/10.5194/acp-11-3835-2011, 2011.
Draxier, R. R. and Hess, G. D.: An overview of the HYSPLIT4 modelling system for trajectories, dispersion, and deposition, Aust. Meteorol. Mag., 47, 295–308, 1998.
Drewnick, F., Hings, S. S., DeCarlo, P., Jayne, J. T., Gonin, M., Fuhrer, K., Weimer, S., Jimenez, J. L., Demerjian, K. L., Borrmann, S., and Worsnop, D. R.: A New Time-of-Flight Aerosol Mass Spectrometer (TOF-AMS) – Instrument Description and First Field Deployment, Aerosol Sci. Tech., 39, 637–658, https://doi.org/10.1080/02786820500182040, 2005.
Dusek, U., Reischl, G. P., and Hitzenberger, R.: CCN activaton of pure and coated carbon black particles, Environ. Sci. Technol., 40, 1223–1230, https://doi.org/10.1021/es0503478, 2006.
Friebel, F., Lobo, P., Neubauer, D., Lohmann, U., Drossaart van Dusseldorp, S., Mühlhofer, E., and Mensah, A. A.: Impact of isolated atmospheric aging processes on the cloud condensation nuclei activation of soot particles, Atmos. Chem. Phys., 19, 15545–15567, https://doi.org/10.5194/acp-19-15545-2019, 2019.
Fu, Y., Peng, X., Sun, W., Hu, X., Wang, D., Yang, Y., Guo, Z., Wang, Y., Zhang, G., Zhu, J., Ou, J., Shi, Z., Wang, X., and Bi, X.: Impact of Cloud Process in the Mixing State and Microphysical Properties of Soot Particles: Implications in Light Absorption Enhancement, J. Geophys. Res.-Atmos., 127, e2022JD037169, https://doi.org/10.1029/2022JD037169, 2022.
Gao, R. S., Schwarz, J. P., Kelly, K. K., Fahey, D. W., Watts, L. A., Thompson, T. L., Spackman, J. R., Slowik, J. G., Cross, E. S., Han, J. H., Davidovits, P., Onasch, T. B., and Worsnop, D. R.: A Novel Method for Estimating Light-Scattering Properties of Soot Aerosols Using a Modified Single-Particle Soot Photometer, Aerosol Sci. Tech., 41, 125–135, https://doi.org/10.1080/02786820601118398, 2007.
Grimonprez, S., Faccinetto, A., Batut, S., Wu, J., Desgroux, P., and Petitprez, D.: Cloud condensation nuclei from the activation with ozone of soot particles sampled from a kerosene diffusion flame, Aerosol Sci. Tech., 52, 814–827, https://doi.org/10.1080/02786826.2018.1472367, 2018.
Hammer, E., Bukowiecki, N., Gysel, M., Jurányi, Z., Hoyle, C. R., Vogt, R., Baltensperger, U., and Weingartner, E.: Investigation of the effective peak supersaturation for liquid-phase clouds at the high-alpine site Jungfraujoch, Switzerland (3580 m a.s.l.), Atmos. Chem. Phys., 14, 1123–1139, https://doi.org/10.5194/acp-14-1123-2014, 2014.
Hansen, J., Sato, M., and Ruedy, R.: Radiative forcing and climate response, J. Geophys. Res.-Atmos., 102, 6831–6864, https://doi.org/10.1029/96JD03436, 1997.
Henning, S., Wex, H., Hennig, T., Kiselev, A., Snider, J. R., Rose, D., Dusek, U., Frank, G. P., Pöschl, U., Kristensson, A., Bilde, M., Tillmann, R., Kiendler-Scharr, A., Mentel, T. F., Walter, S., Schneider, J., Wennrich, C., and Stratmann, F.: Soluble mass, hygroscopic growth, and droplet activation of coated soot particles during LACIS Experiment in November (LExNo), J. Geophys. Res.-Atmos., 115, D11206, https://doi.org/10.1029/2009JD012628, 2010.
Henning, S., Ziese, M., Kiselev, A., Saathoff, H., Möhler, O., Mentel, T. F., Buchholz, A., Spindler, C., Michaud, V., Monier, M., Sellegri, K., and Stratmann, F.: Hygroscopic growth and droplet activation of soot particles: uncoated, succinic or sulfuric acid coated, Atmos. Chem. Phys., 12, 4525–4537, https://doi.org/10.5194/acp-12-4525-2012, 2012.
Hu, D., Liu, D., Kong, S., Zhao, D., Wu, Y., Li, S., Ding, S., Zheng, S., Cheng, Y., Hu, K., Deng, Z., Wu, Y., Tian, P., Liu, Q., Huang, M., and Ding, D.: Direct Quantification of Droplet Activation of Ambient Black Carbon Under Water Supersaturation, J. Geophys. Res.-Atmos., 126, e2021JD034649, https://doi.org/10.1029/2021JD034649, 2021.
Hu, K., Liu, D., Tian, P., Wu, Y., Deng, Z., Wu, Y., Zhao, D., Li, R., Sheng, J., Huang, M., Ding, D., Li, W., Wang, Y., and Wu, Y.: Measurements of the Diversity of Shape and Mixing State for Ambient Black Carbon Particles, Geophys. Res. Lett., 48, e2021GL094522, https://doi.org/10.1029/2021GL094522, 2021.
Hu, K., Liu, D., Tian, P., Wu, Y., Li, S., Zhao, D., Li, R., Sheng, J., Huang, M., Ding, D., Liu, Q., Jiang, X., Li, Q., and Tao, J.: Identifying the Fraction of Core–Shell Black Carbon Particles in a Complex Mixture to Constrain the Absorption Enhancement by Coatings, Environ. Sci. Technol., 9, 272–279, https://doi.org/10.1021/acs.estlett.2c00060, 2022.
Jacobson, M. Z.: Short-term effects of controlling fossil-fuel soot, biofuel soot and gases, and methane on climate, Arctic ice, and air pollution health, J. Geophys. Res., 115, D14209, https://doi.org/10.1029/2009JD013795, 2010.
Jayne, J. T., Leard, D. C., Zhang, X., Davidovits, P., Smith, K. A., Kolb, C. E., and Worsnop, D. R.: Development of an Aerosol Mass Spectrometer for Size and Composition Analysis of Submicron Particles, Aerosol Sci. Tech., 33, 49–70, 2000.
Knutson, E. O. and Whitby, K. T.: Aerosol classification by electric mobility: Apparatus, Theory, and Applications, Aerosol Sci., 6, 443–451, https://doi.org/10.1016/0021-8502(75)90060-9, 1975.
Koch, D. and Del Genio, A. D.: Black carbon semi-direct effects on cloud cover: review and synthesis, Atmos. Chem. Phys., 10, 7685–7696, https://doi.org/10.5194/acp-10-7685-2010, 2010.
Koch, D., Schulz, M., Kinne, S., McNaughton, C., Spackman, J. R., Balkanski, Y., Bauer, S., Berntsen, T., Bond, T. C., Boucher, O., Chin, M., Clarke, A., De Luca, N., Dentener, F., Diehl, T., Dubovik, O., Easter, R., Fahey, D. W., Feichter, J., Fillmore, D., Freitag, S., Ghan, S., Ginoux, P., Gong, S., Horowitz, L., Iversen, T., Kirkevåg, A., Klimont, Z., Kondo, Y., Krol, M., Liu, X., Miller, R., Montanaro, V., Moteki, N., Myhre, G., Penner, J. E., Perlwitz, J., Pitari, G., Reddy, S., Sahu, L., Sakamoto, H., Schuster, G., Schwarz, J. P., Seland, Ø., Stier, P., Takegawa, N., Takemura, T., Textor, C., van Aardenne, J. A., and Zhao, Y.: Evaluation of black carbon estimations in global aerosol models, Atmos. Chem. Phys., 9, 9001–9026, https://doi.org/10.5194/acp-9-9001-2009, 2009.
Koch, D., Balkanski, Y., Bauer, S. E., Easter, R. C., Ferrachat, S., Ghan, S. J., Hoose, C., Iversen, T., Kirkevåg, A., Kristjansson, J. E., Liu, X., Lohmann, U., Menon, S., Quaas, J., Schulz, M., Seland, Ø., Takemura, T., and Yan, N.: Soot microphysical effects on liquid clouds, a multi-model investigation, Atmos. Chem. Phys., 11, 1051–1064, https://doi.org/10.5194/acp-11-1051-2011, 2011.
Kondo, Y., Moteki, N., Oshima, N., Ohata, S., Koike, M., Shibano, Y., Takegawa, N., and Kita, K.: Effects of wet deposition on the abundance and size distribution of black carbon in East Asia, J. Geophys. Res.-Atmos., 121, 4691–4712, https://doi.org/10.1002/2015JD024479, 2016.
Kuwata, M., Kondo, Y., Mochida, M., Takegawa, N., and Kawamura, K.: Dependence of CCN activity of less volatile particles on the amount of coating observed in Tokyo, J. Geophys. Res.-Atmos., 112, D11207, https://doi.org/10.1029/2006JD007758, 2007.
Laborde, M., Mertes, P., Zieger, P., Dommen, J., Baltensperger, U., and Gysel, M.: Sensitivity of the Single Particle Soot Photometer to different black carbon types, Atmos. Meas. Tech., 5, 1031–1043, https://doi.org/10.5194/amt-5-1031-2012, 2012.
Lambe, A. T., Ahern, A. T., Wright, J. P., Croasdale, D. R., Davidovits, P., and Onasch, T. B.: Oxidative aging and cloud condensation nuclei activation of laboratory combustion soot, J. Aerosol Res.-Atmos., 79, 31–39, https://doi.org/10.1016/j.jaerosci.2014.10.001, 2015.
Liu, D., Allan, J., Whitehead, J., Young, D., Flynn, M., Coe, H., McFiggans, G., Fleming, Z. L., and Bandy, B.: Ambient black carbon particle hygroscopic properties controlled by mixing state and composition, Atmos. Chem. Phys., 13, 2015–2029, https://doi.org/10.5194/acp-13-2015-2013, 2013.
Liu, D., Allan, J. D., Young, D. E., Coe, H., Beddows, D., Fleming, Z. L., Flynn, M. J., Gallagher, M. W., Harrison, R. M., Lee, J., Prevot, A. S. H., Taylor, J. W., Yin, J., Williams, P. I., and Zotter, P.: Size distribution, mixing state and source apportionment of black carbon aerosol in London during wintertime, Atmos. Chem. Phys., 14, 10061–10084, https://doi.org/10.5194/acp-14-10061-2014, 2014.
Liu, D., Whitehead, J., Alfarra, M. R., Reyes-Villegas, E., Spracklen, D. V., Reddington, C. L., Kong, S., Williams, P. I., Ting, Y.-C., Haslett, S., Taylor, J. W., Flynn, M. J., Morgan, W. T., McFiggans, G., Coe, H., and Allan, J. D.: Black-carbon absorption enhancement in the atmosphere determined by particle mixing state, Nat. Geosci., 10, 184–188, https://doi.org/10.1038/ngeo2901, 2017.
Liu, D., Ding, S., Zhao, D., Hu, K., Yu, C., Hu, D., Wu, Y., Zhou, C., Tian, P., Liu, Q., Wu, Y., Zhang, J., Kong, S., Huang, M., and Ding, D.: Black Carbon Emission and Wet Scavenging From Surface to the Top of Boundary Layer Over Beijing Region, J. Geophys. Res.-Atmos., 125, e2020JD033096, https://doi.org/10.1029/2020JD033096, 2020.
Liu, J., Chu, B. W., Chen, T. Z., Liu, C. G., Wang, L., Bao, X. L., He, H.: Secondary organic aerosol formation from ambient air at an urban site in Beijing: Effects of OH exposure and precursor concentrations, Environ. Sci. Technol., 52, 6834–6841, https://doi.org/10.1021/acs.est.7b05701, 2018.
Lund, M. T., Berntsen, T. K., and Samset, B. H.: Sensitivity of black carbon concentrations and climate impact to aging and scavenging in OsloCTM2–M7, Atmos. Chem. Phys., 17, 6003–6022, https://doi.org/10.5194/acp-17-6003-2017, 2017.
McDonald, J. E.: Erroneous Cloud-Physics Applications of Raoult's Law, J. Meteorol., 10, 68–70, 1953.
Middlebrook, A. M., Bahreini, R., Jimenez, J. L., and Canagaratna, M. R.: Evaluation of Composition-Dependent Collection Efficiencies for the Aerodyne Aerosol Mass Spectrometer using Field Data, Aerosol Sci. Tech., 46, 258–271, https://doi.org/10.1080/02786826.2011.620041, 2012.
Moore, R. H., Nenes, A., and Medina, J.: Scanning Mobility CCN Analysis – A Method for Fast Measurements of Size-Resolved CCN Distributions and Activation Kinetics, Aerosol Sci. Tech., 44, 861–871, https://doi.org/10.1080/02786826.2010.498715, 2010.
Moteki, N., Kondo, Y., Miyazaki, Y., Takegawa, N., Komazaki, Y., Kurata, G., Shirai T., Blake, D. R., Miyakawa, T., and Koike, M.: Evolution of mixing state of black carbon particles: aircraft measurements over the western pacific in march 2004, Geophys. Res. Lett., 34, 235–255, https://doi.org/10.1029/2006GL028943, 2007.
Moteki, N., Kondo, Y., and Nakamura, S.-I.: Method to measure refractive indices of small nonspherical particles: Application to black carbon particles, J. Aerosol Res.-Atmos., 41, 513–521, https://doi.org/10.1016/j.jaerosci.2010.02.013, 2010.
Motos, G., Schmale, J., Corbin, J. C., Zanatta, M., Baltensperger, U., and Gysel-Beer, M.: Droplet activation behaviour of atmospheric black carbon particles in fog as a function of their size and mixing state, Atmos. Chem. Phys., 19, 2183–2207, https://doi.org/10.5194/acp-19-2183-2019, 2019a.
Motos, G., Schmale, J., Corbin, J. C., Modini, Rob. L., Karlen, N., Bertò, M., Baltensperger, U., and Gysel-Beer, M.: Cloud droplet activation properties and scavenged fraction of black carbon in liquid-phase clouds at the high-alpine research station Jungfraujoch (3580 m a.s.l.), Atmos. Chem. Phys., 19, 3833–3855, https://doi.org/10.5194/acp-19-3833-2019, 2019b.
Ohata, S., Schwarz, J. P., Moteki, N., Koike, M., Takami, A., and Kondo, Y.: Hygroscopicity of materials internally mixed with black carbon measured in Tokyo, J. Geophys. Res.-Atmos., 121, 362–381, https://doi.org/10.1002/2015JD024153, 2016.
Onasch, T. B., Trimborn, A., Fortner, E. C., Jayne, J. T., Kok, G. L., Williams, L. R., Davidovits, P., and Worsnop, D. R.: Soot Particle Aerosol Mass Spectrometer: Development, Validation, and Initial Application, Aerosol Sci. Tech., 46, 804–817, https://doi.org/10.1080/02786826.2012.663948, 2012.
Pan, X., Liu, H., Wu, Y., Tian, Y., Sun, Y., Xie, C., Liu, X., Cheng, T., and Wang, Z.: Dynamic shape factor and mixing state of refractory black carbon particles in winter in Beijing using an AAC-DMA-SP2 tandem system, Atmos. Chem. Phys. Discuss. [preprint], https://doi.org/10.5194/acp-2019-433, 2019.
Park, R. J., Jacob, D. J., Palmer, P. I., Clarke, A. D., Weber, R. J., Zondlo, M. A., Eisele, F. L., Bandy, A. R., Thornton, D. C., Sachse, G. W., and Bond, T. C.: Export efficiency of black carbon aerosol in continental outflow: Global implications, J. Geophys. Res.-Atmos., 110, D11205, https://doi.org/10.1029/2004JD005432, 2005.
Parrish, D. D., Stohl, A., Forster, C., Atlas, E. L., Blake, D. R., Goldan, P. D., Kuster, W. C., Gouw, J. A. de.: Effects of mixing on evolution of hydrocarbon ratios in the troposphere, J. Geophys. Res.-Atmos., 112, D10S34, https://doi.org/10.1029/2006JD007583, 2007.
Peng, J., Hu, M., Guo, S., Du, Z., Zheng, J., Shang, D., Zamora, M. L., Zeng, L., Shao, M., Wu, Y., Zheng, j., Wang, Y., Glen, C. R., Collins, D., Molina, M. J., and Zhang, R.: Markedly enhanced absorption and direct radiative forcing of black carbon under polluted urban environments, P. Natl. Acad. Sci. USA, 113, 4266–4271, https://doi.org/10.1073/pnas.1602310113, 2016.
Peng, J., Hu, M., Guo, S., Du, Z., Shang, D., Zheng, J., Zheng, J., Zeng, L., Shao, M., Wu, Y., Collins, D., and Zhang, R.: Ageing and hygroscopicity variation of black carbon particles in Beijing measured by a quasi-atmospheric aerosol evolution study (QUALITY) chamber, Atmos. Chem. Phys., 17, 10333–10348, https://doi.org/10.5194/acp-17-10333-2017, 2017.
Petters, M. D. and Kreidenweis, S. M.: A single parameter representation of hygroscopic growth and cloud condensation nucleus activity, Atmos. Chem. Phys., 7, 1961–1971, https://doi.org/10.5194/acp-7-1961-2007, 2007.
Pringle, K. J., Tost, H., Pozzer, A., Pöschl, U., and Lelieveld, J.: Global distribution of the effective aerosol hygroscopicity parameter for CCN activation, Atmos. Chem. Phys., 10, 5241–5255, https://doi.org/10.5194/acp-10-5241-2010, 2010.
Pruppacher, H. R. and Klett, J. D.: Microphysics of Cloud and Precipitation, Kluwer Academic Publishers, Dordrecht, https://doi.org/10.1007/978-0-306-48100-0, 1997.
Ramanathan, V. and Carmichael, G.: Global and regional climate changes due to black carbon, Nat. Geosci., 1, 221–227, https://doi.org/10.1038/ngeo156, 2008.
Roberts, G. C. and Nenes, A.: A Continuous-Flow Streamwise Thermal-Gradient CCN Chamber for Atmospheric Measurements, Aerosol Sci. Tech., 39, 206–221, https://doi.org/10.1080/027868290913988, 2005.
Rose, D., Gunthe, S. S., Mikhailov, E., Frank, G. P., Dusek, U., Andreae, M. O., and Pöschl, U.: Calibration and measurement uncertainties of a continuous-flow cloud condensation nuclei counter (DMT-CCNC): CCN activation of ammonium sulfate and sodium chloride aerosol particles in theory and experiment, Atmos. Chem. Phys., 8, 1153–1179, https://doi.org/10.5194/acp-8-1153-2008, 2008.
Rose, D., Gunthe, S. S., Su, H., Garland, R. M., Yang, H., Berghof, M., Cheng, Y. F., Wehner, B., Achtert, P., Nowak, A., Wiedensohler, A., Takegawa, N., Kondo, Y., Hu, M., Zhang, Y., Andreae, M. O., and Pöschl, U.: Cloud condensation nuclei in polluted air and biomass burning smoke near the mega-city Guangzhou, China – Part 2: Size-resolved aerosol chemical composition, diurnal cycles, and externally mixed weakly CCN-active soot particles, Atmos. Chem. Phys., 11, 2817–2836, https://doi.org/10.5194/acp-11-2817-2011, 2011.
Snider, J. R., Wex, H., Rose, D., Kristensson, A., Stratmann, F., Hennig, T., Henning, S., Kiselev, A., Bilde, M., Burkhart, M., Dusek, U., Frank, G. P., Kiendler-Scharr, A., Mentel, T. F., Petters, M. D., and Pöschl, U.: Intercomparison of cloud condensation nuclei and hygroscopic fraction measurements: Coated soot particles investigated during the LACIS Experiment in November (LExNo), J. Geophys. Res.-Atmos., 115, D11205, https://doi.org/10.1029/2009JD012618, ,2010.
Tian, P., Liu, D., Zhao, D., Yu, C., Liu, Q., Huang, M., Deng, Z., Ran, L., Wu, Y., Ding, S., Hu, K., Zhao, G., Zhao, C., and Ding, D.: In situ vertical characteristics of optical properties and heating rates of aerosol over Beijing, Atmos. Chem. Phys., 20, 2603–2622, https://doi.org/10.5194/acp-20-2603-2020, 2020.
Tian, P., Liu, D., Bi, K., Huang, M., Wu, Y., Hu, K., Li, R., He, H., Ding, D., Hu, Y., Liu, Q., Zhao, D., Qiu, Y., Kong, S., and Xue, H.: Evidence for Anthropogenic Organic Aerosols Contributing to Ice Nucleation, Geophys. Res. Lett., 49, e2022GL099990, https://doi.org/10.1029/2022GL099990, 2022.
Tritscher, T., Jurányi, Z., Martin, M., Chirico, R., Gysel, M., Heringa, M. F., DeCarlo, P. F., Sierau, B., Prévôt, A. S. H., Weingartner, E., and Baltensperger, U.: Changes of hygroscopicity and morphology during ageing of diesel soot, Environ. Res. Lett., 6, 034026, https://doi.org/10.1088/1748-9326/6/3/034026, 2011.
Wang, J., Ye, J., Liu, D., Wu, Y., Zhao, J., Xu, W., Xie, C., Shen, F., Zhang, J., Ohno, P. E., Qin, Y., Zhao, X., Martin, S. T., Lee, A. K. Y., Fu, P., Jacob, D. J., Zhang, Q., Sun, Y., Chen, M., and Ge, X.: Characterization of submicron organic particles in Beijing during summertime: comparison between SP-AMS and HR-AMS, Atmos. Chem. Phys., 20, 14091–14102, https://doi.org/10.5194/acp-20-14091-2020, 2020.
Wang, S., Zhou, K., Lu, X., Chen, H., Yang, F., Li, Q., Yang, X., and Wang, X.: Measurement of Density and Shape for Single Black Carbon Aerosols in a Heavily Polluted Urban Area, Aerosol Air. Qual. Res., 21, 210162, https://doi.org/10.4209/aaqr.210162, 2021.
Weingartner, E., Baltensperger, U., and Burtscher, H.: Growth and Structural Change of Combustion Aerosols at High Relative Humidity, Environ. Sci. Technol., 29, 2982–2986, https://doi.org/10.1021/es00012a014, 1995.
Weingartner, E., Burtscher, H., and Baltensperger, U.: Hygroscopic properties of carbon and diesel soot particles, Atmos. Environ., 31, 2311–2327, https://doi.org/10.1016/S1352-2310(97)00023-X, 1997.
Wiedensohler, A.: An approximation of the bipolar charge distribution for particles in the submicron size range, J. Aerosol Sci., 19, 387–389, https://doi.org/10.1016/0021-8502(88)90278-9, 1988.
Wu, Y., Liu, D., Wang, J., Shen, F., Chen, Y., Cui, S., Ge, S., Wu, Y., Chen, M., and Ge, X.: Characterization of Size-Resolved Hygroscopicity of Black Carbon-Containing Particle in Urban Environment, Environ. Sci. Technol., 53, 14212–14221, https://doi.org/10.1021/acs.est.9b05546, 2019.
Wu, Y., Liu, D., Tian, P., Sheng, J., Liu, Q., Li, R., Hu, K., Jiang, X., Li, S., Bi, K., Zhao, D., Huang, M., Ding, D., and Wang, J.: Tracing the Formation of Secondary Aerosols Influenced by Solar Radiation and Relative Humidity in Suburban Environment, J. Geophys. Res.-Atmos., 127, e2022JD036913, https://doi.org/10.1029/2022JD036913, 2022.
Yu, C., Liu, D., Hu, K., Tian, P., Wu, Y., Zhao, D., Wu, H., Hu, D., Guo, W., Li, Q., Huang, M., Ding, D., and Allan, J. D.: Aerodynamic size-resolved composition and cloud condensation nuclei properties of aerosols in a Beijing suburban region, Atmos. Chem. Phys., 22, 4375–4391, https://doi.org/10.5194/acp-22-4375-2022, 2022.
Yuan, B., Shao, M., de Gouw, J., Parrish, D. D., Lu, S., Wang, M., Zeng, L., Zhang, Q., Song, Y., Zhang, J., and Hu, M.: Volatile organic compounds (VOCs) in urban air: How chemistry affects the interpretation of positive matrix factorization (PMF) analysis, J. Geophys. Res.-Atmos., 117, D24302, https://doi.org/10.1029/2012JD018236, 2012.
Zhang, G., Lin, Q., Peng, L., Bi, X., Chen, D., Li, M., Li, L., Brechtel, F. J., Chen, J., Yan, W., Wang, X., Peng, P., Sheng, G., and Zhou, Z.: The single-particle mixing state and cloud scavenging of black carbon: a case study at a high-altitude mountain site in southern China, Atmos. Chem. Phys., 17, 14975–14985, https://doi.org/10.5194/acp-17-14975-2017, 2017.
Zhang, R., Khalizov, A. F., Pagels, J., Zhang, D., Xue, H., and McMurry, P. H.: Variability in morphology, hygroscopicity, and optical properties of soot aerosols during atmospheric processing, P. Natl. Acad. Sci. USA, 105, 10291–10296, https://doi.org/10.1073/pnas.0804860105, 2008.
Zhao, D., Liu, D., Yu, C., Tian, P., Hu, D., Zhou, W., Ding, S., Hu, K., Sun, Z., Huang, M., Huang, Y., Yang, Y., Wang, F., Sheng, J., Liu, Q., Kong, S., Li, X., He, H., and Ding, D.: Vertical evolution of black carbon characteristics and heating rate during a haze event in Beijing winter, Sci. Total Environ., 709, 136251, https://doi.org/10.1016/j.scitotenv.2019.136251, 2020.