the Creative Commons Attribution 4.0 License.
the Creative Commons Attribution 4.0 License.
 | 30 Apr 2024
Tropospheric sulfate from Cumbre Vieja (La Palma) observed over Cabo Verde contrasted with background conditions: a lidar case study of aerosol extinction, backscatter, depolarization and lidar ratio profiles at 355, 532 and 1064 nm
Athena Augusta Floutsi
Moritz Haarig
Martin Radenz
Ronny Engelmann
Dietrich Althausen
Annett Skupin
Albert Ansmann
Cordula Zenk
In September 2021, volcanic aerosol (mainly freshly formed sulfate plumes) originating from the eruption of Cumbre Vieja on La Palma, Canary Islands, Spain, crossed Cabo Verde at altitudes below 2 km. On 24 September 2021, an extraordinary large aerosol optical depth (AOD) close to 1 (daily mean at 500 nm) was observed at Mindelo, Cabo Verde. This event provided favorable conditions to obtain lidar-derived profiles of extinction and backscatter coefficients, lidar ratio, and depolarization ratio at 355, 532 and 1064 nm in the sulfate aerosol plume. A novel feature of the lidar system operated at Mindelo is the availability of extinction, lidar ratio and depolarization measurements at 1064 nm in addition to the standard wavelengths of 355 and 532 nm. Having measurements of these parameters at all three wavelengths is a major advantage for the aerosol characterization and in aerosol typing efforts as the lidar ratio and the particle linear depolarization ratio are key parameters for this purpose. In this article, we present the key results of the lidar observations obtained on one specific day, namely on 24 September 2021 at 04:38–05:57 UTC, including the first ever measurements of the particle extinction coefficient, the lidar ratio and the depolarization ratio at 1064 nm for volcanic sulfate, and discuss the findings in terms of aerosol optical properties and mass concentrations by comparison with a reference observation (16 September 2021) representing the typical background conditions before the start of the eruptions. We found an unusual high particle extinction coefficient of 721 ± 51, 549 ± 38 and 178 ± 13 Mm−1, as well as an enhanced lidar ratio of 66.9 ± 10.1, 60.2 ± 9.2 and 30.8 ± 8.7 sr at 355, 532 and 1064 nm, respectively, in the sulfate-dominated planetary boundary layer (PBL). The particle linear depolarization ratio was ≤ 0.9 % at all respective wavelengths. It is the first time that lidar-derived intensive aerosol optical properties could be derived for volcanic sulfate at all three wavelengths, and thus it is a highly valuable data set for global aerosol characterization. The lidar analysis also revealed a sulfate-related AOD of about 0.35 ± 0.03 at 532 nm of the total PBL-related AOD of 0.43. The rest of the AOD contribution was caused by a lofted Saharan dust layer extending from 1.4 to 5 km and leading to a total AOD of 0.79 at 532 nm. Volcanic ash contribution to the observed aerosol plumes could be mostly excluded based on trajectory analysis and the observed optical properties. Peak mass concentration was 178.5 ± 44.6 µg m−3 in the volcanic-influenced and sulfate-dominated polluted PBL, showing the hazardous potential of such sulfate plumes to significantly worsen local air quality even at remote locations.
- Article
(12379 KB) - Full-text XML
- BibTeX
- EndNote


Volcanic eruptions are of great importance for the Earth's climate (Hansen et al., 1997; Robock, 2000) because the emitted particles and gases can be transported several hundred kilometers away from the source and influence the global radiation budget (Solomon et al., 2011; Groß et al., 2012; Martin et al., 2014). Typically emitted products of volcanic activity are ash particles with a diameter smaller than 2 mm during explosive phases, as well as volatiles such as sulfur dioxide (SO2; McGonigle et al., 2004; Aiuppa et al., 2008; Carracedo et al., 2022). SO2 is the most abundant gas emitted by volcanoes (Kampouri et al., 2021). A total of 10–20 Mt of volcanic SO2 is released into the troposphere each year (Martin et al., 2014). While in the stratosphere this gas has a lifetime of multiple weeks, it persists in the troposphere for around 1–3 d (Navas-Guzmán et al., 2013; Pattantyus et al., 2018). In a chemical reaction with water and further atmospheric components (hydroxyl radical – OH – in clear-air conditions or hydrogen peroxide – H2O2 – in cloudy air), it is quickly converted to sulfate aerosol (sulfate-bearing substances and sulfuric acid droplets; Ansmann et al., 2011b; Martin et al., 2014; Pattantyus et al., 2018). The efficiency of the conversion of SO2 to sulfate aerosol is influenced by multiple factors and increases with temperature and relative humidity (Eatough et al., 1994; Yang et al., 2018). The lifetime of sulfate aerosol in the troposphere of 1–3 weeks is much longer than that of SO2 or volcanic ash so that it can be transported over long distances (Pappalardo et al., 2004; Filonchyk et al., 2022). If it reaches the higher troposphere–lower stratosphere it can even remain for several years (Jäger, 2005; Deshler, 2008; Martin et al., 2014).
Sulfate aerosol particles are impacting the climate in several ways since they reflect solar radiation (Pappalardo et al., 2004) and scatter light even more efficiently with increasing relative humidity due to hygroscopic growth (Miffre et al., 2012). Furthermore, they act as cloud condensation nuclei (CCN) and ice nucleation particles (INPs) and, thus, influence the precipitation cycle (Pappalardo et al., 2004). Especially in cities, sulfate aerosol is of large importance with regard to air quality. It is one of the major components of urban PM2.5 (Zhang et al., 2004; Yang et al., 2018). Although anthropogenic SO2 emissions (at 110 Mt yr−1) are 5–10 times higher than volcanic emissions, volcanic eruptions are one of the greatest natural sources for sulfur emissions (Martin et al., 2014). Furthermore, their emissions have a larger impact on the climate due to the release of SO2 at higher altitudes, which provides a longer lifetime of the formed aerosol particles (Kampouri et al., 2021). In addition, sulfate particles can be emitted directly during volcanic eruptions as well (Martin et al., 2014). Moreover, volcanic eruptions have not only climatological but also economical consequences with regard to aviation. For example, volcanic ash can cause engine damage to aircraft and therefore air traffic can even be suspended, as happened during the eruption of the Iceland volcano Eyjafjallajökull in spring 2010 (Groß et al., 2012). To reduce the risks, ash-dispersion simulations are used in early warning systems. Assimilation of satellite products like Aeolus wind measurements improve the ash plume forecast, as shown in a recent study of Amiridis et al. (2023). Besides the climatological and economical consequences, volcanic gases and particles lead to strong regional pollution events, too, such that during volcanic eruptions villages in the proximity even have to be evacuated. Often, visibility is reduced and extremely degraded air quality occurs (Pattantyus et al., 2018). As a dominant component of PM2.5, sulfate aerosol has a negative impact on human health as it infiltrates deeply into the lungs and can cause asthma, sinusitis or further respiratory disease (Businger et al., 2015).
Lidar observations have expanded our knowledge of volcanic aerosol in the troposphere. In the case of the eruption of Eyjafjallajökull in Iceland in 2010 (Ansmann et al., 2010, 2011b; Groß et al., 2012; Pappalardo et al., 2013) and Etna in Italy in 2002 (Pappalardo et al., 2004) and 2019 (Kampouri et al., 2021), pure volcanic ash was observed. Lidar ratios in the range of 30–60 sr and a particle linear depolarization ratio of 35 %–37 % were measured at 355 and 532 nm. In general, it is challenging to distinguish volcanic ash from other depolarizing aerosol types, especially from desert dust, because of the very similar lidar ratios of both types. The main quantity for the distinction between volcanic ash and desert dust is the particle linear depolarization ratio, which is in the range of 30 ± 5 % (at 355, 532, 710 and 1064 nm) for pure dust (Ansmann et al., 2010) and, thus, smaller than the aforementioned values for ash. Sulfate aerosol instead can be distinguished more easily from volcanic ash due to a much lower particle linear depolarization ratio, which is close to zero, and the different size ranges of the aerosol particles. While volcanic ash is in the coarse mode (diameter > 2 µm), sulfate aerosol is in the fine mode (diameter ≤ 2 µm) (John, 2011). A separation of volcanic sulfate and ash based on the particle linear depolarization ratio was successfully introduced by Ansmann et al. (2011b). Sulfate particles produce a larger lidar ratio (from 55 up to 80 sr) and a particle linear depolarization ratio close to zero (4 %–5 %) as multiwavelength-Raman-lidar observations at 355 and 532 nm during the eruptions of Eyjafjallajökull and Etna have shown (Pappalardo et al., 2004; Mona et al., 2012; Navas-Guzmán et al., 2013). In the case of Eyjafjallajökull, Navas-Guzmán et al. (2013) observed two distinct aerosol layers over Granada, Spain, consisting of 82 % sulfate aerosol. Sulfate aerosol from Eyjafjallajökull mixed with continental aerosol was furthermore observed in the planetary boundary layer (PBL) over Potenza, Italy (Mona et al., 2012). One of the first multiwavelength-Raman-lidar measurements of tropospheric volcanic aerosol, and especially sulfate particles (mixed with a low amount of soot), was also performed at Potenza, capturing the eruption of Mt. Etna in 2002 as reported by Pappalardo et al. (2004).
One of the most recent volcanic eruptions, which was highly present in the European media, took place at the Cumbre Vieja volcanic ridge (28.62° N, 17.88° W, 1949 m a.s.l.) at La Palma, Canary Islands. The event is described in detail by Carracedo et al. (2022). Further studies concerning its impact on air quality were performed by Filonchyk et al. (2022) and Milford et al. (2023). A ceilometer-based study of the mass concentration of volcanic ash at La Palma and its distribution to the south of France was performed by Bedoya-Velásquez et al. (2022). Volcanic activity started on 19 September 2021. The last eruption was recorded on 13 December 2021. The eruptive column usually reached an altitude of 3500 m a.s.l. and peaked at 8500 m a.s.l. on 13 December. During the whole time of volcanic activity, fine lapilli (diameter 2–64 mm) were constantly produced. In addition, ash (< 2 mm) and more than 10 kt SO2 d−1 were emitted (Filonchyk et al., 2022) so that at different measurement sites at La Palma the European air quality hourly threshold of 350 µg m−3 was exceeded on multiple days (Milford et al., 2023). The SO2 emissions were largest at the beginning of the period with a maximum of 125 kt on 23 September 2021 (Milford et al., 2023). According to SO2-dispersion forecasts (Carracedo et al., 2022), the emission products were transported over long distances, reaching central Europe and the Caribbean. A mixture of fine- and coarse-mode aerosol originating from La Palma was detected at Toulouse, France, on 24–25 September 2021 (Bedoya-Velásquez et al., 2022).
Volcanic aerosol of this eruption was also transported towards Mindelo on the Cabo Verde Islands, which are located 1500 km southwest of the Canary Islands. Since June 2021, the multiwavelength-Raman-polarization lidar PollyXT (Engelmann et al., 2016; Baars et al., 2016) has been operated there and was able to capture the volcanic aerosol plume. On 24 September 2021, the volcanic particles caused a high aerosol optical depth (AOD) of around 1.0, as measured with the co-located sun photometer, and strong pollution in the PBL with extinction coefficient values more than twice as much as the typical background conditions, leading to highly reduced visibility. We will show that the volcanic aerosol reached the measurement site at a low altitude and, thus, was significantly relevant for air quality and human health. In this paper, we present a case study of lidar observations conducted on 24 September 2021 (period of volcanic activity) at Mindelo, Cabo Verde, contrasted with a reference measurement from 16 September 2021, before the start of the eruptions. In the following section, the methodology is described, including information about the instruments and models, the measurement site, and the method of data processing. In Sect. 3, the results for the case study are presented and discussed in Sect. 4, before a conclusion is drawn in Sect. 5.
2.1 Measurement site and instrumentation
In the framework of the ground-based part of the Joint Aeolus Tropical Atlantic Campaign (JATAC), called ASKOS (a Greek word originating from Greek mythology that only denotes the name of the campaign; Amiridis and the ASKOS team, 2022; Fehr et al., 2023; Marinou et al., 2023), a temporary Aerosol, Clouds and Trace Gases Research Infrastructure (ACTRIS) remote sensing station was set up at the Ocean Science Center Mindelo (OSCM) at Mindelo, Cabo Verde (16.878° N, 24.995° W), in June 2021. The OSCM is located on the west coast of the island of São Vicente, with low anthropogenic influence. The island itself is located 1500 km southwest of the Canary Islands and La Palma and in the trade wind zone with the usual advection of air masses from the northeasterly direction. Typically, cumulus convection occurs at Mindelo during nighttime.
Among others, this station is equipped with a PollyXT multiwavelength-Raman-polarization lidar. The lidar deployed at Mindelo has a few improvements compared with previous instruments (Althausen et al., 2009; Engelmann et al., 2016). For instance, it uses a diode-pumped Nd : YAG laser, which has a higher repetition rate (100 Hz) than the typical flashlamp-pumped Nd : YAG laser (20–30 Hz) of PollyXT. This feature offers the possibility to retrieve profiles of the optical properties with a lower temporal averaging down to 10 min. It is an important capability with regard to this study, since at Mindelo small clouds often occur at night and cloud-free periods are quite short. Furthermore, the receiver consists of 15 channels and enables measurements of the elastic backscatter coefficient at 355, 532 and 1064 nm, the inelastic backscatter at 387, 607 and 1058 nm, the cross-polar signal at 355, 532 and 1064 nm, and the inelastic signal from water vapor at 407 nm. Additionally to the far-field (FF) measurements, near-field (NF) measurements are available for the 355 and 532 nm elastic channels as well as the 387 and 607 nm Raman channels. The instrument also has a dual-field-of-view depolarization channel (Jimenez et al., 2020a), which is a powerful technique allowing the determination of microphysical properties of liquid water droplets (Jimenez et al., 2020b). Thus, in combination with the lidar-derived aerosol optical properties, it can be used to study aerosol–cloud interactions, which is, however, not within the scope of the study we are presenting here. With the described setup, several aerosol optical properties can be determined. These properties are the particle backscatter coefficient, the particle extinction coefficient, the lidar ratio (ratio of particle extinction-to-backscatter coefficient) and the particle linear depolarization ratio, all at 355, 532 and 1064 nm, as well as the backscatter-related and the extinction-related Ångström exponent between the different wavelengths. The availability of the extinction coefficient, the lidar ratio and the particle linear depolarization ratio at 1064 nm, as well as the backscatter coefficient at this wavelength determined via the rotational Raman (RR) channel at 1058 nm, is a new feature of this device. The calculation of the extinction coefficient at 1064 nm via the rotational Raman method follows the methodology described in Haarig et al. (2016). The spectral cross-talk calibration using a liquid cloud with a constant cloud-base height was introduced in Haarig et al. (2022). Here, a liquid cloud base on 4 October 2021 was used for calibration, which led to a spectral cross-talk correction factor of ± . There was no change in neutral density filters between 24 September and 4 October 2021, and therefore the spectral cross-talk correction factor remained stable. The calibration of the depolarization ratio at 1064 nm and the estimation of its uncertainties followed the same approach as the calibration at 355 and 532 nm (Engelmann et al., 2016). The Δ90° calibration (Freudenthaler et al., 2009) with a linear polarizer after the pinhole was applied. Like every PollyXT lidar system, the PollyXT lidar that operates at Mindelo is part of PollyNET (Baars et al., 2016) and vertical profiles of the lidar optical properties are automatically derived by the PollyNET processing chain (Yin and Baars, 2021). However, for this study, the profiles were analyzed manually. Due to the frequent occurrence of boundary layer clouds, a more tailored data analysis was needed. Furthermore, to reduce noise, the profiles were smoothed vertically by using a moving average filter. The result is again a continuous profile with a distance of 7.5 m between the single data points but starting at an altitude which is half of the smoothing length (s). Thus, each data point contains information on the height range from 0.5⋅s below to 0.5⋅s above this point.
Concerning the uncertainties in the lidar-derived aerosol optical properties, it is worth mentioning that systematic errors (e.g., polarization effects in the receiver unit, dead time effects and overlap effects) are generally corrected as the lidar system is calibrated according to ACTRIS/EARLINET standards (e.g., ACTRIS guidelines, 2024). To account for the remaining unknown systematic errors (e.g., reference height and value) and the statistical uncertainties, a relative error of 15 % is considered for the particle backscatter coefficient determined with the Raman method (Althausen et al., 2009; Baars et al., 2012; Engelmann et al., 2016; Baars et al., 2016). For the particle extinction coefficient, the statistical error is calculated from the error of the linear fit of the derivative without considering systematic uncertainties. This linear fit considers as many data points as the smoothing length (s) and is applied every 7.5 m. For the particle depolarization ratio, we consider a remaining constant absolute error of 0.02 at 355 nm and of 0.01 at 532 and 1064 nm retrieved after intense calibration approaches (ACTRIS guidelines, 2024). The uncertainties in the lidar ratio and the Ångström exponents are then calculated using the Gaussian error propagation.
In addition, a CIMEL sun–sky–lunar photometer of type CE318-T was used for this study, which is operating in the Aerosol Robotic Network (AERONET; Holben et al., 1998). It measures solar irradiances at eight different wavelengths (340, 380, 440, 500, 675, 870, 1020 and 1640 nm) from which the AOD (at the same wavelengths), the columnar Ångström exponent (for six wavelength pairs), the volume size distribution, the refractive index, the single-scattering albedo, the absorption AOD, the extinction AOD, the asymmetry factor and the phase function are derived. A new capability of the latest type CE318-T is that it measures during night as well using the moonlight to determine nighttime AODs.
2.2 Air mass source attribution
To describe the origin of the observed air masses, hybrid single-particle Lagrangian integrated trajectories (HYSPLIT; Stein et al., 2015; Rolph et al., 2017; HYSPLIT, 2024) were used. Ensemble trajectories with 27 members were calculated for 5 d back in time, i.e., towards the day when volcanic activity at La Palma started. The meteorological input data were taken from the Global Data and Assimilation Service (GDAS1, 2024). Furthermore, simulations with the air mass source attribution tool TRACE (Radenz et al., 2021; Radenz, 2021) were performed, which is a combination of the FLEXible PARTicle dispersion model FLEXPART (Pisso et al., 2019) and a simplified version of the MODIS land cover classification (Broxton et al., 2014) or custom-defined geographical areas. For FLEXPART, the meteorological input data were taken from the Global Forecast System (GFS; National Centers for Environmental Prediction et al., 2000). In this case, 5 d backward simulations were calculated for 500 air parcels, which arrive at Mindelo at different altitudes from 0 to 10 km in steps of 500 m with a temporal resolution of 3 h. Evaluating both backward simulation models allows us to ensure more certainty with respect to the origin of the air masses.
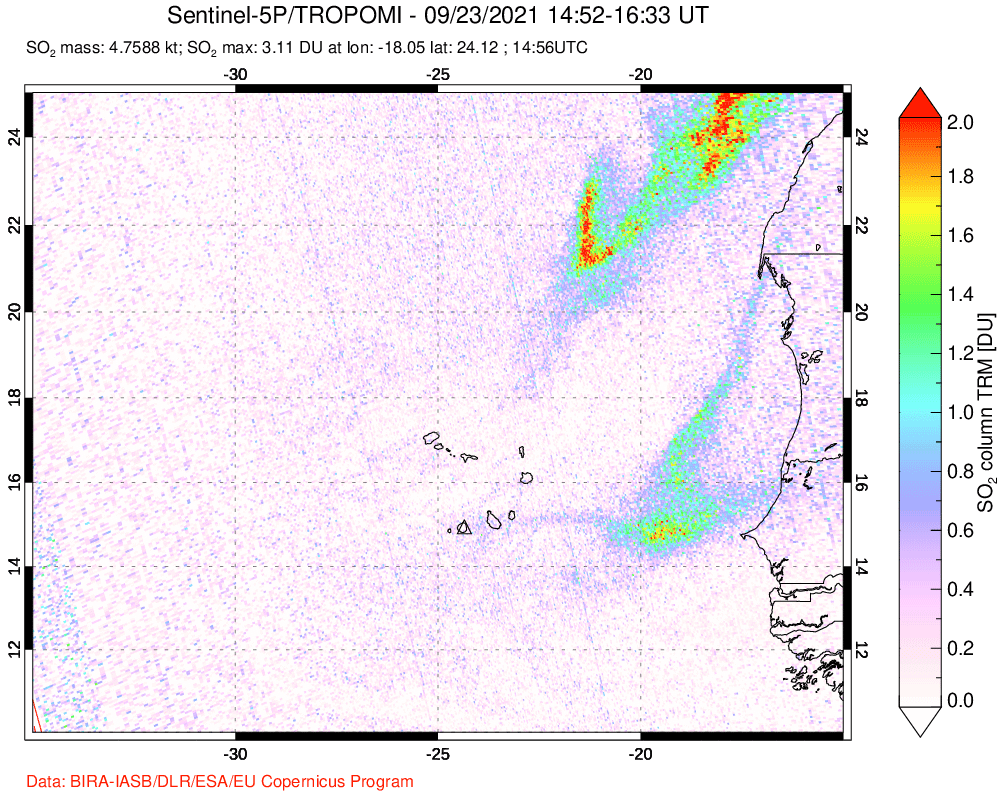
In addition, the horizontal distribution of the volcanic plume was monitored. Therefore, the transport of SO2 and its advection towards Mindelo was tracked. For this purpose, the TROPOspheric Monitoring Instrument (Veefkind et al., 2012; TROPOMI, 2024) on board the polar-orbiting Sentinel-5 Precursor satellite was used, which offers daily global measurements of the mass of SO2 in a column per surface area. Its horizontal resolution is 3.5 km × 5.5 km.
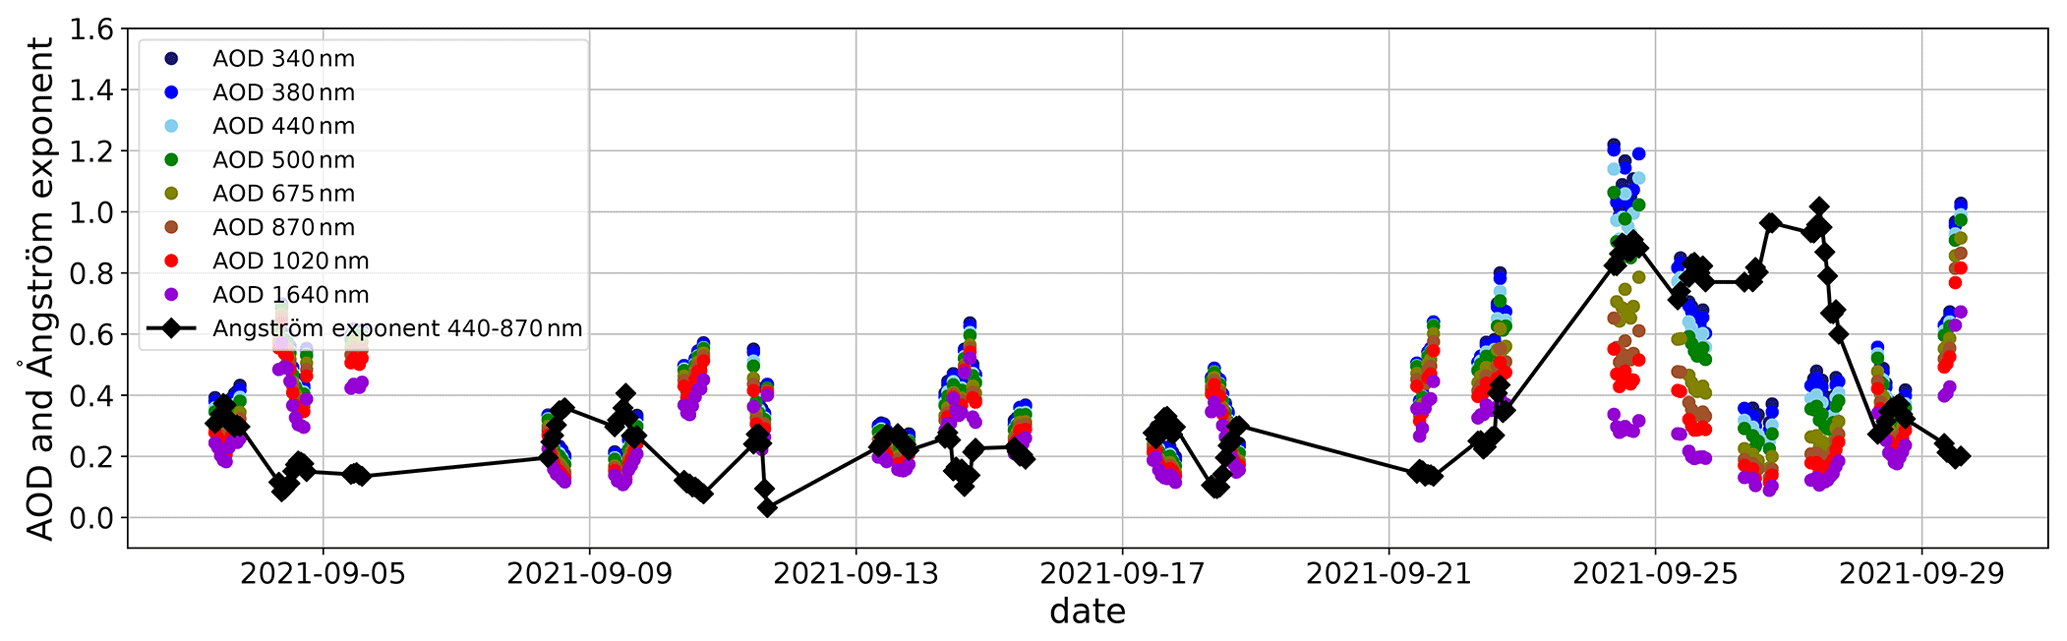
Figure 1Time series of Level-2.0 hourly averages of the aerosol optical depth (AOD) at different wavelengths and the columnar Ångström exponent between 440 and 870 nm measured with an AERONET sun photometer at Mindelo in September 2021. Data points for 16 September were cut out, since on that day a cirrus cloud was present, which was not correctly screened out by the AERONET retrieval. The original data, including the cirrus, are shown in Fig. A1.
A time series of the AERONET AOD at different wavelengths and the columnar Ångström exponent between 440 and 870 nm is shown in Fig. 1. Before the start of the eruption, the hourly mean AOD was around 0.4 at the shown wavelengths. Hourly mean Ångström exponent values of 0.2 were usually observed until 22 September. During the time of volcanic activity, a change in the behavior of the Ångström exponent and the AOD could be seen since 22 September and, thus, 3 d after the eruption started. A strong increase in the Ångström exponent to values higher than 0.8 was measured. In that time, high AOD values close to 1.0 at wavelengths ≤ 500 nm were recorded, e.g., on 24 and 29 September 2021. On 24 September, the daily mean AOD was 1.1 at 340 nm and 0.9 at 500 nm. The vertically resolved lidar optical properties are presented in a case study for 24 September (Sect. 3.2) contrasted with background conditions before the volcanic eruption (16 September; Sect. 3.1), representing a clean PBL (marine influenced).
3.1 Reference case (16 September 2021)
To contrast the differences between the volcanic influenced aerosol conditions over Mindelo and the typical situation before the start of the eruption at La Palma, 16 September 2021 was selected as the reference observation. The corresponding height-resolved temporal development of the calibrated attenuated backscatter coefficient at 1064 nm and the volume depolarization ratio at 532 nm is shown in Fig. 2 (left side). The figure is provided to illustrate the vertical structure of the aerosol layers for the days of interest. As it is not corrected for the atmospheric attenuation, it does not allow a quantitative comparison of the backscatter intensity at a given altitude. For this purpose, vertical profiles of the backscatter coefficient are presented later. The vertical structure on 16 September showed two different aerosol layers. The PBL reached up to 0.8 km height. In that layer, no depolarization occurred (Fig. 2b). Above, a lofted layer, which was strongly depolarizing, was located between 1.2 and 6 km height. Small clouds were frequently present in the PBL as indicated by a very strong backscatter signal and complete attenuation (no signal) some few hundred meters above the cloud base. Such a vertical structure was typically observed over Mindelo from June to October 2021 and is in agreement with previous studies on this archipelago (Ansmann et al., 2011a; Groß et al., 2011; Rittmeister et al., 2017). Additionally, on the reference day, a cirrus cloud occurred, which was not correctly screened out by the AERONET algorithm (compare Figs. A1 and A2). Thus, there are no usable sun photometer data for 16 September.
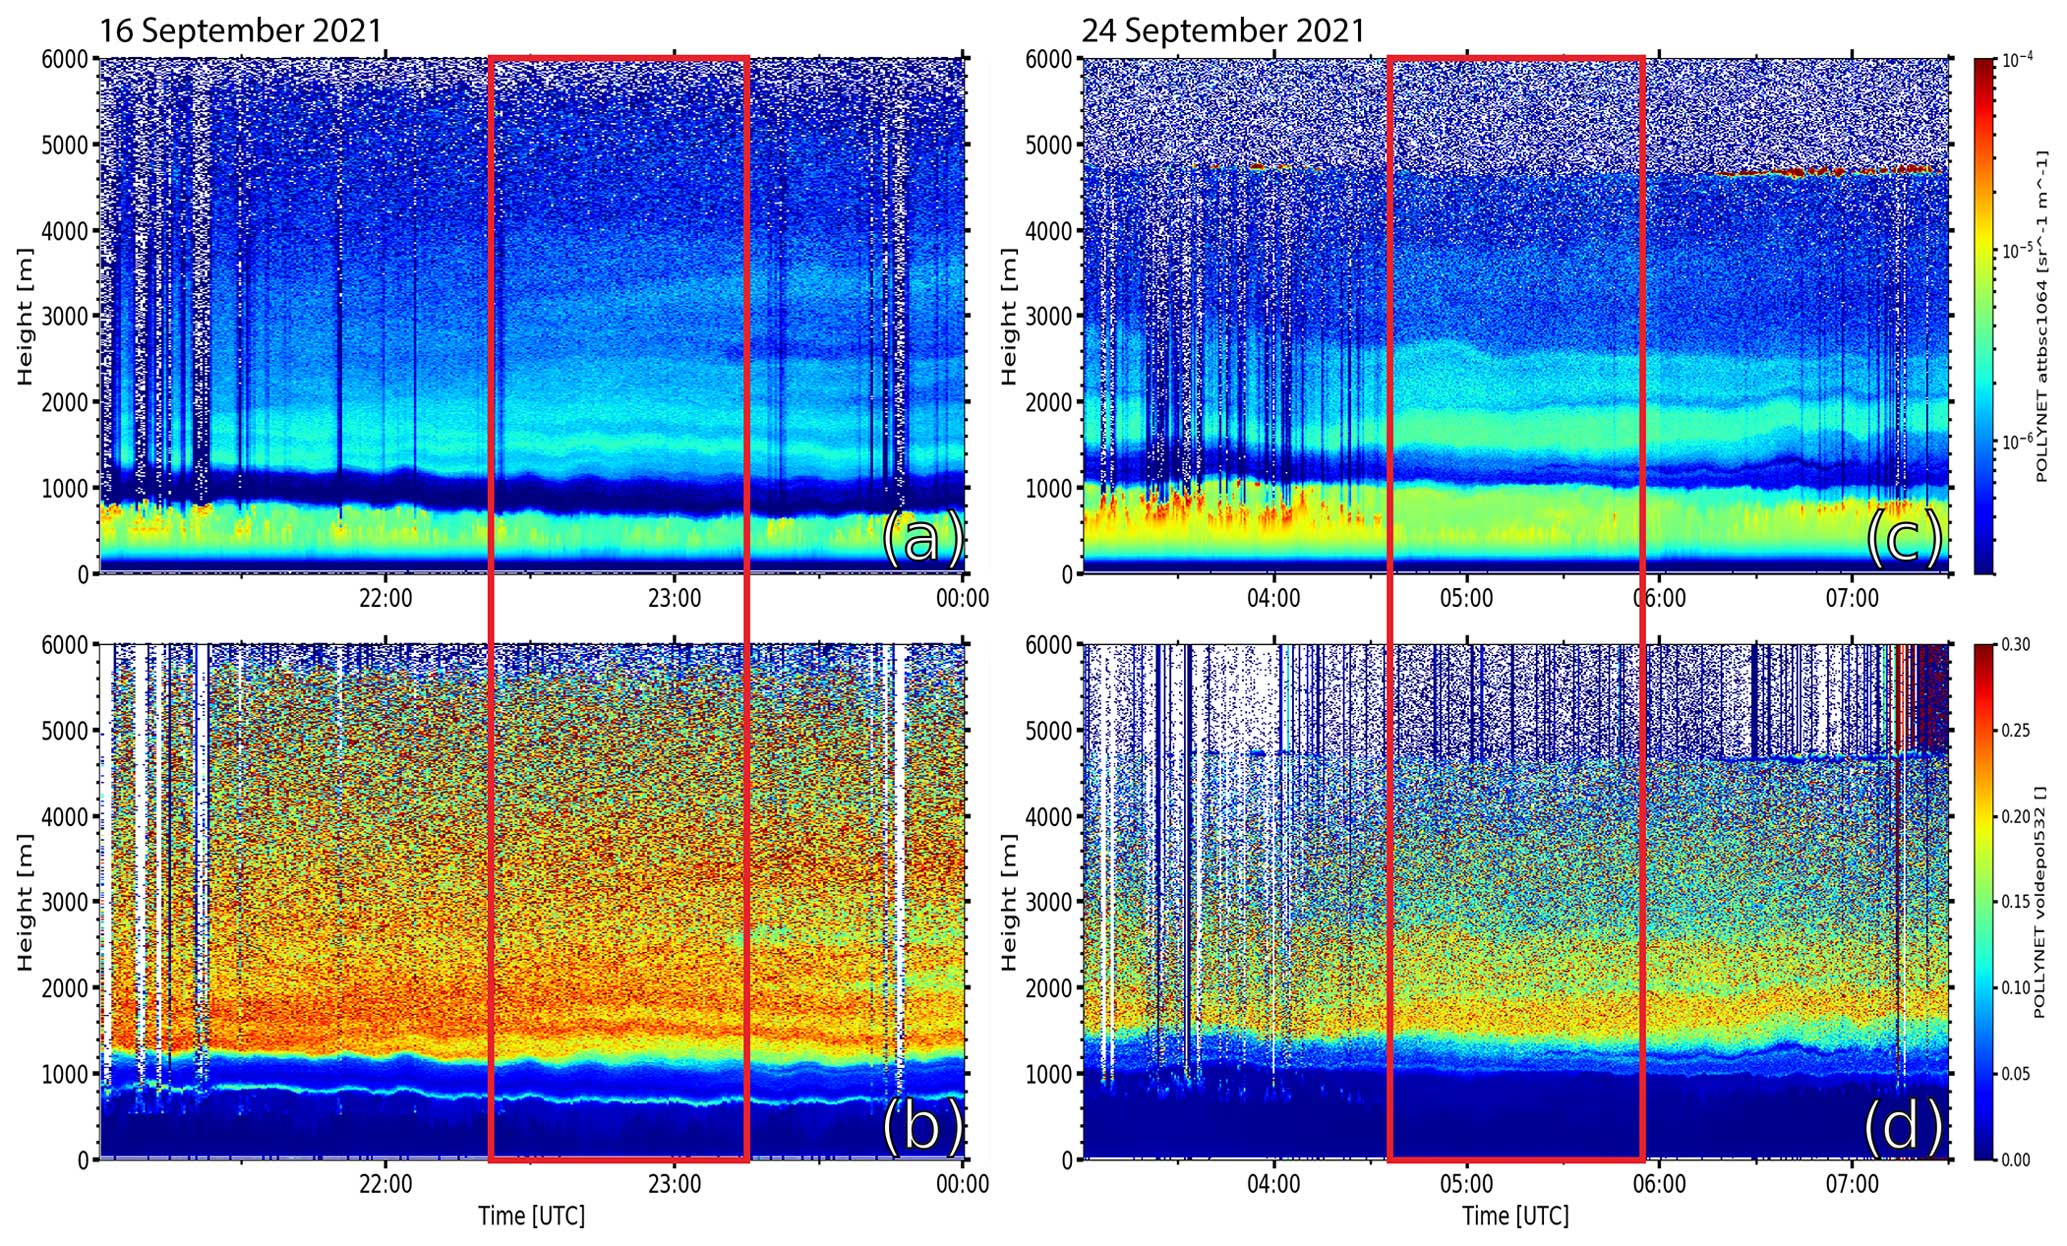
Figure 2Temporal evolution of the height-resolved calibrated attenuated backscatter coefficient at 1064 nm (a, c) and the volume depolarization ratio at 532 nm (b, d) measured by PollyXT at Mindelo, Cabo Verde, during 16 September 2021 at 21:00–24:00 UTC (a, b) and 24 September 2021 at 03:00–07:30 UTC (c, d).
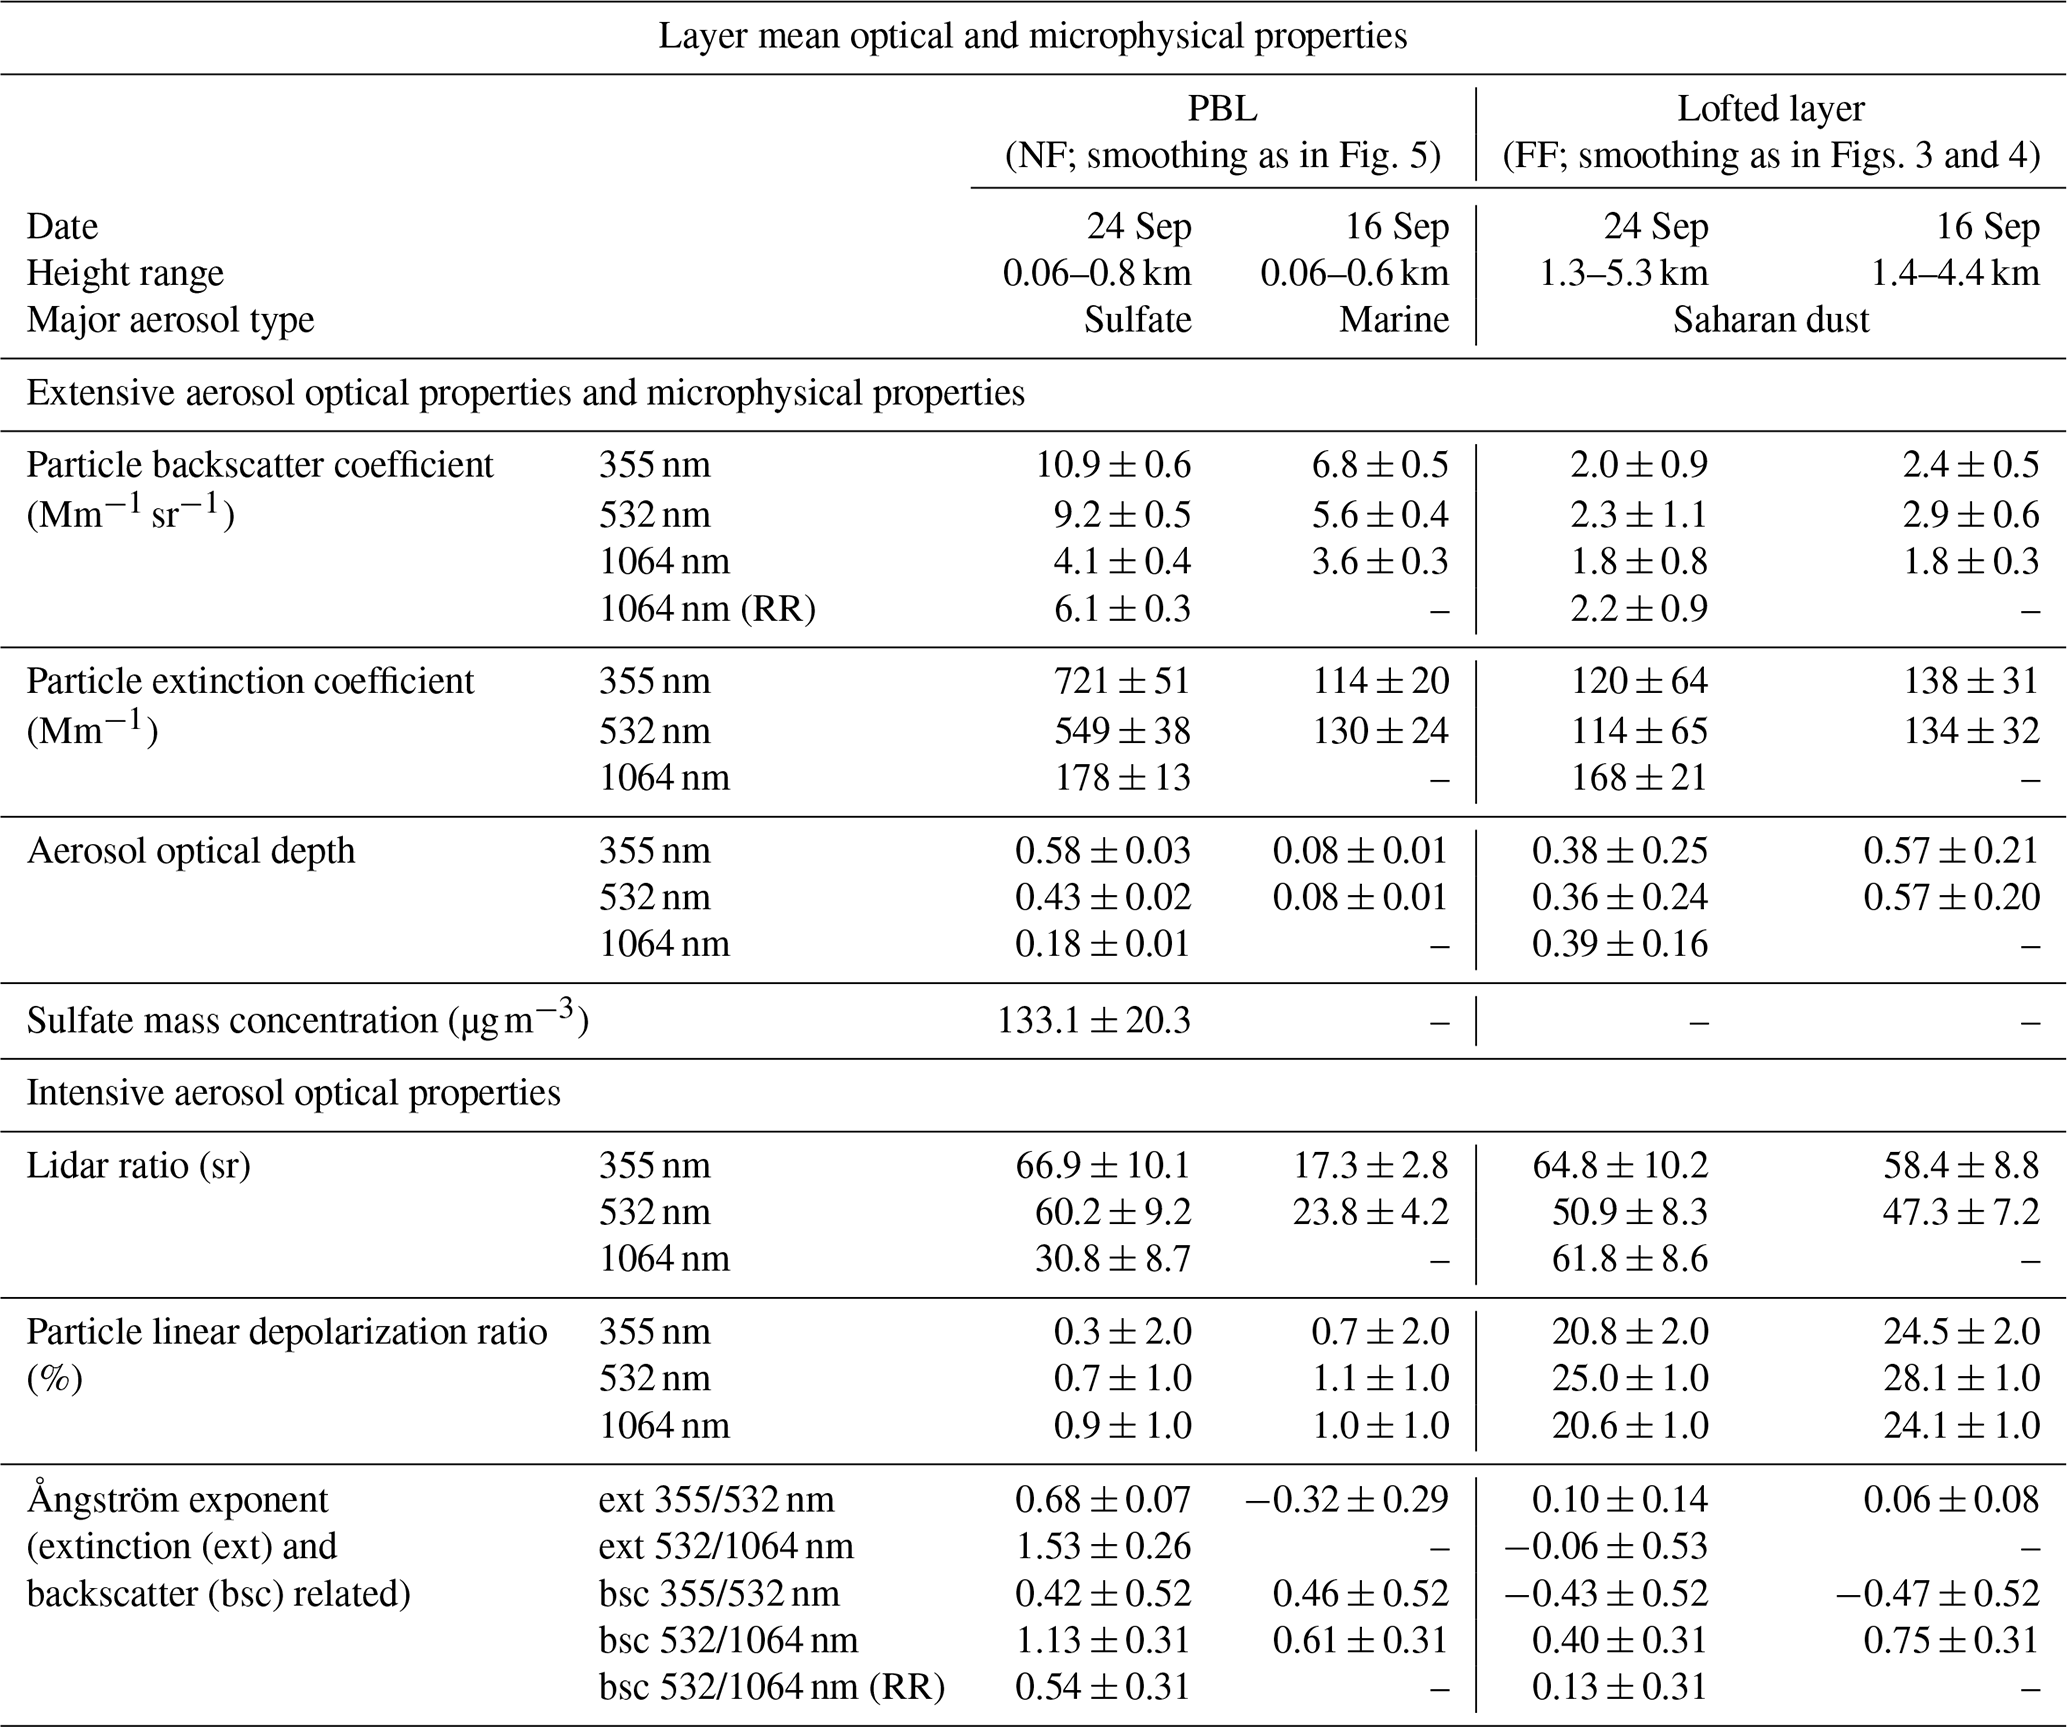
Vertical profiles of the lidar optical properties (Fig. 3) were derived with the Raman method (Ansmann et al., 1992) for a 48 min interval in the evening (22:24–23:12 UTC, indicated by a red rectangle on the left side of Fig. 2, since this was the longest cloud-free period during nighttime). The corresponding mean values are summarized in Table 1. The uncertainties given in the text are always the standard deviation (parameter variability within the layer) or the layer mean error as described in the caption of Table 1. In the lofted layer, between 1.3 and 5.3 km height, the mean lidar ratio of 58.4 ± 8.8 and 47.3 ± 7.2 sr (at 355 and 532 nm) and the particle linear depolarization ratios of 24.5 ± 2.0 %, 28.1 ± 1.0 % and 24.1 ± 1.0 % (at 355, 532 and 1064 nm) are in a typical range for desert dust (Haarig et al., 2017; Floutsi et al., 2023). In the PBL (up to 0.6 km height), relatively clean marine conditions (Bohlmann et al., 2018) were observed, which were characterized by a mean lidar ratio of 17.3 ± 2.8 and 23.8 ± 4.2 sr (at 355 and 532 nm) and a mean particle linear depolarization ratio of ≤ 1.1 % (at 355, 532 and 1064 nm). The mean particle extinction coefficient was about 114 ± 20 and 130 ± 24 Mm−1 (at 355 and 532 nm). Unfortunately, for that day the rotational Raman profiles at 1064 nm were not available since the analyzed time period of 48 min is too short to obtain reasonable results. However, the measurement from 16 September represents the typical values, which we usually observed over Mindelo during that time of the year, as the lidar studies in the framework of ASKOS and L2A+ confirm (L2A+, 2024; EVDC, 2024). This statement is especially valid for the PBL.
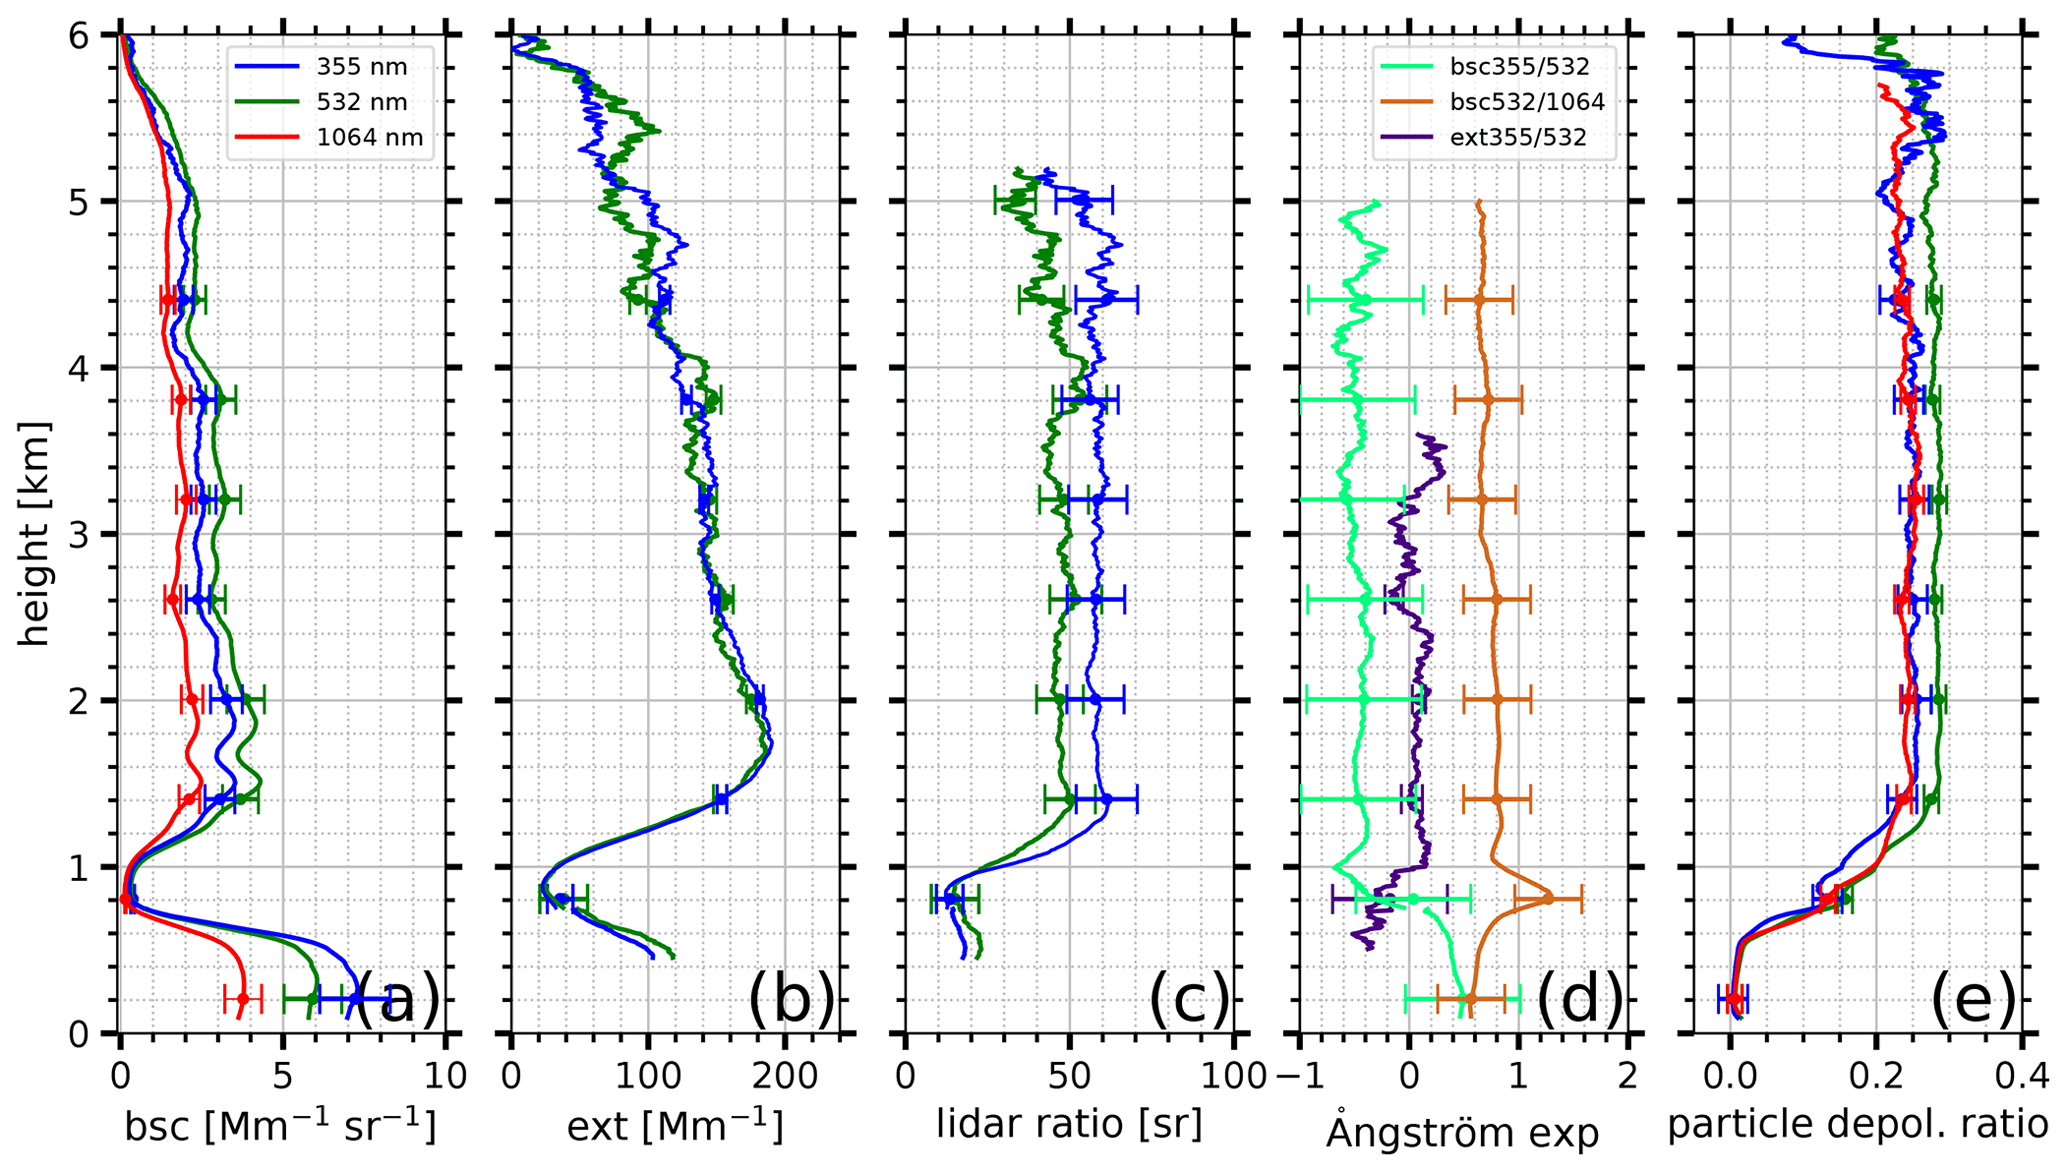
Figure 3Measured with PollyXT at Mindelo, Cabo Verde, on 16 September 2021 between 22:24 and 23:12 UTC: vertical profiles of (a) the particle backscatter coefficient, (b) the particle extinction coefficient, (c) the lidar ratio, (d) the Ångström exponent and (e) the particle linear depolarization ratio. Vertical smoothing: 187.5 m for (a, e) and the backscatter-related Ångström exponent in (d); 742.5 m for (b, c) and the extinction-related Ångström exponent in (d). Near- and far-field measurements are merged at 750 m. The error bars show the uncertainties as described in Sect. 2.1.
Table 1Layer mean values of the lidar-derived aerosol optical and microphysical properties for the PBL and the lofted layer on 24 September 2021 (04:38–05:57 UTC) and on 16 September 2021 (22:24–23:12 UTC). The values are given along with the standard deviation (parameter variability within the layer) for the extensive aerosol properties and the sulfate mass concentration as well as with the layer mean errors (as described in Sect. 2.1) for the intensive aerosol properties. Geometric information regarding the aerosol layers is also provided (note that for the calculation of the extinction-related properties in the PBL, the layer bottom height is 0.25 km due to the overlap configurations).
3.2 Volcanic influence (24 September 2021)
For 24 September 2021, the height-resolved temporal development of the attenuated backscatter coefficient at 1064 nm is shown in Fig. 2c and the volume depolarization ratio at 532 nm in Fig. 2d. Again, two distinct aerosol layers are visible: a weakly depolarizing PBL (Fig. 2d) up to about 1 km height and a strongly depolarizing lofted layer from 1.4 to 5 km height. As on 16 September, small clouds occurred frequently in the PBL. Before first daylight appeared at 07:30 UTC, a longer cloud-free period evolved. Thus, optical properties were retrieved with the Raman method for a 79 min interval (04:38–05:57 UTC, indicated by a red rectangle on the right side of Fig. 2).
The corresponding vertical profiles are shown in Fig. 4. On that day, all lidar-derived optical quantities are available at all three wavelengths. For the lofted layer, mean values, as depicted in Table 1, were retrieved based on the far-field measurements. The particle extinction coefficient was in the range of 114–168 Mm−1 at 355, 532 and 1064 nm. Measurements of the lidar ratio led to layer mean values of 64.8 ± 10.2, 50.9 ± 8.3 and 61.8 ± 8.6 sr (355, 532 and 1064 nm, respectively). These values are slightly larger than the ones measured on 16 September. From 532 to 1064 nm, the lidar ratio increased by 21 %, which is in line with dust observations at Leipzig, Germany (where it increased by 24 %–38 %; Haarig et al., 2022). Because of similar source regions of the dust, namely the western Sahara, both observations are comparable. The higher lidar ratio at 355 nm compared with 532 nm suggests specific source regions in the Sahara, as observed through lidar observations in Senegal (Veselovskii et al., 2020). The measured particle linear depolarization ratio of 20.6 %–25.0 % for the three different wavelengths indicates the presence of non-spherical particles, i.e., desert dust, but is somewhat smaller than what was typically observed for pure dust (Freudenthaler et al., 2009; Floutsi et al., 2023), indicating the presence of some spherical non-dust particles. Considering the wavelength dependence of the particle linear depolarization ratio, a relative decrease of 18 % from 532 towards 1064 nm was observed. Similar findings were made at Leipzig, Germany, and Morocco during SAMUM (relative decrease by 13 %–31 %; Haarig et al., 2022; Freudenthaler et al., 2009). The backscatter-related Ångström exponent in the lofted layer is on average around 0.4 ± 0.31 for the wavelength pair 532/1064 nm, indicating large particles (i.e., desert dust). Considering the higher lidar ratio (especially at 355 nm) and the lower particle linear depolarization ratio on 24 September compared with the typical values of pure desert dust, we conclude that the dust on 24 September was slightly polluted.
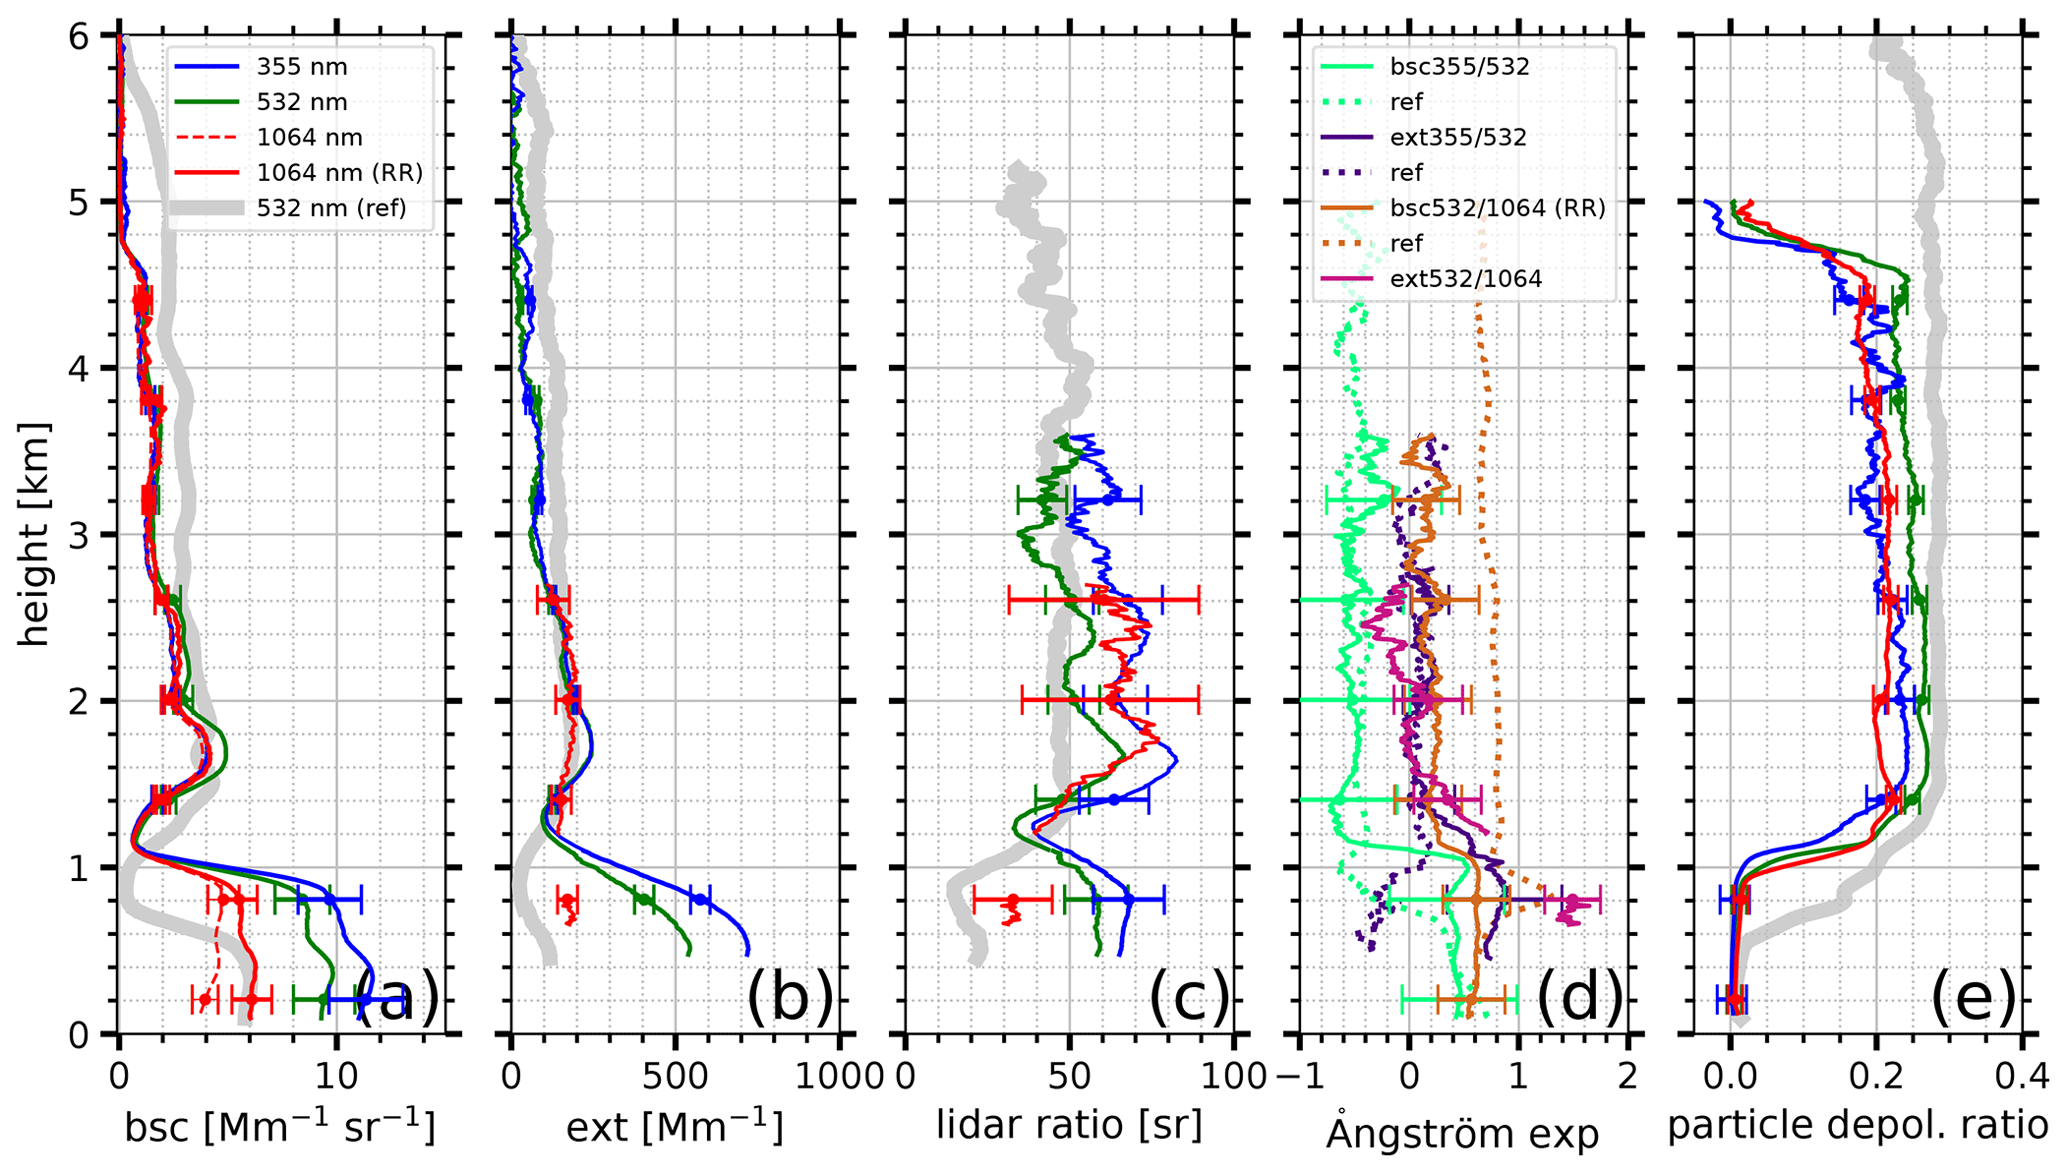
Figure 4Same as in Fig. 3 but for 24 September 2021 between 04:38 and 05:57 UTC (note the changed x scale for a and b), including the particle extinction coefficient and lidar ratio at 1064 nm as well as the extinction-related Ångström exponent between 532 and 1064 nm (vertical smoothing: 397.5 m below 1.2 km and 1492.5 m above 1.2 km). Near- and far-field measurements are merged at 1100 m. Reference profiles at 532 nm from 16 September 2021 are shown as thick gray lines and in (d) as dotted lines labeled as “ref”.
In contrast to the almost typical aerosol conditions in the lofted layer, unusual strong pollution was observed in the PBL. The findings are highlighted in Fig. 5, showing zoomed profiles. In addition, vertical smoothing was reduced, which improves the resolution, reduces the overlap effect especially for the near-field profiles and, thus, allows us to include information from lower altitudes above the lidar. All mean values for the PBL are listed in Table 1 as well. On this day, extremely high values of the particle extinction coefficient were observed with layer mean values of 721 ± 51, 549 ± 38 and 178 ± 13 Mm−1 (at 355, 532 and 1064 nm) in the PBL. The maximum values were even higher with 794 ± 7, 640 ± 13 and 198 ± 26 Mm−1 (at 355, 532 and 1064 nm, mentioned here with statistical errors). These values are 3 to 4 times higher than what was observed under clean marine conditions as shown for 16 September and indicated as gray lines in Fig. 5. Additionally, the particle extinction coefficient strongly decreased with increasing wavelength. A similar behavior was observed for the lidar ratio. Mean values of 66.9 ± 10.1, 60.2 ± 9.2 and 30.8 ± 8.7 sr (at 355, 532 and 1064 nm) were found, showing a decrease of 48 % from 532 towards 1064 nm. The mean values of the lidar ratio are notably high compared with the clean marine conditions and are typical for pollution or even smoke (Floutsi et al., 2023). However, the decrease in the lidar ratio at 1064 nm compared with the value at 532 nm points to pollution rather than to smoke. In the case of wildfire smoke an increase in the lidar ratio at 1064 nm compared with 532 nm was observed (Haarig et al., 2018). The high lidar ratio values point out the presence of particles which strongly attenuate the incoming solar radiation by scattering and absorption (Wandinger et al., 2023). The high extinction values close to the ground indicate strong pollution and explain the unusually high daily mean AOD of 1.1, 0.9 and 0.5, which was measured with the sun photometer at 340, 500 and 1020 nm. The lidar-derived total AOD between 04:38 and 05:57 UTC was 0.96 ± 0.28, 0.79 ± 0.26 and 0.57 ± 0.17 at 355, 532 and 1064 nm, respectively, and, thus, in agreement with the values of the sun photometer measured during daytime. The AOD for the boundary layer only (including the sulfate and marine contribution), as derived from the lidar measurements, was 0.58 ± 0.03, 0.43 ± 0.02 and 0.18 ± 0.01 at 355, 532 and 1064 nm and, thus, covered 54 %–60 % of the total lidar-derived AOD in the case of 355 and 532 nm and 32 % in the case of 1064 nm. Furthermore, visibility was strongly reduced on that day. Based on the maximum particle extinction coefficient at 532 nm and using the Koschmieder equation (Koschmieder, 1924), we calculated the visibility to be around 6 km. The presence of relatively small particles is indicated by the moderate wavelength dependence represented by the backscatter-related Ångström exponent between 532 and 1064 nm (RR), which was 0.54 ± 0.31, and the mean extinction-related Ångström exponent of only 0.68 ± 0.07. The low values of the particle linear depolarization ratio ≤ 0.9 % indicate that the observed particles were spherical.
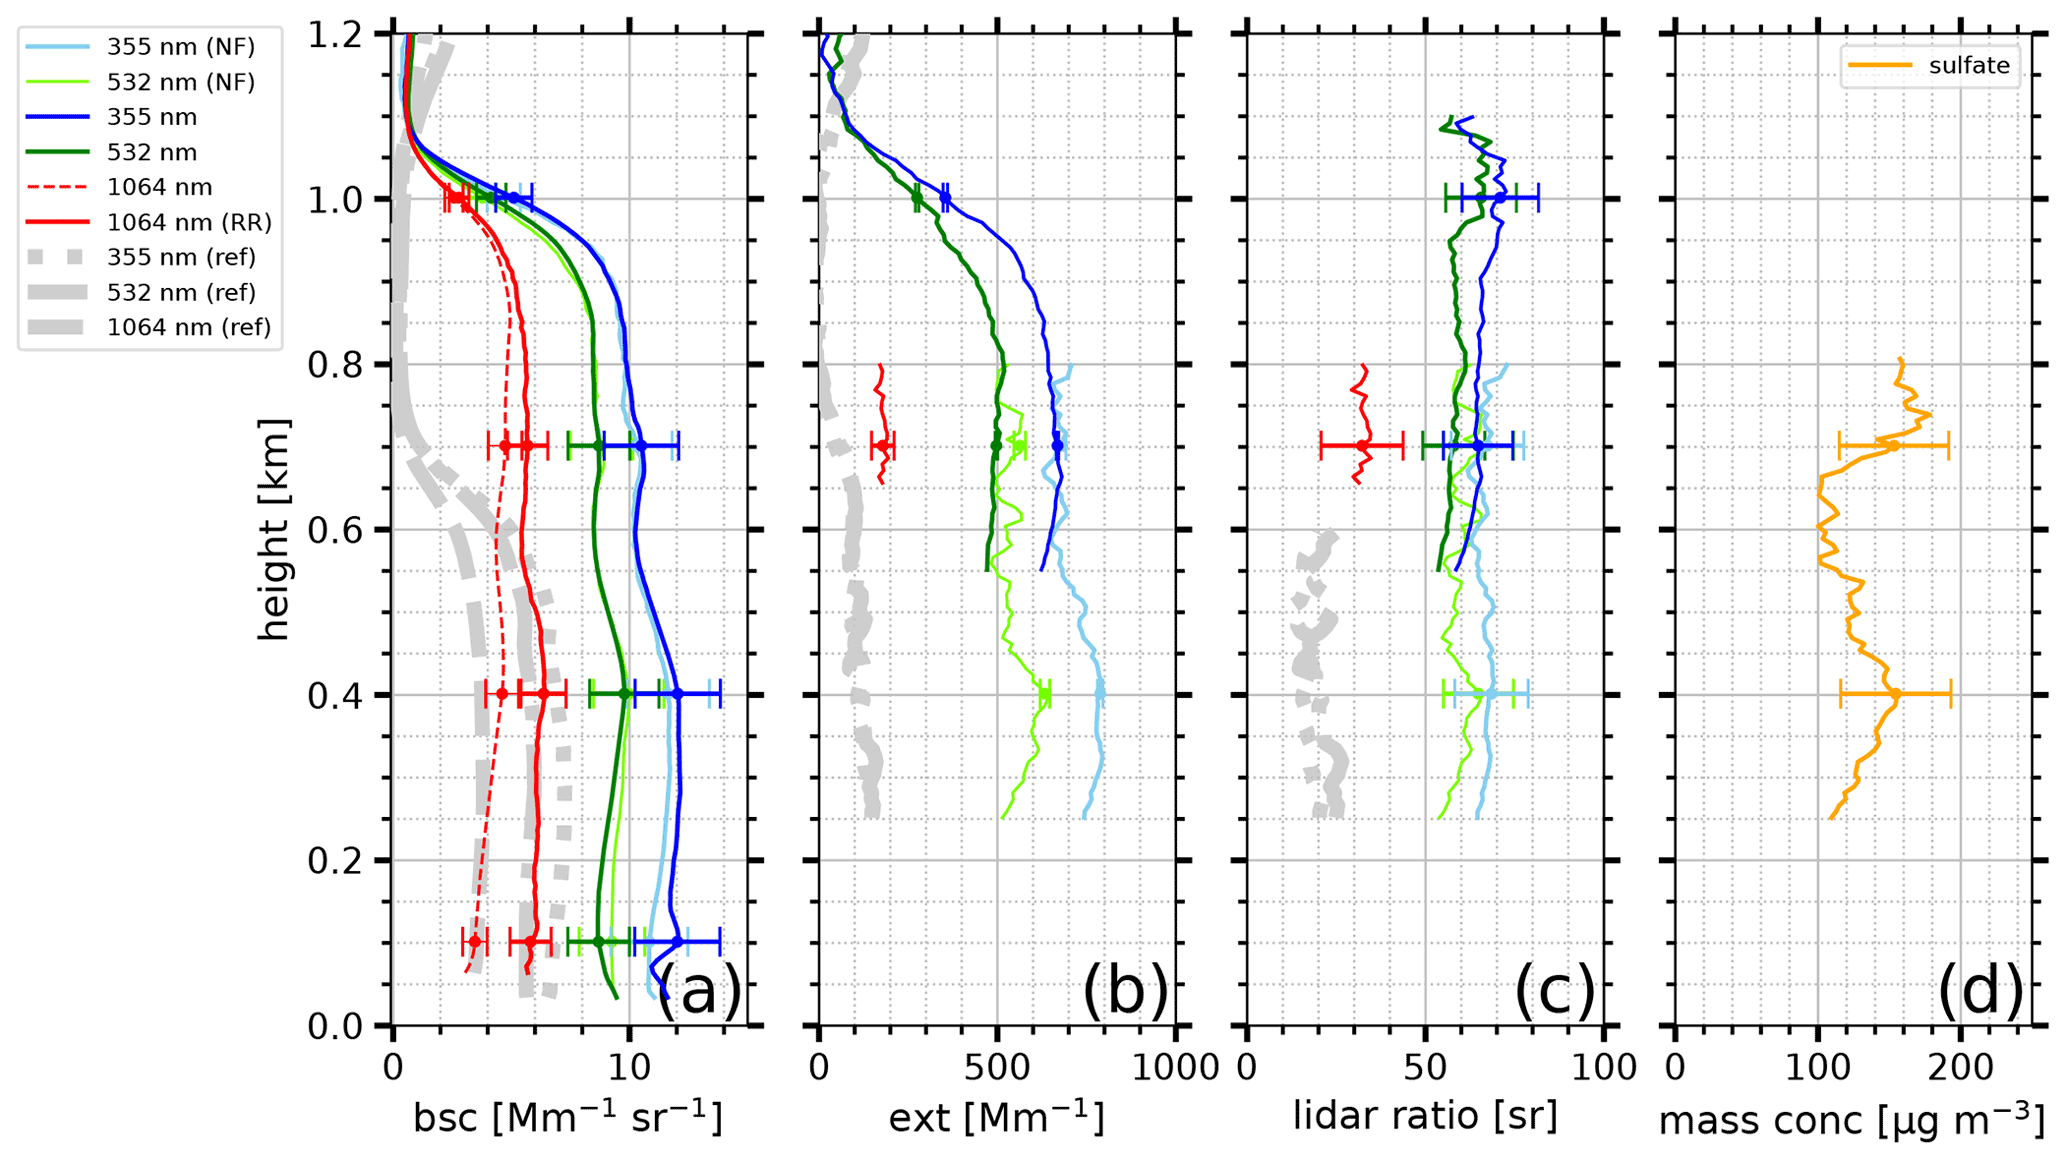
Figure 5(a–c) Same profiles as in Fig. 4a–c, but only up to a height of 1.2 km. Vertical smoothing: (a) 67.5 m and (b, c) 187.5 m at 355 and 532 nm, as well as 742.5 m at 1064 nm. Near- and far-field measurements are shown separately. Panel (d) shows sulfate mass concentration with a height constant relative error of 25 %.
In summary, both days – 16 September 2021 (before the start of the eruption at La Palma) and 24 September 2021 (during the volcanic eruption episode) – had a similar aerosol layering structure with a PBL ≤ 1 km and a lofted layer of Saharan dust up to 6 km, typical for that time of the year at Cabo Verde. Both measurements were taken under similar meteorological conditions and are thus well suited to assess the influence of the volcanic activity.
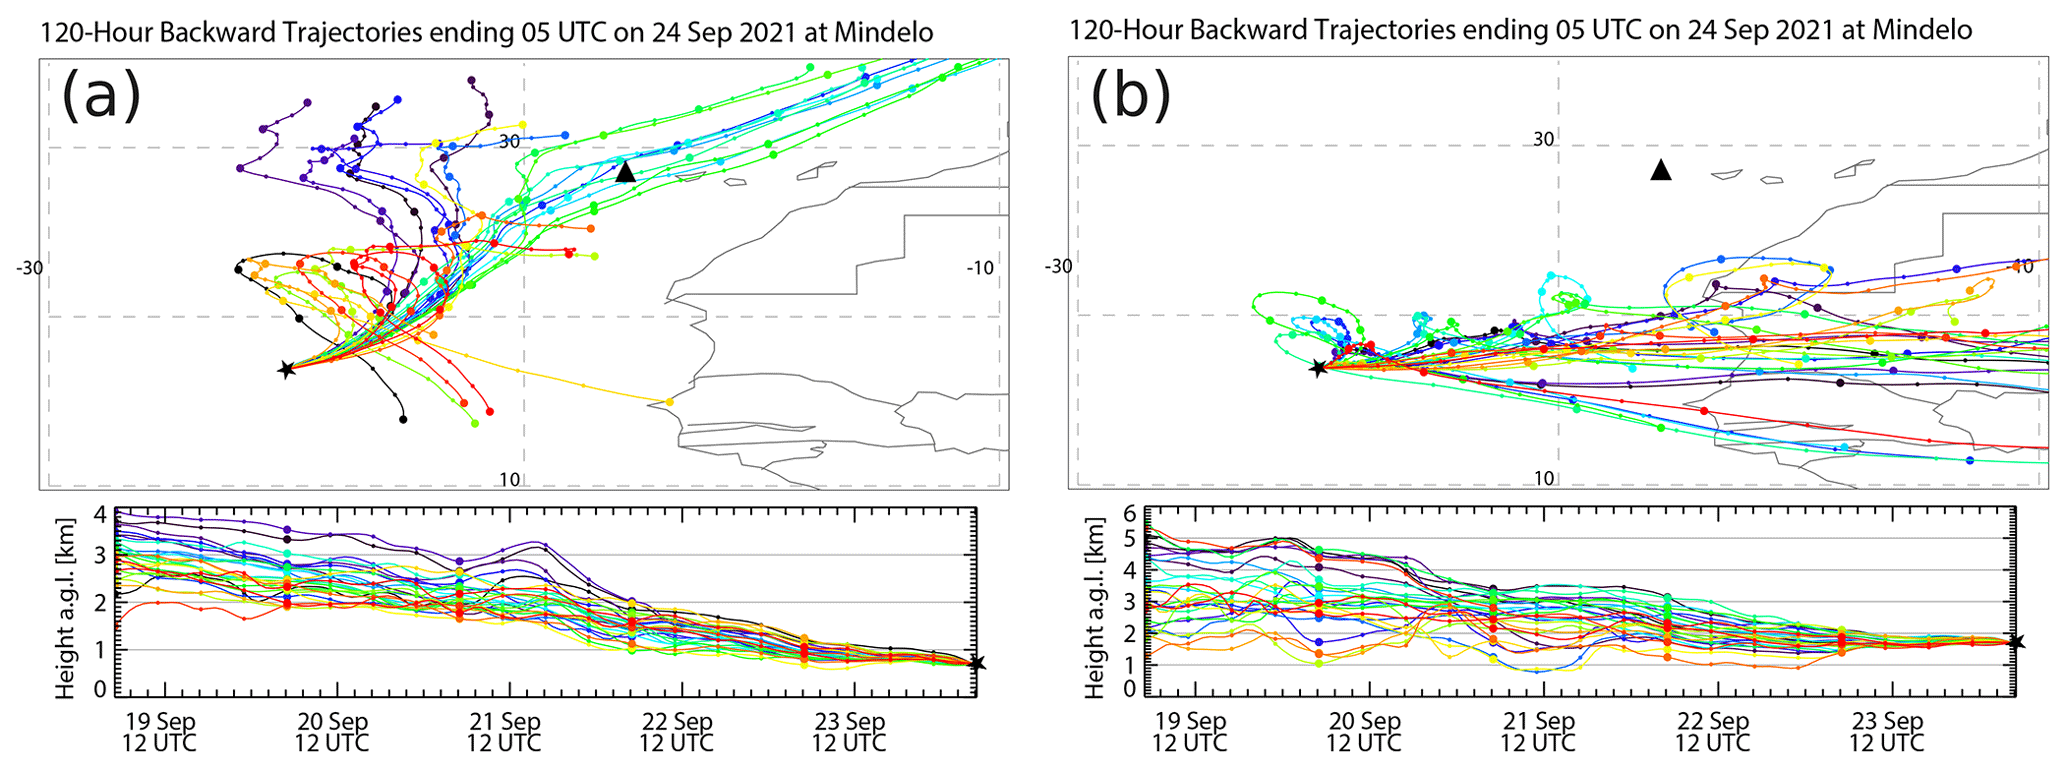
Figure 6HYSPLIT ensemble trajectories for 120 h back in time are shown. Backward trajectories of air masses arriving at Mindelo (black star) on 24 September 2021 at 05:00 UTC at (a) 0.7 km and (b) 1.7 km were computed. In the lower altitude, they mainly originated from La Palma (black triangle), whereas in the higher altitude, they were advected from the Sahara.
Although for the lofted layer, the lidar-derived aerosol optical properties slightly vary concerning the extent and intensity between 16 and 24 September 2021 with a lower layer top height, a lower particle linear depolarization ratio and a higher lidar ratio on 24 September, we can conclude that on both days the predominant aerosol type in the lofted layer was Saharan dust. Obviously, no volcanic ash was included in this layer on 24 September because in that case we would have observed much higher values of the particle linear depolarization ratio (Groß et al., 2012). The higher lidar ratio observed on 24 September, however, indicates the presence of stronger absorbing particles slightly contaminating the Saharan air layer (SAL). Considering the particle linear depolarization ratio and the lidar ratio together, contamination with continental pollution or smoke is feasible. To corroborate the origin of the lofted aerosol layer on this day, 120 h HYSPLIT ensemble backward trajectories are shown in Fig. 6. Simulations of air mass arrival at Mindelo on 24 September at 05:00 UTC at 0.7 km (Fig. 6a) and at 1.7 km (Fig. 6b) have been calculated. The trajectories for the higher altitude (Fig. 6b) show that the lofted layer was influenced by an easterly flow so that air masses were advected directly from the Sahara, which makes the occurrence and predominance of Saharan dust evident. However, partial mixing with sulfate during the transport over the Atlantic Ocean cannot be ruled out, and neither can smoke and pollution contamination over the African continent. Fire spot analysis with the Fire Information for Resource Management System (FIRMS, 2024; Fig. B1) revealed only little fire activity along the transport path within the 120 h. Fires were detected at the eastern border of Algeria and close to the Mediterranean. Thus, smoke contamination may have led to the slight contamination of the SAL. However, we consider the presence of volcanic ash based on this analysis and the eruption mechanisms at Cumbre Vieja to be unlikely.
In contrast, the aerosol conditions in the PBL strongly differed between the two analyzed measurement periods. While on 16 September a clean marine PBL was present, strong pollution was observed on 24 September with layer mean values of the particle extinction coefficient up to almost 800 Mm−1 compared with ≤ 130 Mm−1 during the clean marine conditions. The lidar ratio on that day was strongly enhanced with values around 60 sr compared with values of around 20 sr for pure marine conditions. The aerosol load in the PBL was furthermore responsible for 54 %–60 % at 355 and 532 nm and for 32 % at 1064 nm of the total AOD in the analyzed time period. In contrast, for 16 September, the contribution of the AOD in the PBL to the total AOD was only 12 % (at 355 and 532 nm); i.e., more than 80 % of the total AOD was caused by the SAL. The observed pollution is associated with air masses coming from La Palma containing volcanic aerosol, which is supported by the HYSPLIT backward trajectories depicted in Fig. 6a. They illustrate a distinct advection of air masses from the Canary Islands and, thus, from the volcano on La Palma. Additionally, TRACE backward simulations (Fig. C1) confirm these findings as they show air masses accumulating over the Atlantic Ocean on 18 September before they pass from the northwest over La Palma on 21 September and move further to Mindelo on 23 September. TRACE backward simulations were also performed for air parcels arriving at Mindelo on 16 September 2021 at 00:00 UTC, as shown in Fig. C2. The pathway of the air parcels was similar to the one from 24 September (Fig. C1). However, while on 16 September they also partly crossed the African continent, they passed only over the Atlantic Ocean and the Canary Islands on 24 September. This finding emphasizes the impact of the volcanic eruption on the pollution observed in the PBL at Mindelo even more. As the corresponding particle linear depolarization ratio is low, the presence of ash particles can be excluded.
Instead, volcanic sulfate seemed to be the dominating aerosol type in the PBL. It becomes more evident if the large amount of sulfur dioxide released by the volcano is taken into account. The SO2 emissions were greatest at the beginning of the active period, reaching a maximum of 125 kt on 23 September 2021 (Milford et al., 2023). SO2 was advected towards Mindelo as can be seen in the satellite measurements of TROPOMI on board Sentinel-5P (Fig. 7), showing the amount of SO2 around the Cabo Verde region during the afternoon of 23 September 2021. The presence of SO2 offered the possibility for secondary aerosol formation to sulfate particles, which is assumed to be the source of the observed particles. SO2 quickly oxidates to sulfate aerosol with a high efficiency at warm temperatures and high relative humidity (Eatough et al., 1994; Yang et al., 2018). Favorable conditions seemed to be prevalent since the air masses were transported only over the Atlantic Ocean in a tropical region. According to Pattantyus et al. (2018), conversion rates are large (3 % s−1–50 % s−1), especially in cloudy air, which is given due to the frequently occurring small clouds in the PBL as observed over the Cabo Verde region.
In addition, not only SO2 could have been advected from La Palma but also sulfate particles themselves. Filonchyk et al. (2022) determined, based on the single-scattering albedo and the dissection of the AOD into a coarse- and fine-mode component, that on 24 September 2021 coarse-mode particles were almost absent at La Palma. Instead, the presence of non-absorbing fine-mode particles attributed to sulfate aerosol was reported. These particles could have been formed locally or were emitted directly by the volcano. As these observations are valid for the time period of our case study, it strengthens our hypothesis that we measured volcanic sulfate at Mindelo originating from Cumbre Vieja.
The presence of sulfate aerosol from the volcanic eruption at La Palma also becomes evident since the measured aerosol optical properties are in agreement with previous lidar observations of volcanic sulfate (e.g., Pappalardo et al., 2004; Mona et al., 2012; Navas-Guzmán et al., 2013). Furthermore, in our study, it was the first time ever that tropospheric volcanic sulfate was measured with a Raman lidar at 1064 nm. During the eruption of Eyjafjallajökull in 2010, Navas-Guzmán et al. (2013) observed lofted aerosol layers between 1.5 and 3.5 km consisting of 82 % of fine-mode aerosol particles, i.e., sulfate particles, over Granada, Spain. The corresponding values of the lidar ratio were 55 and 75 sr (355 and 532 nm). Mona et al. (2012) recorded values of the lidar ratio up to 80 sr for volcanic sulfate from Eyjafjallajökull mixed with continental aerosol in the PBL over Potenza, Italy, while during the eruption of Mt. Etna in 2002 a lidar ratio of 55 ± 4 sr (355 nm) was measured in a lofted aerosol layer of young sulfate particles mixed with a low amount of soot between 4 and 4.5 km over Potenza (Pappalardo et al., 2004). With 66.9 ± 10.1 and 60.2 ± 9.2 sr (355 and 532 nm), the observations over Mindelo on 24 September fit well into the range of values of the lidar ratio observed during these previous eruptions. The observed wavelength dependence with a decrease in the lidar ratio by 48 % from 532 towards 1064 nm confirms the assumptions in the CALIPSO aerosol characterization, which uses a lidar ratio of 50 sr at 532 nm and of 30 sr at 1064 nm for sulfate (Kim et al., 2018; Tackett et al., 2023). The particle linear depolarization ratio measured on 24 September 2021 was ≤ 0.9 %, i.e., even smaller than the values observed for sulfate from Eyjafjallajökull, which were 4 %–5 % (Navas-Guzmán et al., 2013), and thus more clearly indicates the presence of spherical (sulfate) particles. For the volcanic sulfate from Eyjafjallajökull, the backscatter-related Ångström exponent measured over Granada was 1.1 ± 0.2 for the wavelength pair 355/532 nm and 2.1 ± 0.1 for 532/1064 nm. During the measurement period, the values decreased to 0.7 ± 0.1 and 1.7 ± 0.3, respectively. Navas-Guzmán et al. (2013) stated that the temporal evolution in the Ångström exponent arose from an increasing particle size in the accumulation mode driven by hygroscopic growth and a potential change in the chemical composition rather than an increasing contribution of coarse-mode particles. In a second layer of volcanic sulfate, values of 1.7 ± 0.1 (355/532 nm) and 1.4 ± 0.2 (532/1064 nm) were observed by Navas-Guzmán et al. (2013), also decreasing significantly during the measurement period. Compared with these studies, the backscatter-related Ångström exponent measured over Mindelo on 24 September 2021 was smaller, having values of only 0.42 ± 0.52 and 0.54 ± 0.31 (355/532 nm and 532/1064 nm). These low values can be explained by hygroscopic growth of the sulfate particles since they were exposed to high humidity during their transport over the Atlantic Ocean before they reached Mindelo. Furthermore, we expect that some marine particles were present in the PBL above Mindelo, particles which are also spherical at high relative humidity (accounting for the low depolarization ratio). As marine particles are larger than sulfate particles, they reduced the backscatter-related Ångström exponent in contrast to the aforementioned observations, in which air masses were influenced by the European continent. The extinction-related Ångström exponent between 355 and 532 nm observed over Mindelo was 0.68 ± 0.07 and, thus, closer to the previous observations at Granada where values of 0.7 ± 0.1 and 0.8 ± 0.1 were observed.
As a further step, an attempt to estimate the mass concentration of the observed sulfate aerosol was done according to the method used in Ansmann et al. (2011b). A sulfate conversion factor of was obtained, leading to the vertical profile of the sulfate mass concentration, which is shown in Fig. 5d, and a layer mean value of about 133.1 ± 20.3 µg m−3 for the PBL. Such a high sulfate concentration indicates extremely polluted conditions. For comparison, the aerosol pollution level should not exceed 50 µg m−3 in European cities to avoid unhealthy situations. For our estimation, the error of the sulfate mass concentration is assumed to be similar to that of the dust mass concentration, which is about 20 %–30 % (Ansmann et al., 2019). Thus, for our estimation, we used a height constant relative error of 25 %.
In this paper, it is the first time ever that we can report the optical properties for a volcanic plume mixed in the marine PBL at all three (aerosol lidar) wavelengths by extending the observational capabilities towards 1064 nm. While the lidar ratios at 355 and 532 nm are in agreement with previous observations, the lidar ratio at 1064 nm of 30.8 ± 8.7 sr and the extinction-related Ångström exponent of 1.53 ± 0.26 between 532 and 1064 nm have not been reported so far. Thus, it is a milestone for the characterization of volcanic sulfate with remote sensing techniques.
In the framework of ESA's JATAC campaign to validate the Aeolus satellite, the multiwavelength-Raman-polarization lidar PollyXT was installed at Mindelo, Cabo Verde, in June 2021 together with additional instruments, e.g., an AERONET sun photometer. During the intensive observation period of the campaign in September 2021, a volcanic eruption at the Cumbre Vieja ridge at La Palma, Canary Islands, took place, starting on 19 September 2021. Volcanic activity was recorded until 13 December 2021. Due to the location of Mindelo in the trade wind zone, the preferred wind direction is northeast, i.e., from the Canary Islands. Thus, advected air masses contaminated with volcanic aerosol were observed within the local PBL, while the SAL above seemed little affected. The occurrence of volcanic aerosol at Mindelo was indicated by an increase in the columnar Ångström exponent and the AOD as measured by the sun photometer after 22 September 2021. Volcanic aerosol was furthermore observed with the PollyXT lidar, which is shown in a case study of 24 September 2021. On that day, pronounced pollution was seen over Cabo Verde, strongly contrasting the conditions observed before the start of the eruption. The intense pollution caused an unusually high AOD of around 1.0 at wavelengths ≤ 500 nm (AERONET daily mean). For a more detailed view, the vertically resolved optical properties derived from the lidar were analyzed. They were compared with the lidar measurements from 16 September, which was before the start of the eruption and represents the typical aerosol conditions over Cabo Verde at that time of the year.
The lidar measurements for both days showed the presence of two distinct aerosol layers: the PBL and a lofted layer of Saharan dust. For 24 September, HYSPLIT trajectory calculations and TRACE simulations indicated a distinct advection of air masses from La Palma in the PBL. Air masses of the lofted layer originated from the Sahara. With the lidar, strong pollution in the PBL was revealed. It led to an unusually high particle extinction coefficient of 721 ± 51, 549 ± 38 and 178 ± 13 Mm−1, as well as an enhanced lidar ratio of 66.9 ± 10.1, 60.2 ± 9.2 and 30.8 ± 8.7 sr (mean values at 355, 532 and 1064 nm) in contrast to ≤ 130 Mm−1 and ≤ 23.8 sr within the clean marine PBL on 16 September. Thus, on 24 September, the attenuation in the PBL was increased by a factor of 3–4 compared with the background conditions. The visibility significantly decreased during these days, down to 6 km. According to the measured particle extinction coefficient profiles, the AOD for the PBL was 0.58 ± 0.03, 0.43 ± 0.02 and 0.18 ± 0.01 at 355, 532 and 1064 nm, respectively. It accounts for 54 %–60 % of the total AOD in the case of 355 and 532 nm and for 32 % at 1064 nm. Compared with the AOD in the PBL of 0.08 (355 and 532 nm) during the clean marine PBL on 16 September 2021, we can conclude that the pollution on 24 September accounted for 81 %–86 % of the AOD in the PBL (AOD caused by pollution: 0.5 ± 0.04 and 0.35 ± 0.03 at 355 and 532 nm, respectively); i.e., only 14 %–19 % of the AOD in the PBL was caused by marine aerosol. Since the particle linear depolarization ratio in the PBL was close to 0 %, the presence of volcanic ash could be excluded. Instead, sulfate aerosol due to the volcanic eruption at La Palma seemed to be the dominating particle type in the low altitudes. This finding was furthermore supported by satellite measurements of Sentinel-5P, showing an advection of SO2 towards Mindelo on 23 September, which was transformed to sulfate aerosol reaching Mindelo the day after.
In contrast, no indication for pure volcanic aerosol in the lofted layer could be found. The lidar ratios of 64.8 ± 10.2, 50.9 ± 8.3 and 61.8 ± 8.6 sr (mean values at 355, 532 and 1064 nm) were slightly higher compared with 58.4 ± 8.8 and 47.3 ± 7.2 sr (355 and 532 nm) on 16 September 2021. The particle linear depolarization ratios of 20.8 ± 2.0 %, 25.0 ± 1.0 % and 20.6 ± 1.0 % were lower than 24.5 ± 2.0 %, 28.1 ± 1.0 % and 24.1 ± 1.0 % (355, 532 and 1064 nm) observed on 16 September. However, Saharan dust as the major contributor can still be identified within this layer (SAL) but was probably slightly contaminated with smoke, pollution and/or sulfate.
While observations of Saharan dust have already been captured during several campaigns (e.g., SAMUM; Ansmann et al., 2011a; Tesche et al., 2011), it was the first time that the optical properties of volcanic aerosol were observed at Cabo Verde with a multiwavelength-Raman-polarization lidar. Lidar observations of volcanic ash exist for distinct eruptions like Eyjafjallajökull (Ansmann et al., 2010; Groß et al., 2012), but lidar measurements of tropospheric volcanic sulfate aerosol are still very rare. Thus, it is important to expand the knowledge about the aerosol optical properties of volcanic sulfate, which was one aim of our study. As the observations were made in a typically clean marine PBL, the influence of mixing with other aerosol types is usually low. Besides this point, we show in our study that long-range-transported volcanic aerosol can affect air quality, indicated by local sulfate mass concentrations of more than 100 µg m−3, and may thus have an impact on human health, even more than 1000 km away from the emission source. One additional benefit of this study is the first ever availability of measurements of the particle extinction coefficient and the lidar ratio at 1064 nm for volcanic sulfate. Having measurements at all three wavelengths is a major advantage with regard to lidar-based aerosol characterization and enlarges our data sets. The findings of this study can in turn be used to further improve the aerosol typing by multiwavelength-Raman-polarization lidars, as well as spaceborne lidar missions, such as NASA's CALIPSO or ESA's Aeolus and EarthCARE, or assist in the development of new aerosol typing schemes. Besides this point, our findings will be helpful for studying the radiative effects of tropospheric volcanic aerosol, which is still not properly quantified and modeled. As the focus of the campaign at Cabo Verde was on the Aeolus validation, there is also the possibility for further research on the potential of Aeolus to capture the volcanic plume on its way to Cabo Verde, research which is planned for future studies. Furthermore, a long-term study of the influence of the eruption of Cumbre Vieja on the atmosphere over Cabo Verde based on the ground-based lidar measurements at Mindelo is foreseen but first needs a more robust cloud screening in the automatically derived lidar products. Finally, the observation of this event highlights the necessity for ground-based lidar stations in remote areas. With respect to that, a permanent aerosol and cloud remote sensing station within the framework of ACTRIS has been set up in Mindelo.
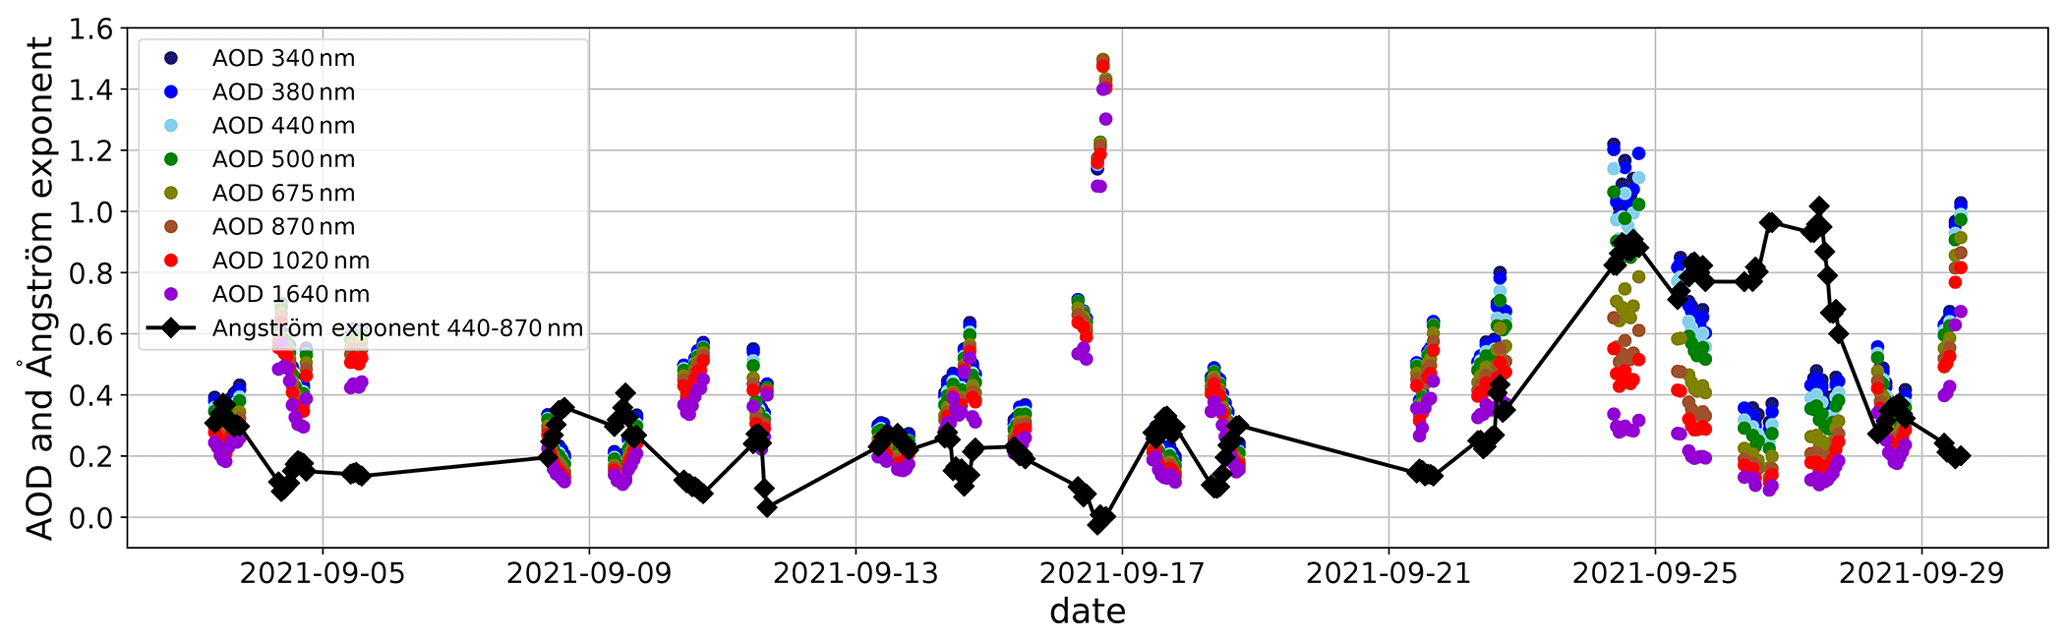
Figure A1Same as Fig. 1 but including the measurement of 16 September 2021, which was contaminated by a cirrus cloud.
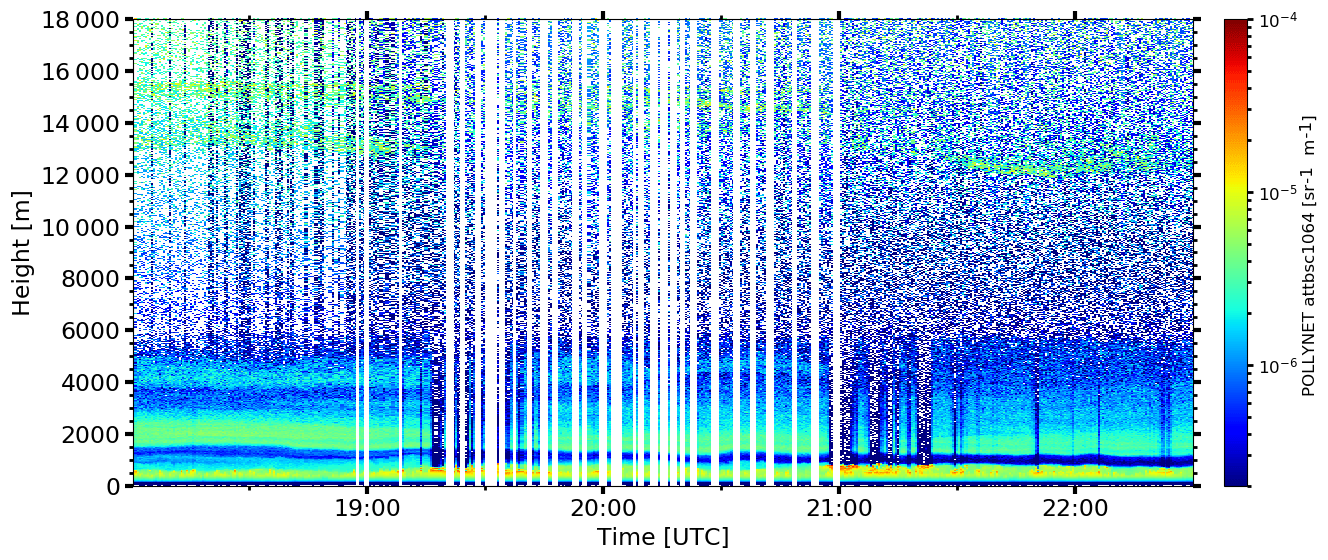
Figure A2Temporal evolution of the calibrated attenuated backscatter coefficient at 1064 nm measured by PollyXT at Mindelo, Cabo Verde, during 16 September 2021 from 18:00–22:30 UTC. The cirrus cloud, which was not correctly screened out by the AERONET algorithm, was located at an altitude between 12 and 16 km.
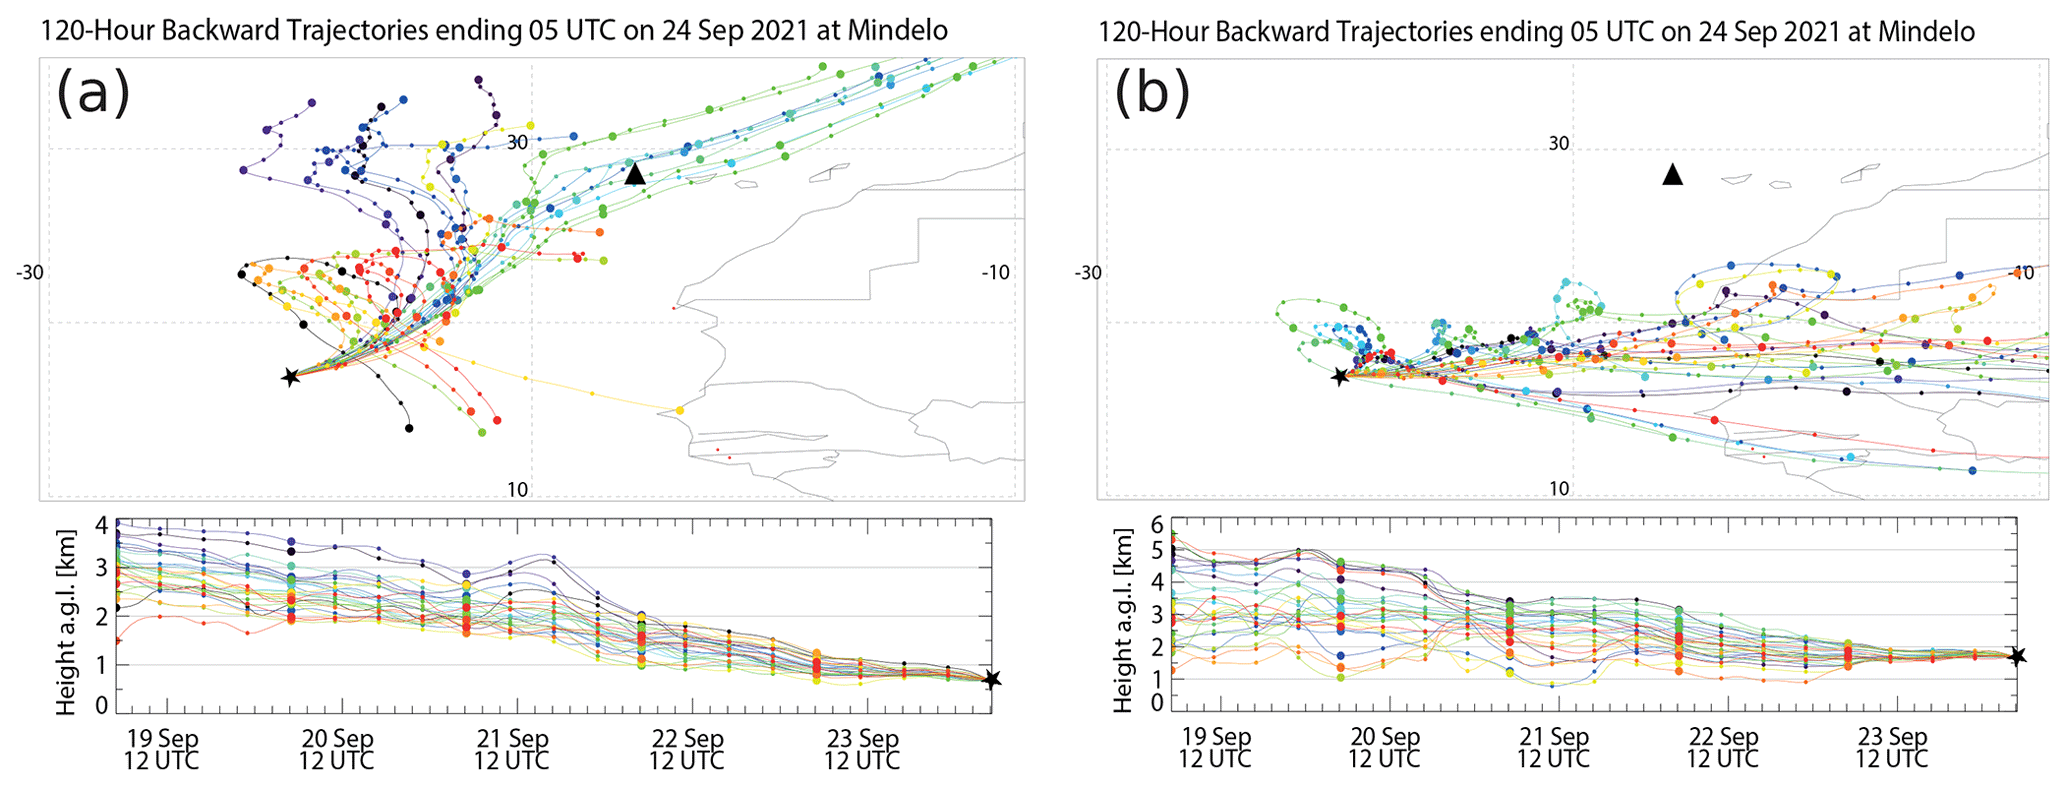
Figure B1Same as Fig. 6 but with fire spot analysis visualized as red dots (e.g., at the west coast of North Africa) from MODIS (FIRMS; https://firms.modaps.eosdis.nasa.gov; last access: 18 January 2024) between 14 and 24 September 2021.
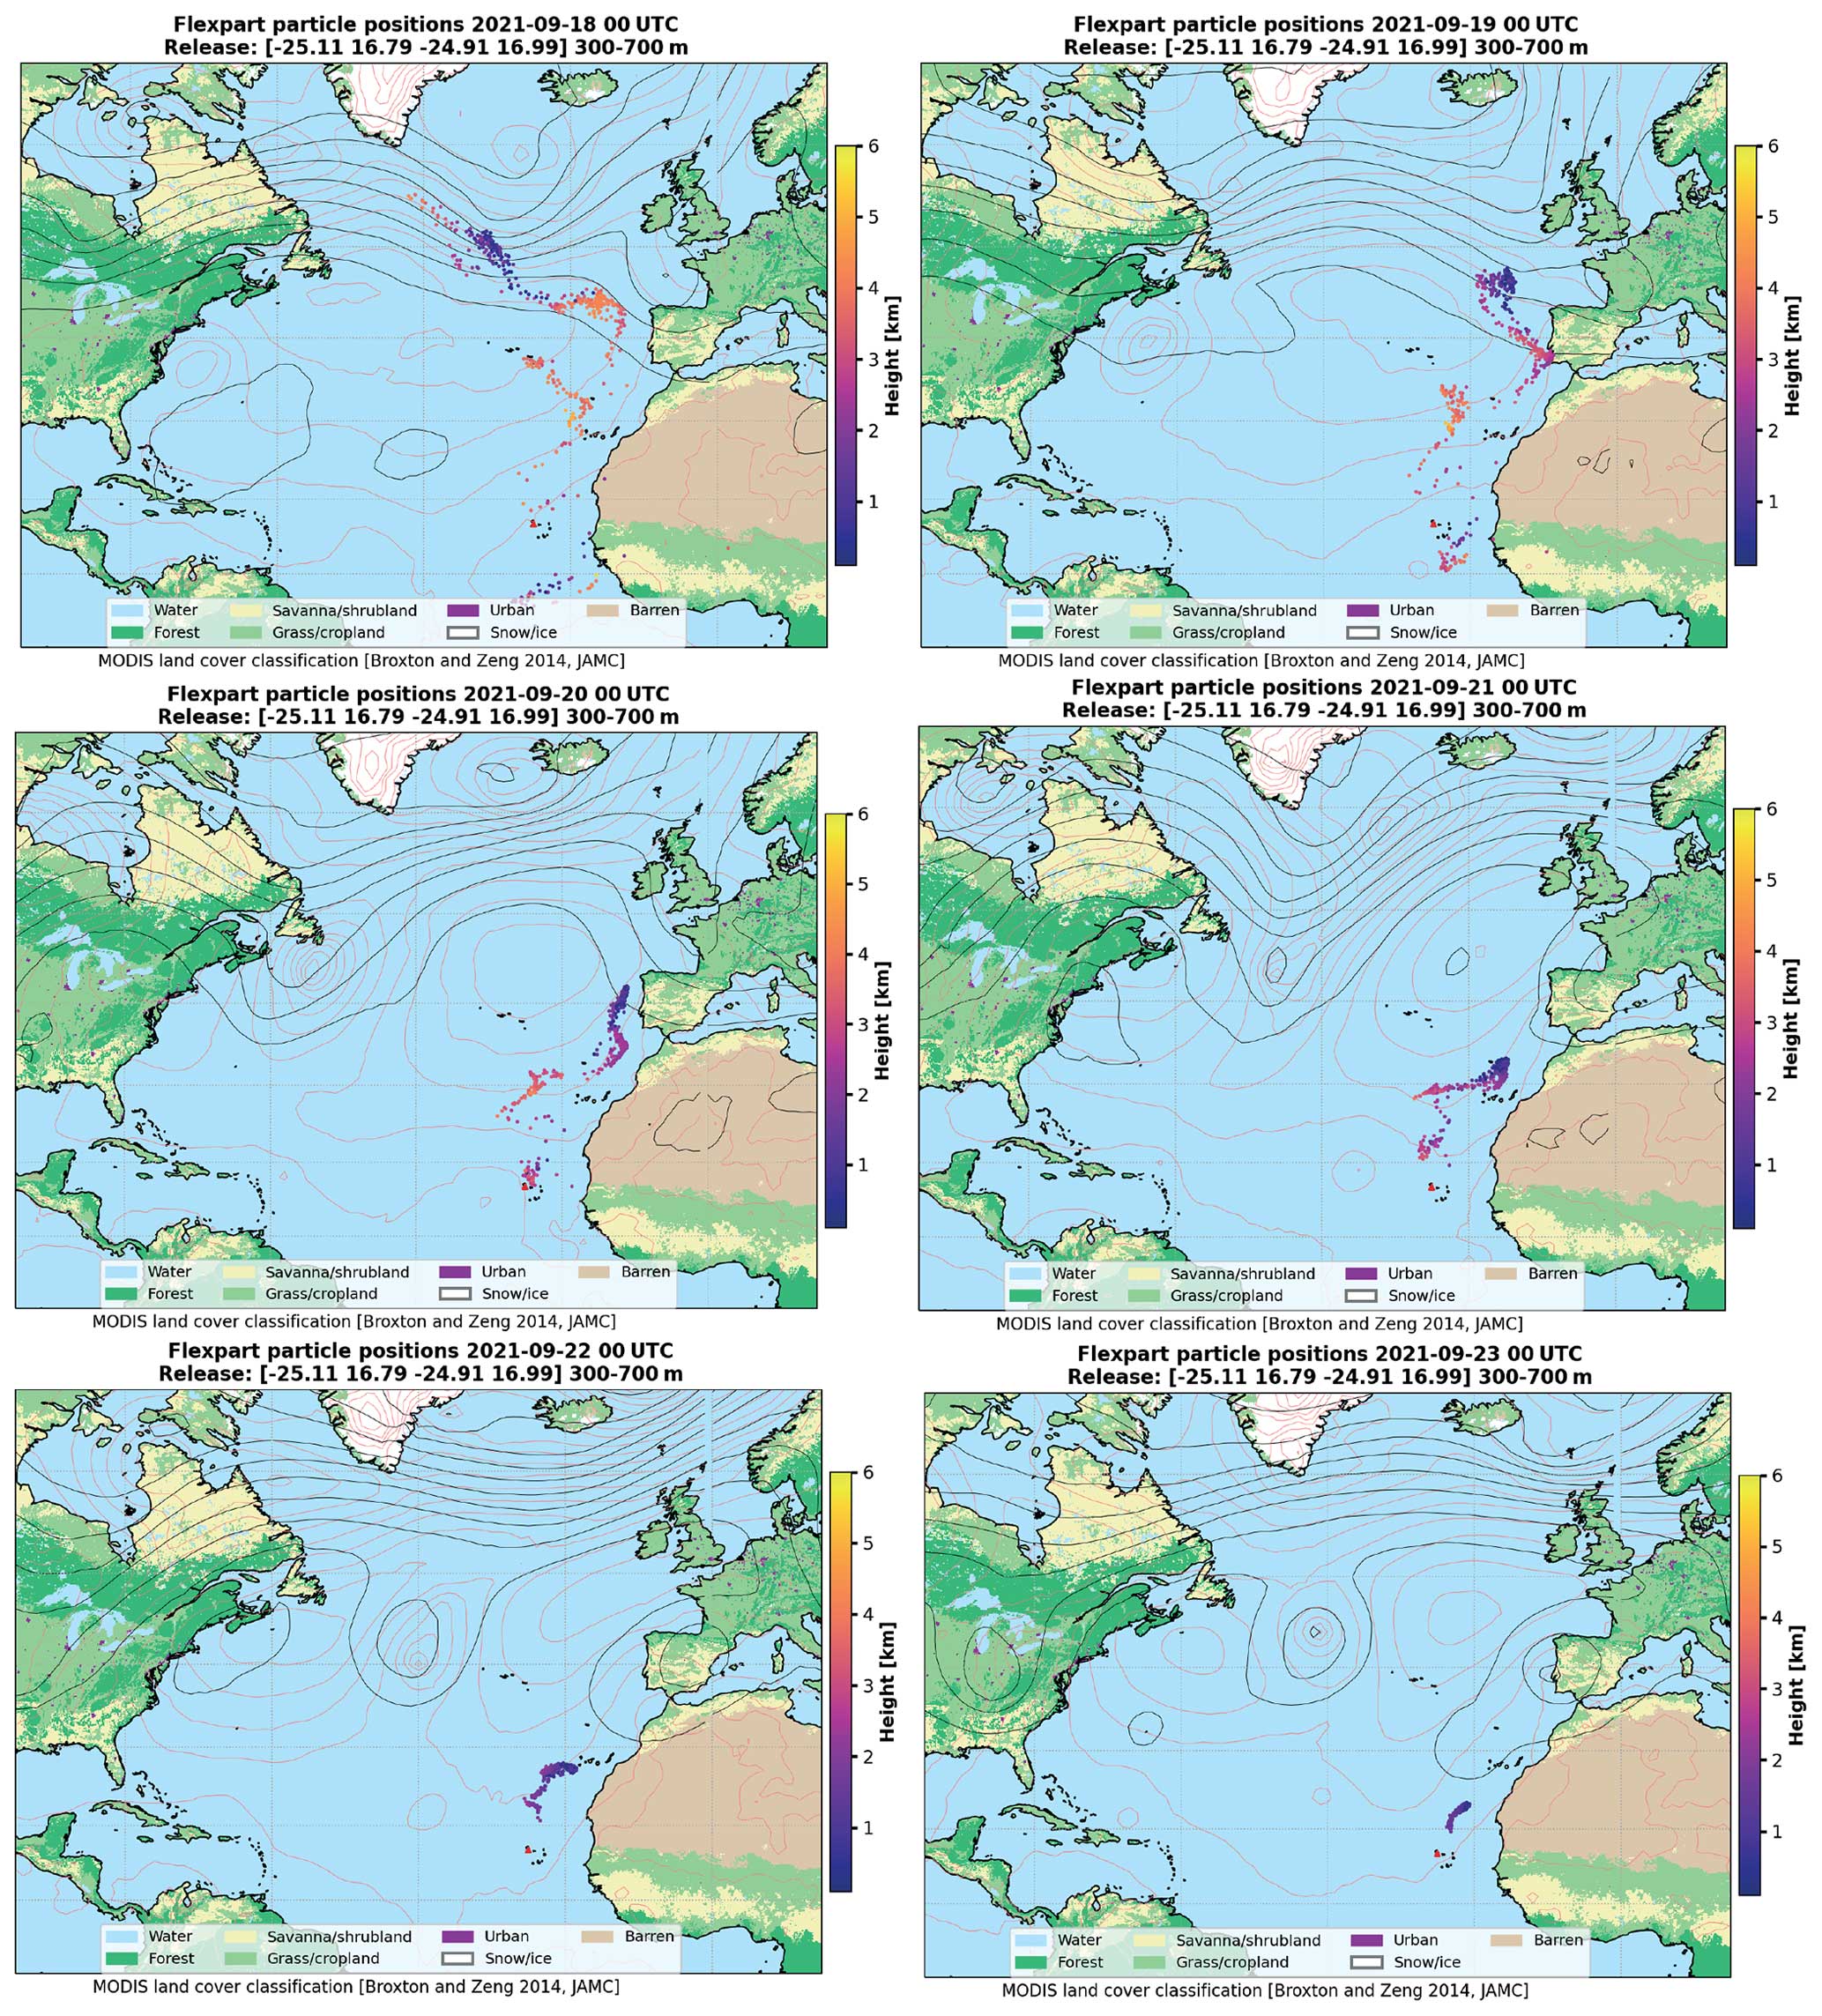
Figure C1Selected TRACE simulations show the location of single air parcels (labeled as “particle positions”) between 18 and 23 September 2021, each at 00:00 UTC, before they arrive at Mindelo (red triangle) at 500 m on 24 September 2021 at 06:00 UTC. The color of the dots indicates their height above ground. MODIS land cover classification according to Broxton et al. (2014).
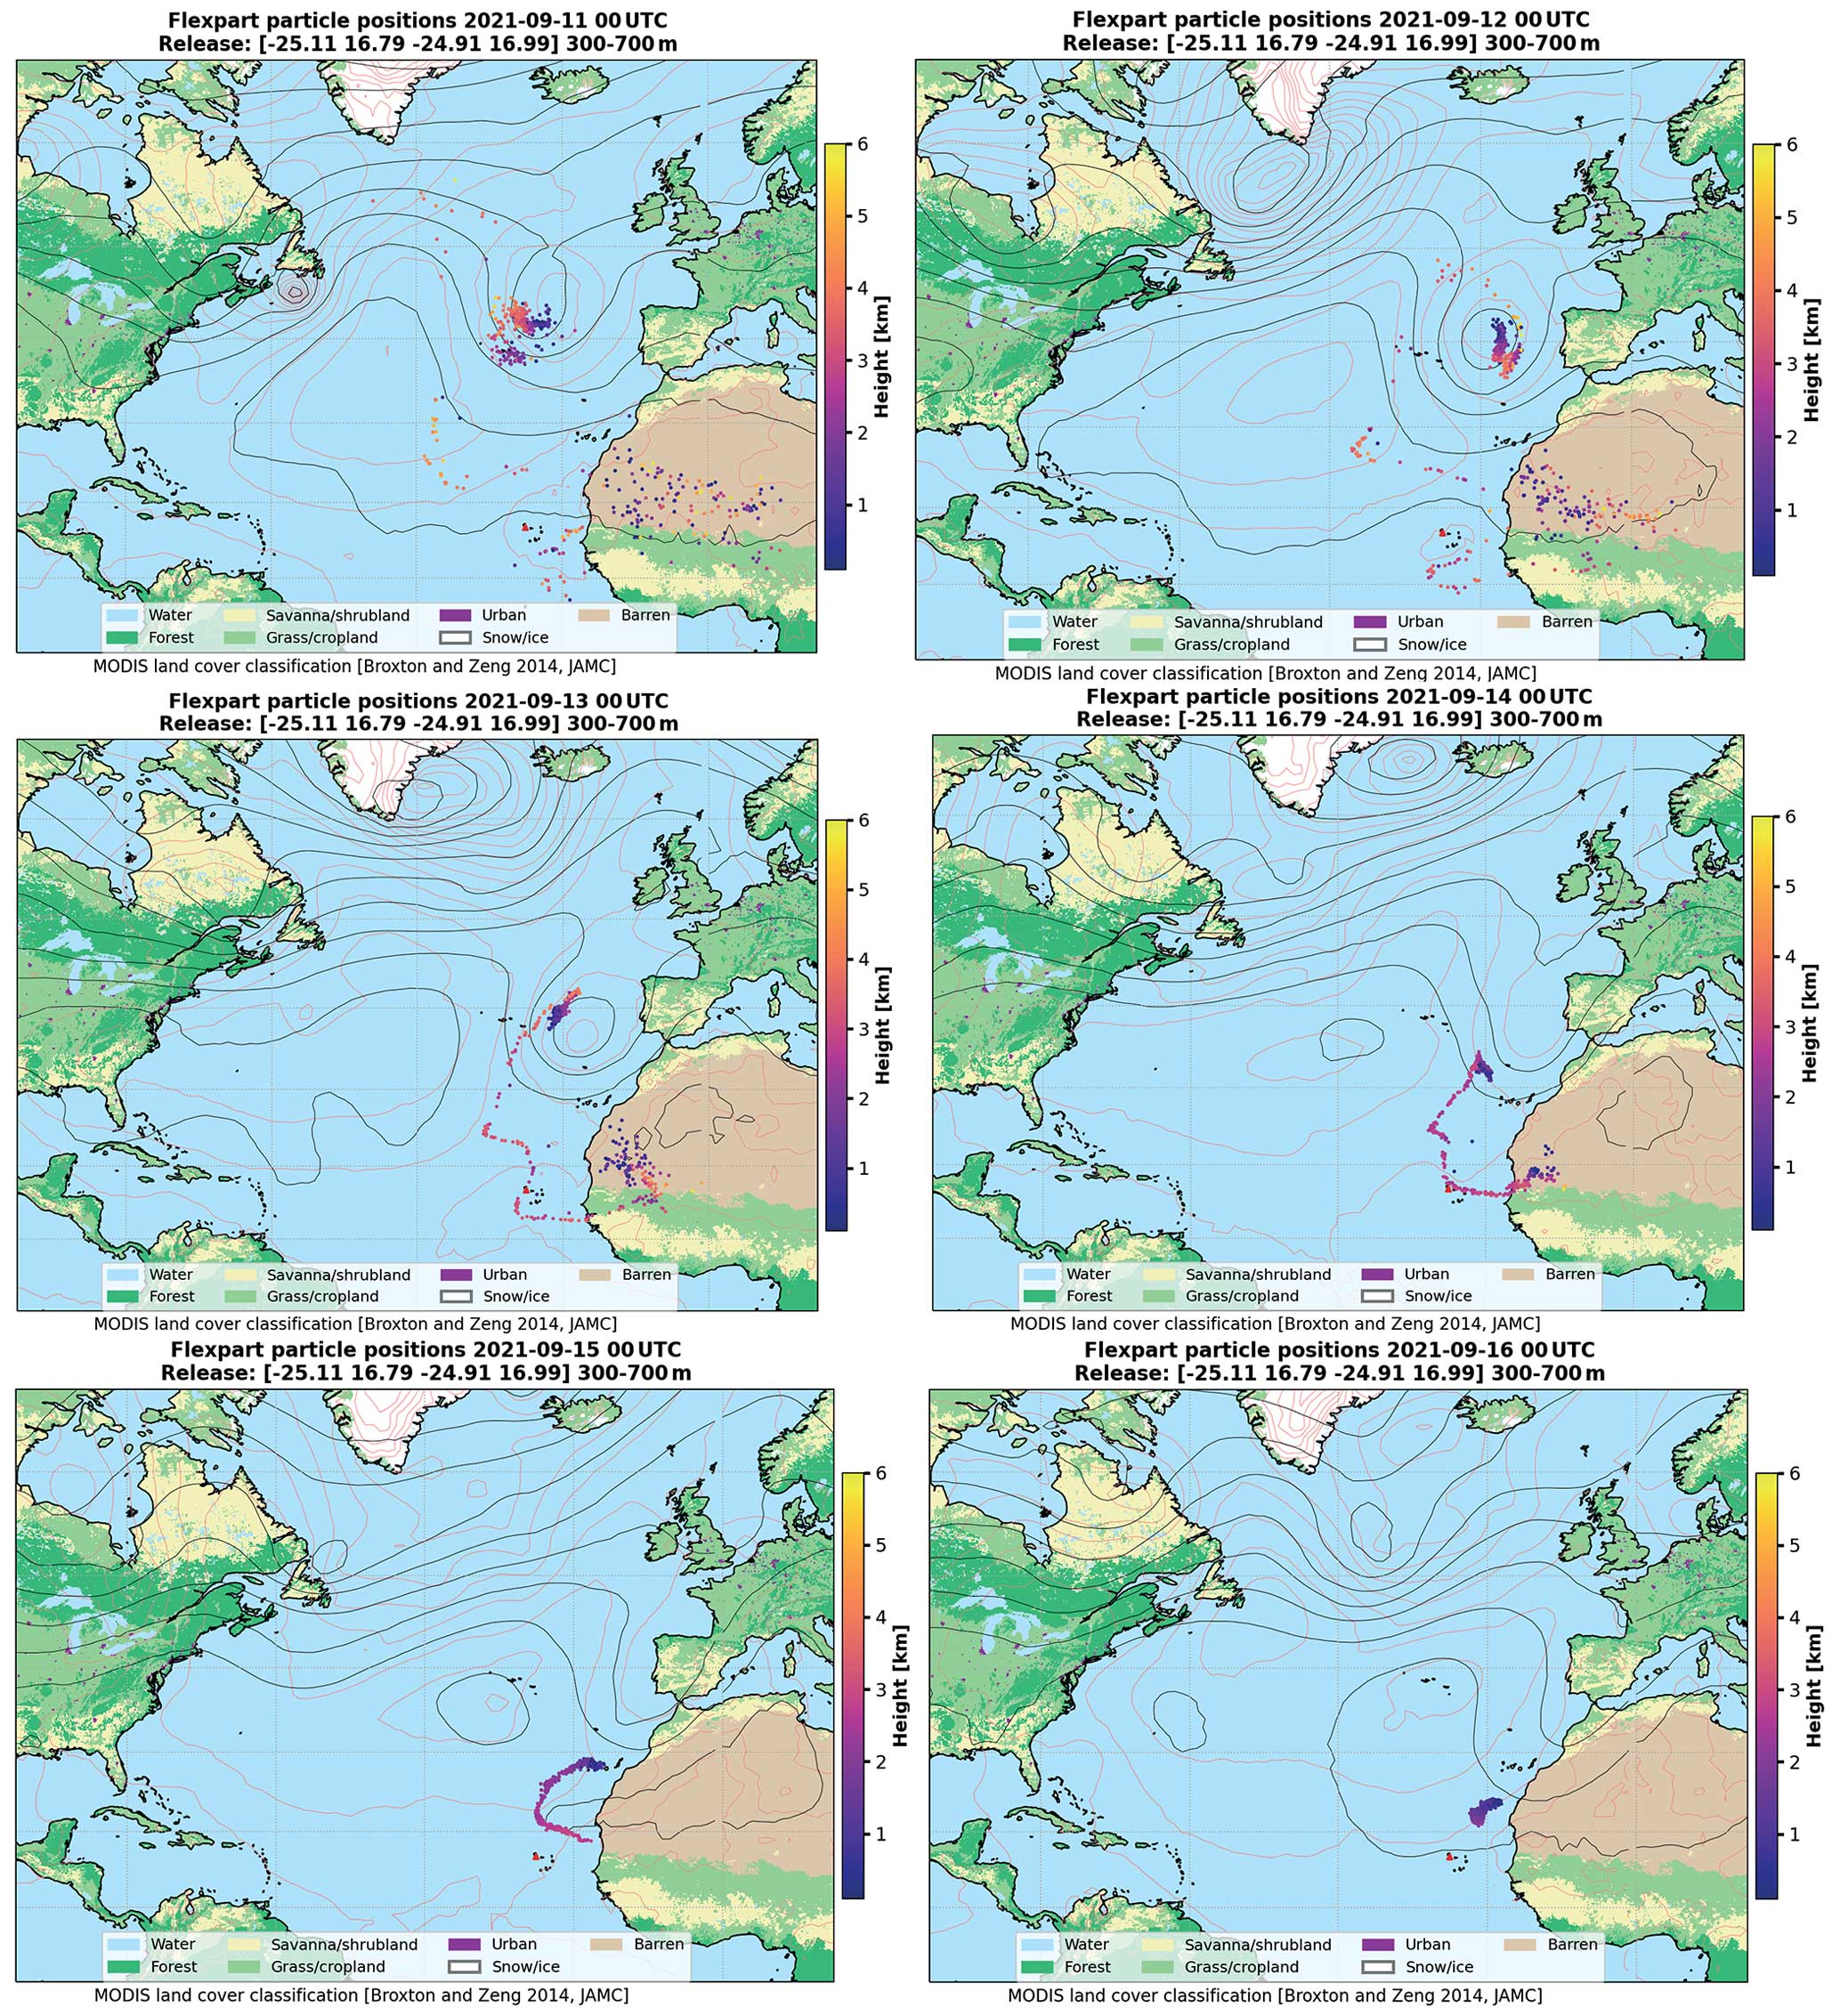
Figure C2Same as Fig. C1 but for air parcels arriving on 16 September 2021 at 00:00 UTC.
The PollyXT lidar data will be made available via ACTRIS services, but for now they are available at https://doi.org/10.5281/zenodo.10650879 (Gebauer et al., 2024). Near-real-time measurement quicklooks can be found at https://polly.tropos.de/ (PollyNET, 2024). AERONET data (station name “Mindelo_OSCM”) were downloaded from https://aeronet.gsfc.nasa.gov/cgi-bin/data_display_aod_v3?site=Mindelo_OSCM&nachal=0&year=2021&month=9&aero_water=0&level=3&if_day=0&if_err=0&place_code=10&year_or_month=0; last access: 14 February 2024; (AERONET, 2024). HYSPLIT trajectories were calculated using the online tool at https://www.ready.noaa.gov/hypub-bin/trajtype.pl?runtype=archive (NOAA, 2024a) with meteorological input data from GDAS1 (https://www.ready.noaa.gov/gdas1.php, NOAA, 2024a). The data for the FLEXPART analysis were taken from https://doi.org/10.5065/D6M043C6 (National Centers for Environmental Prediction et al., 2000). The TROPOMI SO2 plot was taken from https://so2.gsfc.nasa.gov/pix/daily/ixxxza/troploop5pca.php?yr=21&mo=09&dy=23&bn=cverde (TROPOMI, 2024).
HG conceptualized the paper together with HB and AAF. MH provided the data of the lidar extinction measurements at 1064 nm. MR performed the TRACE simulations. AA contributed his expertise on lidar data analysis and volcanic aerosol. RE, DA, HB and AS were responsible for the deployment and operation of the ground-based instruments at Mindelo. CZ coordinated the scientific activities at OSCM, Cabo Verde. All co-authors were actively involved in the extended discussions and the elaboration of the final design of the paper.
The contact author has declared that none of the authors has any competing interests.
Publisher's note: Copernicus Publications remains neutral with regard to jurisdictional claims made in the text, published maps, institutional affiliations, or any other geographical representation in this paper. While Copernicus Publications makes every effort to include appropriate place names, the final responsibility lies with the authors.
We gratefully acknowledge the team of OSCM for their support, without which it would not have been possible to perform the observations. We also thank ESA and the ASKOS/JATAC teams for the organization of the campaign and their support during the entire time.
This research has been supported by the German Federal Ministry for Economic Affairs and Energy (BMWi, grant no. 50EE1721C), the German Federal Ministry of Education and Research (BMBF) under the FONA Strategy “Research for Sustainability” (grant no. 01LK2001A), and the European Union's Horizon 2020 research and innovation program (grant nos. 739530 and 871115).
The publication of this article was funded by the Open Access Fund of the Leibniz Association.
This paper was edited by Farahnaz Khosrawi and reviewed by two anonymous referees.
ACTRIS guidelines: ACTRIS guidlines for quality assurance procedures, https://www.actris.eu/topical-centre/cars/announcements-resources/documents, last access: 31 January 2024. a, b
AERONET: Aerosol Robotic Network, https://aeronet.gsfc.nasa.gov/cgi-bin/data_display_aod_v3?site=Mindelo_OSCM&nachal=0&year=2021&month=9&aero_water=0&level=3&if_day=0&if_err=0&place_code=10&year_or_month=0, last access: 14 February 2024. a
Aiuppa, A., Giudice, G., Gurrieri, S., Liuzzo, M., Burton, M., Caltabiano, T., McGonigle, A. J. S., Salerno, G., Shinohara, H., and Valenza, M.: Total volatile flux from Mount Etna, Geophys. Res. Lett., 35, L24302, https://doi.org/10.1029/2008GL035871, 2008. a
Althausen, D., Engelmann, R., Baars, H., Heese, B., Ansmann, A., Müller, D., and Komppula, M.: Portable Raman Lidar PollyXT for Automated Profiling of Aerosol Backscatter, Extinction, and Depolarization, J. Atmos. Ocean. Tech., 26, 2366–2378, https://doi.org/10.1175/2009JTECHA1304.1, 2009. a, b
Amiridis, V. and the ASKOS team: The ASKOS experiment for desert dust science applications, EGU General Assembly 2022, Vienna, Austria, 23–27 May 2022, EGU22-3633, https://doi.org/10.5194/egusphere-egu22-3633, 2022. a
Amiridis, V., Kampouri, A., Gkikas, A., Misios, S., Gialitaki, A., Marinou, E., Rennie, M., Benedetti, A., Solomos, S., Zanis, P., Vasardani, O., Eleftheratos, K., Paschou, P., Georgiou, T., Scollo, S., Mona, L., Papagiannopoulos, N., Retscher, C., Parrinello, T., and Straume, A. G.: Aeolus winds impact on volcanic ash early warning systems for aviation, Sci. Rep., 13, 1–14, https://doi.org/10.1038/s41598-023-34715-6, 2023. a
Ansmann, A., Wandinger, U., Riebesell, M., Weitkamp, C., and Michaelis, W.: Independent measurement of extinction and backscatter profiles in cirrus clouds by using a combined Raman elastic-backscatter lidar, Appl. Optics, 31, 7113–7131, https://doi.org/10.1364/AO.31.007113, 1992. a
Ansmann, A., Tesche, M., Groß, S., Freudenthaler, V., Seifert, P., Hiebsch, A., Schmidt, J., Wandinger, U., Mattis, I., Müller, D., and Wiegner, M.: The 16 April 2010 major volcanic ash plume over central Europe: EARLINET lidar and AERONET photometer observations at Leipzig and Munich, Germany, Geophys. Res. Lett., 37, L13810, https://doi.org/10.1029/2010GL043809, 2010. a, b, c
Ansmann, A., Petzold, A., Kandler, K., Tegen, I., Wendisch, M., Mueller, D., Weinzierl, B., Mueller, T., and Heintzenberg, J.: Saharan Mineral Dust Experiments SAMUM–1 and SAMUM–2: what have we learned?, Tellus B, 63, 403–429, https://doi.org/10.1111/j.1600-0889.2011.00555.x, 2011a. a, b
Ansmann, A., Tesche, M., Seifert, P., Groß, S., Freudenthaler, V., Apituley, A., Wilson, K. M., Serikov, I., Linné, H., Heinold, B., Hiebsch, A., Schnell, F., Schmidt, J., Mattis, I., Wandinger, U., and Wiegner, M.: Ash and fine-mode particle mass profiles from EARLINET-AERONET observations over central Europe after the eruptions of the Eyjafjallajökull volcano in 2010, J. Geophys. Res.-Atmos., 116, D00U02, https://doi.org/10.1029/2010JD015567, 2011b. a, b, c, d
Ansmann, A., Mamouri, R.-E., Hofer, J., Baars, H., Althausen, D., and Abdullaev, S. F.: Dust mass, cloud condensation nuclei, and ice-nucleating particle profiling with polarization lidar: updated POLIPHON conversion factors from global AERONET analysis, Atmos. Meas. Tech., 12, 4849–4865, https://doi.org/10.5194/amt-12-4849-2019, 2019. a
Baars, H., Ansmann, A., Althausen, D., Engelmann, R., Heese, B., Müller, D., Artaxo, P., Paixao, M., Pauliquevis, T., and Souza, R.: Aerosol profiling with lidar in the Amazon Basin during the wet and dry season, J. Geophys. Res.-Atmos., 117, D21201, https://doi.org/10.1029/2012JD018338, 2012. a
Baars, H., Kanitz, T., Engelmann, R., Althausen, D., Heese, B., Komppula, M., Preißler, J., Tesche, M., Ansmann, A., Wandinger, U., Lim, J.-H., Ahn, J. Y., Stachlewska, I. S., Amiridis, V., Marinou, E., Seifert, P., Hofer, J., Skupin, A., Schneider, F., Bohlmann, S., Foth, A., Bley, S., Pfüller, A., Giannakaki, E., Lihavainen, H., Viisanen, Y., Hooda, R. K., Pereira, S. N., Bortoli, D., Wagner, F., Mattis, I., Janicka, L., Markowicz, K. M., Achtert, P., Artaxo, P., Pauliquevis, T., Souza, R. A. F., Sharma, V. P., van Zyl, P. G., Beukes, J. P., Sun, J., Rohwer, E. G., Deng, R., Mamouri, R.-E., and Zamorano, F.: An overview of the first decade of PollyNET: an emerging network of automated Raman-polarization lidars for continuous aerosol profiling, Atmos. Chem. Phys., 16, 5111–5137, https://doi.org/10.5194/acp-16-5111-2016, 2016. a, b, c
Bedoya-Velásquez, A. E., Hoyos-Restrepo, M., Barreto, A., García, R. D., Romero-Campos, P. M., García, O., Ramos, R., Roininen, R., Toledano, C., Sicard, M., and Ceolato, R.: Estimation of the Mass Concentration of Volcanic Ash Using Ceilometers: Study of Fresh and Transported Plumes from La Palma Volcano, Remote Sens.-Basel, 14, 5680, https://doi.org/10.3390/rs14225680, 2022. a, b
Bohlmann, S., Baars, H., Radenz, M., Engelmann, R., and Macke, A.: Ship-borne aerosol profiling with lidar over the Atlantic Ocean: from pure marine conditions to complex dust–smoke mixtures, Atmos. Chem. Phys., 18, 9661–9679, https://doi.org/10.5194/acp-18-9661-2018, 2018. a
Broxton, P. D., Zeng, X., Sulla-Menashe, D., and Troch, P. A.: A Global Land Cover Climatology Using MODIS Data, J. Appl. Meteorol. Clim., 53, 1593–1605, https://doi.org/10.1175/JAMC-D-13-0270.1, 2014. a, b
Businger, S., Huff, R., Pattantyus, A., Horton, K., Sutton, A. J., Elias, T., and Cherubini, T.: Observing and Forecasting Vog Dispersion from Kīlauea Volcano, Hawaii, B. Am. Meteorol. Soc., 96, 1667–1686, https://doi.org/10.1175/BAMS-D-14-00150.1, 2015. a
Carracedo, J. C., Troll, V. R., Day, J. M. D., Geiger, H., Aulinas, M., Soler, V., Deegan, F. M., Perez-Torrado, F. J., Gisbert, G., Gazel, E., Rodriguez-Gonzalez, A., and Albert, H.: The 2021 eruption of the Cumbre Vieja volcanic ridge on La Palma, Canary Islands, Geology Today, 38, 94–107, https://doi.org/10.1111/gto.12388, 2022. a, b, c
Deshler, T.: A review of global stratospheric aerosol: Measurements, importance, life cycle, and local stratospheric aerosol, Atmos. Res., 90, 223–232, https://doi.org/10.1016/j.atmosres.2008.03.016, 2008. a
Eatough, D., Caka, F., and Farber, R.: The Conversion of SO2 to Sulfate in the Atmosphere, Isr. J. Chem., 34, 301–314, https://doi.org/10.1002/ijch.199400034, 1994. a, b
Engelmann, R., Kanitz, T., Baars, H., Heese, B., Althausen, D., Skupin, A., Wandinger, U., Komppula, M., Stachlewska, I. S., Amiridis, V., Marinou, E., Mattis, I., Linné, H., and Ansmann, A.: The automated multiwavelength Raman polarization and water-vapor lidar PollyXT: the neXT generation, Atmos. Meas. Tech., 9, 1767–1784, https://doi.org/10.5194/amt-9-1767-2016, 2016. a, b, c, d
EVDC: Data of the JATAC campaign, ESA Validation Data Center (EVDC) [data set], https://doi.org/10.60621/jatac.campaign.2021.2022.caboverde, 2024. a
Fehr, T., McCarthy, W., Amiridis, V., Baars, H., von Bismarck, J., Borne, M., Chen, S., Flamant, C., Marenco, F., Knipperz, P., Koopman, R., Lemmerz, C. L., Marinou, E., Močnik, G., Parrinello, T., Piña, A., Reitebuch, O., Skofronick-Jackson, G., Zawislak, J., and Zenk, C.: The Joint Aeolus Tropical Atlantic Campaign 2021/2022 Overview – Atmospheric Science and Satellite Validation in the Tropics, EGU General Assembly 2023, Vienna, Austria, 24–28 Apr 2023, EGU23-7249, https://doi.org/10.5194/egusphere-egu23-7249, 2023. a
Filonchyk, M., Peterson, M. P., Gusev, A., Hu, F., Yan, H., and Zhou, L.: Measuring air pollution from the 2021 Canary Islands volcanic eruption, Sci. Total Environ., 849, 157827, https://doi.org/10.1016/j.scitotenv.2022.157827, 2022. a, b, c, d
FIRMS: Fire Information for Resource Management System, https://firms.modaps.eosdis.nasa.gov, last access: 15 January 2024. a
Floutsi, A. A., Baars, H., Engelmann, R., Althausen, D., Ansmann, A., Bohlmann, S., Heese, B., Hofer, J., Kanitz, T., Haarig, M., Ohneiser, K., Radenz, M., Seifert, P., Skupin, A., Yin, Z., Abdullaev, S. F., Komppula, M., Filioglou, M., Giannakaki, E., Stachlewska, I. S., Janicka, L., Bortoli, D., Marinou, E., Amiridis, V., Gialitaki, A., Mamouri, R.-E., Barja, B., and Wandinger, U.: DeLiAn – a growing collection of depolarization ratio, lidar ratio and Ångström exponent for different aerosol types and mixtures from ground-based lidar observations, Atmos. Meas. Tech., 16, 2353–2379, https://doi.org/10.5194/amt-16-2353-2023, 2023. a, b, c
Freudenthaler, V., Esselborn, M., Wiegner, M., Heese, B., Tesche, M., Ansmann, A., Müller, D., Althausen, D., Wirth, M., Fix, A., Ehret, G., Knippertz, P., Toledano, C., Gasteiger, J., Garhammer, M., and Seefeldner, M.: Depolarization ratio profiling at several wavelengths in pure Saharan dust during SAMUM 2006, Tellus B, 61, 165–179, https://doi.org/10.1111/j.1600-0889.2008.00396.x, 2009. a, b, c
GDAS1: Global Data and Assimilation Service, meteorological data, https://www.ready.noaa.gov/gdas1.php, last access: 14 February 2024. a
Gebauer, H., Floutsi, A. A., Haarig, M., Radenz, M., Engelmann, R., Althausen, D., Skupin, A., Ansmann, A., Zenk, C., and Baars, H.: Lidar-derived aerosol optical properties from Mindelo, Cabo Verde, September 2021, Zenodo [data set], https://doi.org/10.5281/zenodo.10650879, 2024. a
Groß, S., Tesche, M., Freudenthaler, V., Toledano, C., Wiegner, M., Ansmann, A., Althausen, D., and Seefeldner, M.: Characterization of Saharan dust, marine aerosols and mixtures of biomass-burning aerosols and dust by means of multi-wavelength depolarization and Raman lidar measurements during SAMUM 2, Tellus B, 63, 706–724, https://doi.org/10.1111/j.1600-0889.2011.00556.x, 2011. a
Groß, S., Freudenthaler, V., Wiegner, M., Gasteiger, J., Geiß, A., and Schnell, F.: Dual-wavelength linear depolarization ratio of volcanic aerosols: Lidar measurements of the Eyjafjallajökull plume over Maisach, Germany, Atmos. Environ., 48, 85–96, https://doi.org/10.1016/j.atmosenv.2011.06.017, 2012. a, b, c, d, e
Haarig, M., Engelmann, R., Ansmann, A., Veselovskii, I., Whiteman, D. N., and Althausen, D.: 1064 nm rotational Raman lidar for particle extinction and lidar-ratio profiling: cirrus case study, Atmos. Meas. Tech., 9, 4269–4278, https://doi.org/10.5194/amt-9-4269-2016, 2016. a
Haarig, M., Ansmann, A., Althausen, D., Klepel, A., Groß, S., Freudenthaler, V., Toledano, C., Mamouri, R.-E., Farrell, D. A., Prescod, D. A., Marinou, E., Burton, S. P., Gasteiger, J., Engelmann, R., and Baars, H.: Triple-wavelength depolarization-ratio profiling of Saharan dust over Barbados during SALTRACE in 2013 and 2014, Atmos. Chem. Phys., 17, 10767–10794, https://doi.org/10.5194/acp-17-10767-2017, 2017. a
Haarig, M., Ansmann, A., Baars, H., Jimenez, C., Veselovskii, I., Engelmann, R., and Althausen, D.: Depolarization and lidar ratios at 355, 532, and 1064 nm and microphysical properties of aged tropospheric and stratospheric Canadian wildfire smoke, Atmos. Chem. Phys., 18, 11847–11861, https://doi.org/10.5194/acp-18-11847-2018, 2018. a
Haarig, M., Ansmann, A., Engelmann, R., Baars, H., Toledano, C., Torres, B., Althausen, D., Radenz, M., and Wandinger, U.: First triple-wavelength lidar observations of depolarization and extinction-to-backscatter ratios of Saharan dust, Atmos. Chem. Phys., 22, 355–369, https://doi.org/10.5194/acp-22-355-2022, 2022. a, b, c
Hansen, J., Sato, M., Lacis, A., and Ruedy, R.: The missing climate forcing, Philos. T. Roy. Soc. B, 352, 231–240, https://doi.org/10.1098/rstb.1997.0018, 1997. a
Holben, B., Eck, T., Slutsker, I., Tanré, D., Buis, J., Setzer, A., Vermote, E., Reagan, J., Kaufman, Y., Nakajima, T., Lavenu, F., Jankowiak, I., and Smirnov, A.: AERONET–A Federated Instrument Network and Data Archive for Aerosol Characterization, Remote Sens. Environ., 66, 1–16, https://doi.org/10.1016/S0034-4257(98)00031-5, 1998. a
HYSPLIT: HYbrid Single-Particle Lagrangian Integrated Trajectory model, backward trajectory calculation tool, https://www.ready.noaa.gov/index.php, last access: 14 February 2024. a
Jäger, H.: Long-term record of lidar observations of the stratospheric aerosol layer at Garmisch-Partenkirchen, J. Geophys. Res.-Atmos., 110, D08106, https://doi.org/10.1029/2004JD005506, 2005. a
Jimenez, C., Ansmann, A., Engelmann, R., Donovan, D., Malinka, A., Schmidt, J., Seifert, P., and Wandinger, U.: The dual-field-of-view polarization lidar technique: a new concept in monitoring aerosol effects in liquid-water clouds – theoretical framework, Atmos. Chem. Phys., 20, 15247–15263, https://doi.org/10.5194/acp-20-15247-2020, 2020a. a
Jimenez, C., Ansmann, A., Engelmann, R., Donovan, D., Malinka, A., Seifert, P., Wiesen, R., Radenz, M., Yin, Z., Bühl, J., Schmidt, J., Barja, B., and Wandinger, U.: The dual-field-of-view polarization lidar technique: a new concept in monitoring aerosol effects in liquid-water clouds – case studies, Atmos. Chem. Phys., 20, 15265–15284, https://doi.org/10.5194/acp-20-15265-2020, 2020b. a
John, W.: Size distribution characteristics of aerosols, in: Aerosol Measurement – Principles, Techniques, and Applications, vol. 3, edited by: Kulkarni, P., Baron, P. A., and Willeke, K., John Wiley & Sons, Inc., Hoboken, NJ, USA, 41–54, https://doi.org/10.1002/9781118001684.ch4, 2011. a
Kampouri, A., Amiridis, V., Solomos, S., Gialitaki, A., Marinou, E., Spyrou, C., Georgoulias, A. K., Akritidis, D., Papagiannopoulos, N., Mona, L., Scollo, S., Tsichla, M., Tsikoudi, I., Pytharoulis, I., Karacostas, T., and Zanis, P.: Investigation of Volcanic Emissions in the Mediterranean: “The Etna–Antikythera Connection”, Atmosphere, 12, 40, https://doi.org/10.3390/atmos12010040, 2021. a, b, c
Kim, M.-H., Omar, A. H., Tackett, J. L., Vaughan, M. A., Winker, D. M., Trepte, C. R., Hu, Y., Liu, Z., Poole, L. R., Pitts, M. C., Kar, J., and Magill, B. E.: The CALIPSO version 4 automated aerosol classification and lidar ratio selection algorithm, Atmos. Meas. Tech., 11, 6107–6135, https://doi.org/10.5194/amt-11-6107-2018, 2018. a
Koschmieder, H.: Theorie der horizontalen Sichtweite, Beiträge zur Physik der freien Atmosphäre, 12, 33–53, 1924. a
L2A+: L2A+ project deliverable: “Enhanced Aeolus L2A for depolarizing targets and impact on aerosol research and NWP”, https://l2a.space.noa.gr/backend/assets/e7a1b125-e2b2-4489-a205-720bd4f8077a?download, last access: 11 January 2024. a
Marinou, E., Paschou, P., Tsikoudi, I., Tsekeri, A., Daskalopoulou, V., Kouklaki, D., Siomos, N., Spanakis-Misirlis, V., Voudouri, K. A., Georgiou, T., Drakaki, E., Kampouri, A., Papachristopoulou, K., Mavropoulou, I., Mallios, S., Proestakis, E., Gkikas, A., Koutsoupi, I., Raptis, I. P., Kazadzis, S., Baars, H., Floutsi, A., Pirloaga, R., Nemuc, A., Marenco, F., Kezoudi, M., Papetta, A., Močnik, G., Díez, J. Y., Ryder, C. L., Ratcliffe, N., Kandler, K., Sudharaj, A., and Amiridis, V.: An Overview of the ASKOS Campaign in Cabo Verde, Environmental Sciences Proceedings, 26, 200, https://doi.org/10.3390/environsciproc2023026200, 2023. a
Martin, E., Bekki, S., Ninin, C., and Bindeman, I.: Volcanic sulfate aerosol formation in the troposphere, J. Geophys. Res.-Atmos., 119, 12660–12673, https://doi.org/10.1002/2014JD021915, 2014. a, b, c, d, e, f
McGonigle, A. J. S., Delmelle, P., Oppenheimer, C., Tsanev, V. I., Delfosse, T., Williams-Jones, G., Horton, K., and Mather, T. A.: SO2 depletion in tropospheric volcanic plumes, Geophys. Res. Lett., 31, L13201, https://doi.org/10.1029/2004GL019990, 2004. a
Miffre, A., David, G., Thomas, B., Rairoux, P., Fjaeraa, A., Kristiansen, N., and Stohl, A.: Volcanic aerosol optical properties and phase partitioning behavior after long-range advection characterized by UV-Lidar measurements, Atmos. Environ., 48, 76–84, https://doi.org/10.1016/j.atmosenv.2011.03.057, 2012. a
Milford, C., Torres, C., Vilches, J., Gossman, A.-K., Weis, F., Suárez-Molina, D., García, O. E., Prats, N., Barreto, Á., García, R. D., Bustos, J. J., Marrero, C. L., Ramos, R., Chinea, N., Boulesteix, T., Taquet, N., Rodríguez, S., López-Darias, J., Sicard, M., Córdoba-Jabonero, C., and Cuevas, E.: Impact of the 2021 La Palma volcanic eruption on air quality: Insights from a multidisciplinary approach, Sci. Total Environ., 869, 161652, https://doi.org/10.1016/j.scitotenv.2023.161652, 2023. a, b, c, d
Mona, L., Amodeo, A., D'Amico, G., Giunta, A., Madonna, F., and Pappalardo, G.: Multi-wavelength Raman lidar observations of the Eyjafjallajökull volcanic cloud over Potenza, southern Italy, Atmos. Chem. Phys., 12, 2229–2244, https://doi.org/10.5194/acp-12-2229-2012, 2012. a, b, c, d
National Centers for Environmental Prediction, National Weather Service, NOAA, and U. S. Department of Commerce: NCEP FNL Operational Model Global Tropospheric Analyses, continuing from July 1999, Research Data Archive [data set], https://doi.org/10.5065/D6M043C6, 2000. a, b
Navas-Guzmán, F., Müller, D., Bravo-Aranda, J. A., Guerrero-Rascado, J. L., Granados-Muñoz, M. J., Pérez-Ramírez, D., Olmo, F. J., and Alados-Arboledas, L.: Eruption of the Eyjafjallajökull Volcano in spring 2010: Multiwavelength Raman lidar measurements of sulphate particles in the lower troposphere, J. Geophys. Res.-Atmos., 118, 1804–1813, https://doi.org/10.1002/jgrd.50116, 2013. a, b, c, d, e, f, g, h
NOAA: HYSPLIT trajectories, NOAA, https://www.ready.noaa.gov/hypub-bin/trajtype.pl?runtype=archive, last access: 23 April 2024a. a, b
NOAA: Global Data Assimilation System (GDAS1) Archive Information, NOAA [data set], https://www.ready.noaa.gov/gdas1.php, last access: 23 April 2024b.
Pappalardo, G., Amodeo, A., Mona, L., Pandolfi, M., Pergola, N., and Cuomo, V.: Raman lidar observations of aerosol emitted during the 2002 Etna eruption, Geophys. Res. Lett., 31, L05120, https://doi.org/10.1029/2003GL019073, 2004. a, b, c, d, e, f, g, h
Pappalardo, G., Mona, L., D'Amico, G., Wandinger, U., Adam, M., Amodeo, A., Ansmann, A., Apituley, A., Alados Arboledas, L., Balis, D., Boselli, A., Bravo-Aranda, J. A., Chaikovsky, A., Comeron, A., Cuesta, J., De Tomasi, F., Freudenthaler, V., Gausa, M., Giannakaki, E., Giehl, H., Giunta, A., Grigorov, I., Groß, S., Haeffelin, M., Hiebsch, A., Iarlori, M., Lange, D., Linné, H., Madonna, F., Mattis, I., Mamouri, R.-E., McAuliffe, M. A. P., Mitev, V., Molero, F., Navas-Guzman, F., Nicolae, D., Papayannis, A., Perrone, M. R., Pietras, C., Pietruczuk, A., Pisani, G., Preißler, J., Pujadas, M., Rizi, V., Ruth, A. A., Schmidt, J., Schnell, F., Seifert, P., Serikov, I., Sicard, M., Simeonov, V., Spinelli, N., Stebel, K., Tesche, M., Trickl, T., Wang, X., Wagner, F., Wiegner, M., and Wilson, K. M.: Four-dimensional distribution of the 2010 Eyjafjallajökull volcanic cloud over Europe observed by EARLINET, Atmos. Chem. Phys., 13, 4429–4450, https://doi.org/10.5194/acp-13-4429-2013, 2013. a
Pattantyus, A. K., Businger, S., and Howell, S. G.: Review of sulfur dioxide to sulfate aerosol chemistry at Kīlauea Volcano, Hawai'i, Atmos. Environ., 185, 262–271, https://doi.org/10.1016/j.atmosenv.2018.04.055, 2018. a, b, c, d
Pisso, I., Sollum, E., Grythe, H., Kristiansen, N. I., Cassiani, M., Eckhardt, S., Arnold, D., Morton, D., Thompson, R. L., Groot Zwaaftink, C. D., Evangeliou, N., Sodemann, H., Haimberger, L., Henne, S., Brunner, D., Burkhart, J. F., Fouilloux, A., Brioude, J., Philipp, A., Seibert, P., and Stohl, A.: The Lagrangian particle dispersion model FLEXPART version 10.4, Geosci. Model Dev., 12, 4955–4997, https://doi.org/10.5194/gmd-12-4955-2019, 2019. a
PollyNET: Most recent measurements of operational lidars, PollyNET [data set], https://polly.tropos.de/, last access: 23 April 2024. a
Radenz, M.: martin-rdz/trace_airmass_source: trace_airmass_source jan2021, Zenodo [code], https://doi.org/10.5281/zenodo.2576558, 2021. a
Radenz, M., Seifert, P., Baars, H., Floutsi, A. A., Yin, Z., and Bühl, J.: Automated time–height-resolved air mass source attribution for profiling remote sensing applications, Atmos. Chem. Phys., 21, 3015–3033, https://doi.org/10.5194/acp-21-3015-2021, 2021. a
Rittmeister, F., Ansmann, A., Engelmann, R., Skupin, A., Baars, H., Kanitz, T., and Kinne, S.: Profiling of Saharan dust from the Caribbean to western Africa – Part 1: Layering structures and optical properties from shipborne polarization/Raman lidar observations, Atmos. Chem. Phys., 17, 12963–12983, https://doi.org/10.5194/acp-17-12963-2017, 2017. a
Robock, A.: Volcanic eruptions and climate, Rev. Geophys., 38, 191–219, https://doi.org/10.1029/1998RG000054, 2000. a
Rolph, G., Stein, A., and Stunder, B.: Real-time Environmental Applications and Display sYstem: READY, Environ. Modell. Softw., 95, 210–228, https://doi.org/10.1016/j.envsoft.2017.06.025, 2017. a
Solomon, S., Daniel, J. S., Neely, R. R., Vernier, J.-P., Dutton, E. G., and Thomason, L. W.: The Persistently Variable “Background” Stratospheric Aerosol Layer and Global Climate Change, Science, 333, 866–870, https://doi.org/10.1126/science.1206027, 2011. a
Stein, A. F., Draxler, R. R., Rolph, G. D., Stunder, B. J. B., Cohen, M. D., and Ngan, F.: NOAA's HYSPLIT Atmospheric Transport and Dispersion Modeling System, B. Am. Meteorol. Soc., 96, 2059–2077, https://doi.org/10.1175/BAMS-D-14-00110.1, 2015. a
Tackett, J. L., Kar, J., Vaughan, M. A., Getzewich, B. J., Kim, M.-H., Vernier, J.-P., Omar, A. H., Magill, B. E., Pitts, M. C., and Winker, D. M.: The CALIPSO version 4.5 stratospheric aerosol subtyping algorithm, Atmos. Meas. Tech., 16, 745–768, https://doi.org/10.5194/amt-16-745-2023, 2023. a
Tesche, M., Gross, S., Ansmann, A., Mueller, D., Althausen, D., Freudenthaler, V., and Esselborn, M.: Profiling of Saharan dust and biomass-burning smoke with multiwavelength polarization Raman lidar at Cape Verde, Tellus B, 63, 649–676, https://doi.org/10.1111/j.1600-0889.2011.00548.x, 2011. a
TROPOMI: TROPOspheric Monitoring Instrument, quicklooks, https://so2.gsfc.nasa.gov/pix/daily/ixxxza/troploop5pca.php?yr=21&mo=09&dy=23&bn=cverde, last access: 14 February 2024. a, b, c
Veefkind, J., Aben, I., McMullan, K., Förster, H., de Vries, J., Otter, G., Claas, J., Eskes, H., de Haan, J., Kleipool, Q., van Weele, M., Hasekamp, O., Hoogeveen, R., Landgraf, J., Snel, R., Tol, P., Ingmann, P., Voors, R., Kruizinga, B., Vink, R., Visser, H., and Levelt, P.: TROPOMI on the ESA Sentinel-5 Precursor: A GMES mission for global observations of the atmospheric composition for climate, air quality and ozone layer applications, Remote Sens. Environ., 120, 70–83, https://doi.org/10.1016/j.rse.2011.09.027, 2012. a
Veselovskii, I., Hu, Q., Goloub, P., Podvin, T., Korenskiy, M., Derimian, Y., Legrand, M., and Castellanos, P.: Variability in lidar-derived particle properties over West Africa due to changes in absorption: towards an understanding, Atmos. Chem. Phys., 20, 6563–6581, https://doi.org/10.5194/acp-20-6563-2020, 2020. a
Wandinger, U., Floutsi, A. A., Baars, H., Haarig, M., Ansmann, A., Hünerbein, A., Docter, N., Donovan, D., van Zadelhoff, G.-J., Mason, S., and Cole, J.: HETEAC – the Hybrid End-To-End Aerosol Classification model for EarthCARE, Atmos. Meas. Tech., 16, 2485–2510, https://doi.org/10.5194/amt-16-2485-2023, 2023. a
Yang, S., Ma, Y., Duan, F., He, K., Wang, L., Wei, Z., Zhu, L., Ma, T., Li, H., and Ye, S.: Characteristics and formation of typical winter haze in Handan, one of the most polluted cities in China, Sci. Total Environ., 613–614, 1367–1375, https://doi.org/10.1016/j.scitotenv.2017.08.033, 2018. a, b, c
Yin, Z. and Baars, H.: PollyNET/Pollynet_Processing_Chain: Version 3.0, Zenodo [code], https://doi.org/10.5281/zenodo.5571289, 2021. a
Zhang, Y., Zhu, X., Slanina, S., Shao, M., Zeng, L., Hu, M., Bergin, M., and Salmon, L.: Aerosol pollution in some Chinese cities (IUPAC Technical Report), Pure Appl. Chem., 76, 1227–1239, https://doi.org/10.1351/pac200476061227, 2004. a
- Abstract
- Introduction
- Methodology
- Results
- Discussion
- Summary and conclusions
- Appendix A: AOD and lidar quicklooks
- Appendix B: Combined HYSPLIT and FIRMS maps
- Appendix C: TRACE simulations
- Data availability
- Author contributions
- Competing interests
- Disclaimer
- Acknowledgements
- Financial support
- Review statement
- References