the Creative Commons Attribution 4.0 License.
the Creative Commons Attribution 4.0 License.
 | 29 Apr 2024
Global aerosol-type classification using a new hybrid algorithm and Aerosol Robotic Network data
Xiaoli Wei
Qian Cui
Leiming Ma
Feng Zhang
Wenwen Li
Peng Liu
The properties of aerosols are highly uncertain owing to the complex changes in their composition in different regions. The radiative properties of different aerosol types differ considerably and are vital for studying aerosol regional and/or global climate effects. Traditional aerosol-type identification algorithms, generally based on cluster or empirical analysis methods, are often inaccurate and time-consuming. In response, our study aimed to develop a new aerosol-type classification model using an innovative hybrid algorithm to improve the precision and efficiency of aerosol-type identification. This novel algorithm incorporates an optical database, constructed using the Mie scattering model, and employs a random forest algorithm to classify different aerosol types based on the optical data from the database. The complex refractive index was used as a baseline to assess the performance of our hybrid algorithm against the traditional Gaussian kernel density clustering method for aerosol-type identification. The hybrid algorithm demonstrated impressive consistency rates of 90 %, 85 %, 84 %, 84 %, and 100 % for dust, mixed-coarse (mixed, course-mode aerosol), mixed-fine (mixed, fine-mode aerosol), urban/industrial, and biomass burning aerosols, respectively. Moreover, it achieved remarkable precision, with evaluation metric indexes for micro-precision, micro-recall, micro-F1-score, and accuracy of 95 %, 89 %, 91 %, and 89 %, respectively. Lastly, a global map of aerosol types was generated using the new hybrid algorithm to characterize aerosol types across the five continents. This study, utilizing a novel approach for the classification of aerosol, will help improve the accuracy of aerosol inversion and determine the sources of aerosol pollution.
- Article
(20932 KB) - Full-text XML
- BibTeX
- EndNote


Atmospheric aerosols are tiny solid or liquid particles suspended in the atmosphere. Aerosols indirectly affect the energy budget and water cycle of the Earth's gas system by absorbing and scattering solar radiation or by changing the optical properties and life cycle of clouds via their role as condensation nuclei of cloud droplets (Redemann et al., 2000; Ramanathan et al., 2001). Additionally, desert dust, biomass smog, and the anthropogenic emission of air pollutants can affect visibility, air quality, and human health (Tong et al., 2017; Siomos et al., 2020). Evaluating the impact of aerosols on radiative transfer is complex, primarily because of the uncertainty in the radiative forcing caused by the high spatiotemporal dynamic variation in aerosol optical and physical characteristics in different regions (Kaskaoutis et al., 2011; Che et al., 2018; Ghasemifar, 2023). The aerosol type embodies the long-term average physicochemical properties of aerosols in a certain area (Kiehl and Briegleb, 1993; Lu et al., 2023). Therefore, accurate identification of aerosol types can drive the study of the climatic effects of aerosols, the tracking and control of environmental pollution sources, and the precision of radiation transmission models.
Aerosol types are defined based on the radiative properties of different aerosol types, considering the large variation in their optical, physical, and chemical properties. Currently, aerosol types are classified in two ways using traditional clustering algorithms (Kumar et al., 2018). First, based on different sources and properties at different observation points worldwide, aerosols are classified as follows: dust aerosols from deserts, biomass combustion aerosols from forests or grasslands, and urban/industrial (U/I) aerosols from fuel combustion in densely populated urban areas (Dubovik et al., 2002; Pawar et al., 2015; Yousefi et al., 2020). Second, based on the size of the radiation absorption rate, aerosols are separated into four categories: carbonaceous (fine absorption mode), soil dust (coarse absorption mode), sulfates (non-absorbing, fine-grained mode), and sea salt aerosols (non-absorbing, coarse-grained mode) (Levy et al., 2007). The first classification, widely used for aerosol retrieval and common in research, categorizes aerosol types based on the optical properties observed at ground stations. This forms a two-dimensional identification space for clustering. The second approach specifically subcategorizes anthropogenic aerosols. Many combinations of optical properties and parameters are available, such as EAE440–870 nm (extinction Ångström exponent) vs. SSA440 nm (single-scattering albedo), AAE440–870 nm (absorption Ångström exponent) vs. EAE440–870 nm, AAE440–870 nm vs. FMF550 nm (fine-mode fraction), and SSA440 nm vs. EAE440–870 nm (Lee et al., 2010; Shin et al., 2019; Choi et al., 2021a). Various studies have highlighted the importance of selecting the appropriate aerosol properties for accurate aerosol-type identification (Giles et al., 2012; Che et al., 2018).
Among the aerosol-type classification methodologies developed, those using threshold and empirical analyses have the greatest potential for large-area and fixed-period applications (Eck et al., 1999; Omar et al., 2005; Yang et al., 2009). Traditionally, the aerosol-type classification algorithm mainly distinguishes different aerosol types based on their optical properties and determines the threshold of their optical properties based on clustering. However, the composition of aerosols changes rapidly with time and location, owing to the combined influence of natural conditions and human activities (e.g., tornadoes and various anthropogenic activities) (Sheridan et al., 2001). Unfortunately, determining aerosol types accurately and rapidly is a challenge when using traditional methods (Bahadur et al., 2012; Shin et al., 2019; Lin et al., 2021). Nevertheless, with advancements in data science, artificial intelligence techniques have aided the accurate and rapid recognition of different aerosol types.
Artificial intelligence algorithms can receive multiple aerosol characteristic parameters as input, thus preventing the sole reliance of aerosol classification on a limited number of features (Li et al., 2022; Wang et al., 2023). For example, Boselli et al. (2012) performed a k-means clustering analysis of single-scattering albedo (SSA), aerosol optical depth (AOD), electrical asymmetry effect (EAE), and asymmetry parameter (g) datasets for the central Mediterranean Sea for the classification of aerosol into four categories: dusty, continental, oceanic, and mixed aerosols. Nicolae et al. (2018) developed a neural network algorithm to estimate the aerosol type of lidar data, and Hamill et al. (2016) introduced the Mahalanobis distance for aerosol classification to determine a specific aerosol type for each reference cluster. Li et al. (2022) generated a spatial contiguous aerosol-type map for China with an empirical aerosol-type retrieval algorithm. Overall, limited information on the optical properties of aerosols can reasonably determine the type of aerosol (Hamill et al., 2016). However, some challenges remain in identifying aerosol types using machine learning. First, the number of valid ground aerosol property data that can be used for training is less due to cloud removal and quality control. Second, the accuracy of machine learning depends on the labeled aerosol-type dataset, and finding a suitable classification method to classify the dataset is challenging. Third, evaluating the accuracy of the final trained model is also tedious (Zhang and Li, 2019; Siomos et al., 2020; Choi et al., 2021a, b).
The traditional aerosol-type identification methods are easily limited by time and space, and most of them only classify aerosol types using two optical property parameters, restricting the complete characterization of aerosols. Considering these limitations, we aimed to (1) develop a new algorithm that can accurately and quickly identify aerosol types to overcome existing problems, such as low accuracy, insufficient data, and difficulty in setting labels, and (2) investigate the characteristics of the regional spatial distribution of global aerosol types obtained using the new machine learning algorithms, considering the large regional differences in aerosol types. To achieve this, we propose a new aerosol-type classification algorithm based on a Gaussian cluster and random forest algorithm to generate an aerosol classification map over several representative regions of the world.
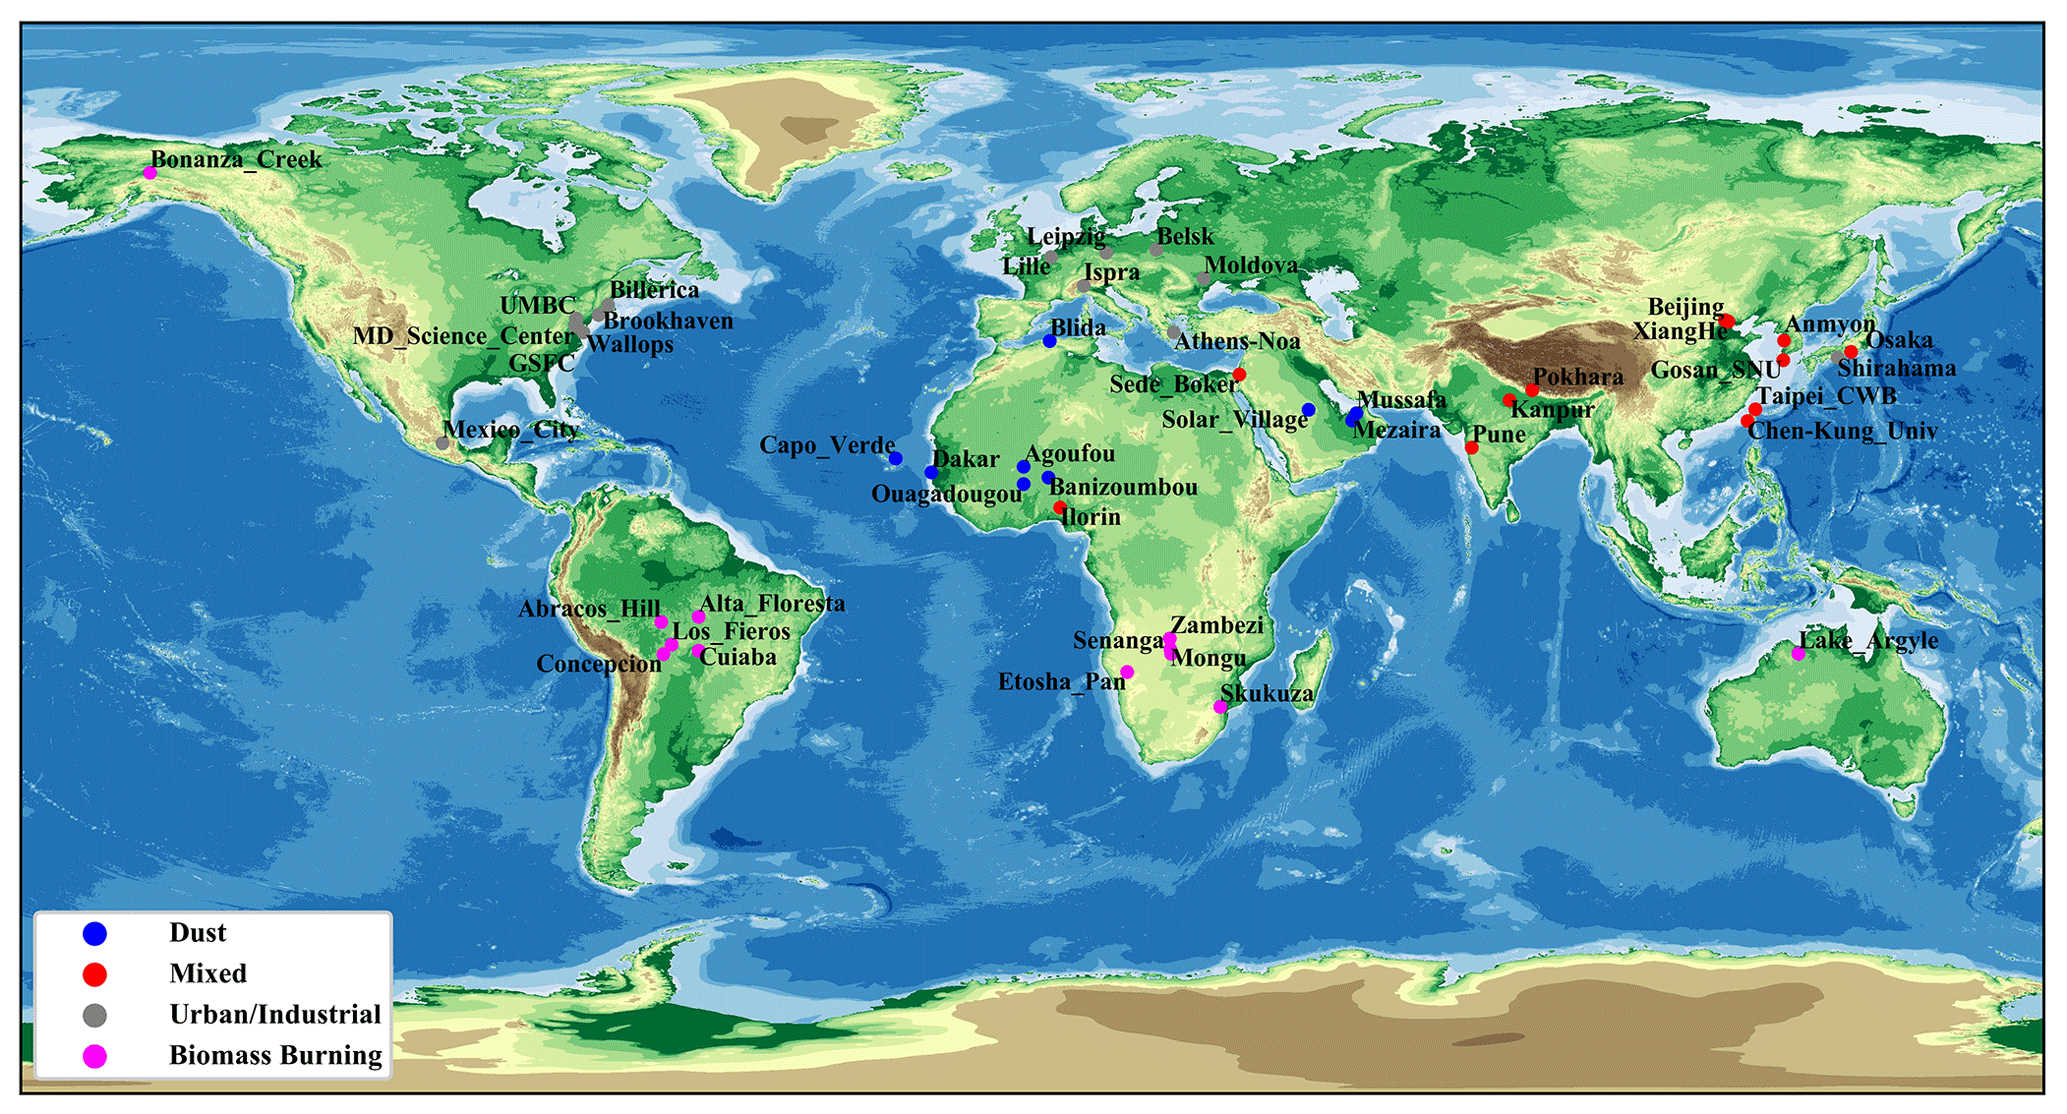
Figure 1Study area and 47 AERONET sites selected by literature review.
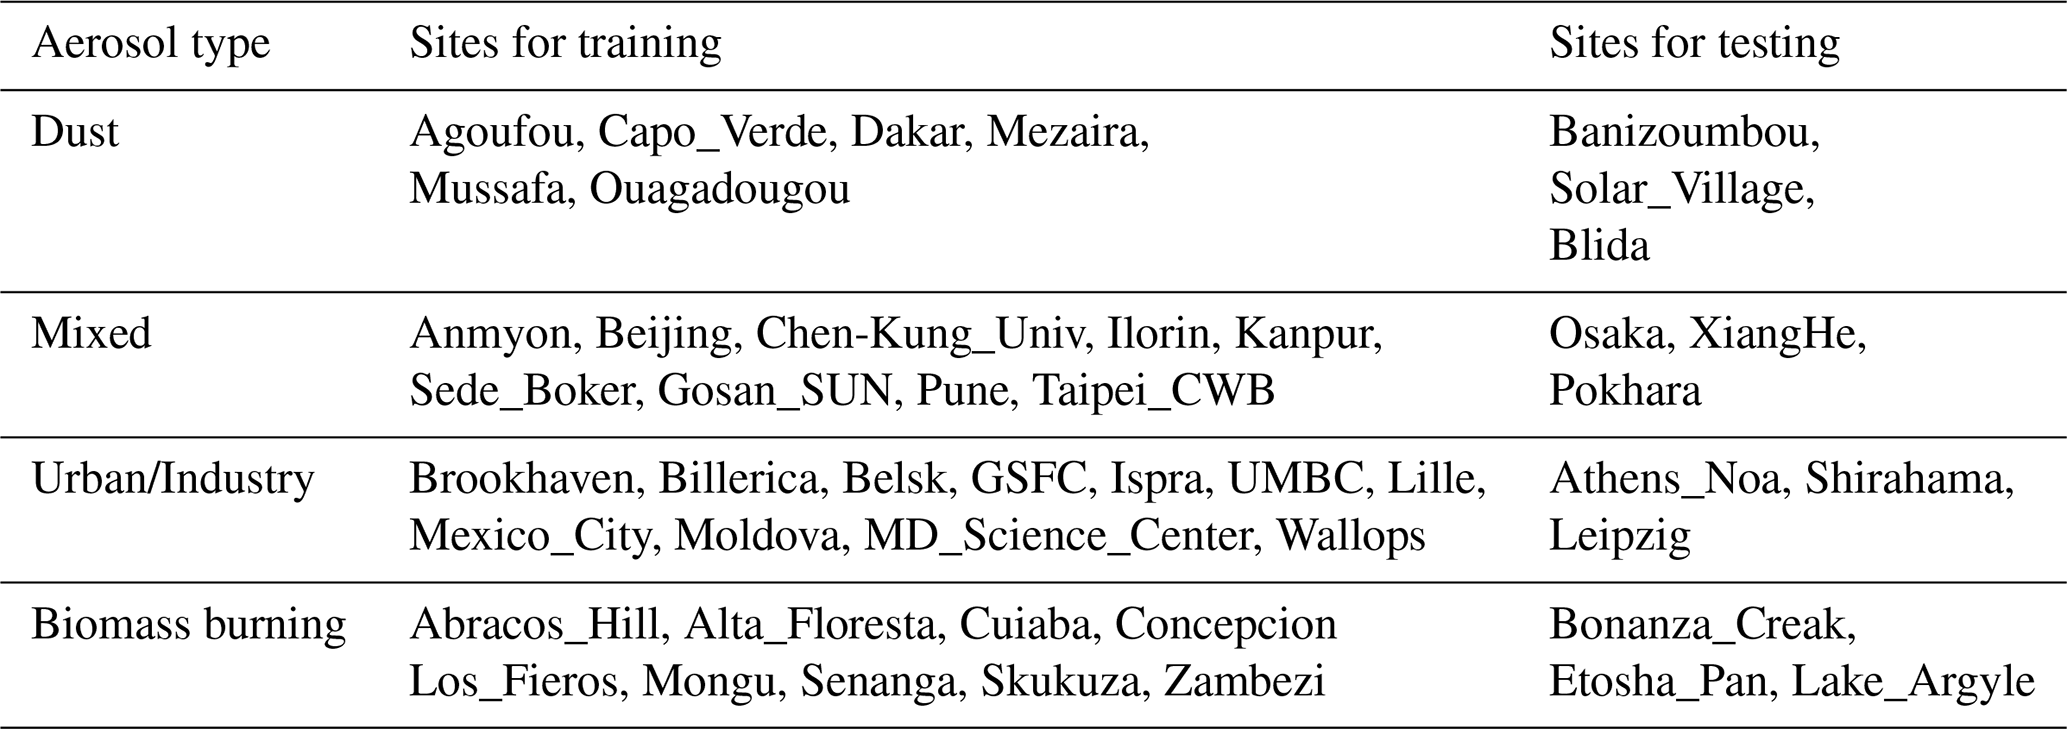
Figure 1 illustrates the research area and the distribution of the Aerosol Robotic Network (AERONET) sites, strategically encompassing major global regions to validate the universality of the research algorithm. The study utilized 47 marked aerosol sites across five continents, leveraging them to train and validate the machine learning approach based on a comprehensive literature review. The 47 sites represent different aerosol-type properties of different aerosol source regions, including dust, mixed (mixed, coarse-mode and mixed, fine-mode aerosols), U/I, and biomass burning (BB) aerosols (Table 1, Fig. 1). Marine aerosols were not considered, as their low optical thickness values (generally <0.4) can result in a less valid data scale that would not meet the study requirements. Here, the aerosol source region refers to the area affected by one dominant emission source, where the aerosol types are fixed and not easily confused (Giles et al., 2012; Hamill et al., 2016). Table 2 presents the optical properties and microphysical characteristic parameters of aerosols at the four AERONET bands (440, 675, 870, and 1020 nm). These parameters were used to construct a database of SSA, AOD, and asymmetry parameters. Further, typical sites dominated by different aerosol types worldwide were selected for compositional analysis using the new model. The selected sites are distributed across different regions of the world and represent a specific dominant aerosol type and aerosol source region.
Table 2The optical and microphysical properties for aerosol-type identification.
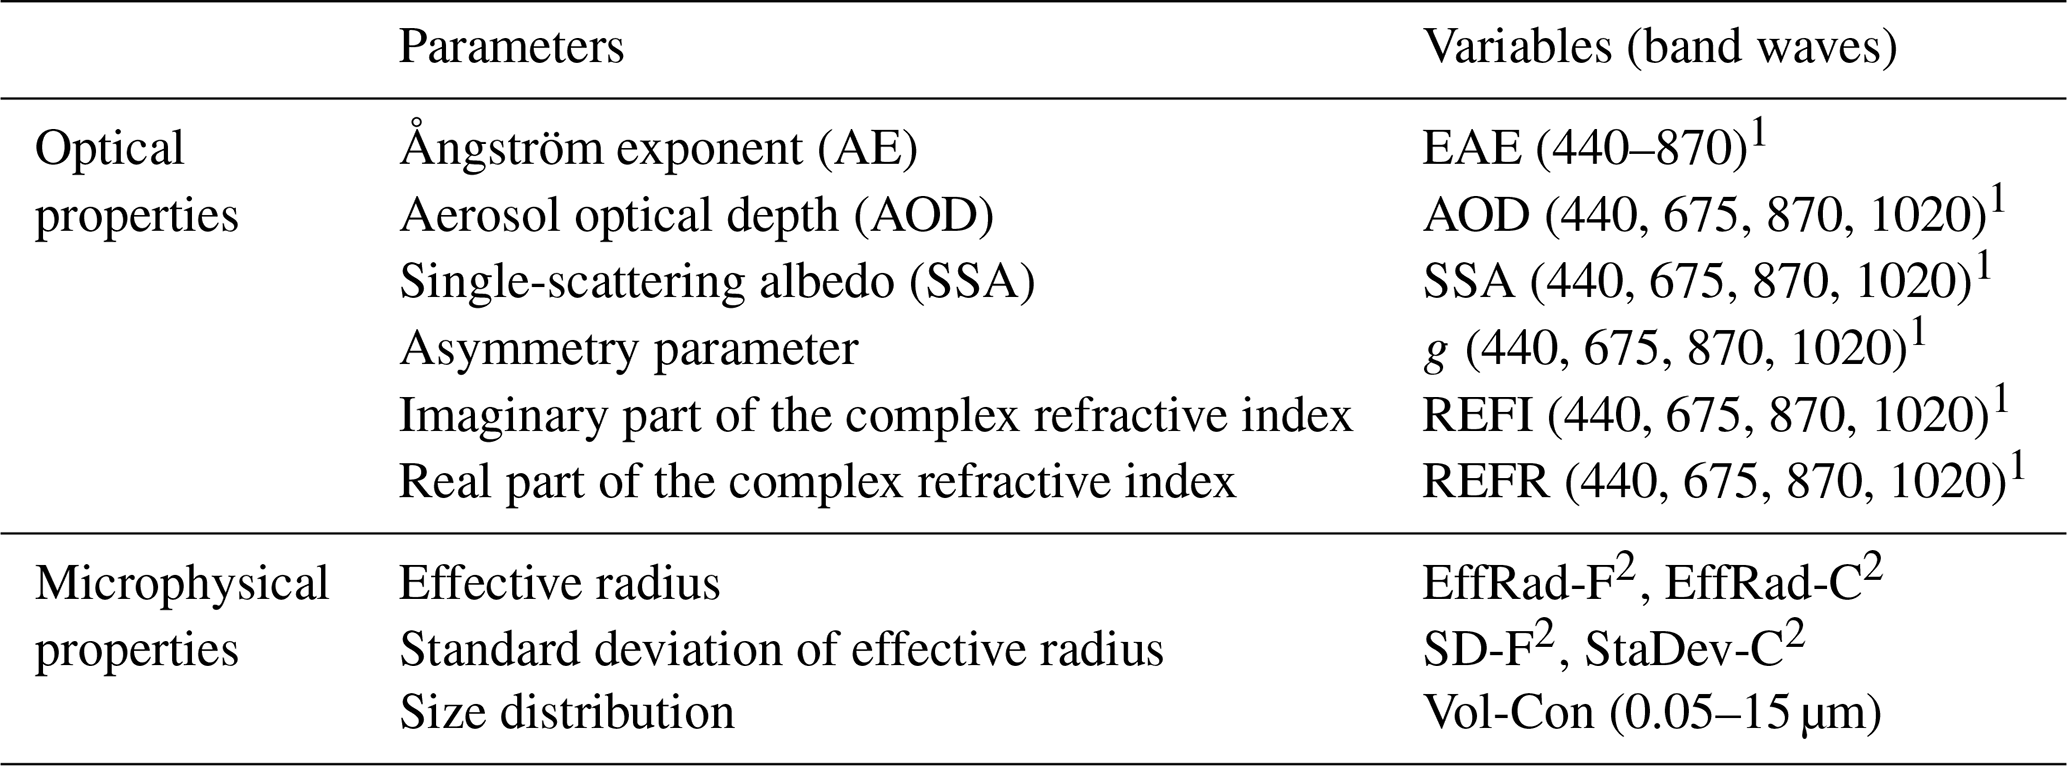
1 The parenthetical information refers to the wavelength (in nm). 2 Different modes are presented. The abbreviations used in the table are as follows: EAE is the extinction Ångström exponent, REFI is the imaginary part of the complex refractive index, REFR is the real part of the complex refractive index, F refers to fine mode, C refers to coarse mode; EffRad is effective radius, SD is standard deviation, and Vol-Con is volume concentration.
For dust aerosols, five AERONET sites, namely Banizoumbou, Capo_Verde, Dakar, and Ouagadougou in Africa and Solar_Village in West Asia, influenced by the Sahara Desert, were considered. The Dakar and Capo_Verde sites are located at the tip of the Capo Verde Peninsula – the westernmost part of Africa, bordering the Atlantic Ocean. Despite being oceanic, these two sites are dominated by dust aerosols that are influenced by aerosol plumes from the Sahara Desert. Meanwhile, the Banizoumbou and Ouagadougou sites are centrally located in Africa. Here, northeasterly winds in winter and northwesterly winds in summer transport Saharan Desert dust aerosols. For mixed aerosols, the Ilorin, Kanpur, Sede_Boker, and XiangHe AERONET sites were selected. For U/I aerosols, the GSFC, Ispra, Mexico_City, and Moldova AERONET sites were selected. Four AERONET sites, namely, Alta_Floresta, Abracos_Hill, Lake_Argyle, and Mongu, were selected as BB-aerosol-dominated sites.
A new hybrid aerosol-type classification approach that provides insight into spatiotemporal variations in aerosol pollution and climate impacts on a global scale is proposed in this study. Using this approach, an aerosol optical properties database using a Mie scattering model was built to rapidly calculate unique aerosol-type features. Additionally, the approach introduced, for the first time, the median value of the complex refractive index (CRI) as the criterion for identifying the aerosol type. The CRI, a key microphysical characteristic of aerosols, plays a significant role in determining their intrinsic optical properties, such as their ability to scatter and absorb light (Raut and Chazette, 2008). The CRI is also vital for determining aerosols' chemical and physical compositions (Dubovik and King, 2000), and the CRI value is known for pure aerosol components (Nandan et al., 2021). Unlike the mean, the median CRI value is employed in this research, as it represents the central tendency of data, which is especially beneficial for skewed distributions or when outliers are present. This is particularly advantageous when an average value of a specific aerosol type might be influenced by the presence of other aerosol types. Moreover, we selected the aerosol classification based on the source (as described in Sect. 1), according to the parameters applied in this study and the requirements for AOD retrieval. Figure 2 shows the working flowchart of the new hybrid aerosol-type identification approach, including three stages: preliminary aerosol classification, aerosol optical database generation, and global aerosol-type identification. The details of these three stages are given in the following.
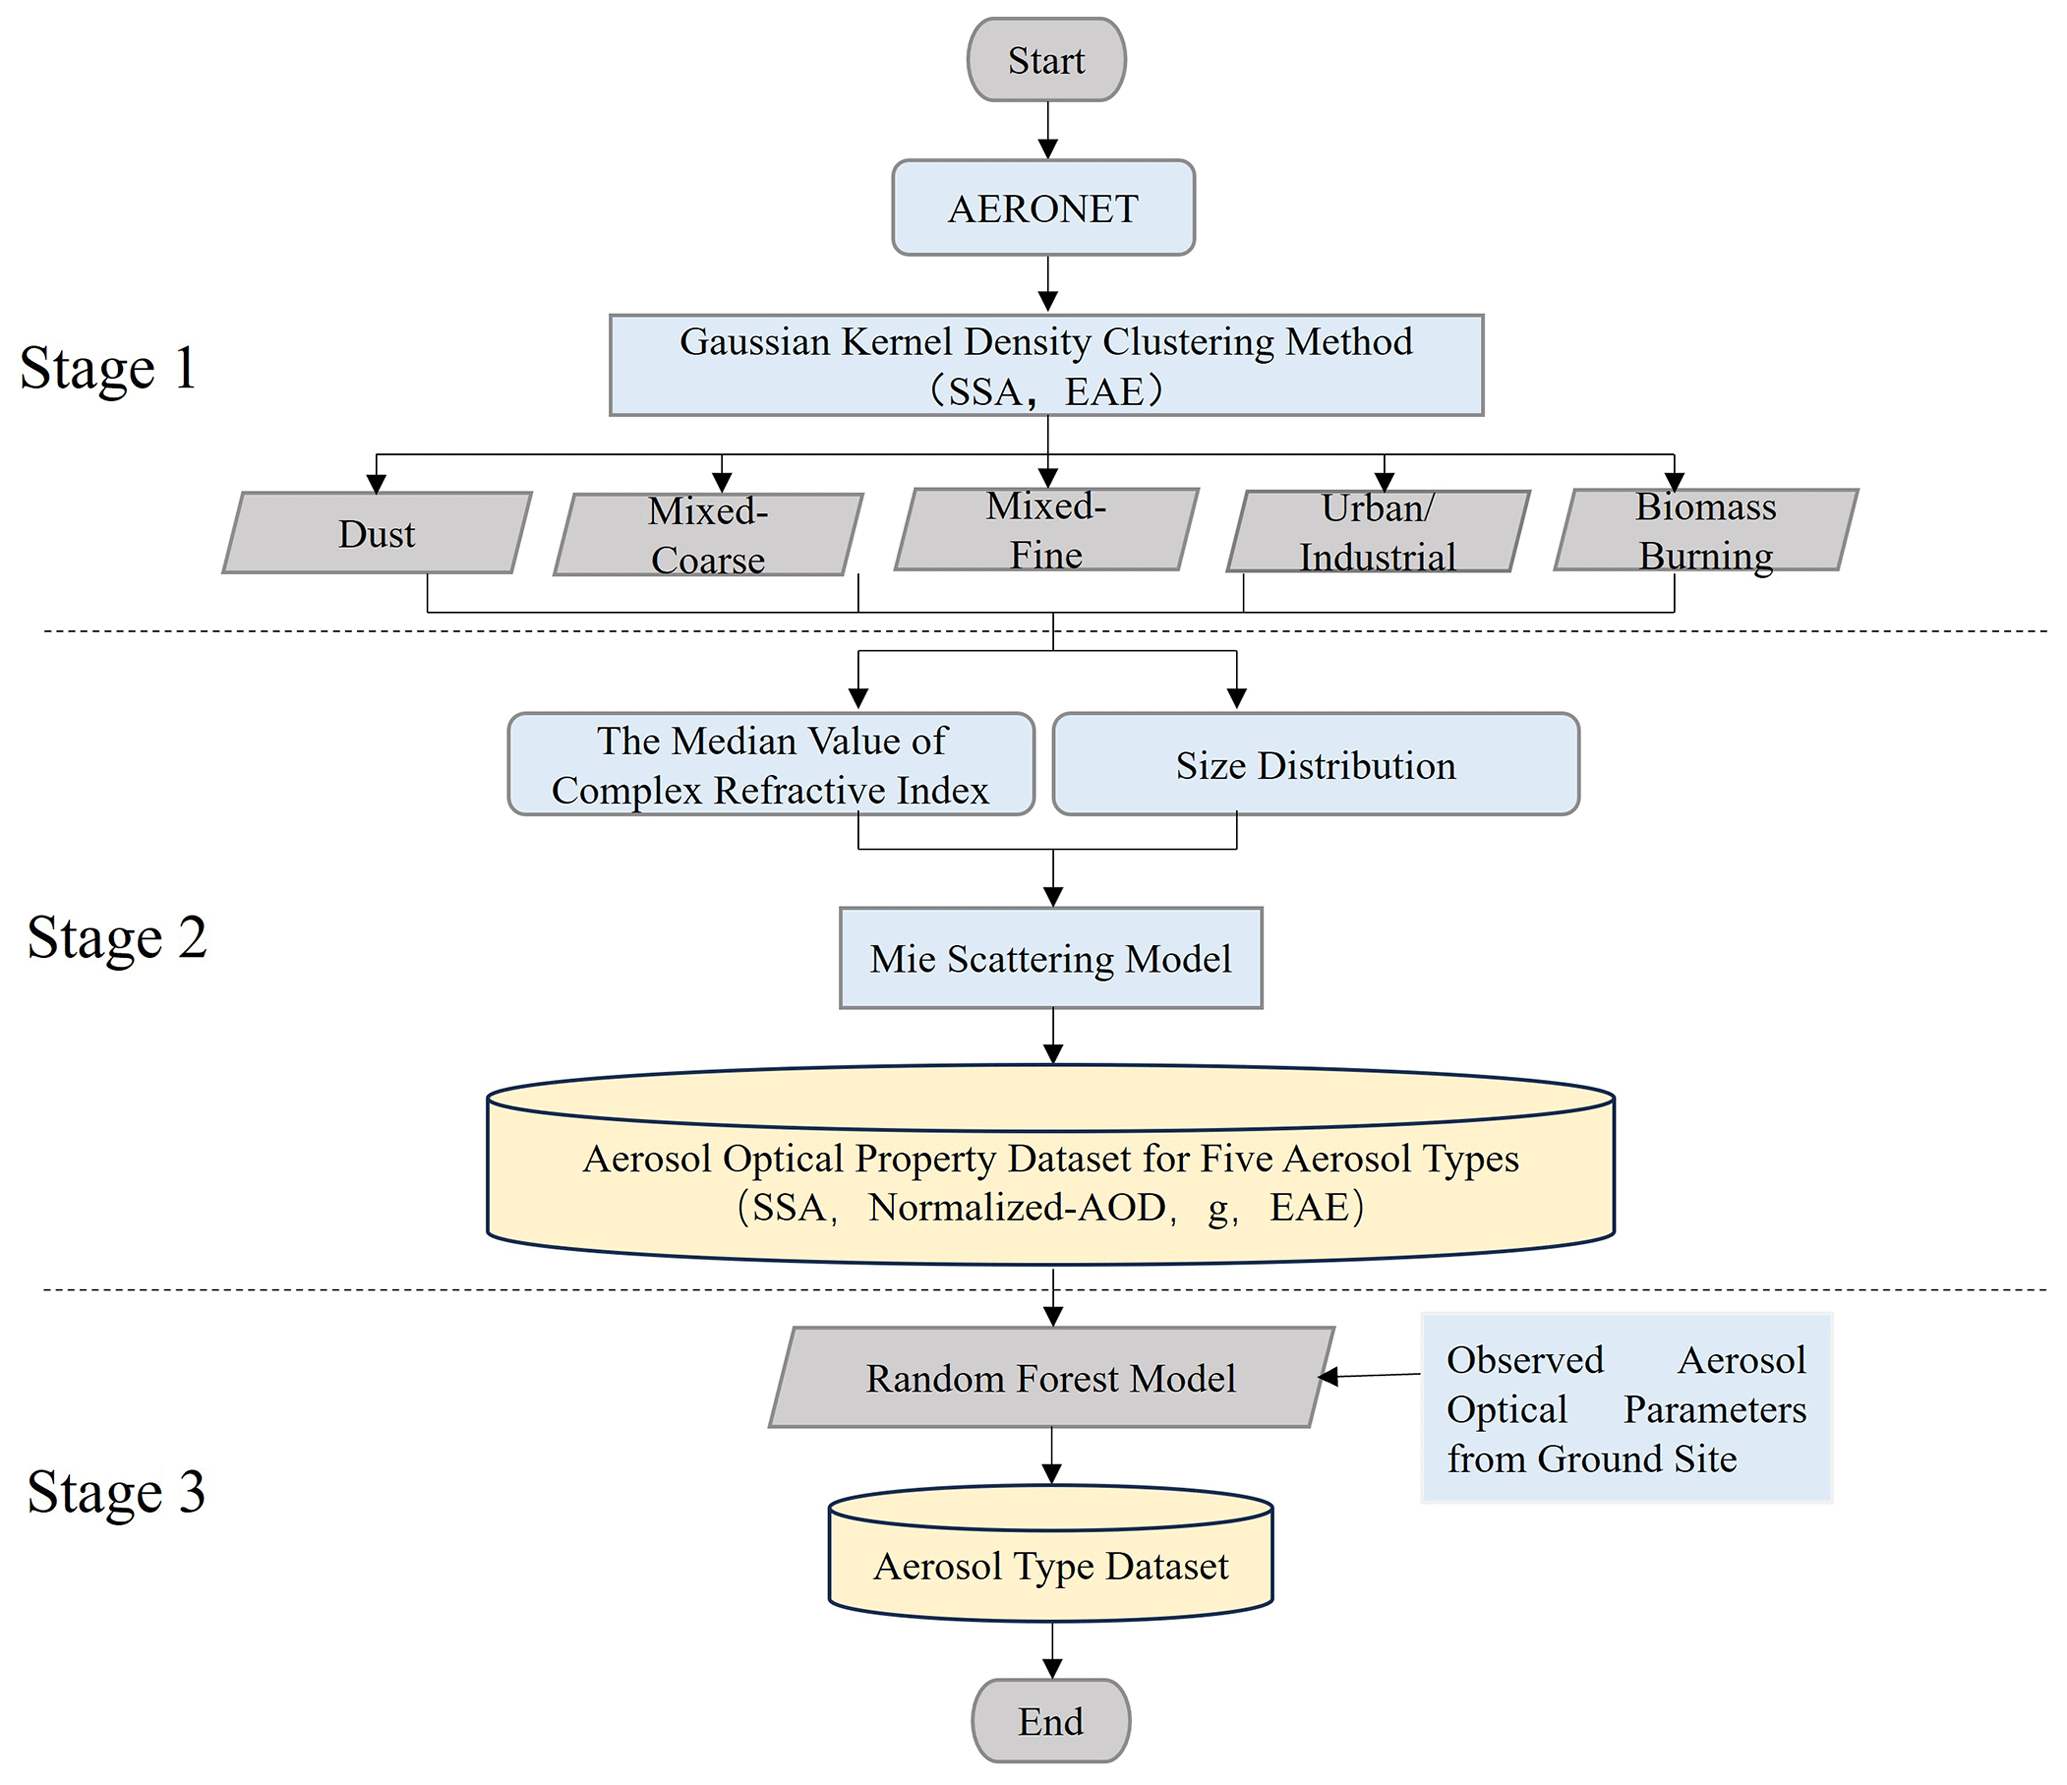
3.1 Aerosol-type preliminary classification (stage 1)
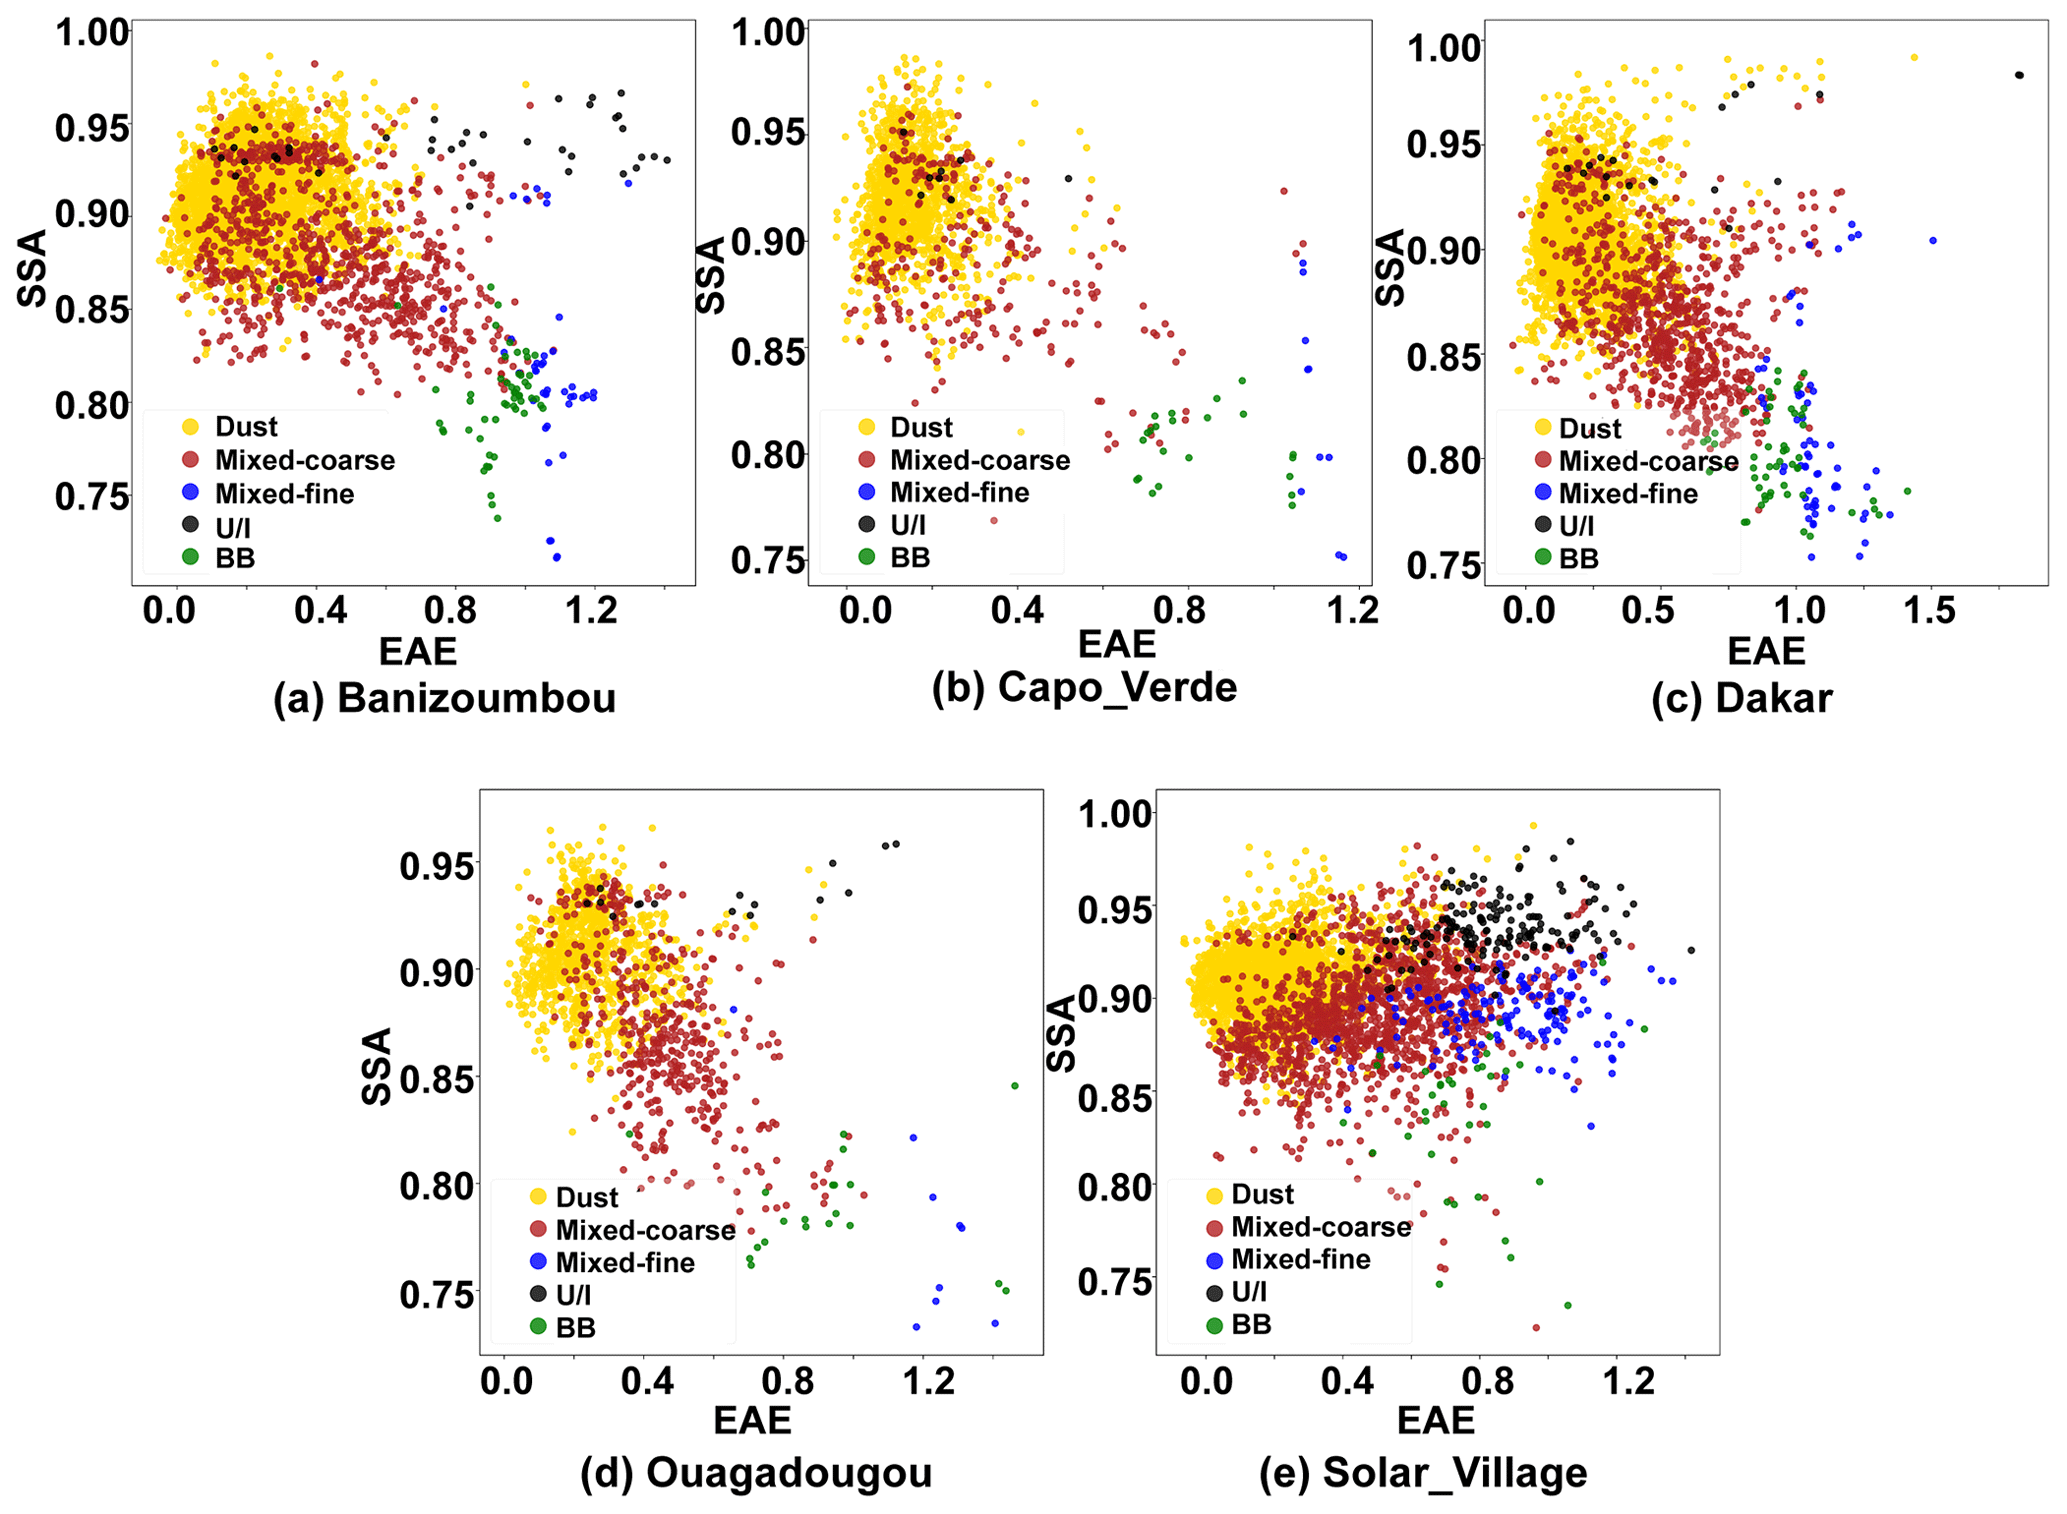
Stage 1 aimed to solve the problem of obtaining a feature parameter dataset for the baseline aerosol type. In previous studies, the Gaussian kernel density clustering algorithm showed great potential with respect to distinguishing the optical properties of different aerosol types and determining their corresponding thresholds rapidly (Kalapureddy et al., 2009; Pathak et al., 2012). The high concentration value in each cluster generally represents the dominant pattern of a specific aerosol type, particularly the data within the window, taking the cluster centroid as the center and a specific distance as the radius. Preliminary, aerosol-type datasets can be generated by digging deep into the distribution information of the effective radius, variance, and refractive index of the data within the window. The spectral absorbability and particle size of aerosols guide the identification of dust, carbonaceous, or hygroscopic aerosols; SSA indicates the absorption of aerosol particles; and EAE describes the aerosol particle size (Giles et al., 2012). Consequently, in this study, the SSA440 nm and EAE440–870 nm of 47 AERONET sites and the Gaussian kernel density clustering method were used to estimate the relative densities and determine the primary patterns of the dominant aerosol types; here, the aerosol type was classified as a dust aerosol. Equations (1) and (2) represent the respective kernel density and Gaussian kernel density clustering methods (Rosenblatt, 2011).
where fX(v) denotes the kernel density and kσ indicates the kernel function. x1, x2 … xL are the sample points of the independent identical distribution. Mathematically, kernel functions are symmetric, normalized, and sample-centric when used for density estimation; this is best described by the Gaussian kernel equation:
where σ is the kernel size used as a smoothing factor (Moraes et al., 2021).
The mixed aerosols comprised fine-mode (mixed-fine) and coarse-mode (mixed-course) aerosols, indicated by EAE > 0.8 and EAE ≤ 0.8, respectively. Figure 3 shows the clustering distribution of EAE and SSA using the Gaussian kernel density clustering method for different aerosol types at the 47 AERONET sites. For the dust aerosol cluster, the density core area EAE was 0.1–0.3 and SSA was 0.89–0.94, implying that it contained many coarse aerosol particles with moderate absorptivity. Furthermore, the mixed aerosols had two distinct centers: one for the coarse-mode aerosols with a median EAE value of 0.4, indicating that the cluster contained massive high-absorption aerosols, and the other for fine-mode aerosols with a median EAE value of 1.3. Low-absorption aerosols were dominant in the cluster, similar to U/I aerosols. Additionally, the density core region EAE of U/I aerosol was 1.5–1.8 and SSA was 0.94–0.97, implying the dominance of fine and low-absorption aerosols. Conversely, BB aerosols had two indistinct centers. This is because, during biomass combustion, gas and particulate matter emissions are limited by the combustion conditions, which are divided into combustion and simmering. Combustion produces black smoke, whereas simmering produces white smoke. Combustion, such as burning flames (grass) with a high black carbon content, has a strong absorption capacity, resulting in a low SSA. Simmering, such as burning wood (i.e., trees), tends to smolder, last longer, have a weaker absorption capacity, and have a higher SSA value. Therefore, despite possessing different absorption characteristics, BB aerosols are defined as one aerosol type with an unseparated center of combustion and simmering.
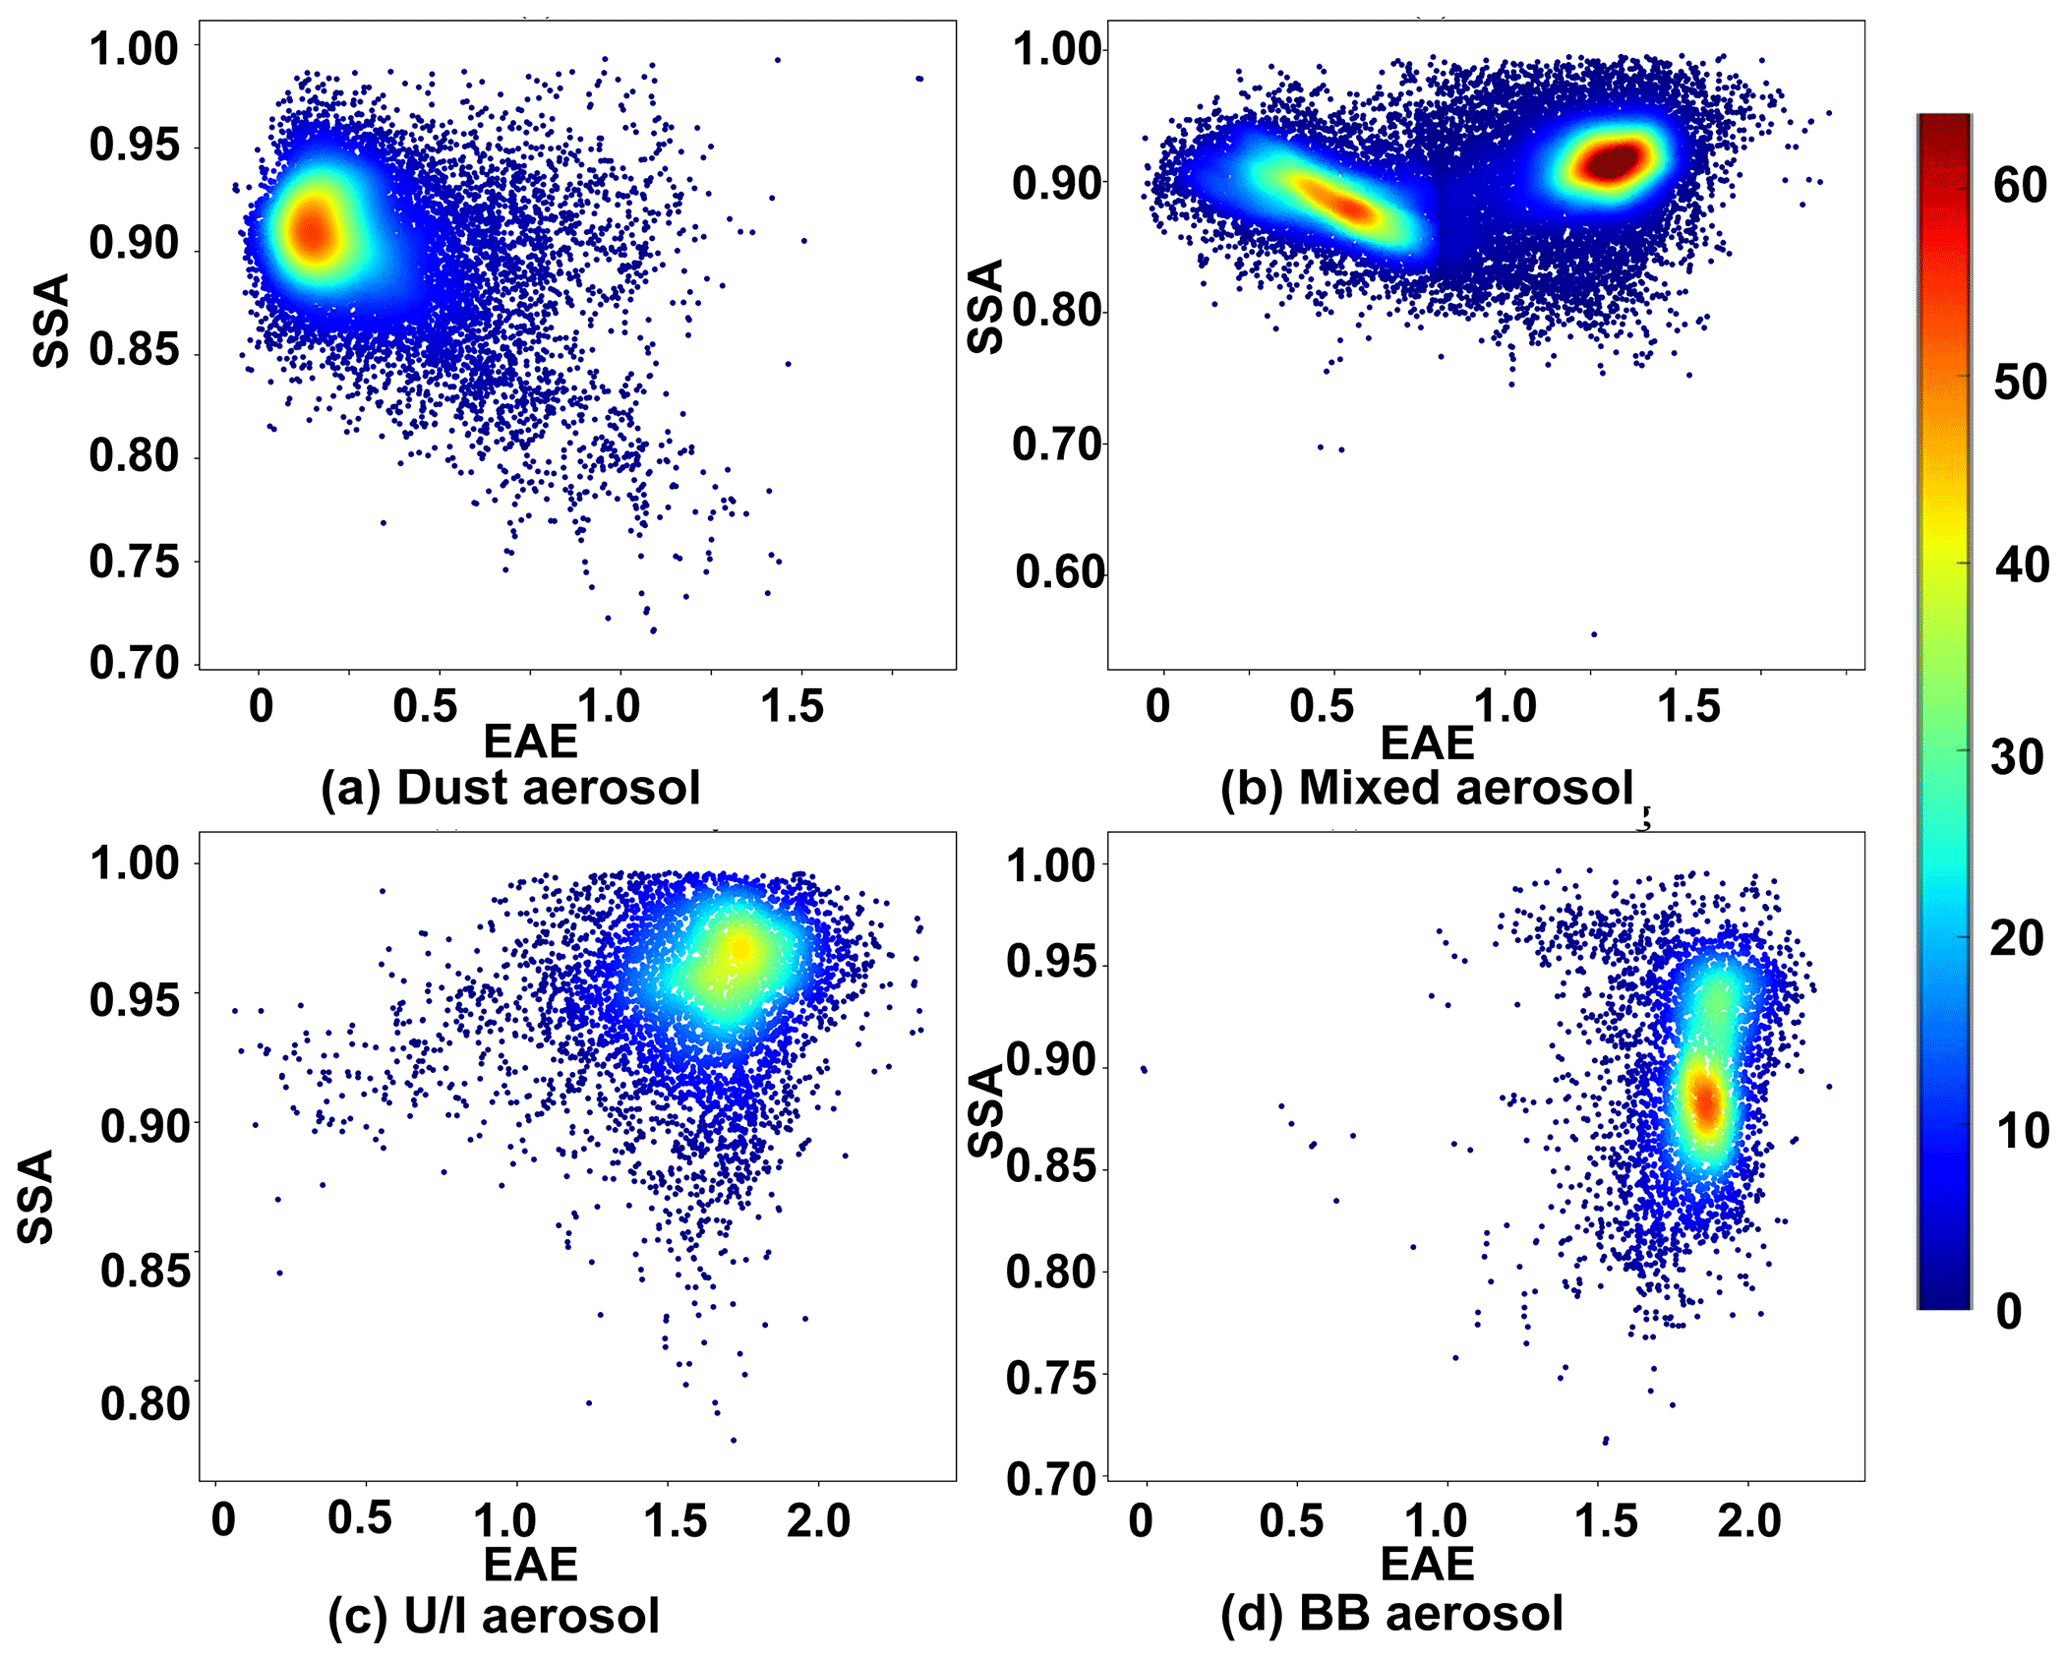
Figure 3The clustering distribution of EAE and SSA using the Gaussian kernel density clustering method for different aerosol types.
3.2 Aerosol optical database generation (stage 2)
In stage 2, the aerosol optical parameter database was built using the aerosol size distribution parameters, CRI, and Mie scattering model, featuring four major parameters (normalized-AOD, EAE, SSA, and g) at four wavelengths (440, 675, 870, and 1020 nm, respectively). The main reasons for constructing an aerosol optical parameter database instead of using the AERONET data directly are as follows: (1) many data are missed in AERONET, particularly those for sites dominated by biomass combustion, which does not meet the requirements for machine learning methods nor traditional aerosol-type identification algorithms; (2) calculating the optical properties of aerosols based on a fixed refractive index can accurately determine aerosol types. Therefore, once the aerosol spectral distribution parameters, such as effective radius, variance, and refractive index, are determined in stage 1, the aerosol optical parameter database can be constructed using the Mie scattering model in stage 2, assuming that aerosols are spherical particles. The Mie scattering model, known for its simplicity and practicality, provides an analytic solution to Maxwell's equations for light scattering by ideal spherical particles. It efficiently depicts the scattering and absorption properties of aerosols in the atmosphere, serving as fundamental basis for radiative transfer, lidar, and optical particle characterization (Ma, 2007; Bian et al., 2017; Michael et al., 1994).
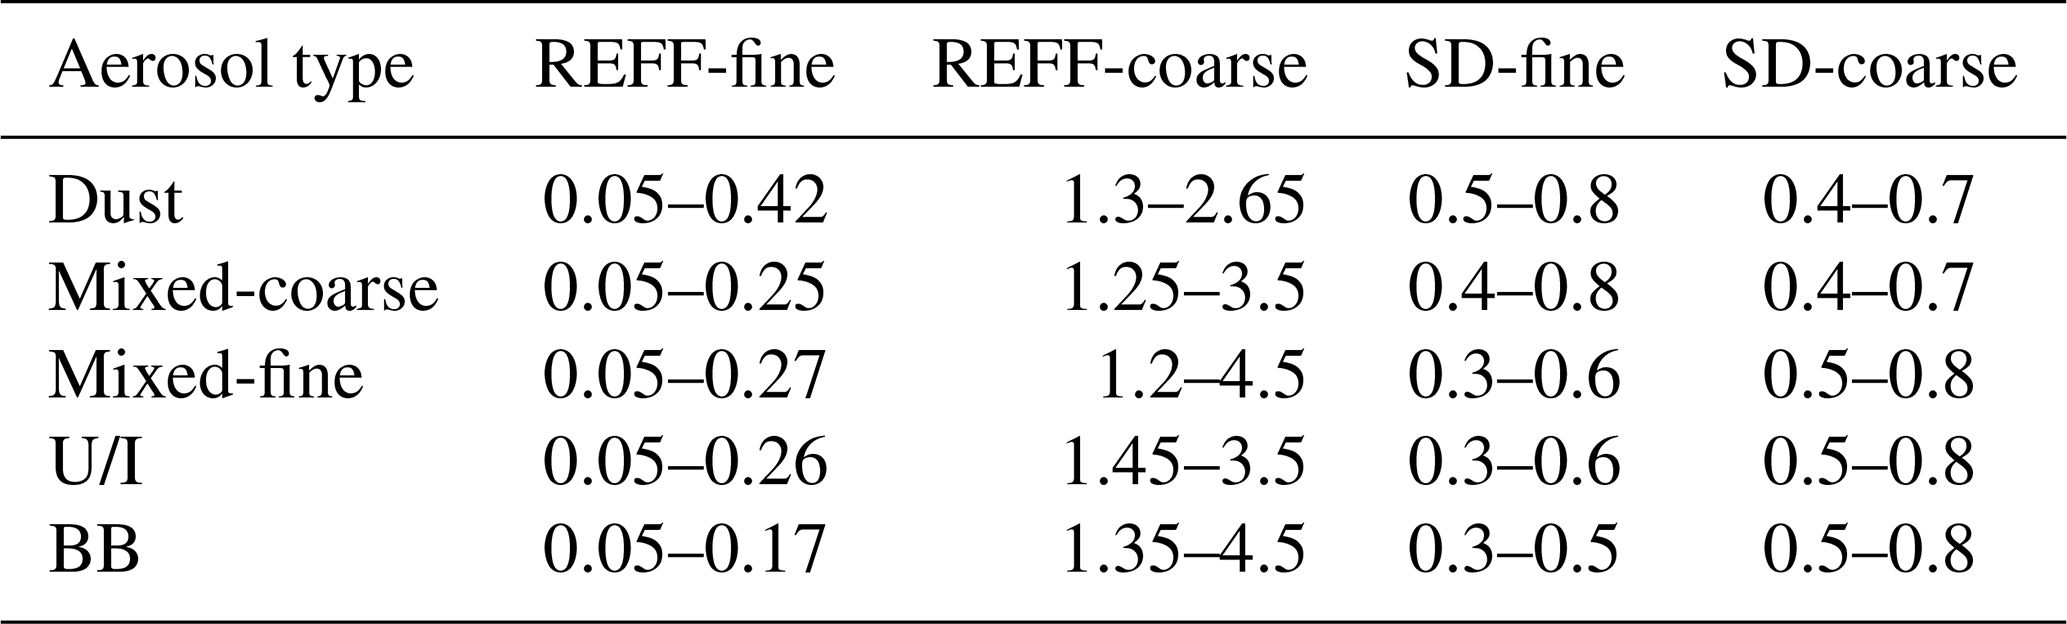
Table 3 presents the aerosol size distribution parameters, including the effective radius and standard deviation range for the five aerosol types in the coarse and fine modes, which were derived from the data window set by the Gaussian kernel density clustering algorithm. These aerosol size distribution parameters and the median CRI value were utilized to construct the optical database for the Mie scattering model. Many studies have proven that it is a reliable model with the advantages of a lower computing load and a high calculation accuracy (Zhao et al., 2020; Fu et al., 2009; Quirantes et al., 2019; Nandan et al., 2021).
Table 3Size distribution parameters of five aerosol types in coarse and fine modes (unit: µm).
The Mie scattering model has various size distribution functions, including lognormal, power-law, and bimodal lognormal distributions, which describe the aerosol type. According to the particle radii provided by AERONET, the size distributions of different aerosol types can be divided into coarse and fine modes. The bimodal lognormal function (Eq. 3) is reportedly the most suitable size distribution function for modeling the aerosol particle size distribution (Remer et al., 2009):
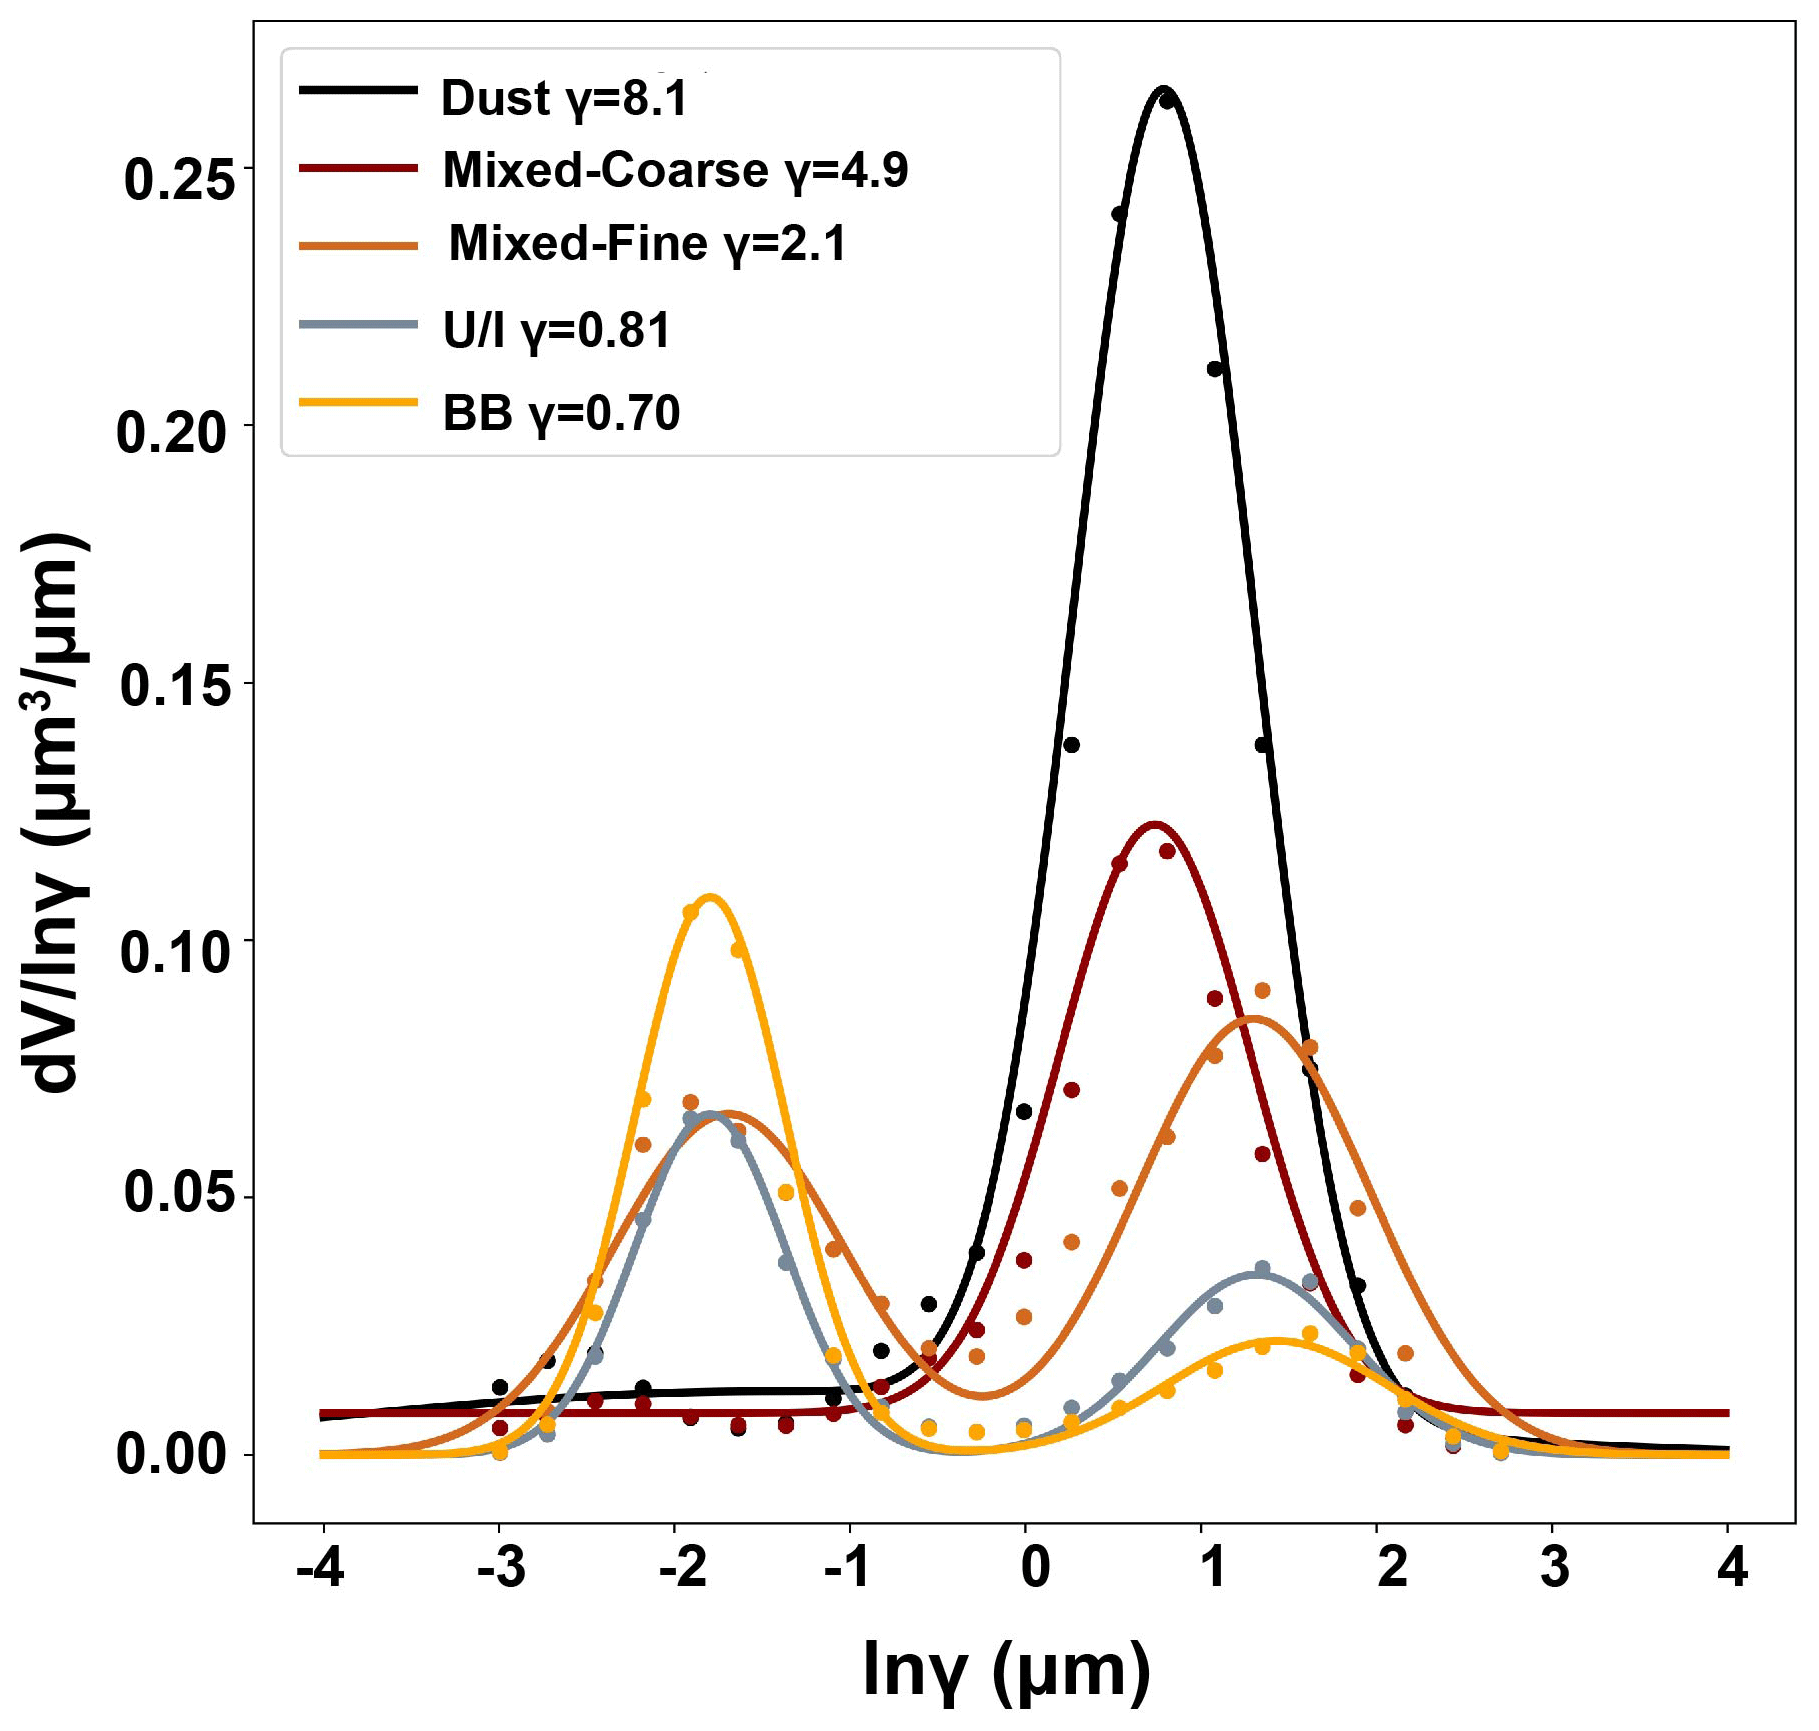
where n(r) represents the particle count at various radii; “constant” is obtained by fitting; and denote the radii and and are the variances for the coarse and fine aerosol modes, respectively; and γ, defined by volume distribution, represents the ratio of the coarse to fine mode in the bimodal normal distribution model, fitted using AERONET's volume distribution data, which averages standard aerosols post-clustering at training sites.
Figure 4 presents the volume distributions of five aerosol types, showing dust aerosols with a peak γ of 8.1 and radii concentrated around 1.5–2.0 µm. Additionally, the mixed-coarse aerosol with a radius in the range of 0.04–0.2 µm and 4.9 as the maximum value of γ are shown. The mixed-fine aerosol had two obvious peaks: one with a large radius, namely the coarse mode, of 2.2–3 µm and 2.1 as the peak point of γ and a second with a small radius of 0.1–0.22 µm and 0.14 as the peak point of γ. Moreover, the volume distributions of the U/I and BB aerosols were similar. Both had a relatively low range of γ values at large radii and relatively high values at small radii, with peak values of 0.81 and 0.7 for U/I and BB aerosols, respectively.
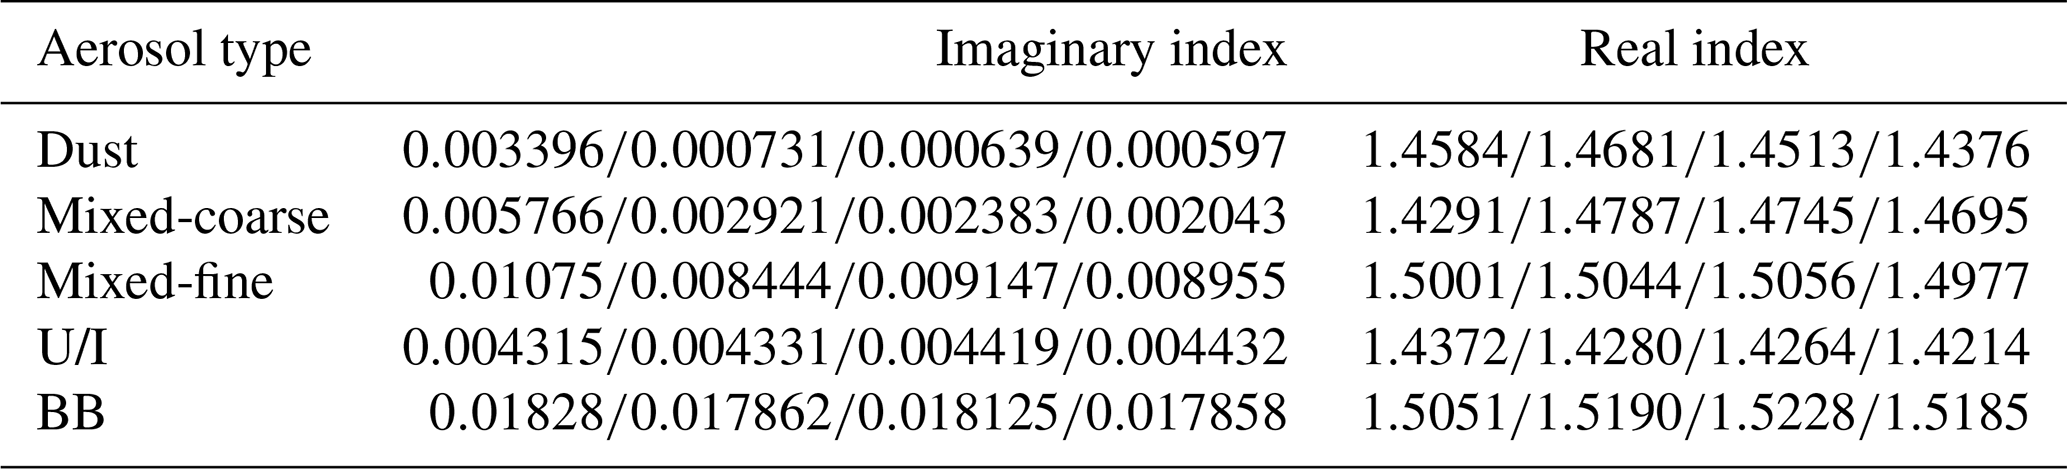
The CRI is an inherent optical property of aerosols. Aerosols in the real atmosphere are usually mixed with different types of particles, which a single refractive index cannot identify; however, the CRI represents the entire aerosol model in the atmosphere (Redemann et al., 2000). Ideally, the CRI and aerosol components can be mutually determined (Wu et al., 2021). The CRI can effectively characterize the main properties of the aerosols and accurately quantify the difference between aerosol-type identification algorithms. Table 4 depicts the standard CRI values for the five aerosol types obtained by calculating the median value of the CRI of the dominant aerosol type after Gaussian kernel density clustering. These values were used as a baseline for identifying the aerosol types in subsequent studies. As presented in Table 4, the minimum imaginary index part is represented by the dust aerosol with CRI values of 0.003396, 0.000731, 0.000639, and 0.000597 at 440, 675, 870, and 1020 nm, respectively, owing to the weakest absorption of dust aerosols. Moreover, the imaginary index part of the mixed-fine aerosols (0.01) was close to that of the BB aerosols (0.02) because of their similar absorption properties.
Table 4Real and imaginary index of the CRI for five aerosol types (bands: nm).
Lastly, by fixing the CRI, changing the size distribution, and using the Mie scattering model, we generated an aerosol optical property database for five aerosols, including the data for normalized-AOD, EAE, SSA, and g. In the aerosol optical property database, normalized AOD is the value obtained after eliminating the influence of the aerosol concentration. The AOD was obtained from the extinction cross section (Cext) calculated using the Mie scattering model in Eqs. (3) and (4), where βext is the extinction coefficient, n(r) is the aerosol spectral distribution, and N(z) is the variation in aerosol concentration with height. Notably, the effect of the aerosol concentration needs to be removed from the AOD when referring to aerosol optical properties. The AOD was normalized by dividing the aerosol optical thickness at the four wavelengths by the optical thickness at 440 nm. The other parameters (EAE, SSA, and g) were calculated using Eqs. (6)–(8).
Here, τ440 and τ870 are the extinction optical depths of the aerosol at 440 and 870 nm, respectively; EAE440–870 nm is the extinction Ångström index from the 440 to 870 nm band; and Θ denotes the scattering angle.
3.3 Global aerosol-type identification and validation (stage 3)
In stage 3, the random forest model was introduced to the aerosol-type identification algorithm. The random forest model is an integrated model based on classification and regression trees, in which multiple trees are aggregated using majority voting and averaging for classification and regression (Breiman, 2001). The model has a high prediction accuracy, excellent tolerance for abnormal values and noise, and a hard overfit. In a comparison by Fernandez-Delgado et al. (2014), the random forest algorithm ranked as the top performer among 179 classification algorithms. In addition, the evaluation matrix was brought into this study, and it further quantitatively assesses the performance of the Gaussian density clustering algorithm and the new hybrid algorithm. The metric indexes include accuracy, recall, precision, and F scores (Reddy et al., 2022). Here, the indexes are adjusted to micro-precision, micro-recall, micro-F1-score, and accuracy to solve the multi-classification problem. Micro refers to the weighted average of the five aerosol types rather than the arithmetic mean; due to the large difference in sample size among the five aerosol types, the arithmetic mean is highly susceptible to the influence of very large or very small aerosol-type sample sizes.
The input parameters for random forest model training, including SSA440 nm, SSA675 nm, SSA870 nm, SSA1020 nm, g440 nm, g675 nm, g870 nm, g1020 nm, normalized AOD675 nm, AOD870 nm, AOD1020 nm, and EAE440–870 nm, were selected from the aerosol optical property database, and the expected output values were the specific aerosol types. The random forest model was optimized, and the parameters were determined using the grid-searching method. The parameters, including n_estimators (classifier), max_depth, max_features (maximum feature value), and min_samples_leaf (minimum number of samples for nodes), were set as 160, 10, 12, and 12, respectively. Based on the trained and optimized model, the aerosol type of any AERONET site in different regions of the world can then be identified quickly. Generating an aerosol-type distribution map on a global scale is vital for regional and global climate studies as well as ground remote sensing.
4.1 Algorithm comparison
To demonstrate the effectiveness of the new hybrid algorithm, its performance was compared with that of the Gaussian kernel density clustering algorithm. Figure 5 shows the confusion matrix between the new hybrid and Gaussian kernel density clustering algorithms with respect to identifying aerosol types. The results of the new hybrid algorithm showed 90 % consistency with those from the Gaussian kernel density clustering algorithm in delineating dusty aerosols, indicating its efficiency in identifying dust. For mixed-coarse aerosols, the consistency reached 85 %, with 14 % identified as mixed-fine aerosols, 1 % identified as dust by the new hybrid algorithm, and 15 % identified as mixed-coarse aerosols by the Gaussian kernel density clustering algorithm. Similarly, for mixed-fine aerosols, both algorithms showed 84 % consistency, with 14 % identified as a mixed-coarse aerosol by the new hybrid algorithm and as a mixed-fine aerosol by the Gaussian kernel density cluster algorithm. Furthermore, both algorithms identified 84 % of U/I aerosols correctly, with the remaining 16 % identified as mixed aerosols (fine and coarse). Lastly, the classification of BB aerosols using these two methods was the same. Overall, the Gaussian kernel density clustering and new hybrid algorithms were consistent for dust, mixed-coarse, U/I, and BB aerosol identification.
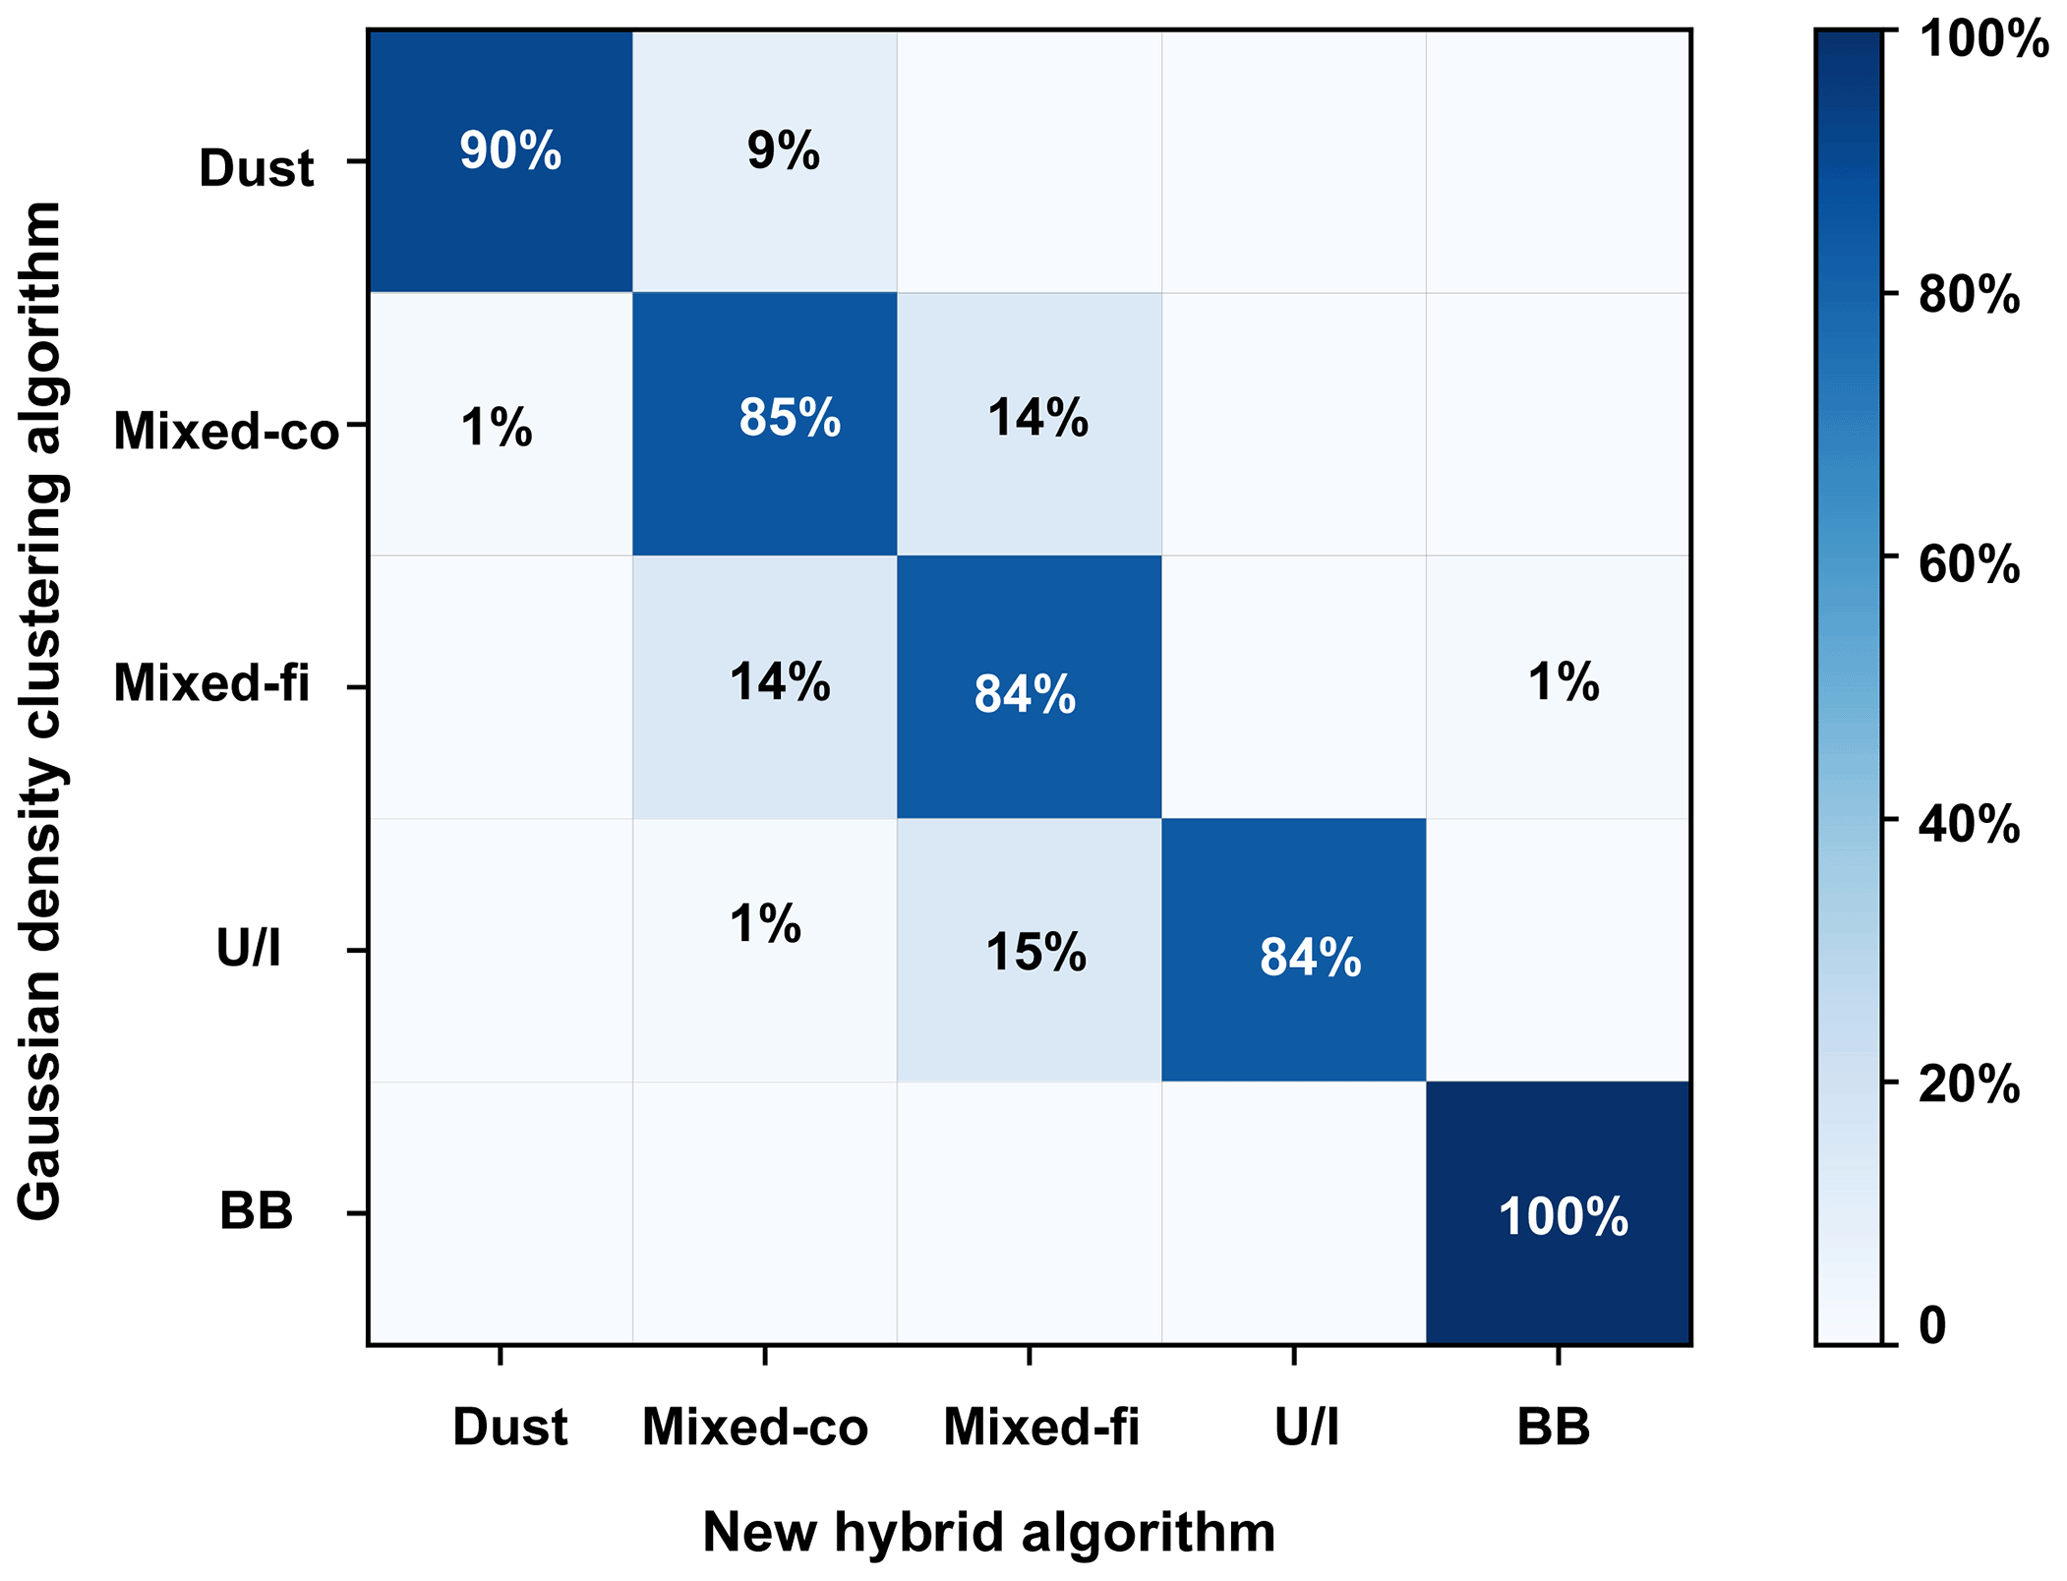
Figure 5A confusion matrix between Gaussian kernel density clustering and the new hybrid algorithm.
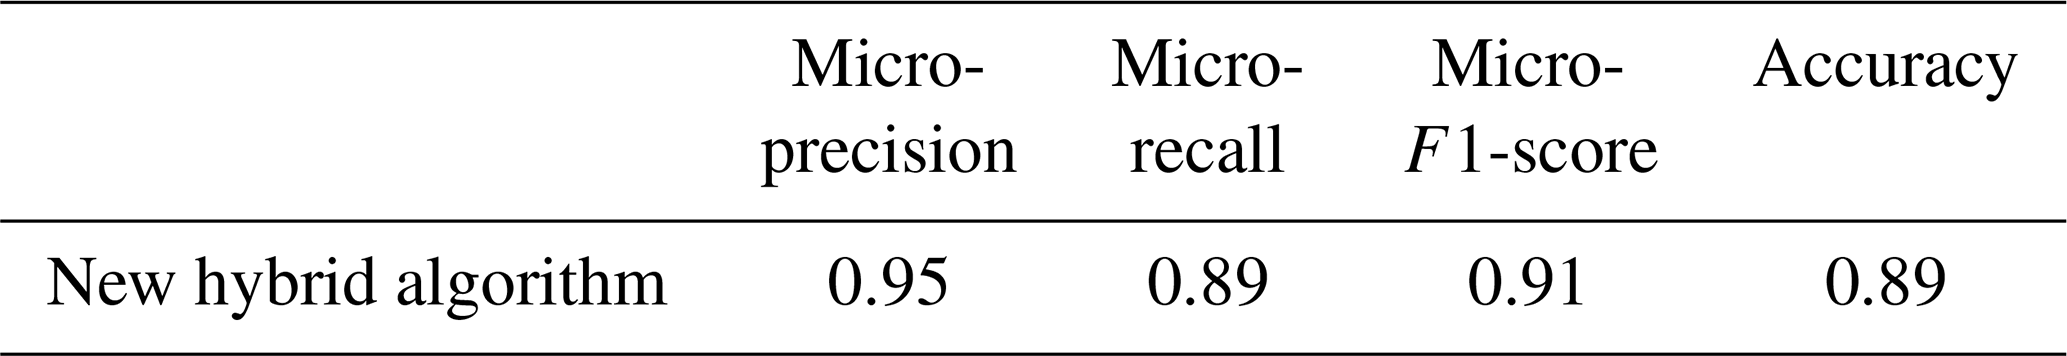
Table 5 shows the metric index value of the random forest algorithm in the new hybrid algorithm. The micro-precision, micro-recall, micro-F1-score, and accuracy are 0.95, 0.89, 0.91, and 0.89, respectively. These metrics are derived from the core values of the window, as determined by the Gaussian density clustering algorithm. Consequently, the strong performance of these indicators further confirms the efficacy and reliability of the newly developed hybrid algorithm.
Table 5Matrix evaluation between the new hybrid classification algorithm and the Gaussian kernel density clustering algorithm.
As described in Sect. 3, a specific aerosol type theoretically has a fixed CRI owing to its constant composition. The CRI characterizes the mixture composition of aerosol particles and is a key parameter controlling the inherent scattering and absorption characteristics of aerosol particles. To further analyze the accuracy of the new algorithm, the aerosol CRI was applied as a key criterion for aerosol identification. The CRI has two parts: imaginary and real. The imaginary part indicates radiation absorption by aerosols, with a small value signifying a small absorption. Because the radiation of aerosols is more dependent on the imaginary than the real part, the imaginary part is essential for inferring the optical properties and aerosol types. Hence, we compared the real and imaginary parts of the CRI calculated using the new hybrid and Gaussian kernel density clustering algorithms.
Figure 6 shows box plots of the aerosol CRI for dust, mixed-coarse, mixed-fine, U/I, and BB aerosols using the new hybrid classification and Gaussian kernel density clustering algorithms. Based on the principle that the CRI of aerosols is fixed under ideal conditions, the closer the median value of the CRI of the identified aerosol type is to the median value of the benchmark CRI, the more accurate the identification method. As shown in Fig. 6a and f, the median values of the CRI real part for dust aerosol are in the range of 1.45–1.53 at four bands, and those of the imaginary part are 0.003–0.004 at 440 nm; further, the values in other bands decrease rapidly as wavelength increases. The imaginary part of the CRI represents the absorption of light by aerosol, with a small absorption value indicating strong scattering. The results of the imaginary part are consistent with the spectral dependence properties of dust-based aerosols according to the wavelength. This is primarily because dust aerosols, composed of clay, quartz, and hematite, exhibit strong absorption in the blue band (440 nm) and low absorption in the visible and near-infrared bands. For the dust aerosols, the CRI determined by the two methods did not differ much. However, the median value of the CRI obtained using the new hybrid algorithm was slightly closer to the benchmark CRI than that obtained using the Gaussian kernel density clustering algorithm for dust aerosols. Therefore, the new hybrid algorithm was concluded to be more accurate with respect to identifying dust aerosol.
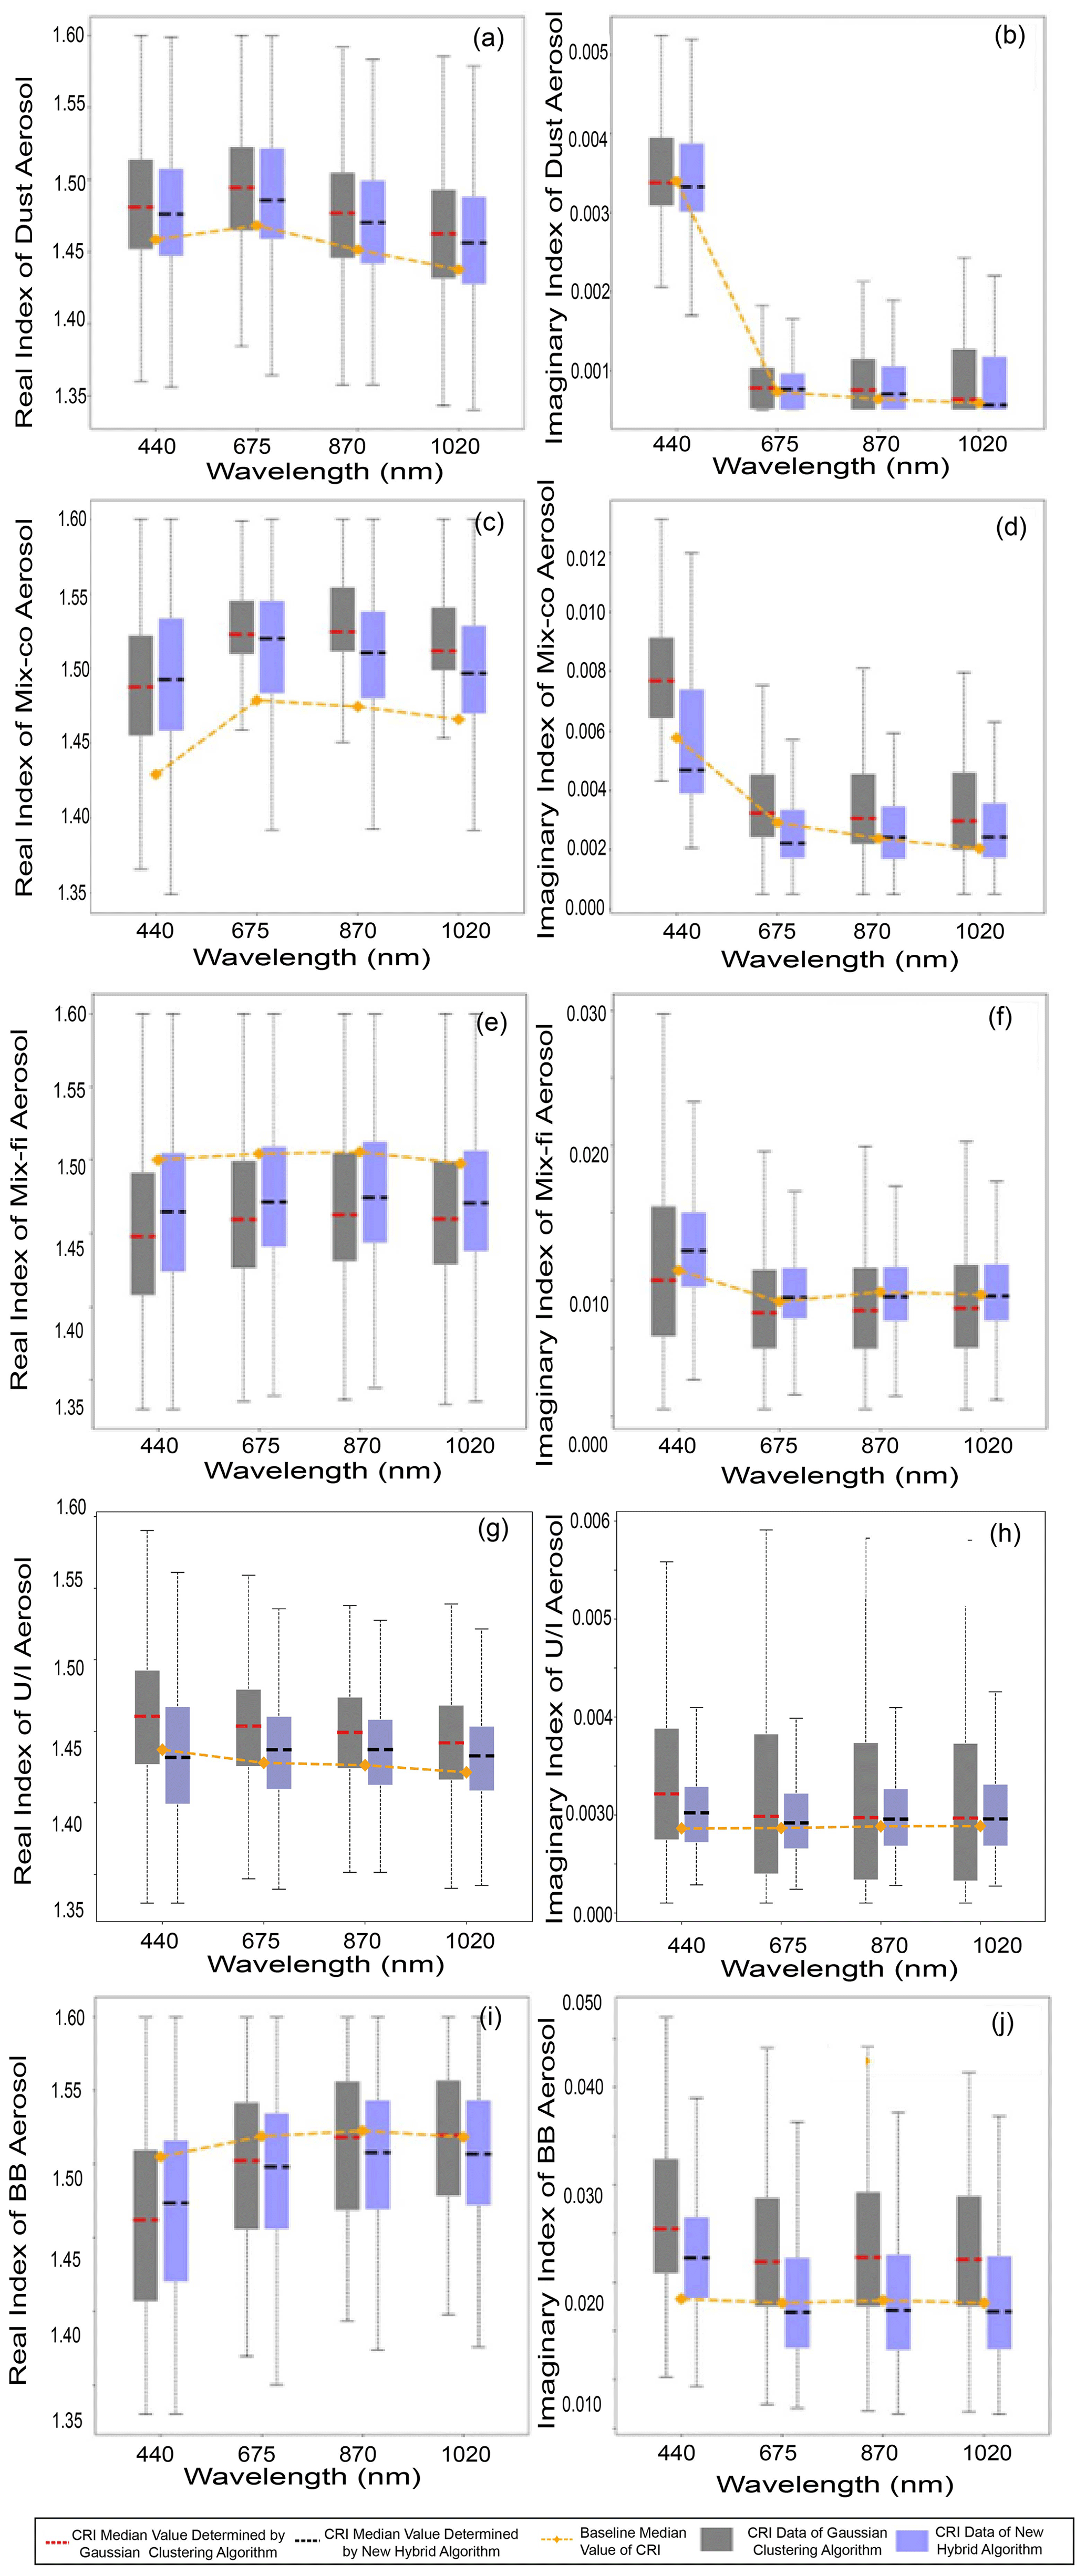
Figure 6Box plots of the real (a, c, e, g, i) and the imaginary (b, d, f, h, j) index of the CRI for (a, b) dust, (c, d) mixed-coarse aerosol, (e, f) mixed-fine aerosol, (g, h) U/I aerosol, and (i, j) BB aerosol identified by the Gaussian kernel density clustering algorithm and the new hybrid algorithm, respectively.
Figure 6b and g show that the median values of the CRI real part for mixed-coarse aerosol are between 1.47 and 1.55 at four bands using the new hybrid algorithm, whereas these values are between 1.44 and 1.50 at four bands determined by the Gaussian kernel density clustering algorithm; the imaginary part is between 0.006 and 0.009 at 440 nm. The median value of the hybrid algorithm was closer to the baseline median value than that of the Gaussian kernel density clustering algorithm for both the real and imaginary parts.
Figure 6c and h show the median value of the CRI real part for mixed-fine aerosols determined using the new hybrid and Gaussian kernel density clustering algorithms, which was 1.42–1.51 at four bands. This result is close to the range (1.44–1.52) reported by Wu et al. (2021) in Beijing using a random forest algorithm. The median CRI values of the real part at four bands and the imaginary part at the 675, 870, and 1020 nm bands were close to the baseline median value for the new algorithm. Additionally, the median value of the imaginary part was lower than that of the new hybrid algorithm and further from the baseline data for the identification of aerosol-type results mixed with 14 % coarse aerosols. Mixed-coarse aerosols result in weaker absorption. Hence, the new hybrid algorithm performed better with respect to identifying mixed-fine aerosols than the Gaussian kernel density clustering algorithm.
Similarly, as seen in Fig. 6d and i, the median value of the CRI real part for U/I aerosol identified using the new hybrid algorithm was 1.39–1.47. This median value was lower than that of the mixed-fine aerosols. This is because the real part indicates the absorption ability of aerosols, and the absorption ability of U/I aerosols was less than that of mixed-fine aerosols. For the imaginary part, the new hybrid algorithm also performed slightly better than the Gaussian kernel density clustering algorithm at the four bands.
For BB aerosols, the median value of the real part generated using the new hybrid algorithm differed slightly from that generated by the Gaussian kernel density clustering algorithm. Additionally, the median obtained using the Gaussian kernel density clustering algorithm was closer to the baseline. Furthermore, when analyzing the imaginary part, the new hybrid algorithm performed much better than the Gaussian kernel density clustering algorithm. Even with a 100 % concordance rate between the new hybrid and Gaussian kernel density clustering algorithms with respect to identifying BB aerosols, the refractive index still differed. This result indicates that 1 % of mixed-fine aerosols classified using the Gaussian kernel density clustering algorithm were correctly identified as BB aerosols by the new algorithm. Overall, these results demonstrate that the new algorithm is reliable.
Additionally, in this study, the 326 400 data points from the optical parameters database and the 98 000 observed data for calculation span from 1 January 1993 to 31 December 2021; the data pass through the Gaussian kernel density clustering algorithm and the new hybrid algorithm Python progresses and are archived on a personal Windows system computer (Intel® CoreTM i7-10710U,16G DDR4 2666 MHz, 512G PCIe SSD). The computational time for the two algorithms indicates that the new hybrid algorithm runs faster than the Gaussian kernel density clustering algorithm with huge quantities of data and advanced training; the new hybrid algorithm can obtain aerosol type in 20 s, whereas it would take 30 to 40 s to obtain aerosol type for one site using the Gaussian algorithm.
4.2 Aerosol-type determination for typical sites
4.2.1 Dust aerosol
Figure 7 shows the aerosol types obtained using the new hybrid algorithm for the five sites selected for dust aerosol identification. According to the prediction by the new hybrid algorithm, the aerosols at these five sites mainly contained dust aerosols; a small amount of U/I, mixed-fine, and BB aerosols; and a large amount of mixed-coarse aerosols. This shows that other types of aerosols, besides dust aerosol, invaded these areas. BB aerosols may have been transferred from the southern African savannah. Additionally, U/I aerosols could be from industrial cities, such as Dakar, Abidjan, and Lagos, which are dominated by anthropogenic aerosols and are close to the AERONET sites.
4.2.2 Mixed aerosol
Besides Ilorin in Africa, the mixed-aerosol AERONET sites, including Kanpur, Sede_Boker, and XiangHe, are in Asia. The aerosol types at these four sites were determined using the new hybrid algorithm (Fig. 8). Mixed-coarse aerosols dominated the Kanpur, Ilorin, and Sede_Boker sites, whereas mixed-fine aerosols dominated XiangHe. Part of the dust in XiangHe could be due to the Taklamakan Desert in spring and the westerly winds prevailing in western China, which transport dust aerosols over long distances. Additionally, the U/I aerosol in XiangHe could be a result of human activities, construction emissions, and fuel burning in winter. The BB aerosol was traced to the burning of a small amount of biomass in XiangHe, located in a suburban area.

Furthermore, excluding dust aerosols, we observed BB and U/I aerosols at the Kanpur site in the Ganges Basin of India. Certain amounts of U/I and dust aerosols were also observed in Sede_Boker, located in the industrial center of Israel, possibly from the Arabian Desert. Lastly, Ilorin had the most dust and least BB aerosols, as it is located in central Africa and often affected by the Sahara Desert and African savannah.
4.2.3 Urban/industrial aerosol
All of the selected AERONET sites for the evaluation of the performance of the new hybrid algorithm in terms of U/I aerosol identification are in Europe or North America (Fig. 9). GSFC is located in the densely populated and industrially developed area of Washington in the United States, explaining its complex aerosol type, which is dominated by U/I aerosol, a few mixed and BB aerosols, and a small amount of dust aerosol.
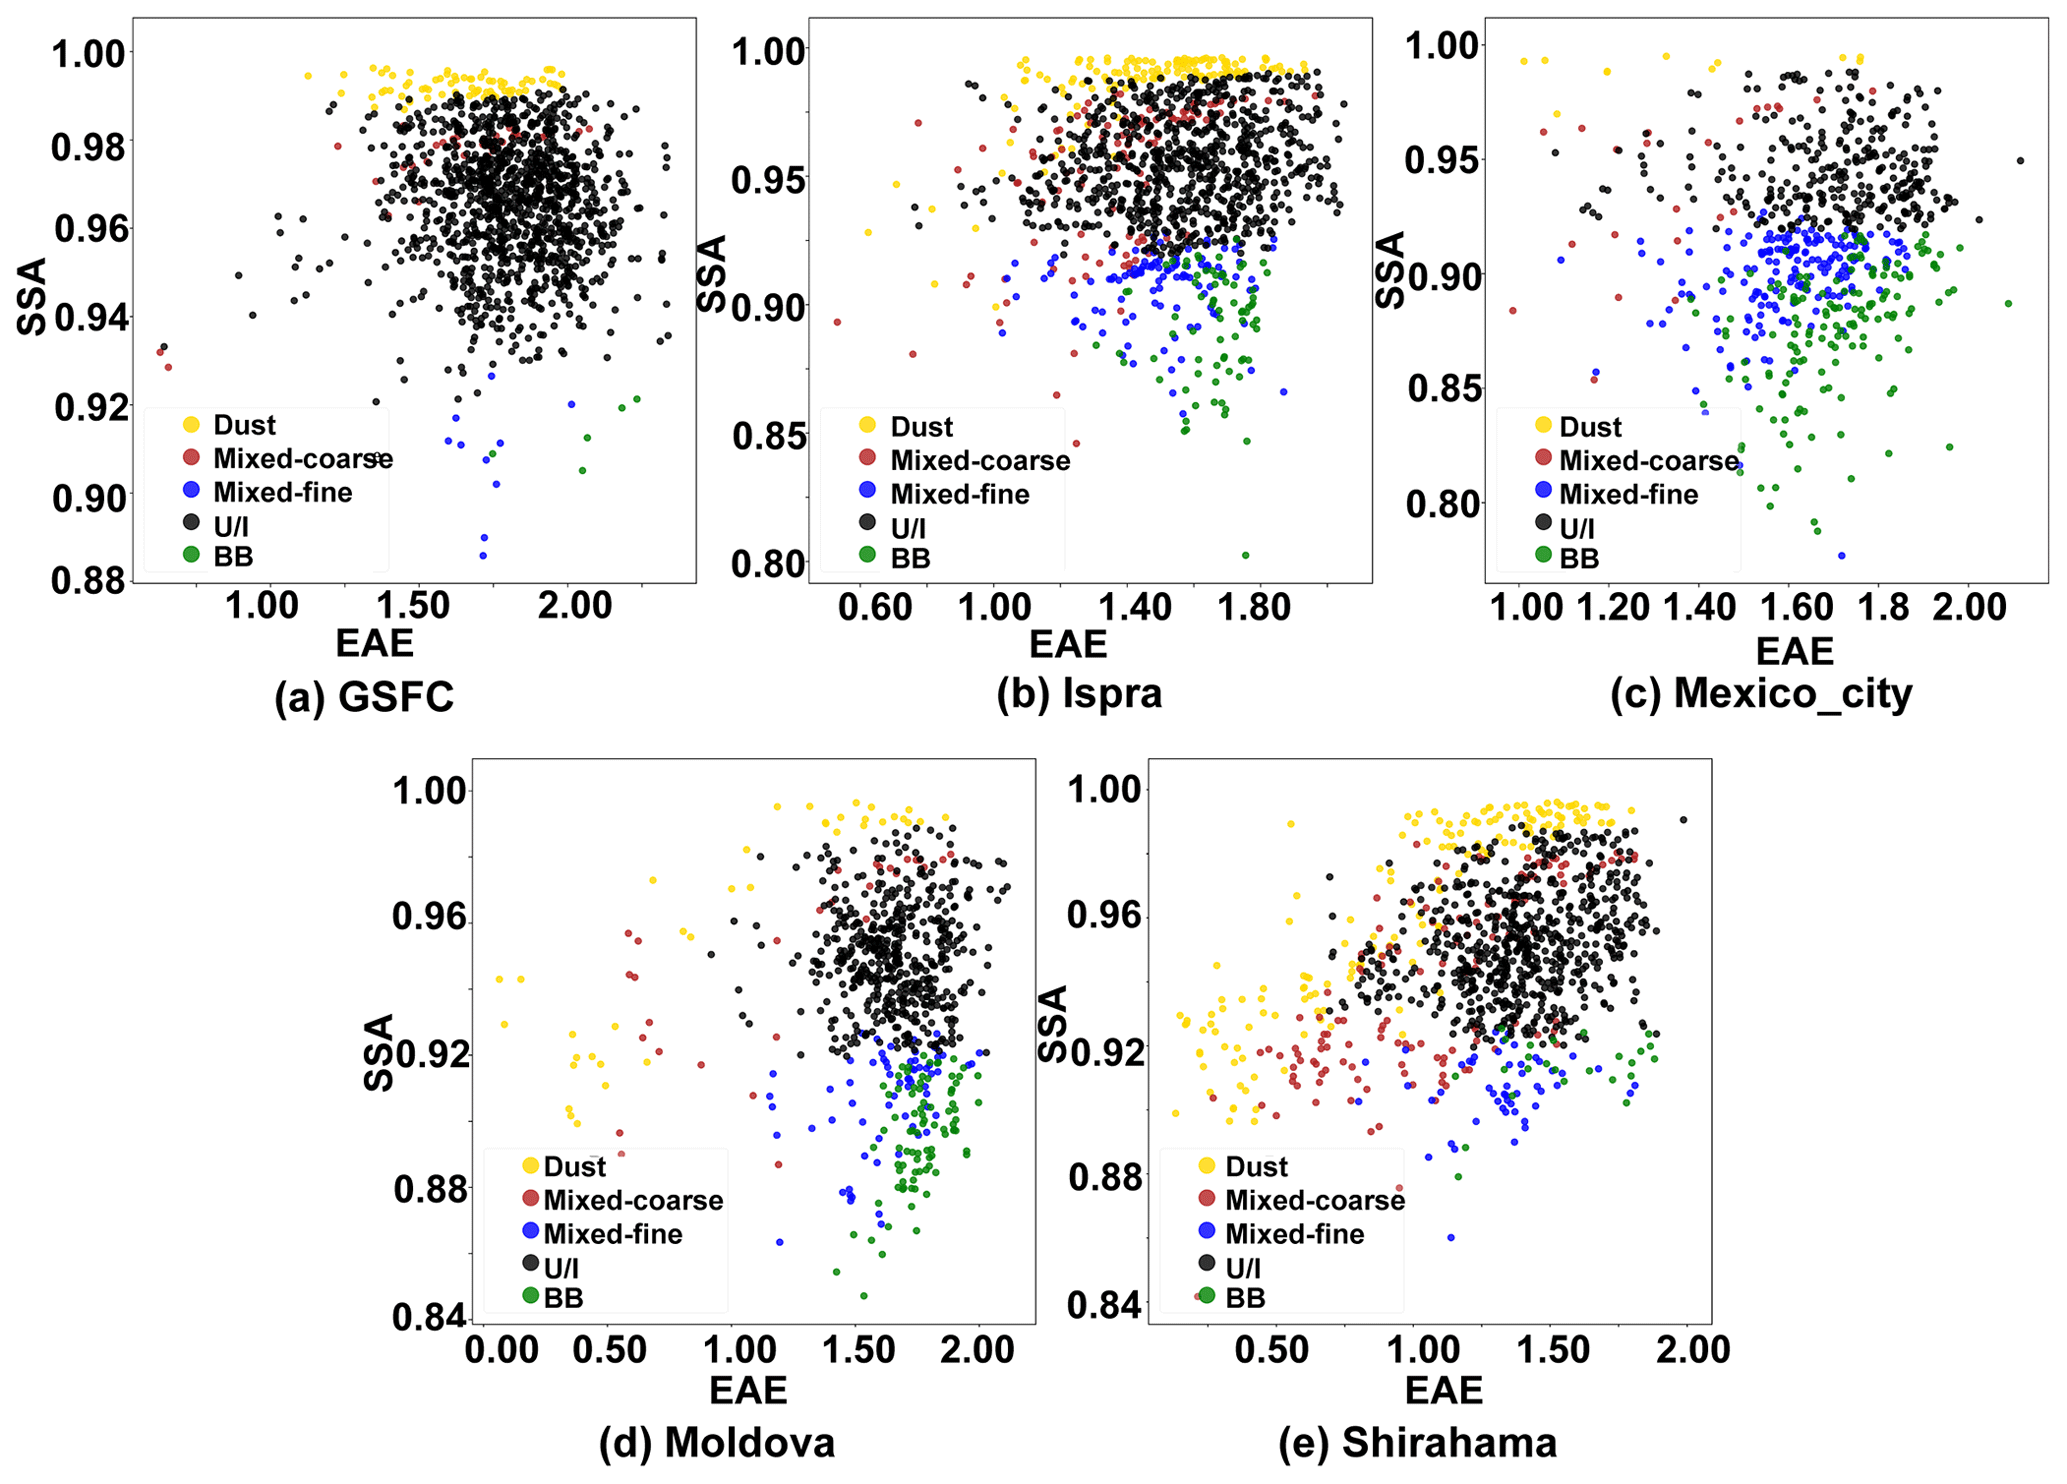
Ispra is in Turin, one of Italy's largest industrial centers. However, dust-type aerosols were identified, possibly transported from the Libyan Desert when Italian winters were controlled by southwesterly winds. Moreover, Mexico, where the Mexico_City site is located, is an industrialized country with modern industries and agriculture, abundant oil production, and a dense population. Nevertheless, we identified dust, mixed-coarse, and BB aerosols at this site using the new hybrid algorithm. These aerosol types could be from the Chihuahuan Desert, an inland desert covering 12 % of Mexico's area and a major source of coarse and dust aerosols. Additionally, the literature shows that Mexico City is surrounded by forested mountains, which experience many wildfires during the dry period between November and May; this accounts for BB aerosols in Mexico City (Yokelson et al., 2007). Finally, the BB aerosols identified at the Moldova site could be attributed to its rich vegetation cover.
4.2.4 Biomass burning aerosol
The selected sites were mainly located in the mountains and highlands. Figure 10 shows the aerosol types identified using the new hybrid algorithm. Large amounts of BB aerosols were identified at all sites. Additionally, small amounts of dust and mixed-coarse aerosols were identified at the Alta_Floresta site, transported over a long distance from the Patagonian Desert in Argentina, southern South America. Moreover, the city where the site is located is industrially developed and has a large population; therefore, more U/I aerosols were identified using the new hybrid algorithm. The geographically close Abracos_Hill and Alta_Floresta sites were characterized by the same aerosol type and source. Furthermore, one data point, Lake_Argyle, was classified as a dust aerosol. This means that, although the site is located on the Kimberley Plateau, Australia has a large desert area, and coarse aerosols still exist. Lastly, a few U/I-type and several dust-type aerosols were identified at the Mongu site, possibly caused by aerosol emissions from nearby cities and dust transport from the Sahara Desert.

4.3 Aerosol-type distribution on a global scale
Given the advantages and accuracy of the new hybrid algorithm with respect to identifying aerosol types, we used it to divide the data from AERONET sites in different regions of the world to obtain global aerosol-type distribution information. The aerosol types of each continent are shown in Figs. 11–15. Additionally, Fig. 16 shows the global aerosol-type distribution. Notably, a pie chart was placed on each site in the study; these charts denote a “point source” assessment of the aerosol type and do not represent the entire region (the size of the pie charts is independent of the optical properties). Moreover, the sites were screened, and only those with valid data of >100 aerosol types were considered; however, offshore sites and sites classified as being dominated by marine aerosol in other literature have been excluded.
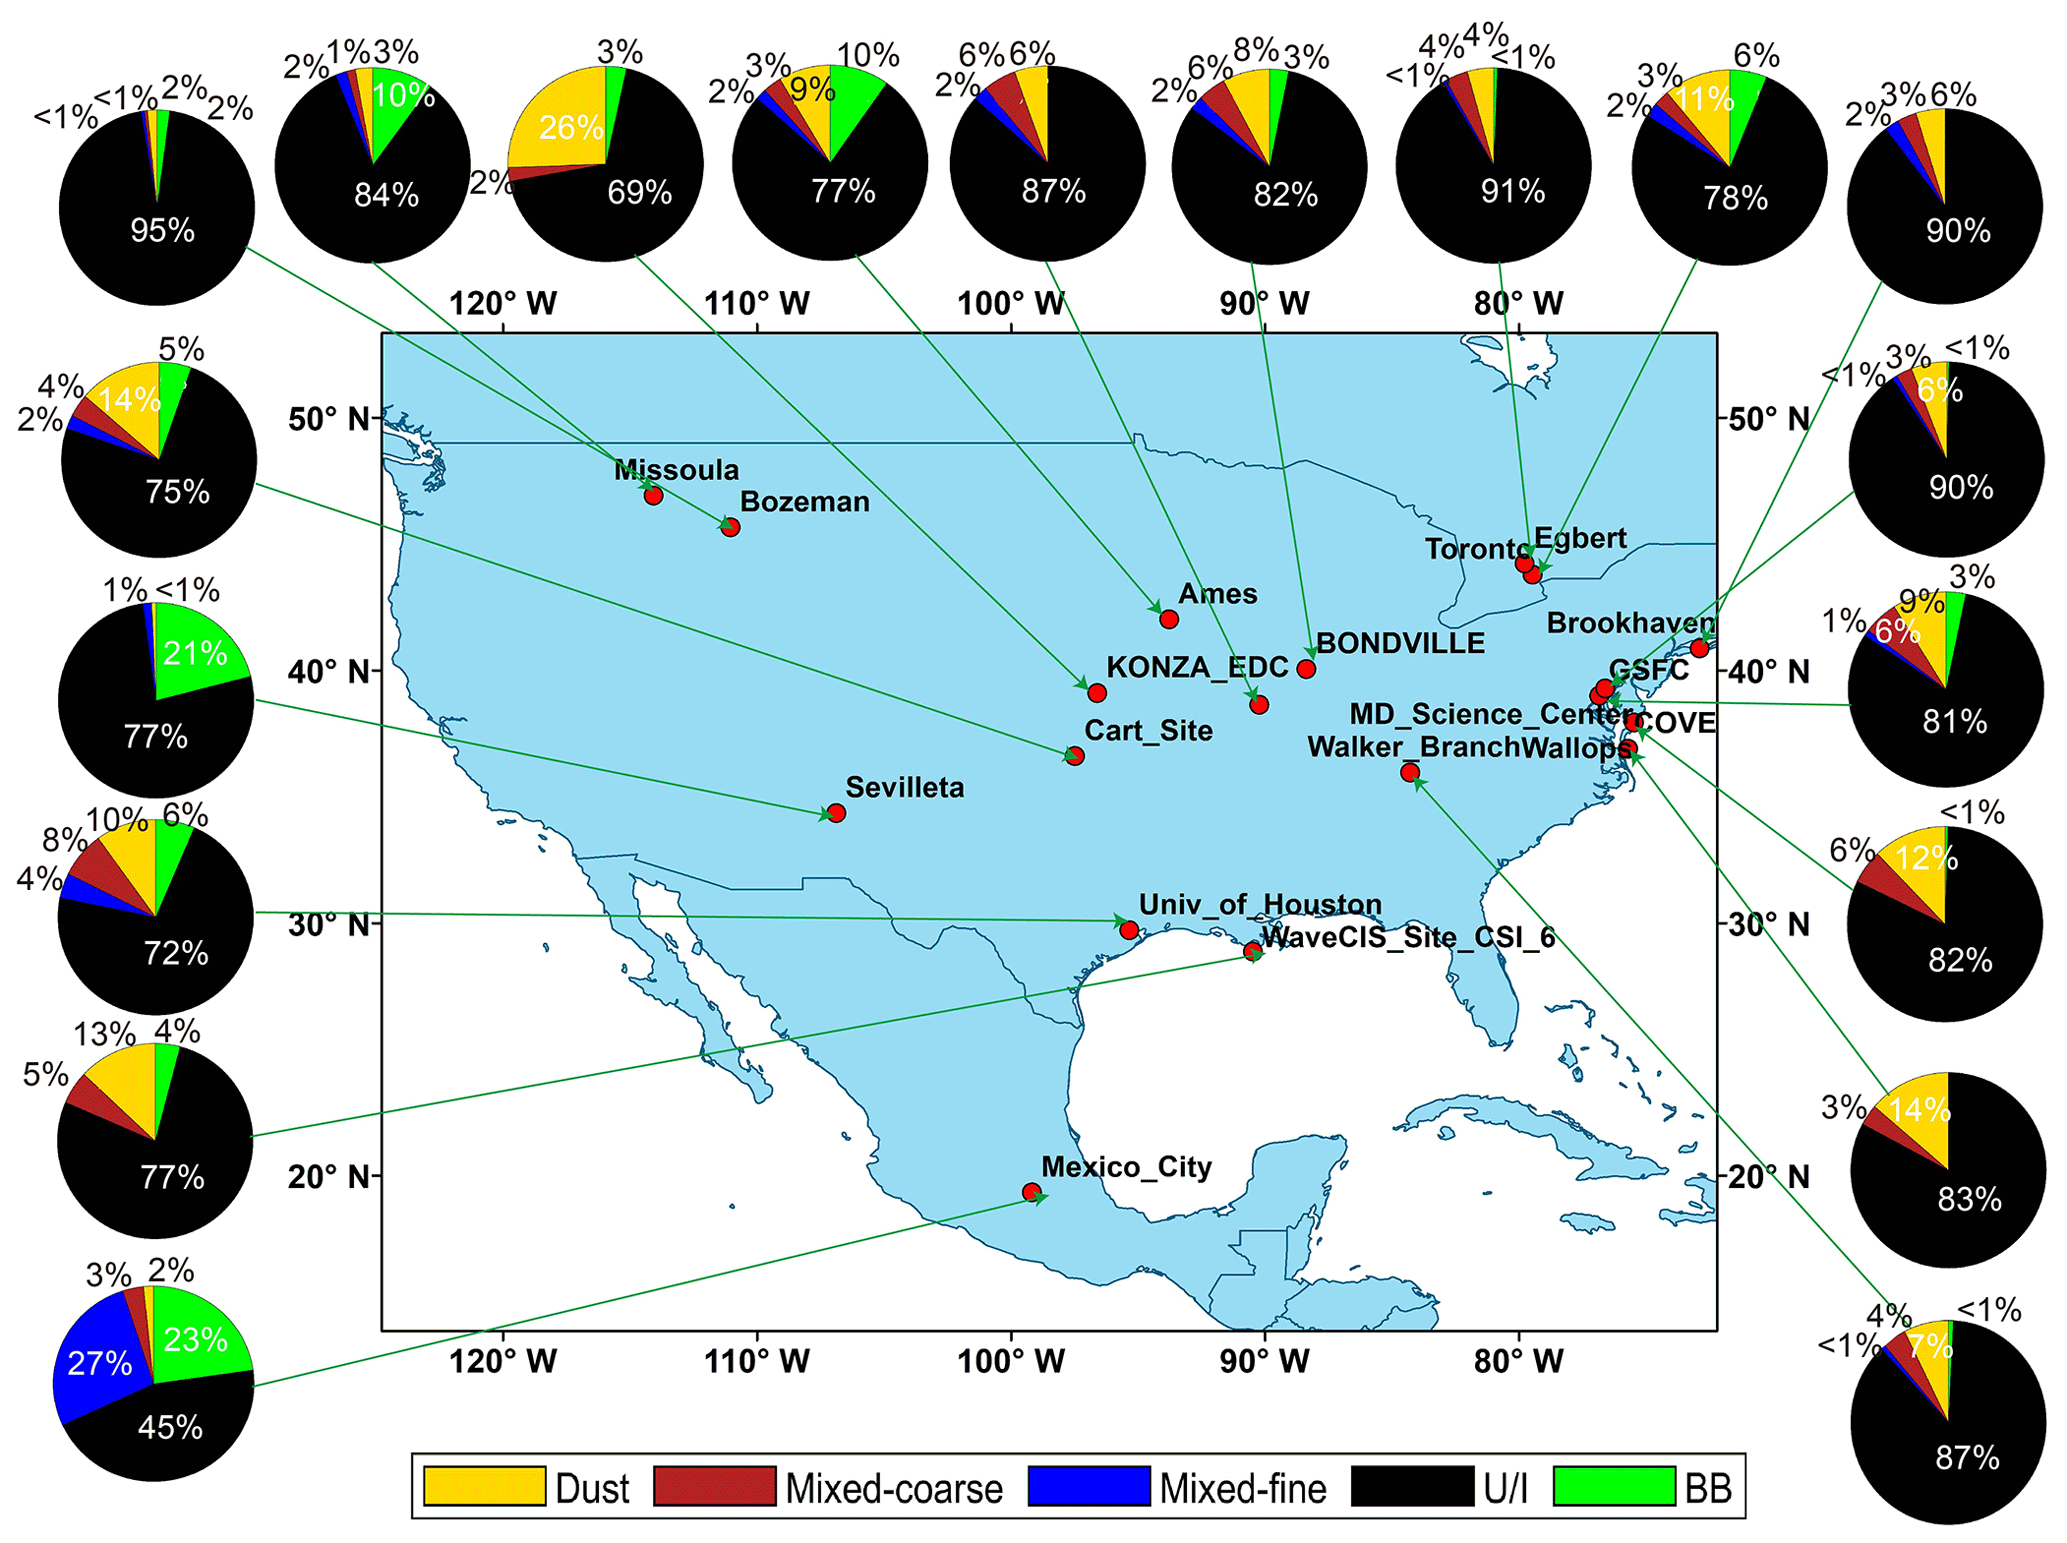
Figure 11Pie charts of the aerosol types at the major sites in North America.
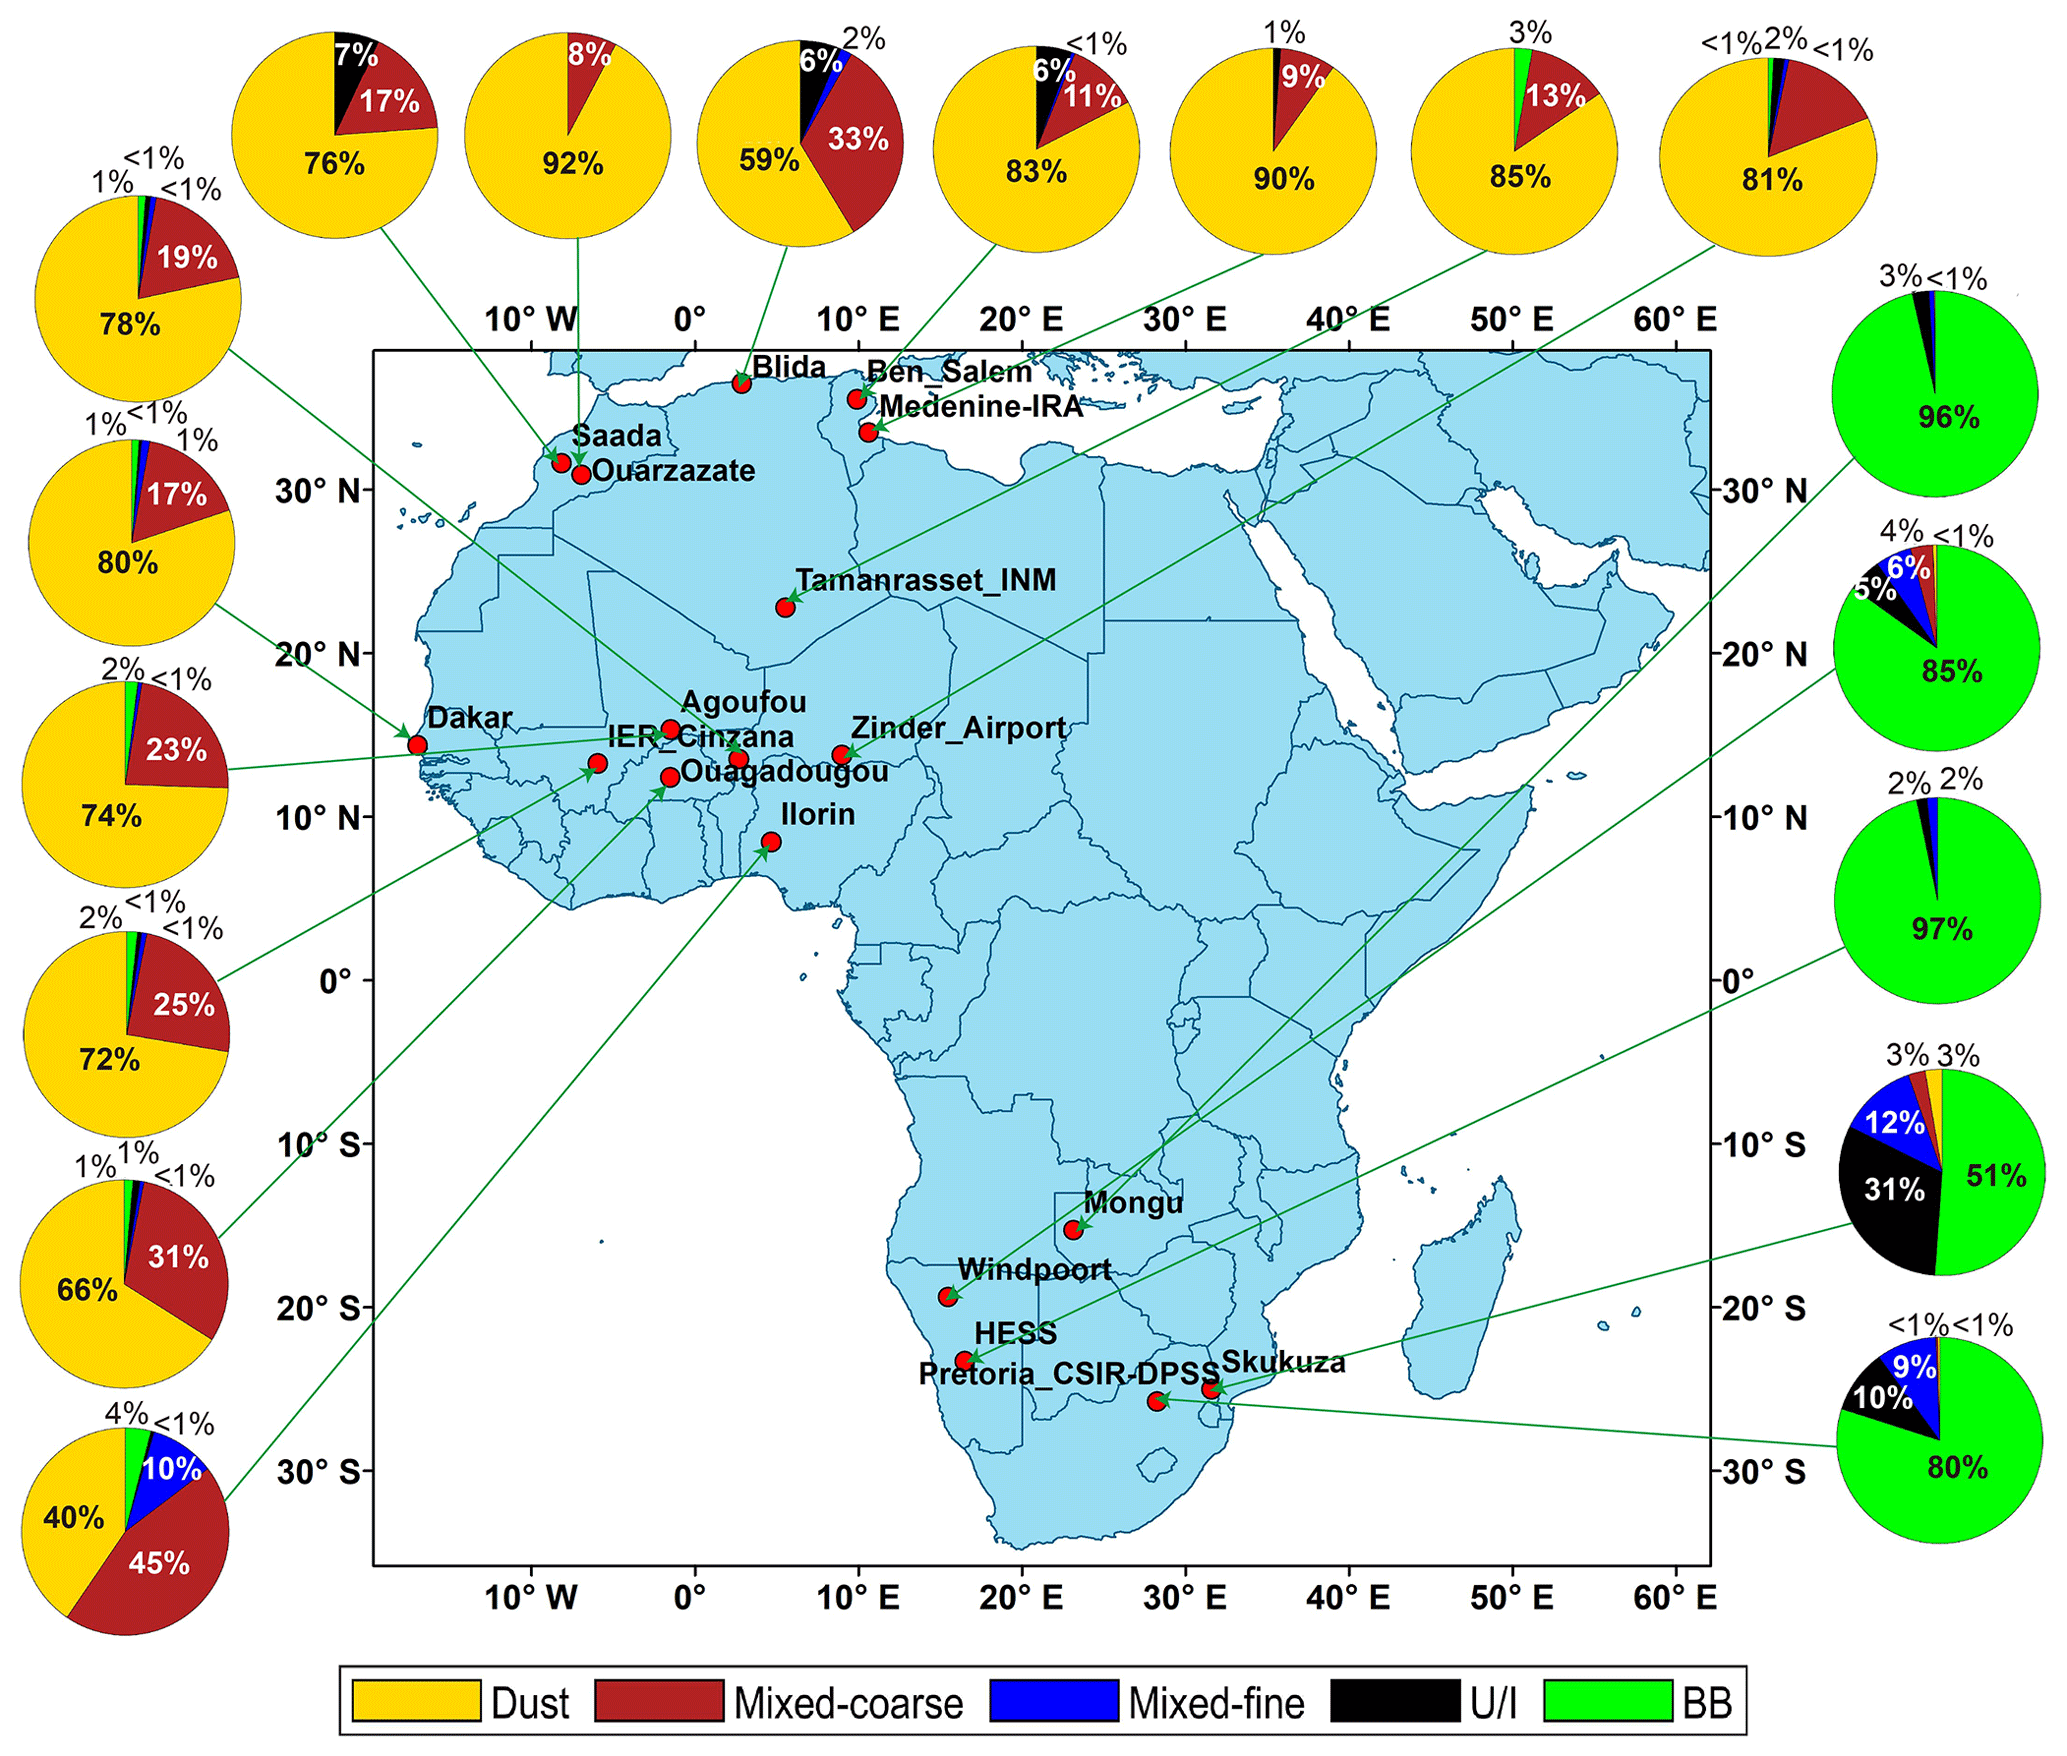
Figure 12Same as Fig. 11 but for Africa.
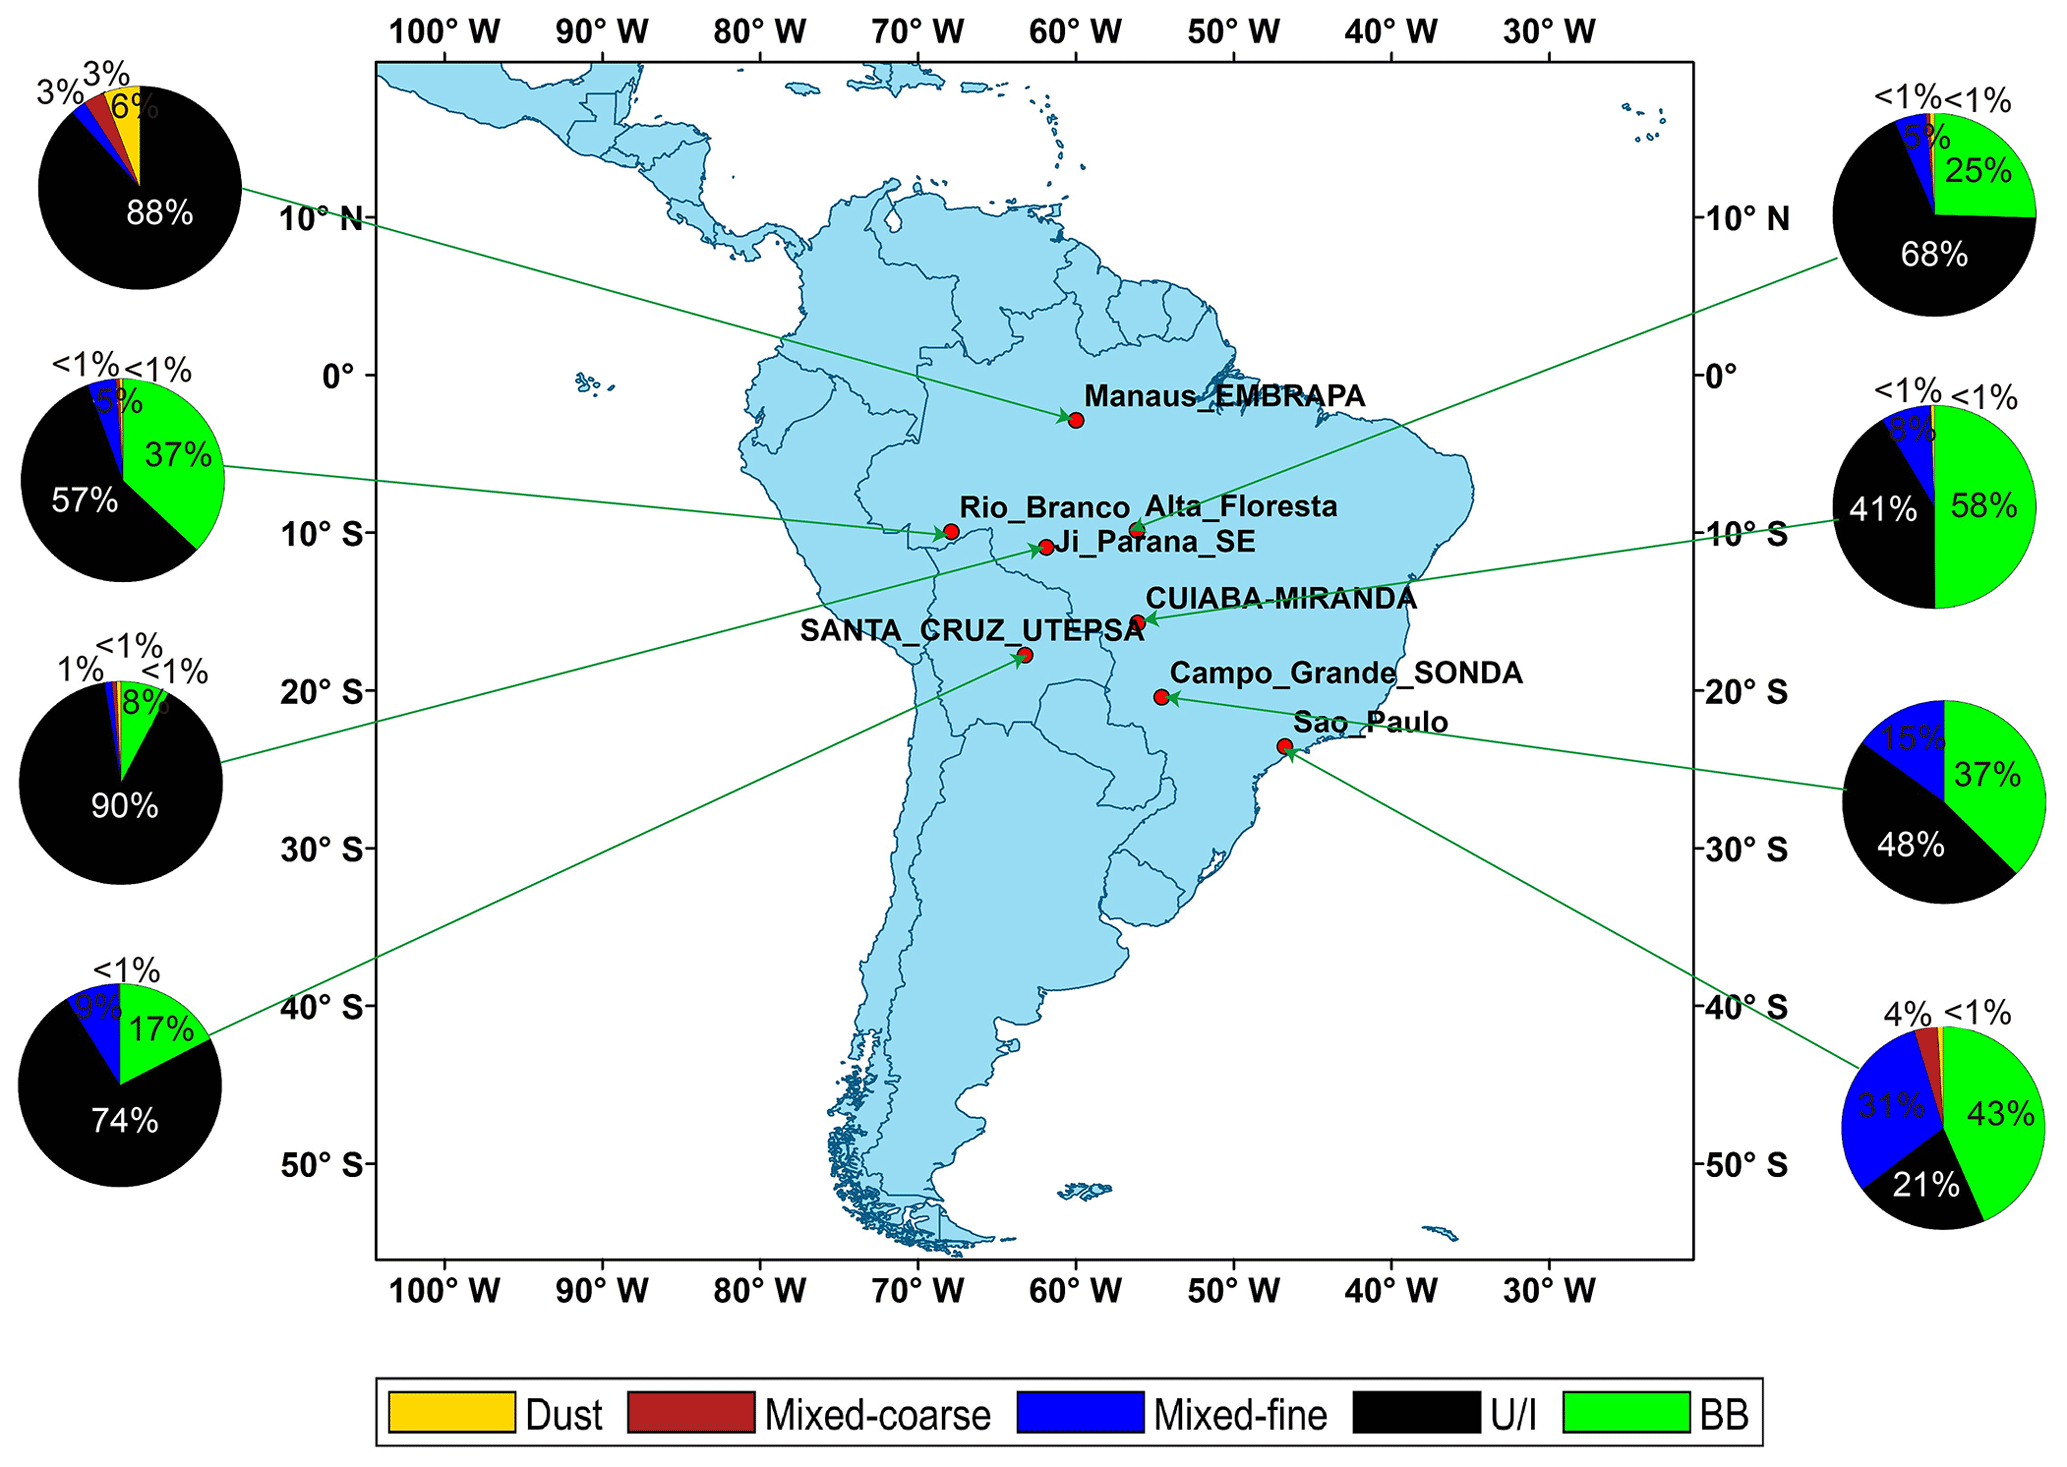
Figure 13Same as Fig. 11 but for South America.
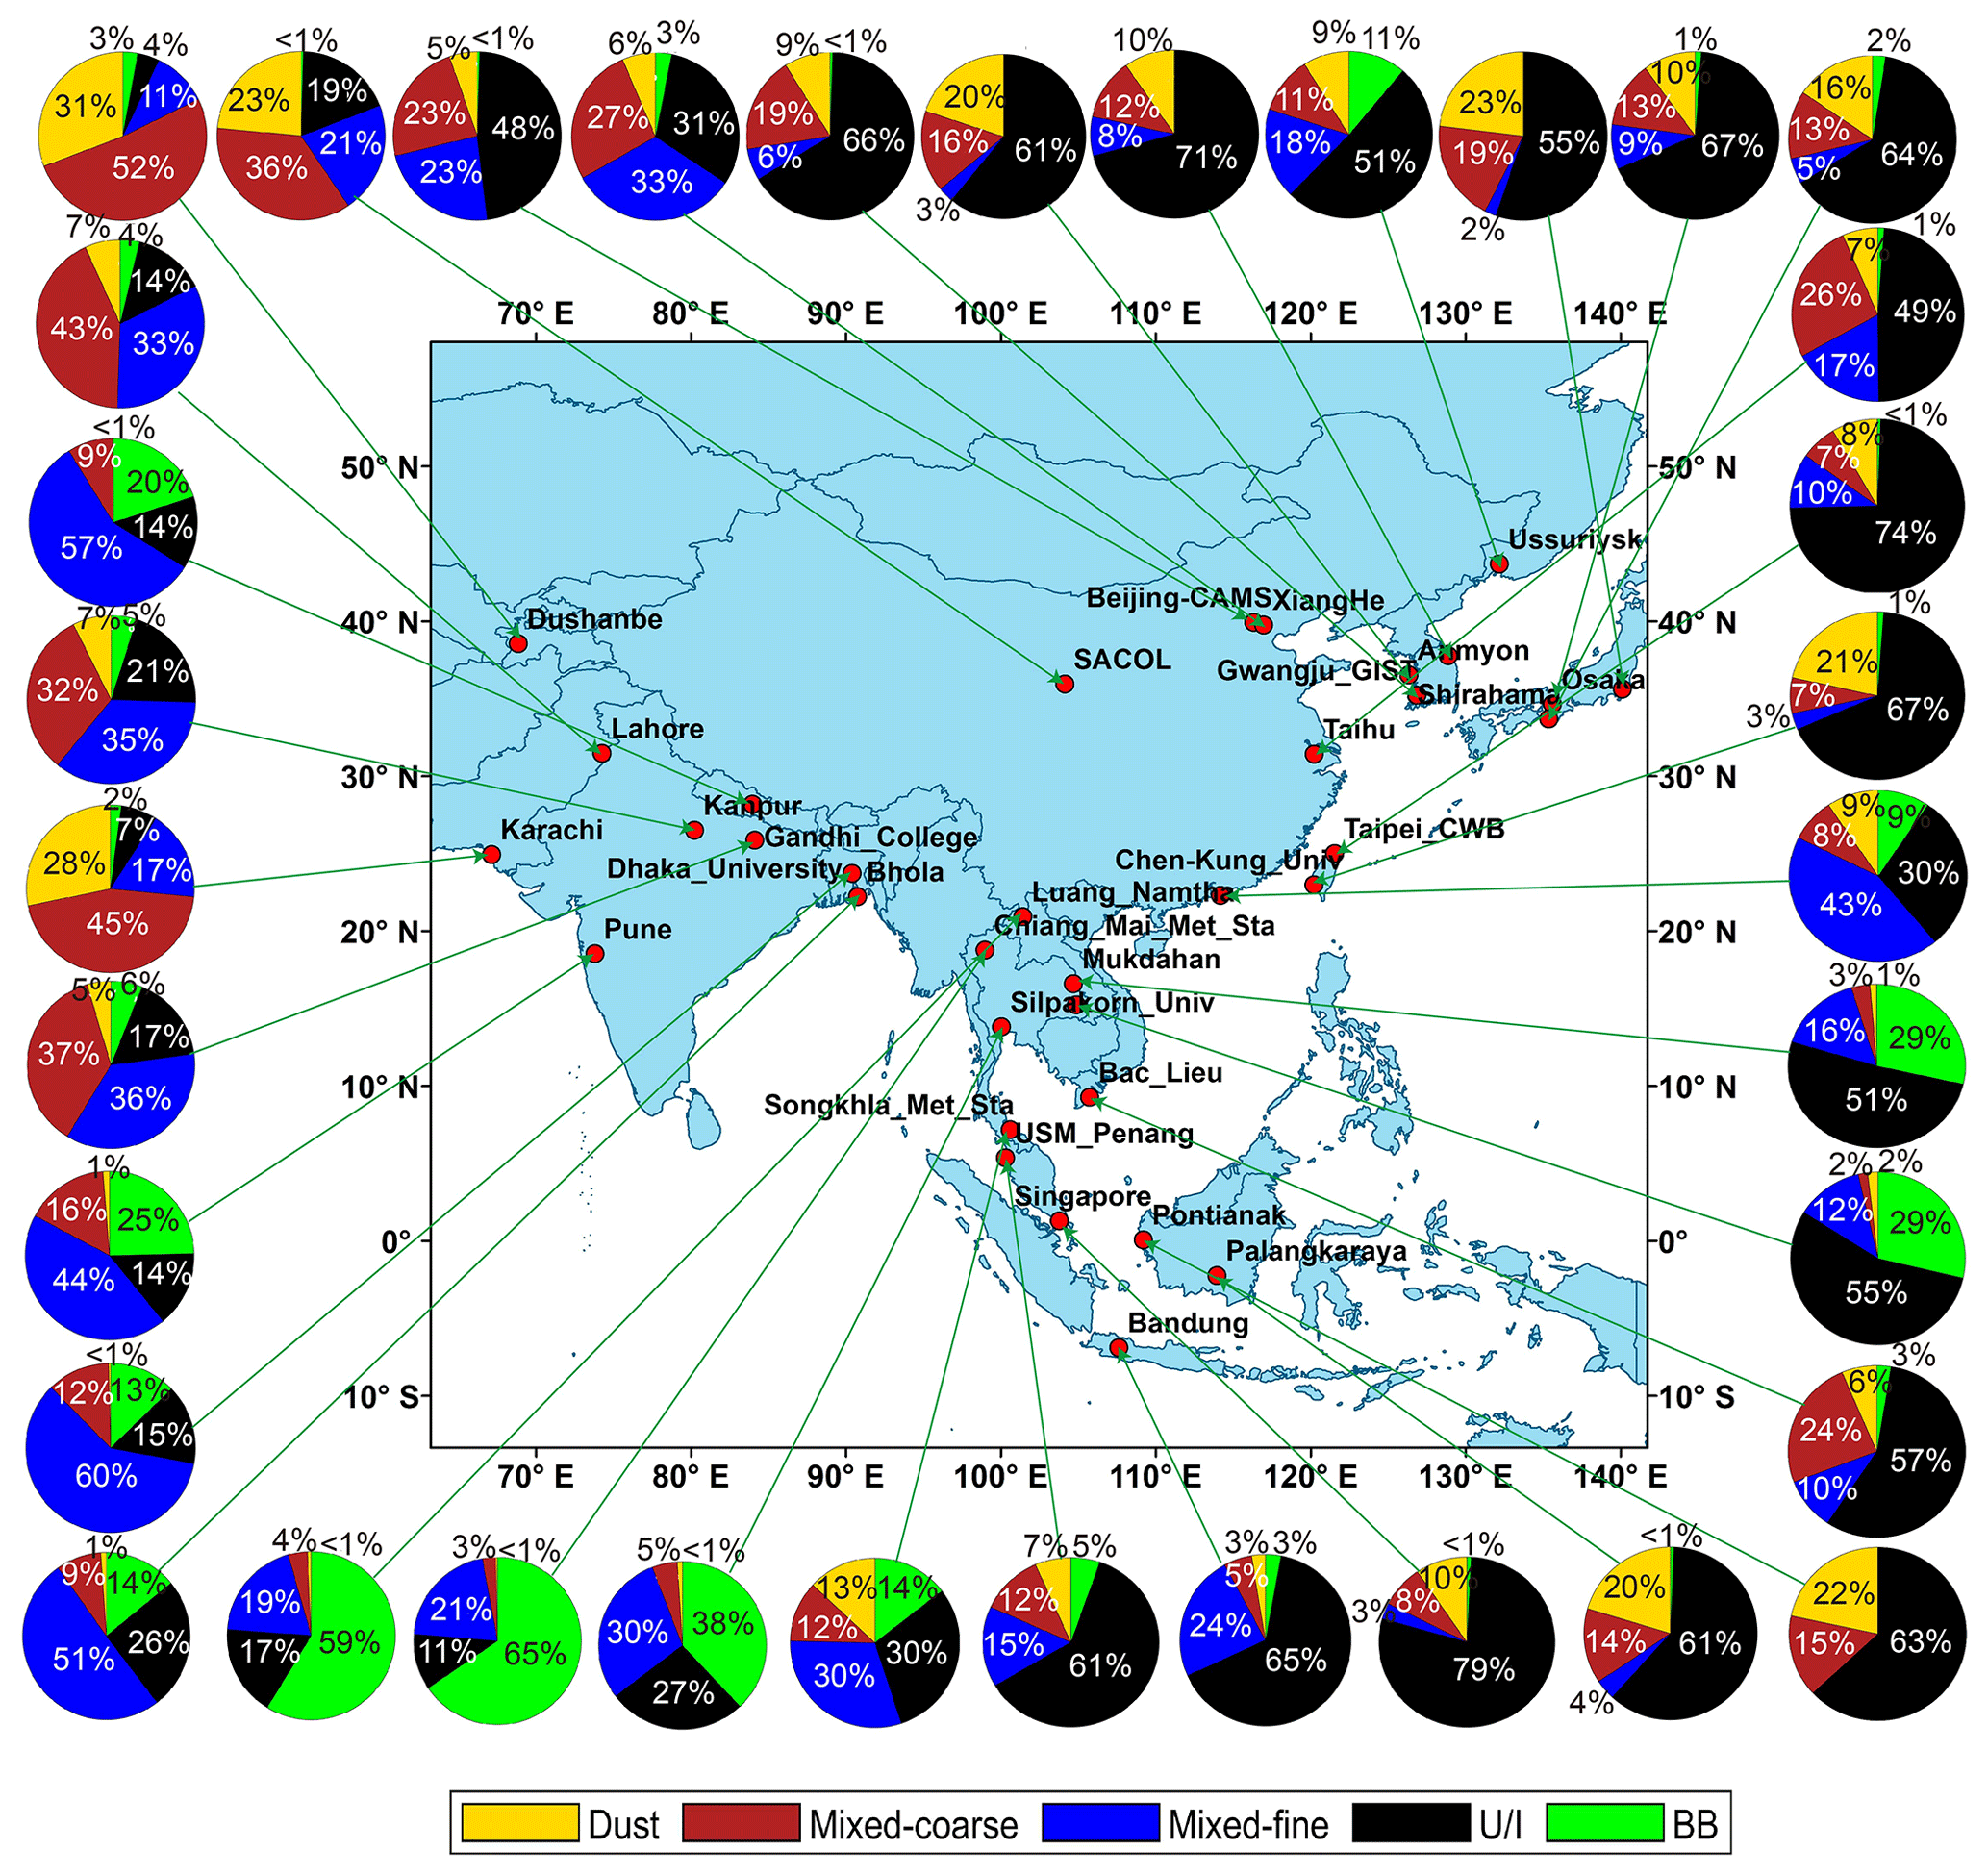
Figure 14Same as Fig. 11 but for Asia.
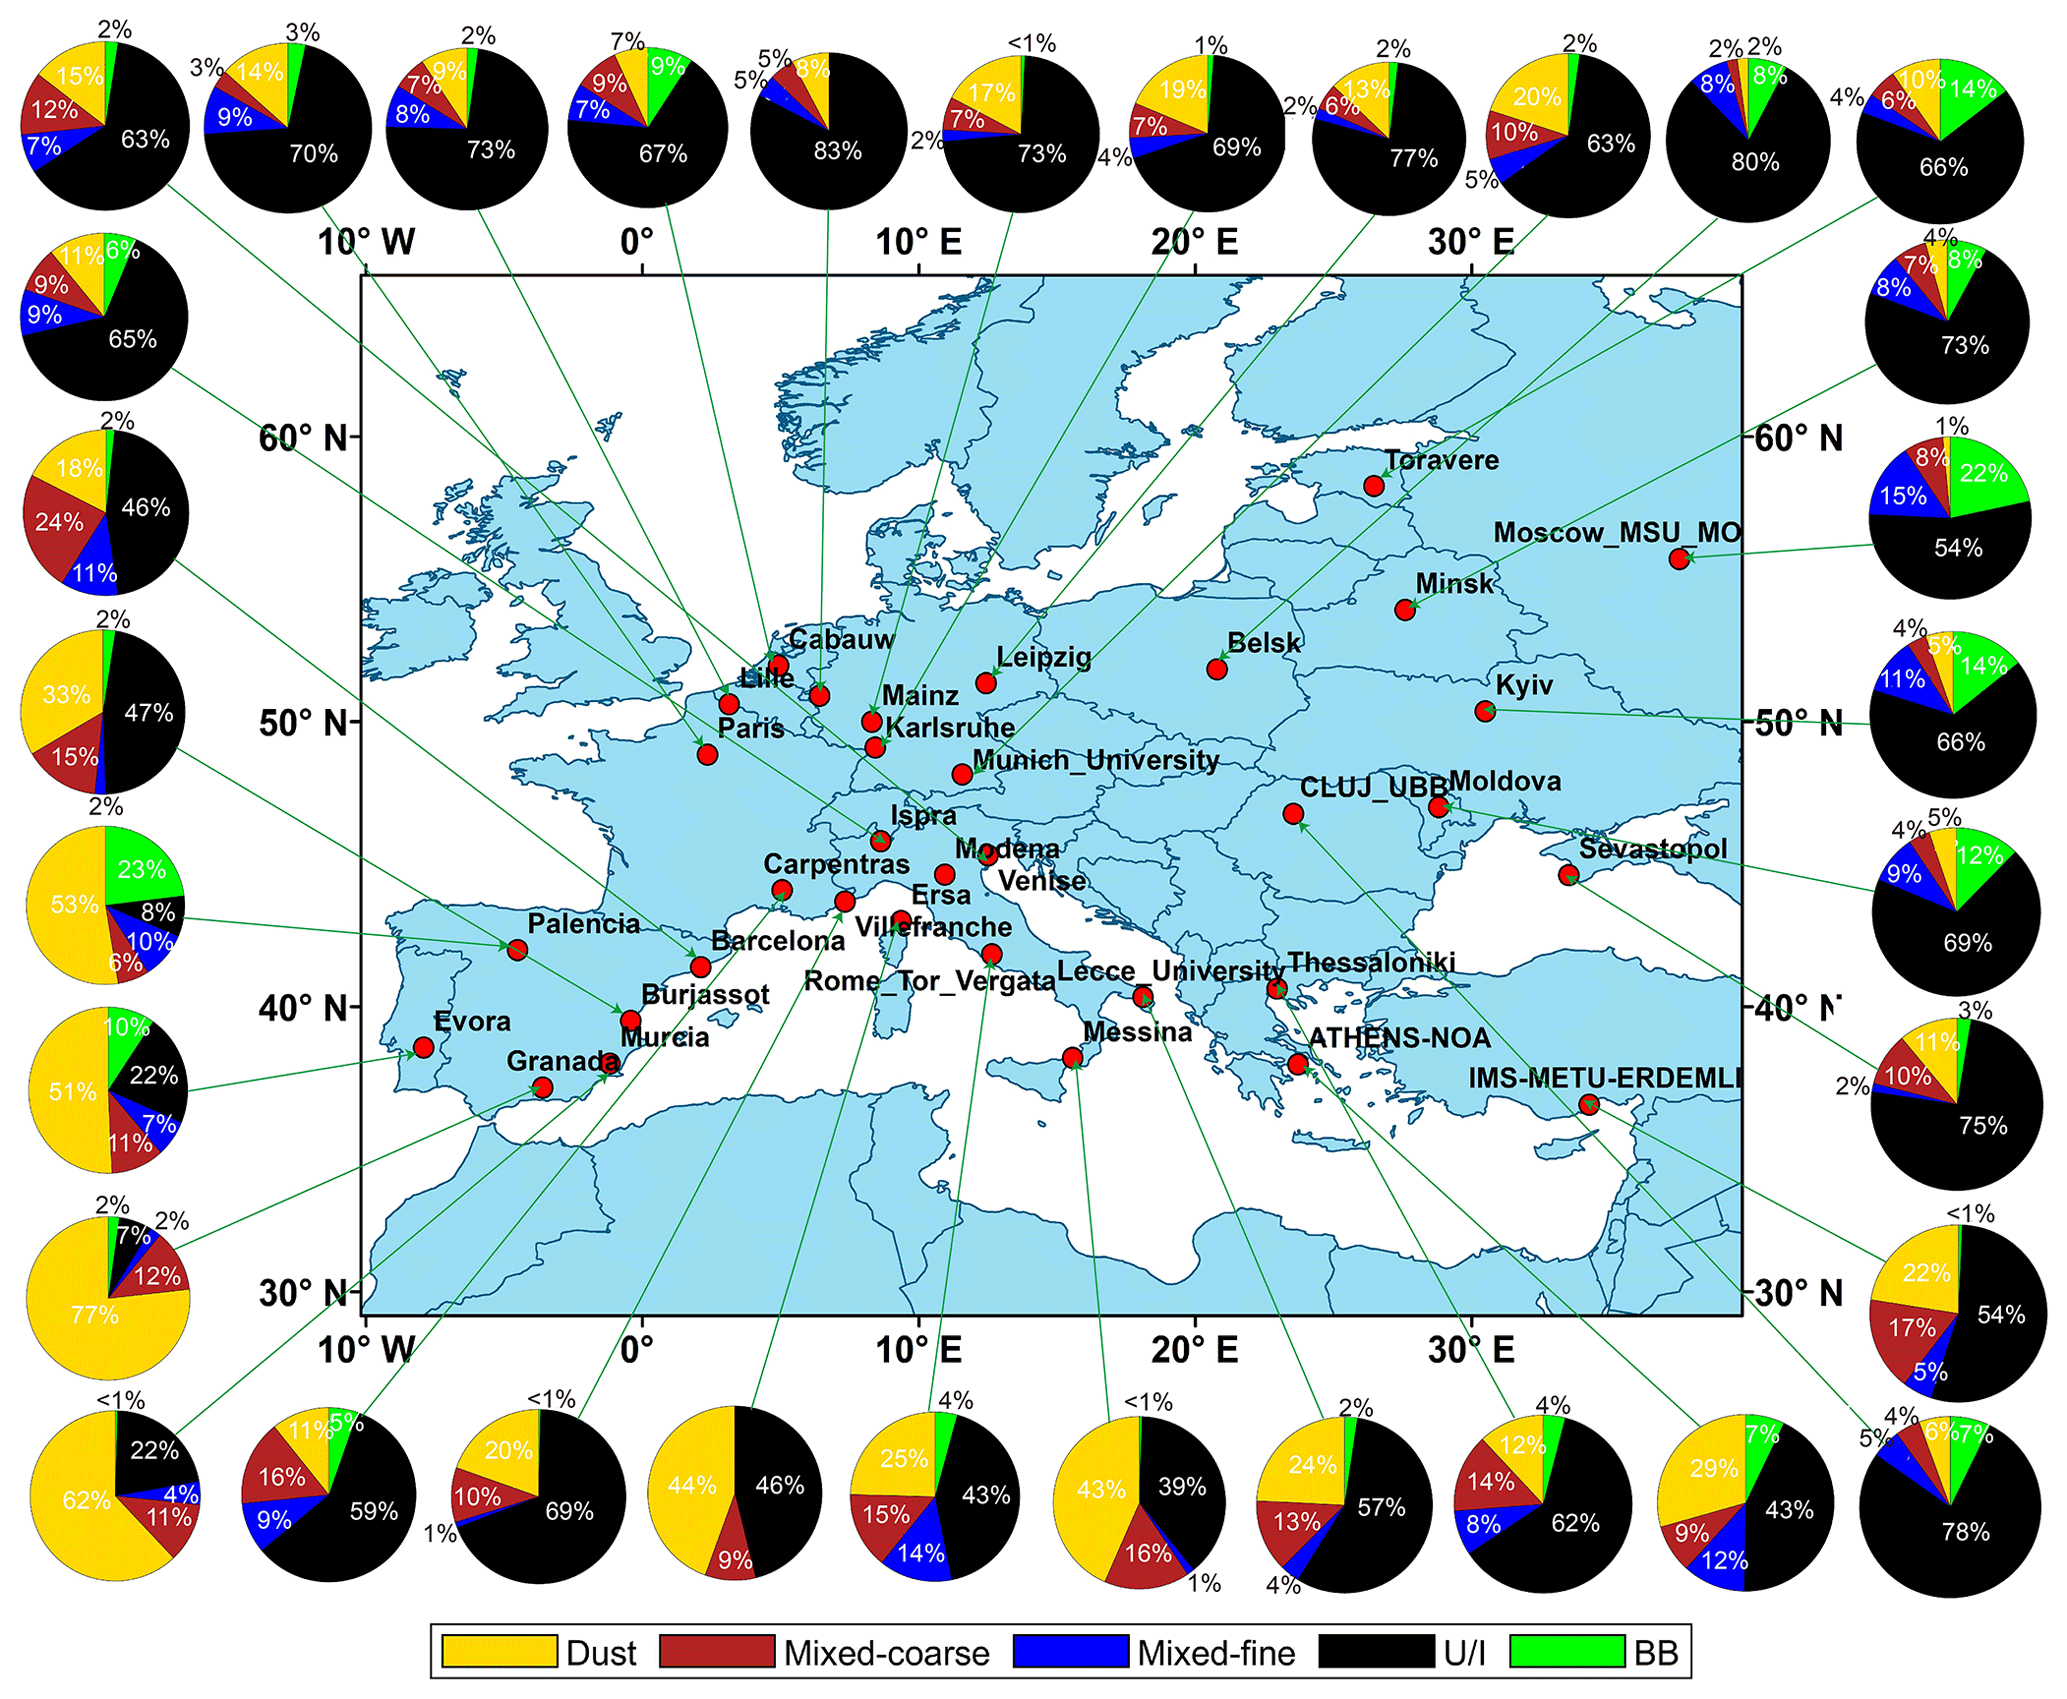
Figure 15Same as Fig. 11 but for Europe.
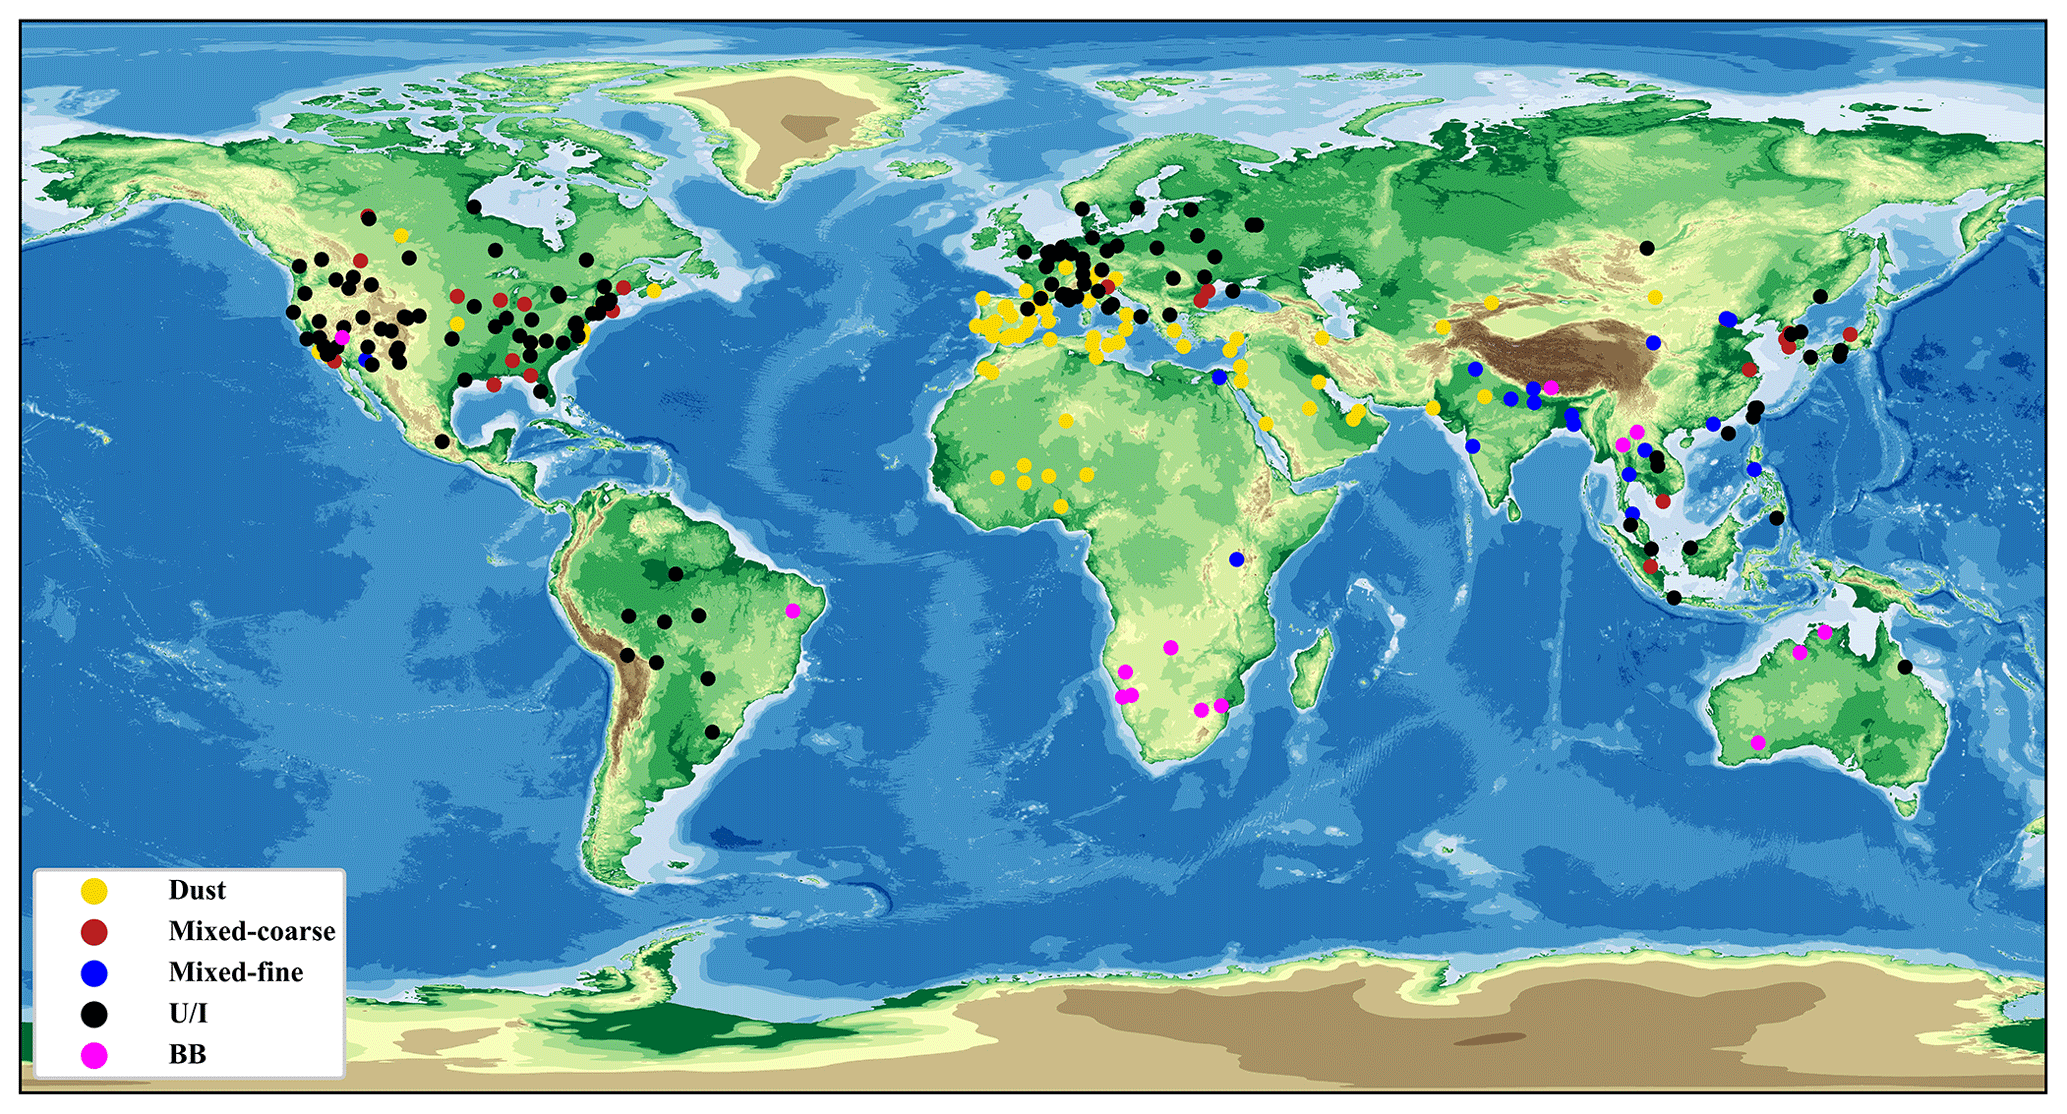
Figure 16Global dominant aerosol-type distribution based on AERONET sites.
Figure 11 shows pie charts of the aerosol types for each scanned AERONET site in North America. The U/I aerosols, particularly in most central eastern regions, contained mixed and small amounts of biomass aerosols. Additionally, the AERONET sites in large cities, such as Chicago, New York, Toronto, Ottawa, and Boston, had U/I aerosols. Many studies have shown that dust aerosols from the Sahara Desert can cross the Atlantic Ocean to North America in summer. Moreover, there is an inland desert in western North America, the Chihuahua Desert, responsible for a small amount of dust and mixed aerosols at the AERONET sites in this region. Additionally, wildfires in western North America and household wood burning contribute to most BB aerosols yearly. The central region site is affected by the environment, with an increased proportion of BB aerosols, and U/I aerosols are still prevalent because the site is located in a large city and is densely populated.
Figure 12 shows the aerosol types in Africa. Northern Africa has the largest desert in the world, the Sahara Desert; therefore, dust aerosols dominate north of the Equator in Africa. However, some AERONET sites in the Sudanese steppe were primarily BB, with some U/I aerosols at nearby urban sites. The Ilorin site is a typical mixed-aerosol site close to the Equator with a small amount of BB aerosols. Most sites close to the Atlantic coast were affected by dust aerosols, even those on the islands of Capo Verde. The reliability of the new model with respect to distinguishing U/I and BB aerosols has been demonstrated. Sites in southern Africa, such as Namibia, Botswana, and Zambia, are dominated by BB aerosols. Nevertheless, studies have shown the presence of U/I aerosols at sites in the urban areas of South Africa. Although U/I and BB aerosols are difficult to distinguish, the two can be identified in the context of a large urban population and less biomass combustion, thus establishing the model's accuracy.
The aerosol types in South America are shown in Fig. 13. Here, only eight sites met the requirement for valid data for > 100 aerosol types. South America is mainly dominated by mountainous plateaus, is under the influence of the Brazilian warm current, and many tropical rainforests are distributed in the south; therefore, the background aerosols are mainly BB aerosols. As shown in Fig. 13, large cities, such as Rio Branco, Campo Grande, Manaus, Santa Cruz, and São Paulo, showed an increased proportion of anthropogenic and mixed aerosols because of their large population and developed industries. Due to the tropical rainforest climate in southern South America, the proportion of BB aerosols increased, such as at the Cuiaba site near the Amazon River. Additionally, the Manaus site contained a small amount of dust aerosols that was presumably transported across the Atlantic Ocean from African dust at the same latitude.
The aerosol types in Asia are shown in Fig. 14. In western Asia, influenced by the Thar Desert, sites on the Indian Peninsula were dominated by coarse-mode aerosols, including dust and mixed-coarse aerosols. Kanpur and Pune are densely populated cities in India with more mixed-fine aerosols produced by human activities. Additionally, in Southeast Asia, all sites contained BB aerosols, consistent with Hamill et al. (2016). This is because of the abundance of tropical rainforests in Southeast Asia. Moreover, some urban sites, such as Singapore and Penang, had large numbers of U/I and mixed-fine aerosols. The coastal areas of East Asia, which are densely populated and industrially developed, were mainly dominated by U/I aerosols. Moreover, dust aerosols appeared at these sites due to dust transported from the Taklamakan Desert in East Asia.
The inland areas of East Asia have a smaller population than the coastal areas; therefore, the proportion of U/I aerosols was small and that of mixed aerosols was high. Generally, mixed aerosols are more easily overestimated than U/I aerosols; however, the new hybrid algorithm identified a larger proportion of U/I aerosols than mixed aerosols at Asian sites. Therefore, the new hybrid algorithm can be considered for improving the classification of mixed aerosols vs. U/I aerosols.
Similarly, southern Europe, which is close to the Sahara and Arabian deserts, was dominated by dust aerosols, with small amounts of mixed and U/I aerosols. Northern European sites have many cities and a large population; therefore, the aerosol type was mainly U/I aerosols, identified using the new hybrid algorithm (Fig. 15). Additionally, small amounts of BB aerosols were identified at most sites in Europe because of olive groves in agricultural lands in the European Union, which produce 91 % of the world's olive oil (Lopez-Pineiro et al., 2011). Papadakis et al. (2015) suggested that the biomass produced from olive oil is used for heating and industry, and its combustion produces carbonaceous aerosols, considered to be the major source of fine-mode aerosols in Europe during winter (Puxbaum et al., 2007).
The global dominant aerosol-type distribution at AERONET sites is shown in Fig. 16. The map does not include marine aerosols. There are more aerosol sites on the global map than those on each continent, as AERONET sites with >5 years of data were selected for the global map; however, sites with >100 valid data points were required for each continent. The global distribution map shows that many BB aerosols were distributed between 20° N and 20° S. This is because this region has a predominantly tropical rainforest climate, with many tropical rainforests and more carbon-containing aerosol emissions. This finding is consistent with those of previous studies that found that global BB aerosols mainly originate from Africa (approximately 52 %), followed by South America (approximately 15 %), equatorial Asia (approximately 10 %), boreal forests (approximately 9 %), and Australia (approximately 7 %) (van der Werf et al., 2010). Furthermore, the global distribution map shows a clear distribution band of dust aerosols between 5° N and 35° N, originating from the Sahara Desert in Africa and the Arabian Desert in western Asia, which are transported across the ocean to other regions.
We developed a new hybrid algorithm to support the rapid classification of aerosol types by building an aerosol optical database for global AERONET sites. This hybrid algorithm is a complex aerosol-type processing algorithm that effectively integrates machine learning and density clustering algorithms. Additionally, this algorithm is not limited by the number of data and improves the accuracy of aerosol-type classification. On investigating the aerosol types at specific sites with dominant aerosols, we observed that different sites contained one or more aerosol types, with the composition of some specific dominant aerosol sites being more complex than that of others. The new algorithm showed a higher accuracy than that of algorithms used in previous studies with respect to identifying aerosol types at specific sites, particularly when distinguishing between U/I and mixed-fine aerosols. Finally, the recognition results of the new hybrid algorithm were closer to the baseline CRI, confirming that the new hybrid algorithm is better than the density clustering algorithm. On investigating the aerosol types at global sites across the continents using the new algorithm, we observed the dominance of different types of aerosols at different sites, and the composition of these could be logically and effectively attributed to the geographical location, energy consumption structure, meteorological conditions, and activities happening at the respective sites.
In this study, the existing aerosol-type identification algorithm was improved using global ground-based AERONET optical property parameter data, and the spatial distribution characteristics of global aerosol types were analyzed, which impacted aerosol radiation research and optical thickness inversion accuracy. Additionally, the presumption of spherical dust aerosols in the Mie scattering model diverges from their actual nonspherical nature in the environment, introducing potential inaccuracies. The optical database's precision, therefore, necessitates further refinement. Future advancements could involve adopting more potent machine learning techniques, such as advanced algorithms beyond the current random forest method. Meanwhile, multisource satellite data and reanalysis products can be incorporated into aerosol-type identification. Ultimately, this study will provide support for the identification and control of air pollution sources.
The code of the new hybrid algorithm used for aerosol-type classification is provided; it includes Gaussian kernel density clustering code, a Mie scattering model, and a random forest model. The Gaussian kernel density clustering and random forest code can be found at https://doi.org/10.5281/zenodo.10972939 (Zhang et al., 2024b). The Mie scattering model is available at http://scatterlib.wikidot.com/codes (SCATTERLIB, 2020).
AERONET products are available from https://aeronet.gsfc.nasa.gov/new_web/draw_map_display_inv_v3.html (NASA, 2020). The global aerosol-type classification using the new hybrid algorithm is openly available from https://doi.org/10.5281/zenodo.10973114 (Zhang et al., 2024a).
FZ designed the study. XW analyzed the results and wrote the original draft. QC engaged in data processing, manuscript editing, and restructuring. LM revised the paper and gave constructive suggestions. WL gave constructive comments on the paper. PL revised the paper. All authors contributed to the study.
The contact author has declared that none of the authors has any competing interests.
Publisher's note: Copernicus Publications remains neutral with regard to jurisdictional claims made in the text, published maps, institutional affiliations, or any other geographical representation in this paper. While Copernicus Publications makes every effort to include appropriate place names, the final responsibility lies with the authors.
The authors would like to acknowledge all of the AERONET participants who have contributed to the global data information used in this study. Two anonymous reviewers provided comments and suggestions that resulted in several significant improvements in the revised manuscript.
This research has been supported by the National Key R&D Program of China (grant no. 2021YFB3900401), the National Natural Science Foundation of China (grant nos. 42075125 and 42105081), and the Science and Technology Foundation of Shanghai (grant no. 23ZR1454100).
This paper was edited by Eduardo Landulfo and reviewed by two anonymous referees.
Bahadur, R., Praveen, P. S., Xu, Y., and Ramanathan, V.: Solar absorption by elemental and brown carbon determined from spectral observations, P. Natl. Acad. Sci. USA, 109, 17366–17371, https://doi.org/10.1073/pnas.1205910109, 2012.
Bian, Y., Zhao, C., Xu, W., Zhao, G., Tao, J., and Kuang, Y.: Development and validation of a CCD-laser aerosol detective system for measuring the ambient aerosol phase function, Atmos. Meas. Tech., 10, 2313–2322, https://doi.org/10.5194/amt-10-2313-2017, 2017.
Boselli, A., Caggiano, R., Cornacchia, C., Madonna, F., Mona, L., Macchiato, M., Pappalardo, G., and Trippetta, S.: Multi year sun-photometer measurements for aerosol characterization in a Central Mediterranean site, Atmos. Res., 104–105, 98–110, https://doi.org/10.1016/j.atmosres.2011.08.002, 2012.
Breiman, L.: Random forests, Mach. Learn., 45, 5–32, https://doi.org/10.1023/A:1010933404324, 2001.
Che, H., Bing, Q., Zhao, H., Xia, X., and Zhang, X.: Aerosol optical properties and direct radiative forcing based on measurements from the China Aerosol Remote Sensing Network (CARSNET) in eastern China, Atmos. Chem. Phys., 18, 405–425, https://doi.org/10.5194/acp-18-405-2018, 2018.
Choi, W., Lee, H., and Park, J.: A first approach to aerosol classification using space-borne measurement data: Machine learning-based algorithm and evaluation, Remote Sens., 13, 1–21, https://doi.org/10.3390/rs13040609, 2021a.
Choi, W., Lee, H., Kim, D., and Kim, S.: Improving spatial coverage of satellite aerosol classification using a random forest model, Remote Sens., 13, 1268, https://doi.org/10.3390/rs13071268, 2021b.
Dubovik, O. and King, M. D.: A flexible inversion algorithm for retrieval of aerosol optical properties from Sun and sky radiance measurements, J. Geophys. Res.-Atmos., 105, 20673–20696, https://doi.org/10.1029/2000JD900282, 2000.
Dubovik, O., Holben, B., Eck, T. F., Smirnov, A., Kaufman, Y. J., King, M. D., Tanré, D., and Slutsker, I.: Variability of absorption and optical properties of key aerosol types observed in worldwide locations, J. Atmos. Sci., 59, 590–608, https://doi.org/10.1175/1520-0469(2002)059<0590:VOAAOP>2.0.CO;2, 2002.
Eck, T. F., Holben, B. N., Reid, J. S., Dubovik, O., Smirnov, A., O'Neill, N. T., Slutsker, I., and Kinne, S.: Wavelength dependence of the optical depth of biomass burning, urban, and desert dust aerosols, J. Geophys. Res.-Atmos., 104, 31333–31349, https://doi.org/10.1029/1999JD900923, 1999.
Fernandez-Delgado, M., Cernadas, E., Barro, S., and Amorim, D.: Do we Need Hundreds of Classifiers to Solve Real World Classification Problems?, J. Mach. Learn. Res., 15, 3133–3181, https://doi.org/10.5555/2627435.2697065, 2014.
Fu, Q., Thorsen, T. J., Su, J., Ge, J., and Huang, J.: Test of Mie-based single-scattering properties of non-spherical dust aerosols in radiative flux calculations, J. Quant. Spectrosc. Ra., 110, 1640–1653, https://doi.org/10.1016/j.jqsrt.2009.03.010, 2009.
Ghasemifar, E.: Climatology of aerosol types and their vertical distribution over Iran using CALIOP dataset during 2007–2021, Remote Sens. Appl., 32, 101053, https://doi.org/10.1016/j.rsase.2023.101053, 2023.
Giles, D. M., Holben, B. N., Eck, T. F., Sinyuk, A., Smirnov, A., Slutsker, I., Dickerson, R. R., Thompson, A. M., and Schafer, J. S.: An analysis of AERONET aerosol absorption properties and classifications representative of aerosol source regions, J. Geophys. Res.-Atmos., 117, 1–16, https://doi.org/10.1029/2012JD018127, 2012.
Hamill, P., Giordano, M., Ward, C., Giles, D., and Holben, B.: An AERONET-based aerosol classification using the Mahalanobis distance, Atmos. Environ., 140, 213–233, https://doi.org/10.1016/j.atmosenv.2016.06.002, 2016.
Kalapureddy, M. C. R., Kaskaoutis, D. G., Ernest Raj, P., Devara, P. C. S., Kambezidis, H. D., Kosmopoulos, P. G., and Nastos, P. T.: Identification of aerosol type over the Arabian Sea in the premonsoon season during the Integrated Campaign for Aerosols, Gases and Radiation Budget (ICARB), J. Geophys. Res.-Atmos., 114, 1–12, https://doi.org/10.1029/2009JD011826, 2009.
Kaskaoutis, D. G., Kharol, S. K., Sinha, P. R., Singh, R. P., Badarinath, K. V. S., Mehdi, W., and Sharma, M.: Contrasting aerosol trends over South Asia during the last decade based on MODIS observations, Atmos. Meas. Tech. Discuss., 4, 5275–5323, https://doi.org/10.5194/amtd-4-5275-2011, 2011.
Kiehl, J. T. and Briegleb, B. P.: The relative roles of sulfate aerosols and greenhouse gases in climate forcing, Science, 260, 311–314, https://doi.org/10.1126/science.260.5106.311, 1993.
Kumar, K. R., Kang, N., and Yin, Y.: Classification of key aerosol types and their frequency distributions based on satellite remote sensing data at an industrially polluted city in the Yangtze River Delta, China, Int. J. Climatol., 38, 320–336, https://doi.org/10.1002/joc.5178, 2018.
Lee, J., Kim, J., Song, C. H., Kim, S. B., Chun, Y., Sohn, B. J., and Holben, B. N.: Characteristics of aerosol types from AERONET sunphotometer measurements, Atmos. Environ., 44, 3110–3117, https://doi.org/10.1016/j.atmosenv.2010.05.035, 2010.
Levy, R. C., Remer, L. A., Mattoo, S., Vermote, E. F., and Kaufman, Y. J.: Second-generation operational algorithm: Retrieval of aerosol properties over land from inversion of Moderate Resolution Imaging Spectroradiometer spectral reflectance, J. Geophys. Res.-Atmos., 112, D13211, https://doi.org/10.1029/2006JD007811, 2007.
Li, K., Bai, K., Ma, M., Guo, J., Li, Z., Wang, G., and Chang, N.-B.: Spatially gap free analysis of aerosol type grids in China: First retrieval via satellite remote sensing and big data analytics, ISPRS J. Photogram. Remote Sens., 193, 45–59, https://doi.org/10.1016/j.isprsjprs.2022.09.001, 2022.
Lin, J., Zheng, Y., Shen, X., Xing, L., and Che, H.: Global aerosol classification based on aerosol robotic network (Aeronet) and satellite observation, Remote Sens., 13, 1–23, https://doi.org/10.3390/rs13061114, 2021.
Lin, M.: Measurement of aerosol size distribution function using Mie scattering – Mathematical considerations, J. Aerosol Sci., 38, 1150–1162, https://doi.org/10.1016/j.jaerosci.2007.08.003, 2007.
Lopez-Pineiro, A., Cabrera, D., Albarran, A., and Pefia, D.: Influence of two-phase olive mill waste application to soil on terbuthylazine behaviour and persistence under controlled and field conditions, J. Soils Sediments, 11, 771–782, https://doi.org/10.1007/s11368-011-0362-3, 2011.
Lu, F., Chen, S., Hu, Z., Han, Z., Alam, K., Luo, H., Bi, H., Chen, J., and Guo, X.: Sensitivity and uncertainties assessment in radiative forcing due to aerosol optical properties in diverse locations in China, Sci. Total Environ., 860, 160447, https://doi.org/10.1016/j.scitotenv.2022.160447, 2023.
Michael, I., Mishchenko, and, Larry, D., and Travis: Light scattering by polydisperse, rotationally symmetric nonspherical particles: Linear polarization, J. Quant. Spectrosc. Ra., 51, 759–778, https://doi.org/10.1016/0022-4073(94)90130-9, 1994.
Moraes, C. P. A., Fantinato, D. G., and Neves, A.: Epanechnikov kernel for PDF estimation applied to equalization and blind source separation, Signal Process., 189, 108251, https://doi.org/10.1016/j.sigpro.2021.108251, 2021.
Nandan, R., Ratnam, M. V., Kiran, V. R., Madhavan, B. L., and Naik, D. N.: Estimation of Aerosol Complex Refractive Index over a tropical atmosphere using a synergy of in-situ measurements, Atmos. Res., 257, 105625, https://doi.org/10.1016/J.ATMOSRES.2021.105625, 2021.
NASA: AERONET, NASA [data set], https://aeronet.gsfc.nasa.gov/ (last access: 1 November 2020), 2020.
Nicolae, D., Vasilescu, J., Talianu, C., Binietoglou, I., Nicolae, V., Andrei, S., and Antonescu, B.: A neural network aerosol-typing algorithm based on lidar data, Atmos. Chem. Phys., 18, 14511–14537, https://doi.org/10.5194/acp-18-14511-2018, 2018.
Omar, A. H., Won, J. G., Winker, D. M., Yoon, S. C., Dubovik, O., and McCormick, M. P.: Development of global aerosol models using cluster analysis of Aerosol Robotic Network (AERONET) measurements, J. Geophys. Res.-Atmos., 110, 1–14, https://doi.org/10.1029/2004JD004874, 2005.
Papadakis, G. Z., Megaritis, A. G., and Pandis, S. N.: Effects of olive tree branches burning emissions on PM2.5 concentrations, Atmos. Environ., 112, 148–158, https://doi.org/10.1016/j.atmosenv.2015.04.014, 2015.
Pathak, B., Bhuyan, P. K., Gogoi, M., and Bhuyan, K.: Seasonal heterogeneity in aerosol types over Dibrugarh-North-Eastern India, Atmos. Environ., 47, 307–315, https://doi.org/10.1016/j.atmosenv.2011.10.061, 2012.
Pawar, G. V., Devara, P. C. S., and Aher, G. R.: Identification of aerosol types over an urban site based on air-mass trajectory classification, Atmos. Res., 164–165, 142–155, https://doi.org/10.1016/j.atmosres.2015.04.022, 2015.
Puxbaum, H., Caseiro, A., Sánchez-Ochoa, A., Kasper-Giebl, A., Claeys, M., Gelencsér, A., Legrand, M., Preunkert, S., and Pio, C.: Levoglucosan levels at background sites in Europe for assessing the impact of biomass combustion on the European aerosol background, J. Geophys. Res., 112, D23S05, https://doi.org/10.1029/2006JD008114, 2007.
Quirantes, A., Guerrero-Rascado, J. L., Pérez-Ramírez, D., Foyo-Moreno, I., Ortiz-Amezcua, P., Benavent-Oltra, J. A., Lyamani, H., Titos, G., Bravo-Aranda, J. A., Cazorla, A., Valenzuela, A., Casquero-Vera, J. A., Bedoya-Velásquez, A. E., Alados-Arboledas, L., and Olmo, F. J.: Extinction-related Angström exponent characterization of submicrometric volume fraction in atmospheric aerosol particles, Atmos. Res., 228, 270–280, https://doi.org/10.1016/j.atmosres.2019.06.009, 2019.
Ramanathan, V., Crutzen, P. J., Lelieveld, J., Mitra, A. P., Althausen, D., Anderson, J., Andreae, M. O., Cantrell, W., Cass, G. R., and Chung, C. E.: Indian Ocean Experiment: An integrated analysis of the climate forcing and effects of the great Indo-Asian haze, J. Geophys. Res.-Atmos., 106, 28371–28398, https://doi.org/10.1029/2001JD900133, 2001.
Raut, J. C. and Chazette, P.: Radiative budget in the presence of multi-layered aerosol structures in the framework of AMMA SOP-0, Atmos. Chem. Phys., 8, 6839–6864, https://doi.org/10.5194/acp-8-6839-2008, 2008.
Reddy, L. A., Glover, T. A., Dudek, C. M., Alperin, A., Wiggs, N. B., and Bronstein, B.: A randomized trial examining the effects of paraprofessional behavior support coaching for elementary students with disruptive behavior disorders: Paraprofessional and student outcomes, J. School Psychol., 92, 227–245, https://doi.org/10.1016/j.jsp.2022.04.002, 2022.
Redemann, J., Turco, R. P., Liou, K. N., Russell, P. B., Bergstrom, R. W., Schmid, B., Hobbs, P. V, Hartley, W. S., Ismail, S., and Ferrare, R. A.: Retrieving the vertical structure of the effective aerosol complex index of refraction from a combination of aerosol in situ and remote sensing measurements during TARFOX, J. Geophys. Res., 105, 9949– 9970, https://doi.org/10.1029/1999JD901044, 2000.
Remer, L. A., Tanré, D., and Kaufman, Y. J.: Algorithm for remote sensing of tropospheric aerosol from MODIS for Collection 005: Revision 2 Products: 04_L2, ATML2, 08_D3, 08_E3, 08_M3, https://modis.gsfc.nasa.gov/data/atbd/atbd_mod02.pdf (last access: 24 April 2024), 2009.
Rosenblatt, M.: Remarks on Some Nonparametric Estimates of a Density Function, Remarks on Some Nonparametric Estimates of a Density Function, in: Selected Works of Murray Rosenblatt. Selected Works in Probability and Statistics, edited by: Davis, R., Lii, K. S., and Politis, D., Springer, New York, NY, https://doi.org/10.1007/978-1-4419-8339-8_13, 2011.
SCATTERLIB: Absorption and Scattering of Light by Small Particles, University of California, San Diego, http://scatterlib.wikidot.com/codes (last access: 1 November 2020), 2020.
Sheridan, P. J., Delene, D. J., and Ogren, J. A.: Four Years of Continuous Surface Aerosol Measurements from the DOE/ARM Southern Great Plains CART Site, J. Geophys. Res.-Atmos., 106, 20735–20747, https://doi.org/10.1029/2001JD000785, 2001.
Shin, S. K., Tesche, M., Noh, Y., and Müller, D.: Aerosol-type classification based on AERONET version 3 inversion products, Atmos. Meas. Tech., 12, 3789–3803, https://doi.org/10.5194/amt-12-3789-2019, 2019.
Siomos, N., Fountoulakis, I., Natsis, A., Drosoglou, T., and Bais, A.: Automated aerosol classification from spectral UV measurements using machine learning clustering, Remote Sens., 12, 1–18, https://doi.org/10.3390/rs12060965, 2020.
Tong, H., Lakey, P. S. J., Arangio, A. M., Socorro, J., Kampf, C. J., Berkemeier, T., Brune, W. H., Pöschl, U., and Shiraiwa, M.: Reactive oxygen species formed in aqueous mixtures of secondary organic aerosols and mineral dust influencing cloud chemistry and public health in the Anthropocene, Faraday Discuss., 200, 251–270, https://doi.org/10.1039/c7fd00023e, 2017.
van der Werf, G. R., Randerson, J. T., Giglio, L., Collatz, G. J., Mu, M., Kasibhatla, P. S., Morton, D. C., DeFries, R. S., Jin, Y., and van Leeuwen, T. T.: Global fire emissions and the contribution of deforestation, savanna, forest, agricultural, and peat fires (1997–2009), Atmos. Chem. Phys., 10, 11707–11735, https://doi.org/10.5194/acp-10-11707-2010, 2010.
Wang, J., Liu, Y., Chen, L., Liu, Y., Mi, K., Gao, S., Mao, J., Zhang, H., Sun, Y., and Ma, Z.: Validation and calibration of aerosol optical depth and classification of aerosol types based on multi-source data over China, Sci. Total Environ., 10, 166603, https://doi.org/10.1016/j.scitotenv.2023.166603, 2023.
Wu, Y., Li, J., Xia, Y., Deng, Z., Tao, J., Tian, P., Gao, Z., Xia, X., and Zhang, R.: Size-resolved refractive index of scattering aerosols in urban Beijing: A seasonal comparison, Aerosol Sci. Tech., 55, 1070–1083, https://doi.org/10.1080/02786826.2021.1924357, 2021.
Yang, M., Howell, S. G., Zhuang, J., and Huebert, B. J.: Attribution of aerosol light absorption to black carbon, brown carbon, and dust in China – Interpretations of atmospheric measurements during EAST-AIRE, Atmos. Chem. Phys., 9, 2035–2050, https://doi.org/10.5194/acp-9-2035-2009, 2009.
Yokelson, R. J., Urbanski, S. P., Atlas, E. L., Toohey, D. W., Alvarado, E. C., Crounse, J. D., Wennberg, P. O., Fisher, M. E., Wold, C. E., and Campos, T. L.: Emissions from forest fires near Mexico City, Atmos. Chem. Phys., 7, 5569–5584, https://doi.org/10.5194/acp-7-5569-2007, 2007.
Yousefi, R., Wang, F., Ge, Q., and Shaheen, A.: Long-term aerosol optical depth trend over Iran and identification of dominant aerosol types, Sci. Total Environ., 722, 137906, https://doi.org/10.1016/j.scitotenv.2020.137906, 2020.
Zhang, F., Wei, X., and Cui, Q.: Global aerosol-type classification using a new hybrid algorithm and Aerosol Robotic Network data [Data set], Zenodo [data set], https://doi.org/10.5281/zenodo.10973114, 2024a.
Zhang, F., Wei, X., and Cui, Q.: Global aerosol-type classification using a new hybrid algorithm and Aerosol Robotic Network data, Zenodo [code], https://doi.org/10.5281/zenodo.10972939, 2024b.
Zhang, L. and Li, J.: Variability of major aerosol types in China classified using AERONET measurements, Remote Sens., 11, 2334, https://doi.org/10.3390/rs11202334, 2019.
Zhao, G., Li, F., and Zhao, C.: Determination of the refractive index of ambient aerosols, Atmos. Environ., 240, 117800, https://doi.org/10.1016/j.atmosenv.2020.117800, 2020.