the Creative Commons Attribution 4.0 License.
the Creative Commons Attribution 4.0 License.
 | 29 Apr 2024
Pyrogenic HONO seen from space: insights from global IASI observations
Lieven Clarisse
Nicolas Theys
Juliette Hadji-Lazaro
Cathy Clerbaux
Pierre Coheur
Nitrous acid (HONO) is a key atmospheric component, acting as a major source of the hydroxyl radical (OH), the primary oxidant in the Earth's atmosphere. However, understanding its spatial and temporal variability remains a significant challenge. Recent TROPOspheric Monitoring Instrument (TROPOMI)/Sentinel-5 Precursor (S5P) ultraviolet–visible (UV–Vis) measurements of fresh fire plumes shed light on the impact of global pyrogenic HONO emissions. Here, we leverage Infrared Atmospheric Sounding Interferometer (IASI)/MetOp's global infrared satellite measurements, complementing midday TROPOMI observations with morning and evening overpasses, to detect and retrieve pyrogenic HONO in 2007–2023. Employing a sensitive detection method, we identify HONO enhancements within concentrated fire plumes worldwide. Most detections are in the Northern Hemisphere (NH) mid- and high latitudes, where intense wildfires and high injection heights favour HONO detection. IASI's nighttime measurements yield 10-fold more HONO detections than daytime measurements, emphasizing HONO's extended lifetime in the absence of photolysis during the night. The annual detection count increases by at least 3–4 times throughout the IASI time series, mirroring the recent surge in intense wildfires at these latitudes. Additionally, we employ a neural-network-based algorithm for retrieving pyrogenic HONO total columns from IASI and compare them with TROPOMI in the same fire plumes. The results demonstrate TROPOMI's efficacy in capturing HONO enhancements in smaller fire plumes and in proximity to fire sources, while IASI's morning and evening overpasses enable HONO measurements further downwind, highlighting the survival of HONO or its secondary formation along long-range transport in smoke plumes.
- Article
(22735 KB) - Full-text XML
- BibTeX
- EndNote


The significance of nitrous acid (HONO) in the atmosphere lies primarily in its pivotal role as a major source of the hydroxyl radical (OH; Alicke et al., 2002; Kleffmann et al., 2005; Volkamer et al., 2010; Elshorbany et al., 2012; Spataro and Ianniello, 2014; Peng et al., 2020). The OH radical shapes the atmospheric oxidative capacity and contributes to the formation of ozone (O3) and secondary pollutants such as peroxyacetyl nitrates (PANs), key constituents of photochemical smog. Understanding HONO's impact on tropospheric chemistry is therefore of utmost importance for assessing air quality and developing efficient pollution mitigation plans. However, there are notable gaps in our knowledge of HONO's global budget, partly due to significant uncertainties surrounding the type and respective magnitude of its emission sources and atmospheric formation pathways (Ammann et al., 1998; Stemmler et al., 2006; Zhou et al., 2011; Oswald et al., 2013; Li et al., 2014; VandenBoer et al., 2015; Ha et al., 2023). As a result, current models typically underestimate HONO concentrations and underrepresent its atmospheric variability. Furthermore, the significance of HONO emissions and production linked to biomass burning has been poorly understood and often overlooked (Roberts et al., 2010; Veres et al., 2010; Elshorbany et al., 2014; Theys et al., 2020; Peng et al., 2021). Thus, high-quality and extensive observational datasets of HONO are increasingly necessary to enhance the understanding and constraints on its budget.
While routine in situ measurements at the (near) surface provide valuable insights on HONO, particularly in polluted regions (VandenBoer et al., 2014; Kramer et al., 2020; Zheng et al., 2020; Yu et al., 2022; Zhang et al., 2023a), the atmospheric distribution of HONO is still poorly represented, especially in the free troposphere (Spataro and Ianniello, 2014), notably due to its high reactivity. For instance, HONO observations in biomass burning events were usually limited to local measurements from aircraft and from ground-based campaigns (Yokelson et al., 2009; Roberts et al., 2010; Neuman et al., 2016; Peng et al., 2020, 2022; Bourgeois et al., 2022).
However, recently, global satellite observations in the ultraviolet–visible (UV–Vis) part of the spectrum from the TROPOspheric Monitoring Instrument (TROPOMI) on board Sentinel-5 Precursor (S5P) have offered unprecedented insights into the distribution and emissions of HONO in freshly emitted fire plumes (Theys et al., 2020). These observations have demonstrated the significant impact of biomass burning on HONO emissions and the dominant contribution of HONO to OH formation inside fire plumes, promoting oxidative plume chemistry and O3 production (Theys et al., 2020). These advancements have highlighted the potential of satellite-based measurements in studying pyrogenic HONO and in gaining a better understanding of its formation mechanisms during biomass burning.
HONO can also be observed by satellite sounders measuring in the thermal infrared (TIR). However, its detection and quantification have been limited thus far. In 2011, Clarisse et al. (2011) reported the first identification of the HONO spectral signature in satellite measurements, specifically in nadir observations made by the Infrared Atmospheric Sounding Interferometer (IASI) on board the MetOp satellite platforms. This detection occurred in a pyrocumulus cloud resulting from the Australian “Black Saturday” bushfires that spread across the state of Victoria in February 2009 (Siddaway and Petelina, 2011; Field et al., 2016; Dowdy et al., 2017). A decade later, De Longueville et al. (2021) identified HONO again in IASI spectra recorded in a large fire plume originating from the extensive bushfires that ravaged southeastern Australia throughout the 2019–2020 biomass burning season, known as the “Black Summer” (Khaykin et al., 2020; Peterson et al., 2021; Fromm et al., 2022). Recently, Dufour et al. (2022) conducted the first infrared retrieval of HONO concentrations throughout a 24 h evolution of the same fire plume using TIR measurements from IASI and the Cross-track Infrared Sounder (CrIS) on board the Suomi National Polar-orbiting Partnership (S-NPP) platform. As a result, HONO has only been detected using infrared satellite sensors in these specific Australian fires, which were characterized by highly favourable conditions for the detection of rare reactive trace gases from space, i.e., abundant gas emissions and intense pyroconvection.
In this study, we explore the detection and retrieval of HONO in various biomass burning plumes worldwide, using the spaceborne TIR observations from IASI and an enhanced retrieval framework. Infrared satellite measurements of HONO, particularly from IASI, offer in principle interesting characteristics to complement TROPOMI measurements.
-
IASI achieves global coverage twice daily, with local measurements in the morning (∼ 09:30 LST) and evening (∼ 21:30 LST). The concentration of HONO in the atmosphere exhibits pronounced intra-day variability, with its lowest levels around midday due to intense photolysis (Volkamer et al., 2010; Spataro and Ianniello, 2014; VandenBoer et al., 2014; Oswald et al., 2015), which roughly aligns with TROPOMI overpass time in the early afternoon (∼ 13:30 LST). Additionally, fire activity can vary regionally throughout the day, with some fires becoming more active during the afternoon, after TROPOMI's overpass (Andela et al., 2015; Gutierrez et al., 2021; Tang et al., 2022; Wilmot et al., 2022). Thus, IASI overpasses can complement TROPOMI observations, allowing the tracking of HONO content evolution downwind of fires at different hours of the day.
-
IASI observations provide a unique 16-year time series of nadir measurements spanning the 2007–2023 period, which is still extending. This continuous time series allows us to investigate the recent evolution of pyrogenic HONO concerning the occurrence and spatial distribution of fire plumes in which this compound can be detected.
-
Despite the differences in overpass times and instrumental performance between IASI and TROPOMI, the retrieval of HONO columns from IASI observations opens the door to potential inter-comparison with the vertical densities obtained from TROPOMI. Comparing TIR and UV–Vis HONO columns is particularly interesting since there are currently few third-party column measurements of HONO available for validating satellite datasets, especially within fire plumes. Independent HONO column data are mainly restricted to localized measurements collected during aircraft campaigns, such as the Biomass Burning Fluxes of Trace Gases and Aerosols (BB-FLUX) campaign (Theys et al., 2020; Kille et al., 2022) and ground-based differential optical absorption spectroscopy (DOAS) retrievals (Hendrick et al., 2014; Wang et al., 2019; Tuite et al., 2021).
-
In biomass burning plumes, aerosols are present in high concentrations, and, while they pose a minor interference in TIR spectra, their impact can be significant in the UV–Vis spectral range due to considerable reduction in photon penetration within the plume (aerosol light extinction). Consequently, UV–Vis HONO retrievals are complicated by the high optical thickness of plumes, and sounders like TROPOMI mainly sample the top layer of the plume (Theys et al., 2020). In contrast, TIR measurements are much less sensitive to the presence of biomass burning aerosols (Clarisse et al., 2010, 2013).
The article is organized as follows. In Sect. 2, we present an enhanced detection method for identifying pyrogenic HONO in the IASI observations, along with spectral evidence that supports the unambiguous detection of HONO in the IASI spectra globally. In Sect. 3, we apply this detection method to the entire set of IASI observations and analyse the spatial distribution and time series of HONO detected in biomass burning events. In Sect. 4, we describe the retrieval of HONO vertical abundance from IASI and conduct case studies to examine the retrieved HONO columns, comparing them with the HONO vertical densities from TROPOMI. We conclude in Sect. 5 by discussing the opportunities that this work presents for understanding pyrogenic HONO and its retrieval with future satellite missions.
The nadir-looking IASI sensor is a main payload of the European meteorological satellite platforms MetOp-A, -B, and -C on sun-synchronous polar orbits. It has been operational since October 2007 on MetOp-A, March 2013 on MetOp-B, and September 2019 on MetOp-C (MetOp-A was decommissioned in late 2021). Although IASI's primary objective is to provide temperature and humidity measurements for improved weather forecasting, its relatively high spatial resolution, wide scanning mode, and good spectral performance have proven to be particularly useful in characterizing the spatiotemporal variability of a whole series of trace gases (Coheur et al., 2009; Clarisse et al., 2011; De Longueville et al., 2021; Vu Van et al., 2023). Here, we combine observations from the three IASI sensors, which demonstrated excellent agreement during their overlapping years (Bouillon et al., 2020), to span the October 2007–September 2023 period.
In this section, we first present the detection method that is used to identify HONO in the IASI spectra. We then demonstrate the application of this method with examples in fresh fire plumes, and we provide evidence of the unambiguous identification of HONO in the spectra. Finally, we describe a specific filter that allows us to extract the observations with genuine identification of pyrogenic HONO in the IASI time series, while minimizing the number of false detections.
2.1 Detection method
In this study, we use the hyperspectral range index (HRI) to identify spectra with observable HONO signatures. The HRI's sensitivity enables the detection of small enhancements in the spectral signature of highly variable absorbers or those with broad or weak spectral absorptions (Clarisse et al., 2013). In recent years, it has been crucial in retrieving challenging infrared species from IASI observations, such as ammonia (NH3) and volatile organic compounds (VOCs; Franco et al., 2022; Clarisse et al., 2023; and references therein).
Introduced by Walker et al. (2011), the HRI is a dimensionless index that measures – over a specific spectral range – the magnitude of the spectral signature of a target gas in an observed spectrum, relative to the spectral variability caused by other contributing factors in the atmosphere. For an individual observed spectrum y, the HRI of a target gas is calculated as
where the spectral Jacobian K represents the spectral signature of that gas and where Sy and are, respectively, the generalized covariance matrix and mean spectrum derived from a set of spectra representative of the atmospheric variability in the absence of observable amount of the target gas (i.e., background conditions). This set of background spectra, and the associated Sy and , are determined via an iterative filtering process (Franco et al., 2018; Clarisse et al., 2019). Beginning with a comprehensive set of IASI spectra, this process consists, at each step, of calculating Sy and associated with the given spectra, determining the HRI for each observation, discarding all spectra with detectable target gas signatures from the set, and calculating the factor N. The HRI is normalized such that the HRIs calculated on a set of background spectra are distributed according to a Gaussian centred at zero and with a standard deviation of 1. As a result, an enhancement of the target gas in a given IASI observation is considered to be statistically significant at 95 % and 99.7 % for, respectively, an HRI value above 2 and 3. The factor N in Eq. (1) guarantees the normalization throughout the iterative process. In addition, we have intentionally increased the proportion of IASI spectra acquired over desert regions to better characterize these background conditions (Clarisse et al., 2023). Note also that the subset of IASI spectra used to calculate Sy and includes both cloud-free and cloudy scenes, in such a way that the HRI remains valid for all observational conditions.
The HRI is calculated within a specific spectral range tailored to each target gas, encompassing their main absorption features while avoiding spectral regions with limited information content or potential interferences (i.e., spectral signatures of other absorbers overlapping with that of the target gas or surface emissivity artefacts). In the thermal infrared spectrum covered by IASI (645–2760 cm−1), there are two prominent absorption bands of HONO suitable for an HRI (Fig. A1): the ν4 bands of the trans- and cis-HONO conformers with Q-branches at 790 and 852 cm−1, respectively, and the ν3 band of the trans-HONO conformer with a Q-branch at 1263 cm−1. Here, we independently calculated an HONO HRI for each of these two absorption bands, specifically over the 820–890 and 1210–1305 cm−1 spectral ranges. In the first range, we excluded the trans-ν4 band (centred at 790 cm−1) from the HRI calculation because it did not provide significantly more information, and the spectral signatures of other absorbers overlapped with that of HONO, thus degrading the quality of the HRI. Throughout Sect. 2, we systematically assess the advantages and limitations of each spectral range for the detection of pyrogenic HONO.
The spectral Jacobian K of HONO in Eq. (1) was generated with the line-by-line radiative transfer model Atmosphit (Coheur et al., 2005). Despite ongoing efforts to provide line positions, intensities, and shape parameters of HONO in the thermal infrared (Armante et al., 2021; Tchana Betnga et al., 2023), spectroscopically resolved parameters are not yet available for all the absorption bands. Therefore, we used the cross-sections of HONO from the Pacific Northwest National Laboratory (PNNL) infrared database (Sharpe et al., 2004) to ensure consistency within the different bands.
In the past, the HRI was found to exhibit small biases between the different IASI instruments and to be sensitive to small changes in the instrument calibration or post-processing (Van Damme et al., 2021), which occurred several times through the course of a decade-long satellite mission. It was recently shown that these biases can be largely removed by disregarding the eigenvectors of the covariance matrix Sy in Eq. (1) corresponding to the smallest eigenvalues (Clarisse et al., 2023). Here, we followed the procedure outlined in that paper, and for the HRIs calculated in the 820–890 and 1210–1305 cm−1 ranges we removed, respectively, the six and seven smallest eigenvalues from Sy.
Owing to its high sensitivity, the HRI serves as an efficient detection method of trace gases in IASI spectra and allows us to detect and analyse HONO globally, as elaborated in the next subsections and in Sect. 3. In Sect. 4, we employ the HRI as the primary input for a fast and robust neural-network-based retrieval scheme to quantify the vertical abundance of HONO from the IASI observations, following a methodology successfully applied to other trace gases.
2.2 Examples of HONO detection in fresh fire plumes
For each IASI observation from the entire time series of MetOp-A, -B, and -C, we calculated the two HONO HRIs as described previously. The results revealed substantial enhancements in the HONO HRI within certain fresh fire plumes. Figure 1 illustrates two typical examples of such enhancements captured by IASI during wildfires that occurred in British Columbia, Canada, in August 2018 (Fig. 1a–b) and in Spain and Portugal in October 2017 (Fig. 1c–d).

Figure 1HONO HRIs from single IASI/MetOp-A and -B nighttime overpasses (∼ 21:30 LST) over wildfires in British Columbia, Canada, on 17 August 2018 (a–b) and in Spain/Portugal on 15 October 2017 (c–d). The HRIs have been calculated in the 820–890 and 1210–1305 cm−1 spectral ranges. The shape of each dot corresponds to the on-ground footprint of an individual IASI measurement. The observations with HRI < 4 are displayed with semi-transparency. The vectors in the bottom panels represent the ECMWF ERA5 daily horizontal wind fields at the planetary boundary layer height. The small orange dots indicate the active fires detected by MODIS/Terra (∼ 22:30 LST). The base map is from MODIS/Aqua visible imagery (∼ 13:30 LST). The light-blue square in panels (a) and (b) points to the IASI/MetOp-A spectrum analysed in Sect. 4.2, with visible imagery from MODIS/Aqua.
Figure 1 displays the HONO HRIs derived from the IASI/MetOp-A and -B measurements of a single satellite overpass over a specific region and day. As expected, the background HRI values generally fluctuate around zero, indicating the absence of observable HONO amounts in these IASI spectra. However, several large clusters of observations exhibit HONO HRI enhancements above a value of 4. According to the HRI's definition (Sect. 2.1), an HRI value of 4 corresponds to a detection statistically significant at 99.9 %. Hence, it can be regarded as a reliable general threshold for the detection of HONO in IASI measurements. In Fig. 1, these elevated HRI values are situated directly downwind of active biomass fires detected by the Moderate Resolution Imaging Spectroradiometer (MODIS; Giglio et al., 2006) on those days and in relative proximity to the fire sources. This is in contrast to other fire tracers measured by IASI (such as NH3 and VOCs), which can be traced over long distances within concentrated fire plumes (Coheur et al., 2009; Franco et al., 2020; Wizenberg et al., 2023). However, it is consistent with the short atmospheric lifetime of HONO and the observations of pyrogenic HONO performed with TROPOMI (Theys et al., 2020).
Additionally, for both case studies in Fig. 1, it is notable that the HRI calculated in the 1210–1305 cm−1 spectral range (Fig. 1b, d) enables the detection of HONO in a greater number of IASI observations, and the HRI values obtained are generally much higher than those calculated in the 820–890 cm−1 window (Fig. 1a, c). This indicates that the ν3 absorption band of HONO is more favourable for IASI, despite the predicted lower intensity of HONO absorptions compared to the ν4 band. This point is investigated through detailed spectra analysis in Sect. 2.3.
2.3 Spectral evidence
The HRI alone cannot unequivocally confirm the presence of a specific signature in the spectrum because false detections can occur when the spectral signature of another trace gas, or unusual surface emissivity, resembles that of the target species (Clarisse et al., 2019). While spectral evidence is usually provided in the form of spectral fits (Coheur et al., 2009; Clarisse et al., 2011), this method assumes prior knowledge of the absorbers and relies on their spectral signatures being sufficiently strong to be modelled. An attractive alternative, which does not rely on expensive computation, is the whitening transformation (De Longueville et al., 2021). It is particularly suitable for analysing enhancements detected with the HRI, as it allows for the decomposition of the HRI into partial HRIs () quantifying the contribution of each spectral channel (i.e., the observed IASI radiance at a specific wavenumber) to the total HRI (Franco et al., 2022).
Whitening is related to the HRI concept, as it dismisses most of the climatological background from the analysed spectrum y. However, while the HRI is tailored to a particular species and yields a unique value, whitening produces a spectrum wherein each spectral channel has been transformed into a normalized and uncorrelated variable.
As a result, the whitened spectrum contains all the spectral residuals deviating from the climatological background. Through a comparison of with the whitened spectral signature of potential absorbers (i.e., the whitened Jacobian ),
it becomes possible to attribute specific trace gases to these spectral anomalies. This attribution further confirms the presence of an increased concentration of the corresponding compound(s) in the analysed spectrum (De Longueville et al., 2021). Moreover, as described in Franco et al. (2022), the individual contribution of each channel i to the HRI calculation, for a species identified in the analysed spectrum, can be visualized by element-wise multiplication of with the of that species,
with
Figure 2a depicts an IASI/MetOp-A spectrum recorded on 23 June 2013, within a fire plume identified with HONO over Quebec during Canadian wildfires. The HRI values associated with HONO for that spectrum were calculated for the two absorption bands (highlighted in green in Fig. 2a) as 7.09 for the 820–890 cm−1 range and 12.57 for the 1210–1305 cm−1 range. Please note that only the 1250–1305 cm−1 spectral interval is displayed here for better visibility of the HONO absorption features, while the HRI remains based on the entire 1210–1305 cm−1 range. The additional panels of Fig. 2 illustrate, for each HONO band, the whitened spectrum , the whitened HONO Jacobian , and the contribution of each channel i to the HRI. In both spectral ranges, we observe matches between the spectral residuals and the HONO signature, confirming the presence of significant HONO enhancements in the analysed spectrum and, consequently, within the fresh fire plume.

Figure 2IASI/MetOp-A spectrum recorded in a fire plume over Quebec, Canada, on June 23, 2013, ∼ 21:30 LST (a). The green frames delimit the spectral ranges in which the signature of HONO is investigated. Result of the whitening transformation (in blue) applied to the IASI spectrum, the whitened HONO Jacobian (in red), and the contribution of each channel to the HRI (in grey) in the 820–890 and 1210–1305 cm−1 spectral ranges (b and c, respectively). The whitened Jacobian of interfering NH3 is displayed in yellow.
However, notable differences exist between the two HONO bands. In the 820–890 cm−1 range (Fig 2b), the main contribution of HONO () to the total HRI originates from the centre of the cis-ν4 band of HONO at 852 cm−1, along with weaker but broadband additional contributions between 860 and 875 cm−1. Significant interferences from NH3 are present in that band (for instance, at 848, 853, 868, and 888 cm−1), which contribute with both positive and negative terms to the HONO HRI. Moreover, this range is affected by dust and spectral variations in surface emissivity over deserts (not represented in Fig. 2b; see Sect. 2.4). Conversely, the 1210–1305 cm−1 range suffers from fewer interferences (Fig. 2c). In this range, reveals strong contributions of HONO originating from the double peak of the trans-ν3 HONO band centred at 1264 cm−1 and from the peak at 1298 cm−1. Other noticeable HONO contributions are observed at 1274 and 1292 cm−1.
Through this exercise, we clearly demonstrate the presence of the spectral signature of HONO in the IASI spectra in the two absorption bands. It also confirms that HONO is the main contributor to the HRI enhancements observed in fresh fire plumes. We conducted similar analyses in other fire plumes where HONO was detected using IASI, which led to the same conclusions. This validates that significant HONO enhancements can be identified with IASI in fresh plumes associated with biomass burning events other than the exceptional 2009 and 2019–2020 Australian wildfires (Clarisse et al., 2011; De Longueville et al., 2021; Dufour et al., 2022). For comparison, the spectral analysis of an IASI observation in a fresh Australian fire plume from December 2019 (depicted in Fig. A2) indicates markedly higher HONO HRI enhancements, with values of 36.04 for the 820–890 cm−1 range and 56.62 for the 1210–1305 cm−1 window.
Although the spectroscopic intensity of the ν3 absorption band of HONO is lower than that of its ν4 band (Fig. A1), the measurement noise in the 1210–1305 cm−1 range of IASI (0.04–0.05 K) is significantly lower than in the 820–890 cm−1 window (0.13–0.14 K; Clerbaux et al., 2009). This is the reason why the 1210–1305 cm−1 range is more sensitive to HONO than the other window, as we already saw in Fig. 1. Moreover, the spectral analysis reveals that the 820–890 cm−1 window is affected by interferences from NH3. This implies that the HONO HRI calculated from this window is prone to be contaminated by enhanced NH3 concentrations in fire plumes. An example of very strong NH3 interference is presented in Fig. A3, where we represent an IASI spectrum recorded within a fire plume during the October 2017 Iberian wildfires. While the HONO contributions to the total HRI in the 1210–1305 cm−1 range (Fig. A3c) are consistent with our previous analysis, we observe strong contributions from several NH3 peaks (both positive and negative terms) to the HONO HRI calculated in the 820–890 cm−1 range (Fig. A3b).
2.4 HONO detection filter
In the previous section, we have shown the unambiguous identification of HONO for spectra with a large HRI observed in fire plumes. Here, we describe an approach to improve the detection of weaker HONO signals (lower HRIs). As discussed previously, an HRI value of 4 represents statistically a reasonable threshold for attributing true detections of a short-lived species like HONO, as it induces a false detection risk of only 0.006 % (due to uncertainties on the HRI). However, considering the observations provided by a single IASI instrument per day, this still results in ∼80 daily potential false detections due to random spectral noise. Figure A4 shows all the IASI/MetOp-A observations over the year 2012 with an HRI value above 4. The maps are dominated by random false detections over both land and remote oceans. In addition, we observe more frequent HRI enhancements over deserts and mountain regions, which can be attributed to localized surface emissivity anomalies in the thermal infrared (Clarisse et al., 2019). The 820–890 cm−1 absorption band also seems to be affected by windblown dust over the Middle East.
To remove these false detections, one option would be to simply increase the threshold on the HRI. However, this comes at a large cost, as it would remove many genuine detections, especially at the edge of fire plumes. As we will show after, we found a robust way of dealing with false detections by relying on co-detection of HONO with NH3 and ethylene (C2H4) in fire plumes. Both NH3 and C2H4 are short-lived compounds that are abundant in fresh fire plumes and are routinely retrieved globally from IASI measurements (Van Damme et al., 2021; Franco et al., 2022; Clarisse et al., 2023). Note that the method described here is specifically designed for the detection of pyrogenic HONO. Although elevated HONO concentrations are associated with anthropogenic activities (Spataro and Ianniello, 2014; VandenBoer et al., 2014; Kramer et al., 2020; Zheng et al., 2020; Yu et al., 2022; Zhang et al., 2023a), up to now no HRI enhancements have been observed with IASI in proximity to anthropogenic sources (e.g., megacities and industrial clusters).
Figure 3 illustrates the relationships between the HONO HRI and the co-located NH3 and C2H4 HRIs for all individual observations with HONO HRI > 4 in the IASI time series. From these scatter plots, it clearly appears that two distinct populations of points coexist. One population shows an increase in HONO HRI accompanied by an enhancement in NH3 or C2H4, or both, while the other, characterized by blue-purple points on the left side of each scatter plot, represents false detections of HONO (both NH3 and C2H4 HRIs close to zero). It is worth noting that this second population is more prominent for the 820–890 cm−1 HONO HRI (Fig. 3a–d), which is more susceptible to surface emissivity anomalies, as illustrated in Fig. A4. Based on these relationships, we have derived consistent conditions that must be met to confidently attribute the HONO enhancement to an authentic detection in fire plumes, depending on the absorption band that is used and the morning and evening satellite overpasses.
-
For 820–890 cm−1 (morning): HRIHONO > 4 and ( > 50 or > 4.5)
-
For 820–890 cm−1 (evening): HRIHONO > 4 and ( > 25 or > 4.5)
-
For 1210–1305 cm−1 (morning): (HRIHONO > 4 and ( > 50 or > 4)) or HRIHONO > 8
-
For 1210–1305 cm−1 (evening): (HRIHONO > 4 and ( > 12 or > 4)) or HRIHONO > 8
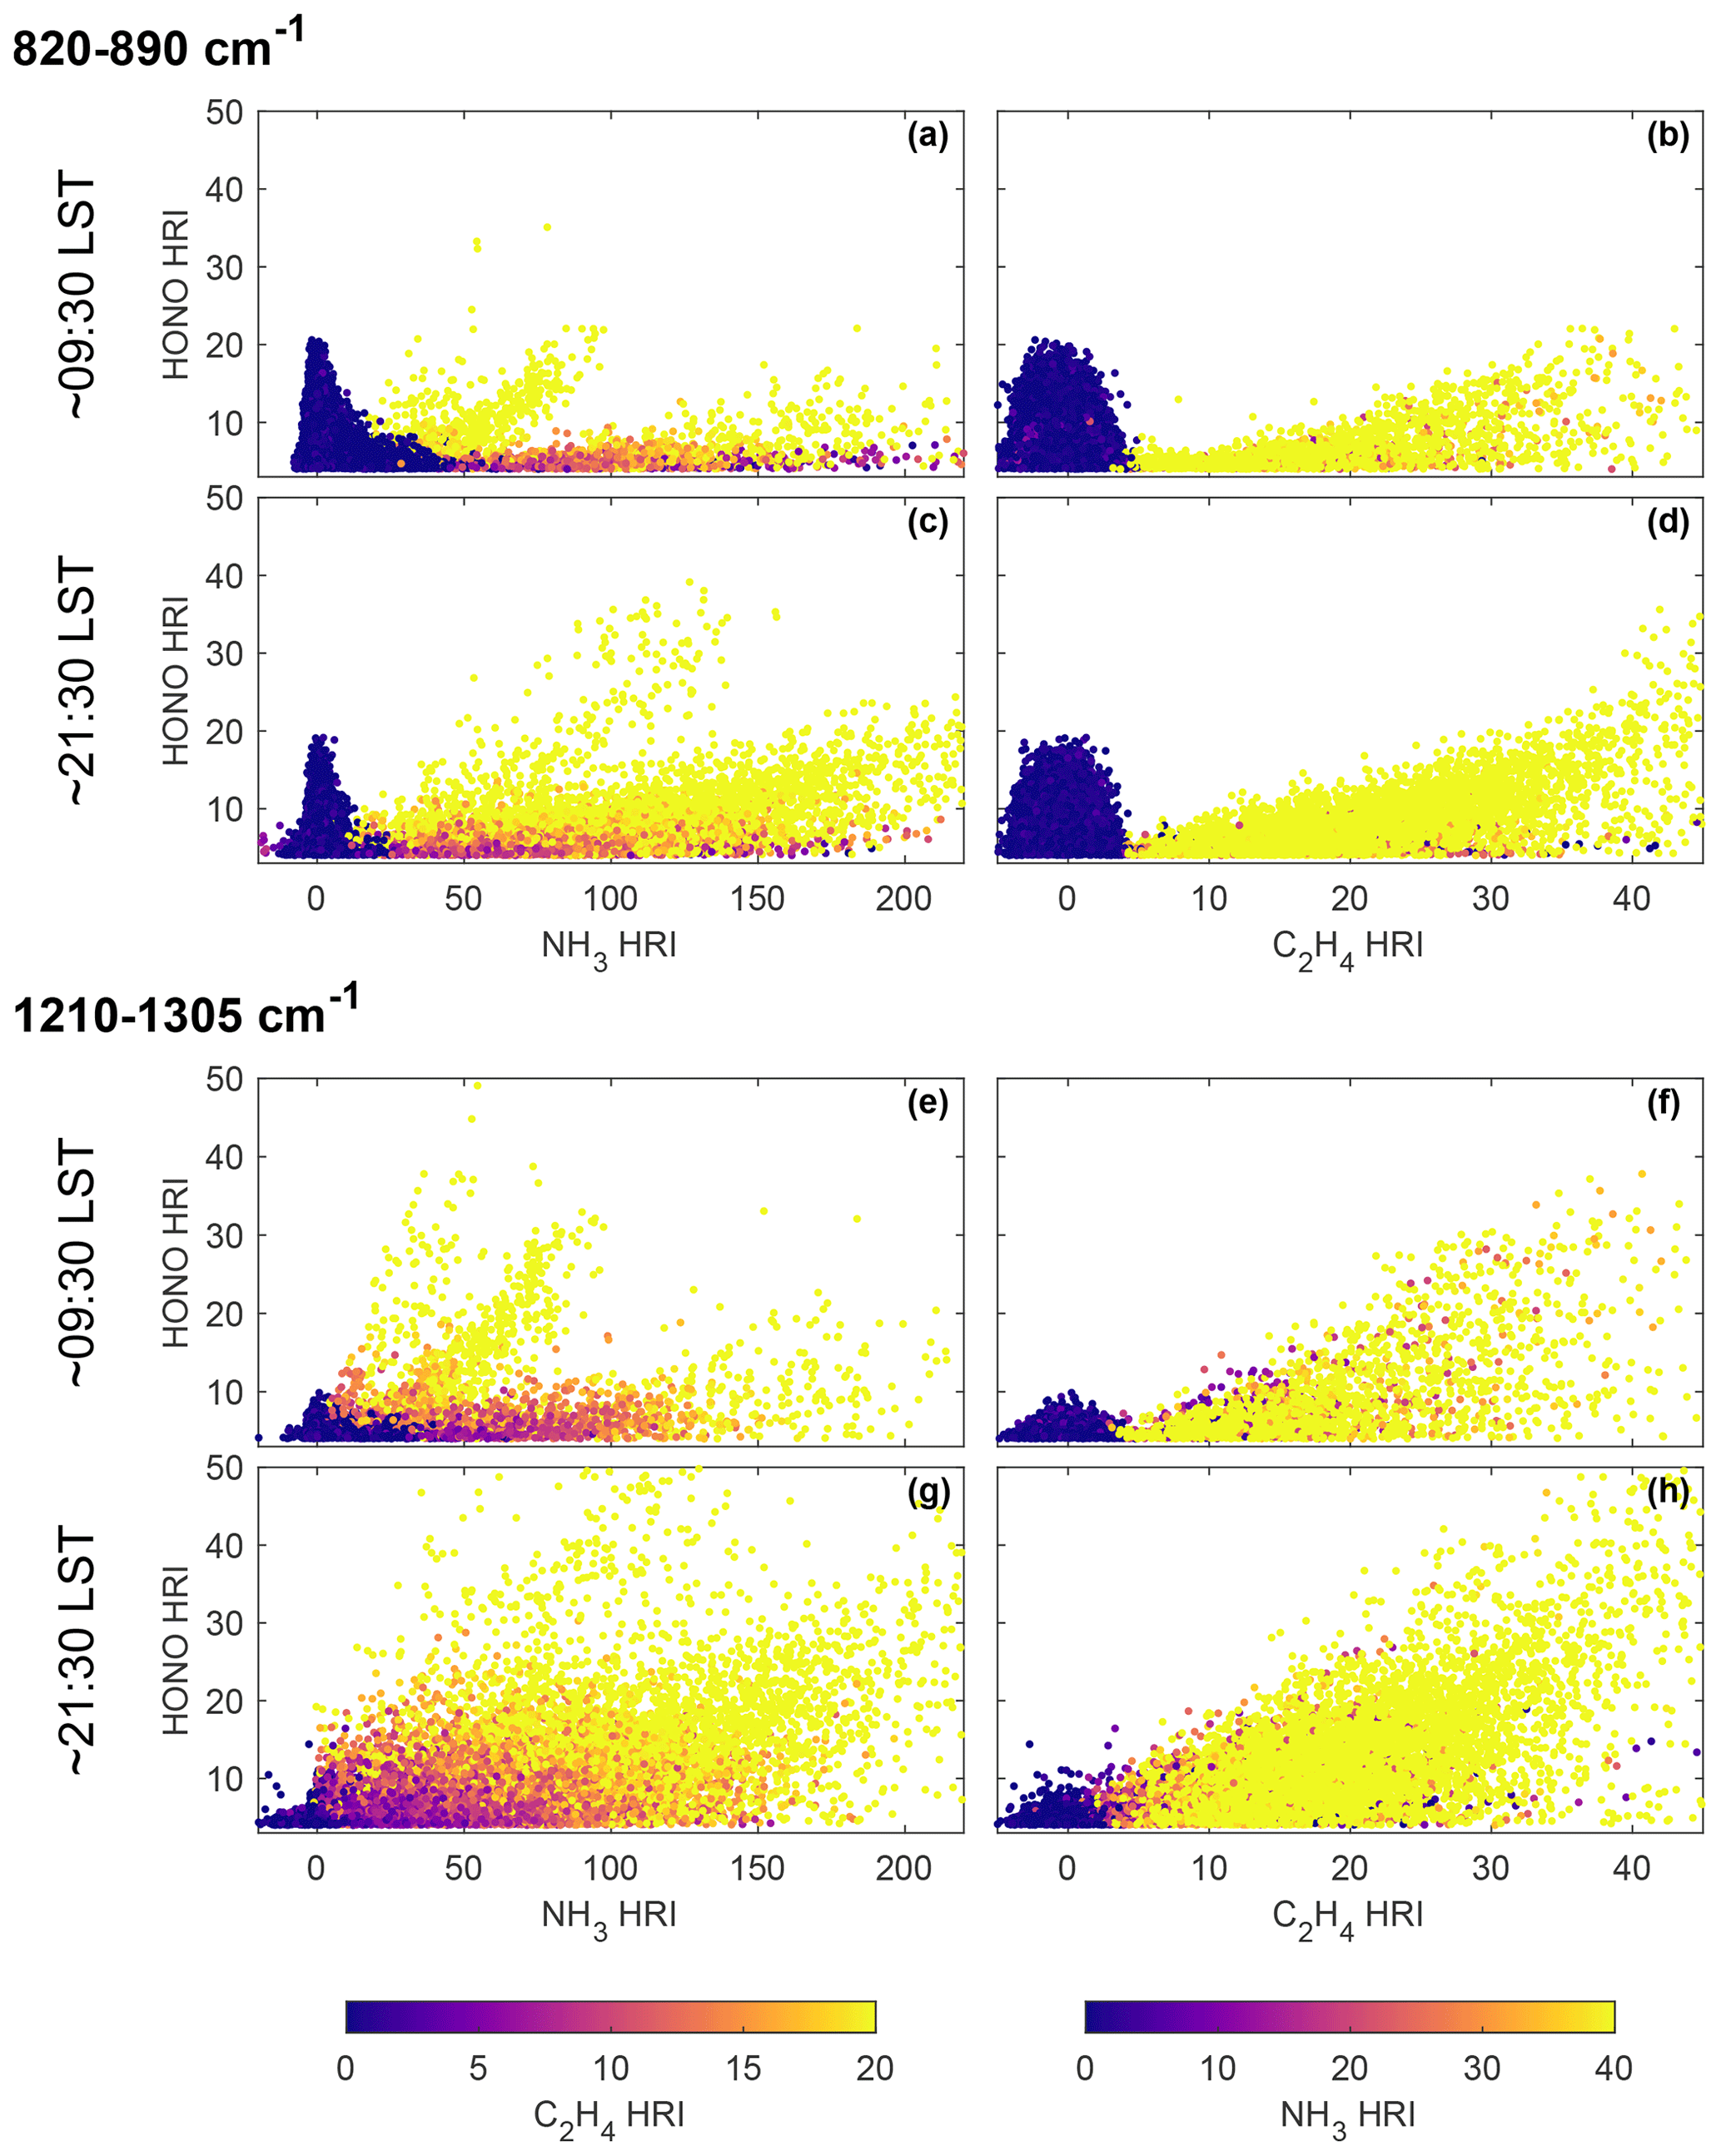
Figure 3Relationships between the HONO HRI and the co-located NH3 and C2H4 HRIs for all individual IASI observations with HONO HRI > 4 identified throughout the IASI time series. The relationships are displayed for the HONO 820–890 (a–d) and 1210–1305 cm−1 (e–h) absorption bands and for the morning and evening IASI measurements separately. The left panels display the HONO HRI vs. NH3 HRI, colour-coded by the C2H4 HRI, and the right panels display the HONO HRI vs. C2H4 HRI, colour-coded by the NH3 HRI.
This filtering process leverages the complementary nature of NH3 and C2H4 detections with IASI. Indeed, simultaneous detection of NH3 and C2H4 in a fire plume is not always consistently observed and may vary depending on the type of biomass burned and the corresponding region. This is illustrated in Fig. 3, where certain IASI measurements showing significant HONO enhancements exhibit high HRIs for C2H4 and weak values for NH3, or vice versa. Including both NH3 and C2H4 in the filter allows us to cover a broader range of biomass burning conditions. Another advantage is the higher sensitivity of IASI to NH3 and C2H4 in the thermal infrared and their longer lifetimes compared to HONO. As a result, the proportion of genuine HONO enhancements mistakenly discarded because of the absence of NH3 and C2H4 detection is negligible.
To set up the filter, we specifically investigated observations with HONO HRI > 4 (i.e., 4 standard deviations beyond the gas background), and we set relatively high HRI values as thresholds for NH3 and C2H4. While this conservative approach may lead to the omission of some genuine HONO detections, our priority has been to produce a reliable IASI HONO dataset with minimal false detections rather than maximizing the number of HONO detections at the expense of their quality. The NH3 thresholds are set at higher values compared to the other species to avoid false HONO detections over regions with elevated background NH3 concentrations due to, e.g., intense agricultural activities (Van Damme et al., 2018). While there are NH3 HRI enhancements in such source regions, the typical NH3 HRI values found in fire plumes are much higher. Conversely, the C2H4 HRI remains weak outside fire plumes and industrial and urban point sources due to the absence of significant emissions (Franco et al., 2022).
It is worth noting that in the 1210–1305 cm−1 HONO absorption band, lower HRI thresholds are used for the filter compared to the 820–890 cm−1 range, especially for NH3, which is a spectral interference in the ν4 band (see Sect. 2.3). Additionally, in the 1210–1305 cm−1 window, if the HONO HRI exceeds a value of 8, it guarantees an authentic HONO detection without the need to consider NH3 and C2H4 co-detection. However, this condition could not be applied to the 820–890 cm−1 HRI due to significant surface emissivity anomalies that can yield high HONO HRI values, as highlighted by the large cluster of blue-purple points in Fig. 3a–d. This further emphasizes the superior detection capabilities of the 1210–1305 cm−1 HONO absorption band with IASI.
Considering the advantages presented in Sect. 2 of the 1210–1305 cm−1 band for the detection of pyrogenic HONO by IASI, we will focus on the HRI calculated within this range from Sect. 3 onwards. Nonetheless, results obtained with the 820–890 cm−1 band will also be presented briefly, as they allow for important cross-verification.
In this section, we analyse the HONO detections by IASI from MetOp-A (2007–2021), -B (2013–2023), and -C (2019–2023). We study the subsequent global distributions and time series of HONO detections and compare these results with those from TROPOMI.
3.1 Global distribution of HONO detection
We applied the previously presented HONO detection filters to the entire 2007–2023 time series of IASI/MetOp-A, -B, and -C for the two different HONO HRIs. Figure 4 shows the global distribution of the detected HONO observations for the 1210–1305 cm−1 spectral range (morning/evening overpasses together). Each dot on the map corresponds to an individual IASI measurement with a confirmed HONO detection in a fire plume. As Fig. 4 shows, IASI has detected HONO in numerous fire events worldwide. The total number of confirmed measurements over 2007–2023 exceeds 21 000 for the 1210–1305 cm−1 HRI (∼ 10 000 in the 820–890 cm−1 range). Note that thanks to the effective detection filter, only a handful of false detections remain (mostly seen over remote ocean). The map reveals that HONO observations with IASI are rarely isolated but typically clustered within individual fire plumes consisting of 10–40 pixels. However, larger events with even higher numbers of HONO detections can also be observed.
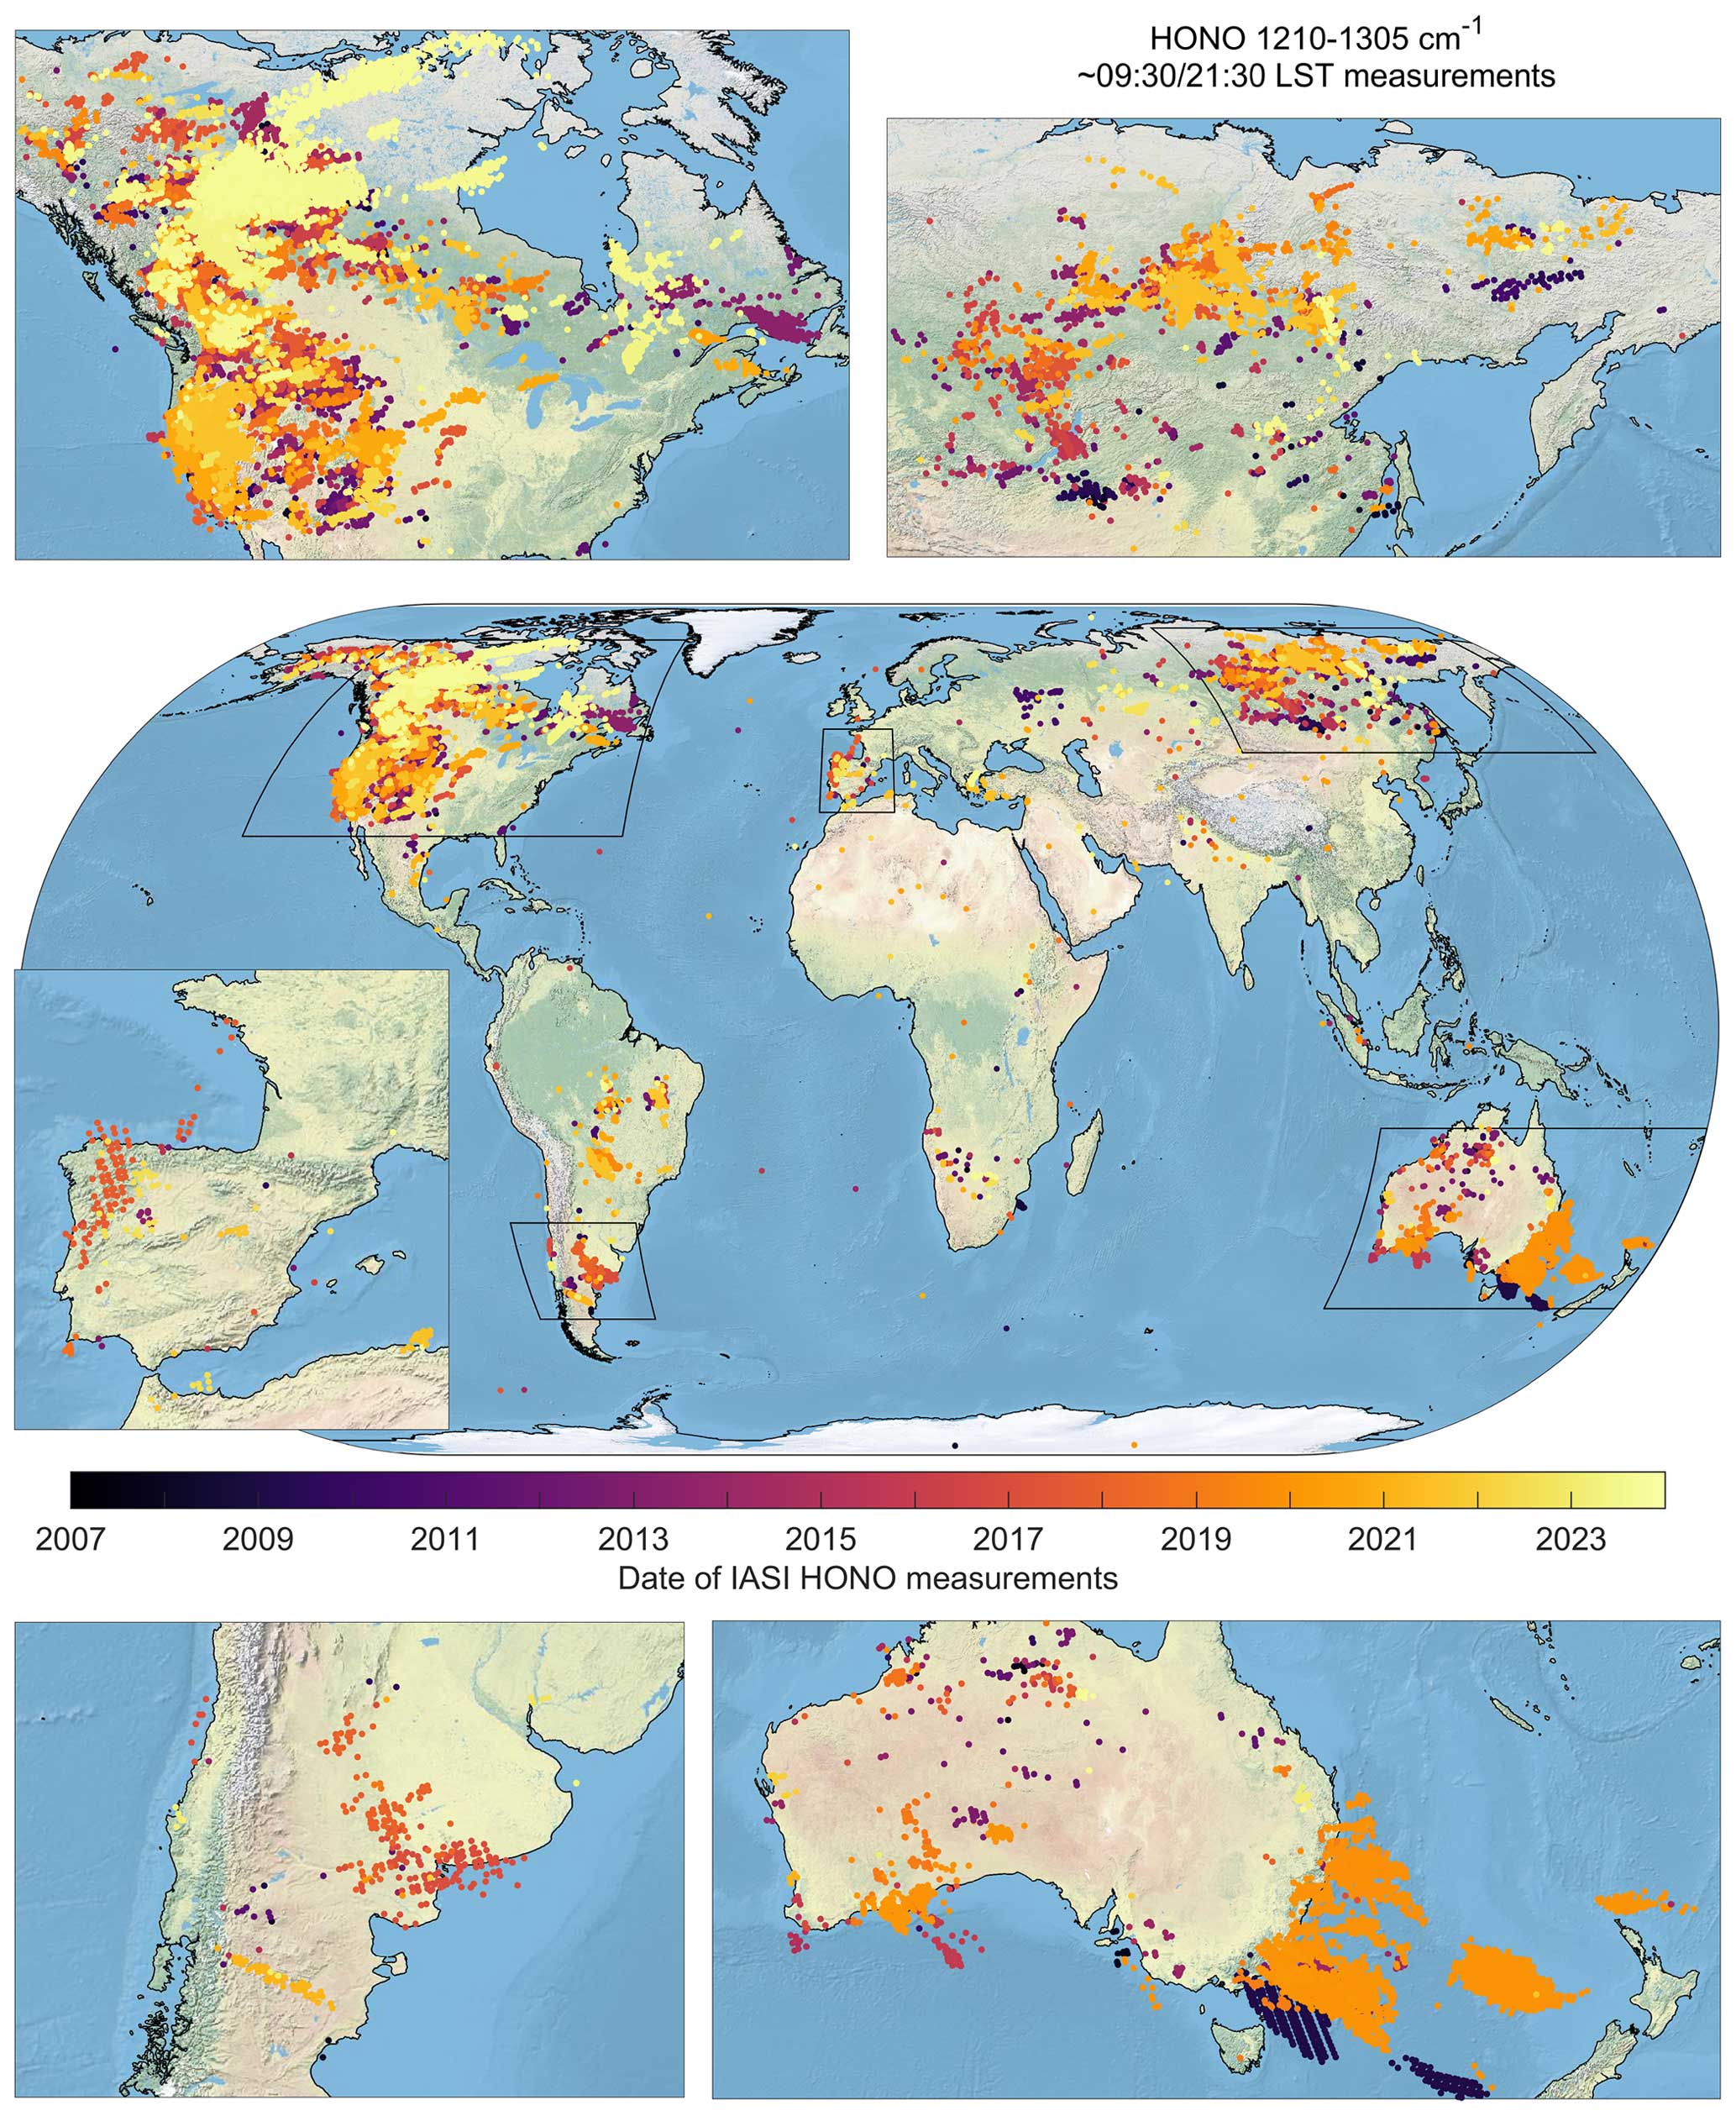
Figure 4Global distribution of the individual IASI measurements (morning/evening overpasses combined) with a confirmed HONO detection in a fire plume, colour-coded by the year of observation. The distribution is based on the HONO HRI calculated in the 1210–1305 cm−1 spectral range. Base map from ESRI (2023).
Interestingly, most HONO detections with IASI occur relatively close to the fire source, and detected plumes are almost never observed 12 h later, on IASI's next overpass, which is consistent with the short atmospheric lifetime of HONO. Exceptions occur with some intense fire events, where IASI can still detect HONO even after long-range transport spanning multiple morning/evening overpasses. In Fig. 4, notable examples include the 2009 and 2019/2020 Australian bushfires (Clarisse et al., 2011; De Longueville et al., 2021; Dufour et al., 2022). In both events, IASI still detects HONO near New Zealand after significant transport of more than 24 h over the ocean. Another example is the Iberian wildfires that affected Portugal and Spain in October 2017 (Fig. 4). These forest fires generated a large smoke plume on 15–16 October, which was transported towards northern Europe. IASI detected HONO over the continent during the early phases of the plume on the night of 15 October (evening overpasses) and on the morning of 16 October (morning overpasses) after significant transport up to Brittany, France. The detection of HONO from space after such long-range transport is remarkable considering its usual short lifetime and the challenges associated with its detection. The survival of HONO could be attributed to the high aerosol concentrations within the fire plumes, which prevented effective HONO photodissociation during daytime, as suggested by Dufour et al. (2022) in the context of the 2019–2020 Australian bushfires. Secondary production of HONO, especially through heterogeneous reactions involving aerosols (Stemmler et al., 2006; Nie et al., 2015), soot (Ammann et al., 1998; Monge et al., 2010), particulate and organic nitrates (Ye et al., 2017; Andersen et al., 2023; González-Sánchez et al., 2023), and NH3-promoted hydrolysis of nitrogen dioxide (NO2; Li et al., 2018; Xu et al., 2019), may also contribute to its presence as such fire plumes are typically characterized by high loads in these components.
The analysis of Fig. 4 reveals that pyrogenic HONO is primarily detected by IASI in the mid- and high latitudes of both hemispheres. In the Northern Hemisphere (NH), the regions with the highest concentrations of HONO detections are North America and Siberia, with additional detections found in the Mediterranean Basin (Spain, northern Africa, Greece, and Turkey) and western Russia (e.g., during the 2010 Russian wildfires). In the Southern Hemisphere (SH), Australia has the highest number of confirmed HONO measurements, with significant detections also occurring in South America (Brazil, Bolivia, and Argentina). In contrast, the detection of pyrogenic HONO is significantly reduced in the typical biomass burning regions within the tropics, such as in Central America, Africa, and southeastern Asia. The same global distribution is observed for the 820–890 cm−1 HONO HRI (Fig. A5).
Figure 5a–b displays all the confirmed HONO detections from the IASI and TROPOMI observations over the 2018–2023 period on a 1° × 1° grid, colour-coded based on the month of the year with the most HONO detections within each grid cell. Despite some differences due to the respective lengths of the two satellite sensors' time series, the IASI and TROPOMI distributions exhibit similar spatial and temporal patterns in the mid- and high latitudes (typically, beyond 35° N and S), with – as expected – the months of most detections occurring in the local summertime (May–September in the NH and November–February in the SH). For example, in Siberia, both sensors detect pyrogenic HONO in the southern part of the region in May–June and in the northern part in July–August, consistent with the increasing temperatures as one moves towards higher latitudes throughout summer. However, the comparison reveals that IASI misses many of the TROPOMI detections in the tropical biomass burning regions. For instance, IASI detects HONO in southern Amazonia, southern Africa, and Indonesia in August–October and in western and northern Australia in October–January, consistent with the dry season in these regions, but these detections are limited compared to TROPOMI. Moreover, IASI detects only a handful of the TROPOMI HONO in Central America, western Africa, and southeastern Asia (March–April) and in central Africa (November–February). Causes for such missed detections are investigated in Sect. 3.2.
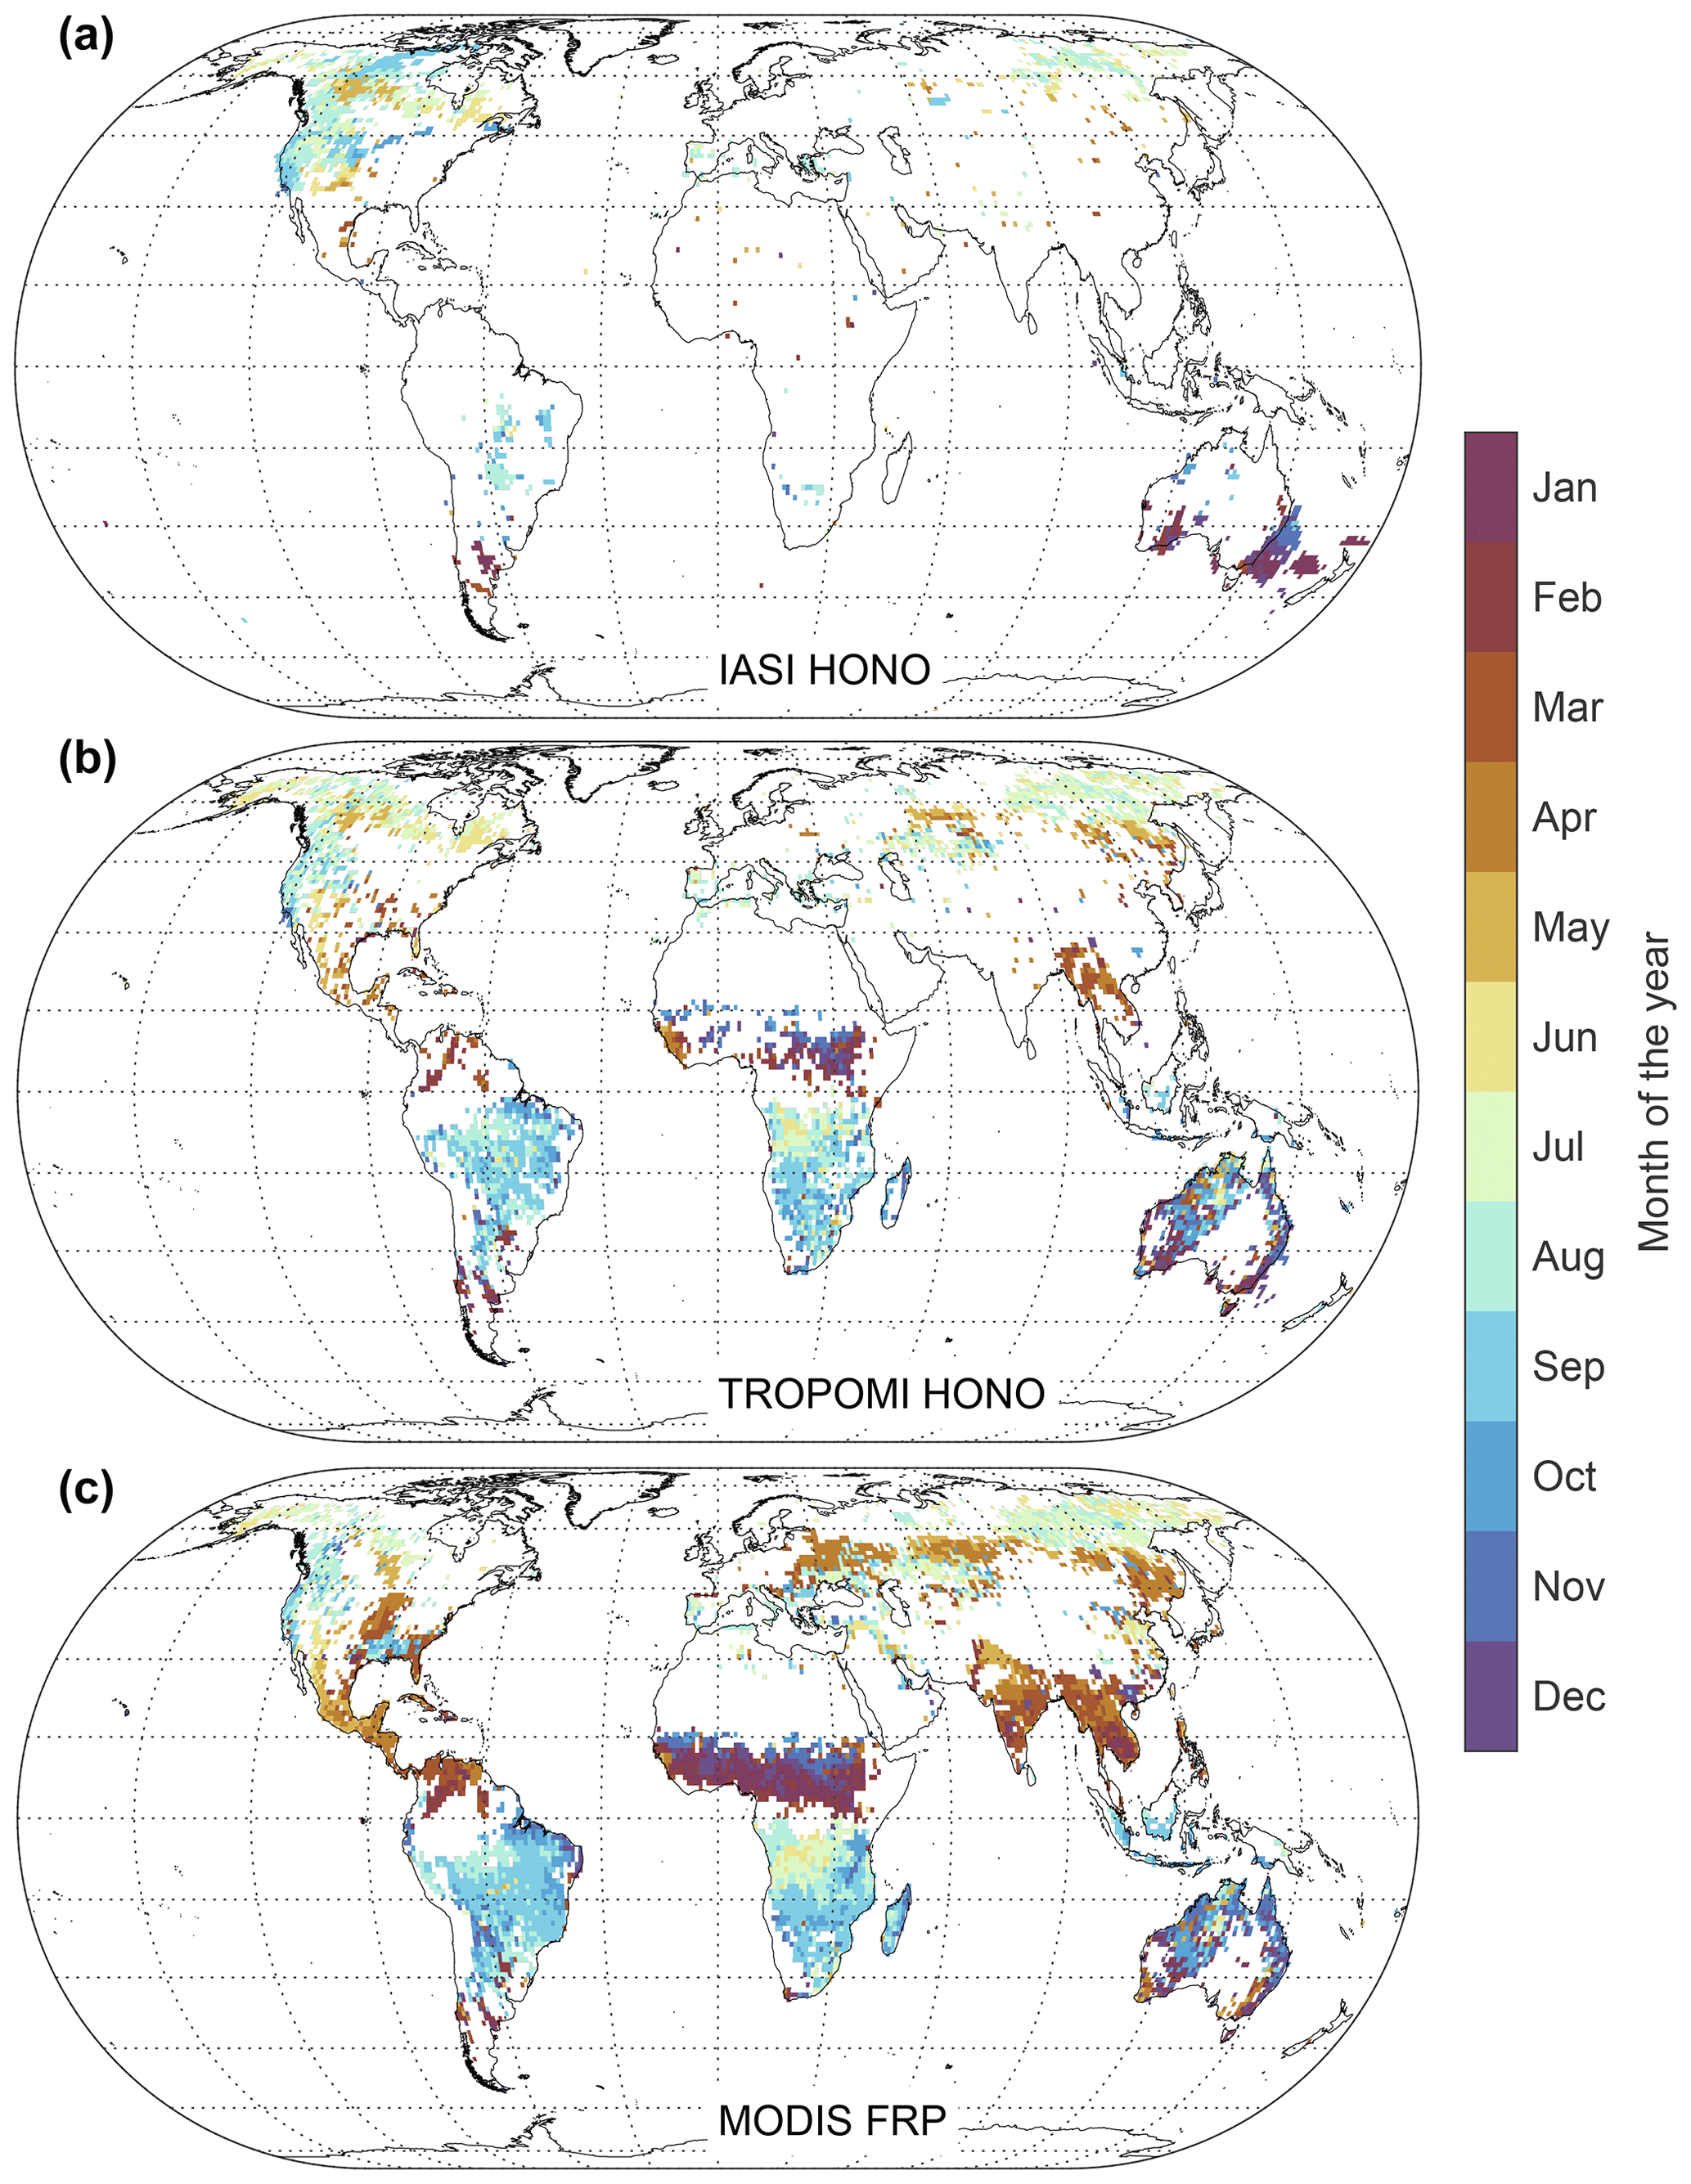
Figure 5Month of the year with the most HONO detections from the IASI (a) and TROPOMI (b) observations over the 2018–2023 period, and with the highest cumulative MODIS/Terra FRP (2018–2022) (c), on a 1° × 1° grid. Filters on the number of MODIS active fire detections (> 50 per grid cell) and cumulative FRP (> 200 MW per grid cell) were applied to exclude regions with fewer biomass burning activities. Parallels are drawn every 15° and meridians every 30°.
3.2 Influence from fire intensity and plume altitude
Two key factors can explain why IASI does not systematically detect HONO in fire plumes, especially in comparison to TROPOMI: low HONO concentrations and weak thermal contrast (temperature difference between Earth's surface and an atmospheric air layer).
HONO is primarily produced abundantly during the flaming phase of wildfires; thus it is related to fire intensity (Keene et al., 2006; Burling et al., 2010; Neuman et al., 2016; Peng et al., 2020; Chai et al., 2021). Such active fires are monitored globally at high spatial resolution by MODIS (Giglio et al., 2006). To investigate the influence of fire activity on the detection of HONO with IASI, we use the MODIS Level 2 fire products, Collection 6 (Giglio et al., 2016), over the 2006–2021 period. Specifically, the MODIS fire radiative power (FRP), quantifying the radiative heat released instantaneously by detected fires, is related to the rate of fuel consumption and serves as a satellite metric of fire intensity (Wooster et al., 2005; Ichoku et al., 2008; Kaiser et al., 2012; Rogers et al., 2015; Giglio et al., 2016). Here, considering the IASI overpass times at the Equator (∼ 09:30/21:30 LST), we use near-synchronous data from MODIS/Terra (∼ 10:30/22:30 LST).
The distribution in Fig. 5c illustrates the month of the year with the highest cumulative MODIS FRP. It indicates that in regions where HONO is detected in fire plumes using IASI (Fig. 5a) and TROPOMI (Fig. 5b) measurements, the timing of most HONO detections coincides with the period of most intense fire activity. This is consistent with the increase in HONO abundance (and of the ratio of HONO to NO2) with increasing FRP that is observed with TROPOMI measurements in wildfire plumes globally (Fredrickson et al., 2023), further underscoring the close link between HONO production and fire intensity.
Figure 6 illustrates the annual count of active fires detected by MODIS and the annual average FRP on a 1° × 1° grid. The highest numbers of active fires are in tropical biomass burning regions, while mid- and high latitudes show significantly fewer fires (Fig. 6a–b). In contrast, the mean MODIS FRP is considerably higher in these latitudes than in the tropics, especially in North America, Siberia, and Australia (Fig. 6c–d). This is consistent with previous studies based on satellite data of active fires that report a general inverse relationship between fire occurrence and observed FRP in most biomass burning ecosystems for intermediate- and high-intensity fires (Giglio et al., 2006; Luo et al., 2017; Andela et al., 2019; Haas et al., 2022). Elevated FRP is typically associated with large and intense fires (Rogers et al., 2015), especially in temperate and boreal forested ecosystems where high fuel densities and fuel continuity in the landscape favour expanded, high-intensity, long-duration wildfires (Andela et al., 2019; Laurent et al., 2019). Conversely, in more arid ecosystems (e.g., savannah, grasslands, and shrublands) and in agricultural and human-dominated landscapes, the size and duration of fires are usually limited by higher fire occurrence, lower availability in fuels, and landscape fragmentation. In humid tropical regions, fuel moisture seems to be the primary factor limiting the velocity, size, and intensity of fires (Luo et al., 2017; Andela et al., 2019). In general, as the largest and most intense fires occur in mid- and high latitudes, and as more HONO is produced from such fires, we therefore conclude that the likelihood of IASI detecting HONO in the associated plumes is higher. Conversely, it is less likely for IASI to detect the smaller fires that frequently occur within the tropics.
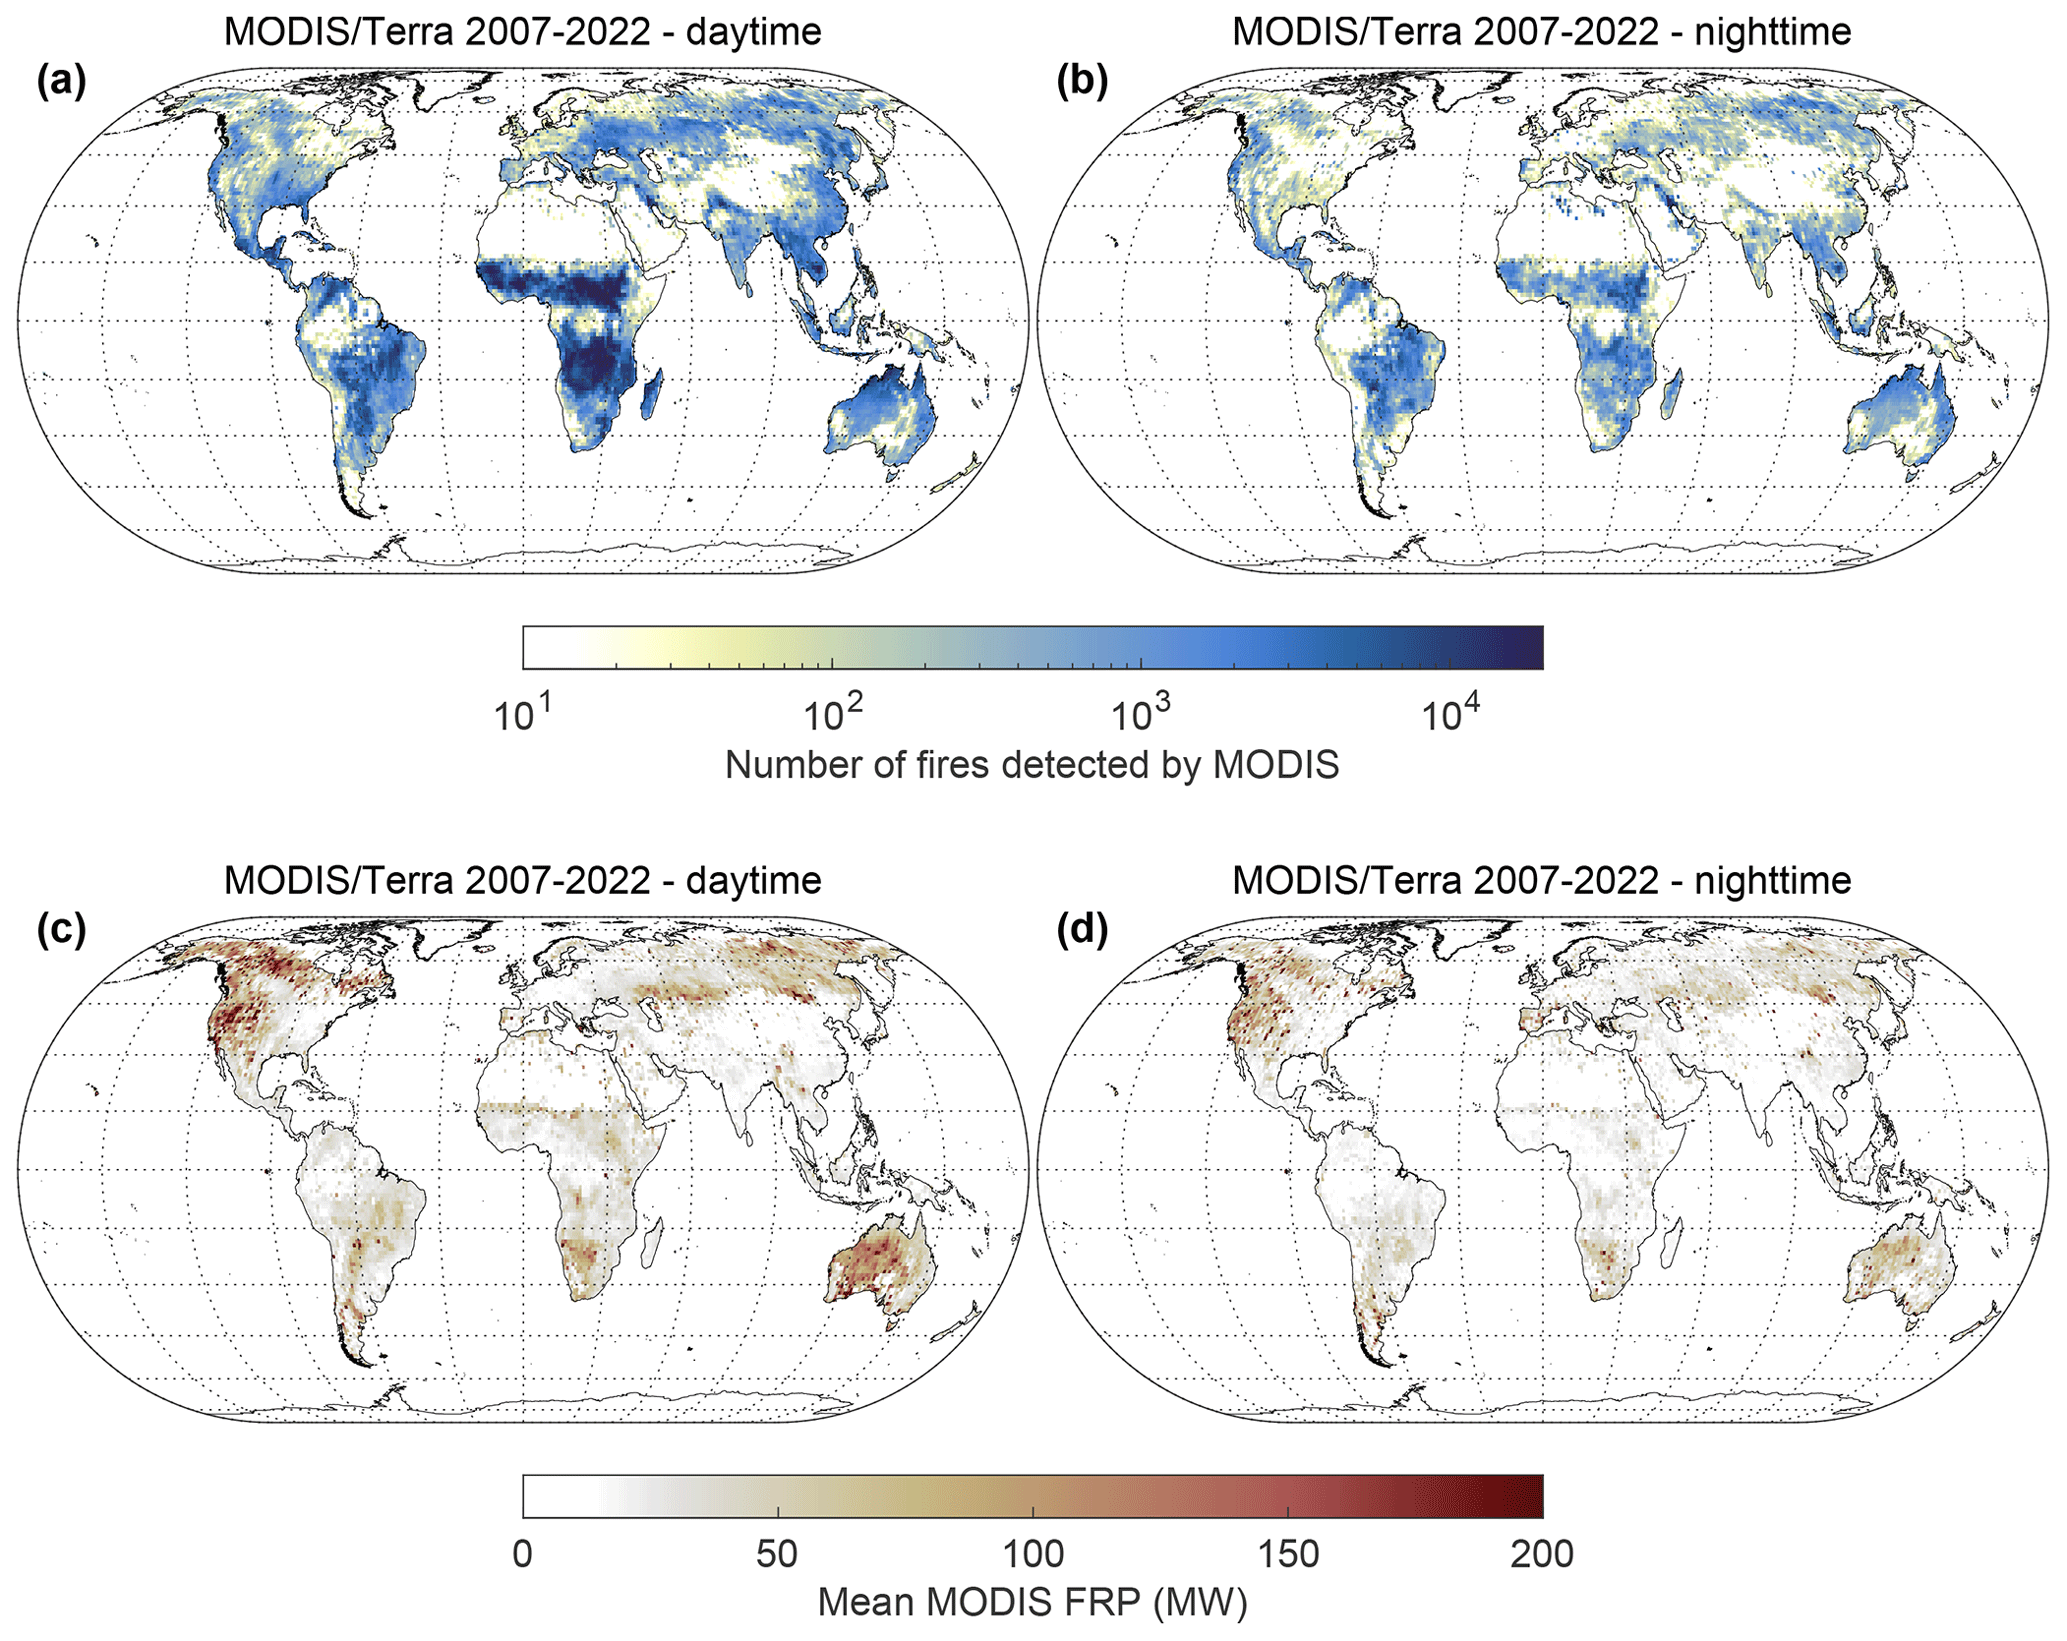
Figure 6Number of detected active fires (a–b) and averaged FRP (c–d) per 1° × 1° grid cell from MODIS/Terra observations over the 2007–2022 period, for daytime and nighttime observations separately (∼ 10:30/22:30 LST). Parallels are drawn every 15° and meridians every 30°.
Applying a similar rationale to TROPOMI data, it is worth noting that TROPOMI also appears to face some challenges in detecting the many small fires visible with MODIS in intertropical areas, especially in the 0–30° N latitudinal band (e.g., in India), although to a lesser extent compared to IASI (Fig. 5a–b).
Thermal contrast is the other major factor influencing the TIR sensitivity to the atmosphere. For the same gas abundance, spectral absorption is stronger when thermal contrast is larger, facilitating the detection of the target species. Thermal contrast is closely tied to the temperature of the atmospheric layer containing the target species and, consequently, to its altitude. As altitude increases, the temperature typically decreases, resulting in higher thermal contrast. Therefore, the altitude at which a smoke plume is situated can significantly affect IASI’s sensitivity and its ability to detect HONO.
Based on Rodgers (2000) and Bauduin et al. (2017), the IASI (generalized) noise can be translated into an HONO vertical column density (VCD; i.e., total column) of
with Sy as the generalized covariance matrix of IASI used in the calculation of the HRI (see Sect. 2.1) and Kz as the spectral Jacobian with respect to HONO distributed vertically following a Gaussian profile peaking at the altitude z (for z values ranging between 0 and 14 km altitude) and with a standard deviation (σ) of 300 m around z, representing a narrow atmospheric layer. For the calculation of the Jacobian, we assumed the 1976 US standard atmosphere with a surface temperature of 300 K. An HONO detection threshold for IASI can then be estimated as 4ϵ consistent with the threshold HRI value of 4 (Sect. 2.4). As depicted in Fig. 7, the detection threshold is notably elevated for fire plumes in the lowermost layers, reflecting IASI's limited sensitivity close to the surface. However, this threshold decreases rapidly for higher fire plumes and larger thermal contrast (e.g., the threshold is reduced by a factor of 3 between 2 and 8 km altitude), indicating IASI's enhanced capability to detect HONO within elevated fire plumes. Figure 7 also provides estimates of TROPOMI's detection threshold for HONO in fire plumes using the same approach as for IASI. The simulations assumed a single-scattering albedo (SSA) of 80 % (fresh plume and absorbing aerosols) and an aerosol optical depth (AOD) of 5. The results indicate that TROPOMI's detection threshold is generally less variable throughout the troposphere and notably lower compared to IASI, particularly in the lowermost atmospheric layers.
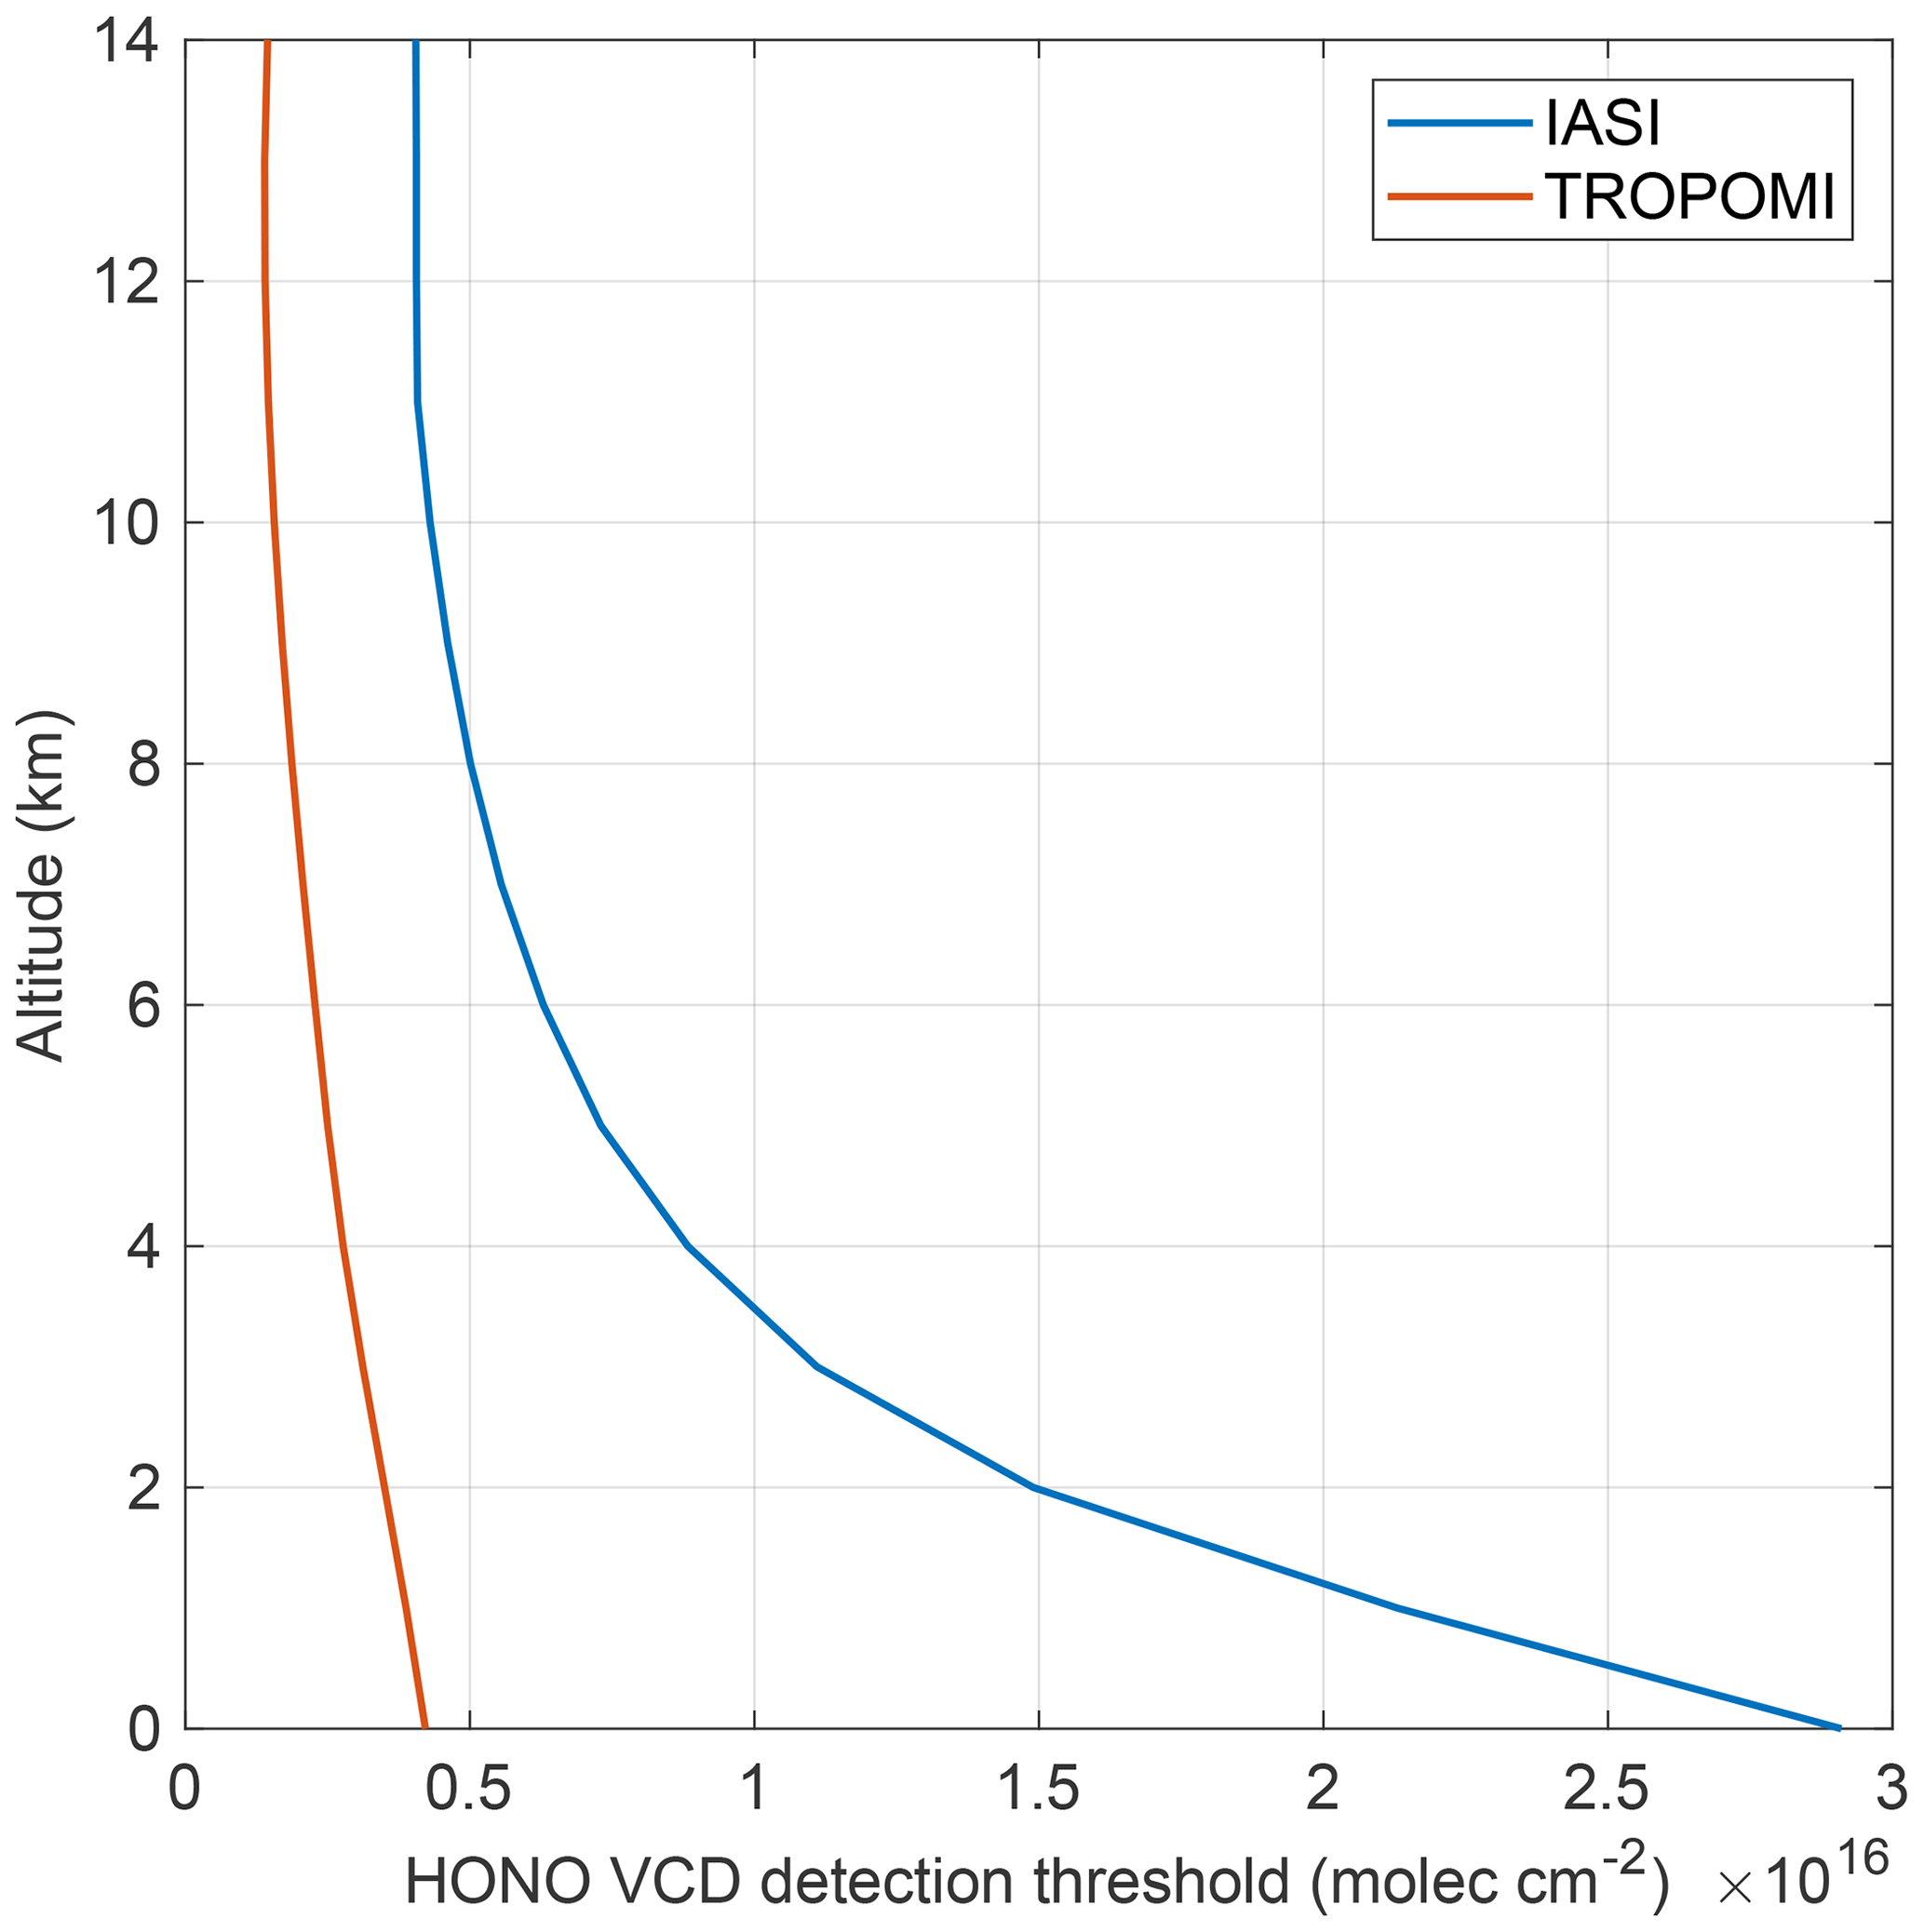
Figure 7Typical IASI and TROPOMI's detection threshold of HONO vertical column densities (VCDs; in molec cm−2) according to the altitude of the fire plume containing HONO.
To investigate the link between HONO detection with IASI and fire plume height, we constructed a plume altitude climatology (Fig. 8) using the Cloud–Aerosol Lidar and Infrared Pathfinder Satellite Observation (CALIPSO) 5 km aerosol layer products (Winker et al., 2009, 2013). We specifically used CALIPSO versions 4.10 (2006–2016) and 4.20 (2017–2020). The climatology was derived through the following steps. For each day of observation, we selected all tropospheric and stratospheric layers categorized as “elevated smoke” or “volcanic ash” with a mid- or high confidence rating in terms of feature-type quality assessment. In cases where multiple layers overlapped on a given day, only the layer with the highest base altitude was considered, as IASI is less likely to detect compounds within lower layers. To exclude influence from anthropogenic pollution plumes, only layers with a base altitude above 2 km were considered. The altitude for each individual layer was determined by averaging the layer top and layer base values. Subsequently, the layer altitudes were calculated on a 1° × 1° grid by considering the 75th percentile of all layer altitudes within each grid cell throughout the CALIPSO time series. We opted for the 75th percentile instead of the mean to reduce the impact of numerous low-altitude layers comprising typically between 2 and 4 km, which may be influenced by anthropogenic pollution plumes. This allows a better representation of the distribution of elevated smoke, which is more relevant considering IASI vertical sensitivity.

Figure 8Climatology of smoke plume altitude on a 1° × 1° grid derived from CALIPSO 5 km aerosol layer products versions 4.10 (2006–2016) and 4.20 (2017–2020). Only smoke layers with a base altitude above 2 km were considered to exclude influence from anthropogenic pollution plumes. A land/sea mask was applied to exclude observations over the ocean. Parallels are drawn every 15° and meridians every 30°.
Figure 8 indicates that fire plumes over continental source regions tend to reach greater heights in mid- and high latitudes compared to biomass burning regions within the tropics. This pattern is particularly noticeable in the 40–60° N latitudinal band, specifically over North America and in Siberia, where IASI detects the majority of pyrogenic HONO. This observation is consistent with the higher MODIS FRP values in these regions (Fig. 6c–d), as intense and expansive wildfires generate smoke plumes that often reach elevated altitudes due to higher temperatures promoting atmospheric instability and strong pyroconvection (Val Martin et al., 2010; Ke et al., 2021; Wilmot et al., 2022; Kingsmill et al., 2023). These findings indicate that in regions characterized by intense wildfires, both significant HONO emissions and higher injection heights increase the spectral absorption in the IASI measurements and facilitate the detection of HONO. Conversely, within the tropics, the fires are more frequently of low or moderate intensity compared to the 40–60° N latitudinal band and generate lower plumes, hindering the HONO detection with IASI. Indeed, the intertropical biomass burning regions where the IASI HONO measurements are limited, especially compared to TROPOMI, correspond relatively well to the areas characterized by lower plume altitudes (e.g., Amazonia, southeastern Asia, and Africa). In contrast, the detection threshold of TROPOMI does not rise as steeply as IASI at lower altitudes (Fig. 7), reflecting its superior sensitivity to the lowermost atmosphere. As a result, TROPOMI can detect pyrogenic HONO in intertropical areas, while IASI often misses these detections.
Figure 9 presents the normalized distributions of HONO detections by IASI and TROPOMI over the 2018–2023 period, alongside the active fires detected by MODIS, per latitudinal bins of 10°. Due to their coincident overpass times, IASI (∼ 09:30/21:30 LST) is compared to MODIS/Terra (∼ 10:30/22:30 LST), while TROPOMI (∼ 13:30 LST) is compared to MODIS/Aqua (∼ 13:30 LST). Figure 9a confirms that IASI primarily detects HONO outside the tropics, especially in the 30–70° N latitudinal band, while HONO detection is not frequent in tropical fires. The peak between 30 and 40° S is mainly attributed to the extensive HONO detections during the 2019–2020 Australian bushfires. In Fig. 9b, it can be seen that the latitudinal distribution of HONO detections by TROPOMI aligns more closely with the MODIS data. These results confirm that TROPOMI can detect lower HONO abundance, particularly in fires within the intertropical zone, owing to its lower detection thresholds and greater sensitivity to the lower layers, as explained previously. Moreover, with a circular pixel size of 12 km diameter at nadir, IASI's spatial resolution is coarser than TROPOMI (3.5 × 5.5 km2). Consequently, the same quantity of HONO concentrated within a fire plume is more diluted inside an IASI pixel, making it either more difficult to detect or undetectable. Moreover, narrow fire plumes can also be missed when they take place in the gaps between IASI pixels. On the other hand, Fig. 9b also reveals discrepancies between the latitudinal distribution of TROPOMI's HONO detections and MODIS data. Notably, there is a higher proportion of HONO detections beyond 50° N and a lower proportion in the 0–30° N band compared to the latitudinal distribution of the MODIS active fires. This emphasizes that, like IASI, TROPOMI's ability to detect pyrogenic HONO is also contingent on biomass burning factors such as the fire size and intensity and the altitude of the fire plume. These findings underscore the significance of these factors in shaping the spaceborne detection of pyrogenic HONO, particularly concerning IASI.
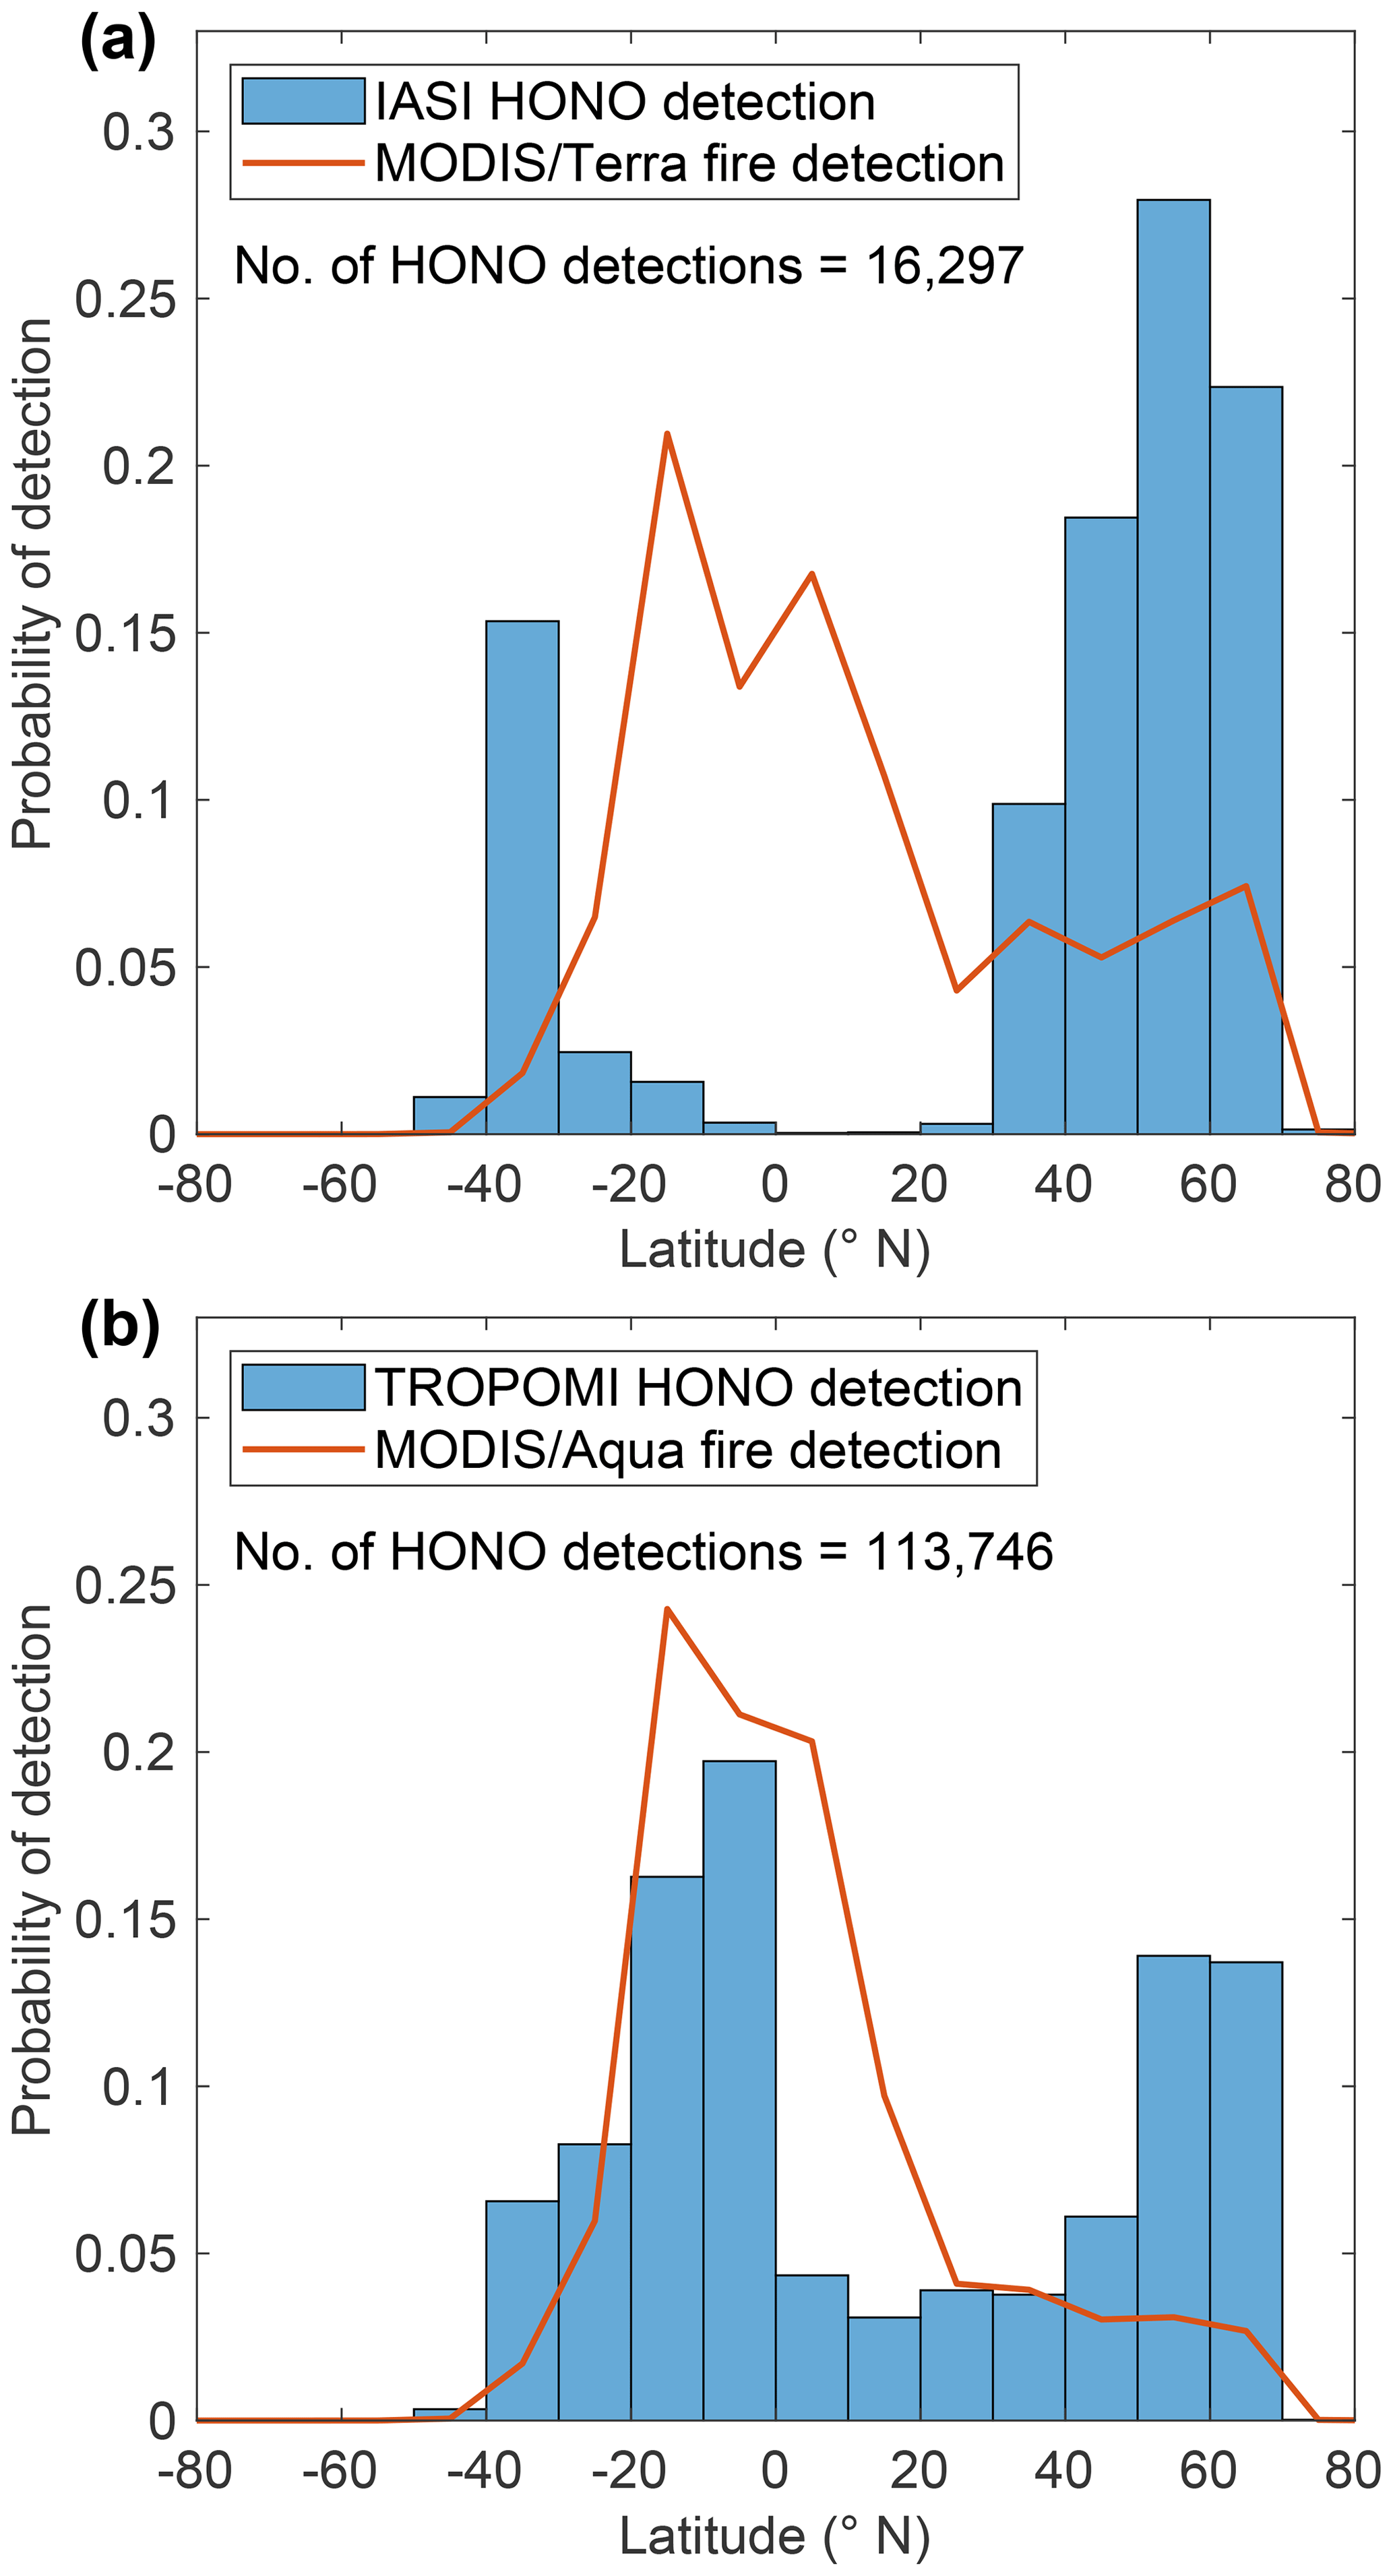
Figure 9Normalized distributions of the count of HONO detections by IASI (a) and TROPOMI (b) over the 2018–2023 period, and of the count of active fires detected by MODIS/Terra (a) and MODIS/Aqua (b), per latitudinal bins of 10°.
Other parameters can also contribute to explaining the observed IASI–TROPOMI discrepancies of HONO detections, such as the overpass time of the satellite sounders. Those will be discussed in further sections.
3.3 IASI time series of pyrogenic HONO
In this section, we analyse the 16-year time series of HONO observations in fresh fire plumes captured by IASI. Figure 10 displays the number of daily detections throughout the time series for each IASI instrument, specifically for the 1210–1305 cm−1 HONO absorption band, with daytime and nighttime data separated. Figure A6 provides the same time series based on the 820–890 cm−1 HRI.

Figure 10Number of daily confirmed HONO detections throughout the time series of each IASI instrument, specifically for the 1210–1305 cm−1 HONO absorption band, with daytime and nighttime data separated.
Firstly, the time series demonstrate the consistency between the HONO detections made by the three IASI instruments during the years when their observations overlap. Additionally, a clear seasonality shows a maximum of HONO detections during the boreal summer, driven by the many HONO measurements in North America and Siberia during the NH wildfire season (see Figs 4–5). A large interannual variability is also noticeable.
Figure 11, which displays the number of HONO detections above 30° N per year and per IASI instrument, further visualizes this interannual variability and the temporal evolution of pyrogenic HONO. The small differences between IASI-A and -B, e.g., in 2017 and 2019, are attributed to short periods of unavailability of IASI-A during the boreal summer. Likewise, the lower HONO detections by IASI-A compared with IASI-B and -C in 2021 are due to the halt of operations and decommissioning of IASI-A in September 2021. Except for these differences, the IASI instruments present consistent results and together show, interestingly, a significant increase in annual HONO measurements. Between the early time series (2008–2009) and 2020–2021 (only 3 months of observations being available in 2007), the number of confirmed HONO detections increases by a factor of 3–4, suggesting an intensification in wildfire activities in the NH mid- and high latitudes. This finding is consistent with recent studies reporting a dramatic increase in the number and intensity of wildfires in boreal regions over the last decades (Schoennagel et al., 2017; Jones et al., 2022; Zheng et al., 2023) due to rising temperatures, water vapour deficits, and intensification in lightning activity (Chen et al., 2021; Jain et al., 2021). In particular, the spike in pyrogenic HONO detected by IASI in 2021 aligns with the record-high CO2 emissions from boreal fires reported for that year by Zheng et al. (2023). Conversely, both IASI-B and -C exhibit a drop in the number of HONO detections in 2022, down to levels observed during the 2008–2011 period. Finally, the data available for the year 2023 (currently until the end of September) show a significant, sharp increase in HONO detections by both IASI-B and -C, almost a factor of 2 compared to 2021 and a factor of 8–9 compared to 2008–2009. Analysis of these HONO detections reveals that this surge is due to the extensive, intense wildfires that occurred in Canada throughout the 2023 summer.
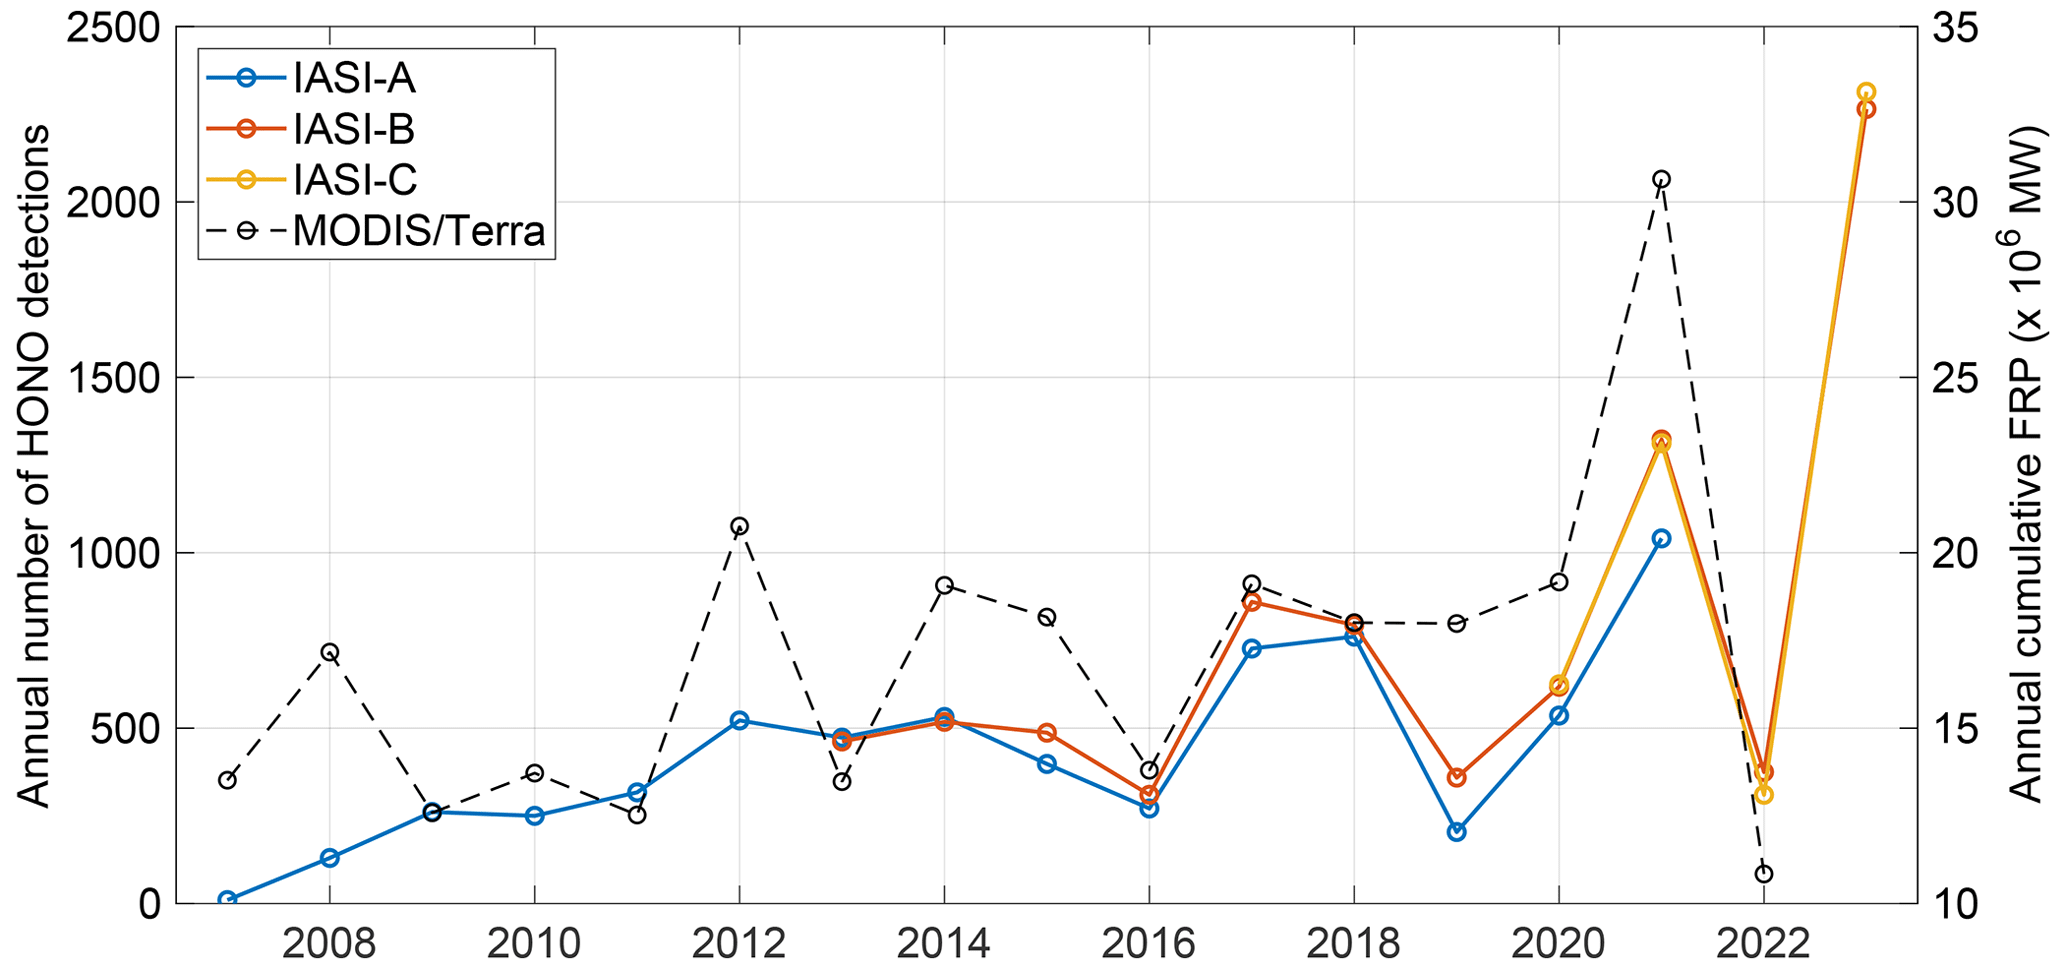
Figure 11Number of confirmed HONO detections (both daytime and nighttime) above 30° N per year and per IASI instrument, specifically for the 1210–1305 cm−1 HONO absorption band (left y axis). Annual cumulative FRP from MODIS/Terra for latitudes above 30° N (right y axis).
In Fig. 11, we also present the annual cumulative FRP from MODIS/Terra for the NH mid- and high latitudes (> 30° N). Note that the consolidated MODIS FRP data are not available yet for the entire 2023 as of the time of this study. The cumulative FRP is the sum of all individual fire contributions throughout each year, providing a better indicator of integrated biomass combustion than the fire count (which disregards fire magnitude) or average FRP (which ignores the number of fires). We observe that the cumulative FRP follows the time series of HONO detections, with noticeable drops in 2016 and 2022 and a peak in 2021, aligning with the IASI data. This confirms the observations made previously with HONO and represents additional evidence indicating that HONO detection with IASI depends strongly on fire intensity.
3.4 Daytime vs. nighttime HONO detections
Figure 10 also reveals a significant disparity in the number of HONO detections between the morning and evening IASI observations, with 2393 and 21 392 confirmed detections, respectively. The nighttime measurements lead to almost 10 times more detections of pyrogenic HONO than the daytime data. This disparity is also evident using the 820–890 cm−1 HRI, with 2316 and 10 608 detections, respectively.
From the perspective of TIR satellite remote sensing, this is remarkable because nighttime measurements are typically characterized by lower thermal contrasts than daytime measurements (Clerbaux et al., 2009). As explained in Sect. 3.2, for the same concentration of the target gas, reduction in thermal contrast decreases spectral absorption. This effect is pronounced for species that already reside in an altitude range characterized by a limited thermal contrast, i.e., in the lowermost atmospheric layers. Example species include NH3, C2H4, methanol, formic acid, acetic acid, and hydrogen cyanide (HCN; Franco et al., 2018, 2020; Rosanka et al., 2021; Franco et al., 2022; Clarisse et al., 2023). For HONO, as we are mostly sensitive to plumes at higher altitudes (well into the free troposphere), the effect should be less, but we would still expect higher sensitivity during the daytime.
In situ measurements have provided compelling evidence of HONO exhibiting a pronounced diel cycle (Volkamer et al., 2010; Spataro and Ianniello, 2014; VandenBoer et al., 2014; Oswald et al., 2015; Zhang et al., 2023b). This cycle is driven by an intense photolysis during the day, rapidly removing HONO from the atmosphere by the time of the morning IASI overpass (∼ 09:30 LST) and resulting in its lowest concentrations in the early afternoon. Conversely, at night, when rapid photodissociation is absent, HONO accumulates in the atmosphere, notably through light-independent heterogeneous formation. The prevalence of HONO detections from the nighttime IASI overpasses (∼ 21:30 LST) can therefore be attributed to the pronounced diel cycle of HONO and its significantly longer lifetime at night.
To rule out potential other reasons for the observed morning/evening difference, it is useful to look at another short-lived biomass burning tracer, namely C2H4. In Fig. 12, we compare the spatial distributions of pyrogenic HONO with the IASI observations of C2H4. Over the same 2007–2023 period as for HONO, we have reported in Fig. 12c–d all the IASI observations with a C2H4 HRI > 5. Considering that C2H4 HRI remains particularly low outside biomass burning plumes (Franco et al., 2022), this threshold effectively isolates pyrogenic C2H4. The IASI detection of ethylene presents interesting similarities with that of HONO (Fig. 12a–b), as both species are reactive fire tracers primarily retrieved in concentrated fire plumes at higher altitudes in the mid- and high-latitudinal bands. As illustrated in Fig. 12c–d, the highest numbers of C2H4 detections are indeed found in North America (primarily in the western US and Canada) and Siberia. Compared with HONO, C2H4 measurements exhibit longer-range transport locally, for instance over the ocean, due to the compound's longer lifetime (1–1.5 d; Warneck, 1999; Wayne, 2000; Atkinson and Arey, 2003). However, unlike HONO, the number of C2H4 detections remains relatively constant for the morning and evening IASI overpasses.

Figure 12umber of confirmed HONO detections (a–b), for the 1210–1305 cm−1 absorption band, and of C2H4 detections (c–d) in fire plumes, on a 1° × 1° grid, derived from the IASI time series over the 2007–2023 period. The detections from the daytime and nighttime IASI overpasses are shown separately. Parallels are drawn every 15° and meridians every 30°.
Ethylene is primarily removed from the atmosphere through oxidation by OH and ozonolysis (Warneck, 1999; Wayne, 2000; Atkinson and Arey, 2003). Although reactions with OH and O3 are expected to proceed more slowly during nighttime hours due to lower temperatures, we do not observe a prevalence of C2H4 detections with the evening IASI measurements, such as observed for HONO (Fig. 12). This suggests, firstly, that variations in photochemistry between daytime and nighttime do not significantly impact C2H4 concentrations in fire plumes. Secondly, it implies that the presence of measurement artefacts responsible for large daytime/nighttime differences in HONO detection can be ruled out, confirming that the absence of photolysis is the primary driver of the more numerous HONO detections at nighttime.
In this section, we describe the methodology employed to retrieve total column abundances of HONO from the IASI measurements. Then, we present two case studies where we compare IASI with TROPOMI measurements.
4.1 Retrieval framework
To derive HONO vertical abundances, we applied the Artificial Neural Network for IASI (ANNI) retrieval scheme, specifically developed for the retrieval of weakly absorbing trace gases from IASI observations and extensively described in the following references (see, e.g., Franco et al., 2018; Clarisse et al., 2023). Since a detailed explanation of this scheme has already been provided in these references, here we only provide a summary of the key retrieval steps and those elements specific to the HONO retrieval. We closely follow the formalism used by Clarisse et al. (2023), shown below.
The first step of the ANNI retrieval procedure consists of calculating an HRI for each observed spectrum, as described earlier (Sect. 2.1). In the second step, the HRI is converted into a single-pixel estimate of the gas total column via a scaling factor SFa (the superscript a indicates the use of an assumed vertical distribution of the target gas).
In ANNI, SFa is estimated by an artificial feedforward neural network (NN) based on input parameters related to the Earth's atmosphere and surface. These parameters include the HONO HRI itself, the temperature (15 levels) and H2O (7 levels) profiles, surface temperature, pressure, emissivity, the IASI viewing angle, and two parameters z0 and σ characterizing the HONO vertical profile following a Gaussian distribution:
with k as a multiplicative factor, z0 ranging from the surface up to 20 km altitude, and σ comprised between 100 m and 3 km. This vertical-profile parametrization, which is the same as that used for the NH3 and C2H4 IASI products, allows us to approximate a wide variety of profiles (Whitburn et al., 2016; Van Damme et al., 2021; Franco et al., 2022). In particular, for HONO, this profile can be used to model fire plumes of various thicknesses and located at various altitudes from the surface to the lower stratosphere.
The NN consists of two computational layers of 12 nodes. It is trained based on an extensive set of synthetic spectra (> 500 000 spectra) generated with representative input data of the atmospheric and surface conditions, as well as parameters related to the abundance and vertical distribution of HONO (σ, z0, and k). For each IASI observation, the NN estimates SFa based on the input parameters and provides the ratio as the main output (along with other ancillary outputs; see Sect. 4.2), which is subsequently converted to . The primary advantage of using this ratio as output instead of itself is to ensure that the retrieval on noisy HRIs does not result in a biased product (see Whitburn et al., 2016, for more on the rationale behind this ratio).
For the ANNI retrieval, the meteorological input variables are sourced from the European Centre for Medium-Range Weather Forecasts (ECMWF) ERA5 reanalysis (Hersbach et al., 2020). This choice ensures a more comprehensive and coherent dataset across the entire IASI operational time series than with the IASI Level 2 data (Van Damme et al., 2021).
Ideally, z0 and σ should be tailored for each single-pixel HONO retrieval based on the actual altitude and thickness of the fire plume. Unfortunately, such third-party information is rarely available. Consequently, for the standard ANNI v4 HONO product, the parameter z0 is set based on a 1° × 1° monthly climatology of fire plume altitudes derived from CALIPSO data (Sect. 3.2), and a value of 350 m is assigned for σ. The same approach was applied to estimate the dust altitude for retrieving dust optical depths from IASI observations (Clarisse et al., 2019). However, since the NN has been trained to encompass a broad range of z0 and σ values, these parameters can be adjusted for an optimized HONO retrieval if information on the altitude and thickness of a specific fire plume under study becomes available.
4.2 The IASI HONO product
For the HONO retrieval, we applied the latest version (v4) of the ANNI framework (Clarisse et al., 2023). This new version introduces significant updates compared to ANNI v3, including the regularization of the covariance matrix used for the HRI setup (Sect. 2.1) and the addition of total-column averaging kernel (AvK; denoted hereafter) associated with each retrieved column. The AvK enables us to simulate the IASI measurement by relating the true column with the retrieved column . For a noise-free measurement, the relation reads as follows:
The AvK can be used to simulate the column that would be retrieved () if HONO was distributed vertically along Xz = Mz, where Mz is the partial columns obtained from third-party measurements or an atmospheric model.
The total columns and can be fairly compared as they both use the same vertical-profile assumption.
However, there is another way in which the AvKs can be exploited, namely, they can be used to alter the actual retrieved column by assuming that the vertical profile of HONO follows , with M as the third-party total column. The corresponding total column can be calculated as
In particular, if we assume that HONO is confined to a certain altitude z′ (mz = 0 for ), the retrieval can be altered according to
An example AvK for an HONO retrieval in British Columbia wildfires, Canada (17 August 2018; see Fig. 1a–b), is shown in Fig. 13b, along with the corresponding a priori profile (Fig. 13a). As explained by Clarisse et al. (2023), the AvKs generated by the ANNI framework result from unconstrained retrievals that do not provide explicit vertical information. Consequently, these AvKs predominantly capture the influence of thermal contrast, and thus altitude, and typically decrease towards the surface. This implies that the retrieved column is potentially biased if the altitude of the HONO peak in the a priori profile does not match the actual altitude of the fire plume containing HONO. For instance, considering the example AvK in Fig. 13b, the retrieved HONO column (assuming a peak at 5 km altitude) would be biased by ∼ 35 %–40 % if the true altitude of the fire plume were 7 km. In cases where the information on the plume height is available, it is advantageous to use Eq. (12) to provide a more realistic estimation of the true vertical distribution and abundance of HONO.
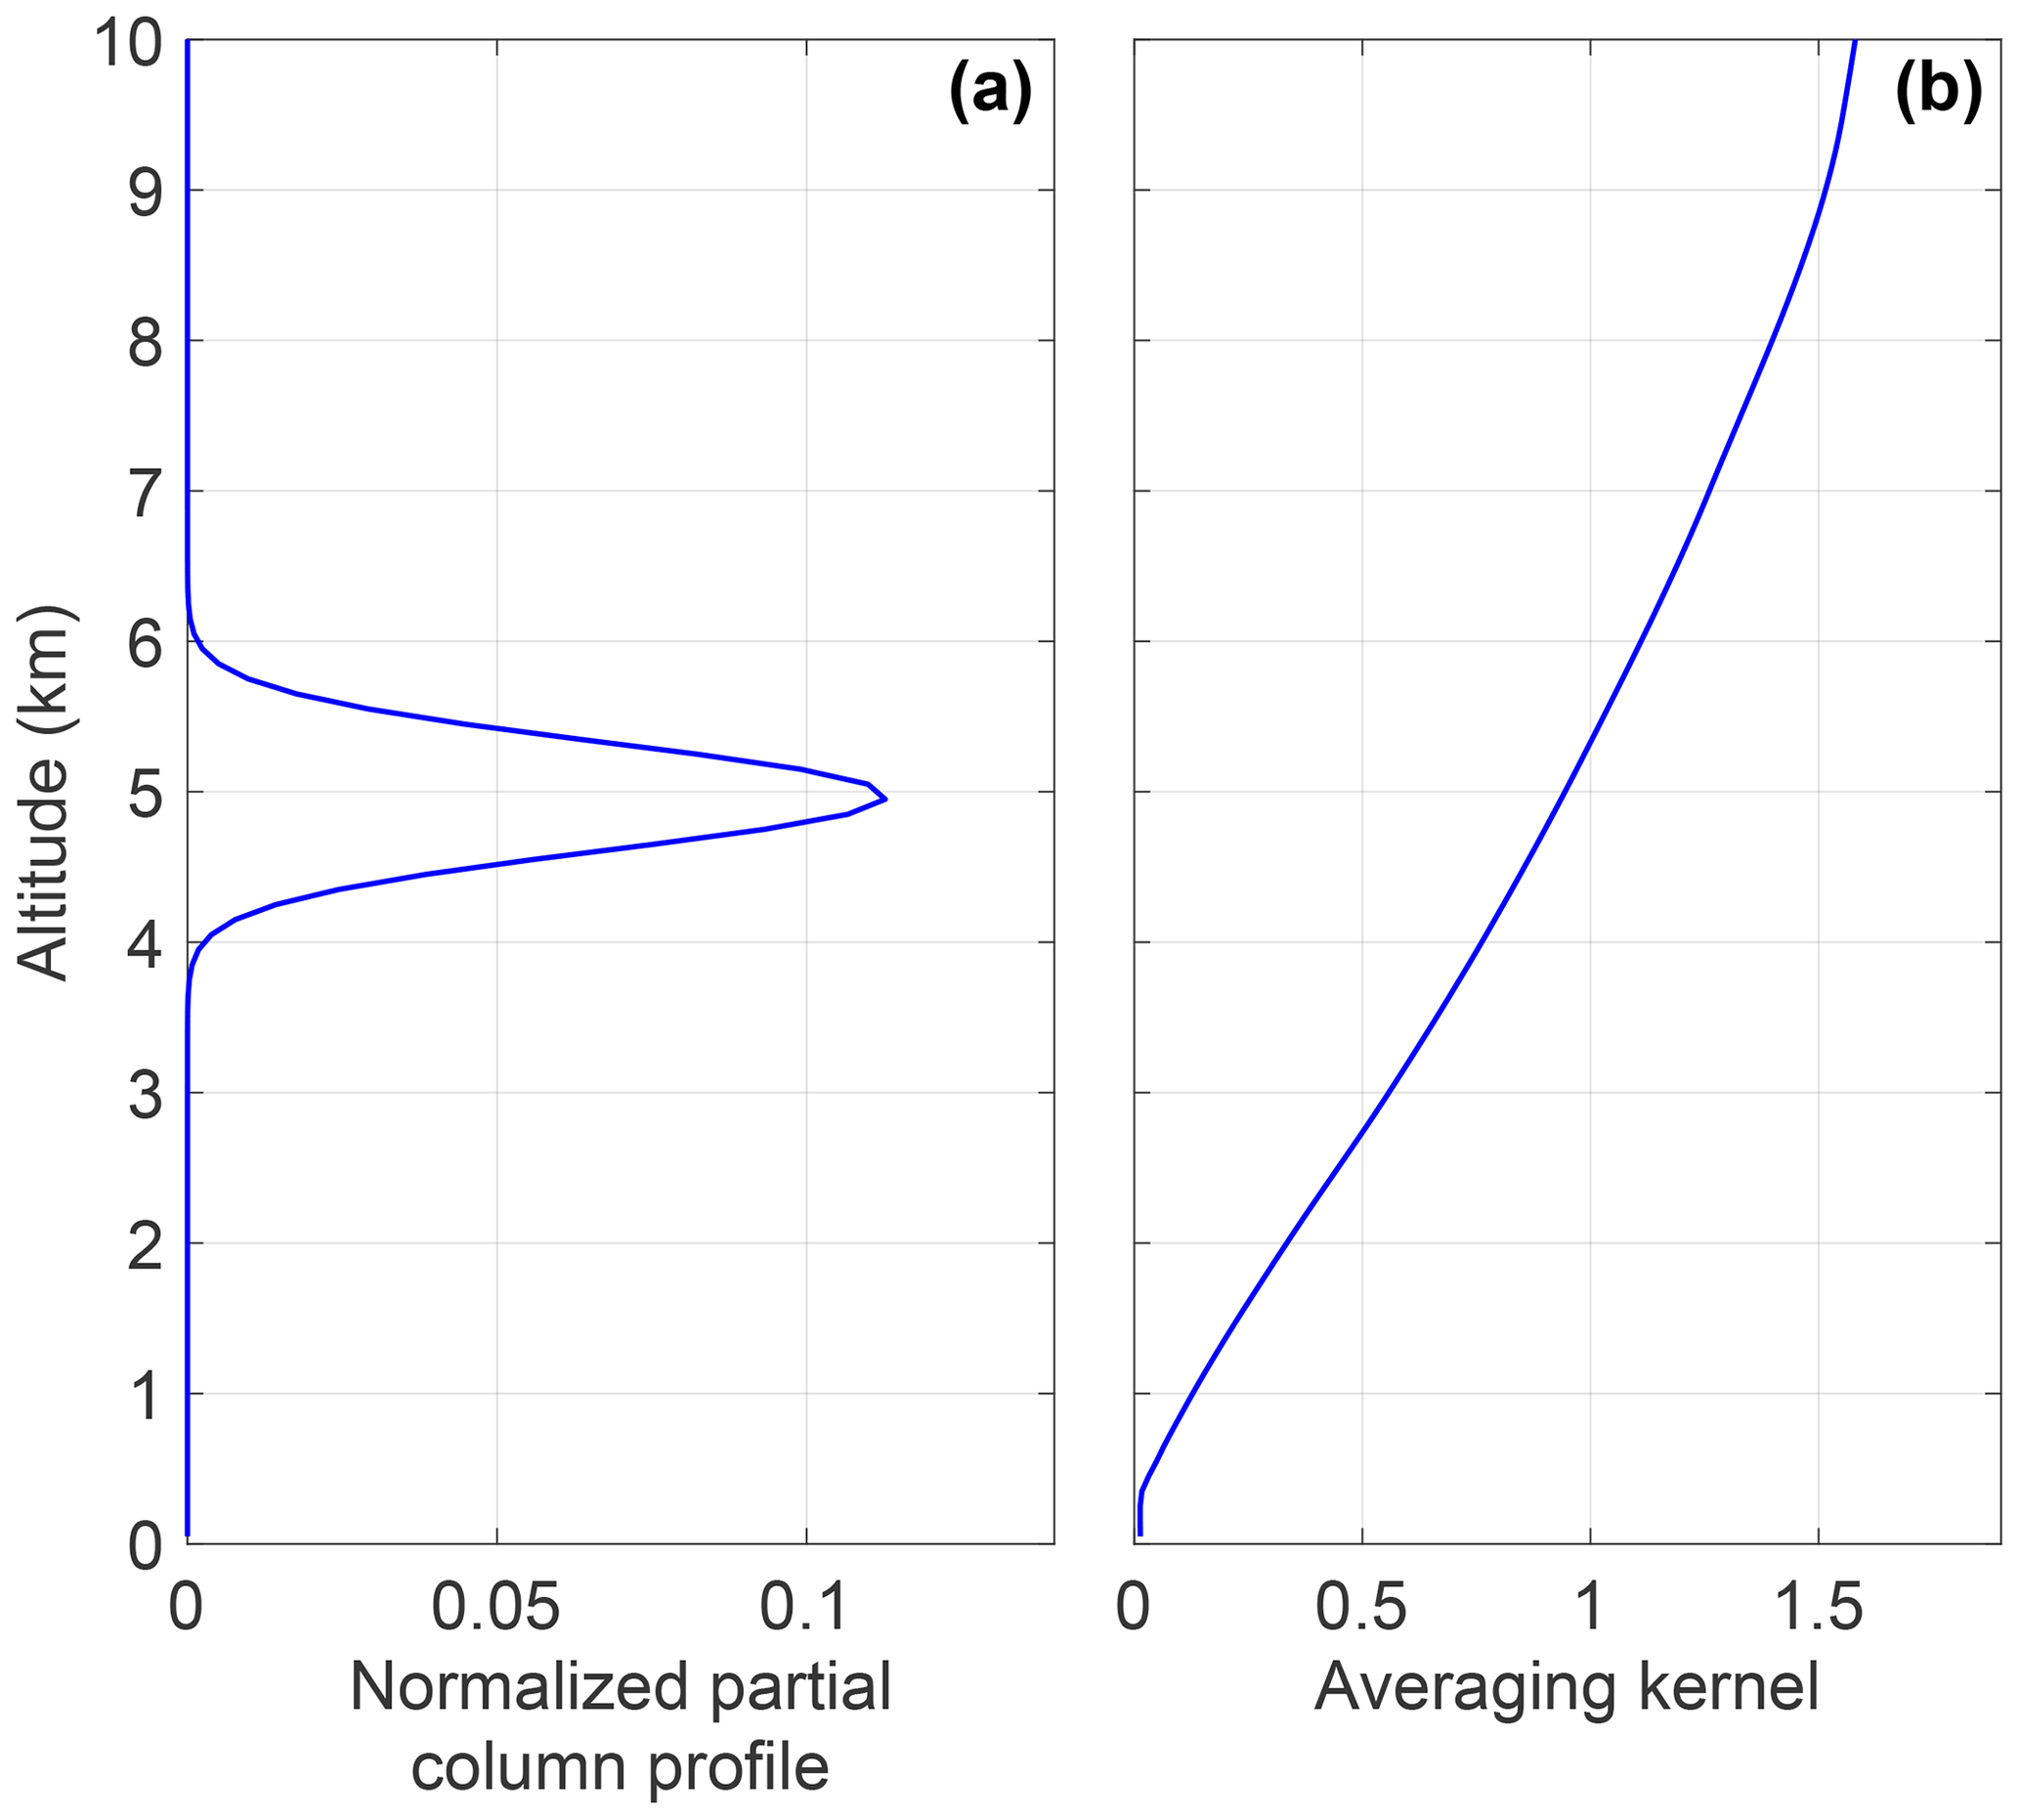
Figure 13A priori vertical profile (a) and averaging kernel (b) of the retrieval of HONO from an IASI/MetOp-A observation recorded in British Columbia wildfires, Canada, on 17 August 2018, ∼ 21:30 LST (see Fig. 1).
In the ANNI framework, filtering of the IASI observations prior to the NN inversion process prevents the retrieval on scenes with excess cloud coverage (Van Damme et al., 2021; Franco et al., 2022; Clarisse et al., 2023). In the case of HONO, we did not apply such pre-filtering, and we performed the retrieval even over scenes that were flagged cloudy, as thick smoke is sometimes confused with clouds. Nonetheless, in the final IASI HONO product, we provide the single-pixel cloud flag developed recently by Whitburn et al. (2022). The flag classifies scenes into four categories: clear sky, less than 10 % cloud coverage, between 10 % and 25 % cloud coverage, and more than 25 % cloud coverage.
In ANNI v4, the random and systematic uncertainties of the individual retrieved column are reported separately, following propagation of uncertainty of the input parameters, as described in Clarisse et al. (2023). Moreover, the uncertainties associated with the HONO vertical profile, specifically the peak z0 and width σ of the Gaussian, are also considered based on Clarisse et al. (2023), with 800 and 400 m assumed as, respectively, random and systematic uncertainties on each of these parameters. However, it should be noted that these uncertainties on the vertical HONO distribution are eliminated when applying the AvKs (either with Eq. 10 or with Eq. 11). Therefore, in the final product, we provide the random and systematic uncertainties for each IASI HONO measurement, both including and excluding the vertical-profile uncertainties.
4.3 Infrared HONO columns in fire plumes
Here, we present the analysis of retrieved HONO VCDs in biomass burning plumes using data from both IASI and TROPOMI. Two case studies are illustrated: the Woolsey Fire in California on 8 November 2018 (Fig. 14) and a series of fires in Yakutia, Siberia, on 2 August 2021 (Fig. 15).
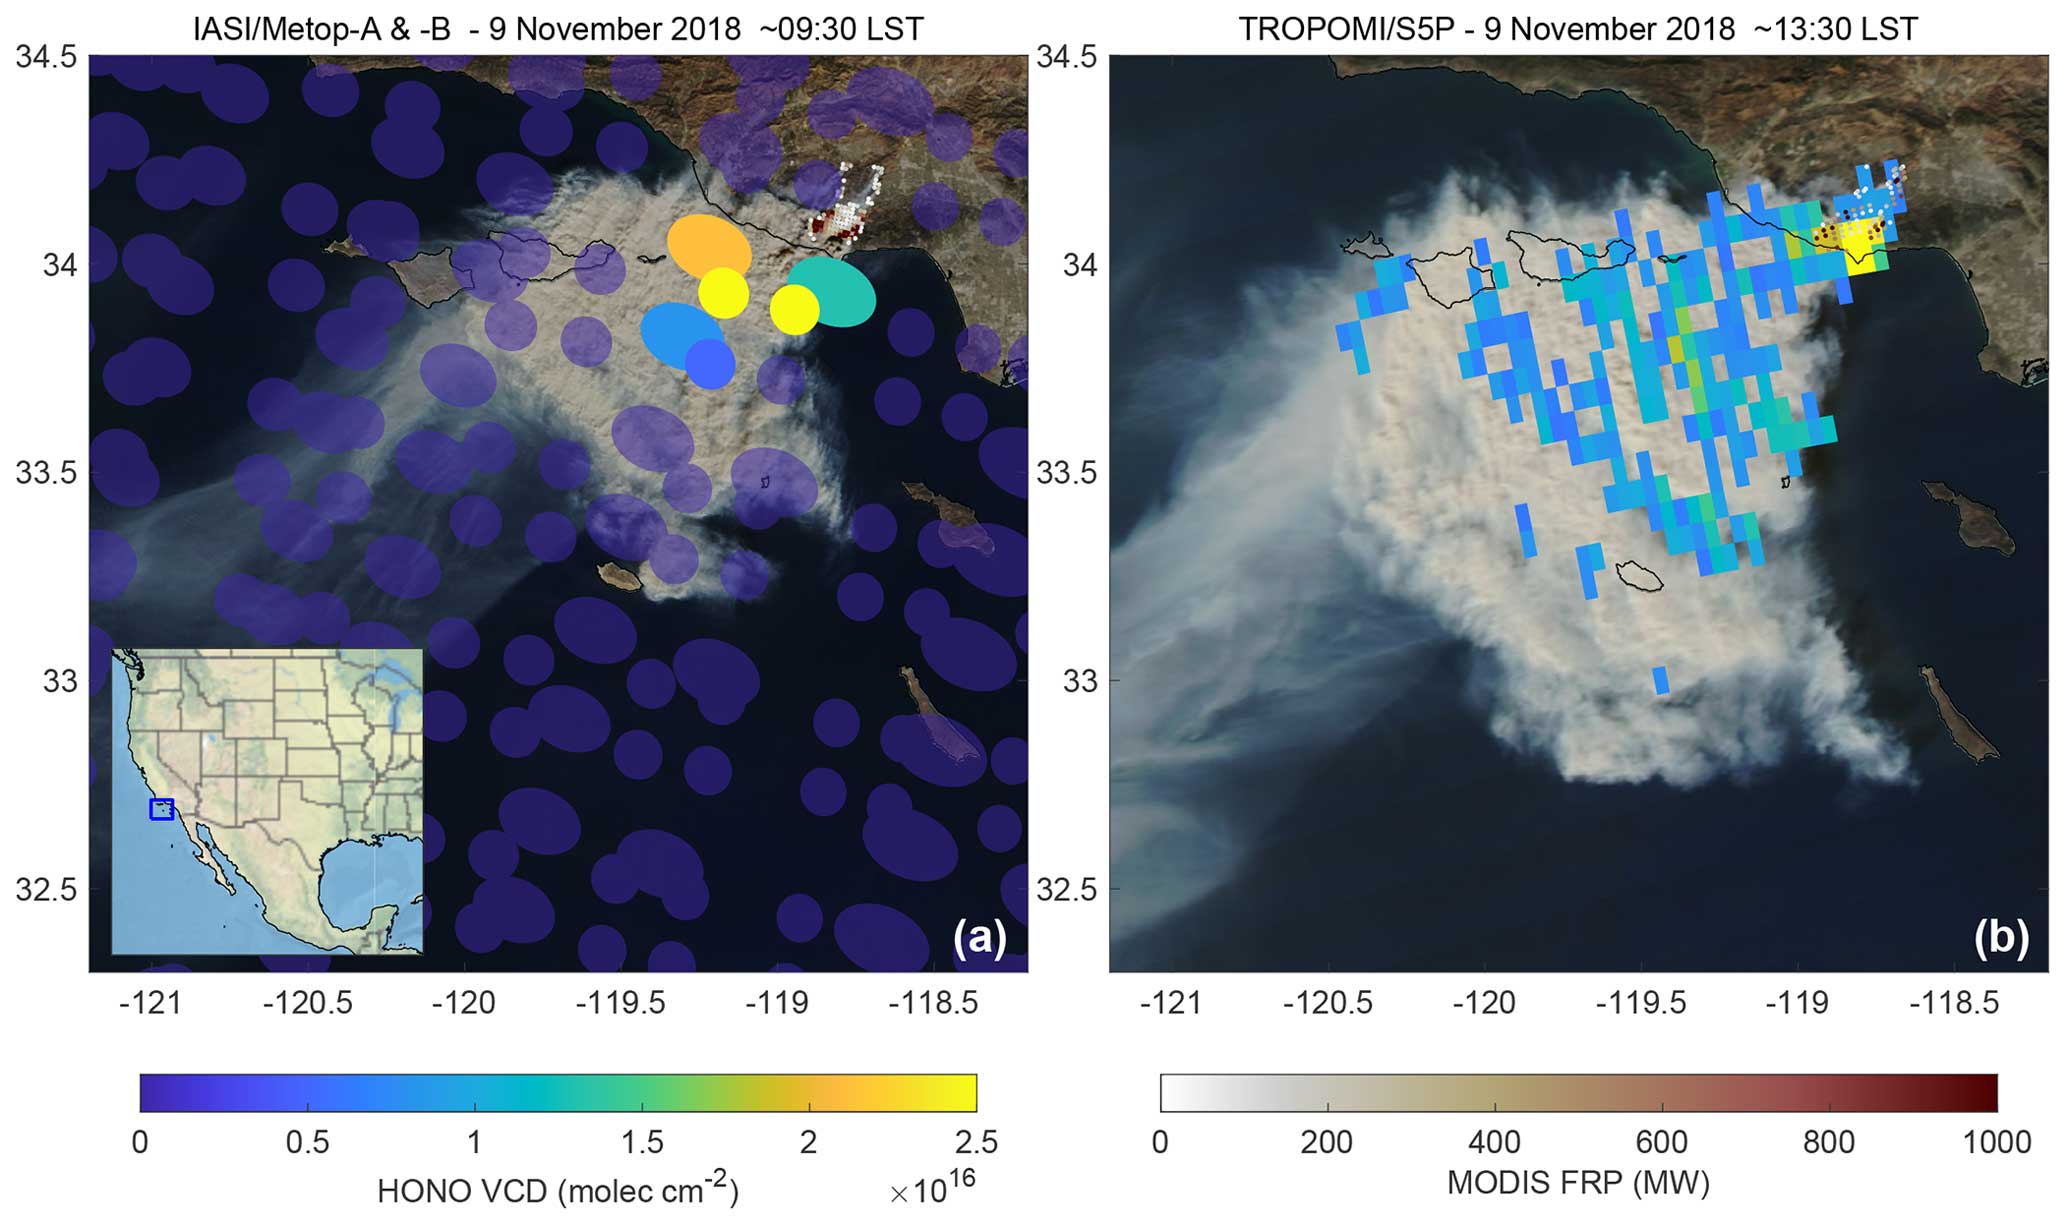
Figure 14HONO VCDs (in molec cm−2) from IASI/MetOp-A and -B (∼ 9:30 LST overpass) and TROPOMI (∼ 13:30 LST overpass) during the Woolsey Fire, California, on 9 November 2018. The shape of each IASI dot corresponds to the on-ground footprint of an individual measurement. The dark-blue, semi-transparent IASI pixels indicate measurements without HONO detections and allow us to visualize the difference in spatial sampling between IASI and TROPOMI. The small white-to-red dots indicate the FRP values of active fires detected by MODIS/Terra (∼ 10:30 LST) and MODIS/Aqua (∼ 13:30 LST), coincident with the IASI and TROPOMI measurements, respectively. Visible imagery from MODIS/Terra (a) and MODIS/Aqua (b).
The goal here is not to perform a quantitative cross-validation of the two satellite products. Comparing the IASI and TROPOMI VCDs of HONO at face value is indeed particularly challenging given the intrinsic differences between the two satellite sounders. The main ones are (i) pixel size, circular with a 12 km diameter at nadir for IASI vs. 3.5 × 5.5 km2 for TROPOMI; (ii) overpass time (∼ 9:30/21:30 LST for IASI vs. ∼ 13:30 LST for TROPOMI), which is particularly important given the short lifetime of HONO and its pronounced diel cycle; and (iii) impact of fire plume altitude and smoke aerosols on, respectively, TIR and UV–Vis retrievals (see Sect. 4.4). For these reasons, the primary objective is to showcase the ANNI v4 HONO product and to provide a qualitative assessment of the HONO VCDs from IASI and TROPOMI.
For both case studies, a constant Gaussian peak (z0) at 5 km with a standard deviation (σ) of 350 m was used to set up the a priori HONO vertical distribution for the IASI retrievals (Sect. 4.1). For the TROPOMI retrievals, an air mass factor (AMF) of 0.3 was consistently used to convert the measured HONO slant column densities (SCDs) into VCDs, which is a reasonable value for high AOD (5–10) and the fire plume height assumed by IASI (5 km).
The Woolsey Fire (8–21 November 2018) affected Los Angeles and Ventura counties, California. On 9 November, a large smoke plume engulfed western Malibu and spread over the Pacific (Keeley and Syphard, 2019; Schneising et al., 2020). Figure 14 presents the HONO columns retrieved from the IASI morning overpass (∼ 09:30 LST) and TROPOMI (∼ 13:30 LST) in that plume. The base maps correspond to the visible satellite imagery provided by MODIS/Terra (∼ 10:30 LST) or MODIS/Aqua (∼ 13:30 LST), approximately coinciding with the IASI and TROPOMI overpass times. These images enable us to visualize the rapid expansion of the smoke plume over the ocean within a few hours. The white-to-red dots indicate the FRP of the active fires detected by these sensors. During this fire event, pyrogenic HONO was detected in only six individual IASI observations. However, all pixels from IASI/MetOp-A and -B are displayed to illustrate the spatial sampling achieved by IASI in comparison to the higher spatial resolution of TROPOMI. It is also worth mentioning that no HONO was detected by IASI during the nighttime overpasses on 8 and 9 November 2018, respectively, before and after the detections illustrated here.
In Fig. 14, we observe the evolution of the fire plume due to the time gap between the two satellite overpasses, with TROPOMI detections in the early afternoon extending further downwind compared to IASI. However, both IASI and TROPOMI detections are relatively limited to the initial part of the visible smoke plume. The rapid breakdown of HONO molecules due to intense photolysis during the daytime can prevent HONO from being present in sufficient concentrations in the most downwind parts of the plume, making it undetectable by the satellite sounders.
Despite the challenges inherent in comparing IASI and TROPOMI, we observe a concurrence in the magnitude of retrieved HONO VCDs, typically falling within the range of 1–2.5 × 10¹⁶ molec cm−2 (Fig. 14). Nonetheless, certain disparities are evident. Given the 4 h time difference between the IASI morning and TROPOMI overpasses, this divergence might be attributed to the intensified photolytic removal of HONO during the UV–Vis measurements in the early afternoon. Another explanation could involve TROPOMI predominantly detecting the HONO burden located in the upper layers of the fire plume, while IASI probes a broader vertical extent (as discussed in Sect. 4.4). Additionally, TROPOMI captures its highest HONO VCDs in the proximity of the fire sources ( molec cm−2), akin to the VCDs measured by IASI further downwind.
In Fig. 15, we analyse the pyrogenic HONO VCDs retrieved from combined IASI/MetOp-A, -B, and -C and from TROPOMI for fires that occurred near the Lena river in Yakutia, Siberia, on 2 August 2021 (Tomshin and Solovyev, 2022). As indicated by the MODIS/Terra and MODIS/Aqua observations, numerous fires ignited in the region, giving rise to a series of extensive smoke plumes oriented westward. The MODIS FRP values indicate a particularly high concentration and intensity of these fires in the eastern part, specifically at the longitudes of 127–128, 132.5, and 134.5° E. This case study presents an example of IASI detecting HONO during both morning and evening overpasses in the same fire event. Coupled with the TROPOMI measurements in the early afternoon, this allows us to explore the temporal evolution of pyrogenic HONO throughout the day.
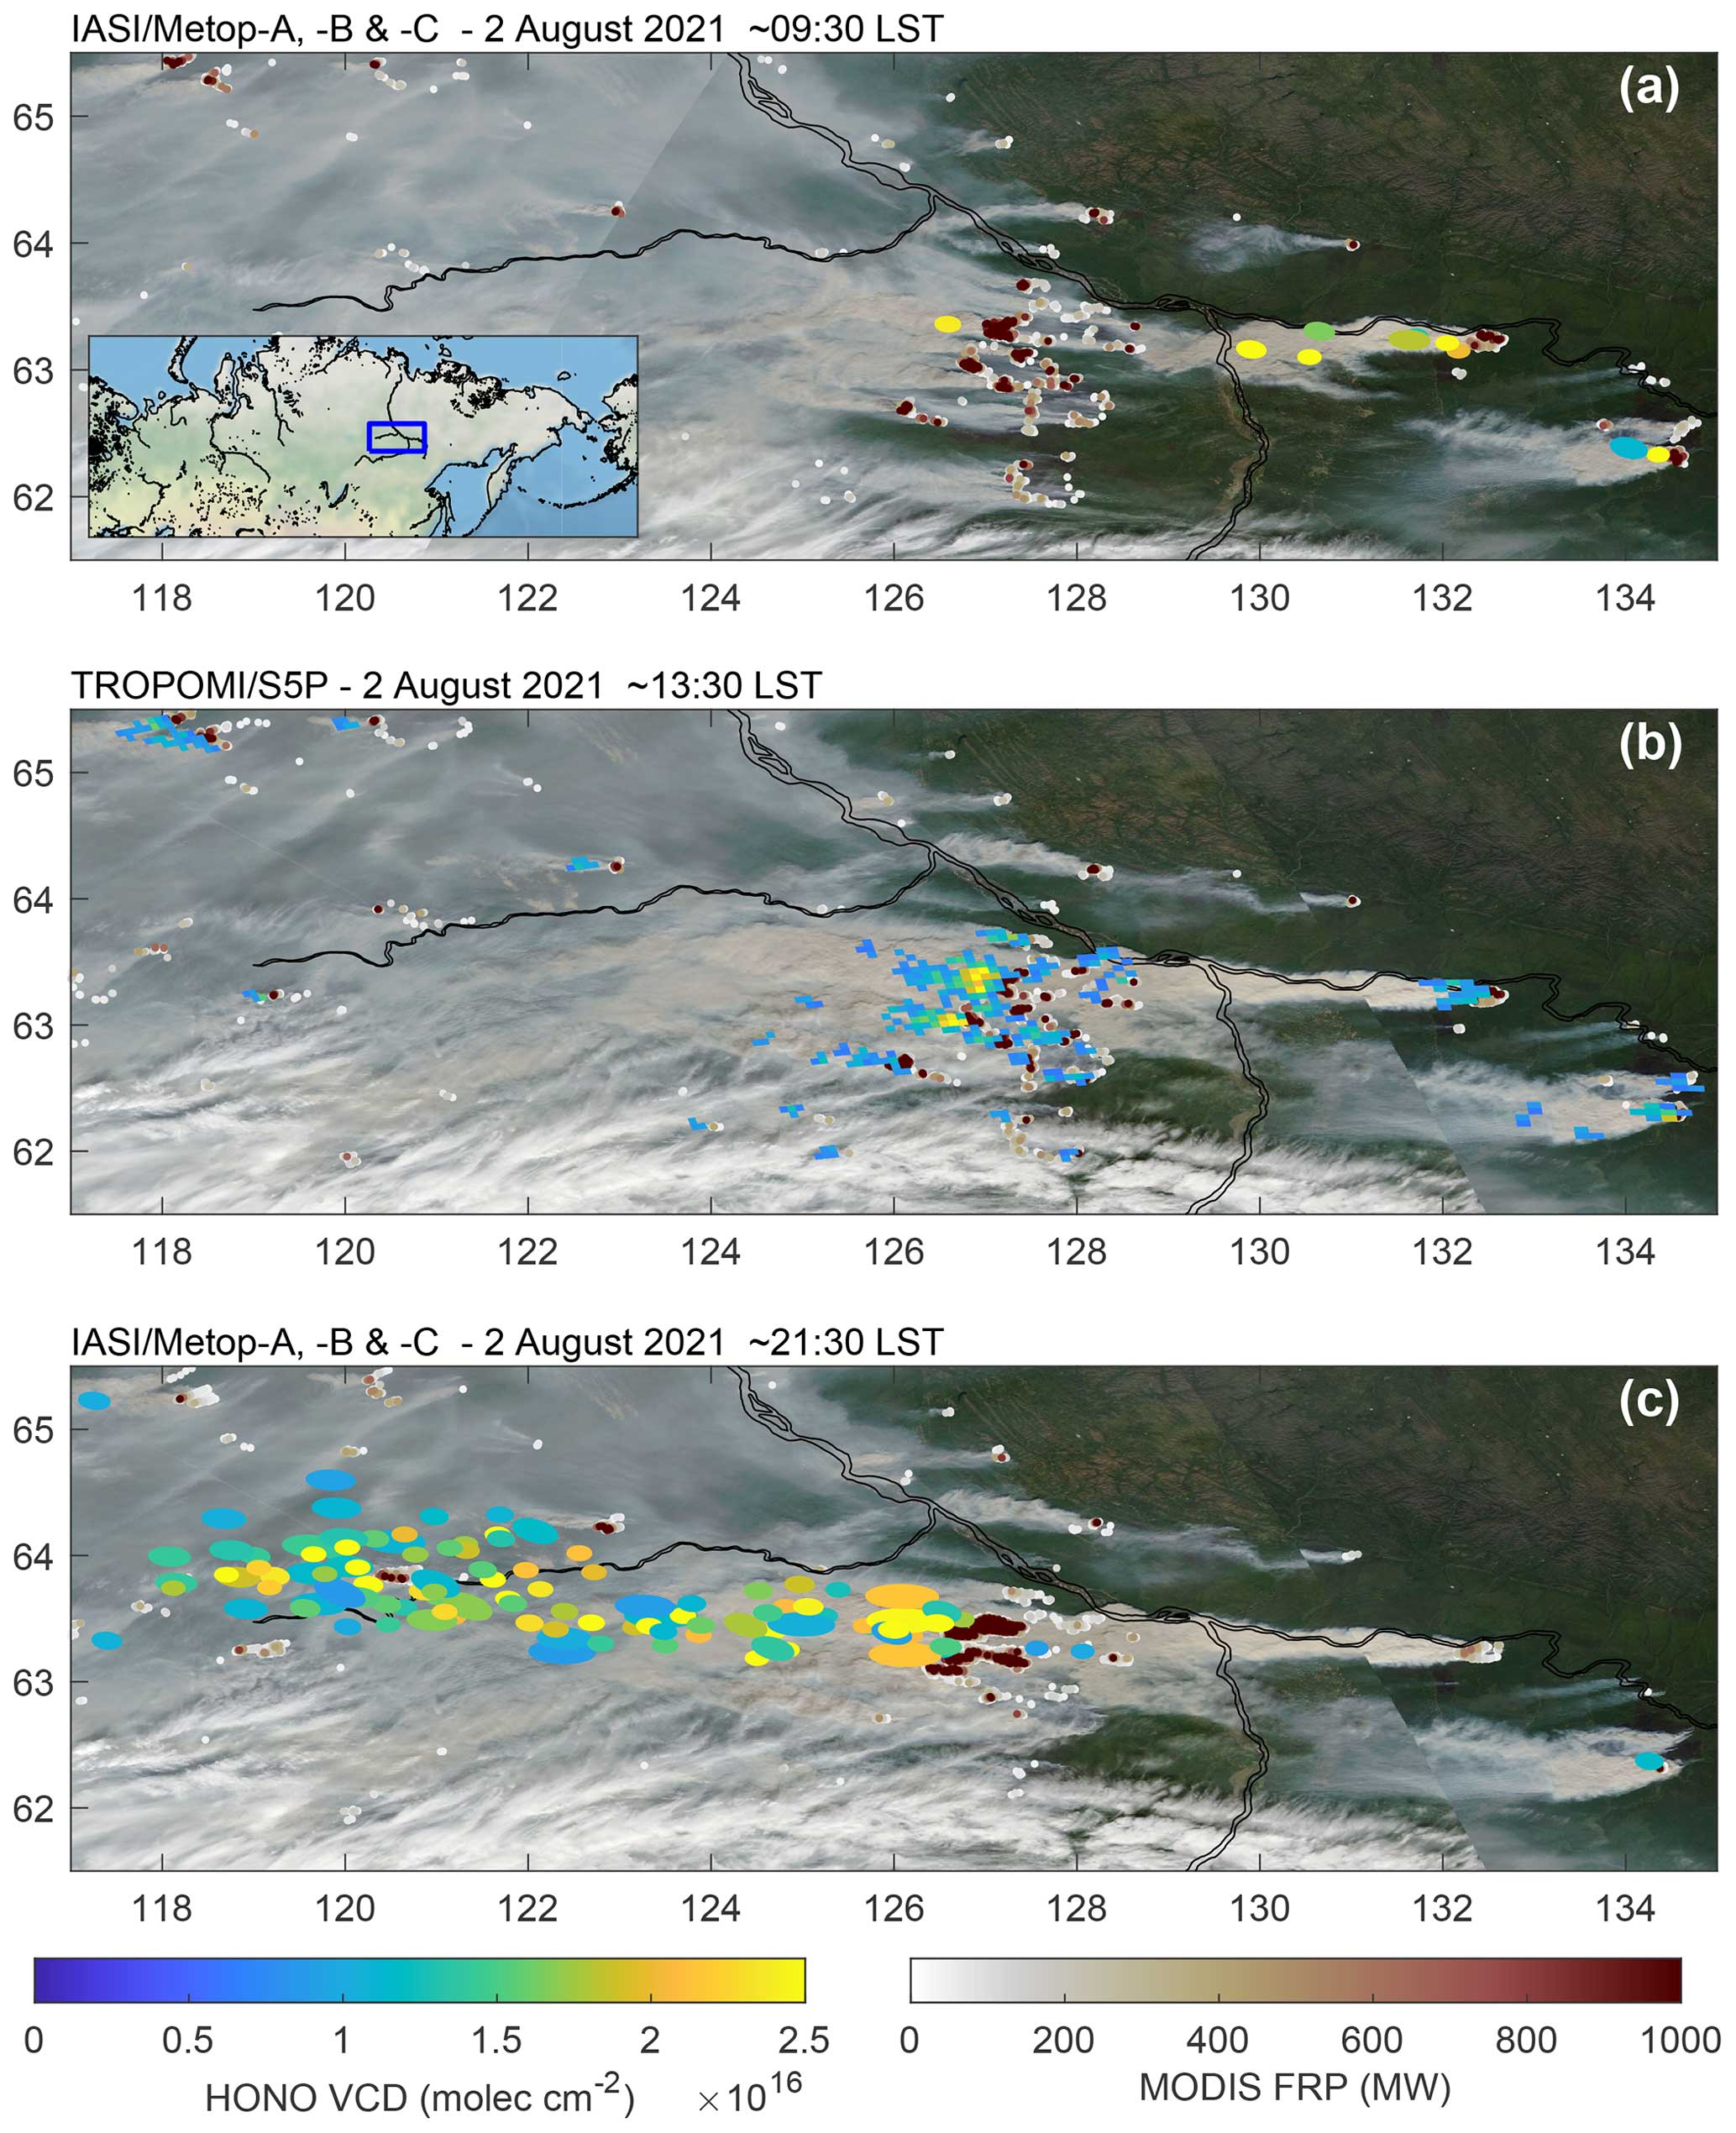
Figure 15HONO VCDs (in molec cm−2) from IASI/MetOp-A, -B, and -C (∼ 09:30/21:30 LST overpasses, separately) and TROPOMI (∼ 13:30 LST overpass) during Siberian wildfires on 2 August 2021. The shape of each IASI dot corresponds to the on-ground footprint of an individual measurement. The small white-to-red dots indicate the FRP values of active fires detected by MODIS/Terra (∼ 10:30 LST and 22:30 LST, separately) and MODIS/Aqua (∼ 13:30 LST), coincident with the IASI and TROPOMI measurements, respectively. Visible imagery from MODIS/Terra (a) and MODIS/Aqua (b–c).
-
During its morning overpasses (∼ 09:30 LST), IASI performs a few HONO detections associated with the fires in the eastern part, with retrieved VCDs mostly in the range of 1.5–2.5 × 10¹⁶ molec cm−2 (Fig. 15a). In this area, the fires are particularly intense, with FRP values often exceeding 1000 MW. Notable are the IASI detections in relative vicinity of the fire sources at 127, 132.5, and 134.5° E, suggesting both rapidly ascending fire plumes and elevated HONO concentrations. Conversely, IASI does not detect HONO associated with the many fires elsewhere in the region, likely because those fires are of a lesser extent and smaller intensity, as evidenced by the MODIS/Terra data.
-
In the early afternoon (∼ 13:30 LST), the MODIS/Aqua visible imagery indicates that the large, thick smoke plumes observed with MODIS/Terra in the morning expanded westward (Fig. 15b). TROPOMI still detects HONO in these plumes, in relative proximity to the fires, but with many more detections from the bulk of fires located at 127–128° E compared to IASI. As observed with the Woolsey Fire, the highest HONO VCDs from TROPOMI ( molec cm−2) are measured close to the fire sources, while the retrieved columns decrease quickly with distance. Additionally, TROPOMI detects HONO associated with lower-intensity fires, especially in the western area. The fact that these detections are made when the HONO photolysis is at its maximum demonstrates TROPOMI's ability to capture HONO enhancements in smaller fire plumes.
-
In the evening (∼ 21:30 LST), the intensity of the easternmost fires (132.5 and 134.5° E) has significantly decreased (typically below 400 MW), unlike those located at 127–128° E (Fig. 15c). The visible imagery in this panel is the same as for the TROPOMI view (i.e., ∼ 13:30 LST MODIS/Aqua overpass), but the active fires and FRP data are taken from the nighttime MODIS/Terra measurements (∼ 22:30 LST) which approximately align with the ∼ 21:30 LST IASI overpasses. IASI detects almost no HONO enhancements close to the weakened eastern fires in contrast to the large smoke plume noted previously, which is likely expanding further westward (no visible imagery available at night). While it cannot be ruled out that some of these detections are due to smaller fires overpassed by the main plume, the fact that almost no HONO is captured in association with the many other fires in the region suggests that HONO mostly originates from the intense fires located at 127–128° E. The long distance to the fire sources at which HONO enhancements are still captured by IASI at night and the high retrieved VCDs (1–2.5 × 10¹⁶ molec cm−2) are remarkable. Beyond demonstrating the added value of TIR nighttime measurements for studying pyrogenic HONO, these results highlight the pronounced diel cycle of HONO and its survival in biomass burning plumes in the absence of its main photolytic sink, likely combined with secondary formation along the transport.
It is worth mentioning that the pattern of HONO dynamics presented here with these Siberian fires has also been observed for other fires throughout the IASI–TROPOMI common observational time series, especially during intense wildfires at NH mid- and high latitudes.
4.4 IASI vs. TROPOMI disparities
Despite improvements, the retrieval of HONO VCDs in fire plumes from both IASI and TROPOMI remains challenging and currently requires assumptions that introduce uncertainties on the retrieved quantities and hinder a more accurate comparison between their respective HONO products.
In particular, the HONO columns retrieved from IASI are altitude-dependent. As seen in Sect. 4.2, the vertical sensitivity of IASI is inhomogeneous and decreases towards the surface (Fig. 13). This may result in biased retrieved columns if the altitude of the HONO peak in the a priori vertical profile differs from the actual altitude of the fire plume in which the bulk of HONO resides. Although the ANNI v4 retrieval algorithm can account for various heights and thicknesses of the HONO layer (Sect. 4.1), correct information on the fire plume altitude is ideally required. However, except for major fire events (e.g., Australian bushfires), the availability of such information is often limited. Moreover, smoke plumes with rapidly changing altitude are even more challenging to represent.
Likewise, TROPOMI's sensitivity depends on the HONO vertical distribution but is also affected by the presence of high loadings of smoke aerosols. Such absorbing aerosols quickly increase the light extinction and hinder the satellite sensor from probing through the full height of the smoke plume (Bousserez, 2014; Theys et al., 2020; Rowe et al., 2022). As a result, it is challenging to determine the AMF needed to convert the measured SCDs into HONO VCDs, adding significant uncertainties to the HONO abundance retrieved from the UV–Vis sensors. In both examples presented here, an AMF of 0.3 has been assumed to calculate the VCDs from TROPOMI. Depending on the aerosol content in these smoke plumes, it cannot be ruled out that the AMF is even lower, which would further increase the HONO VCDs.
With the aerosols preventing the photons from penetrating deep into the smoke plume, TROPOMI predominantly samples the upper layers of that plume, where HONO is most rapidly removed due to intense photolysis, whereas it is less sensitive to the bulk of HONO in the lower plume layers. This might explain why HONO detections with TROPOMI are typically located at a short distance from the fire sources and why TROPOMI VCDs tend to be lower than IASI (in addition to other effects like the different overpass times). Conversely, TIR remote sensing is less affected by smoke aerosols and can potentially probe the full height of the plume (Clarisse et al., 2010, 2013), including HONO contained deeper inside, which is less exposed to photons. As such, HONO would see its lifetime increase inside the plume, potentially contributing to explaining why IASI is able to detect HONO even after significant transport from the fire sources, as observed in the Siberian fires analysed here. In that case study (like in other case studies throughout the IASI time series), the nighttime IASI detections after long-range transport might result from the absence of an efficient removal process but also from HONO emitted earlier that survived the daytime photolysis. This would confirm the findings of Dufour et al. (2022), who suggested the presence of heavy aerosol content to explain the daytime survival of HONO through a 24 h evolution in concentrated smoke plume detected by TIR satellite sensors during the 2019-2020 Australian bushfires.
This research contributes to the understanding of pyrogenic HONO by providing a global picture of HONO in biomass burning plumes through consistent spaceborne measurements. By utilizing measurements from both morning and evening IASI overpasses, we demonstrate the importance of nighttime TIR measurements, which are typically overlooked when studying reactive gases, in monitoring HONO. This is particularly significant as the combination of daytime and nighttime observations highlights the intricate interplay between HONO's rapid photolysis and its diurnal variation.
Considering the limited spatial and temporal representativeness of in situ measurements compared to the extreme variability in pyrogenic HONO in the atmosphere, the IASI observations are a valuable additional asset to investigate the emission mechanisms and global distributions of HONO. In particular, the ANNI v4 HONO product described in this study complements other reactive species routinely retrieved from IASI operations, namely NH3, PAN, and HCN (Franco et al., 2018; Rosanka et al., 2021; Clarisse et al., 2023). In the context of increasing wildfire activities in the mid- and high latitudes, important concerns arise regarding the fallout of the gaseous and aerosol contents originating from these fires on human health and the environment. Consistent HONO, NH3, PAN, and HCN measurements from a single satellite sounder, used in synergy, offer the opportunity to gain a more comprehensive understanding of reactive nitrogen from biomass burning events by addressing issues related to its emissions, chemistry, and transport.
In this study, we emphasize the complementary nature of IASI and TROPOMI for studying pyrogenic HONO. The HONO columns from these two sounders show promising results with retrieved VCDs in the same order of magnitude. Nonetheless, this comparison cannot serve as a cross-validation of the satellite products, given the distinct characteristics and overpass times of the two sounders. While a dedicated validation of the IASI product would be necessary, it would prove difficult considering the limited availability of independent column data, which mostly originate from aircraft campaigns, with significant differences in spatial and temporal representativeness compared to IASI and its relatively coarse pixel size. For instance, Theys et al. (2020) supported TROPOMI HONO SCDs through comparisons with aircraft zenith sky DOAS measurements from the BB-FLUX field study, including observations from events such as the Rabbit Foot Fire, Idaho, on 12 August 2018. Although the TROPOMI and aircraft measurements were almost synchronized and used the same DOAS technique with identical fit settings to retrieve HONO SCDs, the comparison was challenging due to different sampling geometries. Additionally, it revealed high variability in HONO on fine spatial and temporal scales that was not resolved by TROPOMI. For the reasons mentioned earlier in this study, such challenges are expected to be exacerbated in a comparison involving spaceborne TIR HONO VCDs. IASI indeed captured a few HONO enhancements in the Rabbit Foot Fire plume, with VCDs of 1–2 × 10¹⁶ molec cm−2, while the aircraft DOAS measured SCDs up to 1.5 × 10¹⁶ molec cm−2 (i.e., without accounting for the AMF). However, the IASI observations were located hundreds of kilometres further downwind and were from nighttime overpasses, occurring several hours after the aircraft measurements. Consequently, a dedicated validation methodology for the IASI HONO product will need to be carefully designed in the future, contingent upon the availability of exploitable third-party datasets.
So far, HONO has been identified with spaceborne TIR observations only in exceptional pyroconvective smoke plumes from the 2009 and 2019–2020 Australian bushfires (Clarisse et al., 2011; De Longueville et al., 2021; Dufour et al., 2022). In this study, we have demonstrated that HONO can be identified and retrieved from IASI spectra in concentrated fire plumes worldwide. This is an important step toward a better understanding of reactive nitrogen in the atmosphere and its oxidative capacity. Through our work, we also contribute to laying the foundation for the methodology of routinely monitoring pyrogenic HONO from future TIR satellite instruments. Although its identification and the retrieval of its VCD remain particularly challenging and are affected by significant uncertainties, these capabilities are expected to improve with the next generation of TIR satellite sounders, including IASI – New Generation (IASI–NG; Crevoisier et al., 2014) and the geostationary Infrared Sounder on board Meteosat Third Generation (MTG–IRS; https://www.eumetsat.int/meteosat-third-generation, last access: 8 November 2023). With twice-better radiometric and spectral resolution performances compared to IASI, IASI–NG will improve the HONO detection, especially in smaller plumes. The higher vertical sensitivity of IASI–NG will also allow us to probe the lower layers more efficiently, potentially improving the detection of HONO in low-altitude fire plumes, such as those in the tropical regions or closer to the fire sources. On the other hand, the geostationary MTG–IRS will provide continuous spatial coverage of the Earth's surface at a higher spatial resolution (up to 4 × 4 km2), with a revisit time of up to 30 min above Europe. This will offer a unique opportunity to closely track HONO and study its chemistry along its transport in a fire plume.

Figure A1Typical IASI spectrum (displayed in brightness temperature) in the 645–1445 cm−1 spectral range (a) and the Jacobian of the ν4 and ν3 HONO spectral absorption bands in the thermal infrared (b). The 820–890 and 1210–1305 cm−1 spectral ranges used for the calculation of the two HONO HRIs are illustrated in coloured rectangles. The brightness temperatures were normalized to have a minimum value of −1 for visibility purposes. The Jacobian has been produced by the line-by-line radiative transfer model Atmosphit for a standard atmosphere.

Figure A2IASI/MetOp-A spectrum recorded in a fire plume over Australia on 30 December 2019, ∼ 09:30 LST (a). The green frames delimit the spectral ranges in which the signature of HONO is investigated. Result of the whitening transformation (in blue) applied to the IASI spectrum, the whitened HONO Jacobian (in red), and the contribution of each channel to the HRI (in grey) in the 820–890 and 1210–1305 cm−1 spectral ranges (b and c, respectively). The whitened Jacobian of interfering NH3 is displayed in yellow.
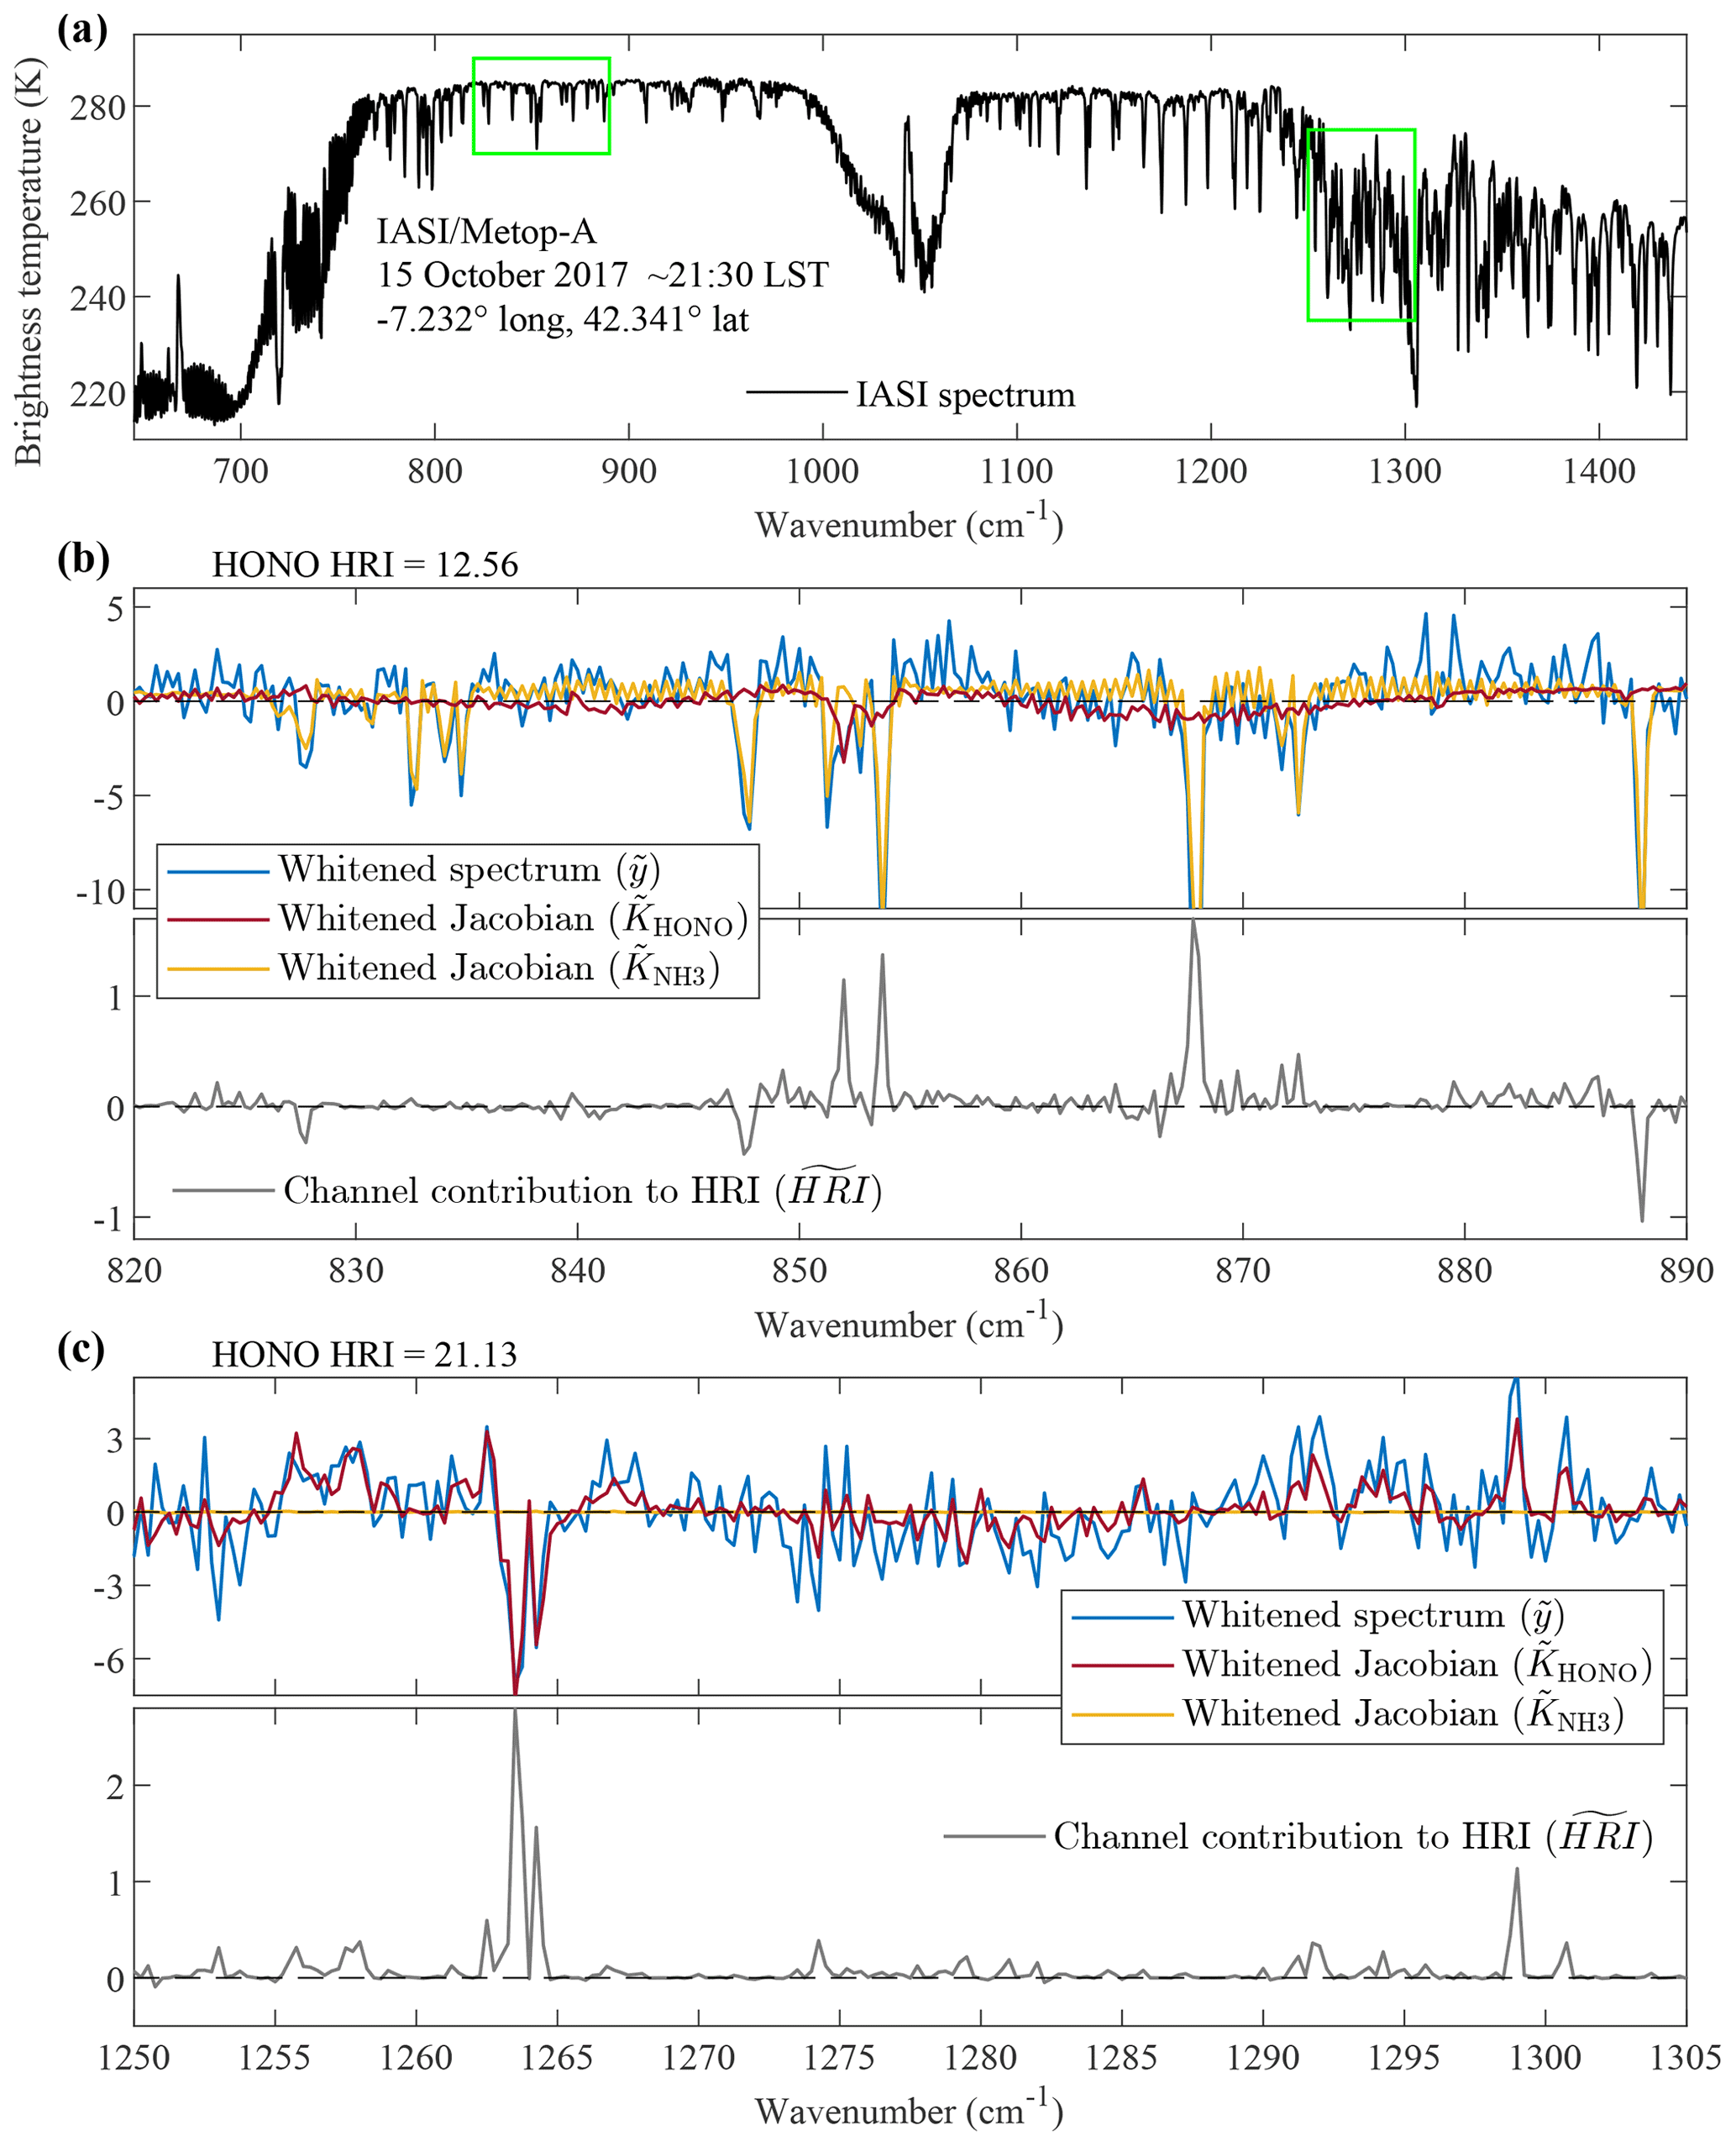
Figure A3IASI/MetOp-A spectrum recorded in a fire plume over Portugal on 15 October 2017, ∼ 21:30 LST (a). The green frames delimit the spectral ranges in which the signature of HONO is investigated. Result of the whitening transformation (in blue) applied to the IASI spectrum, the whitened HONO Jacobian (in red), and the contribution of each channel to the HRI (in grey) in the 820–890 and 1210–1305 cm−1 spectral ranges (b and c, respectively). The whitened Jacobian of interfering NH3 is displayed in yellow.

Figure A4HONO HRI for all the IASI/MetOp-A observations (morning/evening overpasses combined) with an HRI > 4 over the year 2012. The distributions are based on the HONO HRI calculated in the 820–890 cm−1 (a) and 1210–1305 cm−1 (b) spectral ranges. Base map from ESRI (2023).
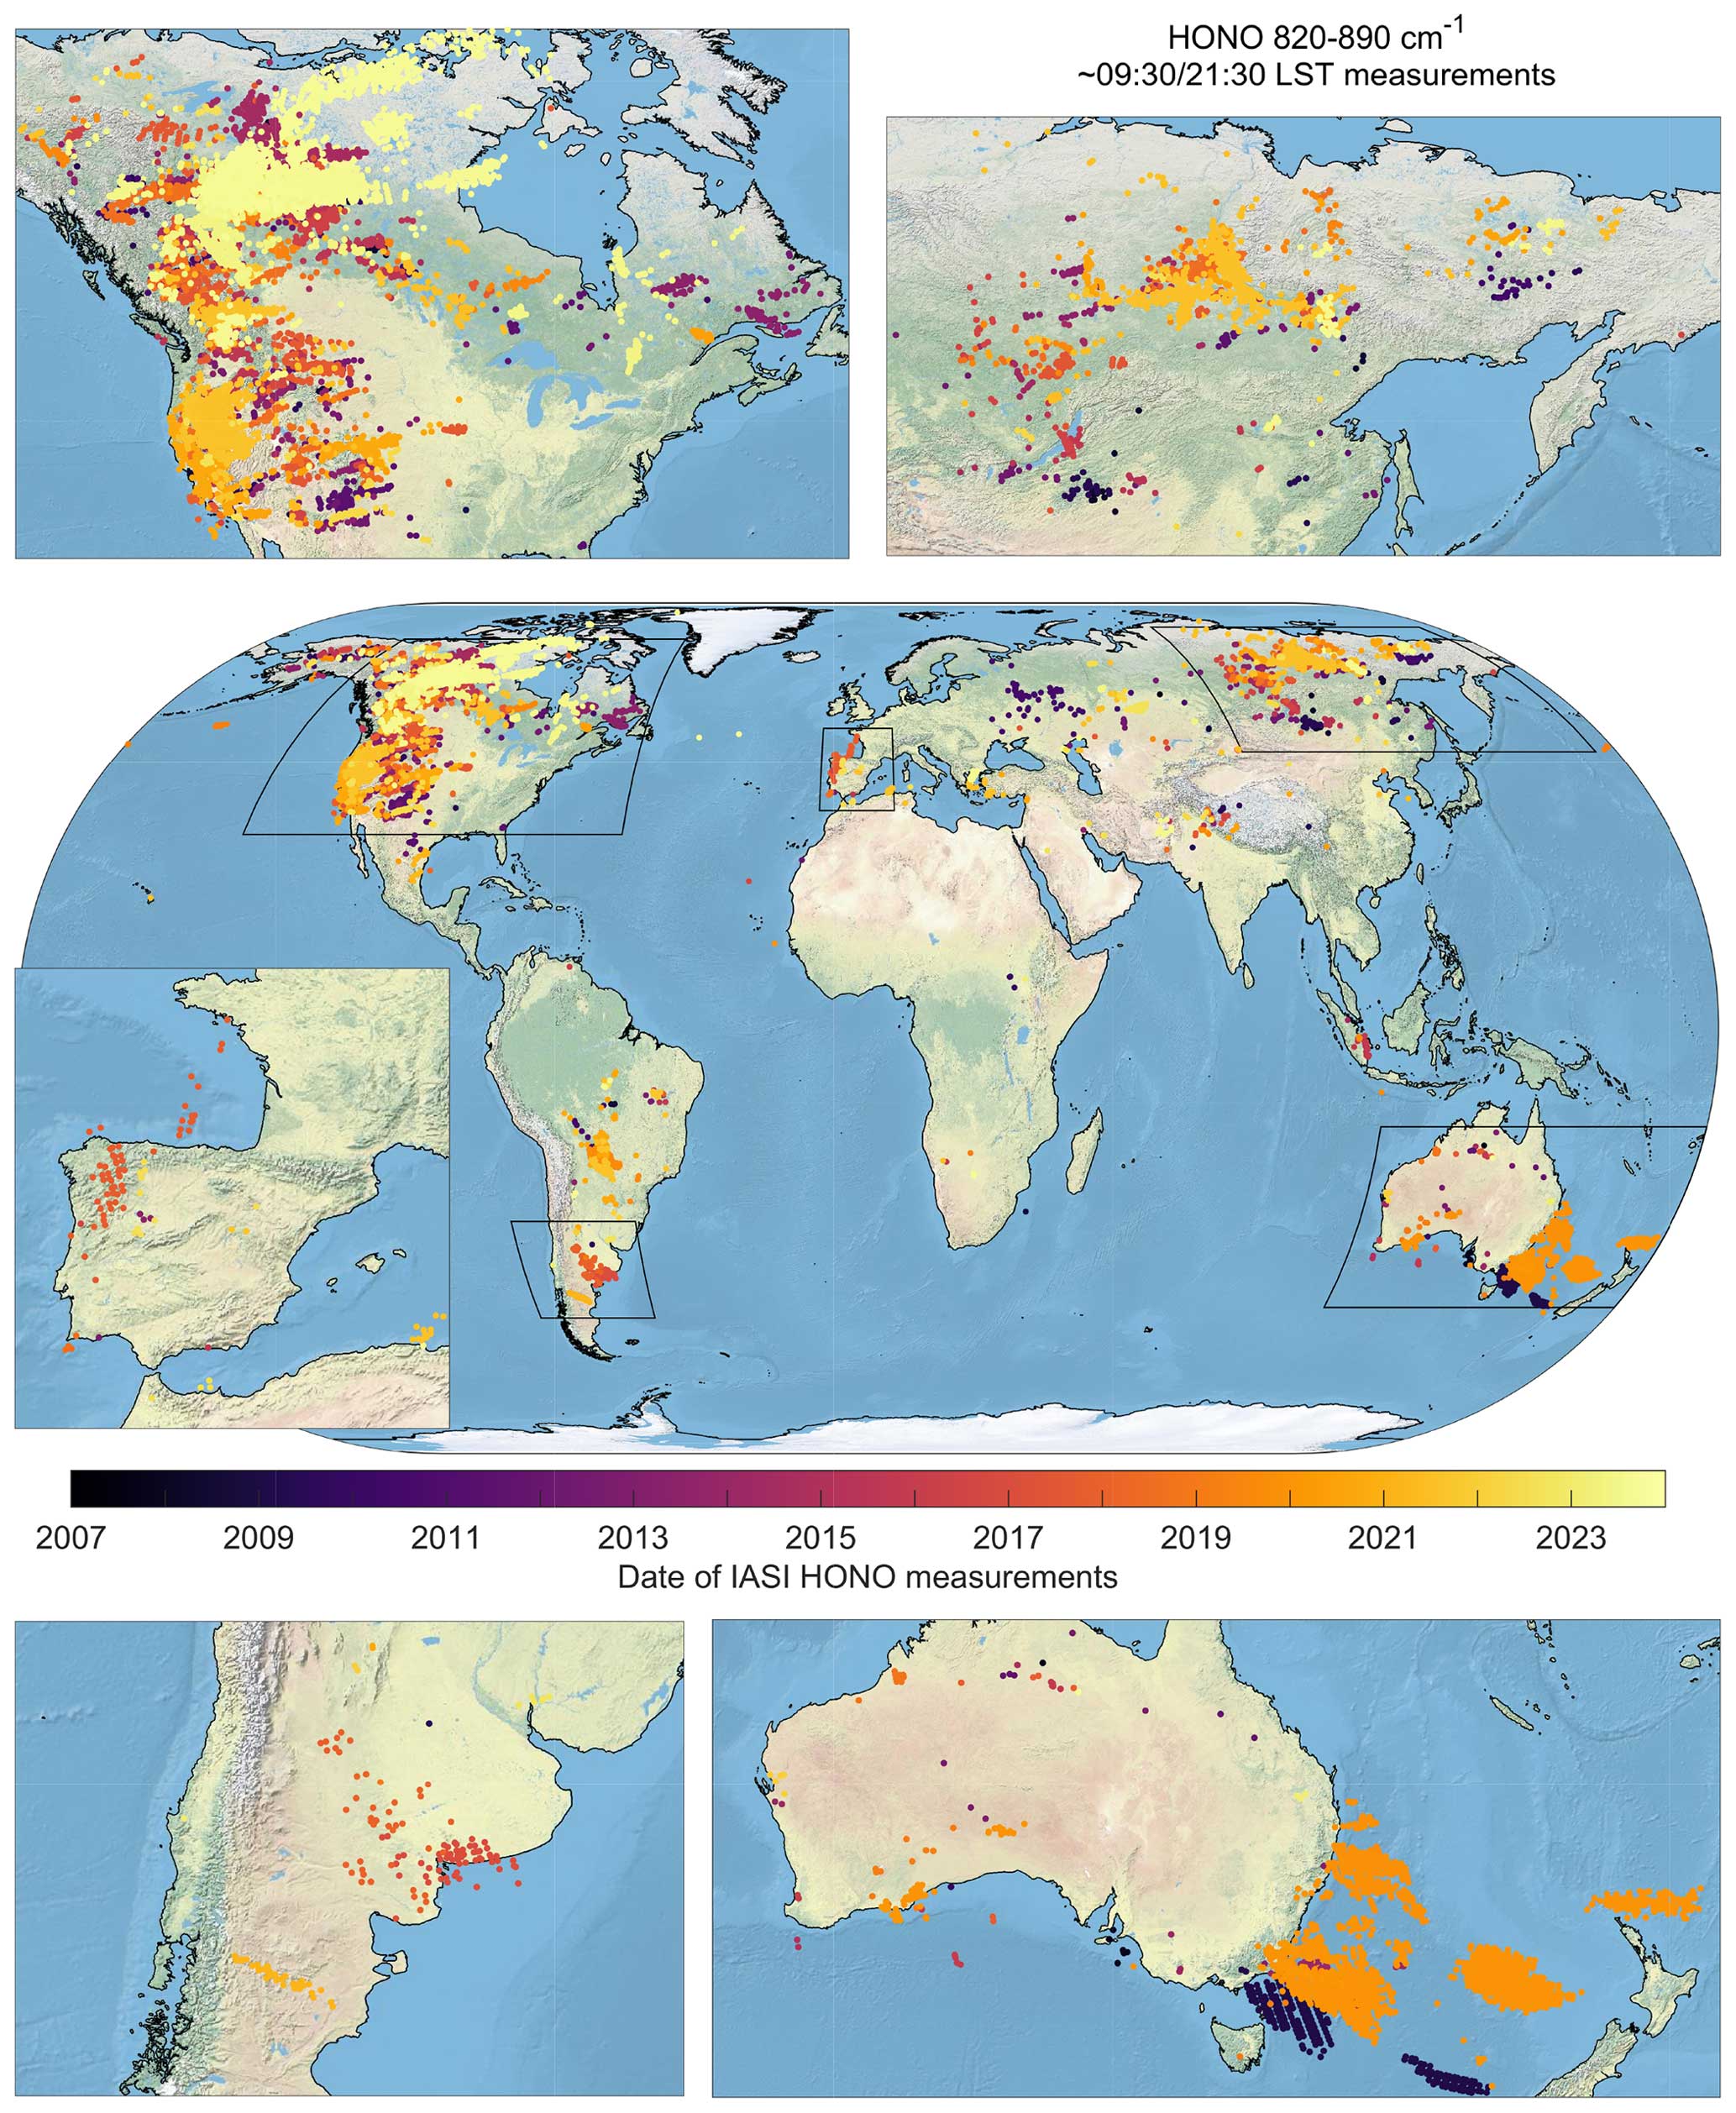
Figure A5Global distribution of the individual IASI measurements (morning/evening overpasses combined) with a confirmed HONO detection in a fire plume, colour-coded by the year of observation. The distribution is based on the HONO HRI calculated in the 820–890 cm−1 spectral range. Base map from ESRI (2023).
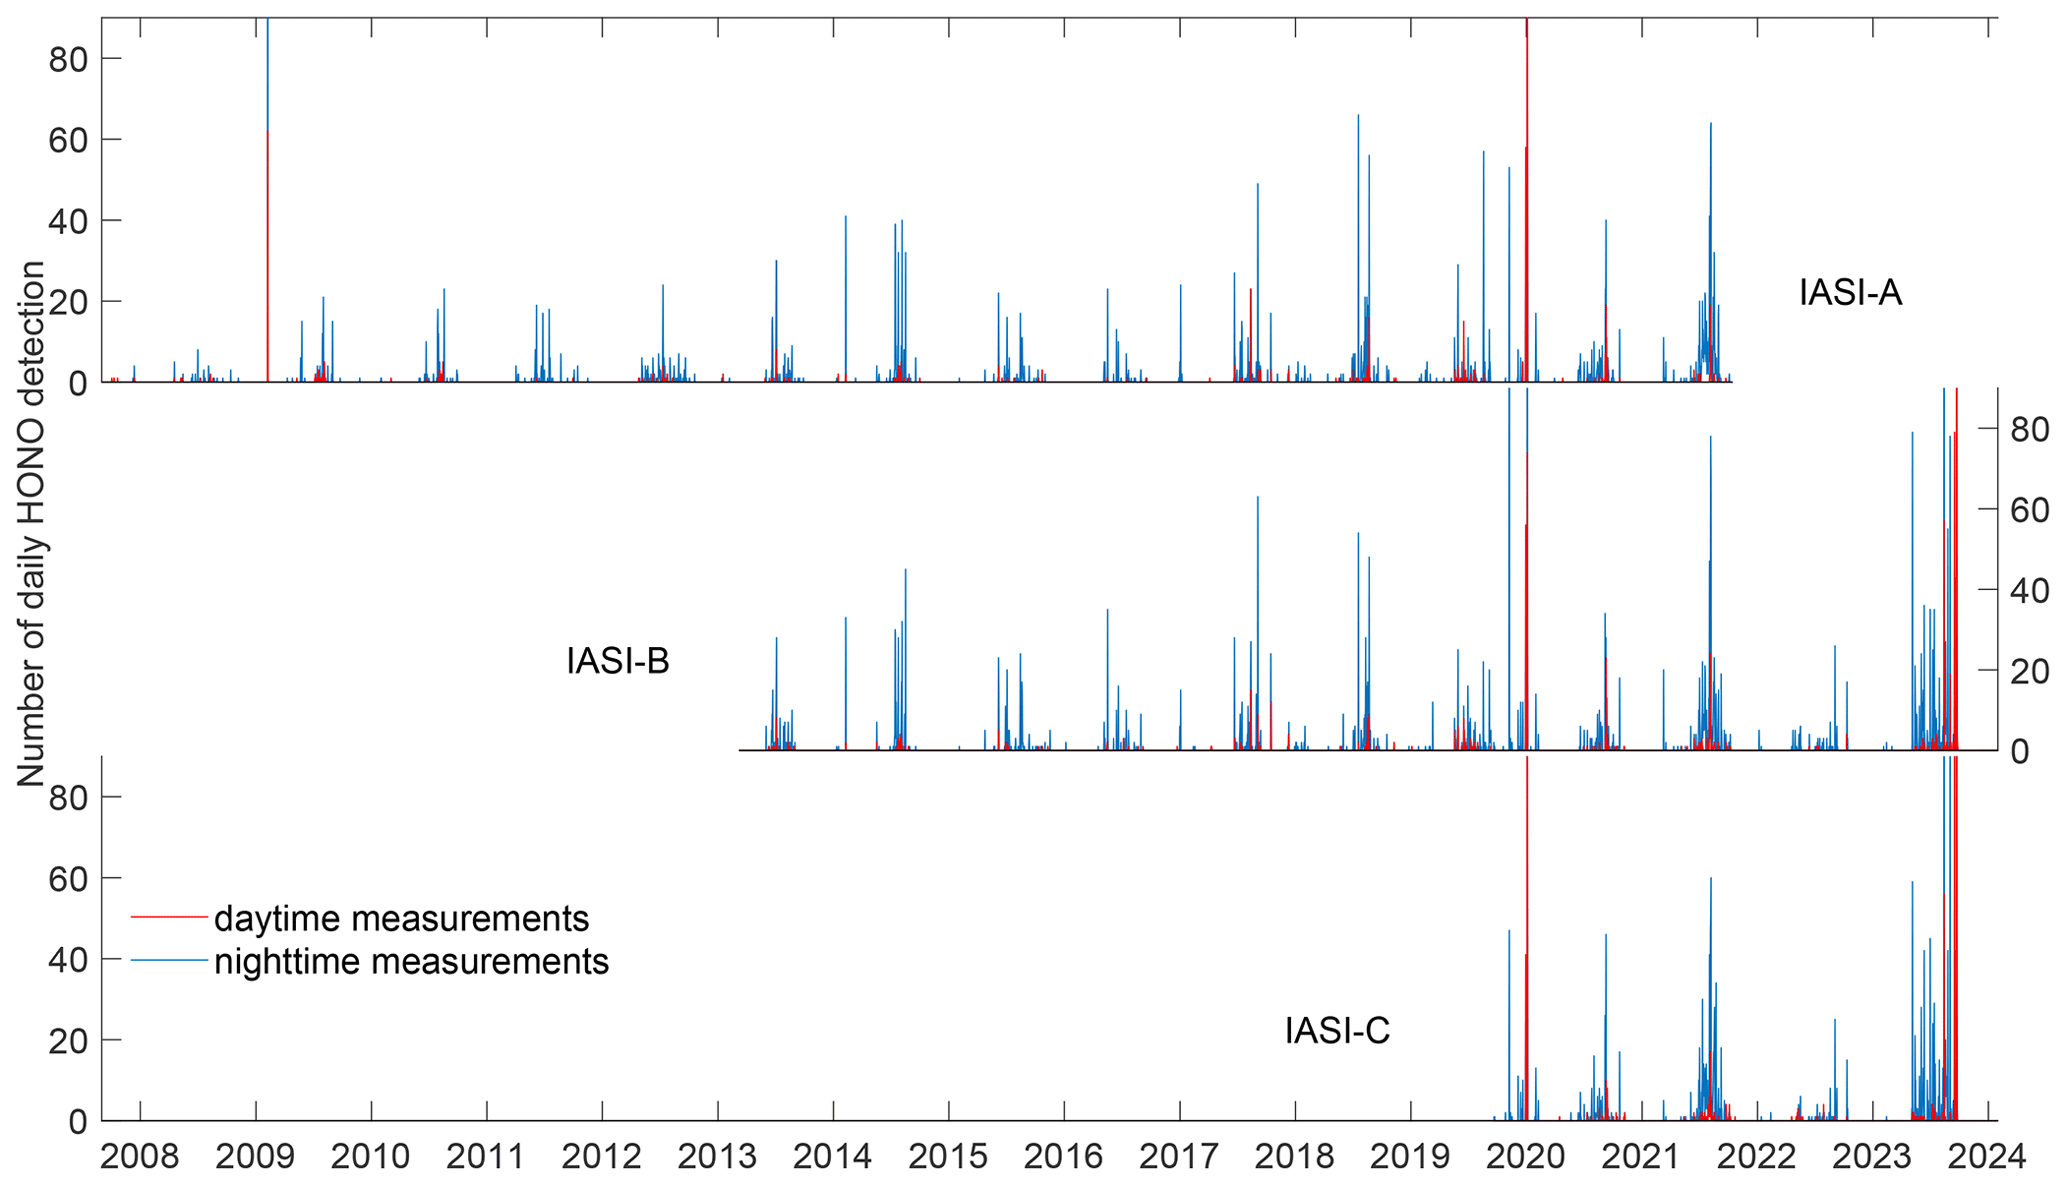
Figure A6Number of daily confirmed HONO detections throughout the time series of each IASI instrument, specifically for the 820–890 cm−1 HONO absorption band, with daytime and nighttime data separated.
The IASI pyrogenic HONO product is publicly accessible at https://doi.org/10.5281/zenodo.10721381 (Franco et al., 2024).
BF and LC conceptualized the study and designed the methodology. BF wrote the first version of the article, performed the IASI data acquisition, and prepared the figures. NT performed the TROPOMI data acquisition. BF, LC, and NT analysed the data. All authors discussed the results and revised the article.
The contact author has declared that none of the authors has any competing interests.
Publisher’s note: Copernicus Publications remains neutral with regard to jurisdictional claims made in the text, published maps, institutional affiliations, or any other geographical representation in this paper. While Copernicus Publications makes every effort to include appropriate place names, the final responsibility lies with the authors.
IASI is a joint mission of EUMETSAT and the Centre national d’études spatiales (CNES, France). The IASI Level 1C data are distributed in near real-time by EUMETSAT through the EUMETCast distribution system. The authors acknowledge the AERIS data infrastructure (https://www.aeris-data.fr/, last access: 10 August 2023) for providing access to the IASI Level 1C data and Level 2 temperature data. This paper contains modified Copernicus data (2018/2023) processed by BIRA-IASB. The authors thank Apolline Tricard for the preliminary analysis of the IASI HONO data in the framework of her master's thesis. Moreover,the French scientists are grateful to CNES and the Centre national de la recherche scientifique (CNRS) for financial support.
The research has been supported by the DINAR (Development and Interpretation of Improved Nitrous Acid Retrievals; http://hono.aeronomie.be, last access: 15 February 2024) project funded by the European Space Agency (contract no. 4000137831/22/I-AG). Activities at ULB have also been supported by the HIRS PRODEX arrangement (ESA–BELSPO). Lieven Clarisse is the research associate supported by the F.R.S.–FNRS.
This paper was edited by Anne Perring and reviewed by two anonymous referees.
Alicke, B., Platt, U., and Stutz, J.: Impact of nitrous acid photolysis on the total hydroxyl radical budget during the Limitation of Oxidant Production/Pianura Padana Produzione di Ozono study in Milan, J. Geophys. Res., 107, 8196, https://doi.org/10.1029/2000jd000075, 2002. a
Ammann, M., Kalberer, M., Jost, D. T., Tobler, L., Rössler, E., Piguet, D., Gäggeler, H. W., and Baltensperger, U.: Heterogeneous production of nitrous acid on soot in polluted air masses, Nature, 395, 157–160, https://doi.org/10.1038/25965, 1998. a, b
Andela, N., Kaiser, J. W., van der Werf, G. R., and Wooster, M. J.: New fire diurnal cycle characterizations to improve fire radiative energy assessments made from MODIS observations, Atmos. Chem. Phys., 15, 8831–8846, https://doi.org/10.5194/acp-15-8831-2015, 2015. a
Andela, N., Morton, D. C., Giglio, L., Paugam, R., Chen, Y., Hantson, S., van der Werf, G. R., and Randerson, J. T.: The Global Fire Atlas of individual fire size, duration, speed and direction, Earth Syst. Sci. Data, 11, 529–552, https://doi.org/10.5194/essd-11-529-2019, 2019. a, b, c
Andersen, S. T., Carpenter, L. J., Reed, C., Lee, J. D., Chance, R., Sherwen, T., Vaughan, A. R., Stewart, J., Edwards, P. M., Bloss, W. J., Sommariva, R., Crilley, L. R., Nott, G. J., Neves, L., Read, K., Heard, D. E., Seakins, P. W., Whalley, L. K., Boustead, G. A., Fleming, L. T., Stone, D., and Fomba, K. W.: Extensive field evidence for the release of HONO from the photolysis of nitrate aerosols, Science Advances, 9, eadd6266, https://doi.org/10.1126/sciadv.add6266, 2023. a
Armante, R., Perrin, A., Kwabia Tchana, F., and Manceron, L.: The ν4 bands at 11 µm: linelists for the Trans- and Cis- conformer forms of nitrous acid (HONO) in the 2019 version of the GEISA database, Mol. Phys., 120, e1951860, https://doi.org/10.1080/00268976.2021.1951860, 2021. a
Atkinson, R. and Arey, J.: Atmospheric Degradation of Volatile Organic Compounds, Chem. Rev., 103, 4605–4638, https://doi.org/10.1021/cr0206420, 2003. a, b
Bauduin, S., Clarisse, L., Theunissen, M., George, M., Hurtmans, D., Clerbaux, C., and Coheur, P.-F.: IASI's sensitivity to near-surface carbon monoxide (CO): Theoretical analyses and retrievals on test cases, J. Quant. Spectrosc. Ra., 189, 428–440, https://doi.org/10.1016/j.jqsrt.2016.12.022, 2017. a
Bouillon, M., Safieddine, S., Hadji-Lazaro, J., Whitburn, S., Clarisse, L., Doutriaux-Boucher, M., Coppens, D., August, T., Jacquette, E., and Clerbaux, C.: Ten-Year Assessment of IASI Radiance and Temperature, Remote Sensing, 12, 2393, https://doi.org/10.3390/rs12152393, 2020. a
Bourgeois, I., Peischl, J., Neuman, J. A., Brown, S. S., Allen, H. M., Campuzano-Jost, P., Coggon, M. M., DiGangi, J. P., Diskin, G. S., Gilman, J. B., Gkatzelis, G. I., Guo, H., Halliday, H. A., Hanisco, T. F., Holmes, C. D., Huey, L. G., Jimenez, J. L., Lamplugh, A. D., Lee, Y. R., Lindaas, J., Moore, R. H., Nault, B. A., Nowak, J. B., Pagonis, D., Rickly, P. S., Robinson, M. A., Rollins, A. W., Selimovic, V., St. Clair, J. M., Tanner, D., Vasquez, K. T., Veres, P. R., Warneke, C., Wennberg, P. O., Washenfelder, R. A., Wiggins, E. B., Womack, C. C., Xu, L., Zarzana, K. J., and Ryerson, T. B.: Comparison of airborne measurements of NO, NO2, HONO, NOy, and CO during FIREX-AQ, Atmos. Meas. Tech., 15, 4901–4930, https://doi.org/10.5194/amt-15-4901-2022, 2022. a
Bousserez, N.: Space-based retrieval of NO2 over biomass burning regions: quantifying and reducing uncertainties, Atmos. Meas. Tech., 7, 3431–3444, https://doi.org/10.5194/amt-7-3431-2014, 2014. a
Burling, I. R., Yokelson, R. J., Griffith, D. W. T., Johnson, T. J., Veres, P., Roberts, J. M., Warneke, C., Urbanski, S. P., Reardon, J., Weise, D. R., Hao, W. M., and de Gouw, J.: Laboratory measurements of trace gas emissions from biomass burning of fuel types from the southeastern and southwestern United States, Atmos. Chem. Phys., 10, 11115–11130, https://doi.org/10.5194/acp-10-11115-2010, 2010. a
Chai, J., Dibb, J. E., Anderson, B. E., Bekker, C., Blum, D. E., Heim, E., Jordan, C. E., Joyce, E. E., Kaspari, J. H., Munro, H., Walters, W. W., and Hastings, M. G.: Isotopic evidence for dominant secondary production of HONO in near-ground wildfire plumes, Atmos. Chem. Phys., 21, 13077–13098, https://doi.org/10.5194/acp-21-13077-2021, 2021. a
Chen, Y., Romps, D. M., Seeley, J. T., Veraverbeke, S., Riley, W. J., Mekonnen, Z. A., and Randerson, J. T.: Future increases in Arctic lightning and fire risk for permafrost carbon, Nat. Clim. Change, 11, 404–410, https://doi.org/10.1038/s41558-021-01011-y, 2021. a
Clarisse, L., Hurtmans, D., Prata, A. J., Karagulian, F., Clerbaux, C., De Mazière, M., and Coheur, P.-F.: Retrieving radius, concentration, optical depth, and mass of different types of aerosols from high-resolution infrared nadir spectra, Appl. Opt., 49, 3713, https://doi.org/10.1364/ao.49.003713, 2010. a, b
Clarisse, L., R'Honi, Y., Coheur, P.-F., Hurtmans, D., and Clerbaux, C.: Thermal infrared nadir observations of 24 atmospheric gases, Geophys. Res. Lett., 38, L10802, https://doi.org/10.1029/2011gl047271, 2011. a, b, c, d, e, f
Clarisse, L., Coheur, P.-F., Prata, F., Hadji-Lazaro, J., Hurtmans, D., and Clerbaux, C.: A unified approach to infrared aerosol remote sensing and type specification, Atmos. Chem. Phys., 13, 2195–2221, https://doi.org/10.5194/acp-13-2195-2013, 2013. a, b, c
Clarisse, L., Clerbaux, C., Franco, B., Hadji-Lazaro, J., Whitburn, S., Kopp, A. K., Hurtmans, D., and Coheur, P.-F.: A Decadal Data Set of Global Atmospheric Dust Retrieved From IASI Satellite Measurements, J. Geophys. Res.-Atmos., 124, 1618–1647, https://doi.org/10.1029/2018jd029701, 2019. a, b, c, d
Clarisse, L., Franco, B., Van Damme, M., Di Gioacchino, T., Hadji-Lazaro, J., Whitburn, S., Noppen, L., Hurtmans, D., Clerbaux, C., and Coheur, P.: The IASI NH3 version 4 product: averaging kernels and improved consistency, Atmos. Meas. Tech., 16, 5009–5028, https://doi.org/10.5194/amt-16-5009-2023, 2023. a, b, c, d, e, f, g, h, i, j, k, l, m
Clerbaux, C., Boynard, A., Clarisse, L., George, M., Hadji-Lazaro, J., Herbin, H., Hurtmans, D., Pommier, M., Razavi, A., Turquety, S., Wespes, C., and Coheur, P.-F.: Monitoring of atmospheric composition using the thermal infrared IASI/MetOp sounder, Atmos. Chem. Phys., 9, 6041–6054, https://doi.org/10.5194/acp-9-6041-2009, 2009. a, b
Coheur, P.-F., Barret, B., Turquety, S., Hurtmans, D., Hadji-Lazaro, J., and Clerbaux, C.: Retrieval and characterization of ozone vertical profiles from a thermal infrared nadir sounder, J. Geophys. Res., 110, D24303, https://doi.org/10.1029/2005jd005845, 2005. a
Coheur, P.-F., Clarisse, L., Turquety, S., Hurtmans, D., and Clerbaux, C.: IASI measurements of reactive trace species in biomass burning plumes, Atmos. Chem. Phys., 9, 5655–5667, https://doi.org/10.5194/acp-9-5655-2009, 2009. a, b, c
Crevoisier, C., Clerbaux, C., Guidard, V., Phulpin, T., Armante, R., Barret, B., Camy-Peyret, C., Chaboureau, J.-P., Coheur, P.-F., Crépeau, L., Dufour, G., Labonnote, L., Lavanant, L., Hadji-Lazaro, J., Herbin, H., Jacquinet-Husson, N., Payan, S., Péquignot, E., Pierangelo, C., Sellitto, P., and Stubenrauch, C.: Towards IASI-New Generation (IASI-NG): impact of improved spectral resolution and radiometric noise on the retrieval of thermodynamic, chemistry and climate variables, Atmos. Meas. Tech., 7, 4367–4385, https://doi.org/10.5194/amt-7-4367-2014, 2014. a
De Longueville, H., Clarisse, L., Whitburn, S., Franco, B., Bauduin, S., Clerbaux, C., Camy-Peyret, C., and Coheur, P.-F.: Identification of Short and Long-Lived Atmospheric Trace Gases From IASI Space Observations, Geophys. Res. Lett., 48, e2020GL091742, https://doi.org/10.1029/2020gl091742, 2021. a, b, c, d, e, f, g
Dowdy, A. J., Fromm, M. D., and McCarthy, N.: Pyrocumulonimbus lightning and fire ignition on Black Saturday in southeast Australia, J. Geophys. Res.-Atmos., 122, 7342–7354, https://doi.org/10.1002/2017jd026577, 2017. a
Dufour, G., Eremenko, M., Siour, G., Sellitto, P., Cuesta, J., Perrin, A., and Beekmann, M.: 24 h Evolution of an Exceptional HONO Plume Emitted by the Record-Breaking 2019/2020 Australian Wildfire Tracked from Space, Atmosphere, 13, 1485, https://doi.org/10.3390/atmos13091485, 2022. a, b, c, d, e, f
Elshorbany, Y. F., Steil, B., Brühl, C., and Lelieveld, J.: Impact of HONO on global atmospheric chemistry calculated with an empirical parameterization in the EMAC model, Atmos. Chem. Phys., 12, 9977–10000, https://doi.org/10.5194/acp-12-9977-2012, 2012. a
Elshorbany, Y. F., Crutzen, P. J., Steil, B., Pozzer, A., Tost, H., and Lelieveld, J.: Global and regional impacts of HONO on the chemical composition of clouds and aerosols, Atmos. Chem. Phys., 14, 1167–1184, https://doi.org/10.5194/acp-14-1167-2014, 2014. a
Field, R. D., Luo, M., Fromm, M., Voulgarakis, A., Mangeon, S., and Worden, J.: Simulating the Black Saturday 2009 smoke plume with an interactive composition-climate model: Sensitivity to emissions amount, timing, and injection height, J. Geophys. Res.-Atmos., 121, 4296–4316, https://doi.org/10.1002/2015jd024343, 2016. a
Franco, B., Clarisse, L., Stavrakou, T., Müller, J.-F., Van Damme, M., Whitburn, S., Hadji-Lazaro, J., Hurtmans, D., Taraborrelli, D., Clerbaux, C., and Coheur, P.-F.: A General Framework for Global Retrievals of Trace Gases from IASI: Application to Methanol, Formic Acid, and PAN, J. Geophys. Res.-Atmos., 123, 13963–13984, https://doi.org/10.1029/2018jd029633, 2018. a, b, c, d
Franco, B., Clarisse, L., Stavrakou, T., Müller, J.-F., Taraborrelli, D., Hadji-Lazaro, J., Hannigan, J. W., Hase, F., Hurtmans, D., Jones, N., Lutsch, E., Mahieu, E., Ortega, I., Schneider, M., Strong, K., Vigouroux, C., Clerbaux, C., and Coheur, P.-F.: Spaceborne Measurements of Formic and Acetic Acids: A Global View of the Regional Sources, Geophys. Res. Lett., 47, e2019GL086239, https://doi.org/10.1029/2019gl086239, 2020. a, b
Franco, B., Clarisse, L., Van Damme, M., Hadji-Lazaro, J., Clerbaux, C., and Coheur, P.-F.: Ethylene industrial emitters seen from space, Nat. Commun., 13, 6452, https://doi.org/10.1038/s41467-022-34098-8, 2022. a, b, c, d, e, f, g, h, i
Franco, B., Clarisse, L., and Coheur, P.: The IASI/Metop pyrogenic HONO product v2, Zenodo [data set], https://doi.org/10.5281/zenodo.10721381, 2024. a
Fredrickson, C. D., Theys, N., and Thornton, J. A.: Satellite Evidence of HONO NO2 Increase With Fire Radiative Power, Geophys. Res. Lett., 50, e2023GL103836, https://doi.org/10.1029/2023gl103836, 2023. a
Fromm, M., Servranckx, R., Stocks, B. J., and Peterson, D. A.: Understanding the critical elements of the pyrocumulonimbus storm sparked by high-intensity wildland fire, Commun. Earth Environ., 3, 243, https://doi.org/10.1038/s43247-022-00566-8, 2022. a
Giglio, L., van der Werf, G. R., Randerson, J. T., Collatz, G. J., and Kasibhatla, P.: Global estimation of burned area using MODIS active fire observations, Atmos. Chem. Phys., 6, 957–974, https://doi.org/10.5194/acp-6-957-2006, 2006. a, b, c
Giglio, L., Schroeder, W., and Justice, C. O.: The collection 6 MODIS active fire detection algorithm and fire products, Remote Sens. Environ., 178, 31–41, https://doi.org/10.1016/j.rse.2016.02.054, 2016. a, b
González-Sánchez, J. M., Huix-Rotllant, M., Brun, N., Morin, J., Demelas, C., Durand, A., Ravier, S., Clément, J.-L., and Monod, A.: Direct formation of HONO through aqueous-phase photolysis of organic nitrates, Atmos. Chem. Phys., 23, 15135–15147, https://doi.org/10.5194/acp-23-15135-2023, 2023. a
Gutierrez, A. A., Hantson, S., Langenbrunner, B., Chen, B., Jin, Y., Goulden, M. L., and Randerson, J. T.: Wildfire response to changing daily temperature extremes in California's Sierra Nevada, Science Advances, 7, eabe6417, https://doi.org/10.1126/sciadv.abe6417, 2021. a
Ha, P. T. M., Kanaya, Y., Taketani, F., Andrés Hernández, M. D., Schreiner, B., Pfeilsticker, K., and Sudo, K.: Implementation of HONO into the chemistry–climate model CHASER (V4.0): roles in tropospheric chemistry, Geosci. Model Dev., 16, 927–960, https://doi.org/10.5194/gmd-16-927-2023, 2023. a
Haas, O., Prentice, I. C., and Harrison, S. P.: Global environmental controls on wildfire burnt area, size, and intensity, Environ. Res. Lett., 17, 065004, https://doi.org/10.1088/1748-9326/ac6a69, 2022. a
Hendrick, F., Müller, J.-F., Clémer, K., Wang, P., De Mazière, M., Fayt, C., Gielen, C., Hermans, C., Ma, J. Z., Pinardi, G., Stavrakou, T., Vlemmix, T., and Van Roozendael, M.: Four years of ground-based MAX-DOAS observations of HONO and NO2 in the Beijing area, Atmos. Chem. Phys., 14, 765–781, https://doi.org/10.5194/acp-14-765-2014, 2014. a
Hersbach, H., Bell, B., Berrisford, P., Hirahara, S., Horányi, A., Munoz-Sabater, J., Nicolas, J., Peubey, C., Radu, R., Schepers, D., Simmons, A., Soci, C., Abdalla, S., Abellan, X., Balsamo, G., Bechtold, P., Biavati, G., Bidlot, J., Bonavita, M., Chiara, G., Dahlgren, P., Dee, D., Diamantakis, M., Dragani, R., Flemming, J., Forbes, R., Fuentes, M., Geer, A., Haimberger, L., Healy, S., Hogan, R. J., Hólm, E., Janisková, M., Keeley, S., Laloyaux, P., Lopez, P., Lupu, C., Radnoti, G., Rosnay, P., Rozum, I., Vamborg, F., Villaume, S., and Thépaut, J.-N.: The ERA5 global reanalysis, Q. J. Roy. Meteor. Soc., 146, 1999–2049, https://doi.org/10.1002/qj.3803, 2020. a
Ichoku, C., Giglio, L., Wooster, M. J., and Remer, L. A.: Global characterization of biomass-burning patterns using satellite measurements of fire radiative energy, Remote Sens. Environ., 112, 2950–2962, https://doi.org/10.1016/j.rse.2008.02.009, 2008. a
Jain, P., Castellanos-Acuna, D., Coogan, S. C. P., Abatzoglou, J. T., and Flannigan, M. D.: Observed increases in extreme fire weather driven by atmospheric humidity and temperature, Nat. Clim. Change, 12, 63–70, https://doi.org/10.1038/s41558-021-01224-1, 2021. a
Jones, M. W., Abatzoglou, J. T., Veraverbeke, S., Andela, N., Lasslop, G., Forkel, M., Smith, A. J. P., Burton, C., Betts, R. A., van der Werf, G. R., Sitch, S., Canadell, J. G., Santín, C., Kolden, C., Doerr, S. H., and Quéré, C. L.: Global and Regional Trends and Drivers of Fire Under Climate Change, Rev. Geophys., 60, e2020RG000726, https://doi.org/10.1029/2020rg000726, 2022. a
Kaiser, J. W., Heil, A., Andreae, M. O., Benedetti, A., Chubarova, N., Jones, L., Morcrette, J.-J., Razinger, M., Schultz, M. G., Suttie, M., and van der Werf, G. R.: Biomass burning emissions estimated with a global fire assimilation system based on observed fire radiative power, Biogeosciences, 9, 527–554, https://doi.org/10.5194/bg-9-527-2012, 2012. a
Ke, Z., Wang, Y., Zou, Y., Song, Y., and Liu, Y.: Global Wildfire Plume-Rise Data Set and Parameterizations for Climate Model Applications, J. Geophys. Res.-Atmos., 126, e2020JD033085, https://doi.org/10.1029/2020jd033085, 2021. a
Keeley, J. E. and Syphard, A. D.: Twenty-first century California, USA, wildfires: fuel-dominated vs. wind-dominated fires, Fire Ecol., 15, 24, https://doi.org/10.1186/s42408-019-0041-0, 2019. a
Keene, W. C., Lobert, J. M., Crutzen, P. J., Maben, J. R., Scharffe, D. H., Landmann, T., Hély, C., and Brain, C.: Emissions of major gaseous and particulate species during experimental burns of southern African biomass, J. Geophys. Res., 111, D04301, https://doi.org/10.1029/2005jd006319, 2006. a
Khaykin, S., Legras, B., Bucci, S., Sellitto, P., Isaksen, L., Tencé, F., Bekki, S., Bourassa, A., Rieger, L., Zawada, D., Jumelet, J., and Godin-Beekmann, S.: The 2019/20 Australian wildfires generated a persistent smoke-charged vortex rising up to 35 km altitude, Commun. Earth Environ., 1, 22, https://doi.org/10.1038/s43247-020-00022-5, 2020. a
Kille, N., Zarzana, K. J., Alvarez, J. R., Lee, C. F., Rowe, J. P., Howard, B., Campos, T., Hills, A., Hornbrook, R. S., Ortega, I., Permar, W., Ku, I. T., Lindaas, J., Pollack, I. B., Sullivan, A. P., Zhou, Y., Fredrickson, C. D., Palm, B. B., Peng, Q., Apel, E. C., Hu, L., Collett, J. L., Fischer, E. V., Flocke, F., Hannigan, J. W., Thornton, J., and Volkamer, R.: The CU Airborne Solar Occultation Flux Instrument: Performance Evaluation during BB-FLUX, ACS Earth and Space Chemistry, 6, 582–596, https://doi.org/10.1021/acsearthspacechem.1c00281, 2022. a
Kingsmill, D. E., French, J. R., and Lareau, N. P.: In situ microphysics observations of intense pyroconvection from a large wildfire, Atmos. Chem. Phys., 23, 1–21, https://doi.org/10.5194/acp-23-1-2023, 2023. a
Kleffmann, J., Gavriloaiei, T., Hofzumahaus, A., Holland, F., Koppmann, R., Rupp, L., Schlosser, E., Siese, M., and Wahner, A.: Daytime formation of nitrous acid: A major source of OH radicals in a forest, Geophys. Res. Lett., 32, L05818, https://doi.org/10.1029/2005gl022524, 2005. a
Kramer, L. J., Crilley, L. R., Adams, T. J., Ball, S. M., Pope, F. D., and Bloss, W. J.: Nitrous acid (HONO) emissions under real-world driving conditions from vehicles in a UK road tunnel, Atmos. Chem. Phys., 20, 5231–5248, https://doi.org/10.5194/acp-20-5231-2020, 2020. a, b
Laurent, P., Mouillot, F., Moreno, M. V., Yue, C., and Ciais, P.: Varying relationships between fire radiative power and fire size at a global scale, Biogeosciences, 16, 275–288, https://doi.org/10.5194/bg-16-275-2019, 2019. a
Li, L., Duan, Z., Li, H., Zhu, C., Henkelman, G., Francisco, J. S., and Zeng, X. C.: Formation of HONO from the NH3-promoted hydrolysis of NO2 dimers in the atmosphere, P. Natl. Acad. Sci. USA, 115, 7236–7241, https://doi.org/10.1073/pnas.1807719115, 2018. a
Li, X., Rohrer, F., Hofzumahaus, A., Brauers, T., Häseler, R., Bohn, B., Broch, S., Fuchs, H., Gomm, S., Holland, F., Jäger, J., Kaiser, J., Keutsch, F. N., Lohse, I., Lu, K., Tillmann, R., Wegener, R., Wolfe, G. M., Mentel, T. F., Kiendler-Scharr, A., and Wahner, A.: Missing Gas-Phase Source of HONO Inferred from Zeppelin Measurements in the Troposphere, Science, 344, 292–296, https://doi.org/10.1126/science.1248999, 2014. a
Luo, R., Hui, D., Miao, N., Liang, C., and Wells, N.: Global relationship of fire occurrence and fire intensity: A test of intermediate fire occurrence-intensity hypothesis, J. Geophys. Res.-Biogeo., 122, 1123–1136, https://doi.org/10.1002/2016jg003722, 2017. a, b
Monge, M. E., D'Anna, B., Mazri, L., Giroir-Fendler, A., Ammann, M., Donaldson, D. J., and George, C.: Light changes the atmospheric reactivity of soot, P. Natl. Acad. Sci. USA, 107, 6605–6609, https://doi.org/10.1073/pnas.0908341107, 2010. a
Neuman, J. A., Trainer, M., Brown, S. S., Min, K.-E., Nowak, J. B., Parrish, D. D., Peischl, J., Pollack, I. B., Roberts, J. M., Ryerson, T. B., and Veres, P. R.: HONO emission and production determined from airborne measurements over the Southeast U.S., J. Geophys. Res.-Atmos., 121, 9237–9250, https://doi.org/10.1002/2016jd025197, 2016. a, b
Nie, W., Ding, A. J., Xie, Y. N., Xu, Z., Mao, H., Kerminen, V.-M., Zheng, L. F., Qi, X. M., Huang, X., Yang, X.-Q., Sun, J. N., Herrmann, E., Petäjä, T., Kulmala, M., and Fu, C. B.: Influence of biomass burning plumes on HONO chemistry in eastern China, Atmos. Chem. Phys., 15, 1147–1159, https://doi.org/10.5194/acp-15-1147-2015, 2015. a
Oswald, R., Behrendt, T., Ermel, M., Wu, D., Su, H., Cheng, Y., Breuninger, C., Moravek, A., Mougin, E., Delon, C., Loubet, B., Pommerening-Röser, A., Sörgel, M., Pöschl, U., Hoffmann, T., Andreae, M. O., Meixner, F. X., and Trebs, I.: HONO Emissions from Soil Bacteria as a Major Source of Atmospheric Reactive Nitrogen, Science, 341, 1233–1235, https://doi.org/10.1126/science.1242266, 2013. a
Oswald, R., Ermel, M., Hens, K., Novelli, A., Ouwersloot, H. G., Paasonen, P., Petäjä, T., Sipilä, M., Keronen, P., Bäck, J., Königstedt, R., Hosaynali Beygi, Z., Fischer, H., Bohn, B., Kubistin, D., Harder, H., Martinez, M., Williams, J., Hoffmann, T., Trebs, I., and Sörgel, M.: A comparison of HONO budgets for two measurement heights at a field station within the boreal forest in Finland, Atmos. Chem. Phys., 15, 799–813, https://doi.org/10.5194/acp-15-799-2015, 2015. a, b
Peng, Q., Palm, B. B., Melander, K. E., Lee, B. H., Hall, S. R., Ullmann, K., Campos, T., Weinheimer, A. J., Apel, E. C., Hornbrook, R. S., Hills, A. J., Montzka, D. D., Flocke, F., Hu, L., Permar, W., Wielgasz, C., Lindaas, J., Pollack, I. B., Fischer, E. V., Bertram, T. H., and Thornton, J. A.: HONO Emissions from Western U.S. Wildfires Provide Dominant Radical Source in Fresh Wildfire Smoke, Environ. Sci. Technol., 54, 5954–5963, https://doi.org/10.1021/acs.est.0c00126, 2020. a, b, c
Peng, Q., Palm, B. B., Fredrickson, C. D., Lee, B. H., Hall, S. R., Ullmann, K., Campos, T., Weinheimer, A. J., Apel, E. C., Flocke, F., Permar, W., Hu, L., Garofalo, L. A., Pothier, M. A., Farmer, D. K., Ku, I.-T., Sullivan, A. P., Collett, J. L., Fischer, E., and Thornton, J. A.: Observations and Modeling of NOx Photochemistry and Fate in Fresh Wildfire Plumes, ACS Earth and Space Chemistry, 5, 2652–2667, https://doi.org/10.1021/acsearthspacechem.1c00086, 2021. a
Peng, Q., Palm, B. B., Fredrickson, C. D., Lee, B. H., Hall, S. R., Ullmann, K., Weinheimer, A. J., Levin, E., DeMott, P., Garofalo, L. A., Pothier, M. A., Farmer, D. K., Fischer, E. V., and Thornton, J. A.: Direct Constraints on Secondary HONO Production in Aged Wildfire Smoke From Airborne Measurements Over the Western US, Geophys. Res. Lett., 49, e2022GL098704, https://doi.org/10.1029/2022gl098704, 2022. a
Peterson, D. A., Fromm, M. D., McRae, R. H. D., Campbell, J. R., Hyer, E. J., Taha, G., Camacho, C. P., Kablick, G. P., Schmidt, C. C., and DeLand, M. T.: Australia's Black Summer pyrocumulonimbus super outbreak reveals potential for increasingly extreme stratospheric smoke events, npj Climate and Atmospheric Science, 4, 38, https://doi.org/10.1038/s41612-021-00192-9, 2021. a
Roberts, J. M., Veres, P., Warneke, C., Neuman, J. A., Washenfelder, R. A., Brown, S. S., Baasandorj, M., Burkholder, J. B., Burling, I. R., Johnson, T. J., Yokelson, R. J., and de Gouw, J.: Measurement of HONO, HNCO, and other inorganic acids by negative-ion proton-transfer chemical-ionization mass spectrometry (NI-PT-CIMS): application to biomass burning emissions, Atmos. Meas. Tech., 3, 981–990, https://doi.org/10.5194/amt-3-981-2010, 2010. a, b
Rodgers, C. D.: Inverse Methods for Atmospheric Sounding, World Scientific, https://doi.org/10.1142/3171, 2000. a
Rogers, B. M., Soja, A. J., Goulden, M. L., and Randerson, J. T.: Influence of tree species on continental differences in boreal fires and climate feedbacks, Nat. Geosci., 8, 228–234, https://doi.org/10.1038/ngeo2352, 2015. a, b
Rosanka, S., Franco, B., Clarisse, L., Coheur, P.-F., Pozzer, A., Wahner, A., and Taraborrelli, D.: The impact of organic pollutants from Indonesian peatland fires on the tropospheric and lower stratospheric composition, Atmos. Chem. Phys., 21, 11257–11288, https://doi.org/10.5194/acp-21-11257-2021, 2021. a, b
Rowe, J. P., Zarzana, K. J., Kille, N., Borsdorff, T., Goudar, M., Lee, C. F., Koenig, T. K., Romero-Alvarez, J., Campos, T., Knote, C., Theys, N., Landgraf, J., and Volkamer, R.: Carbon Monoxide in Optically Thick Wildfire Smoke: Evaluating TROPOMI Using CU Airborne SOF Column Observations, ACS Earth and Space Chemistry, 6, 1799–1812, https://doi.org/10.1021/acsearthspacechem.2c00048, 2022. a
Schneising, O., Buchwitz, M., Reuter, M., Bovensmann, H., and Burrows, J. P.: Severe Californian wildfires in November 2018 observed from space: the carbon monoxide perspective, Atmos. Chem. Phys., 20, 3317–3332, https://doi.org/10.5194/acp-20-3317-2020, 2020. a
Schoennagel, T., Balch, J. K., Brenkert-Smith, H., Dennison, P. E., Harvey, B. J., Krawchuk, M. A., Mietkiewicz, N., Morgan, P., Moritz, M. A., Rasker, R., Turner, M. G., and Whitlock, C.: Adapt to more wildfire in western North American forests as climate changes, P. Natl. Acad. Sci. USA, 114, 4582–4590, https://doi.org/10.1073/pnas.1617464114, 2017. a
Sharpe, S. W., Johnson, T. J., Sams, R. L., Chu, P. M., Rhoderick, G. C., and Johnson, P. A.: Gas-Phase Databases for Quantitative Infrared Spectroscopy, Appl. Spectrosc., 58, 1452–1461, https://doi.org/10.1366/0003702042641281, 2004. a
Siddaway, J. M. and Petelina, S. V.: Transport and evolution of the 2009 Australian Black Saturday bushfire smoke in the lower stratosphere observed by OSIRIS on Odin, J. Geophys. Res., 116, D06203, https://doi.org/10.1029/2010jd015162, 2011. a
Spataro, F. and Ianniello, A.: Sources of atmospheric nitrous acid: State of the science, current research needs, and future prospects, J. Air Waste Manage., 64, 1232–1250, https://doi.org/10.1080/10962247.2014.952846, 2014. a, b, c, d, e
Stemmler, K., Ammann, M., Donders, C., Kleffmann, J., and George, C.: Photosensitized reduction of nitrogen dioxide on humic acid as a source of nitrous acid, Nature, 440, 195–198, https://doi.org/10.1038/nature04603, 2006. a, b
Tang, W., Emmons, L. K., Buchholz, R. R., Wiedinmyer, C., Schwantes, R. H., He, C., Kumar, R., Pfister, G. G., Worden, H. M., Hornbrook, R. S., Apel, E. C., Tilmes, S., Gaubert, B., Martinez-Alonso, S.-E., Lacey, F., Holmes, C. D., Diskin, G. S., Bourgeois, I., Peischl, J., Ryerson, T. B., Hair, J. W., Weinheimer, A. J., Montzka, D. D., Tyndall, G. S., and Campos, T. L.: Effects of Fire Diurnal Variation and Plume Rise on U.S. Air Quality During FIREX-AQ and WE-CAN Based on the Multi-Scale Infrastructure for Chemistry and Aerosols (MUSICAv0), J. Geophys. Res.-Atmos., 127, e2022JD036650, https://doi.org/10.1029/2022jd036650, 2022. a
Tchana Betnga, W., Tchana, F. K., Perrin, A., Manceron, L., Vander Auwera, J., Hindle, F., and Coutens, A.: New line intensities for the far infrared bands of the Trans- and Cis-conformer of nitrous acid (HONO), new determination of the Trans-Cis conformer barrier and its impact on the astrophysical detection of nitrous acid in protostellar clouds, J. Quant. Spectrosc. Ra., 310, 108727, https://doi.org/10.1016/j.jqsrt.2023.108727, 2023. a
Theys, N., Volkamer, R., Müller, J.-F., Zarzana, K. J., Kille, N., Clarisse, L., Smedt, I. D., Lerot, C., Finkenzeller, H., Hendrick, F., Koenig, T. K., Lee, C. F., Knote, C., Yu, H., and Roozendael, M. V.: Global nitrous acid emissions and levels of regional oxidants enhanced by wildfires, Nat. Geosci., 13, 681–686, https://doi.org/10.1038/s41561-020-0637-7, 2020. a, b, c, d, e, f, g, h
Tomshin, O. and Solovyev, V.: Features of the Extreme Fire Season of 2021 in Yakutia (Eastern Siberia) and Heavy Air Pollution Caused by Biomass Burning, Remote Sensing, 14, 4980, https://doi.org/10.3390/rs14194980, 2022. a
Tuite, K., Thomas, J. L., Veres, P. R., Roberts, J. M., Stevens, P. S., Griffith, S. M., Dusanter, S., Flynn, J. H., Ahmed, S., Emmons, L., Kim, S.-W., Washenfelder, R., Young, C., Tsai, C., Pikelnaya, O., and Stutz, J.: Quantifying Nitrous Acid Formation Mechanisms Using Measured Vertical Profiles During the CalNex 2010 Campaign and 1D Column Modeling, J. Geophys. Res.-Atmos., 126, e2021JD034689, https://doi.org/10.1029/2021jd034689, 2021. a
Val Martin, M., Logan, J. A., Kahn, R. A., Leung, F.-Y., Nelson, D. L., and Diner, D. J.: Smoke injection heights from fires in North America: analysis of 5 years of satellite observations, Atmos. Chem. Phys., 10, 1491–1510, https://doi.org/10.5194/acp-10-1491-2010, 2010. a
Van Damme, M., Clarisse, L., Whitburn, S., Hadji-Lazaro, J., Hurtmans, D., Clerbaux, C., and Coheur, P.-F.: Industrial and agricultural ammonia point sources exposed, Nature, 564, 99–103, https://doi.org/10.1038/s41586-018-0747-1, 2018. a
Van Damme, M., Clarisse, L., Franco, B., Sutton, M. A., Erisman, J. W., Kruit, R. W., van Zanten, M., Whitburn, S., Hadji-Lazaro, J., Hurtmans, D., Clerbaux, C., and Coheur, P.-F.: Global, regional and national trends of atmospheric ammonia derived from a decadal (2008-2018) satellite record, Environ. Res. Lett., 16, 055017, https://doi.org/10.1088/1748-9326/abd5e0, 2021. a, b, c, d, e
VandenBoer, T. C., Markovic, M. Z., Sanders, J. E., Ren, X., Pusede, S. E., Browne, E. C., Cohen, R. C., Zhang, L., Thomas, J., Brune, W. H., and Murphy, J. G.: Evidence for a nitrous acid (HONO) reservoir at the ground surface in Bakersfield, CA, during CalNex 2010, J. Geophys. Res.-Atmos., 119, 9093–9106, https://doi.org/10.1002/2013jd020971, 2014. a, b, c, d
VandenBoer, T. C., Young, C. J., Talukdar, R. K., Markovic, M. Z., Brown, S. S., Roberts, J. M., and Murphy, J. G.: Nocturnal loss and daytime source of nitrous acid through reactive uptake and displacement, Nat. Geosci., 8, 55–60, https://doi.org/10.1038/ngeo2298, 2015. a
Veres, P., Roberts, J. M., Burling, I. R., Warneke, C., de Gouw, J., and Yokelson, R. J.: Measurements of gas-phase inorganic and organic acids from biomass fires by negative-ion proton-transfer chemical-ionization mass spectrometry, J. Geophys. Res., 115, D23302, https://doi.org/10.1029/2010jd014033, 2010. a
Volkamer, R., Sheehy, P., Molina, L. T., and Molina, M. J.: Oxidative capacity of the Mexico City atmosphere – Part 1: A radical source perspective, Atmos. Chem. Phys., 10, 6969–6991, https://doi.org/10.5194/acp-10-6969-2010, 2010. a, b, c
Vu Van, A., Boynard, A., Prunet, P., Jolivet, D., Lezeaux, O., Henry, P., Camy-Peyret, C., Clarisse, L., Franco, B., Coheur, P.-F., and Clerbaux, C.: Near-real-time detection of unexpected atmospheric events using principal component analysis on the Infrared Atmospheric Sounding Interferometer (IASI) radiances, Atmos. Meas. Tech., 16, 2107–2127, https://doi.org/10.5194/amt-16-2107-2023, 2023. a
Walker, J. C., Dudhia, A., and Carboni, E.: An effective method for the detection of trace species demonstrated using the MetOp Infrared Atmospheric Sounding Interferometer, Atmos. Meas. Tech., 4, 1567–1580, https://doi.org/10.5194/amt-4-1567-2011, 2011. a
Wang, Y., Dörner, S., Donner, S., Böhnke, S., De Smedt, I., Dickerson, R. R., Dong, Z., He, H., Li, Z., Li, Z., Li, D., Liu, D., Ren, X., Theys, N., Wang, Y., Wang, Y., Wang, Z., Xu, H., Xu, J., and Wagner, T.: Vertical profiles of NO2, SO2, HONO, HCHO, CHOCHO and aerosols derived from MAX-DOAS measurements at a rural site in the central western North China Plain and their relation to emission sources and effects of regional transport, Atmos. Chem. Phys., 19, 5417–5449, https://doi.org/10.5194/acp-19-5417-2019, 2019. a
Warneck, P.: Chemistry of the Natural Atmosphere, Elsevier Science & Techn., ISBN 9780080529066, 1999. a, b
Wayne, R.: Chemistry of atmospheres: an introduction to the chemistry of the atmospheres of earth, the planets, and their satellites, Oxford University Press, Oxford England New York, ISBN 9780198503750, 2000. a, b
Whitburn, S., Van Damme, M., Clarisse, L., Bauduin, S., Heald, C. L., Hadji-Lazaro, J., Hurtmans, D., Zondlo, M. A., Clerbaux, C., and Coheur, P.-F.: A flexible and robust neural network IASI-NH3 retrieval algorithm, J. Geophys. Res.-Atmos., 121, 6581–6599, https://doi.org/10.1002/2016jd024828, 2016. a, b
Whitburn, S., Clarisse, L., Crapeau, M., August, T., Hultberg, T., Coheur, P. F., and Clerbaux, C.: A CO2-independent cloud mask from Infrared Atmospheric Sounding Interferometer (IASI) radiances for climate applications, Atmos. Meas. Tech., 15, 6653–6668, https://doi.org/10.5194/amt-15-6653-2022, 2022. a
Wilmot, T. Y., Mallia, D. V., Hallar, A. G., and Lin, J. C.: Wildfire plumes in the Western US are reaching greater heights and injecting more aerosols aloft as wildfire activity intensifies, Sci. Rep., 12, https://doi.org/10.1038/s41598-022-16607-3, 2022. a, b
Winker, D. M., Vaughan, M. A., Omar, A., Hu, Y., Powell, K. A., Liu, Z., Hunt, W. H., and Young, S. A.: Overview of the CALIPSO Mission and CALIOP Data Processing Algorithms, J. Atmos. Ocean. Tech., 26, 2310–2323, https://doi.org/10.1175/2009jtecha1281.1, 2009. a
Winker, D. M., Tackett, J. L., Getzewich, B. J., Liu, Z., Vaughan, M. A., and Rogers, R. R.: The global 3-D distribution of tropospheric aerosols as characterized by CALIOP, Atmos. Chem. Phys., 13, 3345–3361, https://doi.org/10.5194/acp-13-3345-2013, 2013. a
Wizenberg, T., Strong, K., Jones, D. B. A., Lutsch, E., Mahieu, E., Franco, B., and Clarisse, L.: Exceptional Wildfire Enhancements of PAN, C2H4, CH3OH, and HCOOH Over the Canadian High Arctic During August 2017, J. Geophys. Res.-Atmos., 128, e2022JD038052, https://doi.org/10.1029/2022jd038052, 2023. a
Wooster, M. J., Roberts, G., Perry, G. L. W., and Kaufman, Y. J.: Retrieval of biomass combustion rates and totals from fire radiative power observations: FRP derivation and calibration relationships between biomass consumption and fire radiative energy release, J. Geophys. Res., 110, D24311, https://doi.org/10.1029/2005jd006318, 2005. a
Xu, W., Kuang, Y., Zhao, C., Tao, J., Zhao, G., Bian, Y., Yang, W., Yu, Y., Shen, C., Liang, L., Zhang, G., Lin, W., and Xu, X.: NH3-promoted hydrolysis of NO2 induces explosive growth in HONO, Atmos. Chem. Phys., 19, 10557–10570, https://doi.org/10.5194/acp-19-10557-2019, 2019. a
Ye, C., Zhang, N., Gao, H., and Zhou, X.: Photolysis of Particulate Nitrate as a Source of HONO and NOx, Environ. Sci. Technol., 51, 6849–6856, https://doi.org/10.1021/acs.est.7b00387, 2017. a
Yokelson, R. J., Crounse, J. D., DeCarlo, P. F., Karl, T., Urbanski, S., Atlas, E., Campos, T., Shinozuka, Y., Kapustin, V., Clarke, A. D., Weinheimer, A., Knapp, D. J., Montzka, D. D., Holloway, J., Weibring, P., Flocke, F., Zheng, W., Toohey, D., Wennberg, P. O., Wiedinmyer, C., Mauldin, L., Fried, A., Richter, D., Walega, J., Jimenez, J. L., Adachi, K., Buseck, P. R., Hall, S. R., and Shetter, R.: Emissions from biomass burning in the Yucatan, Atmos. Chem. Phys., 9, 5785–5812, https://doi.org/10.5194/acp-9-5785-2009, 2009. a
Yu, Y., Cheng, P., Li, H., Yang, W., Han, B., Song, W., Hu, W., Wang, X., Yuan, B., Shao, M., Huang, Z., Li, Z., Zheng, J., Wang, H., and Yu, X.: Budget of nitrous acid (HONO) at an urban site in the fall season of Guangzhou, China, Atmos. Chem. Phys., 22, 8951–8971, https://doi.org/10.5194/acp-22-8951-2022, 2022. a, b
Zhang, W., Tong, S., Lin, D., Li, F., Zhang, X., Wang, L., Ji, D., Tang, G., Liu, Z., Hu, B., and Ge, M.: Atmospheric chemistry of nitrous acid and its effects on hydroxyl radical and ozone at the urban area of Beijing in early spring 2021, Environ. Pollut., 316, 120710, https://doi.org/10.1016/j.envpol.2022.120710, 2023a. a, b
Zhang, X., Tong, S., Jia, C., Zhang, W., Wang, Z., Tang, G., Hu, B., Liu, Z., Wang, L., Zhao, P., Pan, Y., and Ge, M.: Elucidating HONO formation mechanism and its essential contribution to OH during haze events, npj Climate and Atmospheric Science, 6, 55, https://doi.org/10.1038/s41612-023-00371-w, 2023b. a
Zheng, B., Ciais, P., Chevallier, F., Yang, H., Canadell, J. G., Chen, Y., van der Velde, I. R., Aben, I., Chuvieco, E., Davis, S. J., Deeter, M., Hong, C., Kong, Y., Li, H., Li, H., Lin, X., He, K., and Zhang, Q.: Record-high CO2 emissions from boreal fires in 2021, Science, 379, 912–917, https://doi.org/10.1126/science.ade0805, 2023. a, b
Zheng, J., Shi, X., Ma, Y., Ren, X., Jabbour, H., Diao, Y., Wang, W., Ge, Y., Zhang, Y., and Zhu, W.: Contribution of nitrous acid to the atmospheric oxidation capacity in an industrial zone in the Yangtze River Delta region of China, Atmos. Chem. Phys., 20, 5457–5475, https://doi.org/10.5194/acp-20-5457-2020, 2020. a, b
Zhou, X., Zhang, N., TerAvest, M., Tang, D., Hou, J., Bertman, S., Alaghmand, M., Shepson, P. B., Carroll, M. A., Griffith, S., Dusanter, S., and Stevens, P. S.: Nitric acid photolysis on forest canopy surface as a source for tropospheric nitrous acid, Nat. Geosci., 4, 440–443, https://doi.org/10.1038/ngeo1164, 2011. a
- Abstract
- Introduction
- HONO detection in IASI spectra
- Pyrogenic HONO throughout the IASI time series
- Infrared retrieval of HONO total column
- Conclusions
- Appendix A: Additional figures
- Data availability
- Author contributions
- Competing interests
- Disclaimer
- Acknowledgements
- Financial support
- Review statement
- References