the Creative Commons Attribution 4.0 License.
the Creative Commons Attribution 4.0 License.
 | 25 Apr 2024
An inverse model to correct for the effects of post-depositional processing on ice-core nitrate and its isotopes: model framework and applications at Summit, Greenland, and Dome C, Antarctica
Zhuang Jiang
Becky Alexander
Joel Savarino
Comprehensive evaluation of the effects of post-depositional processing is a prerequisite for appropriately interpreting ice-core records of nitrate concentration and isotopes. In this study, we developed an inverse model that uses archived snow/ice-core nitrate signals to reconstruct primary nitrate flux (i.e., the deposition flux of nitrate to surface snow that originates from long-range transport or stratospheric input) and its isotopes (δ15N and Δ17O). The model was then applied to two polar sites, Summit, Greenland, and Dome C, Antarctica, using measured snowpack nitrate concentration and isotope profiles in the top few meters. At Summit, the model successfully reproduced the observed atmospheric δ15N(NO) and Δ17O(NO) and their seasonality. The model was also able to reasonably reproduce the observed snowpack nitrate profiles at Dome C as well as the skin layer and atmospheric δ15N(NO) and Δ17O(NO) at the annual scale. The calculated Fpri at Summit was 6.9 × 10⁻⁶ kgN m2 a−1, and the calculated Δ17O(NO) of Fpri is consistent with atmospheric observations in the Northern Hemisphere. However, the calculated δ15N(NO) of Fpri displays an opposite seasonal pattern to atmospheric observations in the northern mid-latitudes, but it is consistent with observations in two Arctic coastal sites. The calculated Fpri at Dome C varies from 1.5 to 2.2 × 10⁻⁶ kgN m−2 a−1, with δ15N(NO) of Fpri varying from 6.2 ‰ to 29.3 ‰ and Δ17O(NO) of Fpri varying from 48.8 ‰ to 52.6 ‰. The calculated Fpri at Dome C is close to the previous estimated stratospheric denitrification flux in Antarctica, and the high δ15N(NO) and Δ17O(NO) of Fpri at Dome C also point towards the dominant role of stratospheric origin of primary nitrate to Dome C.
- Article
(3447 KB) - Full-text XML
- BibTeX
- EndNote


Nitrate ion (NO) is routinely measured in polar snow and ice cores. The precursor of atmospheric nitrate is nitrogen oxide NOx (= NO + NO2), which plays a fundamental role in the production of tropospheric ozone and interconversion of atmospheric HOx (= OH + HO2) radicals (Seinfeld and Pandis, 2016; Sillman, 1999). Given the potential link between ice-core nitrate and atmospheric NOx, some previous studies proposed that ice-core nitrate records could be used to derive information regarding past atmospheric NOx abundance (Dibb et al., 1998; Röthlisberger et al., 2000). In addition, the oxygen isotope mass-independent fractionation signal (Δ17O = δ17O − 0.52 × δ18O) of nitrate is a reliable proxy of atmospheric ratio and is directly related to atmospheric oxidizing environment (Alexander et al., 2004; Alexander and Mickley, 2015; Geng et al., 2017; Sofen et al., 2014). These unique features render ice-core nitrate a potentially useful proxy to retrieve information on atmospheric oxidation environment in the past (Alexander and Mickley, 2015).
Interpretations of ice-core nitrate records are, however, not straightforward (Wolff et al., 2008). Unlike other less reactive species in ice cores such as sulfate, ice-core nitrate may not be able to directly track its atmospheric abundance (Iizuka et al., 2018). To link ice-core nitrate to atmospheric NOx abundance, other information including the conversion rate of NOx to nitrate, the mean lifetime of atmospheric nitrate, and the impact of post-depositional processing must be considered (Wolff, 1995; Wolff et al., 2008). Among these factors, the post-depositional processing of snow nitrate is the first gap in linking ice-core nitrate to atmospheric nitrate and/or NOx.
Snow nitrate is reactive under exposure to sunlight and can be photolyzed to form NOx and HONO (Honrath et al., 2002; Chu and Anastasio, 2003), which is rapidly transported to the overlying atmosphere via diffusion and convection (Zatko et al., 2013). These photoproducts subsequently reform nitrate (we further refer to this as snow-sourced nitrate) which is redeposited locally or exported away, leading to a recycling of nitrate at the air–snow interface (Erbland et al., 2013; Frey et al., 2009). The reformed nitrate would inherit Δ17O signals under local oxidation conditions that is different from primary nitrate, and the re-deposition of atmospheric nitrate could also result in nitrogen isotopic fractionation depending on the different deposition mechanisms (Erbland et al., 2013; Jiang et al., 2022). This post-depositional processing not only disturbs the link between nitrate in snow and its atmospheric precursors but also alters its isotopic signals (Erbland et al., 2013; Jiang et al., 2021, 2022; Shi et al., 2015). But since these processes are initiated by sunlight, the post-depositional processing is muted in polar winter when sunlight is absent.
It is expected that the degree of post-depositional processing varies with changes in factors such as snow accumulation rate under different climates (Akers et al., 2022b; Geng et al., 2015), causing corresponding shifts in the preserved nitrate signals. For example, the lower snow accumulation rate in glacial times would favor a higher degree of post-depositional processing with elevated δ15N(NO) relative to the Holocene as reflected by the GISP2 ice-core records (Geng et al., 2015; Hastings et al., 2005). Moreover, both observational and modeling studies have suggested that at sites with relatively high snow accumulation rates such as Summit, Greenland, the post-depositional processing of snow nitrate under present-day conditions also has a significant impact on seasonal δ15N(NO) variations, although its integral effects at the annual scale are limited (Jiang et al., 2021, 2022). In addition, the Δ17O of snow nitrate would also be altered via secondary chemistry during photolysis on snow grain (i.e., the cage effect), and this effect is enhanced with lower snow accumulation rates (Erbland et al., 2013; Frey et al., 2009; McCabe et al., 2005; Meusinger et al., 2014). Thus, it is critical to evaluate the impact of post-depositional processing on ice-core nitrate records before interpretation, especially for records covering different climates with changes in snow accumulation rates.
Primary nitrate to the polar ice sheets mainly originates from midlatitudes via long-range transport and with extra contributions from stratospheric input (Lee et al., 2014; Legrand and Delmas, 1986; Fischer et al., 1998; Savarino et al., 2007). To build the link between ice-core and atmospheric nitrate, Geng et al. (2015) proposed a simple method of using δ15N(NO) to estimate the fractional loss of snow nitrate caused by post-depositional processing. This method takes advantage of the high sensitivity of δ15N(NO) to the degree of photolytic loss (Erbland et al., 2013; Frey et al., 2009). If δ15N of the initially deposited nitrate can be assumed, the residual fraction of snow nitrate can be calculated by applying a Rayleigh type isotope fractionation model. The photolysis fractionation constant (15εp) can be estimated via the prescribed actinic flux spectrum and the absorption cross section for different nitrate isotopologues (Berhanu et al., 2014). Based on this method, Geng et al. (2015) estimated that as much as 45 %–53 % of snow nitrate was lost after deposition during the last glacial time in the GISP2 ice-core record. However, it is difficult to justify the assumed δ15N of deposited nitrate under different climates, and the method cannot correct for post-depositional modification of Δ17O(NO).
Erbland et al. (2015) developed a 1-D snow photochemistry model (TRANSITS, https://github.com/JZxxhh/TRANSITS-model, last access: 29 January 2024) that quantifies the effects of post-depositional processing on the preservations of nitrate and its isotopes in ice cores. The model comprises a series of physicochemical processes, including UV photolysis of snow nitrate, emission of NOx to the overlying atmosphere, local oxidation, and nitrate deposition. In addition, changes in the isotopic composition of nitrate (δ15N and Δ17O) at each step of the post-depositional processing are also explicitly incorporated. Recently, Shi et al. (2023) extended or followed the TRANSITS model framework to include snowpack δ18O(NO) simulation during the preservation of nitrate in snow. The latter was built upon the same chemical processes related to modeling Δ17O(NO) changes during the post-depositional processing. However, the fractionation factor of δ18O during snow nitrate photolysis (18εp) had to be scaled to reproduce the observations. In this case it remains unclear why the theoretical fractionation factor calculated using the ZPE (zero-point energy) shifted method (Frey et al., 2009) works well on δ15N(NO) but not on δ18O(NO). Nevertheless, the uncertainties associated with δ18O fractionations during snow nitrate photolysis and other processes (e.g., the cage effect, reformation of nitrate from NO2) make this simulation less useful and reliable than for Δ17O(NO), for which there are much fewer influencing factors and are easier to constrain. The TRANSITS model has been applied in various locations with different snow accumulation rates and well reproduced the observed snowpack nitrate and isotope profiles (Erbland et al., 2015; Jiang et al., 2021; Winton et al., 2020; Zatko et al., 2016). Based on model sensitivity tests, Erbland et al. (2015) proposed a framework to correct for the effects of post-depositional processing and to retrieve atmospheric information related to Fpri at Dome C. However, the framework is rather complicated, and it assumes δ15N of the archived nitrate is exclusively determined by the degree of nitrate post-depositional processing. Therefore, the framework cannot be applied to sites with moderate or high snow accumulation rates such as WAIS Divide, Antarctica, and Summit, Greenland, where factors other than post-depositional processing may also contribute to δ15N variations across different periods and/or climates (Hastings et al., 2005; Jiang et al., 2021).
In summary, TRANSITS is a forward model, and it requires prior knowledge of the distribution (e.g., weekly or monthly) of primary nitrate flux and isotopes as model inputs, which is usually unavailable due to the lack of direct observations. In this study, we developed an inverse modeling framework (i.e., the inverse of the TRANSITS model) that uses snowpack and/or ice-core preserved nitrate signals (concentrations and isotopes) as model inputs, and properties of primary nitrate including its flux and isotopes (δ15N and Δ17O) can be directly retrieved with constraints from snow accumulation rate and other known parameters (e.g., snow physicochemical properties). We assessed the model with observations at Summit, Greenland, and Dome C, Antarctica, two representative sites with approximately the high-end and low-end snow accumulation rates at present-day conditions.
The inverse model is designed based on the framework of the TRANSITS model but in an opposite direction of operating flows. The principle of the inverse model is that the archived snow nitrate concentration and isotope profiles from measurements are treated as model input, and they evolve inversely over time through the snow photic zone (defined as 3 times of the snow e-folding depth where the radiation decreases to of its initial intensity at snow surface) to recover their initial states at the time of deposition, thus providing the initial isotope compositions and deposition fluxes before being affected by any post-depositional effects. The primary nitrate flux and its isotopes can be further obtained by solving the mass balance equations in the atmosphere box. A schematic view of the inverse model is shown in Fig. 1 with arrows pointing toward the model direction flow (i.e. inverse of the real physical processes). Major parameters in the inverse model and their definitions are listed in Table 1.
Table 1List of major parameters used in the inverse model.
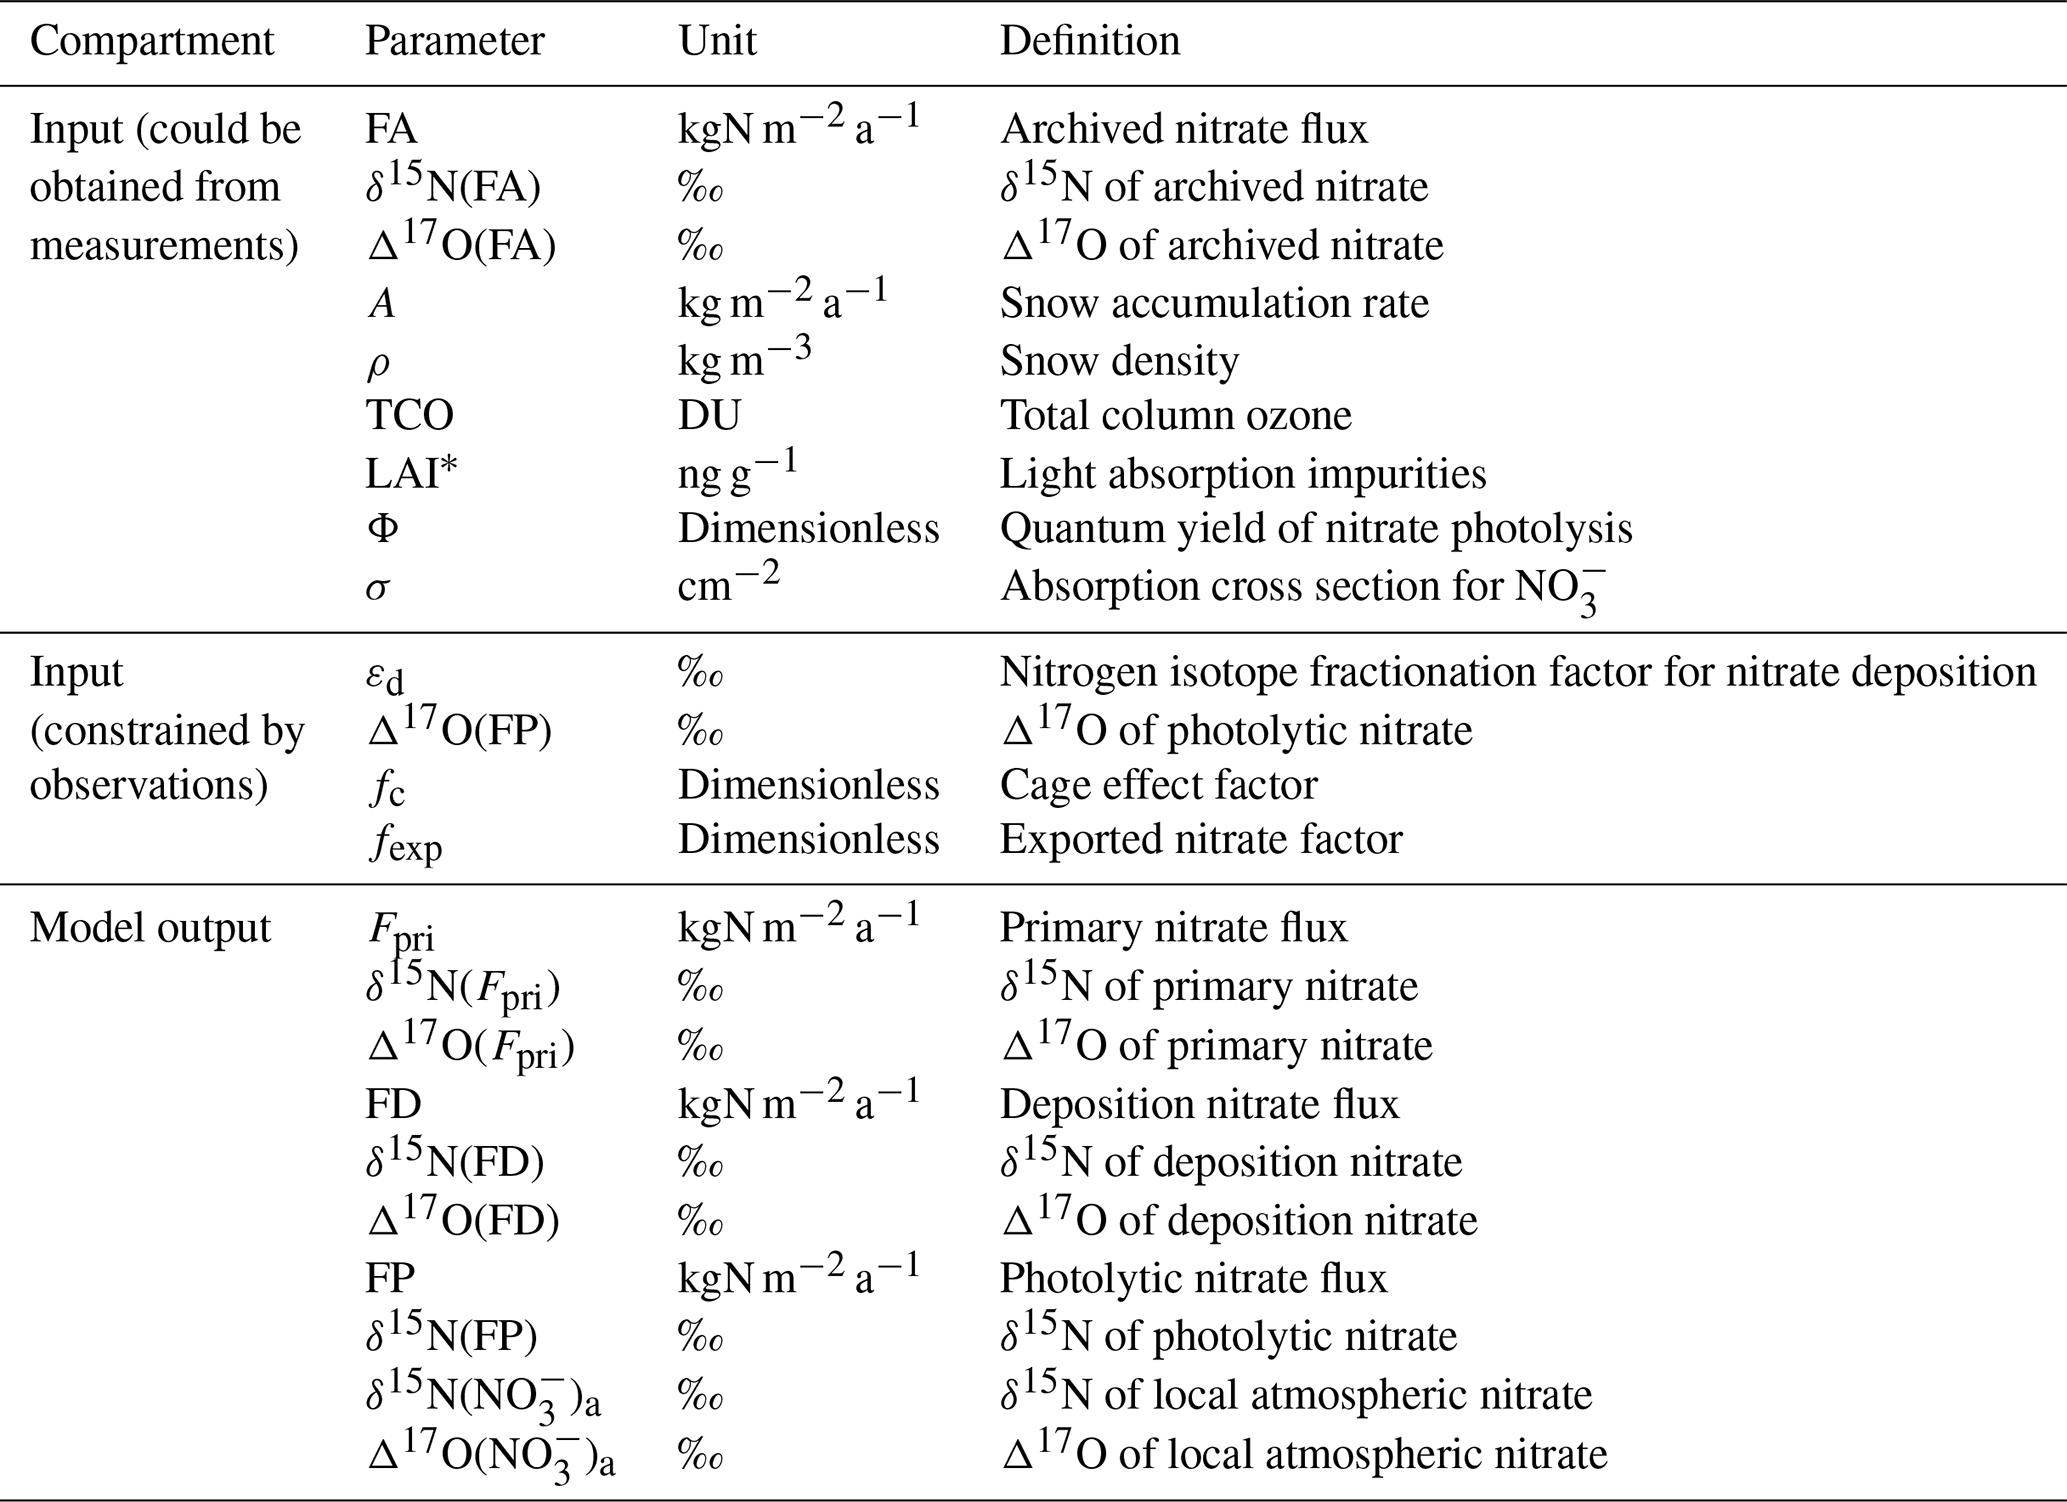
* Three types of light absorption impurity are considered in the inverse mode: black carbon, mineral dust, and organic humic-like substance (HULIS).
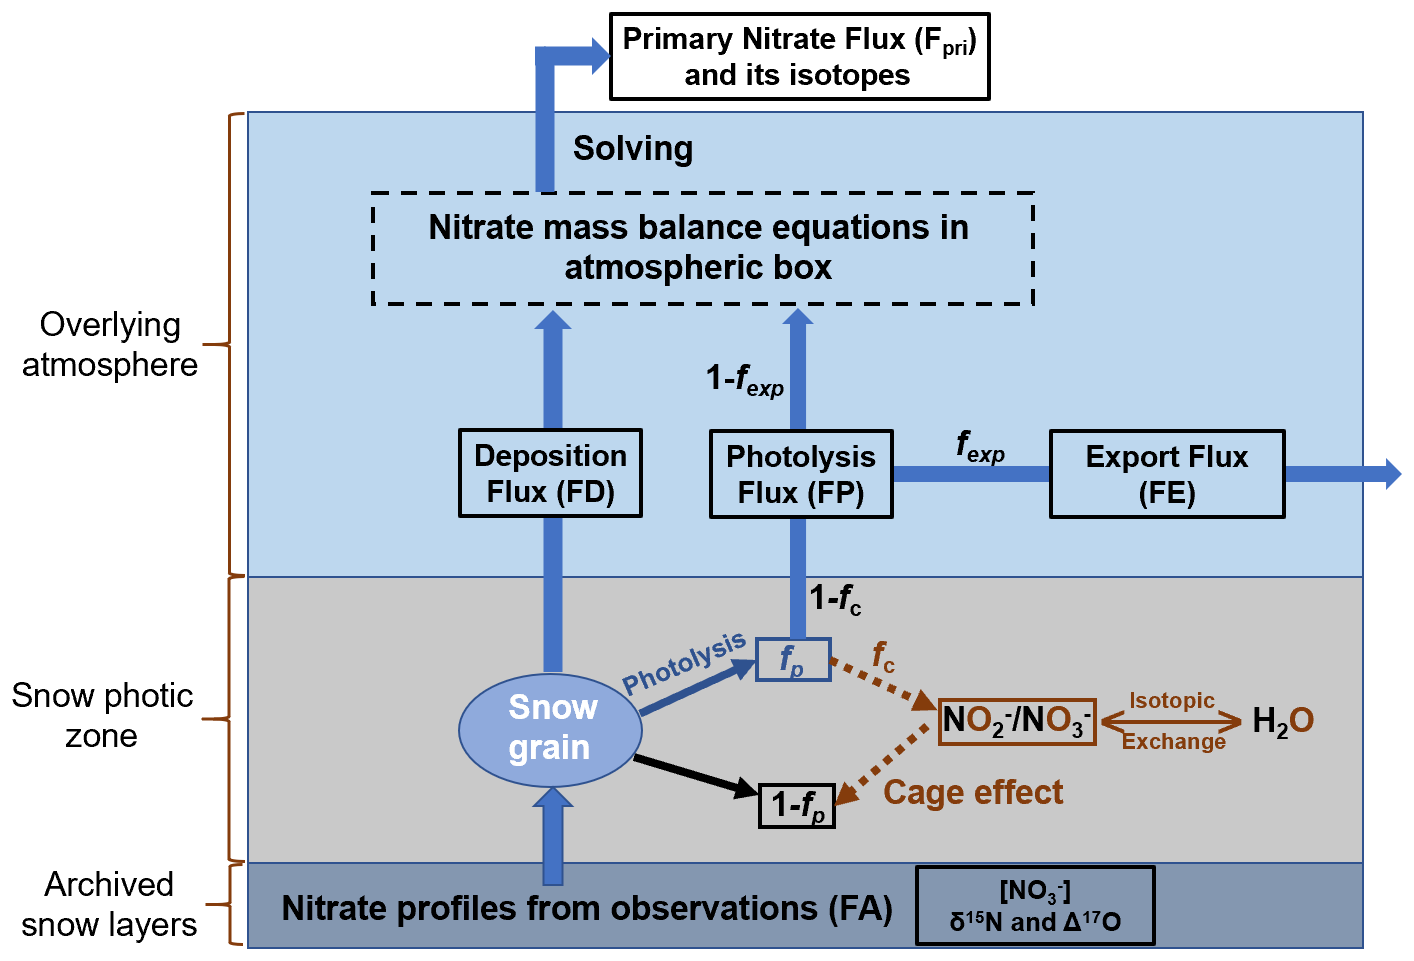
Figure 1Schematic plot of the model domains of the inverse model including the atmospheric box, the snow photic zone and the archived snow layers, where fexp represents the fraction of nitrate exported from the site of photolysis. The nitrate isotopic and mass balance relationships on snow grains during photolysis are also shown, where fp represents the fraction of snow nitrate being photolyzed, and fc represents the fraction of photolyzed nitrate experiencing the cage effect (i.e., exchange of oxygen isotopes with snow water). FA represents the archived nitrate flux.
The inverse model inherits most of the original processes and features in TRANSITS but with several modifications. In accordance with the TRANSITS model, the domains of the inverse model are represented by a 1-D atmosphere and snow column. As shown in Fig. 1, the model contains three vertical parts, including the overlying atmospheric boundary layer, which is treated as a single well-mixed box, the underlying snowpack, which is further separated into a snow photic zone, and the archived snow layers beneath the photic zone. The model time step is set to be 1 week by default. During each time step, the mass conservation equations in the atmospheric box are represented as follows:
where the subscript “a” represents the atmospheric box (i.e., ma refers to the mass of atmospheric nitrate), and δ15Na and Δ17Oa refer to δ15N and Δ17O of atmospheric nitrate, respectively. Different nitrate fluxes transported in and out of the atmospheric box are denoted as FP, FE, and FD, where FP refers to the photolytic nitrate flux (the snow-sourced nitrate), FD refers to the atmospheric deposition nitrate flux, and FE refers to the exported nitrate flux that is horizontally transported out of the atmospheric box via air flow. Following Erbland et al. (2015), FE is assumed to be a portion (fexp) of FP (i.e., FE = fexp×FP) and maintains the isotopic signatures of FP.
In Eqs. (1)–(3), the LHS (left-hand side) terms are 2–3 orders of magnitude smaller than nitrate fluxes in and out of the atmospheric box. Erbland et al. (2015) showed that the atmospheric nitrate mass was a factor of ∼ 10−3 smaller than the surface snow nitrate reservoir at Dome C, and similar results were also found at Summit in Jiang et al. (2021). Thus, is assumed to be zero at each time step (i.e., species and isotope compositions in the atmosphere are considered at steady state), which leads to simplified formulas for calculating Fpri via Eqs. (4)–(6) as follows:
Hence, if the magnitude and isotopic compositions of FP and FD in each time step are known, Fpri can be calculated. FP and FD calculated from the inverse evolution of snowpack nitrate are described in the following sections.
2.1 The backward evolution of snowpack nitrate
Starting with an arbitrary snowpack nitrate depth profile at a given time step, changes in nitrate concentration and isotopic compositions (δ15N and Δ17O) in a certain snow layer in the photic zone induced by photolysis can be calculated as follows:
where c represents the nitrate concentration and SNn refers to the nth snowpack layer, respectively, and the quotation mark in superscript refers to the initial state before being photolyzed at each time step. These equations are based on the nitrate mass and isotopic balances on snow grains during photolysis as shown in Fig. 1, and detailed derivations of these equations can be found in Appendix A.
In Eqs. (7)–(9), fp represents the fraction of snow nitrate that undergoes photolysis at each time step, and fc represents the fraction of nitrate photolysis intermediate undergoing the cage effect (Meusinger et al., 2014), which leads to apparent oxygen isotope exchange with water and lowers Δ17O by a factor of . The potential isotope effect on δ15N during cage effect remains unknown and is not considered. The value of fp is calculated by the first-order reaction of nitrate photolysis:
where J represents the rate constant of nitrate photolysis that varies with time and depth of the snow layer. J is calculated from actinic flux (I), the quantum yield (Φ), and the absorption cross section (σ) of nitrate photolysis as follows:
The rate constant of 15NO photolysis (J∗) is also calculated from the absorption cross section of the heavy isotopologue from Berhanu et al. (2014), and the photolysis fractionation constant for nitrogen isotope εp is calculated via
The solar zenith angle changes with time during each time step, leading to changes in the spectrum of actinic flux and subsequently changes in εp. To simplify the calculation, in Eq. (8) in a certain week is calculated by the weighted average of nitrogen isotope fractionation constant over the durations of different solar zenith angles (0–90°). The radiative transfer in snowpack is calculated using the parameterization from Zatko et al. (2013) to achieve fast online calculations, and this parameterization has been shown to be capable of providing consistent results with a high-order snowpack radiative transfer model DISORT (Zatko et al., 2013). The upper boundary conditions for the parameterization, i.e., the direct and diffuse components of the irradiance at the snow surface, are calculated offline using the Troposphere Ultraviolet and Visible (TUV) radiation model (Madronich et al., 1998) at different total column ozone (TCO) and solar zenith angle conditions.
The relationships between c(SNn), δ15N(SNn), and Δ17O(SNn) and c(SN), δ15N(SN), and Δ17O(SN) in the snowpack are illustrated in Fig. 2. Here, c(SNn), δ15N(SNn), and Δ17O(SNn) represent the values after photolysis in the nth layer at a certain time step, while c(SN), δ15N(SN), and Δ17O(SN) denote the values before photolysis at this time step, which are calculated using Eqs. 7–9. c(SN), δ15N(SN), and Δ17O(SN) also correspond to the values after photolysis in the prior time step when it was in the (n−1)th layer. By repeating this operation, the initially deposited values of nitrate concentration and isotopes for a given snow layer without influence from the photo-driven post-depositional processing (i.e., when this layer was at the surface) can be calculated, which is be further linked to FD.
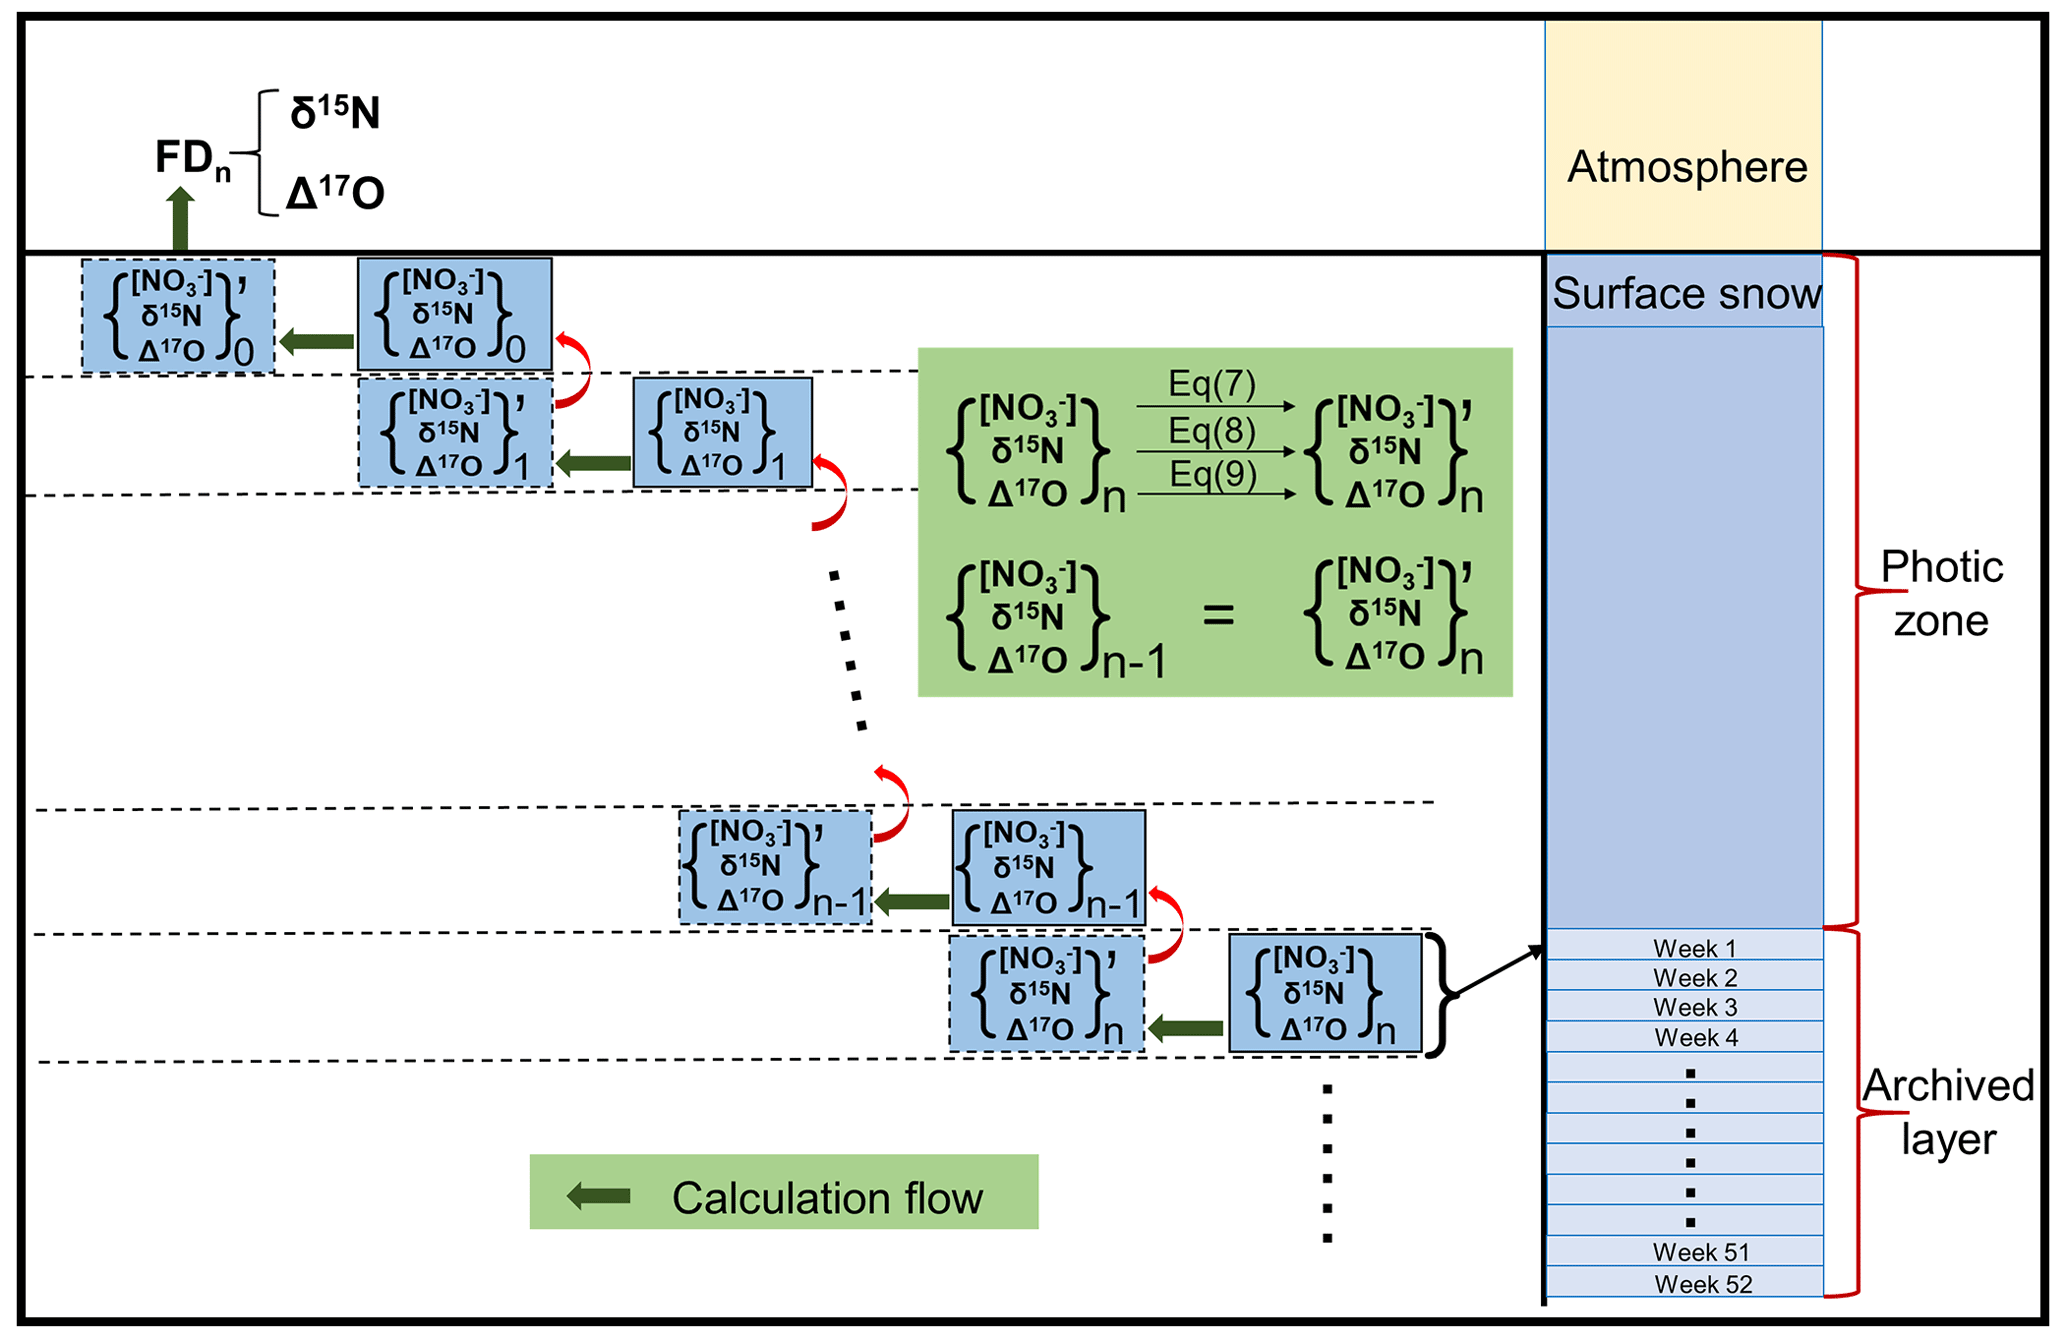
Figure 2Schematic of the evolution of snowpack nitrate from the archived layer to its initial state at the snow surface. The quotation mark in the superscript of the bracket represents the status of snow nitrate before photolysis at each time step.
2.2 Determinations of FP and FD
FP and FD are determined during the inverse evolution of snowpack nitrate profiles. As shown in Fig. 1, photolytic nitrate flux and its δ15N from the nth snow layer can be calculated via the mass balance relationships:
In Eq. (13), ρsnow is the density of snow, dn is the thickness of the nth snow layer, which is equal to the accumulated snow thickness at one time step, and Δt is the default model time step (1 week). Equation (14) implicitly assumes that the reformed nitrate in the overlying atmosphere keeps the same δ15N signals of the snow-emitted photoproduct of NO2 because of isotope mass balance; i.e., essentially all NO2 is oxidized into nitrate at one time step. FP emitted from the whole snowpack and its δ15N can be calculated by
For Δ17O of FP, extra knowledge of the oxidizing agent concentrations in the local atmosphere including HO2, RO2, and O3 must be provided (Appendix B). This is because the emitted NOx would achieve photochemical steady state rapidly, thus erasing any original Δ17O signal inherited from the snowpack nitrate. During the subsequent oxidation of atmospheric NO2, one more oxygen atom inherited from the oxidants (e.g., OH or BrO) is incorporated into one newly formed HNO3 molecule. Thus, Δ17(FP) can be represented by of Δ17O(NO2) plus of Δ17O(oxidant).
FD and its isotopic signals can be obtained from the uppermost snow layer before photolysis occurs as illustrated in Fig. 2:
The calculated FP and FD in each time step are further used to calculate Fpri according to Eqs. (4)–(6).
2.3 The choice of model initial conditions
To run the model, an appropriate archival snow nitrate profile with known concentration and isotopic composition (δ15N and Δ17O) should be assigned as model initial conditions with seasonal or monthly resolution, though ideally weekly or finer-resolution data are the best. The archived nitrate profile could be dated by using various types of seasonal markers, such as the δ18O of H2O, the ion concentrations or their ratios, and the snow accumulation rates (Hastings et al., 2004; Furukawa et al., 2017; Dibb et al., 2007). As long as the archived snow nitrate profiles (i.e., snow nitrate concentration and isotopes below the photic zone) are given, the model can calculate nitrate concentrations and isotopes throughout the photic zone and those in the atmosphere. The latter is considered as the atmospheric signals before being affected by post-depositional processing.
Because we lack direct observations of primary nitrate, we evaluated the model performance with other kinds of observations, including nitrate isotopes in surface snow and the overlying atmosphere. The deposited nitrate flux FD represents the state of nitrate that has just deposited onto the surface snow via dry deposition of gaseous nitrate or wet scavenge from the atmosphere and is close to the definition of the skin layer of snowpack, i.e., the uppermost several millimeters of surface snow (Erbland et al., 2013; Winton et al., 2020). Thus, if there are sufficient high-resolution skin layer observations, a direct comparison with the model output can be performed (i.e., FD vs. skin layer measurements). Moreover, since FD originates from the local atmosphere, if the air–snow nitrate transfer function (i.e., the mass and isotope relationships between atmospheric nitrate and the deposited nitrate) is known, the calculated FD could be used to infer the state of local atmospheric nitrate. In this study, the isotope transfer function is applied instead of the mass transfer function because of its simplicity, especially for Δ17O, which is assumed to be conserved during deposition owing to its mass-independent nature. For δ15N, we assume that the deposition of atmospheric nitrate is associated with a fractionation constant (εd) of +10 ‰ following Erbland et al. (2013). We can either directly compare the modeled isotopes of FD with the observed values in the skin layer or with local atmospheric signals by including the differences (only for δ15N) between FD and atmospheric nitrate.
In this study, we chose two typical polar sites, Summit, Greenland, and Dome C, Antarctica, to conduct case studies in order to test the performance of the inverse model. These two sites were chosen for several reasons. First, these two sites represent typical polar sites with both relatively high (Summit) and extremely low (Dome C) snow accumulation rates. Second, there are sufficient atmospheric and/or snow observations at these two sites, which informs model input parameters and allows for comparison of the model results with observations. Third, these two sites are hot spots of ice-core drilling, and future work using the inverse model on ice-core nitrate records from these sites can be performed. In addition, there have already been studies simulating the post-depositional processing of snow nitrate at these two sites by using the forward TRANSITS model (Erbland et al., 2015; Jiang et al., 2021). Most of the model parameters in this study are kept the same as the original TRANSITS simulation unless otherwise mentioned. The major parameters used in this study are summarized in Table 2. Below, we specifically describe how we chose the initial model values/conditions for simulations at these two sites.
Table 2Values of major parameters used in the model simulations at two different sites.
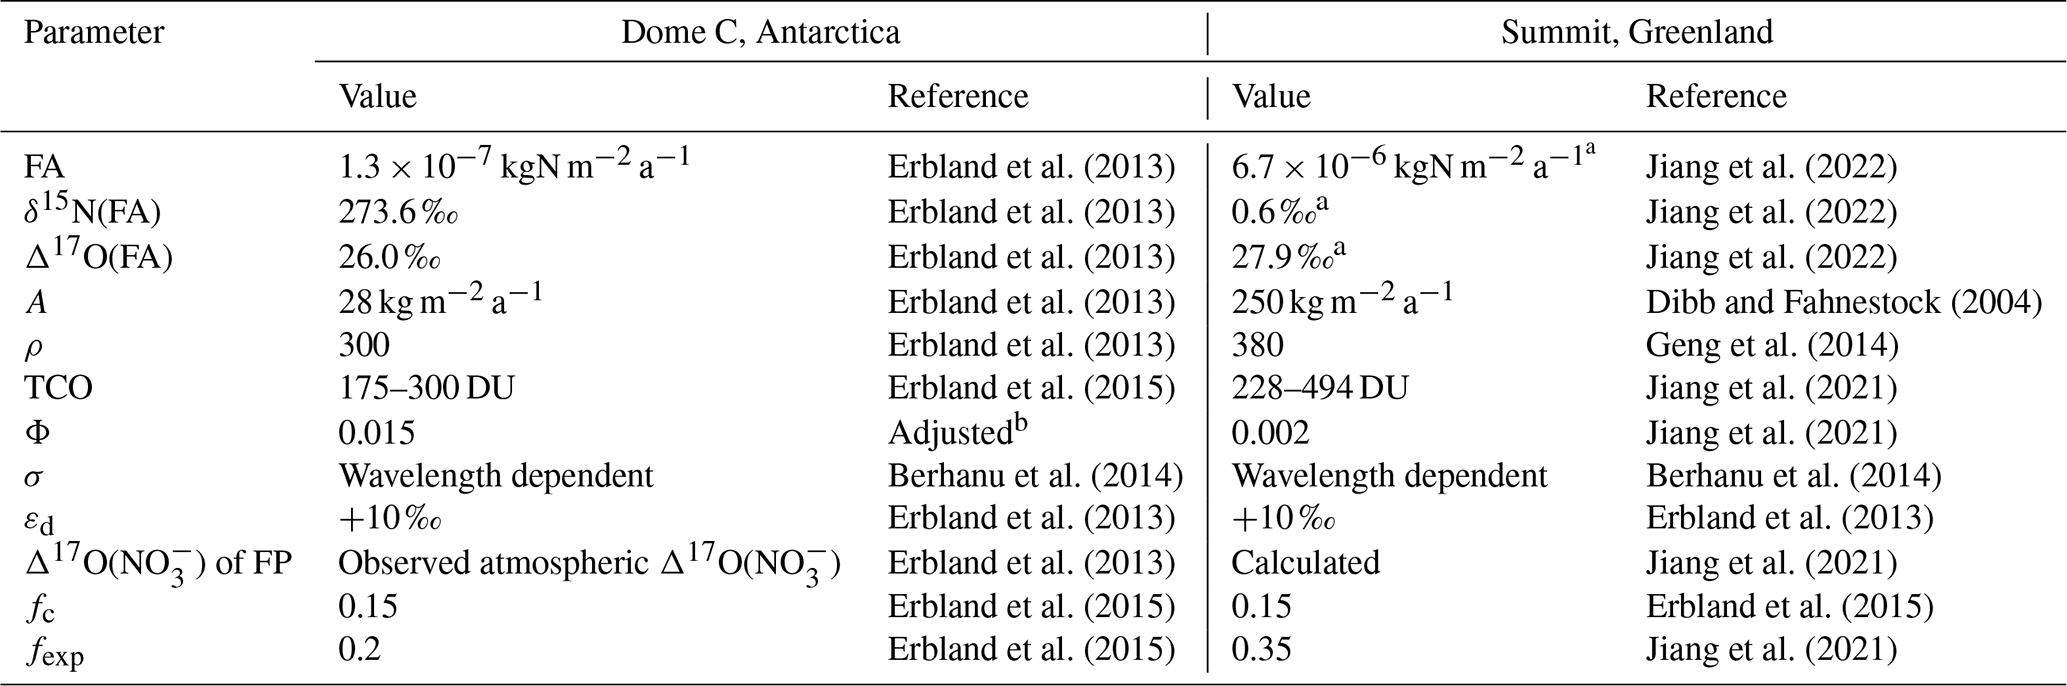
a Annual average value: the weekly resolution data were adopted from Jiang et al. (2022). b Adjusted according to the best fit of snowpack nitrate δ15N profile at Dome C (Appendix C).
3.1 Summit, Greenland
Summit, Greenland, is a typical site with high snow accumulation rate (250 kg m−2 a−1; Dibb and Fahnestock, 2004) at present, and weekly resolved snow accumulation data exists (Burkhart et al., 2004), allowing for the precise dating of the snowpack nitrate profile (Jiang et al., 2022). The snowpack nitrate concentration and isotope data with weekly resolution at Summit compiled in Jiang et al. (2022) were used as initial model input values to represent the archived snow nitrate signals.
3.2 Dome C, Antarctica
The present snow accumulation rate at Dome C, Antarctica, is extremely low (28 kg m−2 a−1, Erbland et al., 2013), and it is currently impossible to discern seasonal or sub-seasonal nitrate patterns owing to the limited resolution of snowpack measurements. Erbland et al. (2013) reported five snowpack nitrate depth profiles at Dome C that extended just below the photic zone. To predict the final archived nitrate concentration and isotopes, Erbland et al. (2013) fitted these depth profiles with an exponential function, and the obtained asymptotic values were regarded as the final preserved nitrate signal. The average asymptotic values for the five snowpacks were (21.2 ± 18.1) ng g−1, (273.6 ± 64.0) ‰, and (26.0 ± 1.9) ‰ for nitrate concentration, δ15N and Δ17O, respectively. These values were used as the annual averages of the preserved nitrate at Dome C in this study.
We note the seasonality of the archived nitrate concentration is important because it determines the magnitude of FP and FD at each time step in the model. In simulations of Dome C, we designed three cases with different weekly concentration distributions in a year. In case 1, the weekly nitrate concentrations were assumed to be uniform throughout a year. In case 2, the weekly archival nitrate concentrations were assumed to be a Gaussian-type distribution to match the observed seasonality in skin layer nitrate concentrations at Dome C (Erbland et al., 2013):
In Eq. (20), ca represents the annual average snow nitrate concentration, n represents the week number (1 to 52, here week 1 is defined as the first week in January for the Northern Hemisphere sites or the first week in July for the Southern Hemisphere sites), and the shape parameters (a, b, σ) were determined by the best fit of skin layer nitrate concentrations (Appendix D). n0 represents the week when nitrate concentration peaks in a year and was set to be 26 according to the observed maximum nitrate concentrations in the skin layer in local midsummer (Erbland et al., 2013). However, since nitrate deposited in different weeks of a year would have experienced different amounts of total actinic flux and nitrate deposited in autumn undergoes minimal degree of photolysis (Jiang et al., 2022), it is likely that the summer peak would shift toward autumn by final preservation. As such, we also prescribed a “shifted peak” distribution in case 3, and in this case n0 was set equal to 35 in Eq. (20), while other parameters were the same as in case 2.
To determine the uncertainties in the model results caused by these artificially assumed nitrate profiles, we applied a Monte Carlo method; i.e., the exact initial value in snow at each week was set arbitrarily as follows:
where ca represents the prescribed initial value of annual-mean snow nitrate concentration in each case as described above, U represents a uniformly distributed random variable, and σ represents the standard error of the observed ca. The obtained time series with random error was normalized again as final model inputs. All three cases were repeated 1000 times, and the model results were used to evaluate the uncertainties.
For isotopic ratios (δ15N and Δ17O) of the archived nitrate, their seasonality was omitted in this study to simplify the model calculations, and for the results at Dome C we only compared the modeled results with observations at annual scale given the unknown seasonal inputs of these parameters. Note that reconstruction of atmospheric signals of δ15N and Δ17O from ice-core records usually use a coarser resolution than sub-annual variations, justifying our annual averaging approach.
4.1 Model results at Summit, Greenland
4.1.1 Comparison of local atmospheric variations
Currently there are no skin layer observations at Summit, so we used the monthly atmospheric nitrate isotopic data from aerosol observations at Summit reported by Jiang et al. (2022) to compare with the modeled atmospheric nitrate isotopic variations. To reduce the uncertainty of model results owing to uncertainties associated with the weekly dating of snowpack, we only compared the modeled monthly averages with observations, and the uncertainties of the monthly model results were calculated as 1 standard error of the mean of results from different weeks. As shown in Fig. 3, the modeled seasonality in atmospheric Δ17O(NO) generally agrees well with the observed seasonal variations, while for δ15N(NO), the model predicted a similar seasonality as the observations, though in the winter half year the model underestimated the absolute values in comparison with the observations. In addition, the modeled and observed atmospheric Δ17O(NO) are both close to snowpack Δ17O(NO). This is as expected at Summit since the deposition of atmospheric nitrate is assumed to be a mass-dependent process. The only process that can alter Δ17O(NO) in snow is the cage effect (McCabe et al., 2005), which is negligible under present Summit conditions. The inverse model calculated a small cage effect of 0.15 ‰ on Δ17O(NO) by comparing the annual weighted average of FA and FD, which is close to the value of 0.19 ‰ predicted by the TRANSITS model (Jiang et al., 2021). At an annual scale, the modeled and observed average atmospheric δ15N(NO) are ‰ and −14.8 ± 7.3 ‰, while for Δ17O(NO) the values are 28.8 ± 2.6 ‰ and 28.6 ± 3.2 ‰ respectively, suggesting that the inverse model reproduced the atmospheric observations quite well.
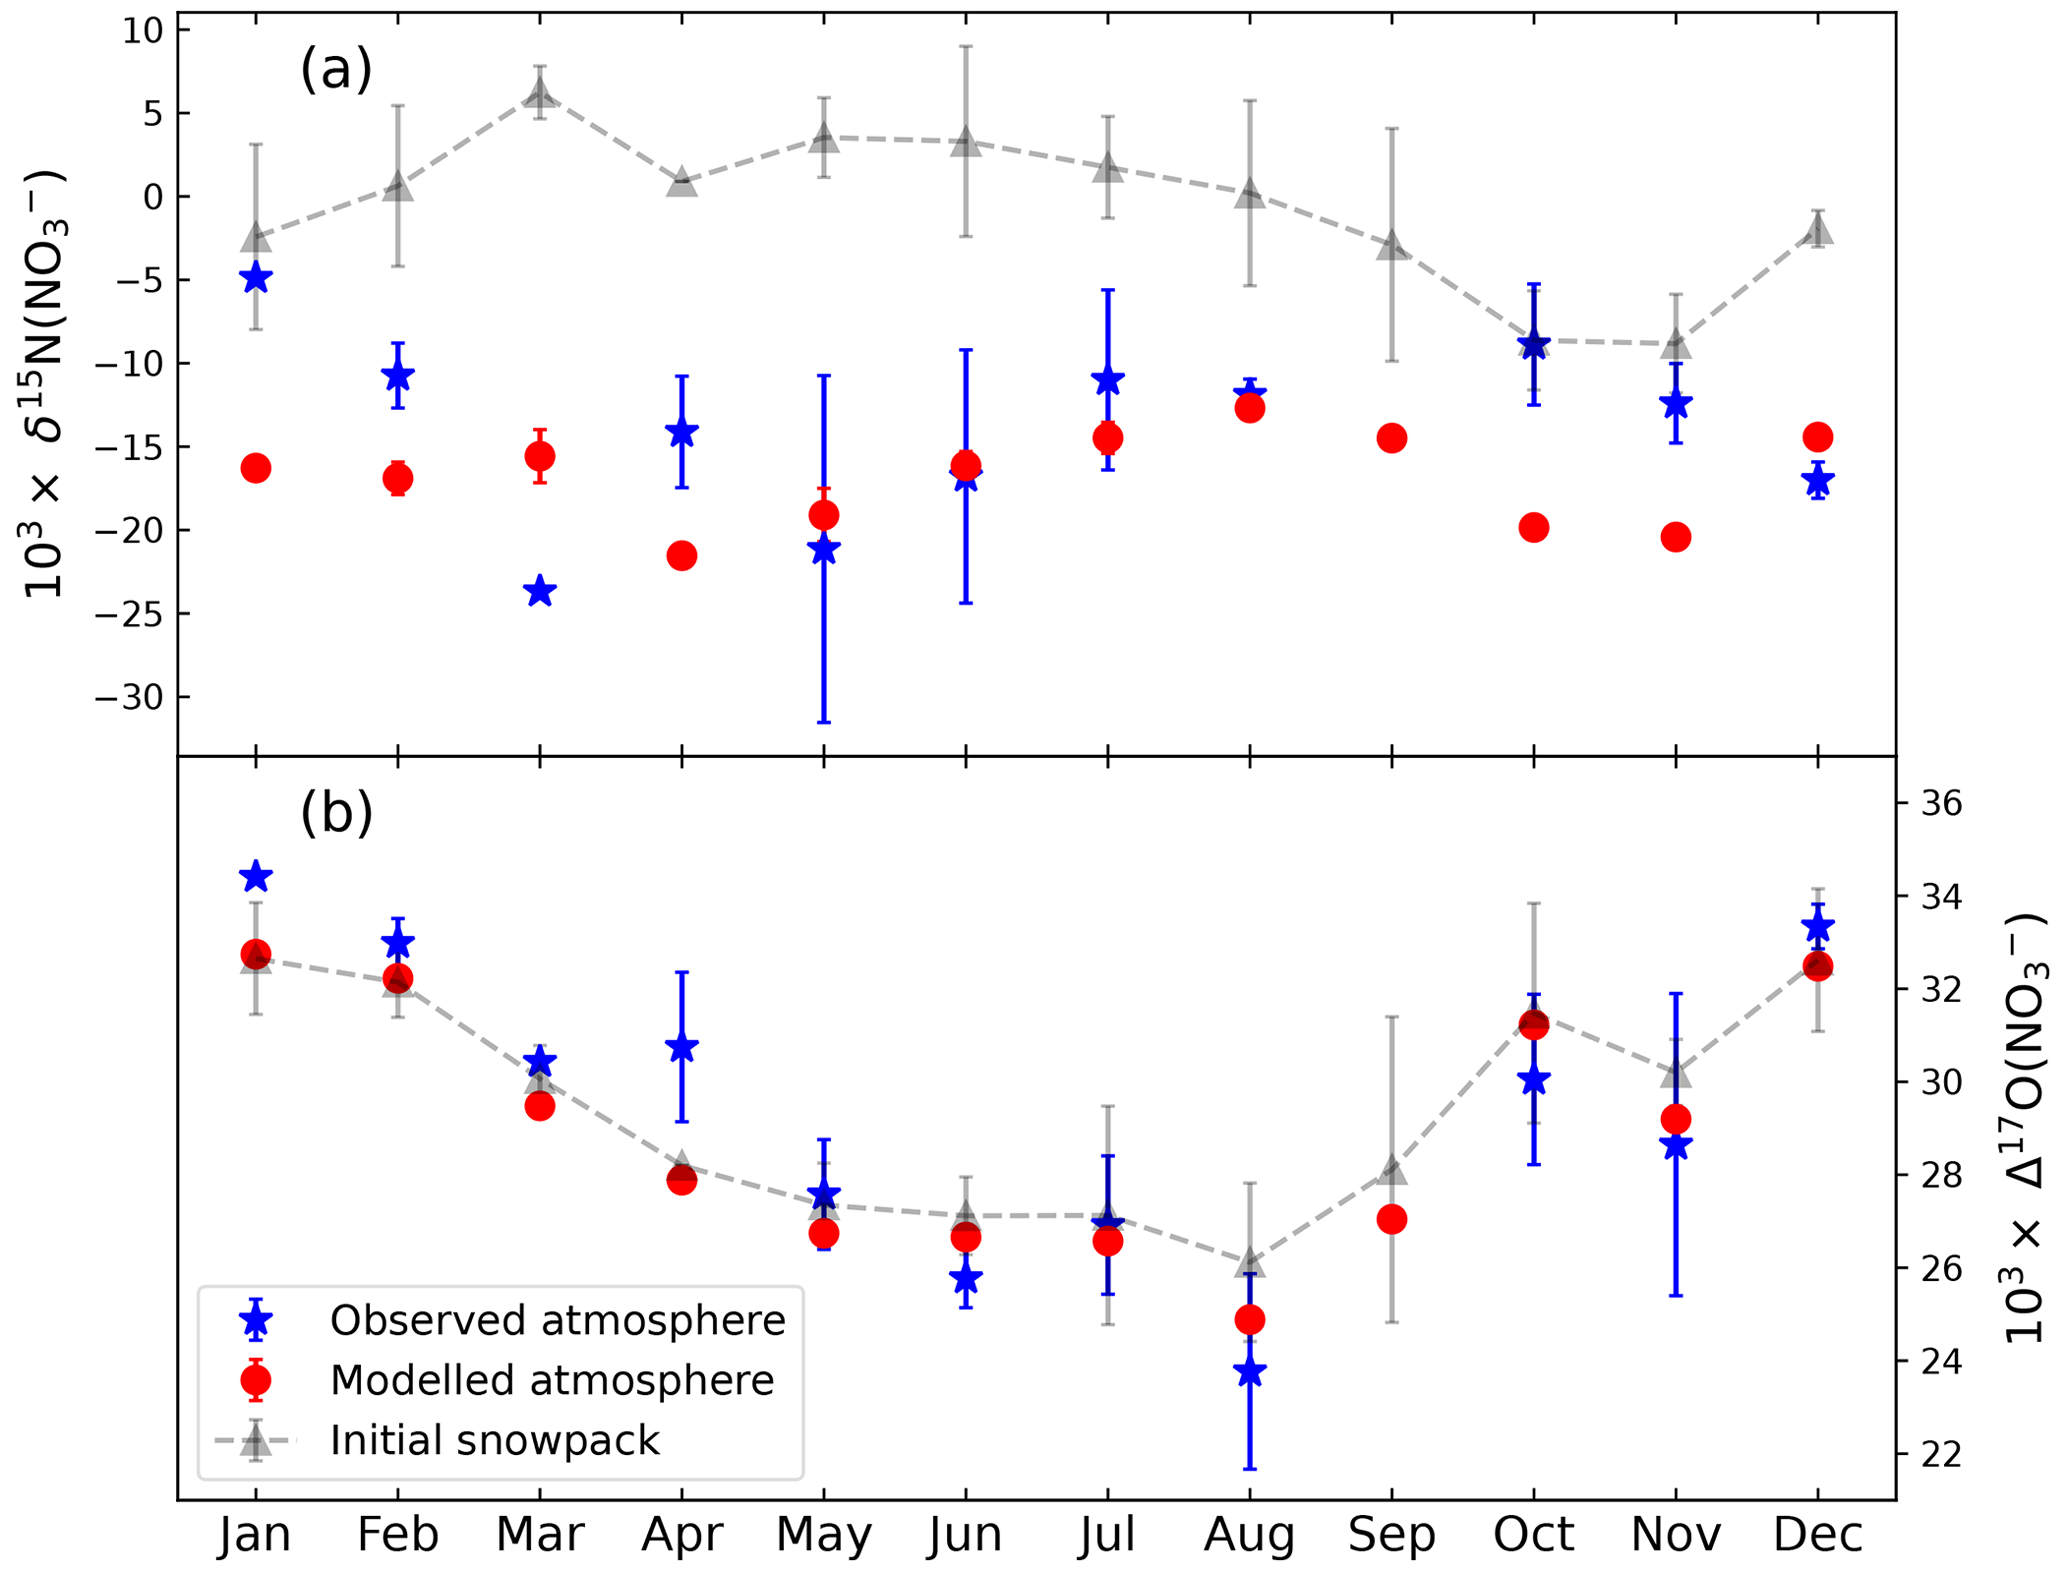
Figure 3Comparison between the modeled (red dots) and observed (blue stars) seasonal variations in atmospheric nitrate (a) δ15N and (b) Δ17O at Summit, Greenland. The dashed line with gray triangle represents the snowpack measurements as model inputs (i.e., the monthly archived snow nitrate δ15N and Δ17O from snowpack observations) (Jiang et al., 2022). The atmospheric observations were from Jiang et al. (2022).
For δ15N(NO), the modeled atmospheric δ15N(NO) seasonality is comparable to the observations, but the absolute values display some discrepancies in autumn and winter. In particular, the modeled and observed average δ15N(NO) values in the summer half year (from March to August) are −17.6 ± 3.5 ‰ and −16.0 ± 7.8 ‰, respectively, while in the winter half-year they are −16.0 ± 7.8 ‰ and −12.0 ± 4.1 ‰, respectively. The model–observation difference in the winter half year may be related to the model setup of a constant εd of +10 ‰. As discussed by Jiang et al. (2022), the partition between nitrate deposition mechanisms (i.e., wet vs. dry deposition) may result in seasonally different air–snow transfer functions for δ15N(NO). It has been observed that δ15N(NO) of dry deposition is generally higher than wet deposition (Beyn et al., 2014; Heaton, 1987). This implies that dry deposition likely possesses a larger εd, perhaps because wet deposition can scavenge all or most of atmospheric nitrate, leading to small to no isotope fractionation. Given the potential seasonal changes in the relative fraction of dry versus wet deposition at Summit, using a constant εd in the model would likely cause discrepancies in one season but not in the other. Some observations at Summit indicate that snowfall activities are more frequent and severe in summer months (June–September) than in winter (Castellani et al., 2015; Bennartz et al., 2019), which implies that dry deposition of atmospheric nitrate is more important in winter instead of summer. Thus, the model–observation discrepancies in the winter half year cannot be explained by the seasonal shift in the ratio between wet and dry deposition, as more dry deposition may result in a larger isotope effect in winter.
Alternatively, we note the εd itself may have a seasonality which could be caused by the temperature dependence of nitrate absorption onto ice grains (Abbatt, 1997) or be influenced by other mechanisms such as the stability of the boundary layer. In fact, observations at Dome C indicated the averaged enrichment in skin layer δ15N(NO) related to atmospheric δ15N(NO) is +25 ‰ in summer, while in winter the value is +10 ‰ (Erbland et al., 2013). This may indicate a larger εd in summer than in winter, though the summer skin layer δ15N(NO) is probably more or less influenced by photolysis which tends to increase δ15N(NO). However, in the inverse model, εd was set as +10 ‰ throughout the year for Summit (note this value is consistent with the observed difference between surface snow and local atmospheric δ15N(NO) at Summit in May and June; Fibiger et al., 2016). If at Summit the εd in winter is lower than that in summer, the modeled average δ15N(NO in the winter half year would have been underestimated. This at least explains in part the model–observation discrepancies in winter half year δ15N(NO). Future work on the degree of nitrogen isotope fractionation during atmospheric nitrate deposition and the causal factors is necessary to further investigate this issue.
4.1.2 Flux and isotopes of primary nitrate
The major function of the inverse model is to reconstruct the primary nitrate flux and its isotopes by using ice-core nitrate records. Primary nitrate flux is closely associated with atmospheric nitrate on the regional scale and could be further linked to the atmospheric abundance of its precursor NOx. The isotopic composition of Fpri could provide extra information. For example, the δ15N of Fpri may be used to infer the variations in NOx source emissions if other factors influencing isotope fractionation during the atmospheric conversion of NOx to nitrate can be constrained. The Δ17O of Fpri depends on the relative concentration of major atmospheric oxidations such as O3 and HO2/RO2 radicals and thus could be used to reflect regional atmospheric oxidation environment (Geng et al., 2017; Sofen et al., 2014).
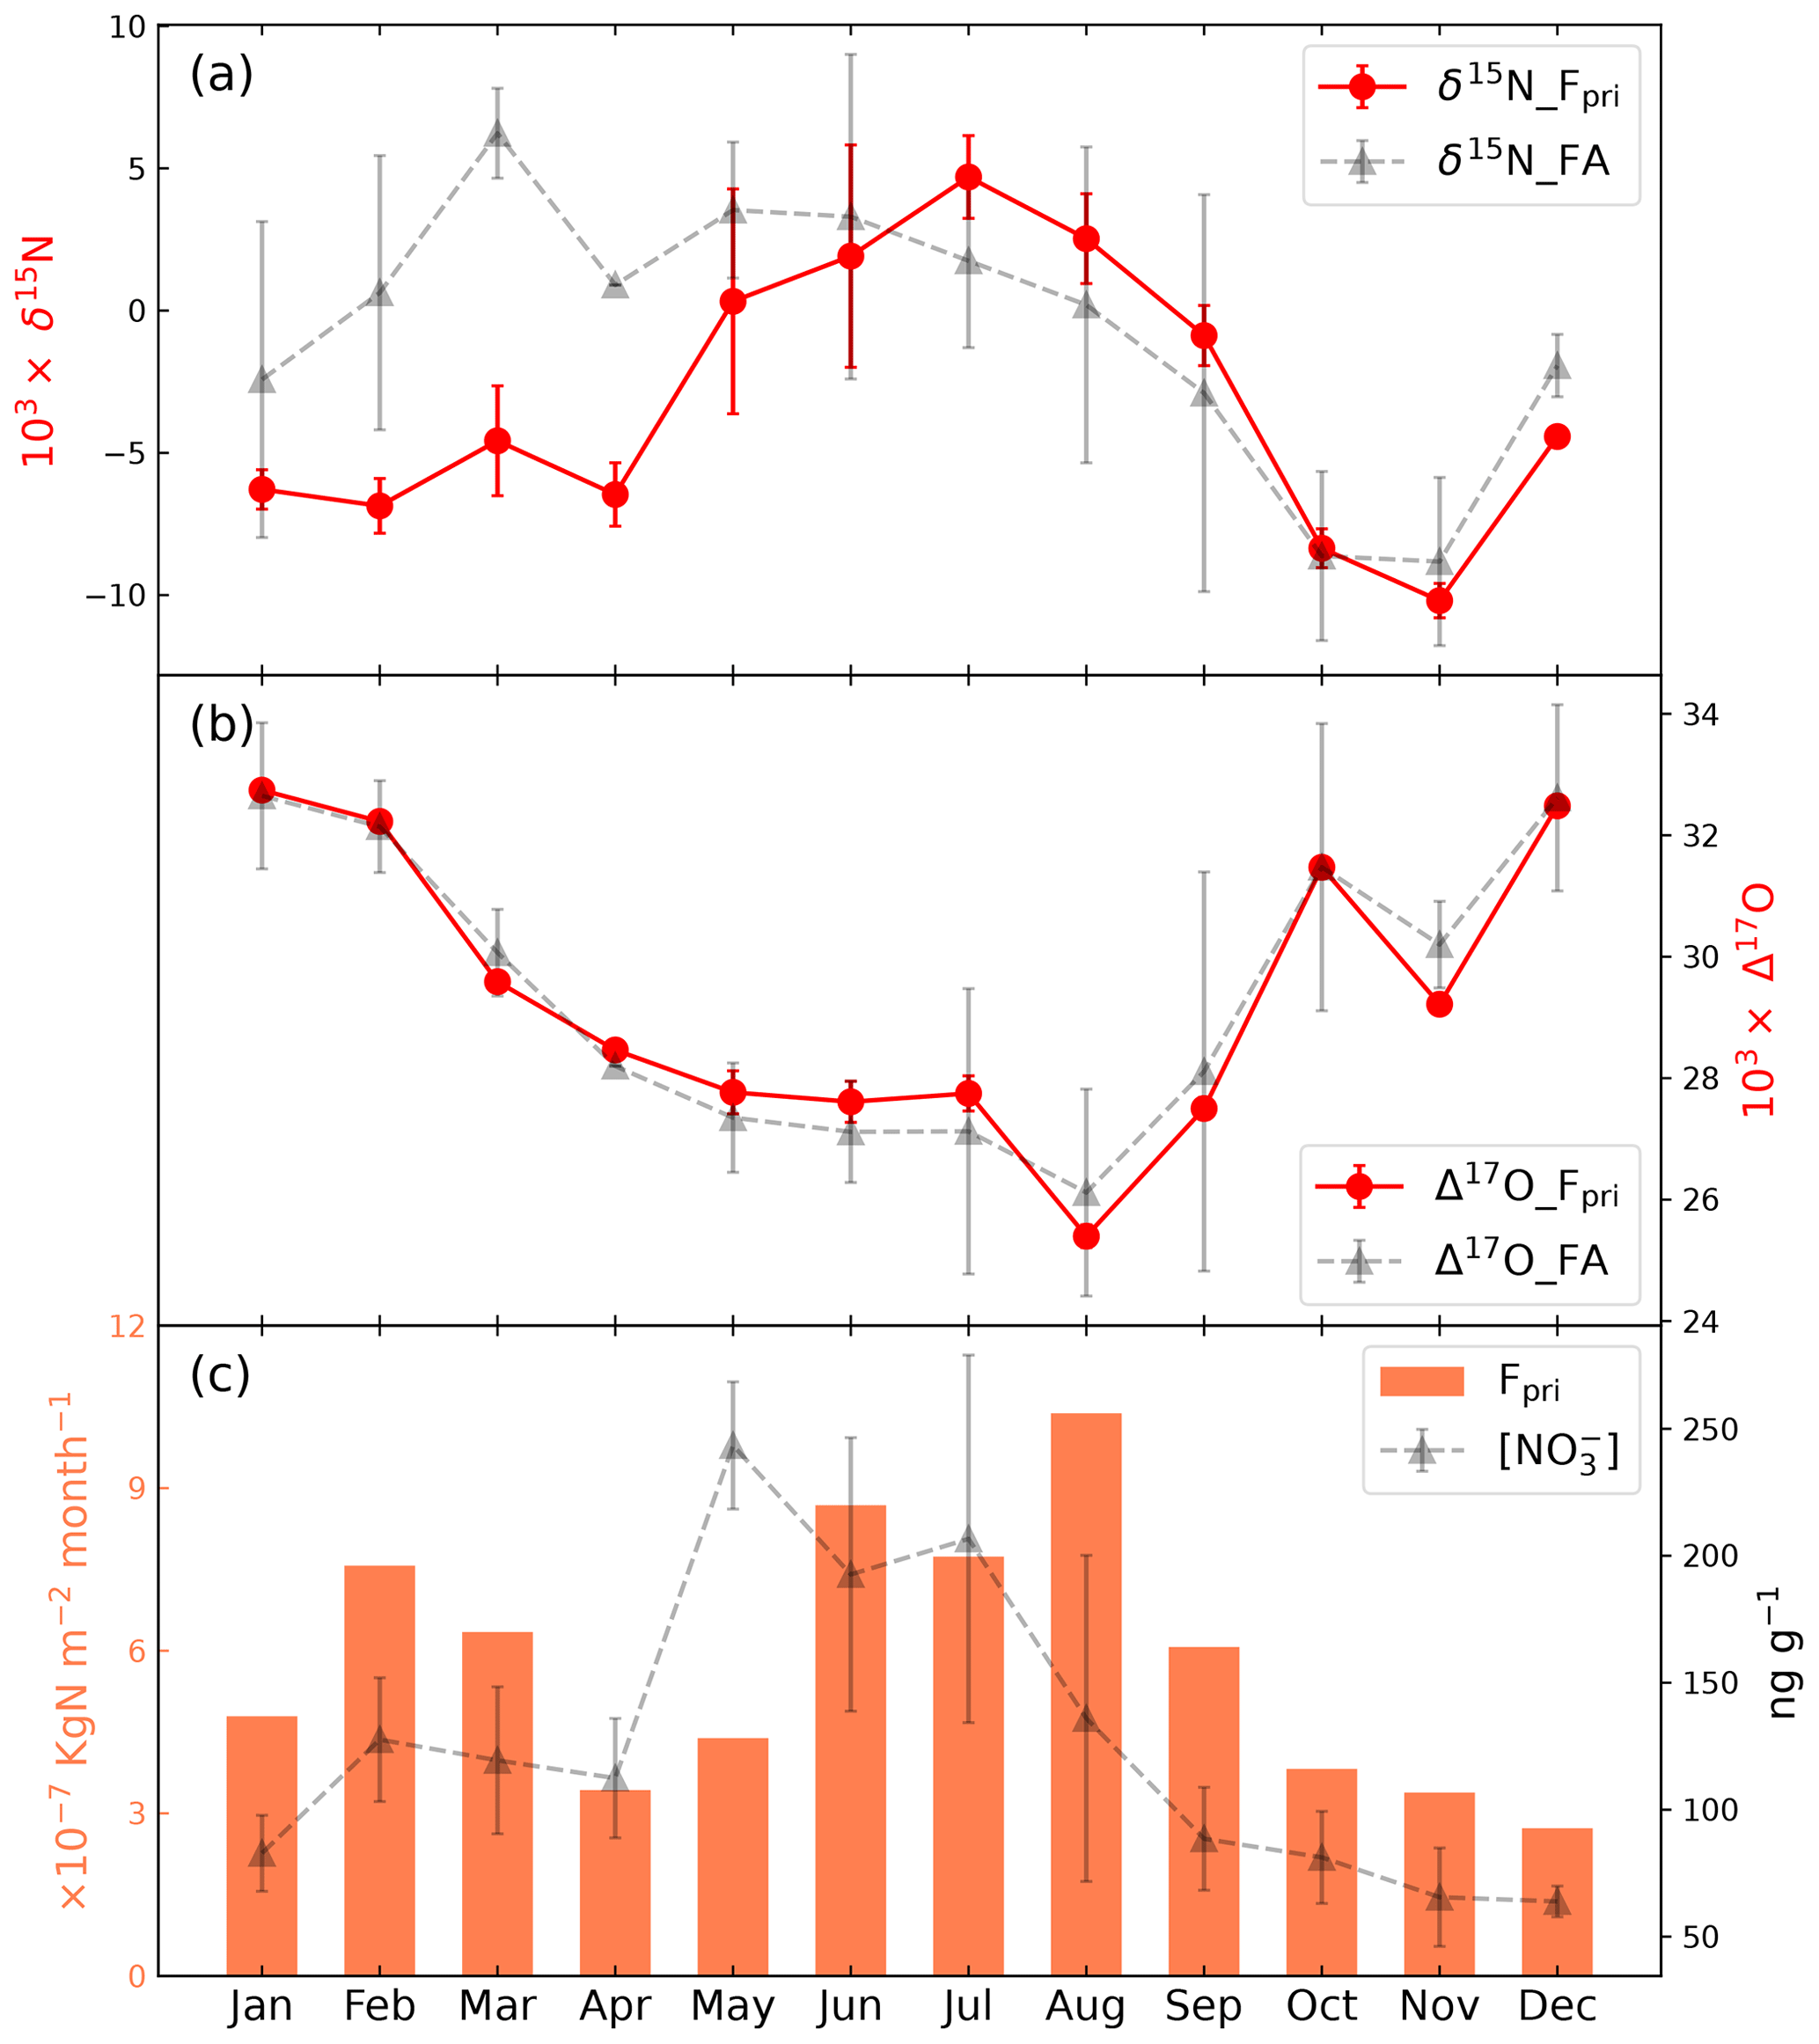
Figure 4The modeled monthly (a) δ15N, (b) Δ17O, and (c) fluxes of primary nitrate (Fpri) to Summit, Greenland. The concentration, δ15N, and Δ17O values of the archived snow nitrate as model inputs are also shown for comparison (gray triangle with dashed line).
The model-calculated seasonal variations in Fpri to Summit are shown in Fig. 4. The annual flux of primary nitrate was calculated to be 6.96 × 10⁻⁶ kgN m2 a−1, which is in the same range (≈ 2–3 × 10⁻⁶ kgN m2 a−1) as model results from Zatko et al. (2016) using the GEOS-Chem model and is about 2 orders of magnitude lower than the atmospheric nitrate deposition flux in the mid-latitude area (Gao et al., 2019; Zhang et al., 2012). The seasonality of Fpri displays a bimodal mode with a major summer peak and a secondary peak in late winter/early spring, in contrast the preserved snowpack nitrate concentration which peaks in spring/summer. The maximum Fpri in summer could be caused by the enhanced temperature-dependent precursor NOx emissions such as from soil microbes (Pilegaard et al., 2006) as well as the more active photochemistry in summer, both of which would promote more efficient atmospheric nitrate production. It is interesting that the secondary Fpri peak in early spring is coincident with the timing of the spring Arctic haze phenomenon (Quinn et al., 2007), as well as the occasional spring nitrate concentration peak in snowpack and ice cores at Summit (Geng et al., 2014), though the exact timing of the seasonal peaks needs further investigation.
The modeled Δ17O of Fpri is close to the measurements in the snowpack with minimum values in summer, suggesting the Δ17O signal of primary nitrate is well preserved under current Summit conditions. The seasonal variations in Δ17O of Fpri can be understood in terms of the different production mechanisms of atmospheric nitrate (Alexander et al., 2020). In summer, ample solar radiation enhances the photochemical production of HNO3 from the NO2 + OH pathway, the Δ17O of which is lowest compared with other nitrate formation pathways. While in winter, the dominant N2O5 hydrolysis pathway produces nitrate with high Δ17O. Such seasonal patterns have been widely observed globally as summarized in Alexander et al. (2020).
The modeled δ15N of Fpri ranges from −10.3 ‰ to 5.0 ‰, which falls well within the reported atmospheric δ15N(NO) values in continental and marine boundary layer in both hemispheres in regions not impacted by snowpack emission (Li et al., 2022; Lim et al., 2022; Morin et al., 2009; Shi et al., 2021). However, the seasonal pattern of δ15N of Fpri, which displays a summer maximum, is opposite to the typical seasonal pattern of atmospheric δ15N(NO) found in mid-latitude continental areas, where higher δ15N(NO) values in winter and lower δ15N(NO) values in summer are widely observed (e.g., Beyn et al., 2014; Freyer, 1991; Fang et al., 2021; Lim et al., 2022; Esquivel Hernández et al., 2023). This summer high and winter low δ15N(NO) in Fpri is instead consistent with the observations at two Arctic coastal sites (Morin et al., 2012, 2008), where the summer high atmospheric δ15N(NO) is strongly correlated with air temperature. Morin et al. (2008) suggest the δ15N(NO)–temperature relationship observed at the Arctic coastal sites may be related to physicochemical transformations of nitrate in the Arctic and during the transport of nitrate and reactive nitrogen from the mid-latitudes, though the specific mechanism is unknown.
Another possibility to explain the higher modeled summer δ15N(NO) in Fpri is that there may be more anthropogenic nitrate transported from mid-latitudes to Greenland in summer than in winter. Fpri is comprised of nitrate originating from the mid-latitudes as well as nitrate formed in the Arctic region. Morin et al. (2009) suggested that air parcels originating from regions with more anthropogenic impacts carries nitrate with higher δ15N, which was confirmed by subsequent studies (Li et al., 2022; Vicars and Savarino, 2014; Shi et al., 2021). The increased frequency of air sources originating from the North America in summer compared to winter (Kahl et al., 1997) could thus lead to more anthropogenic nitrate to Greenland in summer, resulting in higher summer δ15N of primary nitrate than winter.
The potential link between δ15N of Fpri and its precursor NOx emissions is not further discussed here, as recent studies have shown that the isotopic effect during NOx photo-recycling is complex (Li et al., 2020) and may dominate δ15N variations in atmospheric nitrate (Fang et al., 2021; Li et al., 2021). More comprehensive studies on the isotopic effects during atmospheric nitrate formation as well as the potential fractionation during transport are required to further link δ15N of Fpri with its precursors and/or source regions.
4.2 Model results at Dome C, Antarctica
4.2.1 Snowpack nitrate profile in the photic zone
Since Dome C snowpack exhibits very distinct trends in the concentration and isotopic ratio of nitrate in the photic zone, we first examine the modeled summer snowpack nitrate profile at Dome C in comparison with the previous observations (Erbland et al., 2013; Frey et al., 2009) in Fig. 5. The TRANSITS model results (Erbland et al., 2015) are also shown in Fig. 5 for comparison. Both models reproduce the observed decrease in nitrate concentration and the large enrichments in δ15N(NO) well. We note that the predicted surface snow nitrate concentration is higher than the observations by both models. This is because the modeled concentration represents the state that atmospheric nitrate has just deposited onto the snow surface, while the observed skin layer snow may have already undergone snow metamorphism and/or post-depositional processing (Winton et al., 2020). This is also supported by recent observations at Dome C that newly deposited diamond dust could possess nitrate concentrations up to 2000 ppb (Winton et al., 2020), within the range of model predictions.
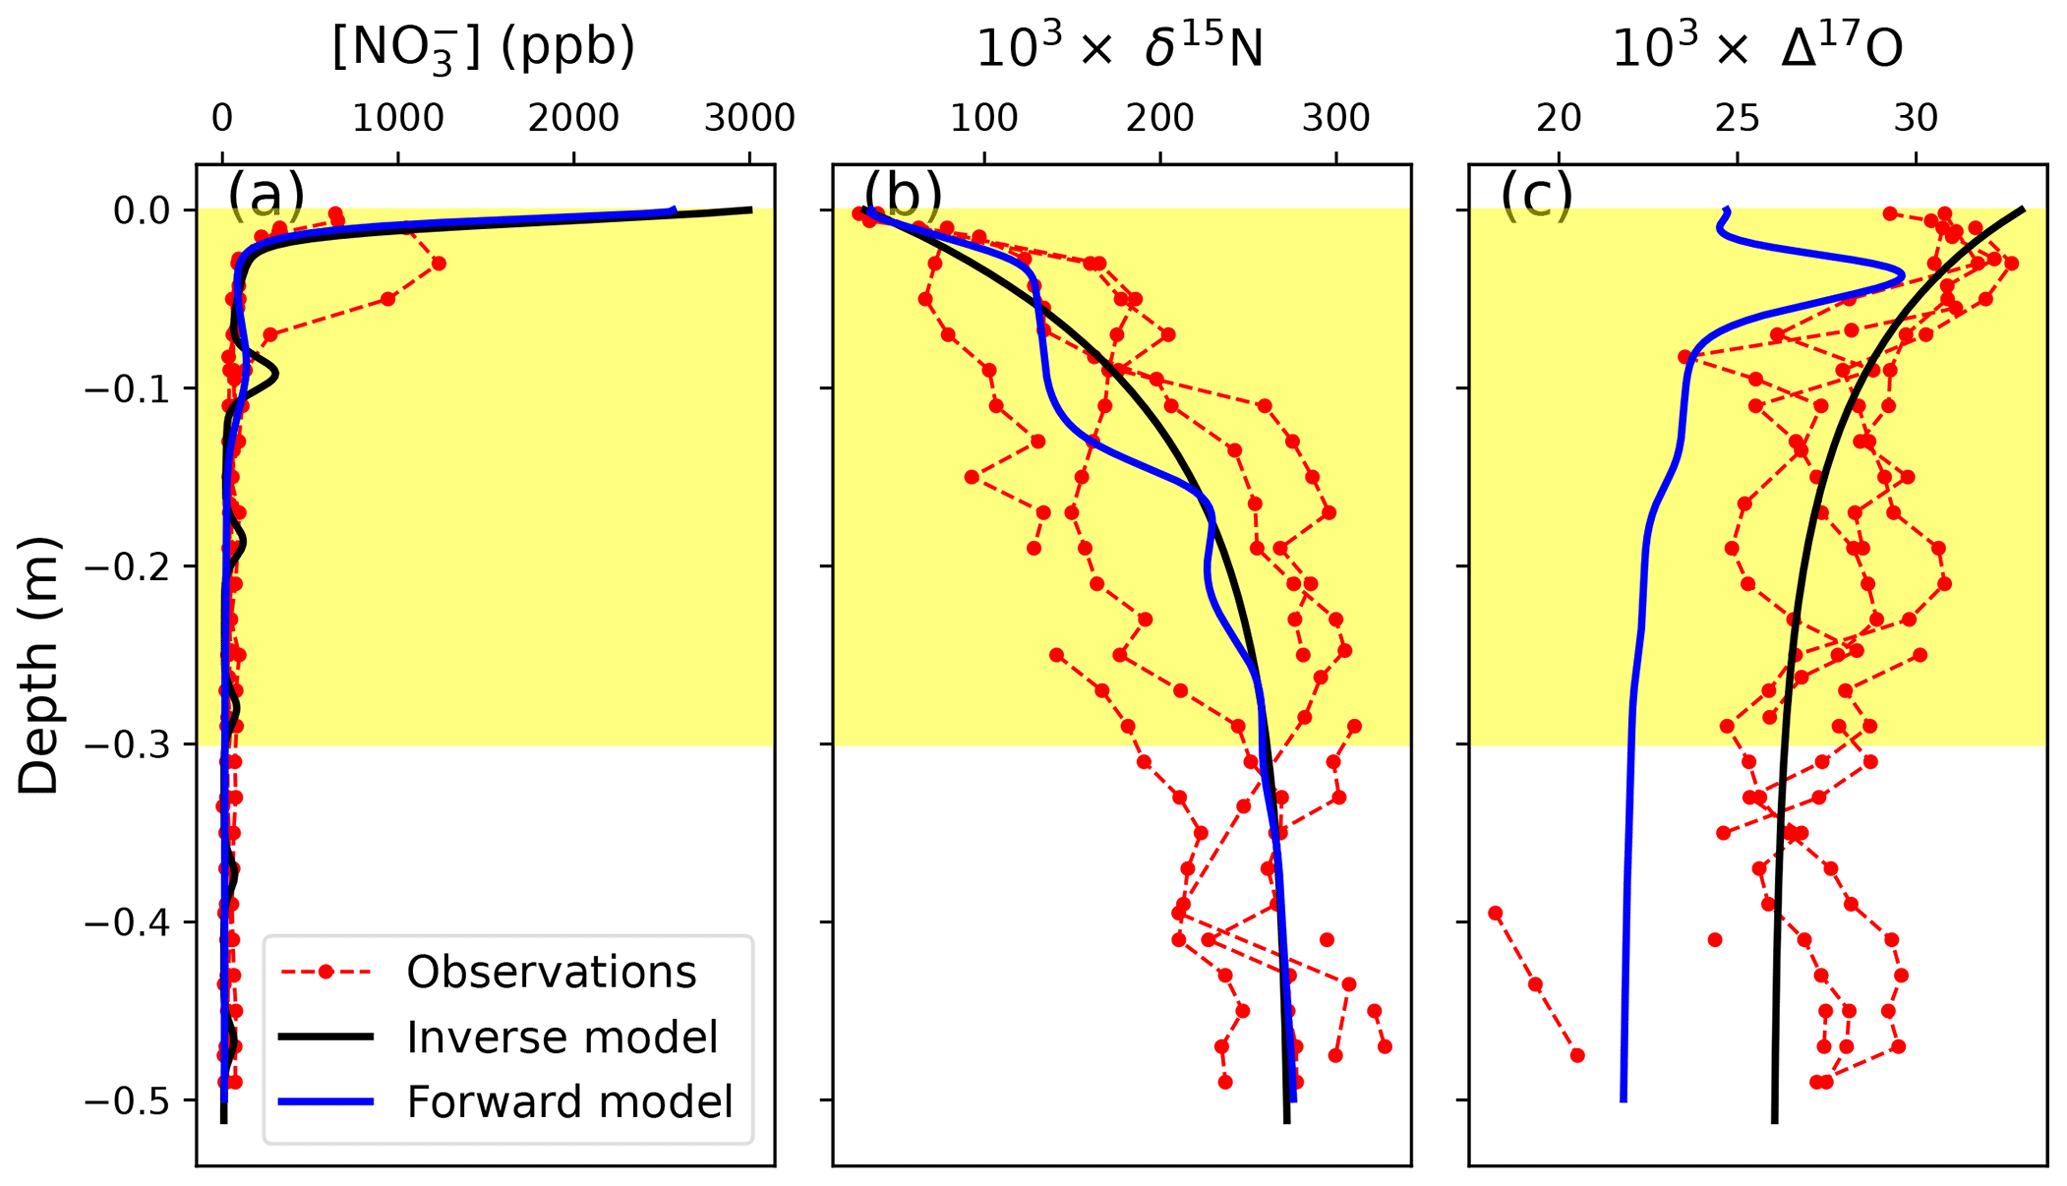
Figure 5Comparison between the observed and modeled snowpack nitrate concentrations, δ15N, and Δ17O at Dome C. The red lines with circles represent four observed snowpack nitrate profiles at Dome C from Erbland et al. (2013) and Frey et al. (2009), while the blue and black lines are modeled results from the forward model (i.e., the TRANSITS model) and the inverse model in this study, respectively. The yellow background represents the depth of the photic zone.
The decreasing trend in Δ17O(NO) within the photic zone is also reproduced by these two models, caused by the cage effect during nitrate photolysis. However, the TRANSITS model appears to underestimate snowpack Δ17O(NO), while the inverse model performs better in snowpack Δ17O(NO) simulation. This is because in the TRANSITS model, snow Δ17O(NO) is controlled by a combination of Δ17O(NO) of FD and the subsequent cage effect after deposition. At Dome C, Δ17O(NO) of FD is dominated by locally formed atmospheric nitrate (i.e., FP) (Erbland et al., 2015), which is in turn determined by the prescribed Δ17O transfer during NO–NO2 cycling and the subsequent OH oxidation of NO2 under sunlight conditions in the model. However, Savarino et al. (2016) demonstrated that the standard chemistry (i.e., exclusive oxidation of NO2 by OH in summer) and the associated isotopic mass balance applied to Δ17O (i.e., the one used by the direct model) does not hold in the Dome C atmosphere, with this standard approach systematically underestimating the observations. Our inverse model is in line with this conclusion. The inverse model calculates atmospheric Δ17O(NO) from the archived snow Δ17O(NO) by subtracting the cage effect but does not assume any specific chemical reaction in the atmospheric box, contrary to the forward model. Therefore, although the inverse model uses the same method as the TRANSITS model to calculate Δ17O(NO) of locally formed atmospheric nitrate (FP), it does not include any hypothesis of how local nitrate is formed. The good match between observations and inverse model output is a further demonstration that atmospheric Δ17O(NO) is not in agreement with the standard daylight chemistry of nitrate formation (i.e., NO2 + OH).
Overall, the consistency of the modeled and observed snowpack nitrate profiles suggests that the effect of post-depositional processing is properly represented by the inverse model. This confirms that the inverse model can properly reproduce snow nitrate concentrations and isotopes in the photic zone, which are intermediate statuses between archived and atmospheric nitrate.
4.2.2 Skin layer and atmospheric nitrate
Although the time step in the model was set to 1 week for Dome C, we mainly focus on the annual average values since the seasonal information of the archived nitrate profiles is unknown. We note that the modeled isotopic compositions of snowpack and skin layer nitrate are not affected by the prescribed nitrate concentration seasonality. This is because the total nitrate loss fraction and the induced isotopic effect only depend on the total amount of actinic flux received during snow burial. In the following discussion we only report and discuss the modeled isotopes of local atmospheric and skin layer nitrate from case 1; i.e., the archived snow nitrate concentration was assumed to be constant throughout the year.
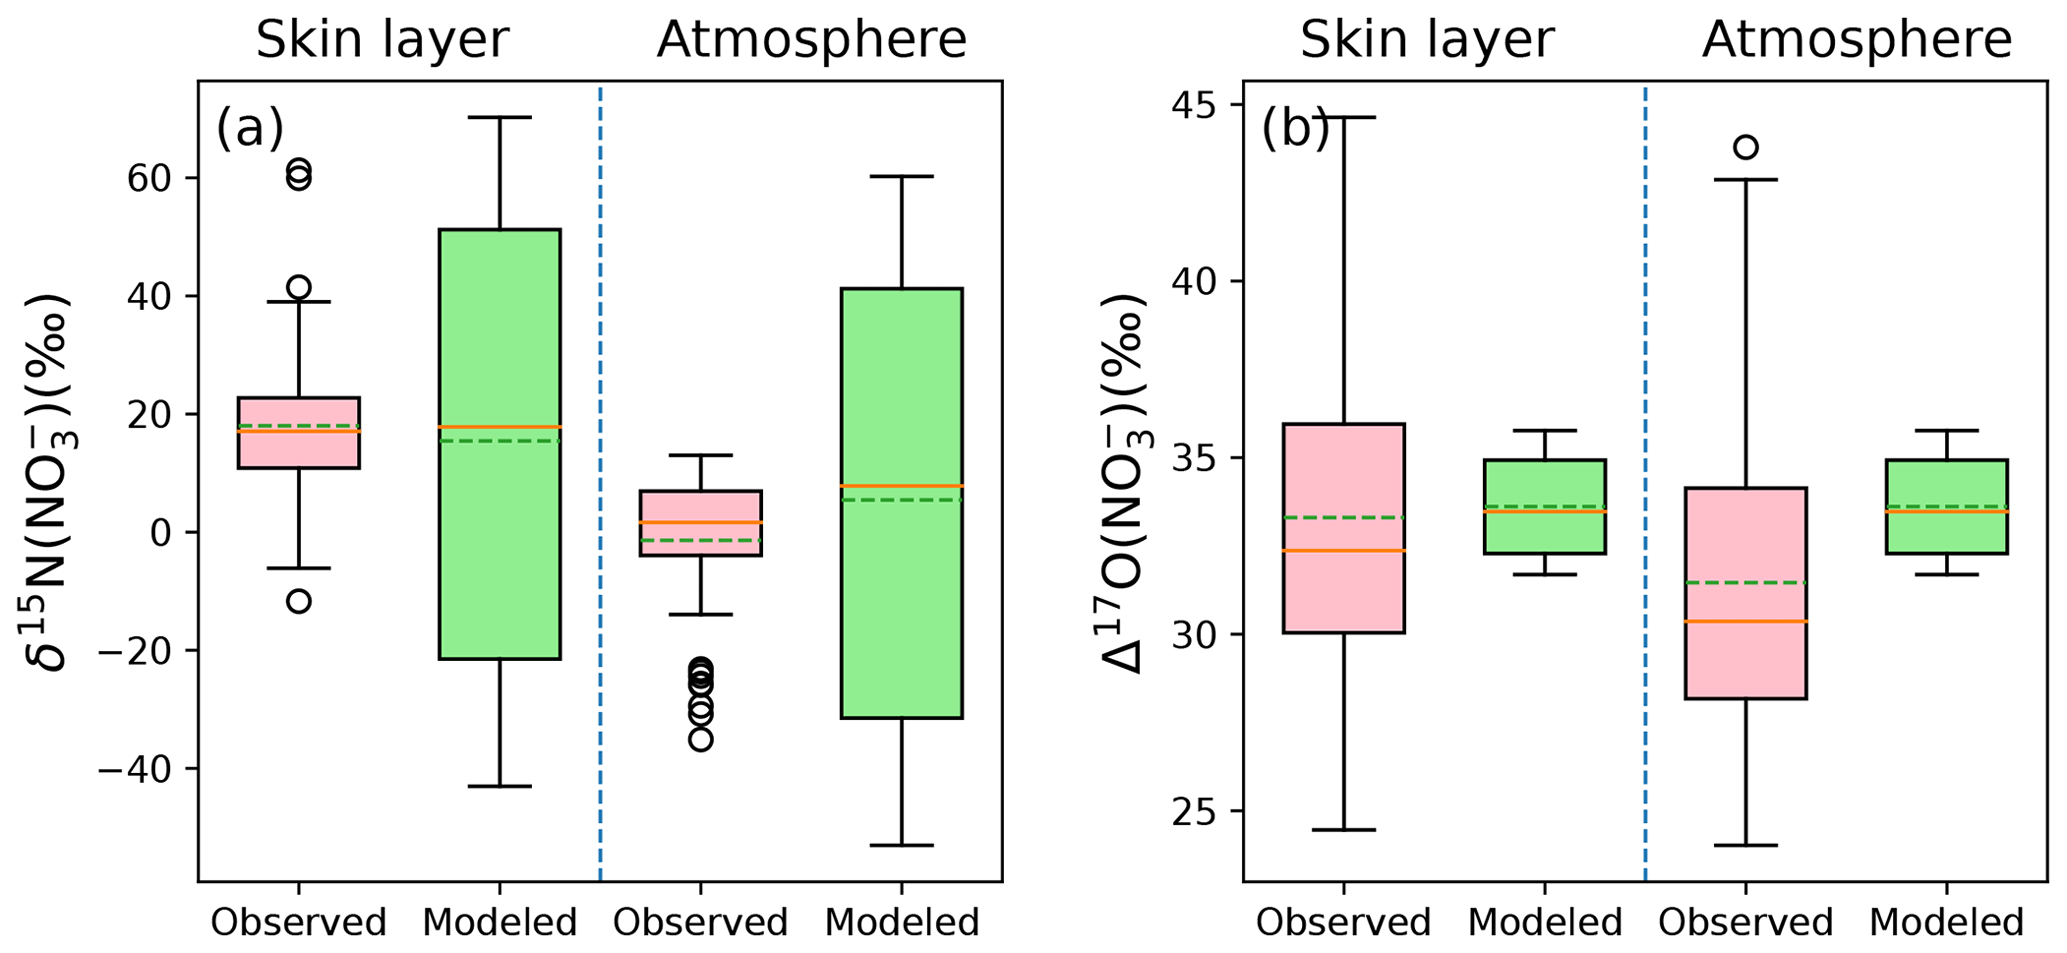
Figure 6Comparison between the observed and modeled annual averages of δ15N(NO) and Δ17O(NO) in the atmosphere and snow skin layer at Dome C. The solid line in the box plot indicates the median value, while the dash line represents the average value.
The observed annual average δ15N(NO) and Δ17O(NO) values in the skin layer at Dome C are 18.0 ± 11.7 ‰ and 33.6 ± 1.4 ‰, respectively (Erbland et al., 2013), while the modeled skin-layer values are 15.7 ± 38.6 ‰ and 33.3 ± 4.7 ‰, respectively, in good agreement with the observations. The observed annual average atmospheric δ15N(NO) and Δ17O(NO) values are −1.3 ± 11.6 ‰ and 31.4 ± 4.6 ‰, while the modeled values are 8.0 ± 11.7 ‰ and 33.6 ± 1.4 ‰, respectively. Note the average observed δ15N values in this study were calculated as arithmetic mean instead of mass-weighted mean reported in Erbland et al. (2013) since the inverse model cannot directly calculate the nitrate concentration in the atmosphere. Nevertheless, the modeled averages are similar to the observed averages except for atmospheric δ15N(NO). The difference between the modeled and observed atmospheric δ15N(NO) could be again related to the constant εd used in the model. As discussed earlier, in the model we followed Erbland et al. (2015) to set εd=10 ‰ throughout the year, while observations at Dome C indicate that εd could be as large as 25 ‰ in summer instead of 10 ‰ (Erbland et al., 2013). Hence the modeled atmospheric δ15N(NO) could be overestimated. This reinforces that it is necessary to further explore the isotope effects on δ15N(NO) during atmospheric nitrate deposition.
4.2.3 Flux and isotopes of primary nitrate
In Fig. 7, the flux of primary nitrate (Fpri) and its mean isotopes from the three difference cases (i.e., different nitrate concentration seasonality in archived snow) are displayed. Similar to the previous section, we only focus on their annual means. Note when calculating Δ17O(NO) of Fpri, Δ17O values of locally formed nitrate are necessary. As discussed in Sect. 4.2.1, following the method in the TRANSITS model to calculate Δ17O(NO) of locally formed atmospheric nitrate would underestimate Δ17O(NO) of FP at Dome C. This is especially evident in summer when the snow sourced nitrate (i.e., FP) dominates the atmospheric nitrate budget, and the calculated Δ17O(NO) of FP by the TRANSITS model is about 6 ‰ lower than observed atmospheric Δ17O(NO) (Erbland et al., 2015). Thus, in the inverse model, when calculating Δ17O(NO) of Fpri at Dome C, Δ17O(NO) of FP was not calculated using the model default method as in the TRANSITS but prescribed as the observed atmospheric summer Δ17O(NO). Otherwise, the modeled Δ17O(NO) of Fpri would be higher than 70 ‰, which is highly unrealistic. Note that this is not an issue at Summit, Greenland, because FP does not dominate the atmospheric nitrate budget in summer there.
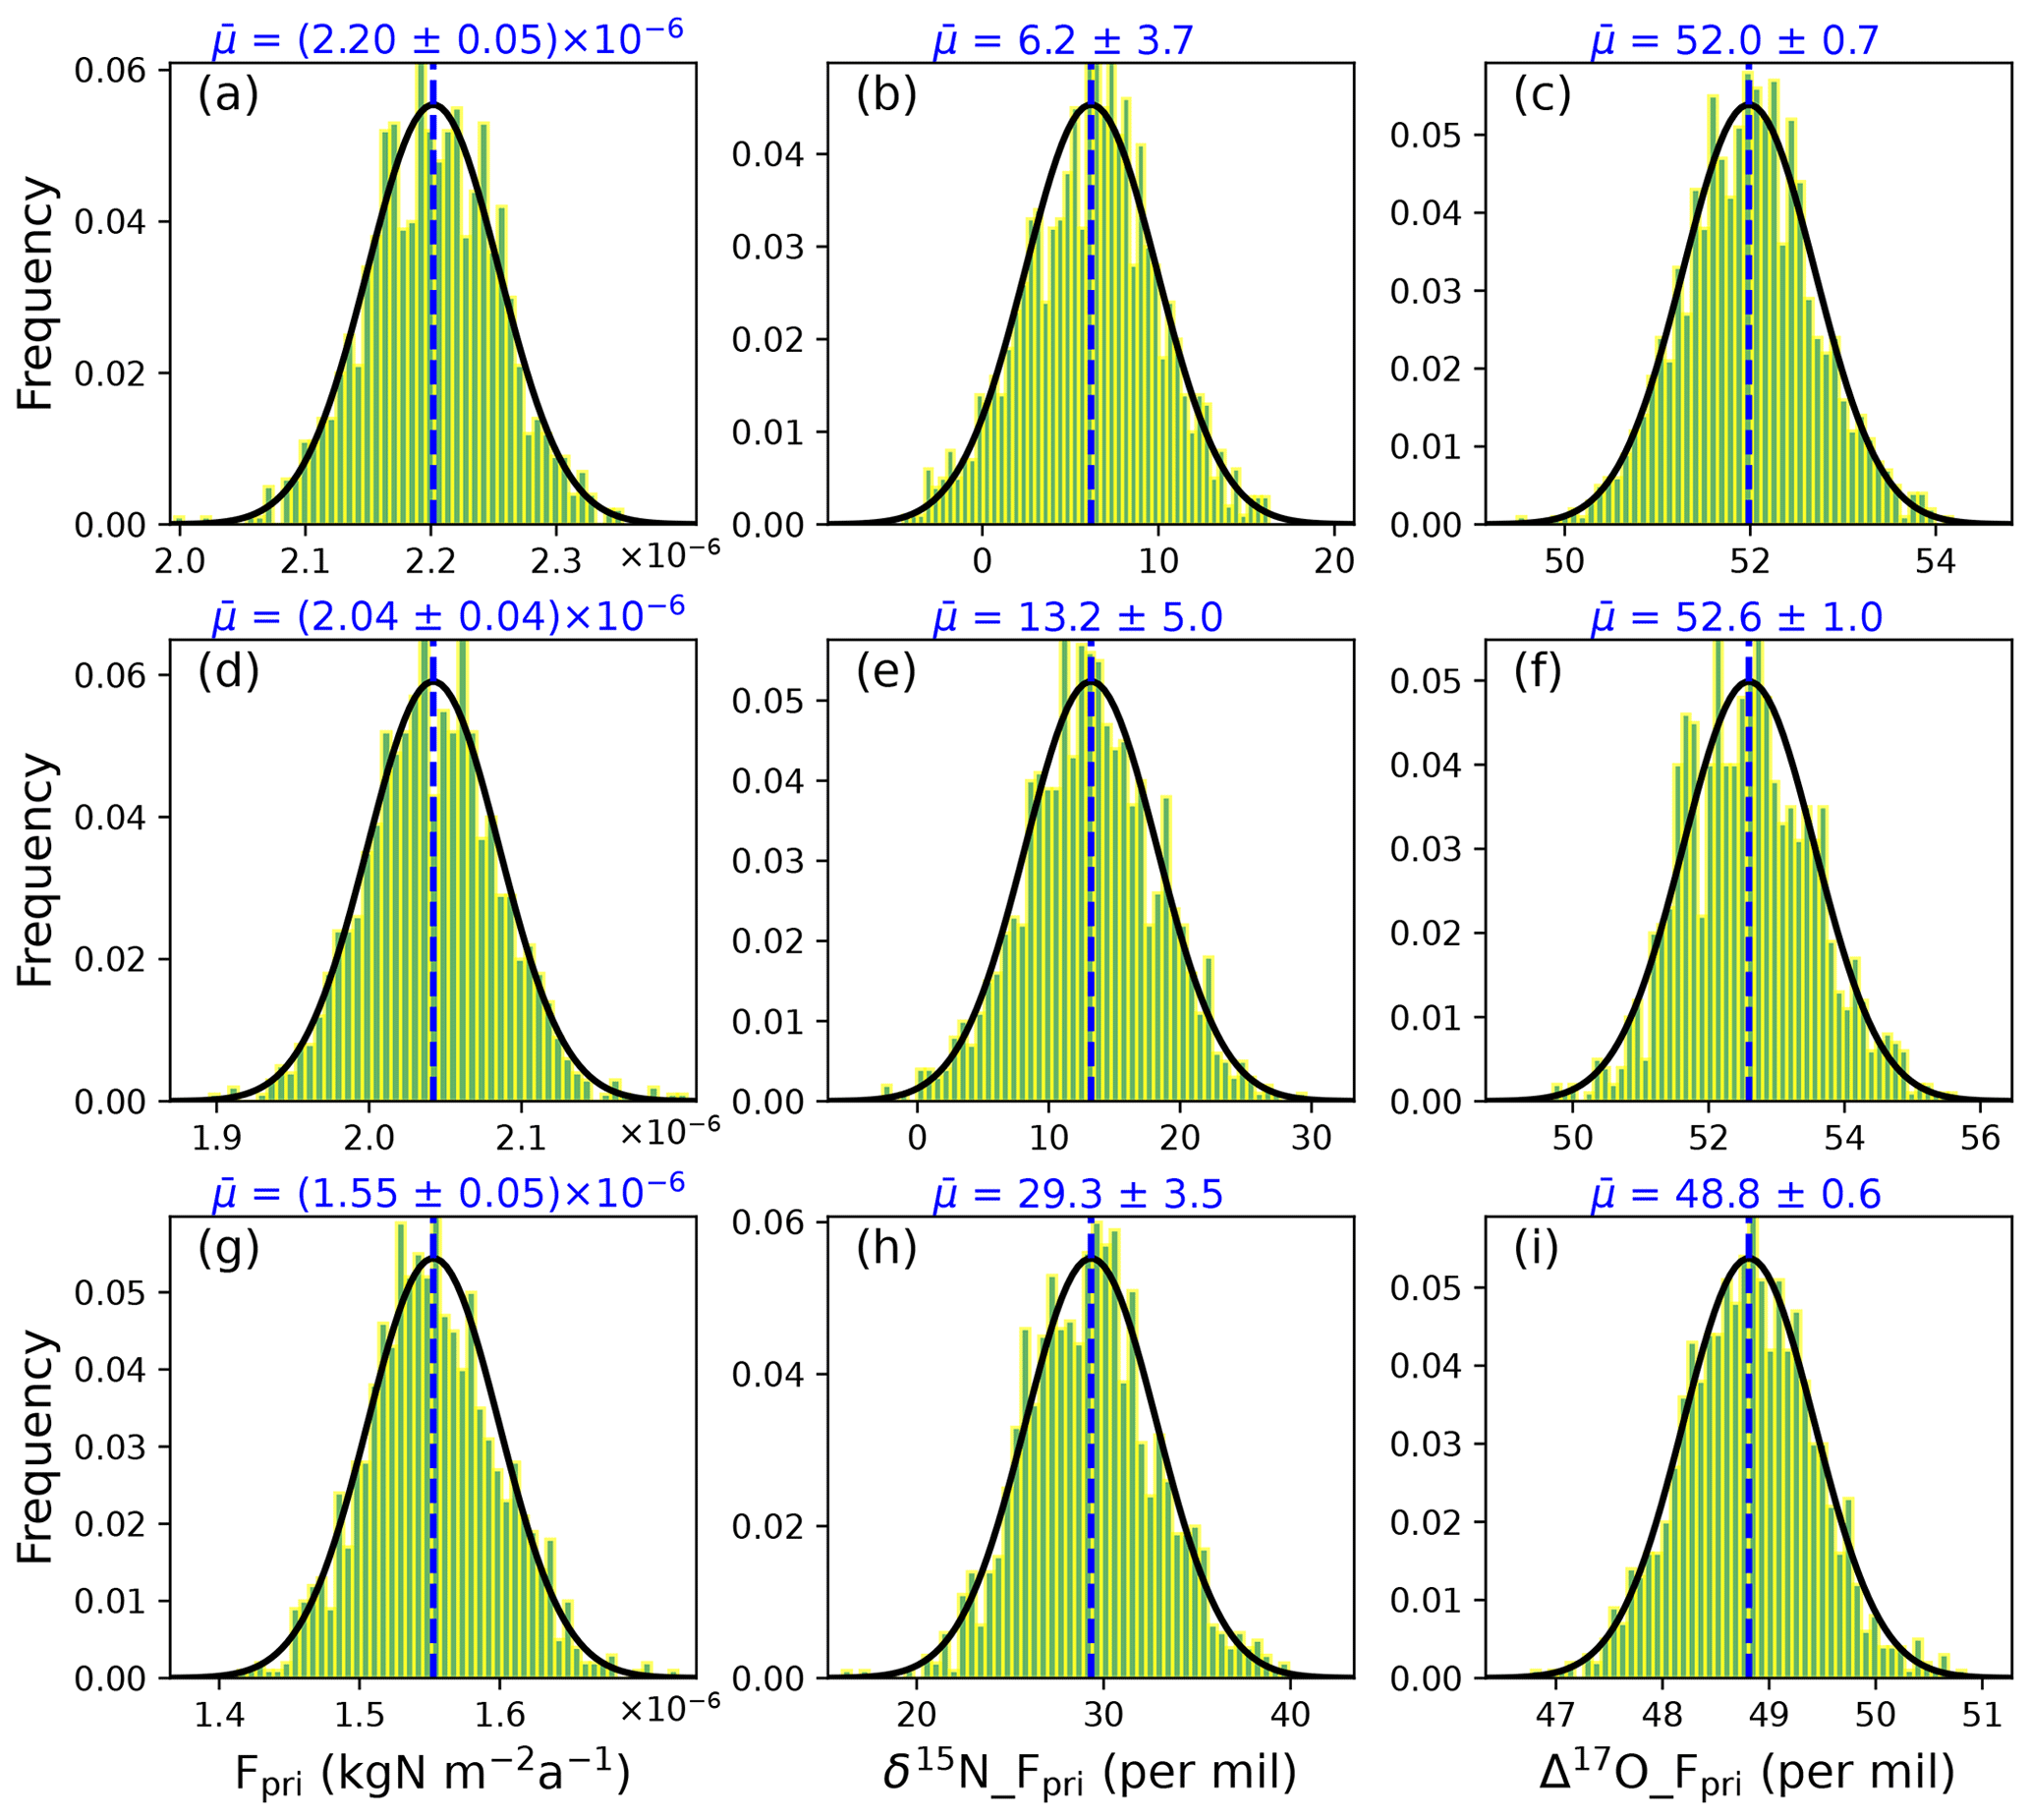
Figure 7Frequency histogram of the calculated primary nitrate flux and its mean δ15N/Δ17O values at Dome C under three different archival snow nitrate concentration distributions: (a–c) Case 1 – uniform distribution, (d–f) Case 2 – Gaussian-type function, and (g–i) Case 3 – shifted Gaussian-type function. The solid black lines represent the fitted Gaussian function of the frequency distribution. The dashed blue lines represent the mean values of Fpri and its δ15N and Δ17O, which are labeled on the top of each subplot.
As shown in Fig. 7, although the prescribed archived nitrate concentration seasonality does not alter the modeled snowpack and atmospheric nitrate isotopes, it has a profound impact on the modeled primary nitrate flux and its isotopes. In particular, under the three cases of different seasonal distributions of the archived snow nitrate concentrations, the modeled Fpri and its annual mean δ15N and Δ17O range from 1.5 to 2.2 × 10⁻⁶ kgN m−2 a−1, 6.2 ‰ to 29.3 ‰, and 48.8 ‰ to 52.6 ‰, respectively. The inverse model-calculated Fpri is smaller than the value used in the original TRANSITS (8.2 × 10⁻⁶ kgN m−2 a−1) in Erbland et al. (2015), but this is easily resolved given the large uncertainty in the archived nitrate concentration used as model input.
The modeled annual mean δ15N of Fpri ranges from 6.2 ‰–29.3 ‰, in contrast with the observed atmospheric δ15N(NO) in southern mid-latitude area or the Southern Ocean where δ15N(NO) is in general negative or close to 0 (Morin et al., 2009; Shi et al., 2018, 2021). The modeled positive δ15N of Fpri is however consistent with the wintertime atmospheric δ15N(NO) observed in Antarctica when the effect of photolysis is null and local atmospheric nitrate likely reflects Fpri. The maximum atmospheric δ15N(NO) in winter was found to be 10.8 ‰ at Dumont d’Urville station (Savarino et al., 2007), 12.8 ‰ at Dome C (Erbland et al., 2013), and 13.9 ‰ at Zhongshan station (Shi et al., 2022). These positive δ15N values have been linked to stratospheric denitrification as nitrate produced in stratosphere is suggested to be 19 ± 3 ‰ by considering the fractionation induced by different of N2O photolysis channels (Savarino et al., 2007). Therefore, the modeled flux and δ15N of Fpri point towards the dominance of stratospheric denitrification in nitrate budget at Dome C.
The modeled Δ17O of Fpri is also very high for all three cases (48.8 ‰–52.6 ‰). The measured bulk Δ17O of surface ozone in Antarctica is about 26 ‰ (Ishino et al., 2017; Savarino et al., 2016) that fits well with the global tropospheric average of 25.4 ‰ (Vicars and Savarino, 2014). Given that the oxygen mass-independent fractionation signal of ozone is mainly occupied by the terminal oxygen atom and transferred to other molecular, atmospheric nitrate of tropospheric origin should possess a Δ17O signal less than 39 ‰ (Mauersberger et al., 2003; Savarino et al., 2008), which cannot explain our calculated high Δ17O of Fpri. However, the bulk Δ17O of stratospheric ozone was measured to be 34.3 ± 3.6 ‰ (Lämmerzahl et al., 2002; Krankowsky et al., 2000), which indicated that nitrate produced in the stratosphere could gain a higher Δ17O signature from ozone (Lyons, 2001). It has been observed in Antarctica that the atmospheric Δ17O(NO) could exceed 40 ‰ in winter and early spring when stratospheric denitrification occurs (Ishino et al., 2017; Walters et al., 2019; Erbland et al., 2013; Savarino et al., 2007; Shi et al., 2022). A recent study also revealed that the surface snow Δ17O(NO) at Dome C frequently exceeds 40 ‰ during winter/spring and could sometimes reach up to 50 ‰ (Akers et al., 2022a). As we mentioned previously, these winter Δ17O(NO) observations likely reflect the primary nitrate signal at that time since the photolysis of snow nitrate does not occur due to lack of sunlight. Thus, the high modeled Δ17O of Fpri seems to again indicate a dominant role of stratosphere denitrification in external nitrate source to Dome C, similar to what can be reflected from the modeled δ15N of primary nitrate. In addition, Erbland et al. (2015) estimated that stratospheric denitrification nitrate flux is (4.1 ± 2.5) × 10−6 kgN m−2 a−1 in Antarctica, while our calculated Fpri of 1.5–2.2 × 10⁻⁶ kgN m−2 a−1 at Dome C is within the same range.
In sum, we acknowledge that there are many factors that would affect the model results, such as the archived snow nitrate concentration and isotopes, the export fraction (fexp), and the cage effect fraction (fc). These need to be further explored by observations to improve the model performance.
In this section, we report the sensitivity test results to elucidate the impact of two model parameters that lack direct observational constraints: the export fraction (fexp) and the cage effect fraction (fc). We mainly focus on the annual net loss and the differences in isotopes between Fpri and FA in accordance with the resolution of ice-core measurements.
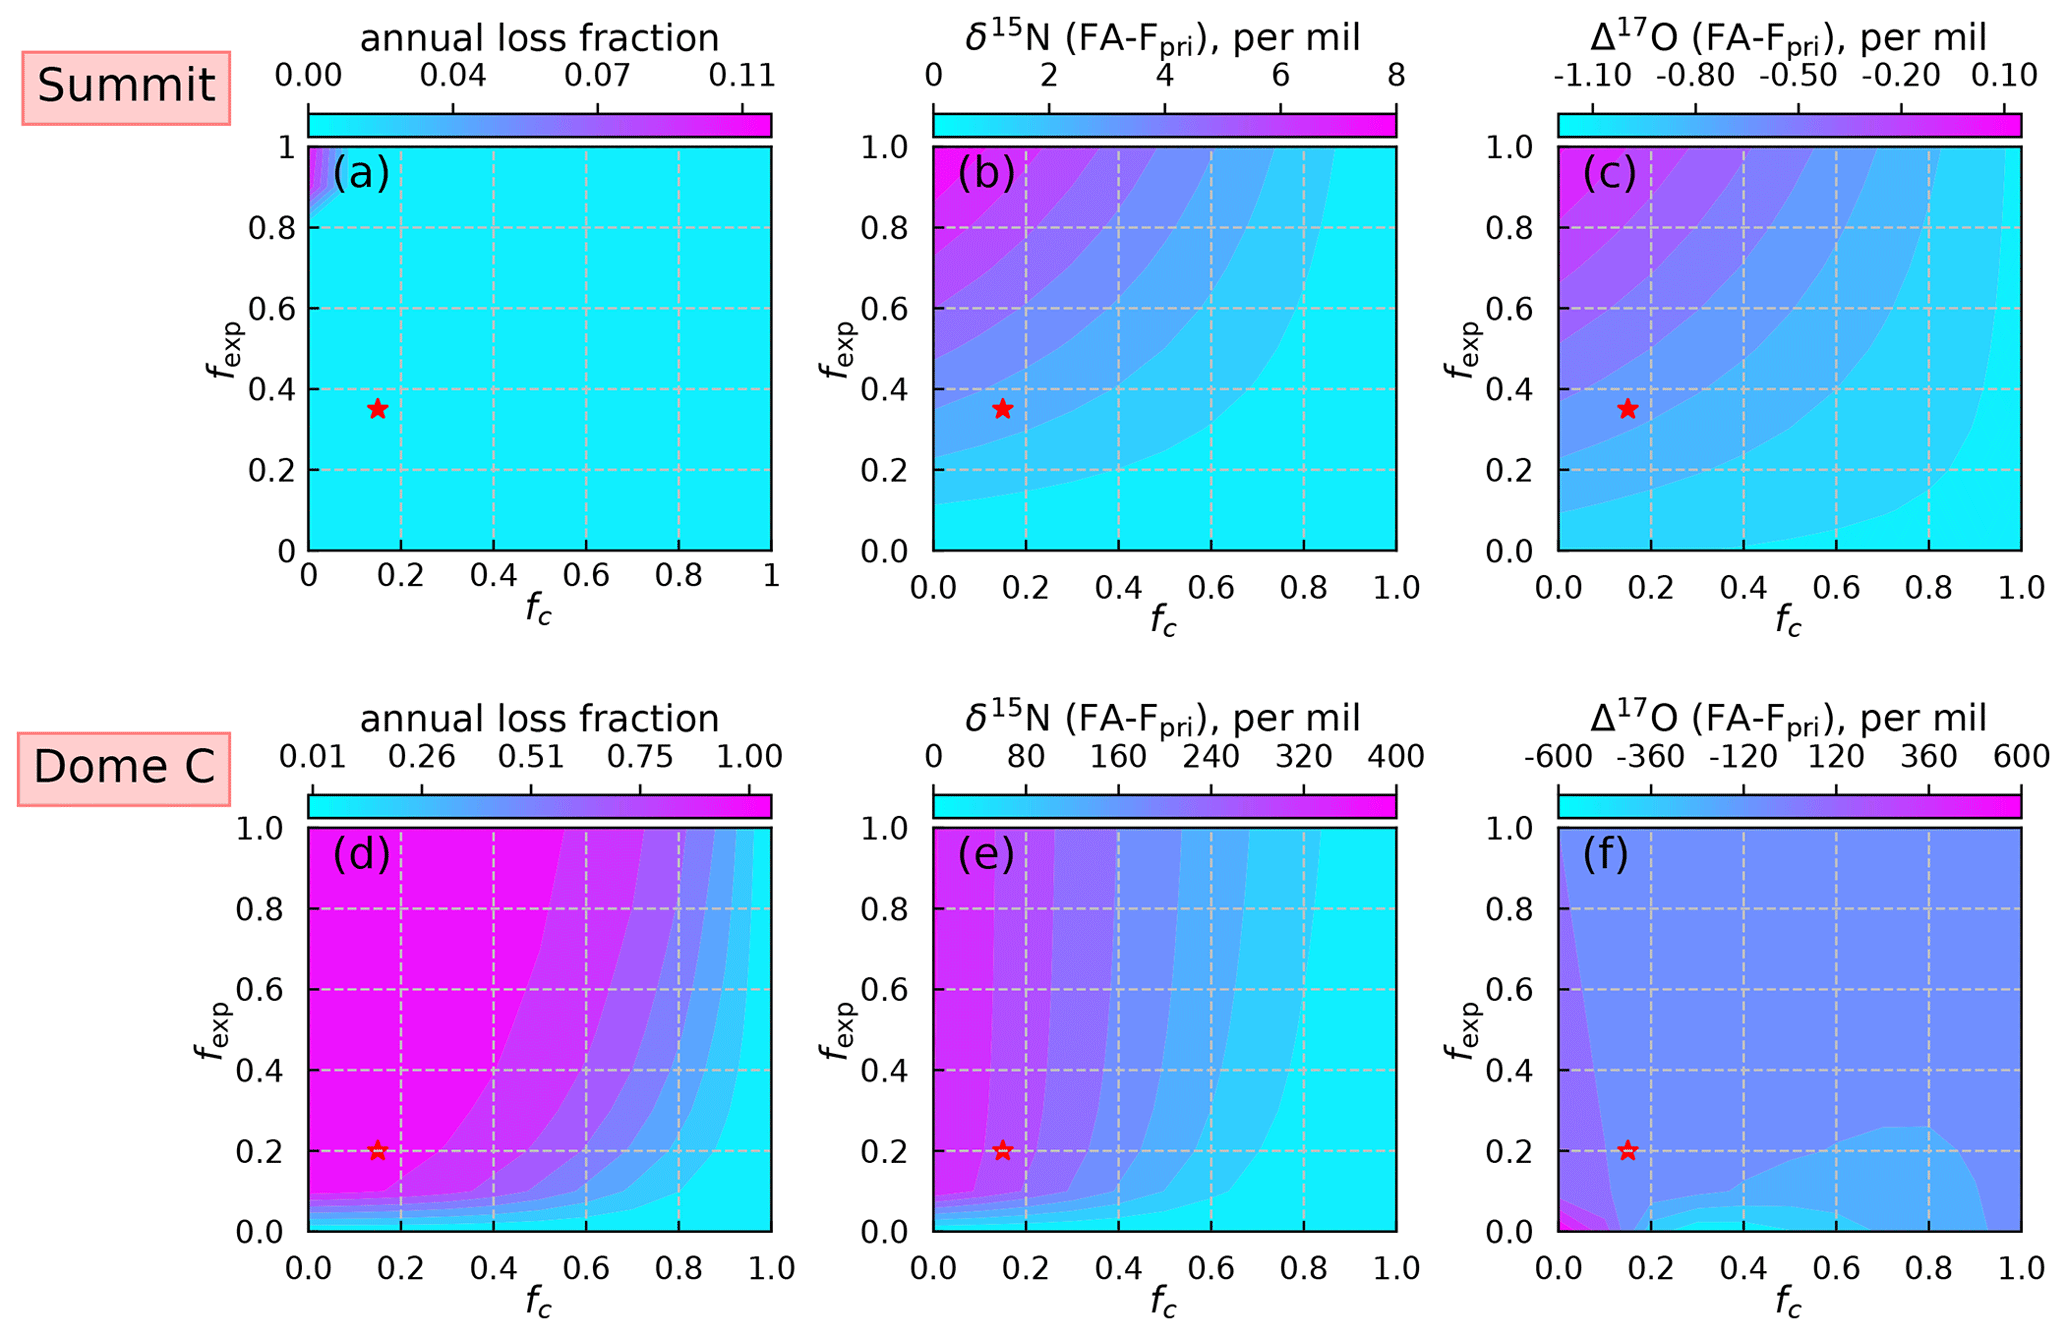
Figure 8Model sensitivity test results of two parameters fexp and fc for Summit (a–c) and Dome C (d–f). The annual nitrate loss fraction is defined as following Jiang et al. (2021). Red stars represent the values of fexp and fc used in model simulations.
The sensitivity test results are shown in Fig. 8. The annual loss fraction (defined as ) represents the final preservation of primary nitrate after post-depositional processing (Jiang et al., 2021). The inverse model predicts an annual loss fraction of 3.5 % under present Summit conditions, which is close to the TRANSITS model prediction of 4.1 % (Jiang et al., 2021). This small discrepancy is likely caused by the use of simplified snow radiative transfer parameterization in the inverse model. In addition, the differences of δ15N and Δ17O between FA and Fpri are also in good agreement with the TRANSITS model. As expected, larger fexp and smaller fc would result in a higher degree of net loss in Fpri and larger isotopic effects in both δ15N and Δ17O. However, under present-day conditions at Summit, the preserved snow nitrate concentrations and isotopes at the annual scale are only altered slightly and the degree of changes is insensitive to fexp and fc.
For Dome C, the model results are sensitive to fexp when fc is small and become sensitive to fc when fexp is larger. In particular, the isotopic signature is largely independent of fexp when fexp is larger than 0.1–0.2. In addition, the Δ17O results display a non-monotonic response to these two parameters, especially when fexp approaches zero (Fig. 8f). A similar phenomenon was seen in the TRANSITS model simulations in Erbland et al. (2015), where they found that the model results could not converge when fexp was set to zero. The high sensitivity of model parameters renders difficult to reconstruct the historical variations in primary nitrate based on ice-core records at Dome C unless these parameters are precisely constrained. For present-day conditions, fexp and fc could be constrained by atmospheric and snowpack observations (Erbland et al., 2015), but it is unknown whether these values could be applied to different climate conditions. In addition, the difficulties in choosing an appropriate archival nitrate concentration profile as model initial conditions would add extra uncertainties to the model results.
In this study, we introduce an inverse model which is designed to correct for the effects of post-depositional processing on ice-core nitrate concentration and its isotopes. The model was tested against present-day Summit, Greenland, and Dome C, Antarctica, conditions to validate its performance under different snow accumulation rates. Model results compared to observations demonstrate that the inverse model is capable of adequately correcting the effect of post-depositional processing. The modeled atmospheric nitrate δ15N/Δ17O values at Summit are generally in good agreement with observations but with a slight underestimate in winter δ15N(NO), which is likely because the model does not treat correctly the seasonal differences in nitrogen isotope fractionation during deposition (εd). At Dome C, the model also well reproduced the observed snowpack nitrate profiles in the photic zone, the annual skin layer δ15N/Δ17O(NO), and atmospheric Δ17O(NO) at Dome C but again overestimated the average atmospheric δ15N(NO) probably also due a low bias in εd used in the model. A better quantification on the isotope fractionation of δ15N(NO) during deposition is therefore needed.
The inverse working flow of this new model also enables us to qualitatively retrieve information regarding primary nitrate from the archived snow nitrate. The calculated seasonality in δ15N of Fpri at Summit displays a maximum in mid-summer that is distinct from the observed spring δ15N(NO) peak in snowpack. This seasonal pattern is in contrast with observed atmospheric δ15N(NO) variations in mid-latitudes, which is thought to be the major aerosol source region to Summit, but is consistent with the atmospheric δ15N(NO) variations observed in the high-latitude Arctic region. The δ15N of Fpri may reflect seasonally varied main source regions to Greenland or a dominate role of high-latitude nitrate transport to Summit. At Dome C, both the magnitude of Fpri and its δ15N/Δ17O indicate a dominant role of stratospheric denitrification on nitrate budget at Dome C.
The inverse model is designed to help interpret ice-core nitrate records. Applying the inverse model to ice-core nitrate records needs knowledge of initial conditions. In particular, archived snow nitrate concentration and its δ15N and Δ17O, the snow accumulation rate, and light absorption impurity concentrations should be known for a given ice core. In addition, chemistry–climate models such as the ICECAP or GCAP model (Murray et al., 2021, 2014) would be also necessary to provide extra constraints, such as the oxidizing agent concentrations, total column ozone (TCO), wind field, and boundary layer heights for the past climates and are required to estimate Δ17O of FP and fexp (Alexander et al., 2020; Jiang et al., 2021). The calculated primary nitrate flux and its δ15N and Δ17O can be further combined with the chemistry–climate model results to interpret its climate implications such as the variations in tropospheric NOx and oxidant abundance, which would improve our understanding of key factors controlling the variability in atmospheric oxidation capacity under different climates.
In the inverse model, we follow Erbland et al. (2015) to separate the photolysis process of nitrate on an ice grain into two steps, i.e., the direct photolysis followed by the subsequent cage effect (Fig. A1). It is well-documented that secondary chemistry can occur during snow nitrate photolysis to reform nitrate and alter the isotopes of the remaining nitrate, which is termed as the cage effect (McCabe et al., 2005; Meusinger et al., 2014). To quantify this effect, Erbland et al. (2015) assigned an empirical parameter (fc) to represent the fraction of the nitrate photoproducts that would undergo the cage effect and derived a value of 0.15 for fc based on the observed decreasing trend of Δ17O (NO) in the snowpack at Dome C. As shown in Fig. A1, assuming a fraction (fp) of initial snow nitrate was photolyzed and a fraction (fc) of these photolyzed nitrate undergone cage effect, the mass balance equation for snow nitrate can be written as
where the superscript represents the state before photolysis. It can be easily seen that Eq. (A1) is equal to Eq. (7).
The impact of the direct photolysis of snow nitrate on δ15N(NO) can be described by the Rayleigh equation. We define the first-order photolysis rate constant of 14NO and 15NO as J and J∗ and their concentration in snow as c and c∗ respectively. The chemical kinetic equations of c and c∗ can be represented as follows:
Integrating Eqs. (A2) and (A3) yields Eqs. (A4) and (A5):
Here c(0) represents the initial concentration before photolysis. The evolution of the isotopic ratio R, which is defined as the ratio of c and c∗, follows Eq. (A6):
Since the delta value δ15N equals , where Rspl and Rref refer to the isotope ratio of sample and standard respectively, Eq. (A6) can be further expanded to
which is consistent with the form of the Rayleigh equation.
By applying the first-order Taylor expansion of ), we obtain the relationship between the δ15N(NO) before and after photolysis:
The δ15N of the emitted NO2 can be calculated via the mass balance equation:
Combining Eqs. (A8) and (A9) would yield
Because part of the photoproduct would undergo cage effect to reform nitrate (Fig. A1), the final state of snow δ15N(NO) after photolysis can be calculated via isotopic mass balance equation:
which is equal to Eq. (8).
For Δ17O, it is assumed that direct photolysis of nitrate will only induce mass-dependent fractionation and has no impact on Δ17O. However, the produced NO2 which is re-oxidized by an OH radical would lower its Δ17O by since an OH radical would rapidly achieve isotopic equilibrium with the surrounding water molecule and erases its Δ17O signal. Hence, by again using the isotopic mass balance equation, it can be shown that
which is equal to Eq. (9).
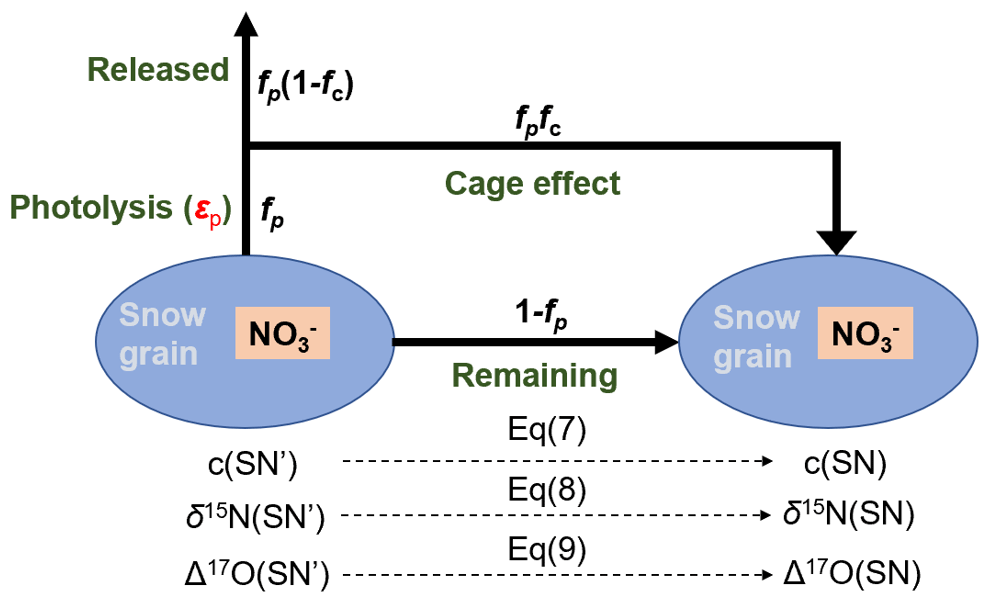
Figure A1Sketch of the mass and isotopic transfer relationship during nitrate photolysis in snow grains. The italic black variables near the arrows indicate the fractional change in each subprocess.
The Δ17O(NO) of FP is required to solve the mass balance equations. We follow the algorithm for calculating atmospheric Δ17O(NO) that has been widely used in a previous study (Alexander et al., 2020). Atmospheric NO2 is assumed to rapidly achieve photochemical steady state (PSS) so that its Δ17O can be represented as follows:
where k represents different oxidation channels for NO in the atmosphere and Δ17O(O) represents Δ17O of the terminal oxygen in the ozone molecule, and RO2 includes both HO2 and other organic peroxyl radicals. Thus, to obtain Δ17O(NO2), concentrations of ozone and oxidizing radicals are necessary. For the subsequent oxidation of NO2, only the NO2 + OH channel is considered, and Δ17O of OH is assumed to be zero owing to its isotopic equilibrium with atmospheric H2O. Thus, Δ17O of the locally formed atmospheric nitrate (i.e., FP) can be calculated by
The photolysis quantum yield (Φ) previously used in TRANSITS model simulation at Dome C was set to 0.026 in Erbland et al. (2015), which was adjusted to 0.015 in this study. Both values are obtained by best fitting the observed nitrate concentration and its δ15N profiles in the snowpack and are within the range of measurement results (0.003–0.44) for Dome C snow. However, using a value of 0.026 in the inverse model would severely overestimate the photolytic loss of snow nitrate, resulting in unrealistically high nitrate concentration in the skin layer (> 15 000 ppb) and excessive fractionation in δ15N(NO) (500 ‰) and Δ17O(NO) (−18 ‰). Adjusting the quantum yield to 0.015 could well reproduce the observed nitrate concentration and δ15N(NO) in skin layer and snowpack by the inverse model.
The discrepancy in the chosen quantum yield in these two models is caused by whether diffusion of snow nitrate is included, as the diffusion process would tend to smooth the entire snowpack nitrate profiles and decrease the asymptotic values. The omission of the diffusion process in the inverse model is based on the following considerations. First, the snowpack nitrate profile at sites with even lower accumulation rates (Dome A in East Antarctica, with annual snow accumulation rate of about 19 kg m−2 a−1) does not display detectable smoothing on snowpack nitrate or its δ15N and Δ17O (Shi et al., 2015), suggesting that diffusion is not as important as assumed in the TRANSITS model. Second, the TRANSITS model would induce numerical diffusion during the division of snow layers in each time step, which results in rapid decreases in the amplitude of the simulated seasonality in snow, as can be seen in the simulated snow profiles in Winton et al. (2020).
To obtain a hypothetical seasonal pattern in the archived nitrate concentration, we assume that the normalized archived nitrate concentrations (by its arithmetic mean) would follow a same Gaussian-type distribution as nitrate concentrations in the skin layer, and the shape parameters (a, b, σ) are determined by using the least square regression method.
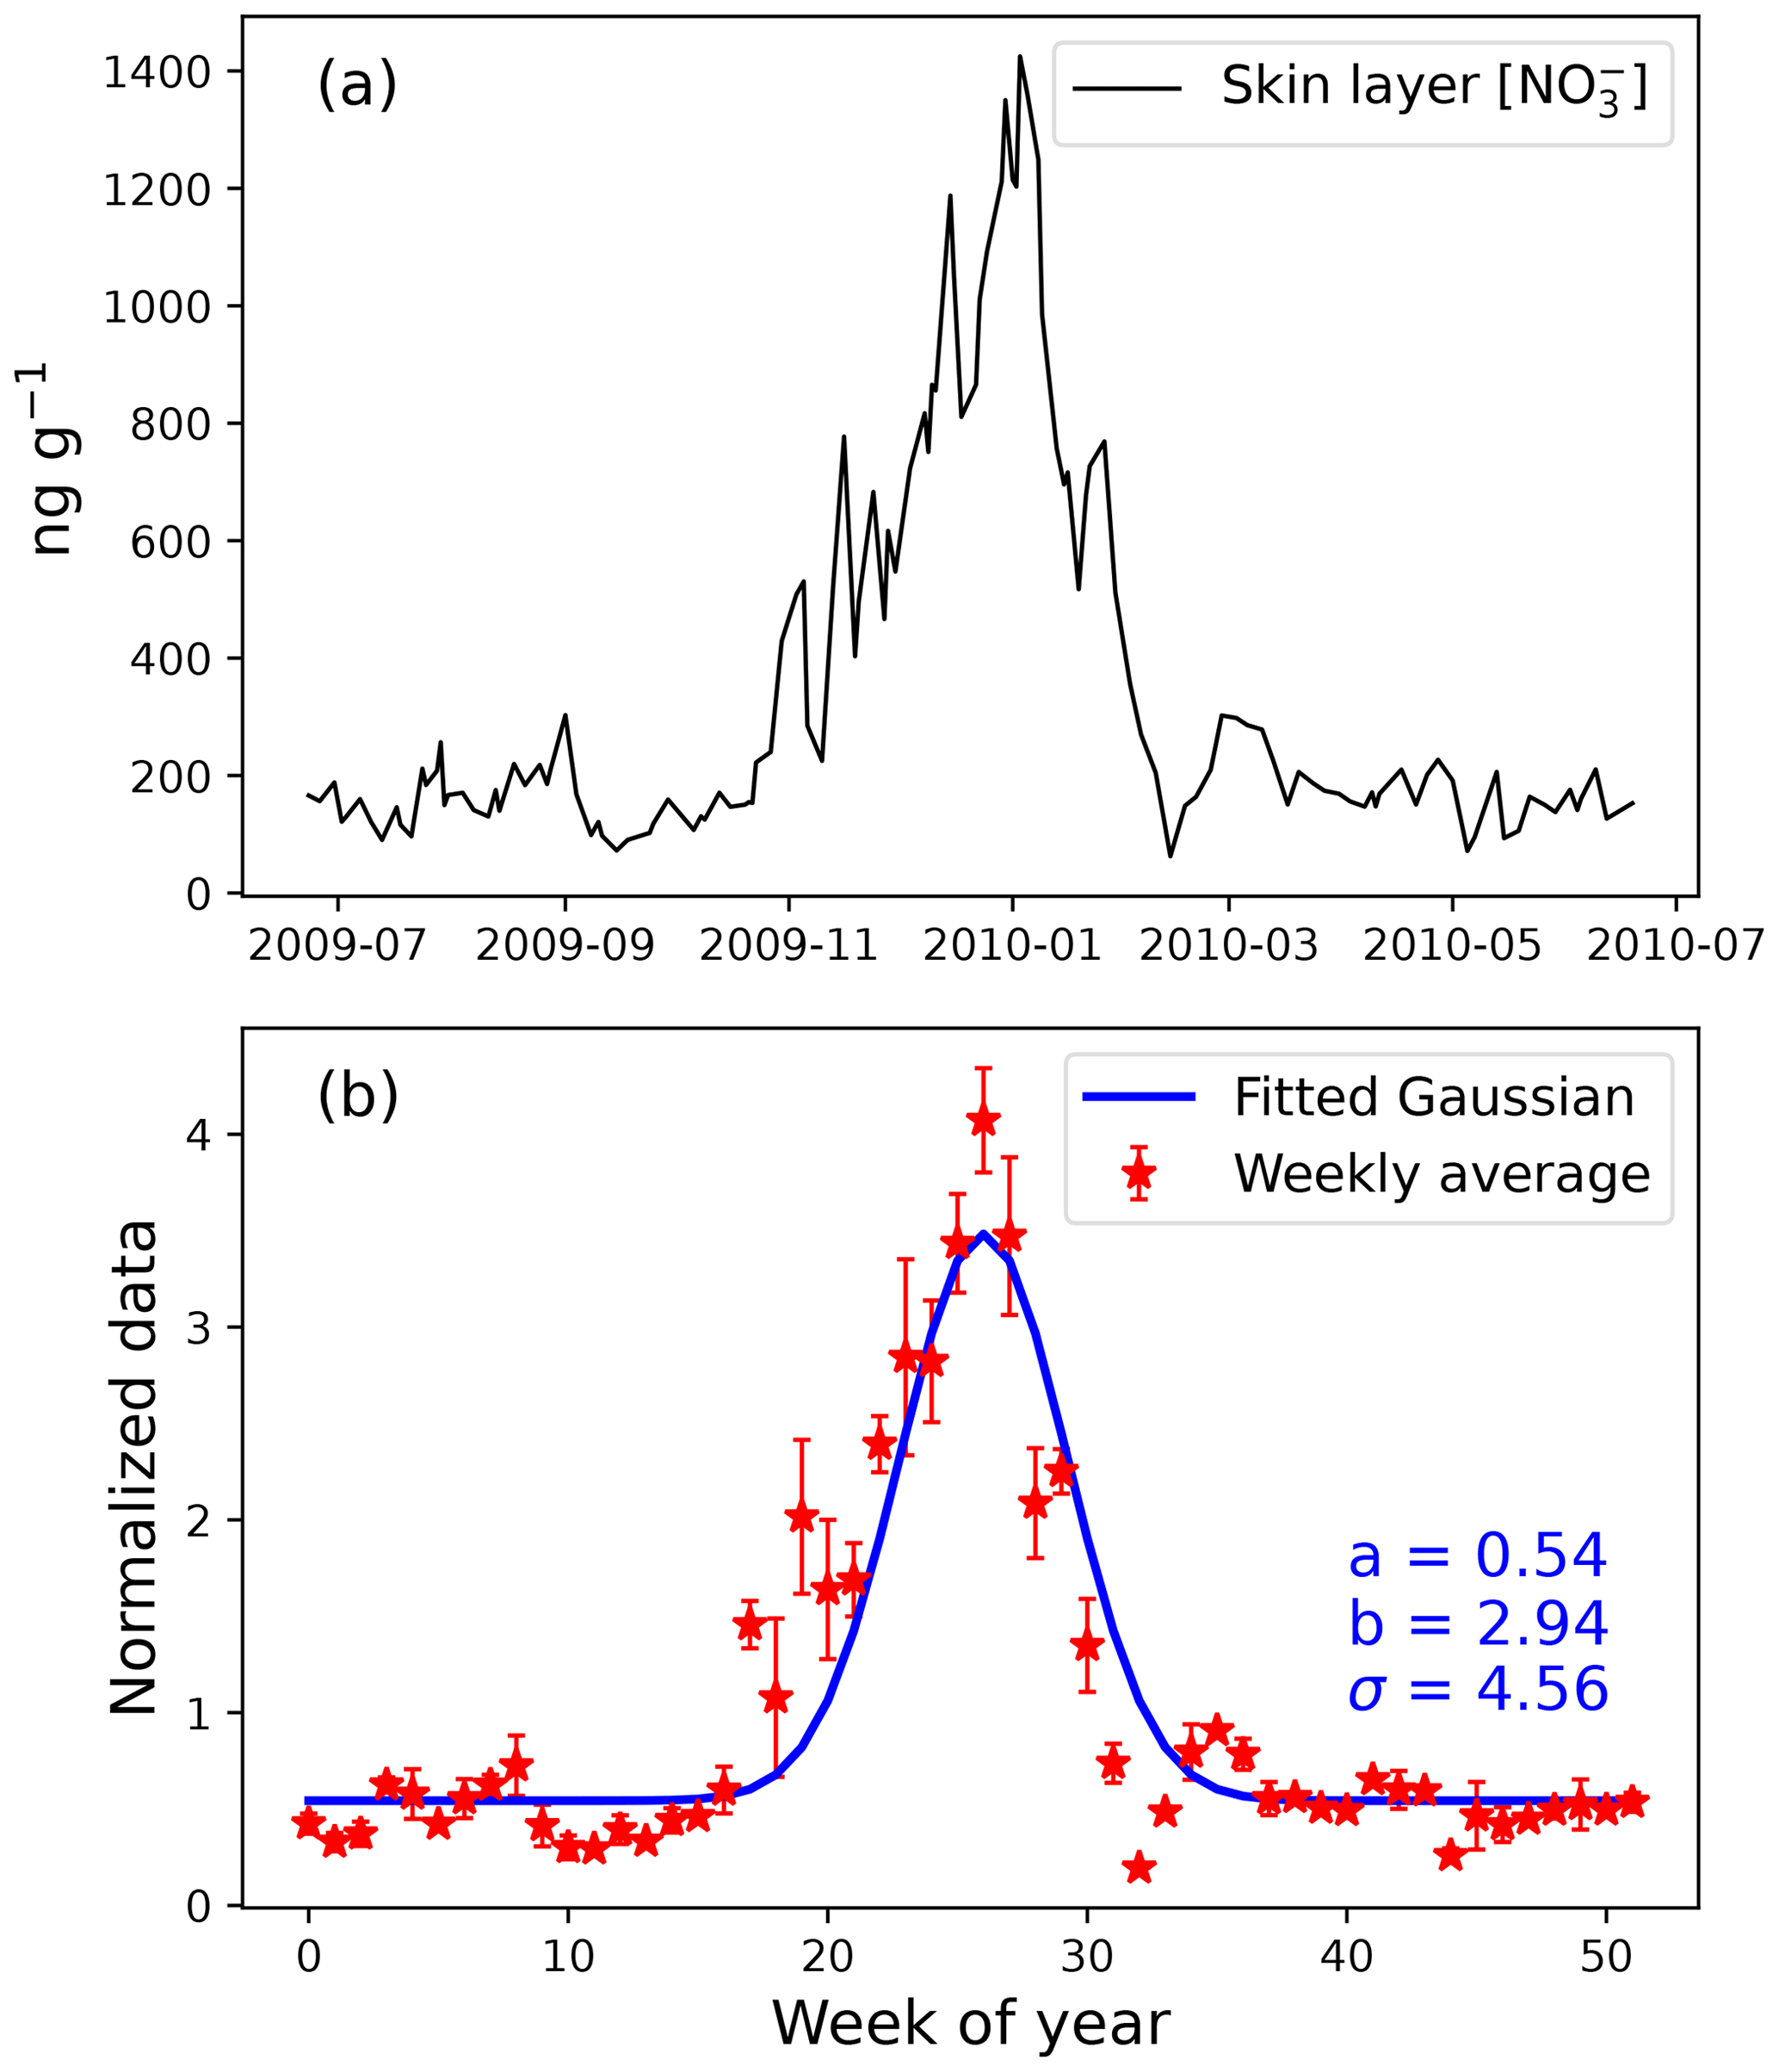
Figure D1(a) Observed annual variations of skin layer nitrate concentration at Dome C (Erbland et al., 2013). (b) Normalized skin layer nitrate concentration by its arithmetic mean and the fitted Gaussian curve, with the shape parameters (a, b, σ) labeled in blue text.
The inverse model code and the model outputs are available at https://github.com/JZxxhh/Inverse-model (last access: 11 March 2024, https://doi.org/10.5281/zenodo.10805443, Jiang, 2024).
LG conceived this study. ZJ developed the model code, conducted the simulations, and wrote the manuscript with LG. JS and BA provided suggestions for data interpretation. All authors gave feedback on the paper writing.
The contact author has declared that none of the authors has any competing interests.
Publisher’s note: Copernicus Publications remains neutral with regard to jurisdictional claims made in the text, published maps, institutional affiliations, or any other geographical representation in this paper. While Copernicus Publications makes every effort to include appropriate place names, the final responsibility lies with the authors.
Joel Savarino acknowledges the support of the overwintering staff and the French polar institute IPEV through the SUNNITEDC (1011) and CAPOXI programs (1177). We would like to thank the reviewers and the editor for their comments and suggestions, which greatly helped in improving the manuscript.
This research has been supported by the National Natural Science Foundation of China (grant nos. 41822605 and 41871051), the Strategic Priority Research Program of Chinese Academy of Sciences (grant no. XDB 41000000), the National Key Research and Development Program of China (grant no. 2022YFC3700701), the Agence Nationale de la Recherche (grant nos. ANR-15-IDEX-02 and ANR10 LABX56), and the National Science Foundation (grant nos. PLR 1542723, AGS 2202287, and AGS 1702266).
This paper was edited by Thorsten Bartels-Rausch and reviewed by two anonymous referees.
Abbatt, J. P. D.: Interaction of HNO3 with water-ice surfaces at temperatures of the free troposphere, Geophys. Res. Lett., 24, 1479–1482, https://doi.org/10.1029/97GL01403, 1997.
Akers, P. D., Savarino, J., Caillon, N., Magand, O., and Le Meur, E.: Photolytic modification of seasonal nitrate isotope cycles in East Antarctica, Atmos. Chem. Phys., 22, 15637–15657, https://doi.org/10.5194/acp-22-15637-2022, 2022a.
Akers, P. D., Savarino, J., Caillon, N., Servettaz, A. P. M., Le Meur, E., Magand, O., Martins, J., Agosta, C., Crockford, P., Kobayashi, K., Hattori, S., Curran, M., van Ommen, T., Jong, L., and Roberts, J. L.: Sunlight-driven nitrate loss records Antarctic surface mass balance, Nat. Commun., 13, 4274, https://doi.org/10.1038/s41467-022-31855-7, 2022b.
Alexander, B. and Mickley, L. J.: Paleo-perspectives on potential future changes in the oxidative capacity of the atmosphere due to climate change and anthropogenic emissions, Curr. Pollut. Rep., 1, 57–69, https://doi.org/10.1007/s40726-015-0006-0, 2015.
Alexander, B., Savarino, J., Kreutz, K. J., and Thiemens, M. H.: Impact of preindustrial biomass-burning emissions on the oxidation pathways of tropospheric sulfur and nitrogen, J. Geophys. Res., 109, D08303, https://doi.org/10.1029/2003JD004218, 2004.
Alexander, B., Sherwen, T., Holmes, C. D., Fisher, J. A., Chen, Q., Evans, M. J., and Kasibhatla, P.: Global inorganic nitrate production mechanisms: comparison of a global model with nitrate isotope observations, Atmos. Chem. Phys., 20, 3859–3877, https://doi.org/10.5194/acp-20-3859-2020, 2020.
Bennartz, R., Fell, F., Pettersen, C., Shupe, M. D., and Schuettemeyer, D.: Spatial and temporal variability of snowfall over Greenland from CloudSat observations, Atmos. Chem. Phys., 19, 8101–8121, https://doi.org/10.5194/acp-19-8101-2019, 2019.
Berhanu, T. A., Meusinger, C., Erbland, J., Jost, R., Bhattacharya, S. K., Johnson, M. S., and Savarino, J.: Laboratory study of nitrate photolysis in Antarctic snow. II. Isotopic effects and wavelength dependence, J. Chem. Phys., 140, 244306, https://doi.org/10.1063/1.4882899, 2014.
Beyn, F., Matthias, V., and Dähnke, K.: Changes in atmospheric nitrate deposition in Germany – An isotopic perspective, Environ. Pollut., 194, 1–10, https://doi.org/10.1016/j.envpol.2014.06.043, 2014.
Burkhart, J. F., Hutterli, M., Bales, R. C., and McConnell, J. R.: Seasonal accumulation timing and preservation of nitrate in firn at Summit, Greenland, J. Geophys. Res.-Atmos., 109, D22309, https://doi.org/10.1029/2004JD004658, 2004.
Castellani, B. B., Shupe, M. D., Hudak, D. R., and Sheppard, B. E.: The annual cycle of snowfall at Summit, Greenland, J. Geophys. Res.-Atmos., 120, 6654–6668, https://doi.org/10.1002/2015JD023072, 2015.
Chu, L. and Anastasio, C.: Quantum Yields of Hydroxyl Radical and Nitrogen Dioxide from the Photolysis of Nitrate on Ice, J. Phys. Chem. A, 107, 9594–9602, https://doi.org/10.1021/jp0349132, 2003.
Dibb, J. E. and Fahnestock, M.: Snow accumulation, surface height change, and firn densification at Summit, Greenland: Insights from 2 years of in situ observation, J. Geophys. Res.-Atmos., 109, D24113, https://doi.org/10.1029/2003JD004300, 2004.
Dibb, J. E., Talbot, R. W., Whitlow, S. I., Shipham, M. C., Winterle, J., McConnell, J., and Bales, R.: Biomass burning signatures in the atmosphere and snow at Summit, Greenland: An event on 5 August 1994, Atmos. Environ., 30, 553–561, https://doi.org/10.1016/1352-2310(95)00328-2, 1996.
Dibb, J. E., Talbot, R. W., Munger, J. W., Jacob, D. J., and Fan, S. M.: Air-snow exchange of HNO3 and NOy at Summit, Greenland, J. Geophys. Res.-Atmos., 103, 3475–3486, https://doi.org/10.1029/97JD03132, 1998.
Dibb, J. E., Whitlow, S. I., and Arsenault, M.: Seasonal variations in the soluble ion content of snow at Summit. Greenland: Constraints from three years of daily surface snow samples, Atmos. Environ., 41, 5007–5019, https://doi.org/10.1016/j.atmosenv.2006.12.010, 2007.
Erbland, J., Vicars, W. C., Savarino, J., Morin, S., Frey, M. M., Frosini, D., Vince, E., and Martins, J. M. F.: Air–snow transfer of nitrate on the East Antarctic Plateau – Part 1: Isotopic evidence for a photolytically driven dynamic equilibrium in summer, Atmos. Chem. Phys., 13, 6403–6419, https://doi.org/10.5194/acp-13-6403-2013, 2013.
Erbland, J., Savarino, J., Morin, S., France, J. L., Frey, M. M., and King, M. D.: Air–snow transfer of nitrate on the East Antarctic Plateau – Part 2: An isotopic model for the interpretation of deep ice-core records, Atmos. Chem. Phys., 15, 12079–12113, https://doi.org/10.5194/acp-15-12079-2015, 2015.
Esquivel-Hernández, G., Matiatos, I., Sánchez-Murillo, R., Vystavna, Y., Balestrini, R., Wells, N. S., Monteiro, L. R., Chantara, S., Walters, W., and Wassenaar, L. I.: Nitrate isotopes (δ15N, δ18O) in precipitation: best practices from an international coordinated research project, Isot. Environ. Healt. S., 59, 127–141, https://doi.org/10.1080/10256016.2023.2177649, 2023.
Fang, H., Walters, W. W., Mase, D., and Michalski, G.: iNRACM: incorporating 15N into the Regional Atmospheric Chemistry Mechanism (RACM) for assessing the role photochemistry plays in controlling the isotopic composition of NOx, NOy, and atmospheric nitrate, Geosci. Model Dev., 14, 5001–5022, https://doi.org/10.5194/gmd-14-5001-2021, 2021.
Fibiger, D. L., Dibb, J. E., Chen, D., Thomas, J. L., Burkhart, J. F., Huey, L. G., and Hastings, M. G.: Analysis of nitrate in the snow and atmosphere at Summit, Greenland: Chemistry and transport, J. Geophys. Res.-Atmos., 121, 5010–5030, https://doi.org/10.1002/2015JD024187, 2016.
Fischer, H., Wagenbach, D., and Kipfstuhl, J.: Sulfate and nitrate firn concentrations on the Greenland ice sheet: 2. Temporal anthropogenic deposition changes, J. Geophys. Res.-Atmos., 103, 21935–21942, https://doi.org/10.1029/98JD01886, 1998.
Frey, M. M., Savarino, J., Morin, S., Erbland, J., and Martins, J. M. F.: Photolysis imprint in the nitrate stable isotope signal in snow and atmosphere of East Antarctica and implications for reactive nitrogen cycling, Atmos. Chem. Phys., 9, 8681–8696, https://doi.org/10.5194/acp-9-8681-2009, 2009.
Freyer, H. D.: Seasonal variation of ratios in atmospheric nitrate species, Tellus B, 43, 30–44, https://doi.org/10.3402/tellusb.v43i1.15244, 1991.
Furukawa, R., Uemura, R., Fujita, K., Sjolte, J., Yoshimura, K., Matoba, S., and Iizuka, Y.: Seasonal-Scale Dating of a Shallow Ice Core From Greenland Using Oxygen Isotope Matching Between Data and Simulation, J. Geophys. Res.-Atmos., 122, 10873–10887, https://doi.org/10.1002/2017JD026716, 2017.
Gao, Y., Zhou, F., Ciais, P., Miao, C., Yang, T., Jia, Y., Zhou, X., Klaus, B.-B., Yang, T., and Yu, G.: Human activities aggravate nitrogen-deposition pollution to inland water over China, Natl. Sci. Rev., 7, 430–440, https://doi.org/10.1093/nsr/nwz073, 2019.
Geng, L., Alexander, B., Cole-Dai, J., Steig, E. J., Savarino, J., Sofen, E. D., and Schauer, A. J.: Nitrogen isotopes in ice core nitrate linked to anthropogenic atmospheric acidity change, P. Natl. Acad. Sci. USA, 111, 5808–5812, https://doi.org/10.1073/pnas.1319441111, 2014.
Geng, L., Zatko, M. C., Alexander, B., Fudge, T. J., Schauer, A. J., Murray, L. T., and Mickley, L. J.: Effects of post-depositional processing on nitrogen isotopes of nitrate in the Greenland Ice Sheet Project 2 ice core, 42, 5346–5354, https://doi.org/10.1002/2015GL064218, 2015.
Geng, L., Murray, L. T., Mickley, L. J., Lin, P., Fu, Q., Schauer, A. J., and Alexander, B.: Isotopic evidence of multiple controls on atmospheric oxidants over climate transitions, Nature, 546, 133–136, https://doi.org/10.1038/nature22340, 2017.
Hastings, M. G., Steig, E. J., and Sigman, D. M.: Seasonal variations in N and O isotopes of nitrate in snow at Summit, Greenland: Implications for the study of nitrate in snow and ice cores, J. Geophys. Res., 109, D20306, https://doi.org/10.1029/2004JD004991, 2004.
Hastings, M. G., Sigman, D. M., and Steig, E. J.: Glacial/interglacial changes in the isotopes of nitrate from the Greenland Ice Sheet Project 2 (GISP2) ice core, Global Biogeochem. Cy., 19, GB4024, https://doi.org/10.1029/2005GB002502, 2005.
Heaton, T. H. E.: 15N14N ratios of nitrate and ammonium in rain at Pretoria, South Africa, Atmos. Environ., 21, 843–852, https://doi.org/10.1016/0004-6981(87)90080-1, 1987.
Honrath, R., Lu, Y., Peterson, M. C., Dibb, J. E., Arsenault, M., Cullen, N., and Steffen, K. J. A. E.: Vertical fluxes of NOx, HONO, and HNO3 above the snowpack at Summit, Greenland, Atmos. Environ., 36, 2629–2640, 2002.
Iizuka, Y., Uemura, R., Fujita, K., Hattori, S., Seki, O., Miyamoto, C., Suzuki, T., Yoshida, N., Motoyama, H., and Matoba, S.: A 60 Year Record of Atmospheric Aerosol Depositions Preserved in a High-Accumulation Dome Ice Core, Southeast Greenland, J. Geophys. Res.-Atmos., 123, 574–589, https://doi.org/10.1002/2017JD026733, 2018.
Ishino, S., Hattori, S., Savarino, J., Jourdain, B., Preunkert, S., Legrand, M., Caillon, N., Barbero, A., Kuribayashi, K., and Yoshida, N.: Seasonal variations of triple oxygen isotopic compositions of atmospheric sulfate, nitrate, and ozone at Dumont d'Urville, coastal Antarctica, Atmos. Chem. Phys., 17, 3713–3727, https://doi.org/10.5194/acp-17-3713-2017, 2017.
Jiang, Z.: The inverse model code, Zenodo [code, data set], https://doi.org/10.5281/zenodo.10805443, 2024.
Jiang, Z., Alexander, B., Savarino, J., Erbland, J., and Geng, L.: Impacts of the photo-driven post-depositional processing on snow nitrate and its isotopes at Summit, Greenland: a model-based study, The Cryosphere, 15, 4207–4220, https://doi.org/10.5194/tc-15-4207-2021, 2021.
Jiang, Z., Savarino, J., Alexander, B., Erbland, J., Jaffrezo, J.-L., and Geng, L.: Impacts of post-depositional processing on nitrate isotopes in the snow and the overlying atmosphere at Summit, Greenland, The Cryosphere, 16, 2709–2724, https://doi.org/10.5194/tc-16-2709-2022, 2022.
Kahl, J. D. W., Martinez, D. A., Kuhns, H., Davidson, C. I., Jaffrezo, J.-L., and Harris, J. M.: Air mass trajectories to Summit, Greenland: A 44-year climatology and some episodic events, J. Geophys. Res.-Oceans, 102, 26861–26875, https://doi.org/10.1029/97JC00296, 1997.
Krankowsky, D., Lämmerzahl, P., and Mauersberger, K.: Isotopic measurements of stratospheric ozone, Geophys. Res. Lett., 27, 2593–2595, https://doi.org/10.1029/2000GL011812, 2000.
Lämmerzahl, P., Röckmann, T., Brenninkmeijer, C. A. M., Krankowsky, D., and Mauersberger, K.: Oxygen isotope composition of stratospheric carbon dioxide, Geophys. Res. Lett., 29, 23-21–23-24, https://doi.org/10.1029/2001GL014343, 2002.
Lee, H.-M., Henze, D. K., Alexander, B., and Murray, L. T.: Investigating the sensitivity of surface-level nitrate seasonality in Antarctica to primary sources using a global model, Atmos. Environ., 89, 757–767, https://doi.org/10.1016/j.atmosenv.2014.03.003, 2014.
Legrand, M. R. and Delmas, R. J.: Relative contributions of tropospheric and stratospheric sources to nitrate in Antarctic snow, Tellus B, 38, 236–249, https://doi.org/10.3402/tellusb.v38i3-4.15132, 1986.
Li, J., Zhang, X., Orlando, J., Tyndall, G., and Michalski, G.: Quantifying the nitrogen isotope effects during photochemical equilibrium between NO and NO2: implications for δ15N in tropospheric reactive nitrogen, Atmos. Chem. Phys., 20, 9805–9819, https://doi.org/10.5194/acp-20-9805-2020, 2020.
Li, J., Davy, P., Harvey, M., Katzman, T., Mitchell, T., and Michalski, G.: Nitrogen isotopes in nitrate aerosols collected in the remote marine boundary layer: Implications for nitrogen isotopic fractionations among atmospheric reactive nitrogen species, Atmos. Environ., 245, 118028, https://doi.org/10.1016/j.atmosenv.2020.118028, 2021.
Li, Y., Shi, G., Chen, Z., Lan, M., Ding, M., Li, Z., and Hastings, M. G.: Significant Latitudinal Gradient of Nitrate Production in the Marine Atmospheric Boundary Layer of the Northern Hemisphere, Geophys. Res., Lett., 49, e2022GL100503, https://doi.org/10.1029/2022GL100503, 2022.
Lim, S., Lee, M., Savarino, J., and Laj, P.: Oxidation pathways and emission sources of atmospheric particulate nitrate in Seoul: based on δ15N and Δ17O measurements, Atmos. Chem. Phys., 22, 5099–5115, https://doi.org/10.5194/acp-22-5099-2022, 2022.
Lyons, J. R.: Transfer of mass-independent fractionation in ozone to other oxygen-containing radicals in the atmosphere, Geophys. Res. Lett., 28, 3231–3234, https://doi.org/10.1029/2000GL012791, 2001.
Madronich, S., McKenzie, R. L., Björn, L. O., and Caldwell, M. M.: Changes in biologically active ultraviolet radiation reaching the Earth's surface, J. Photoch. Photobio. B, 46, 5–19, https://doi.org/10.1016/S1011-1344(98)00182-1, 1998.
Mauersberger, K., Krankowsky, D., and Janssen, C.: Oxygen Isotope Processes and Transfer Reactions, Space Sci. Rev., 106, 265–279, https://doi.org/10.1023/A:1024650007258, 2003.
McCabe, J. R., Boxe, C. S., Colussi, A. J., Hoffmann, M. R., and Thiemens, M. H.: Oxygen isotopic fractionation in the photochemistry of nitrate in water and ice, J. Geophys. Res., 110, D15310, https://doi.org/10.1029/2004JD005484, 2005.
Meusinger, C., Berhanu, T. A., Erbland, J., Savarino, J., and Johnson, M. S.: Laboratory study of nitrate photolysis in Antarctic snow. I. Observed quantum yield, domain of photolysis, and secondary chemistry, J. Chem. Phys., 140, 244305, https://doi.org/10.1063/1.4882898, 2014.
Morin, S., Savarino, J., Frey, M. M., Yan, N., Bekki, S., Bottenheim, J. W., and Martins, J. M. F.: Tracing the Origin and Fate of NOx in the Arctic Atmosphere Using Stable Isotopes in Nitrate, Science, 322, 730–732, https://doi.org/10.1126/science.1161910, 2008.
Morin, S., Savarino, J., Frey, M. M., Domine, F., Jacobi, H.-W., Kaleschke, L., and Martins, J. M. F.: Comprehensive isotopic composition of atmospheric nitrate in the Atlantic Ocean boundary layer from 65° S to 79° N, J. Geophys. Res., 114, D05303, https://doi.org/10.1029/2008JD010696, 2009.
Morin, S., Erbland, J., Savarino, J., Domine, F., Bock, J., Friess, U., Jacobi, H.-W., Sihler, H., and Martins, J. M. F.: An isotopic view on the connection between photolytic emissions of NOx from the Arctic snowpack and its oxidation by reactive halogens, J. Geophys. Res., 117, D00R08, https://doi.org/10.1029/2011JD016618, 2012.
Murray, L. T., Mickley, L. J., Kaplan, J. O., Sofen, E. D., Pfeiffer, M., and Alexander, B.: Factors controlling variability in the oxidative capacity of the troposphere since the Last Glacial Maximum, Atmos. Chem. Phys., 14, 3589–3622, https://doi.org/10.5194/acp-14-3589-2014, 2014.
Murray, L. T., Leibensperger, E. M., Orbe, C., Mickley, L. J., and Sulprizio, M.: GCAP 2.0: a global 3-D chemical-transport model framework for past, present, and future climate scenarios, Geosci. Model Dev., 14, 5789–5823, https://doi.org/10.5194/gmd-14-5789-2021, 2021.
Pilegaard, K., Skiba, U., Ambus, P., Beier, C., Brüggemann, N., Butterbach-Bahl, K., Dick, J., Dorsey, J., Duyzer, J., Gallagher, M., Gasche, R., Horvath, L., Kitzler, B., Leip, A., Pihlatie, M. K., Rosenkranz, P., Seufert, G., Vesala, T., Westrate, H., and Zechmeister-Boltenstern, S.: Factors controlling regional differences in forest soil emission of nitrogen oxides (NO and N2O), Biogeosciences, 3, 651–661, https://doi.org/10.5194/bg-3-651-2006, 2006.
Quinn, P. K., Shaw, G., Andrews, E., Dutton, E. G., Ruoho-Airola, T., and Gong, S. L.: Arctic haze: current trends and knowledge gaps, Tellus B, 59, 99–114, https://doi.org/10.1111/j.1600-0889.2006.00238.x, 2007.
Röthlisberger, R., Hutterli, M. A., Sommer, S., Wolff, E. W., and Mulvaney, R.: Factors controlling nitrate in ice cores: Evidence from the Dome C deep ice core, J. Geophys. Res.-Atmos., 105, 20565–20572, https://doi.org/10.1029/2000JD900264, 2000.
Savarino, J., Kaiser, J., Morin, S., Sigman, D. M., and Thiemens, M. H.: Nitrogen and oxygen isotopic constraints on the origin of atmospheric nitrate in coastal Antarctica, Atmos. Chem. Phys., 7, 1925–1945, https://doi.org/10.5194/acp-7-1925-2007, 2007.
Savarino, J., Bhattacharya, S. K., Morin, S., Baroni, M., and Doussin, J.-F.: The NO + O3 reaction: A triple oxygen isotope perspective on the reaction dynamics and atmospheric implications for the transfer of the ozone isotope anomaly, J. Chem. Phys., 128, 194303, https://doi.org/10.1063/1.2917581, 2008.
Savarino, J., Vicars, W. C., Legrand, M., Preunkert, S., Jourdain, B., Frey, M. M., Kukui, A., Caillon, N., and Gil Roca, J.: Oxygen isotope mass balance of atmospheric nitrate at Dome C, East Antarctica, during the OPALE campaign, Atmos. Chem. Phys., 16, 2659–2673, https://doi.org/10.5194/acp-16-2659-2016, 2016.
Seinfeld, J. H. and Pandis, S. N.: Atmospheric chemistry and physics: from air pollution to climate change, John Wiley & Sons, ISBN 978-1-118-94740-1, 2016.
Shi, G., Buffen, A. M., Hastings, M. G., Li, C., Ma, H., Li, Y., Sun, B., An, C., and Jiang, S.: Investigation of post-depositional processing of nitrate in East Antarctic snow: isotopic constraints on photolytic loss, re-oxidation, and source inputs, Atmos. Chem. Phys., 15, 9435–9453, https://doi.org/10.5194/acp-15-9435-2015, 2015.
Shi, G., Buffen, A. M., Ma, H., Hu, Z., Sun, B., Li, C., Yu, J., Ma, T., An, C., Jiang, S., Li, Y., and Hastings, M. G.: Distinguishing summertime atmospheric production of nitrate across the East Antarctic Ice Sheet, Geochim. Cosmochim. Ac., 231, 1–14, https://doi.org/10.1016/j.gca.2018.03.025, 2018.
Shi, G., Ma, H., Zhu, Z., Hu, Z., Chen, Z., Jiang, S., An, C., Yu, J., Ma, T., Li, Y., Sun, B., and Hastings, M. G.: Using stable isotopes to distinguish atmospheric nitrate production and its contribution to the surface ocean across hemispheres, Earth Planet. Sc. Lett., 564, 116914, https://doi.org/10.1016/j.epsl.2021.116914, 2021.
Shi, G., Li, C., Li, Y., Chen, Z., Ding, M., Ma, H., Jiang, S., An, C., Guo, J., Sun, B., and Hastings, M. G.: Isotopic constraints on sources, production, and phase partitioning for nitrate in the atmosphere and snowfall in coastal East Antarctica, Earth Planet. Sc. Lett., 578, 117300, https://doi.org/10.1016/j.epsl.2021.117300, 2022.
Shi, G., Buffen, A. M., Hu, Y., Chai, J., Li, Y., Wang, D., and Hastings, M. G.: Modeling the Complete Nitrogen and Oxygen Isotopic Imprint of Nitrate Photolysis in Snow, Geophys. Res. Lett., 50, e2023GL103778, https://doi.org/10.1029/2023GL103778, 2023.
Sillman, S.: The relation between ozone, NOx and hydrocarbons in urban and polluted rural environments, Atmos. Environ., 33, 1821–1845, https://doi.org/10.1016/S1352-2310(98)00345-8, 1999.
Sofen, E. D., Alexander, B., Steig, E. J., Thiemens, M. H., Kunasek, S. A., Amos, H. M., Schauer, A. J., Hastings, M. G., Bautista, J., Jackson, T. L., Vogel, L. E., McConnell, J. R., Pasteris, D. R., and Saltzman, E. S.: WAIS Divide ice core suggests sustained changes in the atmospheric formation pathways of sulfate and nitrate since the 19th century in the extratropical Southern Hemisphere, Atmos. Chem. Phys., 14, 5749–5769, https://doi.org/10.5194/acp-14-5749-2014, 2014.
Vicars, W. C. and Savarino, J.: Quantitative constraints on the 17O-excess (Δ17O) signature of surface ozone: Ambient measurements from 50° N to 50° S using the nitrite-coated filter technique, Geochim. Cosmochim. Ac., 135, 270–287, https://doi.org/10.1016/j.gca.2014.03.023, 2014.
Walters, W. W., Michalski, G., Böhlke, J. K., Alexander, B., Savarino, J., and Thiemens, M. H.: Assessing the Seasonal Dynamics of Nitrate and Sulfate Aerosols at the South Pole Utilizing Stable Isotopes, J. Geophys. Res.-Atmos., 124, 8161–8177, https://doi.org/10.1029/2019JD030517, 2019.
Winton, V. H. L., Ming, A., Caillon, N., Hauge, L., Jones, A. E., Savarino, J., Yang, X., and Frey, M. M.: Deposition, recycling, and archival of nitrate stable isotopes between the air–snow interface: comparison between Dronning Maud Land and Dome C, Antarctica , Atmos. Chem. Phys., 20, 5861–5885, https://doi.org/10.5194/acp-20-5861-2020, 2020.
Wolff, E. W.: Nitrate in polar ice, Ice core studies of global biogeochemical cycles, Springer, Berlin, Heidelberg, 195–224, https://doi.org/10.1007/978-3-642-51172-1_10, 1995.
Wolff, E. W., Jones, A. E., Bauguitte, S. J.-B., and Salmon, R. A.: The interpretation of spikes and trends in concentration of nitrate in polar ice cores, based on evidence from snow and atmospheric measurements, Atmos. Chem. Phys., 8, 5627–5634, https://doi.org/10.5194/acp-8-5627-2008, 2008.
Zatko, M., Erbland, J., Savarino, J., Geng, L., Easley, L., Schauer, A., Bates, T., Quinn, P. K., Light, B., Morison, D., Osthoff, H. D., Lyman, S., Neff, W., Yuan, B., and Alexander, B.: The magnitude of the snow-sourced reactive nitrogen flux to the boundary layer in the Uintah Basin, Utah, USA, Atmos. Chem. Phys., 16, 13837–13851, https://doi.org/10.5194/acp-16-13837-2016, 2016.
Zatko, M. C., Grenfell, T. C., Alexander, B., Doherty, S. J., Thomas, J. L., and Yang, X.: The influence of snow grain size and impurities on the vertical profiles of actinic flux and associated NOx emissions on the Antarctic and Greenland ice sheets, Atmos. Chem. Phys., 13, 3547–3567, https://doi.org/10.5194/acp-13-3547-2013, 2013.
Zhang, L., Jacob, D. J., Knipping, E. M., Kumar, N., Munger, J. W., Carouge, C. C., van Donkelaar, A., Wang, Y. X., and Chen, D.: Nitrogen deposition to the United States: distribution, sources, and processes, Atmos. Chem. Phys., 12, 4539–4554, https://doi.org/10.5194/acp-12-4539-2012, 2012.
- Abstract
- Introduction
- Model description
- Model evaluations
- Results and discussion
- Model sensitivity tests: the impact of fexp and fc
- Conclusions and implications
- Appendix A: Derivation of the nitrate mass and isotopic balance equations during photolysis (Eqs. 7–9)
- Appendix B: Method for calculating Δ17O(NO) of FP
- Appendix C: Adjusting the photolysis quantum yield used in Dome C simulations
- Appendix D: Fitting the shape parameters for skin layer nitrate concentration at Dome C
- Code and data availability
- Author contributions
- Competing interests
- Disclaimer
- Acknowledgements
- Financial support
- Review statement
- References