the Creative Commons Attribution 4.0 License.
the Creative Commons Attribution 4.0 License.
Gravity waves generated by the Hunga Tonga–Hunga Ha′apai volcanic eruption and their global propagation in the mesosphere/lower thermosphere observed by meteor radars and modeled with the High-Altitude general Mechanistic Circulation Model
Sharon L. Vadas
Erich Becker
Alan Liu
Alexander Kozlovsky
Diego Janches
Zishun Qiao
Witali Krochin
Guochun Shi
Jie Zeng
Peter Brown
Denis Vida
Neil Hindley
Christoph Jacobi
Damian Murphy
Ricardo Buriti
Vania Andrioli
Paulo Batista
John Marino
Scott Palo
Denise Thorsen
Masaki Tsutsumi
Njål Gulbrandsen
Satonori Nozawa
Mark Lester
Kathrin Baumgarten
Johan Kero
Evgenia Belova
Nicholas Mitchell
Tracy Moffat-Griffin
The Hunga Tonga–Hunga Ha′apai volcano erupted on 15 January 2022, launching Lamb waves and gravity waves into the atmosphere. In this study, we present results using 13 globally distributed meteor radars and identify the volcanogenic gravity waves in the mesospheric/lower thermospheric winds. Leveraging the High-Altitude Mechanistic general Circulation Model (HIAMCM), we compare the global propagation of these gravity waves. We observed an eastward-propagating gravity wave packet with an observed phase speed of 240 ± 5.7 m s−1 and a westward-propagating gravity wave with an observed phase speed of 166.5 ± 6.4 m s−1. We identified these waves in HIAMCM and obtained very good agreement of the observed phase speeds of 239.5 ± 4.3 and 162.2 ± 6.1 m s−1 for the eastward the westward waves, respectively. Considering that HIAMCM perturbations in the mesosphere/lower thermosphere were the result of the secondary waves generated by the dissipation of the primary gravity waves from the volcanic eruption, this affirms the importance of higher-order wave generation. Furthermore, based on meteor radar observations of the gravity wave propagation around the globe, we estimate the eruption time to be within 6 min of the nominal value of 15 January 2022 04:15 UTC, and we localized the volcanic eruption to be within 78 km relative to the World Geodetic System 84 coordinates of the volcano, confirming our estimates to be realistic.
- Article
(12498 KB) - Full-text XML
- BibTeX
- EndNote
The Hunga Tonga–Hunga Ha′apai (HTHH) volcano erupted on 15 January 2022, with the strongest eruption occurring at 04:15 UTC. This eruption injected a gigantic amount of water vapor into the stratosphere and mesosphere (Millán et al., 2022), generated an ash plume reaching up to 57 km in altitude (Carr et al., 2022), and launched Lamb waves and gravity waves into the atmosphere (Wright et al., 2022; Liu et al., 2023; Vadas et al., 2023a; Watanabe et al., 2022). Because of the very large amplitudes involved, this eruption provided a unique opportunity to study the gravity wave propagation around the globe throughout all atmospheric layers from the troposphere to the thermosphere and ionosphere. Many previous studies focused on the Lamb waves generated by the sudden and vigorous explosion of the volcano in the Pacific (Wright et al., 2022; Matoza et al., 2022; Liu et al., 2023). Total electron content (TEC) observations around the Pacific region indicated strong ionospheric disturbances associated with the Hunga Tonga eruption (Themens et al., 2022; Heki, 2022; Yamada et al., 2022; Zhang et al., 2022). Recent modeling and observations indicate that these disturbances seemed to be the result of secondary gravity wave generation rather than a direct propagation of the Lamb wave for which the upper mesosphere is an evanescent region due to the lower speed of sound (Vadas et al., 2023b; Stober et al., 2023). The more complicated propagation conditions in the mesosphere with the extremely cold mesopause and highly variable winds indicate why observations of the Hunga Tunga eruption are underrepresented in the literature for this atmospheric layer. Wright et al. (2022) reported a signature of the Hunga Tonga-caused waves over Hawaii seen in airglow. Meteor radar observations involving the Nordic Meteor Radar Cluster (Nordic) and the Chilean Observation Network De MeteOr Radars (CONDOR) indicated that the Lamb waves from HTHH were attenuated in the mesosphere/lower thermosphere (MLT) and that the strongest amplitudes and signatures of the volcanic eruption were found as eastward- and westward-propagating gravity waves with an intrinsic phase speed of about 210 m s−1 and horizontal wavelengths of 1600–2000 km (Stober et al., 2023).
Simulations of the TEC disturbances in the ionosphere and thermosphere reveal how MLT winds affect the upper atmosphere through E×B coupling (Miyoshi and Shinagawa, 2023; Shinbori et al., 2022). Such multistep vertical coupling, which results from the dissipation of primary gravity waves (GWs) from HTHH in the thermosphere is important for explaining why the volcanogenic waves have much higher phase speeds in TEC observations (Themens et al., 2022; Vadas et al., 2023b) and in MIGHTI (Michelson Interferometer for Global High-resolution Thermospheric Imaging) neutral wind measurements in the thermosphere (Vadas et al., 2023a) as compared to the waves reported in the lower and middle atmosphere (Wright et al., 2022; Matoza et al., 2022; Stober et al., 2023). The HTHH event also provided a benchmark for the modeling of the volcano-triggered gravity waves and their global propagation in a variable background wind field. Simulations with Ground-to-topside model of Atmosphere and Ionosphere for Aeronomy (GAIA) and the Whole Atmosphere Community Climate Model with thermosphere and ionosphere eXtension (WACCM-X) modeled the GW and pseudo-Lamb waves and their propagation around the globe (Miyoshi and Shinagawa, 2023; Liu et al., 2023). In this study, we leverage the Model for gravity wavE SOurce, Ray trAcing and reConstruction (MESORAC)/High-Altitude Mechanistic general Circulation Model (HIAMCM) and demonstrate that concentric gravity wave structures generated by the HTHH eruption reached the thermosphere, causing perturbations in the neutral winds. Other studies based on the abovementioned models showed that the volcanic signature of the eruption also inhibited disturbances in TEC (Miyoshi and Shinagawa, 2023; Vadas et al., 2023b, a), which are well supported by coincident TEC observations.
In the present paper, we investigate the mesospheric propagation of gravity waves resulting from the HTHH eruption using globally distributed meteor radar (MR) observations covering the latitudes from 79° N on Svalbard to 78° S at McMurdo, Antarctica. We identified these gravity waves in wind measurements using 13 different meteor radars at various distances and azimuths from the eruption site, which allows us to infer the observed wave phase speeds for eastward and westward propagation with high accuracy. Furthermore, we demonstrate some asymmetries in the concentric gravity wave propagation, which led to characteristic amplitude variations in both the horizontal wind components as well as the vertical at certain stations. Furthermore, we perform a similar analysis using HIAMCM wind data to compare the observational results with the model wind fields (Vadas et al., 2023a).
Meteor radars have been used for decades to measure the winds and meteor flux in the MLT (Hocking et al., 1997, 2001; Holdsworth et al., 2004; Meek et al., 2013). The HTHH eruption presented an opportunity to demonstrate the capabilities of this technique to detect and trace GWs from a known source around the globe using a common and standardized analysis. The applied retrievals provide information about both horizontal wind components and also infer the vertical wind component using a Tikhonov regularization to account for the low measurement response (Rodgers, 2000; Stober et al., 2022). On the other hand, the biggest challenge in processing the data from monostatic single station data is to achieve a temporal resolution of 10 min while still keeping a good altitude coverage of at least 10 km over the meteor layer. Considering the long vertical wavelength of the HTHH GWs, we kept the frequently used vertical resolution of 2 km but with a 5 km vertical averaging window centered around the respective altitude, including a Gaussian weighting (Hindley et al., 2022), leading to an effective vertical resolution of approximately 4 km (Stober et al., 2023). On the other hand, a temporal averaging of more than 10 min substantially weakens the volcanic gravity wave signature and, thus, reduces the probability of identifying the HTHH GWs in the wind measurements.
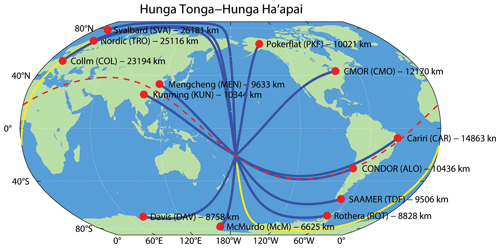
Figure 1Robinson projection of the globe centered on the Pacific. The solid blue lines show the shortest GC distance between the volcanic eruption and the center of each station. The solid yellow line reflects the long GC path for the European radars. The dashed red line indicates the full GC path connecting the volcano and ALO, CAR, MEN, and KUN.
We identified the HTHH GWs using measurements from 13 meteor radars around the globe. The meteor radars are located at McMurdo (Marino et al., 2022), Davis, Rothera (ROT) (Dempsey et al., 2021), in Argentina the Southern Argentina Agile Meteor Radar (SAAMER) Tierra del Fuego (TDF) (Fritts et al., 2010), CONDOR represented by the Andes Lidar Observatory (ALO) (Stober et al., 2021b), Cariri (CAR) (Andrioli et al., 2013), Canadian Meteor Orbit Radar (CMOR) (in this study also – CMO) (Webster et al., 2004; Brown et al., 2010), Poker Flat (PKF), Mengcheng (MEN) (Yang et al., 2023), Kunming (KUN) (Zeng et al., 2022), Svalbard (SVA) (Hall and Tsutsumi, 2020), the Nordic Meteor Radar Cluster (Nordic) represented by the Tromsø (TRO) (Hall and Tsutsumi, 2013; Stober et al., 2021b), and Collm (COL) (Jacobi et al., 2007). The Nordic Meteor Radar Cluster data were reduced to be equivalent to a monostatic meteor radar located at the reference coordinate, which is close to Tromsø. All monostatic meteor radars were analyzed by applying a retrieval algorithm including the World Geodetic Reference System (WGS84; National Imagery and Mapping Agency, 2000) to compute the east-north-up coordinates at the geographic location of each detected meteor. Nonlinear error propagation was considered to incorporate the spatial and temporal wind shears within each time–altitude bin (Gudadze et al., 2019; Stober et al., 2021a). More details of the implementation can be found in Stober et al. (2021b, 2022). Figure 1 shows a map visualizing all meteor radar locations. The blue lines indicate the shortest great circle (GC) distance between each meteor radar and HTHH. The dashed red line indicates the full GC path connecting the volcano and ALO, CAR, MEN, and KUN. The yellow line indicates the long GC path along the eastward direction connecting HTHH to the European radars. The lines indicate idealized propagation paths of the secondary GWs caused by the eruption and are used to measure the distances. The distances shown in the map are computed at 90 km altitude to account for the mesospheric propagation.
Marino et al. (2022)Dempsey et al. (2021)Fritts et al. (2010)Yang et al. (2023)Zeng et al. (2022)Stober et al. (2021b)Andrioli et al. (2013)Webster et al. (2004)Brown et al. (2010)Hall and Tsutsumi (2020)Hall and Tsutsumi (2013)Stober et al. (2021b)Jacobi et al. (2007)Table 1Summary of the geographic locations for each meteor radar and GC distances relative to HTHH (20.54° S, 175.38° W). The term short/long refers to the shortest/longest distance along the GC. The brackets after the GC distance indicate whether the westward or eastward HTHH GWs reached the station along this path.
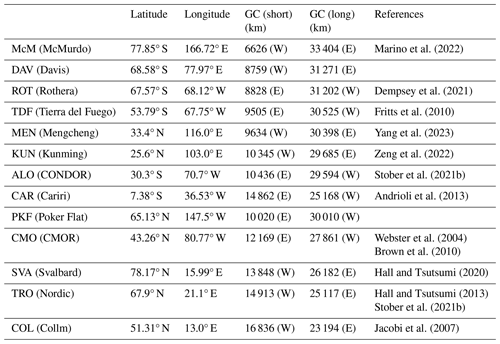
The meteor radars used in this study provide good coverage around the Pacific to investigate potential differences or asymmetries of the volcano-triggered GWs. Furthermore, four stations, namely, MEN, KUN, ALO, and CAR, are located very close to the same GC (dashed red line); thus, it is straightforward to infer differences in the eastward and westward propagation of the GWs. A summary of all stations with their geographic coordinates and their eastward and westward GC distances from the HTHH eruption site are summarized in Table 1.
HIAMCM is a gravity-wave-resolving general circulation model (GCM) from the surface to about 400 km altitude. HIAMCM has a triangular spectral truncation at a horizontal wavenumber of 240, which results in an approximate grid spacing of 55 km and a resolved horizontal wavelength of λh=165 km. The vertical spacing changes with altitude. From the boundary layer up to z=100 km (corresponding to hPa) the vertical level spacing is 600 m. In the thermosphere, the vertical grid resolution increases to about 5 km at 300 km altitude. In total, there are 261 full-model layers with the highest layer at hPa at approximately z=400 km. A detailed description of HIAMCM is found in Becker and Vadas (2020). Recently, it was demonstrated that HIAMCM can be nudged to a meteorological reanalysis such as the Modern-Era Retrospective analysis for Research and Applications (MERRA-2). The nudging is implemented in the spectral domain, which allows us to specify realistic large-scale meteorological fields through which the resolved GWs propagate (Becker et al., 2022).
Leveraging these new capabilities, the primary and secondary GWs resulting from the HTHH eruption were simulated with the Model for gravity wavE SOurce, Ray trAcing and reConstruction (MESORAC) and HIAMCM, respectively, and were analyzed to study the impact of the volcanic eruption on the thermospheric–ionospheric system (Vadas et al., 2023b, a). The MESORAC calculates the primary GWs created from localized (in space and time) vertical updrafts of air using the Fourier–Laplace analytical fully-compressible solutions (Vadas, 2013). These updrafts, which are mechanical displacements of stratospheric/mesospheric air, are identified from NOAA's Geostationary Operational Environmental Satellite (GOES) data. The atmosphere responds by radiating concentric rings of GWs (Vadas and Liu, 2009; Vadas et al., 2012). MESORAC ray traces these GWs forward in time, including their phases, and reconstructs the primary GW field using the GW phases and the GW dissipative dispersion and polarization relations (Vadas and Fritts, 2005, 2009). The background atmosphere is taken from the HIAMCM simulation for 15 January 2022 without the Tonga eruption (base case) using scales with λh>2000 km. Wave dissipation is due to molecular diffusion and turbulent diffusion from saturation. The body forces and heating events created by the dissipation of primary GWs are calculated as functions of space and time as in Vadas (2013). These ambient-flow effects are then added to the momentum and thermodynamic equations of HIAMCM to simulate the secondary GWs from the Tonga eruption (Vadas et al., 2023a). The turbulent diffusion coefficient D0 is tuned to 2000 m2 s−1, because it results in GW amplitudes that are closest to the ICON-MIGHTI large-scale amplitudes without destabilizing HIAMCM. Larger values of D0 result in smaller GW amplitudes, which is inconsistent with the ICON data.
In this study, we focus on the mesospheric data from HIAMCM between 80–100 km and with a temporal resolution of 5 min using the model runs from Vadas et al. (2023a). The simulated perturbations are defined as the differences between the results from the “Tonga run” (with inputs from MESORAC) and the “base run” (without inputs from MESORAC). The HTHH GWs are extracted by subtracting a reference run from the disturbance simulation. Furthermore, we apply an observational filter for each meteor radar to account for the spatial and temporal sampling of these radars similar to previous studies (Pokhotelov et al., 2018; Stober et al., 2020, 2021c).
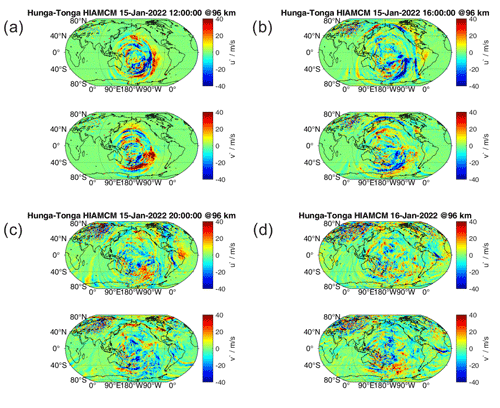
Figure 2HIAMCM zonal wind perturbations u′ (upper panel) and meridional wind perturbations v′ (lower panel) from 15 January 2022 at 12:00, 16:00, 20:00, and 24:00 UT (a–d).
Figure 2 shows maps of how the HTHH secondary GWs propagated around the Earth at four different times on 15 January: 12:00, 16:00, 20:00, and 24:00 UT. Note that each panel in Fig. 2 consists of an upper and a lower part that shows the zonal and the meridional winds, respectively. The HIAMCM GWs propagate radially away from the HTHH eruption site. However, the model also reflects a substantial radial asymmetry in the GW amplitudes, indicating that the eruption resulted in different wavefronts for different azimuthal directions. This asymmetry is also reflected in the keograms for the zonal and meridional wind at the longitude and latitude of HTHH, which are shown in Figs. 3 and 4. The keograms visualize the propagation of the HTHH GW perturbations with latitude and longitude. The black lines show the theoretical lines, assuming a phase velocity of 240 and 165 m s−1.
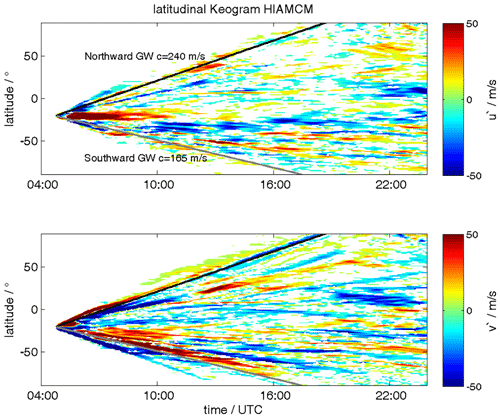
Figure 3Latitudinal keograms of the zonal and meridional wind perturbations from HIAMCM for the 15 January 2022. The reference latitude and longitude are the geographic coordinates of HTHH. The black lines show the theoretical lines, assuming a phase velocity of an eastward-propagating HTHH GW with 240 m s−1 and a westward HTHH GW with 165 m s−1.
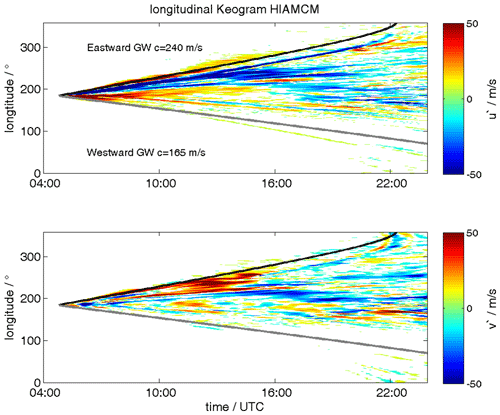
Figure 4Longitudinal keograms of the zonal and meridional wind perturbations from HIAMCM for 15 January 2022. Otherwise, the same as Fig. 3.
The largest amplitudes are found for the southeastward propagation (towards the Andes and the Antarctic Peninsula), whereas much smaller GW amplitudes were simulated over Australia, China, and the North American sector. This asymmetry (of the secondary GWs) is caused by the north and southward orientation of the local body forces (i.e., horizontal accelerations) in the thermosphere that are generated by the localized deposition of momentum that occurred at z ∼ 120–180 km where the primary GWs from Tonga broke and dissipated (Vadas et al., 2023a). These primary GWs were mainly propagating meridionally when they dissipated and created the body forces, because the background wind was strongly meridional in the thermosphere at the time. It is well-known that a local horizontal body force generates an asymmetric GW distribution, with the maximum amplitudes being in and against the body force direction and with zero amplitude perpendicular to the body force direction (Vadas et al., 2003; Vadas and Becker, 2018; Themens et al., 2022).
In addition, some of the additional azimuthal GW asymmetries may be due to the complex eruption sequence (Vadas et al., 2023a). Results from HIAMCM also show that the HTHH GWs traveling westward along the GC towards Europe are disturbed by the polar vortex in the Northern Hemisphere; thus, almost no coherent wavefront arrives over Scandinavia, although this would have been the shortest distance to HTHH. On the other hand, the HIAMCM results suggest that the most coherent wavefront from HTHH propagated towards South America and even gained strength over the Atlantic Ocean before reaching central Europe. This is consistent with the observations presented in Stober et al. (2023) and is related to the geometric refocusing of rays propagating on a sphere and approaching the midpoint to the antipode in North Africa (Matoza et al., 2022; Amores et al., 2022).
Tracking the HTHH secondary GWs around the globe from meteor radar wind observations requires identifying the whole GW packet rather than one distinct feature that can be found in all observations. The main eruption lasted 3 h and consisted of many vigorous detonations resulting in updrafts (Vadas et al., 2023a), triggering the HTHH primary GW field. The secondary GWs were generated by the local body forces created by the dissipation of the primary GWs in the mesosphere and thermosphere. Considering the HIAMCM simulation of the HTHH GW packet illustrates that there is a huge variety of possible amplitudes and shapes of the GW packet depending on the different GC paths along which the waves are propagating. Furthermore, derived phase velocities will depend on the ability to detect the leading edge of the HTHH GW packet rather than on the maximum amplitude, which often corresponds to a later time of the eruption sequence, to identify the correct arrival time in the observation volume. Thus, the time of arrival estimates are prone to large uncertainties that have to be considered in the further analysis of HTHH GWs. In the following, we briefly outline the analysis procedure.
We examined the 10 min resolution meteor radar winds and subtracted a 4 h running window to remove traveling planetary waves (mostly the quasi-2-day-wave (Q2DW) in the Southern Hemisphere), atmospheric tides, and GWs with observed periods longer than 4 h. The vertically integrated anomalies were then inspected to identify the HTHH GW packet by searching for peaks in the zonal, meridional, and total horizontal wind speeds. Our observations can be grouped into three different classes depending on the shape of the GW packet, the amplitude, or a superposition with other waves. The timing was then estimated for all stations that showed a sinusoidal wave by the onset of the GW packet. Typical examples of these stations are ALO, PKF, and TDF. For the other stations, we searched for the first GW amplitude peak in an interval around the estimated arrival time, e.g., CMOR, McM, and DAV.
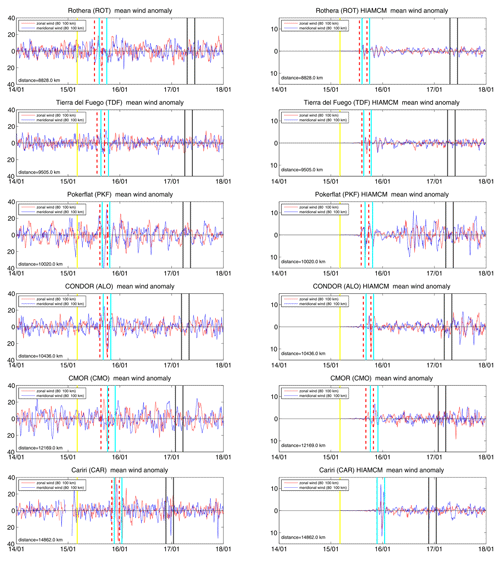
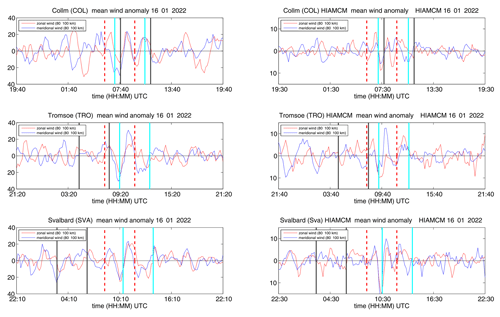
Figure 5Wind anomalies for the meteor radars located eastward of HTHH and corresponding anomalies from HIAMCM. The date ticks are given at 00:00 UTC of the date. The time of the volcanic eruption is indicated by a vertical yellow line. The vertical cyan lines span the predicted arrival of the eastward-propagating GW. The vertical black lines indicate the timing for the westward-propagating HTHH GW packet. The dashed vertical lines indicate the 1σ interval of the time picks for each station. Note that HIAMCM shows perturbations only to the right of the yellow line because we plotted the differences between the Tonga run and the base run (see Sect. 3). A higher resolution of the HTHH GW wave packet is found in Appendix A1.
Figure 5 compares the theoretical arrival times derived from the best fit over all stations along a GC path of the wave packet leading edge for a subset of meteor radars (left column) and HIAMCM winds from Tonga run minus base run ( right column) from the Antarctic Peninsula to Alaska. The time of the first eruption is shown as a vertical yellow line. The vertical cyan lines indicate the arrival times of the eastward-propagating HTHH GW packet estimated from the best-fit phase speed using all stations that detected this wave, whereas the vertical black lines show the best fit of the arrival time of the westward wave. The dashed vertical red lines show the 1σ range of the leading edge arrival time for each station. All vertical lines enclose a time window of 3 h, corresponding to the time of the major eruption sequence. The y axis for the HIAMCM winds is reduced by a factor of 2.8 to mitigate the smaller wind perturbations in the model. The observations and HIAMCM show a remarkable agreement for several stations in both the timing and wave pattern at ALO, PKF, or CAR. Only CMOR exhibits a visible difference in the observed arrival time compared to HIAMCM. Although CMOR is one of the most powerful systems, concerning the number of meteor detections and wind altitude coverage used in this study, the HTHH GW is barely identifiable in the zonal wind component; the observations indicate a much less clear wavefront and an earlier arrival time compared to the model and concerning the other stations. We note that the diurnal variation of the meteor count rate has an impact on the altitude coverage as well as the statistical uncertainties of the retrieved winds. KUN, MEN, and CAR are most significantly affected by the diurnal count rate.
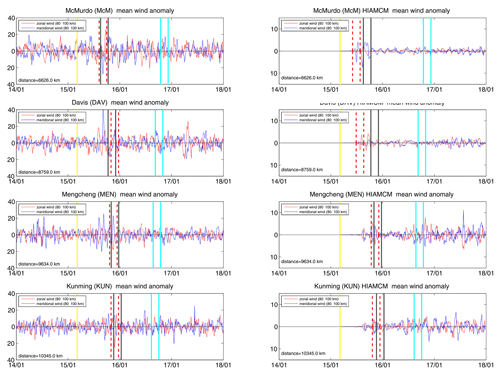
The comparison of the wind anomalies of the Antarctic stations of McM and DAV and the two radars located in China (MEN and KUN) are presented in Fig. 6. Although the two meteor radars on the Antarctic continent are located at the closest distance to HTHH, the GW signature is barely visible in the data. The HTHH GW is mainly identified by a coherent sinusoidal signature (between the vertical lines), which was also found in other stations. However, the amplitude of this wave signature does not exceed the background atmospheric signal for these two stations. Furthermore, these two stations also reflect the largest discrepancy in the arrival time between the observations and HIAMCM (see Sect. 7). Interestingly, KUN and MEN meteor radars observed the HTHH GW with a much smaller amplitude than their counterparts eastward of the volcano in South America (ALO and CAR), even though all these stations are roughly on the same GC. Our results therefore support the azimuthal asymmetry of the GW zonal and meridional wind perturbations in HIAMCM. The increased variability in the wind anomalies before HTHH in the meteor radar data is mainly due to the diurnal variation in the meteor count rate, which reached a minimum during these times. Another important aspect is that the zonal and meridional winds were out of phase for the MEN and KUN stations, indicating a northwestward propagation, whereas CAR and ALO exhibit an in-phase relationship between the two wind components, which is expected for eastward-propagating GWs. Also, the arrival times between HIAMCM and the Chinese meteor radars are in much better agreement compared to McM and DAV.
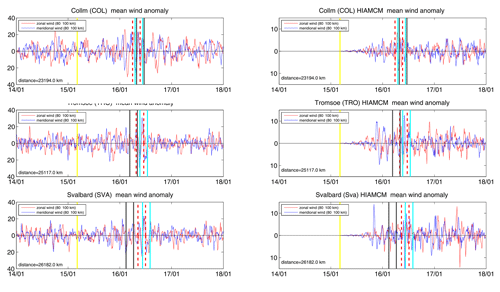
Wind anomalies above the European sector are shown in Fig. 7. We identified the eastward-propagating GWs (long GC path) by searching for identical patterns in the wind anomalies for all three stations. The vertical cyan lines mark a coherent wave structure that exhibits an in-phase behavior of the zonal and meridional winds (as expected since the GWs are propagating northeastward), similar to what was found for all the South American stations. HIAMCM winds also show some remnants of the eastward HTHH GW over the European sector. In particular, the phase behavior between HIAMCM and observations exhibits a remarkable agreement at SVA, TRO, and COL. Overall, the data are much noisier in the Northern Hemisphere winter due to GWs from orographic forcing and the polar vortex. The increased variability, compared to pre-HTHH-eruption time, in the observations may be due to the generation of GWs created by seeding of GWs by the Lamb wave that arrived a few hours before the HTHH GWs (Stober et al., 2023). In addition, we note that Lamb waves likely create a continuum of GWs. For the HTHH Lamb waves, the seeding process seems to occur at or above z ≃ 110 km (Vadas et al., 2023b).
Gravity wave phase speeds are derived from all meteor radar stations using the times of arrival for each station. The phase speeds of the GW packet with the largest amplitude are determined by fitting a distance vs. time and time vs. distance to account for errors in the time estimates as well as for the sizes of the observation volumes. We assumed a 3 h uncertainty for the time corresponding to the most active part of the eruption sequence. The spatial uncertainty is given by the diameter of the observation volume, and we used 350 km for all stations.
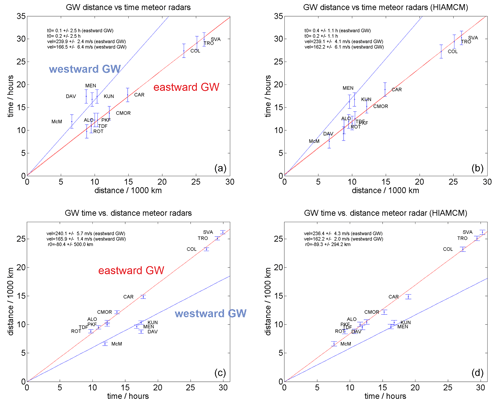
Figure 8Gravity wave phase speed analysis for the meteor radars (a, c) and HIAMCM (b, d) as distance versus time and time versus distance plots. The red line indicates the best fit for the eastward-propagating HTHH GW, and the blue line is the best fit for the westward-propagating HTHH GW.
Figure 8 shows four panels summarizing the analysis. The left column presents the meteor radar observations, and the right column presents the HIAMCM data. The observational data can be grouped in an eastward wave (red line) with an observed phase speed of 240 ± 5.7 m s−1 and a westward traveling GW (blue line) exhibiting an observed phase speed of 166 ± 6.4 m s−1. The fits were obtained by separating the stations according to their relative position (eastward or westward) of HTHH. The eastward stations of ROT, TDF, ALO, PKF, CMOR, CAR, COL, TRO, and SVA provide enough data to determine the eruption time to be within 6–12 min and eruption location to be within 80 km of the nominal HTHH coordinates in the WGS84 reference. The precision of the fitting coefficients significantly depends on the European stations. Due to the much larger distance and time between the eruptions, the errors of the individual measurements are less critical. The westward wave (blue) was analyzed using a regularized fit. The fit is regularized by a fixed eruption time t0=0 h and by a fixed location using the nominal HTHH coordinate. This strategy is necessary to account for the much smaller number of observations. The relative distance between DAV, KUN, and MEN and the volcano is almost identical, leaving essentially only McM as a second point. Thus, we added the westward HTHH wave signature that was found in ALO and already presented in Stober et al. (2023) to the fit.
The same analysis is applied to HIAMCM, and the fitted observed phase velocities for the eastward and westward HTHH GW packets are in very good agreement between the model and the observations. Only the Antarctic stations of McM and DAV show a substantial deviation. The Q2DW may explain this discrepancy, and it is clearly visible in the Southern Hemisphere at mesospheric altitudes in the meteor radar data (Stober et al., 2023) (see Sect. 7). However, there is no indication of this wave found in MERRA2; thus, due to the nudging of the large-scale dynamics in HIAMCM from reanalysis, it is also missing in the HIAMCM winds. The amplitude of the Q2DW is strongest in the meridional wind component and showed a clear northward wind direction during the time of eruption above the South American continent.
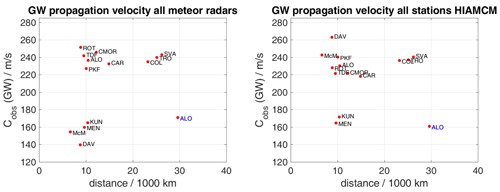
Finally, Fig. 9 compares the derived observed phase speed for each station separately relative to the distance along the GC path from the radars (left panel) and HIAMCM (right panel). The ALO station is added with both detections (eastward and westward GW packet) of the HTHH GW and, thus, appears at two distances representing the eastward and westward GC distance. There is a remarkable agreement for ALO, SVA, TRO, CAR, COL, MEN, and KUN to within ±5 m s−1 when comparing HIAMCM to the observations. Furthermore, this comparison confirms that there are two clusters that correspond to the eastward (240 m s−1) and westward (160 m s−1) HTHH GW packets. It is also obvious that the observed phase speeds remain roughly constant with distance from the volcano. Possible reasons for the exceptional behavior of DAV and McM in the HIAMCM data have already been discussed above.
Currently, there are contradicting interpretations of the meteor radar winds documented in the literature. Poblet et al. (2023) attributed the strong MLT wind perturbation found above CONDOR to be related to the L1 Lamb wave mode, although both the inferred horizontal wavelength and wave period seem to differ from the modeled L1 Lamb wave in WACCM-X simulations (Liu et al., 2023) by an order of magnitude.
This discrepancy between the attribution of HTHH wind perturbations to Lamb waves and GWs can be resolved using polarization relations. GWs show a distinct polarization relation depending on propagation direction and geographic location.
We evaluated the polarization relation for GW along the same GC at approximately the same distances for ALO and MEN. The GW polarization relation is given by Fritts and Alexander (2003);
Here is the intrinsic angular wave frequency; k and l correspond to the zonal and meridional wavenumbers, respectively; and f denotes the Coriolis parameter for a given latitude. The zonal and meridional monochromatic GW amplitude is given by and . Stober et al. (2023) estimated the horizontal wavelength λh=1600–2000 km and derived an intrinsic wave period of about 2 h to 2 h 20 min. (Due to the long horizontal wavelength, the intrinsic wave period is rather close to the observed wave period.) Based on these intrinsic wave parameters, we calculated a theoretical phase for the zonal and meridional wind perturbations caused by the HTHH GW at ALO and MEN. At MEN the zonal and meridional wind components are supposed to be out of phase by 160–170°, whereas at ALO both wind components of the leading HTHH GW should be in phase by 5–15°.
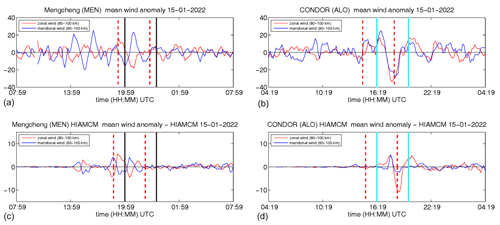
Figure 10Comparison of HTHH GW along the GC connecting HTHH, ALO, and MEN. Panels (a) and (b) show the meteor radar measurements, and panels (c) and (d) show the corresponding HIAMCM perturbation winds.
Figure 10 shows a comparison of the zonal and meridional wind perturbations from both meteor radars (upper panels) and the corresponding HIAMCM winds (lower panels). The meteor radars winds at MEN exhibit an antiphase relation between both wind components as estimated from the linear theory for this location, whereas at ALO we more or less see an in-phase relation between the meridional and zonal wind perturbations caused by the HTHH GW. This phase behavior is also found in the HIAMCM winds for both stations. A similar agreement is found at KUN. We obtained phase differences between 6–30° for ALO and about 160–180° for MEN, which is very close to the theoretical prediction. Thus, the meteor radar winds exhibit a signature of HTHH GWs that satisfy the polarization relation of GW derived from linear theory (Fritts and Alexander, 2003). The secondary GWs from HIAMCM reflect this phase behavior. Therefore, we can show from theory and the observed polarization that the observed waves are likely to be GWs and not the L1 Lamb wave.
Q2DWs are common during the hemispheric summer months (Fritts et al., 2019; Iimura et al., 2021). Long-term observations of temperatures from SABER show that wavenumber 3 dominates in the Southern Hemisphere (Tang and Gu, 2023). During the HTHH eruption in 2022, the meteor radar winds also exhibited a clear Q2DW periodicity in the background wind. Figure 11 shows the zonal and meridional winds after subtracting atmospheric tides and GW using an adaptive spectral filter (ASF) (Baumgarten and Stober, 2019; Stober et al., 2020). The longitudinal distance between DAV and ROT is Δlong=146.1°, which roughly corresponds to a wavenumber 3 structure (Δlong=120°). Although DAV and ROT are almost at the same latitude, only DAV exhibits a Q2DW signature in the zonal wind, whereas ROT reflects the Q2DW in both wind components. The phase difference between the zonal and meridional wind at ROT is Δϕ=90°. Based on the phase differences of mean winds from DAV, TDF, ROT, and ALO, we estimate the wavenumber for the Q2DW by producing a simple wave model to account for the latitudinal variability in the Q2DW amplitude in both horizontal wind components. This approach may be more robust given the sparsity of the observations and their latitudinal separation. Similar results are achieved when applying the phase differencing technique directly to DAV and ROT (He et al., 2021). Figure 12 shows an idealized Q2DW with wavenumber 3 projected on the globe for the Southern Hemisphere covering the latitudes between 70–0° S for the zonal and meridional wind components. The left panels show the zonal and meridional wind structure at the time of the first eruption, which is indicated as a vertical black line in Fig. 11. The right panels present the zonal and meridional wind structure upon the arrival of the HTHH GW on the South American continent 12 h later, which is indicated as a vertical red line in Fig. 11. There is also a weak signature of the Q2DW at CAR, which we used to constrain the amplitude at the Equator. We also examined other wavenumbers but found no equivalent agreement compared to wavenumber 3 for the Q2DW during the eruption.
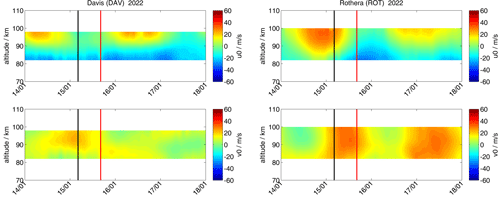
Figure 11Comparison of zonal and meridional mean winds, after subtracting tides and GW with the adaptive spectral filter, above DAV and ROT. The vertical black line indicates the first HTHH eruption at 04:15 UTC on 15 January 2022.
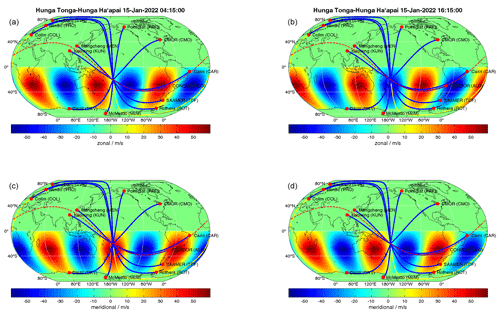
Figure 12Scheme of a westward-propagating Q2DW with wavenumber 3. Panels (a) and (c) show the zonal and meridional wind structure at the time of the eruption. Panels (b) and (d) indicate the Q2DW structure when the first HTHH GW arrives at the South American continent approximately 12 h later. Superimposed on the Q2DW structure, we visualize the GC routes between HTHH and each meteor radar.
The presence of the Q2DW resulted in some interesting effects on the propagation of the HTHH GW. During the eruption, the Q2DW showed a strong northward wind for the location of the volcano. Thus, the HTHH GWs directed towards DAV and McM faced a strong headwind of up to 30–60 m s−1 along the GC route, which explains the delayed signature of the volcanic GW above the Antarctic meteor radars. Furthermore, the cold polar summer mesopause temperatures at polar latitudes essentially provide a natural barrier and form an evanescent region at the MLT, limiting the observed amplitude of the HTHH wave (Vadas et al., 2023a), although DAV and McM were located at the closest distance to HTHH. A similar effect on the HTHH GW amplitude is also found at TDF and ROT.
The Q2DW also plays a crucial role in understanding some differences between HIAMCM and the observations for the meteor radars in Antarctica and South America. HIAMCM is nudged to MERRA2; hence, the large-scale circulation is prescribed (Becker et al., 2022). Therefore, we examined MERRA2 for the presence of a Q2DW in the horizontal wind components. However, we found no agreement between the zonal and meridional wind that matched the observed Q2DW in the meteor radar data, which explains the differences in the arrival times of the HTHH GWs above DAV and McM between HIAMCM and the meteor radars. Furthermore, the Q2DW also affects the meridional HTHH GW amplitude at ALO.
Although meteor radars have become a widely used sensor to observe mesospheric winds, there have been almost no studies on the HTHH eruption based on such observations. Identifying the HTHH GW in standard monostatic meteor radars turned out to be more challenging than would be expected from the stratospheric data (Wright et al., 2022), and it only became feasible due to the results obtained from the high-resolution analysis with the 3DVAR+DIV algorithm (Stober et al., 2023), using MRs with high meteor detection rates such as CONDOR and the Nordic Meteor Radar Cluster. Motivated by this original study, Poblet et al. (2023) aimed to identify the HTHH-caused Lamb wave in hourly winds derived from CONDOR and other South American meteor radar networks. However, such a temporal resolution appears to be insufficient to unambiguously identify the HTHH-caused Lamb wave considering the wave properties presented in Liu et al. (2023). The HIAMCM simulations used for comparison to the radar observations are found to produce a much more fragmented wavefront for the volcanic-caused GWs, including different GW amplitudes for different azimuths relative to the eruption site (Vadas et al., 2023a) when compared to a high-resolution WACCM-X simulation of the pseudo-Lamb wave modes (Liu et al., 2023).
Previous publications emphasized the Lamb waves generated during the first eruption (Wright et al., 2022; Matoza et al., 2022), which was observable in surface pressure data and stratospheric brightness temperatures observed by satellites. However, high-resolution wind measurements indicated only weak signatures of a possible Lamb wave in the MLT below 90 km altitude (Stober et al., 2023). Upon reaching the GW seeding altitude of z ≃ 110 km, the small-amplitude Lamb waves could have seeded a continuous spectrum of upward- and downward-propagating weak-amplitude GWs similar to the GW spectrum excited at the surface by a localized ocean wave packet such as a tsunami (Vadas et al., 2015). The small-amplitude Lamb waves in the MLT could be the source of the enhanced GW activity before the HTHH eastward GW actually arrived in the observation volume (Stober et al., 2023). Similar observations can be made for the MEN and KUN meteor radars in China, which also reveal an increased variability before the westward HTHH GWs arrived (see Figs. 7 and 6).
The observed phase velocities derived in the present study depend crucially on how the timing is determined and referenced. In the literature, typically the onset of the HTHH eruption sequence is used as a reference (15 January 04:15 UTC). However, this captures only partially the complexity of the eruption sequence, which lasted for about 3 h and consisted of several vigorous explosions. We accounted for this complexity by always representing the HTHH GW packet by vertical lines where the left one refers to the onset and the right one is given by onset +3 h. This is important for the comparison with HIAMCM, where five primary volcanic eruptions are modeled with different launch times spread over 1 h 30 min after the initial primary explosion (Vadas et al., 2023a). Furthermore, there is a longitudinal and meridional shift in the location of the updrafts from GOES-17 of about 0.7° or about 70–90 km, and the nominal geographic coordinates of the volcano (20.54° S, 175.38° W), which we used as a reference to compute the distances. Considering these aspects demonstrates how precisely the t0 time and also the location of the eruption have been inferred from the global meteor radar data.
A key factor for the propagation of the GWs is the speed of sound, because it forms an effective natural altitude-dependent bottleneck or barrier. Since most of the large-amplitude secondary GWs were created at z ≃ 120–150 km (e.g., Fig. 13 of Vadas et al., 2023b), those that propagate through the MLT are propagating downward. The mesopause region typically has a sound speed of cs ≃ 280 m s−1, which results in a maximum intrinsic horizontal phase speed of cs ≃ 250 m s−1 (Vadas and Azeem, 2021). This is consistent with the maximum observed phase speeds of 240 m s−1 of the HTHH GWs in the MLT. In addition, the eruption occurred during the Southern Hemisphere summer, where temperatures below 140 K are expected, which was confirmed by the presence of noctilucent clouds in Tierra del Fuego. These temperatures for the lower southern latitudes around the Antarctic continent are consistent with a speed of sound limit close to approximately 239 m s−1 (Stober et al., 2023), which results in a maximum intrinsic horizontal phase speed of 0.9cs≃215 m s−1. This threshold is very likely the reason why the MLT winds at DAV and McM did not show a large amplitude or clear wave pattern of the HTHH GWs at both sites, although both stations are located at the closest distance to HTHH of all meteor radars included in our study. However, HIAMCM predicted that McM and DAV would observe HTHH GWs with observed phase speeds of about 240 m s−1. As mentioned previously, the HTHH GW packet was Doppler shifted due to a strong Q2DW activity in the Southern Hemisphere (Stober et al., 2023), which was also found in ROT, TDF, McM, and DAV (data not shown); thus, this explains the differences in the arrival times between the observations and HIAMCM. However, it also confirms that the intrinsic wave speed was much closer to the sound speed barrier and, thus, forced the HTHH GWs to reflect, thereby preventing the GWs from entering the Antarctic polar MLT region. Hence, the HTHH GW signatures in the MLT winds found above McM and DAV appear to be much weaker.
Comparing the observations from MEN, KUN, ALO, and CAR confirms findings presented in a previous study about the intrinsic wave properties of the HTHH GW traveling along the GC (Stober et al., 2023). All four stations are located rather close to the same GC and, thus, are suitable to evaluate the results obtained from the high-resolution 3DVAR+DIV retrievals (Stober et al., 2023). Hence, our present study confirms that the HTHH GW packet had an intrinsic wave speed of 202.5 m s−1 along this GC. This velocity is low enough to not be affected by the speed of sound limitation caused by a mesopause that was too cold somewhere along the GC, which is confined between 40° S and 40° N. This might also explain why only the 3DVAR+DIV analysis at CONDOR revealed the signatures of both the eastward and westward HTHH GW packets.
Simulations of the Lamb wave modes L0 and L1 with WACCM-X suggest that L1 has a phase speed of about 240 m s−1 (Liu et al., 2023). Although this phase speed seems to agree with the observed phase speeds in this study, the observed horizontal wavelength of about 1600–2000 km (Stober et al., 2023) and a wave period of 2 h 20 min cannot be reconciled with the Lamb wave properties. Furthermore, HIAMCM and meteor radar zonal and meridional winds exhibit variable phase relations between both wind components and a much less coherent phase front than expected for a Lamb wave. There might have been an L1 mode in the MLT, but such a wave was hardly visible in the available meteor radar wind data. Also note in this context that the spatial averaging of 350 km in diameter and temporal resolution of 10 min clearly sets limits for the observed radar winds to reflect Lamb wave perturbations.
In this study, we analyzed winds from 13 globally distributed meteor radars to track HTHH GW packets in the eastward and westward directions from the volcano. The observational data were compared to HIAMCM simulations. This allowed us to identify the HTHH GWs in the observations and applying the same observational filter to HIAMCM. We were able to track eastward-propagating HTHH GWs for 30 000 km from the eruption site in the Pacific up to the Arctic over Svalbard. We determined an observed horizontal phase velocity of 240 ± 5.7 m s−1. Furthermore, we found westward-propagating HTHH GWs with an observed horizontal phase speed of 166.5 ± 6.4 m s−1. The observed phase speeds are in excellent agreement with HIAMCM, which showed observed phase speeds of 239.5 ± 4.3 and 162.2 ± 6.1 m s−1 for the eastward and westward GWs, respectively.
The joint analysis of the global meteor radar observations and HIAMCM perturbations demonstrate the interplay between data and simulations, with both informing each other and helping to understand the complex dynamical situation caused by the HTHH eruption. The model data provided global information about the HTHH GW propagation, which confirmed that the European meteor radars observed the eastward GW as the strongest signature of the HTHH eruption at the MLT. On the other hand, the observations also revealed that the Q2DW played an important role in the propagation along different GCs. Furthermore, the MR observations alone are not sufficient to distinguish between primary and secondary GWs generated by HTHH. However, the modeled HIAMCM secondary waves explain very well the observed phase speed and propagation direction; thus, there is some confidence that indeed these GWs were forced due to the dissipation of primary waves.
The comparison between the meteor radar winds and corresponding model results illustrates the capability of HIAMCM to model the HTHH GWs and their propagation over long distances. The HTHH eruption provided an ideal benchmark for evaluating and comparing observations and models regarding the global dynamics of GWs from a spatially and temporally confined source region. The HIAMCM result revealed the very complex structure of the wavefront generated by the HTHH eruption in the MLT with its large variations of the background flow for GWs from tides and traveling planetary waves as opposed to the situation observed in the stratosphere (Wright et al., 2022).
Tracking the eastward HTHH GW in the meteor radar winds made it possible to determine the GW generation time to be within 6 min of the nominal eruption time (15 January 2022 04:15 UTC), and the location was found to be within a range of 78 km to the WGS84 coordinates of the volcano. Both values are in good agreement with HIAMCM and within derived statistical uncertainties. Furthermore, the obtained accuracy of the determination of the eruption location from HIAMCM is quite satisfactory when considering the complexity of the eruption sequence modeled with MESORAC, which is based on GOES-17 updrafts. These updrafts extend over 0.7° in longitude and showed a horizontal distance of up to 70 km from the volcano WGS84 coordinates. Only the secondary GWs that resulted from the ambient flow effects that occurred when the updraft-induced primary GWs dissipated were simulated by HIAMCM; hence, these secondary GWs (not the primary GWs) propagated around the globe and can explain the majority of the analyzed worldwide radar wind GW perturbations in response to the HTHH eruption.
The appendix figures compare the meteor radar observations and HIAMCM wind perturbations at a much higher temporal resolution. The data are always centered around the theoretical arrival time for the eastward/westward HTHH GW inferred from the observed phase velocity fit shown in Fig. 8.
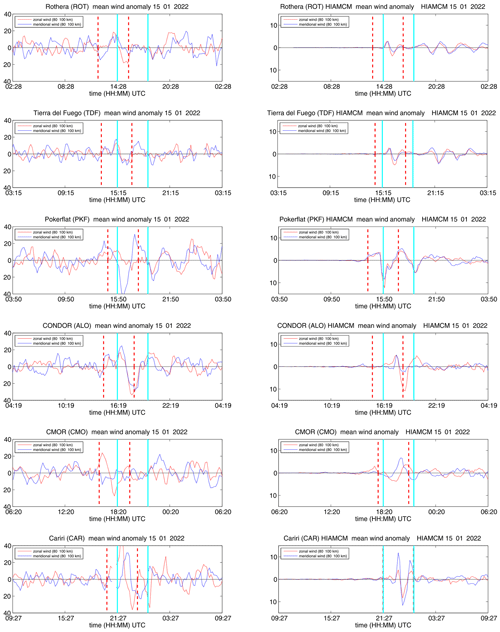
Figure A1Wind anomalies centered at the arrival time for the meteor radars located eastward of HTHH and corresponding anomalies from HIAMCM. The vertical cyan lines span the predicted arrival of the eastward-propagating GW. The vertical black lines indicate the timing for the westward-propagating HTHH GW packet. The dashed vertical lines indicate the 1σ interval of the time picks for each station. Note that HIAMCM shows perturbations only to the right of the yellow line because we plotted the differences between the Tonga run and the base run.
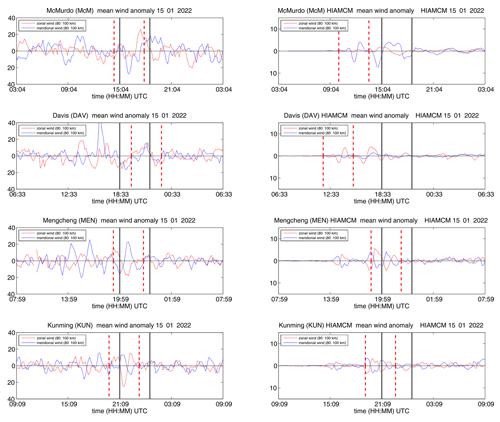
Figure A2The same as Fig. A1 but for the stations westward of HTHH outside the European continent.
HIAMCM wind fields can be requested from Sharon L. Vadas (vasha@nwra.com). The meteor radar data can be requested from the instrument principal investigators for DAV (damian.murphy@aad.gov.au), TDF (diego.janches@nasa.gov), ROT (tmof@bas.ac.uk), SVA, and Nordic (consisting of TRO, SOD, ALT, and KIR). (njal.gulbrandsen@uit.no, tutumi@nipr.ac.jp, alexander.kozlovsky@oulu.fi, kero@irf.se), McM (scott.palo@colorado.edu), ALO (liuz2@erau.edu), Poker Flat (dlthorsen@alaska.edu), CMO (pbrown@uwo.ca), and for CAR (vania.andrioli@inpe.br, paulo.batista@inpe.br, rburiti@df.ufcg.edu.br). The Mengcheng and Kunming radar data were provided through Wen Yi (yiwen@ustc.edu.cn). The retrieved 10 min winds can be requested from the University of Bern (gunter.stober@unibe.ch).
The meteor radar data analysis was performed by GS. HIAMCM runs were carried out by SLV and EB. The data interpretation was done by GS, SLV, EB, DJ, NH, DM, SN, and KB. All authors contributed to the editing of the manuscript. The operation of the meteor radars was secured by all instrument principal investigators.
The contact author has declared that none of the authors has any competing interests.
Any opinions, findings, and conclusions or recommendations expressed in this material are those of the author(s) and do not necessarily reflect the views of the National Science Foundation.
Publisher’s note: Copernicus Publications remains neutral with regard to jurisdictional claims made in the text, published maps, institutional affiliations, or any other geographical representation in this paper. While Copernicus Publications makes every effort to include appropriate place names, the final responsibility lies with the authors.
Gunter Stober, Witali Krochin, and Guochun Shi are members of the Oeschger Center for Climate Change Research (OCCR). Witali Krochin and Guochun Shi are supported by the Schweizerischer Nationalfonds zur Förderung der Wissenschaftlichen Forschung (grant no. 200021-200517/1).
Sharon L. Vadas and Erich Becker were supported by US National Science Foundation (NSF) grant no. AGS-1832988.
Alan Liu is the CONDOR instrument principal investigator, and his work is supported by (while serving at) the National Science Foundation (NSF), USA. Zishun Qiao and the operation of the CONDOR meteor radar system are supported by NSF grant AGS-1828589.
The Esrange meteor radar operation, maintenance, and data collection were provided by the Esrange Space Center of the Swedish Space Corporation.
This research has been supported by the STFC (grant no. ST/W00089X/1 to Mark Lester).
This study is partly supported by Grants-in-Aid for Scientific Research (grant nos. 21H04516, 21H04518, 21H01144, 20K20940) of the Japan Society for the Promotion of Science (JSPS).
Federal University of Paraíba (UFPB) for facilities to install and operate the Cariri meteor radar.
Njål Gulbrandsen acknowledges the support of the Leibniz Institute of Atmospheric Physics (IAP), Kühlungsborn, Germany, for their contributions to the upgrade of the TRO meteor radar.
Operation of the Davis meteor radar was supported by Australian Antarctic Science projects 4445 and 4637. Support for Diego Janches as well as SAAMER-OS' operation are provided by NASA's Planetary Science Division Research Program, through ISFM work packet Exospheres, Ionospheres, Magnetospheres Modeling at Goddard Space Flight Center and NASA Engineering Safety Center (NESC) assessment TI-17-01204. This work was supported in part by the NASA Meteoroid Environment Office under cooperative agreement no. 80NSSC21M0073.
The work by Wen Yi is supported by the National Natural Science Foundation of China (grants no. 42174183).
Poker Flat Meteor Radar is supported by the US NSF (grant no. AGS-1651464).
Christoph Jacobi acknowledges support by Deutsche Forschungsgemeinschaft (grant no. JA 836/47-1).
This research was supported by the International Space Science Institute (ISSI) in Bern, through ISSI International Team project 23-580 – Meteors and Phenomena at the Boundary between Earth's Atmosphere and Outer Space.
This research has been supported by the Schweizerischer Nationalfonds zur Förderung der Wissenschaftlichen Forschung (grant no. 200021-200517/1), the National Science Foundation (grant nos. AGS-1832988, AGS-1828589), the National Natural Science Foundation of China (grant no. 42174183), the Science and Technology Facilities Council (grant no. ST/W00089X/1), the Japan Society for the Promotion of Science (grant nos. 21H04516, 21H04518, 21H01144, and 20K20940), the Australian Antarctic Division (grant nos. 4445 and 4637), NASA Engineering and Safety Center (grant no. TI-17-01204), NASA Engineering and Safety Center (grant no. 80NSSC21M0073), the US NSF (grant no. AGS-1651464), the Deutsche Forschungsgemeinschaft (grant no. JA 836/47-1), and the International Space Science Institute (ISSI) in Bern (through ISSI International Team project 23-580 – Meteors and Phenomena at the Boundary between Earth's Atmosphere and Outer Space).
This paper was edited by Aurélien Podglajen and reviewed by three anonymous referees.
Amores, A., Monserrat, S., Marcos, M., Argüeso, D., Villalonga, J., Jordà, G., and Gomis, D.: Numerical Simulation of Atmospheric Lamb Waves Generated by the 2022 Hunga-Tonga Volcanic Eruption, Geophys. Res. Lett., 49, e2022GL098240, https://doi.org/10.1029/2022GL098240, 2022. a
Andrioli, V. F., Fritts, D. C., Batista, P. P., and Clemesha, B. R.: Improved analysis of all-sky meteor radar measurements of gravity wave variances and momentum fluxes, Ann. Geophys., 31, 889–908, https://doi.org/10.5194/angeo-31-889-2013, 2013. a, b
Baumgarten, K. and Stober, G.: On the evaluation of the phase relation between temperature and wind tides based on ground-based measurements and reanalysis data in the middle atmosphere, Ann. Geophys., 37, 581–602, https://doi.org/10.5194/angeo-37-581-2019, 2019. a
Becker, E. and Vadas, S. L.: Explicit Global Simulation of Gravity Waves in the Thermosphere, J. Geophys. Res.-Space, 125, e2020JA028034, https://doi.org/10.1029/2020JA028034, 2020. a
Becker, E., Vadas, S. L., Bossert, K., Harvey, V. L., Zülicke, C., and Hoffmann, L.: A High-Resolution Whole-Atmosphere Model With Resolved Gravity Waves and Specified Large-Scale Dynamics in the Troposphere and Stratosphere, J. Geophys. Res.-Atmos., 127, e2021JD035018, https://doi.org/10.1029/2021JD035018, 2022. a, b
Brown, P., Wong, D., Weryk, R., and Wiegert, P.: A meteoroid stream survey using the Canadian Meteor Orbit Radar: II: Identification of minor showers using a 3D wavelet transform, Icarus, 207, 66–81, https://doi.org/10.1016/j.icarus.2009.11.015, 2010. a, b
Carr, J. L., Horváth, A., Wu, D. L., and Friberg, M. D.: Stereo Plume Height and Motion Retrievals for the Record-Setting Hunga Tonga-Hunga Ha′apai Eruption of 15 January 2022, Geophys. Res. Lett., 49, e2022GL098131, https://doi.org/10.1029/2022GL098131, 2022. a
Dempsey, S. M., Hindley, N. P., Moffat-Griffin, T., Wright, C. J., Smith, A. K., Du, J., and Mitchell, N. J.: Winds and tides of the Antarctic mesosphere and lower thermosphere: One year of meteor-radar observations over Rothera (68° S, 68° W) and comparisons with WACCM and eCMAM, J. Atmos. Sol.-Terr. Phy., 212, 105510, https://doi.org/10.1016/j.jastp.2020.105510, 2021. a, b
Fritts, D. and Alexander, M. J.: Gravity wave dynamics and effects in the middle atmosphere, Rev. Geophys., 41, 1–64, https://doi.org/10.1029/2001RG000106, 2003. a, b
Fritts, D. C., Janches, D., Iimura, H., Hocking, W. K., Mitchell, N. J., Stockwell, R. G., Fuller, B., Vandepeer, B., Hormaechea, J., Brunini, C., and Levato, H.: Southern Argentina Agile Meteor Radar: System design and initial measurements of large-scale winds and tides, J. Geophys. Res.-Atmos., 115, D18112, https://doi.org/10.1029/2010JD013850, 2010. a, b
Fritts, D. C., Iimura, H., Janches, D., Lieberman, R. S., Riggin, D. M., Mitchell, N. J., Vincent, R. A., Reid, I. M., Murphy, D. J., Tsutsumi, M., Kavanagh, A. J., Batista, P. P., and Hocking, W. K.: Structure, Variability, and Mean-Flow Interactions of the January 2015 Quasi-2-Day Wave at Middle and High Southern Latitudes, J. Geophys. Res.-Atmos., 124, 5981–6008, https://doi.org/10.1029/2018JD029728, 2019. a
Gudadze, N., Stober, G., and Chau, J. L.: Can VHF radars at polar latitudes measure mean vertical winds in the presence of PMSE?, Atmos. Chem. Phys., 19, 4485–4497, https://doi.org/10.5194/acp-19-4485-2019, 2019. a
Hall, C. and Tsutsumi, M.: Neutral temperatures at 90 km altitude over Svalbard (78° N 16° E), 2002–2019, derived from meteor radar observations, Polar Sci., 24, 100530, https://doi.org/10.1016/j.polar.2020.100530, 2020. a, b
Hall, C. M. and Tsutsumi, M.: Changes in mesospheric dynamics at 78° N, 16° E and 70° N, 19° E: 2001–2012, J. Geophys. Res.-Atmos., 118, 2689–2701, 2013. a, b
He, M., Forbes, J. M., Li, G., Jacobi, C., and Hoffmann, P.: Mesospheric Q2DW Interactions With Four Migrating Tides at 53° N Latitude: Zonal Wavenumber Identification Through Dual-Station Approaches, Geophys. Res. Lett., 48, e2020GL092237, https://doi.org/10.1029/2020GL092237, 2021. a
Heki, K.: Ionospheric signatures of repeated passages of atmospheric waves by the 2022 Jan. 15 Hunga Tonga-Hunga Ha′apai eruption detected by QZSS-TEC observations in Japan, Earth Planets Space, 74, 112, https://doi.org/10.1186/s40623-022-01674-7, 2022. a
Hindley, N. P., Mitchell, N. J., Cobbett, N., Smith, A. K., Fritts, D. C., Janches, D., Wright, C. J., and Moffat-Griffin, T.: Radar observations of winds, waves and tides in the mesosphere and lower thermosphere over South Georgia island (54° S, 36° W) and comparison with WACCM simulations, Atmos. Chem. Phys., 22, 9435–9459, https://doi.org/10.5194/acp-22-9435-2022, 2022. a
Hocking, W., Fuller, B., and Vandepeer, B.: Real-time determination of meteor-related parameters utilizing modern digital technology, J. Atmos. Sol.-Terr. Phy., 63, 155–169, https://doi.org/10.1016/S1364-6826(00)00138-3, 2001. a
Hocking, W. K., Thayaparan, T., and Jones, J.: Meteor decay times and their use in determining a diagnostic mesospheric Temperature-pressure parameter: Methodology and one year of data, Geophys. Res. Lett., 24, 2977–2980, https://doi.org/10.1029/97GL03048, 1997. a
Holdsworth, D. A., Reid, I. M., and Cervera, M. A.: Buckland Park all-sky interferometric meteor radar, Radio Sci., 39, RS5009, https://doi.org/10.1029/2003RS003014, 2004. a
Iimura, H., Fritts, D. C., Lieberman, R. S., Janches, D., Mitchell, N. J., Franke, S. J., Singer, W., Hocking, W. K., Taylor, M. J., and Moffat-Griffin, T.: Climatology of quasi-2-day wave structure and variability at middle latitudes in the northern and southern hemispheres, J. Atmos. Sol.-Terr. Phy., 221, 105690, https://doi.org/10.1016/j.jastp.2021.105690, 2021. a
Jacobi, C., Fröhlich, K., Viehweg, C., Stober, G., and Kürschner, D.: Midlatitude mesosphere/lower thermosphere meridional winds and temperatures measured with meteor radar, Adv. Space Res., 39, 1278–1283, https://doi.org/10.1016/j.asr.2007.01.003, 2007. a, b
Liu, H.-L., Wang, W., Huba, J. D., Lauritzen, P. H., and Vitt, F.: Atmospheric and Ionospheric Responses to Hunga-Tonga Volcano Eruption Simulated by WACCM-X, Geophys. Res. Lett., 50, e2023GL103682, https://doi.org/10.1029/2023GL103682, 2023. a, b, c, d, e, f, g
Marino, J., Palo, S. E., and Rainville, N.: First Observations From a New Meteor Radar at McMurdo Station Antarctica (77.8° S, 166.7° E), Radio Sci., 57, e2022RS007466, https://doi.org/10.1029/2022RS007466, 2022. a, b
Matoza, R. S., Fee, D., Assink, J. D., Iezzi, A. M., Green, D. N., Kim, K., Toney, L., Lecocq, T., Krishnamoorthy, S., Lalande, J.-M., Nishida, K., Gee, K. L., Haney, M. M., Ortiz, H. D., Brissaud, Q., Martire, L., Rolland, L., Vergados, P., Nippress, A., Park, J., Shani-Kadmiel, S., Witsil, A., Arrowsmith, S., Caudron, C., Watada, S., Perttu, A. B., Taisne, B., Mialle, P., Pichon, A. L., Vergoz, J., Hupe, P., Blom, P. S., Waxler, R., Angelis, S. D., Snively, J. B., Ringler, A. T., Anthony, R. E., Jolly, A. D., Kilgour, G., Averbuch, G., Ripepe, M., Ichihara, M., Arciniega-Ceballos, A., Astafyeva, E., Ceranna, L., Cevuard, S., Che, I.-Y., Negri, R. D., Ebeling, C. W., Evers, L. G., Franco-Marin, L. E., Gabrielson, T. B., Hafner, K., Harrison, R. G., Komjathy, A., Lacanna, G., Lyons, J., Macpherson, K. A., Marchetti, E., McKee, K. F., Mellors, R. J., Mendo-Pérez, G., Mikesell, T. D., Munaibari, E., Oyola-Merced, M., Park, I., Pilger, C., Ramos, C., Ruiz, M. C., Sabatini, R., Schwaiger, H. F., Tailpied, D., Talmadge, C., Vidot, J., Webster, J., and Wilson, D. C.: Atmospheric waves and global seismoacoustic observations of the January 2022 Hunga eruption, Tonga, Science, 377, 95–100, https://doi.org/10.1126/science.abo7063, 2022. a, b, c, d
Meek, C. E., Manson, A. H., Hocking, W. K., and Drummond, J. R.: Eureka, 80° N, SKiYMET meteor radar temperatures compared with Aura MLS values, Ann. Geophys., 31, 1267–1277, https://doi.org/10.5194/angeo-31-1267-2013, 2013. a
Millán, L., Santee, M. L., Lambert, A., Livesey, N. J., Werner, F., Schwartz, M. J., Pumphrey, H. C., Manney, G. L., Wang, Y., Su, H., Wu, L., Read, W. G., and Froidevaux, L.: The Hunga Tonga-Hunga Ha′apai Hydration of the Stratosphere, Geophys. Res. Lett., 49, e2022GL099381, https://doi.org/10.1029/2022GL099381, 2022. a
Miyoshi, Y. and Shinagawa, H.: Upward propagation of gravity waves and ionospheric perturbations triggered by the 2022 Hunga-Tonga volcanic eruption, Earth Planets Space, 75, 68, https://doi.org/10.1186/s40623-023-01827-2, 2023. a, b, c
National Imagery and Mapping Agency: Department of Defense World Geodetic System 1984: its definition and relationships with local geodetic systems, Tech. Rep. TR8350.2, National Imagery and Mapping Agency, St. Louis, MO, USA, https://apps.dtic.mil/sti/citations/ADA320700 (last access: April 2024), 2000. a
Poblet, F. L., Chau, J. L., Conte, J. F., Vierinen, J., Suclupe, J., Liu, A., and Rodriguez, R. R.: Extreme Horizontal Wind Perturbations in the Mesosphere and Lower Thermosphere Over South America Associated With the 2022 Hunga Eruption, Geophys. Res. Lett., 50, e2023GL103809, https://doi.org/10.1029/2023GL103809, 2023. a, b
Pokhotelov, D., Becker, E., Stober, G., and Chau, J. L.: Seasonal variability of atmospheric tides in the mesosphere and lower thermosphere: meteor radar data and simulations, Ann. Geophys., 36, 825–830, https://doi.org/10.5194/angeo-36-825-2018, 2018. a
Rodgers, C. D.: Inverse Methods for Atmospheric Sounding: Theory and Practice, World Scientific, Singapore, ISBN 9789810227401, 2000. a
Shinbori, A., Otsuka, Y., Sori, T., Nishioka, M., Perwitasari, S., Tsuda, T., and Nishitani, N.: Electromagnetic conjugacy of ionospheric disturbances after the 2022 Hunga Tonga-Hunga Ha′apai volcanic eruption as seen in GNSS-TEC and SuperDARN Hokkaido pair of radars, Earth Planets Space, 74, 106, https://doi.org/10.1186/s40623-022-01665-8, 2022. a
Stober, G., Baumgarten, K., McCormack, J. P., Brown, P., and Czarnecki, J.: Comparative study between ground-based observations and NAVGEM-HA analysis data in the mesosphere and lower thermosphere region, Atmos. Chem. Phys., 20, 11979–12010, https://doi.org/10.5194/acp-20-11979-2020, 2020. a, b
Stober, G., Janches, D., Matthias, V., Fritts, D., Marino, J., Moffat-Griffin, T., Baumgarten, K., Lee, W., Murphy, D., Kim, Y. H., Mitchell, N., and Palo, S.: Seasonal evolution of winds, atmospheric tides, and Reynolds stress components in the Southern Hemisphere mesosphere–lower thermosphere in 2019, Ann. Geophys., 39, 1–29, https://doi.org/10.5194/angeo-39-1-2021, 2021a. a
Stober, G., Kozlovsky, A., Liu, A., Qiao, Z., Tsutsumi, M., Hall, C., Nozawa, S., Lester, M., Belova, E., Kero, J., Espy, P. J., Hibbins, R. E., and Mitchell, N.: Atmospheric tomography using the Nordic Meteor Radar Cluster and Chilean Observation Network De Meteor Radars: network details and 3D-Var retrieval, Atmos. Meas. Tech., 14, 6509–6532, https://doi.org/10.5194/amt-14-6509-2021, 2021b. a, b, c, d, e
Stober, G., Kuchar, A., Pokhotelov, D., Liu, H., Liu, H.-L., Schmidt, H., Jacobi, C., Baumgarten, K., Brown, P., Janches, D., Murphy, D., Kozlovsky, A., Lester, M., Belova, E., Kero, J., and Mitchell, N.: Interhemispheric differences of mesosphere–lower thermosphere winds and tides investigated from three whole-atmosphere models and meteor radar observations, Atmos. Chem. Phys., 21, 13855–13902, https://doi.org/10.5194/acp-21-13855-2021, 2021c. a
Stober, G., Liu, A., Kozlovsky, A., Qiao, Z., Kuchar, A., Jacobi, C., Meek, C., Janches, D., Liu, G., Tsutsumi, M., Gulbrandsen, N., Nozawa, S., Lester, M., Belova, E., Kero, J., and Mitchell, N.: Meteor radar vertical wind observation biases and mathematical debiasing strategies including the 3DVAR+DIV algorithm, Atmos. Meas. Tech., 15, 5769–5792, https://doi.org/10.5194/amt-15-5769-2022, 2022. a, b
Stober, G., Liu, A., Kozlovsky, A., Qiao, Z., Krochin, W., Shi, G., Kero, J., Tsutsumi, M., Gulbrandsen, N., Nozawa, S., Lester, M., Baumgarten, K., Belova, E., and Mitchell, N.: Identifying gravity waves launched by the Hunga Tonga–Hunga Ha′apai volcanic eruption in mesosphere/lower-thermosphere winds derived from CONDOR and the Nordic Meteor Radar Cluster, Ann. Geophys., 41, 197–208, https://doi.org/10.5194/angeo-41-197-2023, 2023. a, b, c, d, e, f, g, h, i, j, k, l, m, n, o, p, q
Tang, L. and Gu, S.-Y.: Interannual and Interhemispheric Comparisons of Q2DW Bimodal and Unimodal Structures During the 2003–2020 Summer Period, J. Geophys. Res.-Space, 128, e2023JA031412, https://doi.org/10.1029/2023JA031412, 2023. a
Themens, D. R., Watson, C., Žagar, N., Vasylkevych, S., Elvidge, S., McCaffrey, A., Prikryl, P., Reid, B., Wood, A., and Jayachandran, P. T.: Global Propagation of Ionospheric Disturbances Associated With the 2022 Tonga Volcanic Eruption, Geophys. Res. Lett., 49, e2022GL098158, https://doi.org/10.1029/2022GL098158, 2022. a, b, c
Vadas, S., Yue, J., and Nakamura, T.: Mesospheric concentric gravity waves generated by multiple convective storms over the North American Great Plain, J. Geophys. Res.-Atmos., 117, D07113, https://doi.org/10.1029/2011JD017025, 2012. a
Vadas, S. L.: Compressible f-plane solutions to body forces, heatings, and coolings, and application to the primary and secondary gravity waves generated by a deep convective plume, J. Geophys. Res.-Space, 118, 2377–2397, https://doi.org/10.1002/jgra.50163, 2013. a, b
Vadas, S. L. and Azeem, I.: Concentric Secondary Gravity Waves in the Thermosphere and Ionosphere Over the Continental United States on March 25–26, 2015 From Deep Convection, J. Geophys. Res.-Space, 126, e2020JA028275, https://doi.org/10.1029/2020JA028275, 2021. a
Vadas, S. L. and Becker, E.: Numerical Modeling of the Excitation, Propagation, and Dissipation of Primary and Secondary Gravity Waves during Wintertime at McMurdo Station in the Antarctic, J. Geophys. Res.-Atmos., 123, 9326–9369, https://doi.org/10.1029/2017JD027974, 2018. a
Vadas, S. L. and Fritts, D. C.: Thermospheric responses to gravity waves: Influences of increasing viscosity and thermal diffusivity, J. Geophys. Res.-Atmos., 110, D15103, https://doi.org/10.1029/2004JD005574, 2005. a
Vadas, S. L. and Fritts, D. C.: Reconstruction of the gravity wave field from convective plumes via ray tracing, Ann. Geophys., 27, 147–177, https://doi.org/10.5194/angeo-27-147-2009, 2009. a
Vadas, S. L. and Liu, H.-L.: Generation of large-scale gravity waves and neutral winds in the thermosphere from the dissipation of convectively generated gravity waves, J. Geophys. Res.-Space, 114, A10310, https://doi.org/10.1029/2009JA014108, 2009. a
Vadas, S. L., Fritts, D. C., and Alexander, M. J.: Mechanism for the Generation of Secondary Waves in Wave Breaking Regions, J. Atmos. Sci., 60, 194–214, https://doi.org/10.1175/1520-0469(2003)060<0194:MFTGOS>2.0.CO;2, 2003. a
Vadas, S. L., Makela, J. J., Nicolls, M. J., and Milliff, R. F.: Excitation of gravity waves by ocean surface wave packets: Upward propagation and reconstruction of the thermospheric gravity wave field, J. Geophys. Res.-Space, 120, 9748–9780, https://doi.org/10.1002/2015JA021430, 2015. a
Vadas, S. L., Becker, E., Figueiredo, C., Bossert, K., Harding, B. J., and Gasque, L. C.: Primary and Secondary Gravity Waves and Large-Scale Wind Changes Generated by the Tonga Volcanic Eruption on 15 January 2022: Modeling and Comparison With ICON-MIGHTI Winds, J. Geophys. Res.-Space, 128, e2022JA031138, https://doi.org/10.1029/2022JA031138, 2023a. a, b, c, d, e, f, g, h, i, j, k, l, m
Vadas, S. L., Figueiredo, C., Becker, E., Huba, J. D., Themens, D. R., Hindley, N. P., Mrak, S., Galkin, I., and Bossert, K.: Traveling ionospheric disturbances induced by the secondary gravity waves from the Tonga eruption on 15 January 2022: Modeling with MESORAC/HIAMCM/SAMI3 and comparison with GPS/TEC and ionosonde data, J. Geophys. Res.-Space, 128, e2023JA031408, https://doi.org/10.1029/2023JA031408, 2023b. a, b, c, d, e, f
Watanabe, S., Hamilton, K., Sakazaki, T., and Nakano, M.: First Detection of the Pekeris Internal Global Atmospheric Resonance: Evidence from the 2022 Tonga Eruption and from Global Reanalysis Data, J. Atmos. Sci., 79, 3027–3043, https://doi.org/10.1175/JAS-D-22-0078.1, 2022. a
Webster, A. R., Brown, P. G., Jones, J., Ellis, K. J., and Campbell-Brown, M.: Canadian Meteor Orbit Radar (CMOR), Atmos. Chem. Phys., 4, 679–684, https://doi.org/10.5194/acp-4-679-2004, 2004. a, b
Wright, C. J., Hindley, N. P., Alexander, M. J., Barlow, M., Hoffmann, L., Mitchell, C. N., Prata, F., Bouillon, M.and Carstens, J., Clerbaux, C., Osprey, S. M., Powell, N., Randall, C. E., and Yue, J.: Surface-to-space atmospheric waves from Hunga Tonga-Hunga Ha′apai eruption, Nature, 609, 741–746, https://doi.org/10.1038/s41586-022-05012-5, 2022. a, b, c, d, e, f, g
Yamada, M., Ho, T.-C., Mori, J., Nishikawa, Y., and Yamamoto, M.-Y.: Tsunami Triggered by the Lamb Wave From the 2022 Tonga Volcanic Eruption and Transition in the Offshore Japan Region, Geophys. Res. Lett., 49, e2022GL098752, https://doi.org/10.1029/2022GL098752, 2022. a
Yang, C., Lai, D., Yi, W., Wu, J., Xue, X., Li, T., Chen, T., and Dou, X.: Observed Quasi 16-Day Wave by Meteor Radar over 9 Years at Mengcheng (33.4° N, 116.5° E) and Comparison with the Whole Atmosphere Community Climate Model Simulation, Remote Sens., 15, 830, https://doi.org/10.3390/rs15030830, 2023. a, b
Zeng, J., Yi, W., Xue, X., Reid, I., Hao, X., Li, N., Chen, J., Chen, T., and Dou, X.: Comparison between the Mesospheric Winds Observed by Two Collocated Meteor Radars at Low Latitudes, Remote Sens., 14, 2354, https://doi.org/10.3390/rs14102354, 2022. a, b
Zhang, S.-R., Vierinen, J., Aa, E., Goncharenko, L. P., Erickson, P. J., Rideout, W., Coster, A. J., and Spicher, A.: 2022 Tonga volcanic eruption induced global propagation of ionospheric disturbances via Lamb waves, Front. Astron. Space Sci., 9, 871275, https://doi.org/10.3389/fspas.2022.871275, 2022. a
- Abstract
- Introduction
- Meteor radar observations
- HIAMCM global fields
- Comparison of HIAMCM results and meteor radar observations
- Gravity wave observed phase speeds
- Polarization of HTHH GW along the great circle – CONDOR and Mengcheng
- The role of the quasi-two-day wave (Q2DW) in the Southern Hemisphere
- Discussion
- Conclusions
- Appendix A: Comparison of HIAMCM results and meteor radar observations
- Data availability
- Author contributions
- Competing interests
- Disclaimer
- Acknowledgements
- Financial support
- Review statement
- References


