the Creative Commons Attribution 4.0 License.
the Creative Commons Attribution 4.0 License.
 | 12 Jan 2024
Short-term source apportionment of fine particulate matter with time-dependent profiles using SoFi Pro: exploring the reliability of rolling positive matrix factorization (PMF) applied to bihourly molecular and elemental tracer data
Qiongqiong Wang
Shuhui Zhu
Shan Wang
Cheng Huang
Yusen Duan
Positive matrix factorization (PMF) has been widely used to apportion the sources of fine particulate matter (PM2.5) by utilizing PM chemical speciation data measured at the receptor site(s). Traditional PMF, which typically relies on long-term observational datasets of daily or lower time resolution to meet the required sample size, has its reliability undermined by changes in source profiles; thus, it is inherently ill-suited for apportioning sporadic sources or ephemeral pollution events. In this study, we explored short-term source apportionment of PM2.5 using a set of bihourly chemical speciation data over a period of 37 d in the winter of 2019–2020. PMF run with campaign-wide data as input (PMFref) was initially conducted to obtain reference profiles for the primary source factors. Subsequently, short-term PMF analysis was performed using the Source Finder Professional (SoFi Pro). The analysis sets a window length of 18 d and constrained the primary source profiles using the a-value approach embedded in SoFi Pro software. Rolling PMF was then conducted with a fixed window length of 18 d and a step of 1 d using the remaining dataset. By applying the a-value constraints to the primary sources, the rolling PMF effectively reproduced the individual primary sources, as evidenced by the slope values close to unity (i.e., 0.9–1.0). However, the estimation for the firework emission factor in the rolling PMF was lower compared with PMFref (slope: 0.8). These results suggest the unique advantage of short-term PMF analysis in accurately apportioning sporadic sources. Although the total secondary sources were well modeled (slope: 1.0), larger biases were observed for individual secondary sources. The variation in source profiles indicated higher variabilities for the secondary sources, with average relative differences ranging from 42 % to 173 %, while the primary source profiles exhibited much smaller variabilities (relative differences of 8 %–26 %). This study suggests that short-term PMF analysis with the a-value constraints in SoFi Pro can be utilized to apportion primary sources accurately, while future efforts are needed to improve the prediction of individual secondary sources. Additionally, future rapid source apportionment analysis can benefit from utilizing a library of source profiles derived from existing measurement data, thereby significantly reducing the time lag associated with receptor modeling source apportionment techniques.
- Article
(3599 KB) - Full-text XML
-
Supplement
(997 KB) - BibTeX
- EndNote


Atmospheric particulate matter with aerodynamic diameter less than 2.5 µm (PM2.5) is known to negatively impact human health and exert a noticeable but highly uncertain effect on climate change (IPCC, 2014). Epidemiological studies have consistently demonstrated that exposure to PM2.5 can result in various cardiovascular and chronic respiratory diseases (Yin et al., 2020). The implementation of stringent control measures since 2013 has led to declining concentrations of PM2.5 in many megacities in China, with annual average decreasing from 72.3 µg m−3 in 2013 to 47.4 µg m−3 in 2017, as calculated from monitoring data in 74 cities across China (Wang et al., 2020; Chow et al., 2022a). However, the annual-mean PM level in many cities remains above the new WHO guidelines (5 µg m−3) by a large margin. Importantly, short-term pollution episodes have continued to occur frequently in recent years (e.g., Shao et al., 2018; Q. Wang et al., 2022). Recognizing the need to reduce the severity and frequency of episodic pollution incidents, it becomes evident that achieving episode-scale source apportionment is essential.
Receptor models such as positive matrix factorization (PMF) and chemical mass balance (CMB) have been widely deployed to apportion the sources of PM2.5 based on observation-based composition data (Paatero and Tapper, 1994; Watson et al., 1984). The CMB model can apportion the source contributions of a single sample in principle, but the uncertainties can be large due to the high variability in the source profiles (Lee and Russell, 2007) as the location-specific profiles are often unavailable in many places. While the PMF model has the advantage of avoiding the need to input source profiles, it requires a large sample size to do the source apportionment. PMF assumes constant source profiles throughout the entire sampling period (Reff et al., 2007). Due to the limited time resolution from offline filter-based sampling schedule, e.g., sampling duration of 24 h and sampling frequency of once every 3 or 6 d, PMF is often conducted using the Environmental Protection Agency (EPA) PMF software (Norris et al., 2014) with data spanning 1 year or multiple years to meet the sample size requirement (e.g., Chow et al., 2022b; Scotto et al., 2021). As a result, there is a notable time lag in obtaining the source apportionment results and implementing relevant policy controls. There is an urgent need for rapid source apportionment methods that can provide timely policy implications.
Source profile changes are often expected over an extended period of observation for certain sources. For instance, biomass burning exhibits variations in dominant biomass materials during different seasons; the implementation of catalytic converter replacement program alters the source profiles of vehicular emissions (Lee et al., 2017). Sporadic sources, such as firework emission during holidays or wildfires during dry seasons, can significantly contribute to PM pollution episodes that persist for hours to days, often overshadowing the effects of reductions in anthropogenic emissions (Song et al., 2021; Kong et al., 2015). The PMF analysis using long-term datasets could not properly reflect source profile changes experienced during the long time span. In other words, long-term PMF is inherently unsuitable for apportioning sporadic sources or ephemeral pollution events. This limitation explains the common observation that PMF with robust mode tends to underestimate high-concentration data while overestimating the low-concentration data (Henry and Christensen, 2010). Consequently, contribution estimates of these sources would be biased when apportioned alongside other regular sources using long-term observational data.
By implementing online measurement techniques, researchers are able to conduct source apportionments studies based on hourly PM chemical speciation data covering several weeks to months. Such studies can circumvent the issue of source profile changes arising from the long-term sampling (Wang et al., 2018). Recently, Canonaco et al. (2021) introduced a new method called “rolling PMF” to conduct the source apportionment with time-dependent source profiles using the Source Finder Professional (SoFi Pro) software. In this method, PMF is performed over a small, moving time frame (e.g., a window length of 2 weeks with step of 1 d), allowing the factor profiles to evolve with time. To decrease the rotational ambiguity, short-term rolling PMF is conducted with the source profile constraints using the a-value approach embedded in the SoFi Pro program (Canonaco et al., 2013). This method has been demonstrated using the 1-year and multi-year non-refractory sub-micrometer aerosol chemical speciation monitor (ACSM) dataset (Canonaco et al., 2021; Chen et al., 2021, 2022) for the source apportionment of organic aerosols (OAs). The source profiles of primary factors obtained from the traditional PMF runs conducted in each season are selected as the reference profiles. With the source profile constraints, the rolling PMF can effectively capture the individual primary organic aerosol (POA) source and total oxygenated organic aerosol (OOA) sources when compared with the traditional PMF. However, noticeable differences in individual OOA sources were observed. The rolling PMF (or moving window PMF) method has also been applied to the hourly PM2.5 chemical speciation data measured in Tianjin during a 2-month field campaign, including ions, organic carbon (OC), elemental carbon (EC), and elements (Song et al., 2021), where PMF runs were performed without the source profile constraints using EPA PMF software. The apportioned results, without the source-specific organic tracers, showed clear mixing of several source factors in Song et al. (2021). The application of the rolling PMF method with time-dependent source profile constraints holds potential for rapid source apportionment when source profiles are available from existing chemical speciation measurement data.
A comprehensive online measurement campaign was conducted at a suburban site in Shanghai during a period of 37 d in the winter of 2019–2020 (specifically from 29 December 2019 to 9 February 2020), encompassing both the pre-lockdown and lockdown phases of the Covid-19 pandemic. This data collection effort involved hourly measurements of major ions, OC, EC, and elements, as well as bihourly measurements of source-specific organic tracers in PM2.5. Notably, this time frame captured the dynamic changes in pollution sources and included a sporadic source event – firework emissions during the Chinese New Year (CNY) and Lantern Festival. Thus, it presented a unique opportunity to evaluate a shot-term PMF strategy. A thorough traditional source apportionment analysis conducted using the EPA PMF software is documented in our previous study (S. Wang et al., 2022). In this study, we specifically investigated the applicability of a short-term source apportionment strategy using the bihourly PM2.5 chemical speciation data with the SoFi Pro software and compared with those obtained through the traditional PMF. The findings of this study offer valuable insights into the future development of rapid source apportionment methods for PM2.5, particularly for short-term periods and episodic events. These insights have the potential to enhance air quality management practices.
2.1 Sampling and chemical analysis
The field campaign was conducted during 29 December 2019 to 9 February 2020 at the Dianshan Lake (DSL) supersite (31.09∘ N, 120.98∘ E) in Shanghai, China. The sampling site was located in a suburban area, about 50 km away from downtown Shanghai and with relatively low influences of local anthropogenic sources. PM speciation measurements included hourly major ions (sulfate, nitrate, and ammonium) by a Monitoring AeRosols and GAses in ambient air system (MARGA), OC and EC by a Sunset semi-continuous carbon analyzer, elements (i.e., K, Ca, Cr, Mn, Fe, Cu, Zn, As, Se, Ba, and Pb) by an energy dispersive X-ray fluorescence spectrometer (XRF), and bihourly organic tracers (hopanes, steranes, levoglucosan, mannosan, phthalic acid, 2,3-dihydroxy-4-oxopentanoic acid (DHOPA), β-caryophyllinic acid (β-caryT), and α-pinene secondary organic aerosol tracers (α-pinT)) by thermal desorption aerosol gas chromatography–mass spectrometry (TAG). TAG data during 16–21 January 2020 were not available due to instrument maintenance. For detailed information about the sampling site and chemical analysis procedures, refer to our previous paper (S. Wang et al., 2022).
2.2 Source apportionment
In this work, PMF with the multilinear engine version 2 (ME-2) (Paatero, 1999) in the interface of SoFi Pro (version 8) (Canonaco et al., 2013) was adopted to apportion the sources contributing to PM2.5 mass. The PMF model in matrix notation is defined as Eqs. (1) and (2):
where xij is the measured concentration, n is the number of samples, m is the number of species, p is the number of factors, gik is the source contribution of the kth factor to the ith sample, fkj is the factor profile of jth species in the kth factor, eij is the residual of jth species in the ith sample, and uij is the user-defined uncertainty. Q is the objective function representing the uncertainty weighted difference between observed and modeled species concentrations. PMF finds the final solution by minimizing the Q value.
Factor analysis methods like PMF are known to encounter rotational ambiguity, whereby different combinations of source contribution G and source profile F matrix can yield the same Q value. This issue often results in mixed factors or environmentally unrealistic factors. Previous studies have demonstrated the effectiveness of constraining expected source profiles using the a-value approach embedded in SoFi Pro software (Canonaco et al., 2013). The a-value approach allows for the imposition of constraints on the source profiles/contributions from the given reference profiles/contributions, with a certain degree of variation from the anchoring profiles (Eqs. 3 and 4).
Here, the index j, which varies between 0 and the number of species m, represents the species of the kth factor. The index i, which varies between 0 and the number of samples n, is the sample of the kth factor. fkj and gik are the anchoring profiles and anchoring contributions, respectively, while and are the output source profiles and source contributions, respectively. The scalar a ranges from 0 to 1, which determines the extent to which the output / is allowed to vary from the input reference fkj/gik. For example, a a value of 0.3 corresponds to 30 % variation, while a a value of 1 is equivalent to a completely unconstrained (or free) PMF situation.
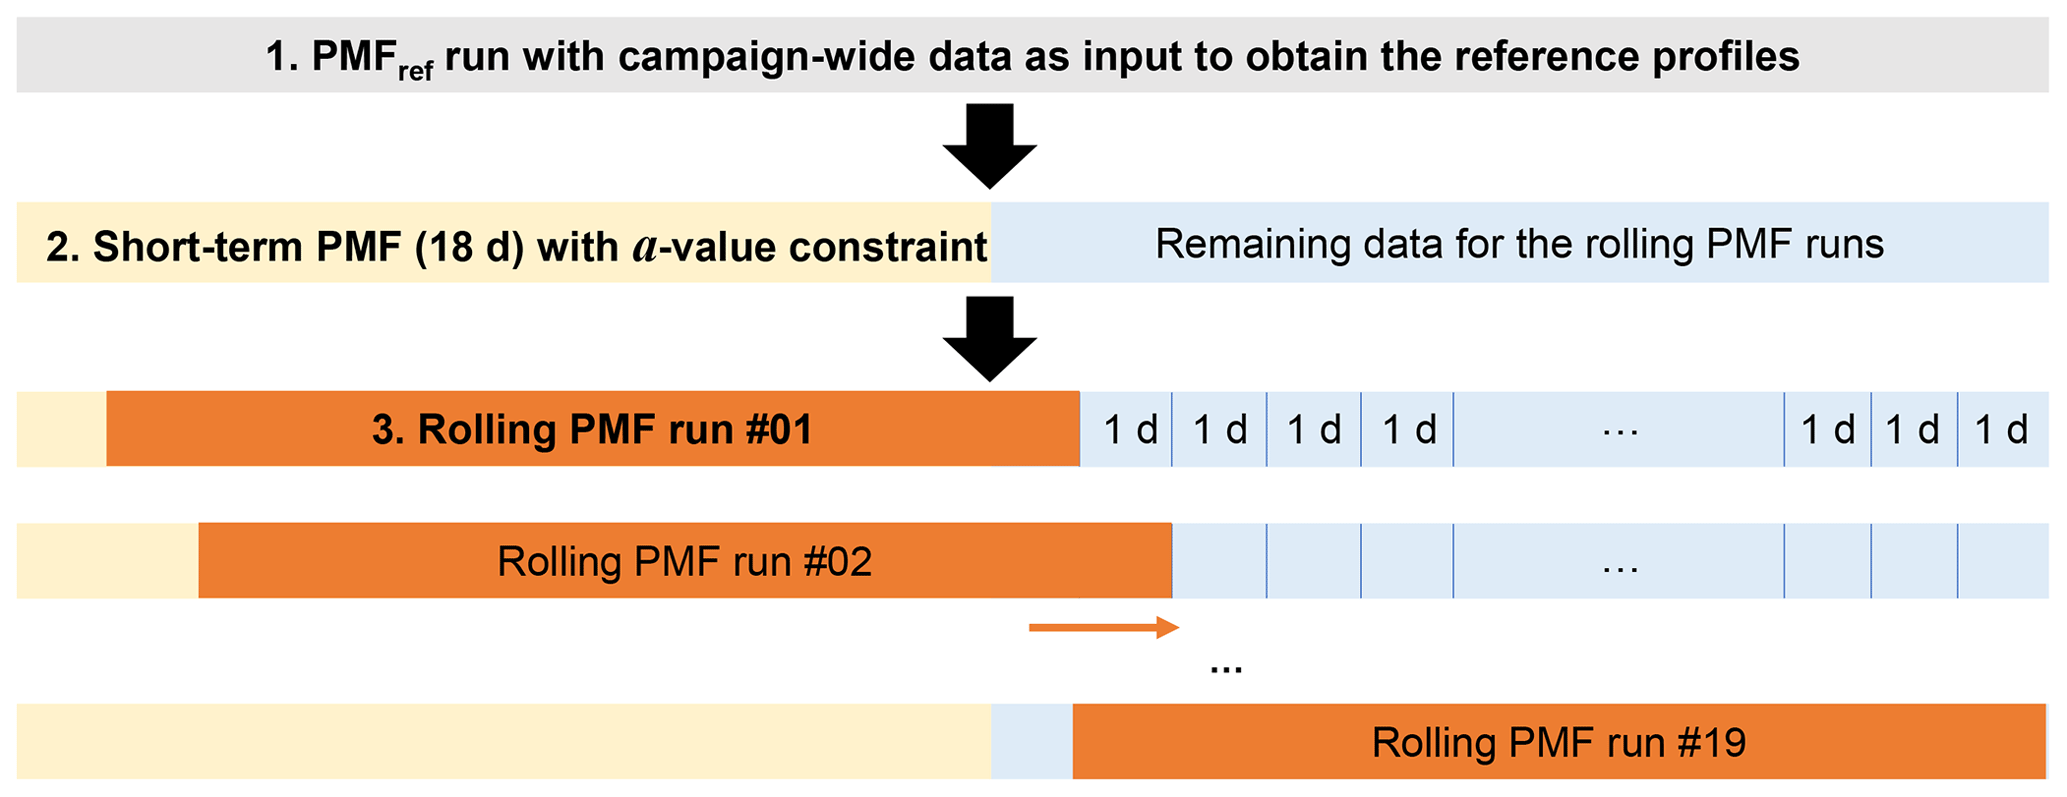
Figure 1 illustrates the flowchart outlining the source apportionment methodology employed in this study. Initially, a PMF run was conducted by EPA PMF software using campaign-wide bihourly data as input (referred to as PMFref) to derive the reference profiles for primary sources. Subsequently, the first sampling period data of 18 d was utilized to perform the short-term PMF run and evaluate the effectiveness of the a-value approach using SoFi Pro. The source profiles obtained from the PMFref run were used as the reference profiles in the a-value approach to help PMF find the environmentally reasonable solution. Following this, the rolling PMF was conducted using the remaining dataset with the optimum a values to validate the short-term PMF results. The results of the rolling PMF analysis were discussed and compared with the results obtained from the PMFref run. The 22 input species for both the PMFref and the short-term rolling PMF runs include sulfate, nitrate, ammonium, OC, EC, K, Ca, Mn, Fe, Cu, Zn, As, Ba, Pb, and eight organic species (hopanes, steranes, levoglucosan, mannosan, phthalic acid, α-pinT, β-caryT, and DHOPA). The specific input data utilized in individual PMF runs are shown in Table S1 in the Supplement.
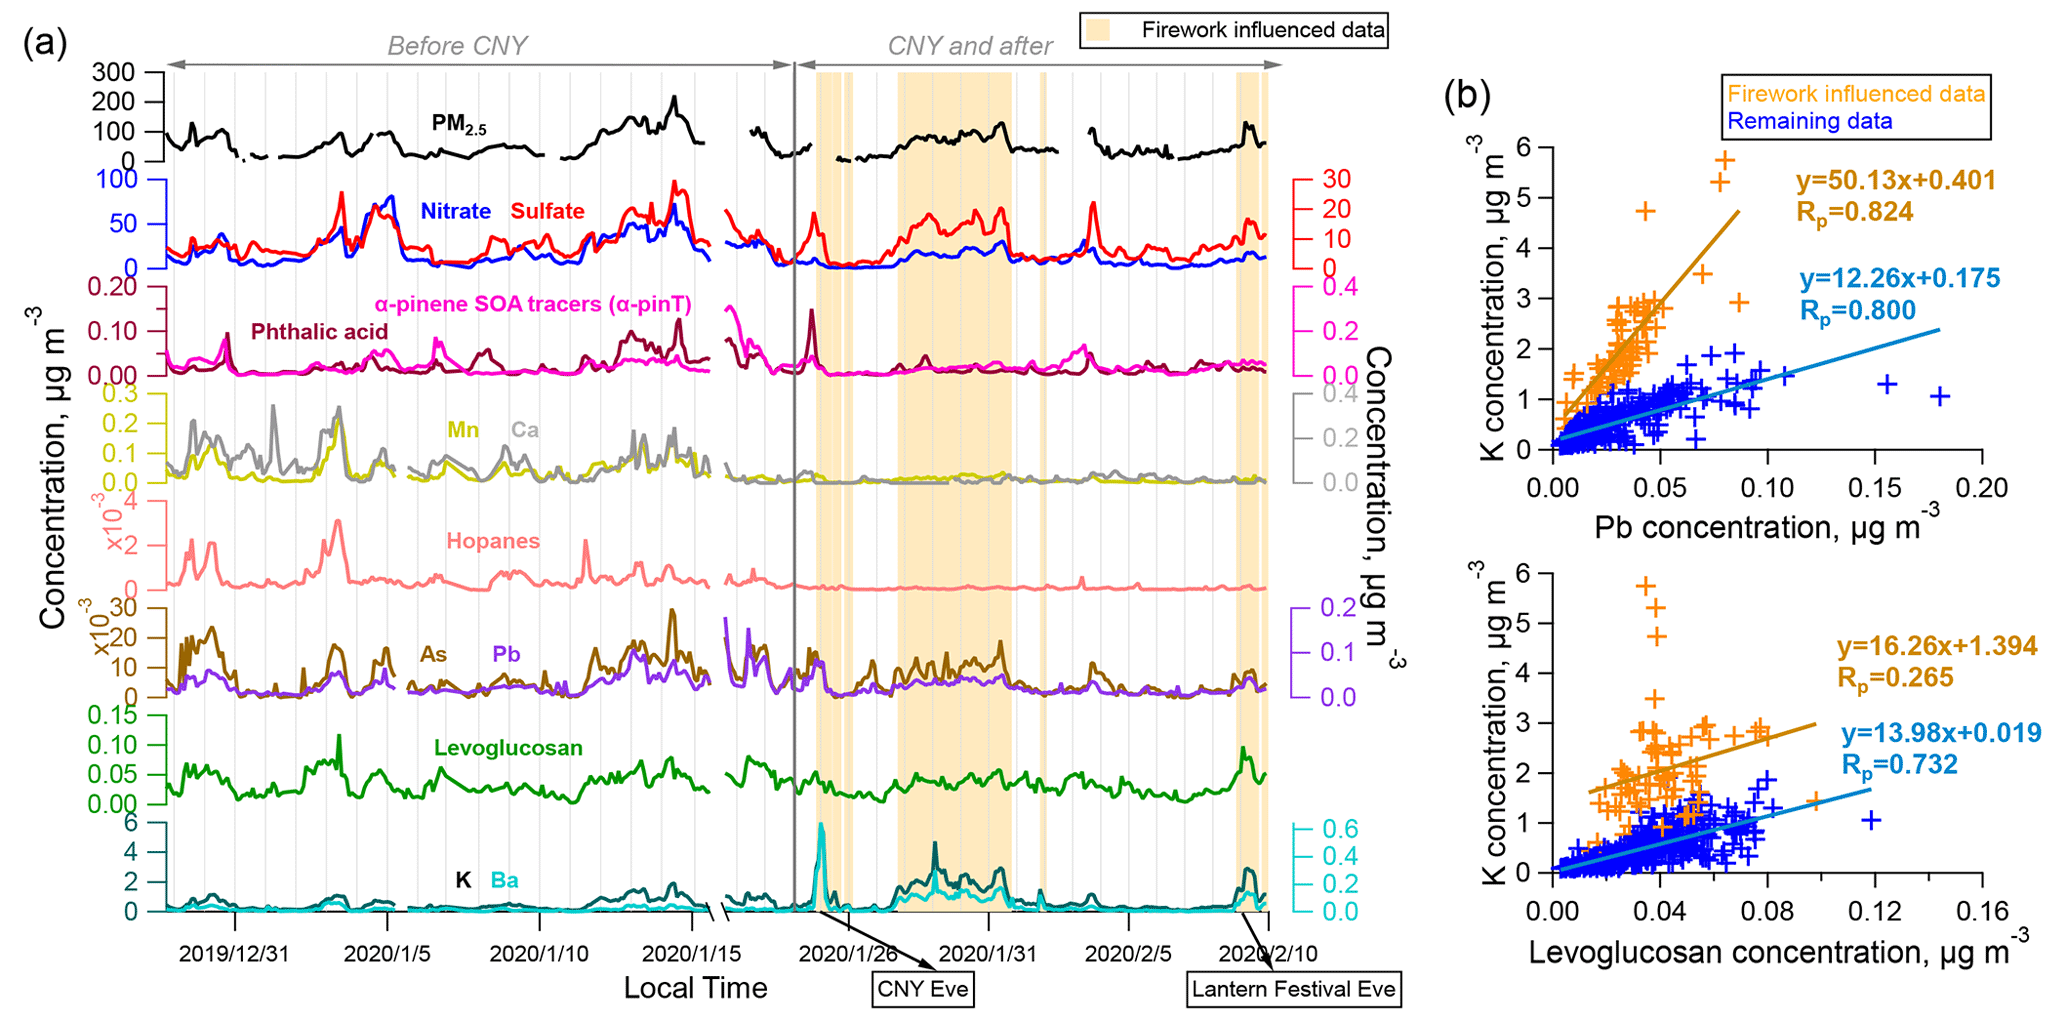
Figure 2(a) Time series of concentrations of total PM2.5 and selected tracer species from 29 December 2019 to 9 February 2020 at the DSL site in Shanghai. The campaign period was divided into two phases: before Chinese New Year (CNY) and the CNY and post-CNY period. The data influenced by firework emissions are highlighted in light orange. (b) Scatter plots illustrating the relationship between K concentrations and two other tracer species, Pb and levoglucosan, during the firework-influenced period and the remaining period.
3.1 Overview of the PM pollution at the DSL site
Figure 2a shows the temporal variation of PM2.5 and select tracers during the campaign period, with the average concentrations provided in Table S2 in the Supplement. The sampling period was divided into two distinct sub-periods: (1) before CNY (29 December 2019–23 January 2020) and (2) CNY and post-CNY (24 January–9 February 2020). The CNY (25 January) and Lantern Festival (8 February) fell within the second period when the lockdown restriction had been implemented. A clear reduction of the concentrations for most tracer species was observed during the CNY and post-CNY period, except for K and Ba (Sect. S1 in the Supplement and Fig. 2a). It is known that combustion of fireworks emits particles enriched with elements such as Sr, K, Ba, Cu, and Bi (Manousakas et al., 2022). Scatter plots of measured K with the source tracers levoglucosan from biomass burning and Pb from coal combustion unequivocally indicated the presence of firework emission source during the CNY holiday and Lantern Festival (Fig. 2b). The combustion of fireworks during these events led to significantly elevated K concentrations. Conversely, during the remaining time period, K primarily originated from biomass burning and coal combustion, as evidenced by the strong correlation with the corresponding tracer species.
Source apportionment results over the entire sampling period (i.e., PMFref) supplies an overview about the emission sources at this site. A thorough source apportionment result for this site can be found in our previous paper (S. Wang et al., 2022), where 14 factors were resolved using a list of more comprehensive input species over the entire sampling period. Among these factors, the polycyclic-aromatic-hydrocarbon-rich factor, cooking emission, and one secondary organic aerosol (SOA) factor are negligible PM2.5 contributors (< 1 %). The contribution of the residual oil combustion factor to PM2.5 is also minor (< 3 %). Additionally, the detection frequency of V, a tracer for the residual oil combustion factor, was lower than 50 % for the short-term input time window. Thus, these four factors were not incorporated in this study, and we focus on the 10 major factors resolved in our PMFref run. Given the limited data points available for the short-term PMF runs, this approach allows us to obtain a more robust solution, aligning with the study's objective of testing the short-term PMF strategy. The robustness of the PMFref result was tested by the bootstrap and displacement error estimation method embedded in EPA PMF 5.0 software (Norris et al., 2014). All bootstrap factors mapped to the base factors in > 95 % of the runs. No factor swaps and no decrease in Q were observed in the displacement analysis. The PMF-modeled reconstructed PM2.5 mass is close to the measured one, with slope of 1.01 and Rp of 0.99. The model performance for individual species was also good, with slopes ranging from 0.59 to 1.08 and Rp in the range of 0.82–1.00.
Briefly, the PMFref run resolved 10 factors comprised of four secondary sources (i.e., secondary nitrate formation process, secondary sulfate formation process, and two SOA factors – SOA_I and SOA_II) and six primary factors (i.e., vehicle exhaust, industrial emissions, coal combustion, dust, biomass burning, and firework emissions). The SOA_I factor contained high loadings of α-pinene and toluene SOA tracers, representing mixture of biogenic and anthropogenic SOA. The SOA_II factor was primarily contributed by phthalic acid, suggesting an anthropogenic origin. Among the primary factors, the firework emission factor was only present during the CNY and post-CNY sampling period (Fig. 2b). Consequently, we imposed constraints to set the factor contributions of firework emissions to zero during the period before CNY. The resolved factor profiles and PM2.5 contributions from PMFref are shown in Figs. S2 and S3 in the Supplement. Briefly, the PMFref results showed that secondary nitrate and secondary sulfate factors constituted the most important sources contributing to the PM2.5 levels at this site, accounting for 58 % and 11 % of the PM2.5 mass during the period before CNY and 40 % and 23 % during the CNY and post-CNY period, respectively. SOA_I and SOA_II contributed to 3 % and 7 %–8 % of the PM2.5 mass, respectively. Among the primary sources, industrial emissions, biomass burning, and dust showed comparable contributions to the PM2.5 mass (ranging from 2 % to 8 %), while vehicle exhaust was a minor source, contributing less than 1 % to PM2.5 at this suburban site. Firework emissions, however, constituted a non-negligible source during the CNY and post-CNY period, contributing to 12 % of the total PM2.5 mass.
3.2 Short-term PMF run combined with a-value approach
The short-term source apportionment analysis was conducted using data from the first sampling period, spanning 18 d from 29 December 2019 to 15 January 2020. The selection of the window length may vary depending on the specific datasets under study. The determination of the window length for our observational dataset is shown in Sect. S2 in the Supplement, where 4, 7, 10, 14, and 18 d were initially evaluated. A window length of 18 d was chosen as it produced the most stable base run result with minimum factor profile mixing. Previous studies that employed higher-time-resolution measurements (e.g., hourly or 30 min intervals) suggested a window length of 14 d (Chen et al., 2022; Canonaco et al., 2021; Song et al., 2021). However, our bihourly time-resolution data indicated a slightly longer window length, which provided a more robust solution.
The short-term PMF run resolved nine factors, with the firework emission factor not resolved during the sampling period before CNY. The a-value approach was tested in the short-term PMF run, utilizing the source profiles of primary factors obtained from the PMFref results as reference profiles. A range of a value, from 0 to 1 with a step size of 0.1, was tested. Compared with primary sources, the secondary sources often do not represent specific emissions. Instead, they typically result from a complex interplay of multiple aging processes that occur over the observational period and are susceptible to environmental conditions such as relative humidity and photoactivity. Thus, the four secondary factors were not constrained in the short-term PMF run using the a-value approach, consistent with the common strategy in previous studies (Chen et al., 2022; Canonaco et al., 2021). A total of 100 PMF calls were performed and the variability of Q/Qexp was examined. The ratio Q/Qexp, where Qexp≈n × m−p × (n+m), indicates the overall fitting of all input species and is reciprocally associated with the fitting (Norris et al., 2014). Among the 100 runs, the variation of Q/Qexp is consistently minimum, with a coefficient of variation of < 1 %. The one with the lowest Q/Qexp was chosen for further analysis. For comparison, the unconstrained PMF run was also conducted in a similar manner. In general, the a-value constrained PMF runs showed better agreement with the PMFref run compared to the unconstrained PMF run (Fig. S5a in the Supplement). The change in Q/Qexp values was evaluated to determine the optimum a values (Fig. S5b). Larger Q/Qexp values were observed in the a-value constrained runs, compared with the unconstrained PMF run. As the a values decreased from 1 to 0, the Q/Qexp increased, reflecting a decrease in the freedom of the source profiles. The change in Q/Qexp exhibited a “U” shape, with higher values observed for small (0–0.2) and large a values (0.9–1), indicating larger changes in the PMF results with varying a values. A threshold a value of 0.3 was initially selected, after which the change in Q/Qexp became considerably smaller.
Figure 3 presents a comparison of the relative difference in PM2.5 source contributions for individual primary source factors obtained from the a-value constrained runs and the unconstrained PMF run, in relation to the PMFref results. Different factors showed different response to the change in the a values. For vehicle exhaust, industrial emissions, and coal combustion, much smaller differences (0 %–15 %) were observed with small a values (< 0.5). However, as the a values increased, the differences became more substantial (10 %–60 %), highlighting the importance of constraining the source profiles for these factors. In the case of dust and biomass burning, larger differences were observed (22 %–44 % and 10 %–21 %, respectively) when the a values exceeded 0.1. Therefore, smaller a values were suggested for the two sources, which was in accordance with the fact that their source profiles were less affected by lockdown restrictions compared to other primary sources. After initial test, an a value of 0.1 was selected for biomass burning and dust, while an a value of 0.3 remained for other primary factors. These chosen a values (0.1 and 0.3) align with previous studies that utilized ACSM datasets, where a values between 0–0.4 were adopted (Canonaco et al., 2021). With this set of optimized a values, the relative differences in the apportioned PM2.5 source contributions compared to those apportioned by PMFref were as follows for the five primary factors: vehicle exhaust (−1 %), industrial emission (−11 %), coal combustion (5 %), dust (−14 %), and biomass burning (−5 %). In comparison, the unconstrained PMF run produced notably poorer results for vehicle exhaust (35 %) and biomass burning (−17 %).
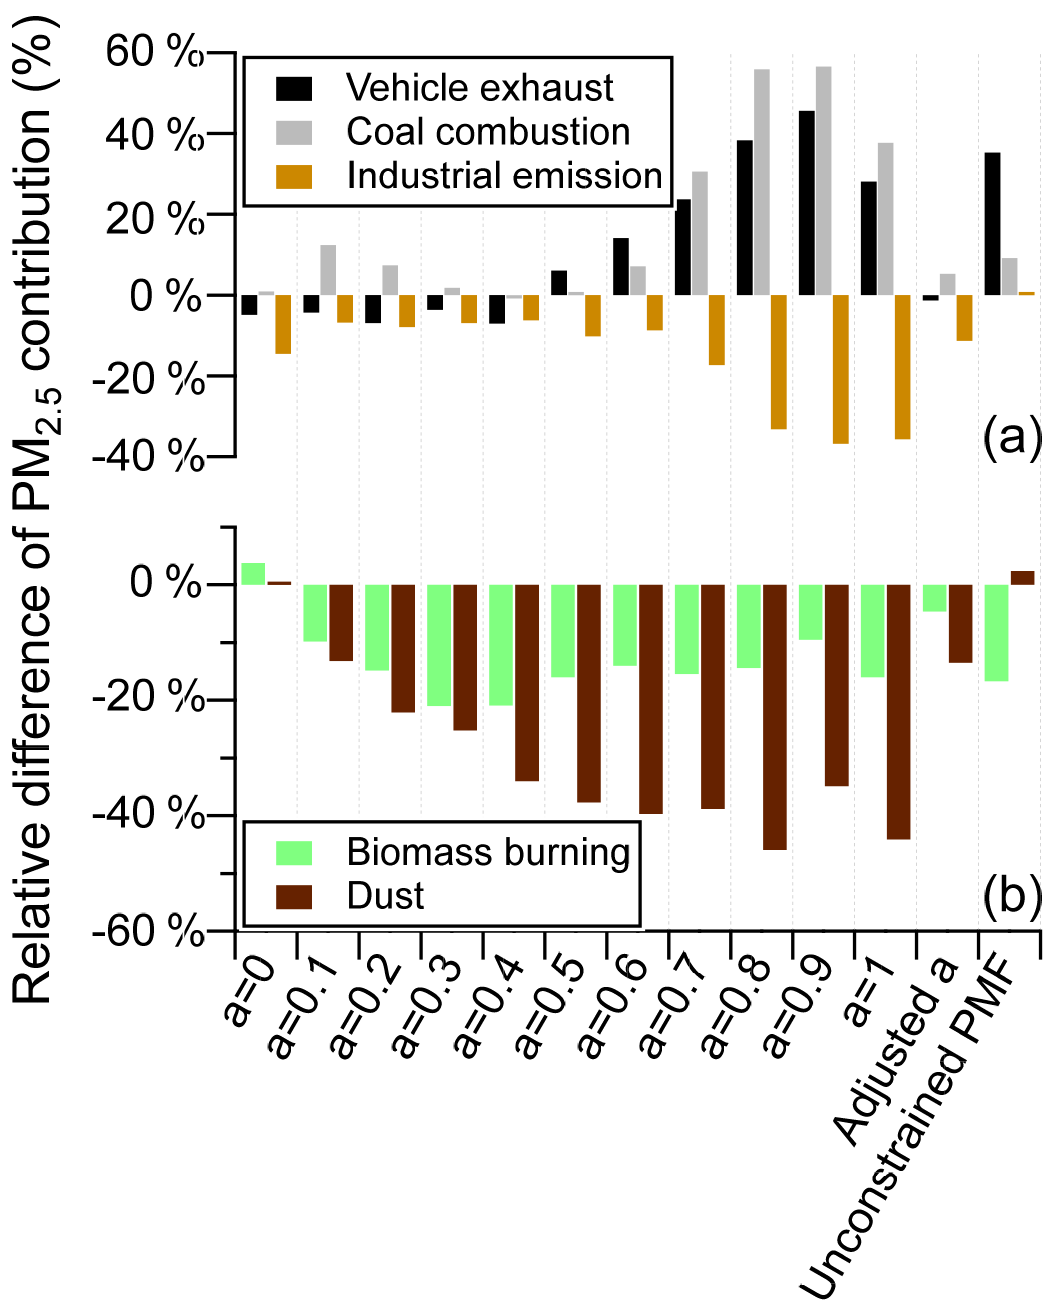
Figure 3Relative differences in PM2.5 contribution between different a-value constrained runs and the unconstrained PMF run, compared to the reference result, for (a) vehicle exhaust, coal combustion, and industrial emission, and (b) biomass burning and dust. The “adjusted a” indicates the final a values adopted, i.e., a=0.3 for vehicle exhaust, coal combustion, and industrial emissions and a=0.1 for biomass burning and dust.
We additionally conducted a sensitivity test on the reference profiles by manually generating a set of new reference profiles that deviated from the original profiles by a relative standard deviation ranging from 10 % to 70 %. The details are shown in Sect. S3 in the Supplement. As the deviation increased, the apportioned source contributions exhibited greater relative differences compared to the PMFref results for the primary factors (Fig. S6 in the Supplement). These findings indicate that utilizing source profiles derived from the PMFref run is an effective approach for establishing appropriate constraints, resulting in a closer approximation to the true source profiles at the site.

Figure 4Time series of factor contributions to PM2.5 for individual PMFroll runs and the average source contributions. The individual PMFroll run is shown by the light red line, and the average PMFroll result is shown by the dark red line.
3.3 Short-term rolling PMF runs combined with the a-value approach
We next tested whether the short-term PMF strategy works on more datasets with potential change in pollution. The rolling PMF runs (denoted as PMFroll) were conducted using the remaining dataset, maintaining a fixed window length of 18 d. The window increment was set at 1 d, following the practice in previous studies (Canonaco et al., 2021; Chen et al., 2021, 2022; Song et al., 2021). A total of 19 PMFroll runs were performed (Table S1). The first two PMFroll runs utilized input data collected before the CNY (30 December 2019–23 January 2020) and resolved nine factors. Subsequently, the 3rd to 19th PMFroll runs employed input data spanning the CNY (1 January–9 February 2020) and resolved 10 factors, including an additional factor attributed to firework emissions. The 3rd PMFroll run (input data of 1–24 January 2020), a transitional PMF run from 9 to 10 factors, was excluded due to the limited availability of data points influenced by firework emissions (Nfirework_data = 2, representing the number of data points under the influence of firework emissions). Furthermore, the apportioned results from this run displayed significant discrepancies compared with the rest of the PMFroll runs. Consequently, 18 out of the 19 PMFroll runs were selected for further analysis.
Figure 4 shows the time series of the PM2.5 source contributions from individual PMFroll runs and the average contributions. Comparable results were observed across the PMFroll runs for all primary source factors, indicating the effectiveness of the a-value approach to reproduce the primary source contributions during the short-term PMF runs. To illustrate this point, we also performed unconstrained rolling PMF runs (i.e., without the a-value approach), which showed much larger run-to-run variability for the primary source factors, especially vehicle exhaust and coal combustion (Sect. S4 and Fig. S7 in the Supplement). These findings underscore the advantage of employing source profile constraints to achieve reproducible source apportionment results when performing the PMF analysis over a short-term measurement period. The four secondary source factors were not subject to constraints and displayed varying levels of run-to-run variability. Secondary nitrate exhibited minimal variability among the runs, while secondary sulfate showed larger variations. Both SOA factors demonstrated even greater variations, particularly the SOA_I factor. However, the SOA_II factor exhibited relatively smaller variations in the later sampling period data.
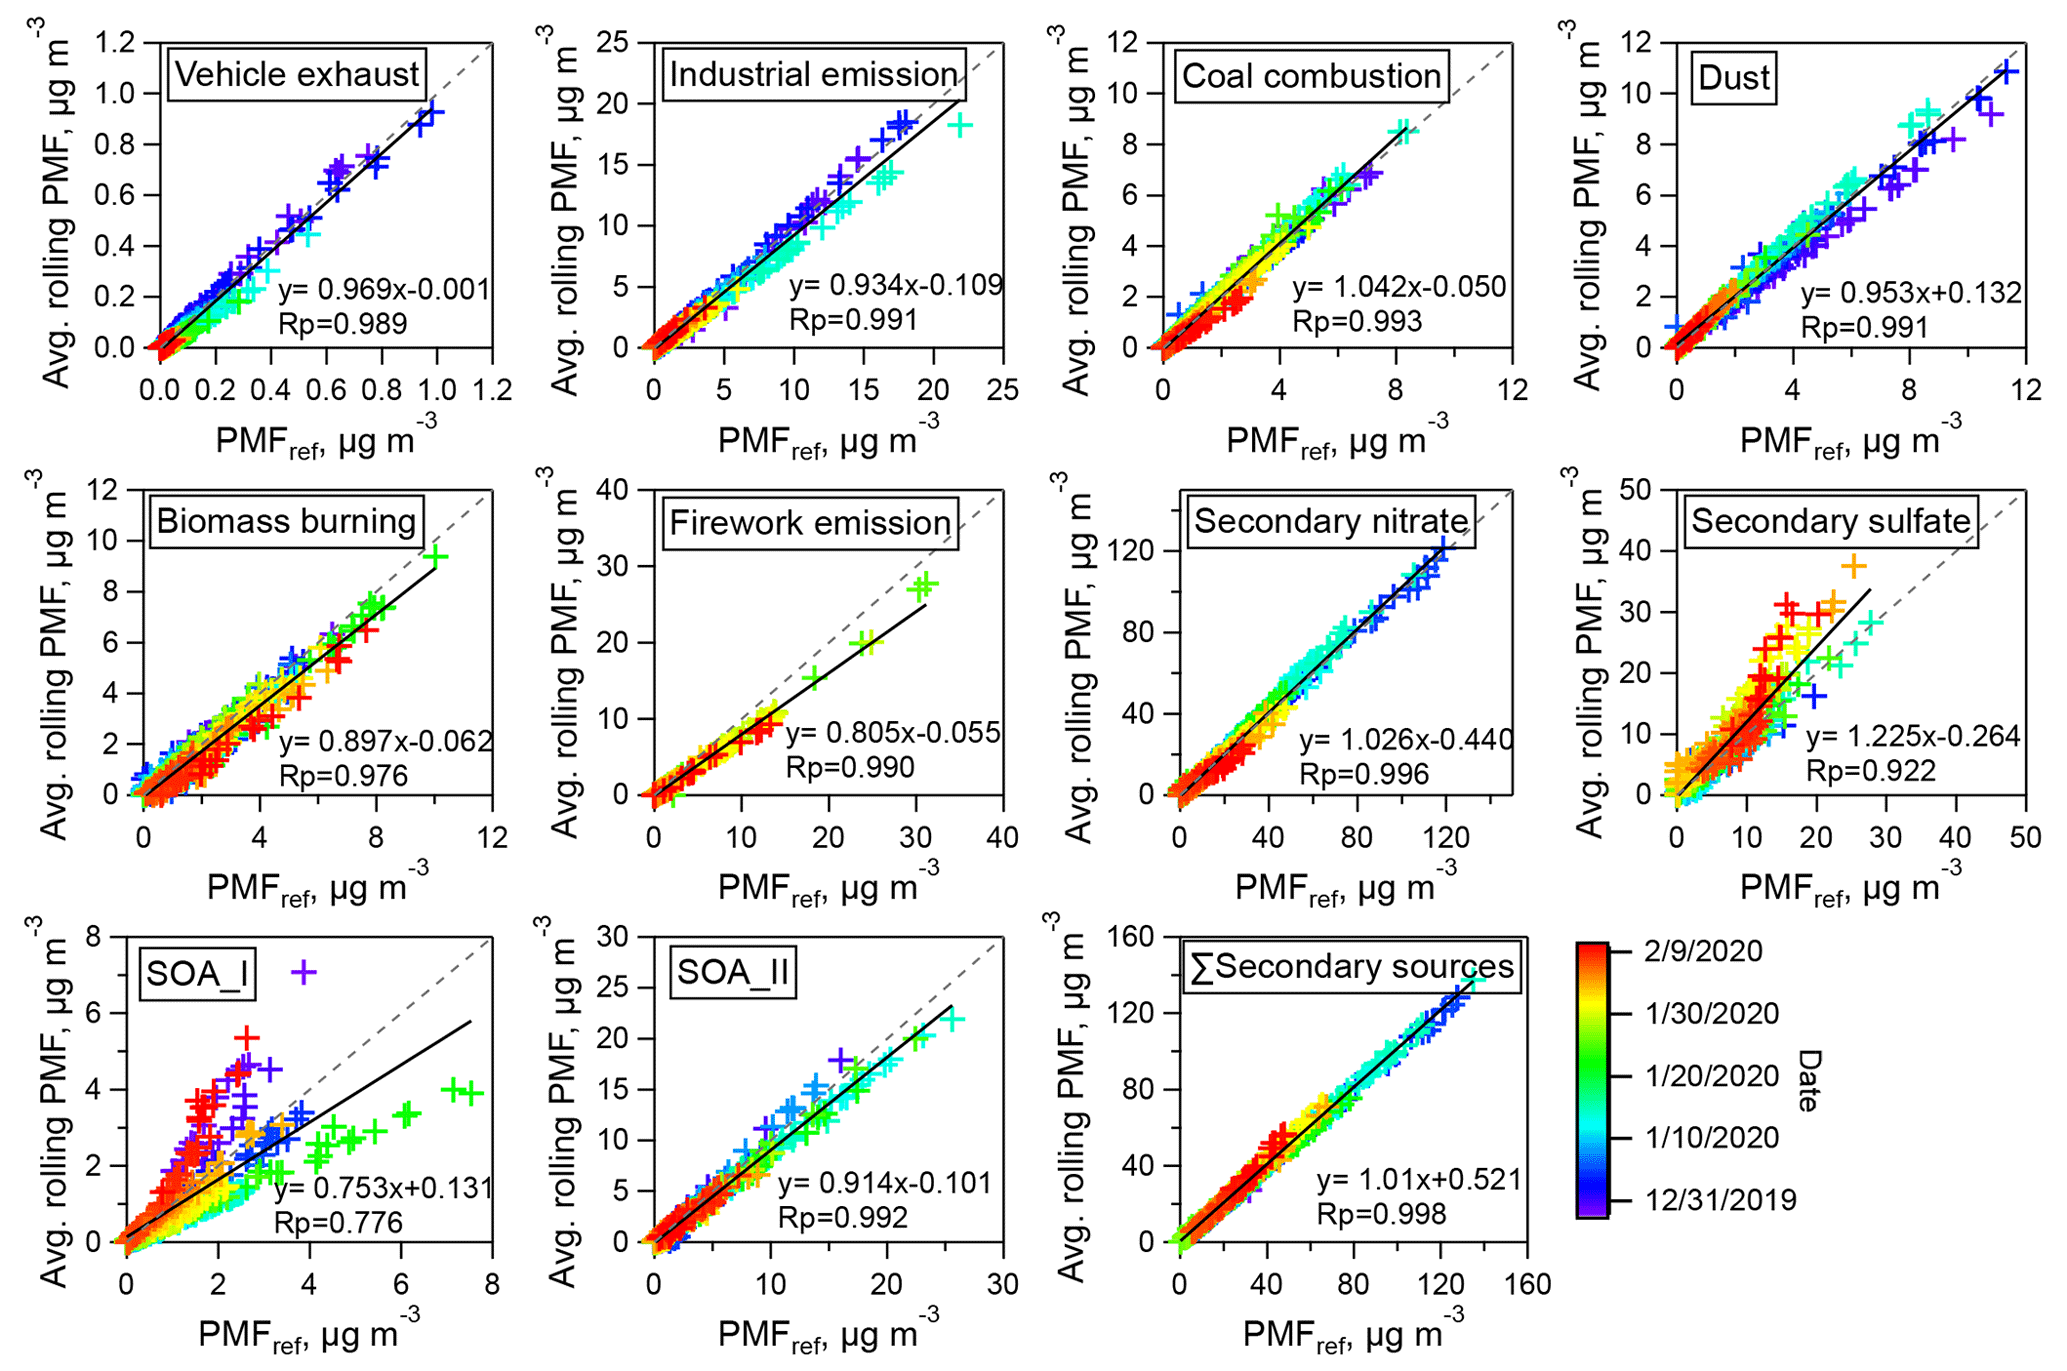
Figure 5Comparison of the PM2.5 source contributions obtained from average PMFroll runs with the reference result in PMFref for individual source factors and the sum of the four secondary sources.
The final solution was obtained by averaging the PM2.5 source contributions from all PMFroll runs, which were then compared with the reference result obtained from the PMFref run (Fig. 5). The primary source factors (i.e., vehicle exhaust, industrial emission, coal combustion, and dust) exhibited a strong agreement between the PMFroll and PMFref results (slope > 0.93). A slight underestimation was observed for biomass burning, with a slope of 0.90. In contrast, the sporadic source of firework emissions showed consistently lower estimations by PMFroll (slope 0.81), which may reflect higher source contributions by PMFref. This result highlights the unique advantage of the short-term source apportionment in accurately apportioning the sporadic sources (Song et al., 2021). Among the four secondary sources, secondary nitrate showed good agreement with the reference result (slope of 1.0 and Pearson correlation coefficient Rp of 1.0). Secondary sulfate exhibited a good correlation with the PMFref run (slope = 1.2 and Rp = 0.92), although the PMFroll runs apportioned higher contributions, especially for the later sampling period during the lockdown. SOA_I showed a weaker correlation with the reference result (Rp = 0.77), and the slope varied with time (Fig. 5). On the other hand, SOA_II displayed good agreement between PMFroll and PMFref, but larger uncertainties were associated with the apportioned results due to large run-to-run variabilities observed in the source contributions, especially during the middle sampling period (Fig. 4). Notably, the sum of the four secondary sources showed good agreement with the PMFref run, both with (slope = 1.0 and Rp = 1.0) and without a-value constraints (slope = 0.95 and Rp = 0.99). This observation may be attributed to the intrinsic temporal variations differing between primary and secondary sources.
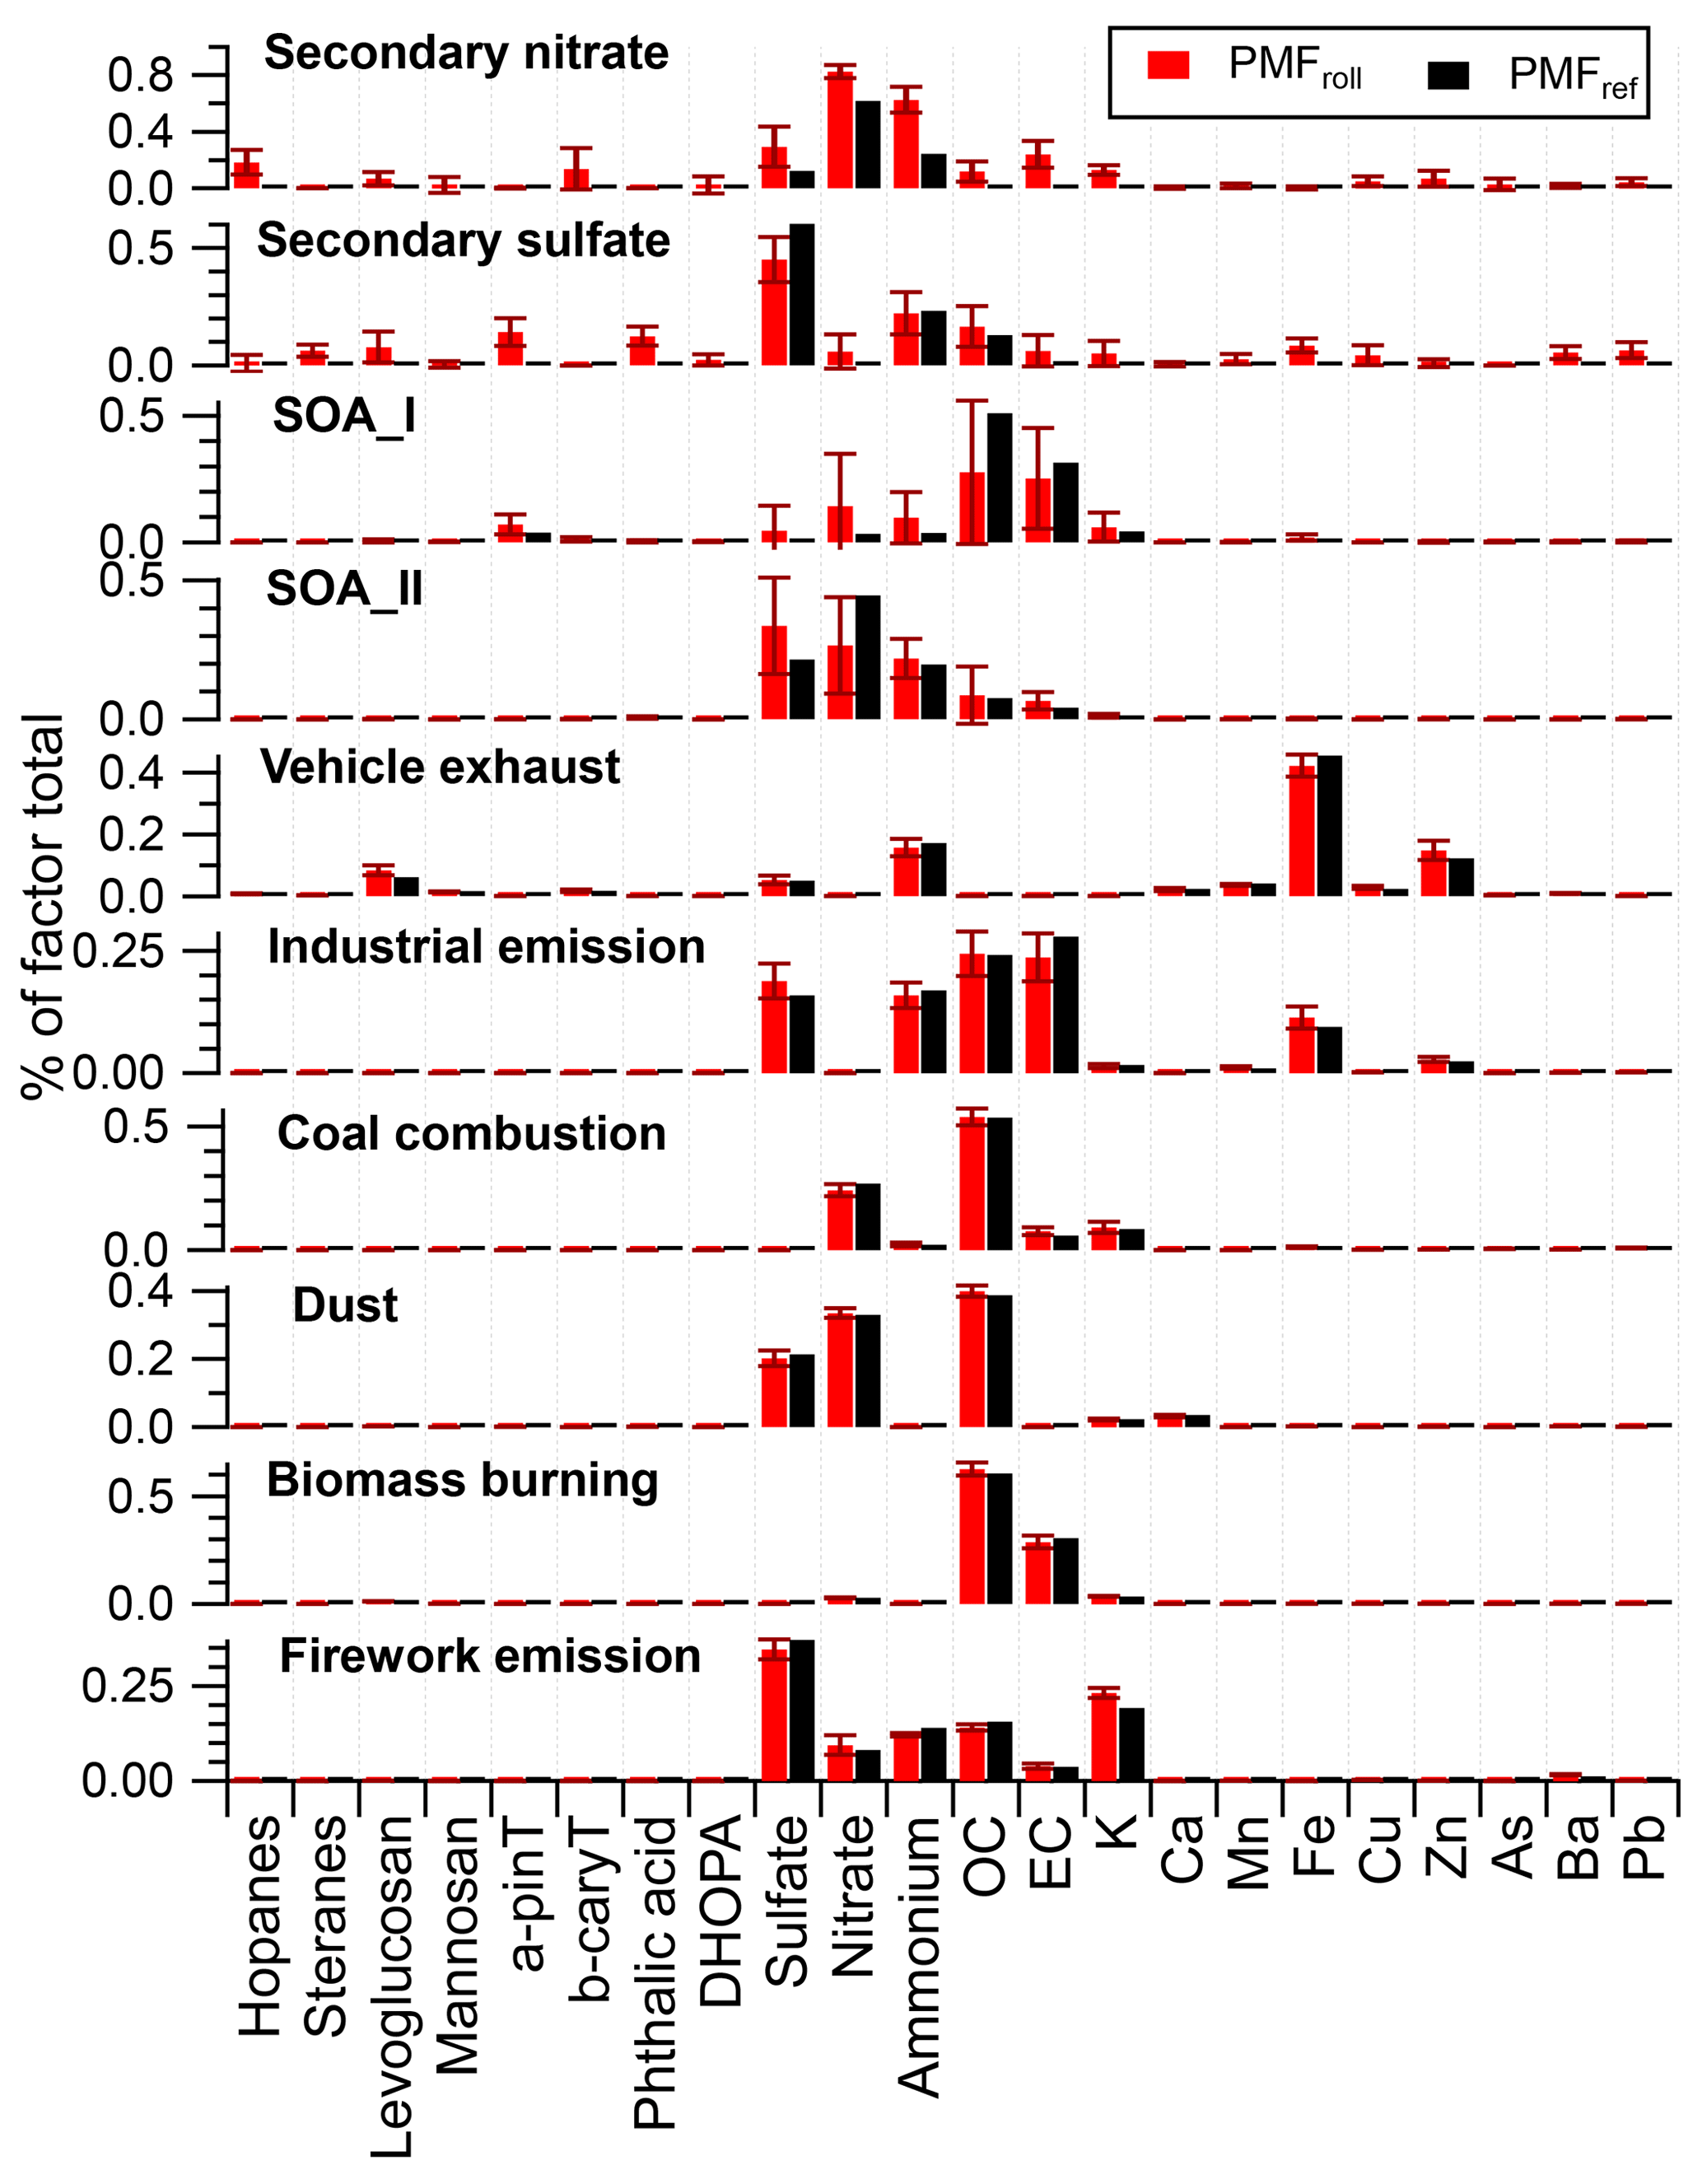
Figure 6Comparison of the source profiles (% of factor total) derived from the short-term rolling PMF runs (PMFroll) and the reference profiles from PMFref. Error bars represent 1 standard deviation of profile variability across the PMFroll runs.
3.4 Source profile variability
The temporal variation of source profiles is the fundamental reason why short-term source apportionment is necessary to achieve accurate source apportionment during episodic events. Figure 6 presents the average factor profiles of the 10 resolved source factors throughout the entire field campaign, alongside the reference profiles from the PMFref run. The error bars represent 1 standard deviation of profile variability across the PMFroll runs throughout the entire measurement period. This variability encompasses both time-dependent variations in the factor profiles and uncertainties associated with the PMF analysis. All primary factors showed comparable source profiles between PMFroll and PMFref. However, the four secondary source factors derived from the PMFroll runs showed higher variabilities in their profiles and larger differences compared to the PMFref run. In particular, the secondary nitrate and sulfate factors from PMFroll showed higher loadings of organic tracers and elemental species in their profiles compared to PMFref. The SOA_I factor showed a higher proportion of inorganic ions, whereas the SOA_II factor showed lower loadings of the inorganic ions.
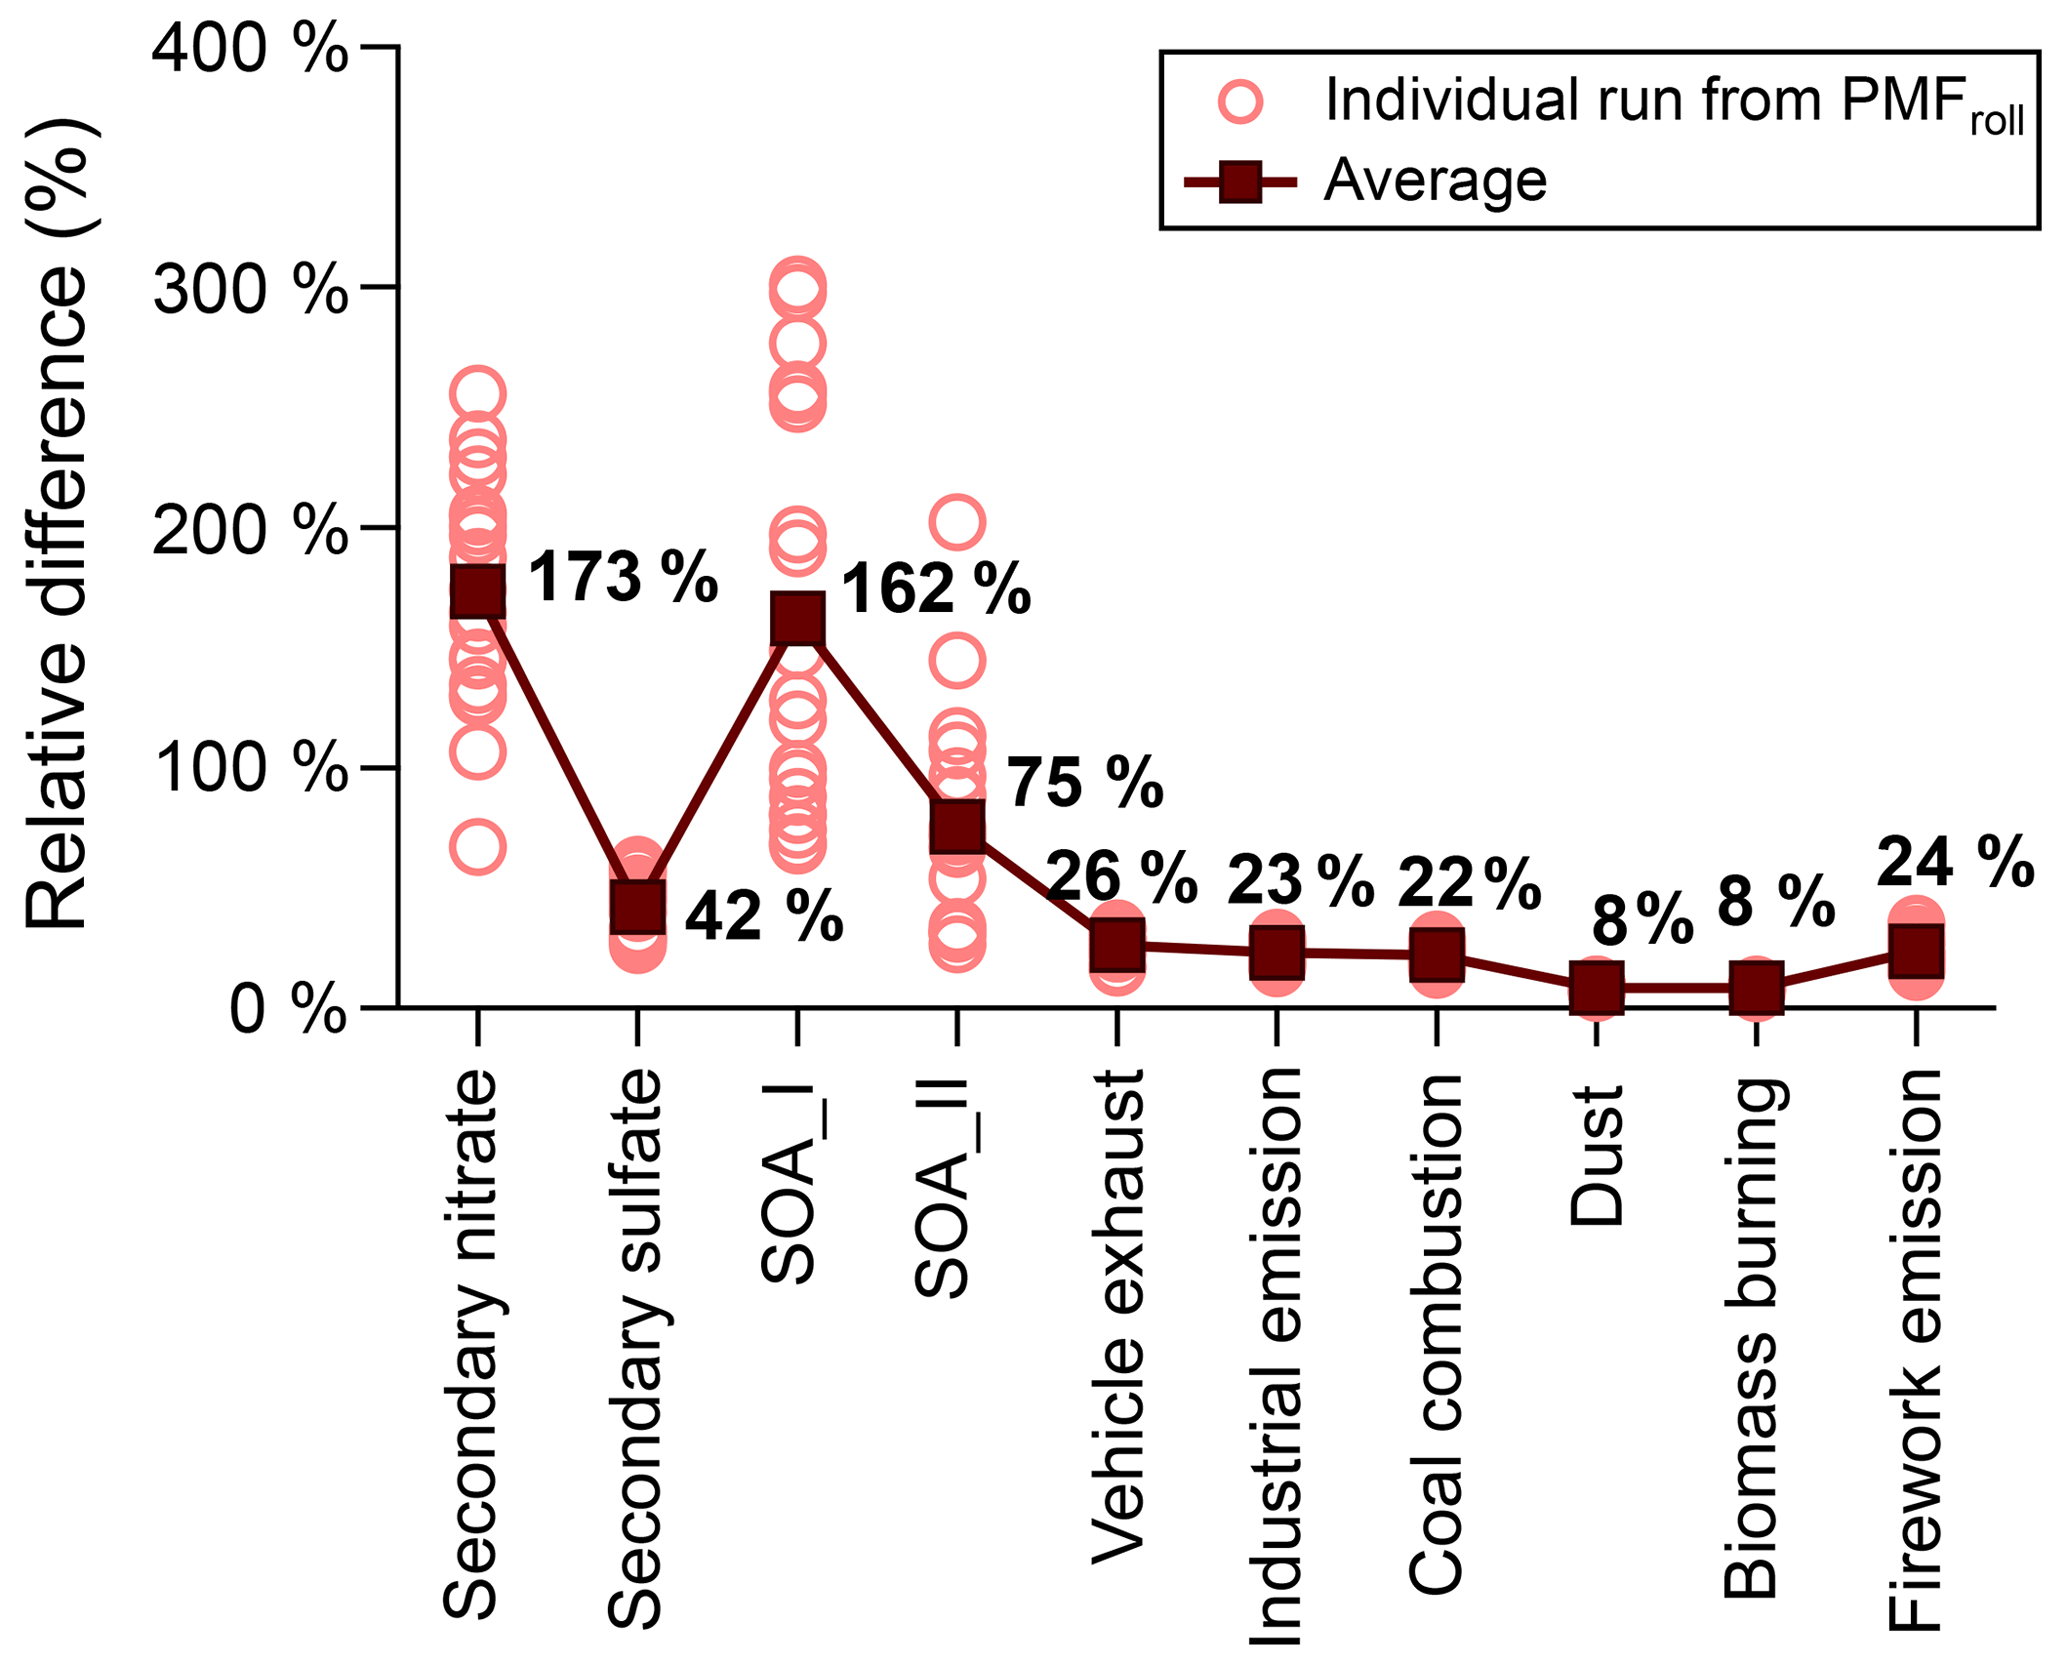
Figure 7The relative difference in the resolved source profiles among the individual rolling PMF runs. The relative difference for the individual rolling PMF run (empty circles) was calculated as the average value of the relative difference for all input species. Solid squares represent the average value from all rolling PMF runs.
We calculated the relative difference between the source profiles obtained from PMFroll with PMFref to evaluate their disparities (Fig. 7). The relative difference for each PMFroll run was calculated as the average value of the relative difference for all input species. The results indicated that the primary sources showed relatively small differences among individual PMFroll runs. For example, the relative difference for vehicle exhaust varied from 17 % to 33 %. Across the five primary factors, the average relative difference ranged from 8 % for dust and biomass burning to 26 % for vehicle exhaust. In contrast, the secondary sources inherently displayed more variability than the primary sources, leading to challenges and larger uncertainties in apportioning individual secondary sources. Significant variabilities were observed in the source profiles of the secondary sources. Among them, secondary sulfate showed a slightly smaller relative difference, with an average value of 42 % (range 26 %–60 %). Secondary nitrate, SOA_I, and SOA_II showed large variations, with an average relative difference of 173 %, 162 %, and 75 %, respectively. In the case of the secondary nitrate factor, although the apportioned PM2.5 contributions from individual source factors were comparable to the reference result, the resolved source profiles exhibited high time-dependent variabilities. We hypothesize this may be attributed to the sensitivity of nitrate formation to the reduction of NOx and volatile organic compound (VOC) precursors during the lockdown restriction (Yang et al., 2022). Previous laboratory studies indicated that reducing anthropogenic pollutants such as SO2 and NOx can also reduce the biogenic SOA formation via anthropogenic–biogenic interactions (Zhang et al., 2019; Xu et al., 2015). This, to some extent, explains the high variabilities in source profiles of the two SOA factors. Additionally, the high variabilities may also arise from the uncertainties in the PMF analysis due to the limited data points available from the short-term time span (Wang et al., 2018). Therefore, in future studies, alternative approaches are needed to independently assess the contribution of secondary sources. Also, we recommend deploying higher-time-resolution measurement of the organic tracers. This will help ensure accurate source apportionment results for individual secondary sources, especially within the confines of a short-term time span.
In this study, we presented a short-term PMF strategy utilizing bihourly PM chemical speciation data including the molecular and elemental tracers. Initially, the PMFref runs using the campaign-wide measurement data were performed by EPA PMF software to get an overview of the emission sources and obtain the reference profiles of the primary sources. Then, the short-term PMF analysis was performed using an 18 d window length combined with the a-value approach in SoFi Pro software. The reference profiles derived from the campaign-wide data were employed as constraints to reduce the rotational ambiguity in the short-term PMF results. The training data with the a-value constraints for an 18 d window indicated a smaller a value for biomass burning and dust sources. This suggests that the profiles of these sources remain relatively constant and exhibit less variability throughout the campaign period. The constrained PMF results exhibited improved agreement with the reference results compared to the base run without any constraints. The rolling PMF analysis with optimized a-value constraints demonstrated good agreement between the regular primary sources and the reference result, underscoring the efficacy of source profile constraints in short-term PMF runs. However, the sporadic source of firework emissions exhibited overestimation in the long-term source apportionment results. Furthermore, noticeable differences were observed between the rolling PMF and PMFref for individual secondary sources, particularly the SOA factors. Nevertheless, the overall contribution of the total secondary sources showed good agreement. Future endeavors should aim to improve the modeling of individual secondary factors by either using alternative approaches or deploying higher-time-resolution measurement of organic tracers.
The findings of this study highlight the applicability of the short-term PMF analysis with source profile constraints for source apportionment of PM2.5. This suggests the potential for future work to achieve rapid source apportionment by utilizing a library of source profiles derived from existing measurement data. By advancing the window frame to incorporate new measurement data (e.g., 1 d data), short-term PMF analysis can provide source contributions for the most recent observations. This approach significantly reduces the time lag associated with receptor modeling source apportionment techniques. Such advancements hold important policy implications, as they enable prompt response during pollution episodes, eliminating the need to wait for the accumulation of sufficient data for conducting PMF analysis.
Bihourly organic markers and other PM chemical speciation data presented in this study can be requested by contacting the corresponding author (jian.yu@ust.hk).
The supplement related to this article is available online at: https://doi.org/10.5194/acp-24-475-2024-supplement.
QW and JZY formulated the overall design of the study. QW, SZ, SW, CH, and YD carried out the measurement of PM chemical speciation data and data validation. QW did the overall data analysis with contributions from JZY. QW and JZY wrote the paper with contributions from all co-authors.
The contact author has declared that none of the authors has any competing interests.
Publisher's note: Copernicus Publications remains neutral with regard to jurisdictional claims made in the text, published maps, institutional affiliations, or any other geographical representation in this paper. While Copernicus Publications makes every effort to include appropriate place names, the final responsibility lies with the authors.
This research has been supported by the Hong Kong Research Grants Council (grant nos. R6011-18 and 16305418), The Hong Kong University of Science and Technology (grant no. VPRDO19IP01), the “CUG” Scientific Research Funds (grant no. 2022115), and the Fundamental Research Funds for the Central Universities (grant no. G1323523063) at the China University of Geosciences (Wuhan).
This paper was edited by Dantong Liu and reviewed by two anonymous referees.
Canonaco, F., Crippa, M., Slowik, J. G., Baltensperger, U., and Prévôt, A. S. H.: SoFi, an IGOR-based interface for the efficient use of the generalized multilinear engine (ME-2) for the source apportionment: ME-2 application to aerosol mass spectrometer data, Atmos. Meas. Tech., 6, 3649–3661, https://doi.org/10.5194/amt-6-3649-2013, 2013.
Canonaco, F., Tobler, A., Chen, G., Sosedova, Y., Slowik, J. G., Bozzetti, C., Daellenbach, K. R., El Haddad, I., Crippa, M., Huang, R.-J., Furger, M., Baltensperger, U., and Prévôt, A. S. H.: A new method for long-term source apportionment with time-dependent factor profiles and uncertainty assessment using SoFi Pro: application to 1 year of organic aerosol data, Atmos. Meas. Tech., 14, 923–943, https://doi.org/10.5194/amt-14-923-2021, 2021.
Chen, G., Sosedova, Y., Canonaco, F., Fröhlich, R., Tobler, A., Vlachou, A., Daellenbach, K. R., Bozzetti, C., Hueglin, C., Graf, P., Baltensperger, U., Slowik, J. G., El Haddad, I., and Prévôt, A. S. H.: Time-dependent source apportionment of submicron organic aerosol for a rural site in an alpine valley using a rolling positive matrix factorisation (PMF) window, Atmos. Chem. Phys., 21, 15081–15101, https://doi.org/10.5194/acp-21-15081-2021, 2021.
Chen, G., Canonaco, F., Tobler, A., Aas, W., Alastuey, A., Allan, J., Atabakhsh, S., Aurela, M., Baltensperger, U., Bougiatioti, A., De Brito, J. F., Ceburnis, D., Chazeau, B., Chebaicheb, H., Daellenbach, K. R., Ehn, M., El Haddad, I., Eleftheriadis, K., Favez, O., Flentje, H., Font, A., Fossum, K., Freney, E., Gini, M., Green, D. C., Heikkinen, L., Herrmann, H., Kalogridis, A.-C., Keernik, H., Lhotka, R., Lin, C., Lunder, C., Maasikmets, M., Manousakas, M. I., Marchand, N., Marin, C., Marmureanu, L., Mihalopoulos, N., Močnik, G., Nęcki, J., O'Dowd, C., Ovadnevaite, J., Peter, T., Petit, J.-E., Pikridas, M., Matthew Platt, S., Pokorná, P., Poulain, L., Priestman, M., Riffault, V., Rinaldi, M., Różański, K., Schwarz, J., Sciare, J., Simon, L., Skiba, A., Slowik, J. G., Sosedova, Y., Stavroulas, I., Styszko, K., Teinemaa, E., Timonen, H., Tremper, A., Vasilescu, J., Via, M., Vodička, P., Wiedensohler, A., Zografou, O., Cruz Minguillón, M., and Prévôt, A. S. H.: European aerosol phenomenology – 8: Harmonised source apportionment of organic aerosol using 22 Year-long ACSM/AMS datasets, Environ. Int., 166, 107325, https://doi.org/10.1016/j.envint.2022.107325, 2022.
Chow, W. S., Liao, K., Huang, X. H. H., Leung, K. F., Lau, A. K. H., and Yu, J. Z.: Measurement report: The 10-year trend of PM2.5 major components and source tracers from 2008 to 2017 in an urban site of Hong Kong, China, Atmos. Chem. Phys., 22, 11557–11577, https://doi.org/10.5194/acp-22-11557-2022, 2022a.
Chow, W. S., Huang, X. H., Leung, K. F., Huang, L., Wu, X., and Yu, J. Z.: Molecular and elemental marker-based source apportionment of fine particulate matter at six sites in Hong Kong, China, Sci. Total Environ., 813, 152652, https://doi.org/10.1016/j.scitotenv.2021.152652, 2022b.
Henry, R. C. and Christensen, E. R.: Selecting an appropriate multivariate source apportionment model result, Environ. Sci. Technol., 44, 2474–2481, https://doi.org/10.1021/es9018095, 2010.
IPCC: Climate Change 2014: Synthesis Report. Contribution of Working Groups I, II and III to the Fifth Assessment Report of the Intergovernmental Panel on Climate Change [Core Writing Team, Pachauri, R. K. and Meyer, L. A. (eds.)], IPCC, Geneva, Switz., 151 pp, 2014.
Kong, S. F., Li, L., Li, X. X., Yin, Y., Chen, K., Liu, D. T., Yuan, L., Zhang, Y. J., Shan, Y. P., and Ji, Y. Q.: The impacts of firework burning at the Chinese Spring Festival on air quality: insights of tracers, source evolution and aging processes, Atmos. Chem. Phys., 15, 2167–2184, https://doi.org/10.5194/acp-15-2167-2015, 2015.
Lee, S. and Russell, A. G.: Estimating uncertainties and uncertainty contributors of CMB PM2.5 source apportionment results, Atmos. Environ., 41, 9616–9624, https://doi.org/10.1016/j.atmosenv.2007.08.022, 2007.
Lee, B. P., Louie, P. K. K., Luk, C., and Chan, C. K.: Evaluation of traffic exhaust contributions to ambient carbonaceous submicron particulate matter in an urban roadside environment in Hong Kong, Atmos. Chem. Phys., 17, 15121–15135, https://doi.org/10.5194/acp-17-15121-2017, 2017.
Manousakas, M., Furger, M., Daellenbach, K. R., Canonaco, F., Chen, G., Tobler, A., Rai, P., Qi, L., Tremper, A. H., Green, D., Hueglin, C., Slowik, J. G., El Haddad, I., and Prevot, A. S. H.: Source identification of the elemental fraction of particulate matter using size segregated, highly time-resolved data and an optimized source apportionment approach, Atmos. Environ. X, 14, https://doi.org/10.1016/j.aeaoa.2022.100165, 2022.
Norris, G. A., Duvall, R., Brown, S. G., and Bai, S.: EPA Positive Matrix Factorization (PMF) 5.0 Fundamentals and User Guide, Environ. Prot. Agency Off. Researc Dev. Publushing House, Whashington, DC, 20460, 136, 2014.
Paatero, P.: The multilinear engine – a table-driven, least squares program for solving multilinear problems, including the n-way parallel factor analysis model, J. Comput. Graph. Stat., 8, 854–888, https://doi.org/10.1080/10618600.1999.10474853, 1999.
Paatero, P. and Tapper, U.: Positive matrix factorization: A non-negative factor model with optimal utilization of error estimates of data values, Environmetrics, 5, 111–126, https://doi.org/10.1002/env.3170050203, 1994.
Reff, A., Eberly, S. I., and Bhave, P. V.: Receptor modeling of ambient particulate matter data using positive matrix factorization: review of existing methods, J. Air Waste Manage. Assoc., 57, 146–154, https://doi.org/10.1080/10473289.2007.10465319, 2007.
Scotto, F., Bacco, D., Lasagni, S., Trentini, A., Poluzzi, V., and Vecchi, R.: A multi-year source apportionment of PM2.5 at multiple sites in the southern Po Valley (Italy), Atmos. Pollut. Res., 12, 101192, https://doi.org/10.1016/j.apr.2021.101192, 2021.
Shao, P., Tian, H., Sun, Y., Liu, H., Wu, B., Liu, S., Liu, X., Wu, Y., Liang, W., Wang, Y., Gao, J., Xue, Y., Bai, X., Liu, W., Lin, S., and Hu, G.: Characterizing remarkable changes of severe haze events and chemical compositions in multi-size airborne particles (PM1, PM2.5 and PM10) from January 2013 to 2016–2017 winter in Beijing, China, Atmos. Environ., 189, 133–144, https://doi.org/10.1016/j.atmosenv.2018.06.038, 2018.
Song, L., Dai, Q., Feng, Y., and Hopke, P. K.: Estimating uncertainties of source contributions to PM2.5 using moving window evolving dispersion normalized PMF, Environ. Pollut., 286, 117576, https://doi.org/10.1016/j.envpol.2021.117576, 2021.
Wang, Q., Qiao, L., Zhou, M., Zhu, S., Griffith, S., Li, L., and Yu, J. Z.: Source Apportionment of PM2.5 Using Hourly Measurements of Elemental Tracers and Major Constituents in an Urban Environment: Investigation of Time-Resolution Influence, J. Geophys. Res.-Atmos., 123, 5284–5300, https://doi.org/10.1029/2017JD027877, 2018.
Wang, Q., Wang, S., Cheng, Y. Y., Chen, H., Zhang, Z., Li, J., Gu, D., Wang, Z., and Yu, J. Z.: Chemical evolution of secondary organic aerosol tracers during high−PM2.5 episodes at a suburban site in Hong Kong over 4 months of continuous measurement, Atmos. Chem. Phys., 22, 11239–11253, https://doi.org/10.5194/acp-22-11239-2022, 2022.
Wang, S., Wang, Q., Zhu, S., Zhou, M., Qiao, L., Huang, D., Ma, Y., Lu, Y., Huang, C., Fu, Q., Duan, Y., and Yu, J. Z.: Hourly Organic Tracers-based Source Apportionment of PM2.5 before and during the Covid-19 lockdown: A Case Study in Suburban Shanghai, China, Atmos. Environ., 289, 119308, https://doi.org/10.1016/j.atmosenv.2022.119308, 2022.
Wang, Y., Gao, W., Wang, S., Song, T., Gong, Z., Ji, D., Wang, L., Liu, Z., Tang, G., Huo, Y., Tian, S., Li, J., Li, M., Yang, Y., Chu, B., Petäjä, T., Kerminen, V. M., He, H., Hao, J., Kulmala, M., Wang, Y., and Zhang, Y.: Contrasting trends of PM2.5 and surface-ozone concentrations in China from 2013 to 2017, Natl. Sci. Rev., 7, 1331–1339, https://doi.org/10.1093/nsr/nwaa032, 2020.
Watson, J. G., Cooper, J. A., and Huntzicker, J. J.: The effective variance weighting for least squares calculations applied to the mass balance receptor model, Atmos. Environ., 18, 1347–1355, https://doi.org/10.1016/0004-6981(84)90043-X, 1984.
Xu, L., Guo, H., Boyd, C. M., Klein, M., Bougiatioti, A., Cerully, K. M., Hite, J. R., Isaacman-VanWertz, G., Kreisberg, N. M., Knote, C., Olson, K., Koss, A., Goldstein, A. H., Hering, S. V., De Gouw, J., Baumann, K., Lee, S. H., Nenes, A., Weber, R. J., and Ng, N. L.: Effects of anthropogenic emissions on aerosol formation from isoprene and monoterpenes in the southeastern United States, P. Natl. Acad. Sci. USA, 112, 37–42, https://doi.org/10.1073/pnas.1417609112, 2015.
Yang, S., Yuan, B., Peng, Y., Huang, S., Chen, W., Hu, W., Pei, C., Zhou, J., Parrish, D. D., Wang, W., He, X., Cheng, C., Li, X.-B., Yang, X., Song, Y., Wang, H., Qi, J., Wang, B., Wang, C., Wang, C., Wang, Z., Li, T., Zheng, E., Wang, S., Wu, C., Cai, M., Ye, C., Song, W., Cheng, P., Chen, D., Wang, X., Zhang, Z., Wang, X., Zheng, J., and Shao, M.: The formation and mitigation of nitrate pollution: comparison between urban and suburban environments, Atmos. Chem. Phys., 22, 4539–4556, https://doi.org/10.5194/acp-22-4539-2022, 2022.
Yin, P., Brauer, M., Cohen, A. J., Wang, H., Li, J., Burnett, R. T., Stanaway, J. D., Causey, K., Larson, S., Godwin, W., Frostad, J., Marks, A., Wang, L., Zhou, M., and Murray, C. J. L.: The effect of air pollution on deaths, disease burden, and life expectancy across China and its provinces, 1990–2017: an analysis for the Global Burden of Disease Study 2017, Lancet Planet. Heal., 4, e386–e398, https://doi.org/10.1016/S2542-5196(20)30161-3, 2020.
Zhang, Y.-Q., Chen, D.-H., Ding, X., Li, J., Zhang, T., Wang, J.-Q., Cheng, Q., Jiang, H., Song, W., Ou, Y.-B., Ye, P.-L., Zhang, G., and Wang, X.-M.: Impact of anthropogenic emissions on biogenic secondary organic aerosol: observation in the Pearl River Delta, southern China, Atmos. Chem. Phys., 19, 14403–14415, https://doi.org/10.5194/acp-19-14403-2019, 2019.