the Creative Commons Attribution 4.0 License.
the Creative Commons Attribution 4.0 License.
 | 11 Jan 2024
Quantifying the effects of the microphysical properties of black carbon on the determination of brown carbon using measurements at multiple wavelengths
Dan Li
Yuanyuan Wang
Dandan Sun
Weizhen Hou
Jinghe Ren
Hailing Wu
Peng Zhou
Jibing Qiu
Methods based on the absorption Ångström exponent (AAE) are widely used to estimate the absorption by brown carbon (BrC), and the estimated absorption by BrC can be significantly different from 0, even for pure black carbon (BC). However, few studies have systematically quantified the effects of BC microphysical properties. Moreover, the conditions under which AAE-based methods are applicable are still unclear. In this work, we used BC models partially coated with non-absorbing materials to calculate the total absorption. Since the total absorption is entirely due to BC, the estimated BrC absorption should be 0 if the retrieval methods are accurate. Thus, the ratio of the estimated BrC absorption to BC absorption (ABSBrC) should be the proportion of the BC absorption that is incorrectly attributed to BrC. The results show that a BC AAE of 1 can generally provide reasonable estimates for freshly emitted BC, since ABSBrC is generally in the range of −4.8 % to 2.7 % during that period. However, when BC aerosols are aged, ABSBrC can sometimes reach about 38.7 %. The wavelength dependence of the AAE (WDA) method does not necessarily improve the estimates; sometimes a negative ABSBrC of about −40.8 % is found for partially coated BC. By combining simulations of a global chemical transport model, this work also quantified the effects of BC microphysical properties on BrC global aerosol absorption optical depth (AAOD) estimates. The AAE = 1 method sometimes leads to a misassigned global mean AAOD of about −0.43– if the BC aerosols have a complex morphology. The WDA method does not necessarily improve the estimates. In our cases, the WDA methods based on spherical models could lead to a global-mean misassigned AAOD range of about −0.87–. At the regional scale, the AAE = 1 method sometimes leads to a distributed AAOD of about −7.3 to in some specific regions. Mie-theory-based WDA methods lead to an estimated AAOD error of about in some regions (e.g., East Asia). This work also showed that the misattributed BrC absorption would lead to substantial uncertainties in the estimation of the global direct radiative forcing (DRF) of absorbing aerosols from different sources.
- Article
(8507 KB) - Full-text XML
-
Supplement
(2791 KB) - BibTeX
- EndNote


Carbonaceous aerosols are a major contributor to climate change (Bond et al., 2013; Myhre et al., 2013). Black carbon (BC) and organic carbon (OC) are the most important carbonaceous aerosols in the atmosphere. The most important absorbing aerosol in the atmosphere, BC, significantly absorbs solar radiation ranging from ultraviolet (UV) to near-infrared (NIR) wavelengths (Cross et al., 2010; Petzold and Schönlinner, 2004; Bond and Bergstrom, 2006). Even when its mass fraction of the total atmospheric aerosols is small, the radiative effects of BC are quite significant due to its high absorption, which greatly enhances global warming (Zhang and Wang, 2011; Bond et al., 2013; Matsui et al., 2018). In contrast, OC was initially considered to be merely a scattering agent that has a cooling effect on the Earth–atmosphere system (Wang et al., 2016). However, recent studies have shown that some OC aerosols also absorb light ranging from UV to visible wavelengths (Kirchstetter et al., 2004; Chakrabarty et al., 2010; Chen and Bond, 2010). These OC aerosols are known as brown carbon (BrC) (Andreae and Gelencsér, 2006; Laskin et al., 2015). Recent studies have also shown that BrC also exerts considerable positive radiative forcing (Zeng et al., 2020b; Feng et al., 2013). In some specific regions, the direct radiative effect of BrC is even comparable to that of BC (A. Zhang et al., 2020). Therefore, understanding BrC absorption is important when studying global climate change.
However, our understanding of BrC absorption is still quite limited. BrC strongly absorbs light in the UV region, while its absorption strongly decreases with increasing wavelength from the UV region to the visible region (Hecobian et al., 2010; Kirchstetter et al., 2004; Chakrabarty et al., 2010; Chen and Bond, 2010; Bahadur et al., 2012). Filter samples in laboratory measurements are the main method for measuring the absorption characteristics of BrC (Chen and Bond, 2010; Xie et al., 2019). Based on laboratory studies, previous studies have shown that the mass cross section (MAC) of BrC varies over a wide range and that the values reported in different studies are different (Dasari et al., 2019; Kirillova et al., 2016). The reasons for the large uncertainties are mainly that the samples are from different regions and were obtained under different measurement conditions. Compared with BC, the absorption by BrC is subject to larger uncertainties as it depends on the type of fuel combusted, the combustion conditions, the aging conditions, etc. Therefore, it is difficult to make accurate estimates of BrC absorption based on laboratory measurements under the range of conditions applicable globally because it is unrealistic to perform filter sampling under all conditions. Numerical modeling is another effective tool for estimating BrC absorption. However, modeling is usually based on prior knowledge from laboratory measurements, which varies depending on the region, weather conditions, aging conditions, etc. Therefore, even with modeling, it is difficult to always provide accurate estimates.
Remote sensing can provide regional/global measurements and is an effective complementary method to address the above issues. Recently, researchers have attempted to derive the absorption by BrC based on the absorption of multiple wavelengths from remote sensing (Arola et al., 2011; Tesche et al., 2011; Wang et al., 2016). Ground-based remote sensing, such as the Aerosol Robotic Network (AERONET) (Holben et al., 1998; Giles et al., 2019), could provide measurements of the temporal aerosol absorption optical depth (AAOD) on a global scale (Shaw, 1983; Shin et al., 2019). In addition, polarimetric satellite measurements have also been used to determine the AAOD (Dubovik et al., 2011, 2014). With the increasing number of satellites, it is expected that absorbing aerosols could be detected in real time on a global scale in the future through the cooperation of satellite constellations. However, the absorption derived from remote sensing is that due to the mixture of different absorbing aerosols. Dust, BrC, and BC are the main absorbing aerosols in the atmosphere, and we usually need to separate out the contributions of dust and BC to study the absorption by BrC. Since dust particles are usually aerosols of a large size, we can determine the contribution of dust based on size information. Specifically, the scattering and extinction Ångström exponents can be used to infer the size information, and they were used in previous studies to separate dust from BC and BrC (Cazorla et al., 2013; Russell et al., 2010; Cappa et al., 2016). However, both BC and BrC are fine aerosols, and it is difficult to separate them based on size information alone.
An effective technique for separating out the contribution of BC is based on the different spectral absorption dependences of BC and BrC (Wang et al., 2016, 2018; Russell et al., 2010; Chung et al., 2012). The absorption by BrC is generally very weak at long visible wavelengths and in the NIR, and it has been generally assumed that the total absorption is entirely to due to BC (Wang et al., 2016; Luo et al., 2021c). Since the spectral dependence of the absorption by BC is subject to relatively small uncertainties, the absorption by BC in the UV region can be derived from the absorption in the long visible and NIR regions. Then, the absorption by BrC in the UV region can be estimated from the difference between the total absorption and the BC absorption. At two reference wavelengths (λ1, λ2), the spectral dependence of absorption is generally represented by a parameter termed the absorption Ångström exponent (AAE), defined as
where and are the absorption coefficients at λ1 and λ2, respectively.
Using the BC AAE value, the absorption by BC in the UV region can be estimated based on the absorption at NIR wavelengths. When estimating the absorption by BrC, a BC AAE of 1 has often been used, but more recent studies based on measurements and simulations have shown a wide range of AAE values (Schnaiter et al., 2005; Lack and Cappa, 2010; Li et al., 2016; Liu et al., 2018). Therefore, the use of a BC AAE of 1 may not always provide accurate estimates. To correct the AAE = 1 method, Wang et al. (2016) proposed that the wavelength dependence of the AAE (WDA) should be used to improve the estimates. In their studies, the WDA was calculated using Mie theory, which assumes that the morphology of BC is spherical. However, in the atmosphere, BC exhibits a rather complex morphology. Luo et al. (2021c) have shown that the WDA method does not necessarily lead to better estimates when BC has a complex morphology. Thus, the estimation of BrC based on absorption measurements at multiple wavelengths suffers from uncertainties in BC properties.
It is well known that the AAE method does not provide accurate results. However, there is a lack of understanding of the uncertainties caused by the microphysical properties of BC. Using morphologically realistic models, Luo et al. (2021c) showed that the estimates from BrC-based AAE methods are significantly affected by the morphology of BC, but they did not investigate how the uncertainties are affected by BC microphysical properties. Moreover, in their work, only single particles are considered, while bulk particles exist in the atmosphere. In this work, we attempt to systematically quantify the impact of BC microphysical properties on the estimates of BrC-based AAE methods. We focus on answering the following questions:
-
How large are the uncertainties caused by BC microphysical properties in the estimation of BrC?
-
How do the microphysical properties of BC affect estimates of BrC?
-
What are the implications for estimates of BrC on a global scale?
To answer the above questions, we generated some “realistic” BC aerosols based on partially coated models and then estimated the fraction of absorption by BC incorrectly attributed to BrC (ABSBrC) using different AAE methods and investigated the effects of BC microphysical properties on ABSBrC. Finally, assuming a typical size distribution, we investigated the global distribution of BC AAOD misattributed to BrC for different BC morphologies and mixing states based on a global chemical transport model, the Goddard Earth Observing System with Chemistry (GEOS-Chem). Our study can improve the understanding of uncertainties in the estimation of BrC based on absorption measurements at multiple wavelengths.
2.1 BC morphological model
When calculating the optical properties, the shape of BC was largely assumed to be spherical, so we could calculate the optical properties using Mie theory (Mie, 1908; Lack and Cappa, 2010; Bao et al., 2019). However, BC in the atmosphere usually has a rather complex morphology (China et al., 2015; Adachi et al., 2010; Yuan et al., 2019; Wang et al., 2017; Luo et al., 2021a). When BC is freshly emitted, the morphology is usually chain-like and consists of numerous spherical particles (Sorensen, 2001, 2011). Researchers have often used the fractal law to describe the morphology: (Sorensen, 2001; Heinson et al., 2017; Luo et al., 2021a, b):
where Ns is the number of spherical monomers; k0 and Df are two parameters representing the symmetry and compactness of the BC aggregates and are called the fractal prefactor and fractal dimension, respectively; and R and Rg represent the radius of the small particles and the gyration radius, respectively.
Df is often used to describe the compactness of BC (Liu and Mishchenko, 2005; Radney et al., 2014). BC generally exhibits a fluffy morphology when emitted into the atmosphere. Previous studies have shown that a small Df can strongly affect the morphology of BC. For BC aerosols from biomass combustion, a Df range of 1.67–1.83 was observed (Chakrabarty et al., 2006); BC aerosols from vehicle emissions showed a Df range of 1.52–1.94 (China et al., 2014); and Wentzel et al. (2003) showed a Df of 1.6–1.9 for fresh BC from vehicle emissions. From a robotics perspective, previous studies have shown that simulations based on the diffusion-limited cluster-cluster aggregation (DLCA) algorithm can explain the measurements well, and a universal Df of about 1.8 was obtained by the simulations (Sorensen, 2001; Dhaubhadel et al., 2006). Therefore, we used a Df of 1.8 to represent the fluffy BC.
With atmospheric aging, BC can be reconstructed into a condensed structure (Lack et al., 2014; Zhang et al., 2008; Bhandari et al., 2019). In many studies, a larger Df was used to represent the compact BC (Liu et al., 2017; Luo et al., 2018, 2019). Previous studies have shown that the Df of aged BC can sometimes reach about 2.3–2.6 (Adachi et al., 2010, 2007; Chen et al., 2016), and we used a Df of 2.6 to represent compact BC. At the same time, the surface of black carbon is covered with other materials, which makes the morphology more complex (China et al., 2013; Pang et al., 2023, 2022; Wang et al., 2021). In the atmosphere, some BC cores are fully coated while others are partially coated. Both the fluffy BC and the compact BC may be partially coated, while the fully coated BC generally has a compact BC core due to the condensation of the coating materials. Therefore, we assumed the following cases for aged BC aerosols: (1) fluffy BC cores partially coated with other materials; (2) compact BC without coating materials; (3) compact BC partially coated with other materials; (4) compact BC fully coated with other materials. It should be noted that BC with thicker coating materials becomes compact more easily, so we assumed a Df of 2.6 for the fully coated BC.
The DLCA algorithm was developed to characterize the morphology of fresh BC, and the aggregates generated generally have a Df of about 1.8 and a k0 of about 1.3 (Sorensen and Roberts, 1997; Heinson et al., 2010, 2017, 2018). However, the DLCA algorithm is not able to characterize the morpology of the aged BC with a compact structure. Since the fractal structure is well described by Eq. (2), tunable algorithms based on Eq. (2) were developed to replace DLCA. Compared to the DLCA algorithm, the tunable algorithms are parametrically adjustable (k0 and Df are fully adjustable) (Filippov et al., 2000; Skorupski et al., 2014; Moran et al., 2019). Although the tunable algorithm does not provide physical explanations of how the morphologies are generated exactly like DLCA, it can represent the DLCA aggregate by setting k0=1.3 and Df=1.8. Moreover, the tunable algorithm can represent more compact BC with a larger Df. Therefore, we used a tunable algorithm developed by Woźniak (2012) to generate the uncoated BC cores.
After the BC cores were generated, we added the coating materials onto the surfaces of the BC cores. Similar to previous studies (Zhang et al., 2018; Luo et al., 2018; Liu et al., 2017), we adopted a spherical coating structure for coated BC. It should be noted that coating materials that are much more complex than the spherical structure used here can be observed in the atmosphere. However, as previous studies have shown, the absorption by coated BC is significantly affected by the “lensing effect”, which largely depends on the fraction of the BC core that is coated. Compared with the fraction of the BC core that is coated (F), the effects of the coating structure on the absorption by BC are relatively small. Therefore, we only consider the F for a partially coated model with a spherical coating structure; complex coating structures were not considered in this work. The effects of the coating structure have been studied elsewhere (Luo et al., 2019).
The spherical coating materials were generated similarly to the method used in Zhang et al. (2018). F was calculated using the following equation:
where VBC inside represents the volume of BC cores that are coated and VBC is the volume of total BC cores.
Once the BC volume fraction (fBC) and F are known, we can determine the radius of the spherical coating. Then the BC cores are moved from side to side until the given F is reached, similar to Zhang et al. (2018). It should be noted that the motion leads to an overlap of the BC core and the coating sphere, and their optical properties cannot be calculated by some efficient numerical methods such as the multiple sphere T-matrix (MSTM) method (Mackowski and Mishchenko, 2011; Mackowski, 2022), which is only applicable for multiple spheres without any overlap. For efficient calculations, we moved the overlapping BC sphere cores outside the coating sphere, similar to Zhang et al. (2018), and the movement did not affect the optical properties of coated BC significantly (Liu et al., 2017). Typical BC morphologies are shown in Fig. 1. Since we only consider spherical coating structures in this work, it is difficult to construct a fluffy shape model with large F and small coating thickness. Therefore, we only consider an F range of 0 to 0.3 for fluffy BC. However, we assume that the presence of BC with a large F would not change the main results of this work.
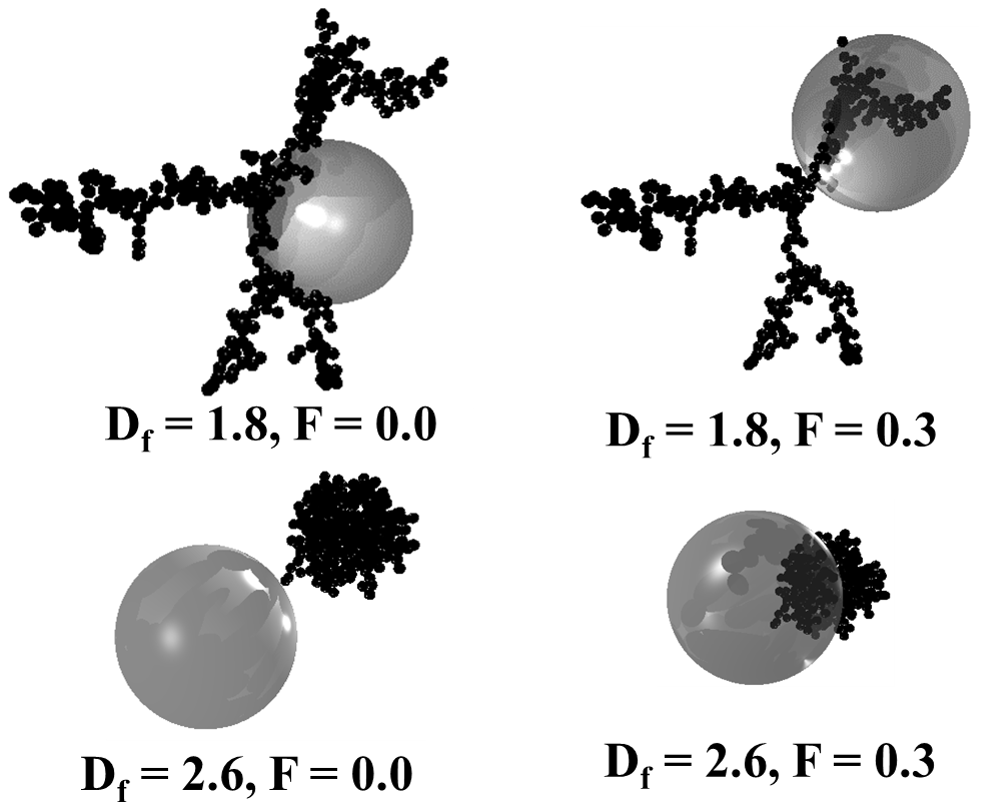
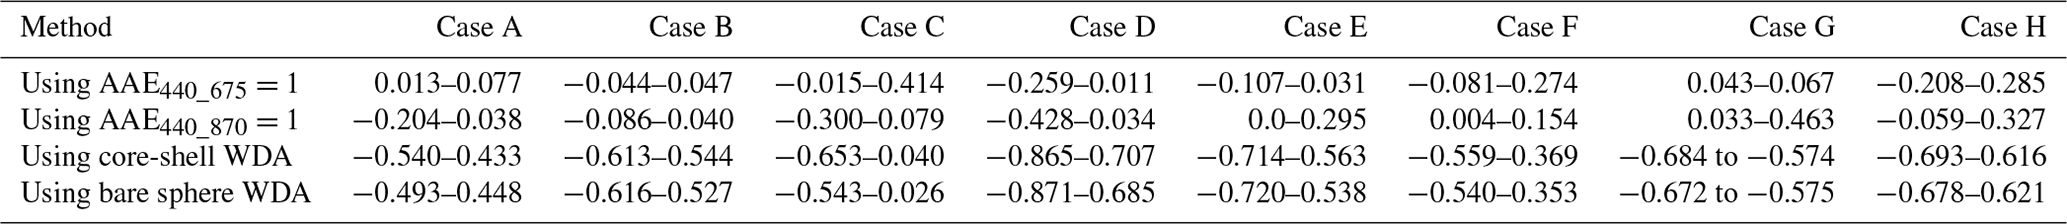
Figure 1Typical BC morphologies assumed in this work, which are similar to those in Luo et al. (2023). We used a Df of 1.8 and 2.6 to represent fluffy BC and compact BC, respectively. Moreover, F=0 means that BC is not internally mixed with coating materials, while BC is gradually partially coated with other materials as F increases. F=1 means that BC is completely coated.
2.2 The calculations of BC absorption
Similar to our previous study (Luo et al., 2018), the absorption cross sections (Cabs) of individual BC particles were calculated by the MSTM method, which can be used to calculate the optical properties of spheres that do not overlap. It has been reported that the refractive index of BC varies with wavelength (Chang and Charalampopoulos, 1990), while it is generally known that it does not vary significantly from visible to near-infrared wavelengths (Bond and Bergstrom, 2006). Therefore, a fixed BC refractive index of 1.95+0.79i was assumed according to the suggestions of Bond and Bergstrom (2006). BrC aerosols consist of organic carbon that absorbs light ranging from UV to visible wavelengths. Therefore, the coating shell was assumed to be organic carbon, and the refractive index was taken to be 1.55 (Bond and Bergstrom, 2006). It should be noted that the imaginary part of BrC should not be 0 in principle. However, in this work, we were mainly concerned with studying the absorption by nonabsorbing aerosols mixed with BC which is erroneously attributed to BrC, so we considered only one nonabsorbing shell. The details are presented in the following sections.
Once the BC structures were generated and the refractive index was specified, the MSTM method was used to calculate the absorption by each BC particle. The MSTM method directly outputs an effective absorption efficiency (Qabs), which is defined in terms of the volume mean radius. The absorption cross section (Cabs) can be calculated as
where rv represents the mean volume radius.
Numerous BC aerosols exist in the atmosphere, and the optical properties of BC should be the average properties over all the particles. Thus, we calculated the bulk optical properties by assuming different size distributions. Assuming a lognormal distribution for the size distribution of BC cores, we have
where rg and σg are the geometric mean radius and geometric standard deviation, respectively.
We first calculated the Cabs of BC with different Ns (i.e., different rv) values, and then we calculated the absorption coefficient (babs) using
where rmax and rmin are the maximum radius and minimum radius of the BC cores, respectively.
The rg and σg values reported in this work are for the BC cores and can be determined using some single particle measurement instruments such as the soot particle photodiameter (SP2) (Moteki et al., 2007; Baumgardner et al., 2004; Schwarz et al., 2006). Many measurements were based on single-particle technologies, and different rg and σg values were observed in different regions. BC particles in Tokyo were observed to have a geometric mean radius (rg) of about 0.032±0.003 µm and a geometric standard deviation (σg) of 1.66±0.12 (Kondo et al., 2011). However, Shiraiwa et al. (2008) showed that the rg and σg of BC in Fukue, Japan, are 0.095–0.105 µm and 1.45–1.55, respectively. In Shanghai, an rg of about 0.1 µm (Gong et al., 2016) was observed for BC. In general, small BC particles are easier to fully coat, so a partially coated BC particle usually has a large size. Therefore, we mainly calculated the optical properties of relatively large BC particles. Ns values of 5–1000 were considered, and the corresponding rmin and rmax are 0.0342 and 0.2 µm, respectively. An rg of 0.05–0.1 µm was assumed, and σg was assumed to be in the range of 1.3 to 2.0.
2.3 Inferring the fractions of BrC absorption
We estimated the absorption by BC which was incorrectly attributed to BrC after calculating the BC absorption. In AERONET, the wavelengths 440, 675, and 870 nm were most commonly used to estimate the BrC absorption, and so we mainly considered these three wavelengths. At 675 and 870 nm, all of the absorption was assumed to be entirely due to BC. The babs of BC at 440 nm can be determined as follows:
where AAEλ_440 represents the AAE of BC for the wavelength pair of λ and 440 nm; λ represents the wavelength 870 or 675 nm.
The babs of BrC at 440 nm can be estimated using
where babs_BrC_440_Estimated and babs_440_total represent the estimated BrC absorption coefficient and the total absorption coefficient at 440 nm, respectively. babs_BC_440 and babs_BrC_440 represent the “true” BC and BrC absorption coefficients at 440 nm, respectively. Thus, the absorption coefficient of BC which is incorrectly attributed to BrC can be calculated as follows:
Then we calculated the proportion of wrongly assigned absorption with
The WDA method is similar to the fixed AAE methods, but the AAEs are inferred from Mie theory:
where the subscript “Mie” indicates that the AAE was calculated using Mie theory. Thus, we can estimate AAE440_870 based on the WDA:
In this work, ABSBrC was retrieved from the absorption by BC. Consequently, any deviations from ABSBrC=0 suggest an uncertainty in BrC estimation. The present work was based solely on modeling, and no measurements were used.
2.4 Calculating the global BC absorption
We used a global atmospheric chemical transport model, GEOS-Chem (Bey et al., 2001; Eastham et al., 2018), to simulate the global distribution of BC. For this work, GEOS-Chem version 12.7 was used with a latitude/longitude grid resolution of 4∘ × 5∘. The MERRA-2 (the second Modern-Era Retrospective analysis for Research and Applications) assimilated meteorology (Molod et al., 2015; Gelaro et al., 2017) was used for the GEOS-Chem model simulations. The model was built with 47 vertical layers. We ran a standard GEOS-Chem simulation with various aerosols such as dust, organic aerosols, BC, sulfate, sea salt, etc. The Community Emissions Data System (CEDS) (Hoesly et al., 2018) inventory provided the global anthropogenic emissions. The Global Fire Emissions Database (GFED4) inventory (Randerson et al., 2018) was used to obtain the emissions from biomass burning. Biogenic emissions were obtained from the Model of Emissions of Gases and Aerosols from Nature version 2.1 (MEGAN 2.1) (Guenther et al., 2012). We used GEOS-Chem to simulate black carbon concentrations for all of 2016 and then took the time average.
The BC AAOD in each GEOS-Chem grid was calculated using
where CBC_column is the column mass concentration of BC; MACBC represents the mass cross section of coated BC that can be calculated with
where mBC represents the mass distribution of BC cores, which can be calculated with
where ρBC represents the mass density of BC. Bond and Bergstrom (2006) used a ρBC of 1.8 g m−3. However, most modeling studies have underestimated the proposed MAC of 7.5±1.2 m2 g−1 at 550 nm by using the proposed ρBC. Similar to Luo et al. (2018), we used a ρBC of 1.5 to fit the MAC measurements.
The global AAOD of BC incorrectly attributed to BrC can be determined using the following method:
In addition to the AAOD, the direct radiative forcing (DRF) is also commonly used to assess climate effects. In this work, the DRF was also estimated using a simple method. Based on the values given in Bond et al. (2013), Kelesidis et al. (2022) proposed that an average absorption forcing efficiency of 170±43 Wm−2/AAOD should be used. Similar to Kelesidis et al. (2022), the DRF was estimated by multiplying the estimated AAOD by 170±43 Wm−2/AAOD. Similarly, the misassigned DRF was also estimated by multiplying the misassigned AAOD by 170±43 Wm−2/AAOD.
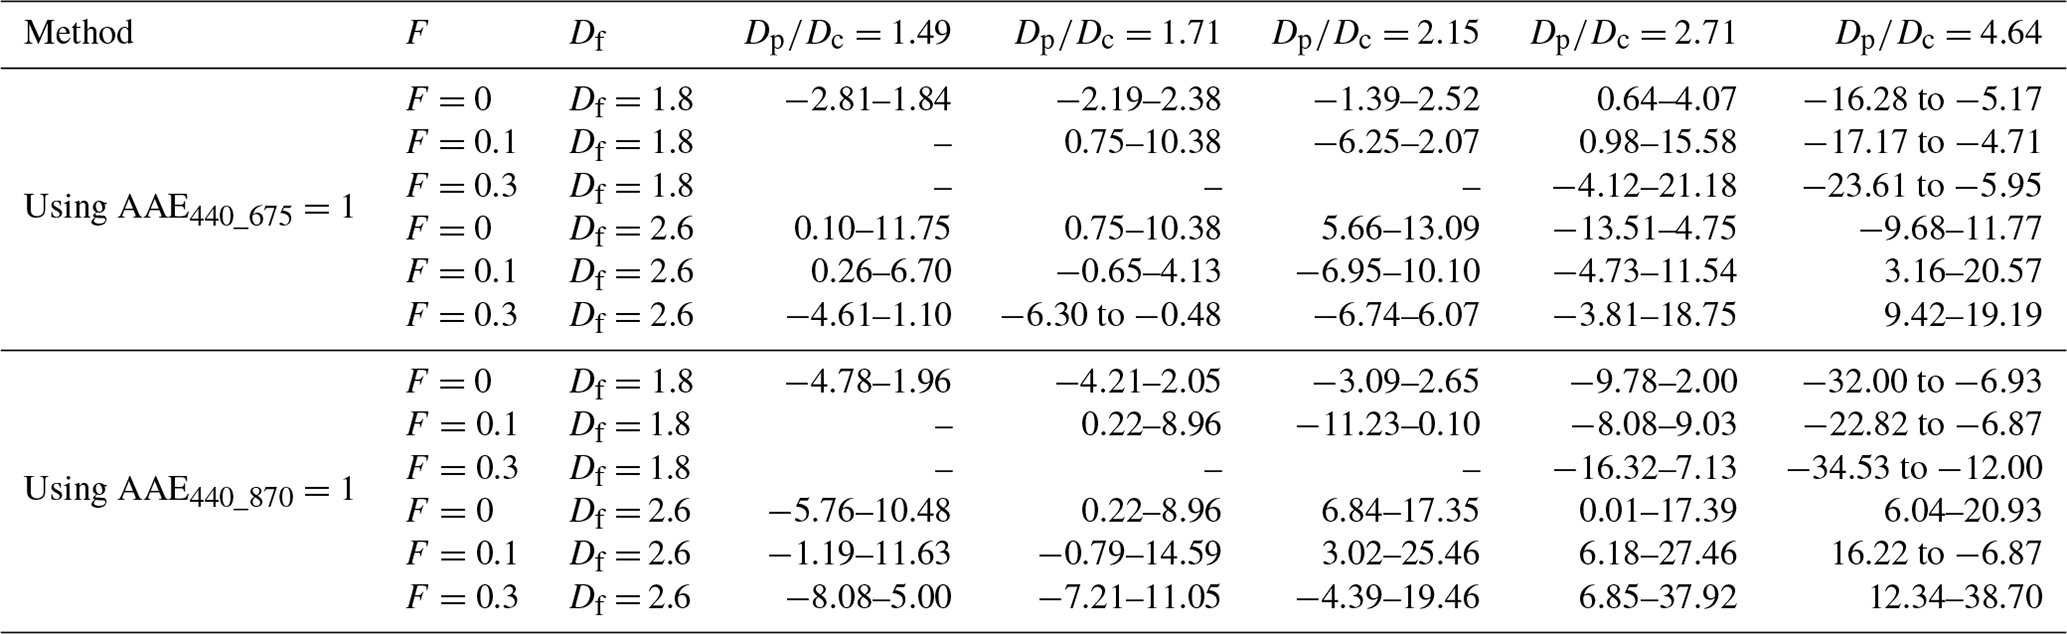
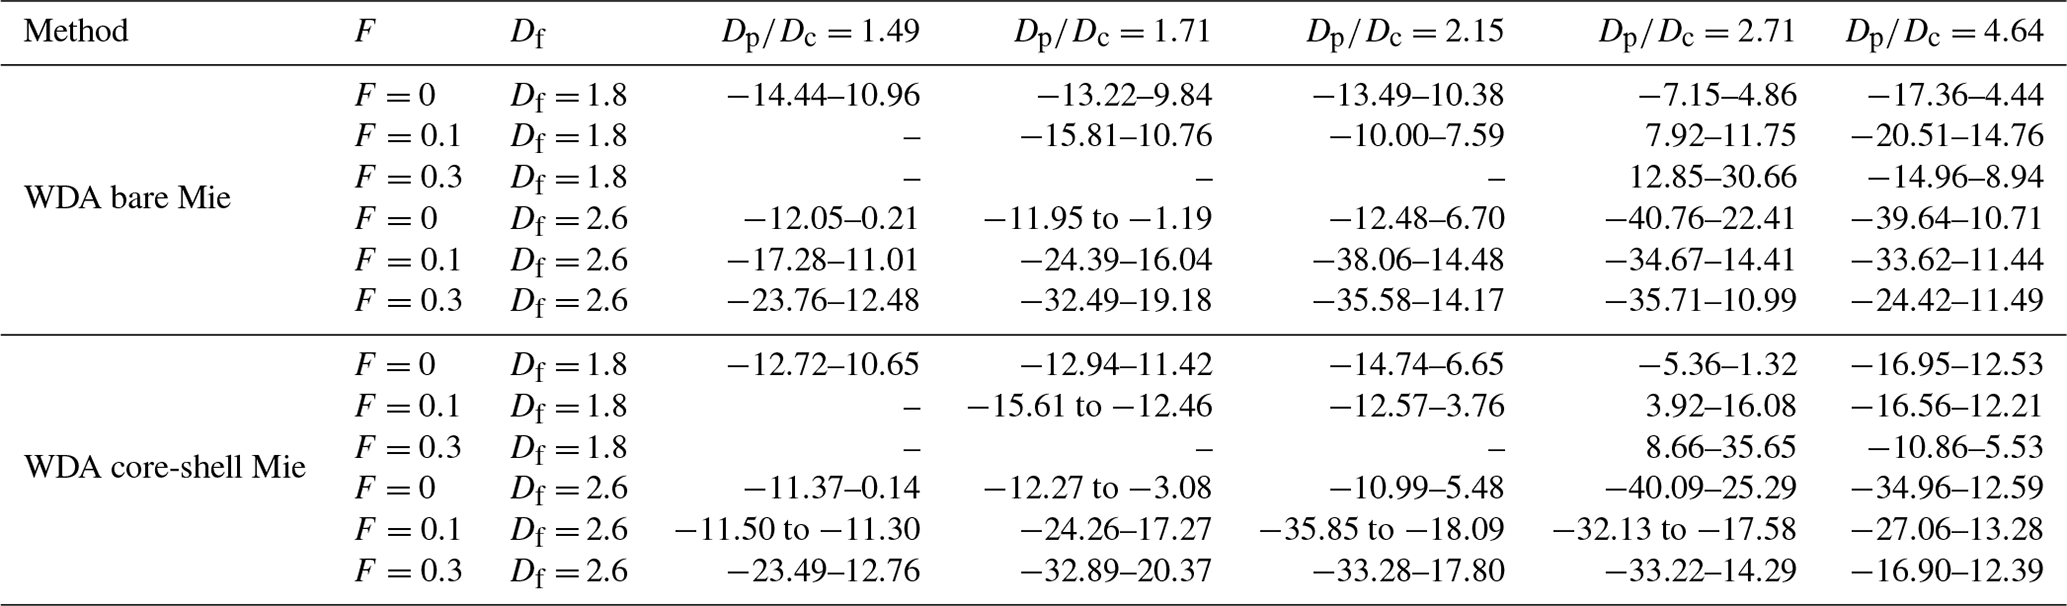
Table 1ABSBrC (%) values estimated for different values using the AAE = 1 methods, as also shown in Fig. 2.
3.1 The effects of BC microphysical properties on the fixed AAE method
Figure 2 shows the effects of the shell diameter to core diameter ratio (). The error bars in the figures represent the upper and lower limits when rg is varied in the range of 0.05–0.1 µm and σg is varied in the range of 1.5–1.8. Since BC aerosols are freshly emitted, they are fluffy and not mixed with the coating materials. Our cases where Df=1.8 and F=0 may reflect freshly emitted BC. Previous studies have shown that the AAE of freshly emitted BC is not significantly different from 1 (Liu et al., 2018; Luo et al., 2020). Thus, using AAE440_675 = 1 and AAE440_870=1 can provide reasonable estimates of BrC absorption for freshly emitted BC, and the estimated ABSBrC is not significantly different from 0 when . As shown in Table 1, the estimated ABSBrC values based on different AAE wavelength pairs show some differences. The AAE440_870 = 1 method generally gives a larger range of ABSBrC than AAE440_675 = 1 does. This could be due to the larger wavelength gap between 440 and 870 nm. ABSBrC ranges from about −2.8 % to 2.5 % when is 2.15 and the AAE440_675=1 method is used, while this range becomes about −4.8 %–2.7 % when the AAE440_870=1 method is used. As the number of coating materials increases, BC AAE may gradually deviate from 1 due to the shielding effect of heavy coatings. Thus, a broader ABSBrC range of about −16.3 % to −5.2 % is obtained when increases to 4.64 and the AAE440_675=1 method is used. A wider range is also observed when AAE440_870=1. ABSBrC ranges from about −32 % to −6.9 % when and the AAE440_870=1 method is used.
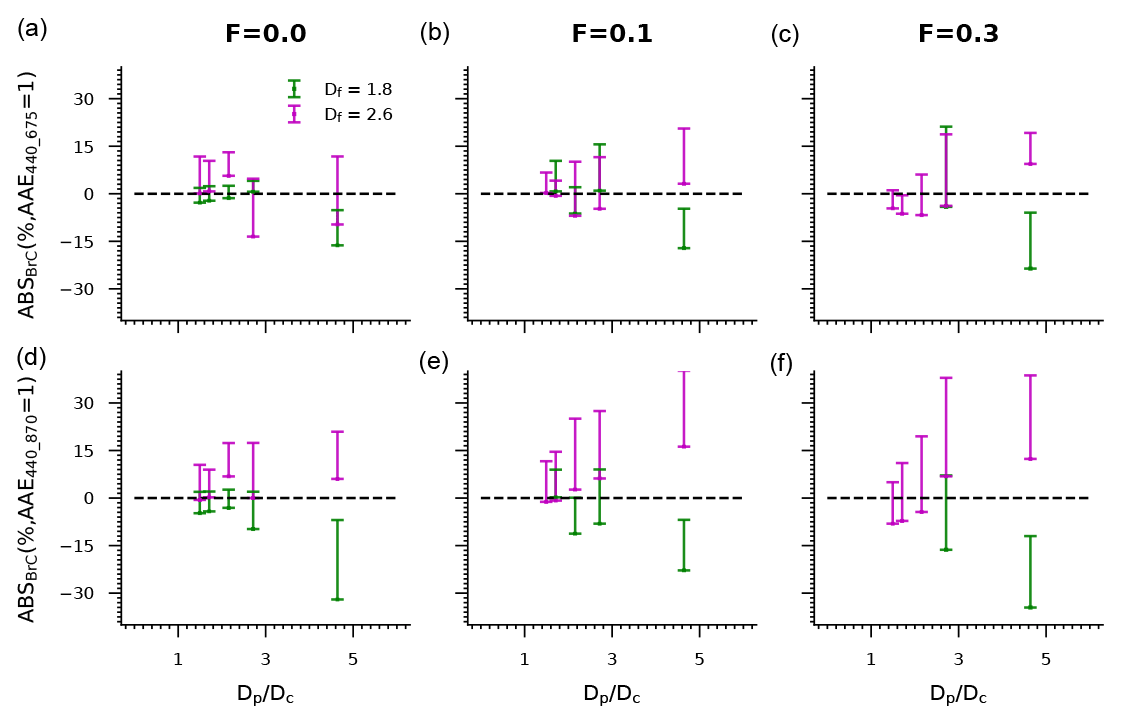
Figure 2ABSBrC values estimated for different values using the AAE = 1 methods. The error bars in the figures represent the upper and lower limits when rg is varied in the range of 0.05–0.1 µm and σg is varied in the range of 1.5–1.8. When freshly emitted, BC generally exhibits a fluffy structure and is not internally mixed with coating materials, as reflected by an F of 0 and a Df of 1.8. However, with increasing atmospheric aging, BC gradually becomes internally mixed with coating materials and thicker coating materials are overlaid on the BC, which may be reflected in a larger F and . Moreover, the BC structure becomes more compact as the particles age, and we used a large Df value to represent the compact BC.
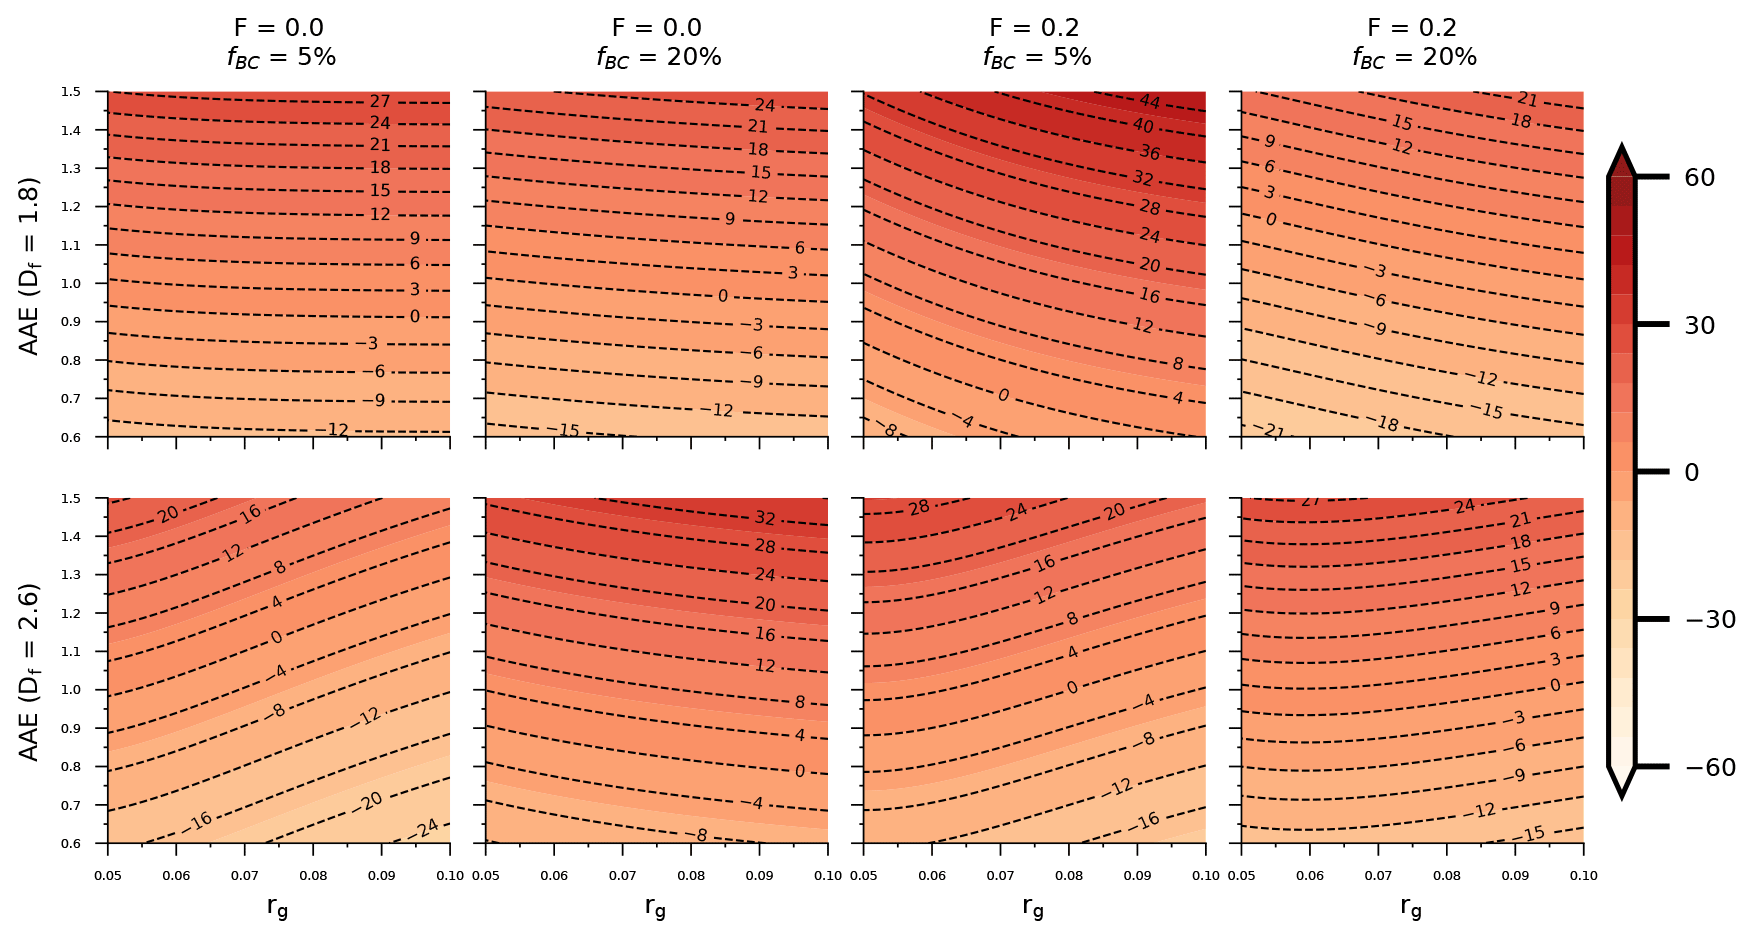
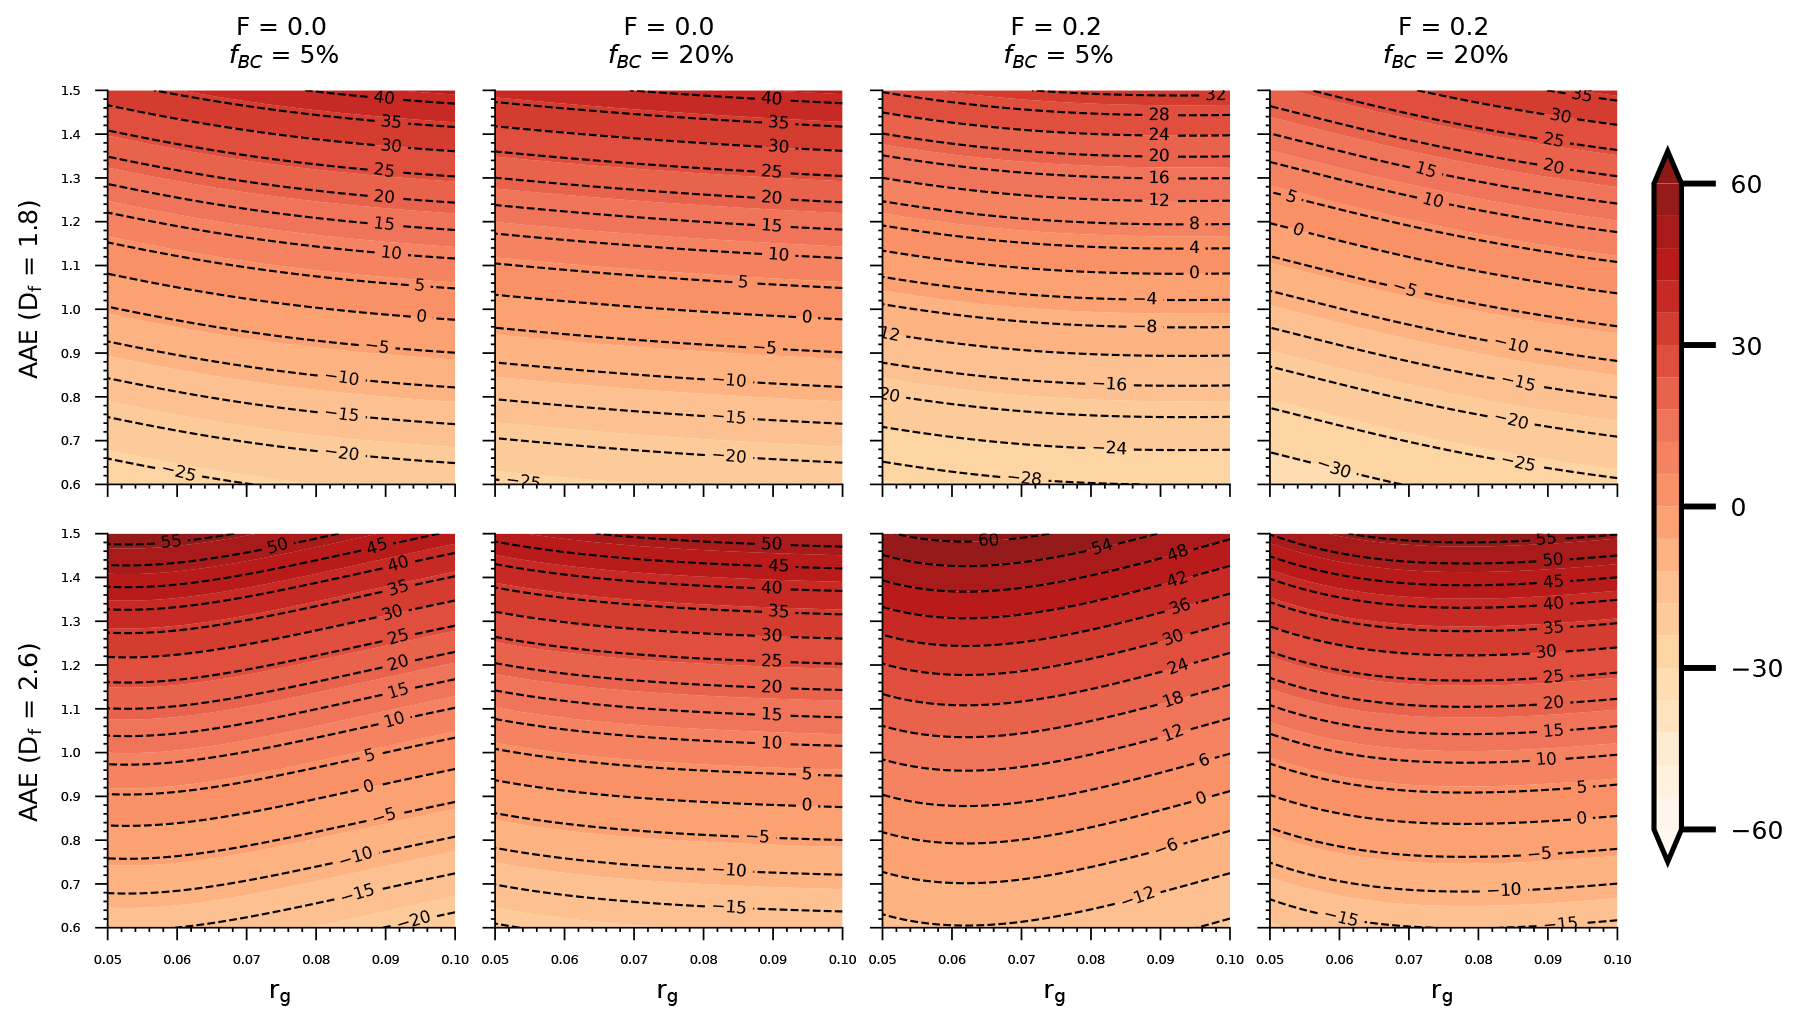
Figure 3The variation in ABSBrC (%, estimated based on a fixed AAE) as a function of AAE and rg, where the wavelength pair are 440 and 675 nm. We can see that ABSBrC increases with rg when AAE is fixed for fluffy BC, which is caused by a decrease in AAE with increasing rg for fluffy BC. However, sometimes the opposite phenomenon can be seen for the compact BC.
The bare, fluffy BC aggregates are gradually coated by other materials with atmospheric aging, so BC with a larger F represents more aged particles. Since the BC aggregates are partially coated, ABSBrC also gradually deviates from 0 for the fluffy BC aggregates. As shown in Fig. 2 and Table 1, the increase in F can lead to a wider range of ABSBrC. With a Df of 1.8, an F of 0.1, and a of less than 2.15, ABSBrC varies in the range of about −6.3 %–10.4 % and −11.2 %–9 % when AAE440_675=1 and AAE440_870=1, respectively. The ranges become −18 % to −4.71 % and −22.8 % to −6.9 %, respectively, when is 4.64. The ABSBrC range becomes larger as F increases to 0.3. An ABSBrC range of −34.5 %–21.2 % can be found for BC with a Df of 1.8 and an F of 0.3 when assuming an AAE of 1. When the BC aggregates are partially coated, the ABSBrC is generally smaller than 0 when is larger (e.g., ) and BC has a fluffy structure, whereas ABSBrC can be larger than 0 when is small. This phenomenon may be due to the different effects of the coating ratio on AAE. When is small, the AAE is generally small and can sometimes be less than 1 (X. Zhang et al., 2020; Luo et al., 2023; Liu et al., 2018). Therefore, assuming an AAE of 1 may overestimate the real AAE, so an ABSBrC of greater than 0 can be observed. On the other hand, the AAE increases with when BC has a fluffy structure. Thus, the AAE can be greater than 1 when the fluffy BC is partially coated with a thick coating (X. Zhang et al., 2020; Luo et al., 2023). This would result in the predicted BC absorption coefficient being greater than the actual BC absorption coefficient, resulting in an ABSBrC of less than 0. For a Df of 1.8, Luo et al. (2023) have shown that the AAE440_870 of partially coated BC generally first decreases with increasing and then increases when is greater than a certain value. The opposite phenomenon is observed for ABSBrC. For BC with a Df of 1.8, the ABSBrC of partially coated BC generally first increases with increasing and then decreases when is greater than 2.71.
With atmospheric aging, the BC cores are reconstructed into a more compact structure. We used a larger Df (Df=2.6) to represent the compact BC. Even with F=0, a Df of 2.6 represents the highly aged BC. By comparing BC with a fluffy structure to BC with a compact structure, we can see the effects of atmospheric aging on the estimation of BrC absorption in more detail. As the BC cores are reconstructed into a compact structure, the AAE = 1 method provides inaccurate estimations even when F=0 and . As shown in Fig. 2 and Table 1, with a Df of 2.6 and an F of 0, ABSBrC varies in the range of approximately −13.5 %–13.1 % and −5.8 %–20.9 % when using AAE440_675=1 and AAE440_870=1, respectively. Also, larger deviations of ABSBrC from 0 can be observed as F increases, and ABSBrC can sometimes increase to approximately 20.6 % when using AAE440_675=1 and to approximately 38.7 % when using AAE440_870=1. Different from the cases where Df=1.8, most cases in which BC has a Df of 2.6 exhibit an ABSBrC of larger than 0. The reason for this is that compact BC generally exhibits a small AAE which is generally less than 1 (Luo et al., 2023; Liu et al., 2018). Also, in most cases, the ABSBrC of BC with a compact structure increases with increasing . This can be explained by the findings in a previous study. Luo et al. (2023) have shown that AAE440_870 generally decreases with increasing , which leads to an increase in ABSBrC with .
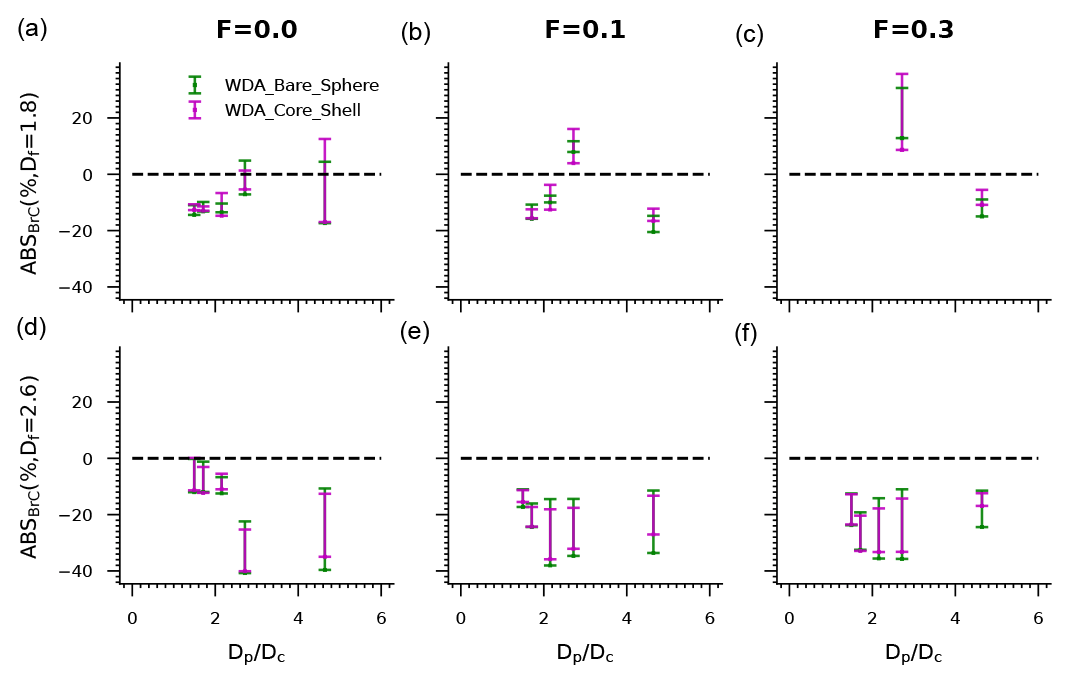
Figure 5Similar to Fig. 2, but using the WDA method. We see that the WDA method does not always provide better estimates than the fixed AAE methods, and its applicability is also significantly affected by the morphology and mixing states.
Table 2ABSBrC (%) values estimated for different values using the WDA methods, as also shown in Fig. 5.
Because the AAE = 1 method would provide inaccurate estimates, many researchers have attempted to use a different AAE value to estimate BrC. For example, Zhang et al. (2019) used a BC AAE of 0.7 in the Pearl River Delta region, China; Rathod and Sahu (2022) suggested using a BC AAE of 1.1 ± 0.05. However, the BC AAE is subject to large uncertainties from differences between regions, age statuses, burn sources, etc. Moreover, the BC AAE is not constant in the same region, and it varies with time as the microphysical properties of BC vary with atmospheric aging. Figures 3–4 show how the microscopic properties of BC affect the application of the different values. As can be seen from Figs. 3–4, there is no fixed AAE value that is applicable to all cases. In general, ABSBrC is larger for larger AAE values. Kirchstetter et al. (2004) measured an AAE range of 0.6 to 1.3. However, using values in this range, the AAE method would not always provide accurate estimates for BrC in the absence of additional information. Sometimes the estimated ABSBrC can be approximately −30 %–55 % if we choose a fixed AAE in the range of 0.6–1.3. The ABSBrC based on different AAE values is significantly affected by the BC size distribution, morphology, and mixing state. For freshly emitted BC (Df=1.8, F=0 in our cases), AAEs of 0.9–1.1 provide reasonable estimates, and the ABSBrC is in the range of about −6 %–6 % at this time. However, using AAEs of 0.6 and 1.3 can sometimes result in an ABSBrC of about −25 % and 18 %, respectively.
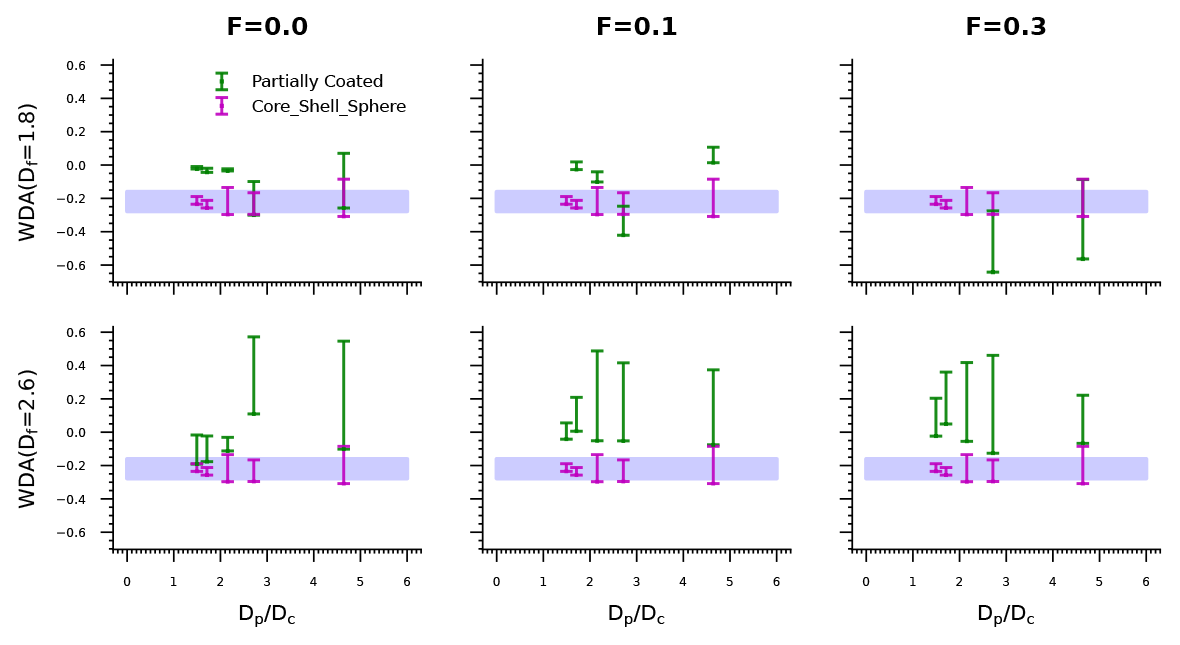
Figure 6The WDAs of BC with different morphologies and different values, where the purple shading represents the WDA calculated for the bare spherical BC model. The results show that the WDA of BC is significantly affected by its morphology and mixing state. When BC is freshly emitted (represented by a Df of 1.8, an F of 0, and a smaller ), the WDA is close to 0. With atmospheric aging, the WDA range becomes broader and often deviates significantly from 0. In addition, the WDA calculated using the Mie assumption can differ greatly from the WDA of partially coated BC, which is why the ABSBrC estimated using the WDA method differs from 0.
Table 3The WDAs of BC with different morphologies and different values given a typical size distribution range, as shown in Fig. 6. The WDA range calculated using the bare sphere model is about −0.277 to −0.161.
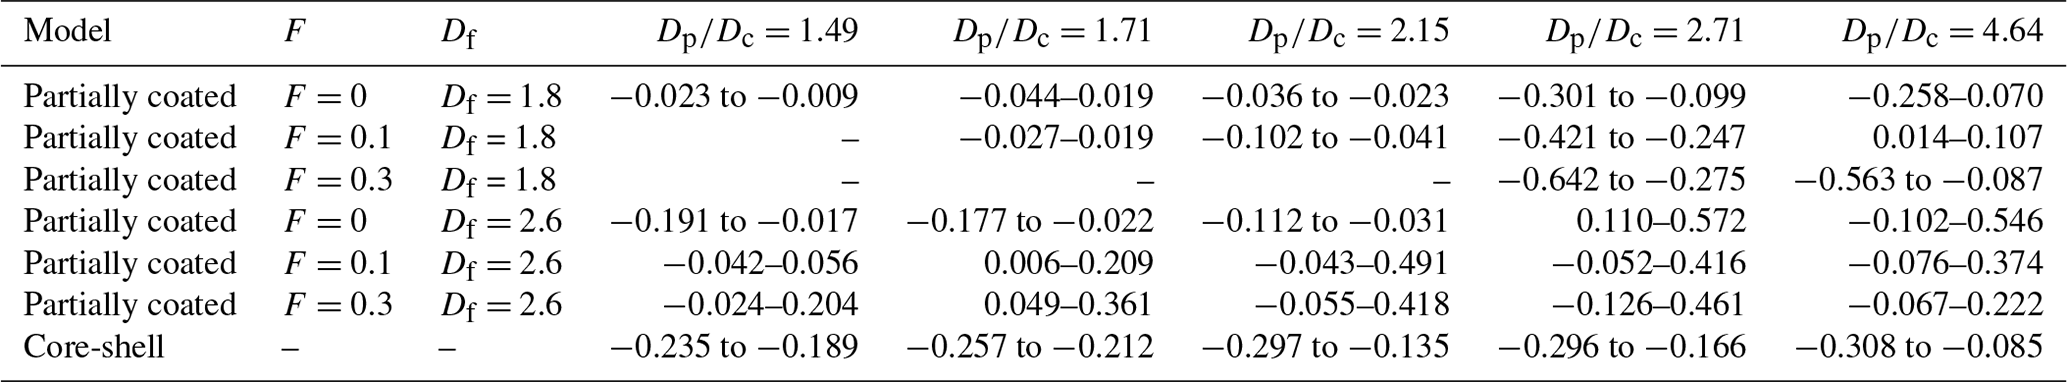
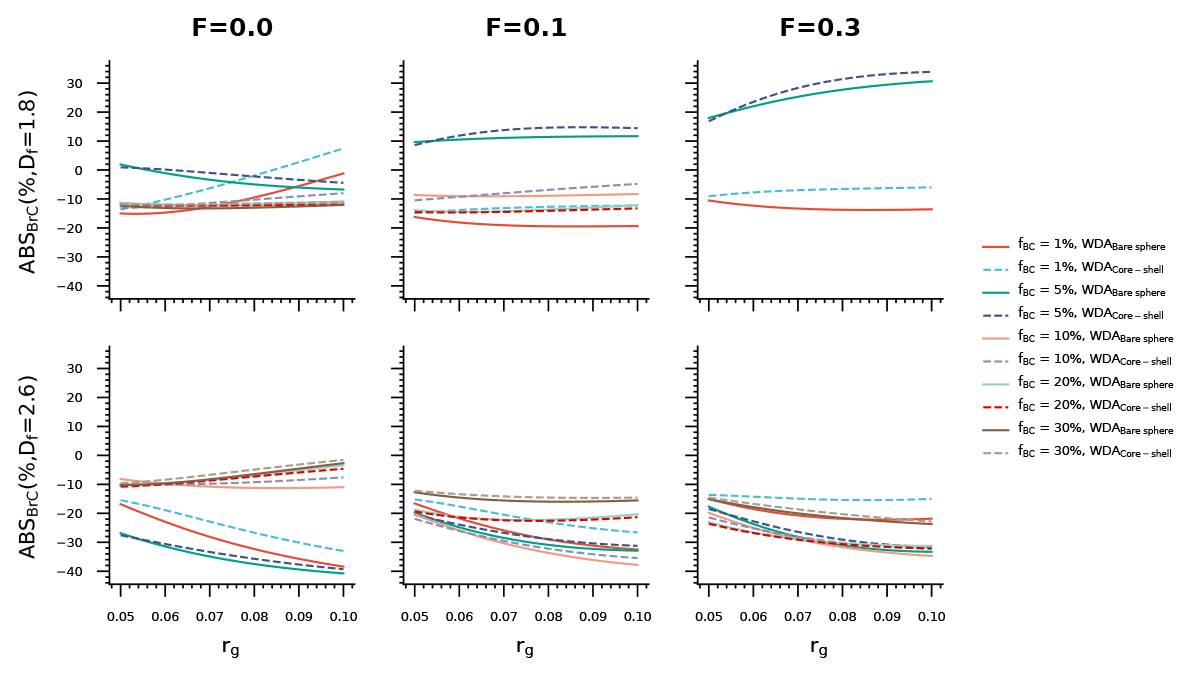
Figure 7The variation in ABSBrC estimated using the WDA method with rg at different mixing states.
However, with a more compact structure and a larger F, choosing accurate AAE values seems to be more important for the estimation of BrC absorption. As the BC cores become more compact (Df=2.6), ABSBrC becomes more affected by the choice of AAE values. This means that an inaccurate choice of AAE could lead to a larger deviation of the BrC absorption for compact BC, since the ABSBrC of compact BC is more sensitive to the AAE values than it is for fluffy BC. It is difficult to find a fixed AAE value for estimating BrC in the absence of additional size information, and using a fixed AAE value could result in an ABSBrC range of approximately −26 % to 44 % in the cases we selected. In Figs. 3–4, we see that the ABSBrC of fluffy BC increases with rg when AAE is fixed. This is caused by a decrease in AAE with increasing rg for fluffy BC (Luo et al., 2023; X. Zhang et al., 2020). However, in some cases, the AAE of compact BC may increase with increasing rg (Luo et al., 2023), which could lead to a decrease in ABSBrC with increasing rg. In summary, ABSBrC is significantly affected by BC size when a fixed BC AAE is used, and it appears that there is no fixed BC AAE value that is applicable to all cases. Similar conclusions can be drawn for the fully coated BC (see Fig. S1 in the Supplement).
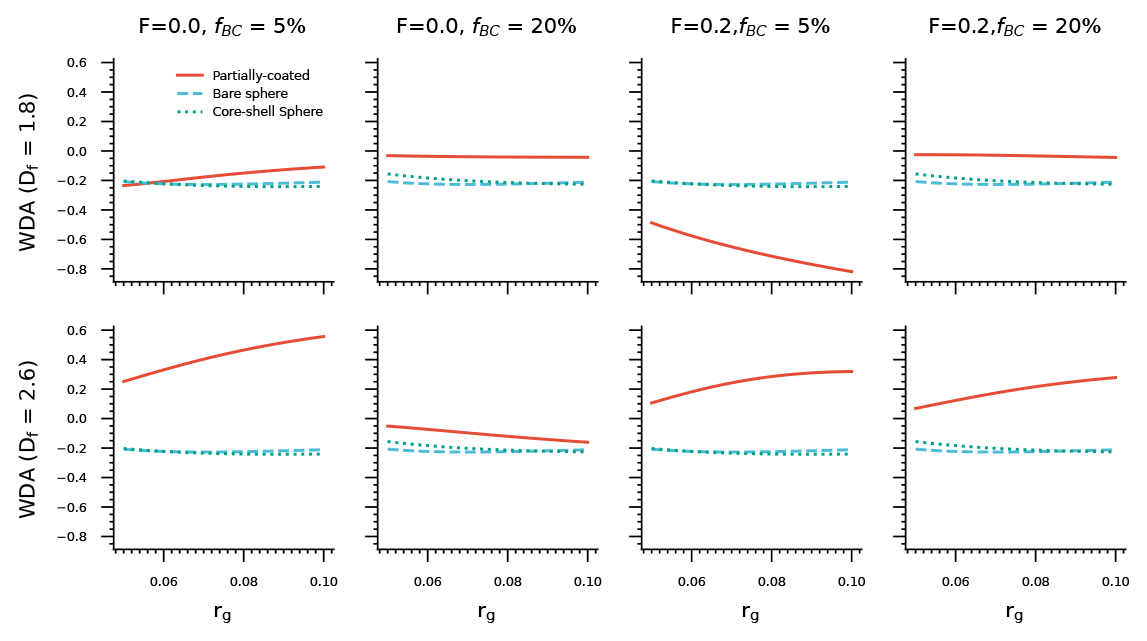
Figure 8The variations in the WDAs of BC with different morphologies with rg at different mixing states, where σg=1.6. We can see different variations with rg for partially coated BC models and spherical models.
3.2 The effects of BC microphysical properties on the WDA method
Because fixed AAE methods cannot always provide accurate estimates of BrC, Wang et al. (2016) proposed a WDA method to derive the BrC absorption. They first calculated the WDA based on Mie theory and then derived the AAE based on the WDA. They claimed that this method can reduce the effects of the BC size and coating. However, in the study by Wang et al. (2016), the morphology of BC was assumed to be spherical, and the WDA calculated based on Mie theory does not always provide accurate estimates. In fact, the spherical model only represents the highly aged BC. Unaged BC in the atmosphere often exhibits fluffy morphologies, and the coating materials make the morphology of coated BC more complex (Pang et al., 2022, 2023; Wang et al., 2017). The WDA calculated based on Mie theory may not represent BC with complex morphologies. In addition, as BC morphologies can change with atmospheric aging, the spherical assumption provides an incomplete understanding of the effects of atmospheric aging on WDA. Figure 5 shows the estimated ABSBrC based on the WDA method. Since some cores are coated while others are not, we calculated ABSBrC based on the WDA using the bare sphere model or the core-shell model. As pointed out by Luo et al. (2021c), the WDA method does not necessarily provide better estimates than the AAE = 1 method. The estimated ABSBrC based on the Mie theory-based WDA can vary in the range from about −40.8 % to 35.7 % (see Table 2).
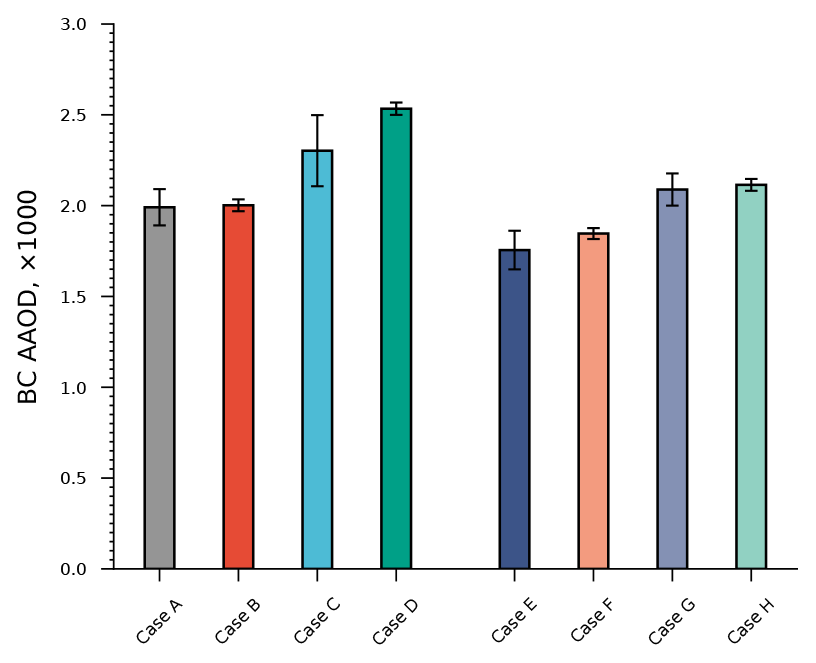
Figure 9The global mean BC AAOD was calculated using different models. The error bars in the figures represent the upper and lower limits when rg is varied in the range of 0.05–0.1 µm and σg is varied in the range of 1.5–1.8. Our case studies show a global mean AAOD value of about 0.0016 to 0.0026, which is significantly affected by the mixing state and morphology. The AAOD of BC with a fluffy morphology is generally larger than that of BC with a compact morphology. Moreover, the predicted AAOD does not necessarily increase with increasing coating ratio (decreasing fBC), which is due to the shielding effects of the coating materials. Moreover, the AAOD of BC with thicker coating materials (a smaller fBC) is more sensitive to the size distribution.
The applicability of the WDA method is also related to the atmospheric aging status. As shown in Fig. 5 and Table 2, the estimated ABSBrC based on the WDA method is generally in the range of −14.7 % to −9.8 % for freshly emitted BC (F=0, Df=1.8, ), and the range becomes approximately −17.4 %–12.5 % when increases to 4.64. For freshly emitted BC, the estimated ABSBrC is generally less than 0. This is because the WDA estimated with Mie generally underestimates the WDA of BC with a fluffy morphology. As shown in Fig. 6 and Table 3, the WDA estimated with the morphologically realistic BC model (about −0.04–0) is not significantly different from 0 for freshly emitted BC (F=0, Df=1.8, ), whereas the WDA estimated with the spherical model varies in the range from about −0.30 to −0.14. The estimated ABSBrC is in the range of about −20.5 %–16.1 % and −15 %–35.7 % when F increases to 0.1 and 0.3, respectively, and the difference in WDA between the partially coated BC and the spherical BC can sometimes exceed 0.4. The estimated ABSBrC based on the WDA method is generally smaller than 0 when the BC cores become compact (Df=2.6). This is due to the fact that the WDA of the partially coated BC is underestimated by Mie theory (see Fig. 6). For a Df of 2.6, the estimated ABSBrC is generally in the range of −40.8 %–0.1 %, and the difference between the WDA of the partially coated BC and the spherical BC can sometimes even exceed 0.6. Thus, since Mie theory does not always provide accurate estimates for the WDA of BC with realistic morphologies, we should carefully consider the effects of the morphologies of partially coated BC when applying the WDA method.
Figure 7 shows the effects of the size distribution on the estimated ABSBrC based on the WDA method. ABSBrC shows different trends with rg for BC with different F and fBC values. When Df=1.8 and F=0, the ABSBrC estimated by the WDA method generally decreases with increasing rg when fBC> is 5 %, while the opposite phenomenon is observed when fBC=1 %. As F increases, different ABSBrC trends can be observed. Unlike the case of F=0, ABSBrC increases with increasing rg when fBC=5 %. As BC cores are reconstructed into a compact structure (Df=2.6), ABSBrC decreases with increasing rg when BC is heavily coated (fBC=1 % and 5 %), while the opposite trend is observed for thinly coated BC. Moreover, ABSBrC decreases with increasing rg – even for thinly coated BC – when F is larger, and similar findings are found for fully coated BC (F=1.0), as shown in Fig. S2.
Table 4The global mean BC AAOD (×1000) calculated using different models, as shown in Fig. 9.

To explain why the above phenomenon occurs, we also calculated the WDAs of BC with different rg. Figure 8 shows the variations of ABSBrC with rg for partially coated BC with different mixed states. The WDA of partially coated BC is very different from that of spherical BC. In general, the WDAs estimated with the bare sphere model and the core-shell sphere model show similar trends with rg. When F=0 and fBC=5 %, the WDA calculated with the morphologically realistic model is comparable to that calculated with the spherical model when rg is small, leading to an ABSBrC of about 0 (see Fig. 7). However, as rg increases, the WDA of the morphologically realistic BC increases, whereas the WDA calculated with the spherical models does not change significantly. Thus, the WDA difference between the morphologically realistic BC and spherical models (the WDA of the morphologically realistic BC minus the WDA of the spherical BC) increases with increasing rg, so ABSBrC decreases with rg. However, the WDAs of both the morphologically realistic BC and the spherical models do not vary significantly with rg when F=0 and fBC=20 %, so the ABSBrC does not vary significantly when rg is changed. When F increases, a different phenomenon is observed. When F=0.2 and fBC=5 %, the WDA of morphologically realistic BC is much smaller than those of the spherical models, which can lead to a positive ABSBrC. Moreover, the WDA of morphologically realistic BC decreases significantly with increasing rg, while the WDAs calculated with the spherical models do not significantly vary, so the WDA difference decreases with increasing rg. Therefore, the ABSBrC can increase with rg.
As the BC cores become compact (Df=2.6), different WDA trends are observed with rg. The WDA of partially coated BC is generally larger than that of spherical BC in the cases where F=0 and fBC=5 %, so a negative ABSBrC is observed. Moreover, during this time, the WDA of the morphologically realistic BC increases with increasing rg, whereas the WDAs calculated with the spherical models do not vary significantly with rg. As a result, the WDA difference between the partially coated BC model and the spherical models increases with increasing rg, causing ABSBrC to decrease with rg. Similar results are found when F=0.2 and fBC=5 % and when F=0.2 and fBC=20 %. A different phenomenon was observed when F=0 and fBC=20 %. At this time, the WDA of partially coated BC is generally larger than that of spherical BC, so ABSBrC has negative values. However, the WDA of partially coated BC decreases with increasing rg, and the WDA difference between the morphologically realistic model and the spherical models becomes smaller. Therefore, ABSBrC increases with rg and tends to 0 when rg is large (e.g., rg=0.1). Similar results can be found for other σg values, with minor differences observed (see Figs. S3–S4.).
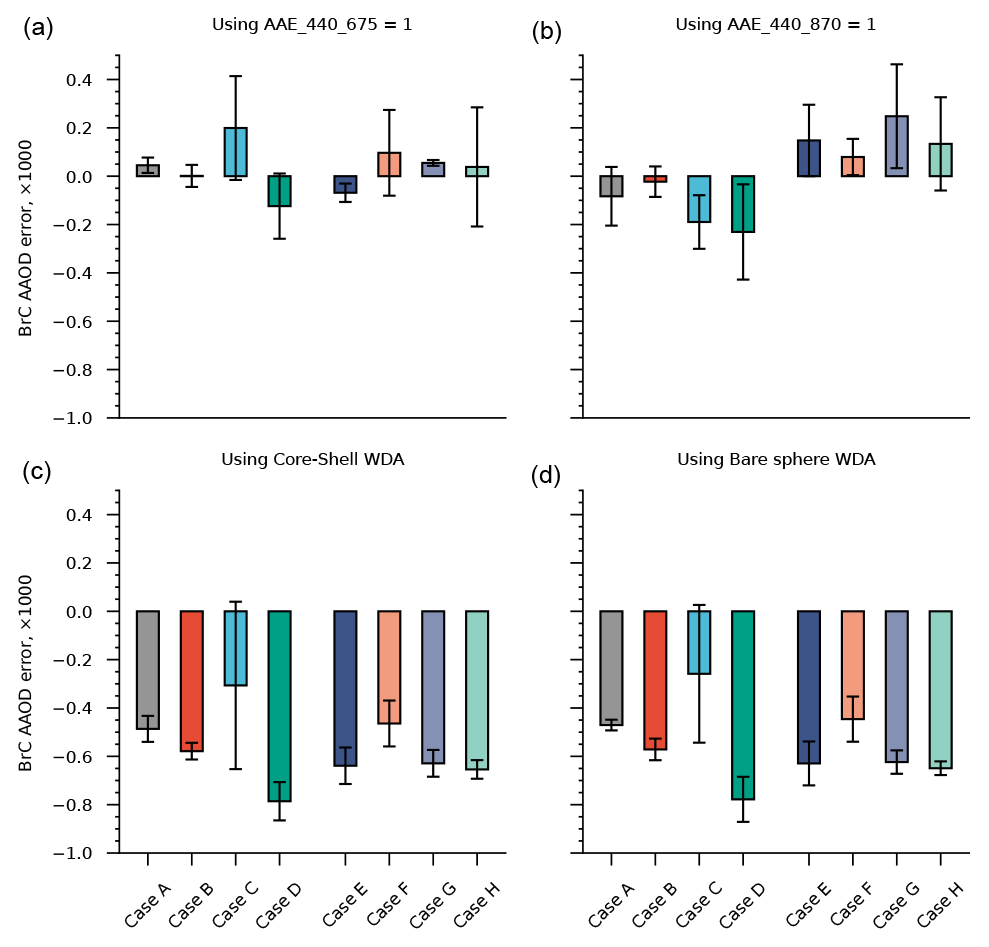
Figure 10The global mean BC AAOD that is misattributed to BrC for different morphological configurations. The error bars in the figures represent the upper and lower limits when rg is varied in the range of 0.05–0.1 µm and σg is varied in the range of 1.5–1.8.
Table 5The global mean BC AAOD (×1000) that is misattributed to BrC for different morphological configurations, as shown in Fig. 10.
3.3 Effects of the microphysical properties of BC on the global estimation of BrC
Recent studies have generated increasing interest in estimating the global distribution of BrC (Zeng et al., 2020a; Wang et al., 2016). In this work, the effects of BC microphysical properties on the global estimation of BrC were also investigated. Figure 9 shows the mean global optical absorption aerosol depth (AAOD) of BC calculated with different configurations. In the figures, case A represents aerosols where Df=1.8, F=0.0, and fBC=5 %; case B represents aerosols where Df=1.8, F=0.0, and fBC=20 %; case C represents aerosols where Df=1.8, F=0.2, and fBC=5 %; case D represents aerosols where Df=1.8, F=0.2, and fBC=20 %; case E represents aerosols where Df=2.6, F=0.0, and fBC=5 %; case F represents aerosols where Df=2.6, F=0.0, and fBC=20 %; case G represents aerosols with Df=2.6, F=0.2, and fBC=5 %; and case H represents aerosols with Df=2.6, F=0.2, and fBC=20 %.
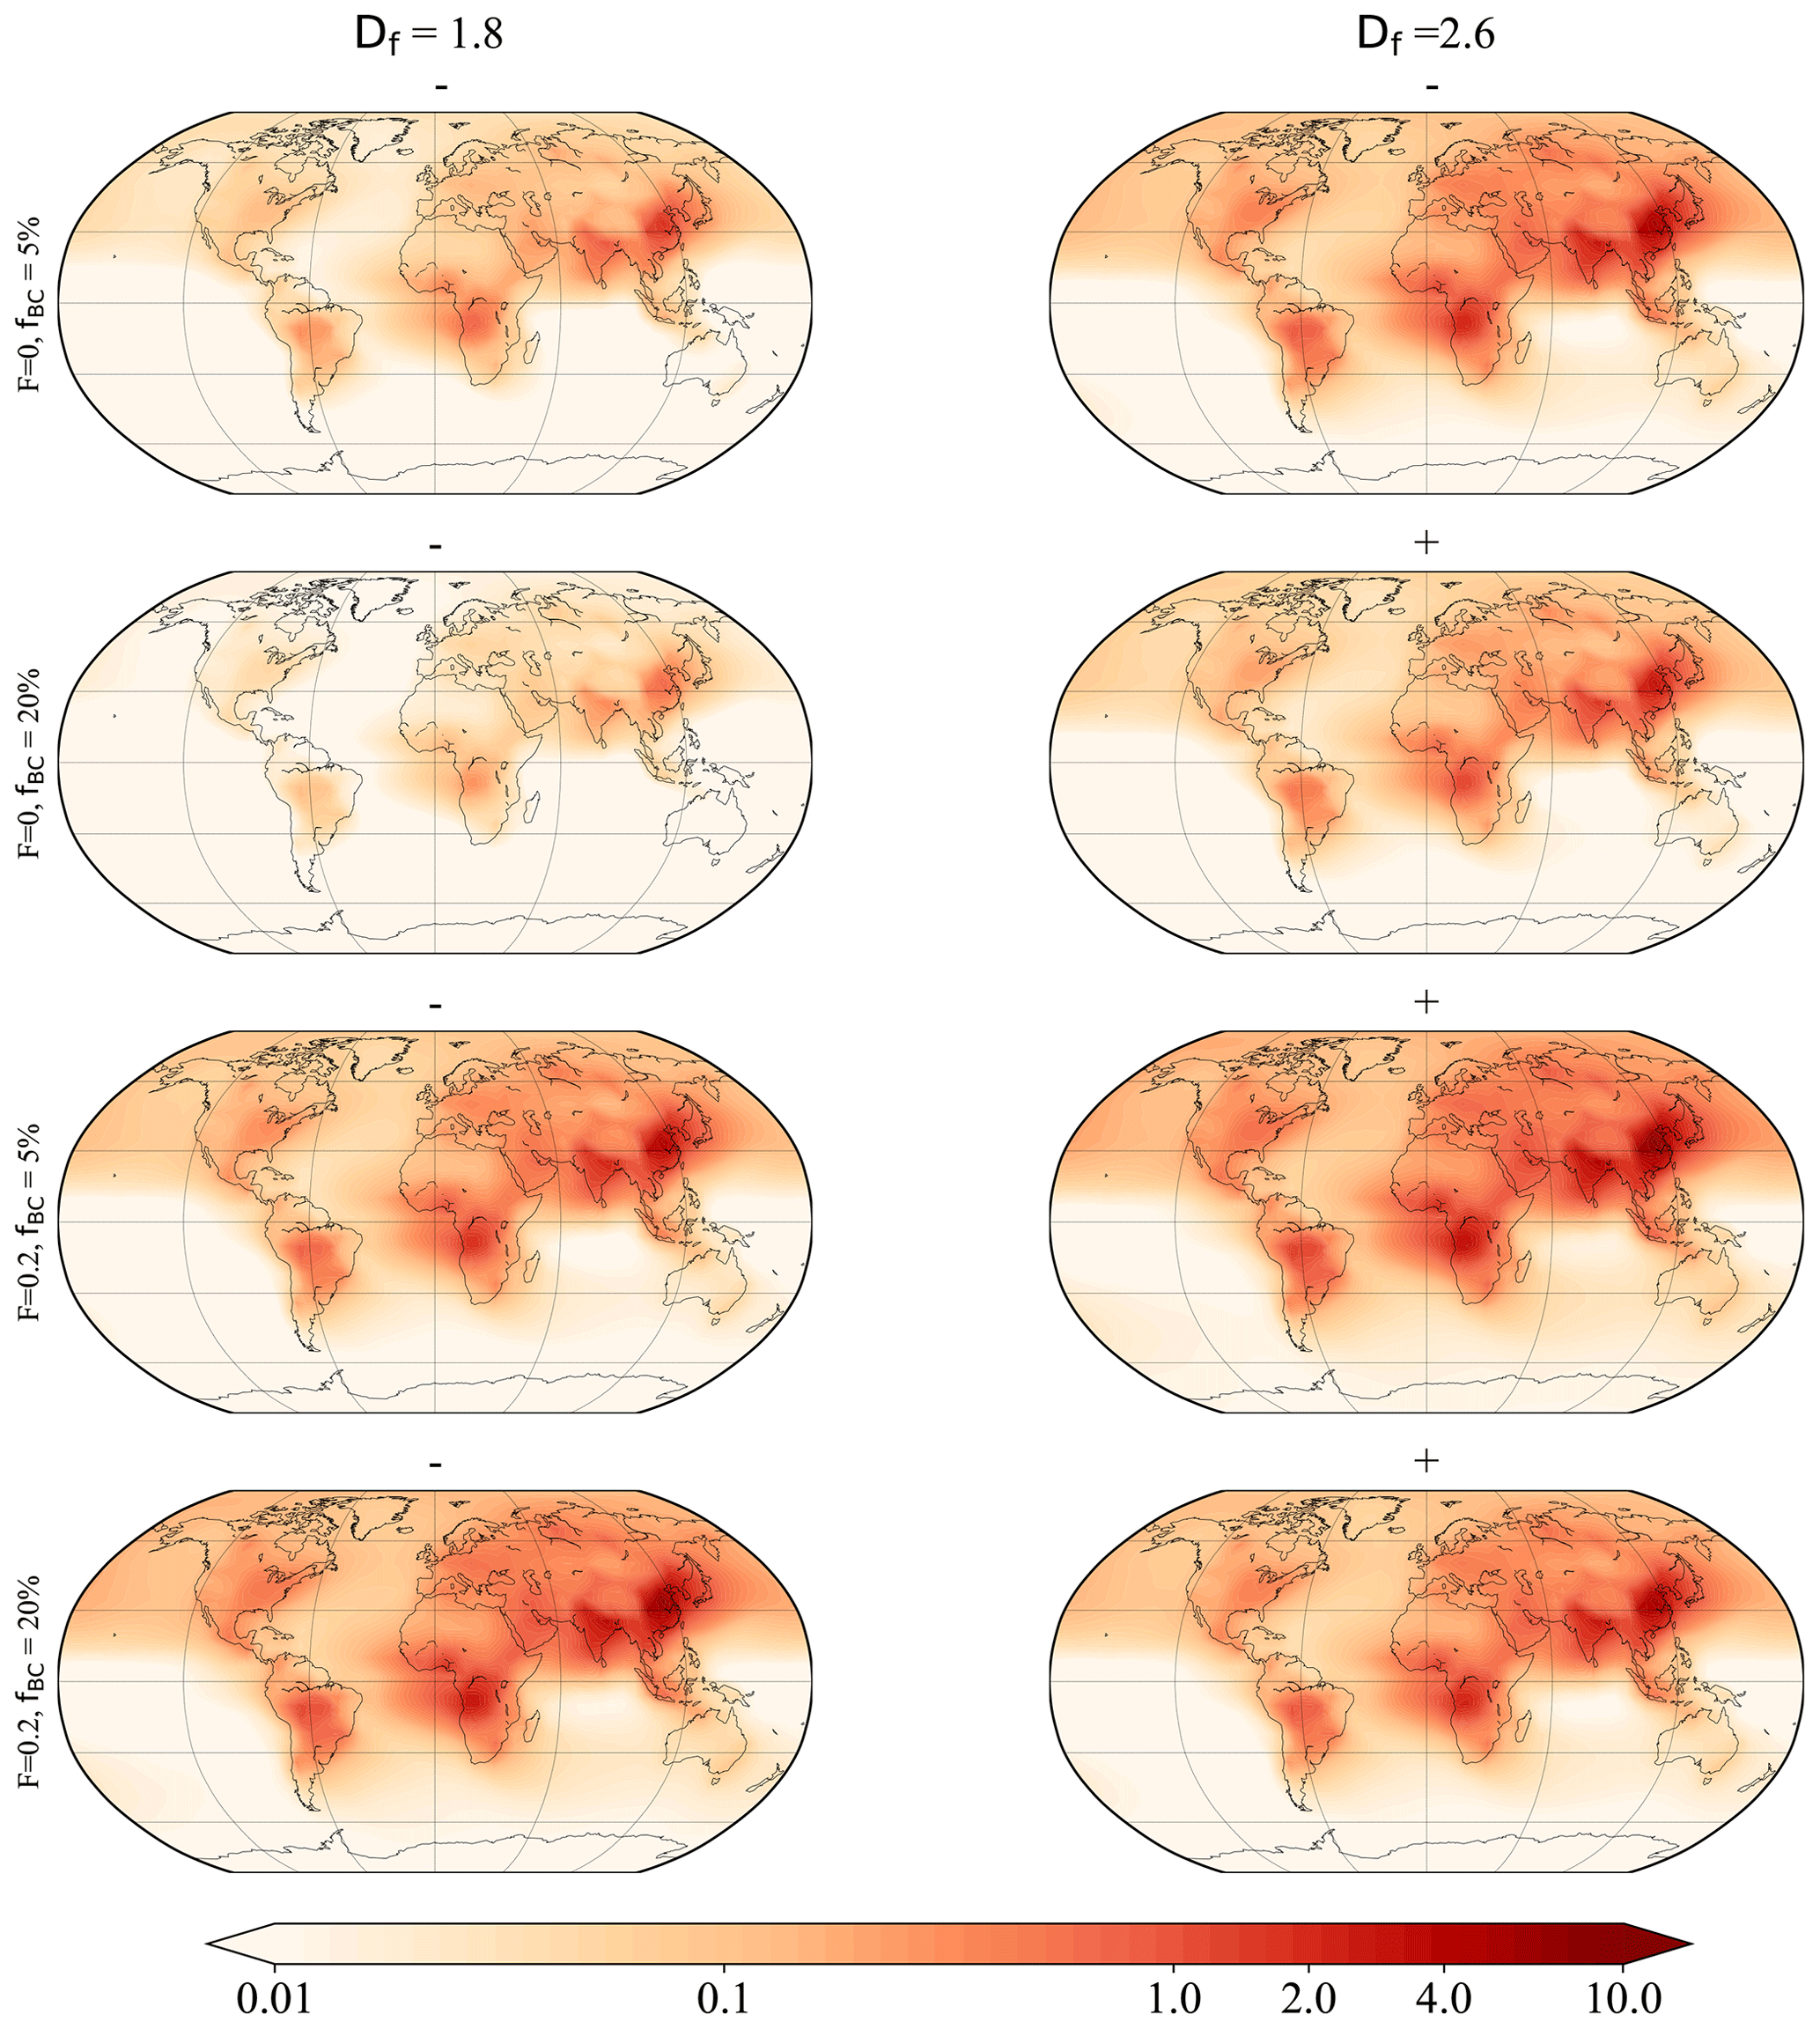
Figure 11Global distributions of the BC AAOD (×1000) that is misattributed to BrC, obtained based on the AAE440_870=1 method. A negative sign means underestimation and a positive sign means overestimation.
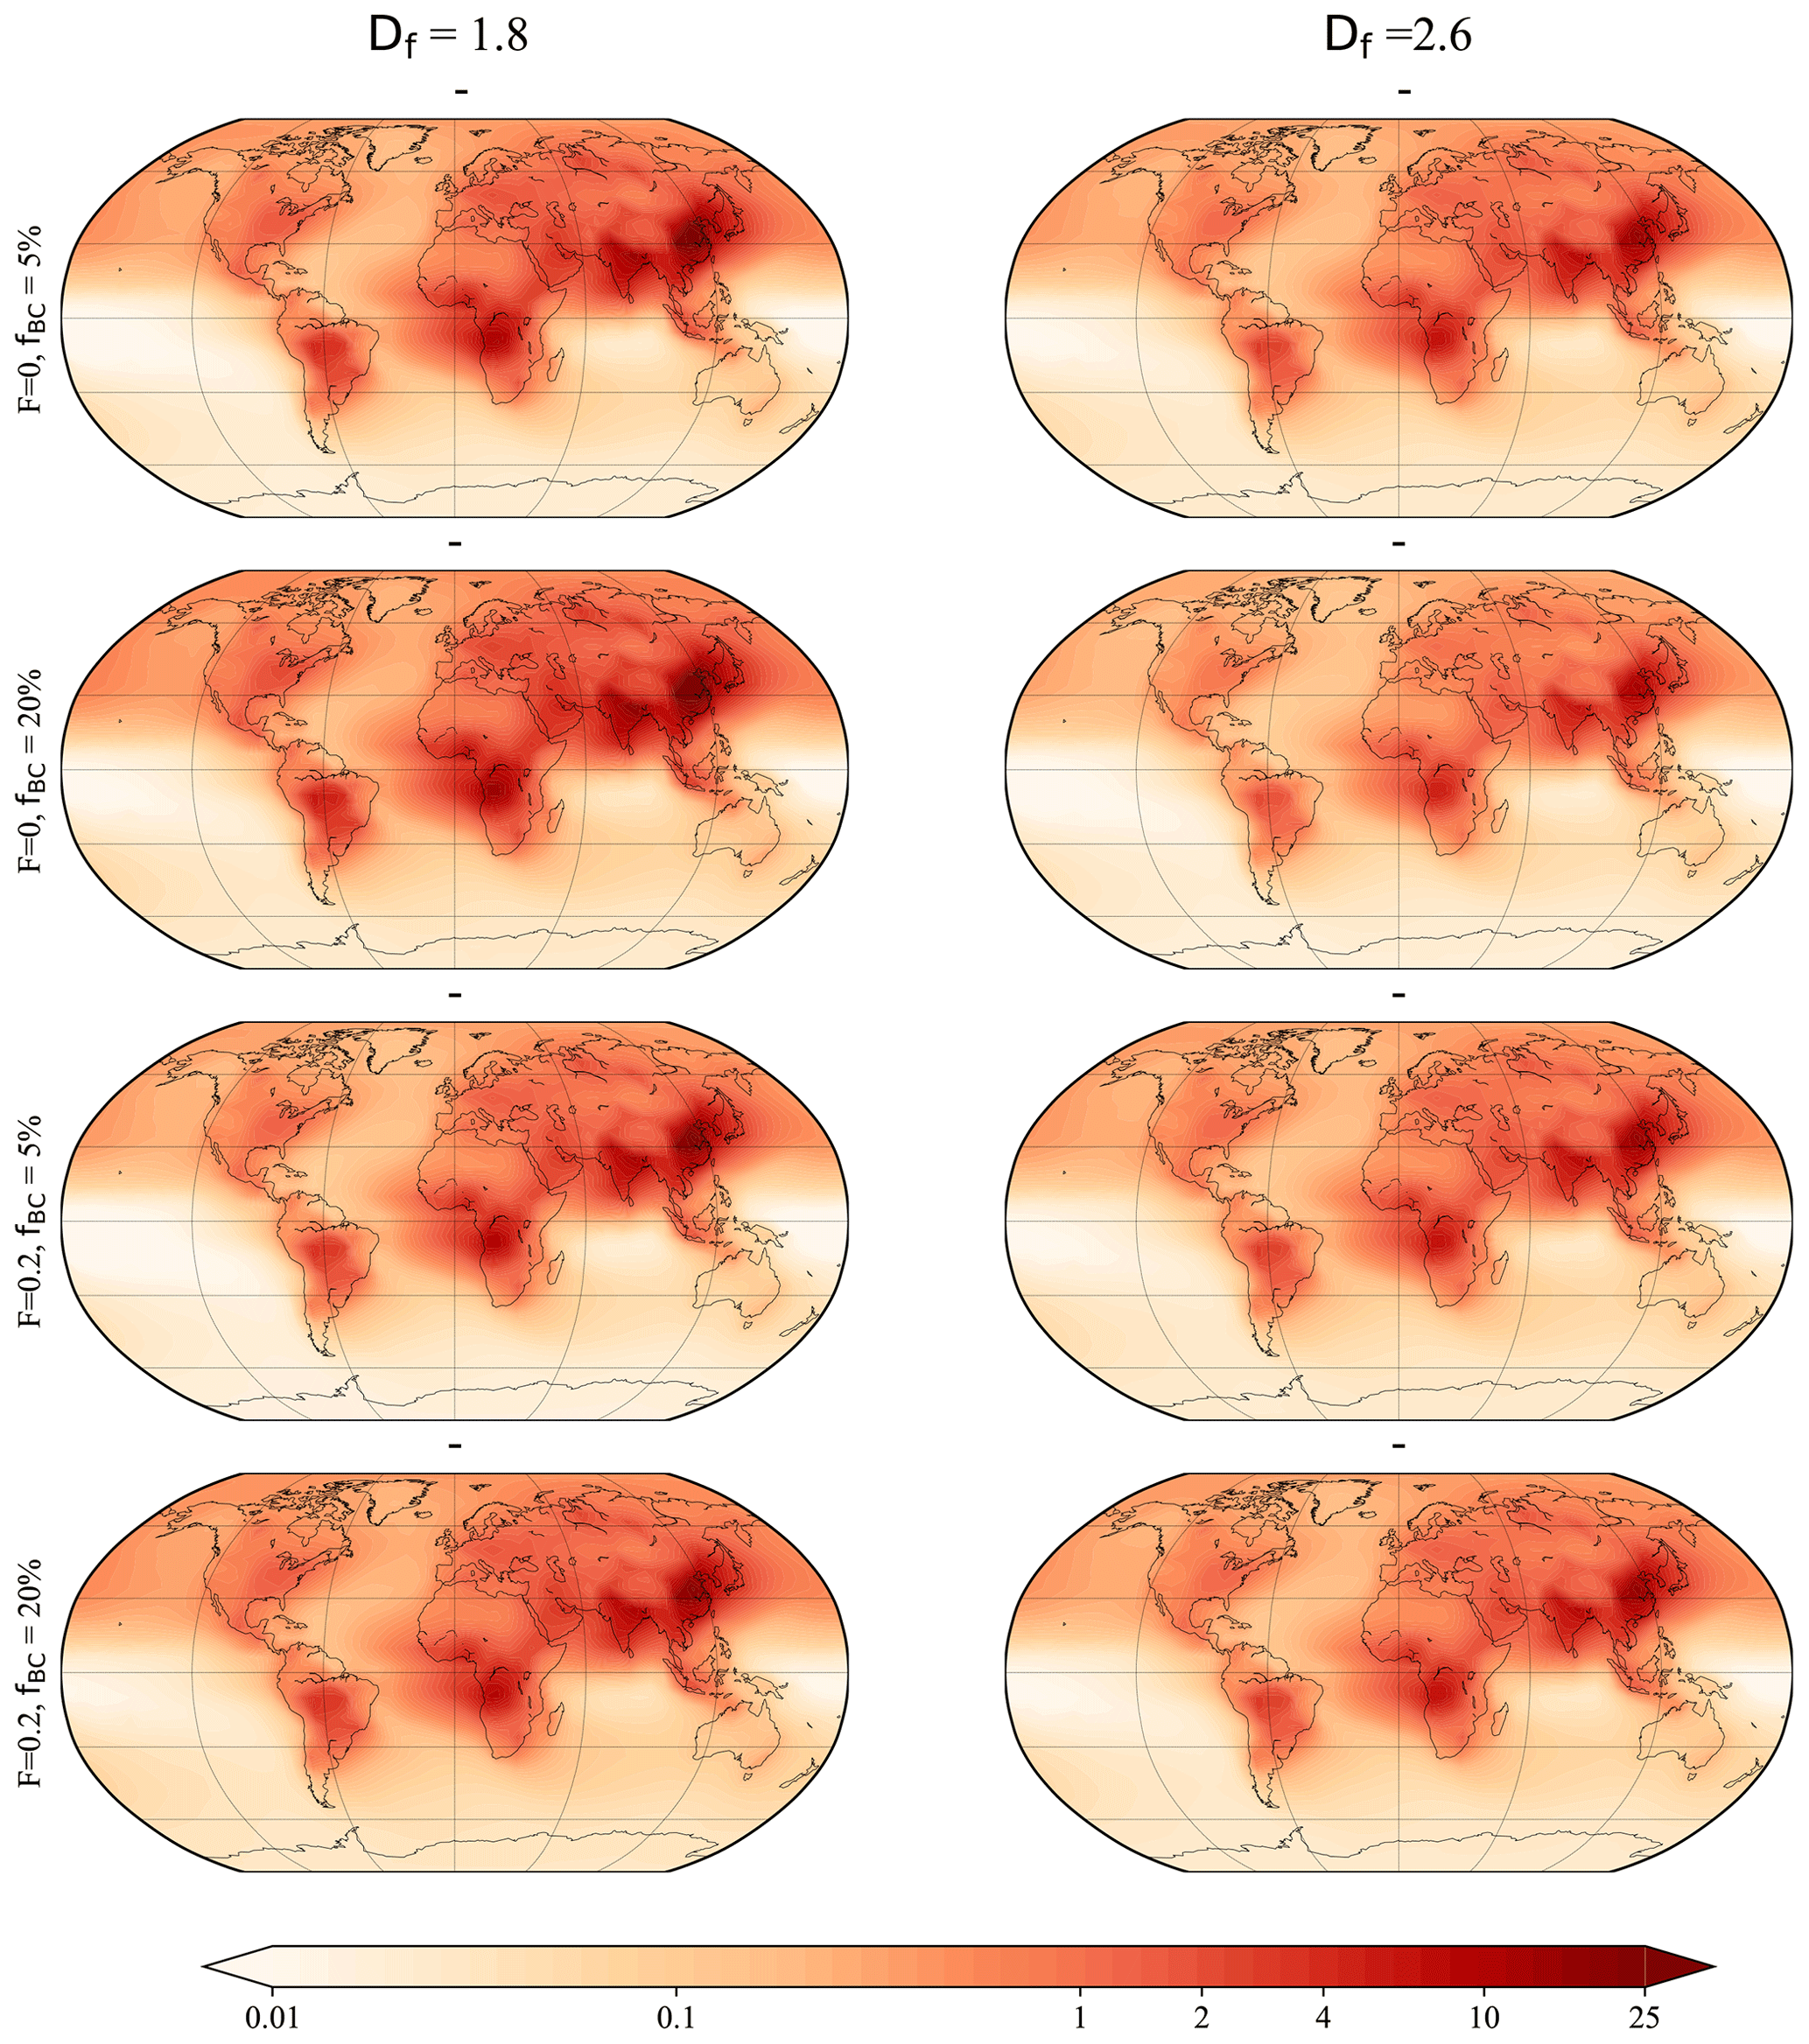
Figure 12Similar to Fig. 11, but obtained using the bare sphere WDA method.
By comparing five models, Sand et al. (2021) showed that the BC AAOD is generally in the range of 0.0007–0.007. Kinne (2019) reported a larger AAOD of 0.0072. However, their studies assume spherical core-shell structures, and a fully coated model could overestimate the overall AAOD. Based on GEOS-Chem simulations, Kelesidis et al. (2022) have shown that the global mean BC AAOD is about 0.0017 ± 0.007 ± and 0.003 ± 0.0016 when the spherical bare model and the coated model are used, respectively, while the values increase to about 0.0021 ± 0.0008 and 0.0036 ± 0.0014 when bare and coated BC agglomerate models are used, respectively. However, in their study, the coated BC aerosols were assumed to be fully coated. As shown in Fig. 9 and Table 4, our case studies show that the global mean AAOD value is about 0.0016 to 0.0026 and strongly depends on the microphysical properties of BC. Our simulated AAOD is generally in the range reported by Kelesidis et al. (2022). Our simulated BC AAOD is a little larger than that from simulations with agglomerate-only models reported by Kelesidis et al. (2022), but it is smaller than that from simulations with fully coated agglomerate models. This is easy to understand since we have mainly considered partially coated BC in this work. It is worth noting that the AAOD in this work is 440 nm, while previous studies generally set it at 550 nm. However, the AAOD does not differ significantly between these two wavelengths. Moreover, the aim of this work is to evaluate the impact of BC microphysical properties on the estimation of BrC, not to make a detailed comparison with the previous studies, so our analysis is valid.
In general, the AAODs of BC with a fluffy structure are higher than those of BC with a compact structure, which is consistent with the results of previous studies (Liu and Mishchenko, 2005; Luo et al., 2022; Kahnert and Devasthale, 2011). This is due to the blocking effects of a more compact structure and results in lower absorption (Kahnert and Devasthale, 2011). When F=0, the effects of the volume fraction (fBC) are not significant. The global BC AAOD is about 1.9–2.1 × 10⁻³ and 1.7–1.9 × 10⁻³ for BC with Df=1.8 and Df=2.6, respectively. As expected, the global mean BC AAOD increases as F increases. As F increases to 0.2 when Df=1.8, the global BC AAOD increases to about 2.1–2.5 × 10⁻³ and 2.45–2.6 × 10⁻³ when fBC is 5 % and 20 %, respectively. The results also show that the AAOD does not necessarily increase when the coating ratio for the partially coated BC increases (i.e., when fBC decreases) due to the shielding effect of the coating materials.
The BC DRF is an important parameter for assessing climate change. Bond et al. (2013) estimated a global mean BC DRF of about +0.17 to +1.48 W m−2, while more recent studies have shown much lower BC DRF values. For example, Kinne (2019) showed a global mean BC DRF of about +0.55 W m−2; Matsui et al. (2018) reported a BC DRF of +0.18 to +0.42 W m−2; and Chen et al. (2022) estimated a mean BC DRF of +0.33 W m−2 [+0.17, +0.54]. However, Heald et al. (2014) reported a much smaller global mean BC DRF of +0.078 W m−2, and Tuccella et al. (2020) obtained global mean BC DRFs of about +0.13 and +0.25 W m−2 when using a bare-sphere model and a core-shell sphere model, respectively. As shown above, we estimate a global mean AAOD range of about 0.0016 to 0.0026. Considering an average absorption forcing of 170 ± 43 W m−2/AAOD, based on the study of Bond et al. (2013), the estimated DRF in this work may be about +0.272 ± 0.069 to +0.442 ± 0.112 W m−2, which is generally in the range of values reported by previous studies.
Figure 10 and Table 5 show the estimated global BC AAOD incorrectly attributed to BrC (denoted the “BrC AAOD error” in the figure) when AAE-based methods are used. When using the AAE440_675=1 method, the errors for cases A, B, E, and G are relatively small, and the AAOD errors are in the range of −0.1–0.08 × 10⁻³. However, in cases C, D, F, and H, the errors are larger, and the estimated AAOD errors can sometimes reach about 0.41 × 10⁻³, which corresponds to about 20 % of the global BC AAOD. A wider range of AAOD errors is found in our cases when the AAE440_870=1 method is used. A general AAOD error range of about −0.43–0.46 × 10⁻³ was estimated when using AAE440_870=1. Assuming an average absorption forcing efficiency of 170 ± 43 W m−2/AAOD (Bond et al., 2013), we can estimate that a DRF range of −0.073 ± 0.0185 to +0.078 ± 0.0198 W m−2 due to BC is incorrectly attributed to BrC. The WDA does not necessarily improve the estimates when BC has a complex morphology. The spherical-model-based WDA methods may result in a global mean AAOD error range of approximately −0.87–0.04 × 10⁻³ in our cases, which could result in a global mean misassigned DRF range of −0.153 ± 0.0387 to +0.0085 ± 0.0022 W m−2.
Figures 11–12 and Figs. S5–S6 show the global distribution of BC AAOD misattributed to BrC obtained using different AAE-based methods. Our results show that the applicability of the different AAE-based methods is significantly limited by the microphysical properties of BC. When all BC is freshly emitted (e.g., F=0, fBC=20 %), the AAE440_870=1 method provides relatively reasonable estimates for the BrC AAOD, and the misattributed AAOD is within 0.8 × 10⁻³. However, the errors become more substantial as the BC gets older (i.e., with more coating, a larger F, or a more compact structure). Sometimes AAE440_870=1 leads to an AAOD error of about −7.3–5.7 × 10⁻³ in East Asia, resulting in a BC DRF of about −1.24 ± 0.314 W m−2 to +0.97 ± 0.245 W m−2 which is incorrectly attributed to BrC. Similar results are also observed using the AAE440_675=1 method (see Fig. S5). In contrast, the AAE440_675=1 method leads to smaller errors for freshly emitted BC. As shown in Figs. 12 and S6, the WDA method can lead to larger errors if all the BC has a complex morphology. In some cases, the Mie-theory-based WDA methods lead to a misattributed AAOD of about −22 × 10−3 in some regions (e.g., East Asia). Multiplying this AAOD error by an average absorption forcing of 170 ± 43 W m−2/AAOD results in an estimated misassigned DRF of −3.74 ± 0.946 W m−2. Therefore, we should carefully consider the effects of the microphysical properties of BC when using AAE-based methods.
AAE-based methods have been widely used to estimate the absorption by BrC, but they are subject to large uncertainties due to the properties of BC. We quantify the effects of the microphysical properties of BC based on numerical simulations and investigate how the applicability of AAE-based methods varies under different aging conditions. From the above, it is clear that using a BC AAE of 1 can provide reasonable estimates for BrC absorption, while the deviation from the “true” BrC absorption becomes significant as the particles age. This means that the AAE = 1 method can provide inaccurate estimates when aged BC is present. In general, regions near emission sources, such as urban traffic areas, contain mainly freshly emitted BC. In this case, it is reasonable to use the AAE = 1 method. With atmospheric aging, we should adjust the AAE values because both the AAE = 1 and WDA methods can sometimes result in misallocations of tens of percent of the BrC absorption. However, the adjustments should differ depending on the aging condition. As shown in Figs. 3–4, for fluffy BC partially mixed with coating materials (Df=1.8 and in this work), ABSBrC=0 occurs in most cases when AAE > 1. Therefore, we propose that a relatively large AAE should be used in general, while a smaller AAE is recommended for compact BCs, including coated and uncoated compact BCs. Recent observations have shown that the average Df is often small, even for coated BCs in regions far from emission sources (Wang et al., 2017; Yuan et al., 2019). Therefore, we prefer larger AAEs. However, there are also some compact BC aerosols in the atmosphere, and we should also consider the uncertainties when the real BC aerosols have a compact structure. In addition, the WDA methods do not improve the estimation. Therefore, we should carefully consider the uncertainties caused by the microphysical properties of BC when estimating the BrC absorption and DRF using the AAE-based methods.
The AAE-based method is commonly used to estimate the absorption by BrC, but it may provide inaccurate estimates due to the effects of the microphysical properties of BC. The goal of this work was not to discuss the use of the AAE-based method but to assess the uncertainties of the AAE-based method. We find that an AAE of 1 can provide a reasonable estimate when the BC is freshly emitted. Therefore, an AAE of 1 is suggested for regions close to the emission source, such as a vehicle emissions region. However, we should also note the uncertainties associated with using an AAE of 1. We estimate an ABSBrC range of about −4.8 % to 2.7 % when using an AAE of 1 for freshly emitted BC. However, the ABSBrC range becomes broader when the BC is aged, and ABSBrC is sometimes in the range of about −34.5%–38.7 %, depending on the aging status and morphology. Therefore, we need to adjust the AAE value when the fixed AAE method is applied to regions consisting of aged BC, such as regions far from the emission source. However, even for aged BC, different AAE values should be used for different aging conditions since we have shown that there is no fixed AAE that is applicable in all cases.
This work represents the aging condition by assuming a more compact structure, the presence of more coating materials, and a larger F. The adjustment of AAE values should be different for different aging processes. For fluffy BC partially mixed with coating materials (Df=1.8 and in this work), we propose a larger AAE in general, while a smaller AAE is recommended for compact BC. Our results also show that the Mie-theory-based WDA method does not necessarily improve the estimate (it gave an ABSBrC range of about −40.8 %–35.7 % in our simulation cases) due to the substantial WDA deviation between the morphologically realistic BC and the spherical BC.
At the global level, the use of a BC AAE of 1 can lead to a global mean misassigned AAOD of about −0.43–0.46 × 10⁻³, resulting in a corresponding global mean misassigned DRF of −0.073 ± 0.0185 to +0.078 ± 0.0198 W m−2. However, for the freshly emitted BC, an AAE of 1 does not lead to a significant misestimation of the AAOD. At the regional level, for an AAE of 1, the mean misassigned AAOD can vary in the range of −7.3 to 5.7 × 10⁻³ in some regions, leading to a misassigned DRF of about −1.24 ± 0.314 W m−2 to +0.97 ± 0.245 W m−2. The WDA method does not necessarily provide a more accurate estimate for the BrC absorption, and sometimes in some regions we can see a mean misassigned AAOD of about −22 × 10−3, leading to a misassigned DRF of about −3.74 ± 0.946 W m−2. Therefore, the effects of the microscopic properties of BC should be carefully considered when estimating BrC absorption and its direct radiative forcing based on the measurements at multiple wavelengths.
The optical properties of black carbon were calculated using the MSTM code, which was downloaded from https://www.eng.auburn.edu/~dmckwski/scatcodes/ (URL no longer valid, last access: 30 April 2022; Mackowski, 2013), and the new version of the code can be downloaded from: https://github.com/dmckwski/MSTM (Mackowski, 2023). The tunable code for generating the fractal BC aggregates can be obtained from: https://sites.google.com/view/fabriceonofri/aggregates/fractal-like-aggregates-diffusion-model/ (Onofri, 2019).
The data can be requested from the corresponding author.
The supplement related to this article is available online at: https://doi.org/10.5194/acp-24-427-2024-supplement.
JL conceived the presented idea. JL developed the models, performed the computations, and wrote the paper. JQ verified the simulation methods and results, revised the paper, and supervised the findings of this work. All authors discussed the results and contributed to the final paper.
The contact author has declared that none of the authors has any competing interests.
Publisher’s note: Copernicus Publications remains neutral with regard to jurisdictional claims made in the text, published maps, institutional affiliations, or any other geographical representation in this paper. While Copernicus Publications makes every effort to include appropriate place names, the final responsibility lies with the authors.
We gratefully acknowledge financial support from the National Key R&D Program of China (grant no. 2022YFB3902802) and the National Natural Science Foundation of China (grant nos. 42305148 and 41871269). We particularly thank Daniel W. Mackowski and Michael I. Mishchenko for making the MSTM code publicly available.
This research has been supported by the National Key Research and Development Program of China (grant no. 2022YFB3902802) and the National Natural Science Foundation of China (grant nos. 42305148 and 41871269).
This paper was edited by Eduardo Landulfo and reviewed by two anonymous referees.
Adachi, K., Chung, S. H., Friedrich, H., and Buseck, P. R.: Fractal parameters of individual soot particles determined using electron tomography: Implications for optical properties, J. Geophys. Res.-Atmos., 112, D14202, https://doi.org/10.1029/2006JD008296, 2007. a
Adachi, K., Chung, S. H., and Buseck, P. R.: Shapes of soot aerosol particles and implications for their effects on climate, J. Geophys. Res.-Atmos., 115, D15206, https://doi.org/10.1029/2009JD012868, 2010. a, b
Andreae, M. O. and Gelencsér, A.: Black carbon or brown carbon? The nature of light-absorbing carbonaceous aerosols, Atmos. Chem. Phys., 6, 3131–3148, https://doi.org/10.5194/acp-6-3131-2006, 2006. a
Arola, A., Schuster, G., Myhre, G., Kazadzis, S., Dey, S., and Tripathi, S. N.: Inferring absorbing organic carbon content from AERONET data, Atmos. Chem. Phys., 11, 215–225, https://doi.org/10.5194/acp-11-215-2011, 2011. a
Bahadur, R., Praveen, P. S., Xu, Y., and Ramanathan, V.: Solar absorption by elemental and brown carbon determined from spectral observations, P. Natl. Acad. Sci. USA, 109, 17366–17371, https://doi.org/10.1073/pnas.1205910109, 2012. a
Bao, F., Cheng, T., Li, Y., Gu, X., Guo, H., Wu, Y., Wang, Y., and Gao, J.: Retrieval of black carbon aerosol surface concentration using satellite remote sensing observations, Remote Sens. Environ., 226, 93–108, 2019. a
Baumgardner, D., Kok, G., and Raga, G.: Warming of the Arctic lower stratosphere by light absorbing particles, Geophys. Res. Lett., 31, L06117, https://doi.org/10.1029/2003GL018883, 2004. a
Bey, I., Jacob, D. J., Yantosca, R. M., Logan, J. A., Field, B. D., Fiore, A. M., Li, Q., Liu, H. Y., Mickley, L. J., and Schultz, M. G.: Global modeling of tropospheric chemistry with assimilated meteorology: Model description and evaluation, J. Geophys. Res.-Atmos., 106, 23073–23095, https://doi.org/10.1029/2001JD000807, 2001. a
Bhandari, J., China, S., Chandrakar, K. K., Kinney, G., Cantrell, W., Shaw, R. A., Mazzoleni, L. R., Girotto, G., Sharma, N., Gorkowski, K., et al.: Extensive soot compaction by cloud processing from laboratory and field observations, Sci. Rep., 9, 11824, https://doi.org/10.1038/s41598-019-48143-y, 2019. a
Bond, T. C. and Bergstrom, R. W.: Light Absorption by Carbonaceous Particles: An Investigative Review, Aerosol Sci. Technol., 40, 27–67, https://doi.org/10.1080/02786820500421521, 2006. a, b, c, d, e
Bond, T. C., Doherty, S. J., Fahey, D. W., Forster, P. M., Berntsen, T., DeAngelo, B. J., Flanner, M. G., Ghan, S., Kärcher, B., Koch, D., Kinne, S., Kondo, Y., Quinn, P. K., Sarofim, M. C., Schultz, M. G., Schulz, M., Venkataraman, C., Zhang, H., Zhang, S., Bellouin, N., Guttikunda, S. K., Hopke, P. K., Jacobson, M. Z., Kaiser, J. W., Klimont, Z., Lohmann, U., Schwarz, J. P., Shindell, D., Storelvmo, T., Warren, S. G., and Zender, C. S.: Bounding the role of black carbon in the climate system: A scientific assessment, J. Geophys. Res.-Atmos., 118, 5380–5552, https://doi.org/10.1002/jgrd.50171, 2013. a, b, c, d, e, f
Cappa, C. D., Kolesar, K. R., Zhang, X., Atkinson, D. B., Pekour, M. S., Zaveri, R. A., Zelenyuk, A., and Zhang, Q.: Understanding the optical properties of ambient sub- and supermicron particulate matter: results from the CARES 2010 field study in northern California, Atmos. Chem. Phys., 16, 6511–6535, https://doi.org/10.5194/acp-16-6511-2016, 2016. a
Cazorla, A., Bahadur, R., Suski, K. J., Cahill, J. F., Chand, D., Schmid, B., Ramanathan, V., and Prather, K. A.: Relating aerosol absorption due to soot, organic carbon, and dust to emission sources determined from in-situ chemical measurements, Atmos. Chem. Phys., 13, 9337–9350, https://doi.org/10.5194/acp-13-9337-2013, 2013. a
Chakrabarty, R. K., Moosmüller, H., Garro, M. A., Arnott, W. P., Walker, J., Susott, R. A., Babbitt, R. E., Wold, C. E., Lincoln, E. N., and Hao, W. M.: Emissions from the laboratory combustion of wildland fuels: Particle morphology and size, J. Geophys. Res.-Atmos., 111, D07204, https://doi.org/10.1029/2005JD006659, 2006. a
Chakrabarty, R. K., Moosmüller, H., Chen, L.-W. A., Lewis, K., Arnott, W. P., Mazzoleni, C., Dubey, M. K., Wold, C. E., Hao, W. M., and Kreidenweis, S. M.: Brown carbon in tar balls from smoldering biomass combustion, Atmos. Chem. Phys., 10, 6363–6370, https://doi.org/10.5194/acp-10-6363-2010, 2010. a, b
Chang, H.-C. and Charalampopoulos, T.: Determination of the wavelength dependence of refractive indices of flame soot, Proc. R. Soc. Lon. Ser-A, 430, 577–591, 1990. a
Chen, C., Fan, X., Shaltout, T., Qiu, C., Ma, Y., Goldman, A., and Khalizov, A. F.: An unexpected restructuring of combustion soot aggregates by subnanometer coatings of polycyclic aromatic hydrocarbons, Geophys. Res. Lett., 43, 11,080–11,088, https://doi.org/10.1002/2016GL070877, 2016. a
Chen, C., Dubovik, O., Schuster, G. L., Chin, M., Henze, D. K., Lapyonok, T., Li, Z., Derimian, Y., and Zhang, Y.: Multi-angular polarimetric remote sensing to pinpoint global aerosol absorption and direct radiative forcing, Nat. Commun., 13, 7459, 2022. a
Chen, Y. and Bond, T. C.: Light absorption by organic carbon from wood combustion, Atmos. Chem. Phys., 10, 1773–1787, https://doi.org/10.5194/acp-10-1773-2010, 2010. a, b, c
China, S., Mazzoleni, C., Gorkowski, K., Aiken, A. C., and Dubey, M. K.: Morphology and mixing state of individual freshly emitted wildfire carbonaceous particles, Nat. Commun., 4, 1–7, 2013. a
China, S., Salvadori, N., and Mazzoleni, C.: Effect of traffic and driving characteristics on morphology of atmospheric soot particles at freeway on-ramps, Environ. Sci. Technol., 48, 3128–3135, 2014. a
China, S., Scarnato, B., Owen, R. C., Zhang, B., Ampadu, M. T., Kumar, S., Dzepina, K., Dziobak, M. P., Fialho, P., Perlinger, J. A., Hueber, J., Helmig, D., Mazzoleni, L. R., and Mazzoleni, C.: Morphology and mixing state of aged soot particles at a remote marine free troposphere site: Implications for optical properties, Geophys. Res. Lett., 42, 1243–1250, https://doi.org/10.1002/2014GL062404, 2015. a
Chung, C. E., Ramanathan, V., and Decremer, D.: Observationally constrained estimates of carbonaceous aerosol radiative forcing, P. Natl. Acad. Sci. USA, 109, 11624–11629, https://doi.org/10.1073/pnas.1203707109, 2012. a
Cross, E. S., Onasch, T. B., Ahern, A., Wrobel, W., Slowik, J. G., Olfert, J., Lack, D. A., Massoli, P., Cappa, C. D., Schwarz, J. P., Spackman, J. R., Fahey, D. W., Sedlacek, A., Trimborn, A., Jayne, J. T., Freedman, A., Williams, L. R., Ng, N. L., Mazzoleni, C., Dubey, M., Brem, B., Kok, G., Subramanian, R., Freitag, S., Clarke, A., Thornhill, D., Marr, L. C., Kolb, C. E., Worsnop, D. R., and Davidovits, P.: Soot Particle Studies—Instrument Inter-Comparison—Project Overview, Aerosol Sci. Technol., 44, 592–611, https://doi.org/10.1080/02786826.2010.482113, 2010. a
Dasari, S., Andersson, A., Bikkina, S., Holmstrand, H., Budhavant, K., Satheesh, S., Asmi, E., Kesti, J., Backman, J., Salam, A., Bisht, D. S., Tiwari, S., Hameed, Z., and Örjan Gustafsson: Photochemical degradation affects the light absorption of water-soluble brown carbon in the South Asian outflow, Sci. Adv., 5, eaau8066, https://doi.org/10.1126/sciadv.aau8066, 2019. a
Dhaubhadel, R., Pierce, F., Chakrabarti, A., and Sorensen, C.: Hybrid superaggregate morphology as a result of aggregation in a cluster-dense aerosol, Phys. Rev. E, 73, 011404, https://doi.org/10.1103/PhysRevE.73.011404, 2006. a
Dubovik, O., Herman, M., Holdak, A., Lapyonok, T., Tanré, D., Deuzé, J. L., Ducos, F., Sinyuk, A., and Lopatin, A.: Statistically optimized inversion algorithm for enhanced retrieval of aerosol properties from spectral multi-angle polarimetric satellite observations, Atmos. Meas. Tech., 4, 975–1018, https://doi.org/10.5194/amt-4-975-2011, 2011. a
Dubovik, O., Lapyonok, T., Litvinov, P., Herman, M., Fuertes, D., Ducos, F., Torres, B., Derimian, Y., Huang, X., Lopatin, A., Chaikovsky, A., Aspetsberger, M., and Federspiel, C.: GRASP: a versatile algorithm for characterizing the atmosphere, SPIE Newsroom, 25, 1–4, https://doi.org/10.1117/2.1201408.005558, 2014. a
Eastham, S. D., Long, M. S., Keller, C. A., Lundgren, E., Yantosca, R. M., Zhuang, J., Li, C., Lee, C. J., Yannetti, M., Auer, B. M., Clune, T. L., Kouatchou, J., Putman, W. M., Thompson, M. A., Trayanov, A. L., Molod, A. M., Martin, R. V., and Jacob, D. J.: GEOS-Chem High Performance (GCHP v11-02c): a next-generation implementation of the GEOS-Chem chemical transport model for massively parallel applications, Geosci. Model Dev., 11, 2941–2953, https://doi.org/10.5194/gmd-11-2941-2018, 2018. a
Feng, Y., Ramanathan, V., and Kotamarthi, V. R.: Brown carbon: a significant atmospheric absorber of solar radiation?, Atmos. Chem. Phys., 13, 8607–8621, https://doi.org/10.5194/acp-13-8607-2013, 2013. a
Filippov, A., Zurita, M., and Rosner, D.: Fractal-like Aggregates: Relation between Morphology and Physical Properties, J. Colloid Interf. Sci., 229, 261–273, https://doi.org/10.1006/jcis.2000.7027, 2000. a
Gelaro, R., McCarty, W., Suárez, M. J., Todling, R., Molod, A., Takacs, L., Randles, C. A., Darmenov, A., Bosilovich, M. G., Reichle, R., Wargan, K., Coy, L., Cullather, R., Draper, C., Akella, S., Buchard, V., Conaty, A., da Silva, A. M., Gu, W., Kim, G.-K., Koster, R., Lucchesi, R., Merkova, D., Nielsen, J. E., Partyka, G., Pawson, S., Putman, W., Rienecker, M., Schubert, S. D., Sienkiewicz, M., and Zhao, B.: The Modern-Era Retrospective Analysis for Research and Applications, Version 2 (MERRA-2), J. Climate, 30, 5419–5454, https://doi.org/10.1175/JCLI-D-16-0758.1, 2017. a
Giles, D. M., Sinyuk, A., Sorokin, M. G., Schafer, J. S., Smirnov, A., Slutsker, I., Eck, T. F., Holben, B. N., Lewis, J. R., Campbell, J. R., Welton, E. J., Korkin, S. V., and Lyapustin, A. I.: Advancements in the Aerosol Robotic Network (AERONET) Version 3 database – automated near-real-time quality control algorithm with improved cloud screening for Sun photometer aerosol optical depth (AOD) measurements, Atmos. Meas. Tech., 12, 169–209, https://doi.org/10.5194/amt-12-169-2019, 2019. a
Gong, X., Zhang, C., Chen, H., Nizkorodov, S. A., Chen, J., and Yang, X.: Size distribution and mixing state of black carbon particles during a heavy air pollution episode in Shanghai, Atmos. Chem. Phys., 16, 5399–5411, https://doi.org/10.5194/acp-16-5399-2016, 2016. a
Guenther, A. B., Jiang, X., Heald, C. L., Sakulyanontvittaya, T., Duhl, T., Emmons, L. K., and Wang, X.: The Model of Emissions of Gases and Aerosols from Nature version 2.1 (MEGAN2.1): an extended and updated framework for modeling biogenic emissions, Geosci. Model Dev., 5, 1471–1492, https://doi.org/10.5194/gmd-5-1471-2012, 2012. a
Heald, C. L., Ridley, D. A., Kroll, J. H., Barrett, S. R. H., Cady-Pereira, K. E., Alvarado, M. J., and Holmes, C. D.: Contrasting the direct radiative effect and direct radiative forcing of aerosols, Atmos. Chem. Phys., 14, 5513–5527, https://doi.org/10.5194/acp-14-5513-2014, 2014. a
Hecobian, A., Zhang, X., Zheng, M., Frank, N., Edgerton, E. S., and Weber, R. J.: Water-Soluble Organic Aerosol material and the light-absorption characteristics of aqueous extracts measured over the Southeastern United States, Atmos. Chem. Phys., 10, 5965–5977, https://doi.org/10.5194/acp-10-5965-2010, 2010. a
Heinson, W. R., Sorensen, C. M., and Chakrabarti, A.: Does Shape Anisotropy Control the Fractal Dimension in Diffusion-Limited Cluster-Cluster Aggregation?, Aerosol Sci. Technol., 44, i–iv, https://doi.org/10.1080/02786826.2010.516032, 2010. a
Heinson, W. R., Liu, P., and Chakrabarty, R. K.: Fractal scaling of coated soot aggregates, Aerosol Sci. Technol., 51, 12–19, 2017. a, b
Heinson, W. R., Heinson, Y. W., Liu, P., and Chakrabarty, R. K.: Breakdown of fractal dimension invariance in high monomer-volume-fraction aerosol gels, Aerosol Sci. Technol., 52, 953–956, https://doi.org/10.1080/02786826.2018.1492086, 2018. a
Hoesly, R. M., Smith, S. J., Feng, L., Klimont, Z., Janssens-Maenhout, G., Pitkanen, T., Seibert, J. J., Vu, L., Andres, R. J., Bolt, R. M., Bond, T. C., Dawidowski, L., Kholod, N., Kurokawa, J.-I., Li, M., Liu, L., Lu, Z., Moura, M. C. P., O'Rourke, P. R., and Zhang, Q.: Historical (1750–2014) anthropogenic emissions of reactive gases and aerosols from the Community Emissions Data System (CEDS), Geosci. Model Dev., 11, 369–408, https://doi.org/10.5194/gmd-11-369-2018, 2018. a
Holben, B., Eck, T., Slutsker, I., Tanré, D., Buis, J., Setzer, A., Vermote, E., Reagan, J., Kaufman, Y., Nakajima, T., Lavenu, F., Jankowiak, I., and Smirnov, A.: AERONET – A Federated Instrument Network and Data Archive for Aerosol Characterization, Remote Sens. Environ., 66, 1–16, https://doi.org/10.1016/S0034-4257(98)00031-5, 1998. a
Kahnert, M. and Devasthale, A.: Black carbon fractal morphology and short-wave radiative impact: a modelling study, Atmos. Chem. Phys., 11, 11745–11759, https://doi.org/10.5194/acp-11-11745-2011, 2011. a, b
Kelesidis, G. A., Neubauer, D., Fan, L.-S., Lohmann, U., and Pratsinis, S. E.: Enhanced light absorption and radiative forcing by black carbon agglomerates, Environ. Sci. Technol., 56, 8610–8618, 2022. a, b, c, d, e
Kinne, S.: Aerosol radiative effects with MACv2, Atmos. Chem. Phys., 19, 10919–10959, https://doi.org/10.5194/acp-19-10919-2019, 2019. a, b
Kirchstetter, T. W., Novakov, T., and Hobbs, P. V.: Evidence that the spectral dependence of light absorption by aerosols is affected by organic carbon, J. Geophys. Res.-Atmos., 109, D21208, https://doi.org/10.1029/2004JD004999, 2004. a, b, c
Kirillova, E. N., Marinoni, A., Bonasoni, P., Vuillermoz, E., Facchini, M. C., Fuzzi, S., and Decesari, S.: Light absorption properties of brown carbon in the high Himalayas, J. Geophys. Res.-Atmos., 121, 9621–9639, https://doi.org/10.1002/2016JD025030, 2016. a
Kondo, Y., Sahu, L., Moteki, N., Khan, F., Takegawa, N., Liu, X., Koike, M., and Miyakawa, T.: Consistency and Traceability of Black Carbon Measurements Made by Laser-Induced Incandescence, Thermal-Optical Transmittance, and Filter-Based Photo-Absorption Techniques, Aerosol Sci. Technol., 45, 295–312, https://doi.org/10.1080/02786826.2010.533215, 2011. a
Lack, D. A. and Cappa, C. D.: Impact of brown and clear carbon on light absorption enhancement, single scatter albedo and absorption wavelength dependence of black carbon, Atmos. Chem. Phys., 10, 4207–4220, https://doi.org/10.5194/acp-10-4207-2010, 2010. a, b
Lack, D. A., Moosmüller, H., McMeeking, G. R., Chakrabarty, R. K., and Baumgardner, D.: Characterizing elemental, equivalent black, and refractory black carbon aerosol particles: a review of techniques, their limitations and uncertainties, Anal. Bioanal. Chem., 406, 99–122, 2014. a
Laskin, A., Laskin, J., and Nizkorodov, S. A.: Chemistry of atmospheric brown carbon, Chem. Rev., 115, 4335–4382, 2015. a
Li, J., Liu, C., Yin, Y., and Kumar, K. R.: Numerical investigation on the Ångström exponent of black carbon aerosol, J. Geophys. Res.-Atmos., 121, 3506–3518, https://doi.org/10.1002/2015JD024718, 2016. a
Liu, C., Li, J., Yin, Y., Zhu, B., and Feng, Q.: Optical properties of black carbon aggregates with non-absorptive coating, J. Quant. Spectrosc. Ra., 187, 443–452, https://doi.org/10.1016/j.jqsrt.2016.10.023, 2017. a, b, c
Liu, C., Chung, C. E., Yin, Y., and Schnaiter, M.: The absorption Ångström exponent of black carbon: from numerical aspects, Atmos. Chem. Phys., 18, 6259–6273, https://doi.org/10.5194/acp-18-6259-2018, 2018. a, b, c, d
Liu, L. and Mishchenko, M. I.: Effects of aggregation on scattering and radiative properties of soot aerosols, J. Geophys. Res.-Atmos., 110, https://doi.org/10.1029/2004JD005649, 2005. a, b
Luo, J., Zhang, Y., Wang, F., and Zhang, Q.: Effects of brown coatings on the absorption enhancement of black carbon: a numerical investigation, Atmos. Chem. Phys., 18, 16897–16914, https://doi.org/10.5194/acp-18-16897-2018, 2018. a, b, c, d
Luo, J., Zhang, Q., Luo, J., Liu, J., Huo, Y., and Zhang, Y.: Optical Modeling of Black Carbon With Different Coating Materials: The Effect of Coating Configurations, J. Geophys. Res.-Atmos., 124, 13230–13253, https://doi.org/10.1029/2019JD031701, 2019. a, b
Luo, J., Zhang, Y., and Zhang, Q.: The Ångström Exponent and Single-Scattering Albedo of Black Carbon: Effects of Different Coating Materials, Atmosphere, 11, 1103, https://doi.org/10.3390/atmos11101103, 2020. a
Luo, J., Zhang, Q., Zhang, C., Zhang, Y., and Chakrabarty, R. K.: The fractal characteristics of atmospheric coated soot: Implication for morphological analysis, J. Aerosol Sci., 157, 105804, https://doi.org/10.1016/j.jaerosci.2021.105804, 2021a. a, b
Luo, J., Zhang, Q., Zhang, Y., and Li, Z.: Radiative Properties of Non-spherical Black Carbon Aerosols, 69–124, Springer International Publishing, Cham, ISBN 978-3-030-87683-8, https://doi.org/10.1007/978-3-030-87683-8_3, 2021b. a
Luo, J., Zhang, Y., and Zhang, Q.: Effects of black carbon morphology on brown carbon absorption estimation: from numerical aspects, Geosci. Model Dev., 14, 2113–2126, https://doi.org/10.5194/gmd-14-2113-2021, 2021c. a, b, c, d
Luo, J., Li, Z., Zhang, C., Zhang, Q., Zhang, Y., Zhang, Y., Curci, G., and Chakrabarty, R. K.: Regional impacts of black carbon morphologies on shortwave aerosol–radiation interactions: a comparative study between the US and China, Atmos. Chem. Phys., 22, 7647–7666, https://doi.org/10.5194/acp-22-7647-2022, 2022. a
Luo, J., Li, Z., Qiu, J., Zhang, Y., Fan, C., Li, L., Wu, H., Zhou, P., Li, K., and Zhang, Q.: The Simulated Source Apportionment of Light Absorbing Aerosols: Effects of Microphysical Properties of Partially-Coated Black Carbon, J. Geophys. Res.-Atmos., 128, e2022JD037291, https://doi.org/10.1029/2022JD037291, 2023. a, b, c, d, e, f, g, h
Mackowski, D.: The extension of the Multiple Sphere T Matrix code to include multiple plane boundaries and 2-D periodic systems, J. Quant. Spectrosc. Ra., 290, 108292, https://doi.org/10.1016/j.jqsrt.2022.108292, 2022. a
Mackowski, D. and Mishchenko, M.: A multiple sphere T-matrix Fortran code for use on parallel computer clusters, J. Quant. Spectrosc. Ra., 112, 2182–2192, https://doi.org/10.1016/j.jqsrt.2011.02.019, 2011. a
Mackowski, D. W.: MSTM Version 3.0: April 2013, MSTM [code], https://www.eng.auburn.edu/~dmckwski/scatcodes/ (last access: 30 April 2022), 2013. a
Mackowski, D. W.: MSTM: Multiple Sphere T Matrix code, GitHub [code], https://github.com/dmckwski/MSTM, last access: 30 December 2023. a
Matsui, H., Hamilton, D. S., and Mahowald, N. M.: Black carbon radiative effects highly sensitive to emitted particle size when resolving mixing-state diversity, Nat. Commun., 9, 3446, https://doi.org/10.1038/s41467-018-05635-1, 2018. a, b
Mie, G.: Beiträge zur Optik trüber Medien, speziell kolloidaler Metallösungen, Ann. Phys., 330, 377–445, 1908. a
Molod, A., Takacs, L., Suarez, M., and Bacmeister, J.: Development of the GEOS-5 atmospheric general circulation model: evolution from MERRA to MERRA2, Geosci. Model Dev., 8, 1339–1356, https://doi.org/10.5194/gmd-8-1339-2015, 2015. a
Moran, J., Fuentes, A., Liu, F., and Yon, J.: FracVAL: An improved tunable algorithm of cluster cluster aggregation for generation of fractal structures formed by polydisperse primary particles, Comput. Phys. Commun., 239, 225–237, https://doi.org/10.1016/j.cpc.2019.01.015, 2019. a
Moteki, N., Kondo, Y., Miyazaki, Y., Takegawa, N., Komazaki, Y., Kurata, G., Shirai, T., Blake, D. R., Miyakawa, T., and Koike, M.: Evolution of mixing state of black carbon particles: Aircraft measurements over the western Pacific in March 2004, Geophys. Res. Lett., 34, L11803, https://doi.org/10.1029/2006GL028943, 2007. a
Myhre, G., Samset, B. H., Schulz, M., Balkanski, Y., Bauer, S., Berntsen, T. K., Bian, H., Bellouin, N., Chin, M., Diehl, T., Easter, R. C., Feichter, J., Ghan, S. J., Hauglustaine, D., Iversen, T., Kinne, S., Kirkevåg, A., Lamarque, J.-F., Lin, G., Liu, X., Lund, M. T., Luo, G., Ma, X., van Noije, T., Penner, J. E., Rasch, P. J., Ruiz, A., Seland, Ø., Skeie, R. B., Stier, P., Takemura, T., Tsigaridis, K., Wang, P., Wang, Z., Xu, L., Yu, H., Yu, F., Yoon, J.-H., Zhang, K., Zhang, H., and Zhou, C.: Radiative forcing of the direct aerosol effect from AeroCom Phase II simulations, Atmos. Chem. Phys., 13, 1853–1877, https://doi.org/10.5194/acp-13-1853-2013, 2013. a
Onofri, F. R. A.: Fractal-like aggregates: Diffusion limited model (random walk algorithm) [code], https://sites.google.com/view/fabriceonofri/aggregates/fractal-like-aggregates-diffusion-model/ (last access: 30 December 2023), 2019. a
Pang, Y., Wang, Y., Wang, Z., Zhang, Y., Liu, L., Kong, S., Liu, F., Shi, Z., and Li, W.: Quantifying the Fractal Dimension and Morphology of Individual Atmospheric Soot Aggregates, J. Geophys. Res.-Atmos., 127, e2021JD036055, https://doi.org/10.1029/2021JD036055, 2022. a, b
Pang, Y., Chen, M., Wang, Y., Chen, X., Teng, X., Kong, S., Zheng, Z., and Li, W.: Morphology and Fractal Dimension of Size-Resolved Soot Particles Emitted From Combustion Sources, J. Geophys. Res.-Atmos., 128, e2022JD037711, https://doi.org/10.1029/2022JD037711, 2023. a, b
Petzold, A. and Schönlinner, M.: Multi-angle absorption photometry—a new method for the measurement of aerosol light absorption and atmospheric black carbon, J. Aerosol Sci., 35, 421–441, https://doi.org/10.1016/j.jaerosci.2003.09.005, 2004. a
Radney, J. G., You, R., Ma, X., Conny, J. M., Zachariah, M. R., Hodges, J. T., and Zangmeister, C. D.: Dependence of soot optical properties on particle morphology: measurements and model comparisons, Environ. Sci. Technol., 48, 3169–3176, 2014. a
Randerson, J., Van Der Werf, G., Giglio, L., Collatz, G., and Kasibhatla, P.: Global Fire Emissions Database, Version 4,(GFEDv4), ORNL DAAC, Oak Ridge, Tennessee, USA, https://doi.org/10.3334/ORNLDAAC/1293, 2018. a
Rathod, T. and Sahu, S.: Measurements of optical properties of black and brown carbon using multi-wavelength absorption technique at Mumbai, India, J. Earth Syst. Sci., 131, 32, 2022. a
Russell, P. B., Bergstrom, R. W., Shinozuka, Y., Clarke, A. D., DeCarlo, P. F., Jimenez, J. L., Livingston, J. M., Redemann, J., Dubovik, O., and Strawa, A.: Absorption Angstrom Exponent in AERONET and related data as an indicator of aerosol composition, Atmos. Chem. Phys., 10, 1155–1169, https://doi.org/10.5194/acp-10-1155-2010, 2010. a, b
Sand, M., Samset, B. H., Myhre, G., Gliß, J., Bauer, S. E., Bian, H., Chin, M., Checa-Garcia, R., Ginoux, P., Kipling, Z., Kirkevåg, A., Kokkola, H., Le Sager, P., Lund, M. T., Matsui, H., van Noije, T., Olivié, D. J. L., Remy, S., Schulz, M., Stier, P., Stjern, C. W., Takemura, T., Tsigaridis, K., Tsyro, S. G., and Watson-Parris, D.: Aerosol absorption in global models from AeroCom phase III, Atmos. Chem. Phys., 21, 15929–15947, https://doi.org/10.5194/acp-21-15929-2021, 2021. a
Schnaiter, M., Linke, C., Möhler, O., Naumann, K.-H., Saathoff, H., Wagner, R., Schurath, U., and Wehner, B.: Absorption amplification of black carbon internally mixed with secondary organic aerosol, J. Geophys. Res.-Atmos., 110, D19204, https://doi.org/10.1029/2005JD006046, 2005. a
Schwarz, J. P., Gao, R. S., Fahey, D. W., Thomson, D. S., Watts, L. A., Wilson, J. C., Reeves, J. M., Darbeheshti, M., Baumgardner, D. G., Kok, G. L., Chung, S. H., Schulz, M., Hendricks, J., Lauer, A., Karcher, B., Slowik, J. G., Rosenlof, K. H., Thompson, T. L., Langford, A. O., Loewenstein, M., and Aikin, K. C.: Single-particle measurements of midlatitude black carbon and light-scattering aerosols from the boundary layer to the lower stratosphere, J. Geophys. Res.-Atmos., 111, D16207, https://doi.org/10.1029/2006JD007076, 2006. a
Shaw, G. E.: Sun Photometry, B. Am. Meteorol. Soc., 64, 4–10, https://doi.org/10.1175/1520-0477(1983)064<0004:SP>2.0.CO;2, 1983. a
Shin, S.-K., Tesche, M., Müller, D., and Noh, Y.: Technical note: Absorption aerosol optical depth components from AERONET observations of mixed dust plumes, Atmos. Meas. Tech., 12, 607–618, https://doi.org/10.5194/amt-12-607-2019, 2019. a
Shiraiwa, M., Kondo, Y., Moteki, N., Takegawa, N., Sahu, L. K., Takami, A., Hatakeyama, S., Yonemura, S., and Blake, D. R.: Radiative impact of mixing state of black carbon aerosol in Asian outflow, J. Geophys. Res.-Atmos., 113, D24210, https://doi.org/10.1029/2008JD010546, 2008. a
Skorupski, K., Mroczka, J., Wriedt, T., and Riefler, N.: A fast and accurate implementation of tunable algorithms used for generation of fractal-like aggregate models, Physica A, 404, 106–117, https://doi.org/10.1016/j.physa.2014.02.072, 2014. a
Sorensen, C. M.: Light Scattering by Fractal Aggregates: A Review, Aerosol Sci. Technol., 35, 648–687, https://doi.org/10.1080/02786820117868, 2001. a, b, c
Sorensen, C. M.: The Mobility of Fractal Aggregates: A Review, Aerosol Sci. Technol., 45, 765–779, https://doi.org/10.1080/02786826.2011.560909, 2011. a
Sorensen, C. M. and Roberts, G. C.: The Prefactor of Fractal Aggregates, J. Colloid Interf. Sci., 186, 447–452, https://doi.org/10.1006/jcis.1996.4664, 1997. a
Tesche, M., Müller, D., Gross, S., Ansmann, A., Althausen, D., Freudenthaler, V., Weinzierl, B., Veira, A., and Petzold, A.: Optical and microphysical properties of smoke over Cape Verde inferred from multiwavelength lidar measurements, Tellus B, 169, 162–174, https://doi.org/10.1111/j.1600-0889.2011.00549.x, 2011. a
Tuccella, P., Curci, G., Pitari, G., Lee, S., and Jo, D. S.: Direct Radiative Effect of Absorbing Aerosols: Sensitivity to Mixing State, Brown Carbon, and Soil Dust Refractive Index and Shape, J. Geophys. Res.-Atmos., 125, e2019JD030967, https://doi.org/10.1029/2019JD030967, 2020. a
Wang, J., Nie, W., Cheng, Y., Shen, Y., Chi, X., Wang, J., Huang, X., Xie, Y., Sun, P., Xu, Z., Qi, X., Su, H., and Ding, A.: Light absorption of brown carbon in eastern China based on 3-year multi-wavelength aerosol optical property observations and an improved absorption Ångström exponent segregation method, Atmos. Chem. Phys., 18, 9061–9074, https://doi.org/10.5194/acp-18-9061-2018, 2018. a
Wang, X., Heald, C. L., Sedlacek, A. J., de Sá, S. S., Martin, S. T., Alexander, M. L., Watson, T. B., Aiken, A. C., Springston, S. R., and Artaxo, P.: Deriving brown carbon from multiwavelength absorption measurements: method and application to AERONET and Aethalometer observations, Atmos. Chem. Phys., 16, 12733–12752, https://doi.org/10.5194/acp-16-12733-2016, 2016. a, b, c, d, e, f, g, h
Wang, Y., Liu, F., He, C., Bi, L., Cheng, T., Wang, Z., Zhang, H., Zhang, X., Shi, Z., and Li, W.: Fractal Dimensions and Mixing Structures of Soot Particles during Atmospheric Processing, Environ. Sci. Technol. Lett., 4, 487–493, https://doi.org/10.1021/acs.estlett.7b00418, 2017. a, b, c
Wang, Y., Pang, Y., Huang, J., Bi, L., Che, H., Zhang, X., and Li, W.: Constructing Shapes and Mixing Structures of Black Carbon Particles With Applications to Optical Calculations, J. Geophys. Res.-Atmos., 126, e2021JD034620, https://doi.org/10.1029/2021JD034620, 2021. a
Wentzel, M., Gorzawski, H., Naumann, K.-H., Saathoff, H., and Weinbruch, S.: Transmission electron microscopical and aerosol dynamical characterization of soot aerosols, J. Aerosol Sci., 34, 1347–1370, 2003. a
Woźniak, M.: CHARACTERIZATION OF NANOPARTICLE AGGREGATES WITH LIGHT SCATTERING TECHNIQUES, Theses, Aix-Marseille Université, https://tel.archives-ouvertes.fr/tel-00747711 (last access: 30 June 2023), 2012. a
Xie, M., Chen, X., Holder, A. L., Hays, M. D., Lewandowski, M., Offenberg, J. H., Kleindienst, T. E., Jaoui, M., and Hannigan, M. P.: Light absorption of organic carbon and its sources at a southeastern U.S. location in summer, Environ. Pollut., 244, 38–46, https://doi.org/10.1016/j.envpol.2018.09.125, 2019. a
Yuan, Q., Xu, J., Wang, Y., Zhang, X., Pang, Y., Liu, L., Bi, L., Kang, S., and Li, W.: Mixing state and fractal dimension of soot particles at a remote site in the southeastern Tibetan Plateau, Environ. Sci. Technol., 53, 8227–8234, 2019. a, b
Zeng, L., Zhang, A., Wang, Y., Wagner, N. L., Katich, J. M., Schwarz, J. P., Schill, G. P., Brock, C., Froyd, K. D., Murphy, D. M., Williamson, C. J., Kupc, A., Scheuer, E., Dibb, J., and Weber, R. J.: Global Measurements of Brown Carbon and Estimated Direct Radiative Effects, Geophys. Res. Lett., 47, e2020GL088747, https://doi.org/10.1029/2020GL088747, 2020a. a
Zeng, L., Zhang, A., Wang, Y., Wagner, N. L., Katich, J. M., Schwarz, J. P., Schill, G. P., Brock, C., Froyd, K. D., Murphy, D. M., Williamson, C. J., Kupc, A., Scheuer, E., Dibb, J., and Weber, R. J.: Global Measurements of Brown Carbon and Estimated Direct Radiative Effects, Geophys. Res. Lett., 47, e2020GL088747, https://doi.org/10.1029/2020GL088747, 2020b. a
Zhang, H. and Wang, Z.: Advances in the Study of Black Carbon Effects on Climate, Adv. Clim. Change Res., 2, 23–30, https://doi.org/10.3724/SP.J.1248.2011.00023, 2011. a
Zhang, A., Wang, Y., Zhang, Y., Weber, R. J., Song, Y., Ke, Z., and Zou, Y.: Modeling the global radiative effect of brown carbon: a potentially larger heating source in the tropical free troposphere than black carbon, Atmos. Chem. Phys., 20, 1901–1920, https://doi.org/10.5194/acp-20-1901-2020, 2020. a
Zhang, G., Peng, L., Lian, X., Lin, Q., Bi, X., Chen, D., Li, M., Li, L., Wang, X., and Sheng, G.: An Improved Absorption Ångström Exponent (AAE)-Based Method for Evaluating the Contribution of Light Absorption from Brown Carbon with a High-Time Resolution, Aerosol Air Qual. Res., 19, 15–24, https://doi.org/10.4209/aaqr.2017.12.0566, 2019. a
Zhang, R., Khalizov, A. F., Pagels, J., Zhang, D., Xue, H., and McMurry, P. H.: Variability in morphology, hygroscopicity, and optical properties of soot aerosols during atmospheric processing, P. Natl. Acad. Sci. USA, 105, 10291–10296, 2008. a
Zhang, X., Mao, M., Yin, Y., and Wang, B.: Numerical Investigation on Absorption Enhancement of Black Carbon Aerosols Partially Coated With Nonabsorbing Organics, J. Geophys. Res.-Atmos., 123, 1297–1308, https://doi.org/10.1002/2017JD027833, 2018. a, b, c, d
Zhang, X., Mao, M., Chen, H., and Tang, S.: The Angstrom exponents of black carbon aerosols with non-absorptive coating: A numerical investigation, J. Quant. Spectrosc. Ra., 257, 107362, https://doi.org/10.1016/j.jqsrt.2020.107362, 2020. a, b, c