the Creative Commons Attribution 4.0 License.
the Creative Commons Attribution 4.0 License.
 | 08 Apr 2024
Sharp increase in Saharan dust intrusions over the western Euro-Mediterranean in February–March 2020–2022 and associated atmospheric circulation
Emilio Cuevas-Agulló
David Barriopedro
Rosa Delia García
Silvia Alonso-Pérez
Juan Jesús González-Alemán
Ernest Werner
David Suárez
Juan José Bustos
Gerardo García-Castrillo
Omaira García
África Barreto
During the months of February–March (FM) of the 2020–2022 period, several intense dust intrusions from northern Africa affected Europe. The frequency of dust events was exceptional, considering that wintertime is the season with minimum dust activity in the Mediterranean, and some episodes displayed a duration and/or intensity never recorded before, affecting large areas of the western Euro-Mediterranean (WEM) region. The main objective of this work is to construct a catalogue of FM dust events over the WEM for the 2003–2022 period based on satellite aerosol retrievals and to analyse their atmospheric drivers at the synoptic and large scales, paying special attention to the recent 2020–2022 period of high dust activity. Overall, our results indicate large intraseasonal and interannual variability in the occurrence of wintertime dust events over the WEM. Dust events of FM 2020–2022 were characterized by enhanced dust concentration and high maximum altitudes in comparison with those of previous years (2003–2019). WEM dust events are associated with enhanced activity of high-pressure systems over the Euro-Atlantic sector, which favour the obstruction of the westerlies and the occurrence of cut-off lows at subtropical latitudes. However, these high-pressure systems can exhibit a large variety of configurations, including meridional dipole blocking patterns with poleward shifted jets or Mediterranean subtropical ridges with an intensified mid-latitude jet. The former is the dominant favourable pattern for WEM dust occurrence, but the latter was relatively common during the 2020–2022 period.
- Article
(5043 KB) - Full-text XML
-
Supplement
(6412 KB) - BibTeX
- EndNote


Mineral dust, when one considers its extinction, is the most abundant type of atmospheric aerosol found over the ocean and continents, representing about 75 % of the global aerosols present in the atmosphere (Kinne et al., 2006; Wu et al., 2020). Dust affects the climate system by interacting with longwave and shortwave radiation and by contributing to the formation of cloud condensation nuclei and ice-nucleating particles (e.g. Szopa et al., 2021). Recent studies revealed that the magnitude of radiative forcing due to mineral dust is small (Kok et al., 2017; Ryder et al., 2018) because dust particles seem to be larger than previously thought (Kok et al., 2017; Szopa et al., 2021). This new finding, along with the fact that global models underestimate the amount of coarse dust in the atmosphere (Adebiyi and Kok, 2020), raises the possibility that dust emissions may even be warming the climate system (Szopa et al., 2021). Primary emissions of mineral dust from deserts are the most important contributor to the aerosol budget in the Middle East, Eurasia, and Africa, accounting for 40 %–70 % of the annual average atmospheric concentrations (Szopa et al., 2021). In large regions of the Earth, mineral dust exerts a great impact on ecosystems (Middleton and Kappelle, 2020), human health (Aghababaeian et al., 2021; Kinni et al., 2021), and other socio-economic sectors such as energy and transportation (Cuevas et al., 2021; ESCAP/APDIM, 2021; Monteiro et al., 2022).
The Sahara and surrounding regions contribute to more than half of global dust emissions (Kok et al., 2021). Dust mobilization and transport in northern Africa show high variability at different timescales: diurnal (Knippertz, 2008; Cuesta et al., 2009; Fiedler et al., 2014), intraseasonal (Ashpole and Washington, 2013; Cuevas et al., 2017), seasonal (Barnaba and Gobbi, 2004; Israelevich et al., 2012), interannual (Rodríguez et al., 2015; Tegen et al., 2013; Wagner et al., 2016), and multidecadal (Wang et al., 2015). African dust can travel around the globe to parts of Europe, South America, Central America, the Caribbean, and the United States (e.g. Shepherd et al., 2016). Mineral dust mobilized in the Sahara and northern Africa often reaches the Mediterranean Basin and the Canary Islands (Moulin et al., 1998; Basart et al., 2009; Varga et al., 2014; Gkikas et al., 2015; Cuevas et al., 2021; Monteiro et al., 2022), affecting air quality and causing exceedances of the thresholds established by the World Health Organization (WHO) air quality guidelines (WHO, 2021). Specifically in southern European countries, African dust intrusions cause the exceedance of the European Union Ambient Air Quality Directive (Kuula et al., 2022) for particulate matter (PM) (Gerasopoulos et al., 2006; Escudero et al., 2007; Querol et al., 2009; Basart et al., 2012; Pey et al., 2013; Marconi et al., 2014). Furthermore, extreme dust events in Europe lead to large impacts on socio-economic activities, such as energy and transportation, with associated economic losses (e.g. Monteiro et al., 2022). Finally, Saharan dust deposition fertilizes the Mediterranean Sea by triggering marine phytoplankton growth but also harmful cyanobacterial blooms (e.g. Guerzoni et al., 1999; Gallisai et al., 2014; Lagaria et al., 2017).
The challenge of mitigating the impacts of sand and dust storms is recognized globally. United Nations (UN) agencies are promoting measures to confront the problem and their inclusion in national policies through the UN Coalition on Combating Sand and Dust Storms (SDSs: sand and dust storms) (Pitkanen-Brunnsberg, 2019). Aligned with the UN Coalition's objectives, the World Meteorological Organization (WMO) Sand and Dust Storm Warning Advisory and Assessment System (SDS-WAS; WMO, 2015) aims to enhance the ability of countries to deliver timely and good-quality SDS forecasts, observations, and knowledge to users through an international hub of research and operational communities (Terradellas et al., 2015; Basart et al., 2019). Monitoring and forecasting are pillars for the deployment of early warning systems, which are the most effective tools to mitigate the impacts of natural hazards such as SDSs.
Winters from 2020 to 2022 were characterized by an unusually high frequency of intense and long-lasting dust events over the western Mediterranean impacting the Euro-Atlantic region, which merited preliminary and widely disseminated analyses by international institutions such as the WMO, Copernicus, and the European Organisation for the Exploitation of Meteorological Satellites (EUMETSAT). These institutions described some of these dust events (see Table S1 in the Supplement) as “unusual”, “historic”, or “exceptional”. In February 2020, two strong Saharan dust events affected the Canary Islands. The first one, on 4–5 February 2020, registered a daily peak of 1000 µg m−3 over the Canary Islands and reached Iceland and Scandinavia (WMO, 2021). The second event, on 22–24 February 2020, stands as the most intense dust event since records began in the Canary Islands (WMO, 2021; Cuevas et al., 2021). This dust intrusion produced extremely high hourly concentrations of PM with diameters below 10 µm (PM10) in the Canary Islands which exceeded 3000 µg m−3 and significantly impacted aviation (closure of eight regional airports and cancellation of ∼1000 flights), agriculture, and solar energy (Cuevas et al., 2021). This dust event also affected the western half of the Iberian Peninsula. On 18 February 2021, a dust intrusion from the Sahara swept across much of southern and central Europe, turning the snow-covered mountains of the Pyrenees and the Alps orange because of dust deposition. The exceptional Saharan dust transport to Europe during this episode was associated with atmospheric rivers (Francis et al., 2022), carrying dust away as far as Scandinavia at the end of the month. On 15–17 March 2022, a plume of Saharan dust travelled from northern Africa and across the Mediterranean into western Europe, reaching the United Kingdom (WMO, 2023a). The dust intrusion caused record PM10 concentrations over the Spanish air quality network and red- and orange-coloured skies and dust deposition on the ground across Europe, especially visible on snow in the Pyrenees and the Alps. The media disseminated shocking images of the dramatic reduction in visibility in southern European cities and of people skiing on reddish-coloured snow in the Pyrenees and the Alps. These dust events caused great social alarm, being sometimes associated with ongoing climate change.
The most frequent time of the year for Saharan dust transport to the Mediterranean Basin varies strongly from one region to another. Overall, we can identify three large regions (Moulin et al., 1998; Basart et al., 2009; Pey et al., 2013; Varga et al., 2014; Gkikas et al., 2013): eastern, central, and western Mediterranean. In the eastern Mediterranean, dust intrusions typically occur in spring (Israelevich et al., 2012), while in the western Mediterranean the maximum Saharan dust transport occurs later, in summer (Salvador et al., 2014). The central Mediterranean shows a bimodal distribution with two secondary dust peaks in spring and summer, respectively (Barnaba and Gobbi, 2004; Marconi et al., 2014).
Thunderstorms and cyclones can produce high-speed winds that lift the dust and transport it thousands of miles away through the air. Fiedler et al. (2014) reported that cyclones are related to up to 20 % of the total dust events over the Mediterranean, although this contribution may increase during extreme dust events. Dust-related cyclones are more frequent in spring and summer (see Moulin et al., 1998; Varga et al., 2014; Gkikas et al., 2016), coinciding with the maximum of dust activity in the Mediterranean. As for winter, cyclones on the leeward side of the Atlas Mountains, also known as “Sharav cyclones” (Winstanley, 1972) and more recently as northern African cyclones or Saharan cyclones, have been associated with SDSs (Flaounas et al., 2022, and references herein). However, the release of dust from the western Sahara, which is the primary source of dust events reaching the western Mediterranean (e.g. Gkikas et al., 2016), takes place at a considerable distance from recognized cyclogenesis areas. This implies that the transport of dust may be more closely linked to intense North Atlantic cyclones (Flaounas et al., 2022) or upper-level cut-off lows in the western Mediterranean (Portmann et al., 2021).
Both North Atlantic cyclones and western Mediterranean cut-off lows have been linked to large-scale atmospheric blocking (e.g. Trigo et al., 2004; Nieto et al., 2007). Blocking is a quasi-stationary, equivalent-barotropic, high-pressure system that can persist for several days or even weeks (Woollings et al., 2018; Kautz et al., 2022; and references herein). Atmospheric blocking interrupts the westerly flow in mid-latitudes and diverts the eastward path of synoptic cyclones (Rex, 1950). The region with the highest frequency of winter blocking is the eastern North Atlantic (Barriopedro et al., 2006; Wazneh et al., 2021; and references herein). In this region, blocking induces an equatorward displacement of the storm track towards the Mediterranean Basin and northern Africa region (Pfahl, 2014; Kautz et al., 2022). The meridional circulation and wavy jet induced by blocks can also result in deep troughs and cut-off lows upstream, downstream, or in the equatorial flank of the block (Barriopedro et al., 2006; Nieto et al., 2007). This favourable large-scale environment for the development of cyclones and cut-off lows suggests an active role of blocking in the occurrence of dust intrusions in the western Mediterranean.
Winter dust intrusions over the western Mediterranean have received little attention, and existing studies on the associated atmospheric circulation have mainly focused on synoptic systems during individual case studies. For example, deep North Atlantic cyclones entering the western Mediterranean through northern Morocco and Algeria were associated with an extreme dust intrusion in February 2017 over western Europe (Fernández et al., 2019; Oduber et al., 2019), whereas Bou Karam et al. (2009) described a strong cyclogenesis over the southern side of the Atlas Mountains during the African dust intrusion of February 2007 over the western Mediterranean. However, a comprehensive climatological study of winter dust intrusions over the western Mediterranean, including the associated large-scale and synoptic atmospheric conditions, is still lacking. This might be a result of (1) a relatively low frequency of occurrence of cyclone-related dust events in this region and season compared with those in spring and summer; (2) hampered assessment of the dust emission and transport in winter and spring due to cyclone-induced clouds (Schepanski et al., 2009); (3) less dust mobilization as a result of greater soil moisture during the winter season in northern Africa (Gherboudj et al., 2015); and (4) the high wind speed thresholds needed to generate dust in winter, which would require severe weather systems, such as deep upper-level troughs or cut-offs (Cowie et al., 2014). All this leads to poor knowledge of the drivers of dust transport to Europe in wintertime.
The main goal of the present study is 2-fold. Firstly, it aims to describe the winter anomaly of dust events that affected the Euro-Atlantic region (from now on the western Euro-Mediterranean region, WEM, for brevity) during the 2020–2022 period and to assess to what extent they were exceptional compared to those recorded in the previous period of 2003–2019 (see Fig. S1 in the Supplement). Secondly, it aims to characterize the atmospheric circulation systems associated with these winter dust events, emphasizing the role of large-scale weather patterns and blocking, which have been largely unexplored so far.
The paper is structured as follows. Section 2 describes the datasets and methods used to generate the results. Section 3 analyses the results of the dust-related datasets focusing on the identification of winter dust events over the WEM for the 2003–2022 period, the associated meteorological systems, and the comparison of the recent anomalous period of 2020–2022 with 2003–2019. Section 4 discusses the main results and identifies the issues that need further investigation. Finally, the main conclusions are presented in Sect. 5.
2.1 Catalogue and characterization of dust events over the western Euro-Mediterranean
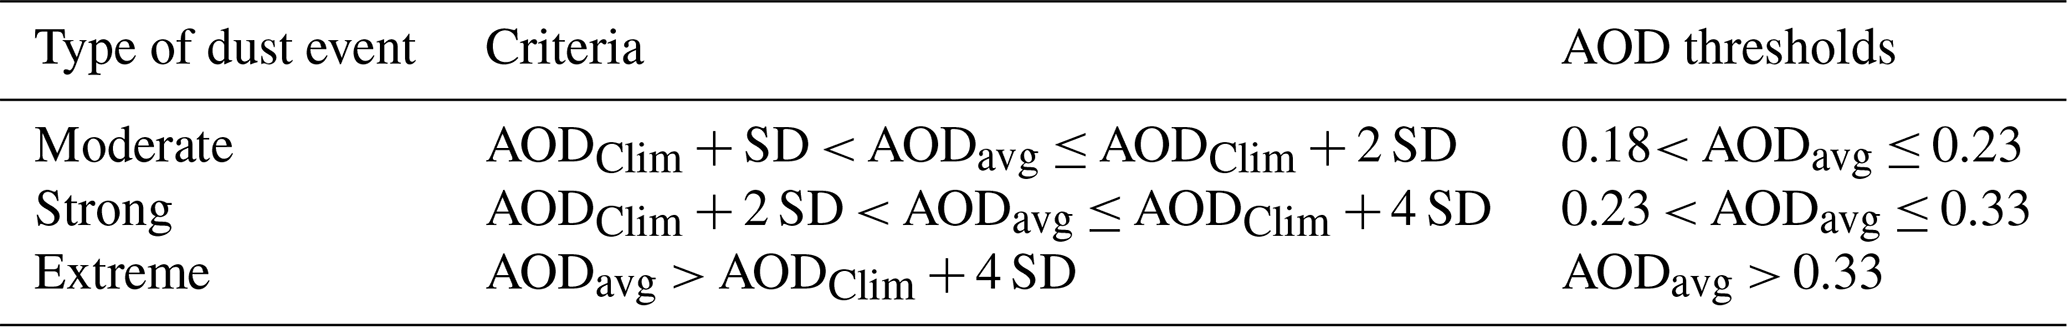
The identification and characterization of dust events rely on satellite-based aerosol products. We have used aerosol optical depth (AOD) at 550 nm from the Moderate Resolution Imaging Spectroradiometer (MODIS; Kaufman et al., 1997) daily aerosol joint product (Collection 6.1), specifically, the combined land and ocean product (Sayer et al., 2013) from the Aqua satellite available between 2003 and 2022 with a 1°×1° spatial horizontal resolution. For the assessment of the meridional transport of dust, monthly mean AOD values have been computed for each month of the extended winters (from December to March) of 2003–2022 and over a large domain (27–60° N, 30° W–36° E), which encompasses northern Africa, the Mediterranean Basin, Europe, and the eastern North Atlantic. The identification of winter dust events in the WEM, defined as 35–50° N, 20° W–5° E, is based on the daily AOD value averaged over the WEM (AODavg) and considers three categories (moderate, strong, and extreme events), following the thresholds proposed by Gkikas et al. (2016).
For an event to occur, these conditions must persist for at least 3 consecutive days (Table 1). For example, a moderate dust event occurs when the daily AODavg is higher than the climatological mean (AODClim) plus 1 standard deviation (SD), the two latter being defined from all daily AODavg values of the winter months (January to March) of the 2003–2022 period. This yields a threshold of 0.18 for AODavg, which must be exceeded for at least 3 consecutive days. Similar values (AOD > 0.15) have also been associated with dust conditions in previous studies (Dubovic et al., 2002; Basart et al., 2009).
Table 1Aerosol optical depth (AOD) thresholds used to identify and classify the intensity of dust events. The imposed criteria must be satisfied for at least 3 consecutive days.
A drawback of the MODIS dataset might be the presence of clouds within some atmospheric systems. This could be particularly inconvenient in winter, when the strongest cyclones are expected over the Mediterranean Sea. However, we have verified that our MODIS-based approach, already used in previous studies (e.g. Moulin et al., 1998; Barnaba and Gobbi, 2004; Gkikas et al., 2016), is robust and reliable. Following Gkikas et al. (2016), we have also compared the MODIS AODavg with ground-based observations from the Aerosol Robotic Network (AERONET) (Giles et al., 2019; see details in Sect. S2.1). In the comparison with five European stations (see Fig. S2), the correlation for dust days of the January–March period of 2003–2022 is in the 0.41–0.67 range (see Table S2).
We have also used dust profiles based on the vertical feature mask (VFM) aerosol product obtained from the National Aeronautics and Space Administration (NASA) Cloud–Aerosol Lidar and Infrared Pathfinder Satellite Observations (CALIPSO; Stephens et al., 2002; Winker et al., 2009), which is an active sensor measuring the backscatter signal at 532 and 1064 nm and the polarization at 532 nm (Winker et al., 2009). The identification of cloud and aerosol layers within the atmosphere (Vaughan et al., 2009) is made through the cloud–aerosol discrimination algorithm (Liu et al., 2009; Kim et al., 2018). The VFM product aerosol subtyping algorithm distinguishes between tropospheric and stratospheric aerosols. It considers seven primary aerosol types: clean marine, dust, polluted continental, clean continental, polluted dust, smoke, and dusty marine (Liu et al., 2019). Here, we use the available CALIPSO Lidar Level 2 VFM product from NASA's Atmospheric Science Data Center (https://asdc.larc.nasa.gov/project/CALIPSO, last access: 15 June 2023), which includes Version 4.2 (2007–2021) and Version 3.1 (for year 2022). Please note that this CALIPSO dataset is the available product at the time the results were processed. Despite the use of two different processing algorithms, the comparison between the two versions shows dust typing remains consistent (https://www-calipso.larc.nasa.gov/resources/calipso_users_guide/qs/cal_lid_l2_all_v4-20.php, last access: 15 September 2023).
The aerosol profile products are generated at a horizontal resolution of 5 km, and the vertical resolution varies from 60 to 180 m depending on the altitude range and the parameter. For the present analysis, the VFM aerosol profile from 2007 to 2022 has been reduced to seven vertical ranges, namely [0–1 km), [1–2 km), [2–4 km), [4–6 km), [6–8 km), [8–10 km), and [>10 km).
2.2 Atmospheric circulation
To analyse the atmospheric circulation patterns associated with winter dust events over the WEM we used data from the National Centers for Environmental Prediction/National Center for Atmospheric Research (NCEP/NCAR) Reanalysis (Kalnay et al., 1996). The NCEP/NCAR Reanalysis is one of the state-of-the-art atmospheric reanalysis systems, providing consistent information from 1948 to present. For this study, 6-hourly and daily mean fields at different pressure levels and 2.5°×2.5° spatial resolution for the 1991–2022 period have been used to characterize the large-scale atmospheric conditions associated with the dust events identified in Sect. 2.1. Following international benchmark standards to assess changes in the meteorological conditions (WMO, 2007), we use 1991–2020 as the climatological normal period of analysis and the baseline to compute the anomalies of the meteorological fields. Although this reference period is not entirely covered by the MODIS observations employed for the characterization of dust events (Sect. 2.1), the results of the atmospheric circulation analyses are robust to the study period (e.g. the 2003–2022 dust period) and the atmospheric reanalysis employed.
For the analysis of the atmospheric circulation, we employed several tools and algorithms, which allowed us to classify the atmospheric configurations associated with dust events, diagnose specific weather systems and circulation components (e.g. blocking and the jet stream), and establish linkages between these atmospheric circulation patterns and dust intrusions. Firstly, we carried out a characterization of the synoptic patterns associated with dust events in order to discriminate different flow configurations leading to dust events. The analysis of favourable patterns for dust intrusions is based on the k-means clustering algorithm (e.g. Wilks, 2011), which partitions data into a predefined number of groups, so that the inter-cluster and intra-cluster Euclidean distances are maximized and minimized, respectively. To obtain the typical patterns associated with dust events we have followed the methodology of Alonso-Pérez et al. (2011). The clustering has been applied to the daily anomalies of geopotential height at 500 hPa (Z500) of all dust days of the wintertime catalogue over the Euro-Atlantic sector (20–70° N, 65° W–25° E) and for the periods 2003–2019 and 2020–2022 separately. The selected number of clusters was limited to two, considering the relatively low number of dust days, particularly for the recent period of 2020–2022. The method assigns each dust day to one of the two clusters, allowing us to explore the two main Z500 patterns associated with WEM dust intrusions.
Secondly, we explored if dust events tend to occur preferentially under specific recurrent patterns of the Euro-Atlantic sector. To categorize the large-scale atmospheric circulation in a limited number of recurrent weather regimes (WRs) we have followed Grams et al. (2017), who use an extended year-round classification of the Euro-Atlantic atmospheric circulation in seven WRs. These WRs are derived from a k-means clustering in the phase space spanned by the seven leading empirical orthogonal functions of 10 d low-pass filtered fields, with denoting the normalized Z500 anomaly over the Euro-Atlantic sector. Following Michel and Rivière (2011), for each day and WR we compute a WR index as the spatial projection of the daily unfiltered onto the cluster centroid (i.e. the mean for all days in the cluster). The resulting indices are normalized (0 mean and 1 SD). A day is assigned to a given WR if the respective index is greater than 1 and higher than that of all other WRs. The seven WRs are defined as follows: the zonal regime (ZO) and its variant Atlantic trough (AT); the Scandinavian trough (ScTr) and Atlantic ridge (AR); and the blocking types, which include European blocking (EuBL), Scandinavian blocking (ScBL), and Greenland blocking (GL). For further information on WR characteristics see Beerli and Grams (2019).
Finally, we analysed the occurrence of specific large-scale phenomena during dust days, including the North Atlantic jet stream and blocking events. The localization of the North Atlantic eddy-driven jet stream and blocking patterns is performed on a daily basis, following the detection algorithms of Barriopedro et al. (2023) and Woollings et al. (2018), respectively. The retrieved fields (daily maps of binary fields) allow us to quantify the local frequency of jet and blocking occurrences during a given time interval or subsample of days. They are herein used to identify the favourable conditions (jet configurations and blocking activity) for the occurrence of dust events during the period of 2003–2019 and the recent period of 2020–2022. We note that the jet stream is detected every day of the analysed period, whereas blocking may or not be present on a given day. Therefore, the blocking catalogue is also employed to distinguish dust days with and without blocking, which allows us to assess the importance of blocking on dust.
The jet stream is diagnosed from 10 d low-pass filtered fields of the 925–700 hPa averaged zonal wind (see more details in Barriopedro et al., 2023). The latitudinal position of the jet is inferred from the daily meridional profile of the zonal wind at each longitude, which has been previously smoothed by averaging the zonal wind over a longitudinal sector of 60° width centred at that longitude. The latitudinal position of the jet is the latitude of the zonal wind maximum in the meridional profile. The poleward and equatorward boundaries of the jet correspond to the latitudes at each side of the jet latitude where the zonal wind maximum decreases by a given amount (defined as half the difference between the zonal wind peak and the meridional mean of the zonal wind over 15–75° N). All latitudes between the poleward and equatorward flanks of the jet identify the jet structure at that longitude. When applied to all longitudes of the Euro-Atlantic sector, the method provides a 2-D daily identification of the North Atlantic jet.
Blocking patterns are identified from Z500 daily fields, following the meridional gradient reversal method described in Woollings et al. (2018). For each day d and longitude λ, meridional Z500 gradients (GHG) are computed to the north and south of a given latitude φ as follows:
where 45° < φ < 70° N and Δ=15° latitude. GHGS is employed to detect flow reversals, whereas GHGN and GHGS2 aim to filter out other aspects unrelated to block. The meridional gradients in Eq. (1) are averaged over in longitude, denoted by the overbars in Eq. (2):
Daily blocking-like structures are identified as spatial clusters of contiguous grid points satisfying the conditions in Eq. (2) and covering a minimum areal extension of 500 000 km2. Finally, the blocked areas detected on consecutive days are required to overlap and persist for at least 5 d to be considered a blocking event.
The results are structured in two sections, which describe the climatological characteristics of wintertime dust events in the WEM, paying special attention to the anomalous dust period of 2020–2022 (Sect. 3.1) and the atmospheric circulation associated with these events (Sect. 3.2).
3.1 Climatological assessment of winter dust events over the WEM
We start assessing the spatial patterns of MODIS monthly mean AOD averaged for the 2020–2022 period in order to find footprints of the strong wintertime Saharan dust intrusions over the Mediterranean Basin and specifically over the WEM at that time. The analysis is performed for each month of the extended winter (December–March) separately and compared with the corresponding maps of the previous period from available MODIS observations (2003–2019) (Fig. 1).
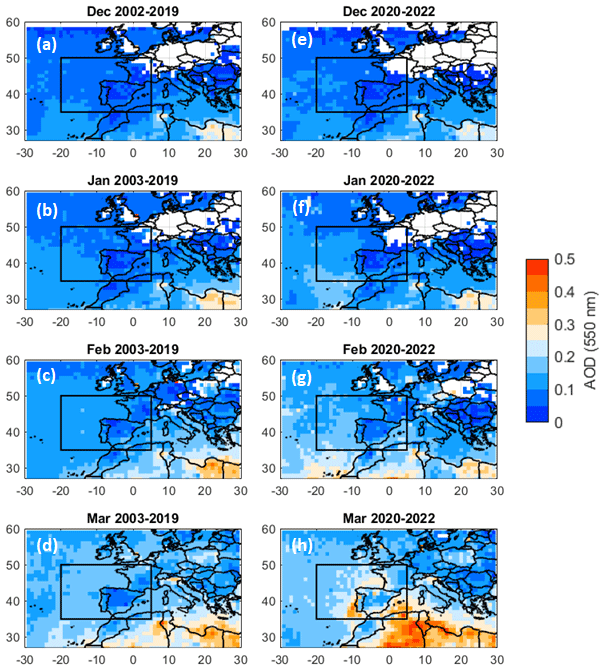
Figure 1MODIS/Aqua AOD at 550 nm monthly averages for (a, e) December, (b, f) January, (c, g) February, and (d, h) March of the 2002–2019 period (a–d) and the 2020–2022 period (e–h). The black box delimits the WEM spatial domain (i.e. 35–50° N, 20° W–5° E).
The climatological assessment (2003–2019 period) shows that wintertime Saharan dust intrusions towards the Mediterranean Basin take place preferentially over the eastern Mediterranean through the coasts of Libya and western Egypt, affecting mainly Greece and southern Italy (Fig. 1a–d). Moreover, dust intrusions increase in intensity and areal extent as winter progresses, reaching a maximum in March (Fig. 1d). However, the impact on AOD over the WEM is very small, which agrees with the results reported in previous studies (e.g. Varga et al., 2014; Gkikas et al., 2015; Gavrouzou et al., 2021). During 2020–2022, no significant changes were found in the AOD patterns of December and January, which showed very low AOD values (Fig. 1e and f), like in the 2003–2019 period. However, in February 2020–2022 the AOD spatial pattern changed drastically: dust transport from the western Sahara occurred through Morocco and Algeria, yielding high AOD values over the WEM (Fig. 1g). Moreover, dust transport through the usual corridors of the eastern Mediterranean almost disappeared, which represents an extraordinary situation. These results suggest an increase in dust transport towards the western Mediterranean in February–March of the 2020–2022 period compared to those recorded in the previous observational (2003–2019) period.
Based on these results, we have selected an appropriate study area (black rectangle in Fig. 1) to detect dust intrusions over the WEM. The southern boundary of the domain has been chosen far enough from northern Africa to avoid the detection of short-range weak dust intrusions associated with mesoscale processes. The northernmost boundary does not extend too far north to get non-negligible mean dust content over the geographical domain. We have analysed the time series (2003–2022) of the monthly mean AOD averaged over the WEM to assess the interannual variability of Saharan dust intrusions for each month of the extended winter (Fig. 2). The historical AOD series of December and January show relatively low values and few interannual variations, which contrasts with the higher and more variable AOD values at interannual scales for February and March. Notably, the February series of AOD displayed anomalously high values in our study region during 3 consecutive years (2020–2022). Similarly, the two highest AOD values of the March series were registered in 2021 and 2022. Although the climatological mean AOD over the WEM increases in spring, the AOD values in March 2020–2022 are larger than in April 2020–2022, indicating that the anomalous character of late winter 2020–2022 did not extend towards the spring.
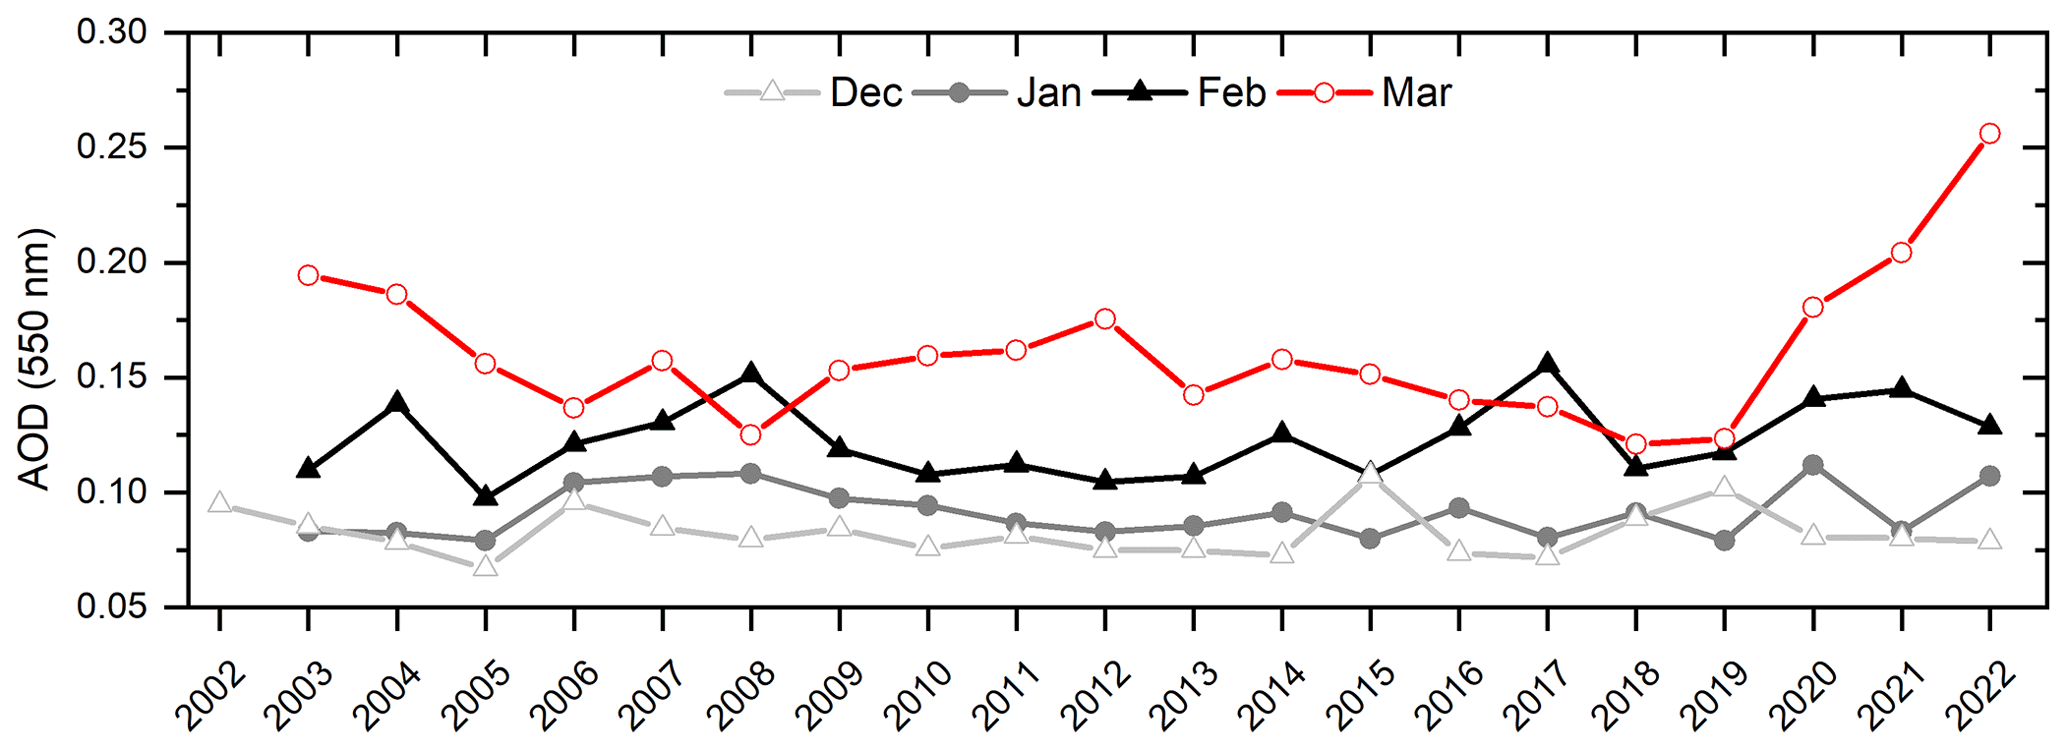
Figure 2Time series of monthly averages of MODIS/Aqua AOD at 550 nm of the extended winter months (i.e. December, January, February, and March) of the 2002–2022 period and for the WEM (black box in Fig. 1).
As the frequency of dust intrusions in the WEM is almost negligible in December and January (Fig. 1a, b, e, and f), from now on the analyses will focus on the months of February and March only. Our choice of wintertime, defined as February–March (FM), is supported by both climatological arguments (higher AOD in late winter than in early winter; Fig. 2) and the degree of extremeness of the 2020–2022 period as compared to the 2003–2019 period (see Sect. S2). Because of the coverage limitations associated with satellite-based products in capturing the daily cycle (i.e. satellite overpasses or cloud contamination), the same dust event analysis is being done using the MERRA-2 global reanalysis (Gelaro et al., 2017) considering the same period (i.e. 2003–2022) and studying the WEM domain. Atmospheric chemistry reanalysis such as MERRA-2 provides representative and complete dust fields in space and time. MERRA-2 confirmed the results obtained by MODIS (Sect. S2.2) showing the exceptional dust in the 2020–2022 period in comparison with 2003–2019 (see Figs. S3 and S4) but also with previous decades (see Figs. S5 and S6).
According to the AOD thresholds specified in Table 1, we have identified a total of 30 dust events (1.5 dust events/year) over the WEM during FM 2003–2022. Recall that dust events lasting less than 3 d or with daily mean AODavg lower than 0.18 are not considered in this study. The main characteristics of the dust events are summarized in the time series of Fig. 3, including the number of dust days and the average AODavg for February and March of each year of the 2003–2022 period. This information is completed with Table 2, which shows the number of dust days and events for each calendar month and analysed period. In February the occurrence of dust events is quite irregular over the analysed period, including a period of 6 consecutive years (2010–2015) without any event (Fig. 3). The intensity of February events tends to be moderate (the only one labelled as extreme occurred in 2017). The 2020–2022 period displayed an outstanding increase in the frequency of February dust intrusions, both in terms of events and days, which were approximately 5 and 3 times higher than those registered in the 2003–2019 period (Table 2). Indeed, 5 out of the 11 dust events recorded in February since 2003 have occurred in the 2020–2022 period, including one strong event (Fig. 3). As expected, March, halfway between late winter and early spring, is the analysed month with the highest frequency of dust events in the WEM. After a quiet period of 4 years (2016–2019), the comparatively shorter 2020–2022 period registered five dust events, including two extreme and two strong episodes. When FM is considered as a whole, the recent 2020–2022 period experienced an outstanding (8-fold increase) in the mean frequency of both dust events and days as compared to 2003–2019.
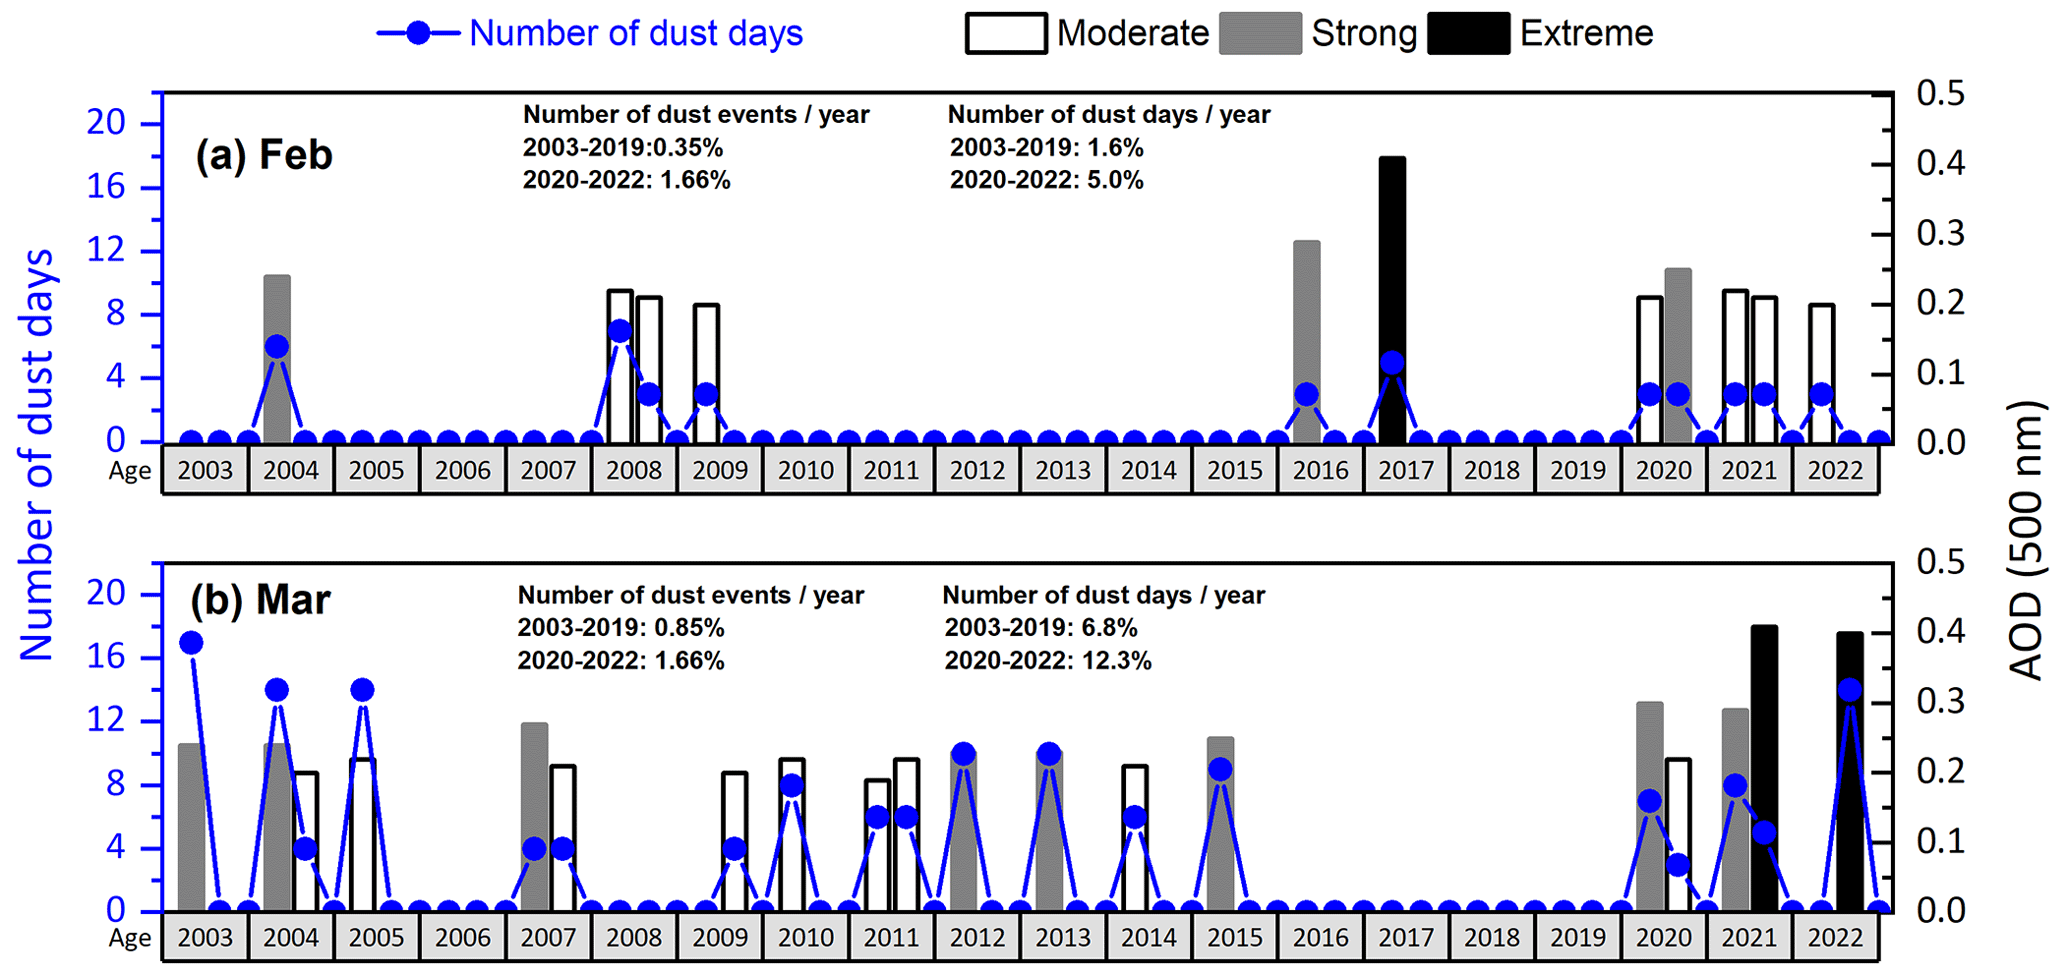
Figure 3Monthly time series (2003–2022) with the number of dust days (blue dots and lines, left y axis) and the AOD at 550 nm averaged over the WEM and for all dust days in the month (bars, right y axis) for (a) February and (b) March. The colour of the bars indicates the type of dust event: moderate (0.18 < AODavg ≤ 0.23) in white, strong (0.23 < AODavg ≤ 0.33) in grey, and extreme (AODavg > 0.33) in black.
Table 2Mean frequency of dust events (number per year) and dust days (days per year) for February and March of the 2003–2019 and 2020–2022 periods.
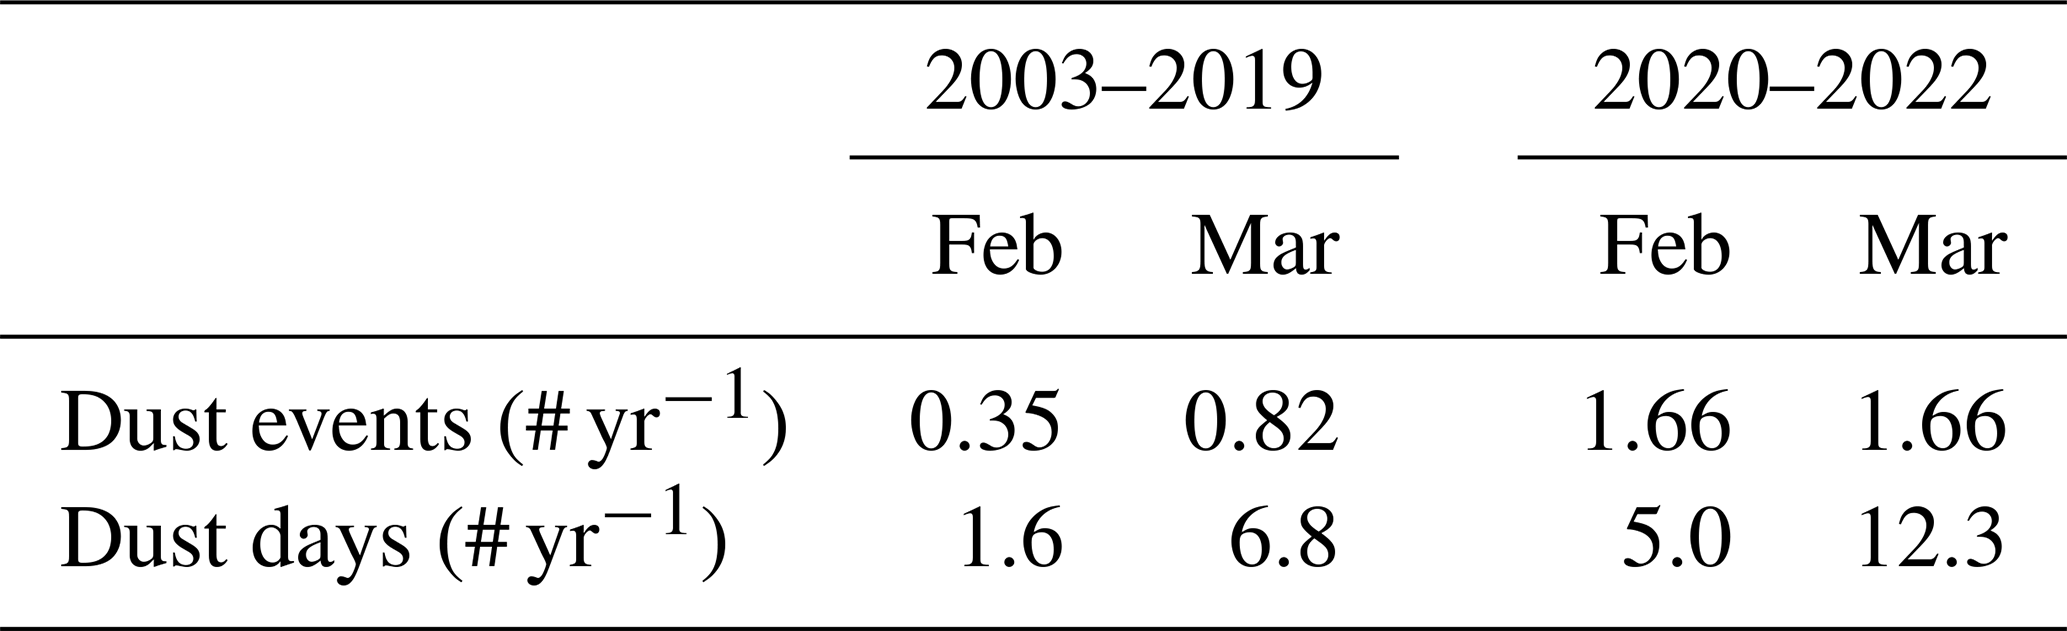
In summary, every February and March of the 2020–2022 period reported dust intrusions, with an average of more than 15 dust days per FM period and at least one strong or extreme event. Overall, the analyses (Fig. 3 and Table 2) confirm that the 2020–2022 period was the most active one in terms of frequency, duration, and intensity of dust events in the WEM since observational records began. Compared to previous years of the 2003–2019 period, many of those dust events were long-lasting (>8 d) and intense (AOD > 0.25). The occurrence of intense dust events over the WEM during 2020–2022 is significantly higher than during the 2003–2019 period (p value of ) as derived from the Wilcoxon rank-sum test. In particular, the 14 d dust event of March 2022, with an AOD mean of 0.4, constitutes a milestone in dust transport from northern Africa to the WEM. This event broke all records in terms of duration, intensity, and areal extent and affected air quality in western and central Europe, with high PM10 values (50–100 µg m−3) (see Fig. S14) even on high mountains such as the Pyrenees and the Alps (see Fig. S15).
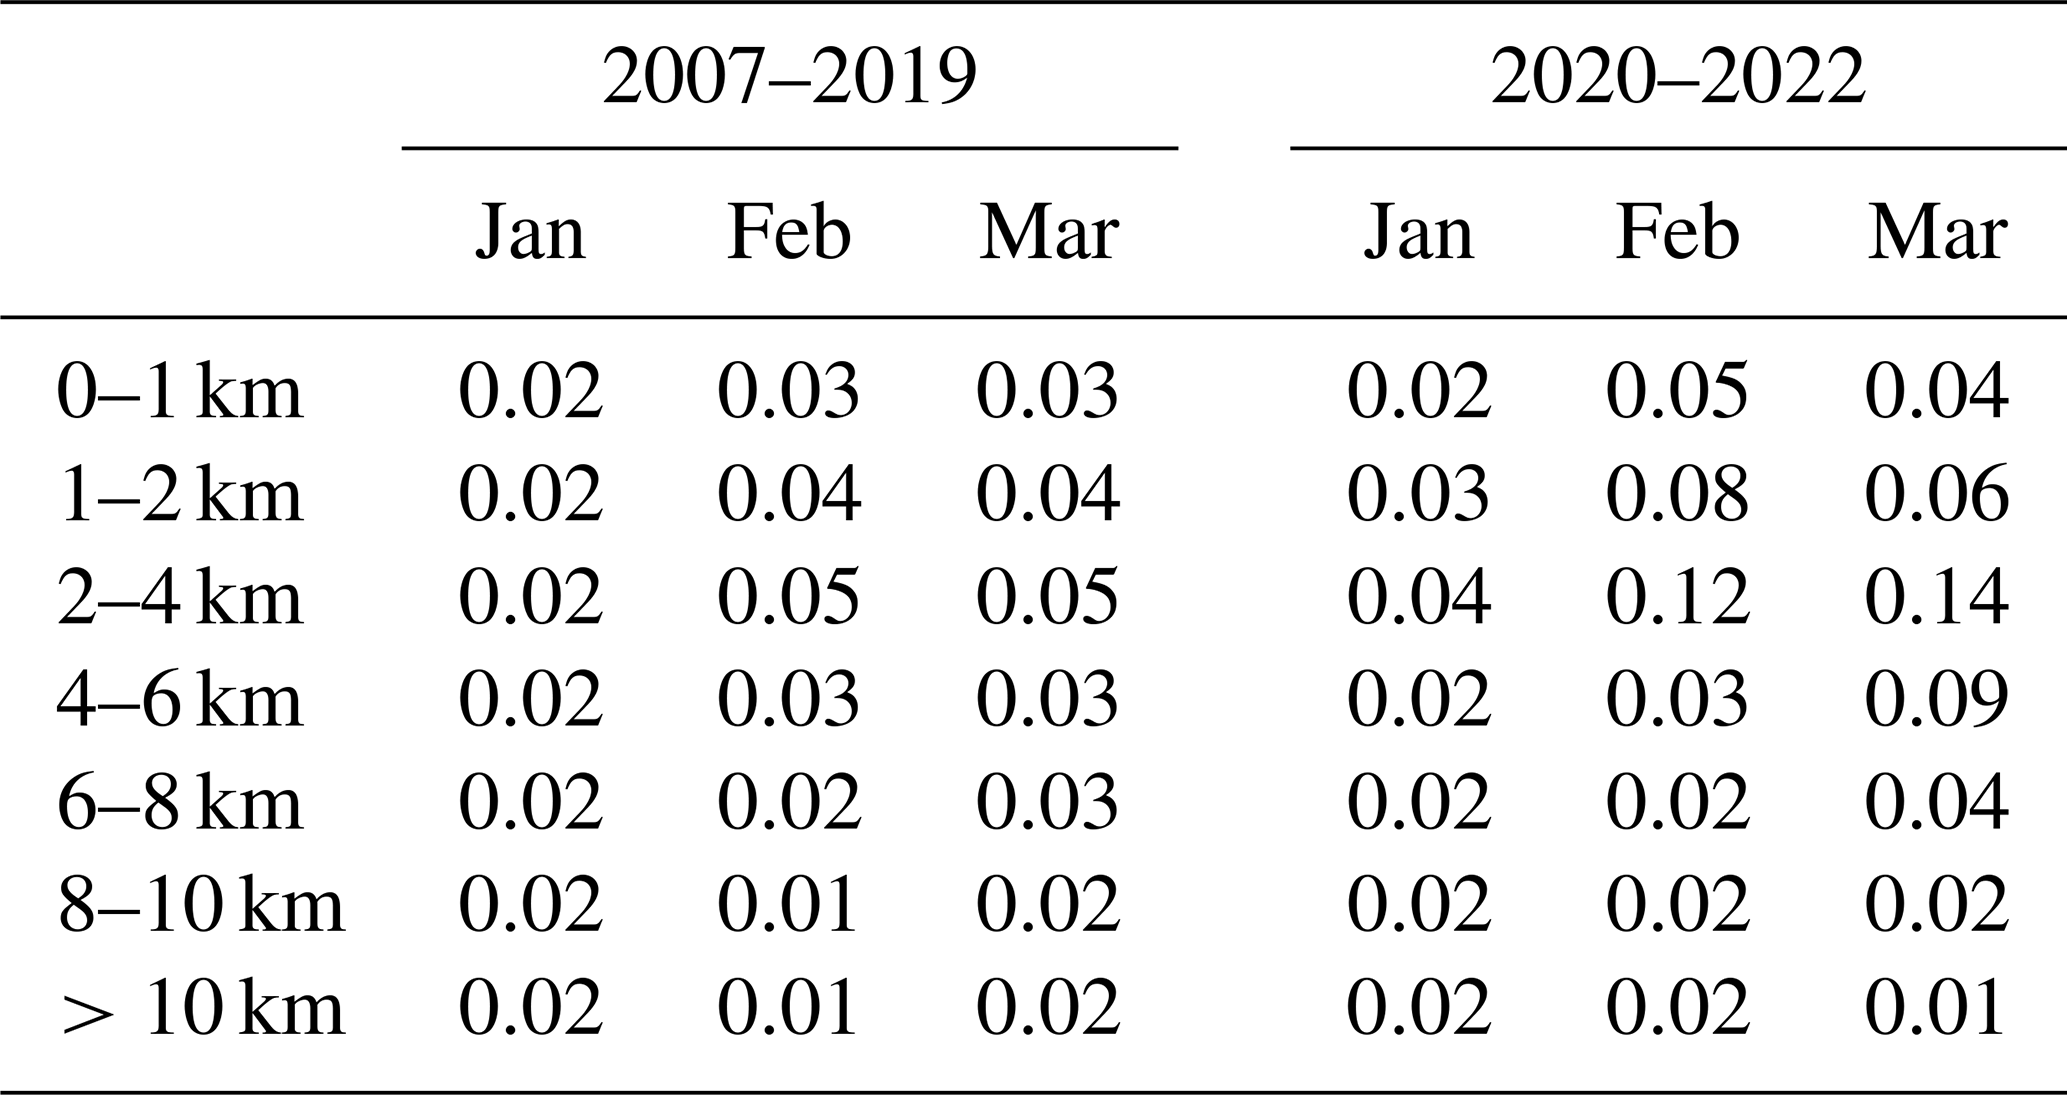
According to the dust climatology of Gkikas et al. (2016), dust layers in the Mediterranean are normally observed between heights of 2 and 6 km during summer, while in winter they are mainly detected below 3 km and over the central and eastern Mediterranean Sea. Here, we have calculated the mean percentage of pure dust in seven tropospheric layers (between 0 and 10 km) of our geographical region based on the aerosol vertical profiles from CALIPSO (see Sect. 2.1), which are available for 2020–2022 and an earlier 2007–2019 period. For the 2007–2019 period, the results show slightly higher percentages of pure dust at higher altitudes (2–4 km) than those reported by Gkikas et al. (2016) (Table 3). The percentages of pure dust increased significantly in FM 2020–2022. In March 2020–2022, a non-negligible percentage of pure mineral dust is detected in an upper layer, between altitudes of 4 and 6 km. These results suggest that the enhanced intensity of dust intrusions during 2020–2022 could have been mediated by atmospheric circulation processes lifting mineral dust from the desert to heights higher than usual. Other factors could have contributed to exacerbate the frequency, duration, and/or intensity of recent dust events. During FM 2021–2022, the severe drought conditions over Europe (Garrido-Pérez et al., 2024) affected the arable areas of northern Morocco and Algeria (see Fig. S7). Indeed, during the winter months of 2022, the monthly mean series of the normalized difference vegetation index (NDVI), which accounts for vegetation cover and activity, recorded some of the lowest values of 2003–2022 over the northernmost strip of the Maghreb (see Fig. S8).
Table 3Mean fraction of pure dust (with respect to the total available aerosol observations) in different vertical layers for the FM dust days of the 2007–2019 and 2020–2022 periods, as inferred from the CALIPSO vertical feature mask (VFM) product.
3.2 Atmospheric drivers of winter dust events over the WEM
This section describes the favourable patterns and preferred WRs for the occurrence of dust events (Sect. 3.2.1), as well as their associated meteorological systems at synoptic and large scales (Sect. 3.2.2). The diversity of atmospheric configurations will be assessed through statistical tools (clusters and WRs) and automatic algorithms tracking specific phenomena (blocking and jet stream), as described in Sect. 2.2. The meteorological systems associated with dust events at synoptic scales (cyclones, cut-off lows, etc.) have been identified qualitatively (by visual inspection), which has also allowed us to confirm the results of the objective analyses.
3.2.1 Dust-related patterns and weather regimes
Figure 4 shows the two most recurrent Z500 anomaly patterns obtained from the k-means clustering of FM dust days for the 2003–2019 and 2020–2022 periods. As explained in Sect. 2.2, we have only retained two clusters, yielding a robust partitioning of the data while still retaining the major features of the dominant patterns associated with dust events. The dominant pattern in both periods (Cluster C#1; Fig. 4a and c) is characterized by a meridional pressure dipole with positive Z500 anomalies between the British Isles and Scandinavia and negative Z500 anomalies to the south. This favourable configuration corresponds to a European Rex-like block (Rex, 1950; Sousa et al., 2021). Comparatively, the second-most-frequent pattern during FM dust days (Cluster C#2; Fig. 4b and d) shows a more zonally oriented dipole but with noticeable differences between the two periods. In the 2003–2019 period, the C#2 pattern (45 % of dust days of that period) featured a pronounced trough over the eastern Atlantic and positive Z500 anomalies over the mid-latitudes of eastern Europe. In the 2020–2022 period, C#2 (30 %) displayed a cut-off low signature in the Z500 anomalous field over the subtropical eastern Atlantic, accompanied by positive Z500 anomalies over the Euro-Mediterranean region.
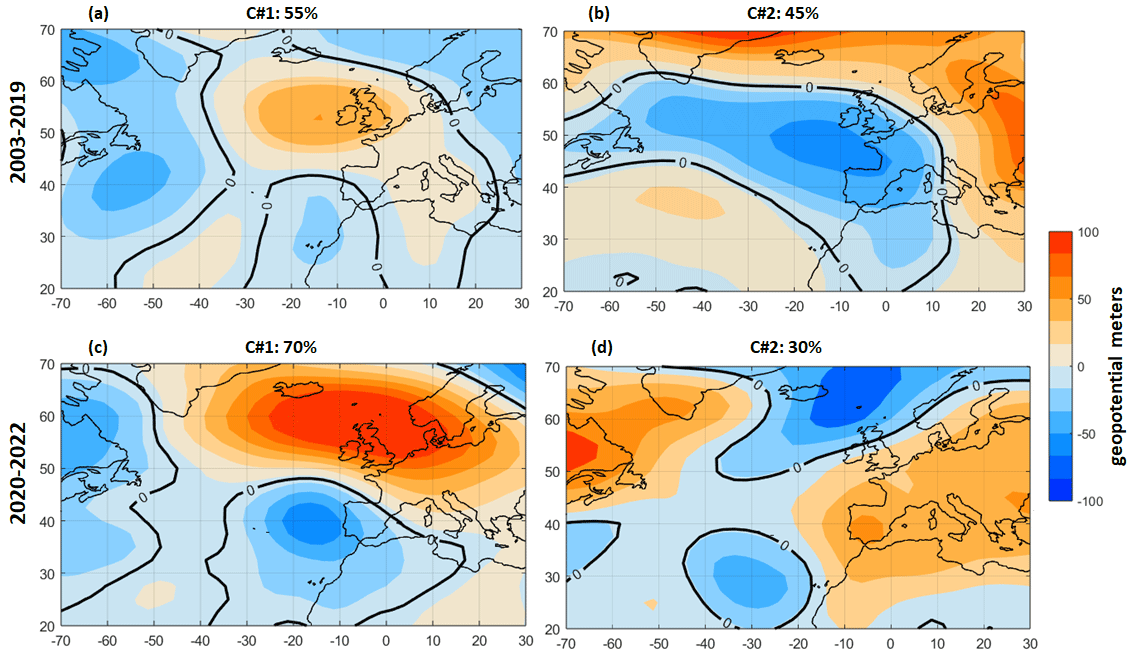
Figure 4Two clusters (C#1 and C#2) of Z500 anomalies (in metres) for the FM dust days of the 2003–2019 (a, b) and the 2020–2022 (c, d) periods. The relative frequency of each cluster (in percent with respect to the total number of dust days of each period) is indicated on the top.
These results show that blocking (C#1) is a recurrent driver of dust intrusions, being present in both periods, albeit with different frequencies of occurrence. There are also differences in the C#2 spatial patterns of the two periods, suggesting that favourable configurations other than high-latitude blocks occurred in the 2020–2022 period. Likewise, the occurrence of cut-off lows was a common signature of dust intrusions during the 2020–2022 period. They were accompanied by either high-latitude blocks over Europe (C#1; Fig. 4c) or high-pressure systems at lower latitudes (C#2; Fig. 4d). There are also signatures of subtropical cut-off lows during dust days of the 2003–2019 period (mainly in C#1; Fig. 4a). Another distinctive signature of the recent 2020–2022 period is the prevalence of positive Z500 anomalies over southwestern Europe, which is absent in the cluster patterns of the 2003–2019 period (see Fig. 4a, b and d). These results suggest that cut-off lows are actively involved in dust intrusions. At larger spatial scales, the enhanced dust activity of the recent 2020–2022 period could partially be explained by a high frequency of favourable configurations, including both recurrent (high-latitude blocking) and uncommon (e.g. subtropical high-pressure systems) dust-related patterns of the 2003–2019 period.
The dust-related configurations identified in Fig. 4 do not necessarily match with the dominant large-scale patterns responsible for the day-to-day variability in the extratropical circulation (WRs). To investigate whether the occurrence of dust days over the WEM is favoured by specific recurrent patterns, we used the WR classification described in Sect. 2.2. Figure 5 shows the frequency–density distribution of the seven WRs for the FM dust days of each period. We note that none of the WRs coincide exactly with the dust-related patterns of Fig. 4, which is reflected in the dispersion of dust days across different WRs. As such, dust intrusions can occur under different WRs, stressing again the multiplicity of large-scale patterns compatible with dust events. In spite of this, a more detailed analysis of WRs and their correspondence with the clusters of Fig. 4 reveals the following results:
-
The WR with a higher probability of occurrence during dust days is the EuBL WR (Fig. 5), which is consistent with the high frequency of occurrence of the C#1 clusters in the two periods (Fig. 4a and c).
-
Several WRs featuring high-pressure systems at subtropical latitudes of the Euro-Mediterranean (e.g. AR and AT) show a small increase in probability of occurrence during dust days of the 2020–2022 period, which is consistent with the distinctive positive Z500 anomalies over the Euro-Mediterranean region of C#2 (Fig. 4d).
-
The frequency of ZO also increased (by a factor of 2) during dust days of the 2020–2022 period with respect to 2003–2019. ZO does not have a direct correspondence with any of the clusters of Fig. 4, but its occurrence is consistent with the presence of European subtropical ridges, which are associated with an intensification of the mid-latitude zonal flow (Sousa et al., 2021). Therefore, the high frequency of ZO in the 2020–2022 period could be interpreted as an increase in subtropical ridges (readily apparent in C#2; Fig. 4d).
Therefore, dust intrusions can occur during WRs featuring high-pressure systems at different latitudes (mainly European blocking, EuBl, and Atlantic ridge, AR), which is consistent with the clustering analysis. The relative influence of blocking and other high-pressure systems is analysed in more detail in the next section.
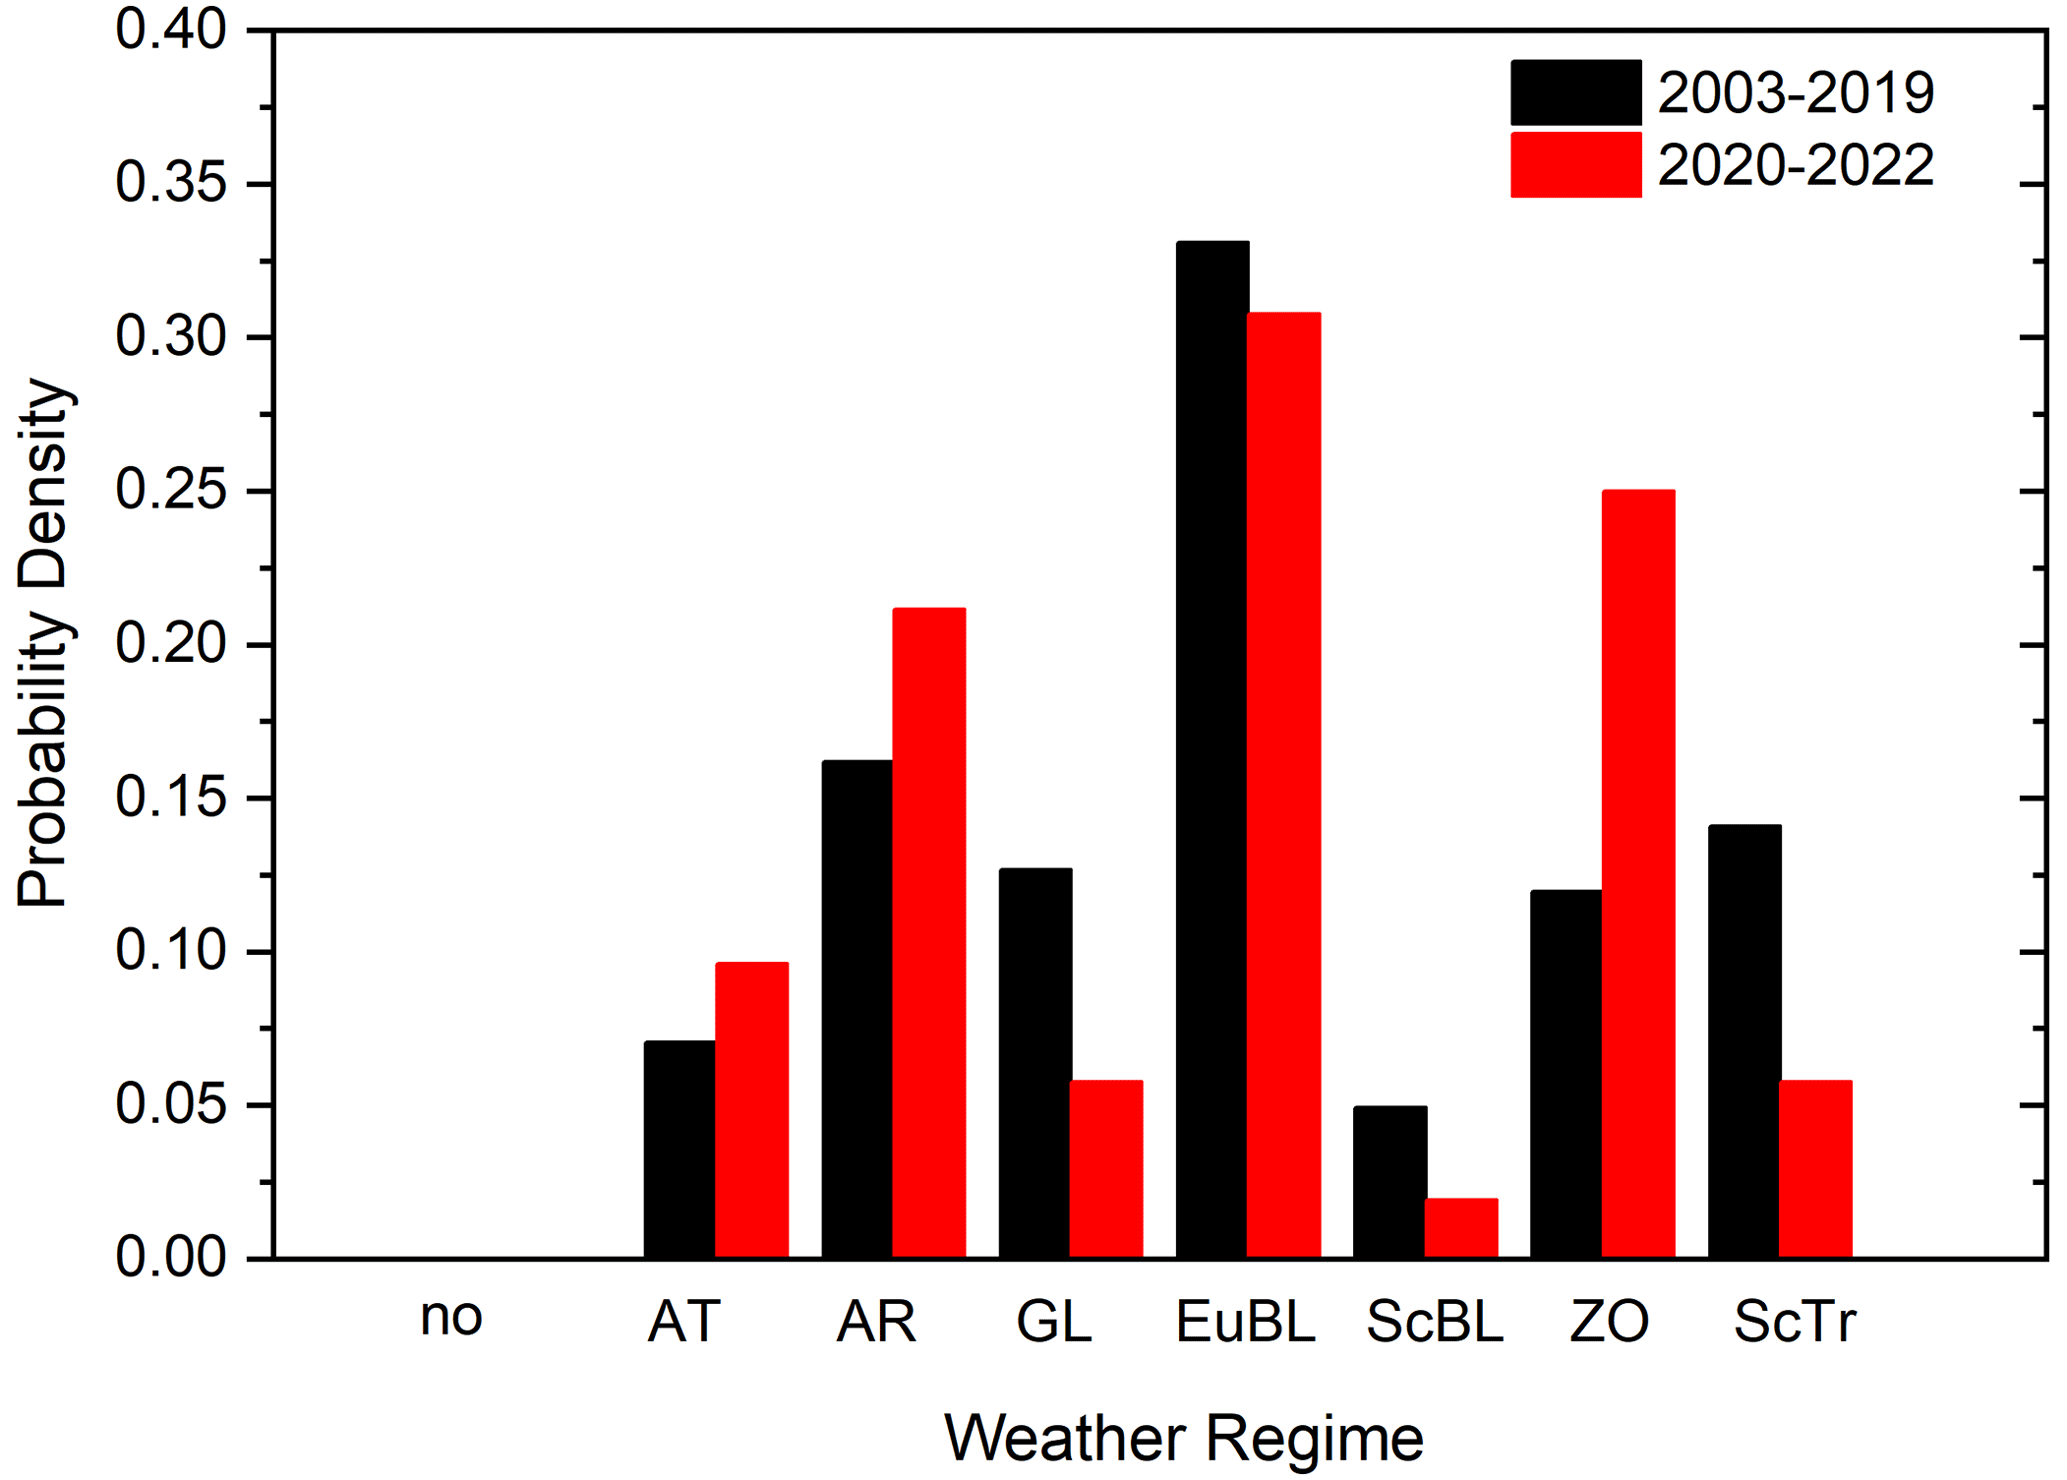
Figure 5Probability of occurrence of weather regimes (WRs) during dust days of 2003–2019 (black bars) and 2020–2022 (red bars). The following acronyms are used. No: no regime; AT: Atlantic trough; AR: Atlantic ridge; GL: Greenland blocking; EuBL: European blocking; ScBL: Scandinavian blocking; ZO: zonal regime; and ScTr: Scandinavian trough.
3.2.2 Meteorological systems
In this section, we analyse the weather systems associated with WEM dust events following the methods described in Sect. 2.2. Firstly, we carried out a preliminary qualitative analysis of the Z fields at different pressure levels (from 925 to 100 hPa) for each day of the 30 dust events of 2003–2022. The results revealed the following common signatures: (1) synoptic systems, characterized by negative Z anomalies (typically m) at all levels from 925 to 200 hPa located in the subtropical region of the eastern North Atlantic or in northwestern Africa, which are identified as cut-off lows; and (2) large-scale systems, characterized by relatively extensive regions of positive Z anomalies (typically >100 m at 500 hPa). The latter can occur under a variety of flow configurations and locations (high-pressure systems from subtropical to high latitudes), as confirmed by Figs. 4 and 5. A substantial number of cases resemble the C#1 patterns (Fig. 4a and e) or EuBL WR, with positive Z anomalies located to the north of a cut-off low, thereby forming a dipole-like block (Rex, 1950; Barriopedro et al., 2010). A second group, like AR, reveals positive Z anomalies at comparatively lower latitudes, which are more characteristic of subtropical ridges (Sousa et al., 2021) or low-latitude blocks (Davini et al., 2012) over the eastern North Atlantic or the western Mediterranean. The next sections describe the synoptic (cut-off lows) and large-scale (high-pressure) systems associated with dust days. We also assess the jet stream, since these weather systems are often associated with substantial departures of the westerlies and the storm track activity (Trigo et al., 2004). The analysis relies on composite anomalies for the 2003–2019 and 2020–2022 period, separately, to emphasize distinctive features of the recent anomalous period.
Section S4 provides a more detailed analysis of the three dust episodes labelled as “extreme” in the 2003-2022 period, which occurred on 20–24 February 2017 (Section S4.1), 27–31 March 2021 (Sect. S4.2), and 15–31 March 2022 (Sect. 4.3). Furthermore, for the three case studies analysed, the geographical location and the activation time of each dust hotspot have also been identified manually (Schepanski et al., 2007, 2009, 2012) by using the 15 min EUMETSAT Dust RGB animations (Met Office, 2022; see time-lapse videos at https://repositorio.aemet.es/handle/20.500.11765/15054, last access: 15 February 2024). Although the results should not be generalized to all dust events, the inspection of case studies confirms that cut-off lows are commonly involved during WEM dust events. Moreover, the three cases featured large-scale, high-pressure systems with different configurations and at different latitudes, ranging from high-latitude blocks to subtropical ridges (Sousa et al., 2021). The synoptic and large-scale patterns favourable for the occurrence of dust events will be addressed in the next sections.
Synoptic scales
For all dust events, the vertical cross-section shows negative Z anomalies between 925 and 200 hPa (not shown). These Z anomalies are in all cases prominent at 200 hPa and weaken towards the surface, consistent with the typical signatures of upper-level cut-off lows (Nieto et al., 2005, and references herein). Indeed, more than half (65 %) of the FM dust events of the 2003–2019 period concurred with a cut-off low. This relationship strengthened during the 2020–2022 period, particularly in March, when all dust events are accompanied by cut-off lows. In a few cases, a near-surface cyclone is initiated during the later phases of the cut-off low. For dust days, cut-off lows are normally located between the Canary Islands and the Iberian Peninsula, activating the dust sources over Morocco and Algeria and transporting dust northwards (see Section S4). Noticeable negative Z anomalies are also found in the lower stratosphere (100 hPa) during at least 50 % of the 2003–2019 cases and all dust events of the 2020–2022 period. Although the negative Z anomalies at the lowest (925 hPa) level are weaker than at higher levels (not shown), they are intense enough to generate surface winds exceeding the wind speed threshold for dust mobilization in the western Sahara, which is between 5 and 12.5 m s−1 (Helgren and Prospero, 1987). This is supported by 6-hourly surface wind data from NCEP/NCAR reanalysis over Morocco, Algeria, the western Sahara, and Mauritania (see Sect. S5).
For some dust events, the centres of these cut-off lows remain stationary over the Atlantic coast of Morocco during ∼3–4 d, mobilizing dust on its eastern flank (see some examples in Fig. S16). However, stationary cut-off lows were relatively uncommon: in most cases, cut-off lows move eastward from the subtropical North Atlantic to the western Mediterranean (see e.g. the cut-off low to the west of the Atlas Mountains during the events of 20–24 February 2017 in Sect. S4.1 and 27–31 March 2021 in Sect. S4.2). The same event can comprise two or more successive cut-off lows. This situation is identified in at least one-third of the 2003–2019 dust events but in almost all March dust events of the 2020–2022 period (see e.g. the sequence of cut-off lows over the coasts of Morocco and Algeria in the 15–31 March 2022 event; Sect. S4.3). The maximum number of cut-off lows in a dust event is four, registered in the historical episode of 15–31 March 2022 (see case #3 in Sect. S4.3). Finally, the cut-off lows detected during dust events tend to be long-lasting, in agreement with the characteristic timescale (∼1 week) of the accompanying high-pressure systems (Barriopedro et al., 2006), which act to weaken the mean zonal flow and slow down the reabsorption of cut-off lows by the westerlies. Apart from this, we do not identify distinctive features of the cut-off lows associated with dust events. Indeed, their characteristics are consistent with those reported in previous climatological studies (e.g. Nieto et al., 2005, 2007): (1) winter cut-off low occurrence is mostly related to blocking events; (2) winter cut-off lows of the European sector tend to occur in northern Africa and southern Europe; and (3) more than 80 % of cut-off lows are highly transient during their life cycle.
Large scale
To assess the influence of large-scale blocking and jet stream configurations, we computed the local frequency of blocking and jet stream occurrence for all FM dust days and compared them with their climatological frequencies (regardless of dust occurrence). Figure 6a and c show blocking and jet frequency exceedances above the climatology during dust days for the 2003–2019 and the 2020–2022 periods. Overall, dust days are associated with enhanced blocking activity over a latitudinal band centred at mid-latitudes (∼50–60° N) and extending from the eastern Atlantic to Scandinavia (Fig. 6a). Therein, the probability of blocking occurrence increases up to ∼12 % (red shading in Fig. 6a), which more than doubles the expected values from the climatology (contours in Fig. 6a). The North Atlantic jet is shifted poleward, with preferred locations over high latitudes and reduced frequencies over typical jet latitudes (Fig. 6c), consistent with the obstruction of the westerlies by the blocking action and its diverting effect on the jet (Trigo et al., 2004; Barriopedro et al., 2010; Sousa et al., 2018). Therefore, European blocking with poleward-shifted jets represent a favourable configuration for dust occurrence.
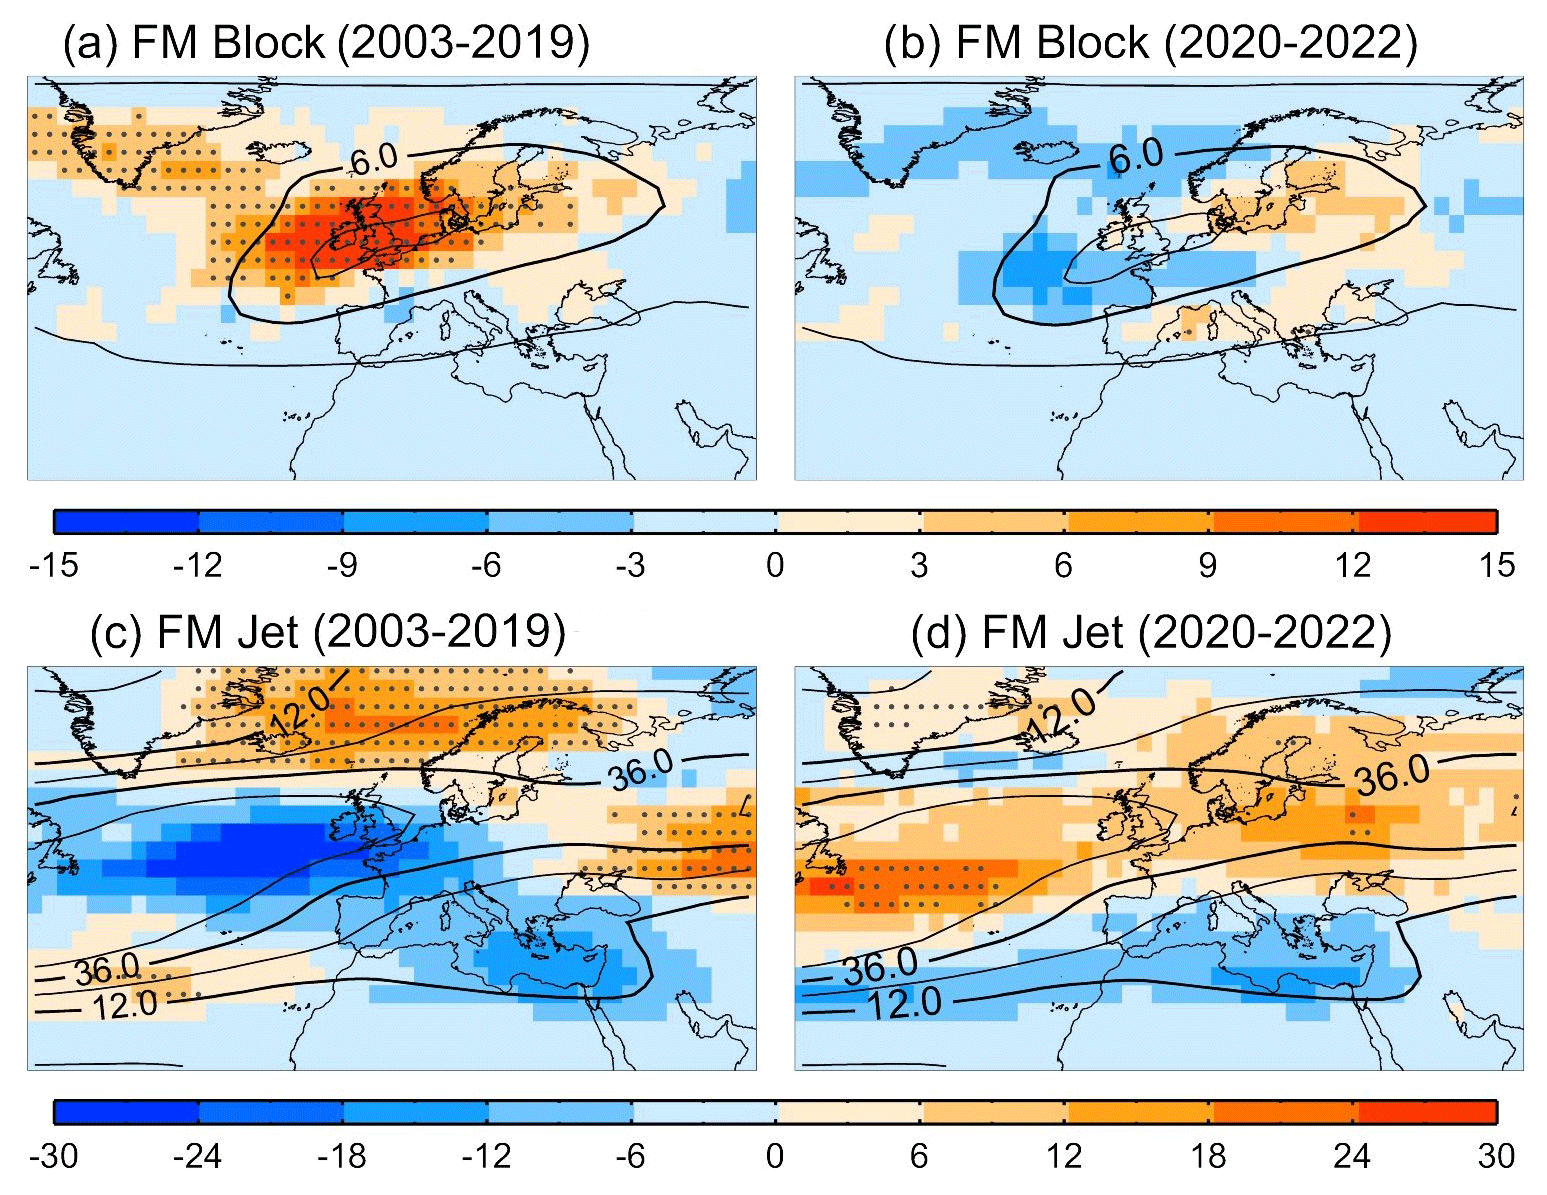
Figure 6Blocking (a, b) and jet stream (c, d) frequency anomaly during dust days (in our study region) in FM of the 2003–2019 (a, c) and 2020–2022 (b, d) periods. Frequencies are expressed in percentage of dust days of the FM period, and anomalies (colour shading) are defined with respect to the expected frequency of occurrence (contours). Dots denote significant positive anomalies at p<0.05 (i.e. grid points where local blocking and jet frequency are significantly higher than expected), as inferred from a 500-trial bootstrap. Significance is assessed with the bootstrapping of 500 members, each one derived from a random choice of FM days of the same size as the number of dust days. The expected frequency of occurrence is defined as the mean of the 500 random members, all with the same sample size as the number of considered days but random dates of occurrence.
Figure 6b and d show the anomalies in blocking and jet frequency for FM 2020–2022. Overall, blocking activity is not significantly higher than the climatology, suggesting that the anomalous frequency of dust days in 2020–2022 cannot be fully explained by a corresponding blocking increase over the favourable region for dust intrusions. However, the lack of statistical significance in the blocking and jet frequency of FM 2020–2022 partially results from contrasting signatures between the corresponding patterns for February and March 2020–2022 (Fig. S17). March 2020–2022 is characterized by poleward jets and enhanced blocking over the climatological region of occurrence, like in Fig. 6a and the canonical pattern associated with dust (cluster C#1 of Fig. 4). In contrast, during February 2020–2022, blocking activity is almost suppressed over central Europe, but it is recurrent at lower latitudes, resulting in a significant increase over the Mediterranean (also apparent in Fig. 4d). A high frequency of low-latitude blocks is commonly associated with subtropical ridges, which can temporarily exhibit meridional gradient reversals (Sousa et al., 2021). These high-pressure, low-latitude structures reinforce the zonal wind at their poleward flanks, favouring a mid-latitude intensification of the jet (consistent with the zonal flow configuration of Fig. 6d) rather than its poleward migration (see e.g. Sousa et al., 2018; Woollings et al., 2018; Barriopedro et al., 2023). The enhanced occurrence of high-pressure systems at subtropical latitudes during the 2020–2022 period is also consistent with the high frequency of R, AT, and ZO WRs (Fig. 5).
These results indicate that dust events can be favoured by high-pressure systems at very different latitudes, ranging from subtropical ridges with mid-latitude jets to high-latitude blocks with poleward-shifted jets. The occurrence of subtropical ridges is particularly enhanced during dust days of FM 2020–2022, weakening the strong block–dust linkage reported over the historical period. To address this question, we quantified the association between blocking and dust days as the percentage of dust days when a block is detected at any latitude of the 25° W–30° E domain. During the 2003–2019 period, more than 65 % of the FM dust days coincide with block, which is significantly higher than that expected by random chance (binomial test, p<0.01). This conditional probability decreases to ∼50 % during FM 2020–2022 (p>0.1). Therefore, although blocking activity was favourable for the anomalously high frequency of FM dust days in 2020–2022, it explains fewer exceedances than those expected from the historical record.
To stress the key role of subtropical (non-blocking) high-pressure systems in driving dust events of the 2020–2022 period, we computed the composites of Z500 anomalies for dust days with and without simultaneous blocking over the 25° W–30° E domain (Fig. 7). The analysis is performed for the 2003–2019 and 2020–2022 periods separately, aiming to uncover the types of weather systems (other than blocking) that contributed to the anomalous frequency of dust intrusions in 2020–2022. As expected, block–dust concurrence during the 2003–2019 period shows the typical configuration of a high–low-pressure dipole, with low pressures to the south of a blocking high that is fully detached from the subtropical belt (Fig. 7a). During the 2020–2022 period, dust-related blocks are located at comparatively more easterly longitudes and displayed higher Z500 anomalies, which extended towards the Mediterranean (Fig. 7b). This equatorial elongation of Z500 anomalies denotes an Omega-like blocking pattern (i.e. without complete detachment of the blocking high; e.g. Barriopedro et al., 2010). The distinctive structure of the 2020–2022 blocked flows becomes clear in Fig. 7c, which shows the Z500 difference between the blocking-like patterns associated with dust days in 2020–2022 and 2003–2019. The pattern is evidenced by an eastern shift and equatorial elongation of 2020–2022 blocking (positive Z500 differences over continental Europe), with a deeper trough upstream of the blocking high (negative Z500 differences over the eastern Atlantic).
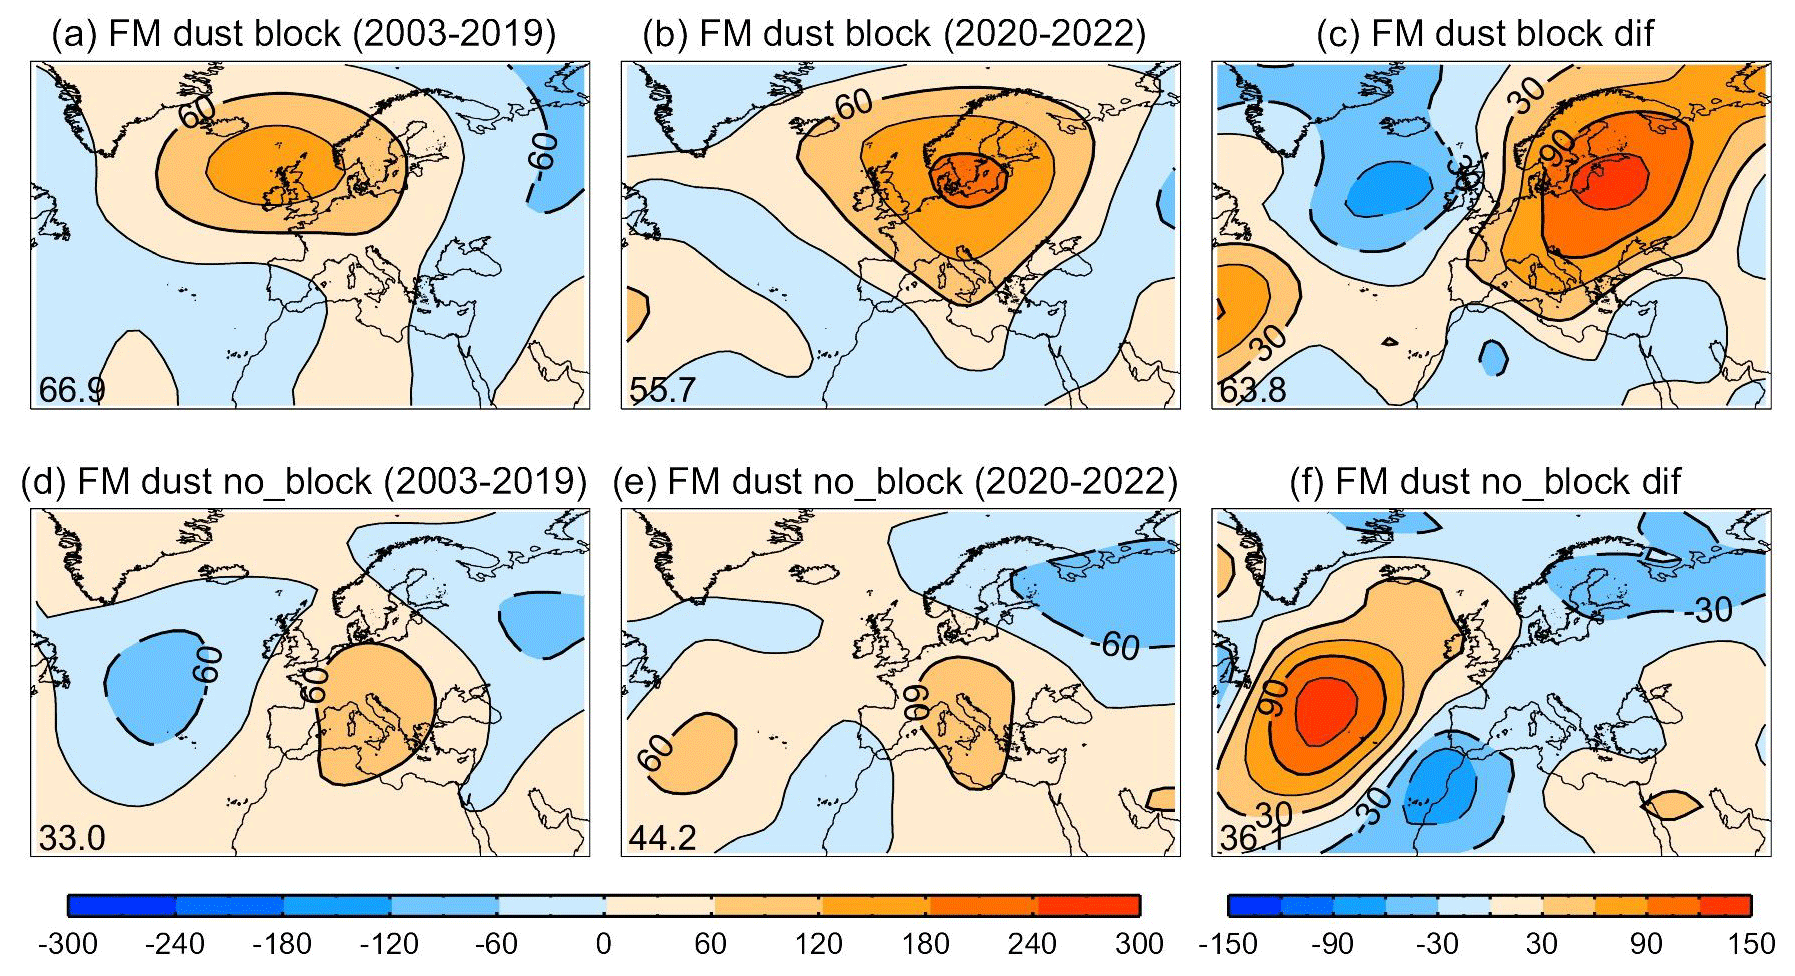
Figure 7Composites of Z500 anomalies (in metres) for dust days of (a, d) the 2003–2019 period, (b, e) the 2020–2022 period, and (c, f) the difference of composites between the 2020–2022 and 2003–2019 periods. Composites for dust days with (a–c) and without blocking (d–f) over the 25° W–30° E domain, respectively.
On the other hand, non-blocking dust days are favoured by positive Z500 anomalies over central Europe and the Mediterranean (Fig. 7d and e). These situations denote high-pressure systems with no meridional reversals of the Z500 gradient (i.e. no block), which is a distinctive feature of pure subtropical ridges (Sousa et al., 2021). This non-blocking pattern is recurrent during 2020–2022 (∼44 % of dust days), and it actually concurs with more dust days than in the historical period, explaining the reduced intervention of blocking. Moreover, the difference between the non-blocking dust day composites of Z500 for 2020–2022 and 2003–2019 indicates an anomalous occurrence or location of cut-off lows over the Canary Islands and northeastern Africa during 2020–2022 (Fig. 7f). The results are consistent with those of the “Synoptic scales” section, which reports an increased percentage of dust events accompanied by cut-off lows during the 2020–2022 period. They also agree with the emergence of a dust-related pattern with positive Z500 anomalies at subtropical latitudes (C#2; Fig. 4d) and the increased frequency of WRs featuring high-pressure signatures over the Mediterranean (Fig. 5). Therefore, while blocking is still the dominant pattern associated with dust days in 2020–2022, an enhanced occurrence of subtropical ridges and cut-off lows at low latitudes also contributes to the outstanding frequency of dust intrusions. Indeed, the high frequency of dust days associated with high-pressure systems at low latitudes (different to blocking) suggests that these systems are particularly relevant for the anomalous frequency of dust events in 2020–2022. Dedicated studies are required to address the causes of the anomalous activity of cut-off lows and associated subtropical ridges in February 2020–2022 and blocking in March 2020–2022.
In this study, we analyse winter dust events over the WEM for the 2003–2022 period, paying special attention to the recent period of exceptional dust activity (FM 2020–2022). This section discusses additional pertinent questions not addressed in the results. For the summer season, Cuevas et al. (2017) found that Saharan dust pulses towards the Mediterranean and the North Atlantic are the result of the coupling between mesoscale dust uplift processes and longitudinal shifts of the Sahara heat low governed by the North African Dipole and Rossby waves. Similarly, winter dust events in the WEM may constitute a good example of atmospheric processes interacting at very different scales: microscale to mesoscale processes, necessary for dust lifting and mobilization (Knippertz and Todd, 2012) from small dust sources located in Morocco and Algeria (Ginoux et al., 2012); synoptic-scale systems such as cut-off lows driving dust transport (Muñoz et al., 2020); and a large-scale environment favouring these synoptic disturbances and the persistence of high AOD values. The latter can occur under a variety of large-scale, high-pressure systems, including European blocking with poleward shifted jets (as in the 2003–2019 period; Fig. 6a and c) or Mediterranean subtropical ridges with an intensified mid-latitude jet (e.g. as in the 2020–2022 period; Fig. 6b and d). Previous studies have reported a strong relationship between the occurrence of cut-off lows and blocking (e.g. Nieto et al., 2007), and our analyses suggest a similar correspondence between cut-off lows and subtropical ridges, particularly strong during the 2020–2022 period. However, it is unclear whether subtropical ridges and cut-off lows represent independent phenomena (and hence their unusually high concurrence in 2020–2022 is by chance) or if they can be dynamically linked, as in the case of blocking and cut-off lows. Additional studies are encouraged to address connections between subtropical ridges and cut-off lows. It is also unclear if the influence of cut-off lows on dust events depends on specific characteristics of the weather system. In this sense, dust-related cut-off lows of the 2020–2022 period are deeper and extended to higher pressure levels than those of the 2003–2019 period. This seems to be in agreement with the enhanced percentage of pure dust in the lower troposphere (0–4 km) and the non-negligible concentration of pure dust in upper layers (4–6 km) recorded during recent dust events.
To the author's knowledge, this work represents the first comprehensive study showing a close relationship between Saharan dust events and different types of large-scale, high-pressure systems, namely blocking and subtropical ridges. Reliable forecasts of these weather systems might enhance the mean range predictability of dust events, which is highly valuable since these episodes can lead to severe pollution episodes locally and in remote regions. The relationship between blocking and air quality is also supported by recent studies describing atmospheric blocking influences on air stagnation and PM10 concentrations in Europe (Garrido-Pérez et al., 2018). High surface ozone levels in Europe have also been related to blocking (Otero et al., 2022) and to the location of subtropical ridges (Ordónez et al., 2017). Therefore, blocks and ridges represent potential predictors of pollution events in Europe, as also shown by Maddison et al. (2021) using statistical models.
Atmospheric rivers have also been pointed out as an important triggering factor of Saharan dust intrusions in Europe (Francis et al., 2022). Preliminary analyses based on a visual identification of atmospheric rivers – herein defined as long and narrow structures with vertically integrated water vapour higher than 20 kg m−2 (Gimeno et al., 2014) – indicate that ∼10 % of the FM dust days of our catalogue concurred with atmospheric rivers. The linkage strengthens during the 2020–2022 period (∼17 % of the FM dust days with atmospheric rivers), which is comparable to the values reported by Francis et al. (2022) but much lower than those obtained by conditioning on cut-off lows or blocks (Sect. 3.2.2). Moreover, atmospheric rivers might not be fully independent of blocking and cut-off lows, as suggested in previous studies (Benedict et al., 2019). Indeed, case studies (Francis et al., 2022) and composite analyses (Lorente-Plazas et al., 2020) of Mediterranean atmospheric rivers reveal high–low-pressure configurations that are consistent with those reported herein for WEM dust events (Fig. 7). In any case, atmospheric rivers might play an important role in the wet deposition of dust, as during some of the extreme events analysed herein. Additional studies are encouraged to address the similarities and differences between dry and wet dust events in terms of driving processes and associated impacts.
The shocking images of European ski slopes covered by Saharan dust that were published by the media during the winters of 2021 and 2022 raised the question of whether these events are becoming more likely because of climate change. Several reasons prevent us from making attribution statements at this stage. Firstly, our catalogue of dust events is short and shows large temporal variations (such as the sharp increase of 2020–2022) and relatively long periods with no Saharan intrusions, which hamper the detection of long-term trends. Secondly, the atmospheric weather systems linked to dust events do not exhibit robust trends, and therefore our confidence in their regional climate change responses is low. For example, winter blocking trends over the last decades are seasonally and spatially heterogeneous, with no robust evidence of generalized significant changes, partially due to discrepancies among the detection indices and their large variability on interannual to multidecadal timescales (e.g. Woollings et al., 2018), which make trends sensitive to the analysed period (Sousa et al., 2021). Although several studies point to future decreases in blocking frequency, the spatial and seasonal patterns of change can be complex or depend on the characteristic addressed. For example, recent studies have reported both significant decreases (Davini and D'Andrea, 2020) and non-significant changes (Bacer et al., 2022) in the frequency and duration of Northern Hemisphere blocking during the 21st century, while other attributes such as blocking size may increase in response to climate change (Nabizadeh et al., 2019). On the other hand, subtropical ridges have been less addressed than blocking; hence their observed and projected changes remain uncertain (Sousa et al., 2021). Finally, the detection of trends in cut-off lows is complicated by the diversity of detection approaches (which can be sensitive to methodological aspects such as the spatial resolution or the vertical level), the large interannual variability at regional scales, and the influence of internal modes of variability. Nieto et al. (2007) did not report significant trends in the frequency of winter cut-off lows over the European sector for the 1958–1998 period. Although this period does not inform on the last decades (with stronger anthropogenic forcing) or our study period, it suggests weak cut-off low responses to long-term climate change. However, the key role of Euro-Atlantic cut-off lows in WEM dust activity calls for updated analyses of their trends and variability.
In addition to atmospheric dynamics, the sources and atmospheric loading of dust are sensitive to changes in other climate components and forcings, including vegetation and land use (IPCC, 2022). In this sense, the 2020–2022 period coincided with dry conditions and the lowest winter NDVI monthly values (Fig. S8). Warm sea surface temperature conditions, such as those reported in the easternmost subtropical North Atlantic and the westernmost Mediterranean in the period 2003–2023 (Fig. S20), seem to play a crucial role in the development and evolution of Mediterranean cyclones by fuelling them with energy and water vapour (Stathopoulos et al., 2020), which may also favour dust intrusions (Flaounas et al., 2015). Finally, Thomas and Nigam (2018) reported a modest northward advance of the Sahara during the boreal winter. Therefore, desertification processes and their complex interactions with the ocean, orography, and soil conditions over northern Africa could also affect the frequency and/or severity of winter dust intrusions.
This work provides a catalogue of dust events over the western Euro-Mediterranean (WEM) region for 2003–2022, focusing on their characteristics during the unusual 2020–2022 period of exceptional activity. Dust events are detected based on satellite aerosol products from MODIS/Aqua. This study also contributes to the understanding of WEM dust events and their synoptic and large-scale environments, which have been poorly addressed in the literature. It shows that wintertime WEM dust events are linked to meridional flows typically induced by subtropical cut-off lows and large-scale, high-pressure systems at middle or low latitudes. The main results can be summarized as follows.
-
Winter dust intrusions over the WEM show irregular activity and large differences among the winter months. December and January are characterized by very low frequencies, and the winter months of highest activity (February and March, FM) display large multi-year variations characterized by calm (e.g. 2018–2019) and active (2020–2022) periods (see Fig. 3). It is unclear if these intraseasonal differences are meaningful or just reflect the effects of limited sampling (a short record with a low number of events).
-
More than half of all FM dust events over the WEM are accompanied by cut-off lows between the Canary Islands and the Iberian Peninsula, which is substantially higher than the frequencies for central and eastern Mediterranean events reported in the literature. These results indicate that cut-off lows are a key synoptic driver of WEM dust intrusions in winter. This association increased during the 2020–2022 period, and all March dust events of that period are concurrent with cut-off lows, suggesting an unusual frequency and/or efficiency of cut-off lows.
-
Concerning the large-scale circulation, WEM dust days are associated with enhanced blocking activity over the mid-latitudes of the Euro-Atlantic sector. This meridional pressure dipole favours the obstruction of the westerlies, which are shifted poleward by the blocking high, and the occurrence of cut-off lows at subtropical latitudes. Although European blocking is not a necessary condition for the occurrence of dust, it represents the most recurrent pattern associated with FM dust days. Consistently, WEM dust days tend to occur under anticyclonic weather regimes.
-
Enhanced mid-latitude blocking and poleward jet configurations are favourable for the outstanding occurrence of WEM dust days, particularly during March 2020–2022. However, a substantial fraction of dust days (mainly those in February 2020–2022) concurs with high-pressure structures at low latitudes or subtropical ridges, which favour a mid-latitude intensification of the jet rather than its poleward migration. Although subtropical ridges do not necessarily develop secluded troughs, they are frequently accompanied by cut-off lows enhancing the southerly winds over northern Africa.
To assess whether the anomalous conditions persisted during the winter of 2023, we have evaluated the data already available for February and March 2023 (see Sect. 7). No dust event is recorded in March 2023, and a 6 d strong dust event is detected on 18–23 February 2023 (Fig. S19). As for the dust events of the 2020–2022 period, dust uplift and transport are associated with two consecutive cut-off lows in the vicinity of the Canary Islands. This event is also accompanied by positive Z500 anomalies over central Europe and the Mediterranean, such as the characteristic pattern of subtropical ridges (Fig. 4d). Further research is required to address the ultimate causes of the anomalous activity of dust events and their atmospheric drivers.
The MODIS and MERRA-2 data used in this work can be freely obtained at https://giovanni.gsfc.nasa.gov/giovanni/ (NASA, 2024). The CALIPSO Level 2 vertical feature mask (VFM) Version 3.1 and 4.2 product available from January to March 2007–2022 can be downloaded from NASA's Atmospheric Science Data Center (ASDC, https://asdc.larc.nasa.gov/project/CALIPSO, NASA, 2023a). NCEP/NCAR Reanalysis data used in this work were obtained from the website of the NOAA PSL, Boulder, Colorado, USA, at https://psl.noaa.gov/ (NOAA, 2023; Kalnay et al., 1996). The AOD direct sun Version 3 Level 1.5 data considered in the Supplement can be downloaded from the AERONET database (https://aeronet.gsfc.nasa.gov, NASA, 2023b; Holben et al., 1998; Giles et al., 2019). Daily mean PM10 data used were obtained from the European Environment Agency's air quality database (AirBase; https://www.eea.europa.eu/data-and-maps/data/aqereporting-9, EEA, 2023). EUMESAT Dust RGB images (processed with the Man computer Interactive Data Access System, McIDAS) and dust forecasts from the MONARCH (Multiscale Online Non-hydrostatic AtmospheRe CHemistry) are available through the WMO Barcelona Dust Regional Center (https://dust.aemet.es/products/daily-dust-products, WMO, 2023b).
The supplement related to this article is available online at: https://doi.org/10.5194/acp-24-4083-2024-supplement.
ECA designed the study and coordinated the different contributions of the analysis. ECA, DB, and SB discussed the main results and wrote the draft, with contributions from all co-authors. RDG, JJB, OG, and AB collected and prepared MODIS, MERRA-2, and AERONET datasets for the elaboration of the dust catalogue. SB collected and prepared the CALIPSO datasets used in the dust catalogue. ECA performed the qualitative analyses of the atmospheric circulation patterns associated with winter dust events. SAP provided the main atmospheric patterns favouring dust intrusions using the k-means clustering algorithm. SAP and JJGA prepared the results on weather regimes. DB provided the localization of the jet stream and blocking patterns using the detection algorithms of Barriopedro et al. (2023) and Woollings et al. (2018), respectively. ECA and SB led the discussion on the identification of the dust events. DB prepared and lead the discussion on meteorological drivers of dust events. EW, DS, and GGC collected and prepared the modelling and monitoring datasets included in the study cases considered in the Supplement. All co-authors reviewed and contributed to the final editing of the paper.
The contact author has declared that none of the authors has any competing interests.
Publisher's note: Copernicus Publications remains neutral with regard to jurisdictional claims made in the text, published maps, institutional affiliations, or any other geographical representation in this paper. While Copernicus Publications makes every effort to include appropriate place names, the final responsibility lies with the authors.
This article is part of the special issue “Dust aerosol measurements, modelling and multidisciplinary effects (AMT/ACP inter-journal SI)”. It is not associated with a conference.
The authors thank all the principal investigators and their staff for establishing and maintaining the NASA and PHOTONS AERONET sites and the NASA MODIS and CALIPSO mission and thank the NASA MERRA scientists and associated NASA personnel for producing the data used in this study. Also, EUMESAT and WMO are sincerely acknowledged for the provision of monitoring and forecasting products. NCEP/NCAR data are provided by the NOAA/ESRL PSL, Boulder, Colorado, USA, from their website at https://psl.noaa.gov/ (last access: 15 June 2023). Emilio Cuevas-Agulló, Ernest Werner, Gerardo García-Castrillo, and Sara Basart acknowledge the WMO Barcelona Dust Regional Center. Sara Basart and Emilio Cuevas-Agulló acknowledge CAMS-84 and CAMS2-82 (part of the Copernicus Atmospheric Monitoring Services, CAMS). This research is part of the Spanish National Research Council (CSIC) Interdisciplinary Thematic Platform (PTI) Clima y Servicios Climáticos (PTI-CLIMA). Also, Christian Grams of the Karlsruher Institut für Technologie (KIT) is acknowledged for providing the weather regime data in the ERA5 reanalysis used in this work. The authors thank Elena Morato, head of the AEMET Library, for hosting the time lapses of the three case studies in the AEMET ARCIMIS repository. Finally, the authors thank the editor and two anonymous referees who kindly reviewed the earlier version of this paper and provided valuable suggestions and comments.
This paper was edited by Stelios Kazadzis and reviewed by two anonymous referees.
Adebiyi, A. A. and Kok, J. F.: Climate models miss most of the coarse dust in the atmosphere, Sci. Adv., 6, eaaz9507, https://doi.org/10.1126/sciadv.aaz9507, 2020.
Aghababaeian, H., Ostadtaghizadeh, A., Ardalan, A., Asgary, A., Akbary, M., Yekaninejad, M. S., and Stephens, C.: Global Health Impacts of Dust Storms: A Systematic Review, Environ. Health Insights, 15, 1–28, https://doi.org/10.1177/11786302211018390, 2021.
Alonso-Pérez, S., Cuevas, E., and Querol, X.: Objective identification of synoptic meteorological patterns favouring African dust intrusions into the marine boundary layer of the subtropical eastern north Atlantic region, Meteorol. Atmos. Phys., 113, 109–124, https://doi.org/10.1007/s00703-011-0150-z, 2011.
Ashpole, I. and Washington, R.: Intraseasonal variability and atmospheric controls on daily dust occurrence frequency over the central and Western Sahara during the boreal summer, J. Geophys. Res.-Atmos., 118, 12915–12926, https://doi.org/10.1002/2013JD020267, 2013.
Bacer, S., Jomaa, F., Beaumet, J., Gallée, H., Le Bouëdec, E., Ménégoz, M., and Staquet, C.: Impact of climate change on wintertime European atmospheric blocking, Weather Clim. Dynam., 3, 377–389, https://doi.org/10.5194/wcd-3-377-2022, 2022.
Barnaba, F. and Gobbi, G. P.: Aerosol seasonal variability over the Mediterranean region and relative impact of maritime, continental and Saharan dust particles over the basin from MODIS data in the year 2001, Atmos. Chem. Phys., 4, 2367–2391, https://doi.org/10.5194/acp-4-2367-2004, 2004.
Barriopedro, D., García-Herrera, R., Lupo, A., and Hernández, E. R.: A climatology of northern hemisphere blocking, J. Climate, 19, 1042–1063, https://doi.org/10.1175/JCLI3678.1, 2006.
Barriopedro, D., García-Herrera, R., and Trigo, R. M.: Application of blocking diagnosis methods to general circulation models. Part I: a novel detection scheme, Clim. Dynam., 35, 1373–1391, https://doi.org/10.1007/s00382-010-0767-5, 2010.
Barriopedro, D., Ayarzagüena, B., Garcia-Burgos, M., and García-Herrera, R.: A multi-parametric perspective of the North Atlantic eddy-driven jet, Clim. Dynam., 61, 375–397, https://doi.org/10.1007/s00382-022-06574-w, 2023.
Basart, S., Pérez, C., Cuevas, E., Baldasano, J. M., and Gobbi, G. P.: Aerosol characterization in Northern Africa, Northeastern Atlantic, Mediterranean Basin and Middle East from direct-sun AERONET observations, Atmos. Chem. Phys., 9, 8265–8282, https://doi.org/10.5194/acp-9-8265-2009, 2009.
Basart, S., Pay, M. T., Jorba, O., Pérez, C., Jiménez-Guerrero, P., Schulz, M., and Baldasano, J. M.: Aerosols in the CALIOPE air quality modelling system: evaluation and analysis of PM levels, optical depths and chemical composition over Europe, Atmos. Chem. Phys., 12, 3363–3392, https://doi.org/10.5194/acp-12-3363-2012, 2012.
Basart, S., Nickovic, S., Terradellas, E., Cuevas, E., Pérez García-Pando, C., García-Castrillo, G., Werner, E., and Benincasa, F.: The WMO SDS-WAS Regional Center for Northern Africa, Middle East and Europe, Web Conf., 99, 04008, https://doi.org/10.1051/e3sconf/20199904008, 2019.
Beerli, R. and Grams, C. M.: Stratospheric modulation of the large-scale circulation in the Atlantic–European region and its implications for surface weather events, Q. J. Roy. Meteorol. Soc., 145, 3732–3750, https://doi.org/10.1002/qj.3653, 2019.
Benedict, J. J., Clement, A. C., and Medeiros, B.: Atmospheric blocking and other large-scale precursor patterns of landfalling atmospheric rivers in the North Pacific: A CESM2 study, J. Geophys. Res.-Atmos., 124, 11330–11353, https://doi.org/10.1029/2019JD030790, 2019.
Bou Karam, D., Flamant, C., Tulet, P., Todd, M. C., Pelon, J., and Williams, E.: Dry cyclogenesis and dust mobilization in the intertropical discontinuity of the West African Monsoon: A case study, J. Geophys. Res.-Atmos., 114, D05115, https://doi.org/10.1029/2008JD010952, 2009.
Cowie, S. M., Knippertz, P., and Marsham, J. H.: A climatology of dust emission events from northern Africa using long-term surface observations, Atmos. Chem. Phys., 14, 8579–8597, https://doi.org/10.5194/acp-14-8579-2014, 2014.
Cuesta, J., Marsham, J. H., Parker, D. J., and Flamant, C.: Dynamical mechanisms controlling the vertical redistribution of dust and the thermodynamic structure of the West Saharan atmospheric boundary layer during summer, Atmos. Sci. Lett., 10, 34–42, https://doi.org/10.1002/asl.207, 2009.
Cuevas, E., Gómez-Peláez, A. J., Rodríguez, S., Terradellas, E., Basart, S., García, R. D., García, O. E., and Alonso-Pérez, S.: The pulsating nature of large-scale Saharan dust transport as a result of interplays between mid-latitude Rossby waves and the North African Dipole Intensity, Atmos. Environ., 167, 586–602, https://doi.org/10.1016/j.atmosenv.2017.08.059, 2017.
Cuevas, E., Milford, C., Barreto, A., Bustos, J. J., García, R. D., Marrero, C. L., Prats, N., Bayo, C., Ramos, R., Terradellas, E., Suárez, D., Rodríguez, S., de la Rosa, J., Vilches, J., Basart, S., Werner, E., López-Villarrubia, E., Rodríguez-Mireles, S., Pita Toledo, M. L., González, O., Belmonte, J., Puigdemunt, R., Lorenzo, J. A., Oromí, P., and del Campo-Hernández, R.: Desert Dust Outbreak in the Canary Islands (February 2020): Assessment and Impacts, WMO Global Atmosphere Watch (GAW) Report No. 259, WWRP 2021-1, edited by: Cuevas, E., Milford, C., and Basart, S., State Meteorological Agency (AEMET), Madrid, Spain and World Meteorological Organization, Geneva, Switzerland, https://www.aemet.es/documentos/es/conocermas/recursos_en_linea/publicaciones_y_estudios/publicaciones/GAW_Report_No_259/GAW_Report_No_259.pdf (last access: 15 July 2023), 2021.
Davini, P. and D'Andrea, F.: From CMIP3 to CMIP6: Northern Hemisphere Atmospheric Blocking Simulation in Present and Future Climate, J. Climate, 33, 10021–10038, https://doi.org/10.1175/JCLI-D-19-0862.1, 2020.
Davini, P., Cagnazzo, C., Gualdi, S., and Navarra, A.: Bidimensional Diagnostics, Variability, and Trends of Northern Hemisphere Blocking, J. Climate, 25, 6496–6509, https://doi.org/10.1175/JCLI-D-12-00032.1, 2012.
Dubovik, O., Holben, B. N., Eck, T. F., Smirnov, A., Kaufman, Y. J., King, M. D., Tanré, D., and Slutsker, I.: Variability of Absorption and Optical Properties of Key Aerosol Types Observed in Worldwide Locations, Atmos. Sci., 59, 590–608, https://doi.org/10.1175/1520-0469(2002)059<0590:VOAAOP>2.0.CO;2, 2002.
EEA – European Environment Agency: Air Quality e-Reporting (AQ e-Reporting) https://www.eea.europa.eu/data-and-maps/data/aqereporting-9 (last access: 15 June 2023), 2023.
ESCAP/APDIM: Sand and dust storms risk assessment in Asia and the Pacific, https://hdl.handle.net/20.500.12870/4452 (last access: 13 November 2023), 2021.
Escudero, M., Querol, X., Ávila, A., and Cuevas, E.: Origin of the exceedances of the European daily PM limit value in regional background areas of Spain, Atmos. Environ., 41, 730–744, https://doi.org/10.1016/j.atmosenv.2006.09.014, 2007.
Fernández, A. J., Sicard, M., Costa, M. J., Guerrero-Rascado, J. L., Gómez-Amo, J. L., Molero, F., Barragán, R., Basart, S. Bortoli, D., Bedoya-Velásquez, A. E., Utrillas, M. P., Salvador, P., Granados-Muñoz, M. J., Potes, M., Ortiz-Amezcua, P., Martínez-Lozano, J. A., Artíñano, B., Muñoz-Porcar, C., Salgado, R., Román, R., Rocadenbosch, F., Salgueiro, V., Benavent-Oltra, A., Rodríguez-Gómez, A., Alados-Arboledas, L., Comerón, A., and Pujadas, M.: Extreme, wintertime Saharan dust intrusion in the Iberian Peninsula: Lidar monitoring and evaluation of dust forecast models during the February 2017 event, Atmos. Res., 228, 223–241, https://doi.org/10.1016/j.atmosres.2019.06.007, 2019.
Fiedler, S., Schepanski, K., Knippertz, P., Heinold, B., and Tegen, I.: How important are atmospheric depressions and mobile cyclones for emitting mineral dust aerosol in North Africa?, Atmos. Chem. Phys., 14, 8983–9000, https://doi.org/10.5194/acp-14-8983-2014, 2014.
Flaounas, E., Kotroni, V., Lagouvardos, K., Kazadzis, S., Gkikas, A. and Hatzianastassiou, N.: Cyclone contribution to dust transport over the Mediterranean region, Atmos. Sci. Lett., 16, 473–478, https://doi.org/10.1002/asl.584, 2015.
Flaounas, E., Davolio, S., Raveh-Rubin, S., Pantillon, F., Miglietta, M. M., Gaertner, M. A., Hatzaki, M., Homar, V., Khodayar, S., Korres, G., Kotroni, V., Kushta, J., Reale, M., and Ricard, D.: Mediterranean cyclones: current knowledge and open questions on dynamics, prediction, climatology and impacts, Weather Clim. Dynam., 3, 173–208, https://doi.org/10.5194/wcd-3-173-2022, 2022.
Francis, D., Fonseca, R., Nelli, N., Bozkurt, D., Picard, G., and Guan, B. Atmospheric rivers drive exceptional Saharan dust transport towards Europe, Atmos. Res., 266, 105959, https://doi.org/10.1016/j.atmosres.2021.105959, 2022.
Gallisai, R., Peters, F.,Volpe, G., Basart, S., and Baldasano, J., M.: Saharan dust deposition may affect phytoplankton growth in the Mediterranean Sea at ecological time scales, PLoS ONE, 9, e110762, https://doi.org/10.1371/journal.pone.0110762, 2014.
Garrido-Pérez, J. M., Ordóñez, C., García-Herrera, R., and Barriopedro, D.: Air stagnation in Europe: Spatiotemporal variability and impact on air quality, Sci. Total Environ., 645, 1238–1252, https://doi.org/10.1016/j.scitotenv.2018.07.238, 2018.
Garrido-Pérez, J. M., Vicente-Serrano, S. M., Barriopedro, D., García-Herrera, R., Trigo, R., and Beguería, S.: Examining the outstanding Euro-Mediterranean drought of 2021–2022 and its historical context, J. Hydrometeorol., 630, 130653, https://doi.org/10.1016/j.jhydrol.2024.130653, 2024.
Gavrouzou, M., Hatzianastassiou, N., Gkikas, A., Lolis, C. J., and Mihalopoulos, N. A.: Climatological Assessment of IntenseDesert Dust Episodes over the Broader Mediterranean Basin Based on Satellite Data, Remote Sens., 13, 2895, https://doi.org/10.3390/rs13152895, 2021.
Gelaro, R., McCarty, W., Suarez, M. J., Todling, R., Molod, A., Takacs, L., Randles, C., Darmenov, A., Bosilovich, M. G., Reichle, R., Wargan, K., Coy, L., Cullather, R., Draper, C., Akella, S., Buchard, V., Conaty, A., da Silva, A., Gu, W., Kim, G. K., Koster, R., Lucchesi, R., Merkova, D., Nielsen, J. E., Partyka, G., Pawson, S., Putman, W., Rienecker, M., Schubert, S. D., Sienkiewicz, M., and Zhao, B.: The Modern-Era Retrospective Analysis for Research and Applications, Version 2 (MERRA-2), J. Climate, 30, 5419–5454, https://doi.org/10.1175/JCLI-D-16-0758.1, 2017.
Gerasopoulos, E., Kouvarakis, G., Babasakalis, P., Vrekoussis, M., Putaud, J. P., and Mihalopoulos, N.: Origin and variability of particulate matter (PM10) mass concentrations over the Eastern Mediterranean, Atmos. Environ., 40, 4679–4690, https://doi.org/10.1016/j.atmosenv.2006.04.020, 2006.
Gherboudj, I., Beegum, S. N., Marticorena, B., and Ghedira, H.: Dust emission parameterizationscheme over the MENA region: Sensitivity analysis to soil moisture andsoil texture, J. Geophys. Res.-Atmos., 120, 10915–10938, https://doi.org/10.1002/2015JD023338, 2015.
Giles, D. M., Sinyuk, A., Sorokin, M. G., Schafer, J. S., Smirnov, A., Slutsker, I., Eck, T. F., Holben, B. N., Lewis, J. R., Campbell, J. R., Welton, E. J., Korkin, S. V., and Lyapustin, A. I.: Advancements in the Aerosol Robotic Network (AERONET) Version 3 database – automated near-real-time quality control algorithm with improved cloud screening for Sun photometer aerosol optical depth (AOD) measurements, Atmos. Meas. Tech., 12, 169–209, https://doi.org/10.5194/amt-12-169-2019, 2019.
Gimeno, L., Nieto, R., Vázquez, M., and Lavers, D.: Atmospheric rivers: a mini-review. Front. Earth Sci., 2, 1–6, https://doi.org/10.3389/feart.2014.00002, 2014
Ginoux, P., Prospero, J. M., Gill, T. E., Hsu, N. C., and Zhao, M.: Global-scale attribution of anthropogenic and natural dust sources and their emission rates based on MODIS Deep Blue aerosol products, Rev. Geophys., 50, RG3005, https://doi.org/10.1029/2012RG000388, 2012.
Gkikas, A., Hatzianastassiou, N., Mihalopoulos, N., Katsoulis, V., Kazadzis, S., Pey, J., Querol, X., and Torres, O.: The regime of intense desert dust episodes in the Mediterranean based on contemporary satellite observations and ground measurements, Atmos. Chem. Phys., 13, 12135–12154, https://doi.org/10.5194/acp-13-12135-2013, 2013.
Gkikas, A., Houssos, E. E., Lolis, C. J., Bartzokas, A., Mihalopoulos, N., and Hatzianastassiou, N.: Atmospheric circulation evolution related to desert dust episodes over the Mediterranean, Q. J. Roy. Meteorol. Soc., 141, 1634–1645, https://doi.org/10.1002/qj.2466, 2015.
Gkikas, A., Basart, S., Hatzianastassiou, N., Marinou, E., Amiridis, V., Kazadzis, S., Pey, J., Querol, X., Jorba, O., Gassó, S., and Baldasano, J. M.: Mediterranean intense desert dust outbreaks and their vertical structure based on remote sensing data, Atmos. Chem. Phys., 16, 8609–8642, https://doi.org/10.5194/acp-16-8609-2016, 2016.
Grams, C. M., Beerli, R., Pfenninger, S., Stafell, I., and Wernli, H.: Balancing Europe's wind-power output through spatial deployment informed by weather regimes, Nat. Clim. Change, 7, 557–562, https://doi.org/10.1038/nclimate3338, 2017.
Guerzoni, S., Chester, R., Dulac, F., Herut, B., Loye-Pilot, M.-D., Measures, C., Migon, C., Molinaroli, E., Moulin, C., Rossini, P., Saydam, C., Soudine, A., and Ziveri, P.: The role of atmospheric deposition in the biogeochemistry of the Mediterranean Sea, Prog. Oceanogr., 44, 147–190, https://doi.org/10.1016/S0079-6611(99)00024-5, 1999.
Helgren, D. M. and Prospero, J. M.: Wind Velocities Associated with Dust Deflation Events in the Western Sahara, J. Clim. Appl. Meteorol., 26, 1147–1151, 1987.
Holben, B. N., Eck, T. F., Slutsker, I., Tanre, D., Buis, J. P., Setzer, A., Vermote, E., Reagan, J. A., Kaufman, Y., Nakajima, T., Lavenue, F., Jankowiak, I., and Smirnov, A.: AERONET – A federated instrument network and data archive for aerosol characterization, Remote Sens. Environ., 66, 1–16, https://doi.org/10.1016/S0034-4257(98)00031-5, 1998.
IPCC: Climate Change 2022: Impacts, Adaptation, and Vulnerability, in: Contribution of Working Group II to the Sixth Assessment Report of the Intergovernmental Panel on Climate Change, edited by: Pörtner, H.-O., Roberts, D. C., Tignor, M., Poloczanska, E. S., Mintenbeck, K., Alegría, A., Craig, M., Langsdorf, S., Löschke, S., Möller, V., Okem, A., and Rama, B., Cambridge University Press, Cambridge, UK and New York, NY, USA, ISBN 978-92-9169-161-6, https://www.ipcc.ch/report/ar6/wg2/downloads/report/IPCC_AR6_WGII_SummaryVolume.pdf (last access: 20 July 2023), 2022.
Israelevich, P., Ganor, E., Alpert, P., Kishcha, P., and Stupp, A.: Predominant transport paths of Saharan dust over the mediterranean sea to Europe, J. Geophys. Res., 117, D02205, https://doi.org/10.1029/2011JD016482, 2012.
Kalnay, E., Kanamitsu, M., Kistler, R., Collins, W., Deaven, D., Gandin, L., Iredell, M., Saha, I. S., White, G., Woollen, J., Zhu, Y., Leetmaa, A., Reynolds, R., Chelliah, M., Ebisuzaki, W., 2 Higgins, W., Janowiak, J., Mo, K. C., Ropelewski, C., Wang, J., Jenne, R., and Joseph, D.: The NCEP/NCAR 40-Year Reanalysis Project, B. Am. Meteorol. Soc., 77, 437–471, https://doi.org/10.1175/1520-0477(1996)077<0437:TNYRP>2.0.CO;2,1996.
Kaufman, Y. J., Tanré, D., Remer, L. A., Vermote, E. F., Chu, A., Holben, B. N.: Operational remote sensing of tropospheric aerosol over land from EOS moderate resolution imaging spectroradiometer, J. Geophys. Res., 102, 17–51, https://doi.org/10.1029/96JD03988, 1997.
Kautz, L.-A., Martius, O., Pfahl, S., Pinto, J. G., Ramos, A. M., Sousa, P. M., and Woollings, T.: Atmospheric blocking and weather extremes over the Euro-Atlantic sector – a review, Weather Clim. Dynam., 3, 305–336, https://doi.org/10.5194/wcd-3-305-2022, 2022.
Kim, M.-H., Omar, A. H., Tackett, J. L., Vaughan, M. A., Winker, D. M., Trepte, C. R., Hu, Y., Liu, Z., Poole, L. R., Pitts, M. C., Kar, J., and Magill, B. E.: The CALIPSO version 4 automated aerosol classification and lidar ratio selection algorithm, Atmos. Meas. Tech., 11, 6107–6135, https://doi.org/10.5194/amt-11-6107-2018, 2018.
Kinne, S., Schulz, M., Textor, C., Guibert, S., Balkanski, Y., Bauer, S. E., Berntsen, T., Berglen, T. F., Boucher, O., Chin, M., Collins, W., Dentener, F., Diehl, T., Easter, R., Feichter, J., Fillmore, D., Ghan, S., Ginoux, P., Gong, S., Grini, A., Hendricks, J., Herzog, M., Horowitz, L., Isaksen, I., Iversen, T., Kirkevåg, A., Kloster, S., Koch, D., Kristjansson, J. E., Krol, M., Lauer, A., Lamarque, J. F., Lesins, G., Liu, X., Lohmann, U., Montanaro, V., Myhre, G., Penner, J., Pitari, G., Reddy, S., Seland, O., Stier, P., Takemura, T., and Tie, X.: An AeroCom initial assessment – optical properties in aerosol component modules of global models, Atmos. Chem. Phys., 6, 1815–1834, https://doi.org/10.5194/acp-6-1815-2006, 2006.
Kinni, P., Kouis, P., Dimitriou, H., Yarza, S., Papatheodorou, S., Kampriani, E., Charalambous, M., Middleton, N., Novack, V., Galanakis, E., and Yiallouros, P. K.: Health effects of desert dust storm events in the south-eastern Mediterranean: perceptions and practices of local stakeholders, East Mediterr. Health, 27, 1092–1101, https://doi.org/10.26719/emhj.21.037, 2021
Knippertz, P.: Dust mobilization in the West African heat trough – The role of the diurnal cycle and of extratropical synoptic disturbances, Meteorol. Z., 17, 553–563, https://doi.org/10.1127/0941-2948/2008/0315, 2008.
Knippertz, P. and Todd, M. C.: Mineral dust aerosols over the Sahara: Meteorological controls on emission and transport and implications for modeling, Rev. Geophys., 50, RG1007, https://doi.org/10.1029/2011RG000362, 2012.
Kok, J. F., Ridley, D. A., Zhou, Q., Miller, R. L., Zhao, C., Heald, C. L., Ward, D. S., Albani, S.,and Haustein, K.: Smaller desert dust cooling effect estimated from analysis of dust size and abundance, Nat. Geosci., 10, 274–278, https://doi.org/10.1038/ngeo2912, 2017.
Kok, J. F., Adebiyi, A. A., Albani, S., Balkanski, Y., Checa-Garcia, R., Chin, M., Colarco, P. R., Hamilton, D. S., Huang, Y., Ito, A., Klose, M., Li, L., Mahowald, N. M., Miller, R. L., Obiso, V., Pérez García-Pando, C., Rocha-Lima, A., and Wan, J. S.: Contribution of the world's main dust source regions to the global cycle of desert dust, Atmos. Chem. Phys., 21, 8169–8193, https://doi.org/10.5194/acp-21-8169-2021, 2021.
Kuula, J., Timonen, H., Niemi, J. V., Manninen, H. E., Rönkkö, T., Hussein, T., Fung, P. L., Tarkoma, S., Laakso, M., Saukko, E., Ovaska, A., Kulmala, M., Karppinen, A., Johansson, L., and Petäjä, T.: Opinion: Insights into updating Ambient Air Quality Directive 2008/50/EC, Atmos. Chem. Phys., 22, 4801–4808, https://doi.org/10.5194/acp-22-4801-2022, 2022.
Lagaria, A., Mandalakis, M., Mara, P., Papageorgiou, N., Pitta, P., Tsiola, A., Kagiorgi, M., and Psarra, S.: Phytoplankton response to Saharan dust depositions in the Eastern Mediterranean Sea: A mesocosm study, Front. Mar. Sci., 3, 287, https://doi.org/10.3389/fmars.2016.00287, 2017.
Liu, Z., Vaughan, M., Winker, D., Kittaka, C., Getzewich, B., Kuehn, R., Omar, A., Powell, K., Trepte, C., and Hostetler, C.: The CALIPSO lidar cloud and aerosol discrimination: Version 2 algorithm and initial assessment of performance, J. Atmos. Ocean. Tech., 26, 1198–1213, https://doi.org/10.1175/2009JTECHA1229.1, 2009.
Liu, Z., Kar, J., Zeng, S., Tackett, J., Vaughan, M., Avery, M., Pelon, J., Getzewich, B., Lee, K.-P., Magill, B., Omar, A., Lucker, P., Trepte, C., and Winker, D.: Discriminating between clouds and aerosols in the CALIOP version 4.1 data products, Atmos. Meas. Tech., 12, 703–734, https://doi.org/10.5194/amt-12-703-2019, 2019.
Lorente-Plazas, R., Montavez, J. P., Ramos, A. M., Jerez, S., Trigo, R. M. and Jimenez-Guerrero, P.: Unusual atmospheric-river-like structures coming from Africa induce extreme precipitation over the western Mediterranean Sea, J. Geophys. Res.-Atmos., 125, e2019JD031280, https://doi.org/10.1029/2019JD031280, 2020.
Maddison, J. W., Abalos, M., Barriopedro, D., García-Herrera, R., Garrido-Pérez, J. M., and Ordóñez, C.: Linking air stagnation in Europe with the synoptic- to large-scale atmospheric circulation, Weather Clim. Dynam., 2, 675–694, https://doi.org/10.5194/wcd-2-675-2021, 2021.
Marconi, M., Sferlazzo, D. M., Becagli, S., Bommarito, C., Calzolai, G., Chiari, M., di Sarra, A., Ghedini, C., Gómez-Amo, J. L., Lucarelli, F., Meloni, D., Monteleone, F., Nava, S., Pace, G., Piacentino, S., Rugi, F., Severi, M., Traversi, R., and Udisti, R.: Saharan dust aerosol over the central Mediterranean Sea: PM10 chemical composition and concentration versus optical columnar measurements, Atmos. Chem. Phys., 14, 2039–2054, https://doi.org/10.5194/acp-14-2039-2014, 2014.
Met Office: EUMETSAT (2022): MSG: Dust imagery in the RGB channels over the full disc at 41.5 degrees East (LEDF41, up to 0900U̇TC 1st June 2022), NERC EDS Centre for Environmental Data Analysis, https://catalogue.ceda.ac.uk/uuid/b1dacc09b42f4d8ab492c5d5c751efa9 (last access: 15 June 2023), 2022.
Michel, C. and Rivière, G.: The link between Rossby wave breakings and weather regime transitions, J. Atmos. Sci., 68, 1730–1748, https://doi.org/10.1175/2011JAS3635.1, 2011.
Middleton, N. and Kappelle, M.: Impacts of sand and dust storms on oceans: a scientific environmental assessment for policy makers, United Nations Environment Programme, Nairobi, Kenya, https://www.unep.org/resources/report/impacts-sand-and-dust-storms-oceans (last access: 15 June 2023), 2020
Monteiro, A., Basart, S., Kazadzis, S., Votsis, A., Gkikas, A., Vandenbussche, S., Tobias, A., Gama, C., Pérez García-Pando, C., Terradellas, E., Notas, G., Middleton, N., Kushta, J., Amiridis, V., Lagouvardos, K., Kosmopoulos, P., Kotroni, V., Kanakidou, M., Mihalopoulos, N., Kalivitis, N., Dagsson-Waldhauserová, P., El-Askary, H., Sievers, K., Giannaros, T., Mona, L., Hirtl, M., Skomorowski, P., Virtanen, T. H., Christoudias, T., Di Mauro, B., Trippetta, S., Kutuzov, S., Meinander, O., and Nickovic, S.: Multi-sectoral impact assessment of an extreme African dust episode in the Eastern Mediterranean in March 2018, Sci. Total Environ., 843, 156861, https://doi.org/10.1016/j.scitotenv.2022.156861, 2022.
Moulin, C., Lambert, C. E., Dayan, U., Masson, V., Ramonet, M., Bousquet, P., Legrand, M., Balkanski, Y. J., Guelle, W., Marticorena, B., Bergametti, G., and Dulac, F.: Satellite climatology of African dust transport in the Mediterranean atmosphere, J. Geophys. Res., 103, 13137–13144, https://doi.org/10.1029/98JD00171, 1998.
Muñoz, C., Schultz, D., and Vaughan, G.: A Midlatitude Climatology and Interannual Variability of 200- and 500-hPa Cut-Off Lows, J. Climate, 33, 2201–2222, https://doi.org/10.1175/JCLI-D-19-0497.1, 2020.
Nabizadeh, E., Hassanzadeh, P., Yang, D., and Barnes, E. A.: Size of the atmospheric blocking events: Scaling law and response to climate change, Geophys. Res. Lett., 46, 13488–13499, https://doi.org/10.1029/2019GL084863, 2019.
NASA: Cloud-Aerosol Lidar and Infrared Pathfinder Satellite Observations, https://asdc.larc.nasa.gov/project/CALIPSO (last access: 15 September 2023), 2023a.
NASA: AERONET, https://aeronet.gsfc.nasa.gov (last access: 15 June 2023), 2023b.
NASA: Giovanni, https://giovanni.gsfc.nasa.gov/giovanni/ (last access: 4 April 2024), 2024.
Nieto, R., Gimeno, L., de la Torre, L., Ribera, P., Gallego, D., García-Herrera, R., García, J. A., Nuñez, M., Redaño, A., and Lorente, J.: Climatological features of Cut-off low systems in the Northern Hemisphere, J. Climate, 18, 3085–3103, https://doi.org/10.1175/JCLI3386.1, 2005.
Nieto, R., Gimeno, L., de la Torre, Ribera, L., Barriopedro, P., García-Herrera, D., Serrano, R., Gordillo, A., Redaño, A., and Lorente, J.: Interannual variability of cut-off low systems over the European sector: The role of blocking and the Northern Hemisphere circulation modes, Meteorol. Atmos. Phys., 96, 85–101, https://doi.org/10.1007/s00703-006-0222-7, 2007.
NOAA: Physical Sciences Laboratory, https://psl.noaa.gov/ (last access: 15 June 2023), 2023.
Oduber, F., Calvo, A. I., Blanco-Alegre, C., Castro, A., Nunes, T., Alves, C., Sorribas, M., Fernández-González, D,. Vega-Maray, A. M., Valencia-Barrera, R. M., Lucarelli, F., Nava, S., Calzolai, G., Alonso-Blanco, E., Fraile, B., Fialho, P., Coz, E., Prevot, A. S. H., Pont, V., and Fraile, R.: Unusual winter Saharan dust intrusions at Northwest Spain: Air quality, radiative and health impacts, Sci. Total Environ., 669, 213–228, https://doi.org/10.1016/j.scitotenv.2019.02.305, 2019.
Ordóñez, C., Barriopedro, D., García-Herrera, R., Sousa, P. M., and Schnell, J. L.: Regional responses of surface ozone in Europe to the location of high-latitude blocks and subtropical ridges, Atmos. Chem. Phys., 17, 3111–3131, https://doi.org/10.5194/acp-17-3111-2017, 2017.
Otero, N., Jurado, O. E., Butler, T., and Rust, H. W.: The impact of atmospheric blocking on the compounding effect of ozone pollution and temperature: a copula-based approach, Atmos. Chem. Phys., 22, 1905–1919, https://doi.org/10.5194/acp-22-1905-2022, 2022.
Pey, J., Querol, X., Alastuey, A., Forastiere, F., and Stafoggia, M.: African dust outbreaks over the Mediterranean Basin during 2001–2011: PM10 concentrations, phenomenology and trends, and its relation with synoptic and mesoscale meteorology, Atmos. Chem. Phys., 13, 1395–1410, https://doi.org/10.5194/acp-13-1395-2013, 2013.
Pfahl, S.: Characterising the relationship between weather extremes in Europe and synoptic circulation features, Nat. Hazards Earth Syst. Sci., 14, 1461–1475, https://doi.org/10.5194/nhess-14-1461-2014, 2014.
Pitkanen-Brunnsberg, J.: Background Note on the UN Sand and Dust Storm (SDS) Coalition, United Nations Convention to Combat Desertification, France, https://policycommons.net/artifacts/2227328/background-note-on-the-un-sand-and-dust-storm-sds-coalition/2984760/ (last access: 17 June 2023), 2019.
Portmann, R., Sprenger, M., and Wernli, H.: The three-dimensional life cycles of potential vorticity cutoffs: a global and selected regional climatologies in ERA-Interim (1979–2018), Weather Clim. Dynam., 2, 507–534, https://doi.org/10.5194/wcd-2-507-2021, 2021.
Querol, X., Pey, J., Pandolfi, M., Alastuey, A., Cusack, M., Pérez, N., Moreno, N., Viana, M., Mihalopoulos, N., Kallos, G., and Kleanthous, S.: African dust contributions to mean ambient PM10 mass-levels across the Mediterranean basin, Atmos. Environ., 43, 4266–4277, https://doi.org/10.1016/j.atmosenv.2009.06.013, 2009.
Rex, D.: Blocking Action in the Middle Troposphere and its Effect upon Regional Climate, Tellus, 2, 275–301, https://doi.org/10.1111/j.2153-3490.1950.tb00339.x, 1950.
Rodríguez, S., Cuevas, E., Prospero, J. M., Alastuey, A., Querol, X., López-Solano, J., García, M. I., and Alonso-Pérez, S.: Modulation of Saharan dust export by the North African dipole, Atmos. Chem. Phys., 15, 7471–7486, https://doi.org/10.5194/acp-15-7471-2015, 2015.
Ryder, C. L., Marenco, F., Brooke, J. K., Estelles, V., Cotton, R., Formenti, P., McQuaid, J. B., Price, H. C., Liu, D., Ausset, P., Rosenberg, P. D., Taylor, J. W., Choularton, T., Bower, K., Coe, H., Gallagher, M., Crosier, J., Lloyd, G., Highwood, E. J., and Murray, B. J.: Coarse-mode mineral dust size distributions, composition and optical properties from AER-D aircraft measurements over the tropical eastern Atlantic, Atmos. Chem. Phys., 18, 17225–17257, https://doi.org/10.5194/acp-18-17225-2018, 2018.
Salvador, P., Alonso-Pérez, S., Pey, J., Artíñano, B., de Bustos, J. J., Alastuey, A., and Querol, X.: African dust outbreaks over the western Mediterranean Basin: 11-year characterization of atmospheric circulation patterns and dust source areas, Atmos. Chem. Phys., 14, 6759–6775, https://doi.org/10.5194/acp-14-6759-2014, 2014.
Sayer, A. M., Hsu, N. C., Bettenhausen, C., and Jeong, M.-J.: Validation and uncertainty estimates for MODIS Collection 6 “Deep Blue” aerosol data, J. Geophys. Res.-Atmos., 118, 7864–7872, https://doi.org/10.1002/jgrd.50600, 2013.
Schepanski, K., Tegen, I., Laurent, B., Heinold, B., and Macke, A.: A new Saharan dust source activation frequency map derived from MSG-SEVIRI IR-channels, Geophys. Res. Lett., 34, L18803, https://doi.org/10.1029/2007GL030168, 2007.
Schepanski, K., Tegen, I., Todd, M. C., Heinold, B., Bönisch, G., Laurent, B., and Macke, A.: Meteorological processes forcing Saharan dust emission inferred from MSGSEVIRI observations of subdaily dust source activation and numerical models, J. Geophys. Res., 114, D10201, https://doi.org/10.1029/2008JD010325, 2009.
Schepanski, K., Tegen, I., and Macke, A.: Comparison of satellite based observations of Saharan dust source areas, Remote Sens. Environ., 123, 90–97, https://doi.org/10.1016/j.rse.2012.03.019, 2012.
Shepherd, G., Terradellas, E., Baklanov, A., Kang, U., Sprigg, W. A., Nickovic, S., Boloorani, A.D., Al-Dousari, A., Basart, S.,, Benedetti, A., Sealy, A., Tong, D., Zhang, X., Shumake-Guillemot, J., Kebin, Z., Knippertz, P., Mohammed, A. A. A., Al-Dabbas, M., Cheng, L., Otani, S., Wang, F., Zhang, C., Ryoo, S. B., and Cha, J.: Global assessment of sand and dust storms, United Nations Environment Programme, Nairobi, 139 pp., ISBN 978-92-807-3551-2, 2016.
Sousa, P. M., Trigo, R. M., Barriopedro, D., Soares, P. M. M., and Santos, J. A.: European temperature responses to blocking and ridge regional patterns, Clim. Dynam., 50, 457–477, https://doi.org/10.1007/s00382-017-3620-2, 2018.
Sousa, P. M., Barriopedro, D., García-Herrera, R., Woollings, T., and Trigo, R. M.: A New Combined Detection Algorithm for Blocking and Subtropical Ridges, J. Climate, 34, 7735–7758, https://doi.org/10.1175/JCLI-D-20-0658.1, 2021.
Stathopoulos, C., Patlakas, P., Tsalis, C., and Kallos, G.: The Role of Sea Surface Temperature Forcing in the Life-Cycle of Mediterranean Cyclones, Remote Sens., 12, 825, https://doi.org/10.3390/rs12050825, 2020.
Stephens, G. L., Vane, D. G., Boain, R. J., Mace, G. G., Sassen, K., Wang, Z., Illingworth, A. J., O'Connor, E. J., Rossow, W. B., Durden, S. L., Miller, S. D., Austin, R. T., Benedetti, A., Mitrescu, C., and CloudSat Science Team: The CloudSat mission and the A-Train: A new dimension of space-based observations of clouds and precipitation, B. Am. Meteorol. Soc., 83, 1771–1790, https://doi.org/10.1175/BAMS-83-12-1771, 2002.
Szopa, S., Naik, V., Adhikary, B., Artaxo, P., Berntsen, T., Collins, W. D., Fuzzi, S., Gallardo, L., Kiendler-Scharr, A., Klimont, Z., Liao, H., Unger, N., and Zanis, P.: Short-Lived Climate Forcers, in: Climate Change 2021: The Physical Science Basis, Contribution of Working Group I to the Sixth Assessment Report of the Intergovernmental Panel on Climate Change, edited by: Masson-Delmotte, V., Zhai, P., Pirani, A., Connors, S. L., Péan, C., Berger, S., Caud, N., Chen, Y., Goldfarb, L., Gomis, M. I., Huang, M., Leitzell, K., Lonnoy, E., Matthews, J. B. R., Maycock, T. K., Waterfield, T., Yelekçi, O., Yu, R., and Zhou, B., Cambridge University Press, Cambridge, UK and New York, NY, USA, 817–922, https://doi.org/10.1017/9781009157896.008, 2021.
Tegen, I., Schepanski, K., and Heinold, B.: Comparing two years of Saharan dust source activation obtained by regional modelling and satellite observations, Atmos. Chem. Phys., 13, 2381–2390, https://doi.org/10.5194/acp-13-2381-2013, 2013.
Terradellas, E., Nickovic, S., and Zhang, X. Y.: Airborne dust: a hazard to human health, environment and society, WMO Bull. 64, 42–46, https://sds-was.aemet.es/materials/hazard.pdf (last access: 15 February 2024), 2015.
Thomas, N. and Nigam, S.: Twentieth-Century Climate Change over Africa: Seasonal Hydroclimate Trends and Sahara Desert Expansion, J. Climate, 31, 3349–3370, https://doi.org/10.1175/JCLI-D-17-0187.1, 2018.
Trigo, R. M., Trigo, I. F., DaCamara, C. C., and Osborn, T. J.: Winter blocking episodes in the European–Atlantic sector: Climate impacts and associated physical mechanisms in the Reanalysis, Clim. Dynam., 23, 17–28, https://doi.org/10.1007/s00382-004-0410-4, 2004.
Varga, G., Ùjvári, G., and Kovács, J.: Spatiotemporal patterns of Saharan dust outbreaks in the Mediterranean Basin, Aeolian Res., 15, 151–160, https://doi.org/10.1016/j.aeolia.2014.06.005, 2014.
Vaughan, M. A., Powell, K. A., Kuehn, R. E., Young, S. A., Winker, D. M., Hostetler, C. A., Hunt, W. H., Liu, Z., McGill, M. J., and Getzewich, B. Z.: Fully automated detection of cloud and aerosol layers in the CALIPSO lidar measurements, J. Atmos. Ocean. Tech., 26, 2034–2050, https://doi.org/10.1175/2009JTECHA1228.1, 2009.
Wagner R., Schepanski, K., Heinold, B., and Tegen, I.: Interannual variability in the Saharan dust source activation – Toward differences between 2007 and 2008, J. Geophys. Res.-Atmos., 121, 4538–4562, https://doi.org/10.1002/2015JD024302, 2016.
Wang, W., Evan, A., Flamant, C., and Lavaysse, C.: On the decadal scale correlation between African dust and Sahel rainfall: The role of Saharan heat low-forced winds, Sci. Adv., 1, e1500646, https://doi.org/10.1126/sciadv.1500646, 2015.
Wazneh, H., Gachon, P., Laprise, R., de Vernal, A., and Tremblay, B.: Atmospheric blocking events in the North Atlantic: trends and links to climate anomalies and teleconnections, Clim. Dynam., 56, 2199–2221, https://doi.org/10.1007/s00382-020-05583-x, 2021.
WHO – World Health Organization: WHO global air quality guidelines: particulate matter (PM2.5 and PM10), ozone, nitrogen dioxide, sulfur dioxide and carbon monoxide, World Health Organization, https://iris.who.int/handle/10665/345329 (last access: 15 June 2023), 2021.
Wilks, D. S.: Statistical Methods in the Atmospheric Sciences, Cambridge Univertity Press, Cambridge, MA, USA, ISBN 9780123850232, 2011.
Winker, D. M., Vaughan, M. A., Omar, A. H., Hu, Y., Powell, K. A., Liu, Z., Hunt, W. H., and Young, S. A.: Overview of the CALIPSO mission and CALIOP data processing algorithms, J. Atmos. Ocean. Tech., 26, 2310–2323, https://doi.org/10.1175/2009JTECHA1281.1, 2009.
Winstanley, D.: Sharav, Weather, 27, 146–160, https://doi.org/10.1002/j.1477-8696.1972.tb04279.x, 1972.
WMO: The Role of Climatological Normals in a Changing Climate, WCDMP-No.61, WMO-TD No. 1377, edited by: Baddour, O. and Kontongomde, H., https://library.wmo.int/viewer/52499/download?file=wmo-td_1377_en.pdf&type=pdf&navigator=1 (last access: 25 January 2024), 2007.
WMO: Sand and Dust Storm Warning Advisory and Assessment System (SDS-WAS), Science and Implementation Plan: 2015–2020, WWRP 2015–5, 30 pp., https://repositorio.aemet.es/handle/20.500.11765/2852 (last access: 15 February 2024), 2015.
WMO: Airborne dust bulletin No. 5, https://library.wmo.int/idurl/4/57560 (last access: 15 June 2023), 2021.
WMO: Airborne dust bulletin No. 7, https://library.wmo.int/idurl/4/57560 (last access: 15 June 2023), 2023a.
WMO: Daily Dust Products, https://dust.aemet.es/products/daily-dust-products (last access: 15 June 2023), 2023b.
Woollings, T., Barriopedro, D., Methven, J., Son, S.-W, Martius, O., Harvey, B., Sillmann, J., Lupo, A. R., and Seneviratne, S.: Blocking and its response to climate change, Curr. Clim. Change Rep., 4, 287–300, https://doi.org/10.1007/s40641-018-0108-z, 2018.
Wu, M., Liu, X., Yu, H., Wang, H., Shi, Y., Yang, K., Darmenov, A., Wu, C., Wang, Z., Luo, T., Feng, Y., and Ke, Z.: Understanding processes that control dust spatial distributions with global climate models and satellite observations, Atmos. Chem. Phys., 20, 13835–13855, https://doi.org/10.5194/acp-20-13835-2020, 2020.