the Creative Commons Attribution 4.0 License.
the Creative Commons Attribution 4.0 License.
 | 04 Apr 2024
A large role of missing volatile organic compound reactivity from anthropogenic emissions in ozone pollution regulation
Wenjie Wang
Yafang Cheng
Jipeng Qi
Sihang Wang
Wei Song
Xinming Wang
Chaoyang Xue
Chaoqun Ma
Fengxia Bao
Hongli Wang
Shengrong Lou
Min Shao
There are thousands of volatile organic compound (VOC) species in ambient air, while existing techniques can only detect a small part of them (approximately several hundred). The large number of unmeasured VOCs prevents us from understanding the photochemistry of ozone and aerosols in the atmosphere. The major sources and photochemical effects of these unmeasured VOCs in urban areas remain unclear. The missing VOC reactivity, which is defined as the total OH reactivity of the unmeasured VOCs, is a good indicator for constraining the photochemical effect of unmeasured VOCs. Here, we identified the dominant role of anthropogenic emission sources in the missing VOC reactivity (accounting for up to 70 %) by measuring missing VOC reactivity and tracer-based source analysis in a typical megacity in China. Omitting the missing VOC reactivity from anthropogenic emissions in model simulations will remarkably affect the diagnosis of sensitivity regimes for ozone formation, overestimating the degree of VOC-limited regimes by up to 46 %. Therefore, a thorough quantification of missing VOC reactivity from various anthropogenic emission sources is urgently needed for constraints of air quality models and the development of effective ozone control strategies.
- Article
(1889 KB) - Full-text XML
-
Supplement
(610 KB) - BibTeX
- EndNote


Volatile organic compounds (VOCs) are key precursors of major photochemical pollutants, including ozone (O3) and secondary organic aerosols (Atkinson, 2000; Atkinson and Arey, 2003). Severe O3 and particle pollution is frequently related to high emissions of VOCs (Atkinson and Arey, 2003; Monks et al., 2015). There exist thousands of VOC species in ambient air that are emitted from either natural processes or anthropogenic activities (Goldstein and Galbally, 2007). No one instrument can capture all VOCs out there, and even when they can be measured, there is information missing on identification and properties (Yuan et al., 2017; Wang et al., 2014). A gas chromatograph–mass spectrometer/flame ionization detector (GC–MS/FID) can measure C2–C12 non-methane hydrocarbons (NMHCs) and C2–C6 oxygenated VOCs (OVOCs) but cannot measure NMHCs and OVOCs with larger carbon numbers (Wang et al., 2014). A proton-transfer-reaction time-of-flight mass spectrometer (PTR-ToF-MS) is able to measure a huge number of OVOCs, aromatics and several alkanes but cannot measure most alkanes and alkenes and cannot distinguish isomers (Yuan et al., 2017). The 2,4-dinitrophenylhydrazine (DNPH) or high-performance liquid chromatography (HPLC) method can measure several carbonyls but cannot measure non-polar organic species (Wang et al., 2009). The two-dimensional GC is able to measure some intermediate-volatile and semivolatile non-polar organics (Song et al., 2022). A lack of standard gases prevents these technologies from accurate quantification even if these technologies can identify more VOC species. In general, many branched alkenes, OVOCs with complex functional groups, intermediate-volatile and semivolatile organics and complex biogenic VOCs cannot currently be well quantified even if they can be identified by instruments. As a result, the total amount of VOCs in ambient air has generally been underestimated. Currently, emission inventories used in air quality models such as the Community Emissions Data System (CEDS) emission inventory and the Multi-resolution Emission Inventory for China (MEIC) only include the VOC species that can be measured, such as some C1–C9 hydrocarbons and simple-structure OVOCs with a small carbon number (< C6). This will lead to an underestimation of the photochemical effect of the total VOCs and thus causes uncertainties in predicting secondary pollution. The quantification of the unmeasured VOCs is crucial for assessing secondary pollution precisely.
The total OH reactivity (ROH), which can be directly measured, is an index for evaluating the amount of reductive pollutants in terms of ambient OH loss. The total OH reactivity is defined as
where X represents a reactive species including carbon monoxide (CO), nitrogen oxides (NOX) and VOCs, and is the reaction rate constant for the oxidation of species X by OH. The measured ROH is higher than that calculated based solely on the measured reactive species, and the difference between them is mostly from unmeasured VOCs (Yang et al., 2017). Missing VOC reactivity (missing VOCR), defined as the VOC reactivity (VOCR) of all unmeasured VOCs, can be obtained by subtracting the calculated ROH from the measured ROH:
where “reactive species” represents measured VOCs and “reactive inorganic species” includes carbon monoxide (CO), nitric oxide (NO), nitrogen dioxide (NO2), O3, sulfur dioxide (SO2), nitrous acid (HONO), and so on. The missing VOCR provides a constraint for evaluating the photochemical roles of unmeasured VOCs in the atmosphere (Sadanaga et al., 2005; Yang et al., 2016b). The inclusion of the missing VOCR can help to improve the performance of the box model and air quality models in simulating photochemistry processes. A relatively high missing VOCR has been found in forests (Di Carlo et al., 2004; Hansen et al., 2014; Nakashima et al., 2014; Nölscher et al., 2016; Praplan et al., 2019), urban areas (Shirley et al., 2006; Yoshino et al., 2006; Dolgorouky et al., 2012; Yang et al., 2017), and suburban areas (Kovacs et al., 2003; Yang et al., 2017; Fuchs et al., 2017; Lou et al., 2010), accounting for 10 %–75 % of the total ROH. Given that the total VOCR is one part of the total ROH, missing VOCR would account for a larger percentage of the total VOCR (> 10 %–75 %).
The potential sources of missing VOCR include anthropogenic emissions, biogenic emissions, soil emissions, and photochemical production (Yang et al., 2016b). Previous studies have reported that the missing VOCR in forest areas was mainly from direct emissions or photochemical oxidation of biogenic VOCs (Di Carlo et al., 2004; Hansen et al., 2014; Nakashima et al., 2014; Nölscher et al., 2016; Praplan et al., 2019). Nevertheless, the dominant source of the missing VOCR in urban and suburban areas remains unclear or under debate.
Surface O3 pollution has become a major public health concern in cities worldwide (Paoletti et al., 2014; Lefohn et al., 2018). A critical issue in determining an emission control strategy for ozone pollution is to understand the relative benefits of NOx and VOC emission controls. This is generally framed in terms of ozone precursor sensitivity, i.e., whether ozone production is NOX-limited or VOC-limited (Kleinman, 1994; Sillman et al., 1990). Nevertheless, the effect of missing VOCs on ozone precursor sensitivity has not been well understood yet. Given that the missing VOCR could potentially account for a large part of the total VOCR, clearly clarifying the role of missing VOCR in determining ozone precursor sensitivity is an urgent need for the diagnosis of ozone sensitivity regimes and the formulation of an effective emission reduction roadmap.
China has become a global hotspot of ground-level ozone pollution in recent years (Lu et al., 2018; Wang et al., 2022). The Pearl River Delta (PRD) remains one of the most O3-polluted regions in China (Li et al., 2022), although many control measures have been attempted. Here, we measured ROH in Guangzhou, a megacity in the PRD, and quantified the missing VOCR. The dominant source of the missing VOCR and its impact on ozone precursor sensitivity were comprehensively investigated.
2.1 Overview of the measurement
The field campaign was conducted from 25 September to 30 October 2018 continuously at an urban site in downtown Guangzhou (113.2° E, 23° N). The sampling site is located on the ninth floor of a building on the campus of the Guangzhou Institute of Geochemistry, Chinese Academy of Sciences, 25 m above ground level. This site is primarily influenced by industrial and vehicular emissions. ROH, VOCs, NOX, O3, HONO, SO2, CO, photolysis frequencies, and meteorological factors were simultaneously measured during the measurement period.
2.2 ROH measurement
The total ROH was measured by the comparative reactivity method (CRM) (Sinha et al., 2008). The CRM system consists of three major components, i.e., an inlet and calibration system, a reactor, and a measuring system. Here, pyrrole (C4H5N) was used as the reference substance in the CRM, and its concentration was quantified by a quadrupole proton-transfer-reaction mass spectrometer (PTR-MS) (Ionicon Analytik GmbH, Innsbruck, Austria). The CRM system was calibrated by propane, propene, toluene standards, and 16 VOC mixed standards (acetaldehyde, methanol, ethanol, isoprene, acetone, acetonitrile, methyl vinyl ketone, methyl ethyl ketone, benzene, toluene, o-xylene, α-pinene, 1,2,4-trimethylbenzene, phenol, m-cresol, and naphthalene). Measured and calculated ROH agreed well within 15 % for all the calibrations. The ROH measurement by the CRM method is interfered by ambient nitric oxide (NO), which produces additional OH radicals via the reaction of HO2 radicals with NO (Sinha et al., 2008). To correct this interference, a series of experiments were conducted by introducing different levels of NO (0–160 ppb) and given amounts of VOC into the CRM reactor. A correction curve was acquired from these NO interference experiments, which can be used to correct the ROH thanks to the simultaneous measurement of ambient NO concentrations (Supplement S1; Fig. S1). The detection limits of the CRM method were around 2.5 s−1, and the total uncertainty was estimated to be about 15 %. The CRM method has been successfully applied to measure OH reactivity in urban areas with high NOX levels in previous studies (Dolgorouky et al., 2012; Yang et al., 2017; Hansen et al., 2015). The intercomparison between the CRM method and the pump–probe technique indicates that the CRM method can be used under high-NOX conditions (NOX>10 ppb) if a NOX-dependent correction is applied (Hansen et al., 2015).
2.3 VOC measurements
NMHCs were measured using a GC–MS/FID system coupled with a cryogen-free preconcentration device (Wang et al., 2014). The system contains two-channel sampling and GC column separation, which are able to measure C2–C5 hydrocarbons with the FID in one channel and measure C5–C12 hydrocarbons using an MS detector in the other channel. After removal of water vapor, VOCs were trapped at −155° in a deactivated quartz capillary column (15 cm × 0.53 mm ID) and a porous-layer open tubular (PLOT) capillary column (15 cm × 0.53 mm ID) for the MS channel and the FID channel, respectively. The system was calibrated weekly by TO-15 (Air Environmental Inc., USA) and PAMS gas standards (Spectra Gases Inc., USA). Detection limits for various compounds were in the range of 0.002–0.070 ppbv. A total of 56 NMHC species were measured (Table S1). The time resolution of the measurement was 1 h. The uncertainties of VOC measurements by GC–MS/FID are in the range of 15 %–20 %. More details of this method can be found in previous studies (Wang et al., 2014; Yuan et al., 2012).
An online PTR-ToF-MS (Ionicon Analytic GmbH, Innsbruck, Austria) with H3O+ and NO+ ion sources was also used to measure VOCs. During the campaign, the PTR-ToF-MS automatically switched between H3O+ and NO+ chemistry every 10–20 min. The H3O+ mode was used to measure OVOCs and aromatics, while the NO+ model was used to measure alkanes with more carbons (C8–C20). When running in the H3O+ ionization mode, the drift tube was at a temperature of 50°, a pressure of 3.8 mbar, and a voltage of 920 V, leading to an operating (E is the electric field, and N is the number density of the gas in the drift tube) ratio of 120 Td. When running in the NO+ ionization mode, the drift tube was at a temperature of 50°, a pressure of 3.8 mbar, and a voltage of 470 V, leading to an operating ratio of 60 Td. The PTR-ToF-MS technique is capable of measuring OVOCs and higher alkanes that a GC–MS/FID cannot measure (Wu et al., 2020; C. Wang et al., 2020). The time resolution of PTR-ToF-MS measurements was 10 s. A total of 31 VOCs were calibrated using either gas or liquid standards (Table S2). For other measured VOCs, we used the method proposed by Sekimoto et al. (2017) to determine the relationship between VOC sensitivity and kinetic rate constants for proton-transfer reactions of H3O+ with VOCs. The fitted line was used to determine the concentrations of those uncalibrated species. The uncertainties of the concentrations for uncalibrated species were about 50 % (Sekimoto et al., 2017). With this method, PTR-ToF-MS can additionally measure 128 VOCs, which were included in the analysis of this study. The detailed information for this method can be found in Wu et al. (2020), and all VOC species measured by a PTR-ToF-MS were provided in Table S4 of that article. The PTR-ToF-MS is capable of measuring additional VOC species that GC–MS/FID cannot measure, including alkanes with more carbons (C12–C20) and OVOCs, including aldehydes, ketones, carboxylic acids, alcohols, and nitrophenols. Formaldehyde (HCHO) was measured by a custom-built instrument based on the Hantzsch reaction and absorption photometry (Xu et al., 2022).
2.4 Other measurements
Nitrous acid (HONO) was measured by a custom-built LOPAP (long-path-absorption photometer) based on wet chemical sampling and photometric detection (Yu et al., 2022). The uncertainty of the measurement was 8 %. NOX, O3, SO2, and CO were measured by an NOX analyzer (Thermo Scientific, Model 42i), an O3 analyzer (Thermo Scientific, Model 49i), an SO2 analyzer (Thermo Scientific, Model 43i), and a CO analyzer (Thermo Scientific, Model 48i), respectively. The meteorological data, including temperature (T), relative humidity (RH), and wind speed and direction (WS, WD), were recorded by Vantage Pro2 Weather Station (Davis Instruments Inc., Vantage Pro2) with a time resolution of 1 min. Photolysis frequencies of O3, NO2, HONO, H2O2, HCHO, and NO3 were measured by a spectrometer (Focused Photonics Inc., PFS-100) (Shetter and Müller, 1999; Wang et al., 2019).
2.5 Multiple linear regression
Multiple linear regression (MLR) has been successfully applied to quantify the sources of air pollutants (Li et al., 2019; Yang et al., 2016a). In this study, a tracer-based MLR analysis was used to decouple the individual contributions of anthropogenic emissions, secondary production, biogenic emissions, and background level to missing VOCR, as shown in Eq. (4).
OX is defined as O3+ NO2. ΔCO, [OX], and [isopreneinitial] are concentrations of tracers for anthropogenic emissions, secondary production, and biogenic emissions, respectively. ΔCO is the relative change between the ambient CO and background CO of 150 ppb (C. Wang et al., 2020). [isopreneinitial] represents the initial concentration of isoprene from biogenic emissions that has not undergone any photochemical reactions, which is calculated from the observed isoprene and its photochemical products methyl vinyl ketone (MVK) and methacrolein (MACR) (Xie et al., 2008). Cbackground indicates the background level of missing VOCR. a, b, c, and Cbackgound are coefficients fitted by the multiple linear regression.
2.6 Observation-based box model
A zero-dimensional box model coupled with the Master Chemical Mechanism (MCM) v3.3.1 (Jenkin et al., 2003) was used to simulate the photochemical production of ROX (ROX= OH + HO2+ RO2) radicals and O3 during the field campaign. The model was constrained by the observations of meteorological parameters, photolysis frequencies, VOCs, NO, NO2, O3, CO, SO2, and HONO. The model runs were performed in a time-dependent mode with a time resolution of 1 h and a spin-up of 4 d. A 24 h lifetime was introduced for all simulated species, including secondary species and radicals, to approximately simulate dry deposition and other losses of these species (Lu et al., 2013; W. Wang et al., 2020). Sensitivity tests show that this assumed physical loss lifetime has a relatively small influence on ROX radicals and ozone production rates.
Measured OVOCs such as HCHO, acetaldehyde, and acetone were constrained in the model, and unmeasured OVOCs were simulated according to the photochemical oxidation of NMHCs by OH radicals. RO2, HO2, and OH radicals were simulated by the box model to calculate the net O3 production rate (P(O3)) and O3 loss rate (L(O3)) as shown in Eqs. (5) and (6) as derived by Mihelcic et al. (2003).
θ is the fraction of O1D from ozone photolysis that reacts with water vapor, and i and j represent the number of species of RO2 and alkenes, respectively.
The box model was used to evaluate the impact of missing VOCR on the O3 production rate. In the base scenario, the box model was constrained by all measured inorganic and organic gases, but the missing VOCR was not considered. To consider the missing VOCR in the box model, we additionally increased the concentration of NMHCs to exactly compensate for the missing VOCR by multiplying a factor on the basis of measured NMHC concentrations. We simulated four scenarios by increasing the concentration of (1) n-pentane, (2) ethylene, (3) toluene, and (4) all measured 56 NMHCs. For the scenario of increasing all 56 NMHCs, concentrations of the 56 NMHC species were increased by multiplying the same factor. Given that the VOCR of unconstrained secondary products increases with the increase in the concentration of NMHCs, several attempts for different values are needed to determine the increasing factor.
3.1 Quantification of missing VOCR during the campaign
Figure 1 shows the time series of measured ROH, calculated ROH according to all measured reactive gases, and missing VOCR (the gap between the measured and calculated ROH) in Guangzhou. By using a GC-MS/FID, we measured 56 NMHCs. By using a PTR-ToF-MS, we measured 159 VOCs, and 128 of them were difficult to measure before. In addition to the alkanes with carbons less than 12, a PTR-ToF-MS can measure alkanes with more carbons (C12–C20). With regard to OVOCs, not only common OVOC species including formaldehyde and C2–C4 carbonyls, but also carbonyls with more carbons (C5–C10) and some N-containing OVOC species such as nitrophenol and methyl nitrophenol were measured by a PTR-ToF-MS. Thanks to these additional measured VOCs, the measured ROH was close to the calculated ROH within 20 % in most periods. In some periods the missing VOCR was negative, which is probably due to the uncertainty in the measurements of ROH and reactive gases. The negative missing VOCR primarily occurred in the afternoon (12:00–17:00) when the photochemistry was most active. Nevertheless, there were still some days exhibiting remarkable missing VOCR. Days with a missing VOCR of more than 25 % of the total ROH, i.e., high missing-VOCR days, are indicated by yellow background in Fig. 1a. The largest missing VOCR occurred on 15, 16, 25, and 26 October, with average values of 16 s−1. During the period of 24 to 26 October, the total ROH was highest and the missing VOCR was also relatively high among all the days. Figure 1b shows the contribution of different species classifications to the total ROH during high missing-VOCR days. Inorganic species, NMHCs, and OVOCs account for 34 %, 13 %, and 14 % of the total ROH, respectively, with missing VOCR accounting for 39 %. The fraction of missing VOCR (39 %) during the high missing-VOCR days is comparable to measurements in Los Angeles in 2010 (Griffith et al., 2016) and in Seoul in 2016 (Sanchez et al., 2021).
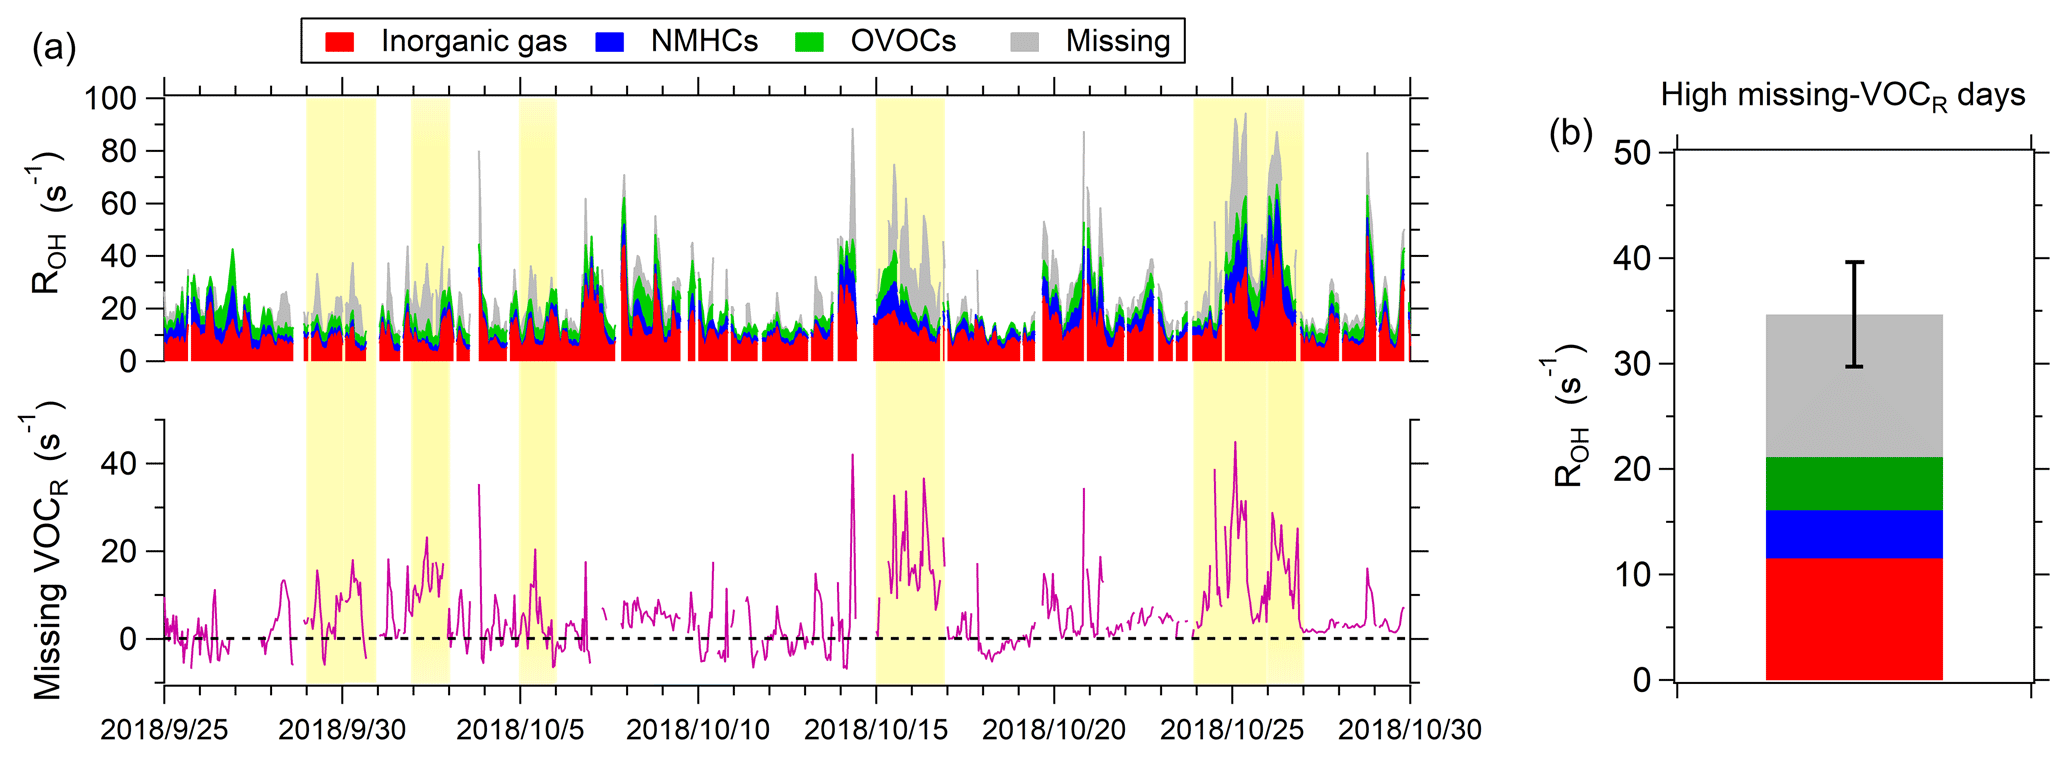
Figure 1The level of missing VOCR during the measurements in Guangzhou. (a) Time series of measured ROH and calculated ROH from all measured reactive gases in Guangzhou. Yellow background represents the high missing-VOCR days, with missing VOCR accounting for more than 30 % of the total ROH. (b) Contributions of different compositions to ROH on high missing-VOCR days. The error bar represents the standard deviation of missing VOCR.
We evaluated the uncertainty of the missing VOCR. The uncertainty of the ROH measurement was 15 %. In addition, according to reports by the Jet Propulsion Laboratory (Burkholder et al., 2020), reaction rate constants used for the calculation of ROH in Eq. (3) have uncertainties of 5 %–30 %, depending on different species. We took the uncertainties in the reaction rate constants and the measurements of all the reactive gases into account when calculating ROH, according to error propagation. As a result, the uncertainties in the missing VOCR are 3.8 and 5.2 s−1 for the whole measurement period and the high missing-VOCR days, respectively. The average missing VOCR during the high missing-VOCR days is 13 s−1, which is significantly higher than the uncertainty of 5.2 s−1, suggesting that the missing VOCR really exists during the high missing-VOCR days.
3.2 The sources of missing VOCR
To explore the sources of missing VOCR during the whole measurement period, we investigated the correlation between missing VOCR and tracers characterizing primary emissions (CO, NOX, and NMHCs) and secondary production (OX≡ O3+ NO2 and formic acid). The correlation of missing VOCR with CO, reactivity of NMHCs (NMHCR), and NOX is moderate, with a correlation coefficient (R) in the range of 0.47–0.56 (Figs. 2a and b, S2) while there is no significant correlation of missing VOCR with OX and formic acid (Figs. 2c and S2). Furthermore, there is no significant correlation between missing VOCR and acetonitrile, which is a tracer of biomass burning (de Gouw et al., 2003; Wang et al., 2007) (Fig. S2), indicating that biomass burning was not a major contributor to missing VOCR during this campaign. In terms of the diurnal variation, the missing VOCR was higher in the morning (07:00–10:00) and evening (18:00–22:00), when the anthropogenic emissions, especially vehicle exhaust, were intensive, and was lower in the afternoon, when the photochemistry was most active (Fig. 2d). The diurnal profile of missing VOCR was similar to those of CO, NOX, and NMHCR. In contrast, the diurnal profiles of secondary species, including OX, formic acid, and acetic acid, which peaked in the afternoon, evidently differ from the diurnal profile of missing VOCR (Fig. S3). Further, we investigated the influence of air mass aging on missing VOCR. The ratio of ethylbenzene to m,p-xylene was used to characterize the degree of air mass aging (de Gouw et al., 2005; Yuan et al., 2013). A higher ratio of ethylbenzene to m,p-xylene corresponds to a higher degree of air mass aging as the m,p-xylene has a larger reaction rate constant (18.9 × 10⁻¹² cm3 molecule−1 s−1) than ethylbenzene (7.0 × 10⁻¹² cm3 molecule−1 s−1) when reacting with the major oxidant – OH radicals. As shown in Fig. 2e, missing VOCR decreases with the ratio of ethylbenzene to m,p-xylene. Given that secondary production generally increased with air mass aging, this result further demonstrates that missing VOCR was not caused by enhanced secondary production.
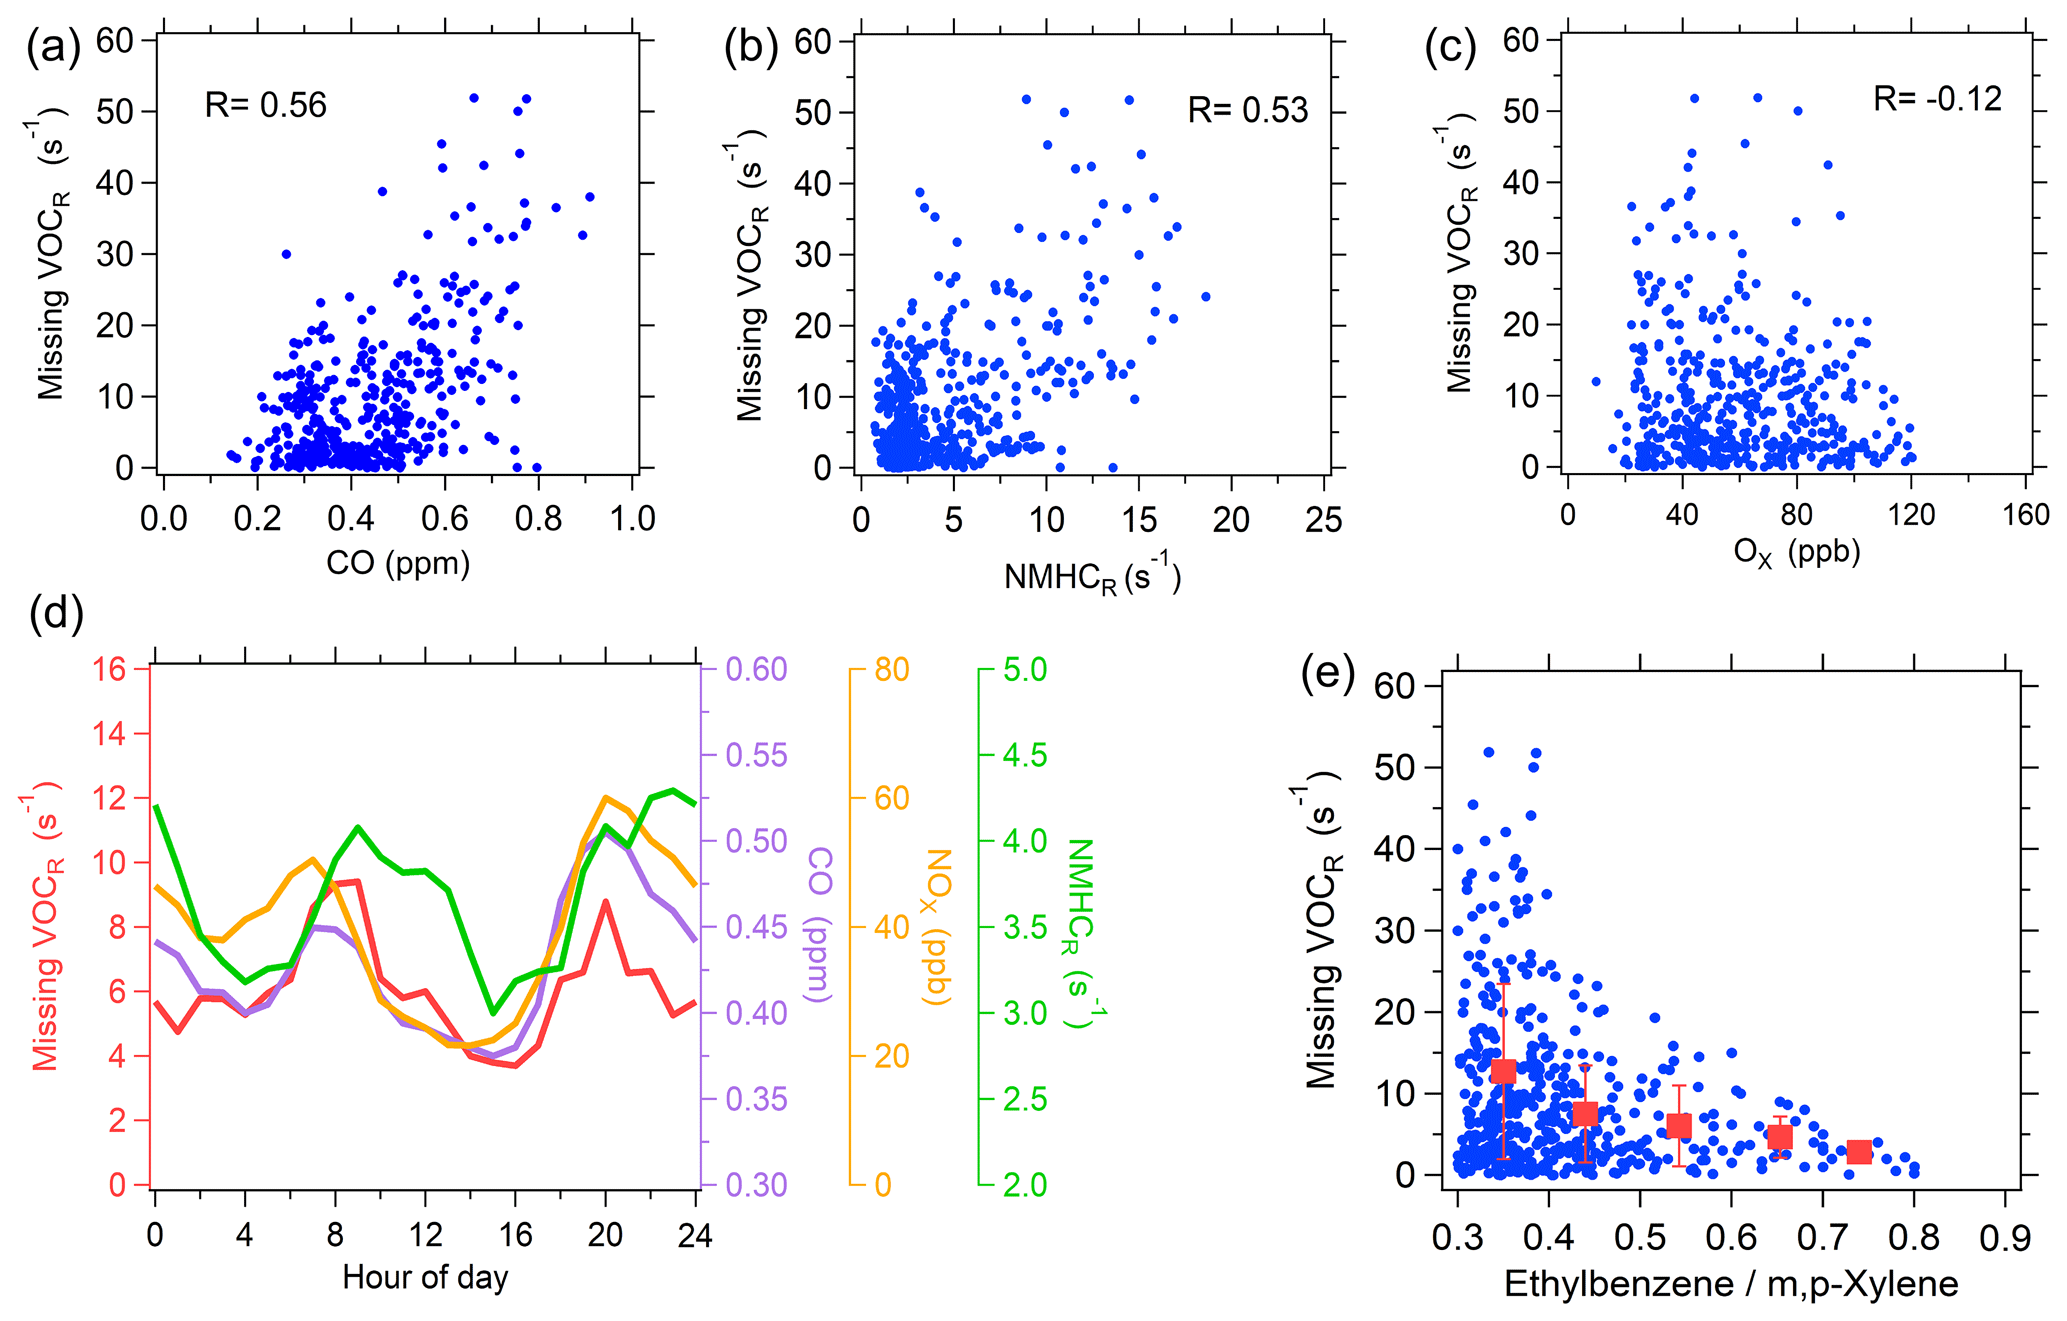
Figure 2Correlation of missing VOCR with major tracers during the whole measurement period. (a–c) Correlation of missing VOCR with CO, OH reactivity of NMHCs (NMHCR), and OX. Each point represents hourly data. (d) Diurnal variations in missing VOCR, CO, NOX, and NMHCs. (e) The dependence of missing VOCR on the ethylbenzene m,p-xylene ratio. The red squares indicate the mean values of missing VOCR in different ranges of the ratio of ethylbenzene to m,p-xylene with a classification width of 0.1, and the error bars represent the standard deviation.
During the high missing-VOCR days, the correlation coefficient for missing VOCR versus CO is 0.76 (Fig. 3a), which is higher than that in the whole measurement period (0.56) shown in Fig. 2a. We then quantify the sources of missing VOCR during the high missing-VOCR days by applying MLR. The fitted coefficients are as follows: a is 0.031 s−1 ppb−1, b is 0.012 s−1 ppb−1, c is 1.8 s−1 ppb−1, and Cbackground is 1.3 s−1. The coefficient of determination (R2) for the MLR is 0.68. As shown in Fig. 3b, anthropogenic emissions were the largest contributor to missing VOCR, accounting for 70 % of missing VOCR. Secondary production, biogenic emissions, and background contribution played a minor role in missing VOCR (13 %, 7 %, and 10 %, respectively). The parametric relationship between missing VOCR and relevant tracers established by MLR provides a valid approach to estimate the missing VOCR according to readily available gases, including CO, OX, and isoprene.
Although anthropogenic emissions are identified as the major source of missing VOCR, which species dominantly contributes to the missing VOCR remains unclear. A potential source is the unmeasured branched alkenes because of their high reactivity previously observed from vehicle exhaust (Nakashima et al., 2010) and gasoline evaporation emissions (Wu et al., 2015). Another possible source is emitted OVOCs with a more complex functional group that cannot be accurately measured. In addition, directly emitted semivolatile and intermediate-volatility organic compounds are also possible sources of missing VOCR (Stewart et al., 2021).
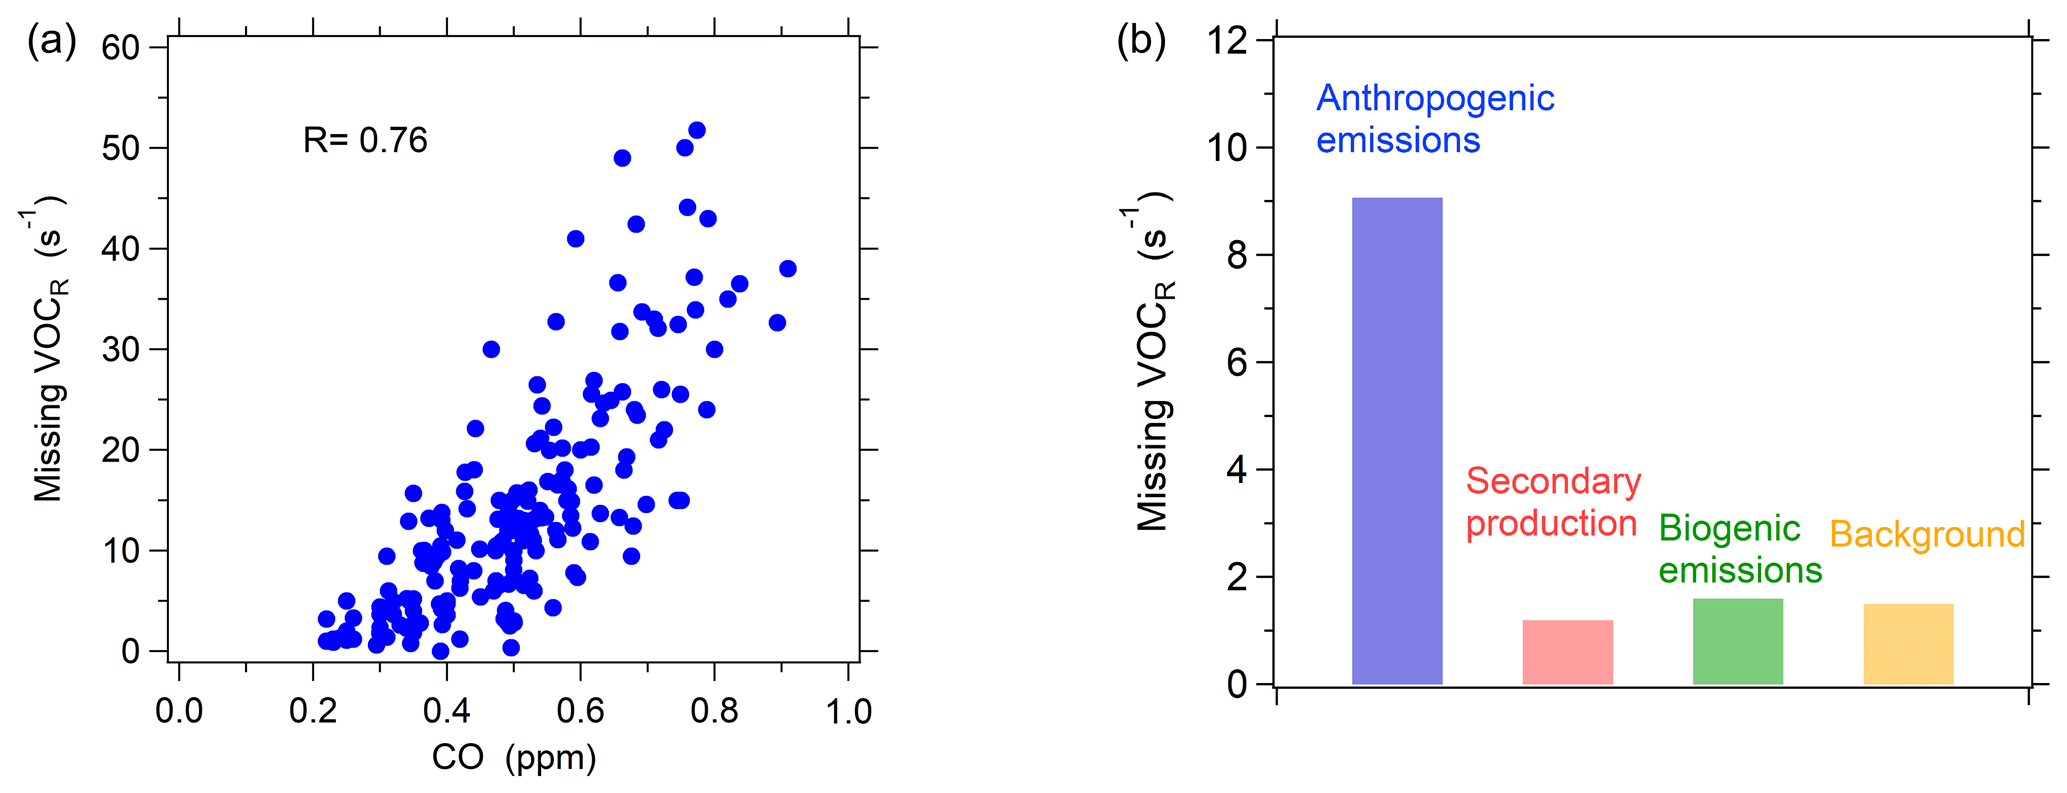
Figure 3The source apportionment of missing VOCR on high missing-VOCR days. (a) Correlation of missing VOCR with CO. Each point represents hourly data. (b) Contributions of different sources to missing VOCR according to the MLR.
3.3 The impact of missing VOCR on O3 sensitivity regimes
The reaction of OH with VOCs is key to the propagation and amplification of OH radicals, thus determining the ozone production rate (Tonnesen and Dennis, 2000). The box model was used to evaluate the impact of missing VOCR on the O3 production rate during high missing-VOCR days. The settings of model simulations for different scenarios are depicted in Sect. 2.6. In the base scenario, on average, the measured VOCRs of n-pentane, ethylene, toluene, and all 56 NMHCs are 0.14, 0.53, 0.60, and 4.6 s−1, respectively. To consider the missing VOCR (an average of 13 s−1) in the model, four scenarios were simulated by additionally increasing n-pentane, ethylene, toluene, and 56 NMHCs by factors of 70, 16, 13.3, and 1.9, respectively. These increasing factors led to an additional increase in VOCR of both NMHCs and unconstrained secondary products, which exactly compensated for the missing VOCR. Figure 4 shows the simulated P(O3) for the base scenario and the scenarios considering missing VOCR. The daytime average P(O3) in the scenarios considering missing VOCR is a factor of 1.5–4.5 for the results in the base scenario. The difference in the added species has a large effect on P(O3). Adding toluene causes a larger increase in P(O3) than adding n-pentane or ethene, as toluene has a stronger ability to amplify the production of radicals.
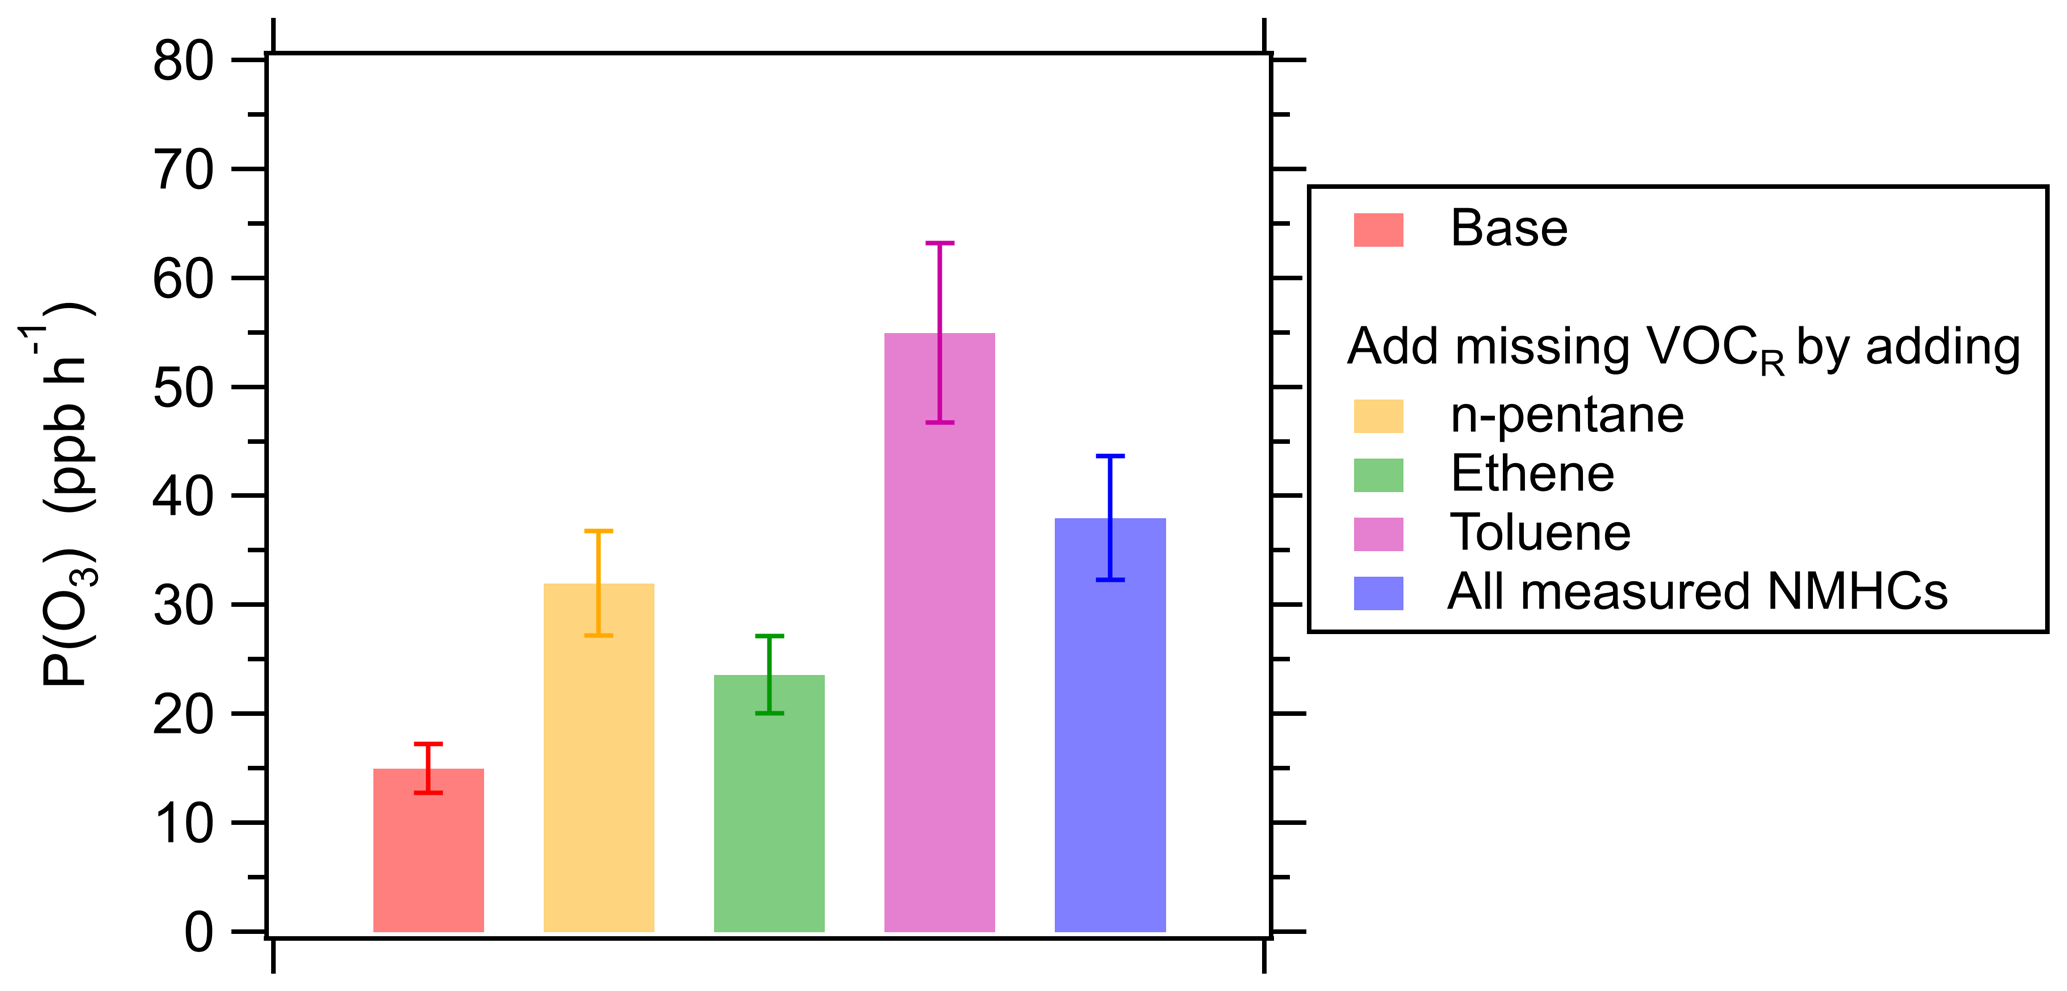
Figure 4Simulated daytime mean P(O3) for the base scenario (without missing VOCR) and the scenario considering missing VOCR, respectively, on high missing-VOCR days. The missing VOCR is considered by adding individual species (n-pentane, ethene, or toluene) or increasing all measured NMHCs to compensate for the missing VOCR. The error bar represents the standard deviation of P(O3) induced by the uncertainty of the missing VOCR.
O3 precursor sensitivity depends on the dominant loss pathways of ROX radicals (ROX= OH + HO2+ RO2). O3 production is NOX-limited if the self-reaction of peroxy radicals (HO2 and RO2) dominates the ROX sink and VOC-limited if the reaction of NO2 with OH dominates (Kleinman et al., 1997, 2001). Accordingly, the ratio of the ROX sink induced by OH + NO2 reaction to the total rate of the two ROX sinks, i.e., , is used to identify O3 sensitivity regimes. O3 production is NOX-limited if is lower than 0.5; otherwise, it is VOC-limited (Kleinman et al., 1997).
As shown in Fig. 5a, in the base scenario, remained at a stable and high level (> 0.9) during the daytime, when photochemical production of ozone occurs, indicating that O3 production was VOC-limited. In the scenarios considering missing VOCR, decreased significantly regardless of which VOC species was added, compared to the base scenario. Adding toluene caused the largest decrease in , followed by adding all measured NMHC species, adding the alkane, and adding the alkene. It is worth noting that adding toluene and all measured NMHC species caused the to be close to 0.5 in the afternoon, indicating that the O3 production shifted to transitional or NOX-limited regimes in these scenarios. Figure 5b shows the changes in radical sinks before and after considering missing VOCR. All radical sinks including self-reactions of peroxy radicals and OH + NO2 reaction increased after considering missing VOCR. Nevertheless, the increased proportion of the self-reactions of peroxy radicals was larger than that of OH + NO2 reaction, leading to a decrease in and thus a shift toward an NOX-limited regime.
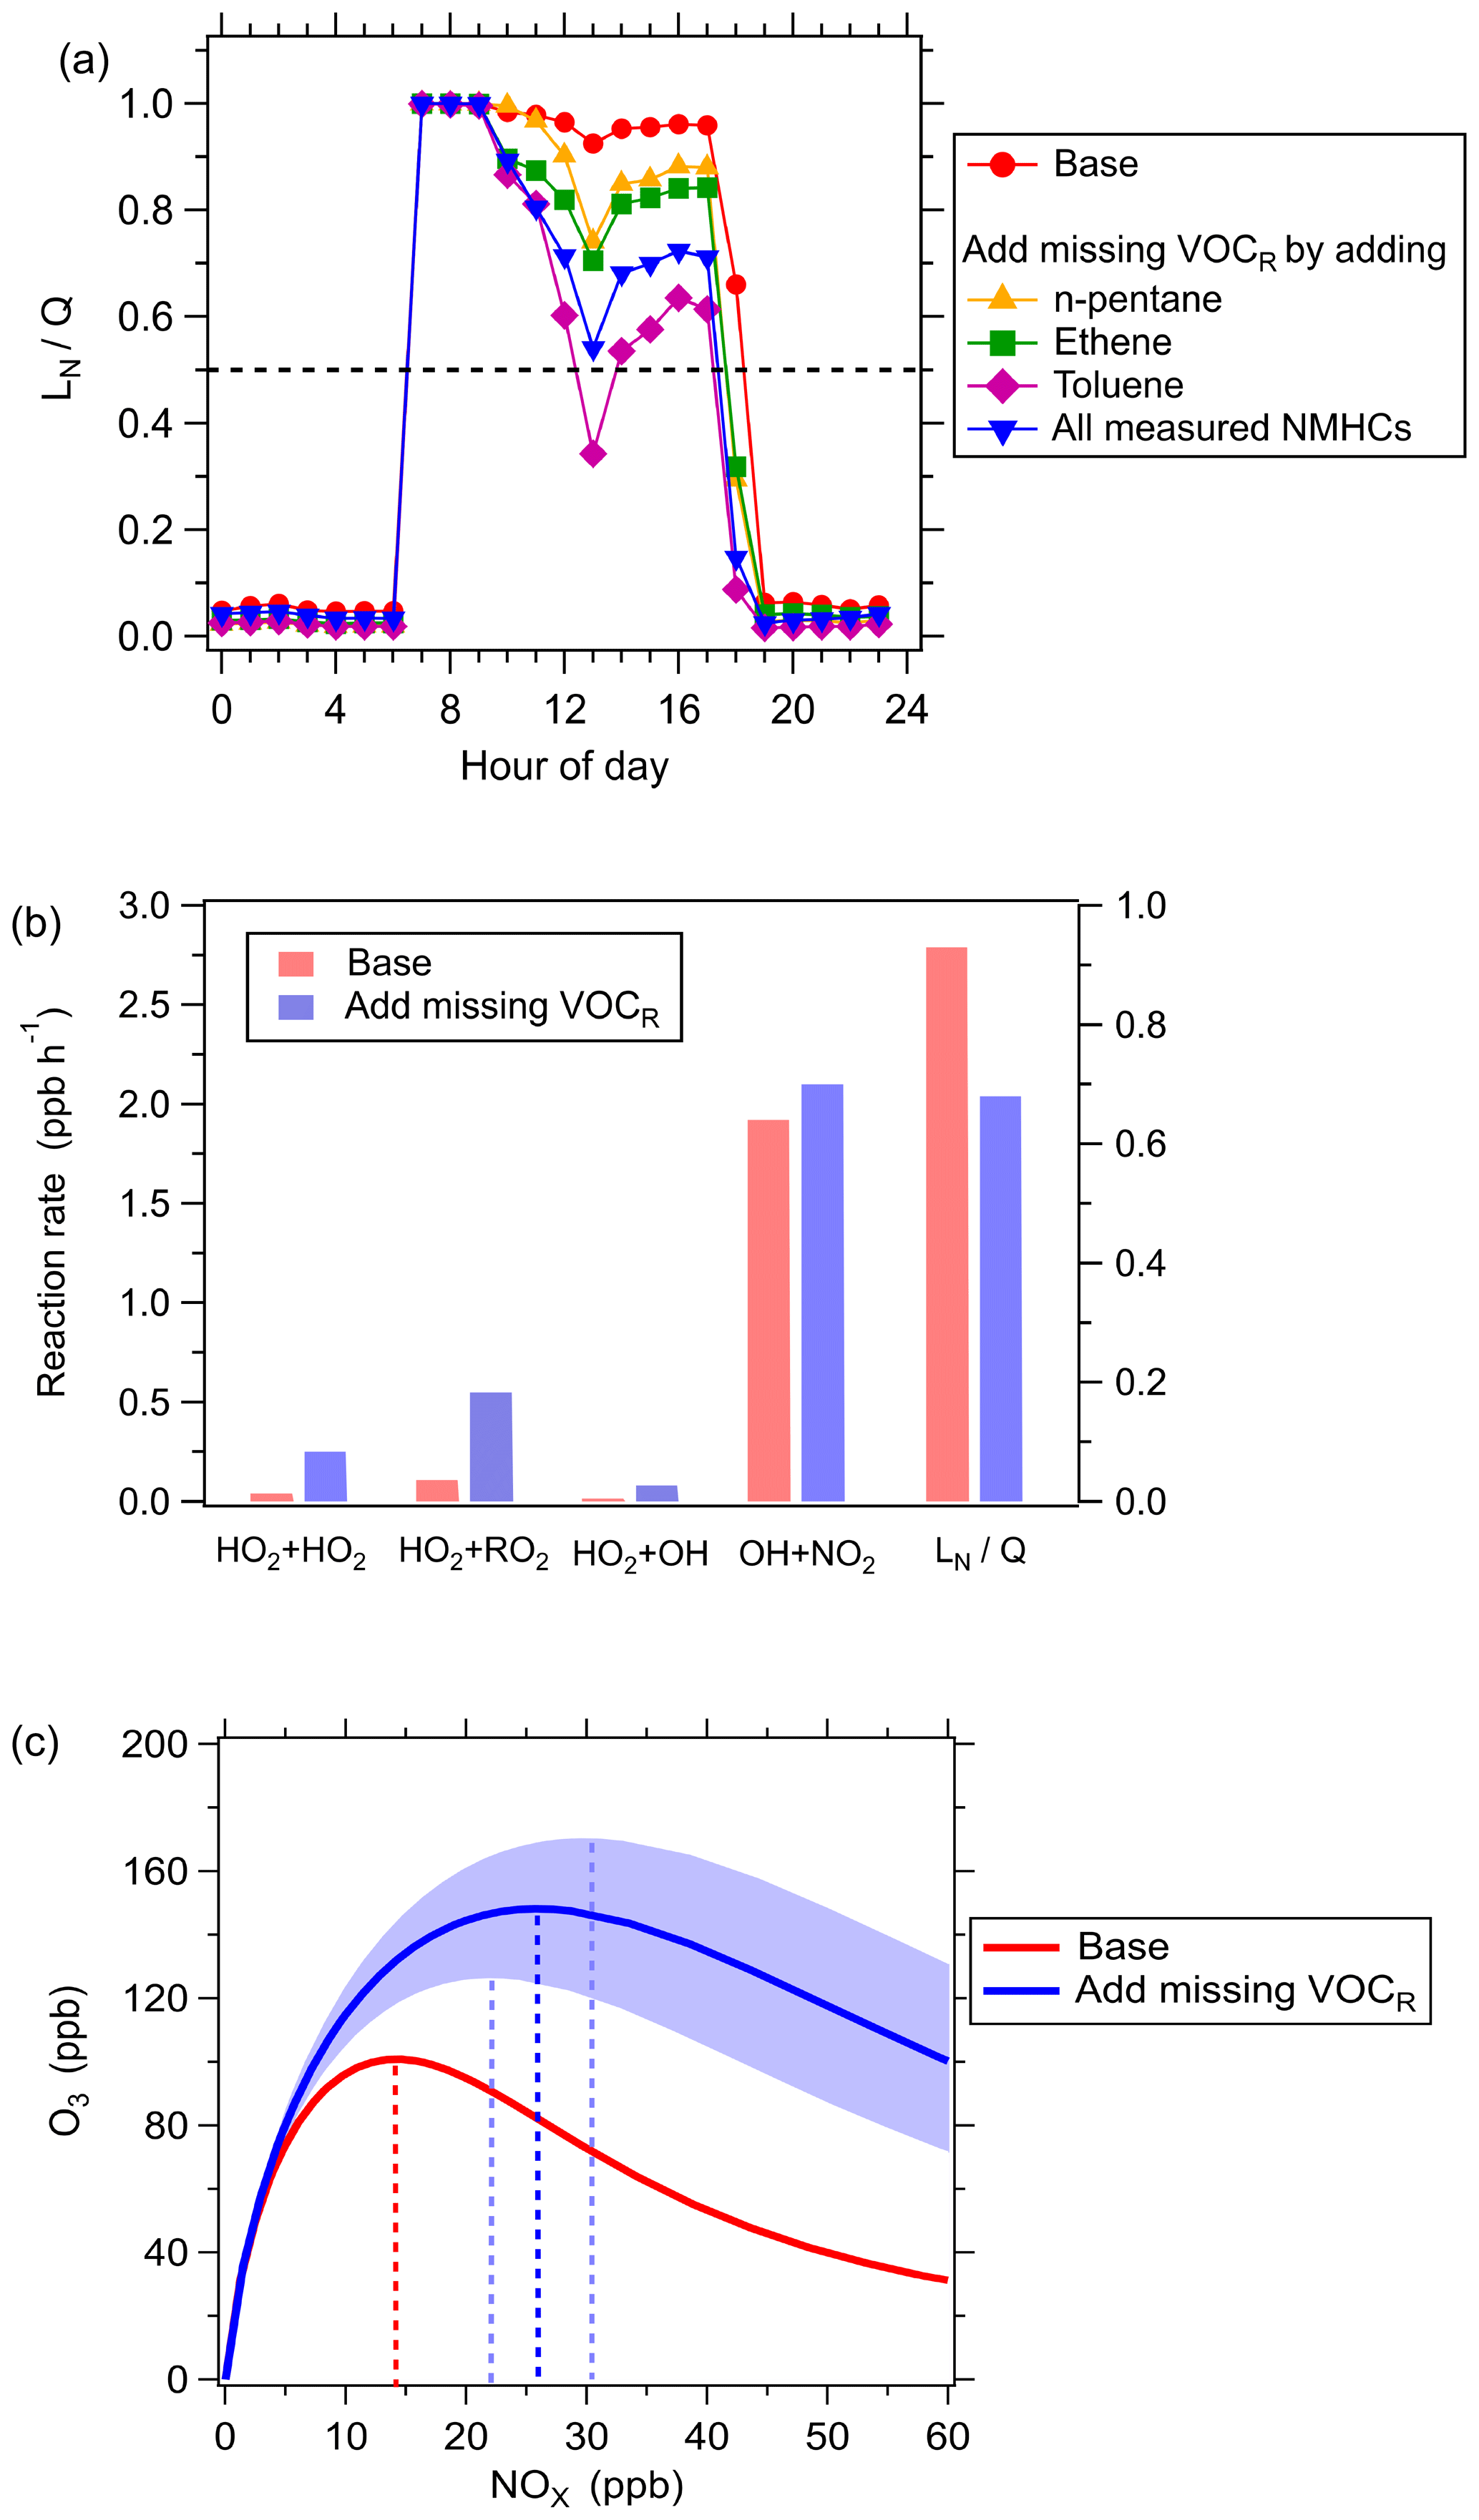
Figure 5The impact of missing VOCR on O3 sensitivity for the high-missing VOCR days. (a) Diurnal variations in for the base scenario and the scenarios considering missing VOCR. The missing VOCR is considered by adding individual species (n-pentane, ethene, or toluene) or increasing all measured NMHCs to fill the missing VOCR. The dashed line represents the threshold value of that distinguishes VOC-limited and NOX-limited regimes. (b) The averages of radical sinks in the afternoon (12:00–18:00) for the base scenario (red bar) and the scenario considering missing VOCR (blue bar) by increasing all measured NMHCs to fill the missing VOCR. (c) Model-simulated dependence of daily peak O3 concentrations on daily mean NOX concentrations for the base scenario (red curve) and the scenario considering missing VOCR (blue curve) by increasing all measured NMHCs to fill the missing VOCR. The dashed lines parallel to the y axis represent the threshold of NOX levels for distinguishing between VOC-limited and NOX-limited regimes. The shaded area represents the standard deviation induced by the uncertainty in the missing VOCR.
Figure 5c shows the dependence of daily peak O3 concentrations on NOX concentrations, which was calculated by the box model for the base scenario and the scenario considering missing VOCR. The NOX concentration level corresponding to the maximum of O3 concentrations was determined. This NOX concentration level reflects the threshold for distinguishing between VOC-limited and NOX-limited regimes. The larger threshold of NOX represents a higher possibility of ozone production in an NOX-limited regime. The threshold of NOX for the scenario considering missing VOCR is 46 % higher than for the base scenario. Note that the uncertainty in missing VOCR leads to 17 % uncertainty in the threshold of NOX for the scenario considering missing VOCR. Overall, Fig. 5 suggests that omitting the missing VOCR will overestimate the degree of the VOC-limited regime and thus overestimate the effect of VOC abatement in reducing ozone pollution, which in turn may mislead ozone control strategy.
3.4 Atmospheric implications
Although many previous studies have reported that photochemical production processes and biogenic emissions are important sources of missing VOCR (Lou et al., 2010; Dolgorouky et al., 2012; Yang et al., 2017; Sanchez et al., 2021; Di Carlo et al., 2004), we find that anthropogenic emissions may dominate the missing VOCR in urban regions. In zero-dimensional box models and three-dimensional chemistry-transport models, the input of VOC emission information mainly contains well-studied simple-structure alkanes, alkenes, and aromatics, while those unmeasured or unknown VOC species have been neglected. This will lead to biases in quantifying ozone production and diagnosing ozone sensitivity regimes. Our study demonstrates that the ambient measurement of ROH at urban sites can provide quantification of missing VOCR, which can be used in models to account for the missing VOCR from anthropogenic emissions. In addition, the parametric equation of missing VOCR derived from the MLR method (Eq. 4) can be used here to estimate missing VOCR according to measurements of CO, OX, and isoprene. Further study should try to parse the specific sources of the missing VOCR, e.g., whether the missing VOCR is from intermediate-volatility and semivolatile organic compounds emitted from vehicles or whether it is from some other sources. Furthermore, future studies can focus on direct measurements of missing VOCR for various emission sources to develop a comprehensive emission inventory of missing VOCR, which will help to improve O3 pollution mitigation strategies.
The observational data and the model code used in this study are available from the corresponding authors upon request (byuan@jnu.edu.cn).
The supplement related to this article is available online at: https://doi.org/10.5194/acp-24-4017-2024-supplement.
BY and WW designed the research. WW and BY prepared the manuscript with contributions from the other authors. WW performed the data analysis with contributions from HS, YC, FB, CX, and CM. JQ, SW, WS, XW, HW, SL, and MS collected data.
At least one of the (co-)authors is a member of the editorial board of Atmospheric Chemistry and Physics. The peer-review process was guided by an independent editor, and the authors also have no other competing interests to declare.
Publisher’s note: Copernicus Publications remains neutral with regard to jurisdictional claims made in the text, published maps, institutional affiliations, or any other geographical representation in this paper. While Copernicus Publications makes every effort to include appropriate place names, the final responsibility lies with the authors.
This work was supported by the National Natural Science Foundation of China (grant nos. 42121004, 42275103, 42230701, and 42175135). This work was also supported by the Special Fund Project for Science and Technology Innovation Strategy of Guangdong Province (grant no. 2019B121205004).
This research has been supported by the National Natural Science Foundation of China (grant nos. 42121004, 42275103, 42230701, and 42175135).
The article processing charges for this open-access publication were covered by the Max Planck Society.
This paper was edited by Rob MacKenzie and reviewed by two anonymous referees.
Atkinson, R.: Atmospheric chemistry of VOCs and NOx, Atmos. Environ., 34, 2063–2101, 2000.
Atkinson, R. and Arey, J.: Atmospheric degradation of volatile organic compounds, Chem. Rev., 103, 4605–4638, 2003.
Burkholder, J., Sander, S., Abbatt, J., Barker, J., Cappa, C., Crounse, J., Dibble, T., Huie, R., Kolb, C., and Kurylo, M.: Chemical kinetics and photochemical data for use in atmospheric studies, evaluation number 19, Pasadena, CA, JPL Publication 19-5, Jet Propulsion Laboratory, National Aeronautics and Space Administration, http://jpldataeval.jpl.nasa.gov (last access: 26 March 2024), 2020.
de Gouw, J. A., Warneke, C., Parrish, D. D., Holloway, J. S., Trainer, M., and Fehsenfeld, F. C.: Emission sources and ocean uptake of acetonitrile (CH3CN) in the atmosphere, J. Geophys. Res.-Atmos., 108, 4329, https://doi.org/10.1029/2002JD002897, 2003.
de Gouw, J., Middlebrook, A., Warneke, C., Goldan, P., Kuster, W., Roberts, J., Fehsenfeld, F., Worsnop, D., Canagaratna, M., and Pszenny, A.: Budget of organic carbon in a polluted atmosphere: Results from the New England Air Quality Study in 2002, J. Geophys. Res.-Atmos., 110, D16305, https://doi.org/10.1029/2004JD005623, 2005.
Di Carlo, P., Brune, W. H., Martinez, M., Harder, H., Lesher, R., Ren, X. R., Thornberry, T., Carroll, M. A., Young, V., Shepson, P. B., Riemer, D., Apel, E., and Campbell, C.: Missing OH reactivity in a forest: Evidence for unknown reactive biogenic VOCs, Science, 304, 722–725, https://doi.org/10.1126/science.1094392, 2004.
Dolgorouky, C., Gros, V., Sarda-Esteve, R., Sinha, V., Williams, J., Marchand, N., Sauvage, S., Poulain, L., Sciare, J., and Bonsang, B.: Total OH reactivity measurements in Paris during the 2010 MEGAPOLI winter campaign, Atmos. Chem. Phys., 12, 9593–9612, https://doi.org/10.5194/acp-12-9593-2012, 2012.
Fuchs, H., Tan, Z., Lu, K., Bohn, B., Broch, S., Brown, S. S., Dong, H., Gomm, S., Häseler, R., He, L., Hofzumahaus, A., Holland, F., Li, X., Liu, Y., Lu, S., Min, K. E., Rohrer, F., Shao, M., Wang, B., Wang, M., Wu, Y., Zeng, L., Zhang, Y., Wahner, A., and Zhang, Y.: OH reactivity at a rural site (Wangdu) in the North China Plain: contributions from OH reactants and experimental OH budget, Atmos. Chem. Phys., 17, 645–661, https://doi.org/10.5194/acp-17-645-2017, 2017.
Goldstein, A. H. and Galbally, I. E.: Known and unexplored organic constituents in the earth's atmosphere, Environ. Sci. Technol., 41, 1514–1521, 2007.
Griffith, S. M., Hansen, R., Dusanter, S., Michoud, V., Gilman, J., Kuster, W., Veres, P., Graus, M., de Gouw, J., and Roberts, J.: Measurements of hydroxyl and hydroperoxy radicals during CalNex-LA: Model comparisons and radical budgets, J. Geophys. Res.-Atmos., 121, 4211–4232, 2016.
Hansen, R. F., Griffith, S. M., Dusanter, S., Rickly, P. S., Stevens, P. S., Bertman, S. B., Carroll, M. A., Erickson, M. H., Flynn, J. H., Grossberg, N., Jobson, B. T., Lefer, B. L., and Wallace, H. W.: Measurements of total hydroxyl radical reactivity during CABINEX 2009 – Part 1: field measurements, Atmos. Chem. Phys., 14, 2923–2937, https://doi.org/10.5194/acp-14-2923-2014, 2014.
Hansen, R. F., Blocquet, M., Schoemaecker, C., Léonardis, T., Locoge, N., Fittschen, C., Hanoune, B., Stevens, P. S., Sinha, V., and Dusanter, S.: Intercomparison of the comparative reactivity method (CRM) and pump–probe technique for measuring total OH reactivity in an urban environment, Atmos. Meas. Tech., 8, 4243–4264, https://doi.org/10.5194/amt-8-4243-2015, 2015.
Jenkin, M. E., Saunders, S. M., Wagner, V., and Pilling, M. J.: Protocol for the development of the Master Chemical Mechanism, MCM v3 (Part B): tropospheric degradation of aromatic volatile organic compounds, Atmos. Chem. Phys., 3, 181–193, https://doi.org/10.5194/acp-3-181-2003, 2003.
Kleinman, L. I.: Low and high NOx tropospheric photochemistry, J. Geophys. Res.-Atmos., 99, 16831–16838, 1994.
Kleinman, L. I., Daum, P. H., Lee, J. H., Lee, Y. N., Nunnermacker, L. J., Springston, S. R., Newman, L., Weinstein-Lloyd, J., and Sillman, S.: Dependence of ozone production on NO and hydrocarbons in the troposphere, Geophys. Res. Lett., 24, 2299–2302, 1997.
Kleinman, L. I., Daum, P. H., Lee, Y. N., Nunnermacker, L. J., Springston, S. R., Weinstein-Lloyd, J., and Rudolph, J.: Sensitivity of ozone production rate to ozone precursors, Geophys. Res. Lett., 28, 2903–2906, 2001.
Kovacs, T., Brune, W., Harder, H., Martinez, M., Simpas, J., Frost, G., Williams, E., Jobson, T., Stroud, C., and Young, V.: Direct measurements of urban OH reactivity during Nashville SOS in summer 1999, J. Environ. Monitor., 5, 68–74, 2003.
Lefohn, A. S., Malley, C. S., Smith, L., Wells, B., Hazucha, M., Simon, H., Naik, V., Mills, G., Schultz, M. G., and Paoletti, E.: Tropospheric ozone assessment report: Global ozone metrics for climate change, human health, and crop/ecosystem research, Elem. Sci. Anth., 6, 27, https://doi.org/10.1525/elementa.279, 2018.
Li, K., Jacob, D. J., Liao, H., Shen, L., Zhang, Q., and Bates, K. H.: Anthropogenic drivers of 2013–2017 trends in summer surface ozone in China, P. Natl. Acad. Sci. USA, 116, 422–427, 2019.
Li, X.-B., Yuan, B., Parrish, D. D., Chen, D., Song, Y., Yang, S., Liu, Z., and Shao, M.: Long-term trend of ozone in southern China reveals future mitigation strategy for air pollution, Atmos. Environ., 269, 118869, https://doi.org/10.1016/j.atmosenv.2021.118869, 2022.
Lou, S., Holland, F., Rohrer, F., Lu, K., Bohn, B., Brauers, T., Chang, C. C., Fuchs, H., Häseler, R., Kita, K., Kondo, Y., Li, X., Shao, M., Zeng, L., Wahner, A., Zhang, Y., Wang, W., and Hofzumahaus, A.: Atmospheric OH reactivities in the Pearl River Delta – China in summer 2006: measurement and model results, Atmos. Chem. Phys., 10, 11243–11260, https://doi.org/10.5194/acp-10-11243-2010, 2010.
Lu, K. D., Hofzumahaus, A., Holland, F., Bohn, B., Brauers, T., Fuchs, H., Hu, M., Häseler, R., Kita, K., Kondo, Y., Li, X., Lou, S. R., Oebel, A., Shao, M., Zeng, L. M., Wahner, A., Zhu, T., Zhang, Y. H., and Rohrer, F.: Missing OH source in a suburban environment near Beijing: observed and modelled OH and HO2 concentrations in summer 2006, Atmos. Chem. Phys., 13, 1057–1080, https://doi.org/10.5194/acp-13-1057-2013, 2013.
Lu, X., Hong, J. Y., Zhang, L., Cooper, O. R., Schultz, M. G., Xu, X. B., Wang, T., Gao, M., Zhao, Y. H., and Zhang, Y. H.: Severe Surface Ozone Pollution in China: A Global Perspective, Environ. Sci. Technol. Lett., 5, 487–494, https://doi.org/10.1021/acs.estlett.8b00366, 2018.
Mihelcic, D., Holland, F., Hofzumahaus, A., Hoppe, L., Konrad, S., Müsgen, P., Pätz, H. W., Schäfer, H. J., Schmitz, T., and Volz-Thomas, A.: Peroxy radicals during BERLIOZ at Pabstthum: Measurements, radical budgets and ozone production, J. Geophys. Res.-Atmos., 108, 8254, https://doi.org/10.1029/2001JD001014, 2003.
Monks, P. S., Archibald, A. T., Colette, A., Cooper, O., Coyle, M., Derwent, R., Fowler, D., Granier, C., Law, K. S., Mills, G. E., Stevenson, D. S., Tarasova, O., Thouret, V., von Schneidemesser, E., Sommariva, R., Wild, O., and Williams, M. L.: Tropospheric ozone and its precursors from the urban to the global scale from air quality to short-lived climate forcer, Atmos. Chem. Phys., 15, 8889–8973, https://doi.org/10.5194/acp-15-8889-2015, 2015.
Nakashima, Y., Kamei, N., Kobayashi, S., and Kajii, Y.: Total OH reactivity and VOC analyses for gasoline vehicular exhaust with a chassis dynamometer, Atmos. Environ., 44, 468–475, https://doi.org/10.1016/j.atmosenv.2009.11.006, 2010.
Nakashima, Y., Kato, S., Greenberg, J., Harley, P., Karl, T., Turnipseed, A., Apel, E., Guenther, A., Smith, J., and Kajii, Y.: Total OH reactivity measurements in ambient air in a southern Rocky mountain ponderosa pine forest during BEACHON-SRM08 summer campaign, Atmos. Environ., 85, 1–8, https://doi.org/10.1016/j.atmosenv.2013.11.042, 2014.
Nölscher, A. C., Yañez-Serrano, A. M., Wolff, S., de Araujo, A. C., Lavrič, J. V., Kesselmeier, J., and Williams, J.: Unexpected seasonality in quantity and composition of Amazon rainforest air reactivity, Nat. Commun., 7, 10383, https://doi.org/10.1038/ncomms10383, 2016.
Paoletti, E., De Marco, A., Beddows, D. C., Harrison, R. M., and Manning, W. J.: Ozone levels in European and USA cities are increasing more than at rural sites, while peak values are decreasing, Environ. Pollut., 192, 295–299, 2014.
Praplan, A. P., Tykka, T., Chen, D., Boy, M., Taipale, D., Vakkari, V., Zhou, P. T., Petaja, T., and Hellen, H.: Long-term total OH reactivity measurements in a boreal forest, Atmos. Chem. Phys., 19, 14431–14453, https://doi.org/10.5194/acp-19-14431-2019, 2019.
Sadanaga, Y., Yoshino, A., Kato, S., and Kajii, Y.: Measurements of OH reactivity and photochemical ozone production in the urban atmosphere, Environ. Sci. Technol., 39, 8847–8852, 2005.
Sanchez, D., Seco, R., Gu, D., Guenther, A., Mak, J., Lee, Y., Kim, D., Ahn, J., Blake, D., Herndon, S., Jeong, D., Sullivan, J. T., McGee, T., Park, R., and Kim, S.: Contributions to OH reactivity from unexplored volatile organic compounds measured by PTR-ToF-MS – a case study in a suburban forest of the Seoul metropolitan area during the Korea–United States Air Quality Study (KORUS-AQ) 2016, Atmos. Chem. Phys., 21, 6331–6345, https://doi.org/10.5194/acp-21-6331-2021, 2021.
Sekimoto, K., Li, S.-M., Yuan, B., Koss, A., Coggon, M., Warneke, C., and de Gouw, J.: Calculation of the sensitivity of proton-transfer-reaction mass spectrometry (PTR-MS) for organic trace gases using molecular properties, Int. J. Mass Spectrom., 421, 71–94, https://doi.org/10.1016/j.ijms.2017.04.006, 2017.
Shetter, R. E. and Müller, M.: Photolysis frequency measurements using actinic flux spectroradiometry during the PEM-Tropics mission: Instrumentation description and some results, J. Geophys. Res.-Atmos., 104, 5647–5661, https://doi.org/10.1029/98JD01381, 1999.
Shirley, T. R., Brune, W. H., Ren, X., Mao, J., Lesher, R., Cardenas, B., Volkamer, R., Molina, L. T., Molina, M. J., Lamb, B., Velasco, E., Jobson, T., and Alexander, M.: Atmospheric oxidation in the Mexico City Metropolitan Area (MCMA) during April 2003, Atmos. Chem. Phys., 6, 2753–2765, https://doi.org/10.5194/acp-6-2753-2006, 2006.
Sillman, S., Logan, J. A., and Wofsy, S. C.: The sensitivity of ozone to nitrogen oxides and hydrocarbons in regional ozone episodes, J. Geophys. Res.-Atmos., 95, 1837–1851, 1990.
Sinha, V., Williams, J., Crowley, J. N., and Lelieveld, J.: The Comparative Reactivity Method – a new tool to measure total OH Reactivity in ambient air, Atmos. Chem. Phys., 8, 2213–2227, https://doi.org/10.5194/acp-8-2213-2008, 2008.
Song, K., Gong, Y., Guo, S., Lv, D., Wang, H., Wan, Z., Yu, Y., Tang, R., Li, T., Tan, R., Zhu, W., Shen, R., and Lu, S.: Investigation of partition coefficients and fingerprints of atmospheric gas- and particle-phase intermediate volatility and semi-volatile organic compounds using pixel-based approaches, J. Chromatogr. A, 1665, 462808, https://doi.org/10.1016/j.chroma.2022.462808, 2022.
Stewart, G. J., Nelson, B. S., Acton, W. J. F., Vaughan, A. R., Farren, N. J., Hopkins, J. R., Ward, M. W., Swift, S. J., Arya, R., Mondal, A., Jangirh, R., Ahlawat, S., Yadav, L., Sharma, S. K., Yunus, S. S. M., Hewitt, C. N., Nemitz, E., Mullinger, N., Gadi, R., Sahu, L. K., Tripathi, N., Rickard, A. R., Lee, J. D., Mandal, T. K., and Hamilton, J. F.: Emissions of intermediate-volatility and semi-volatile organic compounds from domestic fuels used in Delhi, India, Atmos. Chem. Phys., 21, 2407–2426, https://doi.org/10.5194/acp-21-2407-2021, 2021.
Tonnesen, G. S. and Dennis, R. L.: Analysis of radical propagation efficiency to assess ozone sensitivity to hydrocarbons and NOx: 1. Local indicators of instantaneous odd oxygen production sensitivity, J. Geophys. Res.-Atmos., 105, 9213–9225, 2000.
Wang, C., Yuan, B., Wu, C., Wang, S., Qi, J., Wang, B., Wang, Z., Hu, W., Chen, W., Ye, C., Wang, W., Sun, Y., Wang, C., Huang, S., Song, W., Wang, X., Yang, S., Zhang, S., Xu, W., Ma, N., Zhang, Z., Jiang, B., Su, H., Cheng, Y., Wang, X., and Shao, M.: Measurements of higher alkanes using NO+ chemical ionization in PTR-ToF-MS: important contributions of higher alkanes to secondary organic aerosols in China, Atmos. Chem. Phys., 20, 14123–14138, https://doi.org/10.5194/acp-20-14123-2020, 2020.
Wang, H., Zhang, X., and Chen, Z.: Development of DNPH/HPLC method for the measurement of carbonyl compounds in the aqueous phase: applications to laboratory simulation and field measurement, Environ. Chem., 6, 389–397, https://doi.org/10.1071/EN09057, 2009.
Wang, M., Zeng, L., Lu, S., Shao, M., Liu, X., Yu, X., Chen, W., Yuan, B., Zhang, Q., and Hu, M.: Development and validation of a cryogen-free automatic gas chromatograph system (GC-MS/FID) for online measurements of volatile organic compounds, Anal. Method., 6, 9424–9434, 2014.
Wang, Q. Q., Shao, M., Liu, Y., William, K., Paul, G., Li, X. H., Liu, Y. A., and Lu, S. H.: Impact of biomass burning on urban air quality estimated by organic tracers: Guangzhou and Beijing as cases, Atmos. Environ., 41, 8380–8390, https://doi.org/10.1016/j.atmosenv.2007.06.048, 2007.
Wang, W., Li, X., Shao, M., Hu, M., Zeng, L., Wu, Y., and Tan, T.: The impact of aerosols on photolysis frequencies and ozone production in Beijing during the 4-year period 2012–2015, Atmos. Chem. Phys., 19, 9413–9429, https://doi.org/10.5194/acp-19-9413-2019, 2019.
Wang, W., Parrish, D. D., Li, X., Shao, M., Liu, Y., Mo, Z., Lu, S., Hu, M., Fang, X., Wu, Y., Zeng, L., and Zhang, Y.: Exploring the drivers of the increased ozone production in Beijing in summertime during 2005–2016, Atmos. Chem. Phys., 20, 15617–15633, https://doi.org/10.5194/acp-20-15617-2020, 2020.
Wang, W., Parrish, D. D., Wang, S., Bao, F., Ni, R., Li, X., Yang, S., Wang, H., Cheng, Y., and Su, H.: Long-term trend of ozone pollution in China during 2014–2020: distinct seasonal and spatial characteristics and ozone sensitivity, Atmos. Chem. Phys., 22, 8935–8949, https://doi.org/10.5194/acp-22-8935-2022, 2022.
Wu, C., Wang, C., Wang, S., Wang, W., Yuan, B., Qi, J., Wang, B., Wang, H., Wang, C., Song, W., Wang, X., Hu, W., Lou, S., Ye, C., Peng, Y., Wang, Z., Huangfu, Y., Xie, Y., Zhu, M., Zheng, J., Wang, X., Jiang, B., Zhang, Z., and Shao, M.: Measurement report: Important contributions of oxygenated compounds to emissions and chemistry of volatile organic compounds in urban air, Atmos. Chem. Phys., 20, 14769–14785, https://doi.org/10.5194/acp-20-14769-2020, 2020.
Wu, Y., Yang, Y. D., Shao, M., and Lu, S. H.: Missing in total OH reactivity of VOCs from gasoline evaporation, Chinese Chem. Lett., 26, 1246–1248, https://doi.org/10.1016/j.cclet.2015.05.047, 2015.
Xie, X., Shao, M., Liu, Y., Lu, S., Chang, C.-C., and Chen, Z.-M.: Estimate of initial isoprene contribution to ozone formation potential in Beijing, China, Atmos. Environ., 42, 6000–6010, 2008.
Xu, R., Li, X., Dong, H., Lv, D., Kim, N., Yang, S., Wang, W., Chen, J., Shao, M., and Lu, S.: Field observations and quantifications of atmospheric formaldehyde partitioning in gaseous and particulate phases, Sci. Total Environ., 808, 152122, https://doi.org/10.1016/j.scitotenv.2021.152122, 2022.
Yang, Y., Liao, H., and Lou, S.: Increase in winter haze over eastern China in recent decades: Roles of variations in meteorological parameters and anthropogenic emissions, J. Geophys. Res.-Atmos., 121, 13050–13065, https://doi.org/10.1002/2016JD025136, 2016a.
Yang, Y., Shao, M., Wang, X., Nölscher, A. C., Kessel, S., Guenther, A., and Williams, J.: Towards a quantitative understanding of total OH reactivity: A review, Atmos. Environ., 134, 147–161, 2016b.
Yang, Y., Shao, M., Keßel, S., Li, Y., Lu, K., Lu, S., Williams, J., Zhang, Y., Zeng, L., Nölscher, A. C., Wu, Y., Wang, X., and Zheng, J.: How the OH reactivity affects the ozone production efficiency: case studies in Beijing and Heshan, China, Atmos. Chem. Phys., 17, 7127–7142, https://doi.org/10.5194/acp-17-7127-2017, 2017.
Yoshino, A., Sadanaga, Y., Watanabe, K., Kato, S., Miyakawa, Y., Matsumoto, J., and Kajii, Y.: Measurement of total OH reactivity by laser-induced pump and probe technique – comprehensive observations in the urban atmosphere of Tokyo, Atmos. Environ., 40, 7869–7881, https://doi.org/10.1016/j.atmosenv.2006.07.023, 2006.
Yu, Y., Cheng, P., Li, H., Yang, W., Han, B., Song, W., Hu, W., Wang, X., Yuan, B., Shao, M., Huang, Z., Li, Z., Zheng, J., Wang, H., and Yu, X.: Budget of nitrous acid (HONO) at an urban site in the fall season of Guangzhou, China, Atmos. Chem. Phys., 22, 8951–8971, https://doi.org/10.5194/acp-22-8951-2022, 2022.
Yuan, B., Chen, W., Shao, M., Wang, M., Lu, S., Wang, B., Liu, Y., Chang, C.-C., and Wang, B.: Measurements of ambient hydrocarbons and carbonyls in the Pearl River Delta (PRD), China, Atmos. Res., 116, 93–104, 2012.
Yuan, B., Hu, W. W., Shao, M., Wang, M., Chen, W. T., Lu, S. H., Zeng, L. M., and Hu, M.: VOC emissions, evolutions and contributions to SOA formation at a receptor site in eastern China, Atmos. Chem. Phys., 13, 8815–8832, https://doi.org/10.5194/acp-13-8815-2013, 2013.
Yuan, B., Koss, A. R., Warneke, C., Coggon, M., Sekimoto, K., and de Gouw, J. A.: Proton-Transfer-Reaction Mass Spectrometry: Applications in Atmospheric Sciences, Chem. Rev., 117, 13187–13229, https://doi.org/10.1021/acs.chemrev.7b00325, 2017.