the Creative Commons Attribution 4.0 License.
the Creative Commons Attribution 4.0 License.
 | 25 Mar 2024
Assessment of smoke plume height products derived from multisource satellite observations using lidar-derived height metrics for wildfires in the western US
S. Marcela Loría-Salazar
Jaehwa Lee
Heather A. Holmes
As wildfires intensify and fire seasons lengthen across the western US, the development of models that can predict smoke plume concentrations and track wildfire-induced air pollution exposures has become critical. Wildfire smoke plume height is a key indicator of the vertical placement of plume mass emitted from wildfire-related aerosol sources in climate and air quality models. With advancements in Earth observation (EO) satellites, spaceborne products for aerosol layer height or plume injection height have recently emerged with increased global-scale spatiotemporal resolution. However, to evaluate column radiative effects and refine satellite algorithms, vertical profiles of regionally representative aerosol properties from wildfires need to be measured directly. In this study, we conducted the first comprehensive evaluation of four passive satellite remote-sensing techniques specifically designed for retrieving plume height. We compared these satellite products with the airborne Wyoming Cloud Lidar (WCL) measurements during the 2018 Biomass Burning Flux Measurements of Trace Gases and Aerosols (BB-FLUX) field campaign in the western US. Two definitions, namely, “plume top” and “extinction-weighted mean plume height”, were used to derive the representative heights of wildfire smoke plumes, based on the WCL-derived vertical aerosol extinction coefficient profiles. Using these two definitions, we performed a comparative analysis of multisource satellite-derived plume height products for wildfire smoke. We provide a discussion related to which satellite product is most appropriate for determining plume height characteristics near a fire event or estimating downwind plume rise equivalent height, under multiple aerosol loadings. Our findings highlight the importance of understanding the sensitivity of different passive remote-sensing techniques on space-based wildfire smoke plume height observations, in order to resolve ambiguity surrounding the concept of “effective smoke plume height”. As additional aerosol-observing satellites are planned in the coming years, our results will inform future remote-sensing missions and EO satellite algorithm development. This bridges the gap between satellite observations and plume rise modeling to further investigate the vertical distribution of wildfire smoke aerosols.
Please read the corrigendum first before continuing.
-
Notice on corrigendum
The requested paper has a corresponding corrigendum published. Please read the corrigendum first before downloading the article.
-
Article
(5418 KB)
- Corrigendum
-
Supplement
(3340 KB)
-
The requested paper has a corresponding corrigendum published. Please read the corrigendum first before downloading the article.
- Article
(5418 KB) - Full-text XML
- Corrigendum
-
Supplement
(3340 KB) - BibTeX
- EndNote


Characterizing the vertical extent of wildfire smoke aerosols near active fire hotspots, also known as the plume injection height (PIH) or smoke aerosol layer height (ALH), is a critical task in simulating the long-range transport of wildfire smoke. From a physical perspective, the initial PIH at a fire can be described as the height where the relatively stable vertical atmospheric layer is located, causing the smoke plume to accumulate, and where the updrafts generated by the buoyancy above the fire terminate (Kahn et al., 2007; Labonne et al., 2007; Paugam et al., 2015). The PIH is commonly viewed as the vertical height to which a buoyant plume core can lift the polluted air mass before the smoke plume begins to bend over horizontally (Raffuse et al., 2012). Often plume heights near or downwind of active fire areas are treated as equivalent to PIH values. Wildfire smoke plumes move horizontally in single layers through the atmosphere, but some may become stratified into multiple discrete layers (Mardi et al., 2018; Deng et al., 2022b). However, it is impossible to distinguish aerosol layering at multiple heights without vertically resolved smoke aerosol profiles. Consequently, a single height value is often applied and obtained from physics-based numerical models or passive remote-sensing retrievals. Regardless of whether the vertical structure of wildfire smoke aerosols is homogenous or heterogenous, a columnar plume height retrieved from satellites is considered a representative ALH. This study focuses on the smoke-specific plumes from wildfires in the western United States (WUS); therefore, we will use the smoke plume height (SPH) to denote this.
The wildfire SPH observed from space has advanced in spatiotemporal resolution since the 2000s (Kahn et al., 2007; Ichoku et al., 2012; Lyapustin et al., 2019; Kahn, 2020). Passive satellite sensors are used to map the global wildfire SPH distribution, spanning a range of recently developed techniques and retrieval algorithms. It is important to note that each method to obtain satellite SPH retrievals utilizes a distinct remote-sensing technique, resulting in inconsistent definitions of the SPH. To shed light on their differences, a brief overview of these methods is provided to demonstrate why they yield differing plume height interpretations.
The photogrammetric stereo capability of the Multi-Angle Imaging SpectroRadiometer (MISR) aboard the National Aeronautics and Space Administration (NASA) Earth Observing System's Terra spacecraft (Diner et al., 1998), combined with the MISR Interactive Explorer (MINX) tool (Nelson et al., 2008, 2013), provides “wind-corrected” SPH values of elevated smoke aerosols. This approach takes into account feature displacements caused by the plume movement and the stereo parallax shift among different camera views. Another approach to retrieve the SPH takes advantage of the altitude dependence of the absorption spectroscopic characteristics of molecular oxygen (O2) in the A band at 759–771 nm or the B band at 686–695 nm or the O2–O2 spectral band at 477 nm. This approach has been successfully applied to a number of passive satellite-supported instruments, including (but not limited to) POLDER/PARASOL (the POLarization and Directionality of the Earth's Reflectance mounted on the Polarization and Anisotropy of Reflectances for Atmospheric Sciences coupled with Observations from a Lidar platform; Dubuisson et al., 2009), MERIS/ENVISAT (the MEdium Resolution Imaging Spectrometer installed on the Environmental Satellite; Duforêt et al., 2007; Dubuisson et al., 2009), SCIAMACHY/ENVISAT (the SCanning Imaging Absorption SpectroMeter for Atmospheric CHartographY aboard the Environmental Satellite; Corradini and Cervino, 2006; Sanghavi et al., 2012), GOME-2/MetOp (the Global Ozone Monitoring Experiment-2 flying on the Meteorological Operational series of satellites; Sanders et al., 2015; Nanda et al., 2018a; Michailidis et al., 2021), OMI/Aura (the Ozone Monitoring Instrument aboard the Aura spacecraft; Chimot et al., 2017, 2018), EPIC/DSCOVER (the Earth Polychromatic Imaging Camera loaded on the Deep Space Climate Observatory; Xu et al., 2019; Lu et al., 2021), and TROPOMI/S5P (the TROPOspheric Monitoring Instrument carried on the Copernicus Sentinel-5 Precursor mission; Griffin et al., 2020; Nanda et al., 2020; Chen et al., 2021). Other approaches utilize the ultraviolet (UV; 340–380 nm) or thermal infrared (TIR; 11 µm) bands, which are sensitive to the vertical distribution of absorbing aerosols (e.g., smoke and mineral dust) or absorption by gases released from fires (together with smoke aerosols), respectively. Using bands included in wide-swath passive sensors means that these approaches can provide the SPH globally. Based on the sensitivity of backward UV radiance to the height of absorbing aerosols (e.g., dust and smoke) in a Rayleigh scattering atmosphere (Hsu et al., 1996; Torres et al., 1998; Hsu et al., 1999), previous studies have proposed an algorithm called Aerosol Single-scattering albedo and Height Estimation (ASHE) that jointly retrieves ALH and single-scattering albedo (SSA) using the UV aerosol index (UVAI), aerosol optical depth (AOD), and spaceborne lidar backscatter profile from multi-sensor measurements (Jeong and Hsu, 2008; Lee et al., 2015, 2016). In a subsequent study, Lee et al. (2020) revised the ASHE algorithm to function without the lidar backscatter profile. Lyapustin et al. (2019) and Cheeseman et al. (2020) introduced the brightness temperature contrast approach that uses the Moderate Resolution Imaging Spectroradiometer (MODIS) TIR band (11 µm) for smoke plume identification and characterization. Using this technique, daily SPH values are retrieved on a global sinusoidal grid as part of the Multi-Angle Implementation of Atmospheric Correction (MAIAC) atmospheric product MCD19A2.
Passive satellites provide widespread coverage on a regular basis while incurring minimal recurring cost and posing no risk to observers. However, dense smoke plumes, cloud cover, or scan gaps between adjoining orbits of Sun-synchronous polar satellites can result in unsuccessful retrievals (Lyapustin et al., 2008). As a complement to these passive retrievals, active spaceborne lidars like CALIOP/CALIPSO (the Cloud-Aerosol Lidar with Orthogonal Polarization aboard the Cloud-Aerosol Lidar and Infrared Pathfinder Satellite Observation satellite; Winker et al., 2009) and CATS/ISS (the Cloud-Aerosol Transport System installed on the International Space Station; McGill et al., 2015) offer high-resolution vertical profiles of aerosol optical signals. While these spaceborne lidars enhance the detection of thin smoke layers, they are bound by a narrow, pencil-like swath, providing limited spatial coverage (see Fig. 9 in Loría-Salazar et al., 2021). Another limitation of remote-sensing instruments on polar-orbiting satellites is that they do not resolve the diurnal variation in wildfire activity.
Endeavors to investigate fire behavior and the associated air quality (AQ) impacts have predominantly relied on the use of field data and satellite-based retrievals. Passive and active remote-sensing techniques are complementary because of their different observational methods. The deliberate collocation of passive and active techniques provides synergistic insights into missing pieces of fire information that may not be attainable by either method in isolation (D. Liu et al., 2019; Sicard et al., 2019). Unfortunately, in the Intermountain West region of the US, there remains a lack of detailed vertical profiles of aerosol optical properties, despite recent field experiments such as the Fire Influence on Regional to Global Environments and Air Quality (FIREX-AQ) experiment; the Western wildfire Experiment for Cloud chemistry, Aerosol absorption and Nitrogen (WE-CAN); the Biomass Burning Flux Measurements of Trace Gases and Aerosols (BB-FLUX) experiment; and the Fire and Smoke Model Evaluation Experiment (FASMEE). Furthermore, to date, there is no universally accepted methodology for directly deriving the SPH from aerosol extinction or backscatter vertical profiles due to the ambiguous use and definition of the term “effective SPH” (Xu et al., 2017). This poses a challenge, particularly when one wants to compare columnar SPH values from passive remote sensors with the retrieved three-dimensional (3D) distribution of the smoke aerosol vertical structure from active remote sensors.
The primary objective of this study is to address the central research question: which SPH definition corresponds to the most physically relevant plume height for a specific satellite SPH retrieval algorithm? We introduce two SPH definitions using vertical profiles of smoke aerosol from airborne lidar data. We then quantify the sensitivity of four passive remote-sensing techniques to columnar SPH observations with respect to these two definitions, accounting for the effects of local meteorology, distance from the active fire source, and smoke aerosol loading. Meanwhile, we explore an optimal collocation strategy to compare satellite retrievals with lidar measurements, considering instrument discrepancies in observing the SPH experimentally. To the best of our knowledge, we present the first comprehensive assessment of multiple satellite-derived SPH products compared with aircraft lidar data. It is important to note here that there were no coincident satellite-based lidar overpasses for our field campaign data; therefore, they are not included in our results. This omission underscores the difficulties in directly comparing spaceborne lidar products with data from aircraft campaigns. The results of our study clarify the meaning of effective SPH in the remote-sensing and modeling communities, filling a critical gap in uniform plume height comparisons. Our findings also meet the urgent need for a suite of remotely sensed datasets to evaluate the performance of present and future dynamic smoke plume models and smoke modeling frameworks or to provide inputs to these models that improve the SPH characterization required to model the downwind pollutant transport.
2.1 The satellite-based wildfire SPH
The following four space-based wildfire SPH retrievals will be discussed in our study: (1) the MODIS aerosol product using the MAIAC algorithm (MODIS/MAIAC); (2) the MISR-based global SPH database that can be accessed via the MISR Enhanced Research and Lookup Interface (MISR/MERLIN); (3) the Visible Infrared Imaging Radiometer Suite (VIIRS) aerosol product using the ASHE algorithm (VIIRS/ASHE); and (4) the TROPOMI-based ALH product (TROPOMI/ALH). Here, the SPH products from the different instruments retrieved with different methods are named using the passive sensor name and the corresponding retrieval algorithm or dataset name. Table 1 provides further information about these passively remotely sensed SPH products.
Table 1Summary of multisource satellite-derived plume height products.
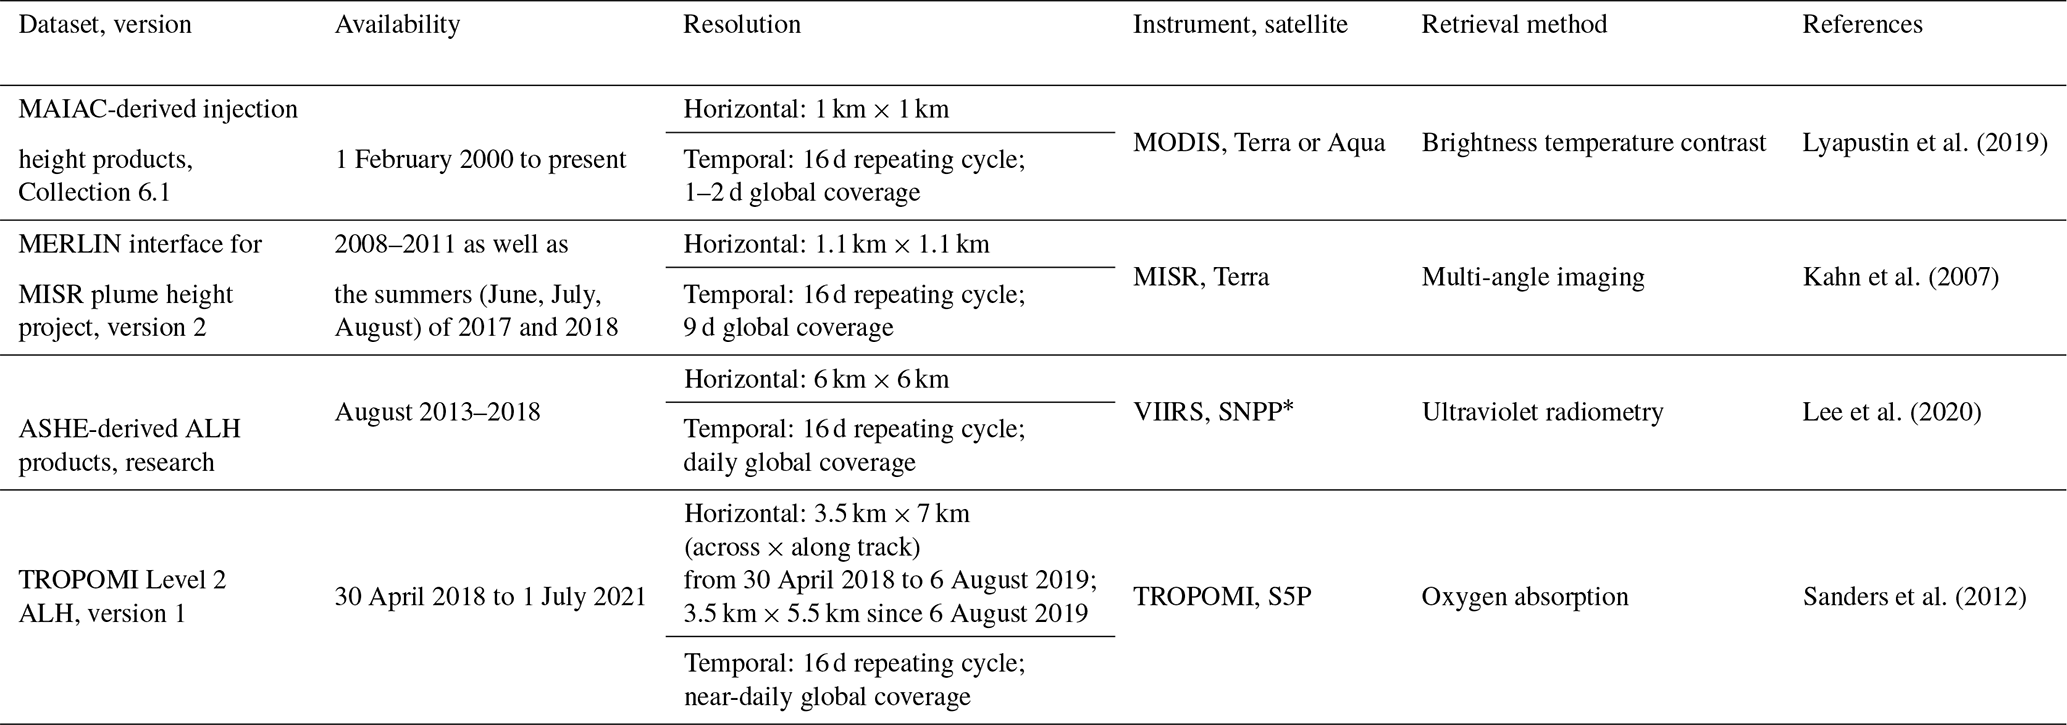
* Data from VIIRS sensors on other satellite platforms were unavailable for this study.
2.1.1 MODIS/MAIAC
MODIS sensors are located on the Terra (morning sensor, 10:30 LST, local solar time, crossing the Equator) and Aqua (afternoon sensor, 13:30 LST crossing the Equator) satellite platforms and operate in the TIR spectrum to detect active fires (Salomonson et al., 2002). This twin-MODIS design covers most regions near the Equator with at least four observations per day. The number of observations increases as one approaches the poles due to overlapping orbits. The MAIAC algorithm uses MODIS data to obtain the near-fire-source aerosol injection height, known as the MCD19A2 dataset, with high resolution (1 km).
By assuming a fixed lapse rate, the MAIAC PIH algorithm utilizes the negative thermal contrast at 11 µm between smoke and sufficient neighboring smoke-free pixels and converts the colder brightness temperature into SPH estimates (Lyapustin et al., 2019; Cheeseman et al., 2020). The valid range for the MAIAC-based SPH is up to 10 km. However, the SPH calculation struggles with large smoke areas and small fires emitting low levels of absorbing gases, meaning it requires a high enough plume opacity (AOD at 470 nm ≥ 0.8) to obtain a useful signal. When compared with other SPH datasets, such as MISR and CALIOP, MAIAC tends to significantly underestimate the height of smoke plumes, particularly for transporting dilute smoke downwind of the fire (Lyapustin et al., 2019). In spite of these limitations, the MAIAC algorithm provides valuable information within approximately 75–150 km of the identified thermal hotspots, i.e., fire (Loría-Salazar et al., 2021).
2.1.2 MISR/MERLIN
With its nine fixed push-broom cameras, MISR aboard NASA's Terra satellite captures images from nine different angles and four spectral bands, allowing for studies of wildfire and aerosol distributions using the stereoscopic technique, unaffected by bright surfaces (Moroney et al., 2002; Muller et al., 2002). The wealth of data collected by the MISR instrument over 2 decades offers valuable insights into the global climatology of fire in the environment, across geographic regions, biomes, and seasons (Val Martin et al., 2018; Gonzalez-Alonso et al., 2019). The publicly available database built using manually post-processed MISR products has been used to evaluate plume rise models (e.g., Ke et al., 2021) and other satellite-derived datasets (e.g., Lyapustin et al., 2019; Griffin et al., 2020). Recently, an interactive visualization tool called MERLIN was developed to facilitate the exploration and accessibility of over 70 000 records of global wildfire plume height retrievals (Boone et al., 2018; Nastan et al., 2022).
MISR's global SPH mapping, with a 250–500 m vertical resolution, complements aerosol height curtains obtained from spaceborne lidar systems (Kahn et al., 2007, 2008; Val Martin et al., 2018). However, Tosca et al. (2011) found that the stereo-derived SPH from MISR was significantly lower than the top altitude observed by CALIOP for the 2006 Indonesian fires. Nevertheless, important lessons can be drawn from the underestimated SPH values in the MISR product. First, the overpass time of MISR in the morning precedes the daytime peak in fire activity, typically in late afternoons when temperatures are highest and relative humidity is lowest. Second, very few coincident overpasses exist over fires during a short time of interest due to the narrow MISR swath, which allows global coverage only approximately once per week. Additionally, the revisit period of MISR for a specific geographical spot varies from 2 to 9 d, depending on the latitude (Kahn et al., 2007). Finally, the MISR automated stereoscopic image's dependence on optically distinct plume-like features for accurate height estimation can introduce bias, mainly when dealing with thin smoke or smoke downwind of the active fire source with less defined boundaries (Nelson et al., 2013). However, blue-band data at a 1.1 km horizontal cell size are considered a better choice for capturing the higher injection heights associated with fine smoke aerosols than the corresponding red-band retrievals at the spatial resolution of 275 m (Nelson et al., 2013). In this study, we extracted blue-band, wind-corrected heights with “good” quality flags downloaded from MERLIN. This preference is due to the blue band's (446.4 ± 41.9 nm) sensitivity to thinner aerosol layers, enabling the detection of aerosol features at higher altitudes.
2.1.3 VIIRS/ASHE
The launch of operational VIIRS sensors has been planned for the Joint Polar Satellite System (JPSS) series since 2011, in anticipation of the post-MODIS era (Cao et al., 2013a, b; Goldberg et al., 2013; Wolfe et al., 2013; Wang and Cao, 2019). VIIRS currently flies on three polar-orbiting satellites: the Suomi National Polar-orbiting Partnership (SNPP) and the National Oceanic and Atmospheric Administration-20 (NOAA-20) and NOAA-21 satellites. This study uses data from SNPP VIIRS. The VIIRS instrument has a wide swath of 3040 km and can observe the entire Earth twice a day: once during the day and once during the night. There are some overlaps between consecutive swaths, which means that midlatitudes will experience up to four looks per day (Wolfe et al., 2013). Even though the SNPP VIIRS data have enhanced radiometric measurement quality, a broad spectral range, and a fine spatial resolution (Csiszar et al., 2014; Schroeder et al., 2014), the limited temporal information may curtail its efficacy for delineating fire perimeters and assessing fire spread, especially during short fire durations (Cardil et al., 2019).
The research version of the ASHE algorithm (transition to operational processing is underway at the time of writing) provides the plume height of UV-absorbing aerosols like smoke and dust over broad areas, including both near-source and transported plumes (Loría-Salazar et al., 2021). Initially, it leveraged the AOD and Ångström extinction exponent (AEE) from the MODIS or VIIRS aerosol product in its retrieval process as well as the ALH along the CALIOP track as a constraint (Jeong and Hsu, 2008; Lee et al., 2015). By assuming a spatially invariant SSA retrieved along the CALIOP track over a MODIS/VIIRS granule, the height retrieval can be extended beyond the narrow CALIOP track, thereby improving spatiotemporal coverage. This study makes use of a release candidate of ASHE that does not use the CALIOP constraints and leverages the synergy between the VIIRS and Ozone Mapping and Profiler Suite Nadir Mapper (OMPS-NM) for UV measurements (Lee et al., 2020). To further improve its performance, a systematic optimization of the smoke optical models used in the algorithm was carried out by iteratively comparing the retrieved ALH and SSA with those from CALIOP and ground-based measurements offline until satisfactory similarity was found between the results (e.g., Jeong et al., 2022). Its application is limited to UV-absorbing aerosols with moderate to thick optical depths (AOD at 550 nm > 0.5–1.0), rendering it ineffective for aerosols with lower optical depths. Preliminary evaluation indicates that the ASHE-retrieved SPH has an uncertainty of 1–1.2 km (or 30 %–40% for an SPH of 3 km) for heavy aerosol loading cases (AOD > 1) (Lee et al., 2016, 2020). The uncertainty is dependent on errors in the retrieved AOD, assumed aerosol optical model, and surface reflectance, and it generally decreases with increasing AOD. It should be noted that OMPS-NM aboard SNPP has a relatively coarse spatial resolution of ∼ 50 × 50 km2 near nadir (∼ 200 × 100 km2 near the edge of the across-track scan), indicating that it has limitations for small-scale (subpixel) smoke plumes. Although there are multiple VIIRS instruments, the ASHE product is currently only available for SNPP VIIRS. It is anticipated that this retrieval algorithm will be implemented for other VIIRS instruments in the future.
2.1.4 TROPOMI/ALH
The TROPOMI instrument is the single payload aboard the European Space Agency (ESA) S5P satellite mission, planned for 2017–2024. TROPOMI is a spectrometer that monitors key atmospheric constituents and aerosol and cloud properties by observing reflected sunlight across the spectral bands in the UV, the visible (270–500 nm), the near-TIR (675–775 nm), and the shortwave TIR (2305–2385 nm) ranges. Compared with its predecessors (OMI and SCIAMACHY), TROPOMI provides high-spatial-resolution information and is capable of daily global coverage and near-real-time data, enabling regular monitoring and rapid assessment of changes in the Earth's atmosphere (Veefkind et al., 2012).
By analyzing the spectral signature of light that is absorbed by O2 in the A band in the near-TIR wavelength range between 759 and 770 nm, the TROPOMI ALH algorithm estimates the height of aerosol plumes in the atmosphere (Sanders et al., 2012; Nanda et al., 2019). It has been shown to be effective in retrieving high plumes up to 8 km a.g.l. (above ground level) in height, with reduced uncertainties for thicker and lower plumes between 1 and 4.5 km a.g.l. (Griffin et al., 2020) as well as for dark surfaces (Nanda et al., 2018b). However, it was found to be biased low compared with other SPH datasets such as MISR and CALIOP, most likely due to its tendency to return an intermediate plume height when multiple aerosol layers are present (Griffin et al., 2020; Nanda et al., 2020). In addition, Nanda et al. (2020) showed that cloud contamination has an impact on the TROPOMI/ALH product, as it is unable to distinguish between cloud and aerosol signals from the measured radiances. In this study, we only used data with a quality assurance value larger than 0.5 to filter and remove the predominately cloudy scenes or retrievals with geolocation errors.
2.2 Airborne lidar measurements
The 2018 BB-FLUX field campaign deployed the upward-pointing Wyoming Cloud Lidar (WCL) on the University of Wyoming King Air (UWKA) research aircraft that sampled smoke plumes from more than 20 wildfires during 35 flights over the WUS. The airborne WCL measurements of the attenuated backscattering coefficient and lidar depolarization ratio were calibrated on a per-flight basis. The vertical aerosol extinction profiles (in units of per kilometer) were retrieved with Fernald's method, assuming a constant lidar ratio of 60, and evaluated with in situ measurements (see Deng et al., 2022a, for details). Table 2 lists nine wildfire cases, including locations, start and containment dates, and acres burned (Geospatial Multi-Agency Coordination Group, 2019). It also summarizes 11 flight missions from August 2018, selected for the number of collocated pairs between valid lidar transects and satellite overpasses, with the flight trajectories illustrated in Fig. 1. The chosen flights are limited to smoke plumes that could be attributed to a specific wildfire. Other flights during the campaign were excluded from this study because they target prescribed fires, small wildfires, clouds, and aged smoke plumes. Small fires were not included, in part, because of the expected large uncertainties in satellite retrievals of the relatively low SPH values (ranging from hundreds of meters for prescribed fires to thousands of meters for small fires). Large errors for smoke aerosol layers within the boundary layer arise from a mismatch between the coarse spatial resolution of satellite pixels and the fine-scale smoke plume variability inherent in wildfire activity (Geddes and Boesch, 2015).
Table 2Summary of 9 wildfire cases, including their general information, and the corresponding 11 flight missions from August 2018. A flight name is denoted by its date and “a” if the flight occurred in the morning or by its date and “b” if it occurred in the afternoon. Note that the average distance between the aircraft and the active fire source was estimated using the geodesic distance from the fire center to the reconstructed lidar vertical cross-section.
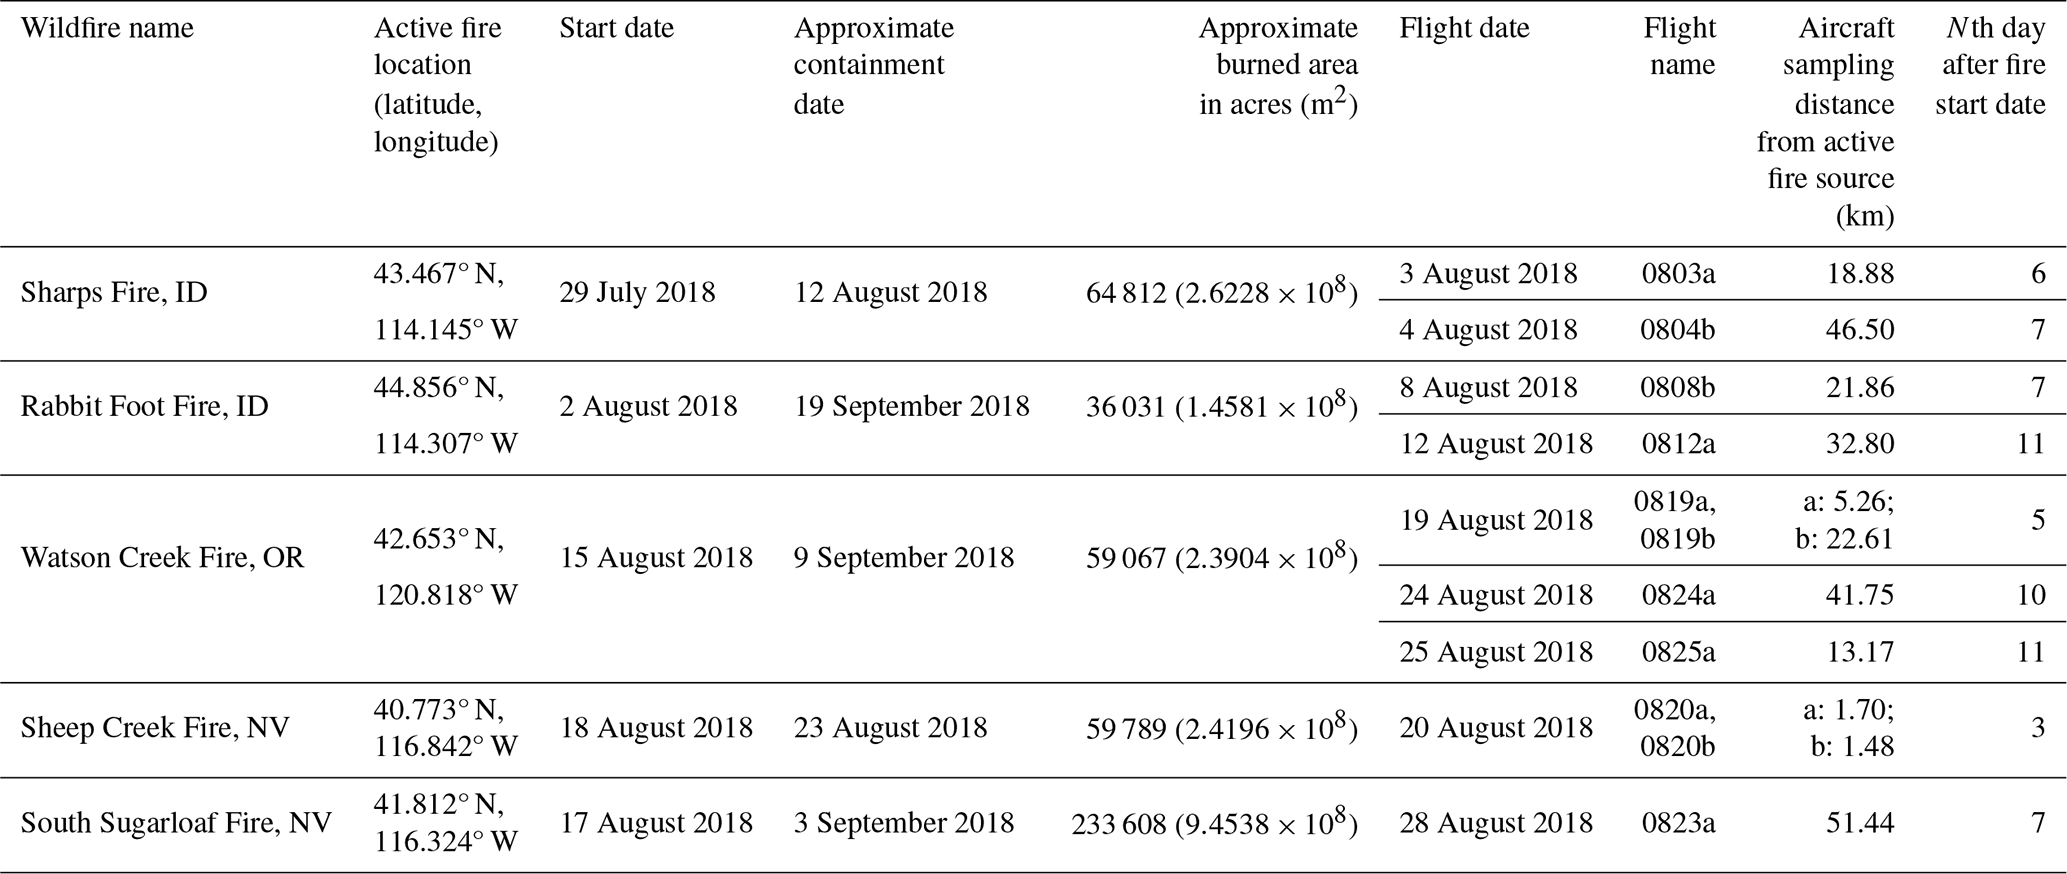
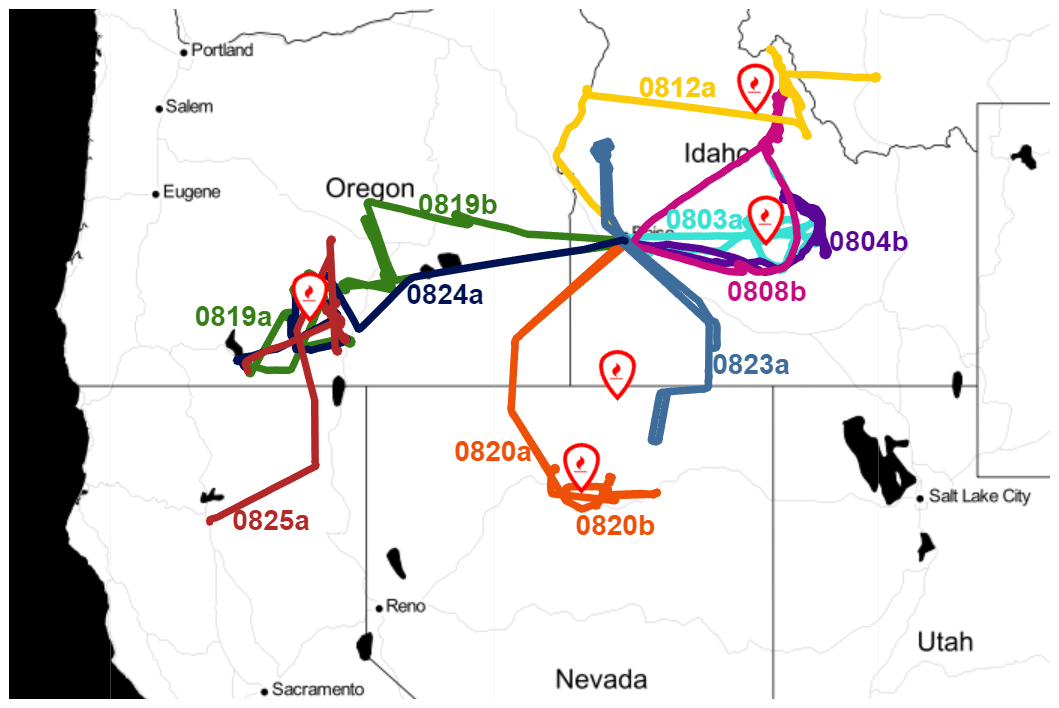
Figure 1The 11 color-coded UWKA flight trajectories during the 2018 August BB-FLUX project, each of which is associated with 1 of 9 wildfire cases denoted by fire icons.
We re-gridded valid WCL two-dimensional (2D) transects at a vertical resolution of 3 m and an along-track horizontal resolution of about 1.1 km to calculate the SPH and columnar AOD throughout the atmosphere. Compared with satellite observations, the re-gridded WCL measurements have a much smaller field of view in the cross-track direction; therefore, the WCL can show much finer spatial variations in smoke. Moreover, it should be noted that the WCL can be fully attenuated in dense smoke and unable to detect the actual SPH, and the aircraft might fly above the plume bottom, so the upward-looking WCL only samples the partial AOD of the aerosol vertical profile, which fundamentally differs from the AOD derived from satellite retrievals.
3.1 Definitions of the wildfire SPH estimates
The extinction coefficient is a key parameter for the fundamental radiative transfer calculations of wildfire smoke aerosols from the surface to the top of the atmosphere (TOA) (e.g., Ansmann et al., 2018; Solomon et al., 2022) and can be related to the particle mass (or volume) concentration (e.g., Mamouri and Ansmann, 2016; Toth et al., 2019; Ansmann et al., 2021). In previous studies, the aerosol extinction coefficient has been one of the most frequently observed and reported aerosol optical properties for characterizing the vertical structure of the atmosphere and developing a height retrieval algorithm (Gordon, 1997; Dubovik et al., 2011; Sanghavi et al., 2012; Hollstein and Fischer, 2014; Ding et al., 2016; Wu et al., 2016; Xu et al., 2017). Lidar-based active remote-sensing technology provides an attenuated backscatter signal intensity that is processed by designating an extinction-to-backscatter ratio to produce vertical profiles of the aerosol extinction coefficient (Liu et al., 2015; Rosati et al., 2016; Baars et al., 2021).
Two definitions have been proposed and widely used to derive a representative height of wildfire smoke plumes based on the vertical distribution of aerosol extinction coefficient at a given spectral wavelength from active lidar measurements. The concept of effective SPH can be defined either through smoke aerosol layer boundaries or by considering the complete vertical profile (Fig. 2). One method identifies the topmost height of the plumes according to the geometric boundary of the aerosol layers (SPHtop). Another approach adopts the average height of the aerosol layers, weighted by the extinction (or backscatter) coefficient that reflects the radiative properties of wildfire smoke particles (SPHext). In this section, we provide a detailed explanation of these two definitions and apply them to the WCL-measured vertical profiles of the aerosol extinction coefficient. The height hereinafter is computed in kilometers above ground level.
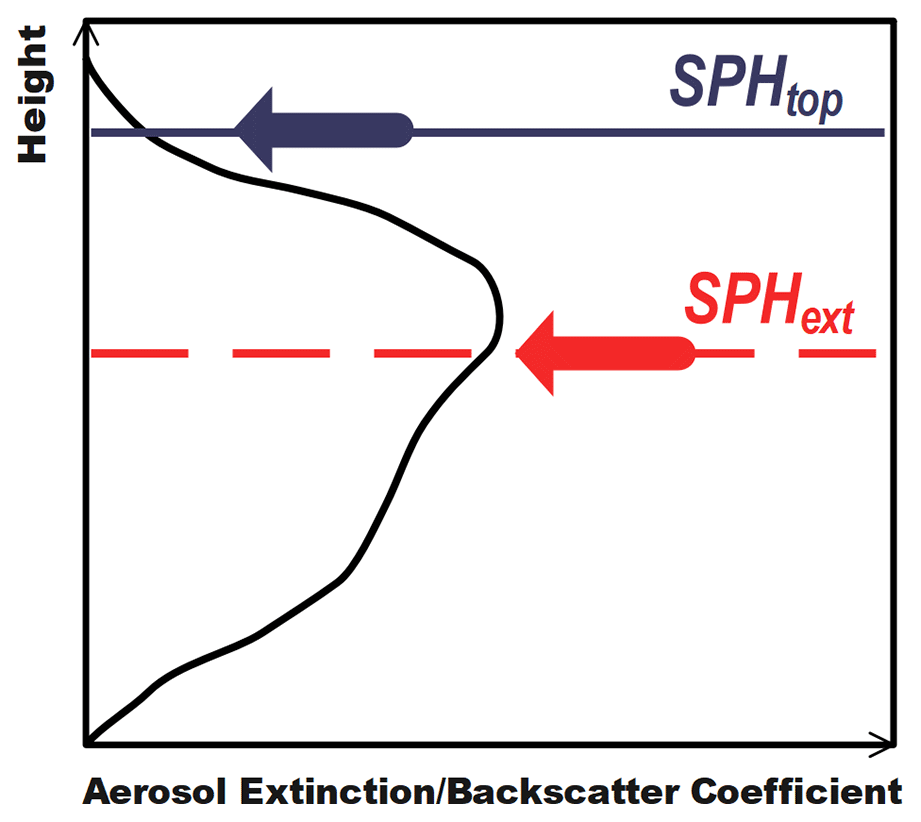
Figure 2Schematic of two standard SPH definitions, SPHtop and SPHext, proposed in our study.
3.1.1 Plume top (SPHtop)
This definition is built on the wavelet covariance transform (WCT) approach given by Gamage and Hagelberg (1993), which is an automatic algorithmic process to extract geometrical features of interest. As it can detect the aerosol layer locations of subtle but coherent transitions according to their strength and sign, the WCT analysis has been applied to detect realistic high-resolution atmospheric structures at a variety of vertical spatial scales, such as a well-mixed convective boundary layer top (e.g., Brooks, 2003; Baars et al., 2008) and the edges of lofted aerosol layers (e.g., Davis et al., 2000; Siomos et al., 2017). Here, we focus on the derivation for the height of the wildfire smoke plume top, referred to as SPHtop.
The WCT method is expressed as
with a step function, the so-called Haar wavelet ha,b(z), which can be defined as
In Eq. (1), f(z) is the lidar signal of interest as a function of height above ground level z (which is the aerosol extinction profile β(z) at 355 nm) and zt and zb are the respective upper and lower limits of the profile. For any arbitrary element of the Haar basis ha,b(z) (as shown in Eq. 2), a is the dilation parameter in relation to the spatial spectrum of the function and b is the translation parameter indicating the location at which the function is centered.
The local match or similarity between the Haar wavelet ha,b(z) and the lidar extinction signal β(z) is measured in the covariance transform Wf(a,b), which can be interpreted as a pattern search for a sudden jump. Accordingly, the position of the local maxima (i.e., positive peaks) in the return WCT signal approximately marks the layer top; likewise, the position of the local minima (i.e., negative peaks) of the covariance transform Wf(a,b) roughly coincides with the layer bottom. Identification of strong variations in the vertical gradient of the aerosol extinction profile β(z) is useful for locating the boundaries between aerosol layers. Following Michailidis et al. (2021, 2023), we define SPHtop as the last positive peak in the corresponding WCT profile from the surface to the upper atmosphere if some physical constraints are satisfied. The optimum value for a affects the number of sufficiently thick aerosol layers that can be retrieved successfully. Therefore, we limited the minimum acceptable wavelet dilation a to be equal to 54 times the vertical resolution of the aerosol extinction profile β(z) at 355 nm, i.e., a= 162 m in this study. To filter noise in the return WCT signal, a minimum threshold value is set to 0.05. The values of SPHtop are extracted using this approach for both single-layer and multi-layer aerosol structure smoke plumes, as illustrated in Figs. S1 and S2 in the Supplement, respectively.
3.1.2 Extinction-weighted mean plume height (SPHext)
Given an aerosol extinction coefficient profile β(z) with n lidar vertical levels, this definition weighs each height above ground level interval zi (in our case, zi= 3 m) for the ith level with the height-dependent extinction coefficient β(zi), as described in Koffi et al. (2012), and then calculates the weighted mean height (i.e., SPHext) as follows:
This method (Eq. 3) has been widely applied in previous literature and is considered ideal for comparisons with the ALH retrieval from passive satellite sensors (Chimot et al., 2018; Kylling et al., 2018; M. Liu et al., 2019; Nanda et al., 2020), as it offers a simple and useful means to represent the aerosol vertical distribution as a single height value. For example, in some cases where a single and homogenous (i.e., same particle size and optical properties) aerosol layer is found in the atmosphere, SPHext indicates the aerosol layer's center of mass. However, when it comes to a vertical structure with multi-layer aerosols, SPHext may be at a vertical level with minimal smoke aerosol loading because smoke plumes are present at multiple heights.
3.2 Lidar–satellite collocation method
When comparing satellite products with observations, a method to collocate the two datasets is required. Even at close range and within short periods, the vertical extent of wildfire smoke plumes can vary substantially. This variation is influenced by factors such as specific vegetation types and fuel structures, terrain characteristics, or ambient meteorological conditions, during atmospheric transport processes which are more favorable to aerosol aging mechanisms and plume rise behaviors than others (Paugam et al., 2016; Junghenn Noyes et al., 2022). Passive satellite remote sensing of the wildfire SPH indirectly measures columnar quantities at a relatively coarse spatial resolution, representing the spatial average of a highly variable pixel area of fire activity and smoke plume behavior. In contrast, active airborne lidar collects instantaneous vertical segments of smoke aerosols only along its flight path, which in turn lacks large-scale spatial representation. Along with the spatial misalignment of collocated pairs, the disparity in sampling time between airplanes and satellites for the same cluster of wildfire plumes, on the order of minutes to days, presents another inherent challenge and, thus, yields few perfectly matched pairs. Hence, to make comparisons between space- and aircraft-based observing platforms, determining the time interval and distance for collocated pairs of satellite retrievals and lidar measurements requires careful consideration (Junghenn Noyes et al., 2020).
We developed and tested two methods to collocate our aircraft observations with four satellite products (Fig. 3). We expect the collocation method to impact the results because of the spatial heterogeneity of smoke plumes and the range of horizontal resolutions for the four satellite products, from 1 to 6 km. Another factor is that multiple satellite pixels can coexist in proximity to a single lidar point when satellite orbits and flight legs intersect. When considering these factors, using a single satellite pixel versus an average of pixels in a specific area to collocate satellite products with aircraft observations provides different results for the comparison. Testing the two methods ensures that our comparisons are fair and consistent across the different satellite products. One, the “spatial averaging method”, uses an average of the surrounding satellite pixels around a lidar point, whereas the other, the “matched-pair method”, employs a nearest-neighbor search to create a matched lidar–satellite pair.
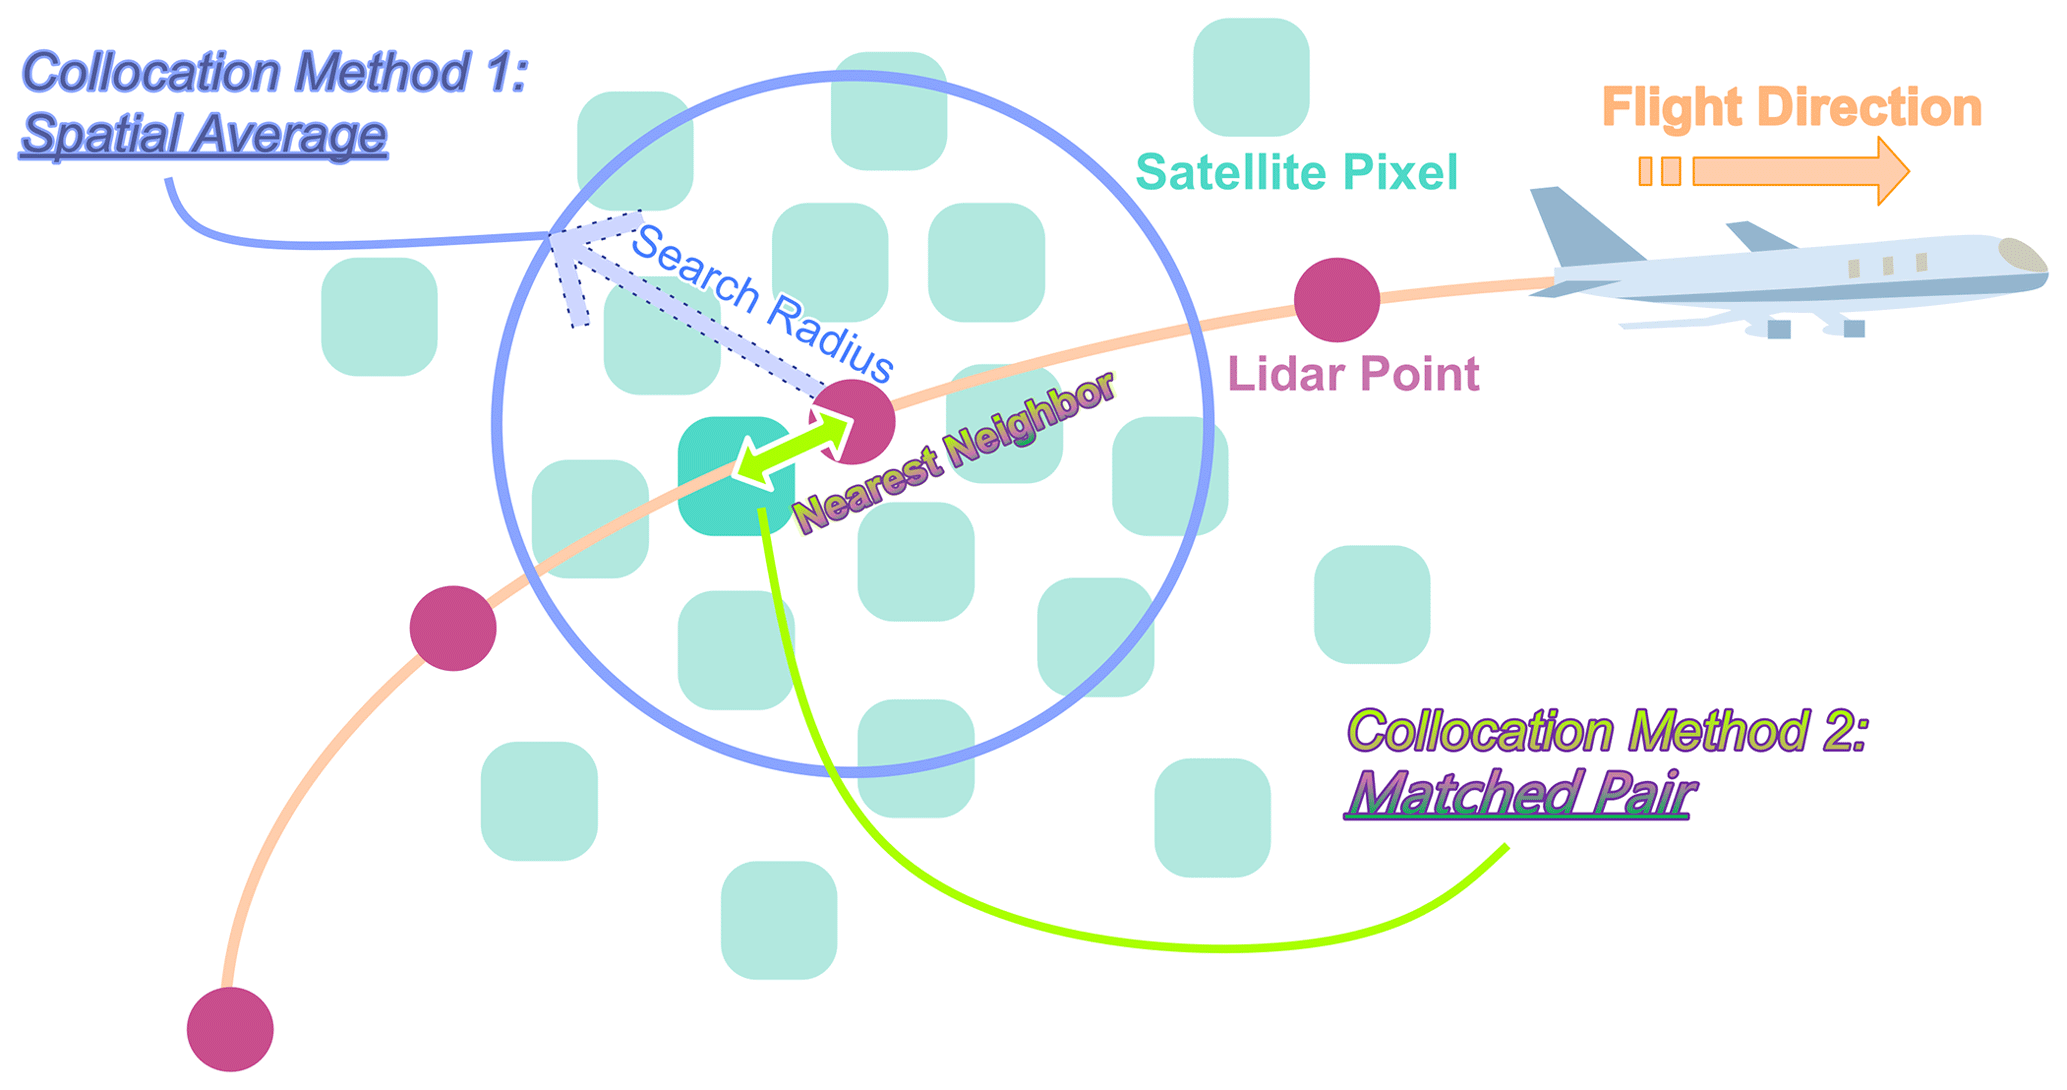
Figure 3Conceptual diagram of two collocation methods used in our study to pair aircraft observations and passive satellite retrievals. Our collocation criteria are a search radius of 6 km and a sampling time window of 12 min.
The spatial averaging method calculates an average value of the satellite retrievals within an area of a fixed search radius around the lidar measurement. For MODIS/MAIAC and MISR/MERLIN, because they have a finer spatial resolution (Table 1), this predisposes them to multiple collocations inside a circular area of a given search radius centered on the lidar point. The values are smoothed because an average value of all satellite retrievals in this circular area for a given sampling time is used for comparison, which is a common practice in the remote-sensing field (e.g., Virtanen et al., 2018). Considering that there are fewer collocated satellite retrievals for the coarse-resolution products, such as VIIRS/ASHE and TROPOMI/ALH, within the search area, we apply our second collocation method, i.e., the matched-pair method. This method is more sensitive to the location of a single satellite pixel coinciding with each point-like airborne lidar measurement. The closest satellite pixel to the nearby lidar point within the given sampling distance and time window is chosen for each match. While using two methods provides the most reliable approach for comparison across multiple satellite products, there are still uncertainties associated with satellite-observation comparisons. The main uncertainty sources of collocation mismatch are (1) misalignment between the satellite pixel size and the lidar observation point; (2) wind-driven advection (e.g., a high fire-induced horizontal wind can reach the maximum value of 10 m s−1 (Y. Liu et al., 2019), which can displace fire-related smoke aerosols 3.6 km in 6 min); and (3) intrinsic positioning and navigation errors. For both methods, we assume that horizontal changes in wildfire smoke plume spread are negligible during short time intervals. It is important to note that each satellite product maintains its native resolution rather than being resampled to a uniform grid for all products. A different collocation method for each satellite product might be used to showcase its spatial characteristics (e.g., to highlight the improvement in finer-spatial-resolution products).
Both collocation methods require spatiotemporal averaging windows to be selected. A single granule of the VIIRS/ASHE product has the largest pixel size (6 km × 6 km) with the longest orbit segment scanning period (∼ 6 min) of all the satellite-derived SPH products in Table 1. To ensure that adequate collocation pairs are available within one 30 min time period due to rapid wildfire smoke plume activity, we utilized a sampling time window of 12 min that corresponds to twice the maximum time span of an orbital swath (one scene). To investigate the effects of search radius size for the two collocation methods, we used 20 sampling distances ranging from 1 to 20 km. Assuming a worst-case windy environment of 30 m s−1, wildfire smoke aerosol layers could migrate ∼ 20 km during the maximum allowed time interval of 12 min. Local SPH spatial variability over scales of up to ∼ 20 km can introduce uncertainty in SPH comparisons. In Fig. S3, the standard deviation (SD) of the multi-sensor satellite SPH retrievals around a lidar point (denoted by σSPH) is calculated to assess the representativeness of the search radius. With increasing distances, all SD curves for the satellite-retrieved SPH display asymptotic behavior. These values can be interpreted as an upper limit of the SPH errors owing to our method of collocation. It is important to optimize the inclusion criteria for the lidar–satellite comparison. For example, a low number of nearby satellite pixel counts shows higher spatial sampling uncertainty, while a low number of one-to-one collocated pairs indicates weaker statistics in calculating the SD. Using the mean SD () from all collocations, the average number of nearby satellite pixels within a search radius per collocation, and the total number of one-to-one collocated pairs, the best search radius is thus set to 6 km. The collocated satellite SPH value is assumed to be representative across the 6 km radius circle centered around the WCL data point, with an average SD-calculated uncertainty () of ∼ 220 m for MODIS-Terra/MAIAC, ∼ 173 m for MODIS-Aqua/MAIAC, ∼ 258 m for MISR/MERLIN, ∼ 300 m for VIIRS/ASHE, and ∼ 152 m for TROPOMI/ALH.
3.3 Reconstructed lidar vertical cross-sections
When the UWKA flew close to perpendicular to the mean wind direction, the consecutive UWKA transects sampled the smoke plumes at different heights over the same latitude or longitude range of the flight trajectory. The UWKA operates at a cruise speed of approximately 90 m s−1, enabling it to capture data from different altitudes and angles. The WCL system uses laser beams to measure the optical properties of the plume and is limited in its ability to penetrate and sample optically thick smoke. Therefore, at each flight leg, the WCL can only provide a partial vertical segment of the smoke plume cross-section, particularly from the lowest flight altitude (i.e., upward-scanning lidar).
We reconstructed the vertical structure of wildfire smoke plumes using consecutive WCL transects from different flight legs. This post-processing approach, using pseudo-vertical profiles of the aerosol extinction coefficient, provides useful lidar-determined SPH reference data for comparison with satellite SPH products. The reconstruction process involves several key steps following Deng et al. (2022b):
- I.
The first step is the application of an extinction coefficient threshold. Cloud-screened WCL transects are collected from 11 flight tracks with valid collocated pairs. To separate densely localized fresh smoke from the aged background smoke, an extinction coefficient threshold of 0.1 km−1 is applied. This step helps remove background noise and signal attenuation in the WCL data and ensures a clear distinction between different smoke components.
- II.
The second step is manual identification of flight legs sampling the same fire smoke plumes. We examine flight track maps and locate areas where multiple flight legs intersected with a smoke plume from the same fire source.
- III.
The third and final step is the interpolation of discontinuous flight segments to a complete vertical cross-section. To display the vertical cross-section of the smoke plume more smoothly and aid further analysis and interpretation, scattered lidar points with 2D vertical structure information from multiple flight legs are interpolated to form a continuous line. The interpolation process relies on the fact that the change in latitude or longitude of the flight tracks is monotonic.
4.1 Evaluation of the satellite-retrieved SPH using the airborne lidar SPH
The comparison of the satellite-based SPH with two distinctive SPH definitions using WCL data poses the following question: what other factors influence the SPH comparison? To address this question, we considered two factors: distance from the fire and aerosol loading. Specifically, we defined four categories, “near-fire-event region (distance from the fire source < 20 km)” or “downwind region (distance from the fire source > 20 km)”, and “AOD < 1” or “AOD ≥ 1”. We then investigated the relationship between these factors and the SPH comparison for each satellite dataset (Fig. 4).
For MODIS-Terra/MAIAC, SPHext is a better comparison than SPHtop for the majority of retrievals, not only for the near-fire-event region but also for the downwind region, and the use of SPHext is not sensitive to significant variability in the aerosol loading. Furthermore, the MAIAC PIH algorithm underestimates the SPH with increasing AOD in the downwind region. Instead, for MODIS-Aqua/MAIAC, the retrievals have a high degree of bias compared with the lidar-derived SPH, with only a few points falling within the region between the 1:1 and 1:2 lines. The MODIS-Aqua/MAIAC retrievals exhibit more consistency with the definition of SPHext near the fire source under high-AOD conditions (when AOD ≥ 1). The MISR/MERLIN product has a good agreement between the retrievals and SPHtop for the areas in the fire vicinity and downwind, with outliers arising for thin plumes (for lower AOD < 0.8), potentially due to the unclear boundaries of the smoke plume. This is because the MISR-based automated stereoscopic image requires distinct plume-like features to provide the complete vertical profile of the smoke plume. The VIIRS/ASHE product compares better with SPHtop than SPHext. Another interesting finding is that, irrespective of AOD values, the ASHE algorithm tends to overestimate the SPH for the near-fire-event region, whereas it underestimates the SPH for the downwind region. Similarly, the TROPOMI/ALH product has lower SPH values for the downwind region but higher SPH values close to the fire, regardless of AOD conditions. The SPHtop proves useful for evaluating the TROPOMI/ALH data within the near-fire-event region, whereas the use of SPHext is more appropriate for the downwind region if outliers are removed.
This qualitative analysis sheds light on the factors influencing the comparison between the satellite-retrieved SPH and lidar-determined SPH definitions. These findings can aid in the interpretation of SPH products from multiple satellite datasets. Additionally, the physical interpretation of the potential biases in the satellite SPH algorithms can help design future field campaigns that provide datasets for evaluation and algorithm development. While the qualitative analysis is useful to understand the physical processes impacting the results, we also provided a quantitative evaluation of the satellite SPH products using the metrics described in Appendix A (results shown on the plots in Fig. 4).
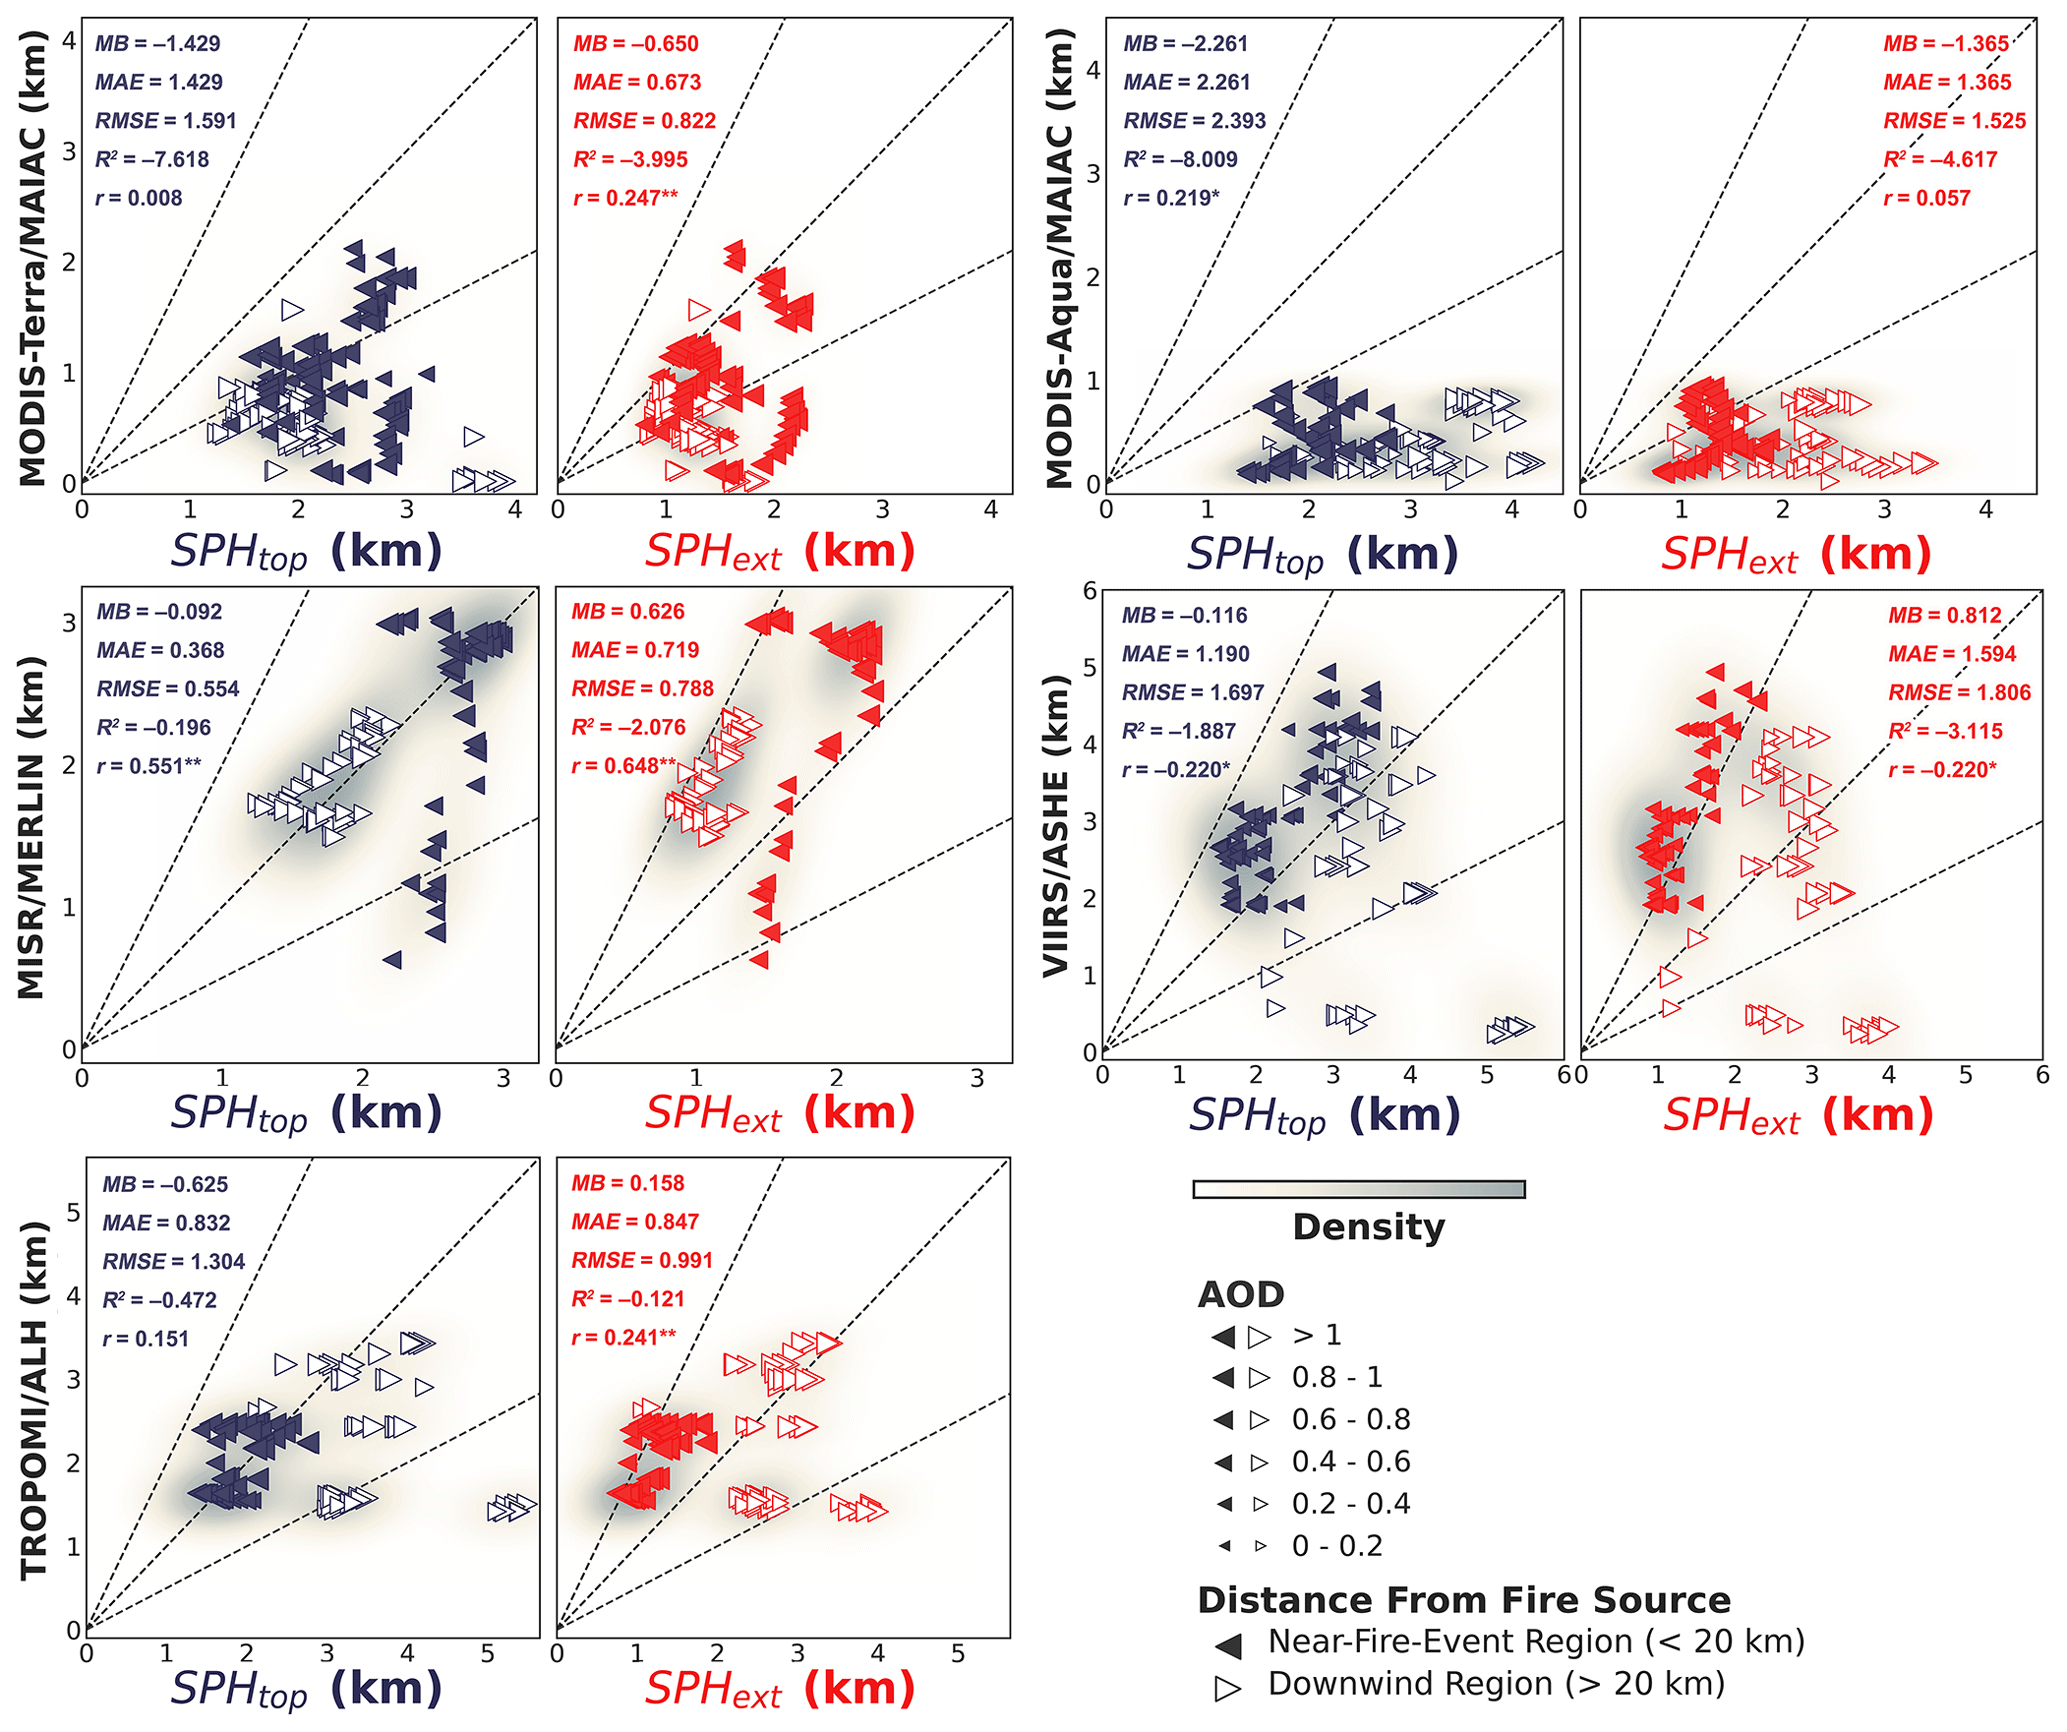
Figure 4Scatterplots of the satellite SPH retrievals from MODIS-Terra/MAIAC, MODIS-Aqua/MAIAC, MISR/MERLIN, VIIRS/ASHE, and TROPOMI/ALH versus the WCL-determined SPH using two different definitions: SPHtop (left, blue) and SPHext (right, red). Results are for the total collocated lidar–satellite pairs using reconstructed WCL vertical cross-sections during August 2018. Dotted lines denote the ratios of 2:1, 1:1, and 1:2 for reference. The shaded areas show the estimated density of the collocated pairs. Points closer to the fire (within 20 km) are shown as left-pointing triangles, whereas those farther away, in the downwind area, are shown as right-pointing triangles. The triangle size denotes the corresponding AOD value. Note that the subpanel axis scales for each satellite product are different. Evaluation metrics used to assess the performance of satellite products are MB (km) – mean bias; MAE (km) – mean absolute error; RMSE (km) – root-mean-square error; R2 (unitless) – coefficient of determination; and r (unitless) – Pearson correlation coefficient (* signifies a p value < 0.05 and indicates a p value < 0.01).
The evaluation metrics are calculated using Eqs. (A1) to (A5), where MB (km) = 0, MAE (km) = 0, RMSE (km) = 0, and r (unitless) = 1 indicate perfect agreement (see the caption of Fig. 4 for metric definitions). The SPH values used for metrics are the averages of all successful collocations found in reconstructed lidar vertical cross-sections. Additional statistics for the lidar–satellite comparisons are summarized in Appendix B. It should be noted that the collocation method used for comparison is not the same across all of the satellite products, where MODIS-Terra/MAIAC, MODIS-Aqua/MAIAC, and MISR/MERLIN use the spatial averaging method, whereas VIIRS/ASHE and TROPOMI/ALH use the matched-pair method. Results for both collocation methods for all satellite products are provided in Tables S1 and S2 in the Supplement. The statistical comparisons of four SPH products derived from passive satellite remote sensing against WCL-determined SPH allow us to examine the strengths and limitations of these distinct observational methods. Next, we present an in-depth assessment of the performance of each product based on the quantitative evaluation.
The MAIAC PIH algorithm has low confidence (i.e., large negative R2 from −8.009 to −3.995 and high RMSE from 0.822 to 2.393) in SPH retrievals compared with the WCL SPH measurements using two definitions, especially in the afternoon. One reason for this might be that the MAIAC algorithm cannot achieve a strong negative thermal contrast, i.e., the smoke pixel (white) is not sufficiently “colder” than the background (dark) in the afternoon when the fire activity is most prominent. Moreover, assuming an average lapse rate over mountainous terrains instead of more accurate atmospheric temperature profiles from reanalysis data can introduce more uncertainties in SPH estimates. A more significant difference between the MODIS/MAIAC SPH product and the definition of SPHtop is found compared with the definition of SPHext, indicating the limitation of a high enough total AOD to ensure sufficient gaseous absorption constrains its ability to detect SPHtop. Therefore, using the definition of SPHext to evaluate the MODIS/MAIAC product is recommended.
The MISR/MERLIN plume height fluctuates from 0.625 to 3.029 km, and the corresponding SPHtop determined from lidar profiles varies from 1.254 to 2.982 km. The mean, SD, and quartiles of the collocated MISR/MERLIN SPH data have relatively small biases compared with SPHtop. The MISR/MERLIN product outperforms the other three datasets with respect to capturing SPHtop, as seen by the lowest MB, MAE, and RMSE values. It also has a moderate positive relationship (r=0.551) with the changes in SPHtop. This is anticipated, as contrasting features are visible inside plumes and between smoke aerosols and the terrain surface through multiple, angular views, allowing the MISR stereo technique to capture the evolution of wildfire smoke plumes.
Lee et al. (2015) highlighted that the VIIRS/ASHE product performs well over mountainous areas due to the surface elevation consideration during the retrieval process. Although the mean values and general distribution of both satellite retrievals and lidar observations are fairly close, the VIIRS/ASHE data have a wider spread of values (larger SD), a slight tendency to underestimate SPHtop by nearly 116 m, and lower plume height extremes (maximum and minimum plume heights). A fraction within 1.5 km of 14 % for the VIIRS/ASHE SPH leads to some outliers, which are reflected in higher MAE and RMSE values. These large outlier errors could be attributed to the passive sensors having difficulties measuring the presence of multi-layer aerosols (see Figs. 7b and S4d), and a potentially high AOD bias over bright surfaces. However, the negative correlation (r= −0.22) between the VIIRS/ASHE data and the WCL-determined SPH suggests significant discrepancies in their spatial resolution when collocating.
Using the definition of SPHext, the TROPOMI/ALH product slightly overestimates the SPH by approximately 158 m, but it maintains overall reasonable performance, as indicated by the MAE and RMSE values, and a weak positive correlation (r= 0.241) with lidar observations. However, this evaluation could be influenced by a limited number of collocations. Choosing the appropriate SPH definition to interpret the TROPOMI ALH algorithm differs on a case-by-case basis, as shown in the reconstructed lidar curtains (Sect. 4.3). When multi-layer structures are detected in the sample cases (Fig. 7b), the SPH from the TROPOMI ALH algorithm is regarded as the average computation of aerosol optical properties, resulting in a poor comparison with the lidar SPH. On the other hand, the TROPOMI ALH algorithm shows encouraging potential for characterizing SPHtop in homogenous, well-developed smoke layers (Fig. S4f and i). Multi-layer aerosols, inaccurate aerosol-type detection, and biased UVAI retrievals over bright areas with complex terrain are all potential causes of retrieval uncertainties in the TROPOMI/ALH product.
Overall, the discrepancies between passive satellite retrievals and lidar measurements with respect to observing SPH primarily stem from their different approaches to characterizing smoke aerosol. Passive satellites typically operate under the assumption of a singular aerosol layer within the atmospheric column, a simplification that often fails to account for the presence of multiple layers actively captured by lidars. This divergence creates a challenge in aligning satellite-derived SPH data with lidar observations due to the uncertainty in correlating equivalent layers. Further investigation of the smoke plume physics and vertical aerosol distributions are provided in the following sections using the WCL vertical profiles, including comparisons with passive satellite SPH products.
4.2 Leveraging airborne lidar measurements to characterize plume behavior and SPH
Through the use of airborne lidar measurements, our study seeks to understand how well a passive satellite remote-sensing technique can retrieve the SPH. The lidar profiles allow for multiple aerosol layers to be sampled, unlike the conventional passive satellite aerosol height retrieval algorithm which presumes the presence of a single, homogeneously distributed aerosol layer throughout the entire atmosphere. Despite different measurement concepts when it comes to multiple layers of plumes, to ensure comparability between passive retrievals and active observations of smoke plume behavior for ease of calculation, we emphasize the significance of an effective height parameter. The two different SPH definitions (Sect. 3.1) used to determine this parameter give an indication of the height of the wildfire smoke aerosol distribution as a single number.
In Fig. 5, the height distributions of wildfire smoke plumes during BB-FLUX in August 2018 are shown using two definitions of the lidar-derived SPH. Caution should be taken when identifying key criteria used to define the SPH prior to evaluating the satellite retrievals. This is because SPHtop (Fig. 5a) has a vertical extent spanning from 0.5 to 5.5 km, with the most common height being approximately 2.25 km, whereas SPHext (Fig. 5b) exhibits a vertical range from 0.5 to 4.5 km, with its peak observed at roughly 1.2 km. For SPH values less than 3.5 km, the occurrence of smoke plumes identified within one single layer is significantly higher than that of multi-layer smoke plumes (> 60 % for each height bin), suggesting that the columnar SPH values obtained from satellite retrievals can be compared with those measured via upward-facing lidar profiles, as smoke plumes produced by wildfire typically exhibit a single-aerosol-layer structure. This finding holds particularly true for wildfires of decreased fire intensity under suppression operations (i.e., some flight dates approach the corresponding fire containment date listed in Table 2).
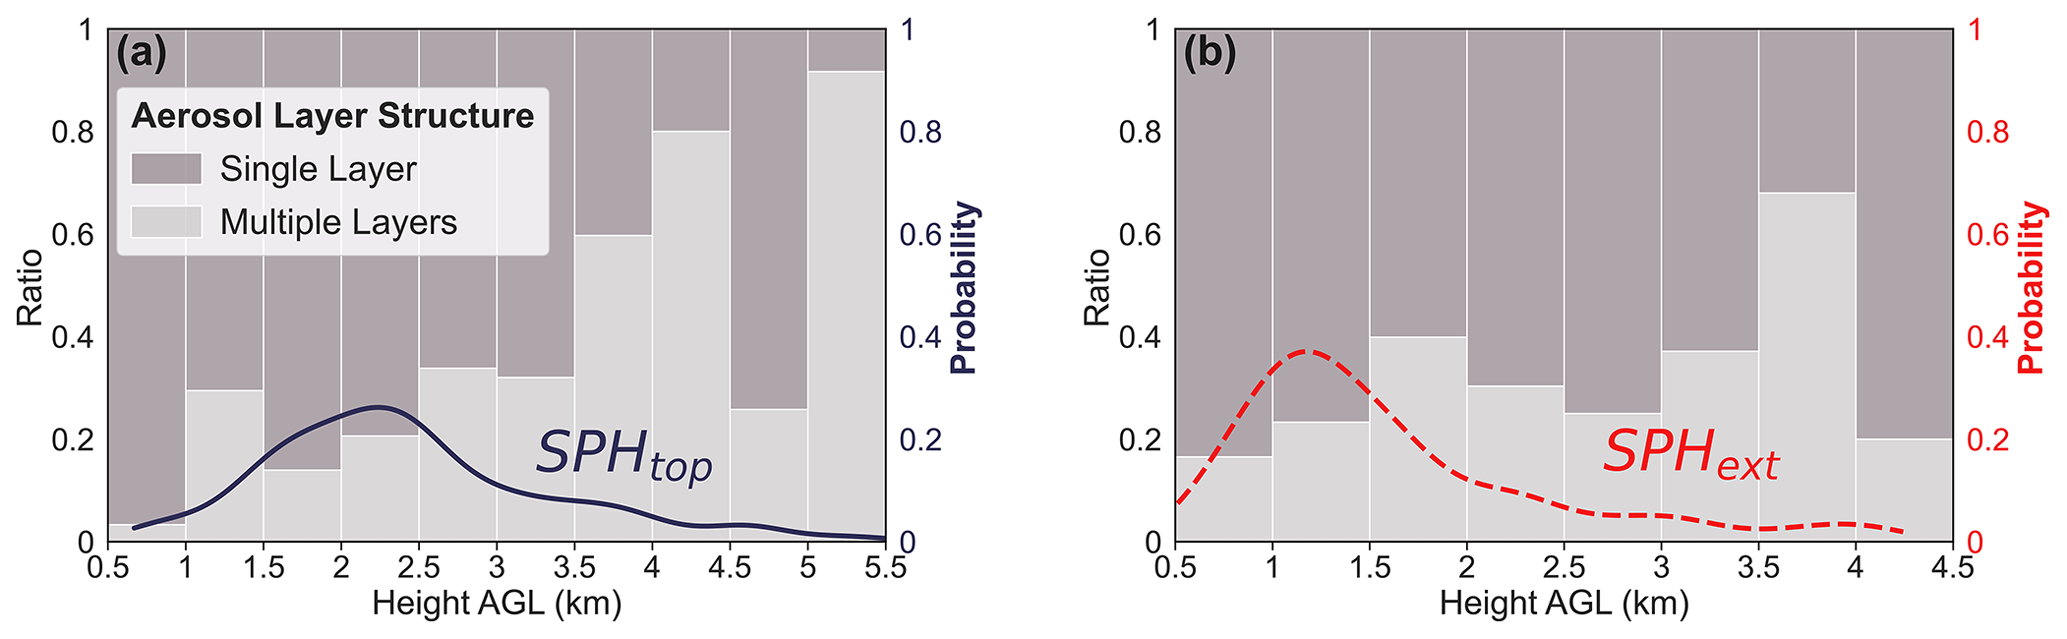
Figure 5Ratios of single-layer and multi-layer aerosol structures in the 0.5 km wide bins using two different WCL-determined SPH definitions: (a) SPHtop and (b) SPHext. Lines indicate the probability mass function (PMF). Note that the WCL plume height data are equally binned by setting the bin width parameter to 0.5 km, and the bins are spread out in the range from 0.5 to 5.5 km for SPHtop and in the range from 0.5 to 4.5 km for SPHext.
It should be noted that the upward-sampled WCL can only provide a partial vertical segment and not a fully resolved cross-section of the smoke plumes from the lowest flight height due to the restricted lidar laser penetration in optically thick smoke plumes. For instance, when probing the plume centerline, there is complete attenuation of the lidar beam, resulting in a loss of data samples. However, the WCL can successfully delineate the atmosphere on each pass in the less dense portions of smoke plumes. Therefore, the vertical structure of individual smoke plumes reconstructed from airborne WCL measurements yields the vertical profiles of the mean aerosol extinction coefficient, reflecting the average conditions of smoke plumes over multi-leg UWKA sampling periods (see more details in Sects. 3.3 and 4.3). In terms of the lidar-derived SPH biases identified in our study, we observe three main scenarios: (1) underestimation of SPHtop (i.e., optically thick plumes limiting vertical extent); (2) overestimation of SPHext (i.e., the upward-pointing lidar not sampling below aircraft); and (3) underestimation of both SPHtop and SPHext in situations where the lidar faces dense smoke above and cannot measure below the aircraft.
4.3 Reconstructed lidar curtain and lidar–satellite comparison
It is necessary to implement post-processing procedures to conduct a comparative analysis between lidar observations and satellite retrievals. Here, we present detailed reconstructed lidar vertical cross-sections of the aerosol extinction coefficient along with the collocated satellite SPH on 19 August 2018, for the morning (0819a, Fig. 6) and afternoon (0819b, Fig. 7) flights. Similar plots are included in Figs. S4 and S5 for each flight. Figures 6a and 7a demonstrate that the smoke plume coverage of the MISR/MERLIN product aligns well with the manually identified plume area and reveals high-resolution SPH retrievals. In contrast, the MODIS/MAIAC product with the highest spatial resolution displays lower SPH values in general over biomass-burning regions. Meanwhile, both the VIIRS/ASHE product and the TROPOMI/ALH product indicate that higher SPH values are generally shifted towards the downwind region.
The vertical distributions of wildfire smoke aerosols (Figs. 6b and 7b) are useful to visualize the smoke plume structure and provide more information about the physical processes influencing aerosol layering in the atmosphere. A visual comparison of the SPH values from the four satellite products against the WCL is presented in Figs. 6b and 7b. In Fig. 6b, even when faced with intricate aerosol structures, the MISR/MERLIN data are capable of reaching SPHtop, except for thin plumes with comparably low AOD values. The MODIS-Terra/MAIAC SPH is similar to SPHext, although it is unable to distinguish the top of multiple aerosol layers and, consequently, produces exceptionally low SPH values. As the reconstructed aerosol vertical cross-section for Fig. 7b is located in the downwind region, there is an increase in SPHtop and SPHext with distance from the fire. We recommend caution when using the MODIS-Aqua/MAIAC product for estimating downwind SPH, as its effectiveness in such scenarios is not always optimal (also refer to Fig. S4b and c for more details). This limitation in the MAIAC PIH algorithm has also been reported in previous studies (Lyapustin et al., 2019; Loría-Salazar et al., 2021). Regarding heterogeneous aerosol vertical profiles, the spatial agreement between the collocated VIIRS/ASHE SPH values and the two SPH definitions is poor, despite achieving, on average, a good numerical agreement with SPHtop. This is partly due to the coarse spatial resolution of OMPS UVAI data used in the algorithm (∼ 50 km at nadir; ∼ 100 km near the scan edge) not being able to represent finer-scale features. The TROPOMI/ALH data are consistent with the SPHext values, given the observed overestimation of SPHext attributable to the elevated flight height. The potential explanation for this phenomenon is that, in cases where there may be several layers of smoke aerosols, the retrieved SPH would be the average height of the plume, which is much lower than the height of the optically thick aerosol layer (Michailidis et al., 2023).
According to these results and specific fires studied, the MODIS/MAIAC product struggles with most heterogeneous aerosol structures, even in close proximity to active fire sources. Even though the MISR/MERLIN product aims to capture the top boundary of the smoke plume, it can be highly biased in thin plume height estimates with low AOD or for a more complex aerosol structure with multiple aerosol layers. The challenges observed for the VIIRS/ASHE retrievals are as follows: (1) poor correlation with general trends in lidar measurements and (2) they may not accurately represent complex atmospheric conditions with multiple aerosol layers. Out of the four satellite SPH datasets that we investigated, TROPOMI/ALH has the least variance in the retrieved SPH across spatial areas. This is not ideal for practical use, as real-world wildfire and smoke plume activity varies significantly in space and time. However, elevated smoke layers with a high aerosol loading over dark surfaces at not very high altitudes are favorable for the TROPOMI ALH algorithm to retrieve vertically localized aerosol layers in the free troposphere (FT).
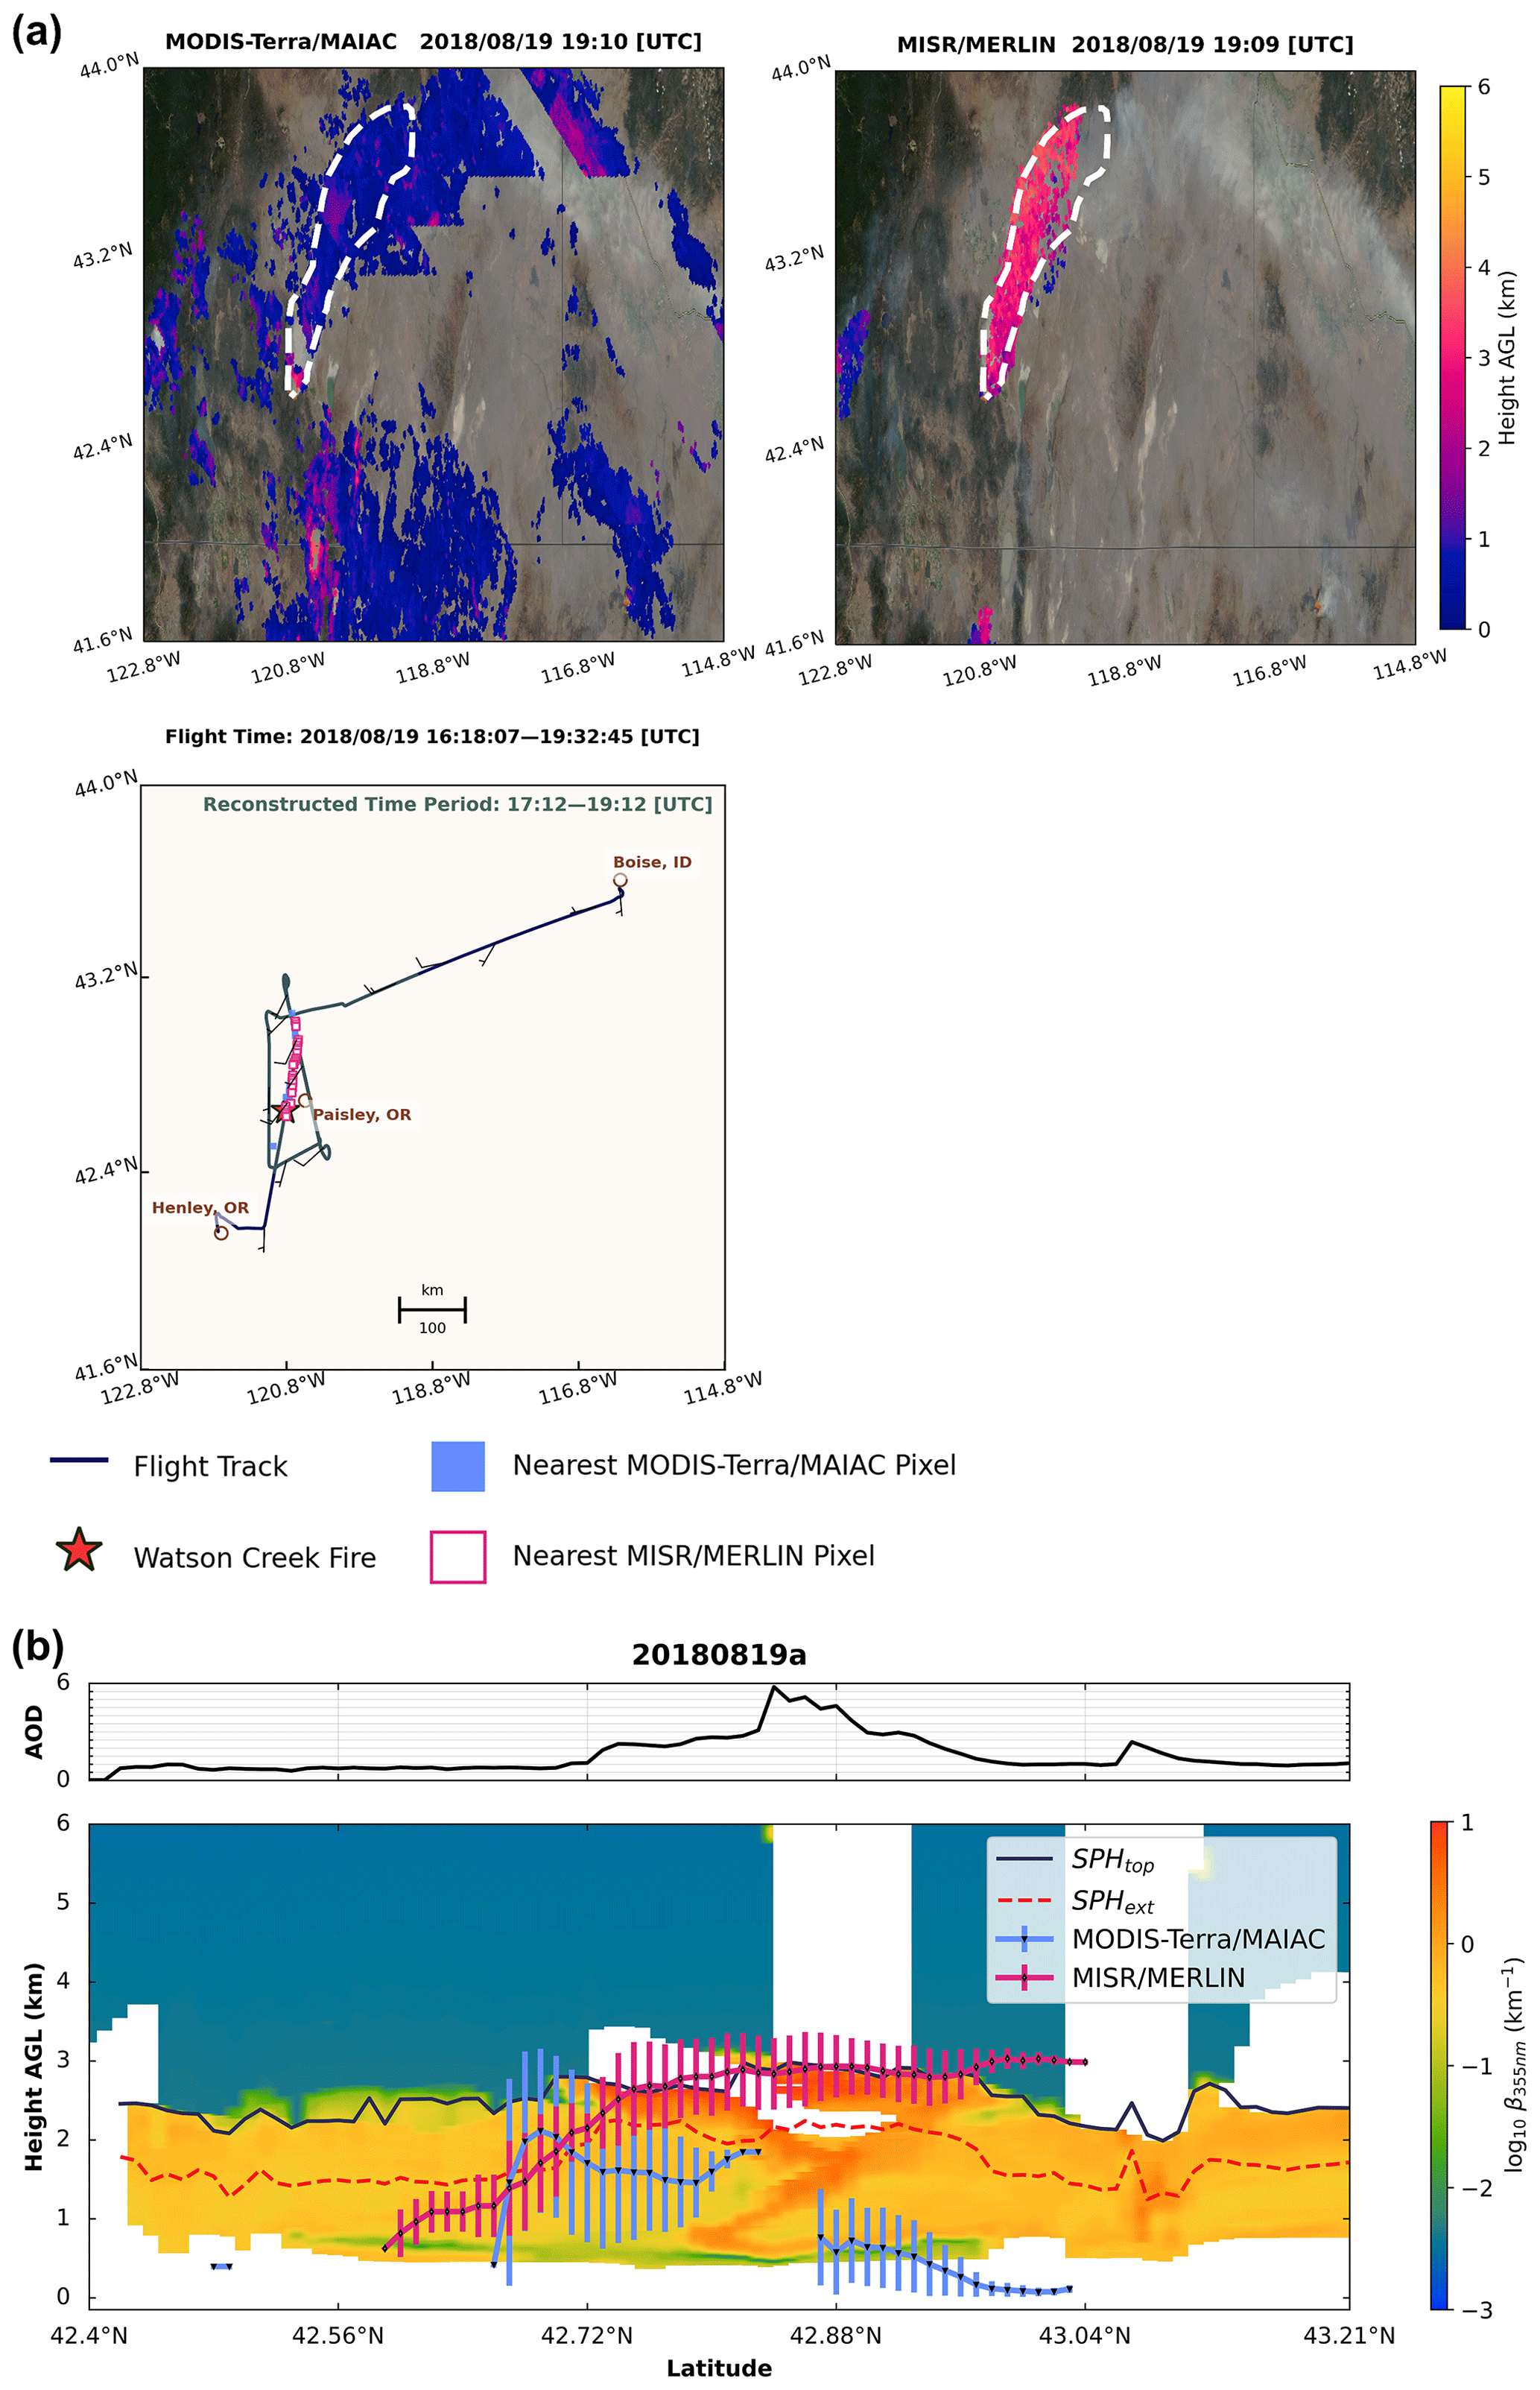
Figure 6(a) The nearest satellite pixels of MODIS-Terra/MAIAC and MISR/MERLIN to the corresponding airborne lidar points along the 0819a flight track during the reconstructed time period from 17:12 to 19:12 UTC (highlighted in green). Wind barbs are plotted along the trajectory with each short barb representing 5 kn and each long barb representing 10 kn. The star symbol indicates the center location of the Watson Creek Fire taken from the incident report system (InciWeb). Note that the NASA Worldview MODIS Terra true-color (i.e., corrected reflectance) images are shown beneath the satellite-retrieved SPH maps, along with the user-drawn smoke plume polygons (denoted as the dashed white region). (b) Composite latitude–height cross-sections of the reconstructed WCL vertical aerosol extinction coefficient at 355 nm, overlaid with WCL-determined SPHtop and SPHext and the collocated satellite-retrieved mean SPH with error bars, for the Watson Creek Fire in the morning on 19 August 2018 with the corresponding AOD.
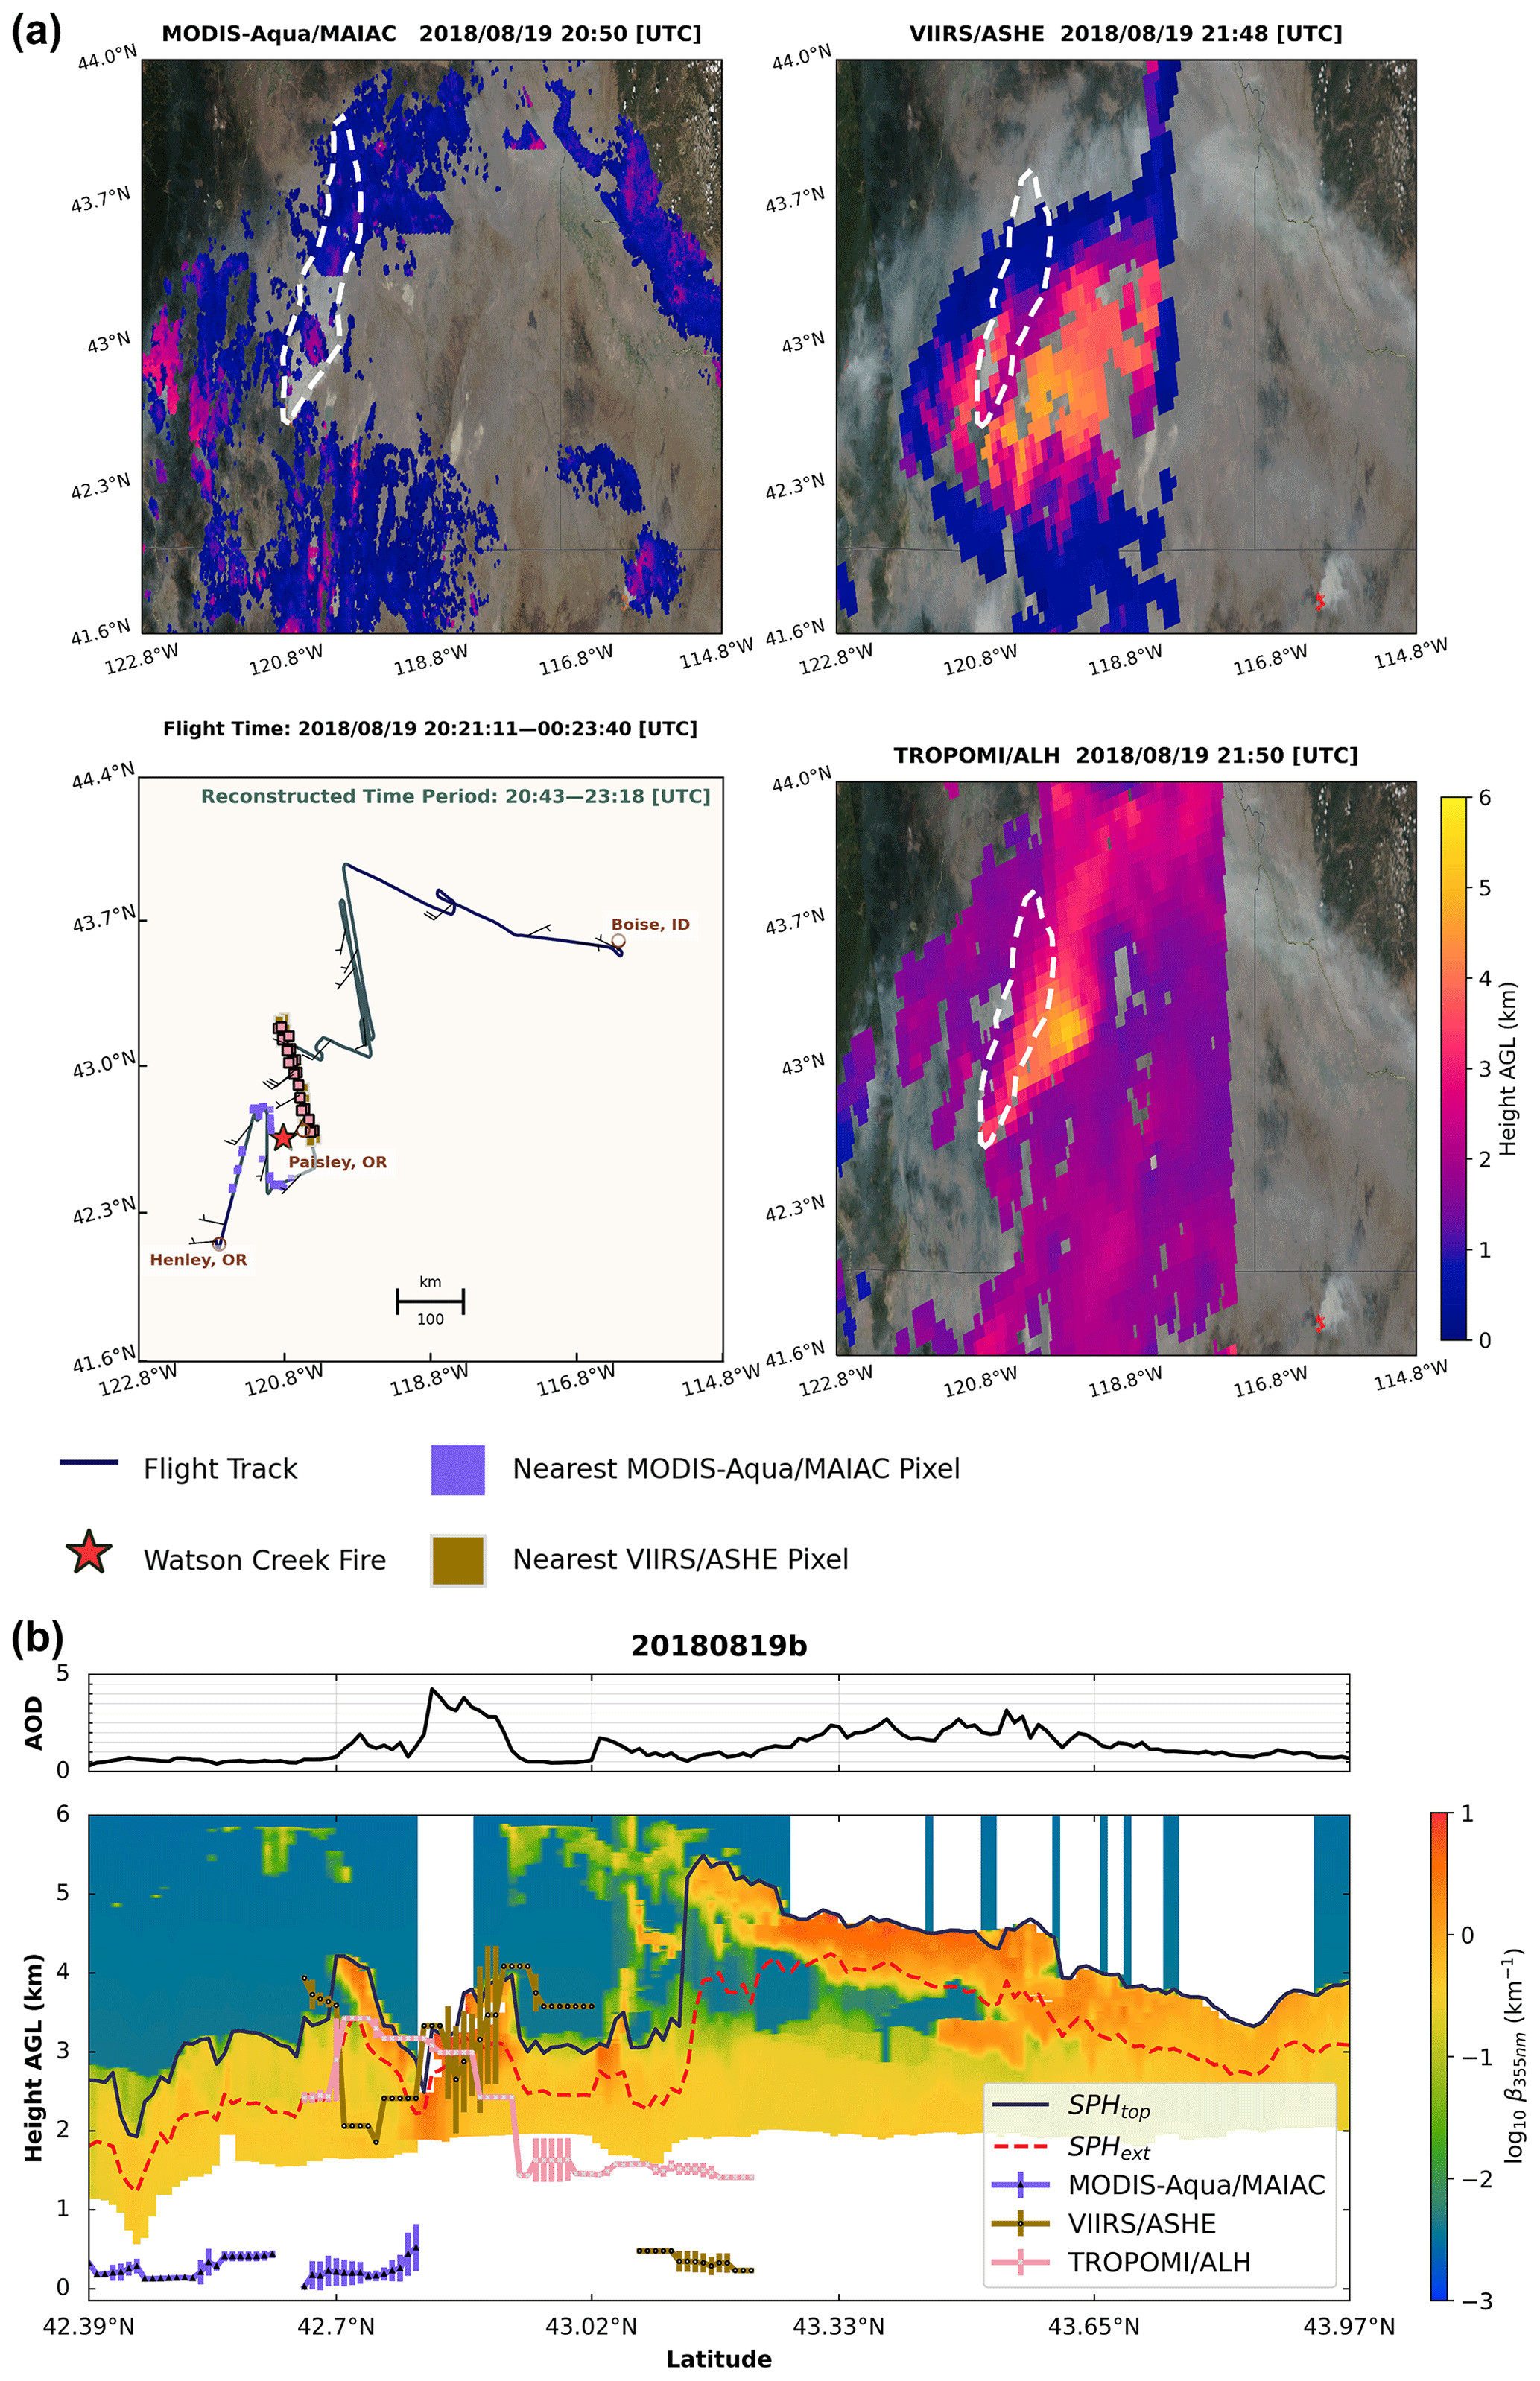
Figure 7Panel (a) is the same as Fig. 6a but for the nearest satellite pixels of MODIS-Aqua/MAIAC, VIIRS/ASHE, and TROPOMI/ALH to the corresponding airborne lidar points along the 0819b flight track during the reconstructed time period from 20:43 to 23:18 UTC (highlighted in green). Note that the NASA Worldview true-color images (both MODIS Aqua and VIIRS are used) at the corresponding moment are shown beneath the satellite-retrieved SPH maps, along with the user-drawn smoke plume polygons (denoted as the dashed white region). Panel (b) is the same as Fig. 6b but for the Watson Creek Fire in the afternoon on 19 August 2018.
4.4 The SPH application
Knowing the SPH has additional benefits beyond atmospheric modeling; here, we illustrate how the SPH can be used to improve our understanding of surface air pollution concentrations and smoke plume dynamics resulting from fire–atmosphere interactions. By using both definitions of the SPH, SPHtop and SPHext, additional insights related to plume dynamics can be assessed. How smoke aerosols are vertically distributed throughout the atmosphere plays a dominant role in estimating surface particulate matter (PM) models from satellite AOD products. High-elevation smoke aerosol layers above the planetary boundary layer height (PBLH) lead to high column AOD while not elevating the near-surface PM levels. Generally, aerosol concentrations are low in the higher, relatively stable atmospheric layers above the planetary boundary layer (PBL). However, large wildfires can have vigorous buoyant plume cores that lift the smoke plume into the FT or even the stratosphere (Fromm et al., 2019), thereby contributing to elevated aerosol concentrations above the PBLH. Based on the approximate burned area in Table 2, the fires in our study meet the definition of a megafire (10 000–100 000 ha) suggested by Linley et al. (2022), but it should be noted that fire size alone cannot characterize the fire intensity, activity, or resulting smoke plume behavior (Tedim et al., 2018). The ratio of the effective SPH to PBLH (SPH : PBLH) is an indicator of the AOD and surface PM concentration relationship (Cheeseman et al., 2020). We incorporated the modeled PBLH from the Weather Research and Forecasting (WRF) model (as shown in Fig. 8), so we can better understand local meteorology and its impact on the wildfire SPH. The WRF model, for our use, has a domain extending over the WUS with a 4 km spatial resolution, nudged with observations from weather stations as well as balloon soundings. The PBLH values were recalculated from the WRF simulations using the vertical potential temperature gradient method or the Richardson number method (de Arruda Moreira et al., 2020). The locations and elevations of each balloon sounding station are given in Table S3, details of the WRF model configuration are listed in Table S4, and results of the WRF model evaluation are shown in Fig. S6.
In Fig. 8, there is no clear single pattern for the vertical spread of the smoke plume due to the fire–atmosphere coupling and boundary layer turbulence (Sun et al., 2009; Deng et al., 2022b). The difference between SPHtop and SPHext is often greater within a single plume than the differences across different plumes. Based on the wildfire information in Table 2, we can qualitatively discuss the differences between SPHtop : PBLH and SPHext : PBLH for each wildfire in terms of their start dates, approximate containment dates, and approximate acres burned. SPH : PBLH characterizes a joint interaction between buoyant plume cores and boundary layer mixing (e.g., entrainment and wind shear). It also depends on other important factors such as the fire size, distance from the fire source, and the fire spread. In some cases, high SPHtop : PBLH (> 1) and low SPHext : PBLH (< 1) occur concurrently, as shown in Fig. 8. This means that a higher columnar AOD does not necessarily give rise to the majority of the smoke plume concentrations being above the PBL. For instance, the Watson Creek Fire, which started on 15 August 2018, had two flight missions, 0819a and 0819b, and their aviation operation dates were close to the fire start date, compared with the 0824a and 0825a flights. The challenging terrain with dense fuel on the ground facilitated rapid fire spread, and the fire was not contained. Therefore, we can expect that the intense fire behavior would generate a higher number of smoke plumes injected into the FT, where both SPHtop : PBLH and SPHext : PBLH are larger than 1. A total of 5 d later, as the fire activity decreased and containment of the fire increased to 15 %, there was likely more smoldering and, thus, lower plume heights. The SPHext reaches a similar level to the PBLH, although SPHtop : PBLH remains relatively high. When comparing the morning and afternoon SPH patterns, the morning SPH relationships are less complex and potentially easier to model. In contrast, turbulence, convection, and fire–atmosphere interactions contribute to more chaotic plume and PBL dynamics in the afternoon, and the growth rate of the fire exceeds the growth rate of the PBL. The Sheep Creek Fire is an exception due to a timely and consistent fire response, making rare SPH behavior in the afternoon possible: smoke plumes were contained within the PBL. Additionally, a significant portion of the lidar vertical cross-section is missing for the 0823a flight during the South Sugarloaf Fire, as depicted in Fig. S4g. In spite of the fire size indicating a megafire (Linley et al., 2022), the absence of the extinction coefficient data as well as in situ sampling in the downwind region (Table 2) led to low estimates of SPHtop and SPHext.
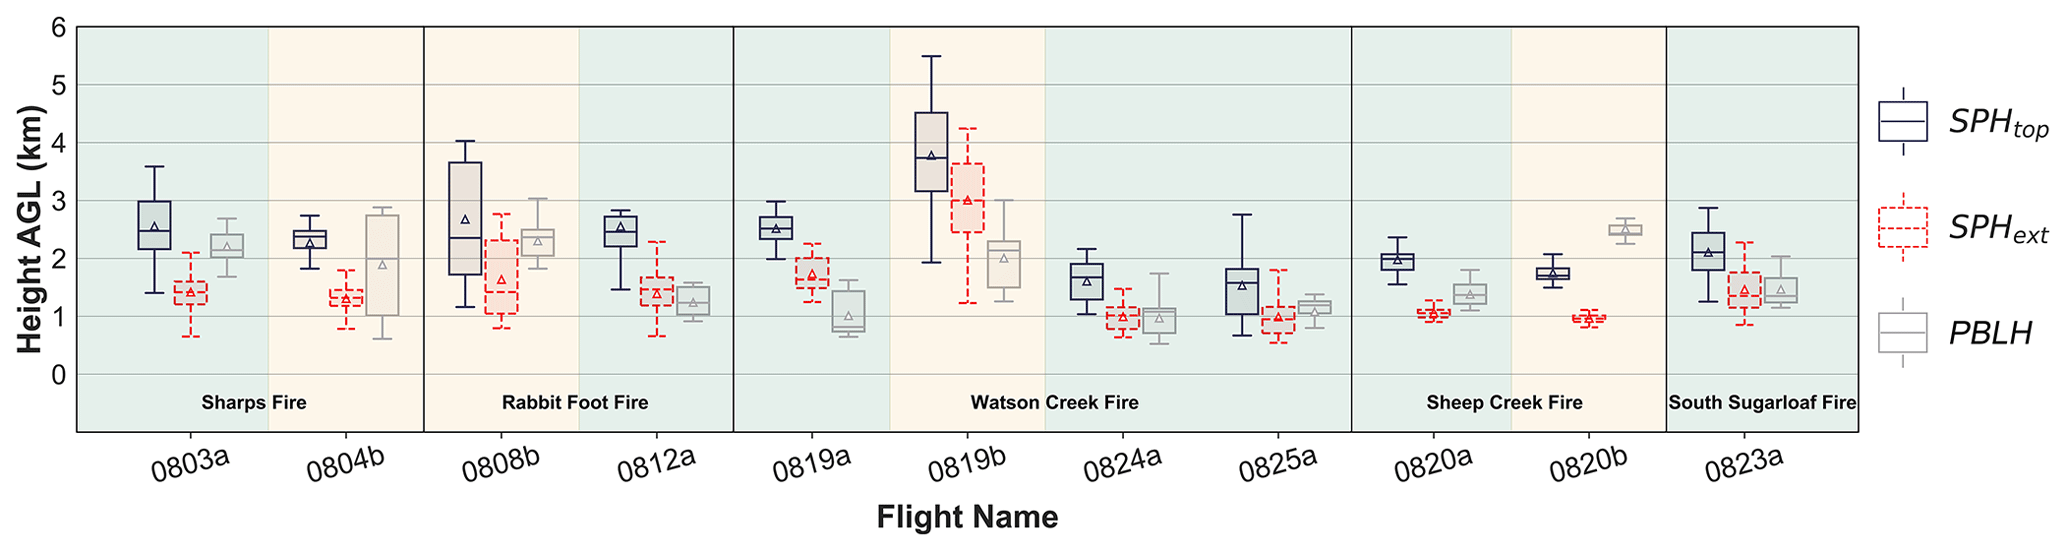
Figure 8Box plots comparing the 30 min average modeled PBLH (gray) with the WCL-determined SPH using two different definitions (SPHtop, blue; SPHext, red) for the morning (shaded by green) and afternoon (shaded by yellow) flight missions. Each panel represents a single wildfire case. Upper and lower whiskers represent the 95th and 5th percentiles, respectively, while the box spans from the 25th percentile to the 75th percentile. The line inside the box represents the median (the 50th percentile), and the triangle indicates the mean of the range of height values. Note that the range of WCL SPH measurements for both morning (0820a) and afternoon (0820b) flight missions on 20 August 2018 is limited because only a small fraction of the flight track transects is considered valid for reconstruction.
The notion of the SPH can be visualized as the vertical displacement from the ground to the upper atmosphere, marking the extent to which smoke plumes ascend. This parameter is vital for simulating the initial stage of plume production and predicting the potential spread of smoke from wildfires (e.g., Walter et al., 2016; Tang et al., 2022). If smoke is emitted above the PBL, it tends to persist longer and travel farther. Smoke emitted within the PBL adversely impacts AQ and increases ground-level air pollution concentrations.
Current efforts to study the wildfire SPH mainly rely on the use of active lidar data and passive satellite sensor retrievals. However, these instruments face inherent spatial and temporal limitations, such as their inability to swiftly adapt to changes in fire and smoke plume behavior. Nonetheless, fusing multi-satellite products to estimate the SPH is still an evolving field. Transported smoke aerosols can form complex, multi-layer structures, but this study has shown that a single, uniform aerosol layer is encountered more frequently than previously assumed. This means that a single value can be used to describe the height of the aerosol layer. With this more straightforward representation, scientists can more readily incorporate aerosol layer data into climate and AQ models, including our earlier discussion of an effective SPH concept. We used two SPH definitions for comparisons because the SPH criterion varies between plume rise retrieval algorithms, given their diverse representations of aerosol vertical allocation that may not sufficiently reflect the real wildfire-associated smoke aerosol layering. We also employed two different collocation methods to provide lidar–satellite collocated pairs. Collocation uncertainties can be caused by the discrepancy between the coarse spatial resolution of the satellite retrieval algorithm and the fine-scale variability in wildfire smoke plume activity detected by high-resolution active lidar measurements.
The results in this paper reaffirmed that uncertainties in multiple satellite-derived SPH products arise from different remote-sensing techniques (Tosca et al., 2011; Flower and Kahn, 2017). The current state of satellite-based SPH products is impacted by significant errors, which we ascribe mostly to either complex multiple aerosol layers or to thin transparent plumes. The user recommendations and main conclusions drawn from this study are as follows:
- 1.
The MAIAC PIH algorithm necessitates careful quality verification, as its SPH retrievals are routinely lower than the lidar measurements, especially for MODIS-Aqua/MAIAC. We suggest selecting SPHext as a suitable height metric to evaluate the MODIS-Terra/MAIAC product when the distance from the fire source is < 20 km and when AOD at 355 nm >1.
- 2.
The MISR plume height climatology is promising to help locate wildfire-associated SPHtop and provide the best estimates over mountainous terrain. However, as WUS fires have become more frequent since the 2000s, the available MISR/MERLIN datasets are relatively minimal. Some challenges associated with using MISR/MERLIN include the limited timing of MISR overpasses (which only occur in the late morning, local time) and the labor-intensive nature of operating the MINX software to digitize the smoke plumes.
- 3.
Both the VIIRS/ASHE and the TROPOMI/ALH products show great potential for characterizing SPHtop in a single homogenous aerosol-rich layer. An overestimation of the SPH in the near-fire-event region and an underestimation of the SPH in the downwind region still prevail. We find that large retrieval errors occur in the studied cases, underscoring the need for a robust quality screening approach related to the UVAI parameterization.
However, the performance evaluation of four satellite SPH products presented here indicates only a weak to moderate correlation between passive satellite retrievals and airborne lidar observations. Deploying both passive and active sensors in tandem can offer a synergistic approach, filling gaps in our understanding of fire and smoke plume behavior by utilizing the unique strengths of each method. The lack of synchronization between satellite overpass times and variations in fire activity and aerosol layering is responsible for more than half of the collocation mismatches. It is expected that future satellites, equipped with active or passive sensors, can increase the chances of capturing a large wildfire event at its peak, as exemplified by improved spatial and temporal coverage of the Advanced Baseline Imager (ABI) on geostationary satellites. Notably, NASA's forthcoming aerosol investigations from space, such as AOS (Atmosphere Observing System), MAIA (Multi-Angle Imager for Aerosols), PACE (Plankton, Aerosol, Cloud, ocean Ecosystem), and TEMPO (Tropospheric Emissions: Monitoring of Pollution), are expected to play a pivotal role in this regard. By integrating data from multiple satellite systems as a potential solution to the synchronization issue, scientists can create a more comprehensive and improved picture of wildfire plume rise.
This study provides a preliminary comparison reference for multiple satellite-based SPH applications. Our findings serve to connect smoke transport and AQ forecasting frameworks and future satellite missions that aim to quantify the vertical distribution of aerosols in the atmosphere, similar to the efforts of Raffuse et al. (2012), Solomos et al. (2015), Ke et al. (2021), and Kumar et al. (2022). Therefore, we encourage conversations between the communities involved in satellite remote sensing and atmospheric modeling to enhance the diversity of perspectives and foster a consensus on the measurement and comprehension of effective SPH with greater clarity.
We evaluate the performance of a satellite SPH product against lidar observations using the following statistics: mean bias (MB), mean absolute error (MAE), root-mean-square error (RMSE), coefficient of determination (R2), and Pearson correlation coefficient (r). The metrics are calculated for the SPH using Eqs. (A1) to (A5):
Here, SPHlidar,i is the ith collocated lidar measurement, SPHsatellite,i is the ith collocated satellite retrieval, is the arithmetic mean of the collocated lidar measurements, is the arithmetic mean of the collocated satellite retrievals, and N is the number of collocated pairs.
The MB represents the average bias of a satellite SPH product, but it should be interpreted cautiously because positive and negative errors will cancel out. The MAE measures the average over the sample absolute differences between lidar measurements and satellite retrievals where all individual differences have equal weight, without considering their direction. The RMSE is the square root of the average of squared differences between lidar measurements and satellite retrievals. The RMSE is more useful when large outlier errors are particularly undesirable. Unlike the RMSE, the MAE is an unambiguous measure of average error magnitude. The R2 provides a statistical measure of how well a satellite SPH retrieval algorithm reflects the real-world conditions, as measured by the more direct lidar technique. The closer the R2 is to 1, the more reliable the satellite retrieval is with respect to representing the actual SPH. A negative R2 happens when the performance of the satellite SPH product is worse than the mean absolute deviation of the lidar observations. The r value is a measure of the strength of a linear association between two variables, indicating that the distribution of both lidar measurements and satellite retrievals for SPH has a similar trend in the change. The best performance that a satellite SPH product would have for these evaluation metrics is as follows: MB (km) = 0, MAE (km) = 0, RMSE (km) = 0, R2 (unitless) = 1, and r (unitless) = 1.
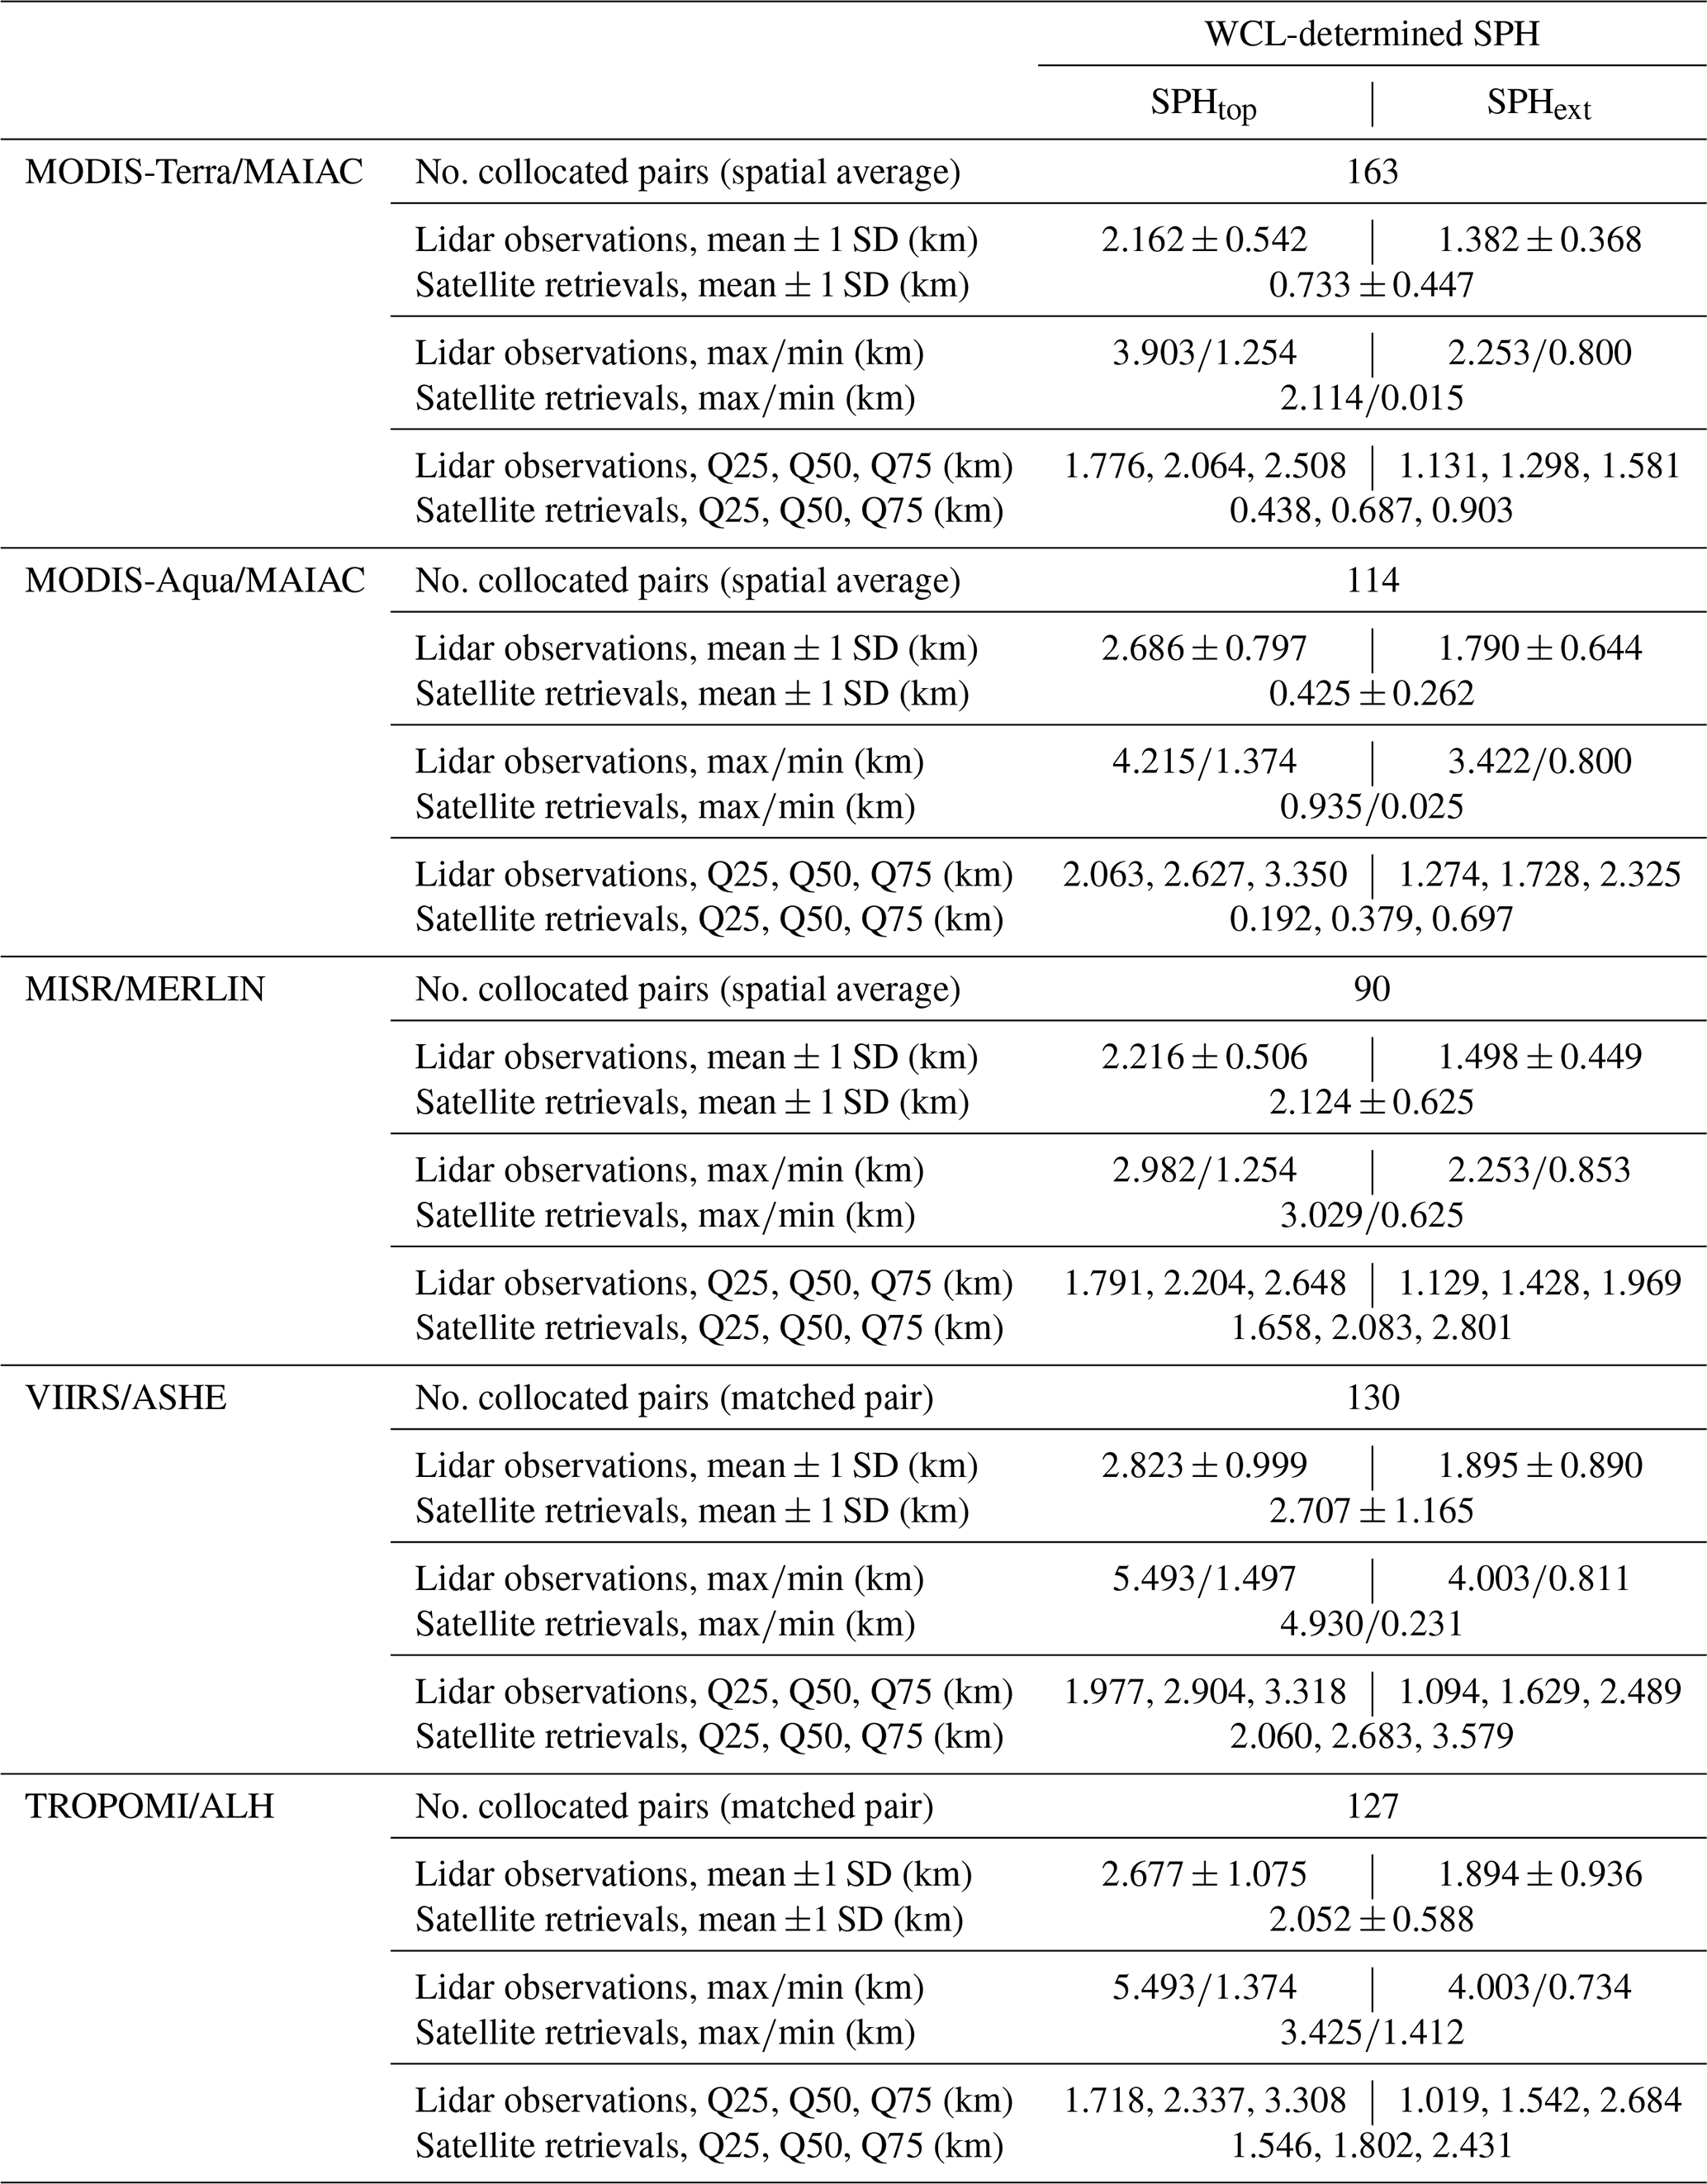
Table B1Additional statistical evaluation of four satellite-derived SPH products against WCL-determined SPH observations. Note that the satellite SPH information is only shown in one column to be compared with two distinctive WCL-determined SPH definitions. The metrics presented in the table are as follows: SD – standard deviation; Q25 – lower quartile, 25 % of the data lie below this value; Q50 – median, 50 % of the data lie below this value; and Q75 – upper quartile, 25 % of the data lie above this value.
The MODIS/MAIAC MCD19A2 Version 6.1 data product can be found at https://doi.org/10.5067/MODIS/MCD19A2.061 (Lyapustin and Wang, 2022). The Atmospheric Science Data Center hosts a web-based interface for freely downloading the MISR/MERLIN plume files at https://l0dup05.larc.nasa.gov/merlin/merlin# (NASA, 2022a). The TROPOMI/ALH Level 2 data are publicly available to users via the Copernicus Data Space Ecosystem at https://doi.org/10.5270/S5P-7g4iapn (ESA, 2021). The VIIRS/ASHE data can be obtained from the VIIRS Deep Blue aerosol group (https://doi.org/10.5067/VIIRS/AERDB_L2_VIIRS_SNPP.002, NASA, 2022b). The BB-FLUX WCL data can be obtained from the official UWKA project website (https://doi.org/10.15786/M25W9D, University of Wyoming – Flight Center, 2007). Balloon sounding data are available from the Atmospheric Soundings – Wyoming Weather Web website (https://weather.uwyo.edu/upperair/sounding.html, University of Wyoming, 1996).
The supplement related to this article is available online at: https://doi.org/10.5194/acp-24-3673-2024-supplement.
JH: conceptualization; investigation; methodology; lidar and satellite data curation; software; data visualization and analysis; writing – original draft; writing – review and editing. SMLS: investigation; methodology; writing – review and editing. MD: methodology; lidar data curation; writing – review and editing. JL: methodology; satellite data curation; writing – review and editing. HAH: conceptualization; investigation; methodology; supervision; funding acquisition; writing – review and editing.
The contact author has declared that none of the authors has any competing interests.
Publisher’s note: Copernicus Publications remains neutral with regard to jurisdictional claims made in the text, published maps, institutional affiliations, or any other geographical representation in this paper. While Copernicus Publications makes every effort to include appropriate place names, the final responsibility lies with the authors.
The authors acknowledge high-performance computing support from Cheyenne (https://doi.org/10.5065/D6RX99HX, Computational and Information Systems Laboratory, 2019), which is managed by the National Center for Atmospheric Research's (NCAR) Computational and Information Systems Laboratory (CISL) and sponsored by the National Science Foundation (NSF). We thank the University of Wyoming King Air team for the successful deployment of the 2018 BB-FLUX project (PI: Rainer Volkamer). We acknowledge the use of imagery from the Worldview Snapshots application (https://wvs.earthdata.nasa.gov, NASA, 2018), part of the Earth Observing System Data and Information System (EOSDIS). We appreciate the MODIS Adaptive Processing System (MODAPS) team, the MISR Wildfire Smoke Plume Height Project, the VIIRS Deep Blue aerosol group from NASA, and the TROPOMI algorithm team from the ESA for their efforts to create and maintain the satellite data records used in this paper.
This material is based on work supported, in part, by the NSF Division of Chemical, Bioengineering, Environmental, and Transport Systems (CBET) under grant no. 2048423.
This paper was edited by Qiang Zhang and reviewed by two anonymous referees.
Ansmann, A., Baars, H., Chudnovsky, A., Mattis, I., Veselovskii, I., Haarig, M., Seifert, P., Engelmann, R., and Wandinger, U.: Extreme levels of Canadian wildfire smoke in the stratosphere over central Europe on 21–22 August 2017, Atmos. Chem. Phys., 18, 11831–11845, https://doi.org/10.5194/acp-18-11831-2018, 2018.
Ansmann, A., Ohneiser, K., Mamouri, R.-E., Knopf, D. A., Veselovskii, I., Baars, H., Engelmann, R., Foth, A., Jimenez, C., Seifert, P., and Barja, B.: Tropospheric and stratospheric wildfire smoke profiling with lidar: mass, surface area, CCN, and INP retrieval, Atmos. Chem. Phys., 21, 9779–9807, https://doi.org/10.5194/acp-21-9779-2021, 2021.
Baars, H., Ansmann, A., Engelmann, R., and Althausen, D.: Continuous monitoring of the boundary-layer top with lidar, Atmos. Chem. Phys., 8, 7281–7296, https://doi.org/10.5194/acp-8-7281-2008, 2008.
Baars, H., Radenz, M., Floutsi, A. A., Engelmann, R., Althausen, D., Heese, B., Ansmann, A., Flament, T., Dabas, A., and Trapon, D.: Californian wildfire smoke over Europe: A first example of the aerosol observing capabilities of Aeolus compared to ground-based lidar, Geophys. Res. Lett., 48, e2020GL092194, https://doi.org/10.1029/2020GL092194, 2021.
Boone, J. T., Tosca, M., Galvin, A., Nastan, A., Schurman, D., Nair, P., Davidoff, S., Lombeyda, S., Mushkin, H., and Hendrie, M.: Redesigning for Research: Accessible Data Interaction with MISR Fire Plumes, AGU Fall Meeting Abstracts, GC51E-0840, 2018AGUFMGC51E0840B, 2018.
Brooks, I. M.: Finding boundary layer top: Application of a wavelet covariance transform to lidar backscatter profiles, J. Atmos. Ocean. Tech., 20, 1092–1105, https://doi.org/10.1175/1520-0426(2003)020<1092:FBLTAO>2.0.CO;2, 2003.
Cao, C., De Luccia, F. J., Xiong, X., Wolfe, R., and Weng, F.: Early on-orbit performance of the visible infrared imaging radiometer suite onboard the Suomi National Polar-Orbiting Partnership (S-NPP) satellite, IEEE T. Geosci. Remote Sens., 52, 1142–1156, https://doi.org/10.1109/TGRS.2013.2247768, 2013a.
Cao, C., Xiong, J., Blonski, S., Liu, Q., Uprety, S., Shao, X., Bai, Y., and Weng, F.: Suomi NPP VIIRS sensor data record verification, validation, and long-term performance monitoring, J. Geophys. Res.-Atmos., 118, 11664–11678, https://doi.org/10.1002/2013JD020418, 2013b.
Cardil, A., Monedero, S., Ramírez, J., and Silva, C. A.: Assessing and reinitializing wildland fire simulations through satellite active fire data, J. Environ. Manage., 231, 996–1003, https://doi.org/10.1016/j.jenvman.2018, 2019.
Cheeseman, M., Ford, B., Volckens, J., Lyapustin, A., and Pierce, J.: The relationship between MAIAC smoke plume heights and surface PM, Geophys. Res. Lett., 47, e2020GL088949, https://doi.org/10.1029/2020GL088949, 2020.
Chen, X., Wang, J., Xu, X., Zhou, M., Zhang, H., Garcia, L. C., Colarco, P. R., Janz, S. J., Yorks, J., and McGill, M.: First retrieval of absorbing aerosol height over dark target using TROPOMI oxygen B band: Algorithm development and application for surface particulate matter estimates, Remote Sens. Environ., 265, 112674, https://doi.org/10.1016/j.rse.2021.112674, 2021.
Chimot, J., Veefkind, J. P., Vlemmix, T., de Haan, J. F., Amiridis, V., Proestakis, E., Marinou, E., and Levelt, P. F.: An exploratory study on the aerosol height retrieval from OMI measurements of the 477 nm O2–O2 spectral band using a neural network approach, Atmos. Meas. Tech., 10, 783–809, https://doi.org/10.5194/amt-10-783-2017, 2017.
Chimot, J., Veefkind, J. P., Vlemmix, T., and Levelt, P. F.: Spatial distribution analysis of the OMI aerosol layer height: a pixel-by-pixel comparison to CALIOP observations, Atmos. Meas. Tech., 11, 2257–2277, https://doi.org/10.5194/amt-11-2257-2018, 2018.
Computational and Information Systems Laboratory: Cheyenne: HPE/SGI ICE XA System (NCAR Community Computing), National Center for Atmospheric Research, https://doi.org/10.5065/D6RX99HX, 2019.
Corradini, S. and Cervino, M.: Aerosol extinction coefficient profile retrieval in the oxygen A-band considering multiple scattering atmosphere. Test case: SCIAMACHY nadir simulated measurements, J. Quant. Spectrosc. Ra., 97, 354–380, https://doi.org/10.1016/j.jqsrt.2005.05.061, 2006.
Csiszar, I., Schroeder, W., Giglio, L., Ellicott, E., Vadrevu, K. P., Justice, C. O., and Wind, B.: Active fires from the Suomi NPP Visible Infrared Imaging Radiometer Suite: Product status and first evaluation results, J. Geophys. Res.-Atmos., 119, 803–816, https://doi.org/10.1002/2013JD020453, 2014.
Davis, K. J., Gamage, N., Hagelberg, C., Kiemle, C., Lenschow, D., and Sullivan, P.: An objective method for deriving atmospheric structure from airborne lidar observations, J. Atmos. Ocean. Tech., 17, 1455–1468, https://doi.org/10.1175/1520-0426(2000)017<1455:AOMFDA>2.0.CO;2, 2000.
de Arruda Moreira, G., Guerrero-Rascado, J. L., Bravo-Aranda, J. A., Foyo-Moreno, I., Cazorla, A., Alados, I., Lyamani, H., Landulfo, E., and Alados-Arboledas, L.: Study of the planetary boundary layer height in an urban environment using a combination of microwave radiometer and ceilometer, Atmos. Res., 240, 104932, https://doi.org/10.1016/j.atmosres.2020.104932, 2020.
Deng, M., Wang, Z., Volkamer, R., Snider, J. R., Oolman, L., Plummer, D. M., Kille, N., Zarzana, K. J., Lee, C. F., and Campos, T.: Wildfire smoke observations in the western United States from the airborne Wyoming Cloud Lidar during the BB-FLUX project. Part I: Data description and methodology, J. Atmos. Ocean. Tech., 39, 545–558, https://doi.org/10.1175/JTECH-D-21-0092.1, 2022a.
Deng, M., Volkamer, R. M., Wang, Z., Snider, J. R., Kille, N., and Romero-Alvarez, L. J.: Wildfire smoke observations in the western United States from the airborne Wyoming Cloud Lidar during the BB-FLUX project. Part II: Vertical structure and plume injection height, J. Atmos. Ocean. Tech., 39, 559–572, https://doi.org/10.1175/JTECH-D-21-0093.1, 2022b.
Diner, D. J., Beckert, J. C., Reilly, T. H., Bruegge, C. J., Conel, J. E., Kahn, R. A., Martonchik, J. V., Ackerman, T. P., Davies, R., and Gerstl, S. A.: Multi-angle Imaging SpectroRadiometer (MISR) instrument description and experiment overview, IEEE T. Geosci. Remote, 36, 1072–1087, https://doi.org/10.1109/36.700992, 1998.
Ding, S., Wang, J., and Xu, X.: Polarimetric remote sensing in oxygen A and B bands: sensitivity study and information content analysis for vertical profile of aerosols, Atmos. Meas. Tech., 9, 2077–2092, https://doi.org/10.5194/amt-9-2077-2016, 2016.
Dubovik, O., Herman, M., Holdak, A., Lapyonok, T., Tanré, D., Deuzé, J. L., Ducos, F., Sinyuk, A., and Lopatin, A.: Statistically optimized inversion algorithm for enhanced retrieval of aerosol properties from spectral multi-angle polarimetric satellite observations, Atmos. Meas. Tech., 4, 975–1018, https://doi.org/10.5194/amt-4-975-2011, 2011.
Dubuisson, P., Frouin, R., Dessailly, D., Duforêt, L., Léon, J.-F., Voss, K., and Antoine, D.: Estimating the altitude of aerosol plumes over the ocean from reflectance ratio measurements in the O2 A-band, Remote Sens. Environ., 113, 1899–1911, https://doi.org/10.1016/j.rse.2009.04.018, 2009.
Duforêt, L., Frouin, R., and Dubuisson, P.: Importance and estimation of aerosol vertical structure in satellite ocean-color remote sensing, Appl. Optics, 46, 1107–1119, https://doi.org/10.1364/ao.46.001107, 2007.
ESA: Copernicus Sentinel-5P, TROPOMI Level 2 Aerosol Layer Height products, Version 02, European Space Agency [data set], https://doi.org/10.5270/S5P-7g4iapn, 2021.
Flower, V. J. and Kahn, R. A.: Assessing the altitude and dispersion of volcanic plumes using MISR multi-angle imaging from space: Sixteen years of volcanic activity in the Kamchatka Peninsula, Russia, J. Volcanol. Geoth. Res., 337, 1–15, https://doi.org/10.1016/j.jvolgeores.2017.03.010, 2017.
Fromm, M., Peterson, D., and Di Girolamo, L.: The primary convective pathway for observed wildfire emissions in the upper troposphere and lower stratosphere: A targeted reinterpretation, J. Geophys. Res.-Atmos., 124, 13254–13272, https://doi.org/10.1029/2019JD031006, 2019.
Gamage, N. and Hagelberg, C.: Detection and analysis of microfronts and associated coherent events using localized transforms, J. Atmos. Sci., 50, 750–756, https://doi.org/10.1175/1520-0469(1993)050<0750:DAAOMA>2.0.CO;2, 1993.
Geddes, A. and Bösch, H.: Tropospheric aerosol profile information from high-resolution oxygen A-band measurements from space, Atmos. Meas. Tech., 8, 859–874, https://doi.org/10.5194/amt-8-859-2015, 2015.
Geospatial Multi-Agency Coordination Group: Historic Perimeters Combined 2000-2018 GeoMAC, https://data-nifc.opendata.arcgis.com/datasets/nifc::historic-perimeters-combined-2000-2018-geomac/about (last access: 20 November 2023), 2019.
Goldberg, M. D., Kilcoyne, H., Cikanek, H., and Mehta, A.: Joint Polar Satellite System: The United States next generation civilian polar-orbiting environmental satellite system, J. Geophys. Res.-Atmos., 118, 13463–13475, https://doi.org/10.1002/2013JD020389, 2013.
Gonzalez-Alonso, L., Val Martin, M., and Kahn, R. A.: Biomass-burning smoke heights over the Amazon observed from space, Atmos. Chem. Phys., 19, 1685–1702, https://doi.org/10.5194/acp-19-1685-2019, 2019.
Gordon, H. R.: Atmospheric correction of ocean color imagery in the Earth Observing System era, J. Geophys. Res.-Atmos., 102, 17081–17106, https://doi.org/10.1029/96JD02443, 1997.
Griffin, D., Sioris, C., Chen, J., Dickson, N., Kovachik, A., de Graaf, M., Nanda, S., Veefkind, P., Dammers, E., McLinden, C. A., Makar, P., and Akingunola, A.: The 2018 fire season in North America as seen by TROPOMI: aerosol layer height intercomparisons and evaluation of model-derived plume heights, Atmos. Meas. Tech., 13, 1427–1445, https://doi.org/10.5194/amt-13-1427-2020, 2020.
Hollstein, A. and Fischer, J.: Retrieving aerosol height from the oxygen A band: a fast forward operator and sensitivity study concerning spectral resolution, instrumental noise, and surface inhomogeneity, Atmos. Meas. Tech., 7, 1429–1441, https://doi.org/10.5194/amt-7-1429-2014, 2014.
Hsu, N. C., Herman, J., Bhartia, P., Seftor, C., Torres, O., Thompson, A., Gleason, J., Eck, T., and Holben, B.: Detection of biomass burning smoke from TOMS measurements, Geophys. Res. Lett., 23, 745–748, https://doi.org/10.1029/96GL00455, 1996.
Hsu, N. C., Herman, J., Torres, O., Holben, B., Tanre, D., Eck, T., Smirnov, A., Chatenet, B., and Lavenu, F.: Comparisons of the TOMS aerosol index with Sun-photometer aerosol optical thickness: Results and applications, J. Geophys. Res.-Atmos., 104, 6269–6279, https://doi.org/10.1029/1998JD200086, 1999.
Ichoku, C., Kahn, R., and Chin, M.: Satellite contributions to the quantitative characterization of biomass burning for climate modeling, Atmos. Res., 111, 1–28, https://doi.org/10.1016/j.atmosres.2012.03.007, 2012.
Jeong, M. and Hsu, N. C.: Retrievals of aerosol single-scattering albedo and effective aerosol layer height for biomass-burning smoke: Synergy derived from “A-Train” sensors, Geophys. Res. Lett., 35, L24801, https://doi.org/10.1029/2008GL036279, 2008.
Jeong, U., Tsay, S.-C., Hsu, N. C., Giles, D. M., Cooper, J. W., Lee, J., Swap, R. J., Holben, B. N., Butler, J. J., Wang, S.-H., Chantara, S., Hong, H., Kim, D., and Kim, J.: Simultaneous retrievals of biomass burning aerosols and trace gases from the ultraviolet to near-infrared over northern Thailand during the 2019 pre-monsoon season, Atmos. Chem. Phys., 22, 11957–11986, https://doi.org/10.5194/acp-22-11957-2022, 2022.
Junghenn Noyes, K. T., Kahn, R. A., Sedlacek, A., Kleinman, L., Limbacher, J. A., and Li, Z.: Wildfire smoke particle properties and evolution, from space-based multi-angle imaging, Remote Sens.-Basel, 12, 769, https://doi.org/10.3390/rs12050769, 2020.
Junghenn Noyes, K. T., Kahn, R. A., Limbacher, J. A., and Li, Z.: Canadian and Alaskan wildfire smoke particle properties, their evolution, and controlling factors, from satellite observations, Atmos. Chem. Phys., 22, 10267–10290, https://doi.org/10.5194/acp-22-10267-2022, 2022.
Kahn, R. A.: A Global Perspective on Wildfires, Eos, 101, https://doi.org/10.1029/2020EO138260, 2020.
Kahn, R. A., Li, W., Moroney, C., Diner, D. J., Martonchik, J. V., and Fishbein, E.: Aerosol source plume physical characteristics from space-based multiangle imaging, J. Geophys. Res.-Atmos., 112, D11205, https://doi.org/10.1029/2006JD007647, 2007.
Kahn, R. A., Chen, Y., Nelson, D. L., Leung, F., Li, Q., Diner, D. J., and Logan, J. A.: Wildfire smoke injection heights: Two perspectives from space, Geophys. Res. Lett., 35, L04809, https://doi.org/10.1029/2007GL032165, 2008.
Ke, Z., Wang, Y., Zou, Y., Song, Y., and Liu, Y.: Global Wildfire Plume-Rise Data Set and Parameterizations for Climate Model Applications, J. Geophys. Res.-Atmos., 126, e2020JD033085, https://doi.org/10.1029/2020JD033085, 2021.
Koffi, B., Schulz, M., Bréon, F., Griesfeller, J., Winker, D., Balkanski, Y., Bauer, S., Berntsen, T., Chin, M., and Collins, W. D.: Application of the CALIOP layer product to evaluate the vertical distribution of aerosols estimated by global models: AeroCom phase I results, J. Geophys. Res.-Atmos., 117, D10201, https://doi.org/10.1029/2011JD016858, 2012.
Kumar, A., Pierce, R. B., Ahmadov, R., Pereira, G., Freitas, S., Grell, G., Schmidt, C., Lenzen, A., Schwarz, J. P., Perring, A. E., Katich, J. M., Hair, J., Jimenez, J. L., Campuzano-Jost, P., and Guo, H.: Simulating wildfire emissions and plume rise using geostationary satellite fire radiative power measurements: a case study of the 2019 Williams Flats fire, Atmos. Chem. Phys., 22, 10195–10219, https://doi.org/10.5194/acp-22-10195-2022, 2022.
Kylling, A., Vandenbussche, S., Capelle, V., Cuesta, J., Klüser, L., Lelli, L., Popp, T., Stebel, K., and Veefkind, P.: Comparison of dust-layer heights from active and passive satellite sensors, Atmos. Meas. Tech., 11, 2911–2936, https://doi.org/10.5194/amt-11-2911-2018, 2018.
Labonne, M., Bréon, F., and Chevallier, F.: Injection height of biomass burning aerosols as seen from a spaceborne lidar, Geophys. Res. Lett., 34, L11806, https://doi.org/10.1029/2007GL029311, 2007.
Lee, J., Hsu, N. C., Bettenhausen, C., Sayer, A. M., Seftor, C. J., and Jeong, M.-J.: Retrieving the height of smoke and dust aerosols by synergistic use of VIIRS, OMPS, and CALIOP observations, J. Geophys. Res.-Atmos., 120, 8372–8388, https://doi.org/10.1002/2015JD023567, 2015.
Lee, J., Hsu, N. C., Bettenhausen, C., Sayer, A. M., Seftor, C. J., Jeong, M.-J., Tsay, S.-C., Welton, E. J., Wang, S.-H., and Chen, W.-N.: Evaluating the height of biomass burning smoke aerosols retrieved from synergistic use of multiple satellite sensors over Southeast Asia, Aerosol Air Qual. Res., 16, 2831–2842, https://doi.org/10.4209/aaqr.2015.08.0506, 2016.
Lee, J., Hsu, N. C., Sayer, A. M., Seftor, C. J., and Kim, W. V.: Aerosol layer height with enhanced spectral coverage achieved by synergy between VIIRS and OMPS-NM measurements, IEEE Geosci. Remote S., 18, 949–953, https://doi.org/10.1109/LGRS.2020.2992099, 2020.
Linley, G. D., Jolly, C. J., Doherty, T. S., Geary, W. L., Armenteras, D., Belcher, C. M., Bliege Bird, R., Duane, A., Fletcher, M., and Giorgis, M. A.: What do you mean, 'megafire'?, Global Ecol. Biogeogr., 31, 1906–1922, https://doi.org/10.1111/geb.13499, 2022.
Liu, D., Chen, S., Cheng, C., Barker, H. W., Dong, C., Ke, J., Wang, S., and Zheng, Z.: Analysis of global three-dimensional aerosol structure with spectral radiance matching, Atmos. Meas. Tech., 12, 6541–6556, https://doi.org/10.5194/amt-12-6541-2019, 2019a.
Liu, M., Lin, J., Boersma, K. F., Pinardi, G., Wang, Y., Chimot, J., Wagner, T., Xie, P., Eskes, H., Van Roozendael, M., Hendrick, F., Wang, P., Wang, T., Yan, Y., Chen, L., and Ni, R.: Improved aerosol correction for OMI tropospheric NO2 retrieval over East Asia: constraint from CALIOP aerosol vertical profile, Atmos. Meas. Tech., 12, 1–21, https://doi.org/10.5194/amt-12-1-2019, 2019b.
Liu, Y., Kochanski, A., Baker, K. R., Mell, W., Linn, R., Paugam, R., Mandel, J., Fournier, A., Jenkins, M. A., and Goodrick, S.: Fire behaviour and smoke modelling: model improvement and measurement needs for next-generation smoke research and forecasting systems, Int. J. Wildland Fire, 28, 570–588, https://doi.org/10.1071/wf18204, 2019c.
Liu, Z., Winker, D., Omar, A., Vaughan, M., Kar, J., Trepte, C., Hu, Y., and Schuster, G.: Evaluation of CALIOP 532 nm aerosol optical depth over opaque water clouds, Atmos. Chem. Phys., 15, 1265–1288, https://doi.org/10.5194/acp-15-1265-2015, 2015.
Loría-Salazar, S. M., Sayer, A. M., Barnes, J., Huang, J., Flynn, C., Lareau, N., Lee, J., Lyapustin, A., Redemann, J., Welton, E. J., Wilkins, J. L., and Holmes, H. A.: Evaluation of Novel NASA Moderate Resolution Imaging Spectroradiometer and Visible Infrared Imaging Radiometer Suite Aerosol Products and Assessment of Smoke Height Boundary Layer Ratio During Extreme Smoke Events in the Western USA, J. Geophys. Res.-Atmos., 126, e2020JD034180, https://doi.org/10.1029/2020JD034180, 2021.
Lu, Z., Wang, J., Xu, X., Chen, X., Kondragunta, S., Torres, O., Wilcox, E. M., and Zeng, J.: Hourly mapping of the layer height of thick smoke plumes over the western US in 2020 severe fire season, Front. Remote Sens., 2, 766628, https://doi.org/10.3389/frsen.2021.766628, 2021.
Lyapustin, A. and Wang, Y: MODIS/Terra+Aqua Land Aerosol Optical Depth Daily L2G Global 1km SIN Grid V061, NASA EOSDIS Land Processes Distributed Active Archive Center [data set], https://doi.org/10.5067/MODIS/MCD19A2.061, 2022.
Lyapustin, A., Wang, Y., and Frey, R.: An automatic cloud mask algorithm based on time series of MODIS measurements, J. Geophys. Res.-Atmos., 113, D16207, https://doi.org/10.1029/2007JD009641, 2008.
Lyapustin, A., Wang, Y., Korkin, S., Kahn, R., and Winker, D.: MAIAC thermal technique for smoke injection height from MODIS, IEEE Geosci. Remote S., 17, 730–734, https://doi.org/10.1109/LGRS.2019.2936332, 2019.
Mamouri, R.-E. and Ansmann, A.: Potential of polarization lidar to provide profiles of CCN- and INP-relevant aerosol parameters, Atmos. Chem. Phys., 16, 5905–5931, https://doi.org/10.5194/acp-16-5905-2016, 2016.
Mardi, A. H., Dadashazar, H., MacDonald, A. B., Braun, R. A., Crosbie, E., Xian, P., Thorsen, T. J., Coggon, M. M., Fenn, M. A., and Ferrare, R. A.: Biomass burning plumes in the vicinity of the California coast: Airborne characterization of physicochemical properties, heating rates, and spatiotemporal features, J. Geophys. Res.-Atmos., 123, 13560–13582, https://doi.org/10.1029/2018JD029134, 2018.
McGill, M. J., Yorks, J. E., Scott, V. S., Kupchock, A. W., and Selmer, P. A.: The Cloud-Aerosol Transport System (CATS): A technology demonstration on the International Space Station, Lidar Remote Sensing for Environmental Monitoring XV, San Diego, CA, 9–13 August 2015, 34–39, https://doi.org/10.1117/12.2190841, 2015.
Michailidis, K., Koukouli, M.-E., Siomos, N., Balis, D., Tuinder, O., Tilstra, L. G., Mona, L., Pappalardo, G., and Bortoli, D.: First validation of GOME-2/MetOp absorbing aerosol height using EARLINET lidar observations, Atmos. Chem. Phys., 21, 3193–3213, https://doi.org/10.5194/acp-21-3193-2021, 2021.
Michailidis, K., Koukouli, M.-E., Balis, D., Veefkind, J. P., de Graaf, M., Mona, L., Papagianopoulos, N., Pappalardo, G., Tsikoudi, I., Amiridis, V., Marinou, E., Gialitaki, A., Mamouri, R.-E., Nisantzi, A., Bortoli, D., João Costa, M., Salgueiro, V., Papayannis, A., Mylonaki, M., Alados-Arboledas, L., Romano, S., Perrone, M. R., and Baars, H.: Validation of the TROPOMI/S5P aerosol layer height using EARLINET lidars, Atmos. Chem. Phys., 23, 1919–1940, https://doi.org/10.5194/acp-23-1919-2023, 2023.
Moroney, C., Davies, R., and Muller, J.-P.: Operational retrieval of cloud-top heights using MISR data, IEEE T. Geosci. Remote, 40, 1532–1540, https://doi.org/10.1109/TGRS.2002.801150, 2002.
Muller, J.-P., Mandanayake, A., Moroney, C., Davies, R., Diner, D. J., and Paradise, S.: MISR stereoscopic image matchers: Techniques and results, IEEE T. Geosci. Remote, 40, 1547–1559, https://doi.org/10.1109/TGRS.2002.801160, 2002.
Nanda, S., Veefkind, J. P., de Graaf, M., Sneep, M., Stammes, P., de Haan, J. F., Sanders, A. F. J., Apituley, A., Tuinder, O., and Levelt, P. F.: A weighted least squares approach to retrieve aerosol layer height over bright surfaces applied to GOME-2 measurements of the oxygen A band for forest fire cases over Europe, Atmos. Meas. Tech., 11, 3263–3280, https://doi.org/10.5194/amt-11-3263-2018, 2018a.
Nanda, S., de Graaf, M., Sneep, M., de Haan, J. F., Stammes, P., Sanders, A. F. J., Tuinder, O., Veefkind, J. P., and Levelt, P. F.: Error sources in the retrieval of aerosol information over bright surfaces from satellite measurements in the oxygen A band, Atmos. Meas. Tech., 11, 161–175, https://doi.org/10.5194/amt-11-161-2018, 2018b.
Nanda, S., de Graaf, M., Veefkind, J. P., ter Linden, M., Sneep, M., de Haan, J., and Levelt, P. F.: A neural network radiative transfer model approach applied to the Tropospheric Monitoring Instrument aerosol height algorithm, Atmos. Meas. Tech., 12, 6619–6634, https://doi.org/10.5194/amt-12-6619-2019, 2019.
Nanda, S., de Graaf, M., Veefkind, J. P., Sneep, M., ter Linden, M., Sun, J., and Levelt, P. F.: A first comparison of TROPOMI aerosol layer height (ALH) to CALIOP data, Atmos. Meas. Tech., 13, 3043–3059, https://doi.org/10.5194/amt-13-3043-2020, 2020.
NASA: Global Imagery Browse Services (GIBS), Worldview Snapshots [data set], https://wvs.earthdata.nasa.gov/ (last access: 15 June 2023), 2018.
NASA: The MISR Enhanced Research and Lookup Interface (MERLIN), Atmospheric Sciences Data Center (ASDC) [data set], https://l0dup05.larc.nasa.gov/merlin/merlin# (last access: 10 August 2022), 2022a.
NASA: VIIRS/Suomi NPP Deep Blue Aerosol Level 2 6-Minute Swath 6 kilometer, Version 2, Level-1 and Atmosphere Archive and Distribution System Distributed Active Archive Center (LAADS DAAC) [data set], https://doi.org/10.5067/VIIRS/AERDB_L2_VIIRS_SNPP.002, 2022b.
Nastan, A., Val, S., Tosca, M., Galvin, A., Ainsworth, H., and Diner, D. J.: Enabling New Research with MISR Wildfire Plume Height Project Data: The MISR Enhanced Research and Lookup INterface (MERLIN), AGU Fall Meeting Abstracts, A14F-01, 2022AGUFM.A14F..01N, 2022.
Nelson, D. L., Chen, Y., Kahn, R. A., Diner, D. J., and Mazzoni, D.: Example applications of the MISR INteractive eXplorer (MINX) software tool to wildfire smoke plume analyses, Remote sensing of fire: Science and application, Proc. SPIE, 7089, 65–75, https://doi.org/10.1117/12.795087, 2008.
Nelson, D. L., Garay, M. J., Kahn, R. A., and Dunst, B. A.: Stereoscopic height and wind retrievals for aerosol plumes with the MISR INteractive eXplorer (MINX), Remote Sens.-Basel, 5, 4593–4628, 2013.
Paugam, R., Wooster, M., Atherton, J., Freitas, S. R., Schultz, M. G., and Kaiser, J. W.: Development and optimization of a wildfire plume rise model based on remote sensing data inputs – Part 2, Atmos. Chem. Phys. Discuss., 15, 9815–9895, https://doi.org/10.5194/acpd-15-9815-2015, 2015.
Paugam, R., Wooster, M., Freitas, S., and Val Martin, M.: A review of approaches to estimate wildfire plume injection height within large-scale atmospheric chemical transport models, Atmos. Chem. Phys., 16, 907–925, https://doi.org/10.5194/acp-16-907-2016, 2016.
Raffuse, S. M., Craig, K. J., Larkin, N. K., Strand, T. T., Sullivan, D. C., Wheeler, N. J., and Solomon, R.: An evaluation of modeled plume injection height with satellite-derived observed plume height, Atmosphere, 3, 103–123, https://doi.org/10.3390/atmos3010103, 2012.
Rosati, B., Herrmann, E., Bucci, S., Fierli, F., Cairo, F., Gysel, M., Tillmann, R., Größ, J., Gobbi, G. P., Di Liberto, L., Di Donfrancesco, G., Wiedensohler, A., Weingartner, E., Virtanen, A., Mentel, T. F., and Baltensperger, U.: Studying the vertical aerosol extinction coefficient by comparing in situ airborne data and elastic backscatter lidar, Atmos. Chem. Phys., 16, 4539–4554, https://doi.org/10.5194/acp-16-4539-2016, 2016.
Salomonson, V. V., Barnes, W., Xiong, J., Kempler, S., and Masuoka, E.: An overview of the Earth Observing System MODIS instrument and associated data systems performance, IEEE International Geoscience and Remote Sensing Symposium, Toronto, Canda, 24–28 June, 2002, 1174–1176, https://doi.org/10.1109/IGARSS.2002.1025812, 2002.
Sanders, A. F., De Haan, J. F., and Veefkind, J. P.: Retrieval of aerosol height from the oxygen A band with TROPOMI, Proceedings of Advances in Atmospheric Science and Applications, Bruges, Belgium, 18–22 June 2012, ESA SP-708, ISBN 978-92-9092-272-8, 2012.
Sanders, A. F. J., de Haan, J. F., Sneep, M., Apituley, A., Stammes, P., Vieitez, M. O., Tilstra, L. G., Tuinder, O. N. E., Koning, C. E., and Veefkind, J. P.: Evaluation of the operational Aerosol Layer Height retrieval algorithm for Sentinel-5 Precursor: application to O2 A band observations from GOME-2A, Atmos. Meas. Tech., 8, 4947–4977, https://doi.org/10.5194/amt-8-4947-2015, 2015.
Sanghavi, S., Martonchik, J. V., Landgraf, J., and Platt, U.: Retrieval of the optical depth and vertical distribution of particulate scatterers in the atmosphere using O2 A- and B-band SCIAMACHY observations over Kanpur: a case study, Atmos. Meas. Tech., 5, 1099–1119, https://doi.org/10.5194/amt-5-1099-2012, 2012.
Schroeder, W., Oliva, P., Giglio, L., and Csiszar, I. A.: The New VIIRS 375 m active fire detection data product: Algorithm description and initial assessment, Remote Sens. Environ., 143, 85–96, https://doi.org/10.1016/j.rse.2013.12.008, 2014.
Sicard, M., Granados-Muñoz, M. J., Alados-Arboledas, L., Barragán, R., Bedoya-Velásquez, A. E., Benavent-Oltra, J. A., Bortoli, D., Comerón, A., Córdoba-Jabonero, C., Costa, M. J., del Águila, A., Fernández, A. J., Guerrero-Rascado, J. L., Jorba, O., Molero, F., Muñoz-Porcar, C., Ortiz-Amezcua, P., Papagiannopoulos, N., Potes, M., Pujadas, M., Rocadenbosch, F., Rodríguez-Gómez, A., Román, R., Salgado, R., Salgueiro, V., Sola, Y., and Yela, M.: Ground/space, passive/active remote sensing observations coupled with particle dispersion modelling to understand the inter-continental transport of wildfire smoke plumes, Remote Sens. Environ., 232, 111294, https://doi.org/10.1016/j.rse.2019.111294, 2019.
Siomos, N., Balis, D. S., Poupkou, A., Liora, N., Dimopoulos, S., Melas, D., Giannakaki, E., Filioglou, M., Basart, S., and Chaikovsky, A.: Investigating the quality of modeled aerosol profiles based on combined lidar and sunphotometer data, Atmos. Chem. Phys., 17, 7003–7023, https://doi.org/10.5194/acp-17-7003-2017, 2017.
Solomon, S., Dube, K., Stone, K., Yu, P., Kinnison, D., Toon, O. B., Strahan, S. E., Rosenlof, K. H., Portmann, R., and Davis, S.: On the stratospheric chemistry of midlatitude wildfire smoke, P. Natl. Acad. Sci. USA, 119, e2117325119, https://doi.org/10.1073/pnas.2117325119, 2022.
Solomos, S., Amiridis, V., Zanis, P., Gerasopoulos, E., Sofiou, F., Herekakis, T., Brioude, J., Stohl, A., Kahn, R., and Kontoes, C.: Smoke dispersion modeling over complex terrain using high resolution meteorological data and satellite observations–The FireHub platform, Atmos. Environ., 119, 348–361, https://doi.org/10.1016/j.atmosenv.2015.08.066, 2015.
Sun, R., Krueger, S. K., Jenkins, M. A., Zulauf, M. A., and Charney, J. J.: The importance of fire–atmosphere coupling and boundary-layer turbulence to wildfire spread, Int. J. Wildland Fire, 18, 50–60, https://doi.org/10.1071/WF07072, , 2009.
Tang, W., Emmons, L. K., Buchholz, R. R., Wiedinmyer, C., Schwantes, R. H., He, C., Kumar, R., Pfister, G. G., Worden, H. M., Hornbrook, R. S., Apel, E. C. Tilmes, S., Gaubert, B., Martinez-Alonso, S.-E., Lacey, F., Holmes, C. D., Diskin, G. S., Bourgeois, I., Peischl, J., Ryerson, T. B., Hair, J. W., Weinheimer, A. J., Montzka, D. D., Tyndall, G. S., and Campos, T. L.: Effects of fire diurnal variation and plume rise on US Air quality during FIREX-AQ and WE-CAN Based on the multi-scale infrastructure for chemistry and aerosols (MUSICAv0), J. Geophys. Res.-Atmos., 127, e2022JD036650, https://doi.org/e2022JD036650, 2022.
Tedim, F., Leone, V., Amraoui, M., Bouillon, C., Coughlan, M. R., Delogu, G. M., Fernandes, P. M., Ferreira, C., McCaffrey, S., McGee, T. K., Parente, J., Paton, D., Pereira, M. G., Ribeiro, L. M., Viegas, D. X., and Xanthopoulos, G.: Defining Extreme Wildfire Events: Difficulties, Challenges, and Impacts, Fire, 1, 9, https://doi.org/10.3390/fire1010009, 2018.
Torres, O., Bhartia, P., Herman, J., Ahmad, Z., and Gleason, J.: Derivation of aerosol properties from satellite measurements of backscattered ultraviolet radiation: Theoretical basis, J. Geophys. Res.-Atmos., 103, 17099–17110, https://doi.org/10.1029/98JD00900, 1998.
Tosca, M. G., Randerson, J. T., Zender, C. S., Nelson, D. L., Diner, D. J., and Logan, J. A.: Dynamics of fire plumes and smoke clouds associated with peat and deforestation fires in Indonesia, J. Geophys. Res.-Atmos., 116, D08207, https://doi.org/10.1029/2010JD015148, 2011.
Toth, T. D., Zhang, J., Reid, J. S., and Vaughan, M. A.: A bulk-mass-modeling-based method for retrieving particulate matter pollution using CALIOP observations, Atmos. Meas. Tech., 12, 1739–1754, https://doi.org/10.5194/amt-12-1739-2019, 2019.
University of Wyoming: Wyoming Weather Web, Radiosonde Data, University of Wyoming, College of Engineering, Department of Atmospheric Science [data set], https://weather.uwyo.edu/upperair/sounding.html (last access: 22 May 2023), 1996.
University of Wyoming – Flight Center: The University of Wyoming Cloud Lidar (WCL), University of Wyoming, College of Engineering, Department of Atmospheric Science [data set], https://doi.org/10.15786/M25W9D, 2007.
Val Martin, M., Kahn, R. A., and Tosca, M. G.: A global analysis of wildfire smoke injection heights derived from space-based multi-angle imaging, Remote Sens.-Basel, 10, 1609, https://doi.org/10.3390/rs10101609, 2018.
Veefkind, J. P., Aben, I., McMullan, K., Förster, H., De Vries, J., Otter, G., Claas, J., Eskes, H., De Haan, J., and Kleipool, Q.: TROPOMI on the ESA Sentinel-5 Precursor: A GMES mission for global observations of the atmospheric composition for climate, air quality and ozone layer applications, Remote Sens. Environ., 120, 70–83, https://doi.org/10.1016/j.rse.2011.09.027, 2012.
Virtanen, T. H., Kolmonen, P., Sogacheva, L., Rodríguez, E., Saponaro, G., and de Leeuw, G.: Collocation mismatch uncertainties in satellite aerosol retrieval validation, Atmos. Meas. Tech., 11, 925–938, https://doi.org/10.5194/amt-11-925-2018, 2018.
Walter, C., Freitas, S. R., Kottmeier, C., Kraut, I., Rieger, D., Vogel, H., and Vogel, B.: The importance of plume rise on the concentrations and atmospheric impacts of biomass burning aerosol, Atmos. Chem. Phys., 16, 9201–9219, https://doi.org/10.5194/acp-16-9201-2016, 2016.
Wang, W. and Cao, C.: NOAA-20 VIIRS sensor data records geometric and radiometric calibration performance one year in-orbit, IGARSS 2019 – 2019 IEEE International Geoscience and Remote Sensing Symposium, Yokohama, Japan, 28 July–2 August, 2019, 8485–8488, https://doi.org/10.1109/IGARSS.2019.8899074, 2019.
Winker, D. M., Vaughan, M. A., Omar, A., Hu, Y., Powell, K. A., Liu, Z., Hunt, W. H., and Young, S. A.: Overview of the CALIPSO mission and CALIOP data processing algorithms, J. Atmos. Ocean. Tech., 26, 2310–2323, https://doi.org/10.1175/2009JTECHA1281.1, 2009.
Wolfe, R. E., Lin, G., Nishihama, M., Tewari, K. P., Tilton, J. C., and Isaacman, A. R.: Suomi NPP VIIRS prelaunch and on-orbit geometric calibration and characterization, J. Geophys. Res.-Atmos., 118, 11508–11521, https://doi.org/10.1002/jgrd.50873, 2013.
Wu, L., Hasekamp, O., van Diedenhoven, B., Cairns, B., Yorks, J. E., and Chowdhary, J.: Passive remote sensing of aerosol layer height using near-UV multiangle polarization measurements, Geophys. Res. Lett., 43, 8783–8790, https://doi.org/10.1002/2016GL069848, 2016.
Xu, X., Wang, J., Wang, Y., Zeng, J., Torres, O., Yang, Y., Marshak, A., Reid, J., and Miller, S.: Passive remote sensing of altitude and optical depth of dust plumes using the oxygen A and B bands: First results from EPIC/DSCOVR at Lagrange-1 point, Geophys. Res. Lett., 44, 7544–7554, https://doi.org/10.1002/2017GL073939, 2017.
Xu, X., Wang, J., Wang, Y., Zeng, J., Torres, O., Reid, J. S., Miller, S. D., Martins, J. V., and Remer, L. A.: Detecting layer height of smoke aerosols over vegetated land and water surfaces via oxygen absorption bands: hourly results from EPIC/DSCOVR in deep space, Atmos. Meas. Tech., 12, 3269–3288, https://doi.org/10.5194/amt-12-3269-2019, 2019.
- Abstract
- Introduction
- Measures of the wildfire SPH
- Methods
- Results and discussion
- Summary and conclusions
- Appendix A: Evaluation metrics for collocated lidar–satellite SPH comparison
- Appendix B
- Data availability
- Author contributions
- Competing interests
- Disclaimer
- Acknowledgements
- Financial support
- Review statement
- References
- Supplement
The requested paper has a corresponding corrigendum published. Please read the corrigendum first before downloading the article.
- Article
(5418 KB) - Full-text XML
- Corrigendum
-
Supplement
(3340 KB) - BibTeX
- EndNote
- Abstract
- Introduction
- Measures of the wildfire SPH
- Methods
- Results and discussion
- Summary and conclusions
- Appendix A: Evaluation metrics for collocated lidar–satellite SPH comparison
- Appendix B
- Data availability
- Author contributions
- Competing interests
- Disclaimer
- Acknowledgements
- Financial support
- Review statement
- References
- Supplement