the Creative Commons Attribution 4.0 License.
the Creative Commons Attribution 4.0 License.
 | 21 Mar 2024
Quasi-10 d wave activity in the southern high-latitude mesosphere and lower thermosphere (MLT) region and its relation to large-scale instability and gravity wave drag
Wonseok Lee
Byeong-Gwon Song
Yong Ha Kim
Seasonal variation in westward-propagating quasi-10 d waves (Q10DWs) in the mesosphere and lower thermosphere of the Southern Hemisphere (SH) high-latitude regions is investigated using meteor radar (MR) observations for the period of 2012–2016 and using the Specified Dynamics (SD) version of the Whole Atmosphere Community Climate Model (WACCM). The phase difference in meridional winds measured by two MRs located in Antarctica gives observational estimates of the amplitude and phase of the Q10DW with zonal wavenumber 1 (W1). The amplitude of the observed Q10DW-W1 is large around equinoxes. In order to elucidate the variations in the observed Q10DW-W1 and its possible amplification mechanism, we carry out two SD-WACCM experiments nudged towards the MERRA-2 reanalysis from the surface up to ∼ 60 km (EXP60) and ∼ 75 km (EXP75). Results of the EXP75 indicate that the observed Q10DW-W1 can be amplified around regions of barotropic and/or baroclinic instability in the middle mesosphere around 60–70° S. In the EXP60 experiment, it was also found that the Q10DW-W1 is amplified around the regions of instability, but the amplitude is too large compared to MR observations. The large-scale instability in the EXP60 in the SH summer mesosphere is stronger than that in the EXP75 and Microwave Limb Sounder observations. The larger instability in the EXP60 is related to the large meridional and vertical variations in polar mesospheric zonal winds in association with gravity wave parameterization (GWP). Given uncertainties inherent in GWP, these results can suggest that it is possible for models to spuriously generate traveling planetary waves such as the Q10DW, especially in summer, due to excessively strong large-scale instability in the SH high-latitude mesosphere.
- Article
(10345 KB) - Full-text XML
-
Supplement
(4937 KB) - BibTeX
- EndNote


A series of Rossby normal modes (free oscillations) is the homogeneous solution of the governing equations on a sphere linearized with respect to the isothermal and quiescent reference atmosphere (e.g., Andrews et al., 1987; Forbes et al., 1995; Salby, 1984). Traveling normal modes exhibit clear planetary-scale spatiotemporal oscillations throughout the whole atmosphere, and for sufficiently large amplitudes, these traveling planetary waves (PWs) can play an important role in momentum and energy transfer to the mean flow (Salby, 1984). Three gravest traveling normal modes have been observed: westward-propagating zonal-wavenumber-1 PWs with periods of approximately 5, 10, and 16 d. Classical wave theory based on the isothermal and quiescent atmosphere gives the theoretical periods of 5, 8.3, and 12.5 d, but the periods in the real atmosphere can be shifted to values close to 5, 10, and 16 d, respectively (Salby, 1981a, b), due to influences of vertical and meridional variation in the mean horizontal winds and temperature.
Among the gravest modes, the quasi-5 d wave (Q5DW) and quasi-16 d wave (Q16DW) have been extensively studied through observations, modeling, and assimilation products: ground-based observations (e.g., Day and Mitchell, 2010; He et al., 2020b; and Mitra et al., 2022), satellite observations (e.g., Forbes and Zhang, 2017; Huang et al., 2022), reanalysis data (e.g., Huang et al., 2017), and simulations (e.g., Qin et al., 2021). Using meteor radars (MRs) located in the northern and southern polar regions, Day and Mitchell (2010) showed that PW activity is strong during winter, and the seasonal variation in PW is similar in both polar regions. According to Qin et al. (2021) and Mitra et al. (2022), barotropic and baroclinic instabilities are the possible sources of the Q5DW and Q16DW in that the waves can draw energy from the mean flow in the region of instability. The disturbance of zonal-mean flow frequently occurs during large-scale meteorological events such as sudden stratospheric warming (SSW). It has been reported that the amplitude of the Q5DW or Q16DW increases during SSW events (Eswaraiah et al., 2016; Lee et al., 2021; Li et al., 2021; Ma et al., 2022). In addition, the amplified PWs can interact with tidal waves through the in situ nonlinear interaction, resulting in ionospheric disturbances during SSW (e.g., Goncharenko et al., 2020; Forbes et al., 2021; Liu et al., 2021; and Qin et al., 2019).
In contrast, the westward-propagating quasi-10 d wave (Q10DW) with zonal wavenumber 1 (W1) has received little attention compared to the other gravest normal modes. Forbes and Zhang (2015) showed that the Q10DW-W1 has a mean period of 9.8 ± 0.4 d using the temperature measurements from the Sounding of the Atmosphere using Broadband Emission Radiometry (SABER) instrument mounted on NASA's TIMED (Thermosphere–Ionosphere–Mesosphere Energetics Dynamics) satellite in 2002–2013. They showed that the large amplitude of the Q10DW-W1 is found in the mid-latitude (40–50° latitude) mesosphere and lower thermosphere (MLT) region of both hemispheres during equinoxes, although their results are limited to the latitude of 50° because of the yaw cycle of the satellite. Hirooka (2000) reported the global structure of the Q10DW-W1 using the Improved Stratosphere and Mesospheric Sounder (ISAMS) instrument aboard the Upper Atmosphere Research Satellite (UARS) from November 1991 to May 1992. The results also showed that the Q10DW-W1 is active during equinoxes and winter at 0.1 hPa (∼ 65 km). In addition, it was found that nonuniform and background zonal wind field can influence the structure of the wave in the mesosphere. The amplitude of the Q10DW-W1 is uniform or decays in the vertical near the mesopause, and it does not increase above the mesosphere even though the critical layer is absent. Using the assimilated reanalysis airglow intensities simulated by the global circulation model from the ground to 30 km, Egito et al. (2017) also found that the 10 d oscillation is dominant from autumn to spring in the mid-latitude MLT region. More recently, Huang et al. (2021) investigated Q10DW activity based on the Modern-Era Retrospective analysis for Research and Applications version 2 (MERRA-2) reanalysis data. They showed that the dominant components of the Q10DW are westward-propagating waves with zonal wavenumber 1 during winter and spring in the stratosphere and mesosphere and eastward-propagating waves with zonal wavenumber 1 and 2, which are both excited in the region of mesospheric instability. Although both westward and eastward Q10DW modes are found, they mainly focus on the eastward-propagating Q10DW.
Several studies have investigated the response of the Q10DW-W1 to SSWs. Matthias et al. (2012) conducted a composite analysis of wave activities during major Northern Hemisphere (NH) SSWs from 1989 to 1998, revealing an amplification of the Q10DW-W1 in the NH high-latitude MLT region following major SSW events. He et al. (2020a, b) utilized NH MRs to observe the occurrence of the Q10DW-W1 and Q16DW-W1 during four major winter SSWs. They found that these waves persisted for approximately three to five whole cycles during the events. Chandran et al. (2013) examined the forcing of secondary PW-W1s driven by stratospheric instability on zonal winds as a response to the 2012 NH minor SSW. Sassi and Liu (2014) conducted numerical simulations during minor and major NH SSWs and solar minimum conditions. They found that PW-W1s with periods between 2 and 10 d originating in the high-latitude NH were able to propagate equatorward and influence equatorially trapped tides. This equatorward propagation of secondary PWs was also reported by Qin et al. (2022). They suggested that secondary PW-W1s with periods of 10 to 16 d generated in the high-latitude NH during sudden stratospheric final warming could impact the Southern Hemisphere (SH) stratosphere depending on the phase of the quasi-biennial oscillation (QBO). In the SH, studies by Lee et al. (2021) and Wang et al. (2021) using SH MRs reported that the Q10DW was amplified prior to the 2019 SH SSW. Yamazaki and Matthias (2019) reported that the Q10DW-W1 is not only intensified during SSWs but also affected by the seasonal timing of SSWs (i.e., final stratospheric warming) in regions of stratospheric instability.
While the amplification mechanism of the Q10DW-W1 generated following SSWs has been addressed in previous studies (e.g., Qin et al., 2022; Yin et al., 2023), the specific mechanisms driving its seasonal amplification during equinoxes remain less explored. In the present study, we focus on the seasonal variation in the Q10DW-W1 in the SH high-latitude MLT region using MRs located in Antarctica. In addition, we carry out numerical simulations using the Specified Dynamics Whole Atmosphere Community Climate Model (SD-WACCM) nudged towards MERRA-2 reanalysis data, in order to elucidate the observed Q10DW-W1 and its amplification mechanism. Section 2 describes two MRs located at the Davis station (68.6° S, 77.9° E) and King Sejong Station (KSS; 62.2° S, 58.8° W) and describes how we obtained the Q10DW-W1 from the observations. Also, the SD-WACCM experiments and Microwave Limb Sounder (MLS) data used for validation are described in Sect. 2. Results are presented in Sect. 3. In Sect. 3.1, we show seasonal variation in the observed and modeled Q10DW-W1 in the SH high-latitude MLT region. The amplification mechanism of the Q10DW is discussed in Sect. 3.2. Q10DW activities from SD-WACCM simulations are demonstrated in Sect. 3.3. In Sect. 4, the results are summarized and their implications are discussed.
2.1 Meteor radars
In this study, we use two MRs located at the Davis station (68.6° S, 77.9° E) and King Sejong Station (KSS; 62.2° S, 58.8° W), Antarctica, from 2012 to 2016. The operating frequencies of both the Davis and KSS MRs are 33.2 MHz and the peak powers are 6.8 and 12 kW for each respective MR. Details of the operation parameters of Davis and KSS are summarized in Holdsworth et al. (2008) and Lee et al. (2018), respectively. A large number of studies has been performed to investigate PW or tidal activities in the MLT region using single-station measurements of horizontal winds from an MR (e.g., Eswaraiah et al., 2019; Luo et al., 2021; Wang et al., 2021; Liu et al., 2022; and Lee et al., 2021). However, single-station analysis has a limitation in diagnosing the wave propagation direction, and thus most such studies focused on the timing of occurrence and amplitude variations in waves with a particular periodicity. For detailed analysis of PWs based on the Rossby normal modes, propagation directions and wavenumbers need to be considered. Recently, He et al. (2018) developed a method of estimating wave propagation direction and wavenumber as well as amplitude by adopting the phase differencing technique (PDT) to longitudinally separated MR observations based on the method of Walker et al. (2004). Since the longitudinal difference (λΔ) between Davis and KSS is about 137°, the PDT is appropriate for analyzing PWs with zonal wavenumber 1. In order to estimate the zonal wavenumber (s), we first make a continuous wavelet transformation from the daily-mean Davis and KSS MR data , respectively, using the Morlet wavelet function as a mother wavelet function (Torrence and Compo, 1998). Then, the cross wavelet spectrum C(f,t) is derived: , where ∗ denotes the complex conjugate. Using the phase difference (θΔ) obtained from at a given frequency and time, we estimate the zonal wavenumber (s): . In this study, we focus on the PW activity with s = 1, and the number of whole wave cycle (C) between the two stations is set to zero (see He et al., 2018, for detailed PDT analysis).
Classical wave theory shows that the latitudinal structures of zonal and meridional wind components for the Q10DW normal mode from the Laplace tidal equation are antisymmetric and symmetric with respect to the Equator, respectively (e.g., Fig. 1 in Yamazaki and Matthias, 2019). The magnitude of the Q10DW-W1 has maxima at a latitude of 25° and the poles for zonal and meridional wind components, respectively. Around the latitude of 65° S, close to the latitudes of the two MR observation sites, the normalized amplitude of the Q10DW-W1 normal mode for the zonal wind is nearly zero, but the normalized normal-mode magnitude for the meridional wind is larger than the half of the maximum magnitude of the meridional wind (Yamazaki and Matthias, 2019). For this reason, daily-mean meridional wind data from the MRs are used for the Q10DW analysis.
2.2 SD-WACCM
In this study, for detailed analysis of the observed Q10DW-W1 activity and of its amplification mechanism, we compare observational results with the Q10DW-W1 simulated using the Specified Dynamics (SD) version of WACCM4 (Marsh et al., 2013). WACCM4 is a high-top (up to the lower thermosphere at about 140 km) atmospheric component model of the Community Earth System Model developed by the National Center for Atmospheric Research. WACCM4 employs the Community Atmospheric Model (CAM) version 4 physics package. The default horizontal resolution of WACCM4 is 1.9° × 2.5° (lat. × long.), and it uses 88 hybrid sigma vertical levels for the SD mode. Since we focus on PWs such as the Q10DW-W1, daily-mean values from the SD-WACCM are used. In this study, two SD-WACCM experiments with two different nudging depths (EXP60 and EXP75) are performed. In the EXP60 and EXP75, model variables are nudged towards the MERRA-2 reanalysis data from the surface to about 60 km and 75 km in altitude, respectively. The MERRA-2 reanalysis is produced by assimilating various types of observations into the Goddard Earth Observing System version 6 (GEOS-6) global model (Gelaro et al., 2017). In addition to conventional meteorological observations and operational satellite measurements, Earth Observing System (EOS) Aura MLS temperature and ozone data are included in the assimilation procedure of MERRA-2 from 5 hPa (∼ 37 km) up to 0.02 hPa (∼ 75 km) for temperature and from 250 hPa (∼ 10 km) to 0.1 hPa (∼ 65 km) for ozone (Gelaro et al., 2017; McCormack et al., 2021). There is a divergence damping layer near the top boundary of the GEOS-6 model used for production of the MERRA-2 reanalysis (Fujiwara et al., 2017). Divergence damping is often used to effectively and selectively remove high-frequency (noisy) gravity waves, keeping the large-scale circulation and PW structure less affected (Jablonowski and Williamson, 2011). As a result, the MERRA-2 reanalysis can reflect large-scale MLT variabilities (e.g., McCormack et al., 2021; Harvey et al., 2021). As suggested by Brakebusch et al. (2013), nudging coefficients for EXP60 and EXP75 below the altitudes of 50 and 65 km, respectively, are 0.01 s−1, and they decrease linearly and become zero above the altitudes of 60 and 75 km for their respective simulations.
WACCM simulation requires sea surface temperature, sea ice fraction, solar and geomagnetic index, and ionization rate by energetic particle precipitation (EPP) data for the time period of the simulations. The sea surface temperature and sea ice fraction data are produced by the NOAA Optimum Interpolation (Reynolds et al., 2002). The solar and geomagnetic indices are obtained from the NASA Goddard Space Flight Center (GSFC) Space Physics Data Facility (SPDF) OMNIWeb interface (https://omniweb.gsfc.nasa.gov/ow.html, last access: March 2024). The EPP ionization rate comes from the Chemistry–Climate Model Initiative (CCMI) REFC2 data for the period of 1960–2100 (Eyring et al., 2013). Regarding MLT dynamics, the effects of gravity wave drag (GWD) are crucial. WACCM includes a suite of GWD parameterizations (Richter et al., 2010) for the effects of unresolved GW momentum transfer from orography (McFarlane, 1987), deep convection (Beres et al., 2005), and frontal activity (Charron and Manzini, 2002). SD-WACCM simulations start from 1 January 2011 and end on 31 December 2016. The first year of results is discarded as a spin-up, and results for 2012–2016 are compared with MR observations.
2.3 MLS
To validate the Q10DW-W1 estimates obtained from MR observations, we derive the geostrophic winds from geopotential height (GPH) data (version 5.1) measured using the MLS on board NASA's EOS Aura satellite (Schwartz et al., 2008). Geostrophic wind components are computed following Matthias and Ern (2018). The Aura satellite launched on July 2004 is in a sun-synchronous orbit with an altitude of 705 km. Spatial coverage of the MLS instrument is from 82° S to 82° N with a 165 km resolution along the track. The sun-synchronous orbit of the Aura satellite can provide daily global coverage data in about 15 orbits. The global coverage of GPH is produced using daily mean values in 5° × 5° (lat × long) grids. In this process, GPH data are filtered on the basis of the recommended precision, status, quality, and convergence thresholds of Version 5.0x Level 2 and 3 data quality and description document (https://mls.jpl.nasa.gov/data/v5-0_data_quality_document.pdf, last access: March 2024).
3.1 Seasonal variation in the Q10DW-W1 in the MLT region
The meridional wind perturbation for the Q10DW-W1 is symmetric in latitude around the Equator, as mentioned earlier. Therefore, in order to extract and analyze the Q10DW-W1, which is potentially related to the Rossby normal mode in the MLT region, it is necessary to confirm whether the latitudinal structure of the Q10DW-W1 has hemispheric symmetry. Although the KSS and Davis MR observations can provide information about longitudinal propagation of the Q10DW-W1, it is impossible to estimate the latitudinal structure using these radars alone. In this study, the meridional geostrophic winds obtained from the MLS geopotential data are used to confirm the hemispheric symmetry of the Q10DW-W1 estimated from MRs. The amplitudes of the Q10DW-W1 in the MLS are obtained using a two-dimensional fast Fourier transform (FFT) of the geostrophic meridional winds averaged over the height range of 80–90 km in the time (30 d sliding window) and longitude domain. The time–latitude cross section of the amplitude of the Q10DW-W1 derived from the MLS geostrophic meridional wind averaged over the height range of 80–90 km is presented in the Supplement (Fig. S1). Hereafter, “Q10DW” denotes a westward-propagating quasi-10 d normal-mode wave with zonal wavenumber 1 and hemispheric symmetry, where “quasi-10 d periodicity” means periods between 9 and 11 d. Unless hemispheric symmetry is satisfied, the analyzed westward-propagating signals with zonal wavenumber 1 are referred to as quasi-10 d-like oscillations (Q10DOs).
Figure 1 shows the time–height distributions of the amplitudes of Q10DWs and Q10DOs derived from the daily-mean meridional winds observed at the Davis and KSS MRs using the PDT method. The regions shaded in gray represent the time periods when hemispheric symmetry was not found in the MLS results, as shown in Fig. S1. The time periods of the hemispheric symmetries are defined by the periods when the amplitudes of the MLS meridional geostrophic winds (vertically averaged over 80–90 km) with quasi-10 d periodicity exceeded 3.5 m s−1 in both 60–80° N and 60–80° S. MLS results during solstices are generally shaded in gray (see Fig. S1). This result indicates that normal-mode Q10DWs are found during equinoxes, which is consistent with the results from Forbes and Zhang (2015). Using the periods of hemispheric symmetry of the Q10DW obtained from the MLS, we identify the normal-mode Q10DW from the Davis and KSS MR observations.
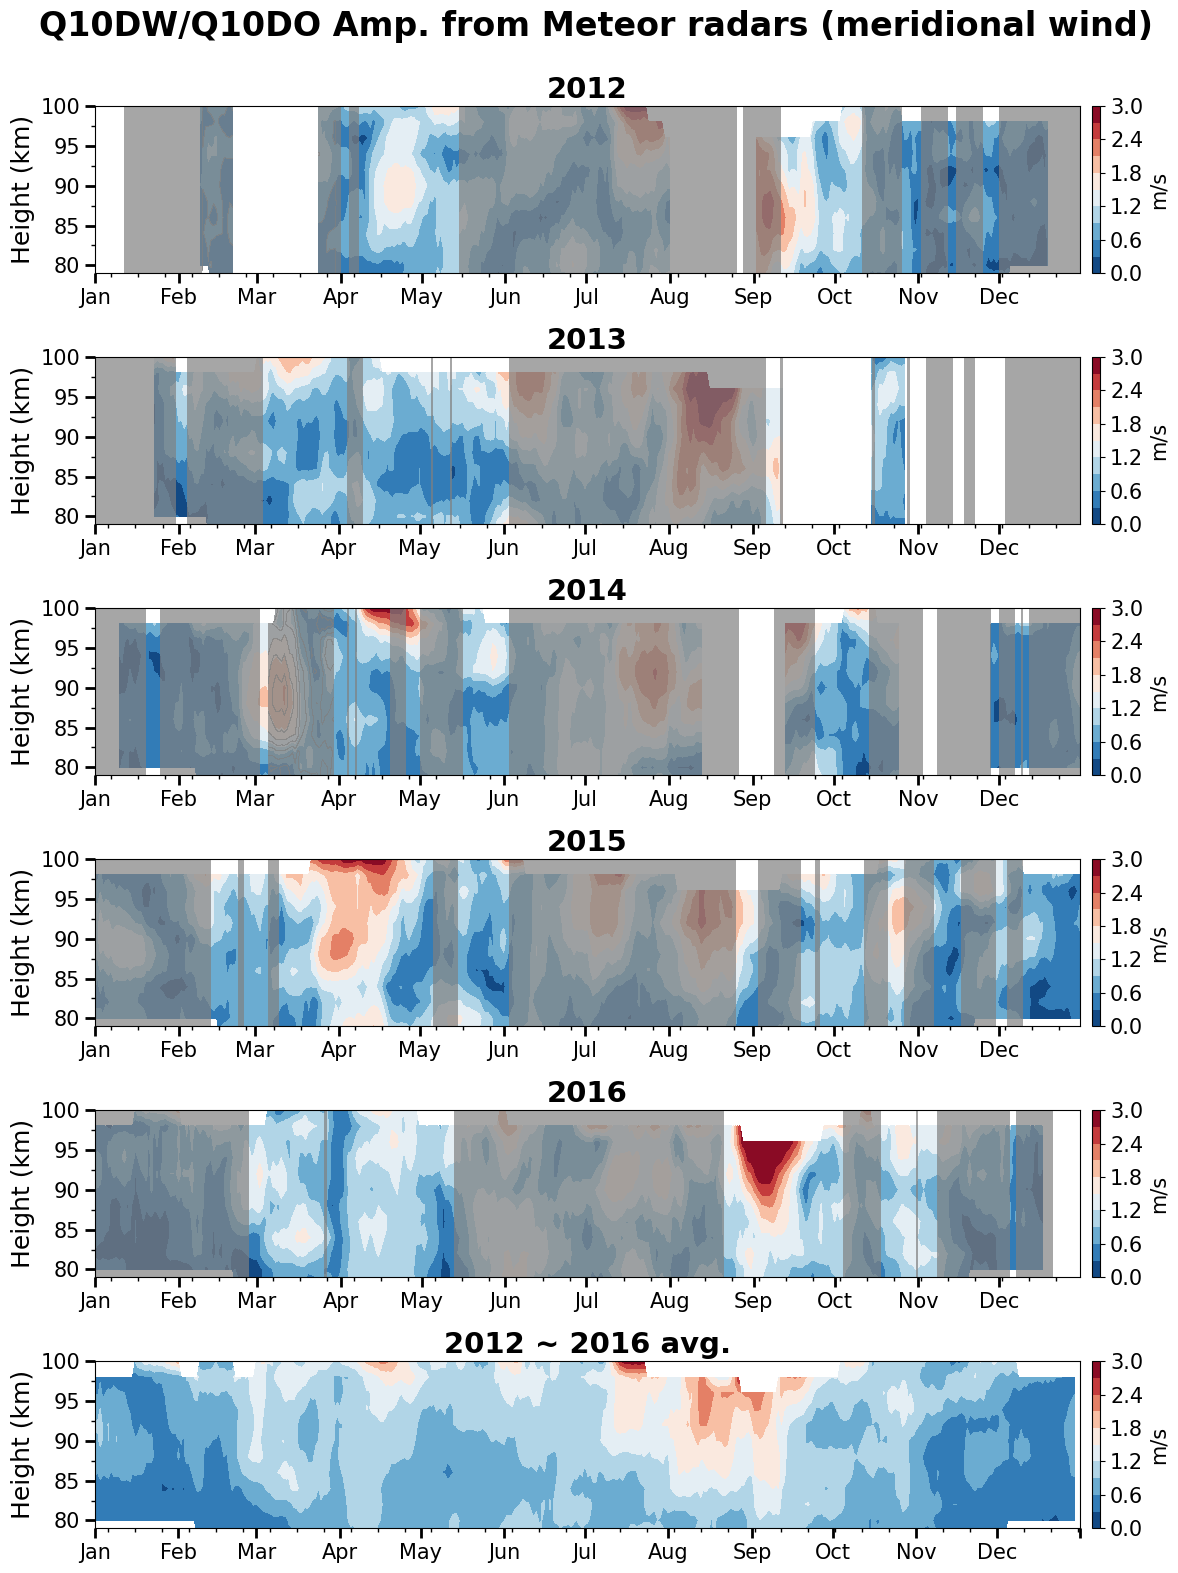
Figure 1Time–height distributions of the amplitudes of Q10DWs (unshaded regions) and Q10DOs (shaded regions) derived from meridional winds observed by MRs at Davis (68.6° S, 77.9° E) and KSS (62.2° S, 58.8° W) from 2012–2016. The bottommost panel shows the 5-year average from 2012 to 2016. The gray shading represents time periods where the hemispheric symmetry is unclear in the MLS results (see the text for details).
The 5-year average (the bottommost panel of Fig. 1) between 2012 and 2016 indicates that Q10DWs are generally enhanced from late February to April and from late August to September in the altitude range of 82–98 km with a maximum amplitude of 2.6 m s−1. Q10DWs are usually more amplified in early spring, from late August to September, with the largest amplitudes around the altitudes of 90–95 km. Large amplitudes are found in winter (July to mid-August), but they are unlikely to represent normal-mode Q10DWs as is clear from the gray shading in winter. According to Wang et al. (2021), nonlinear wave–wave interaction can generate Q10DOs in SH winter. Their Q10DOs are eastward-propagating, interacting with stationary PWs with zonal wavenumber 1. Meanwhile, the Q10DWs and Q10DOs (Fig. 1) obtained from two MRs using the PDT method are westward-propagating. Understanding of the mechanisms of the wintertime westward-propagating Q10DOs is beyond the scope of this study and requires continuing research. It is important to note that the amplitudes of the Q10DW are systematically lower in MRs compared to the MLS results. These discrepancies might be attributed to the accuracy of estimated geostrophic winds from the MLS data or to the inherent limitations of MR analysis, which in our case involves only two stations located at slightly different latitudes.
For individual years, it was also found that the amplitude of the Q10DW is generally large during equinoxes (see panels for each year in Fig. 1 and S1). During March–April (autumn), active Q10DWs are identified, and their amplitudes reach up to ∼ 3 m s−1 in 2014 and 2015. In particular, the peak in September (spring) is prominent in 2016. These MR observation results are remarkably consistent with results obtained using satellite geopotential height in the high-latitude SH region (Forbes and Zhang, 2015). Occasionally, large-amplitude Q10DWs are observed near an altitude of 98–100 km during equinoxes (e.g., April 2015), but results around 100 km can be less reliable because the number of MR echoes above 96 km is much smaller than those around 90 km (Lee et al., 2022).
Figure 2 demonstrates the time–height distributions of the amplitudes of Q10DWs and Q10DOs around the latitude of 63° S in the EXP75 SD-WACCM simulation for an altitude range of 60–110 km in 2012–2016, along with the hemispheric symmetry period obtained from the MLS results. The bottommost panel in Fig. 2 shows the 5-year average from 2012 to 2016. The amplitudes are obtained by decomposing the meridional winds obtained from the simulation into westward-propagating Fourier modes with zonal wavenumber 1 using the 2D FFT in time (30 d sliding window) and a longitudinal domain around 63° S. From Fig. 2, it is clear that the seasonal variations in the Q10DW amplitudes obtained from the simulation have year-to-year variations, the same as in the Q10DW amplitudes derived from the two MRs. However, the Q10DW activities observed in the MR observations are much smaller than those in the EXP75 simulation (see Fig. 1).
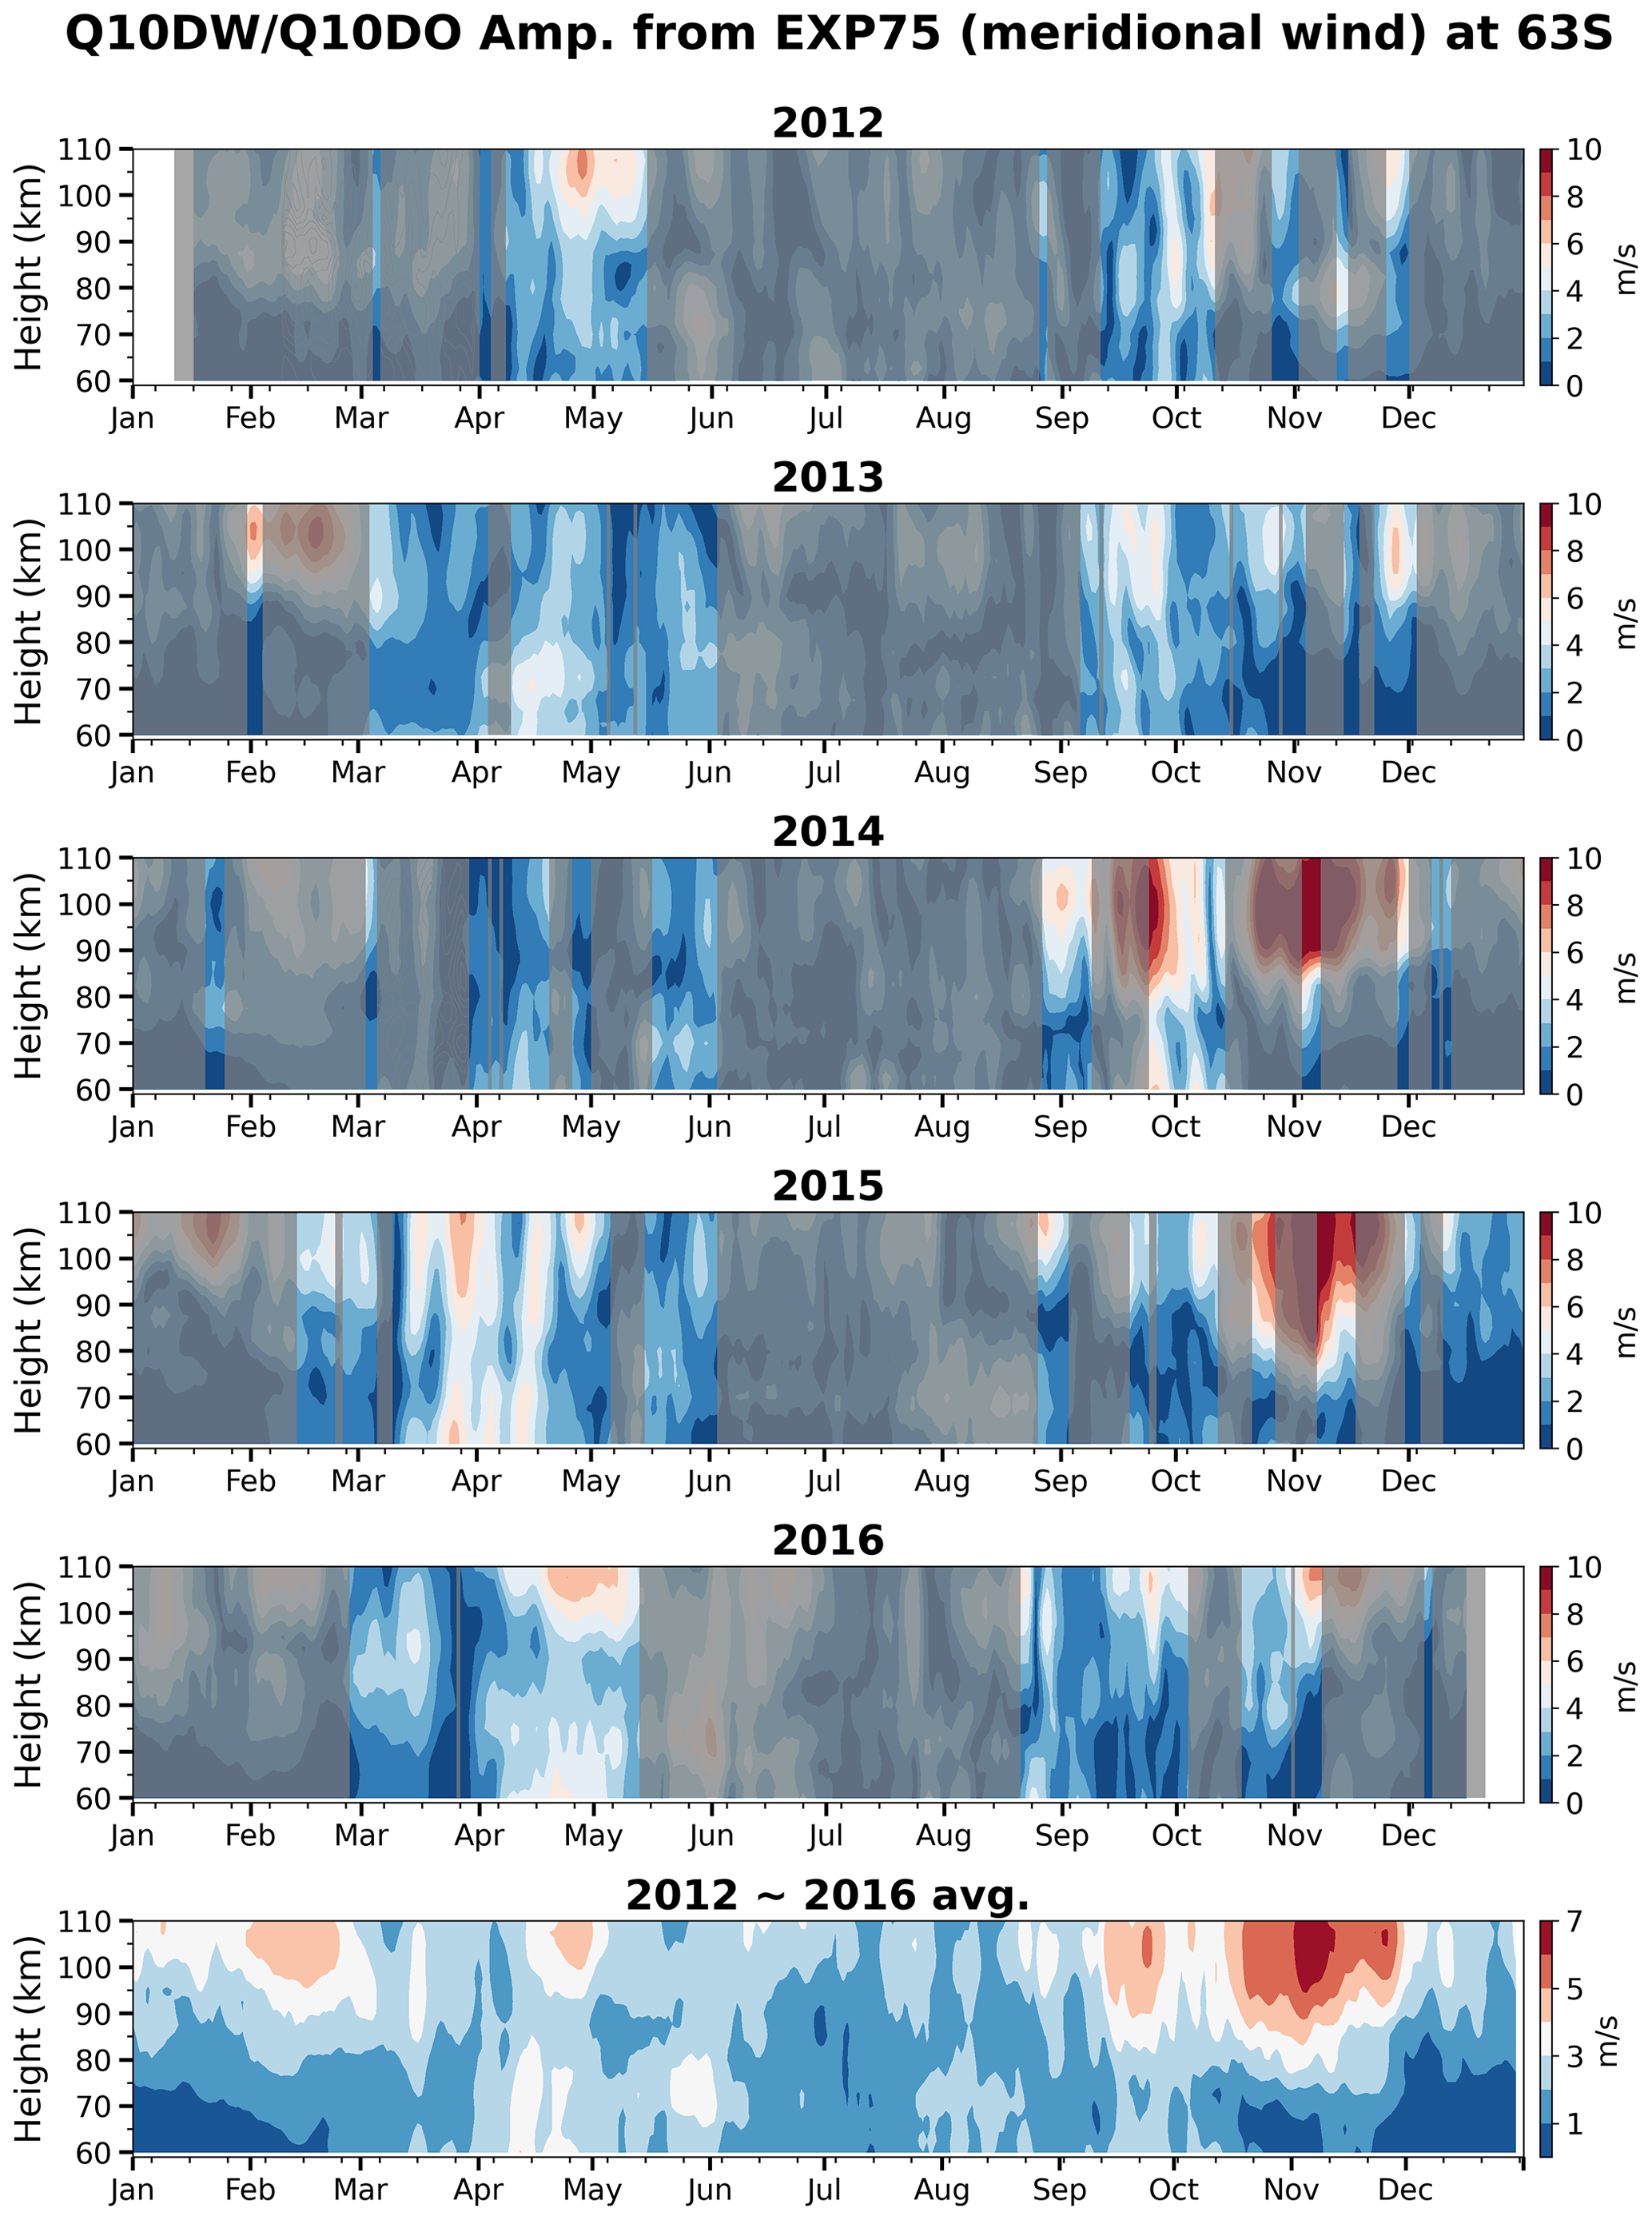
Figure 2Time–height distributions of the amplitudes of Q10DWs (unshaded regions) and Q10DOs (shaded regions) around 63° S from 2012–2016 in the EXP75 simulation. The bottommost panel shows the 5-year average between 2012 and 2016. The gray shaded areas represent periods where hemispheric symmetry was not observed in the MLS results.
The 5-year average in Fig. 2 shows that there are four main time periods (February, April, September, and November) when the modeled Q10DWs and Q10DOs are active in the EXP75 simulation. April and September are consistent with the MR observations, in terms of Q10DW amplitudes and hemispheric symmetry obtained from the MLS, but the other periods are not. The active signals simulated in February and November do not appear to be normal-mode Q10DWs because hemispheric symmetry is not seen in the MLS data during February and November. For a more comprehensive understanding of the Q10DOs in the EXP75 simulation during February and November, we will discuss this in more detail later in Sect. 3.3 by comparing the EXP75 and EXP60.
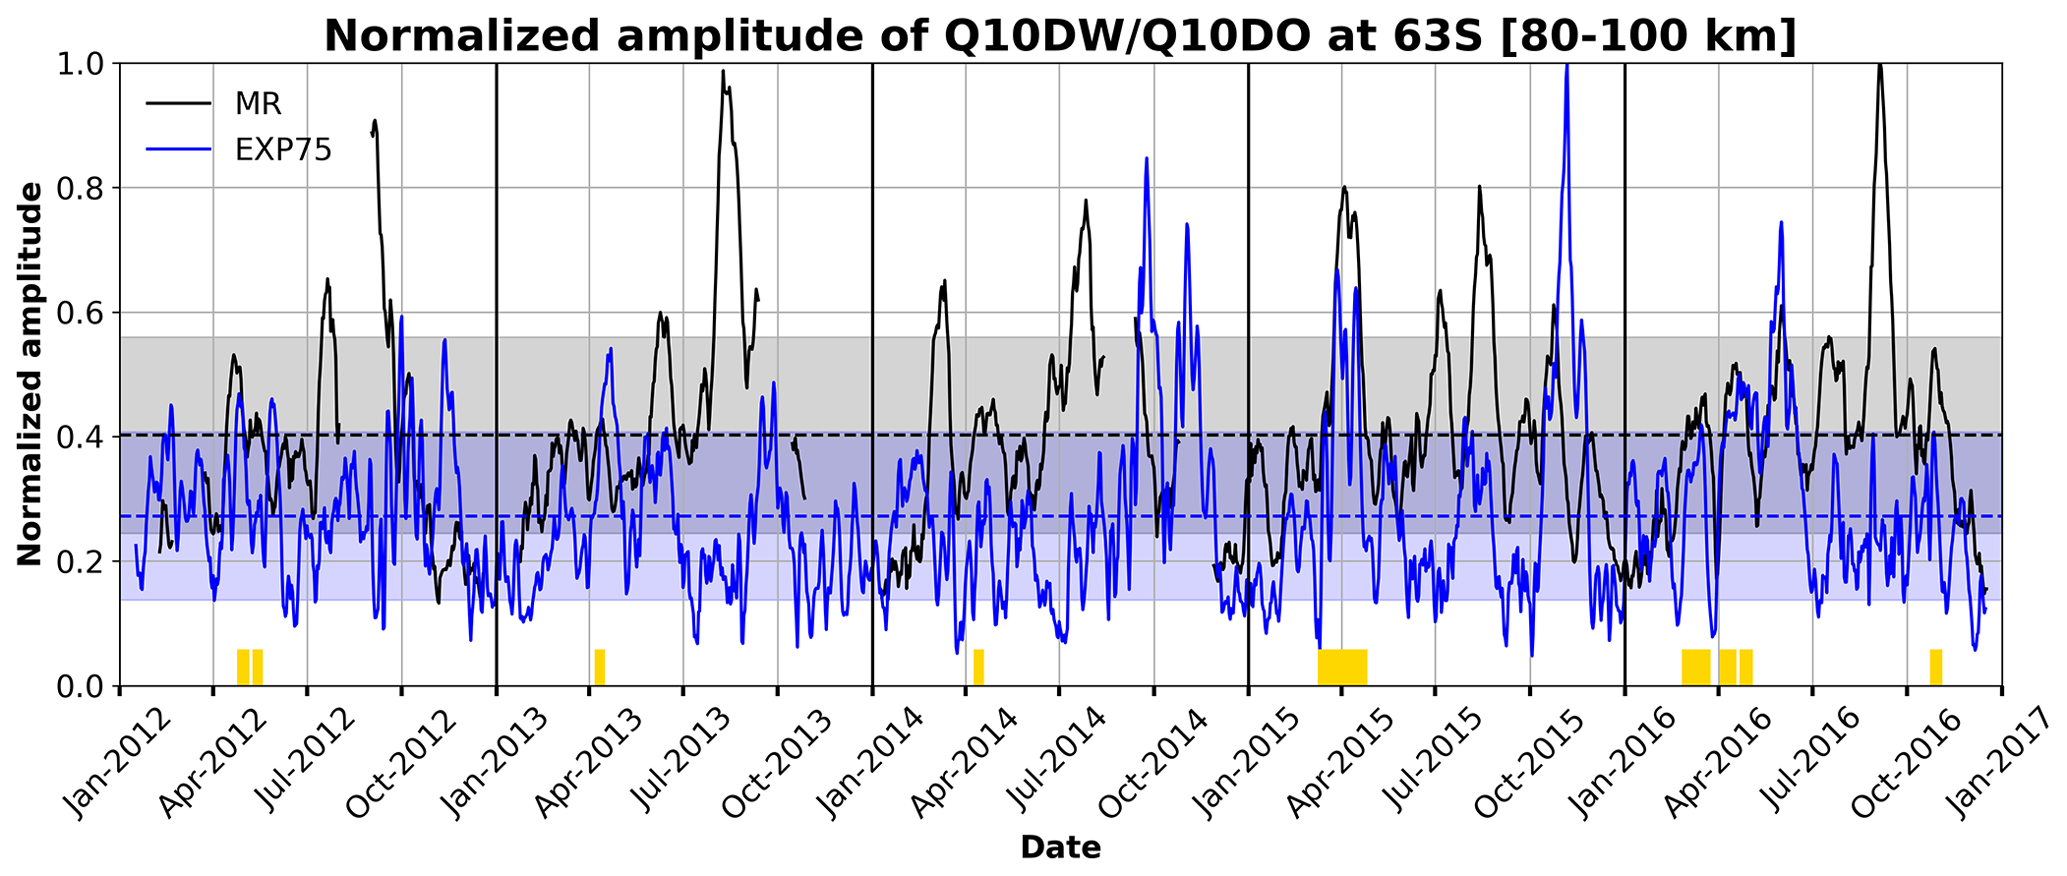
Figure 3Time series of normalized amplitudes of Q10DWs and Q10DOs from the observations (black line) and EXP75 simulation (blue line). The dashed lines and shaded areas represent the mean and standard deviation of the normalized amplitude of Q10DWs and Q10DOs from the observations (black) and EXP75 (blue). Yellow boxes on the x axis indicate the dates when the normalized amplitudes from both MRs and EXP75 can be considered to be caused by normal-mode Q10DWs.
Figure 3 shows time series of the normalized amplitudes of Q10DWs and Q10DOs obtained from the MR observations (black) and EXP75 simulation (blue). Normalization is carried out by averaging the amplitudes in the altitude range between 80 and 100 km and dividing the 5-year averaged values by the respective maximum values in the same altitude range. We select the dates when (i) the amplitudes obtained from both MRs and EXP75 exceed their respective 5-year mean values, (ii) their correlation is relatively large (> 0.6), and (iii) hemispheric symmetry occurs in the MLS results. The correlation coefficients are computed for sliding 7 d windows with a 1 d time step. The dates when the three criteria are satisfied are represented by yellow boxes on the x axis in Fig. 3. The total number of dates when the Q10DW was substantially active in both observations and the model (EXP75) is 46. Using EXP75 results on the selected dates, amplification mechanisms of the observed Q10DW will be discussed.
3.2 Amplification mechanisms of the Q10DW
The amplitude of upward-propagating PWs grows with height when vertical propagation is allowed, but it can decrease with height in the evanescent region where the square of the refractive index (n2) becomes negative. Regions of negative n2 are often accompanied by regions of negative latitudinal gradient of zonal-mean potential vorticity (), where is the zonal-mean quasi-geostrophic potential vorticity (QGPV), the overbar denotes zonal averaging, ϕ is the latitude, and the subscript ϕ denotes a partial derivative in the latitudinal direction. In regions of negative , barotropic and/or baroclinic instabilities can occur (Matsuno, 1970), and it is known that PWs can be amplified extracting energy from the mean flow while they pass through the regions of instability (Meyer and Forbes, 1997; Cohen et al., 2013). If PWs somehow reach their critical lines within a region of instability, it is possible for these PWs to tunnel through the critical lines (Rhodes et al., 2021). In cases where the evanescent region is thin enough, and the PWs can reach their critical lines, it is also possible for over-reflection to take place, resulting in amplified PWs and propagation of the amplified PWs out of the region of over-reflection (Lindzen et al., 1980; Rhodes et al., 2021).
Another possible way of modulating PWs is excitation by nonconservative GWD (Song et al., 2020). Nonconservative GWD forcing (NCGWD; Z′) can generate PWs, as is clearly seen in the QGPV perturbation equation given in the form of wave action conservation (Eq. 1) when diabatic forcing is ignored in Z′ (see Andrews et al., 1987, and Palmer, 1982, for details):
where a is the Earth's mean radius; ρ0 is the reference density given as an exponentially decreasing function of log-pressure height z; the prime denotes the perturbation from the respective zonal mean; A, defined below using , is the wave-activity density in the spherical QG system; is the perturbation of the modified QGPV, modified to consider the planetary vorticity advection by the isallobaric meridional wind in spherical geometry (Matsuno, 1970; Palmer, 1982); Z′ is the curl of the horizontal GWD perturbation; and ∇⋅F is the divergence of Eliassen–Palm (EP) flux (F). Flux F is considered to be the wave-activity flux given by F=cgA in the QG framework, where cg is the group velocity in the latitude–height domain.
In Eq. (1), wave-activity density A and the modified QGPV perturbation are given in spherical geometry (Palmer, 1982) as the following equations:
where u and v are zonal and meridional wind components, respectively; λ is the longitude; f is the Coriolis parameter; and θ is the potential temperature. The subscripts λ and z mean the partial derivatives in longitude and vertical direction, respectively.
To understand the amplification of PWs around the regions of instability, the regions of barotropic and baroclinic instability are determined by the negative sign of (Andrews et al., 1987) given by
where Ω is the Earth's rotation rate and N is the buoyancy frequency. The negative sign of is a necessary condition of barotropic and baroclinic instabilities. The second and third terms with a negative sign on the right-hand side of Eq. (4) represent the meridional and vertical curvature of the zonal-mean zonal wind, respectively. If the second or third term is dominant, can become negative, and instabilities can take place.
The square of the refractive index n2 is used to analyze the propagation characteristics of PWs and depends on the mean QGPV gradient:
where c is the zonal phase speed of a single PW (i.e., ; s is the zonal wavenumber, and τ is the wave period), and the constant scale height H is set to 7 km. Propagation of PWs is possible in regions of positive n2. On the other hand, PWs can be reflected or be evanescent in regions where n2<0 (Matsuno, 1970).
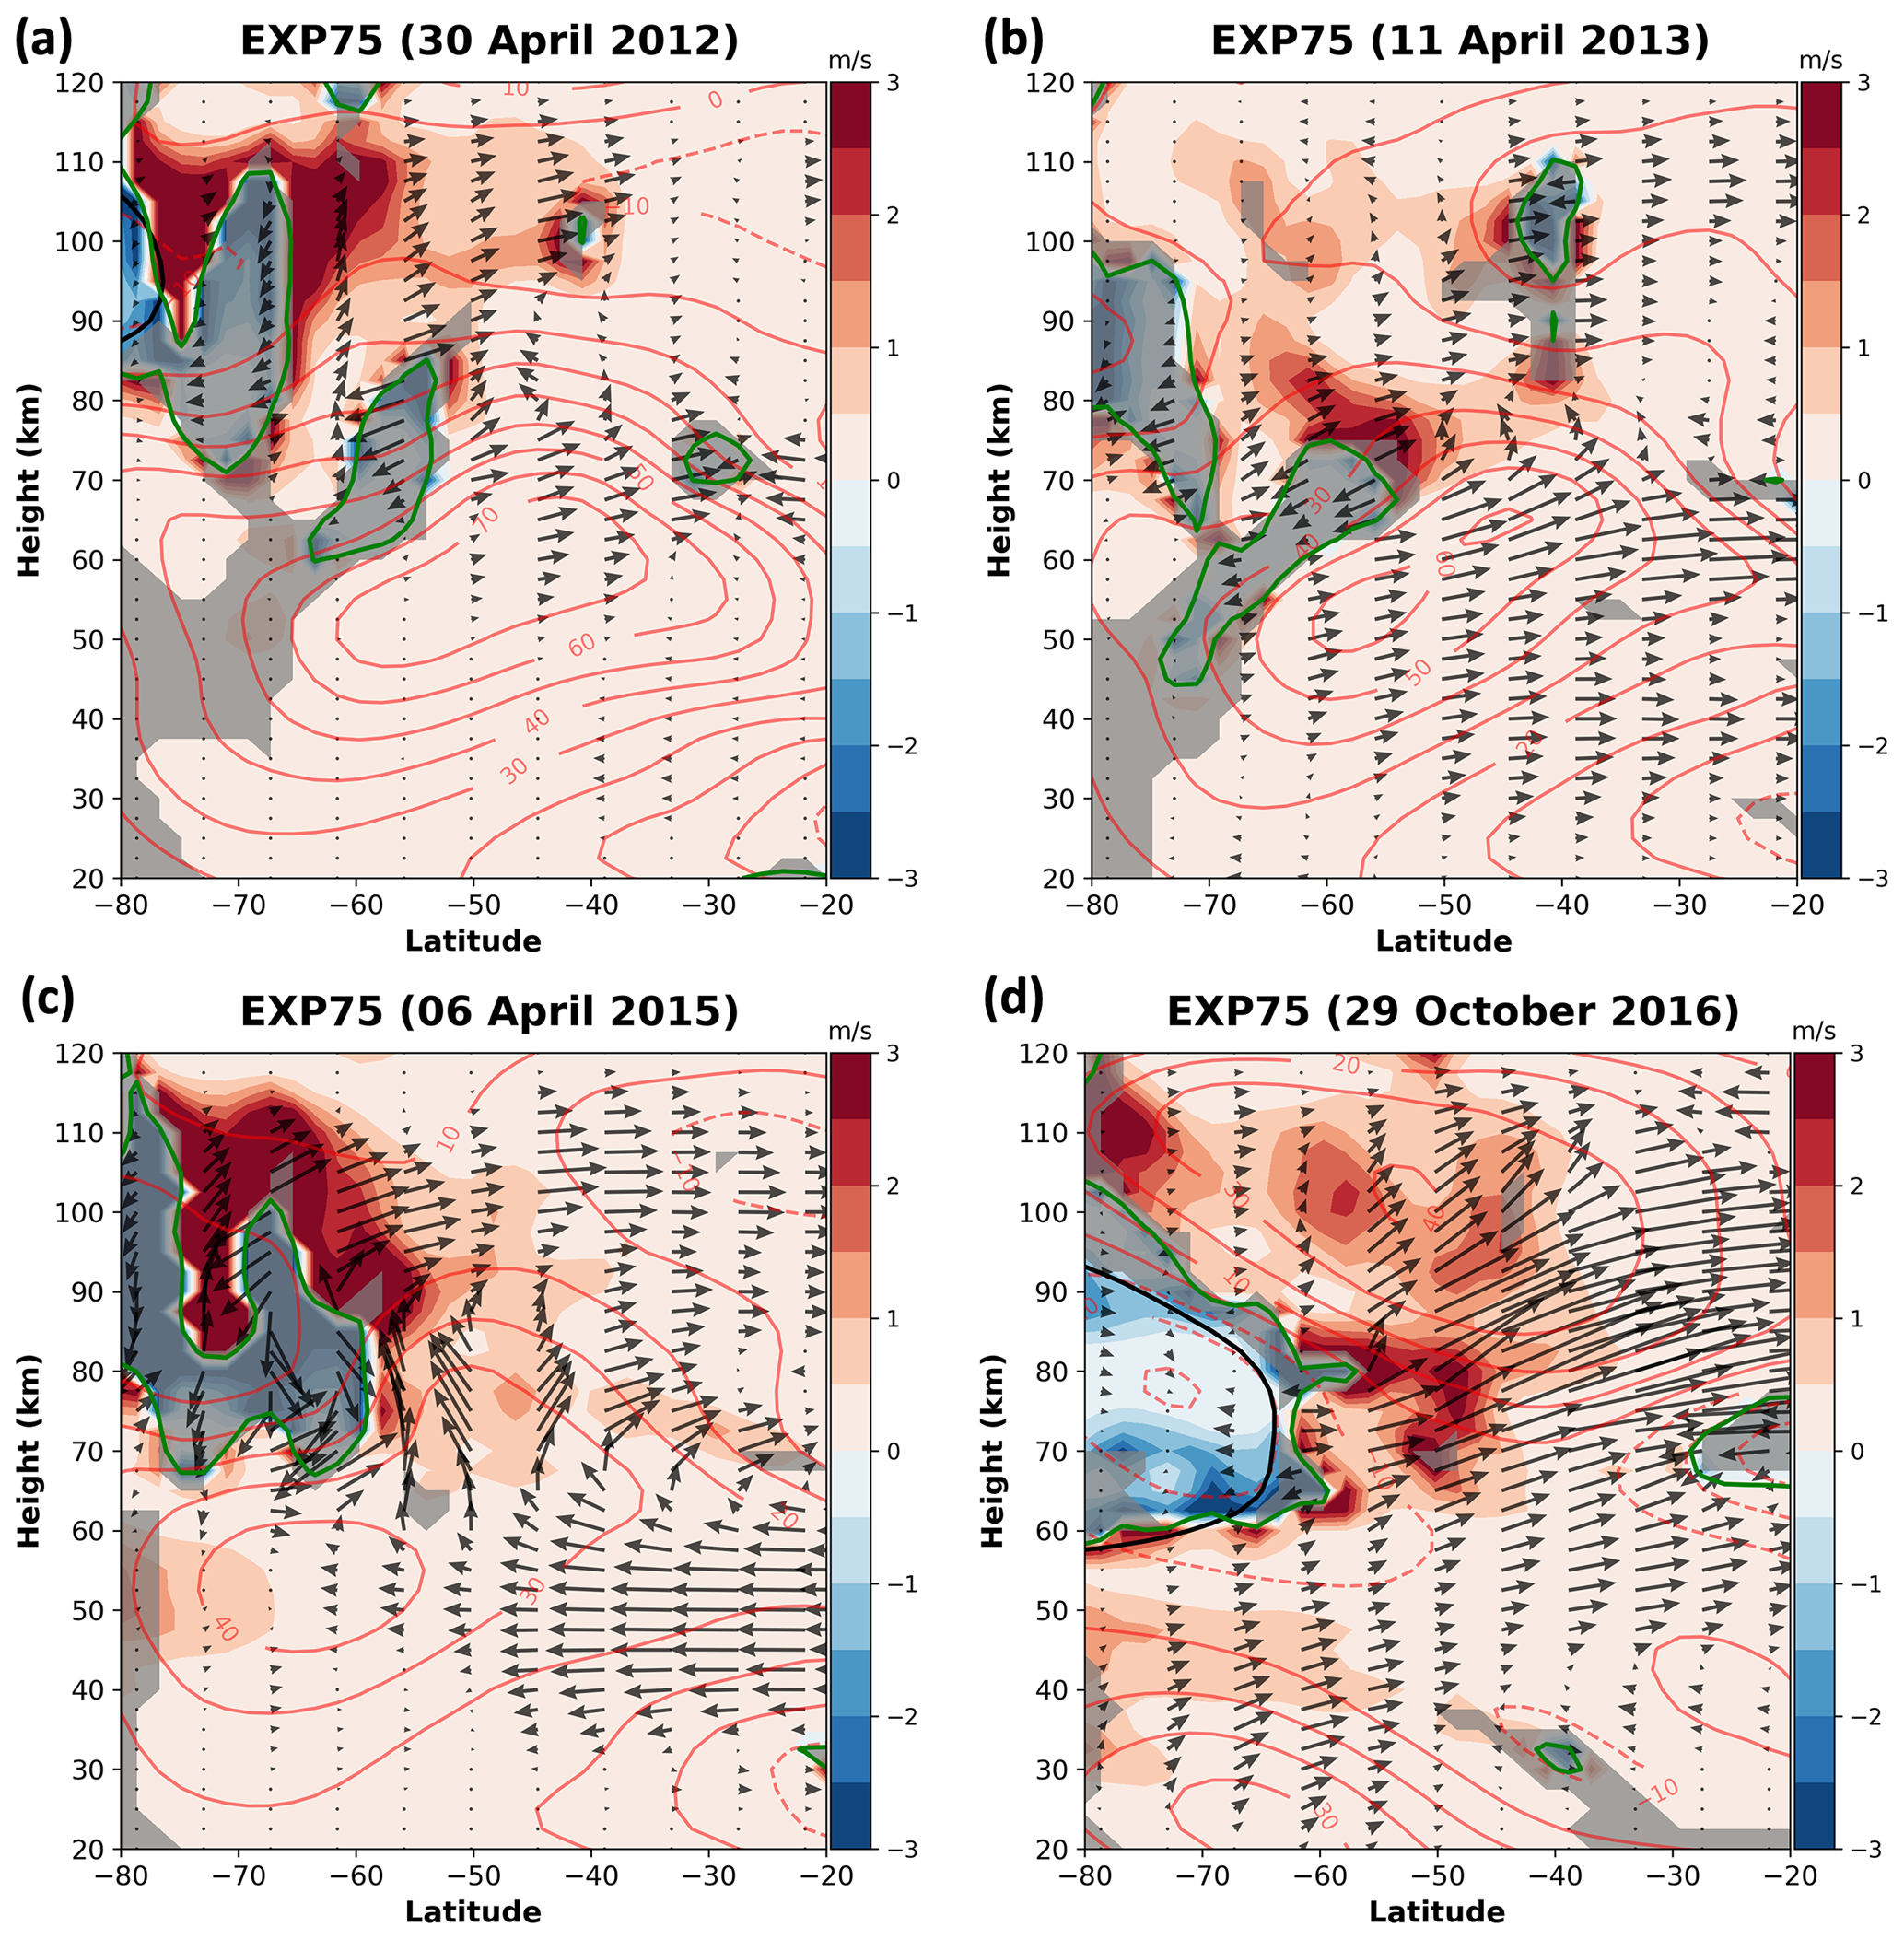
Figure 4EP flux parallel to local group velocity [] and normalized wave activity density (A(ρ0acos ϕ)−1 given in units of m s−1) for the Q10DWs in the EXP75 on (a) 30 April 2012, (b) 11 April 2013, (c) 6 April 2015, and (d) 29 October 2016. The activity density A is shaded in blue or red depending on its sign. The boundaries of the regions of instability (; green lines), the negative n2 regions (grey shading), and the red contours for zonal-mean zonal wind are plotted over each panel. For eastward (westward) zonal-mean zonal wind, contours are plotted in solid (dashed) lines, and the contour interval is 10 m s−1.
In order to analyze wave propagation and wave activity for the selected dates for Q10DWs (or Q10DOs) found in MRs and model simulations, we use the EP flux as a diagnostic tool, derived from the transformed Eulerian mean framework for a spherical QG system (Palmer, 1982; Andrews et al., 1987). In spherical geometry, the meridional [F(ϕ)] and vertical [F(z)] components of the EP flux ] are given by
Figure 4 shows the EP flux F and wave activity density normalized using ρ0acos ϕ for Q10DWs in the EXP75. The propagation inhibition region (n2<0) and the contours of the zonal-mean zonal wind are plotted over the panels. Thick green and black lines indicate the regions of and of critical lines for Q10DWs, respectively. The critical lines are plotted by computing the zonal phase speed (c) of the Q10DW: , where s=1 and τ=10 d. The wave-activity density is shaded in blue or red depending on its sign [sgn(A)]. For the EP flux vector, (, rather than F itself, (=cgA) is plotted such that the EP flux can always be parallel to the local group velocity of Q10DWs regardless of the regions of instability where and thus A<0. To better illustrate the EP flux in the atmosphere where its density decreases exponentially with height, the meridional and vertical components of EP flux are scaled by (Edmon et al., 1980; Gan et al., 2018), where ps and p are surface and atmospheric pressure, respectively.
For Fig. 4, we selected the four dates of (a) 30 April 2012, (b) 11 April 2013, (c) 6 April 2015, and (d) 29 October 2016 when the three criteria mentioned in Fig. 3 are satisfied (see yellow boxes in Fig. 3). That is, the amplitudes obtained from both MRs and EXP75 exceed their respective 5-year mean values, the correlation coefficient is larger than 0.6, and hemispheric symmetry is found in the MLS results. The 30 April 2012 case (Fig. 4a) shows that the stratospheric jet is located around 40–60° S (55 km) in the latitude–height domain and that there is a predominant branch of upward and equatorward Q10DW EP flux vectors across the center of the stratospheric jet. In the high-latitude mesosphere, there are two regions where both large-scale instability ( and evanescence (n2<0) take place, and they are located at 55–65° S (60–85 km) and 65–80° S (70–110 km), respectively. Along the boundaries of the instability (green lines), large positive or negative Q10DW activities are found. Divergent EP flux vectors in the meridional direction are clearly seen around the region of instability located at 53° S (65–75 km), which implies excitation of Q10DWs in association with the instability. In the region of MR observations (60–65° S; 85–100 km), substantially amplified Q10DW activity appears, and the equatorward Q10DW EP flux towards the MR sites is found over the amplified Q10DW activity.
Figure 4b demonstrates the case of 11 April 2013. One major branch of Q10DW EP flux vectors (Fig. 4b) originates from the stratospheric jet located at 55–60° S (45–60 km). On the southern and upper side of the stratospheric jet, the region of instability and evanescence extends from 45 to 70 km in height at latitudes of 50–75° S. Above the region of instability, a distinct region of strong wave activity is found around 50–65° S (65–90 km), and this region partially overlaps with the MR observation region. Around this region, the Q10DW EP flux is directed downward and poleward inside of the region of instability (within the green line; Fig. 4b). The Q10DW EP flux is directed upward and equatorward outside and above the region of instability. This diverging pattern of EP flux around the region of instability also shows the possibility of Q10DW excitation in association with the instability.
For the 6 April 2015 case (Fig. 4c), the structure of wave-activity density and regions of instability is similar to the 30 April 2012 case (Fig. 4a). The regions of instability and evanescence occur around 60–80° S (70–100 km). Along the boundaries of the instability, there are strong positive and negative wave-activity densities, and this region of strong wave activities includes the MR observation region. Again, divergence of the Q10DW fluxes appears in the upper part of the region of instability around 60–70° S (80–100 km). The Q10DW propagates upward and equatorward outside the region of instability and downward inside the region of instability, as in the other dates shown in Fig. 4a and b. Unlike the other events, propagation of the Q10DW is poleward in the stratosphere (30–60 km altitude). This result is consistent with Qin et al. (2022). They reported that the meridional component of EP flux extends from the NH stratosphere across the Equator to the SH stratosphere during the westerly phase of QBO in the middle stratosphere and during the westerly phase of the semi-annual oscillation in the upper stratosphere.
In the 29 October 2016 case (Fig. 4d), the center of the stratospheric jet is located around 60–70° S (20–30 km). Above the stratospheric jet, the eastward wind turns westward around an altitude of 60 km. Within the region of westward wind, regions of instability and evanescence are found. In addition, critical lines exist inside the region of instability. The over-reflection or transmission process can take place near the critical lines, as we mentioned. Notably, the significantly large positive and negative wave-activity density regions are found around 45–70° S (60–90 km) near the boundaries of the instability, and these regions partially overlap with the MR observation region. This result suggests that the observed amplification of the Q10DW may be attributed to the over-reflection process. The EP flux of the Q10DW predominantly propagates upward and equatorward away from the strong region of wave-activity around 60° S (60–70 km), with weak poleward propagation of the Q10DW towards the region of instability across the critical lines.
For all cases shown in Fig. 4, the results indicate that a distinct region of strong wave-activity density is located within the area observed by the MRs (around 60–70° S and 80–100 km in height), which is associated with the region of large-scale instability. Considering that wave-activity density A is directly proportional to and inversely proportional to , it can be assumed that the small contributes to the large magnitude of A near the region of instability. However, we confirm that the large is located around the region of instability, leading to overall large wave-activity density (not shown). In addition, the group velocity of the wave is given as . For the selected cases (Fig. 4), the EP flux F in the MR observation region is relatively small, while the magnitude of A is comparatively large. This suggests a small group velocity in this region. These results agree with the research of Thorncroft et al. (1993), which states that during the amplification of baroclinic waves, the group velocity tends to be small.
As previously mentioned, Song et al. (2020) proposed that the NCGWD can generate PWs. In addition, Forbes and Zhang (2015) suggested that the dissipation of gravity waves filtered by the Q10DW wind field can generate a secondary Q10DW by momentum deposition. In this regard, both parameterized GWs and resolved GWs (s≥20) could also play a role in generating the Q10DW. To verify the contribution of the NCGWD, we analyze the linearized disturbance QGPV equation (Andrews et al., 1987) for the four cases shown in Fig. 4. Our analysis shows that the contribution of both the NCGWD and resolved GW for the Q10DW is negligible in the MLT region (see Fig. S3 in the Supplement).
These results indicate that the large amplitudes of the Q10DW observed in the SH high-latitude region by the Davis and KSS MRs can originate from the high-latitude stratosphere–mesosphere region, where barotropic and/or baroclinic instability or over-reflection near the critical layer occurs.
3.3 Comparison of Q10DO between SD-WACCM simulations
This section compares the Q10DOs around the regions of mesospheric instability in the two SD-WACCM simulations (EXP75 and EXP60) for February and November. February and November were chosen because the amplitudes of modeled Q10DOs are substantial. The magnitude of Q10DO in the EXP75 is generally smaller than that in the EXP60, which is more comparable to the MR and MLS observations in which both Q10DWs and Q10DOs are weak (see Figs. S1 and S2 in the Supplement). Note that more realistic meteorological fields are nudged throughout the mesosphere in the EXP75. In this section, comparison between EXP75 and EXP60 for February and November is carried out to reveal the mechanisms behind weak Q10DOs in the EXP75.
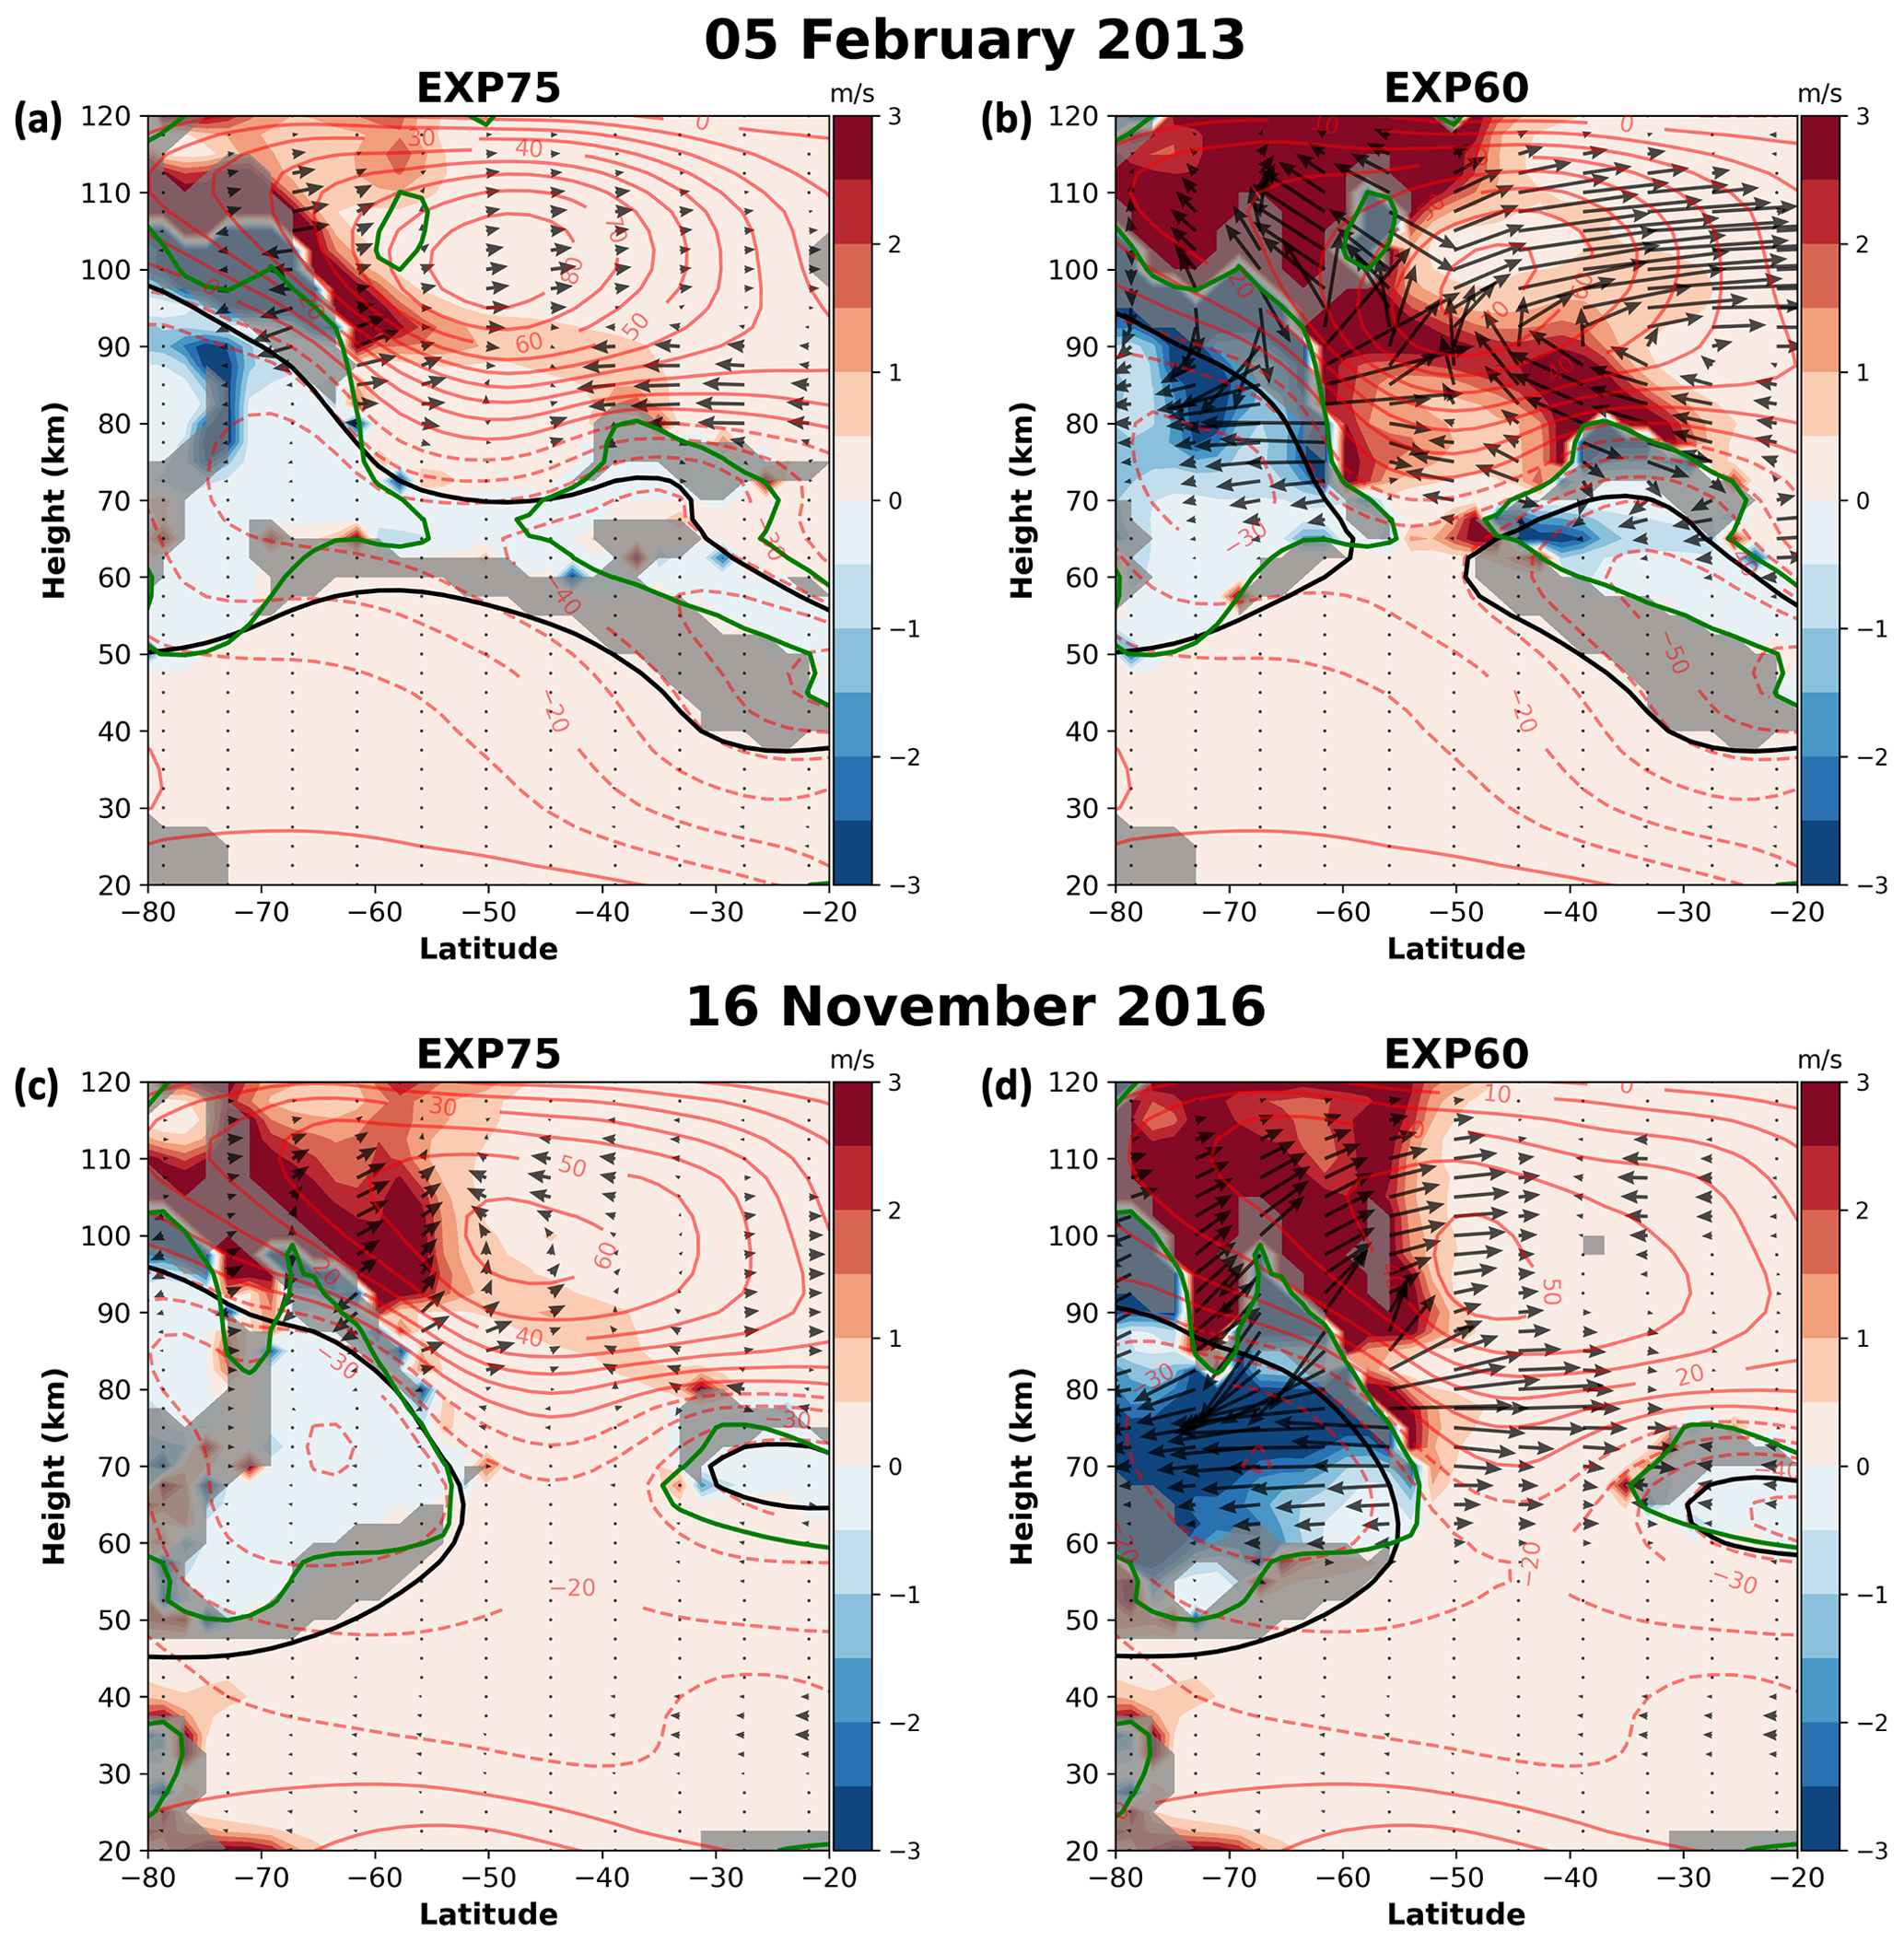
Figure 5Same as Fig. 4 but for (a, b) 5 February 2013 and (c, d) 15 November 2016. Panels (a) and (c) represent the results from EXP75, while (b) and (d) are from EXP60.
Figure 5 demonstrates the properties of the Q10DO and background atmospheric conditions (as shown in Fig. 4) for 5 February 2013 and 16 November 2016 when Q10DO activity was found to be large in both simulations. The left and right panels of Fig. 5 are the results from the EXP75 and EXP60, respectively. In Fig. 5, it is clear that the strong wave-activity density for the Q10DO arises in polar regions above the altitude of 70 km in the EXP60, and the magnitude of the EP fluxes in the EXP60 is much larger than that in EXP75. In addition, on 5 February 2013 in the EXP60 (Fig. 5b), a region of substantially strong wave-activity density is located in the mid-latitude mesospheric region as well. Around the regions of strong wave-activity in the polar upper mesosphere, it is seen that the EP fluxes of Q10DWs are divergent. In addition, the distinct wave-activity density of Q10DO regions in the EXP60 occurs along the regions of instability and critical lines around 50–70° S (70–110 km) and 20–40° S (65–80 km). On the other hand, the wave-activity density of Q10DO in the EXP75 (Fig. 5a and c) is located at relatively higher altitudes (80–100 km), and the strength of Q10DO EP flux and wave-activity density is weaker than in EXP60. Moreover, the negative EP flux divergence (EPFD) is much larger in the EXP60 than in the EXP75 above the altitude of 80 km (not shown).
Our analysis reveals larger wave-activity density and EP fluxes in the EXP60 along the region of large-scale instability in the polar upper mesosphere compared to in the EXP75. This indicates that the stronger large-scale instability in the EXP60 can amplify Q10DO activities, which is consistent with the analysis result that barotropic and baroclinic instabilities can be major sources of the amplification of traveling PWs (Harvey et al., 2019).
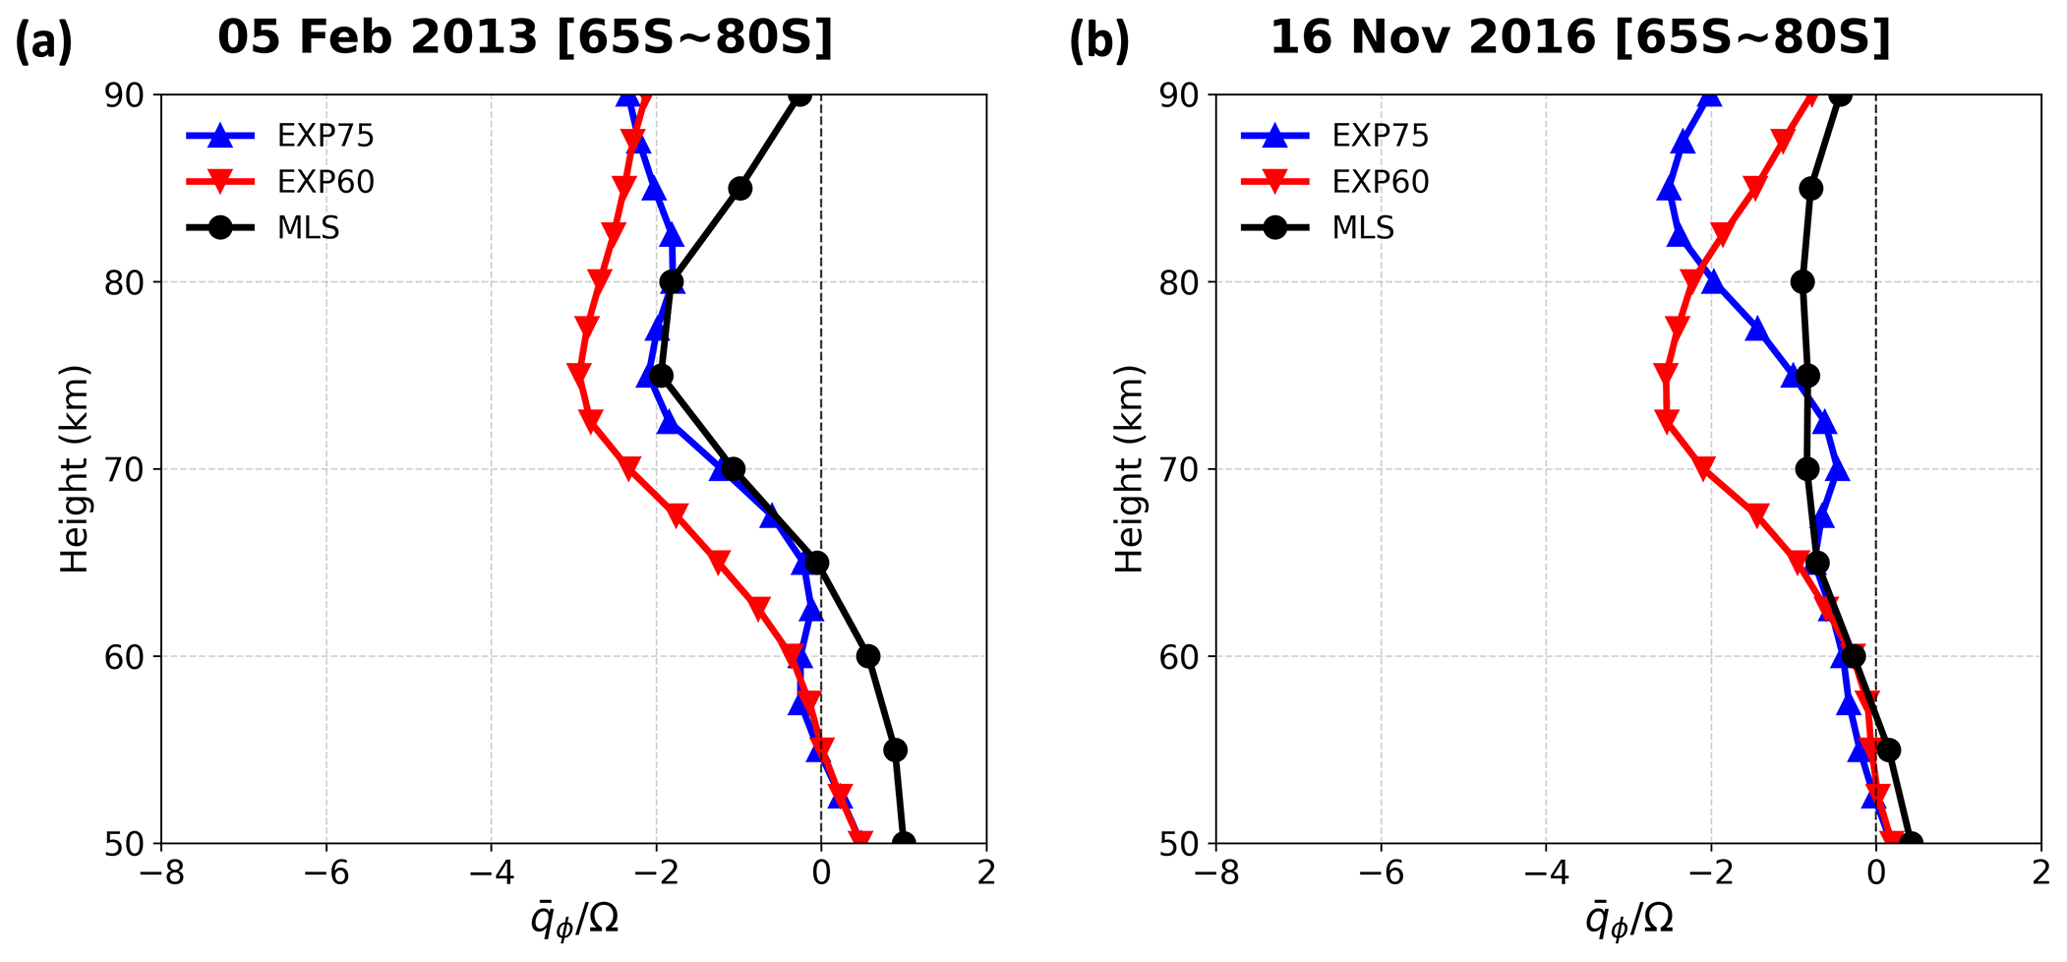
Figure 6 (normalized with Ω), averaged over 65–85° S for (a) 5 February 2013 and (b) 16 November 2016 from the EXP75 (blue), EXP60 (red), and MLS (black).
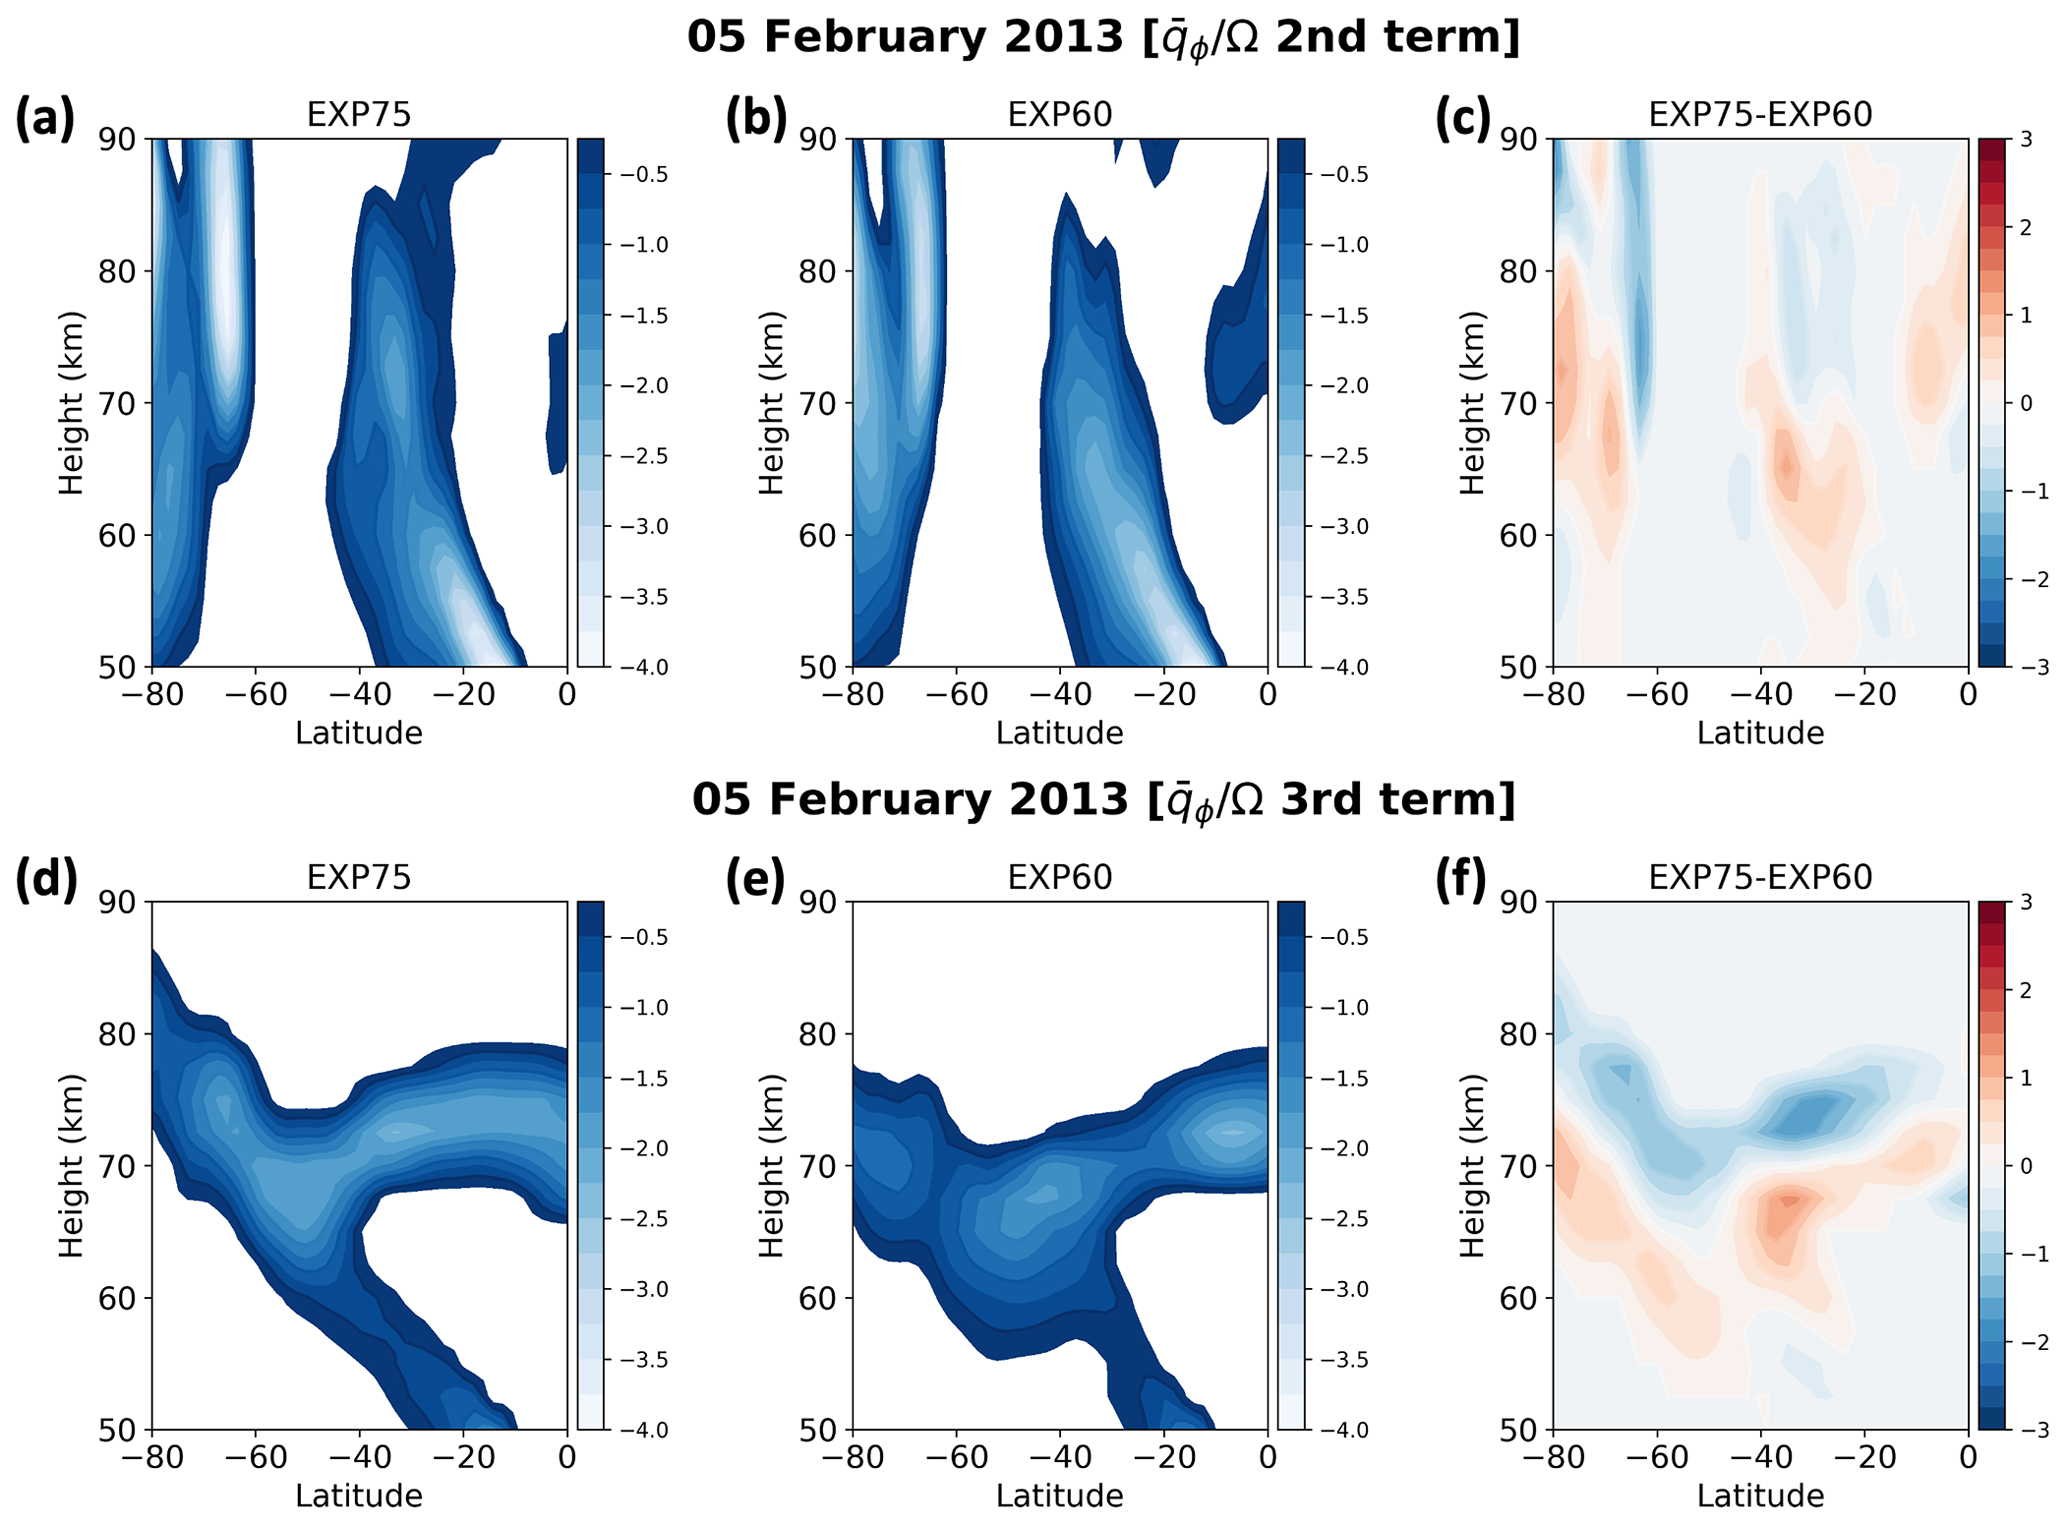
Figure 7Contributions of (a–c) the meridional variation in the zonally averaged mean flow and (d–f) its vertical variation to the instability condition (negative ) shown in Eq. (2) for 5 February 2013. Panels in each column present the results from (a, d) the EXP75, (b, e) the EXP60, and (c, f) the difference between EXP75 and EXP60. Only negative values are plotted, except for panels (c) and (f).
Figure 6 shows the (normalized with Ω) for 5 February 2013 and 16 November 2016 from the EXP75 (blue), EXP60 (red), and MLS (black). Normalization makes dimensionless. The from MLS is derived in the quasi-geostrophic framework (Andrews et al., 1987) and is included as a reference for validation. The is averaged between the latitudes of 65–80° S where wave-activity density is strong and large negative is found (Fig. 5). It is seen that the vertical profiles of from the EXP75 and MLS have somewhat small negative values, and they are generally similar below the altitude of 75 km, although the difference gradually increase above the altitude of 75 km. On the other hand, large discrepancies are shown between EXP75 and EXP60 in the altitudes between 60–80 km. In the EXP60, has much larger negative values, which suggest a relatively stronger barotropic or baroclinic instability and amplification of the Q10DO in the middle–upper mesosphere in association with the stronger instability.
The negative can be induced by latitudinal and vertical curvatures of zonal-mean zonal wind that correspond to the second and third terms (with negative signs) on the right side of Eq. (4), respectively. Figure 7 shows the second (top panels) and third (bottom panels) terms for 5 February 2013. The differences shown in Fig. 7c and f indicate that the larger negative is located at lower altitudes in the EXP60 than in the EXP75, inducing the larger instability at 65–75 km in height around 70–80° S in the EXP60, which is consistent with Fig. 6. Note that the positive differences seen at about 65–75 km in the high-latitude regions in Fig. 7c and f mean a larger negative in the EXP60. Also, it is clear that both vertical and horizontal shear contribute to the stronger barotropic and/or baroclinic instability in the EXP60 in the middle–upper mesosphere, as shown in Fig. 7a–b and d–e. This analysis demonstrates that the mesospheric dynamics specified by the MERRA-2 data up to the altitude of 75 km reduce large-scale instability in the middle–upper mesosphere in the EXP75. This is consistent with Sassi et al. (2021), who proposed that the absence of specification of middle atmosphere dynamics induces instability in the summer mesospheric westward jet, leading to large traveling PWs.
The wind structure in the MLT region is mainly driven by momentum deposition from PWs and GWs. Harvey et al. (2019) reported that GWs can change the vertical shears significantly, leading to enhanced instability and larger traveling PWs in the mesospheric region, based on the satellite observations and SD-WACCM simulations. GW forcing is one of the main factors in maintaining the necessary conditions of barotropic and/or baroclinic instability in the modeled mesosphere (Sato et al., 2018). Therefore, in order to better understand the mechanisms underlying the discrepancies in zonal wind fields and the resulting instability in the model, it is important to examine the contribution of resolved wave forcing (EPFD) and GWD forcing on the zonal wind structure in the mesosphere.
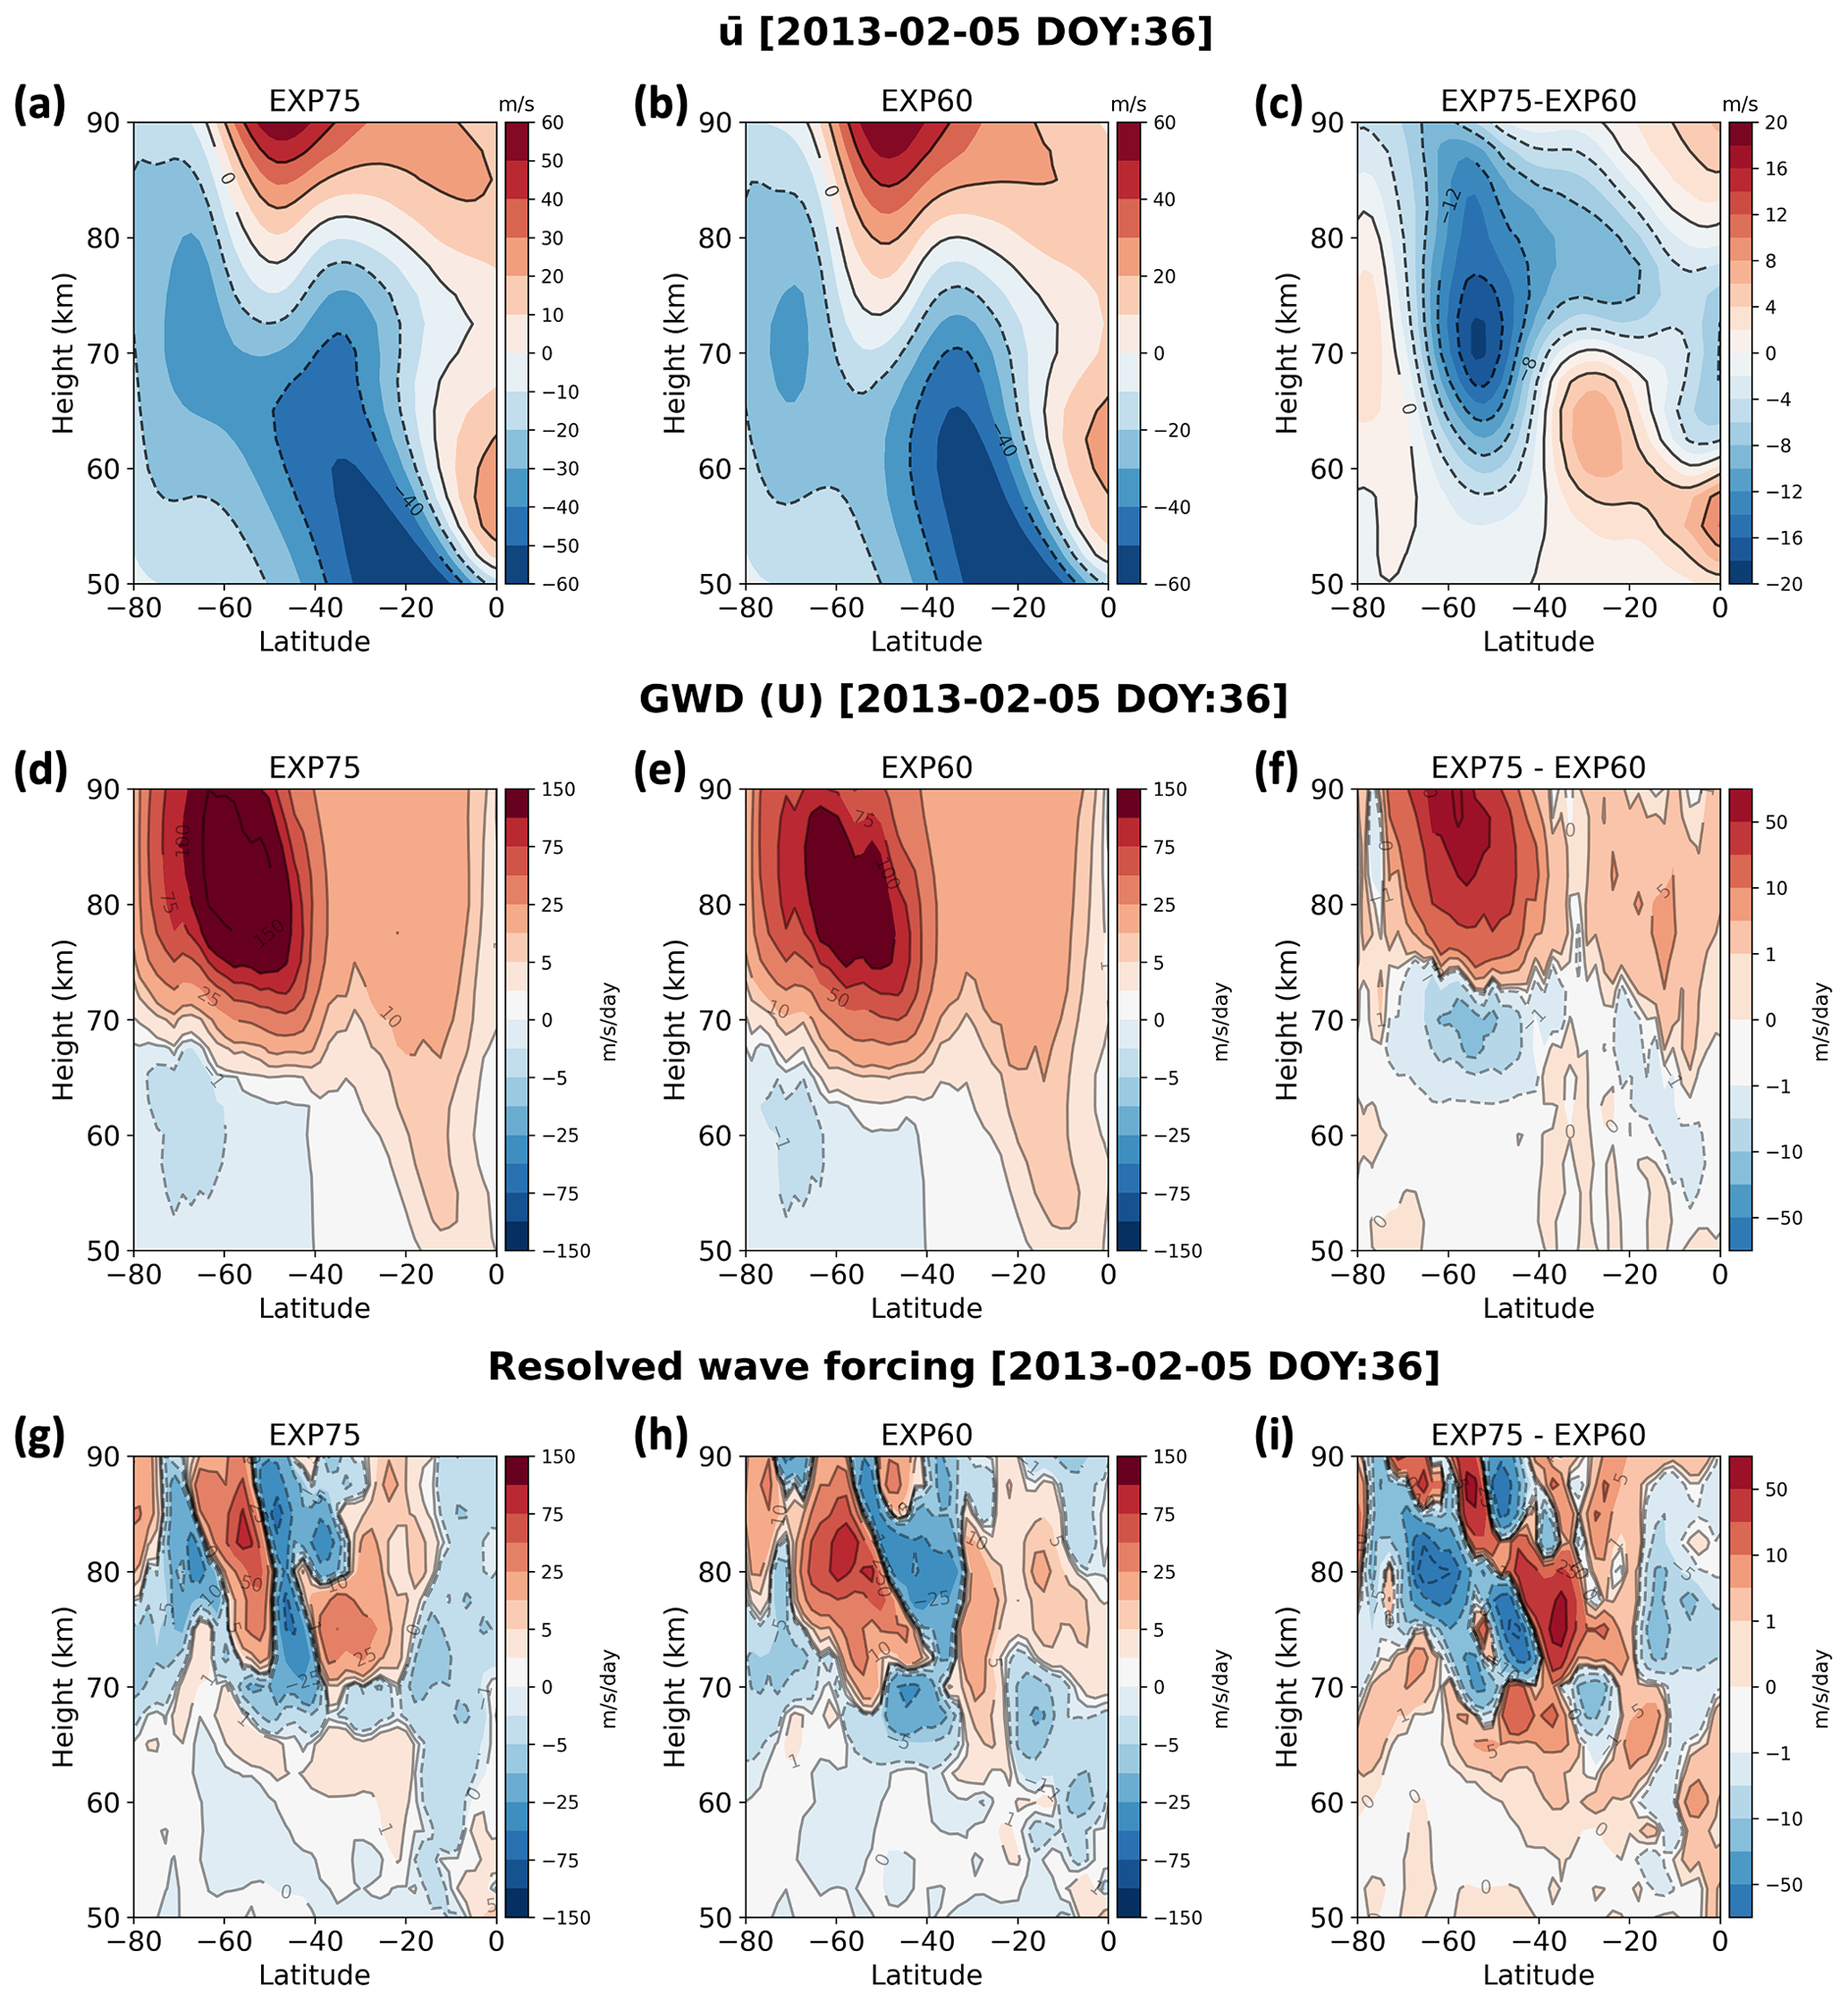
Figure 8Latitude–height distributions of (a–c) zonal-mean zonal wind, (d–f) the zonal component of GWD, and (g–i) resolved wave forcing (EP flux divergence) on 5 February 2013 in the (a, d, g) EXP75, (b, e, h) and the EXP60 and (c, f, i) the difference between EXP75 and EXP60 (EXP75–EXP60).
Figure 8 shows the latitude–height distributions of zonal-mean zonal wind, the zonal component of GWD, and resolved wave forcing (EPFD) on 5 February 2013 for the EXP75, the EXP60, and the difference between EXP75 and EXP60 (EXP75–EXP60). The zonal-mean zonal wind, zonal component of GWD, and resolved wave forcing (EPFD) are calculated using a 21 d averaging (central date ±10 d). For GWD, the orographic and non-orographic values are added. In Fig. 8a–b, zero-wind lines are located around 80 km in height in the SH mid-latitude region, indicating the reversal of the zonal-mean zonal wind due to eastward momentum forcing from the GWs and resolved waves. It is clear that the zero-wind line in the EXP60 is located about 5 km lower compared to the EXP75, which means that eastward GWD and eastward EPFD in the EXP60 can be larger below the altitude of ∼ 80 km than in the EXP75. Indeed, the difference field between EXP75 and EXP60 for GWD (Fig. 8f) shows that the eastward GWD in the EXP60 is larger around 60° S (70 km) than that in EXP75, as indicated by the negative difference field in those regions. In addition, the resolved wave forcing (EP flux divergence) is more eastward above the altitude of 70 km in the mid- to high-latitude regions in the EXP60 than in the EXP75. This result indicates that eastward resolved wave forcing also contributes more in the middle–upper mesosphere in the EXP60, resulting in zonal-mean zonal wind reversal (westward to eastward wind) at a lower altitude in the EXP60, as shown around 60° S in Fig. 8b.
As mentioned before, amplification or modulation of westward-propagating PWs with zonal wavenumber 1 and a quasi-10 d period due to NCGWD and resolved GW is negligible (Fig. S3 in Supplement), indicating that amplification of the Q10DW or Q10DO is mainly related to the baroclinic/barotropic instability. The stronger instability in the EXP60 around the altitude of 70 km indicates that WACCM simulates a large meridional and vertical variation in zonal winds compared to the observations in the middle–upper mesosphere, which is likely due to the stronger eastward GWD and eastward EPFD forcing near 70 km in altitude in the EXP60, as shown in Fig. 8. Cohen et al. (2013) reported that parameterized GWs can generate instability that can generate resolved waves, of which forcing (i.e., EPFD) can compensate for GWD. Our results show that the increased eastward GWD at 70 km in altitude generates instability and leads to more Q10DOs. The EPFD in the EXP60 gives a more eastward forcing above 70 km, enhancing the wind reversal in the mid-to-high latitudes. However, comparison of Fig. 8f and i indicates that the structures of GWD and EPFD are roughly 90–180° shifted in the vertical direction, approximately consistent with the compensation between GWD and EPFD. Raising the nudging altitude of MERRA-2 reanalysis data to 75 km (from 60 km) reduces the instability in the middle–upper mesosphere, leading to decreased Q10DO activity in the EXP75. Therefore, we suggest that strong eastward GWD in the middle–upper mesosphere in summer needs to be alleviated, which can generate more instability in the SH high-latitude mesosphere region that can lead to differences between observations and simulations.
In this paper, the seasonal variation and amplification mechanism of the Q10DW during 2012–2016 in the SH high-latitude regions are investigated using two MRs located in Antarctica and SD-WACCM simulations. Using the phase difference in meridional winds measured by two MRs, we extract the westward-propagating Q10DW with zonal wavenumber 1. The seasonal variation in the observed Q10DW shows that the amplitude is strong during equinoxes, which is consistent with previous studies. In addition, our study shows that the Q10DWs from the MLS appear to be consistently overestimated compared to those from MRs. These discrepancies can be due to both errors in estimating winds from the MLS and uncertainties in results obtained from the two MR stations alone. Further investigation is required to more reliably estimate the amplitude and phase of Q10DWs from observations.
In order to elucidate the amplification mechanism of the Q10DW observed by MRs during equinoxes, two SD-WACCM experiments were carried out using the MERRA-2 reanalysis data from the surface to ∼ 60 km (EXP60) and ∼ 75 km (EXP75). The temporal variation in the averaged amplitude of the Q10DW in the EXP75 during 2012–2016 is in better agreement with the MR observations. Meanwhile, the amplitude of the Q10DW in the EXP60 is excessively large compared to the observations. Based on analysis of the meridional gradient of the QGPV and wave-activity density, the Q10DW observed in the SH high-latitude region by the MRs originated in situ around the high-latitude stratosphere–mesosphere region, where large-scale instability or over-reflection near the critical lines occurs. The unrealistically large magnitude of the Q10DO (quasi-10 d-like oscillations without satisfying hemispheric symmetry, unlike the Q10DW) is simulated in the EXP60 during February and November. In order to understand mechanisms of the large amplitude of the Q10DO in the EXP60 during the SH summer, we compare the meridional gradient of QGPV from the EXP75 and the EXP60. The results show that specified dynamics with MERRA-2 reanalysis data mitigate the meridional and vertical variation in zonal winds in the polar middle–upper mesosphere in the EXP75, resulting in a reduction in the large-scale instability. On the other hand, the large amplitude of the Q10DO in the EXP60 is attributed to the large-scale instability related to the GWD and partially to the EPFD in the polar middle–upper mesosphere.
The polar mesospheric GWD can lead to strong large-scale instability in the SH high-latitude mesosphere and unrealistically large amplitude of the Q10DO in summer. The present study of the amplification mechanism of the Q10DW during equinoxes and the unrealistic Q10DO amplitude in summer shows the potential importance of large-scale instability for numerical models, which can be to a substantial degree caused by parameterized GWD during summer in the polar mesosphere. In this paper, we focus on the Q10DW related to the large-scale instability and polar mesospheric GWD, but other normal modes of PW will be considered for future studies.
The results of SD-WACCM may depend on the extra damping above the middle mesosphere in the GEOS-6 model (Fujiwara et al., 2017) used to produce the MERRA-2 data. The damping may have harmful effects on the results for the upper mesosphere in the EXP75, where the dynamics is still specified above the middle mesosphere using MERRA-2, but comparison with observations shows that the zonal asymmetric structure of mesospheric temperature in the EXP75 is reasonable for the time periods of our interest (Fig. S5). However, the activity and variability in mesospheric PWs in MERRA-2 and SD-WACCM need to be further examined for longer time periods and evaluated against other observations to support the reliability of results obtained in this study, which should be a topic of continuing research.
The source code of the Community Earth System Model 2 (CESM2) developed at the National Center for Atmospheric Research (NCAR) is available at https://www.cesm.ucar.edu/models/cesm2 (NCAR, 2024; ; Danabasoglu et al., 2020). The atmospheric forcing data for specified dynamics are available from the NCAR Research Data Archive (RDA) at https://doi.org/10.5065/XVAQ-2X07 (NCAR/UCAR, 2018).
The Davis station meteor radar data are available from the Australian Antarctic Data Centre at https://data.aad.gov.au/metadata/Davis_33MHz_Meteor_Radar (Murphy, 2017). The King Sejong Station meteor radar data are available from the Korea Polar Data Center (KPDC) at https://kpdc.kopri.re.kr (last access: March 2024; 2012: https://doi.org/10.22663/KOPRI-KPDC-00000305.2, KOPRI, 2013; 2013: https://doi.org/10.22663/KOPRI-KPDC-00001678.5, KOPRI, 2021; 2014: https://doi.org/10.22663/KOPRI-KPDC-00000502.2, KOPRI, 2014; 2015: https://doi.org/10.22663/KOPRI-KPDC-00000567.2, KOPRI, 2015; 2016: https://doi.org/10.22663/KOPRI-KPDC-00000823.4, KOPRI, 2017). The GPH data from the MLS on board NASA's EOS Aura satellite are available from the Goddard Earth Science Data and Information Services Center (GES DISC) at https://doi.org/10.5067/Aura/MLS/DATA2520 (Schwartz et al., 2020).
The supplement related to this article is available online at: https://doi.org/10.5194/acp-24-3559-2024-supplement.
WL and ISS designed the study together with YHK and wrote the manuscript. WL performed the analysis of the observational (MR and satellite) data in collaboration with ISS. ISS designed the SD-WACCM experiments. WL and ISS carried out the SD-WACCM experiments. ISS and BGS aided in interpreting the analysis of the action conservation equation for Rossby waves. All authors discussed the results and contributed to the final paper.
The contact author has declared that none of the authors has any competing interests.
Publisher’s note: Copernicus Publications remains neutral with regard to jurisdictional claims made in the text, published maps, institutional affiliations, or any other geographical representation in this paper. While Copernicus Publications makes every effort to include appropriate place names, the final responsibility lies with the authors.
This research has been supported by the Korea Astronomy and Space Science Institute under R&D programs (grant nos. 2023-1-850-07 and 2024-1-850-02) supervised by the Ministry of Science and ICT. The second author (In-Sun Song) has been supported by the Yonsei University Research Funds of 2022 and 2023 (grant nos. 2022-22-0098 and 2023-22-0095).
This paper was edited by John Plane and reviewed by Yosuke Yamazaki and one anonymous referee.
Andrews, D. G., Holton, J. R., and Leovy, C. B.: Middle Atmosphere Dynamics, Elsevier, New York, USA, 489 pp., ISBN 0-12-058576-6, 1987.
Beres, J. H., Garcia, R. R., Boville, B. A., and Sassi, F.: Implementation of a gravity wave source spectrum parameterization dependent on the properties of convection in the Whole Atmosphere Community Climate Model (WACCM), J. Geophys. Res.-Atmos., 110, D10108, https://doi.org/10.1029/2004jd005504, 2005.
Brakebusch, M., Randall, C. E., Kinnison, D. E., Tilmes, S., Santee, M. L., and Manney, G. L.: Evaluation of Whole Atmosphere Community Climate Model simulations of ozone during Arctic winter 2004–2005, J. Geophys. Res.-Atmos., 118, 2673–2688, https://doi.org/10.1002/jgrd.50226, 2013.
Chandran, A., Garcia, R. R., Collins, R. L., and Chang, L. C.: Secondary planetary waves in the middle and upper atmosphere following the stratospheric sudden warming event of January 2012, Geophys. Res. Lett., 40, 1861–1867, https://doi.org/10.1002/grl.50373, 2013.
Charron, M. and Manzini, E.: Gravity waves from fronts: Parameterization and middle atmosphere response in a general circulation model, J. Atmos. Sci., 59, 923–941, https://doi.org/10.1175/1520-0469(2002)059<0923:gwffpa>2.0.co;2, 2002.
Cohen, N. Y., Gerber, E. P. and Bühler, O.: Compensation between resolved and unresolved wave driving in the stratosphere: Implications for downward control, J. Atmos. Sci., 70, 3780–3798, https://doi.org/10.1175/jas-d-12-0346.1, 2013.
Danabasoglu, G., Lamarque, J. -F., Bacmeister, J., Bailey, D. A., DuVivier, A. K., Edwards, J., Emmons, L. K., Fasullo, J., Garcia, R., Gettelman, A., Hannay, C., Holland, M. M., Large, W. G., Lauritzen, P. H., Lawrence, D. M., Lenaerts, J. T. M., Lindsay, K., Lipscomb, W. H., Mills, M. J., Neale, R., Oleson, K. W., Otto-Bliesner, B., Phillips, A. S., Sacks, W., Tilmes, S., Kampenhout, L., Vertenstein, M., Bertini, A., Dennis, J., Deser, C., Fischer, C., Fox-Kemper, B., Kay, J. E., Kinnison, D., Kushner, P. J., Larson, V. E., Long, M. C., Mickelson, S., Moore, J. K., Nienhouse, E., Polvani, L., Rasch, P. J., and Strand, W. G.: The Community Earth System Model Version 2 (CESM2), J. Adv. Model. Earth. Sy., 12, e2019MS001916, https://doi.org/10.1029/2019ms001916, 2020.
Day, K. A. and Mitchell, N. J.: The 5-day wave in the Arctic and Antarctic mesosphere and lower thermosphere, J. Geophys. Res.-Atmos., 115, 1984–2012, https://doi.org/10.1029/2009jd012545, 2010.
Edmon, H. J., Hoskins, B. J., and McIntyre, M. E.: Eliassen-Palm cross sections for the troposphere, J. Atmos. Sci., 37, 2600–2616, https://doi.org/10.1175/1520-0469(1980)037<2600:epcsft>2.0.co;2, 1980.
Egito, F., Takahashi, H., and Miyoshi, Y.: Effects of the planetary waves on the MLT airglow, Ann. Geophys., 35, 1023–1032, https://doi.org/10.5194/angeo-35-1023-2017, 2017.
Eswaraiah, S., Kim, Y. H., Hong, J., Kim, J.-H., Ratnam, M. V., Chandran, A., Rao, S. V. B., and Riggin, D.: Mesospheric signatures observed during 2010 minor stratospheric warming at King Sejong Station (62° S, 59° W), J. Atmos. Sol-Terr. Phy., 140, 55–64, https://doi.org/10.1016/j.jastp.2016.02.007, 2016.
Eswaraiah, S., Ratnam, M. V., Kim, Y. H., Kumar, K. N., Chalapathi, G. V., Ramanajaneyulu, L., Lee, J., Prasanth, P. V., Thyagarajan, K., and Rao, S. V. B.: Advanced meteor radar observations of mesospheric dynamics during 2017 minor SSW over the tropical region, Adv. Space. Res., 64, 1940–1947, https://doi.org/10.1016/j.asr.2019.05.039, 2019.
Eyring, V., Lamarque, J. F., Hess, P., Arfeuille, F., Bowman, K., Chipperfiel, M. P., Duncan, B., Fiore, A., Gettelman, A., Giorgetta, M. A., Granier, C., Hegglin, M., Kinnison, D., Kunze, M., Langematz, U., Luo, B., Martin, R., Matthes, K., Newman, P. A., Peter, T., Robock, A., Ryerson, T., Saiz-Lopez, A., Salawitch, R., Schultz, M., Shepherd, T. G., Shindell, D., Staehelin, J., Tegtmeier, S., Thomason, L., Tilmes, S., Vernier, J. P., Waugh, D., and Young, P. Y.: Overview of IGAC/SPARC Chemistry-Climate Model Initiative (CCMI) community simulations in support of upcoming ozone and climate assessments, SPARC newsletter, 40, 48–66, https://oceanrep.geomar.de/id/eprint/20227 (last access: March 2024), 2013.
Forbes, J. M. and Zhang, X.: Quasi-10-day wave in the atmosphere, J. Geophys. Res.-Atmos., 120, 11079–11089, https://doi.org/10.1002/2015jd023327, 2015.
Forbes, J. M. and Zhang, X.: The quasi-6 day wave and its interactions with solar tides, J. Geophys. Res.-Space, 122, 4764–4776, https://doi.org/10.1002/2017ja023954, 2017.
Forbes, J. M., Hagan, M. E., Miyahara, S., Vial, F., Manson, A. H., Meek, C. E., and Portnyagin, Y. I.: Quasi 16-day oscillation in the mesosphere and lower thermosphere, J. Geophys. Res.-Atmos., 100, 9149–9163, https://doi.org/10.1029/94jd02157, 1995.
Forbes, J. M., Zhang, X., Heelis, R., Stoneback, R., Englert, C. R., Harlander, J. M., Harding, B. J., Marr, K. D., Makela, J. J., and Immel, T. J.: Atmosphere-Ionosphere (A-I) coupling as viewed by ICON: Day-to-day variability due to planetary wave (PW)-tide interactions, J. Geophys. Res.-Space, 126, e2020JA028927, https://doi.org/10.1029/2020ja028927, 2021.
Fujiwara, M., Wright, J. S., Manney, G. L., Gray, L. J., Anstey, J., Birner, T., Davis, S., Gerber, E. P., Harvey, V. L., Hegglin, M. I., Homeyer, C. R., Knox, J. A., Krüger, K., Lambert, A., Long, C. S., Martineau, P., Molod, A., Monge-Sanz, B. M., Santee, M. L., Tegtmeier, S., Chabrillat, S., Tan, D. G. H., Jackson, D. R., Polavarapu, S., Compo, G. P., Dragani, R., Ebisuzaki, W., Harada, Y., Kobayashi, C., McCarty, W., Onogi, K., Pawson, S., Simmons, A., Wargan, K., Whitaker, J. S., and Zou, C.-Z.: Introduction to the SPARC Reanalysis Intercomparison Project (S-RIP) and overview of the reanalysis systems, Atmos. Chem. Phys., 17, 1417–1452, https://doi.org/10.5194/acp-17-1417-2017, 2017.
Gan, Q., Oberheide, J., and Pedatella, N. M.: Sources, sinks, and propagation characteristics of the quasi 6-day wave and its impact on the residual mean circulation, J. Geophys. Res.-Atmos., 123, 9152–9170, https://doi.org/10.1029/2018jd028553, 2018.
Gelaro, R., McCarty, W., Suárez, M. J., Todling, R., Molod, A., Takacs, L., Randles, C. A., Darmenov, A., Bosilovich, M. G., Reichle, R., Wargan, K., Coy, L., Cullather, R., Draper, C., Akella, S., Buchard, V., Conaty, A., Silva, A. M. da, Gu, W., Kim, G.-K., Koster, R., Lucchesi, R., Merkova, D., Nielsen, J. E., Partyka, G., Pawson, S., Putman, W., Rienecker, M., Schubert, S. D., Sienkiewicz, M., and Zhao, B.: The Modern-Era Retrospective Analysis for Research and Applications, Version 2 (MERRA-2), J. Climate, 30, 5419–5454, https://doi.org/10.1175/jcli-d-16-0758.1, 2017.
Goncharenko, L. P., Harvey, V. L., Greer, K. R., Zhang, S.-R., and Coster, A. J.: Longitudinally dependent low-latitude ionospheric disturbances linked to the Antarctic sudden stratospheric warming of September 2019, J. Geophys. Res.-Space, 125, e2020JA028199, https://doi.org/10.1029/2020ja028199, 2020.
Harvey, V. L., Randall, C. E., Becker, E., Smith, A. K., Bardeen, C. G., France, J. A., and Goncharenko, L. P.: Evaluation of the mesospheric polar vortices in WACCM, J. Geophys. Res.-Atmos., 124, 10626–10645, https://doi.org/10.1029/2019jd030727, 2019.
Harvey, V. L., Knox, J. A., France, J. A., Fujiwara, M., Gray, L., Hirooka, T., Hitchcock, P., Hitchman, M., Kawatani, Y., Manney, G. L., McCormack, J., Orsolini, Y., Sakazaki, T., and Tomikawa, Y.: Chapter 11: Upper Stratosphere and Lower Mesosphere, SPARC Reanalysis Intercomparison Project (S-RIP) Final Report, edited by: Fujiwara, M., Manney, G. L., Gray, L. J., and Wright, J. S., SPARC Report No. 10, WCRP-6/2021, SPARC, DLR-IPA, Oberpfaffenhofen, Germany, https://doi.org/10.17874/800dee57d13, 2021.
He, M., Chau, J. L., Stober, G., Li, G., Ning, B., and Hoffmann, P.: Relations between semidiurnal tidal variants through diagnosing the zonal wavenumber using a phase differencing technique based on two ground-based detectors, J. Geophys. Res.-Atmos., 123, 4015–4026, https://doi.org/10.1002/2018jd028400, 2018.
He, M., Chau, J. L., Forbes, J. M., Thorsen, D., Li, G., Siddiqui, T. A., Yamazaki, Y., and Hocking, W. K.: Quasi-10-day wave and semidiurnal tide nonlinear interactions during the Southern Hemispheric SSW 2019 observed in the Northern Hemispheric mesosphere, Geophys. Res. Lett., 47, e2020GL091453, https://doi.org/10.1029/2020gl091453, 2020a.
He, M., Yamazaki, Y., Hoffmann, P., Hall, C. M., Tsutsumi, M., Li, G., and Chau, J. L.: Zonal wave number diagnosis of Rossby wave-like oscillations using paired ground-based radars, J. Geophys. Res.-Atmos., 125, e2019JD031599, https://doi.org/10.1029/2019jd031599, 2020b.
Hirooka, T.: Normal mode Rossby waves as revealed by UARS/ISAMS observations, J. Atmos. Sci., 57, 1277–1285, https://doi.org/10.1175/1520-0469(2000)057<1277:NMRWAR>2.0.CO;2, 2000.
Holdsworth, D. A., Murphy, D. J., Reid, I. M., and Morris, R. J.: Antarctic meteor observations using the Davis MST and meteor radars, Adv. Space Res., 42, 143–154, https://doi.org/10.1016/j.asr.2007.02.037, 2008.
Huang, C., Zhang, S., Chen, G., Zhang, S., and Huang, K.: Planetary wave characteristics in the lower atmosphere over Xianghe (117.00° E, 39.77° N), China, revealed by the Beijing MST radar and MERRA data, J. Geophys. Res.-Atmos., 122, 9745–9758, https://doi.org/10.1002/2017jd027029, 2017.
Huang, C., Li, W., Zhang, S., Chen, G., Huang, K., and Gong, Y.: Investigation of dominant traveling 10-day wave components using long-term MERRA-2 database, Earth Planets Space, 73, 85, https://doi.org/10.1186/s40623-021-01410-7, 2021.
Huang, Y.-Y., Cui, J., Li, H.-J., and Li, C.-Y.: Inter-annual variations of 6.5-day planetary waves and their relations with QBO, Earth Planet. Phys., 6, 135–148, https://doi.org/10.26464/epp2022005, 2022.
Jablonowski, C. and Williamson, D. L.: Numerical techniques for global atmospheric models, Lect. Notes Comput. Sci. Eng., 80, 381–493, https://doi.org/10.1007/978-3-642-11640-7_13, 2011.
Korea Polar Research Institute (KOPRI): Neutral wind and temperature from Meteor Radar, King Sejong Station, Antarctica, 2012, Korea Polar Data Center (KPDC) [data set], https://doi.org/10.22663/KOPRI-KPDC-00000305.2, 2013.
Korea Polar Research Institute (KOPRI): Neutral wind and temperature from Meteor Radar, King Sejong Station, Antarctica, 2014, Korea Polar Data Center (KPDC) [data set], https://doi.org/10.22663/KOPRI-KPDC-00000502.2, 2014.
Korea Polar Research Institute (KOPRI): Neutral wind and temperature from Meteor Radar, King Sejong Station, Antarctica, 2015, Korea Polar Data Center (KPDC) [data set], https://doi.org/10.22663/KOPRI-KPDC-00000567.2, 2015.
Korea Polar Research Institute (KOPRI): Neutral wind and temperature from Meteor Radar, King Sejong Station, Antarctica, 2016, Korea Polar Data Center (KPDC) [data set], https://doi.org/10.22663/KOPRI-KPDC-00000823.4, 2017.
Korea Polar Research Institute (KOPRI): Neutral wind and temperature from Meteor Radar, King Sejong Station, Antarctica, 2013, Korea Polar Data Center (KPDC) [data set], https://doi.org/10.22663/KOPRI-KPDC-00001678.5, 2021.
Lee, W., Kim, Y. H., Lee, C., and Wu, Q.: First comparison of mesospheric winds measured with a Fabry-Perot interferometer and meteor radar at the King Sejong Station (62.2° S, 58.8° W), J. Astron. Space Sci., 35, 235–242, https://doi.org/10.5140/JASS.2018.35.4.235, 2018.
Lee, W., Song, I., Kim, J., Kim, Y. H., Jeong, S., Eswaraiah, S., and Murphy, D. J.: The observation and SD-WACCM simulation of planetary wave activity in the middle atmosphere during the 2019 Southern Hemispheric sudden stratospheric warming, J. Geophys. Res.-Space, 126, e2020JA029094, https://doi.org/10.1029/2020ja029094, 2021.
Lee, W., Lee, C., Kim, J., Kam, H., and Kim, Y. H.: A modeling analysis of the apparent linear relation between mesospheric temperatures and meteor height distributions measured by a meteor radar, J. Geophys. Res.-Space, 127, e2021JA029812, https://doi.org/10.1029/2021ja029812, 2022.
Li, W., Huang, C., and Zhang, S.: Global characteristics of the westward-propagating quasi-16-day wave with zonal wavenumber 1 and the connection with the 2012/2013 SSW revealed by ERA-Interim, Earth Planets Space, 73, 113, https://doi.org/10.1186/s40623-021-01431-2, 2021.
Lindzen, R. S., Farrell, B., and Tung, K.-K.: The concept of wave overreflection and its application to baroclinic instability, J. Atmos. Sci., 37, 44–63, https://doi.org/10.1175/1520-0469(1980)037<0044:tcowoa>2.0.co;2, 1980.
Liu, G., Janches, D., Lieberman, R. S., Moffat-Griffin, T., Mitchell, N. J., Kim, J., and Lee, C.: Wind variations in the mesosphere and lower thermosphere near 60° S latitude during the 2019 Antarctic sudden stratospheric warming, J. Geophys. Res.-Space, 126, e2020JA028909, https://doi.org/10.1029/2020ja028909, 2021.
Liu, G., Janches, D., Ma, J., Lieberman, R. S., Stober, G., Moffat-Griffin, T., Mitchell, N. J., Kim, J., Lee, C., and Murphy, D. J.: Mesosphere and lower thermosphere winds and tidal variations during the 2019 Antarctic sudden stratospheric warming, J. Geophys. Res.-Space, 127, e2021JA030177, https://doi.org/10.1029/2021ja030177, 2022.
Luo, J., Gong, Y., Ma, Z., Zhang, S., Zhou, Q., Huang, C., Huang, K., Yu, Y., and Li, G.: Study of the quasi 10-day waves in the MLT region during the 2018 February SSW by a meteor radar chain, J. Geophys. Res.-Space, 126, e2020JA028367, https://doi.org/10.1029/2020ja028367, 2021.
Ma, Z., Gong, Y., Zhang, S., Xiao, Q., Xue, J., Huang, C., and Huang, K.: Understanding the excitation of quasi-6-day waves in both hemispheres during the September 2019 Antarctic SSW, J. Geophys. Res.-Atmos., 127, e2021JD035984, https://doi.org/10.1029/2021jd035984, 2022.
Marsh, D. R., Mills, M. J., Kinnison, D. E., Lamarque, J.-F., Calvo, N., and Polvani, L. M.: Climate change from 1850 to 2005 simulated in CESM1(WACCM), J. Climate, 26, 130509150556003, https://doi.org/10.1175/jcli-d-12-00558.1, 2013.
Matsuno, T.: Vertical propagation of stationary planetary waves in the winter Northern Hemisphere, J. Atmos. Sci., 27, 871–883, https://doi.org/10.1175/1520-0469(1970)027<0871:vpospw>2.0.co;2, 1970.
Matthias, V. and Ern, M.: On the origin of the mesospheric quasi-stationary planetary waves in the unusual Arctic winter 2015/2016, Atmos. Chem. Phys., 18, 4803–4815, https://doi.org/10.5194/acp-18-4803-2018, 2018.
Matthias, V., Hoffmann, P., Rapp, M., and Baumgarten, G.: Composite analysis of the temporal development of waves in the polar MLT region during stratospheric warmings, J. Atmos. Sol.-Terr. Phys., 90, 86–96, https://doi.org/10.1016/j.jastp.2012.04.004, 2012.
McCormack, J. P., Harvey, V. L., Randall, C. E., Pedatella, N., Koshin, D., Sato, K., Coy, L., Watanabe, S., Sassi, F., and Holt, L. A.: Intercomparison of middle atmospheric meteorological analyses for the Northern Hemisphere winter 2009–2010, Atmos. Chem. Phys., 21, 17577–17605, https://doi.org/10.5194/acp-21-17577-2021, 2021.
McFarlane, N. A.: The effect of orographically excited gravity wave drag on the general circulation of the lower stratosphere and troposphere, J. Atmos. Sci., 44, 1775–1800, https://doi.org/10.1175/1520-0469(1987)044<1775:teooeg>2.0.co;2, 1987.
Meyer, C. K. and Forbes, J. M.: A 6.5-day westward propagating planetary wave: Origin and characteristics, J. Geophys. Res.-Atmos., 102, 26173–26178, https://doi.org/10.1029/97jd01464, 1997.
Mitra, G., Guharay, A., Batista, P. P., and Buriti, R. A.: Impact of the September 2019 minor sudden stratospheric warming on the low-latitude middle atmospheric planetary wave dynamics, J. Geophys. Res.-Atmos., 127, e2021JD035538, https://doi.org/10.1029/2021jd035538, 2022.
Murphy, D. J.: Davis 33MHz Meteor Detection Radar Winds, Ver. 1, Australian Antarctic Data Centre [data set], https://data.aad.gov.au/metadata/Davis_33MHz_Meteor_Radar (last access: March 2024), 2017.
NCAR: Community Earth System Model 2, National Center for Atmospheric Research [code], https://www.cesm.ucar.edu/models/cesm2 (last access: March 2024), 2024.
NCAR/UCAR: MERRA2 Global Atmosphere Forcing Data, Atmospheric Chemistry Observations & Modeling/National Center for Atmospheric Research/University Corporation for Atmospheric Research, and Climate and Global Dynamics Division/National Center for Atmospheric Research/University Corporation for Atmospheric Research, Research Data Archive at the National Center for Atmospheric Research, Computational and Information Systems Laboratory [data set], https://doi.org/10.5065/XVAQ-2X07, 2018.
Palmer, T. N.: Properties of the Eliassen-Palm flux for planetary scale motions, J. Atmos. Sci., 39, 992–997, https://doi.org/10.1175/1520-0469(1982)039<0992:potepf>2.0.co;2, 1982.
Qin, Y., Gu, S., Dou, X., Gong, Y., Chen, G., Zhang, S., and Wu, Q.: Climatology of the quasi-6-day wave in the mesopause region and its modulations on total electron content during 2003–2017, J. Geophys. Res.-Space, 124, 573–583, https://doi.org/10.1029/2018ja025981, 2019.
Qin, Y., Gu, S., Teng, C., Dou, X., Yu, Y., and Li, N.: Comprehensive study of the climatology of the quasi-6-day wave in the MLT region based on Aura/MLS observations and SD-WACCM-X simulations, J. Geophys. Res.-Space, 126, e2020JA028454, https://doi.org/10.1029/2020ja028454, 2021.
Qin, Y., Gu, S., Dou, X., Teng, C., Yang, Z., and Sun, R.: Southern Hemisphere response to the secondary planetary waves generated during the Arctic sudden stratospheric final warmings: Influence of the quasi-biennial oscillation, J. Geophys. Res.-Atmos., 127, e2022JD037730, https://doi.org/10.1029/2022jd037730, 2022.
Reynolds, R. W., Rayner, N. A., Smith, T. M., Stokes, D. C., and Wang, W.: An improved in situ and satellite SST analysis for climate, J. Climate, 15, 1609–1625, https://doi.org/10.1175/1520-0442(2002)015<1609:aiisas>2.0.co;2, 2002.
Rhodes, C. T., Limpasuvan, V., and Orsolini, Y. J.: Eastward-propagating planetary waves prior to the January 2009 sudden stratospheric warming, J. Geophys. Res.-Atmos., 126, e2020JD033696, https://doi.org/10.1029/2020jd033696, 2021.
Richter, J. H., Sassi, F., and Garcia, R. R.: Toward a physically based gravity wave source parameterization in a general circulation model, J. Atmos. Sci., 67, 136–156, https://doi.org/10.1175/2009jas3112.1, 2010.
Salby, M. L.: Rossby normal modes in nonuniform background configurations. Part I: Simple fields, J. Atmos. Sci., 38, 1803–1826, https://doi.org/10.1175/1520-0469(1981)038<1803:rnminb>2.0.co;2, 1981a.
Salby, M. L.: Rossby normal modes in nonuniform background configurations. Part II. Equinox and solstice conditions, J. Atmos. Sci., 38, 1827–1840, https://doi.org/10.1175/1520-0469(1981)038<1827:rnminb>2.0.co;2, 1981b.
Salby, M. L.: Survey of planetary-scale traveling waves: The state of theory and observations, Rev. Geophys., 22, 209–236, https://doi.org/10.1029/rg022i002p00209, 1984.
Sassi, F. and Liu, H.-L.: Westward traveling planetary wave events in the lower thermosphere during solar minimum conditions simulated by SD-WACCM-X, J. Atmos. Sol.-Terr. Phys., 119, 11–26, https://doi.org/10.1016/j.jastp.2014.06.009, 2014.
Sassi, F., McCormack, J. P., Tate, J. L., Kuhl, D. D., and Baker, N. L.: Assessing the impact of middle atmosphere observations on day-to-day variability in lower thermospheric winds using WACCM-X, J. Atmos. Sol.-Terr. Phys., 212, 105486, https://doi.org/10.1016/j.jastp.2020.105486, 2021.
Sato, K., Yasui, R., and Miyoshi, Y.: The momentum budget in the stratosphere, mesosphere, and lower thermosphere. Part I: Contributions of different wave types and in situ generation of Rossby waves, J. Atmos. Sci., 75, 3613–3633, https://doi.org/10.1175/jas-d-17-0336.1, 2018.
Schwartz, M., Livesey, N., and Read, W.: MLS/Aura Level 2 Temperature V005, Greenbelt, MD, USA, Goddard Earth Sciences Data and Information Services Center (GES DISC) [data set], https://doi.org/10.5067/Aura/MLS/DATA2520, 2020.
Schwartz, M. J., Lambert, A., Manney, G. L., Read, W. G., Livesey, N. J., Froidevaux, L., Ao, C. O., Bernath, P. F., Boone, C. D., Cofield, R. E., Daffer, W. H., Drouin, B. J., Fetzer, E. J., Fuller, R. A., Jarnot, R. F., Jiang, J. H., Jiang, Y. B., Knosp, B. W., Krüger, K., Li, J. -L. F., Mlynczak, M. G., Pawson, S., Russell, J. M., Santee, M. L., Snyder, W. V., Stek, P. C., Thurstans, R. P., Tompkins, A. M., Wagner, P. A., Walker, K. A., Waters, J. W., and Wu, D. L.: Validation of the Aura Microwave Limb Sounder temperature and geopotential height measurements, J. Geophys. Res.-Atmos., 113, D15S11, https://doi.org/10.1029/2007jd008783, 2008.
Song, B.-G., Chun, H.-Y., and Song, I.-S.: Role of gravity waves in a vortex-split sudden stratospheric warming in January 2009, J. Atmos. Sci., 77, 3321–3342, https://doi.org/10.1175/jas-d-20-0039.1, 2020.
Thorncroft, C. D., Hoskins, B. J., and McIntyre, M. E.: Two paradigms of baroclinic-wave life-cycle behaviour, Q. J. Roy. Meteor. Soc., 119, 17–55, https://doi.org/10.1002/qj.49711950903, 1993.
Torrence, C. and Compo, G. P.: A practical guide to wavelet analysis, B. Am. Meteorol. Soc., 79, 61–78, https://doi.org/10.1175/1520-0477(1998)079<0061:apgtwa>2.0.co;2, 1998.
Walker, S. N., Sahraoui, F., Balikhin, M. A., Belmont, G., Pinçon, J. L., Rezeau, L., Alleyne, H., Cornilleau-Wehrlin, N., and André, M.: A comparison of wave mode identification techniques, Ann. Geophys., 22, 3021–3032, https://doi.org/10.5194/angeo-22-3021-2004, 2004.
Wang, J. C., Palo, S. E., Forbes, J. M., Marino, J., Moffat-Griffin, T., and Mitchell, N. J.: Unusual Quasi 10-Day Planetary wave activity and the ionospheric response during the 2019 Southern Hemisphere sudden Stratospheric Warming, J. Geophys. Res.-Space, 126, e2021JA029286, https://doi.org/10.1029/2021ja029286, 2021.
Yamazaki, Y. and Matthias, V.: Large-amplitude quasi-10-day waves in the middle atmosphere during final warmings, J. Geophys. Res.-Atmos., 124, 9874–9892, https://doi.org/10.1029/2019jd030634, 2019.
Yin, S., Ma, Z., Gong, Y., Zhang, S., and Li, G.: Response of quasi-10-day waves in the MLT region to the sudden stratospheric warming in March 2020, Adv. Space Res., 71, 298–305, https://doi.org/10.1016/j.asr.2022.10.054, 2023.