the Creative Commons Attribution 4.0 License.
the Creative Commons Attribution 4.0 License.
 | 18 Mar 2024
Sea salt reactivity over the northwest Atlantic: an in-depth look using the airborne ACTIVATE dataset
Eva-Lou Edwards
Yonghoon Choi
Ewan C. Crosbie
Joshua P. DiGangi
Glenn S. Diskin
Claire E. Robinson
Michael A. Shook
Edward L. Winstead
Luke D. Ziemba
Chloride (Cl−) displacement from sea salt particles is an extensively studied phenomenon with implications for human health, visibility, and the global radiation budget. Past works have investigated Cl− depletion over the northwest Atlantic (NWA); however, an updated, multi-seasonal, and geographically expanded account of sea salt reactivity over the region is needed. This study uses chemically resolved mass concentrations and meteorological data from the airborne Aerosol Cloud meTeorology Interactions oVer the western ATlantic Experiment (ACTIVATE) to quantify seasonal, spatial, and meteorological trends in Cl− depletion and to explore the importance of quantifying (1) non-sea salt sources of Na+ and (2) mass concentrations of lost Cl− (instead of relative amounts displaced). Lost Cl− mass concentrations are lowest in December–February and March, moderate around Bermuda in June, and highest in May (median losses of 0.04, 0.04, 0.66, and 1.76 µg m−3, respectively), with losses in May that are high enough to potentially accelerate tropospheric oxidation rates. Inorganic acidic species can account for all Cl− depletion in December–February, March, and June near Bermuda but none of the lost Cl− in May, suggesting that organic acids may be of importance for Cl− displacement in certain months. Contributions of dust to Na+ are not important seasonally but may cause relevant overestimates of lost Cl− in smoke and dust plumes. Higher percentages of Cl− depletion often do not correspond to larger mass concentrations of lost Cl−, so it is highly recommended to quantify the latter to place depletion reactions in context with their role in atmospheric oxidation and radiative forcing.
- Article
(3294 KB) - Full-text XML
-
Supplement
(3044 KB) - BibTeX
- EndNote


Chlorine (Cl) is a common constituent of trace gases and aerosol particles found in Earth's atmosphere. Chlorine-containing species play a critical role in the global radiation budget for many reasons, including their ability to produce highly reactive Cl radicals. These radicals can perturb atmospheric chemical processes by inducing reactions that would otherwise be less likely to occur and/or accelerating the rates of certain reactions. For example, Cl radicals in the stratosphere can incite reactions that destroy ozone (O3; Molina and Rowland, 1974; Solomon et al., 2023), therefore allowing increased amounts of shortwave radiation to reach the surface and harmfully affect living beings.
Cl radicals typically react faster with volatile organic compounds (VOCs) compared with hydroxyl radicals (OH; Roberts et al., 2008; Thornton et al., 2010; Young et al., 2014), a fact which has particular importance in the troposphere. Cl radicals oxidize methane ∼ 16 times faster than OH (Faxon and Allen, 2013, and references therein), thus reducing the lifetime of this important greenhouse gas. Accelerated oxidation of methane and other VOCs can result in increased O3 production near the surface (Knipping and Dabdub, 2003; Pechtl and von Glasow, 2007; Tanaka et al., 2003), which can have deleterious effects on animals (e.g., respiratory problems, increased mortality; Lippmann, 1989; Nuvolone et al., 2018) and plants (e.g., decreased growth and photosynthesis; Wittig et al., 2009). Cl radicals may be responsible for 0.8 % of the global oxidation of methane, 14 % of ethane, 8 % for propane, and 7 % for longer-chain alkanes (Wang et al., 2021) and can play an exceptionally critical role in governing the atmospheric composition in the early morning when OH radicals are less abundant (Young et al., 2013; Riedel et al., 2014; Osthoff et al., 2008). Due to their significant impacts on radiative forcing, rates of chemical cycling, and the health of living organisms, it is critical to quantify and understand sources of atmospheric Cl radicals.
Sea salt aerosol particles are the largest reservoir of reactive atmospheric Cl. Keene et al. (1999) estimated that, at any given time, there is ∼ 22 Tg of reactive Cl in the troposphere and that 68 % of this mass is found in the particulate form, primarily sea salt. More recently, Wang et al. (2021) suggested that there is 2.44 Tg of reactive Cl in the troposphere and that 90 % of this mass is found in the particulate form as sea salt. The fact that estimates for the reactive tropospheric Cl budget have decreased by an order of magnitude over the past 2 decades motivates continued research on tropospheric halogen chemistry and its impacts. Although the Cl in sea salt will not directly photolyze to produce Cl radicals, it can be displaced by acidic species (e.g., sulfate, SO; nitrate, NO; and organic acids) and released in a reactive gaseous form (e.g., ClNO2, HCl, and Cl2) that has the potential to produce Cl radicals. This phenomenon is called chloride (Cl−) depletion and can be generalized with the following reaction:
where A is one of the acidic species mentioned above. Note that most of the generated HCl is removed by deposition, but a fraction (∼ 16 % globally; Wang et al., 2021) reacts with OH to produce Cl radicals, initiating rapid cycling between these radicals and their inorganic non-radical reservoirs. In addition to producing reactive chlorine-containing gases, Cl− depletion can alter the acidity (e.g., Keene and Savoie, 1998), hygroscopicity (e.g., Drozd et al., 2014; Ghorai et al., 2014; Randles et al., 2004), and optical properties (Finlayson-Pitts and Pitts, 2000; Tang et al., 1997) of sea salt particles. Such changes affect the partitioning of other chemicals (e.g., water vapor; ammonia, NH3; SO; and NO between the gas and particle phases (Chen et al., 2021), the rates and types of reactions occurring within sea salt particles (Chameides and Stelson, 1993), the activity of these particles as cloud condensation nuclei (e.g., Chatterjee et al., 2020), and their interactions with solar radiation, all of which can have implications for visibility, air quality, biogeochemical cycles, and Earth's radiation budget.
Many factors dictate the extent to which Cl− depletion occurs in an air mass, including meteorology (e.g., wind speed; temperature; relative humidity, RH; and available solar radiation), the size distribution and mixing state of sea salt particles, and the availability and length of exposure to surrounding acidic species (Su et al., 2022, and references therein). Regarding the latter, Cl− depletion is therefore typically observed where marine particles and acidic species are both present, such as where emissions from biomass burning (BB) advect over a marine location (Braun et al., 2017; Maudlin et al., 2015; Li et al., 2003; Yokelson et al., 2009; Akagi et al., 2013; Dang et al., 2022; Crosbie et al., 2022); in regions with active phytoplankton and marine bacteria that emit dimethyl sulfide (DMS), which can oxidize to form sulfuric acid (H2SO4; Seinfeld and Pandis, 2016; Tang et al., 2019; Yan et al., 2020); and/or in and around urban coastal environments (e.g., Kong et al., 2014; Chatterjee et al., 2020; AzadiAghdam et al., 2019; Nolte et al., 2008) where anthropogenic emissions serve as precursors for various acidic species.
For this reason, the northwest Atlantic (NWA) is an opportune region for observing and studying Cl− depletion. Cities extending along the East Coast of North America consistently emit sulfur dioxide (SO2), nitrogen oxides (NOx), and VOCs, which can oxidize to form H2SO4, nitric acid (HNO3), and organic acids, respectively, while sea salt particles are ubiquitous over the region due to wave breaking (Reid et al., 2001; Ferrare et al., 2023). Occasional long-range transport from BB in Alaska, Canada, and the western United States (US; Fehsenfeld et al., 2006; Mardi et al., 2021), agricultural fires throughout the eastern and southeastern US (Jaffe et al., 2020; McCarty et al., 2007), wintertime wood burning for residential heating (Corral et al., 2021; Sullivan et al., 2019), and seasonally varying emissions from vegetation and ocean biological activity (Savoie et al., 2002; Corral et al., 2022) can also introduce acidic species to this region.
Cl− depletion has been observed over the NWA for decades (Table 1). Previous datasets typically span 2–3 months, and most are reflective of conditions during the boreal summer, although there are a handful of studies extending outside of this period (i.e., Keene et al., 1990; Yao and Zhang, 2012; Zhao and Gao, 2008; Haskins et al., 2018). Combining results from these works to build seasonal and temporal statistics is challenged by the fact that each dataset is specific to a certain altitude (or range of altitudes), location(s), time period, sampling method, and size range of sampled particles. In addition to these logistical constraints, there is an overall shortage of Cl− depletion data for the spring, fall, and winter, which is of concern as depletion processes are sensitive to several properties that fluctuate seasonally over the NWA (e.g., temperature, solar radiation, and RH).
Most past works over the NWA report on Cl− depletion along the United States East Coast (USEC) and/or in Bermuda. To our knowledge, there is an absence of discussion about the gradient in Cl− depletion moving from the USEC to the open-ocean environment closer to Bermuda. Corral et al. (2021) showed strong gradients in aerosol optical depth along this direction for several particle types including sea salt and SO, suggesting there may be a gradient in Cl− depletion as well. Furthermore, Cl− depletion results from previous studies typically reflect conditions near the surface; however, Shinozuka et al. (2004) showed that the vertical scattering profile of sea salt in the lower 1 km of the atmosphere becomes increasingly less uniform with increasing wind speed. Also of note is that most datasets referenced in Table 1 are now several decades old. Mass concentrations of SO2, NOx, SO, and NO over the eastern US and Canada have steadily decreased since 1990 due, in part, to the Clean Air Act of 1963 and its subsequent amendments (Feng et al., 2020; Kuklinska et al., 2015). Such reductions warrant an updated analysis of Cl− depletion over the NWA.
We note that Cl− depletion results from the Wintertime Investigation of Transport, Emissions and Reactivity (WINTER) aircraft campaign (Haskins et al., 2018) are an exception to many of the points raised above. As an airborne campaign from February to March 2015, WINTER provides data relevant to halogen chemistry at altitudes throughout the boundary layer, at a time of year that had previously not been studied, and in a year recent enough to capture the aforementioned reductions in anthropogenically sourced acidic species. However, WINTER flights specifically sampled over and downwind of various pollution sources in the eastern and southeastern US, meaning Cl− depletion results may be disproportionately reflective of highly polluted, coastally influenced air masses compared with other air mass types observed over the NWA during winter and spring, for example, those (i) occurring after synoptically forced frontal systems have moved through, (ii) associated with cold-air outbreaks (CAOs), and (iii) occurring when southerly winds advect maritime air masses northward along the East Coast.
It is common for Cl− depletion studies to base their calculations on the assumption that sea salt particles are the only source of atmospheric sodium (Na+; i.e., Na+ is used as the reference species for determining the extent of Cl− depletion observed), including nearly all the works listed in Table 1. The validity of this assumption is dependent on several factors, including the proximity to urban emissions, if dust particles are present, and the size range of particles sampled. Ooki et al. (2002) found Na+ to be highly correlated with potassium (K+) in particles < 1.1 µm in urban air masses, implying that these two species have the same source in fine, anthropogenically sourced particles. K+ is thought to come mainly from BB (Echalar et al., 1995; Andreae et al., 1998; Andreae and Merlet, 2001) and anthropogenic activities (Ooki et al., 2002, and references therein), suggesting that marine air masses heavily influenced by BB or urban emissions may have non-negligible contributions from non-sea salt sources to total Na+, especially if submicrometer particles contribute significantly to total mass concentrations (which would depend on the size range of particles sampled). Na+ can also be found in mineral dust (Seinfeld and Pandis, 2016), which has motivated a handful of studies to discern between the amounts of Na+ coming from dust and sea salt using a system of equations (e.g., Boreddy and Kawamura, 2015; AzadiAghdam et al., 2019). The NWA is known to be periodically influenced by Asian, African, and North American dust (e.g., Aldhaif et al., 2020) and emissions from BB (Fehsenfeld et al., 2006; Schroder et al., 2018; Sullivan et al., 2019; Mardi et al., 2021), and it is consistently influenced by anthropogenic activities throughout the year. Several works shown in Table 1 have acknowledged that these additional sources of Na+ may influence estimates of Cl− depletion over the NWA, but none have quantitatively explored this possibility.
Finally, most Cl− depletion studies report the percentage of Cl− in unreacted sea salt particles that has been displaced by acidic species, an approach useful for quantifying the extent of Cl− depletion processes independently of the sea salt mass concentrations present, which can vary seasonally, temporally, and geographically. However, reporting Cl− depletion as a percentage can make it more difficult to conceptualize and quantify the degree to which depletion reactions may be affecting the atmospheric oxidation potential. Several past works focusing on the NWA have reported the magnitude of Cl− displaced from sea salt particles, either in units of nanomoles per cubic meter (e.g., Keene and Savoie, 1998; Keene et al., 1990) or parts per trillion by volume (Keene et al., 2007; Haskins et al., 2018), which we find useful for comprehensive interpretation considering that Singh and Kasting (1988) suggested that part-per-billion-by-volume concentrations of HCl have the potential to produce enough Cl radicals to oxidize 20 %–40 % of non-methane alkanes in the marine troposphere. Thus, reporting Cl− depletion both as a percentage and as a mass concentration benefits the atmospheric chemistry community, as results can be used either comparatively or to improve quantification of Cl radical budgets and the atmospheric oxidation capacity in a given region. Although a few past works in the NWA have reported mass concentrations of displaced Cl−, there is still a need for results reflecting current conditions across a range of seasons, as we have discussed above.
In summary, there is a demand for an updated, multi-seasonal, spatially resolved dataset reflecting Cl− depletion processes in the NWA boundary layer across a variety of meteorological conditions and air mass types. There is also interest in (i) exploring the sensitivity of Cl− depletion results to accounting for non-sea salt sources of Na+, especially in seasons and/or air masses influenced by dust and BB emissions, as well as (ii) quantifying both the percentage and magnitude of Cl− displaced from sea salt particles for straightforward comparisons to other works and to link results more easily to boundary layer Cl radical budgets and their potential influence on atmospheric oxidation rates. This study seeks to address these points using data from the NASA Aerosol Cloud meTeorology Interactions oVer the western ATlantic Experiment (ACTIVATE) airborne field campaign (Sorooshian et al., 2019). The statistical approach, large number of flights spanning a range of seasons and meteorological conditions, and type of instruments deployed on this campaign make the ACTIVATE dataset well suited to address several of the outstanding uncertainties and unknowns regarding Cl− depletion over the NWA.
Table 1Relevant information from previous works, sorted chronologically, documenting Cl− depletion over the northwest Atlantic (NWA). “USEC” stands for United States East Coast and “US” stands for United States.
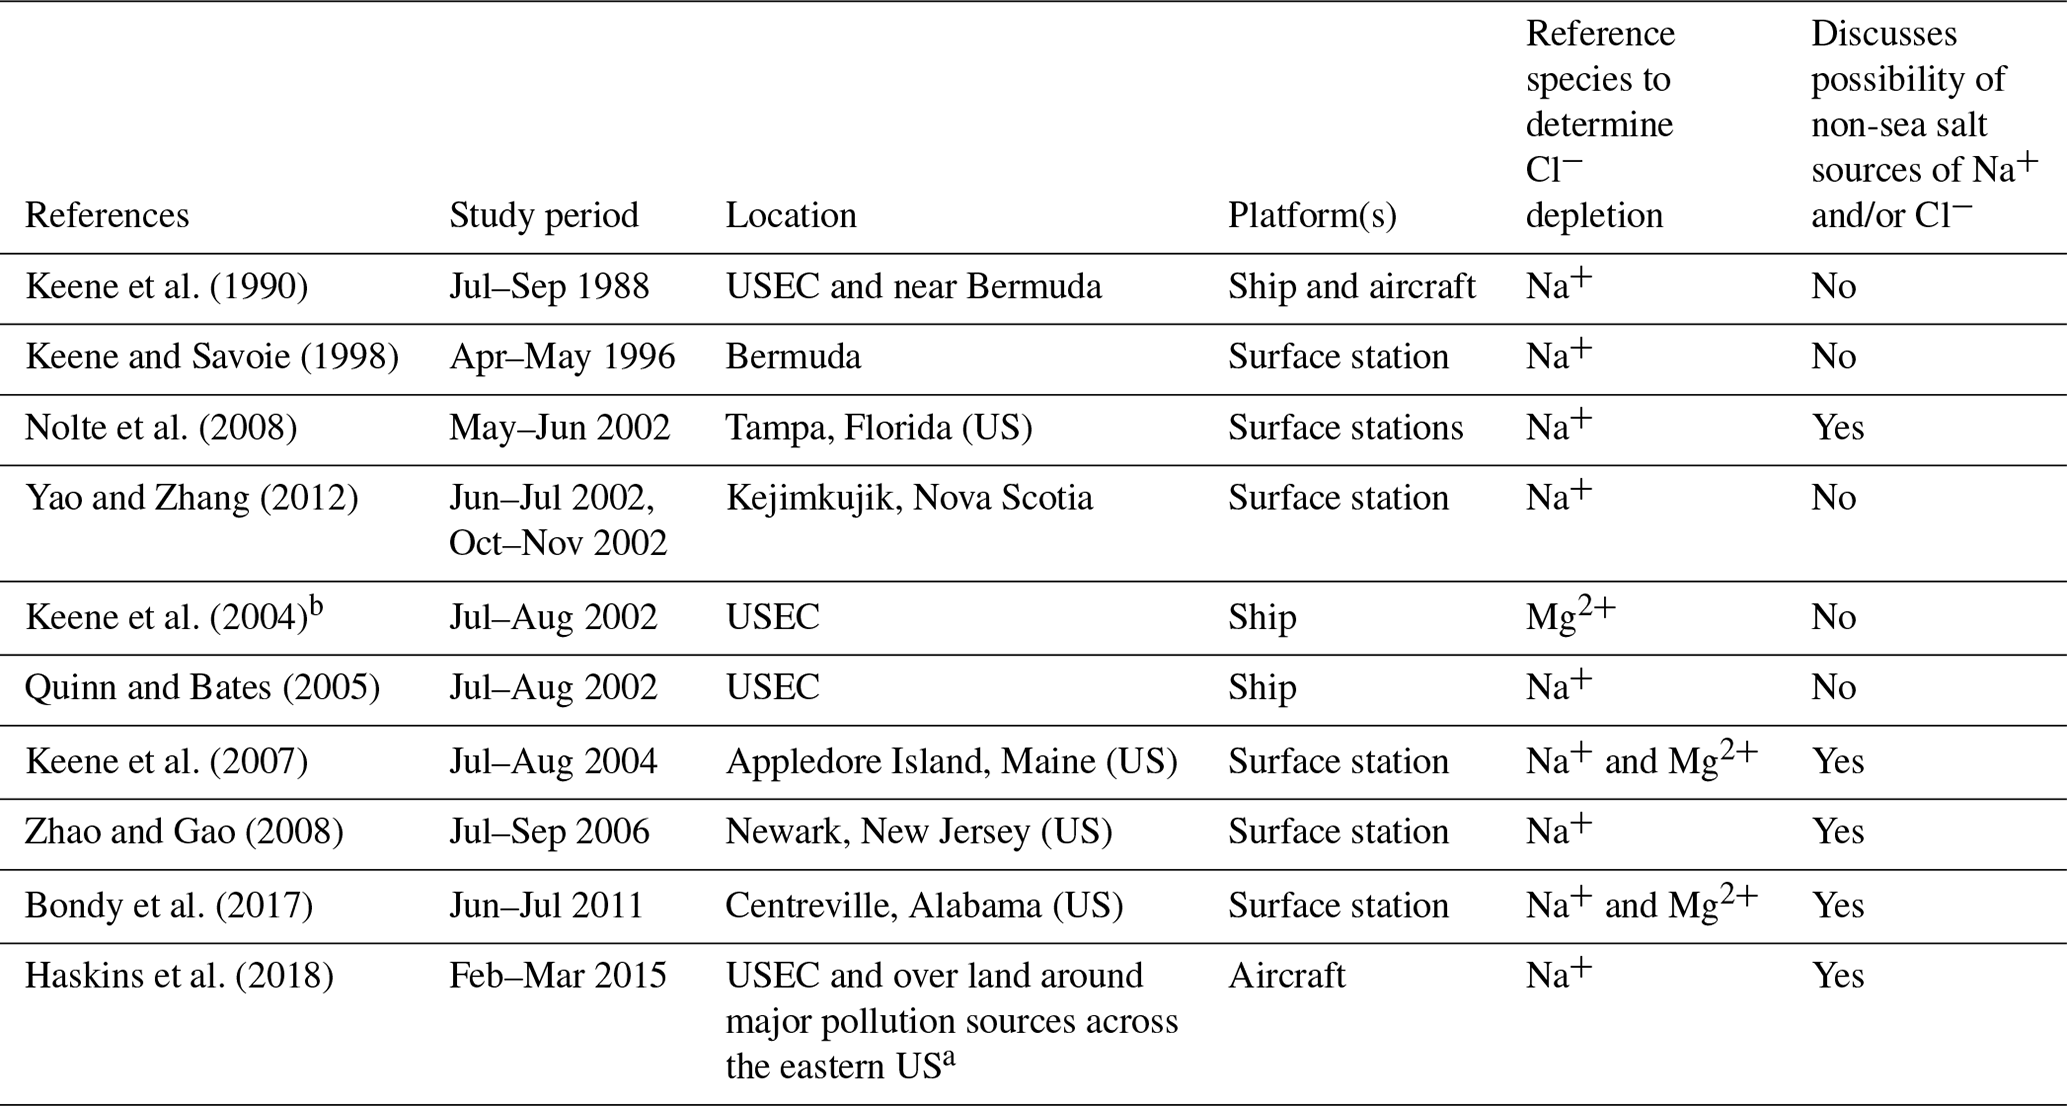
a The Wintertime Investigation of Transport, Emissions, and Reactivity (WINTER) airborne field campaign focused on three regions over the US: (i) the northeast metropolitan corridor (encompassing major cities from Boston to Washington, D.C.), (ii) the Ohio River valley, and (iii) the Southeast. Research flights also extended over coastal waters to sample polluted air masses downwind of their sources. b Magnesium (Mg2+) was chosen as the reference species for sea salt in Keene et al. (2004), as Na+ had a relatively higher and more variable background in the quartz-fiber sampling media used.
2.1 ACTIVATE campaign description
The ACTIVATE field campaign focused on characterizing relationships between aerosol particles, meteorology, and marine boundary layer clouds over the NWA using two research aircraft flying in coordination. Operations were based out of NASA Langley Research Center (LaRC), although a multitude of other sites supported various aspects of the project. The high-flying King Air usually flew steadily at ∼ 9 km releasing dropsondes and using a suite of remote sensors to retrieve particle and cloud properties below the aircraft. The low-flying HU-25 Falcon (hereafter referred to as the “Falcon”) made in situ measurements of trace gases, aerosol particle properties, cloud and precipitation properties (if present), and meteorological conditions in and around boundary layer clouds or in clear conditions usually below 3 km.
ACTIVATE placed a high priority on building statistics to fulfill its objectives and address current uncertainties regarding aerosol–cloud interactions and remote-sensing capabilities over the NWA. To acquire such statistics, the Falcon and King Air achieved 174 and 168 flights with 574 and 592 total flight hours, respectively, from 2020 to 2022 (note that 162 of these were “joint” flights where the aircraft flew in coordination; Sorooshian et al., 2023). The campaign included multiple seasons, with each aircraft adhering to an intentional and consistent flight strategy throughout, to better constrain the multitude of variables affecting a given clear or cloudy scene. As mentioned above, the King Air flew at a fixed altitude of ∼ 9 km regardless of the amount of cloud coverage below. In the presence of low-level (< 3 km) clouds, the Falcon conducted “cloud ensembles” by flying 3 min legs at the following key vertical positions: near the ocean surface (MinAlt; ∼ 150 m), below cloud base, above cloud base, below cloud top, and above cloud top. In the absence of low-level clouds, the Falcon switched to “clear ensembles”, which involved 3 min legs at MinAlt, ∼ 230 m (an altitude useful for remote-sensing validation), and at altitudes falling slightly below and above the boundary layer height (see Fig. 2 in Sorooshian et al., 2023, for an illustration of these ensembles). The campaign was executed over six deployments, which are referred to as Winter 2020 (February–March 2020), Summer 2020 (August–September 2020), Winter 2021 (January–April 2021), Summer 2021 (May–June 2021), Winter 2022 (November 2021–March 2022), and Summer 2022 (May–June 2022) as recommended in Sorooshian et al. (2023). Note that Winter 2022 includes 2 months in 2021 but is referred to as Winter 2022 for simplicity.
2.2 Falcon data
The main instrument providing data for this study is a particle-into-liquid sampler (PILS; Brechtel Manufacturing Inc. – BMI) that was operated downstream from an isokinetic Clarke-style shrouded solid double-diffuser inlet (BMI; McNaughton et al., 2007) onboard the Falcon. The PILS grows aerosol particles with diameters of 50–5000 nm at ambient RH into droplets large enough to be collected via inertial impaction (Sorooshian et al., 2006; Crosbie et al., 2020). Droplets striking the impaction plate are pumped into vials that are analyzed offline using ion chromatography (IC) to quantify air-equivalent mass concentrations of Na+, ammonium (NH, K+, magnesium (Mg2+), calcium (Ca2+), Cl−, NO, SO, and oxalate. PILS data are critical to this study due to the instrument's ability to capture particles containing sea salt, dust, and other refractory species that are largely omitted by the aerosol mass spectrometer (AMS). PILS flow rates were set such that it took 300–420 s (5–7 min) to fill each vial, the minimum duration for collecting enough particle mass to be above speciated detection limits while also meeting injection volume requirements for IC analysis. Note that the time spent collecting one PILS sample is greater than the duration of the individual level legs (∼ 3 min) comprising clear and cloudy ensembles. The possibility that each PILS sample could represent atmospheric properties sampled during multiple level legs and/or periods of ascent or descent between level legs impacted our analysis in two ways. First, PILS measurements must be considered to be a representation of the water-soluble ionic composition throughout the lower 3 km of the atmosphere, meaning they cannot provide vertically resolved information. Second, we exclude PILS data collected during cloudy ensembles to eliminate possible cloud contamination. During cloudy ensembles, it is likely that the Falcon intercepted a cloud within any interval of 5–7 min and that, in doing so, shattered droplets and other cloud artifacts were collected in the awaiting sample vial. Additionally, while flying through clouds, large droplets and ice particles can impact onto the walls within the isokinetic inlet where they may resuspend and, therefore, cause delayed sampling of larger particles previously caught on these walls.
The PILS was operated without upstream acid and base denuders as (1) the removal efficiency for specific relevant gases is not well quantified, (2) it is not known how the removal of gases affects the particle-phase equilibrium for semi-volatile species (e.g., NO, and (3) the addition of denuders decreases the transmission efficiency of coarse-mode sea salt particles into the PILS. While there could be a small positive artifact from certain gases (e.g., SO2 and HNO3), the PILS should be much less sensitive to this issue than filter collection methods with offline analysis. However, the absence of a base denuder opened the possibility for NH3, a highly soluble trace gas, to contribute to particulate NH mass concentrations. During quality control analyses, PILS NH mass concentrations were unjustifiably high in many samples, prompting us to omit this species from this study's analysis. As NH is a critical species for deriving parameters relevant to Cl− depletion, we alternatively use NH mass concentrations from a high-resolution time-of-flight aerosol mass spectrometer (HR-ToF-AMS; Aerodyne; DeCarlo et al., 2008; hereafter referred to as an “AMS”), which provided non-refractory mass concentrations of NH (among other species) for particles 60–600 nm in diameter at a 30 s time resolution. The AMS additionally provided mass concentrations of spectral markers for organic components, of which we use the tracers for oxygenated organics, 44, and methanesulfonic acid (MSA), 79. The AMS collection efficiency was set to unity, as there was not compelling evidence to lower this value when comparing the AMS and PILS SO mass concentrations. AMS data were filtered to isolate those from clear ensembles and then averaged over the 5–7 min interval for each PILS sample. Due to differences in the size range of the PILS and AMS, NH mass concentrations from the AMS represent a lower limit in this analysis.
Horizontal wind speed and static air temperature data were obtained using the Turbulent Air Motion Measurement System (TAMMS; Thornhill et al., 2003) operating at a 20 Hz time resolution, while the diode laser hygrometer (DLH; Diskin et al., 2002) supplied water vapor mixing ratios and values of RH at a 1 Hz time resolution. A commercial cavity ring-down spectrometer (G2401-m; PICARRO, Inc.) provided carbon monoxide (CO) measurements at a 0.4 Hz resolution (DiGangi et al., 2021), which are used to qualitatively compare the extent to which certain seasons were influenced by anthropogenic emissions (Panagi et al., 2020; Naeher et al., 2001; Saide et al., 2011). Data are only considered from clear ensembles for each of the parameters described in this paragraph.
The Falcon occasionally intercepted clouds during clear ensembles. During these cloud passes, certain instruments (e.g., the AMS) sampled downstream of a counterflow virtual impactor (CVI, BMI; Shingler et al., 2012) for droplet residual characterization. We removed data collected during periods with active CVI sampling from our analysis for all of the variables mentioned above.
2.3 Deployment selection and category classifications
This analysis focuses on data collected during the Winter 2022 and Summer 2022 deployments, as they cover the largest geographical range over the NWA and, thus, present the best opportunity for studying spatial gradients in Cl− depletion. During Winter 2022, sampling was extended northward on flights when the Falcon flew to Quonset State Airport in Rhode Island, refueled, and returned to LaRC, an option that was unavailable during the first four deployments due to challenges associated with the COVID-19 pandemic. Summer 2022 is the only deployment to (i) execute “transit flights” (i.e., flights where the Falcon flew to Bermuda, refueled, and flew back to LaRC on the same day) and (ii) include a set of out-and-back flights based in Bermuda. Additionally, Winter 2022 and Summer 2022 supply the largest and most continuous dataset compared with the first 2 years of the campaign. Nearly half of the total Falcon flights occurred within these two deployments, and sampling occurred consistently from 31 November 2021 to 18 June 2022 with a brief break from 30 March to 2 May 2022. The high frequency of flights over a ∼ 7-month period allows us to explore the seasonal evolution of properties relevant to Cl− depletion while also observing their fluctuations on daily to multiday timescales.
To capture both seasonal and spatial trends, Winter 2022 and Summer 2022 data are distributed among the following categories by season/month and/or by the geographical area sampled: December–February (30 November 2021–26 February 2022), March (2–29 March 2022), May (3–20 May 2022), March transit (22 March 2022), May transit (18, 21, and 31 May 2022), and June Bermuda (2–13 June 2022). Note that some flights from the Winter 2022 and Summer 2022 deployments are omitted from this study because they are either composed entirely of cloudy ensembles and/or PILS data are unavailable during the clear ensembles. To explore relationships between (i) speciated mass concentrations and Cl− depletion as well as (ii) phenomena occurring on finer timescales (e.g., the passage of weather fronts and the transport events of African dust plumes), meteorological conditions and/or notable influence from distinct aerosol types are documented for each research flight (RF). We also select RFs sampling various airstreams associated with passing frontal systems and dust-influenced air masses to further illustrate relationships between these phenomenon and properties relevant to Cl− depletion.
2.4 Calculations relevant to Cl− depletion
The following section describes how various properties associated with Cl− depletion were derived using PILS and AMS bulk speciated mass concentrations and literature-based ratios for ions in sea salt, dust, and emissions from various combustion processes. Identifying the amount of Cl− displaced from sea salt particles begins with quantifying the original amount of Cl−, which we derive from Na+ in sea salt (ssNa+) as this species has a relatively high mass fraction and is chemically inert in sea salt particles. We use Eqs. (1)–(5) to resolve contributions of sea salt and dust to bulk PILS mass concentrations of Na+ and Ca2+ (see Sect. S1 in the Supplement for additional information about these equations; Table S1 for variable nomenclature; and Table S2 for values of constant parameters, e.g., mass ratios).
We then use an analogous set of equations (Eqs. 6–14) to explore if various combustion processes contribute non-negligible amounts of Na+ to bulk PILS Na+ mass concentrations (see Sect. S2 for more information).
Combustion-generated particles over the NWA can stem from a range of seasonal and perennial processes, each with a different Na+ and K+ emission factor. We use empirical, literature-based values of for particles emitted from the following combustion-related activities/phenomena: agricultural burning, forest fires, industrial operations, sauna stove wood burning for residential heating, car exhaust, and coal burning for electricity generation (Table S3). Note that only one value at a time can be used for in Eqs. (13) and (14), which forces the assumption that all combustion-generated particles collected in PILS samples are from the same source and/or have the same value.
Mass concentrations of ssNa+ determined either by Eqs. (1)–(5) or Eqs. (6)–(14) are then used to determine sea salt mass concentrations (Eq. 15) as well as quantities relevant to Cl− depletion (Eqs. 16–26).
We first calculate the percentage of Cl− originally in sea salt particles that has been displaced by acidic species (%Cl− depletion; Eq. 16) to facilitate comparisons between our results and other studies. Subsequently, mass concentrations of displaced Cl− are calculated using two approaches to explore the effects of accounting for non-sea salt sources of Na+: Approach 1 quantifies displaced Cl− using derived mass concentrations of ssNa+ (lost Cl−; Eq. 17), while Approach 2 determines displaced Cl− using bulk PILS Na+ mass concentrations (; Eq. 18), thus assuming sea salt is the only source of Na+. Mass concentrations of will always be greater than corresponding values of lost Cl−, and differences between the two (; Eq. 19) are used to assess the significance in accounting for non-sea salt sources of Na+ when evaluating the extent of Cl− depletion processes and their potential effects on atmospheric chemistry.
As mentioned above, acidic species are responsible for displacing Cl− from sea salt particles. However, only a subset of the bulk PILS mass concentrations of SO and NO are available for Cl− depletion reactions, as (i) SO is a naturally occurring component of sea salt and (ii) available NH will neutralize certain amounts of SO and potentially NO, leaving them relatively unreactive. Equations (20)–(23) determine mass concentrations of non-sea salt, unneutralized SO as well as NO, which are added to bulk PILS mass concentrations of oxalate to quantify the amount of excess acidic species (Eq. 24) available for displacing Cl− from sea salt particles. Note that we use oxalate here as a proxy variable to represent organic acids in general, as it is typically the most abundant organic acid in tropospheric aerosol particles (e.g., Hilario et al., 2021; Ziemba et al., 2011; Cruz et al., 2019). We calculate the theoretical amount of lost Cl− attributable to each excess acidic species (Eq. 25) as well as the total amount attributed to all measured excess acidic species (Eq. 26). Results from Eq. (26) can be compared to values from Eq. (17) to identify the amount of lost Cl− explained by the measured excess acidic species, and discrepancies in these values may indicate there are additional species contributing to Cl− depletion (e.g., weak organic acids – Laskin et al., 2012; reactions initiated by O3 – Keene et al., 1990).
2.5 MERRA-2 and NAAPS reanalysis products
Wind speed and wind direction at 950 hPa were obtained from the Modern-Era Retrospective Analysis for Research and Application, Version 2 (MERRA-2; Gelaro et al., 2017) to provide context for large-scale boundary layer wind patterns over the region during each category and/or flights of interest. Monthly averages were attained for December 2021 and January, February, March, May, and June 2022 at a 0.5° × 0.625° spatial resolution, while 3 h averages were acquired for periods pertinent to each transit flight as well as the case study flights discussed in Sect. 3.2 and 3.7.1. Monthly averages for December 2021, January 2022, and February 2022 were combined and averaged to produce a single wind vector field representative of the December–February category, while averages for March, May, and June 2022 were used to portray conditions for the March, May, and June Bermuda categories, respectively. The 950 hPa pressure layer was selected, as this was the Falcon's median pressure altitude during the Winter 2022 and Summer 2022 deployments.
We relied on the Navy Aerosol Analysis and Prediction System (NAAPS) to identify the presence of surface-level dust and smoke over the region on selected days using images from the Aerosol Modeling archive (https://www.nrlmry.navy.mil/aerosol/, last access: 8 October 2023) for the “Eastern United States” and “Tropical Atlantic”. We selected images at 18:00 Z (Zulu time) for each day, as this time is most relevant to flights during the Winter 2022 and Summer 2022 deployments. NAAPS surface dust and smoke mass concentrations are gridded reanalysis products available at a 1° × 1° spatial resolution and a 6-hourly temporal resolution, where simulations of dust depend on the surface erodible fraction and surface friction velocity (Lynch et al., 2016), and those of smoke depend on size and duration of satellite-detected hotspots (Reid et al., 2009; Hyer et al., 2013). Modeled atmospheric transport of dust and smoke particles is then governed by the Navy Global Environmental Model (NAVGEM; Hogan et al., 2014). These products are used to explore how influence from dust and smoke plumes may affect calculations of Cl− depletion for case studies presented in Sect. 3.7.1.
3.1 Meteorological context
Meteorological conditions during the Winter 2022 and Summer 2022 deployments are mostly consistent with climatological characteristics reported for the NWA in Sorooshian et al. (2020) and Painemal et al. (2021). Median temperatures are lowest in December–February (2.7 °C), followed by March (9.2 °C), March transit (13.3 °C; recall that the March transit flights are in late March), May transit (19.2 °C), May (19.9 °C), and June Bermuda (21.9 °C; Fig. 1). Median water vapor mixing ratios and RH follow the same trend with the exception that RH slightly decreases from December–February (53 %) to March (50 %) and March transit (47 %). Median wind speeds are highest for March (10.3 m s−1); similar for December–February, March transit, and May (8.9, 8.6, and 8.4 m s−1, respectively); and lowest for May transit and June Bermuda (6.7 and 6.4 m s−1, respectively). MERRA-2 wind fields at 950 hPa (e.g., Fig. 2) show westerly flow along the USEC for December–February that transitions to southwesterly flow for March and March transit, which is a typical progression as the Bermuda High begins to strengthen (Davis et al., 1997). For May and May transit, zonal flow returns north of 34° N while relatively weak southwesterly flow persists to the south. Southwesterly winds dominate for June Bermuda, and large-scale flow patterns across the NWA appear conventional for a fully developed summertime Bermuda High.
Median CO volume mixing ratios are highest for categories sampling solely along the USEC (i.e., December–February, 133 ppb; March, 141 ppb; and May, 124 ppb) compared with June Bermuda (81 ppb), affirming sampled coastal air masses were most influenced by anthropogenic emissions. We refrain from using CO to compare levels of anthropogenic influence between categories focused on the USEC, as CO exhibits seasonal dependence over the NWA (Buchholz et al., 2021). Specifically, peak values are typically observed in early spring due to wintertime accumulation caused by reduced destruction by OH, while increased rates of oxidation by OH over summer lead to minimum concentrations in late summer.
Precipitation is considered in this work under the provisos that (i) wet scavenging processes remove sea salt particles more efficiently than several other particle types (Galloway et al., 1993) and (ii) strong winds associated with precipitation events can enhance sea salt emissions and offset scavenging losses (Dadashazar et al., 2021; Grandey et al., 2011), both of which can influence the amount of Cl− available for depletion reactions on shorter timescales than the seasonal factors discussed above. The NWA receives the most rainfall from December to February followed by June to August, with precipitation rates peaking along the Gulf Stream in all seasons (Painemal et al., 2021). Hawcroft et al. (2012) showed that 65 %–80 % and 50 %–70 % of the rainfall over the NWA in December–February and June–August, respectively, is associated with midlatitude cyclones (MLCs), a common year-round weather phenomenon for the region (e.g., Braun et al., 2021; Eichler and Higgins, 2006), largely dictating the eastward transport of trace gases and particulates from North America to the adjacent marine environment (Keim et al., 2005; Cooper et al., 2002, 2001). Despite their frequency and known effects on other aerosol properties (e.g., aerosol optical depth and size distribution; Grandey et al., 2011), there is uncertainty regarding how frontal passages influence parameters relevant to Cl− depletion over the NWA. During this study, meteorological conditions were often driven by MLCs, with synoptic conditions changing every few days (Table 2). We discuss key variables in the context of prefrontal and postfrontal airstreams associated with MLCs to explore the influence of midlatitude weather disturbances on depletion reactions and Cl radical budgets over the NWA. Finally, note that clear-ensemble data for December–February do not extend eastward of ∼ 73° W due to frequent cloud cover below 3 km over the ocean. This should be taken into consideration when comparing results for December–February to other categories, especially for continentally sourced properties and/or those that depend on wind fetch.
Table 2Dates, sample quantities, meteorological conditions, and aerosol particle properties relevant to Cl− depletion for research flights (RFs) considered in each category. Median values of Na and Ca are based on bulk PILS data, while values of lost Cl−, Cl− depletion, and excess acidic species are derived using Eqs. (1)–(5), (16), (17), and (20)–(24). “N PILS samples” refers to the total number of PILS samples collected during clear ensembles on the date indicated, while “NPILS” refers to the number of these samples providing enough information to determine a given property, and “NPILS&AMS” refers to the number of coinciding mass concentrations from the PILS and aerosol mass spectrometer (AMS) necessary to calculate excess acidic species' mass concentrations.
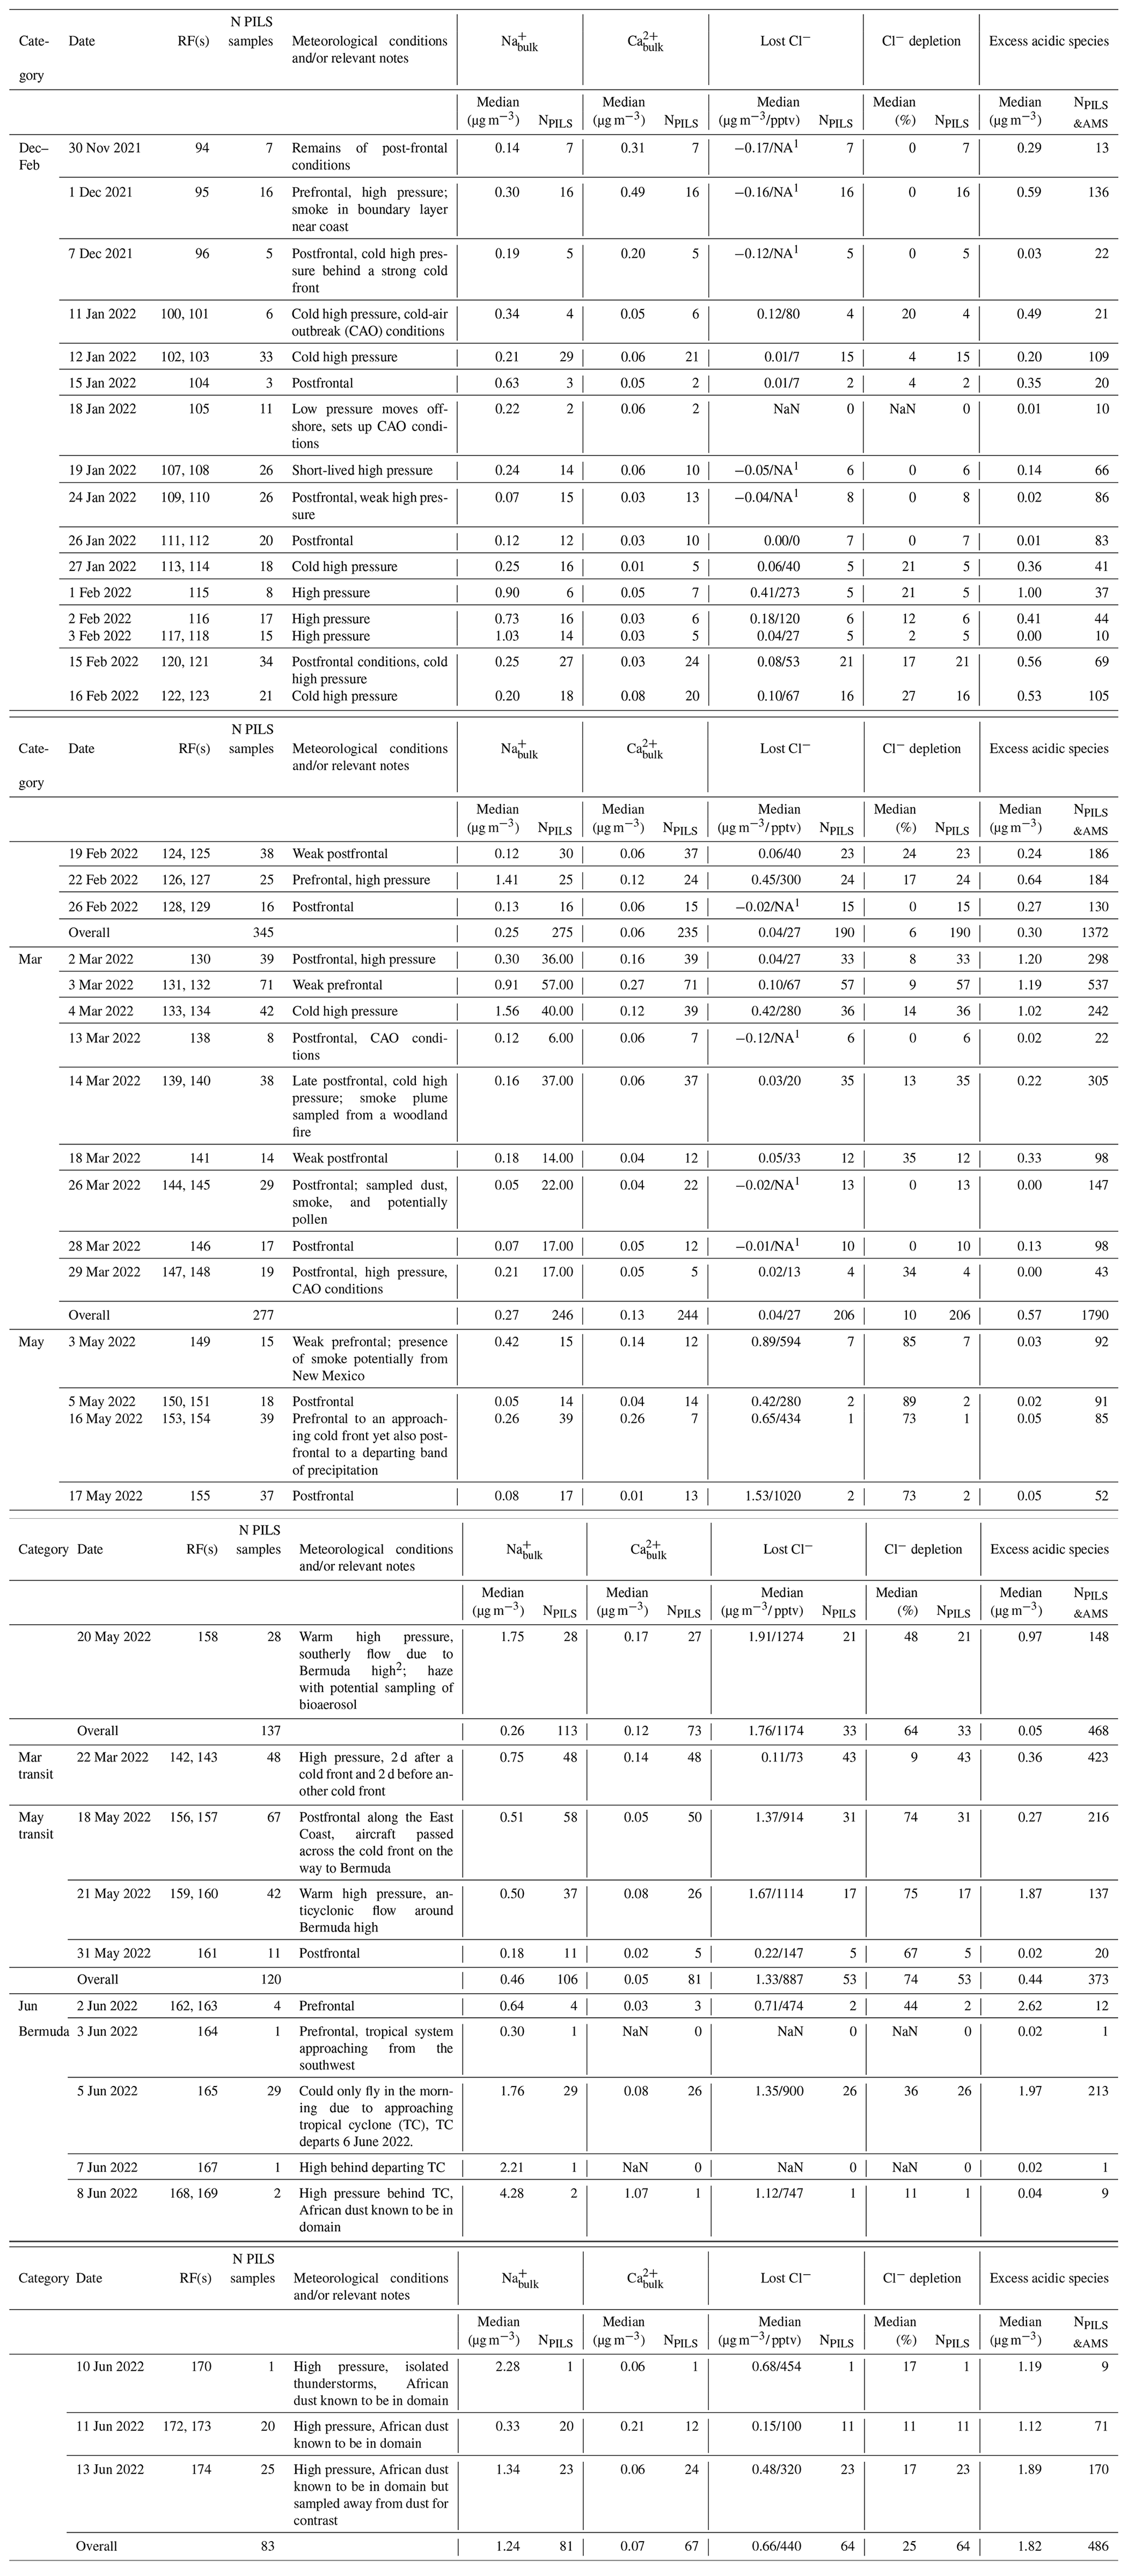
1 Negative mass concentrations (in µg m−3) are reported for lost Cl− and can be conceptualized as the amount of measured particulate Cl− in excess of what would be in unreacted sea salt particles based on Eqs. (1)–(4). Negative values may suggest there are additional non-sea salt sources of particulate Cl− within the sampled air mass. In these cases, we do not provide corresponding gas-phase concentrations of lost Cl− in parts per trillion by volume, as these are only meaningful when Cl− is displaced from sea salt particles. These cases are denoted using NA. 2 Davis et al. (1997).
3.2 Seasonal, spatial, and frontal trends in Na+
Cl− depletion studies are motivated by the fact that radicals produced via depletion reactions can influence atmospheric chemistry, the extent to which largely depends on the quantity of radicals generated. Therefore, the amount of Cl− in sea salt available for depletion reactions is critical to quantify, which is why a large portion of our initial discussion is about trends in bulk Na+ mass concentrations as they are a reliable indicator of sea salt mass concentrations. Bulk PILS Na+ mass concentrations are remarkably similar for December–February, March, and May (median mass concentrations of 0.25, 0.27, and 0.26 µg m−3, respectively); higher for March transit and May transit (0.75 and 0.46 µg m−3, respectively); and highest in and around Bermuda (1.24 µg m−3). In general, past works have also typically reported higher sea salt mass concentrations in open-ocean environments compared with coastal locations (Table S4), which is intuitive considering that wind fetch is one important factor governing atmospheric sea salt mass concentrations. However, if Na+ mass concentrations were dictated chiefly by wind fetch over the NWA, values would mostly increase moving eastward, which is not always the case (e.g., Fig. 2e). In fact, there does not appear to be any distinct spatial gradients in Na+ mass concentrations for the seasons/categories presented; however, (i) overlap of flight tracks makes it difficult to view all mass concentrations at once and (ii) we do not have enough data to state that this is always true for the region.
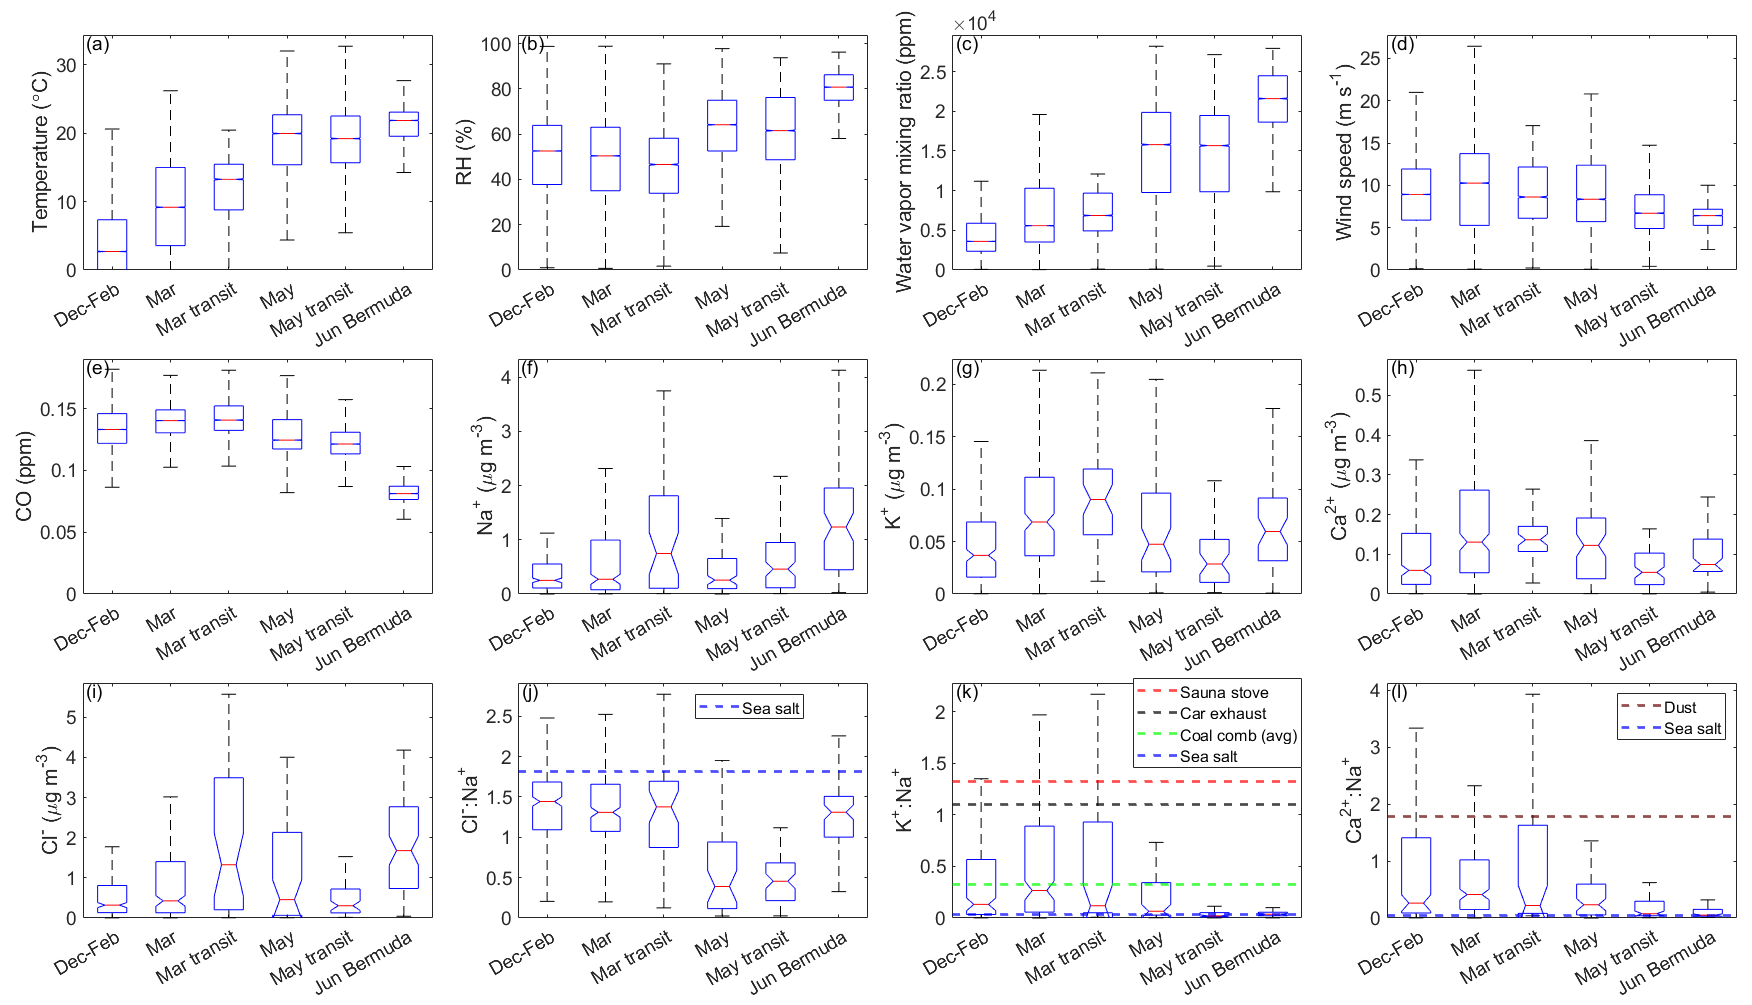
Figure 1Notched box plots showing seasonal/categorical differences in (a) temperature; (b) relative humidity (RH); (c) water vapor mixing ratio; (d) wind speed; (e) carbon monoxide (CO) mixing ratios; bulk mass concentrations from a particle-into-liquid sampler (PILS) of (f) chloride (Cl−), (g) sodium (Na+), (h) potassium (K+), and (i) calcium (Ca2+); and ratios of the aforementioned mass concentrations for (j) , (k) , and (l) . Data are from clear ensembles only. Typical ratios for particular ions in sea salt and/or dust are marked with dashed lines in panels (j), (k), and (l). In panel (k), we use additional lines to indicate ratios of reported in the literature for inefficient batch combustion in a sauna stove (1.33; Lamberg et al., 2011), car exhaust (1.1; Huang et al., 1994), and coal combustion (0.33; Ondov et al., 1989). The solid red line in the center of each box indicates the median, box edges represent the 25th and 75th percentiles, and the lower and upper whiskers indicate the lower limit (first quartile −1.5 × interquartile range) and upper limit (third quartile +1.5 × interquartile range), respectively. The notches span the 95th confidence interval for the median.
Aside from wind fetch, removal via wet scavenging processes is another factor dictating sea salt mass concentrations over marine environments. We explore the effect of passing frontal systems on bulk Na+ mass concentrations for December–February, March, and May, as (i) bulk Na+ appears seasonally independent among these categories and (ii) flights sampled the same general region, allowing us to remove coastal versus open-ocean sampling as a confounding variable. When applying the meteorological conditions identified for each day in Table 2, bulk Na+ mass concentrations are generally higher during prefrontal/high-pressure conditions compared with postfrontal scenes for each seasonal/monthly category (Fig. 3). It is not unusual for bulk Na+ mass concentrations to exceed 3 µg m−3 under prefrontal and/or high-pressure conditions, especially in March and May, but values never exceed this threshold under postfrontal conditions. Although bulk statistics suggest frontal passages may reduce sea salt mass concentrations over the NWA, data from prefrontal and postfrontal conditions are not guaranteed to be linked, meaning samples quantifying bulk Na+ before and after each frontal passage are not always available. Therefore, we isolate bulk Na+ mass concentrations for flights straddling frontal passages to assess the relationship of sea salt mass concentrations and MLCs on a case-study level.
Postfrontal conditions on 19 February 2022 (RFs 124 and 125) are associated with bulk Na+ mass concentrations mostly < 0.3 µg m−3 and moderate westerly winds bringing continental air over the NWA (Fig. S1). A total of 3 d later (22 February 2022; RFs 126 and 127), prefrontal conditions show increased bulk Na+ mass concentrations that are distributed evenly from 0.3 to 2.7 µg m−3 and southerly winds along the coast. Bulk Na+ mass concentrations then swiftly decrease to values mostly below 0.3 µg m−3 by 26 February 2022 (RFs 128 and 129) as another MLC moves through the region, although it should be noted that clear-ensemble sampling was more restricted to the coastline on this day compared with 19 and 22 February 2022.
Unfortunately, samples straddling a frontal passage for March are unavailable, but we use consecutive flights from 2 to 4 March 2022 to depict the “recharge” of sea salt mass concentrations following a MLC (Fig. S2). Bulk Na+ mass distributions gradually shift towards larger mass concentrations moving from postfrontal conditions with gentle westerly winds (2 March 2022; RF 130), to weak prefrontal conditions with stronger northwesterly and southwesterly winds converging at 36° N (3 March 2022; RFs 131 and 132), and, finally, to cold high-pressure conditions with moderate anticyclonic flow around a high over the northeastern US (4 March 2022; RFs 133 and 134). Air masses sampled on 2 and 3 March 2022 appear more continentally influenced and may have been more recently affected by large-scale precipitation compared with the marine air mass sampled on 4 March 2022, which is a potential explanation for the differences in bulk Na+ mass concentrations.
Flights on 16 May 2022 (RFs 153 and 154) sampled an air mass recently impacted by a retreating band of precipitation but also considered to be prefrontal due to an approaching cold front (Fig. S3). As there was limited time for sea salt mass concentrations to recharge between the consecutive MLCs, it is unsurprising that there is little difference in bulk Na+ mass concentrations between 16 May 2022 and the postfrontal conditions sampled on 17 May 2022 (RF 155). Frontal influence dissipated by 20 May 2022 (RF 158) with southwesterly flow returning along the coastline in association with the strengthening Bermuda High. This, and the absence of precipitation for several days, may help explain the increase in bulk Na+ mass concentrations from mostly below 1 µg m−3 on 16–17 May 2022 to mostly above this value on 20 May 2022. The three case studies presented are meant to illustrate how rapidly sea salt mass concentrations can change over the NWA due, in part, to fluctuations in synoptic-scale wind patterns and/or large-scale precipitation associated with MLCs. However, we acknowledge that there are many other confounding atmospheric variables influencing sea salt mass concentrations during these case studies and that flight tracks do not cover the exact same locations on each of these days. Although we do not have enough data to make definitive claims, bulk statistical and case study analyses suggest that sea salt mass concentrations decrease behind passing MLCs over the NWA, which corresponds to reduced potential in the amount of reactive chlorine-containing gases that could be produced via depletion reactions compared with under prefrontal and high-pressure conditions.
3.3 Seasonal trends in K+, Ca2+, Cl−, and ion mass ratios
As described above, the NWA receives BB emissions from continuous sources (e.g., fossil fuel combustion for transportation and industrial efforts along the USEC), seasonal practices (e.g., agricultural waste burning in spring and wood burning in winter), and intermittent but influential events (e.g., forest fires). Using K+ as a tracer for such activities, BB influence is greatest during March and March transit flights with median bulk K+ mass concentrations of 0.07 and 0.09 µg m−3, respectively, compared with 0.04, 0.05, 0.03, and 0.06 µg m−3 for the December–February, May, May transit, and June Bermuda categories, respectively. This agrees with previous findings where mass concentrations of organic carbon and particles with diameters 2.5–10 µm (PMcoarse) were much higher in March than in any other month at a coastal site in Florida (Edwards et al., 2021), and this was attributed mostly to the annual peak in prescribed burning across the southeastern US (Jaffe et al., 2020; McCarty et al., 2007). Our bulk K+ mass concentrations are comparable to mean values reported at a receptor site for BB and urban emissions from East Asia (0.02–0.05 µg m−3; Boreddy and Kawamura, 2015) as well as those in polluted air masses containing dust (0.03 µg m−3) and biogenically influenced air masses (0.03 µg m−3) over the southeastern US during the Study of Emissions and Atmospheric Composition, Clouds, and Climate Coupling by Regional Surveys (SEAC4RS; Kacenelenbogen et al., 2022). However, bulk K+ values are mostly lower than average K+ mass concentrations in air masses influenced by agricultural burning (0.10 µg m−3) and wildfire (0.09 µg m−3) emissions during SEAC4RS (Kacenelenbogen et al., 2022) and also lower than average mass concentrations (0.82 µg m−3) measured during the Fire Influence on Regional to Global Environments and Air Quality (FIREX-AQ) airborne field campaign (Adachi et al., 2022) sampling BB plumes in the western and southeastern US. Thus, BB particles were consistently present during the Winter 2022 and Summer 2022 deployments, although relatively dilute compared with their levels in air masses more heavily influenced by BB processes. This is an important point to consider when contemplating how BB emissions may affect estimates of Cl− depletion, which is discussed in greater detail in Sect. 3.7.2.
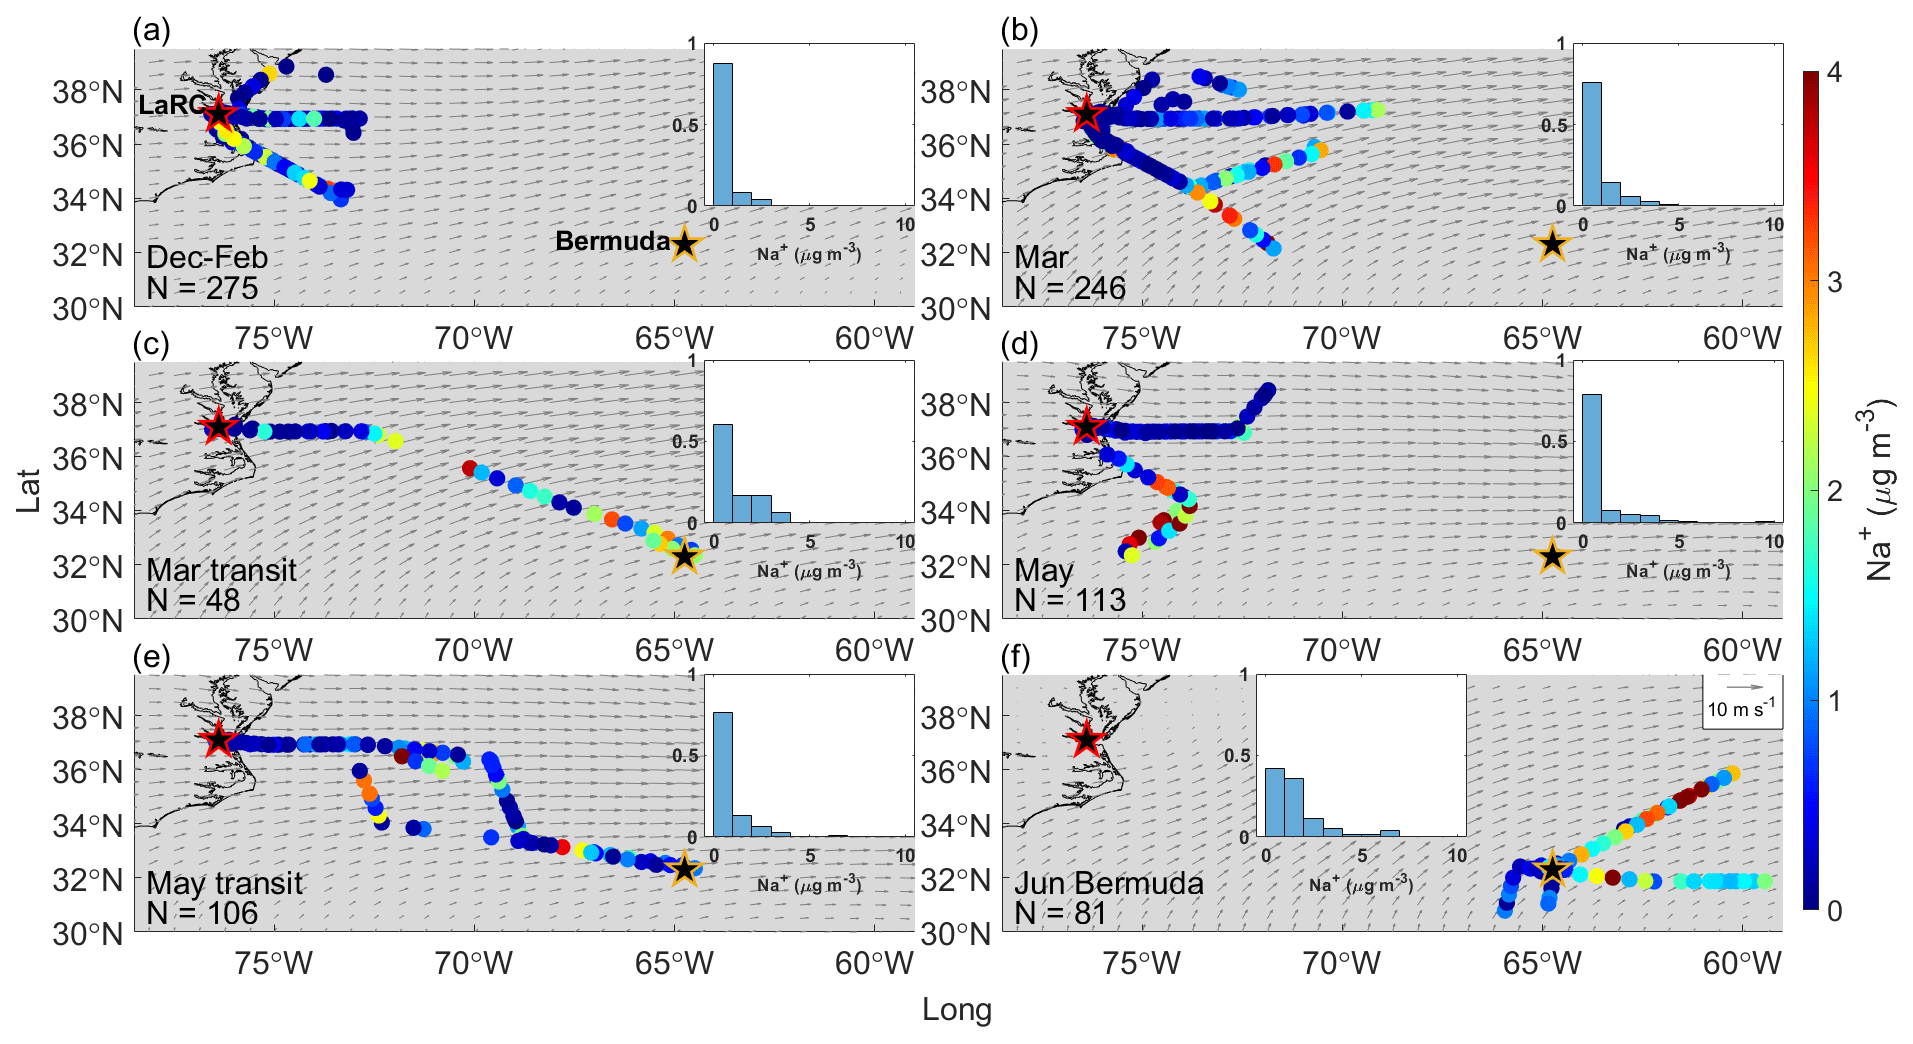
Figure 2Bulk PILS Na+ mass concentrations from clear ensembles during (a) December 2021–February 2022, (b) March 2022, (c) March 2022 transit flights between NASA Langley Research Center (LaRC; marked with a red-edged star) and Bermuda (marked with a golden-edged star), (d) May 2022, (e) May 2022 transit flights between LaRC and Bermuda, and (f) the Bermuda field campaign in June 2022. Normalized histograms in each panel show the distribution of bulk PILS Na+ mass concentrations for that specific category, as overlap among the colored dots can hide some from view. Gray arrows indicate the average magnitude and direction of winds at 950 hPa from MERRA-2 for the period relevant to each category.
We use bulk Ca2+ to identify the influence of dust particles and see a similar trend as above: median bulk Ca2+ mass concentrations are higher in certain spring categories (0.13, 0.14, and 0.12 µg m−3 for the March, March transit, and May categories, respectively) compared with December–February (0.06 µg m−3) and June Bermuda (0.07 µg m−3). Higher springtime bulk Ca2+ mass concentrations are likely due to the periodic influence of Asian dust plumes, which arrive most frequently over the region from March to May (Aldhaif et al., 2020), and/or to increased suspension of dust particles in BB plumes from agricultural fires across the eastern and southeastern US due to turbulent mixing around flames and the burn front (e.g., Kavouras et al., 2012; Popovicheva et al., 2014; Maudlin et al., 2015; Schlosser et al., 2017; Palmer, 1981). Interestingly, bulk Ca2+ mass concentrations are lowest for May transit (0.05 µg m−3), but this may be explained by the episodic nature of dust events over the NWA (e.g., Wu et al., 2015; Perry et al., 1997; Prospero, 1999) and the fact that this category is comprised of only 3 d. African dust plumes become more common over the NWA from June to August (Zuidema et al., 2019) with the strengthening of the Bermuda High, but the Summer 2022 deployment ended just as these plumes were becoming evident over the region (see the meteorological notes for 10, 11, and 13 June 2022 in Table 2). There does not appear to be distinct spatial trends in bulk Ca2+ over the region for most categories (Fig. S4), presumably as fluctuations in bulk Ca2+ may be largely driven by the periodic influence of long-range dust transport, smoke plumes from fires along the USEC advecting over the ocean, and midlatitude weather disturbances (Fig. S5). However, a gradient seems to exist along the March transit flights (RFs 142 and 143 on 22 March 2022) such that bulk Ca2+ mass concentrations are highest to the east of LaRC and then decrease to the southeast towards Bermuda. This potential sampling of a dust plume and its implications with respect to calculations relevant to Cl− depletion are explored further in Sect. 3.7.1.
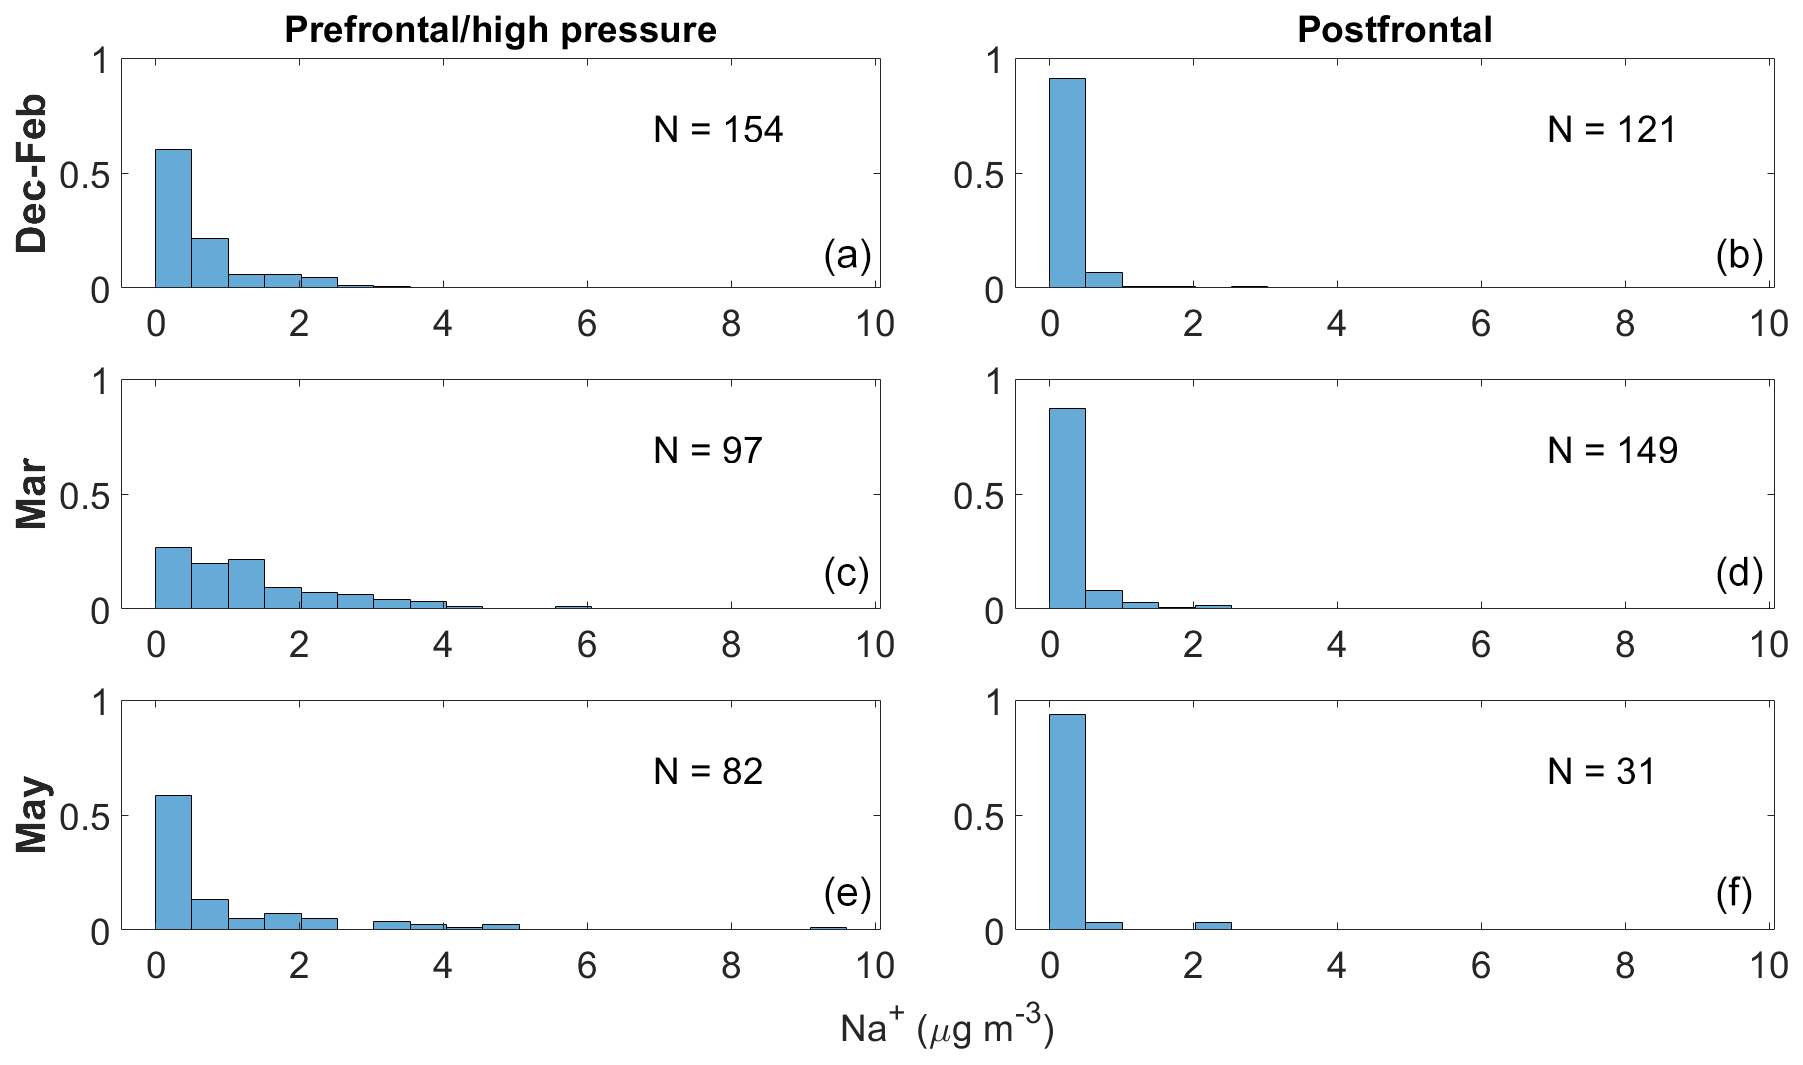
Figure 3Normalized histograms showing differences in bulk PILS Na+ mass concentrations from clear ensembles occurring in prefrontal and/or high-pressure versus postfrontal conditions for December–February (a, b), March (c, d), and May (e, f). These categories are shown because they represent flights occurring in and around the East Coast, eliminating coastal versus open-ocean sampling as a confounding variable.
Median Cl− mass concentrations exhibit slightly different seasonal trends compared with bulk Na+, with values lowest for May transit (0.31 µg m−3); slightly higher for December–February, March, and May (0.32, 0.43, and 0.46 µg m−3, respectively); and much higher for March transit and Bermuda (1.33 and 1.68 µg m−3, respectively). The fact that May transit has the third highest median bulk Na+ mass concentration but the lowest Cl− median is the main difference in seasonal trends between these species, which may seem to suggest that Cl− depletion processes are most active for May transit. However, the number of PILS samples providing (i) bulk Na+ and (ii) Cl− mass concentrations are very different for May (113 and 43, respectively) and May transit (106 and 65, respectively), but they are comparable for December–February, March, March transit, and June Bermuda (Table S5). Thus, it is best to avoid drawing conclusions about Cl− depletion from individual trends in bulk Na+ and Cl− and to instead focus on samples providing mass concentrations for both species. These samples were isolated to generate the statistics shown in Fig. 1j, which (i) can be considered to be a precursory analysis for Cl− depletion over the NWA where sea salt is assumed to be the only source of Na+ and (ii) are directly comparable to many past works making this assumption. Ratios of are below 1.81 for all categories, suggesting that Cl− depletion processes are consistently occurring over the region. However, median values are much lower for May (0.39) and May transit (0.46) compared with December–February (1.44), March (1.31), March transit (1.38), and June Bermuda (1.31), suggesting that depletion reactions are particularly prevalent in late spring. May and May transit ratios are comparable to those previously reported along the USEC (Quinn and Bates, 2005; Nolte et al., 2008; Zhao and Gao, 2008) in late spring and summer, especially for submicrometer sea salt particles.
As mentioned above, ratios are only an appropriate means to illustrate the extent of Cl− depletion if sea salt is the predominant source of each species. Ratios of bulk and are useful for indicating if other particle types may be contributing to bulk Na+ concentrations, as these ions are present in distinctly different proportions in sea salt, emissions from various combustion processes, and dust particles. Combustion and/or BB activities do not appear to contribute meaningfully to bulk Na+ for May, May transit, or June Bermuda, as the ratios (0.065, 0.020, and 0.037, respectively) are fairly similar to the reference value for sea salt (0.036; Seinfeld and Pandis, 2016; Finlayson-Pitts and Pitts, 2000), whereas ratios exceeding this value are observed for December–February (0.132), March (0.267), and March transit (0.119). Table 2 indicates that smoke was only directly sampled on 4 d of the Winter 2022 and Summer 2022 deployments (1 December 2021, 14 March 2022, 26 March 2022, and 3 May 2022), suggesting that increased ratios for December–February, March, and March transit may have been driven by increased background levels of BB particles over the NWA from widespread and continuous residential wood burning and prescribed agricultural burning in winter and early spring (as opposed to acute BB events). All categories have median ratios exceeding the reference value for sea salt (0.038; Bowen, 1979; Finlayson-Pitts and Pitts, 2000), with values of 0.412, 0.261, 0.233, 0.219, 0.075, and 0.050 for March, December–February, May, March transit, May transit, and June Bermuda, respectively. These results nicely motivate an investigation into how estimates of Cl− depletion change when eliminating contributions of (i) dust and (ii) both dust and combustion emissions to bulk Na+ mass concentrations, which are the topics of Sect. 3.7.1 and 3.7.2, respectively.
3.4 Seasonal, spatial, and frontal trends in acidic species
Sea salt mass concentrations alone control the maximum amount of reactive chlorine-containing gases that can be released via Cl− depletion reactions, but available acidic species are an important factor in regulating the extent to which these reactive gases are actually released. Median mass concentrations of bulk SO show that this acidic species is a common constituent of sampled air masses, especially for March transit and June Bermuda (Fig. 4; Table S6). Median bulk NO mass concentrations are of similar magnitude to bulk SO, but they exhibit less variability among the categories, while oxalate is present in relatively low amounts for December–February, March, and March transit; increases sharply for May and May transit; and then decreases slightly for June Bermuda. In Sect. 2.4, we describe how ssNa+ mass concentrations and subsequently derived parameters can be calculated either by assuming (i) dust and sea salt or (ii) dust, sea salt, and combustion-sourced particles contribute to bulk Na+. In this section and Sect. 3.5, 3.6, 3.7.1, and 3.7.3, we discuss values based on the first assumption, whereas those based on the second assumption are the topic of Sect. 3.7.2.
After accounting for contributions of sea salt to SO and neutralization of non-sea salt SO and NO with NH, excess SO (ExSO is typically nonexistent for all categories except June Bermuda (median of 0.63 µg m−3; Fig. S6), while a range of mass concentrations of excess NO (ExNO remain for all categories except May (0.24, 0.51, 0.32, 0.74, and 1.02 µg m−3 for December–February, March, March transit, May transit, and June Bermuda, respectively). Thus, mass concentrations of measured acidic species available to participate in Cl− depletion reactions are relatively low for May (0.05 µg m−3; contributed mostly by oxalate); moderate for December–February, March, March transit, and May transit (0.30, 0.57, 0.36, and 0.44 µg m−3, respectively); and relatively high for June Bermuda (1.82 µg m−3). However, recall that oxalate is used in this study as a proxy for general trends in organic acids, many of which have been shown to considerably displace Cl− from sea salt particles (e.g., Laskin et al., 2012), including formate, acetate, MSA, and succinate (Kerminen et al., 1998; Braun et al., 2017); thus, the results based on oxalate are a lower bound for the effects that organic acids have on depletion reactions. Although lower than other aerosol constituents, oxalate mass concentrations are highest for May and May transit along with those of 44, a marker of oxygenated organics that has been shown to correlate with organic acids (Zhang et al., 2005; Takegawa et al., 2007; Sorooshian et al., 2010), and 79, a marker for MSA (Zorn et al., 2008; Van Rooy et al., 2021). Median 44 mass concentrations especially suggest organic acids may play an important role in sea salt particle chemistry for May and May transit, as values (0.46 and 0.41 µg m−3, respectively) (i) are comparable to those of other dominant acidic species over the region, (ii) represent the mass only of the particle fragments (i.e., carboxylic acids) able to displace Cl−, and (iii) reflect a lower limit of what is actually available for depletion reactions as AMS measurements are for particles 60–600 nm.
Like sea salt mass concentrations, excess acidic species do not display clear zonal or meridional trends over the NWA (Fig. S7) but do appear to decrease near the USEC following the passage of MLCs (Fig. S8). The reasons for such high mass concentrations of excess acidic species for June Bermuda are uncertain, but a probable cause may be emissions of DMS from marine organisms oxidizing to produce H2SO4 (e.g., Luria et al., 1989; Andreae et al., 2003). Excess acidic species' mass concentrations are not nearly as high near Bermuda for March transit and May transit compared with June Bermuda, suggesting that the increased values in June may be (i) due to greater photochemical production of SO with increased incident solar radiation (Parungo et al., 1987; Corral et al., 2021) or (ii) due to an episodic surge in local marine biological activity, which has been shown to occur around Bermuda when higher doses of solar radiation become available to the upper mixed layer of the ocean (Vallina and Simó, 2007; Toole and Siegel, 2004). Level-3 (8 d average, 4 km resolution) sea surface chlorophyll-a concentrations from MODIS-Aqua show consistent values around Bermuda for March transit, May transit, and June Bermuda. However, there is an important distinction between biomass and ocean biological activity such that steady biomass around Bermuda does not necessarily correspond to similar gaseous emission rates for these categories. Thus, additional research is needed to better understand the seasonal variations in excess acidic species around Bermuda.
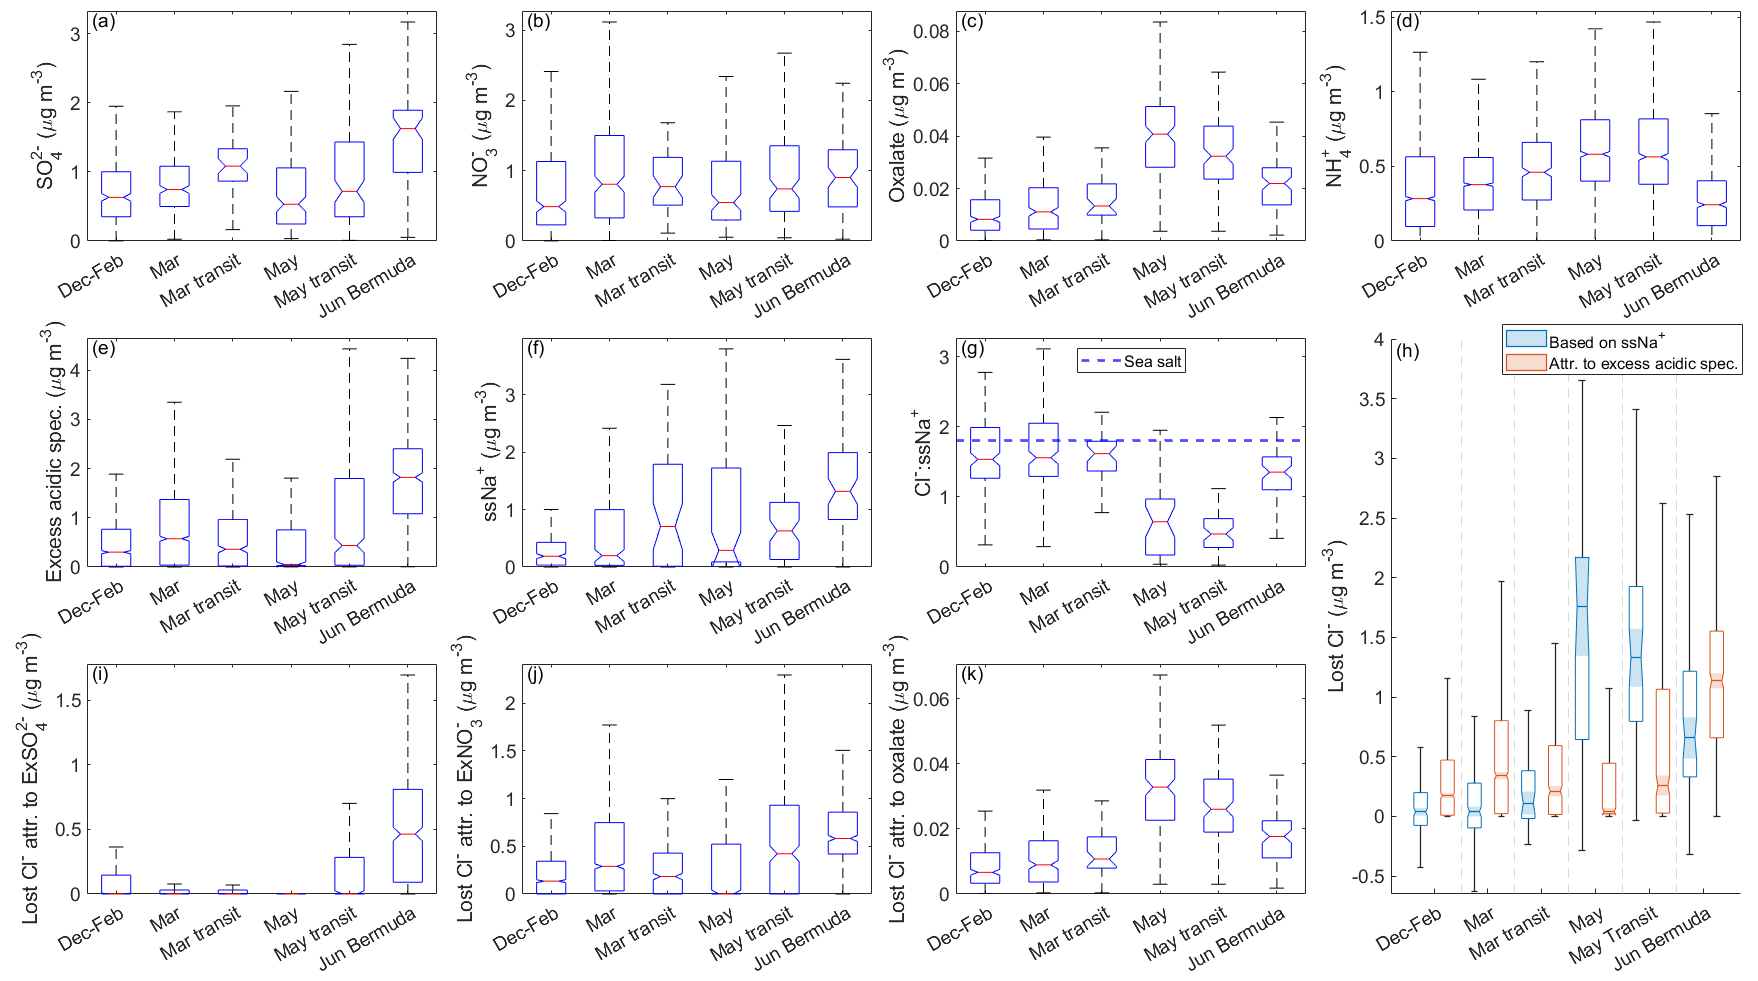
Figure 4Notched box plots showing seasonal/categorical differences in observed mass concentrations from clear ensembles of bulk PILS (a) sulfate (SO, (b) nitrate (NO, and (c) oxalate as well as (d) AMS ammonium (NH. Similar plots are shown for derived mass concentrations of (e) total excess acidic species; (f) sea salt Na+ (ssNa+); (g) the ratio of Cl− : ssNa+; (h) mass concentrations of actual and theoretical lost Cl−; and the theoretical mass concentrations of lost Cl− attributable to (i) excess SO (ExSO, (j) excess NO (ExNO, and (k) oxalate. The value of in sea salt (1.81; Seinfeld and Pandis, 2016) is indicated in panel (g) with a horizontal dashed blue line. In panel (h), light blue boxes represent the actual Cl− displaced from sea salt particles based on derived mass concentrations of ssNa+, while light red boxes represent the theoretical amount of Cl− that could have been displaced by the derived mass concentrations of excess acidic species. The properties of the boxes are the same as described in Fig. 1.
3.5 Seasonal, spatial, and frontal trends in Cl− depletion
Median ssNa+ mass concentrations display similar trends to bulk Na+ with comparable values among the December–February, March, and May categories (0.19, 0.20, and 0.29 µg m−3, respectively); higher mass concentrations for March transit and May transit (0.71 and 0.63 µg m−3, respectively); and the highest values for June Bermuda (1.32 µg m−3). Median ratios of (1.54, 1.56, 1.62, 0.65, 0.47, and 1.35 for December–February, March, March transit, May, May transit, and June Bermuda, respectively) are higher than those of for each category, serving as a preliminary example of how neglecting contributions of dust to bulk Na+ can lead to overestimates of Cl− depletion. Regardless of magnitude, the and ratios both convey that the greatest fraction of available sea salt Cl− is converted to reactive chlorine-containing gas during the month of May (i.e., May and May transit categories) over the NWA. Lost Cl− mass concentrations are relatively low for December–February, March, and March transit (0.04, 0.04, and 0.11 µg m−3, respectively); abruptly increase for May and May transit (1.76 and 1.33 µg m−3, respectively); and then show a moderate decrease for June Bermuda (0.66 µg m−3). These mass concentrations correspond to increases in atmospheric mixing ratios of reactive chlorine-containing gas of 27, 27, 73, 1174, 887, and 440 pptv, respectively, suggesting that Cl− depletion processes have the potential to considerably alter rates of boundary layer VOC oxidation in May over the NWA; recall that Singh and Kasting (1998) reported that part-per-billion-by-volume levels of HCl can produce enough Cl radicals to oxidize 20 %–40 % of tropospheric non-methane alkanes. However, it should be noted that our reported lost Cl− mass concentrations are for particles with diameters < 5 µm; therefore, although May appears to be the only category where Cl− depletion is severe enough to potentially accelerate tropospheric VOC oxidation, lost Cl− mass concentrations may be higher in reality for other categories, depending on the extent of depletion reactions in larger sea salt particles.
Lost Cl− mass concentrations (1) do not display a clear spatial gradient over the region (Fig. 5) and (2) decrease near the USEC after passing frontal systems, both of which are intuitive as bulk Na+ and excess acidic species' mass concentrations display the same trends. Although median lost Cl− mass concentrations are above 0 µg m−3 for all categories, negative lost Cl− mass concentrations are observed in 45 %, 42 %, 35 %, 3 %, 2 %, and 14 % of the samples for December–February, March, March transit, May, May transit, and June Bermuda, respectively. Negative lost Cl− values can be interpreted as there being more Cl− in a sample than expected for unreacted sea salt particles based on derived mass concentrations of ssNa+. Such values may indicate the influence of non-sea salt sources of Cl−, such as biomass burning (Jing et al., 2017; Park et al., 2013; Cao et al., 2016), mineral dust (Sullivan et al., 2007), and waste incineration (Moffet et al., 2008). Especially in December–February and March, negative mass concentrations of lost Cl− often occur in samples with relatively high mass concentrations of bulk Ca2+ (Fig. S10) and K+ (Fig. S11), which can be considered tracers for many of the non-sea salt sources of Cl− mentioned above. However, there are several exceptions to these relationships, and we leave a more thorough investigation into non-sea salt sources of particulate Cl− to future studies.
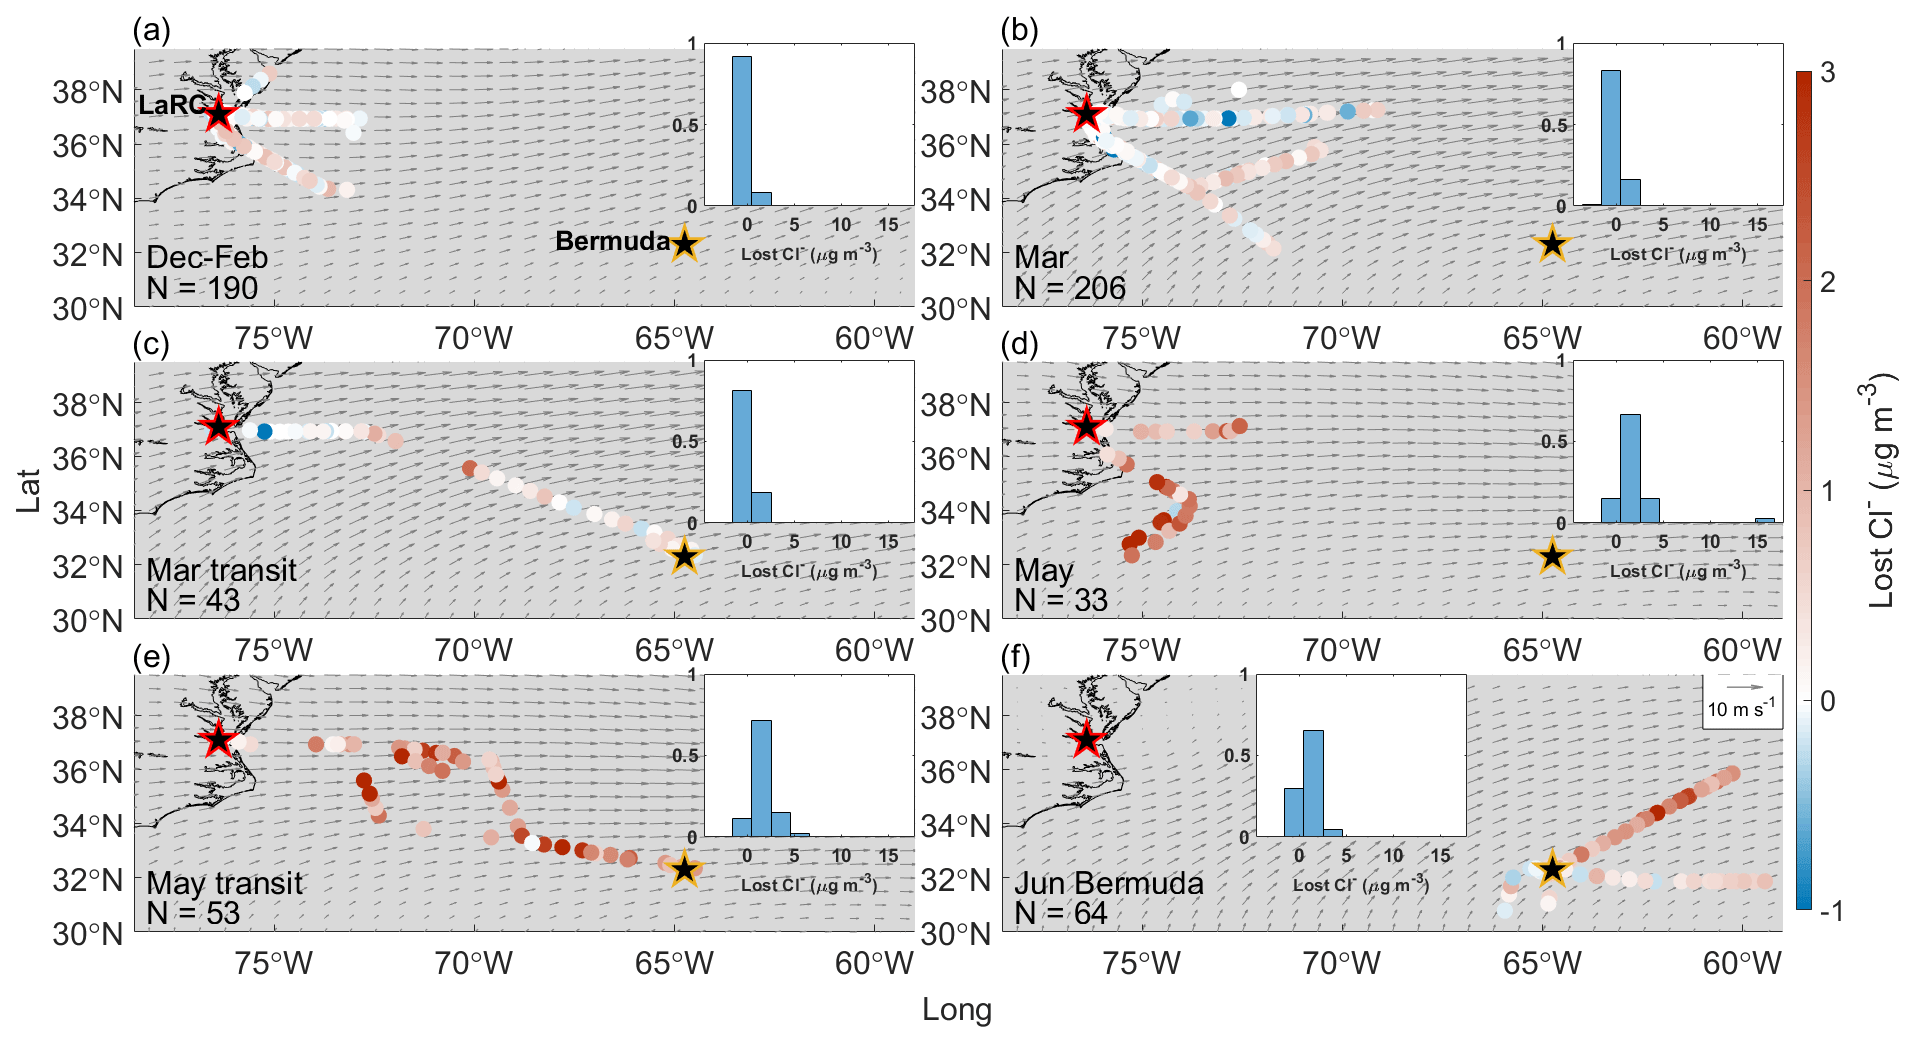
Figure 5Same as Fig. 2 but for lost Cl−.
3.6 Attributing lost Cl− to acidic species
Median mass concentrations of excess acidic species have the potential to displace 0.17, 0.34, 0.21, 0.04, 0.26, and 1.14 µg m−3 (117, 228, 141, 27, 172, and 758 pptv, respectively) of Cl− from sea salt particles for December–February, March, March transit, May, May transit, and June Bermuda, respectively. These hypothetical losses exceed actual mass concentrations of lost Cl− for all categories except May and May transit, suggesting that measured excess acidic species often did not react to their full potential with available particulate Cl−, considering that median %Cl− depletion values are 6 %, 10 %, 9 %, and 64 % for December–February, March, March transit, and June Bermuda, respectively. The extent of depletion reactions in December–February, March, March transit, and June Bermuda may have been limited by meteorological variables (e.g., temperature and RH) and/or restricted access of acidic species to particulate Cl− due to the size distribution and/or mixing state of sea salt particles (Su et al., 2022, and references therein).
Most lost Cl− can be attributed primarily to ExNO in December–February, March, March transit, and May transit, which is consistent with findings from past works (e.g., Nolte et al., 2008; Yao and Zhang, 2012; Zhao and Gao, 2008). Excess SO and ExNO have the potential to contribute equally to Cl− losses for June Bermuda; however, as actual lost Cl− was much lower than theoretical lost Cl−, the extent to which each species contributed is unknown. Oxalate has the potential to displace the least Cl− for all categories (0.01, 0.01, 0.01, 0.03, 0.03, and 0.02 µg m−3 for December–February, March, March transit, May, May transit, and June Bermuda, respectively), although it is but one organic acid among thousands (Robinson et al., 2007). As mentioned above, there is convincing evidence that organic acids had a considerable presence in sampled air masses, especially for March transit, May, and May transit. This may be due to rising amounts of incident solar radiation accelerating photochemical oxidation of abundant biogenic and anthropogenic VOCs along the USEC to produce secondary organic aerosols (SOAs), followed by further oxidation of these SOAs to produce oxygenated organics, many of which can serve as weak acids in Cl− depletion reactions. It is possible that unmeasured organic acids are responsible for the lost Cl− that currently cannot be accounted for in May and May transit, although further research is necessary to explore this idea, specifically studies quantifying mass concentrations of additional organic acids in the context of Cl− depletion.
3.7 Outcomes from quantifying Cl− depletion semi-unconventionally
In the following subsections, we examine the effects of accounting for (i) dust and (ii) dust and combustion emissions as a source of Na+ as well as focusing our discussions on mass concentrations of Cl− displaced from sea salt particles instead of either %Cl− depletion or ratios alone. We consider these to be “semi-unconventional” approaches: a handful of studies have employed at least one of these methods, but they are not commonly used in Cl− depletion studies (based on the 76 studies presented in Table S3 in Su et al., 2022). However, we acknowledge that many works neglect non-sea salt sources of Na+ after determining that crustal contributions are unlikely (e.g., Rastogi et al., 2020; Bondy et al., 2017) or avoid calculating Cl− depletion for particles of a certain size range when anthropogenic sources seem to contribute to Na+ and/or Cl− (e.g., Feng et al., 2017; Nolte et al., 2008). This work builds on past studies to provide an all-encompassing method for quantifying Cl− depletion in air masses influenced by dust and/or combustion emissions as well as relating Cl− losses to their potential effects on atmospheric oxidation processes. We now discuss when, if ever, these methods are of importance for the NWA and provide a few lessons learned for future works interested in using these methods.
3.7.1 Significance of accounting for Na+ in dust
To facilitate understanding of the results below, recall that mass concentrations of quantify the difference in estimating Cl− depletion when dust is considered to be a source of Na+ (Approach 1) versus when Na+ is attributed entirely to sea salt (Approach 2). Median mass concentrations are 0.05, 0.1, 0.09, 0.05, 0.02, and 0.01 µg m−3 (33, 64, 59, 34, 11, and 7 pptv, respectively) for December–February, March, March transit, May, May transit, and June Bermuda, respectively, meaning that Cl− losses are overestimated by a factor of 2.24, 3.38, 1.80, 1.03, 1.01, and 1.01, respectively, when using Approach 2 versus Approach 1. However, even though overestimates are proportionately large for December–February, March, and March transit, it may not be critical to account for dust as a source of Na+ on a seasonal scale (Fig. 6). Specifically, mass concentrations for December–February, March, and March transit (58, 91, and 133 pptv, respectively) are still well below the point where they would significantly accelerate VOC oxidation in the boundary layer. Similarly, Approaches 1 and 2 both lead to the conclusion that depletion reactions in May have the potential to accelerate tropospheric VOC oxidation, while values are too small for May transit and June Bermuda to affect overarching conclusions regarding relationships between Cl− depletion and VOC oxidation rates. However, this study reports mass concentrations of lost Cl− and for particles with ambient diameters < 5 µm, so it is possible that contributions of Na+ from dust particles > 5 µm may be high enough to lead to critical overestimates of Cl− depletion, especially considering that lost Cl− mass concentrations may increase when additionally accounting for depletion in larger sea salt particles.
Although not critically important on a seasonal scale, approaches 1 and 2 produce considerably different estimates of lost Cl− for several flights sampling air masses more heavily influenced by dust. Median bulk Ca2+ mass concentrations are 5.2 and 8.2 times higher on 30 November and 1 December 2021 (RFs 94 and 95, respectively) than the December–February median without corresponding enhancements in bulk Na+, suggesting a higher presence of dust than usual. Using Approach 1, 100 % and 88 % (0.14 and 0.23 µg m−3, respectively) of median bulk Na+ mass concentrations are attributed to dust for 30 November and 1 December (Table S7), respectively, resulting in corrections of lost Cl− of up to 0.63 µg m−3 (420 pptv) compared with overestimates based on Approach 2 (Fig. 7). Dust particles sampled on these flights were likely lofted in smoke plumes extending over the NWA from fires in the eastern and southeastern US. On 3 March 2022 (RFs 131 and 132), median bulk Ca2+ and Na+ mass concentrations are 2.1 and 3.4 times higher, respectively, than categorical medians, as it appears that the NWA was heavily influenced by BB emissions from agricultural fires throughout the eastern US. Although only 15 % of the median bulk Na+ mass concentration is attributed to dust, mass concentrations are as high as 1.05 µg m−3 (700 pptv), with most between 0.11 and 0.32 µg m−3 (73–213 pptv). As mentioned in Sect. 3.3, there is interest in exploring the spatial gradient in bulk Ca2+ along March transit flights (RFs 142 and 143) to see how estimates of Cl− depletion are affected by the transition from a potentially dust-influenced air mass (directly east of LaRC) to one with less dust influence (to the southeast towards Bermuda). Although mass concentrations are lower compared with those of previous case studies, Approach 2 overestimates Cl− depletion more for the air mass closest to the USEC compared with that closest to Bermuda. The air mass with higher bulk Ca2+ mass concentrations appears to be composed of emissions from widespread springtime BB, and the shape of the plume is such over the NWA that the aircraft would fly in it near the USEC but not necessarily near Bermuda. The case studies above suggest that Cl− depletion can be considerably overestimated in smoke plumes when using Approach 2, as entrained dust particles can contribute meaningfully to bulk Na+ mass concentrations, and that these overestimates may be of consequence when relating Cl− depletion to potential increases in VOC oxidation over the region. Median Ca2+ mass concentrations are 3 times higher (0.21 µg m−3) than the June Bermuda median on 11 June 2022 (RFs 172 and 173) without similar enhancements in bulk Na+, suggesting that increases in bulk Ca2+ are likely due to African dust sampling (as opposed to increased sea salt mass concentrations). The arrival of African dust near Bermuda results in overestimates of lost Cl− up to 0.315 µg m−3 (210 pptv) via Approach 2, which are not large enough to affect predictions for potential increases in rates of tropospheric VOC oxidation. Sampling ended near the beginning of the peak season for long-range transport of African dust to the NWA (e.g., Prospero, 1996; Zuidema et al., 2019), so we do not have many flights to choose from for studying the effects of African dust plumes on Cl− depletion calculations. Using 6300 ppm as a mass ratio of Na+ in dust particles (Seinfeld and Pandis, 2016), 131.54 and 73.66 µg m−3 of dust would be necessary to cause critical overestimates of lost Cl− (i.e., values would reach 1.5 µg m−3 using Approach 2) assuming that 0 and 0.66 µg m−3 of Cl− were already being displaced from sea salt particles, respectively (note that 0.66 µg m−3 is the median lost Cl− value for June Bermuda). Edwards et al. (2021) reported peak African dust mass concentrations of 73.32 µg m−3 near Miami, Florida, so it may be possible for values to reach these levels over Bermuda, but it would take a relatively large plume. Therefore, it is typically not critical to use Approach 1 when quantifying Cl− depletion near Bermuda, but it may be important to use this approach during strong African dust events.
Furthermore, past works have demonstrated the uptake of precursors to acidic species (e.g., NOx and SO2; Grassian, 2002; Hanisch and Crowley, 2003; Ullerstam et al., 2002), inorganic acids (e.g., H2SO4 and HNO3; Ooki and Uematsu, 2005; Sullivan et al., 2007), organic acids (Al-Hosney et al., 2005; Carlos-Cuellar et al., 2003), and HCl (Zhang and Iwasaka, 2001; Ooki and Uematsu, 2005; Sullivan et al., 2007; Santschi and Rossi, 2006; Sorooshian et al., 2012) on dust particles. Thus, in addition to considering dust as a source of Na+, it may also be important to account for its presence to avoid overestimating Cl− depletion and its impacts on atmospheric oxidation as (i) uptake of acidic species and their precursors may reduce the amounts available for depletion reactions and (ii) deposition of HCl on dust particles may reduce the amount of Cl radical produced following Cl− displacement.
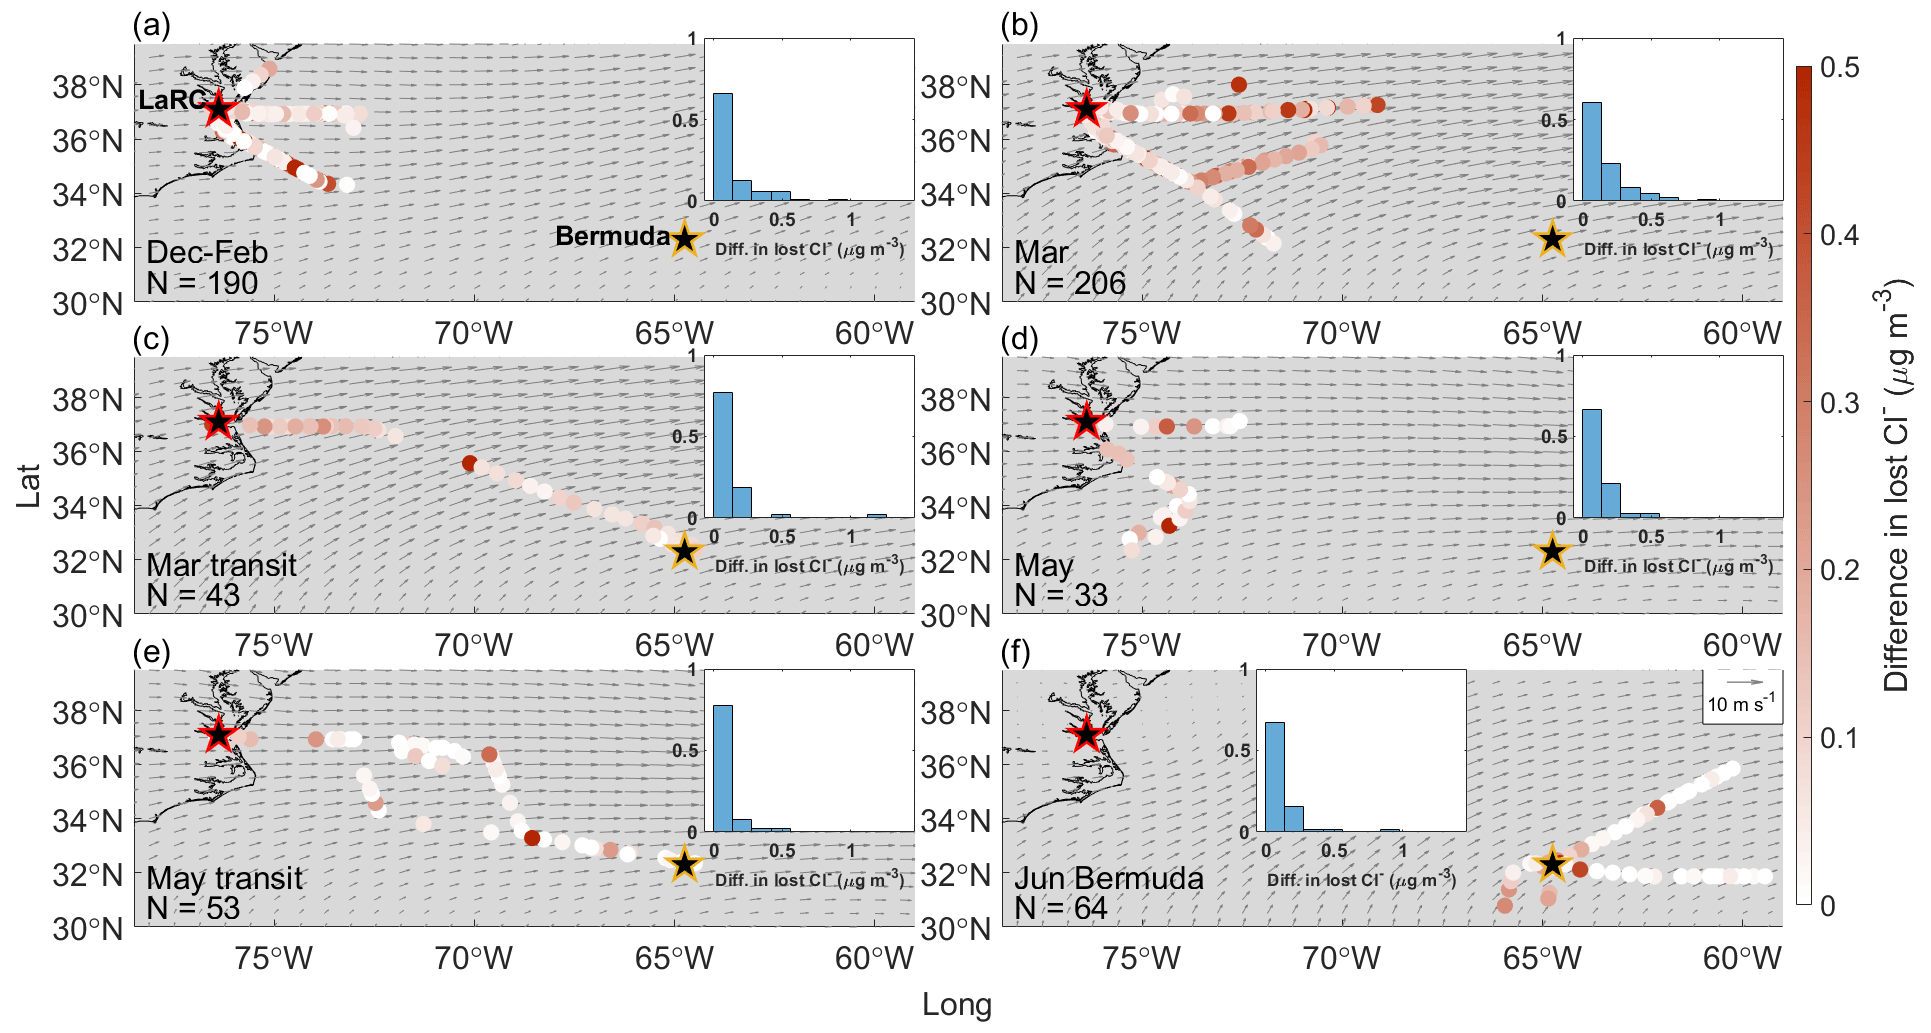
Figure 6Same as Fig. 2 but for differences in lost Cl− when sea salt is assumed to be the only source of bulk Na+ versus when sea salt and dust are both considered to contribute to bulk Na+ mass concentrations.
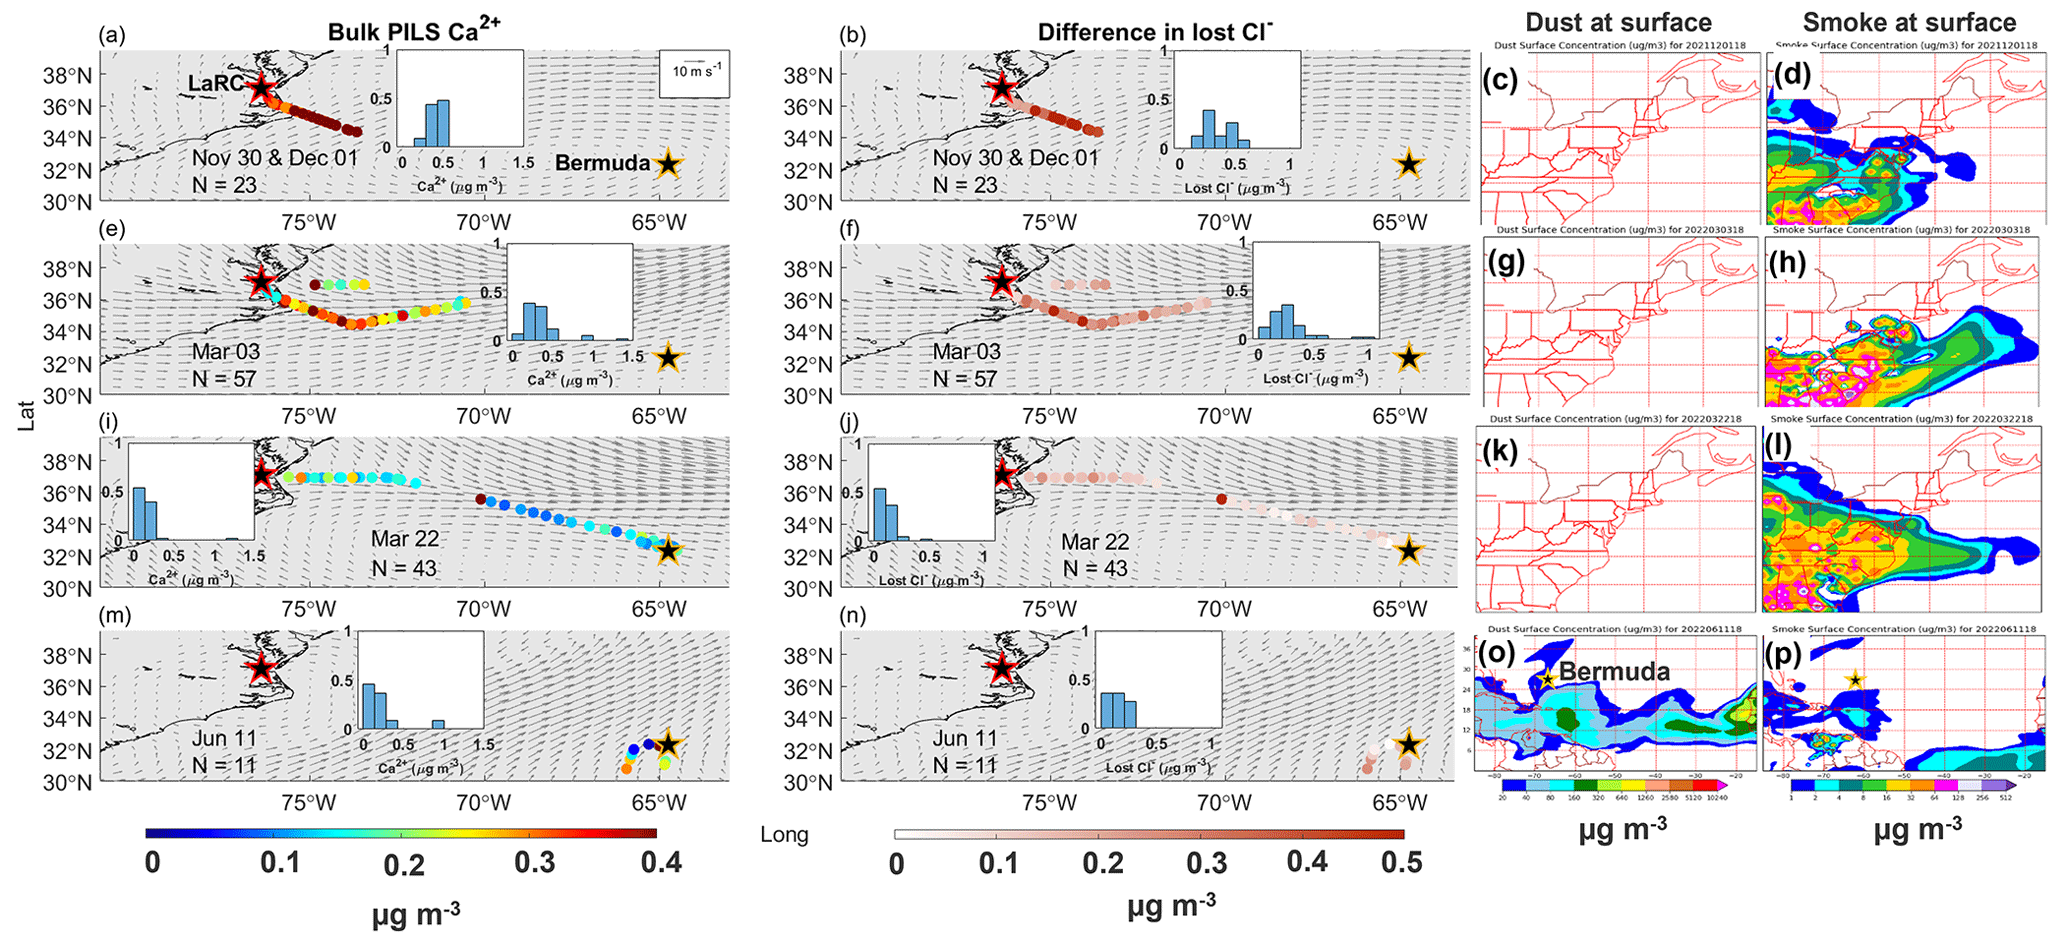
Figure 7Spatial relationships between mass concentrations of (a) bulk PILS Ca2+ and (b) differences in lost Cl− as well as NAAPS reanalysis surface mass concentrations of (c) dust and (d) smoke for the case study on 30 November–1 December 2022 (RFs 94 and 95). The second, third, and fourth rows correspond to case studies on 3 March (RFs 131 and 132), 22 March (RFs 142 and 143), and 11 June (RFs 172 and 173) 2022, respectively, where panels (e), (f), (g), and (h); panels (i), (j), (k), and (l); and panels (m), (n), (o), and (p) display the same respective variables as panels (a), (b), (c), and (d). Normalized histograms for bulk PILS Ca2+ and differences in lost Cl− show the distribution of values for that specific case study, as overlap among the colored dots can hide some from view. Gray arrows indicate the average magnitude and direction of MERRA-2 winds at 950 hPa for the month(s) relevant to each category. The NASA Langley Research Center (LaRC) and Bermuda are marked with red-edged and golden-edged stars, respectively.
3.7.2 Significance of accounting for Na+ in dust and combustion-sourced particles
As shown above, air masses influenced by BB frequently advect over the NWA, especially in March, occasionally increasing dust mass concentrations to levels capable of causing considerable overestimates in Cl− depletion. However, there is little to no effect on Cl− depletion calculations when accounting for contributions to Na+ from combustion particles emitted via agricultural burning and forest fires, as median mass concentrations are 0.00 µg m−3 for all categories (Tables S8 and S9, respectively). Therefore, it may be more important to quantify the contributions of dust as opposed to the combustion-sourced particles in smoke plumes over the NWA to avoid overestimates of Cl− depletion. However, recall that the median bulk K+ mass concentrations for this study are 2 and 14 times lower than values measured in air masses more heavily influenced by (i) agricultural burning (Kacenelenbogen et al., 2022) and (ii) wildfire smoke (Adachi et al., 2022), respectively. Thus, it is possible that quantifying is important for accurate estimates of Cl− depletion in more concentrated BB plumes; however, we cannot explore this with the flights available and leave such an investigation to future studies. When combustion emissions are attributed to industrial operations, residential wood burning in sauna stoves, car exhaust, or coal burning at power plants, there is also no influence on Cl− depletion calculations for any category (i.e., all median values are 0.00 µg m−3; Tables S10–S13). Thus, particles generated by the myriad of combustion processes occurring along the eastern US may be too dilute over the NWA to affect calculations of Cl− depletion not only in air masses reaching Bermuda but also in those much closer to the USEC (e.g., Fig. S12).
As mass concentrations of are typically negligible, Eqs. (1)–(4) and (6)–(13) should provide the same median mass concentrations of ssNa+ and for each category. However, many samples are excluded when using Eqs. (6)–(13), as their K+ mass concentrations are below IC detection limits, causing adjustments in median ssNa+ and values for several categories. Despite the advantages of accounting for non-sea salt sources of Na+, one disadvantage is the potential dataset reduction. For example, 275, 246, 48, 113, 106, and 81 samples provide bulk Na+ mass concentrations for December–February, March, March transit, May, May transit, and June Bermuda, respectively, yet only 202, 220, 48, 64, 75, and 66, respectively, can be used in Eqs. (1)–(4), with even fewer available for use in Eqs. (6)–(13) where concurrent mass concentrations of bulk Na+, Ca2+, and K+ are necessary. Thus, future studies may want to weigh the consequences of neglecting contributions of Na+ from non-sea salt sources versus potential reductions to the number of samples included in statistical analyses.
3.7.3 Significance of focusing on lost Cl− instead of %Cl− depletion
Values of %Cl− depletion display similar trends to lost Cl− mass concentrations, where most percentages are (i) relatively low for December–February, March, and March transit (half are ≤ 10 %, nearly all are ≤ 50 %); (ii) relatively high for May and May transit (nearly all are > 40 %); and (iii) relatively moderate for June Bermuda (values are distributed fairly evenly from 0 % to 30 %, and nearly all are ≤ 60 %, Fig. S13). However, these %Cl− depletion values can only be used to show relative seasonal/categorical differences, and they cannot (i) provide information regarding when Cl− mass transfer is greatest from the particulate to gas phase or (ii) place such depletion reactions in the context of their potential influence on tropospheric VOC oxidation rates. For example, samples with higher %Cl− depletion values can easily be misinterpreted as having greater Cl− losses when, in reality, the opposite may be true. Lost Cl− and %Cl− depletion have a negative correlation for May and May transit, meaning that samples with the least (most) displaced Cl− have the highest (lowest) %Cl− depletion values (Fig. 8). The remaining categories have mostly positive correlations between lost Cl− and %Cl− depletion, although %Cl− depletion values are typically higher for samples with relatively low bulk Na+ mass concentrations at a fixed lost Cl− value. This trend may be due to samples containing sea salt particles with varying size distributions (i.e., lower bulk Na+ mass concentrations may mean smaller sea salt particles were collected in a given sample) and considering that smaller sea salt particles are typically more susceptible to depletion reactions (e.g., Su et al., 2022, and references therein). However, this behavior may also be an artifact of increased sensitivity of %Cl− depletion to samples with relatively small ssNa+ mass concentrations. Many of the samples with mass concentrations of lost Cl− high enough to potentially influence VOC oxidation rates (i.e., lost Cl µg m−3) have %Cl− depletion values < 40 %, while nearly all samples with %Cl− depletion values > 80 % do not have Cl− losses capable of affecting such rates. Thus, we highly recommend that future studies quantify mass concentrations of lost Cl− to make results from depletion studies more suitable for understanding mass exchange between sea salt particles and the surrounding atmosphere and the consequences this can have on rates of tropospheric chemistry and radiative forcing.
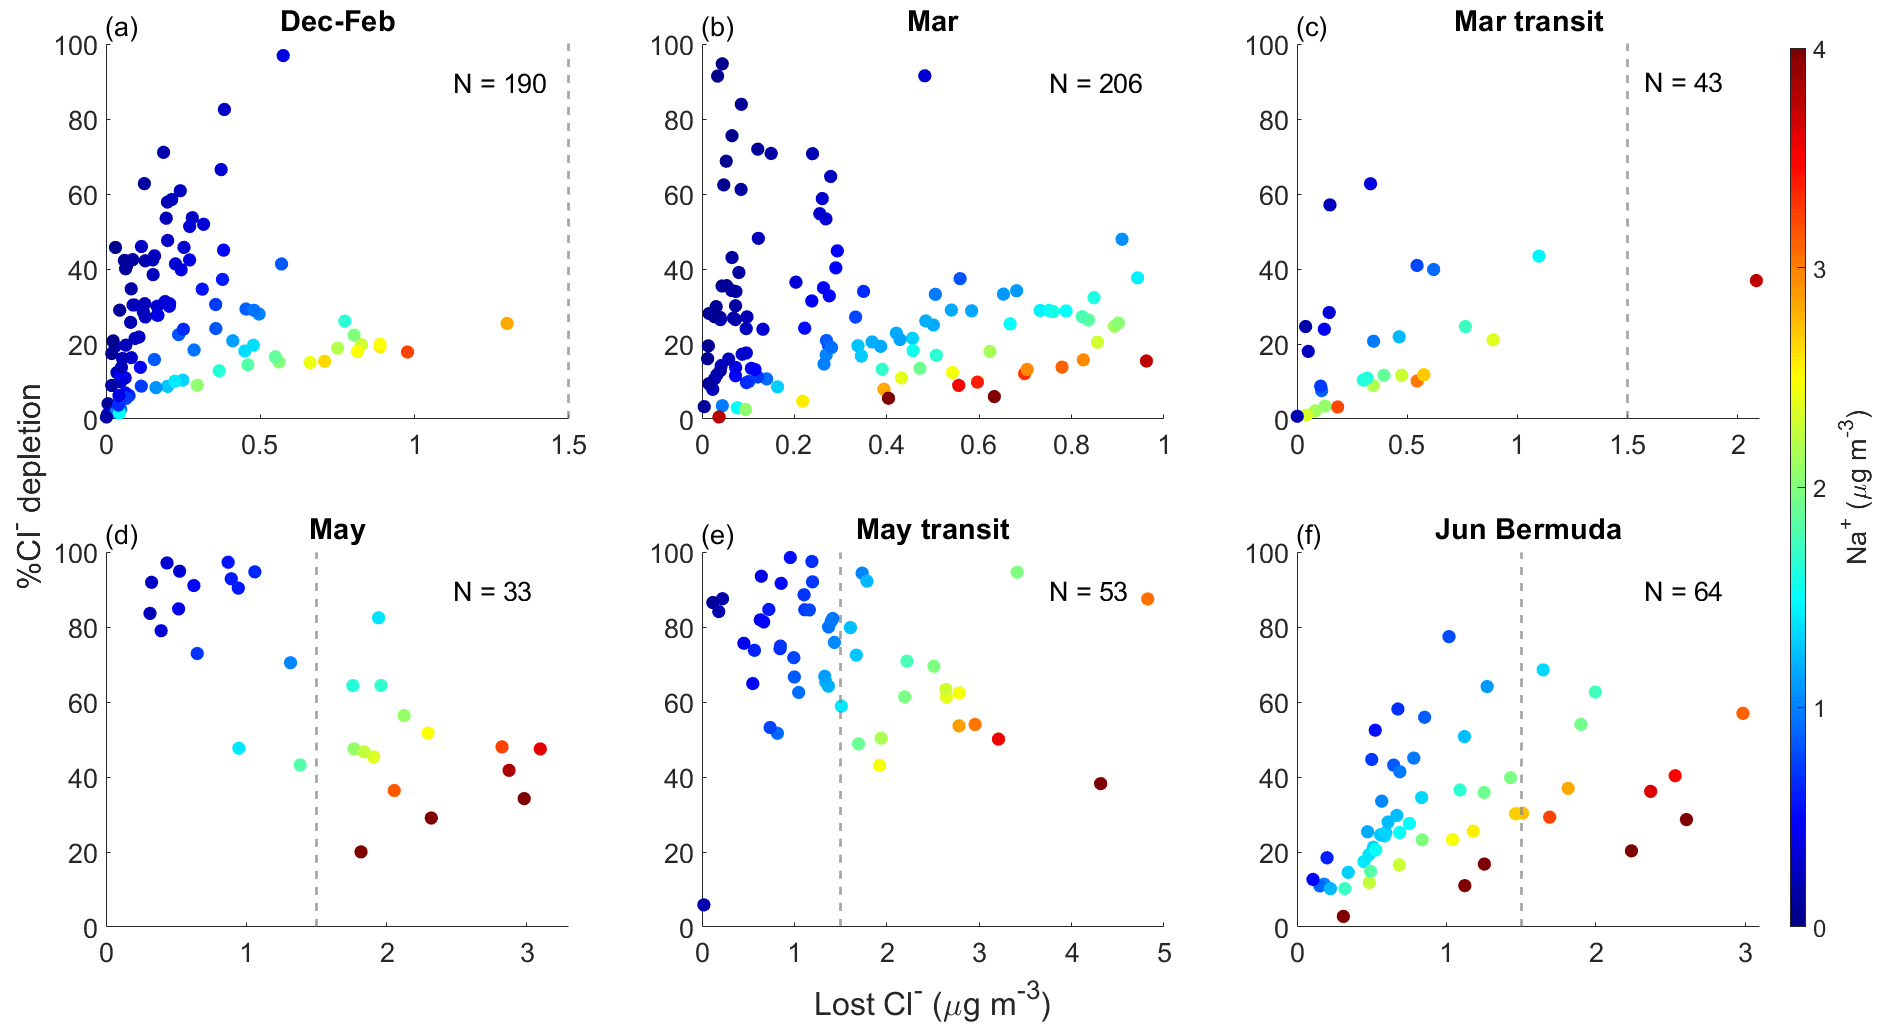
Figure 8Relationships between mass concentrations of lost Cl− and %Cl− depletion for (a) December–February, (b) March, (c) March transit, (d) May, (e) May transit, and (f) June Bermuda. Markers are colored by bulk PILS Na+ mass concentrations, and the vertical dashed gray line in some panels denotes where mass concentrations of lost Cl− may begin to have considerable influence on tropospheric VOC oxidation rates.
This study investigates Cl− depletion in sea salt particles over the NWA from approximately December 2021 to June 2022 using an airborne dataset quantifying the chemical composition of particles < 5 µm among other parameters throughout the lower 3 km of the atmosphere. Trends in bulk PILS Na+ suggest that sea salt mass concentrations (1) do not exhibit seasonal variation but are reduced following the passage of MLCs near the USEC and (2) are higher in the open-ocean environment of Bermuda than along the USEC. Losses of Cl− are greatest in May and least in December–February and March, with median lost Cl− mass concentrations of 1.76, 0.04, and 0.04 µg m−3 (1174, 27, and 27 pptv), respectively. Mass concentrations of measured excess acidic species can account for all the Cl− depletion observed in December–February, March, and June near Bermuda but none in May, suggesting that unmeasured organic acids may be largely responsible for displacement in certain months. Accounting for dust as a source of Na+ is not critical for accurately predicting how Cl− depletion reactions will influence rates of tropospheric VOC oxidation on a seasonal basis, but this may be important for large smoke and dust plumes over the NWA. Combustion-sourced particles do not contribute enough Na+ to meaningfully affect Cl− depletion estimates in any season for the air masses sampled. Finally, quantifying Cl− depletion as a percentage sufficiently captures seasonal trends in depletion processes but fails to convey the effects that they may have on atmospheric oxidation rates.
These results help address several uncertainties regarding Cl− depletion over the NWA and its influence on regional oxidation cycles. First, by identifying factors affecting regional sea salt mass concentrations, we help advance the scientific community towards better understanding and forecasting of regional fluctuations in this major reactive atmospheric Cl reservoir. Additionally, seasonally resolved mass concentrations of lost Cl− reveal that depletion reactions correspond to increases in HCl capable of producing concentrations of Cl radicals sufficient to oxidize 20 %–40 % of non-methane alkanes in the marine troposphere in May, which can have numerous implications (including potentially accelerating O3 production) over this highly populated region. The possibility for dust to cause meaningful overestimates of Cl− depletion is a regionally novel finding and should encourage future studies and modeling efforts to monitor and account for smoke and dust plumes advecting over the NWA when quantifying sea salt reactivity. Additionally, our results reveal the importance of quantifying absolute Cl− losses, as samples with the highest values of %Cl− depletion often have relatively low Cl− losses, and lost Cl− and %Cl− depletion are negatively correlated in May, which is critical to recognize because Cl− depletion has the greatest potential effect on tropospheric VOC oxidation rates during this month compared with all others studied.
Lost Cl− mass concentrations are similar between median values reported in this study and the mean presented in Keene et al. (1990) for summertime conditions around Bermuda (0.66 and 0.68 µg m−3, respectively), while our values also fall within the range observed over Bermuda in spring (0.22–1.35 µg m−3; Keene and Savoie, 1998). Keene et al. (1990) reported lower lost Cl− mass concentrations along the USEC from July to September than our findings in May (1.11 and 1.76 µg m−3, respectively), while our median in May is above the range shared in Keene et al. (2007) for July–August (0–1.31 µg m−3). Haskins et al. (2018) quantified median lost Cl− mass concentrations of 0.30 µg m−3 over the ocean from February to March, which is 7 times higher than our medians for December–February and March (0.04 and 0.04 µg m−3, respectively); however, it should be noted that their study specifically targeted polluted winter air masses, whereas ours did not. Many past works along the North American east coast have been able to attribute Cl− depletion largely to inorganic acids in the summer and fall (Zhao and Gao, 2008; Keene et al., 2007; Nolte et al., 2008; Yao and Zhang, 2012), with Keene et al. (1990) reporting a lowest contribution of 38 %. We can attribute all Cl− depletion to inorganic acids in December–February, March, and June, but we find that inorganic acids do not contribute at all to displacement reactions in May. Our study suggests that depletion reactions are still occurring to the extent that they were in the 1990s and 2000s over the NWA except that organic acids are possibly becoming increasingly responsible for Cl− displacement, especially in May, although further research is needed to verify this.
Although the ACTIVATE dataset is well equipped to explore seasonal and spatial trends in Cl− depletion over the NWA, there are several caveats and limitations to be mindful of when reviewing our results. Reported mass concentrations of sea salt and lost Cl− should be interpreted as a lower limit due to the size range of particles sampled (< 5 µm). Additionally, calculations for the neutralization of SO and NO by NH combine speciated mass concentrations from two separate instruments, each considering a different size range of particles, meaning that mass concentrations of excess acidic species should be considered to be an upper limit for particles < 5 µm. We recommend accounting for non-sea salt sources of Na+ when appropriate but acknowledge that it may limit statistical analyses, as the procedure for disentangling contributions of various sources to bulk Na+ requires synchronous mass concentrations of multiple species.
Overall, this study presents an updated account of sea salt reactivity over the NWA while also providing unprecedented statistics for (i) responses in parameters relevant to Cl− depletion to passing frontal systems; (ii) sea salt particle mass concentrations within the lower 3 km of the atmosphere between the USEC and Bermuda; (iii) the extent of Cl− depletion occurring in a variety of air masses in winter, spring, and early summer; the importance of (iv) accounting for smoke and dust plumes as a source of Na+; and the importance of (v) quantifying Cl− depletion absolutely instead of relatively. Our finding that depletion reactions are extensive enough to alter rates of VOC oxidation along the USEC in May is impactful on multiple levels, ranging from human health to regional radiative forcing, while reporting that inorganic acidic species are not contributing to these losses informs future works and the chemical modeling community that additional acidic species are critical to first identify and then to monitor. Finally, this study reveals the limitations in using traditional methods when quantifying Cl− depletion and will hopefully motivate future works to either be mindful of these limitations or choose alternative methods.
The ACTIVATE dataset can be found at https://doi.org/10.5067/SUBORBITAL/ACTIVATE/DATA001 (ACTIVATE Science Team, 2020). Level-3 (8 d, 4 km resolution) sea surface chlorophyll-a concentrations from MODIS-Aqua can be found at https://doi.org/10.5067/AQUA/MODIS/L3M/CHL/2022 (NASA Goddard Space Flight Center, 2022).
The supplement related to this article is available online at: https://doi.org/10.5194/acp-24-3349-2024-supplement.
YC, ECC, JPD, GSD, CER, MAS, ELW, and LDZ collected and/or prepared the data. ELE conducted the data analysis. ELE, ECC, and AS conducted data interpretation. ELE and AS prepared the manuscript; YC, ECC, JPD, GSD, MAS, ELW, and LDZ edited the manuscript.
At least one of the (co-)authors is a member of the editorial board of Atmospheric Chemistry and Physics. The peer-review process was guided by an independent editor, and the authors also have no other competing interests to declare.
Publisher’s note: Copernicus Publications remains neutral with regard to jurisdictional claims made in the text, published maps, institutional affiliations, or any other geographical representation in this paper. While Copernicus Publications makes every effort to include appropriate place names, the final responsibility lies with the authors.
The authors acknowledge Claire Robinson for her contributions to this study and dedicate this to her. We thank the pilots and aircraft maintenance personnel of NASA Langley Research Services Directorate for successfully conducting ACTIVATE flights and all others who were involved in executing the ACTIVATE campaign.
This work was funded by ACTIVATE, a NASA Earth Venture Suborbital-3 (EVS-3) investigation funded by NASA's Earth Science Division and managed through the Earth System Science Pathfinder Program Office. University of Arizona investigators were funded by NASA (grant no. 80NSSC19K0442) and ONR (grant no. N00014-21-1-2115).
This paper was edited by Daniel Knopf and reviewed by two anonymous referees.
ACTIVATE Science Team: Aerosol Cloud meTeorology Interactions oVer the western ATlantic Experiment Data, NASA [data set], https://doi.org/10.5067/SUBORBITAL/ACTIVATE/DATA001, 2020.
Adachi, K., Dibb, J. E., Scheuer, E., Katich, J. M., Schwarz, J. P., Perring, A. E., Mediavilla, B., Guo, H., Campuzano-Jost, P., Jimenez, J. L., Crawford, J., Soja, A. J., Oshima, N., Kajino, M., Kinase, T., Kleinman, L., Sedlacek III, A. J., Yokelson, R. J., and Buseck, P. R.: Fine Ash-Bearing Particles as a Major Aerosol Component in Biomass Burning Smoke, J. Geophys. Res.-Atmos., 127, e2021JD035657, https://doi.org/10.1029/2021JD035657, 2022.
Akagi, S. K., Yokelson, R. J., Burling, I. R., Meinardi, S., Simpson, I., Blake, D. R., McMeeking, G. R., Sullivan, A., Lee, T., Kreidenweis, S., Urbanski, S., Reardon, J., Griffith, D. W. T., Johnson, T. J., and Weise, D. R.: Measurements of reactive trace gases and variable O3 formation rates in some South Carolina biomass burning plumes, Atmos. Chem. Phys., 13, 1141–1165, https://doi.org/10.5194/acp-13-1141-2013, 2013.
Aldhaif, A. M., Lopez, D. H., Dadashazar, H., and Sorooshian, A.: Sources, frequency, and chemical nature of dust events impacting the United States East Coast, Atmos. Environ., 231, 117456, https://doi.org/10.1016/j.atmosenv.2020.117456, 2020.
Al-Hosney, H. A., Carlos-Cuellar, S., Baltrusaitis, J., and Grassian, V. H.: Heterogeneous uptake and reactivity of formic acid on calcium carbonate particles: a Knudsen cell reactor, FTIR and SEM study, Phys. Chem. Chem. Phys., 7, 3587–3595, https://doi.org/10.1039/B510112C, 2005.
Andreae, M. O. and Merlet, P.: Emission of trace gases and aerosols from biomass burning, Global Biogeochem. Cy., 15, 955–966, https://doi.org/10.1029/2000GB001382, 2001.
Andreae, M. O., Andreae, T. W., Annegarn, H., Beer, J., Cachier, H., Le Canut, P., Elbert, W., Maenhaut, W., Salma, I., Wienhold, F. G., and Zenker, T.: Airborne studies of aerosol emissions from savanna fires in southern Africa: 2. Aerosol chemical composition, J. Geophys. Res.-Atmos., 103, 32119–32128, https://doi.org/10.1029/98JD02280, 1998.
Andreae, M. O., Andreae, T. W., Meyerdierks, D., and Thiel, C.: Marine sulfur cycling and the atmospheric aerosol over the springtime North Atlantic, Chemosphere, 52, 1321–1343, https://doi.org/10.1016/S0045-6535(03)00366-7, 2003.
AzadiAghdam, M., Braun, R. A., Edwards, E.-L., Bañaga, P. A., Cruz, M. T., Betito, G., Cambaliza, M. O., Dadashazar, H., Lorenzo, G. R., Ma, L., MacDonald, A. B., Nguyen, P., Simpas, J. B., Stahl, C., and Sorooshian, A.: On the nature of sea salt aerosol at a coastal megacity: Insights from Manila, Philippines in Southeast Asia, Atmos. Environ., 216, 116922, https://doi.org/10.1016/j.atmosenv.2019.116922, 2019.
Bondy, A. L., Wang, B., Laskin, A., Craig, R. L., Nhliziyo, M. V., Bertman, S. B., Pratt, K. A., Shepson, P. B., and Ault, A. P.: Inland Sea Spray Aerosol Transport and Incomplete Chloride Depletion: Varying Degrees of Reactive Processing Observed during SOAS, Environ. Sci. Technol., 51, 9533–9542, https://doi.org/10.1021/acs.est.7b02085, 2017.
Boreddy, S. K. R. and Kawamura, K.: A 12-year observation of water-soluble ions in TSP aerosols collected at a remote marine location in the western North Pacific: an outflow region of Asian dust, Atmos. Chem. Phys., 15, 6437–6453, https://doi.org/10.5194/acp-15-6437-2015, 2015.
Bowen, H. J. M.: Environmental chemistry of the elements, Academic Press, London, New York, xv, 333 pp., ISBN-10 0121204502, 1979.
Braun, R. A., Dadashazar, H., MacDonald, A. B., Aldhaif, A. M., Maudlin, L. C., Crosbie, E., Aghdam, M. A., Hossein Mardi, A., and Sorooshian, A.: Impact of Wildfire Emissions on Chloride and Bromide Depletion in Marine Aerosol Particles, Environ. Sci. Technol., 51, 9013–9021, https://doi.org/10.1021/acs.est.7b02039, 2017.
Braun, R. A., McComiskey, A., Tselioudis, G., Tropf, D., and Sorooshian, A.: Cloud, Aerosol, and Radiative Properties Over the Western North Atlantic Ocean, J. Geophys. Res.-Atmos., 126, e2020JD034113, https://doi.org/10.1029/2020JD034113, 2021.
Buchholz, R. R., Worden, H. M., Park, M., Francis, G., Deeter, M. N., Edwards, D. P., Emmons, L. K., Gaubert, B., Gille, J., Martínez-Alonso, S., Tang, W., Kumar, R., Drummond, J. R., Clerbaux, C., George, M., Coheur, P.-F., Hurtmans, D., Bowman, K. W., Luo, M., Payne, V. H., Worden, J. R., Chin, M., Levy, R. C., Warner, J., Wei, Z., and Kulawik, S. S.: Air pollution trends measured from Terra: CO and AOD over industrial, fire-prone, and background regions, Remote Sens. Environ., 256, 112275, https://doi.org/10.1016/j.rse.2020.112275, 2021.
Cao, F., Zhang, S.-C., Kawamura, K., and Zhang, Y.-L.: Inorganic markers, carbonaceous components and stable carbon isotope from biomass burning aerosols in Northeast China, Sci. Total Environ., 572, 1244–1251, https://doi.org/10.1016/j.scitotenv.2015.09.099, 2016.
Carlos-Cuellar, S., Li, P., Christensen, A. P., Krueger, B. J., Burrichter, C., and Grassian, V. H.: Heterogeneous Uptake Kinetics of Volatile Organic Compounds on Oxide Surfaces Using a Knudsen Cell Reactor: Adsorption of Acetic Acid, Formaldehyde, and Methanol on á-Fe2O3, á-Al2O3, and SiO2, J. Phys. Chem. A, 107, 4250–4261, https://doi.org/10.1021/jp0267609, 2003.
Chameides, W. L. and Stelson, A. W.: Reply [to “Comment on `Aqueous phase chemical processes in deliquescent sea-salt aerosols: A mechanism that couples the atmospheric cycles of S and sea salt' by W. L. Chameides and A. W. Stelson”], J. Geophys. Res.-Atmos., 98, 9051–9054, https://doi.org/10.1029/93JD00310, 1993.
Chatterjee, A., Dutta, M., Ghosh, A., Ghosh, S. K., and Roy, A.: Relative role of black carbon and sea-salt aerosols as cloud condensation nuclei over a high altitude urban atmosphere in eastern Himalaya, Sci. Total Environ., 742, 140468, https://doi.org/10.1016/j.scitotenv.2020.140468, 2020.
Chen, Z., Liu, P., Liu, Y., and Zhang, Y.-H.: Strong Acids or Bases Displaced by Weak Acids or Bases in Aerosols: Reactions Driven by the Continuous Partitioning of Volatile Products into the Gas Phase, Acc. Chem. Res., 54, 3667–3678, https://doi.org/10.1021/acs.accounts.1c00318, 2021.
Cooper, O. R., Moody, J. L., Parrish, D. D., Trainer, M., Ryerson, T. B., Holloway, J. S., Hübler, G., Fehsenfeld, F. C., Oltmans, S. J., and Evans, M. J.: Trace gas signatures of the airstreams within North Atlantic cyclones: Case studies from the North Atlantic Regional Experiment (NARE '97) aircraft intensive, J. Geophys. Res.-Atmos., 106, 5437–5456, https://doi.org/10.1029/2000JD900574, 2001.
Cooper, O. R., Moody, J. L., Parrish, D. D., Trainer, M., Holloway, J. S., Hübler, G., Fehsenfeld, F. C., and Stohl, A.: Trace gas composition of midlatitude cyclones over the western North Atlantic Ocean: A seasonal comparison of O3 and CO, J. Geophys. Res.-Atmos., 107, ACH 2-1-ACH 2-12, https://doi.org/10.1029/2001JD000902, 2002.
Corral, A. F., Braun, R. A., Cairns, B., Gorooh, V. A., Liu, H., Ma, L., Mardi, A. H., Painemal, D., Stamnes, S., van Diedenhoven, B., Wang, H., Yang, Y., Zhang, B., and Sorooshian, A.: An Overview of Atmospheric Features Over the Western North Atlantic Ocean and North American East Coast – Part 1: Analysis of Aerosols, Gases, and Wet Deposition Chemistry, J. Geophys. Res.-Atmos., 126, e2020JD032592, https://doi.org/10.1029/2020JD032592, 2021.
Corral, A. F., Choi, Y., Collister, B. L., Crosbie, E., Dadashazar, H., DiGangi, J. P., Diskin, G. S., Fenn, M., Kirschler, S., Moore, R. H., Nowak, J. B., Shook, M. A., Stahl, C. T., Shingler, T., Thornhill, K. L., Voigt, C., Ziemba, L. D., and Sorooshian, A.: Dimethylamine in cloud water: a case study over the northwest Atlantic Ocean, Environ. Sci.-Atmos., 2, 1534–1550, https://doi.org/10.1039/D2EA00117A, 2022.
Crosbie, E., Shook, M. A., Ziemba, L. D., Anderson, B. E., Braun, R. A., Brown, M. D., Jordan, C. E., MacDonald, A. B., Moore, R. H., Nowak, J. B., Robinson, C. E., Shingler, T., Sorooshian, A., Stahl, C., Thornhill, K. L., Wiggins, E. B., and Winstead, E.: Coupling an online ion conductivity measurement with the particle-into-liquid sampler: Evaluation and modeling using laboratory and field aerosol data, Aerosol Sci. Technol., 54, 1542–1555, https://doi.org/10.1080/02786826.2020.1795499, 2020.
Crosbie, E., Ziemba, L. D., Shook, M. A., Robinson, C. E., Winstead, E. L., Thornhill, K. L., Braun, R. A., MacDonald, A. B., Stahl, C., Sorooshian, A., van den Heever, S. C., DiGangi, J. P., Diskin, G. S., Woods, S., Bañaga, P., Brown, M. D., Gallo, F., Hilario, M. R. A., Jordan, C. E., Leung, G. R., Moore, R. H., Sanchez, K. J., Shingler, T. J., and Wiggins, E. B.: Measurement report: Closure analysis of aerosol–cloud composition in tropical maritime warm convection, Atmos. Chem. Phys., 22, 13269–13302, https://doi.org/10.5194/acp-22-13269-2022, 2022.
Cruz, M. T., Bañaga, P. A., Betito, G., Braun, R. A., Stahl, C., Aghdam, M. A., Cambaliza, M. O., Dadashazar, H., Hilario, M. R., Lorenzo, G. R., Ma, L., MacDonald, A. B., Pabroa, P. C., Yee, J. R., Simpas, J. B., and Sorooshian, A.: Size-resolved composition and morphology of particulate matter during the southwest monsoon in Metro Manila, Philippines, Atmos. Chem. Phys., 19, 10675–10696, https://doi.org/10.5194/acp-19-10675-2019, 2019.
Dadashazar, H., Alipanah, M., Hilario, M. R. A., Crosbie, E., Kirschler, S., Liu, H., Moore, R. H., Peters, A. J., Scarino, A. J., Shook, M., Thornhill, K. L., Voigt, C., Wang, H., Winstead, E., Zhang, B., Ziemba, L., and Sorooshian, A.: Aerosol responses to precipitation along North American air trajectories arriving at Bermuda, Atmos. Chem. Phys., 21, 16121–16141, https://doi.org/10.5194/acp-21-16121-2021, 2021.
Dang, C., Segal-Rozenhaimer, M., Che, H., Zhang, L., Formenti, P., Taylor, J., Dobracki, A., Purdue, S., Wong, P.-S., Nenes, A., Sedlacek III, A., Coe, H., Redemann, J., Zuidema, P., Howell, S., and Haywood, J.: Biomass burning and marine aerosol processing over the southeast Atlantic Ocean: a TEM single-particle analysis, Atmos. Chem. Phys., 22, 9389–9412, https://doi.org/10.5194/acp-22-9389-2022, 2022.
Davis, R. E., Hayden, B. P., Gay, D. A., Phillips, W. L., and Jones, G. V.: The North Atlantic Subtropical Anticyclone, J. Climate, 10, 728–744, https://doi.org/10.1175/1520-0442(1997)010<0728:TNASA>2.0.CO;2, 1997.
DeCarlo, P. F., Dunlea, E. J., Kimmel, J. R., Aiken, A. C., Sueper, D., Crounse, J., Wennberg, P. O., Emmons, L., Shinozuka, Y., Clarke, A., Zhou, J., Tomlinson, J., Collins, D. R., Knapp, D., Weinheimer, A. J., Montzka, D. D., Campos, T., and Jimenez, J. L.: Fast airborne aerosol size and chemistry measurements above Mexico City and Central Mexico during the MILAGRO campaign, Atmos. Chem. Phys., 8, 4027–4048, https://doi.org/10.5194/acp-8-4027-2008, 2008.
DiGangi, J. P., Choi, Y., Nowak, J. B., Halliday, H. S., Diskin, G. S., Feng, S., Barkley, Z. R., Lauvaux, T., Pal, S., Davis, K. J., Baier, B. C., and Sweeney, C.: Seasonal Variability in Local Carbon Dioxide Biomass Burning Sources Over Central and Eastern US Using Airborne In Situ Enhancement Ratios, J. Geophys. Res.-Atmos., 126, e2020JD034525, https://doi.org/10.1029/2020JD034525, 2021.
Diskin, G. S., Podolske, J. R., Sachse, G. W., and Slate, T. A.: Open-path airborne tunable diode laser hygrometer, in: Diode Lasers and Applications in Atmospheric Sensing, Diode Lasers and Applications in Atmospheric Sensing, 196–204 pp., https://doi.org/10.1117/12.453736, 2002.
Drozd, G., Woo, J., Häkkinen, S. A. K., Nenes, A., and McNeill, V. F.: Inorganic salts interact with oxalic acid in submicron particles to form material with low hygroscopicity and volatility, Atmos. Chem. Phys., 14, 5205–5215, https://doi.org/10.5194/acp-14-5205-2014, 2014.
Echalar, F., Gaudichet, A., Cachier, H., and Artaxo, P.: Aerosol emissions by tropical forest and savanna biomass burning: Characteristic trace elements and fluxes, Geophys. Res. Lett., 22, 3039–3042, https://doi.org/10.1029/95GL03170, 1995.
Edwards, E.-L., Corral, A. F., Dadashazar, H., Barkley, A. E., Gaston, C. J., Zuidema, P., and Sorooshian, A.: Impact of various air mass types on cloud condensation nuclei concentrations along coastal southeast Florida, Atmos. Environ., 254, 118371, https://doi.org/10.1016/j.atmosenv.2021.118371, 2021.
Eichler, T. and Higgins, W.: Climatology and ENSO-Related Variability of North American Extratropical Cyclone Activity, J. Climate, 19, 2076–2093, https://doi.org/10.1175/JCLI3725.1, 2006.
Faxon, C. B. and Allen, D. T.: Chlorine chemistry in urban atmospheres: a review, Environ. Chem., 10, 221–233, https://doi.org/10.1071/EN13026, 2013.
Fehsenfeld, F. C., Ancellet, G., Bates, T. S., Goldstein, A. H., Hardesty, R. M., Honrath, R., Law, K. S., Lewis, A. C., Leaitch, R., McKeen, S., Meagher, J., Parrish, D. D., Pszenny, A. A. P., Russell, P. B., Schlager, H., Seinfeld, J., Talbot, R., and Zbinden, R.: International Consortium for Atmospheric Research on Transport and Transformation (ICARTT): North America to Europe – Overview of the 2004 summer field study, J. Geophys. Res.-Atmos., 111, D23S01, https://doi.org/10.1029/2006JD007829, 2006.
Feng, J., Chan, E., and Vet, R.: Air quality in the eastern United States and Eastern Canada for 1990–2015: 25 years of change in response to emission reductions of SO2 and NOx in the region, Atmos. Chem. Phys., 20, 3107–3134, https://doi.org/10.5194/acp-20-3107-2020, 2020.
Feng, L., Shen, H., Zhu, Y., Gao, H., and Yao, X.: Insight into Generation and Evolution of Sea-Salt Aerosols from Field Measurements in Diversified Marine and Coastal Atmospheres, Sci. Rep., 7, 41260, https://doi.org/10.1038/srep41260, 2017.
Ferrare, R., Hair, J., Hostetler, C., Shingler, T., Burton, S. P., Fenn, M., Clayton, M., Scarino, A. J., Harper, D., Seaman, S., Cook, A., Crosbie, E., Winstead, E., Ziemba, L., Thornhill, L., Robinson, C., Moore, R., Vaughan, M., Sorooshian, A., Schlosser, J. S., Liu, H., Zhang, B., Diskin, G., DiGangi, J., Nowak, J., Choi, Y., Zuidema, P., and Chellappan, S.: Airborne HSRL-2 measurements of elevated aerosol depolarization associated with non-spherical sea salt, Front. Remote Sens., 4, 01–18, https://doi.org/10.3389/frsen.2023.1143944, 2023.
Finlayson-Pitts, B. J. and Pitts, J. N.: CHAPTER 9 – Particles in the Troposphere, in: Chemistry of the Upper and Lower Atmosphere, edited by: Finlayson-Pitts, B. J. and Pitts, J. N., Academic Press, San Diego, 349–435, https://doi.org/10.1016/B978-012257060-5/50011-3, 2000.
Galloway, J. N., Savoie, D. L., Keene, W. C., and Prospero, J. M.: The temporal and spatial variability of scavenging ratios for NSS sulfate, nitrate, methanesulfonate and sodium in the Atmosphere over the North Atalantic Ocean, Atmos. Environ. A, 27, 235–250, https://doi.org/10.1016/0960-1686(93)90354-2, 1993.
Gelaro, R., McCarty, W., Suárez, M. J., Todling, R., Molod, A., Takacs, L., Randles, C. A., Darmenov, A., Bosilovich, M. G., Reichle, R., Wargan, K., Coy, L., Cullather, R., Draper, C., Akella, S., Buchard, V., Conaty, A., Silva, A. M. da, Gu, W., Kim, G.-K., Koster, R., Lucchesi, R., Merkova, D., Nielsen, J. E., Partyka, G., Pawson, S., Putman, W., Rienecker, M., Schubert, S. D., Sienkiewicz, M., and Zhao, B.: The Modern-Era Retrospective Analysis for Research and Applications, Version 2 (MERRA-2), J. Climate, 30, 5419–5454, https://doi.org/10.1175/JCLI-D-16-0758.1, 2017.
Ghorai, S., Wang, B., Tivanski, A., and Laskin, A.: Hygroscopic Properties of Internally Mixed Particles Composed of NaCl and Water-Soluble Organic Acids, Environ. Sci. Technol., 48, 2234–2241, https://doi.org/10.1021/es404727u, 2014.
Grandey, B. S., Stier, P., Wagner, T. M., Grainger, R. G., and Hodges, K. I.: The effect of extratropical cyclones on satellite-retrieved aerosol properties over ocean, Geophys. Res. Lett., 38, L13805, https://doi.org/10.1029/2011GL047703, 2011.
Grassian, V. H.: Chemical Reactions of Nitrogen Oxides on the Surface of Oxide, Carbonate, Soot, and Mineral Dust Particles: Implications for the Chemical Balance of the Troposphere, J. Phys. Chem. A, 106, 860–877, https://doi.org/10.1021/jp012139h, 2002.
Hanisch, F. and Crowley, J. N.: Heterogeneous reactivity of NO and HNO3 on mineral dust in the presence of ozone, Phys. Chem. Chem. Phys., 5, 883–887, https://doi.org/10.1039/B211503D, 2003.
Haskins, J. D., Jaeglé, L., Shah, V., Lee, B. H., Lopez-Hilfiker, F. D., Campuzano-Jost, P., Schroder, J. C., Day, D. A., Guo, H., Sullivan, A. P., Weber, R., Dibb, J., Campos, T., Jimenez, J. L., Brown, S. S., and Thornton, J. A.: Wintertime Gas-Particle Partitioning and Speciation of Inorganic Chlorine in the Lower Troposphere Over the Northeast United States and Coastal Ocean, J. Geophys. Res.-Atmos., 123, 12897–12916, https://doi.org/10.1029/2018JD028786, 2018.
Hawcroft, M. K., Shaffrey, L. C., Hodges, K. I., and Dacre, H. F.: How much Northern Hemisphere precipitation is associated with extratropical cyclones?, Geophys. Res. Lett., 39, L24809, https://doi.org/10.1029/2012GL053866, 2012.
Hilario, M. R. A., Crosbie, E., Bañaga, P. A., Betito, G., Braun, R. A., Cambaliza, M. O., Corral, A. F., Cruz, M. T., Dibb, J. E., Lorenzo, G. R., MacDonald, A. B., Robinson, C. E., Shook, M. A., Simpas, J. B., Stahl, C., Winstead, E., Ziemba, L. D., and Sorooshian, A.: Particulate Oxalate-To-Sulfate Ratio as an Aqueous Processing Marker: Similarity Across Field Campaigns and Limitations, Geophys. Res. Lett., 48, e2021GL096520, https://doi.org/10.1029/2021GL096520, 2021.
Hogan, T. F., Liu, M., Ridout, J. A., Peng, M. S., Whitcomb, T. R., Ruston, B. C., Reynolds, C. A., Eckermann, S. D., Moskaitis, J. R., Baker, N. L., McCORMACK, J. P., Viner, K. C., McLAY, J. G., Flatau, M. K., Xu, L., Chen, C., and Chang, S. W.: The Navy Global Environmental Model, Oceanography, 27, 116–125, https://doi.org/10.5670/oceanog.2014.73, 2014.
Huang, X., Olmez, I., Aras, N. K., and Gordon, G. E.: Emissions of trace elements from motor vehicles: Potential marker elements and source composition profile, Atmos. Environ., 28, 1385–1391, https://doi.org/10.1016/1352-2310(94)90201-1, 1994.
Hyer, E. J., Reid, J. S., Prins, E. M., Hoffman, J. P., Schmidt, C. C., Miettinen, J. I., and Giglio, L.: Patterns of fire activity over Indonesia and Malaysia from polar and geostationary satellite observations, Atmos. Res., 122, 504–519, https://doi.org/10.1016/j.atmosres.2012.06.011, 2013.
Jaffe, D. A., O'Neill, S. M., Larkin, N. K., Holder, A. L., Peterson, D. L., Halofsky, J. E., and Rappold, A. G.: Wildfire and prescribed burning impacts on air quality in the United States, J. Air Waste Manage. Assoc., 70, 583–615, https://doi.org/10.1080/10962247.2020.1749731, 2020.
Jing, B., Peng, C., Wang, Y., Liu, Q., Tong, S., Zhang, Y., and Ge, M.: Hygroscopic properties of potassium chloride and its internal mixtures with organic compounds relevant to biomass burning aerosol particles, Sci. Rep., 7, 43572, https://doi.org/10.1038/srep43572, 2017.
Kacenelenbogen, M. S. F., Tan, Q., Burton, S. P., Hasekamp, O. P., Froyd, K. D., Shinozuka, Y., Beyersdorf, A. J., Ziemba, L., Thornhill, K. L., Dibb, J. E., Shingler, T., Sorooshian, A., Espinosa, R. W., Martins, V., Jimenez, J. L., Campuzano-Jost, P., Schwarz, J. P., Johnson, M. S., Redemann, J., and Schuster, G. L.: Identifying chemical aerosol signatures using optical suborbital observations: how much can optical properties tell us about aerosol composition?, Atmos. Chem. Phys., 22, 3713–3742, https://doi.org/10.5194/acp-22-3713-2022, 2022.
Kavouras, I. G., Nikolich, G., Etyemezian, V., DuBois, D. W., King, J., and Shafer, D.: In situ observations of soil minerals and organic matter in the early phases of prescribed fires, J. Geophys. Res.-Atmos., 117, D12313, https://doi.org/10.1029/2011JD017420, 2012.
Keene, W. C. and Savoie, D. L.: The pH of deliquesced sea-salt aerosol in polluted marine air, Geophys. Res. Lett., 25, 2181–2184, https://doi.org/10.1029/98GL01591, 1998.
Keene, W. C., Pszenny, A. A. P., Jacob, D. J., Duce, R. A., Galloway, J. N., Schultz-Tokos, J. J., Sievering, H., and Boatman, J. F.: The geochemical cycling of reactive chlorine through the marine troposphere, Global Biogeochem. Cy., 4, 407–430, https://doi.org/10.1029/GB004i004p00407, 1990.
Keene, W. C., Khalil, M. A. K., Erickson III, David. J., McCulloch, A., Graedel, T. E., Lobert, J. M., Aucott, M. L., Gong, S. L., Harper, D. B., Kleiman, G., Midgley, P., Moore, R. M., Seuzaret, C., Sturges, W. T., Benkovitz, C. M., Koropalov, V., Barrie, L. A., and Li, Y. F.: Composite global emissions of reactive chlorine from anthropogenic and natural sources: Reactive Chlorine Emissions Inventory, J. Geophys. Res-.Atmos., 104, 8429–8440, https://doi.org/10.1029/1998JD100084, 1999.
Keene, W. C., Pszenny, A. A. P., Maben, J. R., Stevenson, E., and Wall, A.: Closure evaluation of size-resolved aerosol pH in the New England coastal atmosphere during summer, J. Geophys. Res.-Atmos., 109, D23307, https://doi.org/10.1029/2004JD004801, 2004.
Keene, W. C., Stutz, J., Pszenny, A. A. P., Maben, J. R., Fischer, E. V., Smith, A. M., von Glasow, R., Pechtl, S., Sive, B. C., and Varner, R. K.: Inorganic chlorine and bromine in coastal New England air during summer, J. Geophys. Res.-Atmos., 112, D10S12, https://doi.org/10.1029/2006JD007689, 2007.
Keim, B. D., Meeker, L. D., and Slater, J. F.: Manual synoptic climate classification for the east coast of New England (USA) with an application to PM2.5 concentration, Clim. Res., 28, 143–153, https://doi.org/10.3354/cr028143, 2005.
Kerminen, V.-M., Teinilä, K., Hillamo, R., and Pakkanen, T.: Substitution of chloride in sea-salt particles by inorganic and organic anions, J. Aerosol Sci., 29, 929–942, https://doi.org/10.1016/S0021-8502(98)00002-0, 1998.
Knipping, E. M. and Dabdub, D.: Impact of Chlorine Emissions from Sea-Salt Aerosol on Coastal Urban Ozone, Environ. Sci. Technol., 37, 275–284, https://doi.org/10.1021/es025793z, 2003.
Kong, S., Wen, B., Chen, K., Yin, Y., Li, L., Li, Q., Yuan, L., Li, X., and Sun, X.: Ion chemistry for atmospheric size-segregated aerosol and depositions at an offshore site of Yangtze River Delta region, China, Atmos. Res., 147–148, 205–226, https://doi.org/10.1016/j.atmosres.2014.05.018, 2014.
Kuklinska, K., Wolska, L., and Namiesnik, J.: Air quality policy in the U.S. and the EU – a review, Atmos. Pollut. Res., 6, 129–137, https://doi.org/10.5094/APR.2015.015, 2015.
Lamberg, H., Nuutinen, K., Tissari, J., Ruusunen, J., Yli-Pirilä, P., Sippula, O., Tapanainen, M., Jalava, P., Makkonen, U., Teinilä, K., Saarnio, K., Hillamo, R., Hirvonen, M.-R., and Jokiniemi, J.: Physicochemical characterization of fine particles from small-scale wood combustion, Atmos. Environ., 45, 7635–7643, https://doi.org/10.1016/j.atmosenv.2011.02.072, 2011.
Laskin, A., Moffet, R. C., Gilles, M. K., Fast, J. D., Zaveri, R. A., Wang, B., Nigge, P., and Shutthanandan, J.: Tropospheric chemistry of internally mixed sea salt and organic particles: Surprising reactivity of NaCl with weak organic acids, J. Geophys. Res.-Atmos., 117, D15302, https://doi.org/10.1029/2012JD017743, 2012.
Li, J., Pósfai, M., Hobbs, P. V., and Buseck, P. R.: Individual aerosol particles from biomass burning in southern Africa: 2, Compositions and aging of inorganic particles, J. Geophys. Res.-Atmos., 108, 8484, https://doi.org/10.1029/2002JD002310, 2003.
Lippmann, M.: HEALTH EFFECTS OF OZONE A Critical Review, JAPCA, 39, 672–695, https://doi.org/10.1080/08940630.1989.10466554, 1989.
Luria, M., Van Valin, C. C., Galloway, J. N., Keene, W. C., Wellman, D. L., Sievering, H., and Boatman, J. F.: The relationship between dimethyl sulfide and particulate sulfate in the mid-atlantic ocean atmosphere, Atmos. Environ., 23, 139–147, https://doi.org/10.1016/0004-6981(89)90106-6, 1989.
Lynch, P., Reid, J. S., Westphal, D. L., Zhang, J., Hogan, T. F., Hyer, E. J., Curtis, C. A., Hegg, D. A., Shi, Y., Campbell, J. R., Rubin, J. I., Sessions, W. R., Turk, F. J., and Walker, A. L.: An 11-year global gridded aerosol optical thickness reanalysis (v1.0) for atmospheric and climate sciences, Geosci. Model Dev., 9, 1489–1522, https://doi.org/10.5194/gmd-9-1489-2016, 2016.
Mardi, A. H., Dadashazar, H., Painemal, D., Shingler, T., Seaman, S. T., Fenn, M. A., Hostetler, C. A., and Sorooshian, A.: Biomass Burning Over the United States East Coast and Western North Atlantic Ocean: Implications for Clouds and Air Quality, J. Geophys. Res.-Atmos., 126, e2021JD034916, https://doi.org/10.1029/2021JD034916, 2021.
Maudlin, L. C., Wang, Z., Jonsson, H. H., and Sorooshian, A.: Impact of wildfires on size-resolved aerosol composition at a coastal California site, Atmos. Environ., 119, 59–68, https://doi.org/10.1016/j.atmosenv.2015.08.039, 2015.
McCarty, J. L., Justice, C. O., and Korontzi, S.: Agricultural burning in the Southeastern United States detected by MODIS, Remote Sens. Environ., 108, 151–162, https://doi.org/10.1016/j.rse.2006.03.020, 2007.
McNaughton, C. S., Clarke, A. D., Howell, S. G., Pinkerton, M., Anderson, B., Thornhill, L., Hudgins, C., Winstead, E., Dibb, J. E., Scheuer, E., and Maring, H.: Results from the DC-8 Inlet Characterization Experiment (DICE): Airborne Versus Surface Sampling of Mineral Dust and Sea Salt Aerosols, Aerosol Sci. Technol., 41, 136–159, https://doi.org/10.1080/02786820601118406, 2007.
Moffet, R. C., Desyaterik, Y., Hopkins, R. J., Tivanski, A. V., Gilles, M. K., Wang, Y., Shutthanandan, V., Molina, L. T., Abraham, R. G., Johnson, K. S., Mugica, V., Molina, M. J., Laskin, A., and Prather, K. A.: Characterization of aerosols containing Zn, Pb, and Cl from an industrial region of Mexico City, Environ. Sci. Technol., 42, 7091–7097, https://doi.org/10.1021/es7030483, 2008.
Molina, M. J. and Rowland, F. S.: Stratospheric sink for chlorofluoromethanes: chlorine atom-catalysed destruction of ozone, Nature, 249, 810–812, https://doi.org/10.1038/249810a0, 1974.
Naeher, L. P., Smith, K. R., Leaderer, B. P., Neufeld, L., and Mage, D. T.: Carbon Monoxide As a Tracer for Assessing Exposures to Particulate Matter in Wood and Gas Cookstove Households of Highland Guatemala, Environ. Sci. Technol., 35, 575–581, https://doi.org/10.1021/es991225g, 2001.
NASA Goddard Space Flight Center: Ocean Ecology Laboratory, Ocean Biology Processing Group. Moderate-resolution Imaging Spectroradiometer (MODIS) Aqua Data, NASA OB.DAAC, Greenbelt, MD, USA, NASA [data set], https://doi.org/10.5067/AQUA/MODIS/L3M/CHL/2022, 2022.
Nolte, C., Bhave, P., Arnold, J., Dennis, R., Zhang, K., and Wexler, A.: Modeling urban and regional aerosols – Application of the CMAQ-UCD Aerosol Model to Tampa, a coastal urban site, Atmos. Environ., 42, 3179–3191, https://doi.org/10.1016/j.atmosenv.2007.12.059, 2008.
Nuvolone, D., Petri, D., and Voller, F.: The effects of ozone on human health, Environ. Sci. Pollut. Res., 25, 8074–8088, https://doi.org/10.1007/s11356-017-9239-3, 2018.
Ondov, J. M., Choquette, C. E., Zoller, W. H., Gordon, G. E., Biermann, A. H., and Heft, R. E.: Atmospheric behavior of trace elements on particles emitted from a coal-fired power plant, Atmos. Environ., 23, 2193–2204, https://doi.org/10.1016/0004-6981(89)90181-9, 1989.
Ooki, A. and Uematsu, M.: Chemical interactions between mineral dust particles and acid gases during Asian dust events, J. Geophys. Res.-Atmos., 110, D03201, https://doi.org/10.1029/2004JD004737, 2005.
Ooki, A., Uematsu, M., Miura, K., and Nakae, S.: Sources of sodium in atmospheric fine particles, Atmos. Environ., 36, 4367–4374, https://doi.org/10.1016/S1352-2310(02)00341-2, 2002.
Osthoff, H. D., Roberts, J. M., Ravishankara, A. R., Williams, E. J., Lerner, B. M., Sommariva, R., Bates, T. S., Coffman, D., Quinn, P. K., Dibb, J. E., Stark, H., Burkholder, J. B., Talukdar, R. K., Meagher, J., Fehsenfeld, F. C., and Brown, S. S.: High levels of nitryl chloride in the polluted subtropical marine boundary layer, Nat. Geosci., 1, 324–328, https://doi.org/10.1038/ngeo177, 2008.
Painemal, D., Corral, A. F., Sorooshian, A., Brunke, M. A., Chellappan, S., Afzali Gorooh, V., Ham, S.-H., O'Neill, L., Smith Jr., W. L., Tselioudis, G., Wang, H., Zeng, X., and Zuidema, P.: An Overview of Atmospheric Features Over the Western North Atlantic Ocean and North American East Coast – Part 2: Circulation, Boundary Layer, and Clouds, J. Geophys. Res.-Atmos., 126, e2020JD033423, https://doi.org/10.1029/2020JD033423, 2021.
Palmer, T. Y.: Large fire winds, gases and smoke, Atmos. Environ., 15, 2079–2090, https://doi.org/10.1016/0004-6981(81)90241-9, 1981.
Panagi, M., Fleming, Z. L., Monks, P. S., Ashfold, M. J., Wild, O., Hollaway, M., Zhang, Q., Squires, F. A., and Vande Hey, J. D.: Investigating the regional contributions to air pollution in Beijing: a dispersion modelling study using CO as a tracer, Atmos. Chem. Phys., 20, 2825–2838, https://doi.org/10.5194/acp-20-2825-2020, 2020.
Park, S.-S., Sim, S. Y., Bae, M.-S., and Schauer, J. J.: Size distribution of water-soluble components in particulate matter emitted from biomass burning, Atmos. Environ., 73, 62–72, https://doi.org/10.1016/j.atmosenv.2013.03.025, 2013.
Parungo, F. P., Nagamoto, C. T., Madel, R., Rosinski, J., and Haagenson, P. L.: Marine aerosols in pacific upwelling regions, J. Aerosol Sci., 18, 277–290, https://doi.org/10.1016/0021-8502(87)90023-1, 1987.
Pechtl, S. and von Glasow, R.: Reactive chlorine in the marine boundary layer in the outflow of polluted continental air: A model study, Geophys. Res. Lett., 34, L11813, https://doi.org/10.1029/2007GL029761, 2007.
Perry, K. D., Cahill, T. A., Eldred, R. A., Dutcher, D. D., and Gill, T. E.: Long-range transport of North African dust to the eastern United States, J. Geophys. Res.-Atmos., 102, 11225–11238, https://doi.org/10.1029/97JD00260, 1997.
Popovicheva, O., Kistler, M., Kireeva, E., Persiantseva, N., Timofeev, M., Kopeikin, V., and Kasper-Giebl, A.: Physicochemical characterization of smoke aerosol during large-scale wildfires: Extreme event of August 2010 in Moscow, Atmos. Environ., 96, 405–414, https://doi.org/10.1016/j.atmosenv.2014.03.026, 2014.
Prospero, J. M.: Saharan Dust Transport Over the North Atlantic Ocean and Mediterranean: An Overview, in: The Impact of Desert Dust Across the Mediterranean, edited by: Guerzoni, S. and Chester, R., Springer Netherlands, Dordrecht, 133–151, https://doi.org/10.1007/978-94-017-3354-0_13, 1996.
Prospero, J. M.: Long-term measurements of the transport of African mineral dust to the southeastern United States: Implications for regional air quality, J. Geophys. Res.-Atmos., 104, 15917–15927, https://doi.org/10.1029/1999JD900072, 1999.
Quinn, P. K. and Bates, T. S.: Regional aerosol properties: Comparisons of boundary layer measurements from ACE 1, ACE 2, Aerosols99, INDOEX, ACE Asia, TARFOX, and NEAQS, J. Geophys. Res.-Atmos., 110, D14202, https://doi.org/10.1029/2004JD004755, 2005.
Randles, C. A., Russell, L. M., and Ramaswamy, V.: Hygroscopic and optical properties of organic sea salt aerosol and consequences for climate forcing, Geophys. Res. Lett., 31, L16108, https://doi.org/10.1029/2004GL020628, 2004.
Rastogi, N., Agnihotri, R., Sawlani, R., Patel, A., Babu, S. S., and Satish, R.: Chemical and isotopic characteristics of PM10 over the Bay of Bengal: Effects of continental outflow on a marine environment, Sci.e Total Environ., 726, 138438, https://doi.org/10.1016/j.scitotenv.2020.138438, 2020.
Reid, J. S., Jonsson, H. H., Smith, M. H., and Smirnov, A.: Evolution of the vertical profile and flux of large sea-salt particles in a coastal zone, J. Geophys. Res.-Atmos., 106, 12039–12053, https://doi.org/10.1029/2000JD900848, 2001.
Reid, J. S., Hyer, E. J., Prins, E. M., Westphal, D. L., Zhang, J., Wang, J., Christopher, S. A., Curtis, C. A., Schmidt, C. C., Eleuterio, D. P., Richardson, K. A., and Hoffman, J. P.: Global Monitoring and Forecasting of Biomass-Burning Smoke: Description of and Lessons From the Fire Locating and Modeling of Burning Emissions (FLAMBE) Program, IEEE J. Select. Top. Appl. Earth Observ. Remote Sens., 2, 144–162, https://doi.org/10.1109/JSTARS.2009.2027443, 2009.
Riedel, T. P., Wolfe, G. M., Danas, K. T., Gilman, J. B., Kuster, W. C., Bon, D. M., Vlasenko, A., Li, S.-M., Williams, E. J., Lerner, B. M., Veres, P. R., Roberts, J. M., Holloway, J. S., Lefer, B., Brown, S. S., and Thornton, J. A.: An MCM modeling study of nitryl chloride (ClNO2) impacts on oxidation, ozone production and nitrogen oxide partitioning in polluted continental outflow, Atmos. Chem. Phys., 14, 3789–3800, https://doi.org/10.5194/acp-14-3789-2014, 2014.
Roberts, J. M., Osthoff, H. D., Brown, S. S., and Ravishankara, A. R.: N2O5 Oxidizes Chloride to Cl2 in Acidic Atmospheric Aerosol, Science, 321, 1059–1059, https://doi.org/10.1126/science.1158777, 2008.
Robinson, A. L., Donahue, N. M., Shrivastava, M. K., Weitkamp, E. A., Sage, A. M., Grieshop, A. P., Lane, T. E., Pierce, J. R., and Pandis, S. N.: Rethinking Organic Aerosols: Semivolatile Emissions and Photochemical Aging, Science, 315, 1259–1262, https://doi.org/10.1126/science.1133061, 2007.
Saide, P. E., Carmichael, G. R., Spak, S. N., Gallardo, L., Osses, A. E., Mena-Carrasco, M. A., and Pagowski, M.: Forecasting urban PM10 and PM2.5 pollution episodes in very stable nocturnal conditions and complex terrain using WRF–Chem CO tracer model, Atmos. Environ., 45, 2769–2780, https://doi.org/10.1016/j.atmosenv.2011.02.001, 2011.
Santschi, Ch. and Rossi, M. J.: Uptake of CO2, SO2, HNO3 and HCl on Calcite (CaCO3) at 300 K: Mechanism and the Role of Adsorbed Water, J. Phys. Chem. A, 110, 6789–6802, https://doi.org/10.1021/jp056312b, 2006.
Savoie, D. L., Arimoto, R., Keene, W. C., Prospero, J. M., Duce, R. A., and Galloway, J. N.: Marine biogenic and anthropogenic contributions to non-sea-salt sulfate in the marine boundary layer over the North Atlantic Ocean, J. Geophys. Res.-Atmos., 107, AAC3-1–AAC3-21, https://doi.org/10.1029/2001JD000970, 2002.
Schlosser, J. S., Braun, R. A., Bradley, T., Dadashazar, H., MacDonald, A. B., Aldhaif, A. A., Aghdam, M. A., Mardi, A. H., Xian, P., and Sorooshian, A.: Analysis of aerosol composition data for western United States wildfires between 2005 and 2015: Dust emissions, chloride depletion, and most enhanced aerosol constituents, J. Geophys. Res.-Atmos., 122, 8951–8966, https://doi.org/10.1002/2017JD026547, 2017.
Schroder, J. C., Campuzano-Jost, P., Day, D. A., Shah, V., Larson, K., Sommers, J. M., Sullivan, A. P., Campos, T., Reeves, J. M., Hills, A., Hornbrook, R. S., Blake, N. J., Scheuer, E., Guo, H., Fibiger, D. L., McDuffie, E. E., Hayes, P. L., Weber, R. J., Dibb, J. E., Apel, E. C., Jaeglé, L., Brown, S. S., Thornton, J. A., and Jimenez, J. L.: Sources and Secondary Production of Organic Aerosols in the Northeastern United States during WINTER, J. Geophys. Res.-Atmos., 123, 7771–7796, https://doi.org/10.1029/2018JD028475, 2018.
Seinfeld, J. H. and Pandis, S. N.: Atmospheric Chemistry and Physics: From Air Pollution to Climate Change, John Wiley & Sons, 1146 pp., ISBN 9781119221166, 2016.
Shingler, T., Dey, S., Sorooshian, A., Brechtel, F. J., Wang, Z., Metcalf, A., Coggon, M., Mülmenstädt, J., Russell, L. M., Jonsson, H. H., and Seinfeld, J. H.: Characterisation and airborne deployment of a new counterflow virtual impactor inlet, Atmos. Meas. Tech., 5, 1259–1269, https://doi.org/10.5194/amt-5-1259-2012, 2012.
Shinozuka, Y., Clarke, A. D., Howell, S. G., Kapustin, V. N., and Huebert, B. J.: Sea-salt vertical profiles over the Southern and tropical Pacific oceans: Microphysics, optical properties, spatial variability, and variations with wind speed, J. Geophys. Res.-Atmos., 109, D24201, https://doi.org/10.1029/2004JD004975, 2004.
Singh, H. B. and Kasting, J. F.: Chlorine-hydrocarbon photochemistry in the marine troposphere and lower stratosphere, J. Atmos. Chem., 7, 261–285, https://doi.org/10.1007/BF00130933, 1988.
Solomon, S., Stone, K., Yu, P., Murphy, D. M., Kinnison, D., Ravishankara, A. R., and Wang, P.: Chlorine activation and enhanced ozone depletion induced by wildfire aerosol, Nature, 615, 259–264, https://doi.org/10.1038/s41586-022-05683-0, 2023.
Sorooshian, A., Brechtel, F. J., Ma, Y., Weber, R. J., Corless, A., Flagan, R. C., and Seinfeld, J. H.: Modeling and Characterization of a Particle-into-Liquid Sampler (PILS), Aerosol Sci. Technol., 40, 396–409, https://doi.org/10.1080/02786820600632282, 2006.
Sorooshian, A., Murphy, S. M., Hersey, S., Bahreini, R., Jonsson, H., Flagan, R. C., and Seinfeld, J. H.: Constraining the contribution of organic acids and AMS 44 to the organic aerosol budget: On the importance of meteorology, aerosol hygroscopicity, and region, Geophys. Res. Lett., 37, L21807, https://doi.org/10.1029/2010GL044951, 2010.
Sorooshian, A., Csavina, J., Shingler, T., Dey, S., Brechtel, F. J., Sáez, A. E., and Betterton, E. A.: Hygroscopic and Chemical Properties of Aerosols Collected near a Copper Smelter: Implications for Public and Environmental Health, Environ. Sci. Technol., 46, 9473–9480, https://doi.org/10.1021/es302275k, 2012.
Sorooshian, A., Anderson, B., Bauer, S. E., Braun, R. A., Cairns, B., Crosbie, E., Dadashazar, H., Diskin, G., Ferrare, R., Flagan, R. C., Hair, J., Hostetler, C., Jonsson, H. H., Kleb, M. M., Liu, H., MacDonald, A. B., McComiskey, A., Moore, R., Painemal, D., Russell, L. M., Seinfeld, J. H., Shook, M., Smith, W. L., Thornhill, K., Tselioudis, G., Wang, H., Zeng, X., Zhang, B., Ziemba, L., and Zuidema, P.: Aerosol–Cloud–Meteorology Interaction Airborne Field Investigations: Using Lessons Learned from the U.S. West Coast in the Design of ACTIVATE off the U.S. East Coast, B. Am. Meteorol. Soc., 100, 1511–1528, https://doi.org/10.1175/BAMS-D-18-0100.1, 2019.
Sorooshian, A., Corral, A. F., Braun, R. A., Cairns, B., Crosbie, E., Ferrare, R., Hair, J., Kleb, M. M., Hossein Mardi, A., Maring, H., McComiskey, A., Moore, R., Painemal, D., Scarino, A. J., Schlosser, J., Shingler, T., Shook, M., Wang, H., Zeng, X., Ziemba, L., and Zuidema, P.: Atmospheric Research Over the Western North Atlantic Ocean Region and North American East Coast: A Review of Past Work and Challenges Ahead, J. Geophys. Res.-Atmos., 125, e2019JD031626, https://doi.org/10.1029/2019JD031626, 2020.
Sorooshian, A., Alexandrov, M. D., Bell, A. D., Bennett, R., Betito, G., Burton, S. P., Buzanowicz, M. E., Cairns, B., Chemyakin, E. V., Chen, G., Choi, Y., Collister, B. L., Cook, A. L., Corral, A. F., Crosbie, E. C., van Diedenhoven, B., DiGangi, J. P., Diskin, G. S., Dmitrovic, S., Edwards, E.-L., Fenn, M. A., Ferrare, R. A., van Gilst, D., Hair, J. W., Harper, D. B., Hilario, M. R. A., Hostetler, C. A., Jester, N., Jones, M., Kirschler, S., Kleb, M. M., Kusterer, J. M., Leavor, S., Lee, J. W., Liu, H., McCauley, K., Moore, R. H., Nied, J., Notari, A., Nowak, J. B., Painemal, D., Phillips, K. E., Robinson, C. E., Scarino, A. J., Schlosser, J. S., Seaman, S. T., Seethala, C., Shingler, T. J., Shook, M. A., Sinclair, K. A., Smith Jr., W. L., Spangenberg, D. A., Stamnes, S. A., Thornhill, K. L., Voigt, C., Vömel, H., Wasilewski, A. P., Wang, H., Winstead, E. L., Zeider, K., Zeng, X., Zhang, B., Ziemba, L. D., and Zuidema, P.: Spatially coordinated airborne data and complementary products for aerosol, gas, cloud, and meteorological studies: the NASA ACTIVATE dataset, Earth Syst. Sci. Data, 15, 3419–3472, https://doi.org/10.5194/essd-15-3419-2023, 2023.
Su, B., Wang, T., Zhang, G., Liang, Y., Lv, C., Hu, Y., Li, L., Zhou, Z., Wang, X., and Bi, X.: A review of atmospheric aging of sea spray aerosols: Potential factors affecting chloride depletion, Atmos. Environ., 290, 119365, https://doi.org/10.1016/j.atmosenv.2022.119365, 2022.
Sullivan, A. P., Guo, H., Schroder, J. C., Campuzano-Jost, P., Jimenez, J. L., Campos, T., Shah, V., Jaeglé, L., Lee, B. H., Lopez-Hilfiker, F. D., Thornton, J. A., Brown, S. S., and Weber, R. J.: Biomass Burning Markers and Residential Burning in the WINTER Aircraft Campaign, J. Geophys. Res.-Atmos., 124, 1846–1861, https://doi.org/10.1029/2017JD028153, 2019.
Sullivan, R. C., Guazzotti, S. A., Sodeman, D. A., and Prather, K. A.: Direct observations of the atmospheric processing of Asian mineral dust, Atmos. Chem. Phys., 7, 1213–1236, https://doi.org/10.5194/acp-7-1213-2007, 2007.
Takegawa, N., Miyakawa, T., Kawamura, K., and Kondo, Y.: Contribution of Selected Dicarboxylic and ù-Oxocarboxylic Acids in Ambient Aerosol to the 44 Signal of an Aerodyne Aerosol Mass Spectrometer, Aerosol Sci. Technol., 41, 418–437, https://doi.org/10.1080/02786820701203215, 2007.
Tanaka, P. L., Riemer, D. D., Chang, S., Yarwood, G., McDonald-Buller, E. C., Apel, E. C., Orlando, J. J., Silva, P. J., Jimenez, J. L., Canagaratna, M. R., Neece, J. D., Mullins, C. B., and Allen, D. T.: Direct evidence for chlorine-enhanced urban ozone formation in Houston, Texas, Atmos. Environ., 37, 1393–1400, https://doi.org/10.1016/S1352-2310(02)01007-5, 2003.
Tang, I. N., Tridico, A. C., and Fung, K. H.: Thermodynamic and optical properties of sea salt aerosols, J. Geophys. Res.-Atmos., 102, 23269–23275, https://doi.org/10.1029/97JD01806, 1997.
Tang, M., Guo, L., Bai, Y., Huang, R.-J., Wu, Z., Wang, Z., Zhang, G., Ding, X., Hu, M., and Wang, X.: Impacts of methanesulfonate on the cloud condensation nucleation activity of sea salt aerosol, Atmos. Environ., 201, 13–17, https://doi.org/10.1016/j.atmosenv.2018.12.034, 2019.
Thornhill, K. L., Anderson, B. E., Barrick, J. D. W., Bagwell, D. R., Friesen, R., and Lenschow, D. H.: Air motion intercomparison flights during Transport and Chemical Evolution in the Pacific (TRACE-P)/ACE-ASIA, J. Geophys. Res.-Atmos., 108, 8783, https://doi.org/10.1029/2002JD003108, 2003.
Thornton, J. A., Kercher, J. P., Riedel, T. P., Wagner, N. L., Cozic, J., Holloway, J. S., Dubé, W. P., Wolfe, G. M., Quinn, P. K., Middlebrook, A. M., Alexander, B., and Brown, S. S.: A large atomic chlorine source inferred from mid-continental reactive nitrogen chemistry, Nature, 464, 271–274, https://doi.org/10.1038/nature08905, 2010.
Toole, D. A. and Siegel, D. A.: Light-driven cycling of dimethylsulfide (DMS) in the Sargasso Sea: Closing the loop, Geophys. Res. Lett.s, 31, L09308, https://doi.org/10.1029/2004GL019581, 2004.
Ullerstam, M., Vogt, R., Langer, S., and Ljungström, E.: The kinetics and mechanism of SO2 oxidation by O3 on mineral dust, Phys. Chem. Chem. Phys., 4, 4694–4699, https://doi.org/10.1039/B203529B, 2002.
Vallina, S. M. and Simó, R.: Strong Relationship Between DMS and the Solar Radiation Dose over the Global Surface Ocean, Science, 315, 506–508, https://doi.org/10.1126/science.1133680, 2007.
Van Rooy, P., Drover, R., Cress, T., Michael, C., Purvis-Roberts, K. L., Silva, P. J., Nee, M. J., and Cocker, D.: Methanesulfonic acid and sulfuric acid Aerosol Formed through oxidation of reduced sulfur compounds in a humid environment, Atmos. Environ., 261, 118504, https://doi.org/10.1016/j.atmosenv.2021.118504, 2021.
Wang, X., Jacob, D. J., Downs, W., Zhai, S., Zhu, L., Shah, V., Holmes, C. D., Sherwen, T., Alexander, B., Evans, M. J., Eastham, S. D., Neuman, J. A., Veres, P. R., Koenig, T. K., Volkamer, R., Huey, L. G., Bannan, T. J., Percival, C. J., Lee, B. H., and Thornton, J. A.: Global tropospheric halogen (Cl, Br, I) chemistry and its impact on oxidants, Atmos. Chem. Phys., 21, 13973–13996, https://doi.org/10.5194/acp-21-13973-2021, 2021.
Wittig, V. E., Ainsworth, E. A., Naidu, S. L., Karnosky, D. F., and Long, S. P.: Quantifying the impact of current and future tropospheric ozone on tree biomass, growth, physiology and biochemistry: a quantitative meta-analysis, Global Change Biol., 15, 396–424, https://doi.org/10.1111/j.1365-2486.2008.01774.x, 2009.
Wu, Y., Han, Z., Nazmi, C., Gross, B., and Moshary, F.: A trans-Pacific Asian dust episode and its impacts to air quality in the east coast of U.S., Atmos. Environ., 106, 358–368, https://doi.org/10.1016/j.atmosenv.2015.02.013, 2015.
Yan, J., Jung, J., Zhang, M., Bianchi, F., Tham, Y. J., Xu, S., Lin, Q., Zhao, S., Li, L., and Chen, L.: Uptake selectivity of methanesulfonic acid (MSA) on fine particles over polynya regions of the Ross Sea, Antarctica, Atmos. Chem. Phys., 20, 3259–3271, https://doi.org/10.5194/acp-20-3259-2020, 2020.
Yao, X. and Zhang, L.: Chemical processes in sea-salt chloride depletion observed at a Canadian rural coastal site, Atmos. Environ., 46, 189–194, https://doi.org/10.1016/j.atmosenv.2011.09.081, 2012.
Yokelson, R. J., Crounse, J. D., DeCarlo, P. F., Karl, T., Urbanski, S., Atlas, E., Campos, T., Shinozuka, Y., Kapustin, V., Clarke, A. D., Weinheimer, A., Knapp, D. J., Montzka, D. D., Holloway, J., Weibring, P., Flocke, F., Zheng, W., Toohey, D., Wennberg, P. O., Wiedinmyer, C., Mauldin, L., Fried, A., Richter, D., Walega, J., Jimenez, J. L., Adachi, K., Buseck, P. R., Hall, S. R., and Shetter, R.: Emissions from biomass burning in the Yucatan, Atmos. Chem. Phys., 9, 5785–5812, https://doi.org/10.5194/acp-9-5785-2009, 2009.
Young, A. H., Keene, W. C., Pszenny, A. A. P., Sander, R., Thornton, J. A., Riedel, T. P., and Maben, J. R.: Phase partitioning of soluble trace gases with size-resolved aerosols in near-surface continental air over northern Colorado, USA, during winter, J. Geophys. Res.-Atmos., 118, 9414–9427, https://doi.org/10.1002/jgrd.50655, 2013.
Young, C. J., Washenfelder, R. A., Edwards, P. M., Parrish, D. D., Gilman, J. B., Kuster, W. C., Mielke, L. H., Osthoff, H. D., Tsai, C., Pikelnaya, O., Stutz, J., Veres, P. R., Roberts, J. M., Griffith, S., Dusanter, S., Stevens, P. S., Flynn, J., Grossberg, N., Lefer, B., Holloway, J. S., Peischl, J., Ryerson, T. B., Atlas, E. L., Blake, D. R., and Brown, S. S.: Chlorine as a primary radical: evaluation of methods to understand its role in initiation of oxidative cycles, Atmos. Chem. Phys., 14, 3427–3440, https://doi.org/10.5194/acp-14-3427-2014, 2014.
Zhang, D. and Iwasaka, Y.: Chlorine deposition on dust particles in marine atmosphere, Geophys. Res. Lett., 28, 3613–3616, https://doi.org/10.1029/2001GL013333, 2001.
Zhang, Q., Alfarra, M. R., Worsnop, D. R., Allan, J. D., Coe, H., Canagaratna, M. R., and Jimenez, J. L.: Deconvolution and Quantification of Hydrocarbon-like and Oxygenated Organic Aerosols Based on Aerosol Mass Spectrometry, Environ. Sci. Technol., 39, 4938–4952, https://doi.org/10.1021/es048568l, 2005.
Zhao, Y. and Gao, Y.: Acidic species and chloride depletion in coarse aerosol particles in the US east coast, Sci. Total Environ., 407, 541–547, https://doi.org/10.1016/j.scitotenv.2008.09.002, 2008.
Ziemba, L. D., Griffin, R. J., Whitlow, S., and Talbot, R. W.: Characterization of water-soluble organic aerosol in coastal New England: Implications of variations in size distribution, Atmos. Environ., 45, 7319–7329, https://doi.org/10.1016/j.atmosenv.2011.08.022, 2011.
Zorn, S. R., Drewnick, F., Schott, M., Hoffmann, T., and Borrmann, S.: Characterization of the South Atlantic marine boundary layer aerosol using an aerodyne aerosol mass spectrometer, Atmos. Chem. Phys., 8, 4711–4728, https://doi.org/10.5194/acp-8-4711-2008, 2008.
Zuidema, P., Alvarez, C., Kramer, S. J., Custals, L., Izaguirre, M., Sealy, P., Prospero, J. M., and Blades, E.: Is Summer African Dust Arriving Earlier to Barbados? The Updated Long-Term In Situ Dust Mass Concentration Time Series from Ragged Point, Barbados, and Miami, Florida, B. Am. Meteorol. Soc., 100, 1981–1986, https://doi.org/10.1175/BAMS-D-18-0083.1, 2019.