the Creative Commons Attribution 4.0 License.
the Creative Commons Attribution 4.0 License.
 | 08 Mar 2024
Spatial disparities of ozone pollution in the Sichuan Basin spurred by extreme, hot weather
Yunsong Du
Dongyang Chen
Haiyan Meng
Li Zhou
Guangming Shi
Miao Feng
Wei Li
Mulan Chen
Zhenliang Li
Fumo Yang
Under the influence of climate change, the increasing occurrence of extreme weather events, such as heatwaves, has led to an enhanced frequency of ozone (O3) pollution issues. In August 2022, the Sichuan Basin (SCB), a typical large-scale geographical terrain located in southwestern China, experienced the most severe heatwave in the last 20 years. The heatwave led to substantial disparities in O3 levels across the region. Here, by integrating observations, machine learning, and numerical simulations, we aim to understand the diverse O3 formation mechanisms in two megacities, Chengdu (western location) and Chongqing (eastern location). Observational data showed that Chengdu experienced a consecutive 17 d period of O3 exceedance, in contrast to Chongqing, where O3 concentrations remained below the standard. Meteorological and precursor factors were assessed, highlighting high temperatures, intense solar radiation, and overnight accumulative pollutants as key contributors to O3 concentrations. The interplay of isoprene, temperature, and O3, alongside the observation-based box model and MEGAN simulations, underscored the significant role of intensified biogenic volatile organic compounds (BVOCs) in O3 formation. Interestingly, Chongqing exhibited nearly double the BVOC emissions of Chengdu, yet contributed less to O3 concentrations. This discrepancy was addressed through CMAQ-DDM (Decoupled Direct Method) simulations and satellite diagnosis by investigating the O3–NOx–VOC sensitivity. Notably, Chengdu displayed a VOC-driven sensitivity, while Chongqing showed a transitional regime. Moreover, the regional transport also played a pivotal role in the spatial divergence of O3 pollution. Cross-regional transport predominantly influenced Chongqing (contributing ∼ 80 %), whereas Chengdu was mainly affected by the emissions within the basin. The local accumulated pollutants gave rise to the atmospheric oxidizing capacity, resulting in a substantial photochemical contribution to O3 levels (49.9 ppbv h−1) in Chengdu. This comparison of the difference provides insights into the complex interplay of meteorology, natural emissions, and anthropogenic sources during heatwaves, guiding the necessity of targeted pollution control measures on regional scales.
- Article
(5154 KB) - Full-text XML
-
Supplement
(1788 KB) - BibTeX
- EndNote


Ground-level ozone (O3), formed through intricate photochemical reactions involving precursors like volatile organic compounds (VOCs) and nitrogen oxides (NOx) under sunlight, is a prominent constituent of smog and a major contributor to poor air quality. Different from the protective role in the stratosphere, O3 in the troposphere has garnered great attention due to its potential damage to human wellbeing and ecological systems (Krupa and Kickert, 1989; Schwela, 2000; Emberson et al., 2001; Xiao et al., 2021). The hazardous effects span multiple domains, such as detrimental impacts on human health, vegetation growth, and the climate. Addressing O3 pollution is a complex endeavor, which mainly arises from the nonlinear relationship between O3 and its precursors. Besides, the substantial influence of meteorological conditions adds another layer of intricacy to the challenge of managing O3 pollution. Under global warming, the interplay of factors such as extreme weather events and elevated anthropogenic emissions has led to the frequent emergence of O3 pollution, worsening air quality in urban areas worldwide.
Net O3 production arises when the equilibrium between O3 and nitrogen oxides (NOx), i.e., , is disrupted through the involvement of alkylperoxyl (RO2) and hydroperoxyl (HO2) radicals originating from oxidation of VOCs and carbon monoxide (CO). This intervention triggers the oxidation of NO to NO2, ultimately resulting in the accumulation of O3 through NO2 photolysis (Jacob, 2000; Lelieveld and Dentener, 2000). Functioning as a pivotal role in photochemical reactions, VOCs have been identified as a crucial focal point for advancing efforts in the prevention and management of O3 pollution (Jenkin and Clemitshaw, 2000). However, influenced by the diversity, abundance, and reactivity of VOC species, the spatial and temporal VOC characteristics depict regional disparities, adding difficulty in developing an effective strategy to reduce photochemical smog. Moreover, due to the dual roles of NOx in O3 formation, where they enhance O3 formation in low-NOx environments and titrate O3 in high-NOx environments, reductions in VOCs must be examined, along with the patterns of NOx. Given the diverse energy structures in different regions, comprehending the regional responsiveness of O3–NOx–VOC sensitivity is essential. This is particularly vital for elucidating nonlinear relationship discrepancies within regional contexts, which helps to advance the formulation of effective emission reduction strategies.
O3 pollution episodes are also closely related to meteorology. High temperature, intensive solar radiation, and light winds are found to be the unfavorable weather conditions inducing photochemical pollution (Ding et al., 2017). Generally, the impact of meteorological conditions on O3 is manifested through factors such as changes in chemical reaction rates, dry/wet deposition, and atmospheric transport. By objectively classifying pollution weather types, numerous studies have summarized the typical weather conditions that lead to O3 pollution. For example, a high-pressure ridge, a continental anticyclone, and the periphery of typhoons are the typical weather systems inducing O3 pollution in east Asia (McElroy et al., 1986; Daum et al., 2003; Wang et al., 2015). Besides, meteorology can also indirectly affect O3 by modulating natural emissions, such as BVOC (biogenic VOC) emissions from vegetation and reactive nitrogen emissions from soil (Hall et al., 1996; Saunier et al., 2017; Huang et al., 2018). For instance, a rise in temperature can result in elevated emissions of BVOCs, thereby contributing to the formation of O3 (N. Wang et al., 2022). With the influence of climate change, there is an increasing frequency of extreme weather events, further perturbating the natural emissions and finally exacerbating O3 pollution (Lu et al., 2019).
The Sichuan Basin (SCB), encircled by the Qinghai–Tibet Plateau, Yungui Plateau, and surrounding mountain ranges, stands as a notable hotspot for atmospheric pollution within China. Two megacities, Chengdu and Chongqing, are situated in the SCB, with populations exceeding 50 million. In fact, a considerable amount of research on the pollution characteristics of O3 has been conducted in the SCB. For example, the characteristics of O3 and the precursors have been widely measured and analyzed (Zhao et al., 2018; Qiao et al., 2019; Zhou et al., 2020; Chen et al., 2022). The complicated coupling effect between the plateau-deep basin topography and the unique meteorological conditions on atmospheric pollution have been studied (Hu et al., 2022; Shu et al., 2022; Lei et al., 2023). The impact of aerosol feedbacks on O3 was also explored (Wang et al., 2020).
However, a limited focus has been placed on contrasting the varied responses among different sites or cities within the basin. Exploring and contrasting diverse mechanisms across multiple sites enriches our comprehension and facilitates collaborative air pollution mitigation efforts on a regional scale. In August 2022, the SCB experienced an exceptionally rare heatwave, with monthly mean temperature ranking the highest over the last 2 decades. As a result, the Chengdu Plain suffered from 17 d consecutive O3 pollution, whereas Chongqing remained good air quality. Here, we combined field measurements, machine learning, and numerical simulations to elucidate the spatial disparities of O3 pollution mechanism within the SCB. This information has implications for better understanding the meteorological contributions, the discrepancy in O3–NOx–VOC sensitivity, and regional transport disparities between large urban areas and provides insights into the regional joint control of O3 pollution.
2.1 Data source
Data of atmospheric compositions, including O3, NOx (NO and NO2), CO, SO2, VOC components, and meteorological parameters, were collected from two in situ observational sites. The Chengdu sampling site was located on the rooftop super monitoring station of the Chengdu Environmental Science Academy in Qingyang District, Chengdu (30.65° N, 106.49° E), while the Chongqing sampling site was situated on the rooftop research observation station of Longshan Primary School in Yubei District, Chongqing (29.75° N, 106.46° E). Both sites were situated in mixed-use areas encompassing traffic arteries, commercial, and residential zones, serving as representative locations for assessing urban air quality. Detailed information on the measurements, such as monitoring instruments, data coverage, and resolution, is summarized in Table S1 in the Supplement. Briefly, the ambient concentrations of O3, NOx, CO, and SO2 were detected by instruments produced by Thermo Scientific (Model 49i, 42i, 48i, and 43i, respectively). The species of VOCs were sampled by the GC955-611/811 ozone precursor analyzer produced by Synspec. The instrument targeted the VOC species designated as photochemical precursors by the US Environmental Protection Agency (EPA). The gas standards used were identical to those employed by the US EPA Photochemical Assessment Monitoring Stations (PAMS). The photolysis rates of NO2 (JNO2 value) were measured by an ultra-fast CCD detector (UF-CCD, MetCon, Germany). Meteorological parameters including temperature, relative humidity, wind speed, and wind direction at the same sites were concurrently measured by the mini weather stations (WS600-UMB in Chengdu and WS502-WTB100 in Chongqing). All instruments were meticulously maintained and regularly calibrated. Moreover, the air quality monitoring network established by the Ministry of Ecology and Environment of China was employed to assess O3 pollution events in the SCB.
In addition, for regional analysis in this study, we acquired the monthly averaged 90th percentile of MDA8 O3 (MDA8-90) product. This gridded distributed O3 product (10×10 km) was reconstructed by integrating surface monitoring, satellite observation, emission inventory, numerical modeling, and big data analysis. The data were sourced from TAP (Tracking Air Pollution in China; http://tapdata.org.cn/, last access: 3 February 2024).
2.2 Stepwise regression analysis
We employed stepwise regression analysis to assess the impact of various meteorological factors on O3 formation. This approach involves the introduction of numerous input variables, with the method iteratively selecting significant factors while eliminating non-significant ones, ultimately resulting in the identification of a final set of critical factors. Following this, we constructed a multivariate linear regression equation to model O3 concentration. In detail, meteorological parameters were obtained from the fifth generation of the European Centre for Medium-Range Weather Forecasts atmospheric reanalysis (ERA5). The selected parameters included the 10 m u component of wind (U10), the 10 m v component of wind (V10), vertical wind (w), boundary layer height (BLH), 2 m temperature (T2), and surface solar radiation (SSR). Given the high correlation (R=0.85) between the diurnal variations of T2 and SSR during the heatwave, it was challenging to distinguish the individual impacts of T2 and SSR. As a pragmatic approach, we chose to combine them by multiplying T2 with SSR, thereby examining the collective influence of elevated temperatures and high solar radiation. Additionally, we also incorporated previous night accumulative air pollutants, such as O3 (ACCO3) and NO2 (ACCNO2), as input parameters to investigate the impact of pollutants accumulating overnight on O3 levels. The machine-learning-simulated O3 concentrations were then validated against observations, revealing a robust correlation (Pearson correlation coefficient (R) > 0.91, p value (from two-tailed t test) < 0.01) between them (Fig. S1 in the Supplement). This result demonstrates the effectiveness of meteorological and overnight accumulative factors in explaining a substantial portion of O3 concentrations.
2.3 Observation-based model (OBM)
In this study, an observation-based box model (OBM) configured with the Master Chemical Mechanism (MCM v3.3.1) was employed to identify the key VOC species influencing O3 (Jenkin et al., 2015; Bloss et al., 2005; Saunders et al., 2003; Jenkin et al., 2003, 1997). The model considered VOC concentrations, trace gases (O3, NOx, CO, SO2), meteorological parameters, and the photolysis rates of NO2 (JNO2) from the in situ sites in Chengdu and Chongqing. Observations were used as constraints in the model and were averaged to represent the diurnal cycle with a time resolution of 1 h. The photolysis rates generated by the model were adjusted based on the measured JNO2 values in order to accurately simulate the photochemical reactions. The mean mixing ratios of 46 VOC species, including 20 alkanes, 11 alkenes, 1 alkyne (ethyne), and 14 aromatics, are listed in Table S2. The model started at 00:00 local time (LT; the time zone for all instances in the text is LT) and ran for a period of 24 h. Prior to the formal calculation, we conducted a spin-up run for 4 d, with constraints representing the diurnal cycle, allowing the unconstrained compounds (e.g., radicals and HCHO) to reach steady states. Using the OBM simulation, the relative incremental reactivity (RIR) method was applied to assess the sensitivity of O3 formation to individual precursor species (Cardelino and Chameides, 1995; Meng et al., 2023; Zhang et al., 2019; Xue et al., 2014; Zhu et al., 2020). The calculation process can be expressed in Eq. (1).
Here, X represents a specific precursor of O3. and represent the maximum simulated O3 concentration based on measured concentration and the concentration when the precursor levels change by ΔX. ΔC(X)/C(X) indicates the relative change of precursor X. In this study, a reduction of 20 % in precursor X was selected to perform the RIR analysis.
2.4 Lagrangian particulate dispersion modeling
We conducted backward Lagrangian particulate dispersion modeling (LPDM) to ascertain the potential source regions for the air masses observed at the monitoring stations. This approach involved employing the hybrid single-particulate Lagrangian-integrated trajectory model (HYSPLIT) driven by the ARL format Global Data Assimilation System (GDAS) data. The LPDM was executed with a temporal resolution of 1 h, releasing 3000 particulates at 100 m above sea level from the site and then tracking their backward movement for 72 h. The particulates' positions were calculated in both vertical and horizontal dimensions, considering the impact of atmospheric advection and diffusion. By analyzing the resulting data, we derived the “retroplume”, which indicates the spatial residence time of particulates and reflects the distribution of surface probability or simulated air mass residence time. This technique enabled us to diagnose whether the in situ observation was predominantly influenced by local emissions or regional transport.
2.5 Chemical transport modeling
A chemical transport model, WRF-MEGAN-CMAQ (Weather Research and Forecasting–Model of Emissions of Gases and Aerosols from Nature–Community Multiscale Air Quality), was employed to study the O3 formation mechanism in the SCB. We adopted a two-nested domain, with the outer domain covering most parts of east Asia (grid resolution of 36 × 36 km) and the inner domain covering southwestern China, with the SCB being focused on (grid resolution of 12 × 12 km) (see Fig. S2). The European Centre for Medium-Range Weather Forecasts (ECMWF) reanalysis data were used as the initial and lateral boundary conditions of the WRF (version 3.9.1). Carbon Bond Mechanism Version 6 and Aerosol Scheme 6 were used for gas-phase and aerosol chemical simulations within the CMAQ model (version 5.4), respectively. With regard to anthropogenic emissions, the recently updated 2020-based MEIC emissions (Multi-resolution Emission Inventory for China; developed by Tsinghua University) were used for areas within China, and the 2010-based MIX emissions (Li et al., 2017) were used for regions outside China. Both sets of the emissions have a horizontal resolution of 0.25 × 0.25°, incorporating sectors such as transportation, industry, power plant, residential, and agriculture. Besides, natural emissions were calculated using the MEGAN model (version 2.1) driven by the WRF-simulated meteorology. The static input data, the vegetation-related data of MEGAN, were updated by using the 2020-based plant function type (PFT) and leaf area index (LAI) retrieved from the MODIS (Moderate-Resolution Imaging Spectroradiometer) products. After a spin-up of 5 d, the WRF-CMAQ model was performed to simulate O3 concentrations in the SCB. More details of the modeling configuration are summarized in Table S3.
In this study, we introduced the CMAQ-DDM (Decoupled Direct Method) module to investigate the nonlinear relationship between O3 and its precursors. Unlike the traditional brute force method (BFM) that involves cutting or eliminating emissions from source regions (or sectors), which is not only computationally intensive but also prone to uncertainties (due to the intricate nonlinear nature of O3 chemistry), the DDM method offers a more refined alternative. It enables accurate and computationally efficient calculations of the sensitivity coefficients required for evaluating the impact of parameter variations on output chemical concentrations (Napelenok et al., 2008). Furthermore, the DDM method has been reported to exhibit more accurate calculations when addressing uncertainties arising from the nonlinear relationship between secondary pollutants and their emissions, in comparison to the BFM (Itahashi et al., 2015). Herein, both first-order and higher-order sensitivities were calculated to obtain the O3–NOx–VOC sensitivities in Chengdu and Chongqing. In addition, we also utilized the CMAQ-ISAM (Integrated Source Apportion Method) technique, an innovative approach for source tracing. This method enables us to trace and quantify the distinct impacts on O3 concentrations originating from specific source sectors, emissions confined within designated geographical regions, and effects arising from stratospheric and lateral boundary conditions (Kwok et al., 2013). Through this approach, we calculated the separate influences of anthropogenic and biogenic emissions on O3 levels. We also assessed the contributions of source regions to O3 levels in Chengdu and Chongqing, encompassing both local and regional influences. A map of source regions' classification in this study was provided in Fig. S3.
We validated the performance of the WRF-MEGAN-CMAQ model using surface network monitoring data. The time series and statistical outcomes of the simulated and observed O3 within the SCB are consolidated in Fig. S4 and Table S4. In general, the favorable alignment between observations and simulations underscores the model's proficiency in accurately replicating the magnitude and temporal variations of air pollutants.
3.1 Regional disparity of O3 between Chengdu and Chongqing
In August 2022, the SCB witnessed its hottest August in the last 20 years, with Chengdu and Chongqing reporting monthly mean temperatures soaring to 36.8 and 40.3 °C, respectively (Fig. 1). Typically, the atmospheric conditions in the SCB are relatively stable due to the topography of the basin. This stability, in conjunction with elevated temperatures, tended to foster the occurrence of photochemical pollution (Zhao et al., 2018; Chen et al., 2022). However, during this historically unprecedented heatwave, O3 levels exhibited substantial variations across the SCB. Observations revealed that O3 concentrations surpassed China's Grade II standard (75 ppbv) in the western part of the SCB, notably in Chengdu. Conversely, significantly lower concentrations, well below the standard, were observed in the eastern region of the basin, particularly in Chongqing (Fig. 1a). According to the network monitoring data, the average maximum daily 8 h (MDA8h) O3 concentration in Chengdu was measured at 75.1 ppbv. In contrast, the MDA8h O3 concentration in Chongqing was recorded at 55.1 ppbv.
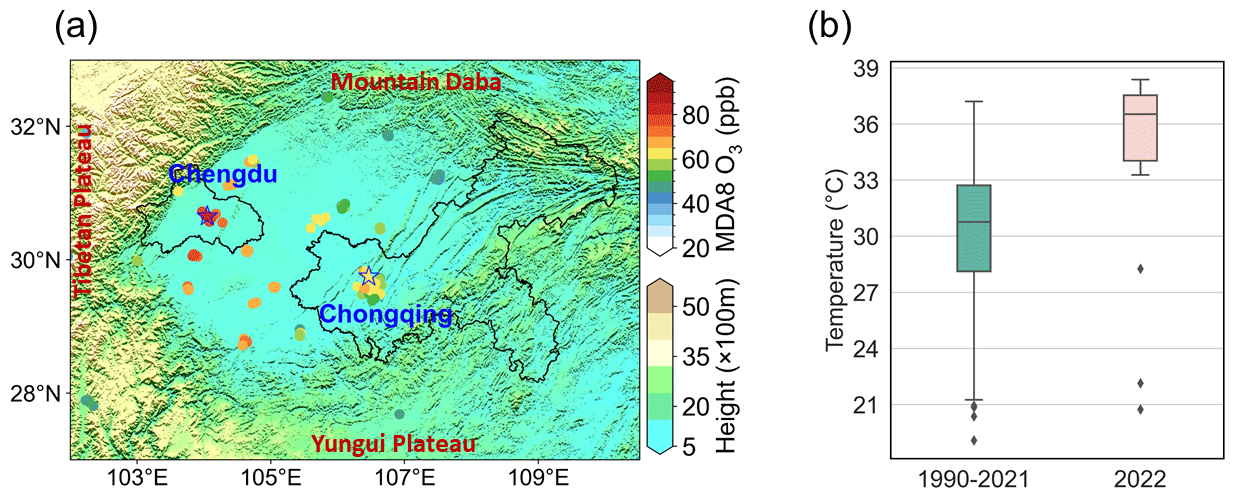
Figure 1(a) Geographical distribution of Sichuan Basin with scattered averaged monthly MDA8 O3 concentrations (data obtained from Ministry of Ecology and Environment of China). The contours show the 3D terrain height in SCB. The black lines highlight the administrative borders of Chengdu and Chongqing. The blue stars indicate the supersites in Chengdu and Chongqing. (b) Historical monthly averaged daily maximum air temperature (August) comparison between 2022 and the climate average (1990–2021) of the SCB region.
We compared the averaged diurnal variations of the in situ-measured meteorological parameters and air pollutants (Fig. 2). Consistent with the analysis of weather patterns, Chongqing was influenced by the southeast winds (3.1 m s−1), while Chengdu's conditions were more stagnant, with lighter wind speed (1.4 m s−1) (Fig. 2a–b). In addition, the boundary layer height (BLH) was also significantly higher in Chongqing (Fig. 2c). A simple calculation of the ventilation coefficient (VC) with wind speed and BLH indicated that Chongqing (VC = 3.34 km m s−1) had better ventilation conditions compared to Chengdu (VC = 1.24 km m s−1, Fig. 2d). It could be inferred that, influenced by lighter winds and lower BLH, air pollutants in Chengdu were more easily trapped and accumulated. Both cities displayed typical meteorological features of a heatwave conducive to photochemical pollution, characterized by elevated temperatures, intense solar radiation, and low relative humidity (Fig. 2e–g). Among these factors, temperature and solar radiation in Chongqing were higher compared to those in Chengdu, suggesting that the conditions in Chongqing were more conducive to photochemical O3 reactions. Additionally, significantly lower relative humidity was observed in Chongqing, suggesting a potential reduction in O3 removal by water vapor, for instance, through HOx reactions. However, the degree of O3 pollution was quite the opposite to that previously mentioned (Figs. 1a and 2h). We conducted further investigation into the diurnal variation of the precursors. Two distinct peaks in NO2 levels were identifiable, with one occurring in the morning and the other appearing during night (Fig. 2i). The morning peaks were likely influenced by vehicular emissions during rush hour. The night peaks were possibly caused by the NOx titration effect. Moreover, the levels of total VOCs (TVOCs) were much higher in Chengdu than those in Chongqing (Fig. 2j). Considering the different degrees of NO2 and TVOC concentrations in Chengdu and Chongqing, it could be inferred that there might be differences in the O3 formation mechanism between the two cities. Indeed, the diurnal variation of isoprene, a highly active VOC, showed distinct differences (Fig. 2k). The observed data in Chongqing showed a notable afternoon peak, whereas in Chengdu, the peak appeared exclusively between 17:00 and 20:00. Usually, isoprene, mainly emitted by vegetation, is sensitive to ambient temperature and solar radiation and peaks in the afternoon. There might be some potential explanations. Firstly, the isoprene peak between 17:00 and 20:00 in Chengdu could be attributed to other sources, such as vehicular emissions. However, this possibility was ruled out after examining the diurnal variation of benzene (Fig. 2l). As a marker of anthropogenic vehicular emissions, benzene did not exhibit any peaks between 17:00 and 20:00. The second possibility was that the atmospheric oxidizing capacity in Chengdu was more robust than in Chongqing, leading to the rapid photochemical consumption of isoprene emitted by vegetation. This hypothesis was supported by the diurnal variations in O3 levels, which were notably elevated in the afternoon, implying a stronger atmospheric oxidizing capacity. The instrument-detected isoprene was indicative of its aged state, implying the rapid photochemical consumption due to both the atmospheric oxidizing capacity and the inherent reactivity of isoprene itself. Furthermore, a distinct decrease in BLH between 17:00 and 20:00 was also a possible reason for the isoprene peak of Chengdu in the late afternoon.
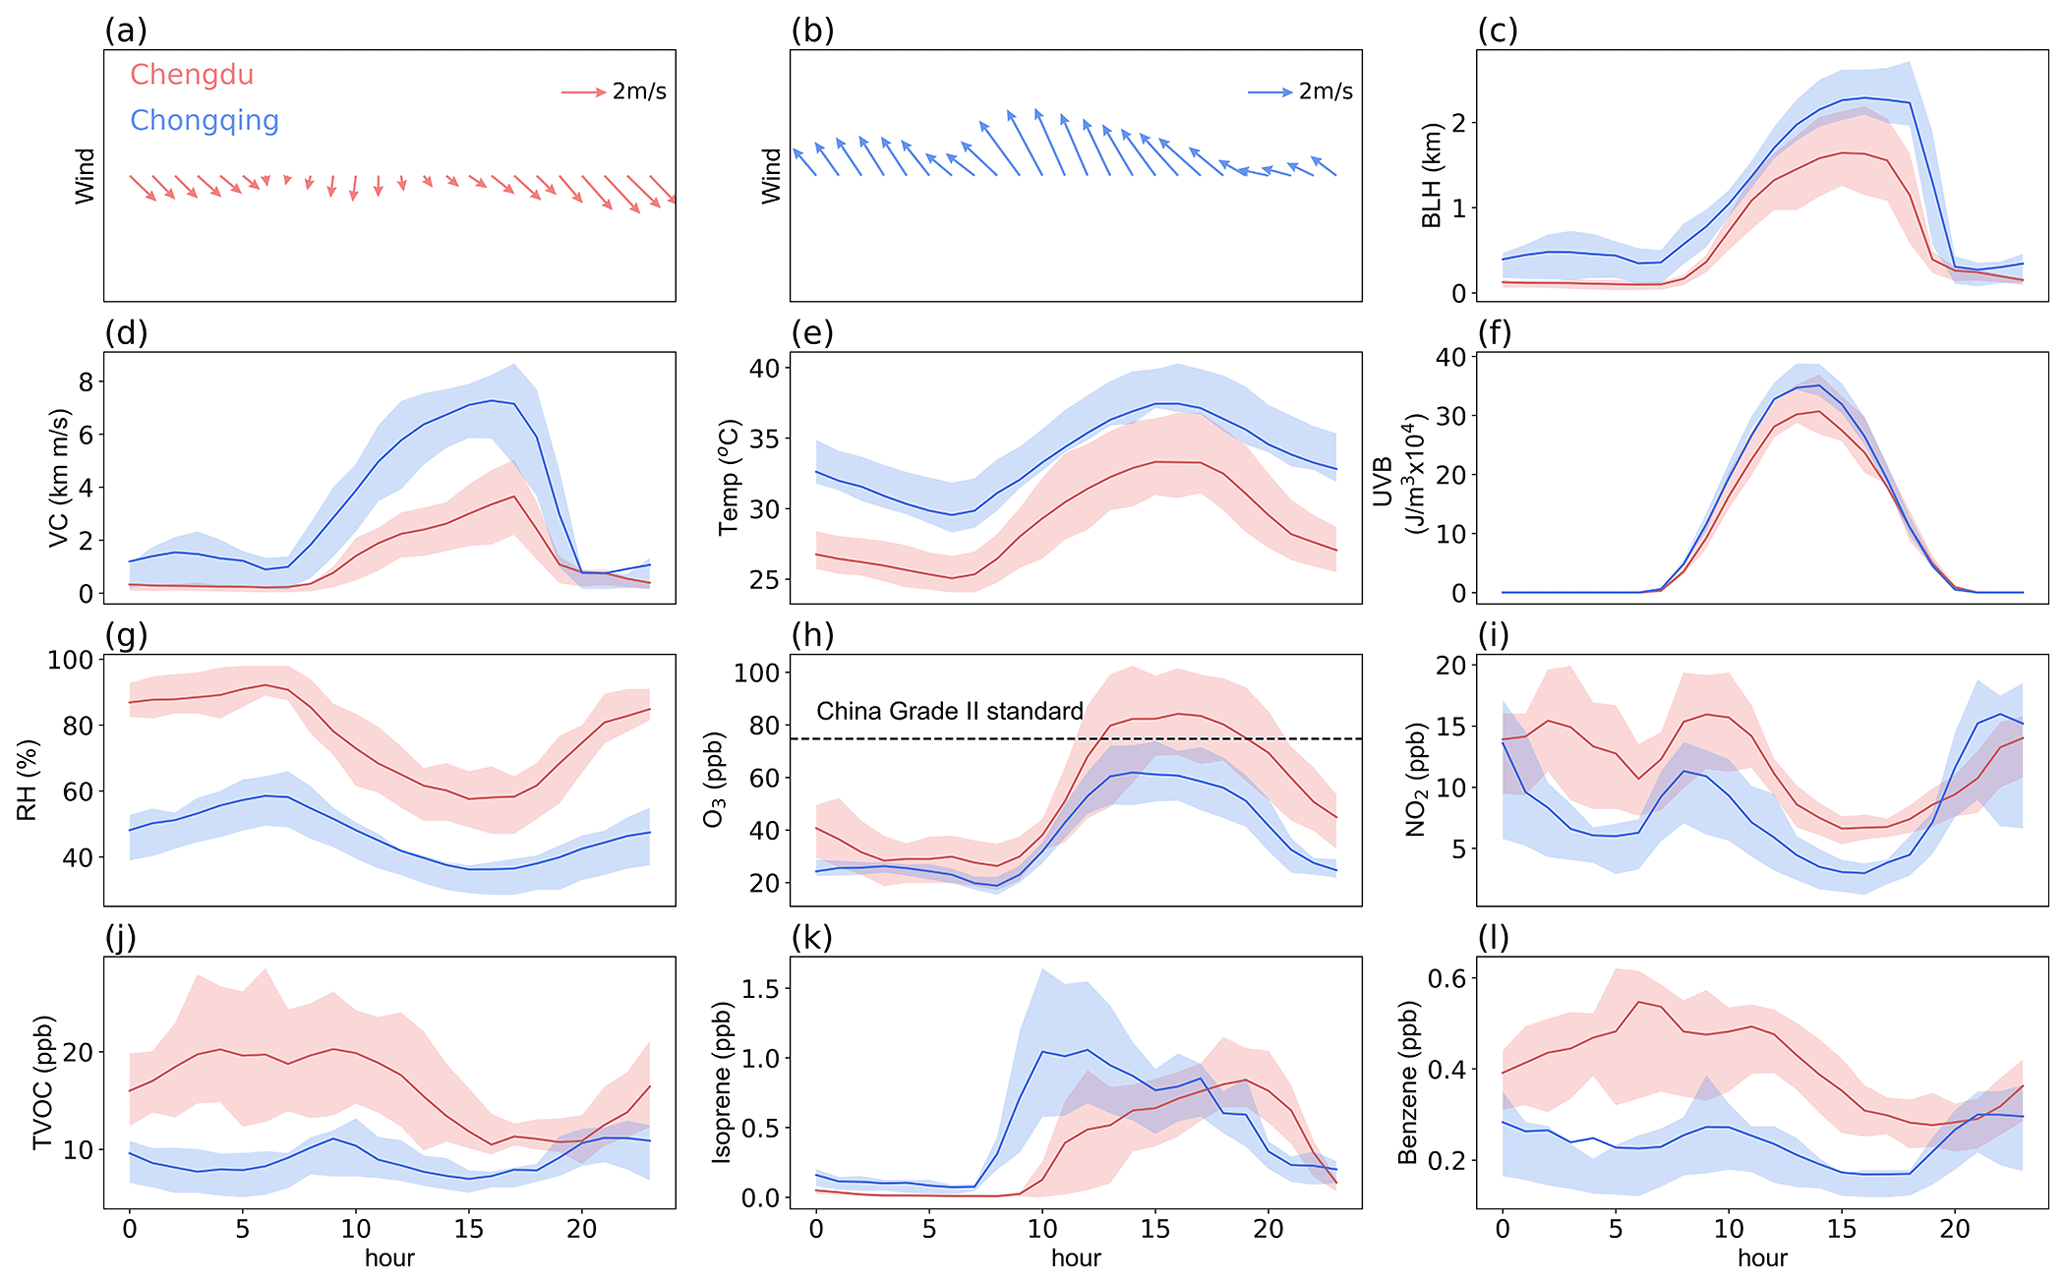
Figure 2Diurnal variation of meteorological parameters (including winds, boundary layer height (BLH), ventilation coefficient (VC), temperature (temp), ultraviolet radiation (UVB), and relative humidity (RH)) and air pollutants (O3, NO2, total volatile organic carbons (TVOCs), isoprene, and benzene) in both Chengdu and Chongqing.
Subsequently, we employed a machine learning method, stepwise regression analysis, to quantify the impact of diverse meteorological parameters and precursor concentrations on O3 levels (Fig. 3). In both cities, the significance of T2 and SSR, along with ACCO3 and ACCNO2, took precedence. This indicates that meteorological conditions characterized by high temperatures, intense solar radiation, and the presence of overnight accumulative pollutants played a pivotal role in O3 concentration, especially during heatwaves. The distinction between the two cities lay in the significance of atmospheric dispersion capacities represented by the variations in winds and BLH. The study revealed that winds, including both horizontal winds (U10 and V10) and vertical wind (W), along with BLH, had positive effects on elevating O3 levels in Chengdu. Conversely, they predominantly had negative effects, resulting in a decrease in O3 levels, in Chongqing. These findings align with the diurnal analysis, which indicated that Chengdu experienced lighter winds and lower BLH. The poor ventilation conditions facilitated the accumulation of air pollutants, contributing to the increase in O3 levels. In contrast, the ventilation condition in Chongqing was conducive to reduce O3 concentrations. Combined with the aforementioned analysis of diurnal patterns, it could be inferred that Chengdu was more constrained by local emissions, while Chongqing was more susceptible to regional transport influences (further discussed in Sect. 3.3).
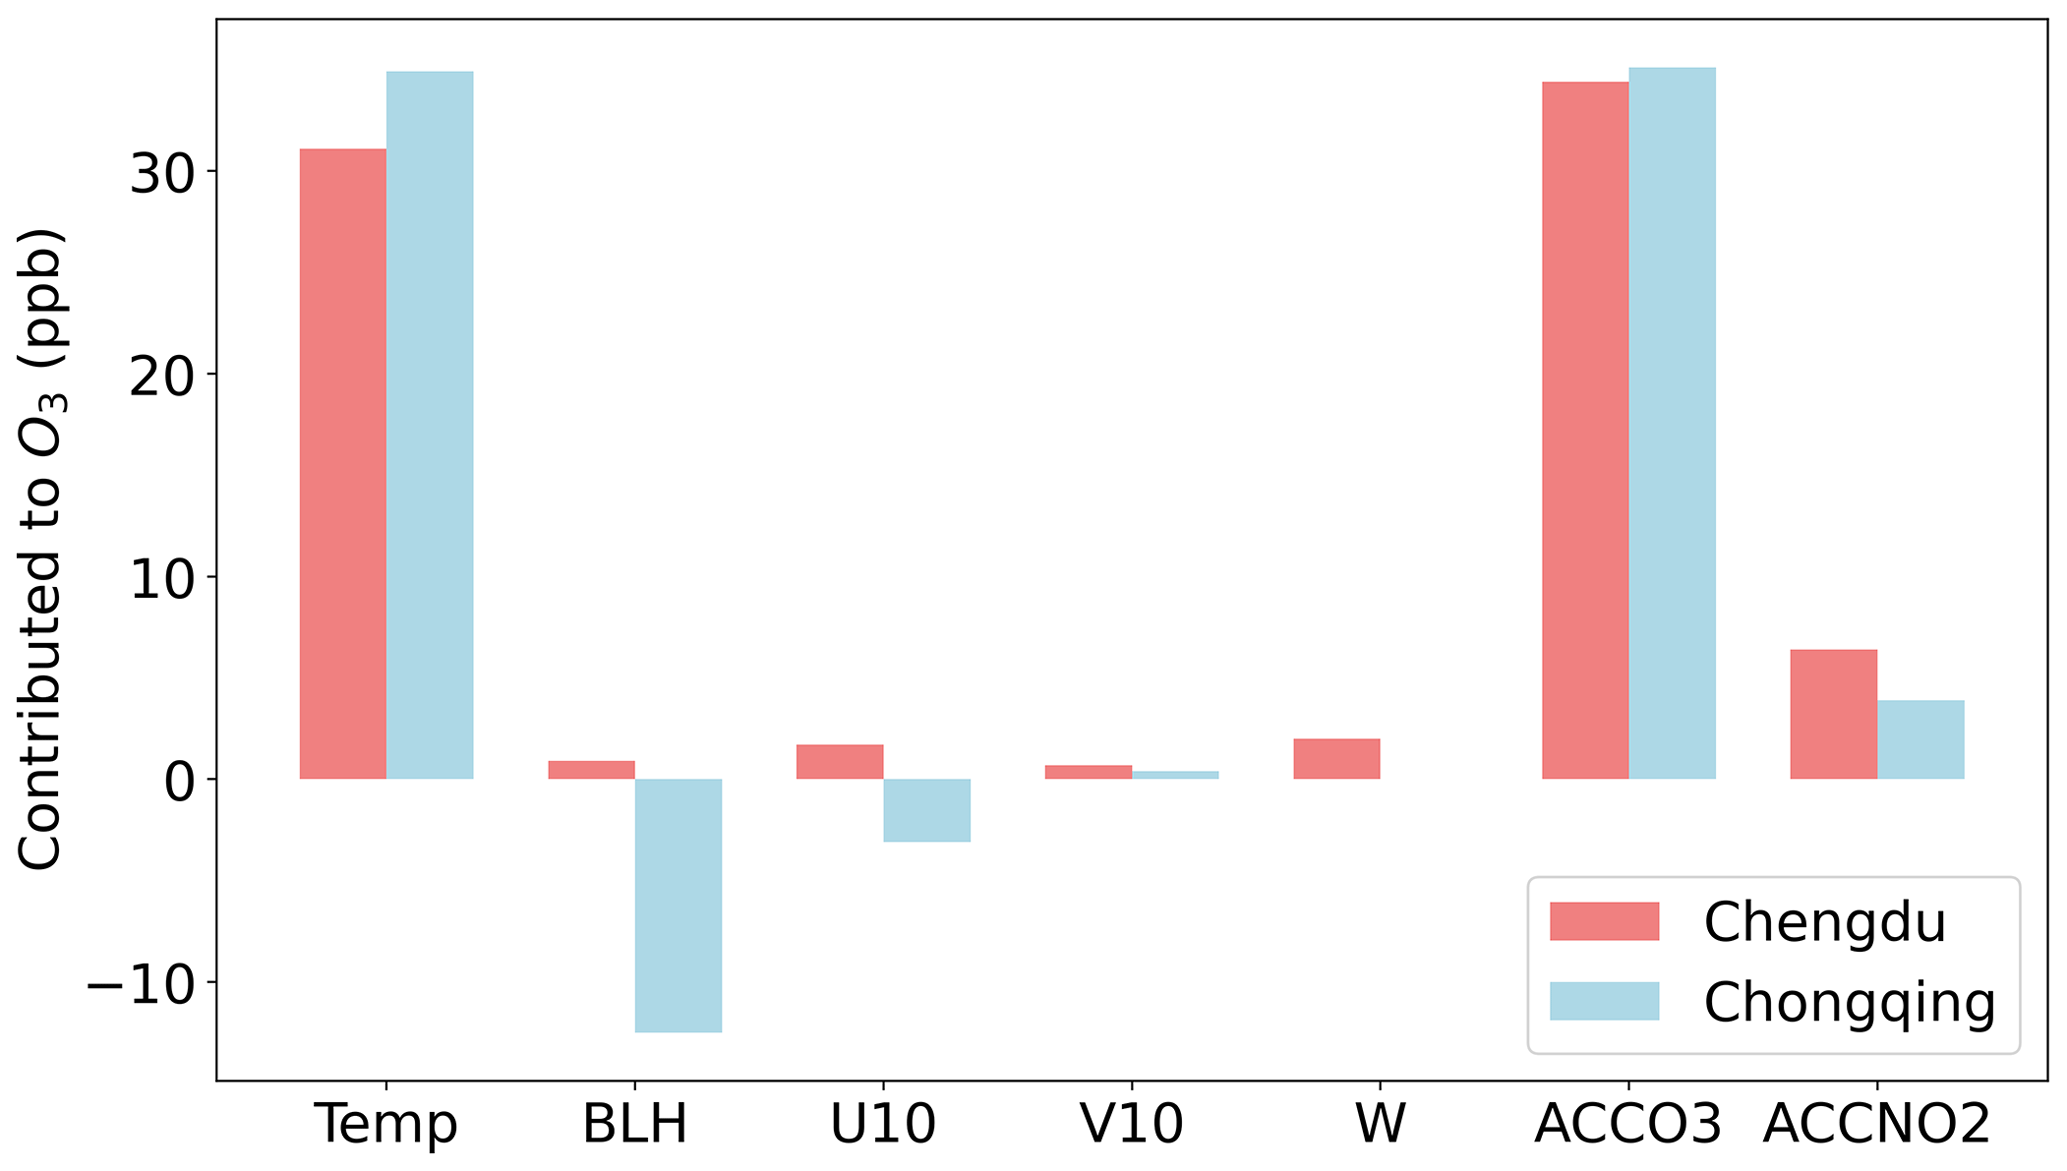
Figure 3Contribution of multi-factors influencing O3 concentrations in Chengdu and Chongqing, respectively. Temp, SSR, BLH, U10, V10, W, ACCO3, and ACCNO2 stand for temperature, surface solar radiation, boundary layer height, 10 m u component of wind, 10 m u component of wind, vertical wind, previous night accumulative O3, and previous night accumulative NO2, respectively.
3.2 Difference in heatwave-intensified BVOC emissions and their impact on O3 formation
In addition to the influence of meteorological factors under heatwave conditions, the precursors also play important roles in contributing O3 concentrations. Therefore, we utilized the OBM model to compute and identify the primary VOC components that exerted a substantial influence on O3 levels. Here, we introduced the RIR values that could reflect the importance of a given species to O3 concentrations. As Fig. 4 shows, alkenes and aromatic hydrocarbons were the principal VOC components influencing O3 levels in both cities. In Chengdu, the most influential VOC species on O3 concentrations included isoprene, m-xylene, trans-2-butene, o-xylene, cis-2-butene, toluene, ethene, 1-hexene, 1,2,4-trimethylbenzene, and 1,2,3-trimethylbenzene. Similarly, in Chongqing, the primary VOC contributors to O3 levels were isoprene, m-xylene, trans-2-butene, cis-2-butene, o-xylene, 1,2,4-trimethylbenzene, trans-2-pentene, propane, cis-2-pentene, and toluene. According to the results, both Chengdu and Chongqing should prioritize the regulation of alkenes and aromatic hydrocarbons from sources like vehicular emissions and solvent usage. Besides, the results clearly highlight isoprene as the dominant VOC species impacting O3 levels. The characteristics of the heatwave were high temperature, intense solar radiation, and dry air conditions. These meteorological factors significantly enhanced the emission of BVOCs from vegetation, indicating the notable role of heatwave-triggered natural emissions in secondary O3 pollution.
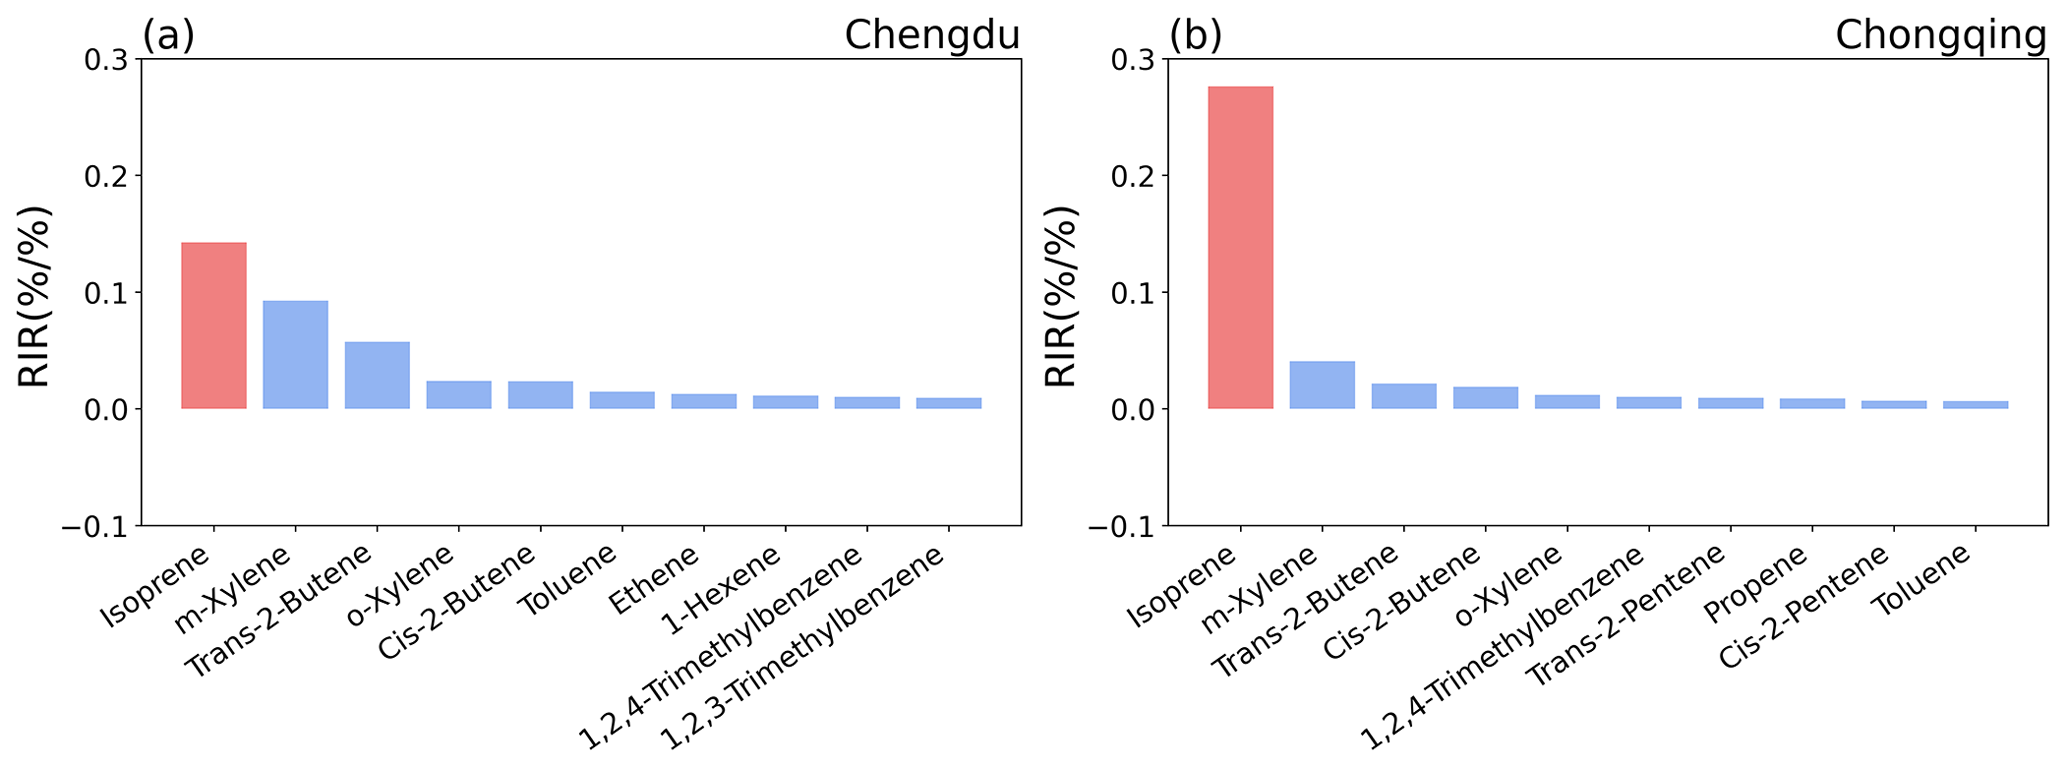
Figure 4OBM calculated the top-10 VOC species with the highest RIR values in (a) Chengdu and (b) Chongqing, respectively.
We further examined the relationship between isoprene, temperature, and O3 using observational data. In order to expand the sample size, we gathered a dataset corresponding to the daily maxima O3 values recorded during the months of July and August in 2022. In Chengdu, the variations of isoprene and temperature basically showed an increasing trend, indicating that higher isoprene concentrations were associated with higher temperatures, which in turn coincided with elevated O3 levels (Fig. 5a). In Chongqing, the concentration of isoprene initially increased with rising temperatures. However, when the temperature surpassed approximately 40 °C, the isoprene concentration started to decrease with further temperature elevation (Fig. 5b). Notably, the peak values of O3 corresponded closely to the high values of isoprene, occurring at temperatures ∼ 38 to ∼ 42 °C. According to recent studies, isoprene emissions increase with rising temperatures, and even under high-temperature conditions when vegetation closes stomata, due to the indirect impact of elevated leaf temperature, it decreases only under extreme high-temperature drought conditions because of the inhibition of substrate supply (Potosnak et al., 2014; H. Wang et al., 2022). Here, the variation of isoprene with temperature in Chengdu and Chongqing illustrates these two distinctions, though the isoprene concentration being observed was aged.
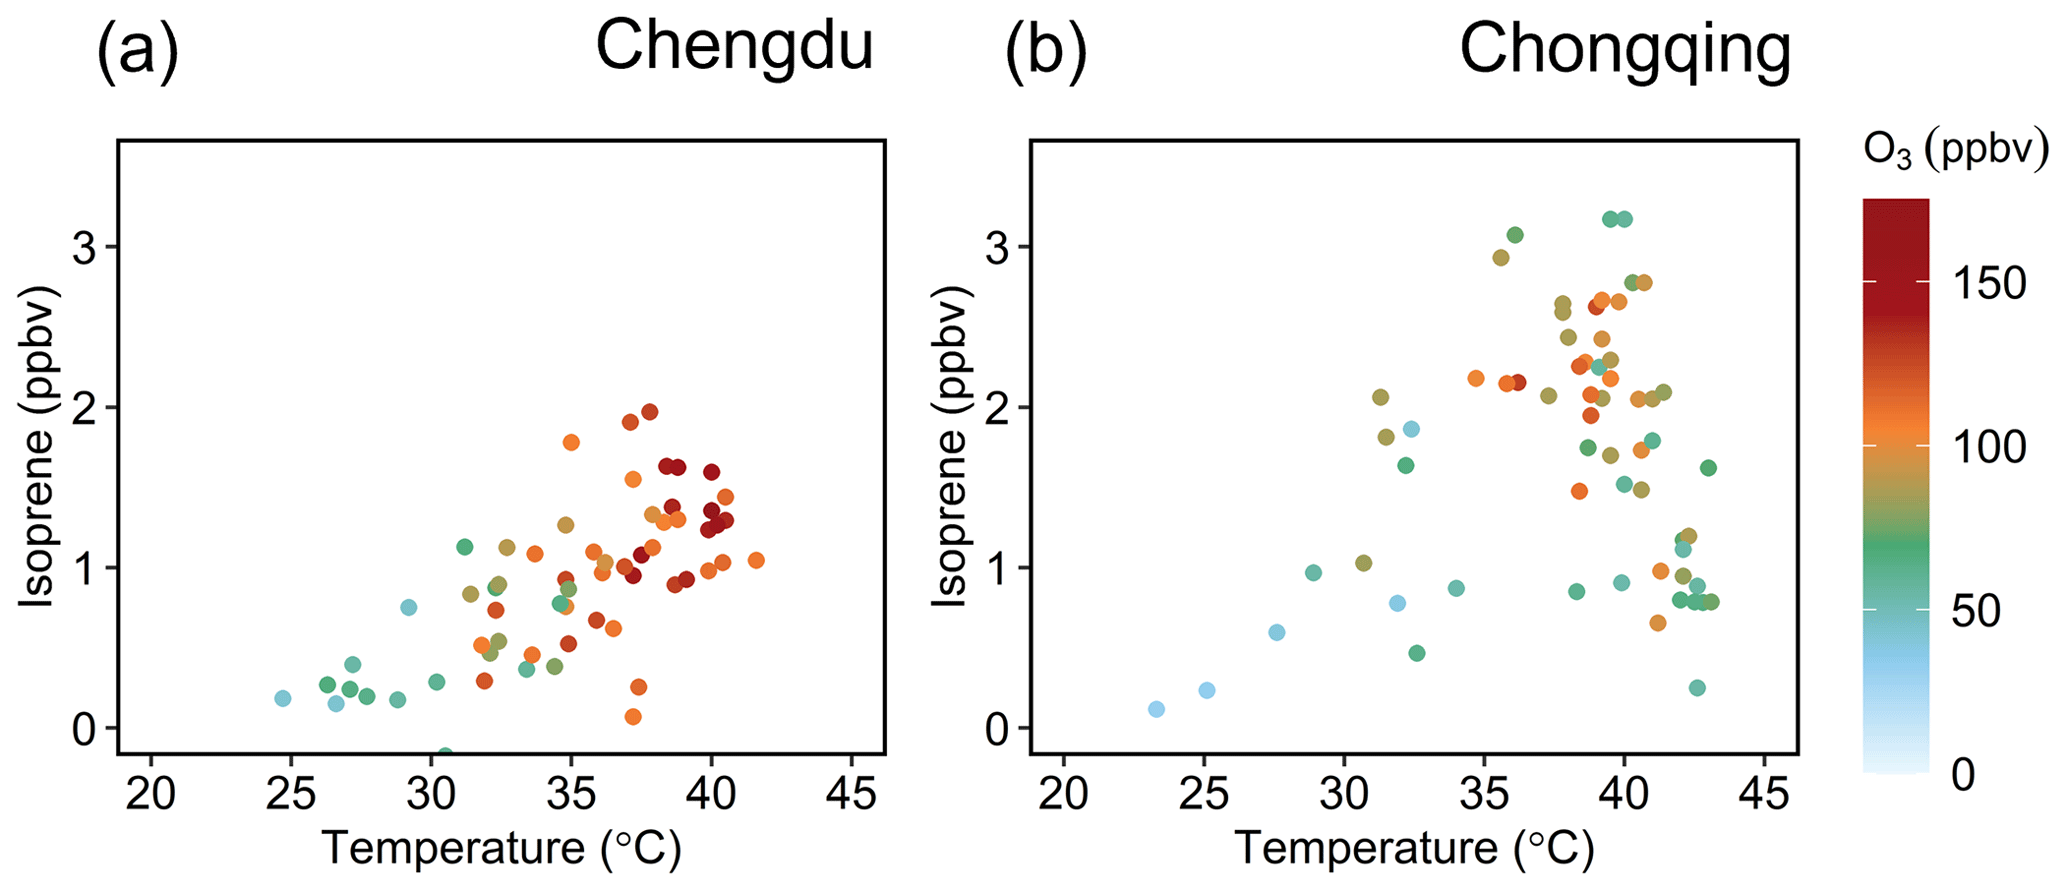
Figure 5Scatter plots of observed isoprene, temperature, and O3 in (a) Chengdu and (b) Chongqing. The data collected corresponded to daily maxima O3 concentrations from July 2022 to August 2022.
We utilized the theoretical calculation from the MEGAN model to quantify the disparities in isoprene emissions between the two cities. Considering the varying administrative areas of Chengdu (14 378 km2) and Chongqing (82 339 km2), comparing the total isoprene emissions might not be appropriate. Instead, we quantified the emissions per unit grid area (9 × 9 km) for both locations (Fig. 6). We used two sets of meteorological fields to drive the MEGAN model. One set corresponded to the meteorological fields simulated by WRF for the summer of 2021, while the other set corresponded to the meteorological fields simulated by WRF for the summer of 2022. Among these, the BVOC emissions obtained by driving the MEGAN model with the meteorological fields from the summer of 2021 were considered isoprene (ISOP) emissions by the base meteorology (Base METE). The difference in BVOC emissions obtained by driving the MEGAN model with the meteorological fields from the summer of 2022, compared to Base METE, was considered as ISOP emission induced by heatwaves (By Heatwave). It could be observed that the isoprene emissions in Chongqing were higher than those in Chengdu (nearly twice as much). In particular, under the influence of heatwaves, the isoprene emissions in Chongqing and Chengdu increased by 41.1 % and 22.2 %, respectively. The significant role of heatwave-intensified BVOC emissions was expected to aggravate O3 pollution in Chengdu and Chongqing. With the aid of CMAQ-ISAM simulation, we proceeded to quantify the distinct impacts of anthropogenic emissions and BVOC emissions on O3 concentrations. The findings indicated that at 13:00, when photochemical reactions were most intense, anthropogenic emissions contributed to 50.6 ppbv and BVOC emissions contributed to 33.3 ppbv in Chengdu. In comparison, anthropogenic emissions and BVOC emissions contributed to 31.3 and 20.6 ppbv in Chongqing, respectively. Interestingly, despite higher BVOC emissions in Chongqing compared to Chengdu, the contribution of BVOCs to O3 levels was actually smaller in Chongqing than in Chengdu. This implies that there were differences in the O3–NOx–VOC response mechanisms between the two cities.
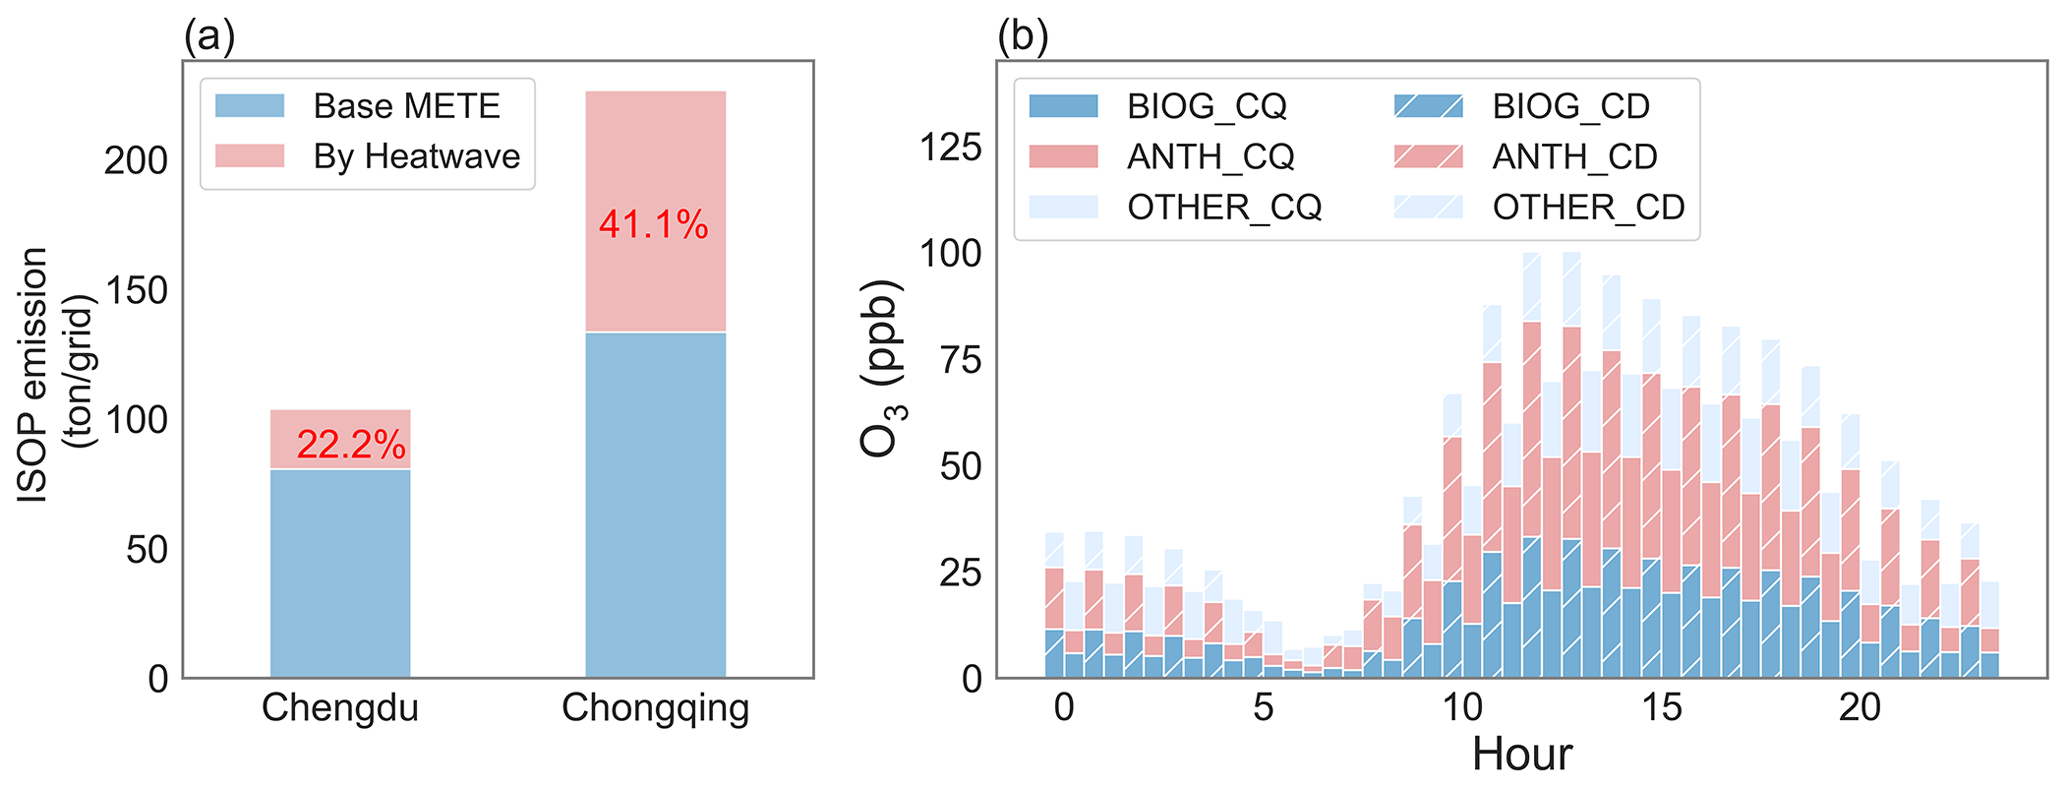
Figure 6(a) Meteorology-driven ISOP emission between Chengdu and Chongqing, respectively. (b) Averaged source contributions (by emissions) to diurnal O3 levels in Chengdu (CD) and Chongqing (CQ), respectively. BIOG, ANTH, and OTHER refer to contributions from biogenic, anthropogenic, and other sources.
Herein, we conducted CMAQ-DDM simulations to investigate the nonlinear relationship between O3 and its precursors. Indeed, the O3–NOx–VOC sensitivity response mechanisms in Chengdu and Chongqing were different (Fig. 7a–b). On the one hand, the Chengdu region demonstrated a greater sensitivity (first-order sensitivity coefficients) to VOCs in comparison to Chongqing. Specifically, in certain urban grids within Chengdu, the sensitivity coefficient exceeded 10 ppbv, while the highest sensitivity in Chongqing was only ∼ 3 ppbv. On the other hand, Chongqing generally exhibited higher sensitivity to NOx, except for quite limited urban cores. In contrast, the eastern areas of Chengdu, particularly its urban cores, displayed low sensitivity to NOx. Furthermore, by taking both the first-order sensitivity coefficient and the second-order sensitivity coefficient into account, we constructed the O3 isopleth for both cities during the month of August (Fig. 7c–d). It was evident that Chengdu was situated in a VOC-limited regime, while Chongqing was operating within a mixed-limited regime. These simulated results agree with the satellite-diagnosed O3 formation sensitivity (obtained through the ratio of HCHO and NO2), confirming again the good modeling performance (Fig. S5). The results implied that a temporary decrease in NOx emissions in Chengdu would result in an increase in O3 concentrations, whereas reducing VOC emissions could potentially lower O3 pollution. This finding could partially explain the increasing trend of O3 concentrations in Chengdu Plain during the past as the previous emission control measures mainly targeted NOx emissions (driven by the need to control acid rain and PM2.5 pollution successively). In Chongqing, differently, a reduction in either NOx emissions or VOC emissions could contribute to alleviating O3 pollution. The disparity in O3–NOx–VOC sensitivity between the two cities could also elucidate the reason that Chongqing, despite its higher BVOC emissions, exhibits a lower contribution to O3 levels. Considering the varying regional sensitivities in O3–NOx–VOC formation, it is advisable to implement precise emission reduction strategies tailored to the unique sensitivities of each city for effective pollution prevention and control. This approach stands in contrast to a uniform solution that may not suit all contexts. For example, in Chengdu, the previously nationally implemented strategy, which prioritized NOx-focused control, might ultimately lead to O3 reduction through substantial NOx reductions. However, this approach would initially enter into a phase characterized by relatively high O3 concentrations (positioned within the transitional regime based on the O3 isopleth), posing environmental risks. Instead, a strategy centered on VOC control alongside simultaneous NOx control could bypass the high-O3 phase and align with the need to address both O3 and PM2.5 pollution.
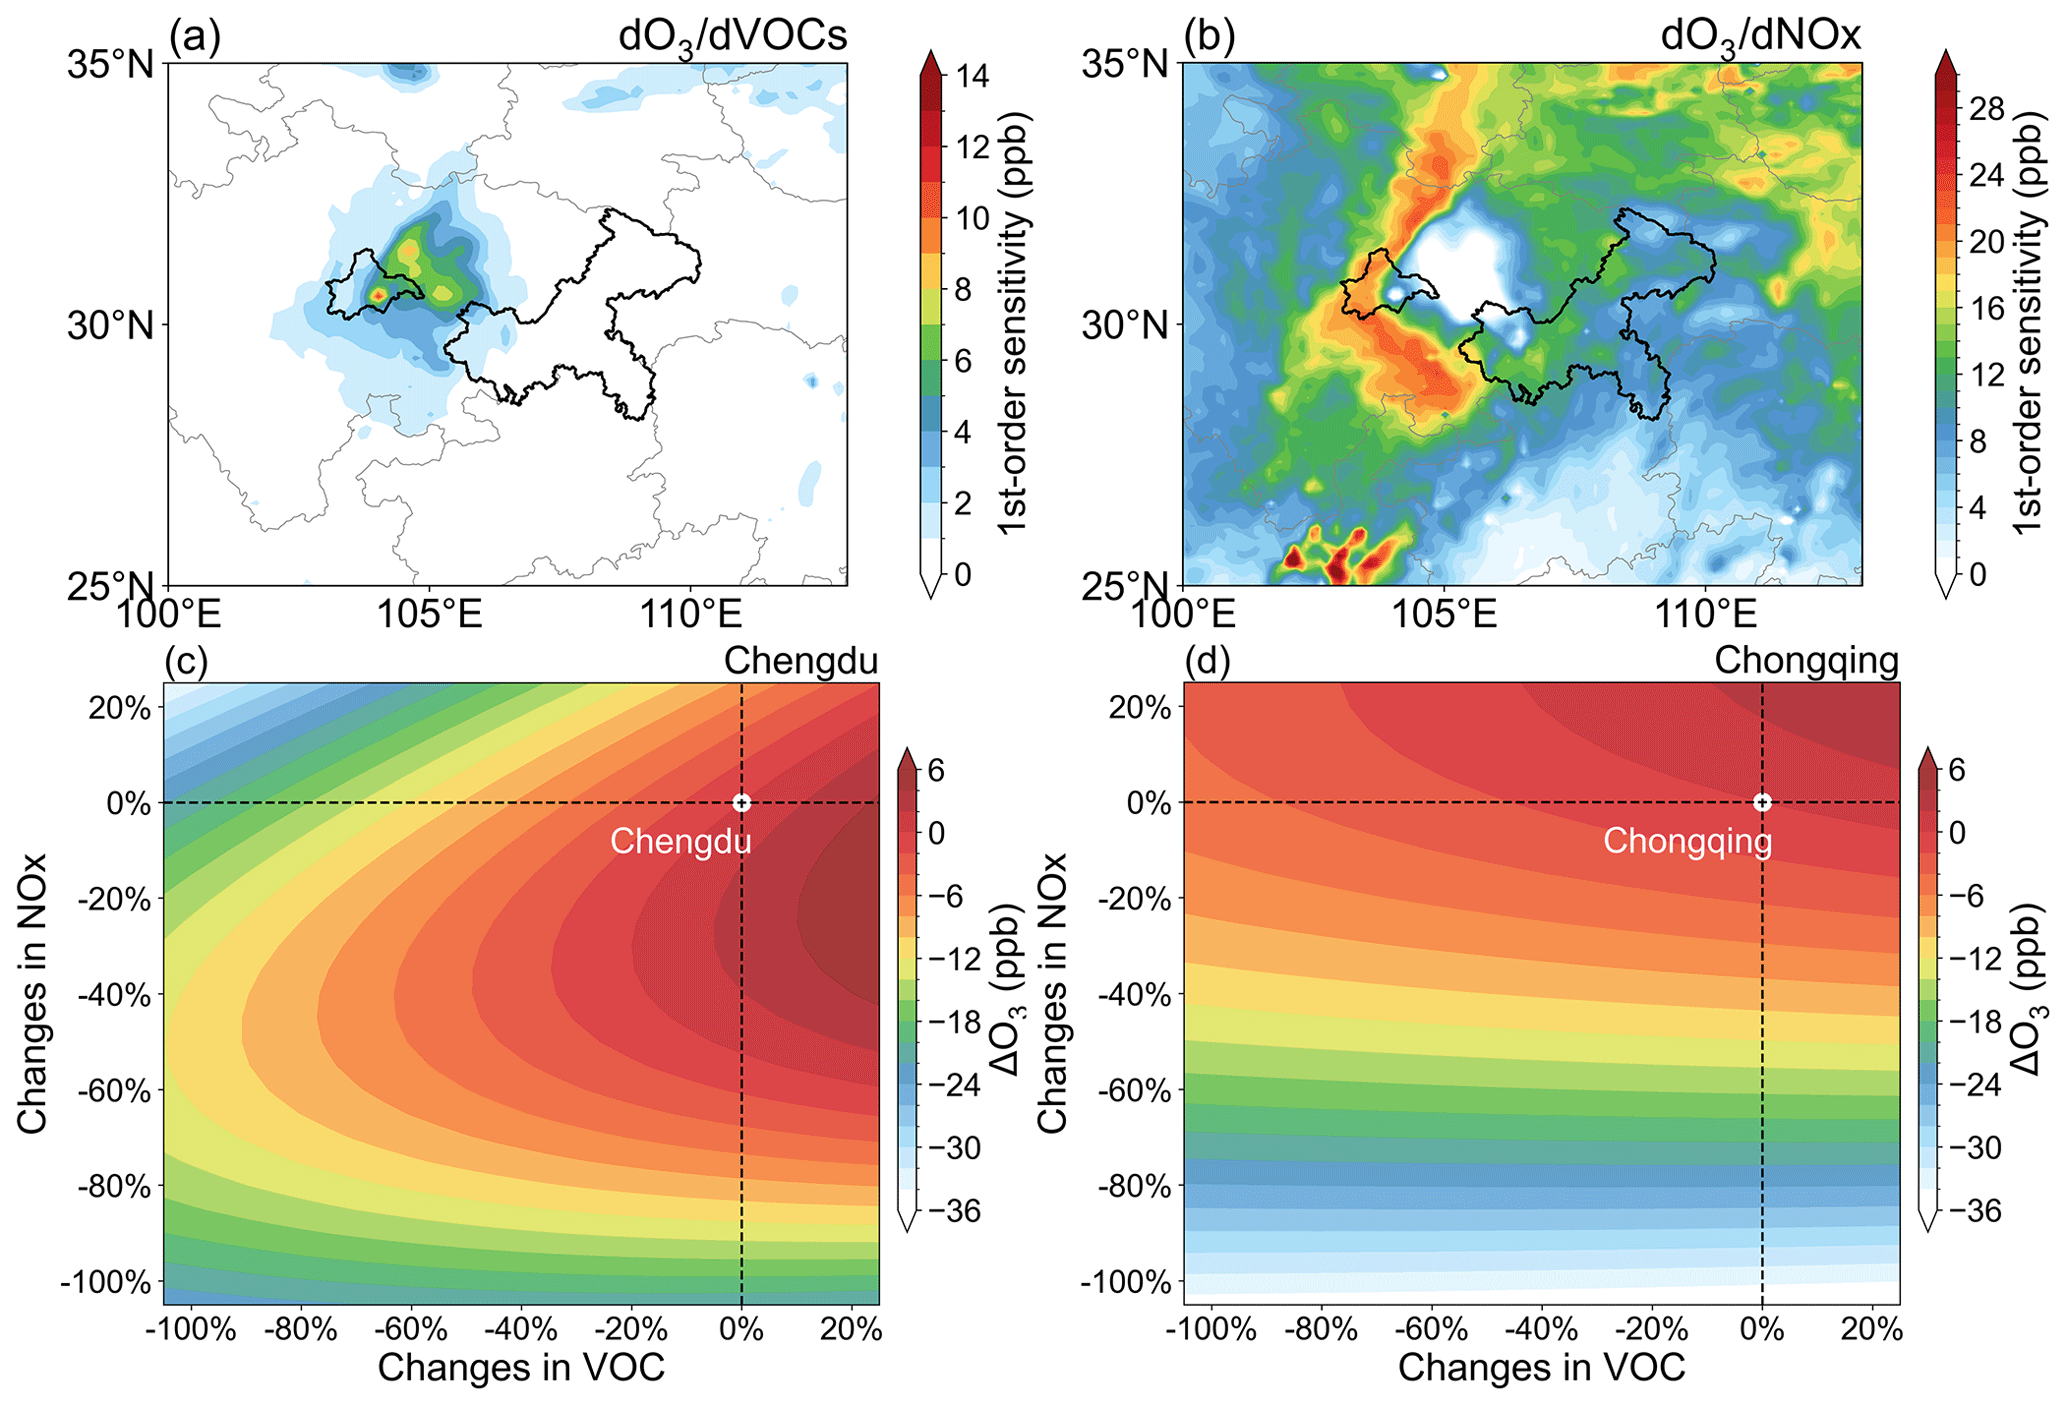
Figure 7Spatial distribution of daytime first-order sensitivity coefficients to (a) VOCs and (b) NOx. O3 isopleth plots are shown for (c) Chengdu and (d) Chongqing.
3.3 Regional divergence of source region contribution
Surface-level O3 concentrations are influenced not only by photochemical reactions but also by regional transport. In this section, we mainly focus on the disparities in the impact of regional transport on O3 between Chengdu and Chongqing.
The distribution of O3 concentration in China's southwestern region, as shown in Fig. 8a, revealed that high O3 concentrations were mainly concentrated in the SCB region. In contrast, the O3 concentration in the adjacent Yunnan–Guizhou Plateau (southeast) was very low, indicating a poor-O3 region. According to the synoptic flows, it could be seen the prevailing wind was southeastward, and the wind speed gradually decreased from east to west, implying that Chengdu wind was more stationary than Chongqing. Our LPDM-simulated 72 h backward retroplumes (Fig. 8b) show that Chengdu was primarily influenced by local air masses encompassing areas such as the city of Chengdu and the eastern parts of the SCB. Relatively fewer air masses originated from cross-province transport in the southeast direction. The distribution of NOx emissions showed that Chengdu was significantly influenced by the locally anthropogenic emissions. Differently, Chongqing showed a situation to be more susceptible to cross-regional transport influences. The dominant air masses in Chongqing not only originated locally but also experienced cross-province transport from the southeast, influenced by the regions such as Yungui Plateau, a poor-O3 region with relatively low anthropogenic emissions but high BVOC emissions. Considering the strong reactivity and limited lifetime of BVOCs, their role in downwind air quality is rather limited. To support this, we adopted CMAQ-ISAM to identify the local and non-local O3 precursors with their relative contribution to O3 concentrations in both cities (see discussions below). The LPDM simulation result was consistent with the synoptic analysis in Fig. S6. By examining the difference between 2022 Aug and climate average (1990–2021), it was found that the anomalies of high air temperature and low relative humidity were connected with the strong-southerly driven cross-regional transport of cool and relatively clean air masses from the Yungui Plateau, which could suppress the photochemical O3 production in Chongqing. In contrast, Chengdu experienced typical stationary conditions, with light wind, high temperature, and low relative humidity, which were conducive to local photochemical pollution.
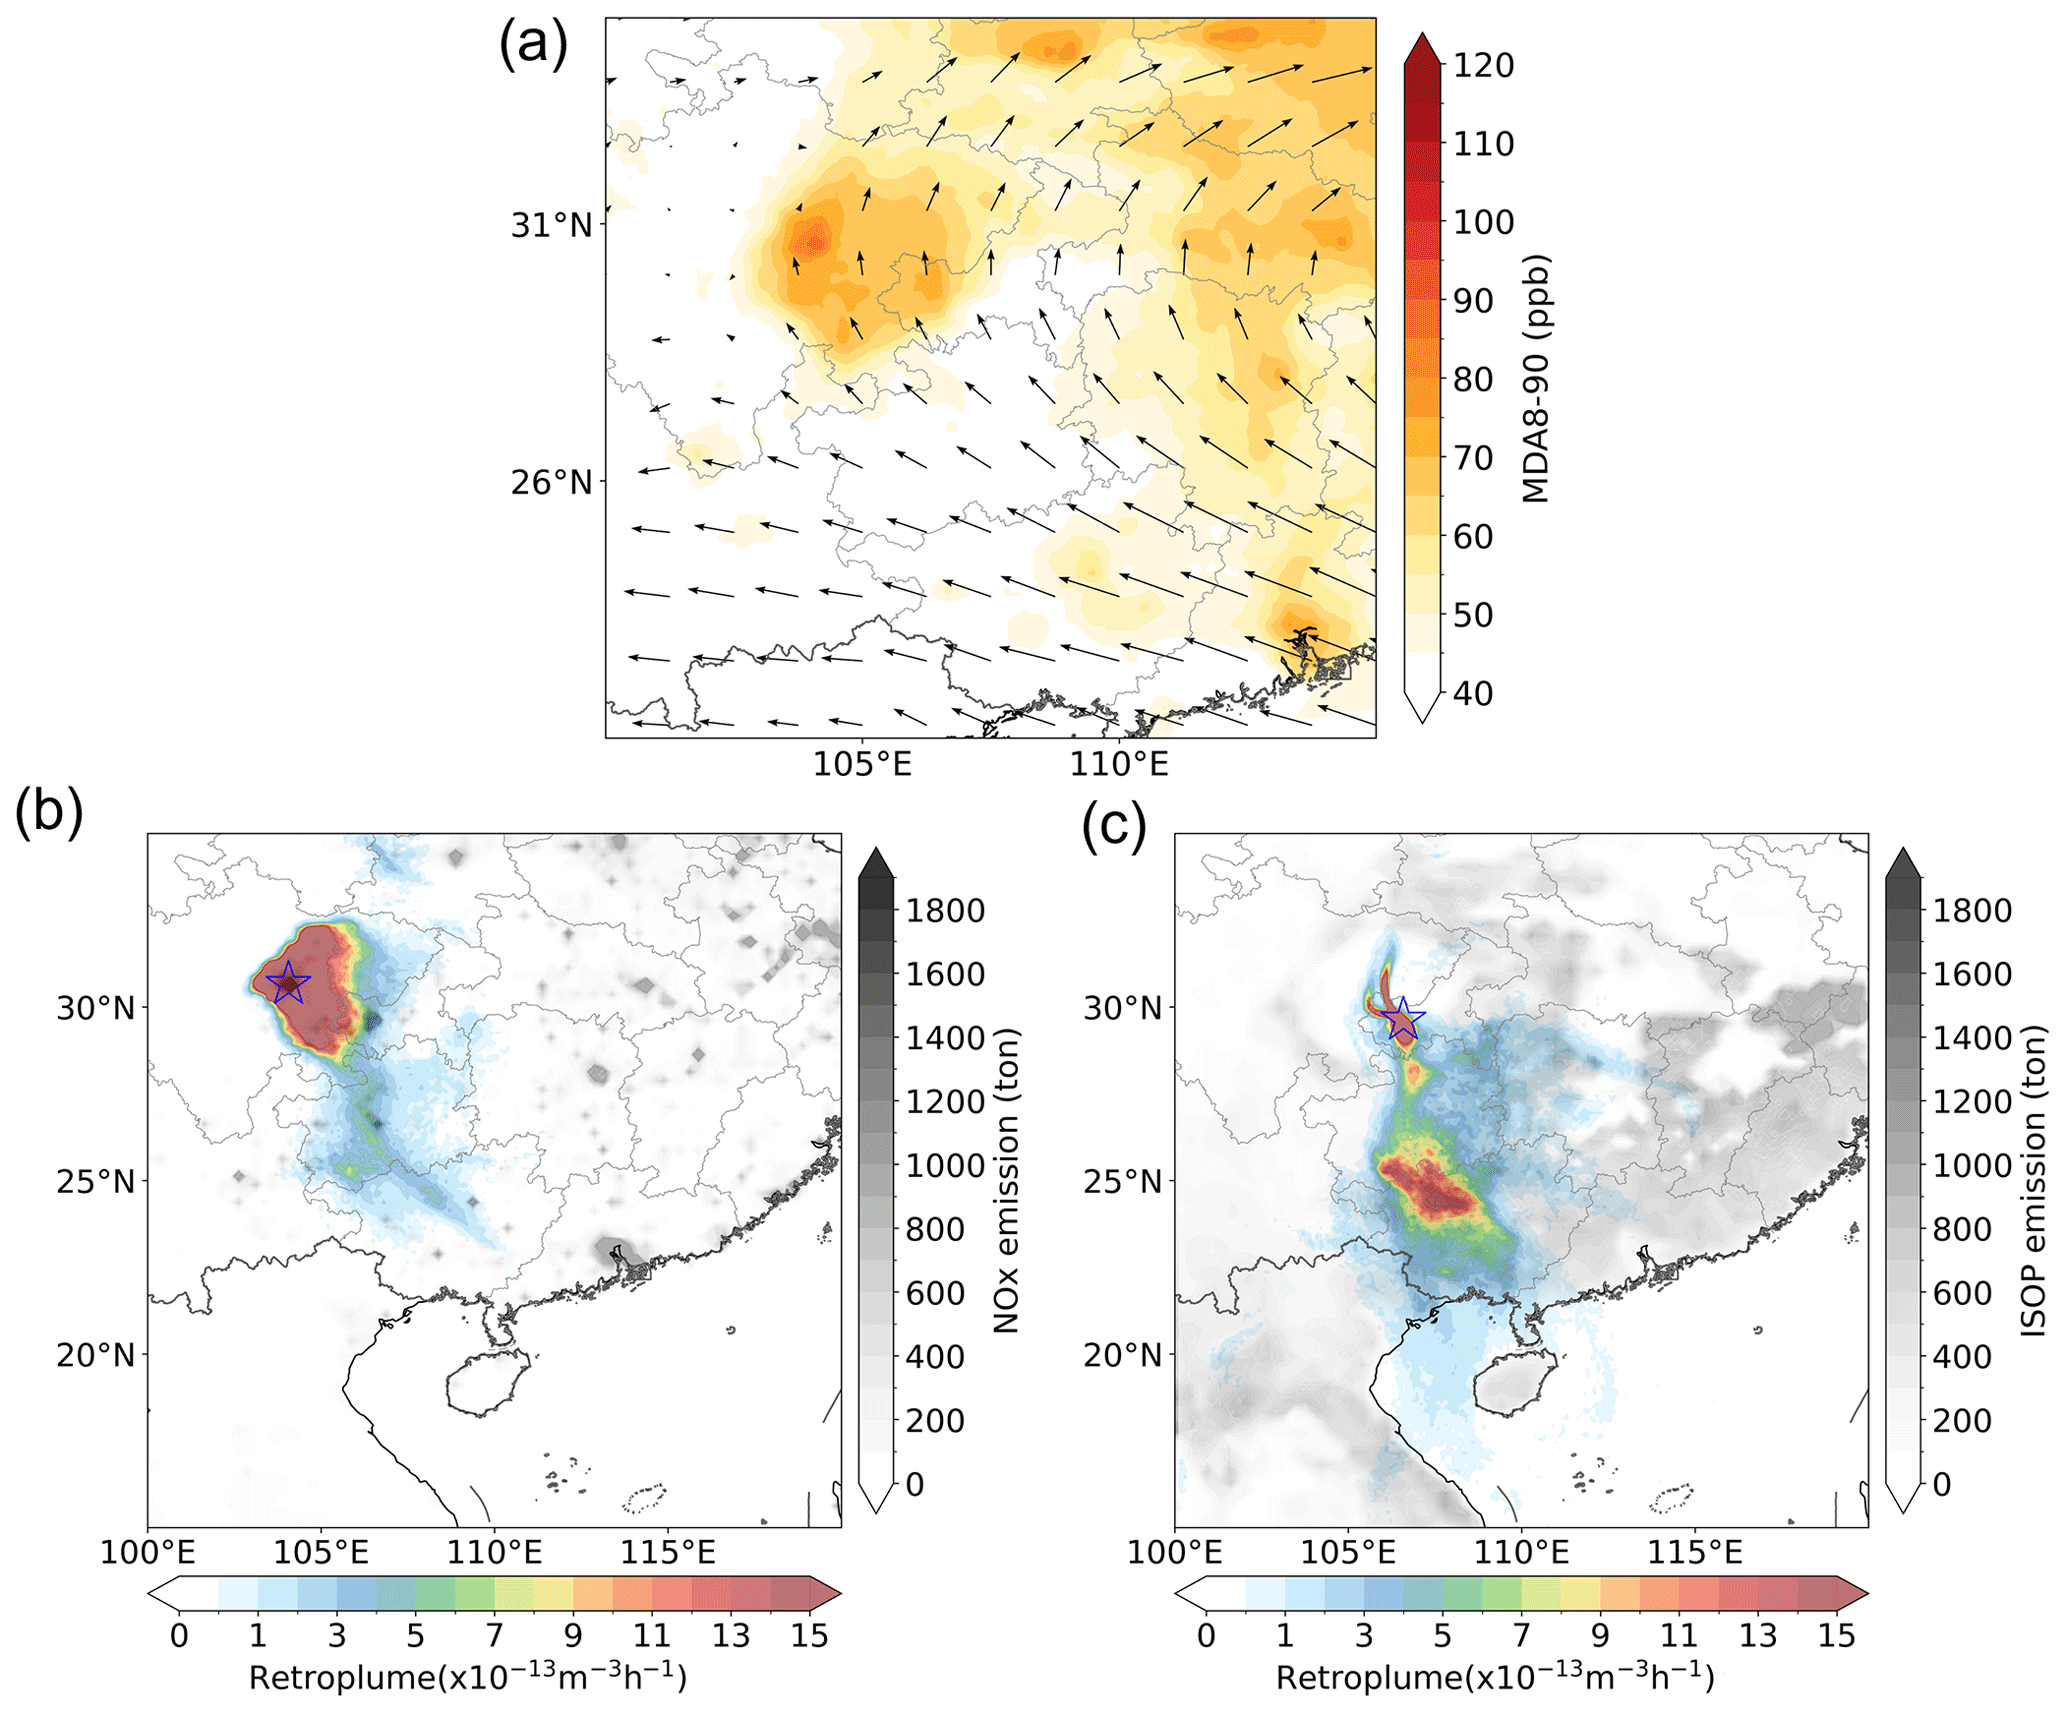
Figure 8(a) Distribution of monthly averaged 90th percentile of MDA8 O3 (MDA8-90; TAP dataset) concentrations and monthly averaged winds at 500 hPa, (b) the 72 h retroplume (footprint residence time) showing transport pathways of air masses arriving at Chengdu and distribution of anthropogenic NOx emissions, and (c) the 72 h retroplume (footprint residence time) showing transport pathways of air masses arriving at Chongqing and distribution of biogenic isoprene (ISOP) emissions in August 2022.
Besides, we also adopted the in situ-measured data by comparing the ratio of m- and p-xylene and ethylbenzene. Given that m- and p-xylene are more reactive than ethylbenzene, their ratios typically decrease due to photochemical reactions that take place during the transport of air masses. As shown in Fig. S7, the ratio was much lower in Chongqing (1.04 ppbv ppbv−1), indicating the presence of aged air masses being monitored. Conversely, a higher ratio (3.11 ppbv ppbv−1) in Chengdu indicated the prevalence of fresh air masses likely originating from local emissions. The discovery reaffirmed that Chongqing exhibited superior ventilation conditions compared to Chengdu. This inference suggests that Chongqing's enhanced dispersion capacity played a pivotal role in significantly reducing its O3 concentrations during the severe heatwave period.
Further, we employed the CMAQ-ISMA modeling system to quantify the source regions' contribution to Chengdu and Chongqing (Fig. 9). In this study, we divided the study area into eight major regions, namely Chengdu Plain (CD Plain), Chongqing (CQ), South Sichuan (South SC), Northeast Sichuan (Northeast SC), Northwest Region (Northwest), Southwest Region (Southwest), Northeast Region (Northeast), and Southeast Region (Southeast) (Fig. S3). Generally, the regions like CD Plain, CQ, Northeast SC, and South SC were distributed within the SCB region and could be regarded as the local regions. On the other hand, regions like Northwest, Southwest, Northeast, and Southeast were situated outside the SCB, and air masses originating from these regions were considered to be a result of regional transport. As Fig. 9 shows, Chengdu was mainly affected by local regions, which contributed to 46.8 %. This implied that local emissions within the SCB were a significant contributor to the excessive O3 levels in Chengdu. In contrast, the influence of the local region on O3 levels in Chongqing was only 18.3 %. Instead, the contribution outside the basin almost reached 50 %, indicating that Chongqing was more susceptible to the influence of cross-regional transport. In general, the spatial disparity of O3 pollution between Chongqing and Chengdu was decided by the changes in regional transport of O3 and its precursors, respectively, with high and low contributions of non-local O3 precursors to the two urban areas. This difference demonstrates that even the two major core cities located within the SCB exhibit distinct source contribution characteristics.
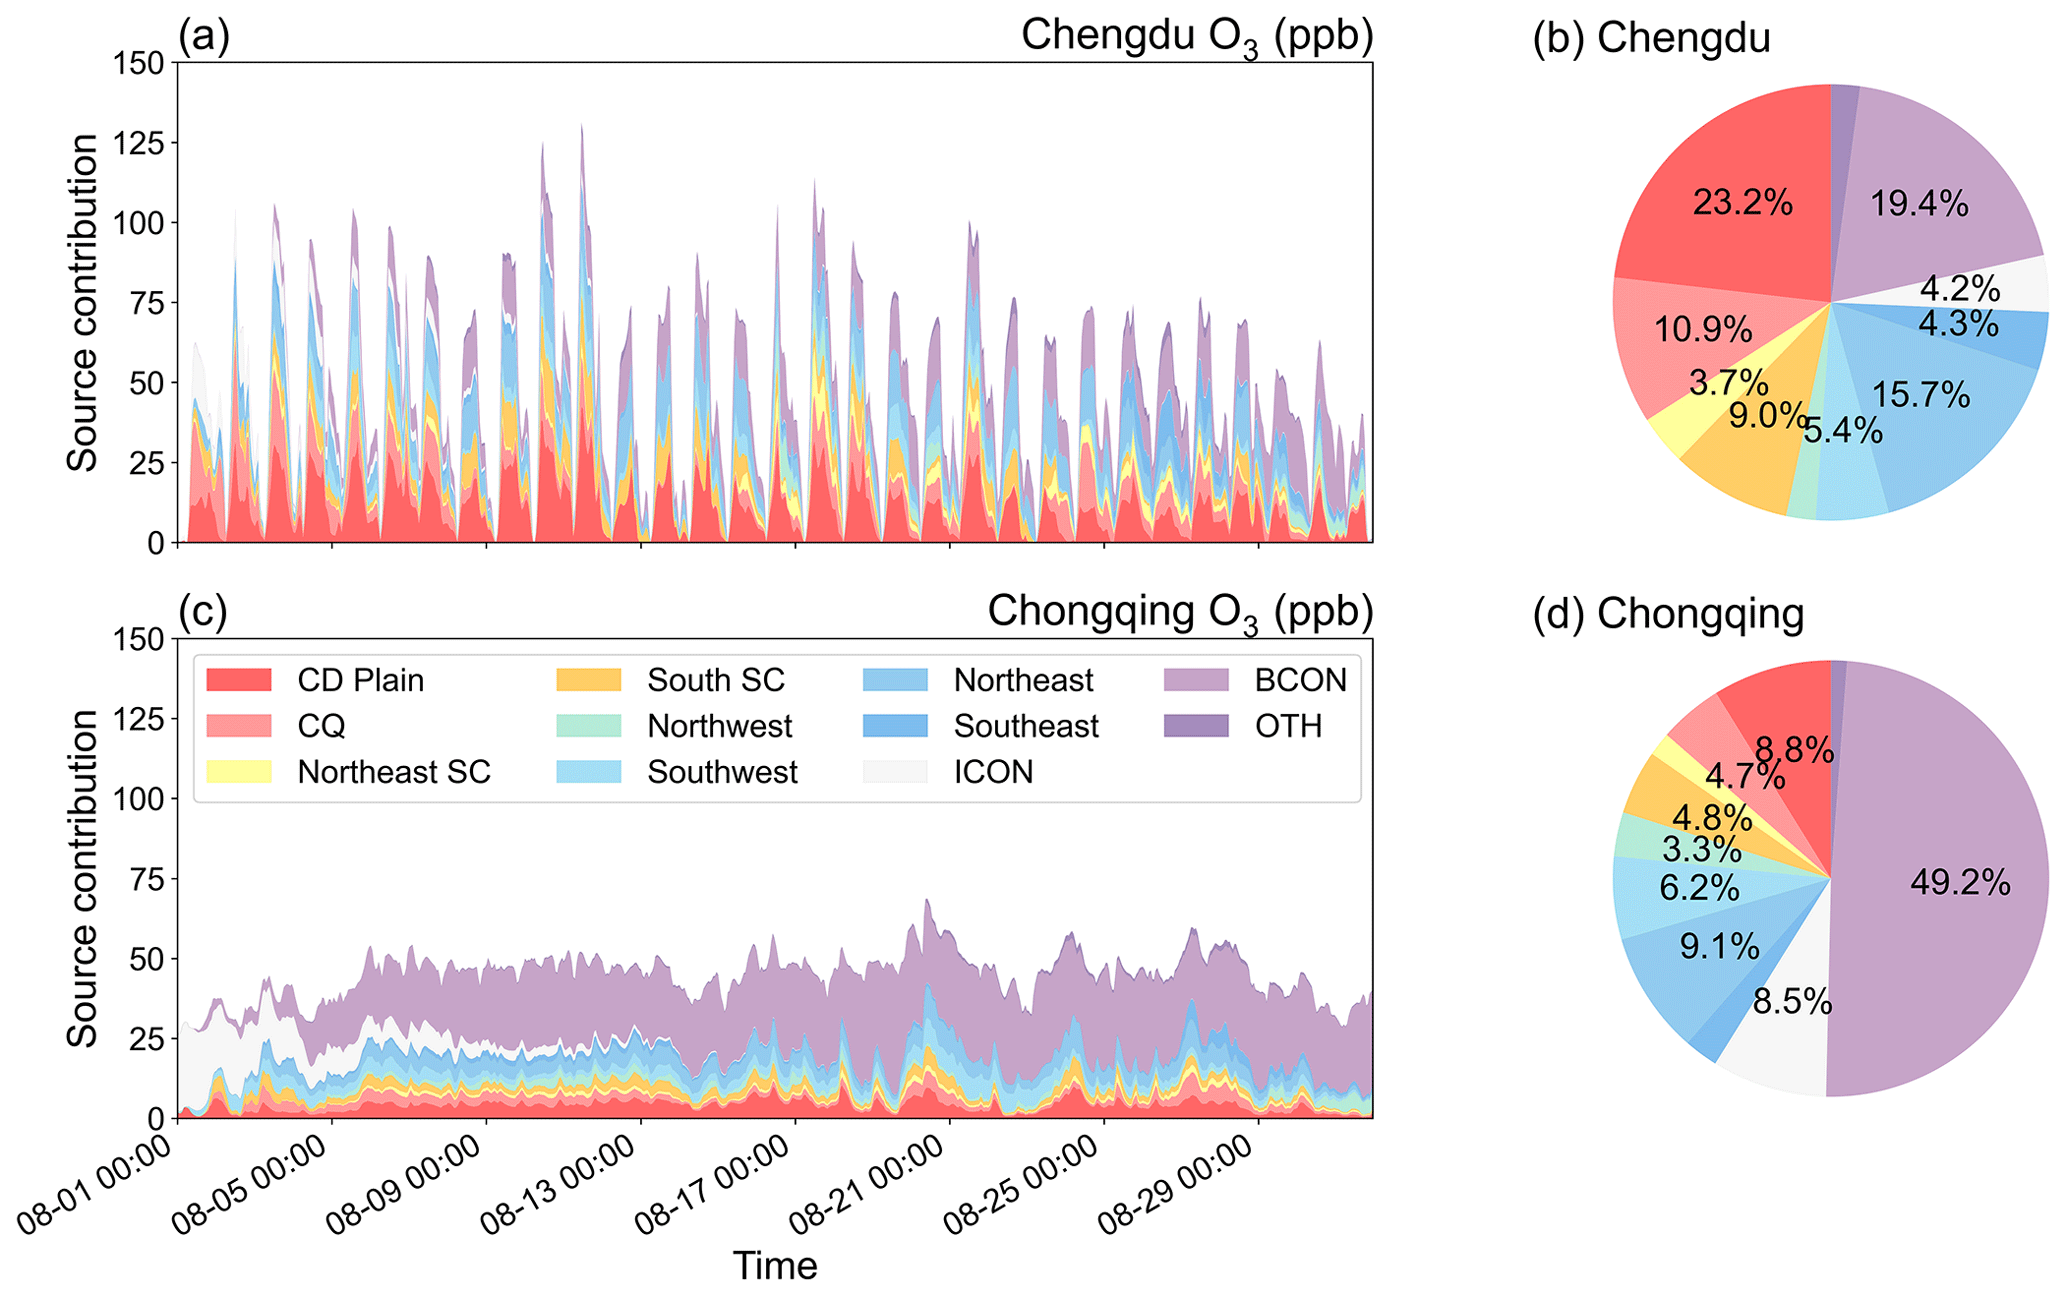
Figure 9Source regions' contribution to O3 levels in Chengdu. (a) Time series of O3 contributions from each region. (b) Pie charts illustrating the percentage contributions of each region. Panels (c) and (d) are the same as panels (a) and (b) but for Chongqing.
Given that ambient O3 concentrations are the integrated results of multiple processes, encompassing photochemical formation, deposition, and transport, we employed the integrated process rate (IPR) tool within the CMAQ model to analyze the contributions of individual physical and chemical processes to O3 levels. Here, we compared the contributions of different processes to O3 during the peak period of heightened photochemical reactions at 14:00 LT in the afternoon. As Fig. 10 shows, the process analysis results reveal distinct differences between the two cities. Specifically, in Chengdu, photochemical reactions took the lead in escalating O3 levels (reaching 49.9 ppbv). This could be attributed to a combination of factors. On the one hand, being limited to the local air masses, pollutants accumulated, and this resulted in the increment of the atmospheric oxidizing capacity. On the other hand, under the influence of conducive meteorological conditions during heatwaves, the vigorous photochemical formation of O3 was substantially enhanced, resulting in notable O3 concentration increments. Compared to Chengdu, the contribution of photochemistry to O3 in Chongqing was nearly half (29.2 ppbv). While both photochemical reactions and regional transport positively affected O3 levels in Chongqing, the overall net accumulation of O3 was notably lower in this city.
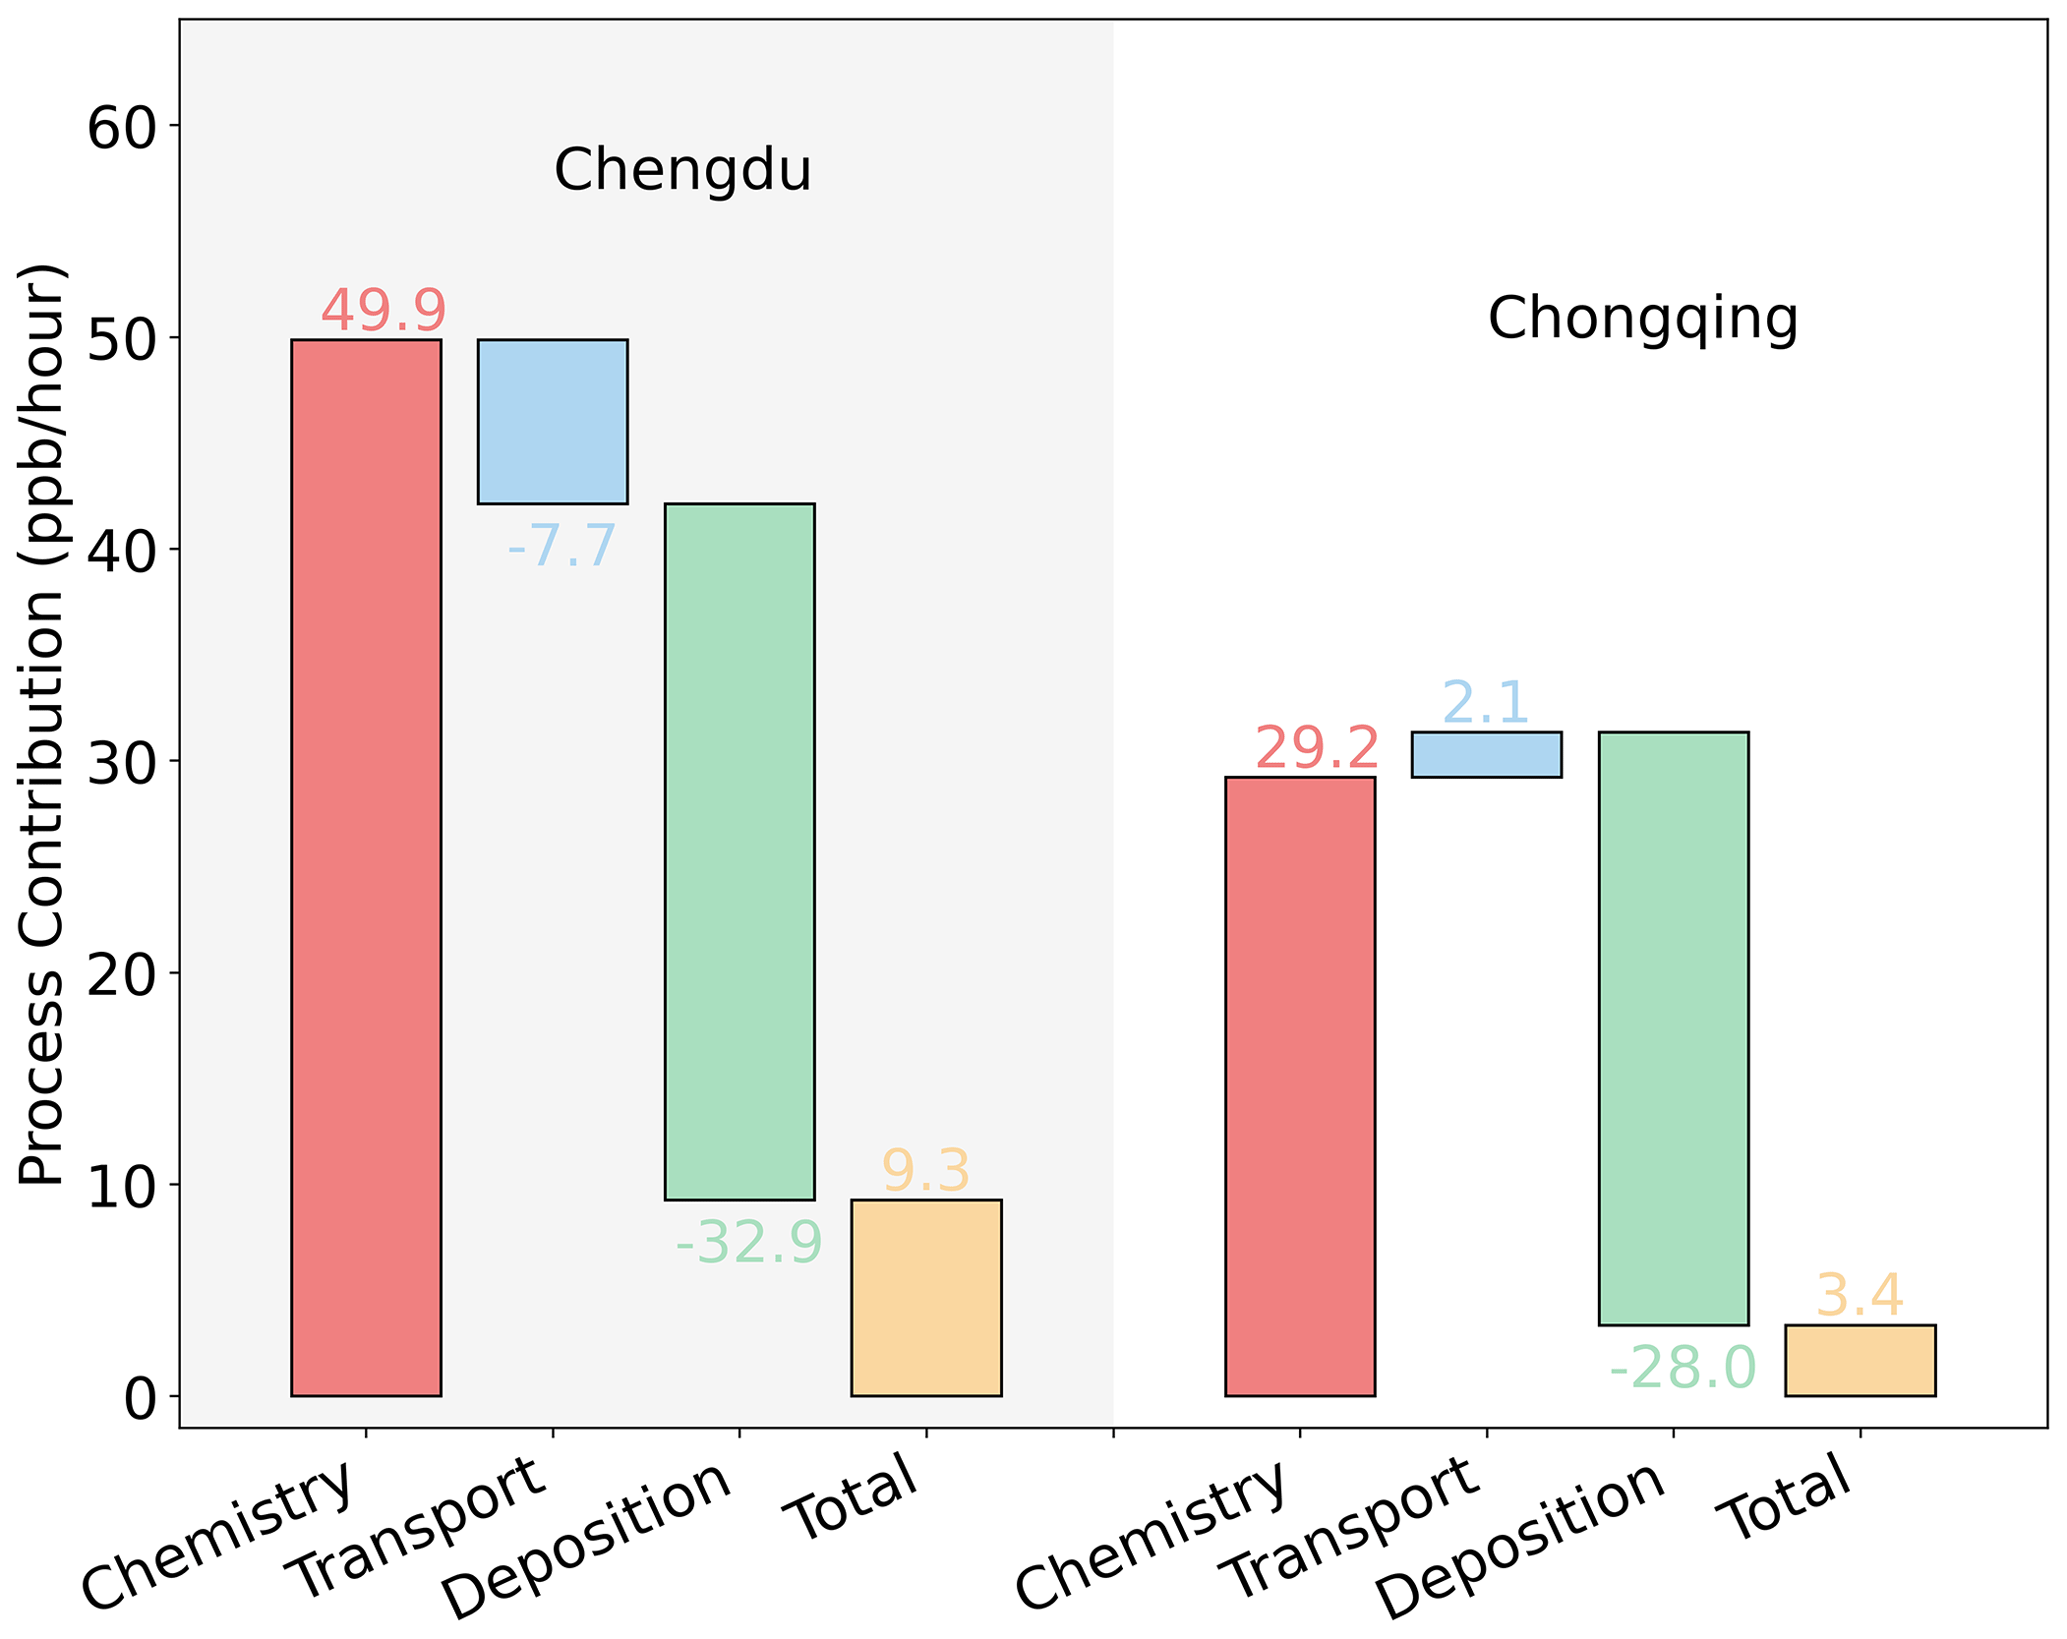
Figure 10Averaged contributions of different processes to O3 concentrations in the afternoon (14:00 LT) in Chengdu and Chongqing.
The unprecedented heatwave of August 2022 brought about significant divergence in O3 levels between Chengdu and Chongqing, with exceeded levels of O3 appeared in the western SCB (Chengdu) but relatively lower concentrations in the eastern basin (Chongqing). Meteorological and precursor factors were assessed using a machine learning method, highlighting high temperatures, intensive solar radiation, and overnight accumulative pollutants as key contributors to O3 concentration. The interplay of isoprene, temperature, and O3, alongside MEGAN calculations, underscored the intensified BVOC emissions during heatwaves, highlighting the important role of meteorology-induced natural emissions. Interestingly, BVOC emissions in Chongqing were nearly twice those in Chengdu; however, their contributions to O3 concentrations were subdued. This discrepancy was attributed to the distinct responses of O3–NOx–VOC sensitivity mechanisms. Chengdu exhibited sensitivity to VOCs, while Chongqing displayed a transitional sensitivity regime. Considering that China's previous emission reduction strategies have primarily focused on a nationwide NOx reduction (driven by the need to control PM2.5 pollution), it is important to recognize that a short-term reduction in NOx can lead to an O3 rebound in regions like Chengdu Plain. To achieve more precise pollution control, a strategy that combines VOCs as the primary focus with concurrent NOx reductions would be more appropriate. In addition, the investigation into source region contributions revealed varying impacts of regional transport, even within the same basin. Chongqing was significantly influenced by cross-regional transport, whereas Chengdu was predominantly affected by local emissions.
These findings illuminate the complex interplay of meteorology, natural emissions, and anthropogenic sources during heatwaves, guiding the necessity of targeted pollution control measures. It is imperative to adopt emission control strategies that are customized according to regional or even local conditions, rather than enforcing uniform measures for the entire region. Given that O3 pollution is not solely an in situ problem but rather a regional issue, this concept extends beyond the SCB and is applicable to other urban clusters, such as the Beijing–Tianjin–Hebei region, the Yangtze River Delta region, the Pearl River Delta region, and developed regions in other countries. Future efforts are suggested to focus on regional coordinated and balanced control measures.
The code and data used in this study are available from Nan Wang (nan.wang@scu.edu.cn).
The supplement related to this article is available online at: https://doi.org/10.5194/acp-24-3029-2024-supplement.
FY and NW designed the research. NW wrote the manuscript. NW, DY, CD, and MH contributed to the interpretation of the results. All the authors provided critical feedback and helped to improve the manuscript.
The contact author has declared that none of the authors has any competing interests.
Publisher’s note: Copernicus Publications remains neutral with regard to jurisdictional claims made in the text, published maps, institutional affiliations, or any other geographical representation in this paper. While Copernicus Publications makes every effort to include appropriate place names, the final responsibility lies with the authors.
The authors acknowledge the financial support of the National Key Research and Development Program, the National Natural Science Foundation of China, the Science and Technology Department of Sichuan Province, the Guangdong Basic and Applied Basic Research Foundation, the Fundamental Research Funds for the Central Universities, and the Young Talent Support Project of Guangzhou Association for Science and Technology. The authors also thank Tsinghua University for compiling and sharing the MEIC.
This research has been supported by the National Key Research and Development Program (grant no. 2023YFC3709304), the National Natural Science Foundation of China (grant nos. 42175124 and 22276128), the Science and Technology Department of Sichuan Province (grant no. 23YFS0383), the Basic and Applied Basic Research Foundation of Guangdong Province (grant no. 2022A1515011753), the Fundamental Research Funds for the Central Universities (grant no. YJ202313), and the Young Talent Support Project of Guangzhou Association for Science and Technology (grant no. QT-2023-048).
This paper was edited by Tim Butler and reviewed by two anonymous referees.
Bloss, C., Wagner, V., Jenkin, M. E., Volkamer, R., Bloss, W. J., Lee, J. D., Heard, D. E., Wirtz, K., Martin-Reviejo, M., Rea, G., Wenger, J. C., and Pilling, M. J.: Development of a detailed chemical mechanism (MCMv3.1) for the atmospheric oxidation of aromatic hydrocarbons, Atmos. Chem. Phys., 5, 641–664, https://doi.org/10.5194/acp-5-641-2005, 2005.
Cardelino, C. A. and Chameides, W. L.: An Observation-Based Model for Analyzing Ozone Precursor Relationships in the Urban Atmosphere, J. Air Waste Ma., 45, 161–180, https://doi.org/10.1080/10473289.1995.10467356, 1995.
Chen, D., Zhou, L., Wang, C., Liu, H., Qiu, Y., Shi, G., Song, D., Tan, Q., and Yang, F.: Characteristics of ambient volatile organic compounds during spring O3 pollution episode in Chengdu, China, J, Environ. Sci., 114, 115–125, 2022.
Daum, P. H., Kleinman, L. I., Springston, S. R., Nunnermacker, L., Lee, Y. N., Weinstein-Lloyd, J., Zheng, J., and Berkowitz, C. M.: A comparative study of O3 formation in the Houston urban and industrial plumes during the 2000 Texas Air Quality Study, J. Geophys. Res.-Atmos., 108, 4715, https://doi.org/10.1029/2003JD003552, 2003.
Ding, A., Huang, X., and Fu, C.: Air pollution and weather interaction in East Asia, in: Oxford Research Encyclopedia of Environmental Science, https://doi.org/10.1093/acefore/9780199389414.013.536, 2017.
Emberson, L., Ashmore, M., Murray, F., Kuylenstierna, J., Percy, K., Izuta, T., Zheng, Y., Shimizu, H., Sheu, B., and Liu, C.: Impacts of air pollutants on vegetation in developing countries, Water Air Soil Poll., 130, 107–118, 2001.
Hall, S. J., Matson, P. A., and Roth, P. M.: NOx emissions from soil: implications for air quality modeling in agricultural regions, Annu. Rev. Energ. Env., 21, 311–346, 1996.
Hu, J., Zhao, T., Liu, J., Cao, L., Wang, C., Li, Y., Shi, C., Tan, C., Sun, X., and Shu, Z.: Exploring the ozone pollution over the western Sichuan Basin, Southwest China: The impact of diurnal change in mountain-plains solenoid, Sci. Total Environ., 839, 156264, https://doi.org/10.1016/j.scitotenv.2022.156264, 2022.
Huang, J., Hartmann, H., Hellén, H., Wisthaler, A., Perreca, E., Weinhold, A., Rücker, A., van Dam, N. M., Gershenzon, J., and Trumbore, S.: New perspectives on CO2, temperature, and light effects on BVOC emissions using online measurements by PTR-MS and cavity ring-down spectroscopy, Environ. Sci. Technol., 52, 13811–13823, 2018.
Itahashi, S., Hayami, H., and Uno, I.: Comprehensive study of emission source contributions for tropospheric ozone formation over East Asia, J. Geophys. Res.-Atmos., 120, 331–358, 2015.
Jacob, D. J.: Heterogeneous chemistry and tropospheric ozone, Atmos. Environ., 34, 2131–2159, 2000.
Jenkin, M. E. and Clemitshaw, K. C.: Ozone and other secondary photochemical pollutants: chemical processes governing their formation in the planetary boundary layer, Atmos. Environ., 34, 2499–2527, 2000.
Jenkin, M. E., Saunders, S. M., and Pilling, M. J.: The tropospheric degradation of volatile organic compounds: a protocol for mechanism development, Atmos. Environ., 31, 81–104, https://doi.org/10.1016/S1352-2310(96)00105-7, 1997.
Jenkin, M. E., Saunders, S. M., Wagner, V., and Pilling, M. J.: Protocol for the development of the Master Chemical Mechanism, MCM v3 (Part B): tropospheric degradation of aromatic volatile organic compounds, Atmos. Chem. Phys., 3, 181–193, https://doi.org/10.5194/acp-3-181-2003, 2003.
Jenkin, M. E., Young, J. C., and Rickard, A. R.: The MCM v3.3.1 degradation scheme for isoprene, Atmos. Chem. Phys., 15, 11433–11459, https://doi.org/10.5194/acp-15-11433-2015, 2015.
Krupa, S. V. and Kickert, R. N.: The greenhouse effect: impacts of ultraviolet-B (UV-B) radiation, carbon dioxide (CO2), and ozone (O3) on vegetation, Environ. Pollut., 61, 263–393, 1989.
Kwok, R. H., Napelenok, S. L., and Baker, K. R.: Implementation and evaluation of PM2.5 source contribution analysis in a photochemical model, Atmos. Environ., 80, 398–407, 2013.
Lei, Y., Wu, K., Zhang, X., Kang, P., Du, Y., Yang, F., Fan, J., and Hou, J.: Role of meteorology-driven regional transport on O3 pollution over the Chengdu Plain, southwestern China, Atmos. Res., 285, 106619, https://doi.org/10.1016/j.atmosres.2023.106619, 2023.
Lelieveld, J. and Dentener, F. J.: What controls tropospheric ozone?, J. Geophys. Res.-Atmos., 105, 3531–3551, https://doi.org/10.1029/1999jd901011, 2000.
Lu, X., Zhang, L., and Shen, L.: Meteorology and Climate Influences on Tropospheric Ozone: a Review of Natural Sources, Chemistry, and Transport Patterns, Current Pollution Reports, 5, 238–260, https://doi.org/10.1007/s40726-019-00118-3, 2019.
McElroy, M. B., Salawitch, R. J., and Wofsy, S. C.: Antarctic O3: Chemical mechanisms for the spring decrease, Geophys. Res. Lett., 13, 1296–1299, 1986.
Meng, X., Jiang, J., Chen, T., Zhang, Z., Lu, B., Liu, C., Xue, L., Chen, J., Herrmann, H., and Li, X.: Chemical drivers of ozone change in extreme temperatures in eastern China, Sci. Total Environ., 874, 162424, https://doi.org/10.1016/j.scitotenv.2023.162424, 2023.
Napelenok, S., Cohan, D., Odman, M. T., and Tonse, S.: Extension and evaluation of sensitivity analysis capabilities in a photochemical model, Environ. Modell. Softw., 23, 994–999, 2008.
Potosnak, M. J., LeStourgeon, L., Pallardy, S. G., Hosman, K. P., Gu, L., Karl, T., Geron, C., and Guenther, A. B.: Observed and modeled ecosystem isoprene fluxes from an oak-dominated temperate forest and the influence of drought stress, Atmos. Environ., 84, 314–322, 2014.
Qiao, X., Guo, H., Wang, P., Tang, Y., Ying, Q., Zhao, X., Deng, W., and Zhang, H.: Fine particulate matter and ozone pollution in the 18 cities of the Sichuan Basin in southwestern China: model performance and characteristics, Aerosol Air Qual. Res., 19, 2308–2319, 2019.
Saunders, S. M., Jenkin, M. E., Derwent, R. G., and Pilling, M. J.: Protocol for the development of the Master Chemical Mechanism, MCM v3 (Part A): tropospheric degradation of non-aromatic volatile organic compounds, Atmos. Chem. Phys., 3, 161–180, https://doi.org/10.5194/acp-3-161-2003, 2003.
Saunier, A., Ormeño, E., Boissard, C., Wortham, H., Temime-Roussel, B., Lecareux, C., Armengaud, A., and Fernandez, C.: Effect of mid-term drought on Quercus pubescens BVOCs' emission seasonality and their dependency on light and/or temperature, Atmos. Chem. Phys., 17, 7555–7566, https://doi.org/10.5194/acp-17-7555-2017, 2017.
Schwela, D.: Air pollution and health in urban areas, Rev. Environ. Health, 15, 13–42, 2000.
Shu, Z., Zhao, T., Liu, Y., Zhang, L., Ma, X., Kuang, X., Li, Y., Huo, Z., Ding, Q., and Sun, X.: Impact of deep basin terrain on PM2.5 distribution and its seasonality over the Sichuan Basin, Southwest China, Environ. Pollut., 300, 118944, https://doi.org/10.1016/j.envpol.2022.118944, 2022.
Wang, H., Lu, X., Seco, R., Stavrakou, T., Karl, T., Jiang, X., Gu, L., and Guenther, A. B.: Modeling Isoprene Emission Response to Drought and Heatwaves Within MEGAN Using Evapotranspiration Data and by Coupling With the Community Land Model, J. Adv. Model. Earth Sy., 14, e2022MS003174, https://doi.org/10.1029/2022MS003174, 2022.
Wang, N., Guo, H., Jiang, F., Ling, Z., and Wang, T.: Simulation of ozone formation at different elevations in mountainous area of Hong Kong using WRF-CMAQ model, Sci. Total Environ., 505, 939–951, 2015.
Wang, N., Huang, X., Xu, J., Wang, T., Tan, Z.-M., and Ding, A.: Typhoon-boosted biogenic emission aggravates cross-regional ozone pollution in China, Science Advances, 8, eabl6166, https://doi.org/10.1126/sciadv.abl6166, 2022.
Wang, P., Qiao, X., and Zhang, H.: Modeling PM2.5 and O3 with aerosol feedbacks using WRF/Chem over the Sichuan Basin, southwestern China, Chemosphere, 254, 126735, https://doi.org/10.1016/j.chemosphere.2020.126735, 2020.
Wang, T., Xue, L., Brimblecombe, P., Lam, Y. F., Li, L., and Zhang, L.: Ozone pollution in China: A review of concentrations, meteorological influences, chemical precursors, and effects, Sci. Total Environ., 575, 1582–1596, 2017.
Xiao, Q., Geng, G., Xue, T., Liu, S., Cai, C., He, K., and Zhang, Q.: Tracking PM2.5 and O3 pollution and the related health burden in China 2013–2020, Environ. Sci. Technol., 56, 6922–6932, 2021.
Xue, L., Wang, T., Wang, X., Blake, D. R., Gao, J., Nie, W., Gao, R., Gao, X., Xu, Z., Ding, A., Huang, Y., Lee, S., Chen, Y., Wang, S., Chai, F., Zhang, Q., and Wang, W.: On the use of an explicit chemical mechanism to dissect peroxy acetyl nitrate formation, Environ. Pollut., 195, 39–47, https://doi.org/10.1016/j.envpol.2014.08.005, 2014.
Zhang, Y., Sun, J., Zheng, P., Chen, T., Liu, Y., Han, G., Simpson, I. J., Wang, X., Blake, D. R., Li, Z., Yang, X., Qi, Y., Wang, Q., Wang, W., and Xue, L.: Observations of C1–C5 alkyl nitrates in the Yellow River Delta, northern China: Effects of biomass burning and oil field emissions, Sci. Total Environ., 656, 129–139, https://doi.org/10.1016/j.scitotenv.2018.11.208, 2019.
Zhao, S., Yu, Y., Yin, D., Qin, D., He, J., and Dong, L.: Spatial patterns and temporal variations of six criteria air pollutants during 2015 to 2017 in the city clusters of Sichuan Basin, China, Sci. Total Environ., 624, 540–557, 2018.
Zhou, Z., Tan, Q., Deng, Y., Song, D., Wu, K., Zhou, X., Huang, F., Zeng, W., and Lu, C.: Compilation of emission inventory and source profile database for volatile organic compounds: A case study for Sichuan, China, Atmos. Pollut. Res., 11, 105–116, 2020.
Zhu, J. X., Cheng, H. R., Peng, J., Zeng, P., Wang, Z. W., Lyu, X. P., and Guo, H.: O3 photochemistry on O3 episode days and non-O3 episode days in Wuhan, Central China, Atmos. Environ., 223, 117236, https://doi.org/10.1016/j.atmosenv.2019.117236, 2020.