the Creative Commons Attribution 4.0 License.
the Creative Commons Attribution 4.0 License.
 | 01 Mar 2024
European CH4 inversions with ICON-ART coupled to the CarbonTracker Data Assimilation Shell
Wouter Peters
Ingrid Luijkx
Stephan Henne
Huilin Chen
Samuel Hammer
We present the first application of the ICOsahedral Nonhydrostatic model with Aerosols and Reactive Trace gases (ICON-ART) in inverse modeling in inverse modeling of greenhouse gas fluxes with an ensemble Kalman smoother. For this purpose, we extended ICON-ART to efficiently handle gridded emissions, generate an ensemble of perturbed emissions during runtime and use nudging on selected variables to keep the simulations close to analyzed meteorology. We show that the system can optimize total and anthropogenic European CH4 fluxes on a national scale in an idealized setup using pseudo-observations from a realistic network of measurement stations. However, we were unable to constrain the sum of the natural emission sources of comparatively low magnitude. Also regions with low emissions and regions with low observational coverage could not be optimized individually for lack of observational constraints. Furthermore, we investigated the sensitivities towards different inversion parameters and design choices with 15 sensitivity runs using the same idealized setup, demonstrating the robustness of the approach when regarding some minimal requirements of the setup (e.g., number of ensemble members). Subsequently, we applied the system to real in situ observations from 28 European stations for three years, 2008, 2013 and 2018. We used a priori anthropogenic fluxes from the EDGARv6 inventory and a priori natural fluxes from peatlands and mineral soils, inland waters, the ocean, biofuels and biomass burning, and geology. Our results for the year 2018 indicate that anthropogenic emissions may be underestimated in EDGARv6 by ca. 25 % in the Benelux countries and, to a smaller degree, in northwestern France and southern England. In the rest of the domain, anthropogenic fluxes are corrected downwards by the inversion, suggesting an overestimation in the a priori. For most countries, this means that the a posteriori country-total anthropogenic emissions are closer to the values reported to the United Nations Framework Convention on Climate Change (UNFCCC) than the a priori emissions from EDGARv6. Aggregating the a posteriori emissions across the EU27 + UK results in a total of 17.4 Tg yr−1, while the a priori emissions were 19.9 Tg yr−1. Our a posteriori is close to the total reported to the UNFCCC of 17.8 Tg yr−1. Natural emissions are reduced from their a priori magnitude almost everywhere, especially over Italy and Romania–Moldova, where a priori geological emissions are high, and over the United Kingdom and Scandinavia, where emissions from peatlands and wetlands were possibly unusually low during the hot and dry summer of 2018. Our a posteriori anthropogenic emissions for the EU27 + UK fall within the range estimated by global top-down studies but are lower than most other regional inversions. However, many of these studies have used observations from different measurement stations or satellite observations. The spatial pattern of the emission increments in our results, especially the increase in the Benelux countries, also agrees well with other regional inversions.
- Article
(11987 KB) - Full-text XML
- BibTeX
- EndNote


To achieve the long-term goal of the Paris Agreement to limit global temperature increases to well below 2 °C, global greenhouse gas (GHG) emissions will have to be reduced drastically in the coming decades. The implementation of the Paris Agreement requires all parties to commit to mitigation measures (described in nationally determined contributions) and to regularly report their anthropogenic GHG emissions, in the form of national inventory reports (NIRs), to the United Nations Framework Convention on Climate Change (UNFCCC). NIRs are developed from socioeconomic statistics, activity data and emission factors following the guidelines of the Intergovernmental Panel on Climate Change (Eggleston et al., 2006). Following these guidelines, most parties also report uncertainties in emissions, which they calculate based on uncertainties in activity data and emission factors or uncertainties in the underlying data.
Complementary to these bottom-up emission inventories is the “top-down approach”, where atmospheric inversions are used for emission estimation from observations (Bergamaschi et al., 2018; Nisbet and Weiss, 2010). Due to the Paris Agreement, the interest in high-resolution inversions with country-scale emission estimates has grown recently. However, top-down emission estimation is still subject to large and poorly quantified uncertainties due to insufficient coverage of measurements, errors in simulated atmospheric transport, representation errors, measurement biases and other factors. To advance the field, it is therefore paramount to reduce these errors as much as possible and to build modeling systems that properly account for the remaining uncertainties.
Inversions for CH4 have already been made in previous studies. European CH4 emissions have been estimated and compared to bottom-up values in both regional (Bergamaschi et al., 2018, 2022; Petrescu et al., 2023) and global (Deng et al., 2022; Petrescu et al., 2023) inversions, using both surface in situ measurements and satellite observations. Bergamaschi et al. (2018) compared a total of seven inversion models with a regional setup for the period 2006 to 2012, with all models using harmonized observations. The mean of the estimates of the models for the anthropogenic emissions for EU27 + UK was higher than the reported values for all years but still within the calculated uncertainty range. Another regional inversion study for Europe was recently presented by Bergamaschi et al. (2022) using a new nested high-resolution inversion system FLEXPART-COSMO TM5 4DVAR. They also compared the results with FLEXPART extended Kalman filter (FLExKF) (Brunner et al., 2012) and with TM5 4DVAR (Meirink et al., 2008) inversions. All three inversion models resulted in higher emissions for 2018 for Germany, France and Benelux than the sum of UNFCCC reported and natural (estimated by the Global Carbon Project, hereafter referred to as GCP) emissions.
European CH4 emissions were also estimated from global inversions operating at lower resolution and often assimilating a smaller set of observations available over Europe compared to the regional systems. Deng et al. (2022) and Petrescu et al. (2023) compared a number of global inversions presented previously by Saunois et al. (2020) with the reported values. While Deng et al. (2022) included all Annex I countries (with periodic emission reports) and non-Annex I countries (with only sporadic reports) worldwide, Petrescu et al. (2023) focused on EU27 + UK and also compared regional inversions with the reported values. The results showed that anthropogenic CH4 emissions estimated in regional inversions were generally higher than reported emissions, while global inversions were mostly lower. This general tendency was found irrespective of whether only ground in situ measurements or satellite observations were assimilated. These results show that there is still little consistency between different inversion results and that further work is needed to identify the causes of the discrepancies. Therefore, a new model intercomparison experiment was established by the Atmospheric Tracer Transport Model Intercomparison Project (TransCom), which requires all participating groups to follow a common data protocol ensuring maximum consistency in terms of the usage of observation data, boundary conditions and a priori fluxes. The results presented here for the real-data application are based on simulations following this protocol.
In inverse modeling, measured atmospheric dry-air mole fractions are linked to emissions using an atmospheric transport model (ATM). The most likely set of emissions is determined by minimizing a Bayesian cost function with an inversion algorithm given a prior constraint (usually a bottom-up inventory or flux model) and uncertainties. Different inversion techniques exist (see, e.g., Chap. 11 of Brasseur and Jacob, 2017), such as synthesis (Gurney et al., 2002; Baker et al., 2006; Butler et al., 2010); geostatistical (Michalak et al., 2004; Gourdji et al., 2012); Kalman smoother (Bruhwiler et al., 2005), ensemble Kalman filter (EnKF), ensemble Kalman smoother (EnKS) or ensemble square root filter (EnSRF) (Peters et al., 2005; Tsuruta et al., 2017); and 4D variational inversion (4D-Var; Chevallier et al., 2005; Baker et al., 2010; Bergamaschi et al., 2022) methods. They have been developed to address different trace gases, observations types, and spatial and temporal scales. The 4D-Var and EnKF methods are computationally expensive but have become standard methods today to address large inversion problems.
A limiting factor for analytical synthesis and geostatistical inversions is the dimension of the inversion problem (both the control and the observation space), which needs to be sufficiently small to store the related covariance error matrices in computer memory and calculate their algebraic inverse. The 4D variational approach, on the other hand, where the cost function is minimized by the calculation of its gradient and through an iterative descent, requires an adjoint model, which is often not available for a given ATM. The ensemble Kalman filter or smoother data assimilation (Evensen, 1994, 2003; Burgers et al., 1998) has the advantages that it can deal with large inversion problems, that no adjoint ATM is required (Kalnay, 2010) and that it returns an approximate error covariance matrix. The disadvantage is that the covariance error matrix and the Kalman gain are only approximated based on a finite ensemble.
Peters et al. (2005) developed such an ensemble Kalman smoother, which was further implemented in the CarbonTracker Data Assimilation Shell (CTDAS) (van der Laan-Luijkx et al., 2017). It was designed to optimize biospheric and oceanic CO2 fluxes from different biomes and ocean regions on a weekly timescale by assimilating the CO2 observations from a global network of stations. CTDAS has been applied in subsequent studies to investigate, for example, the carbon budget over North America (Peters et al., 2007), over Europe (Peters et al., 2010; Smith et al., 2020), over South America (van der Laan-Luijkx et al., 2015) and globally (van der Laan-Luijkx et al., 2017). More recently, CTDAS has been coupled with a Lagrangian particle dispersion model for studying regional carbon budgets (He et al., 2018) and has also been applied to other species like methane (Bruhwiler et al., 2014; Tsuruta et al., 2019).
A critical requirement for accurate emission estimates by inverse modeling is the quality of the ATM. An attractive new atmospheric model is the global ICOsahedral Nonhydrostatic (ICON) atmospheric modeling framework (Wan et al., 2013; Zängl et al., 2015; Pham et al., 2021), which can be extended with the Aerosols and Reactive Trace gases (ART) model, developed at the Karlsruhe Institute of Technology (KIT) (Rieger et al., 2015; Weimer et al., 2017; Schröter et al., 2018) to simulate aerosols and trace gases. ICON-ART can be run from a global scale down to a cloud-resolving scale and has attractive transport properties such as mass conversation, positivity of tracers and the use of recent developments in subgrid-scale transport.
Here we present the first application of ICON-ART in inverse modeling of GHG emissions with CTDAS. For this purpose, we extended ICON-ART with modules for efficient handling of emissions and online (i.e., during runtime) generation of the ensemble of perturbed fluxes and with a nudging scheme to keep the simulations close to analyzed meteorology. Using an idealized setup with synthetically generated observations, we analyze how well the new computationally efficient model is suited to constraining European anthropogenic CH4 emissions for individual countries with observations from a European observation network. The sensitivity of the system to different parameters is analyzed in a set of sensitivity experiments. The system is then applied to real observations from a harmonized set of CH4 dry-air mole fraction observations from 28 European stations to assess the performance of ICON-ART in terms of atmospheric transport and to demonstrate the capability of the new system to constrain European emissions using this network. A detailed description of our model setup and the methodology is given in Sect. 2. In Sect. 3 we present the results of both applications, with pseudo-observations as well as with real observations. Section 4 provides conclusions.
2.1 ICON-ART model and simulation setup
2.1.1 Weather and climate model ICON
ICON is a highly versatile non-hydrostatic atmospheric model for global and regional weather and climate simulations developed jointly by the German Weather Service (DWD) and the Max Planck Institute for Meteorology (Wan et al., 2013; Zängl et al., 2015; Pham et al., 2021). It has been used at DWD for operational weather prediction since 2016 and has been coupled with other models including an ocean and a land surface model for climate simulations (Giorgetta et al., 2018). ICON is based on an icosahedral triangular grid, where 20 equilateral triangles of an icosahedron are iteratively split into smaller triangles up to the desired resolution. With such a grid, the problem of singularity at the poles is avoided. To zoom into a specific region, refined grids can be nested into the parent grid, with one additional edge bisection. The model equations are fully compressible, and the vertical discretization is in generalized smooth-level vertical coordinates (SLEVEs) (Leuenberger et al., 2010). Tracers in ICON are transported with perfect mass conservation by solving the continuity equation of mass for each tracer consecutively in the vertical direction with a finite-volume method and in the horizontal direction with a simplified flux-form semi-Lagrangian method (Miura, 2007; Lauritzen et al., 2011; Rieger et al., 2015).
2.1.2 ART extension for trace gases and aerosols
The ART model was developed as an extension for ICON at the Karlsruhe Institute of Technology (KIT) (Rieger et al., 2015; Weimer et al., 2017; Schröter et al., 2018) with the aim of simulating aerosols as well as passive and chemically reactive trace gases. The ART module is coupled online with ICON and allows a flexible definition of tracers and processes to be included (Schröter et al., 2018). Since only CH4 was simulated in the present study, all tracers are passive tracers; i.e., they are only transported without radiative feedback on the meteorology and without degradation by the hydroxyl radical (OH). Depletion by reaction with OH is assumed to be negligible given the short residence time of the air masses within the domain of no more than a few days compared to the CH4 lifetimes of about 10 years.
To simplify and accelerate the treatment of emissions during the simulations, we implemented the online emissions module (OEM) into ICON-ART, which was originally developed for the regional weather and climate model COSMO (Jähn et al., 2020). Unlike the standard offline approach, where numerous input files have to be provided at discrete model time steps, OEM requires only a small number of files at the beginning of a simulation. These files contain annual mean sector-specific 2D emission fields as well as the temporal and vertical profiles for individual emission categories and countries. During the simulation, these profiles are applied online to update the hourly emissions for each species. OEM has recently become an official component of ART (since ART version 2.6.3).
To project the inventory data onto the ICON grid, we extended the stand-alone Python package emiproc (also described in Jähn et al., 2020). The package emiproc projects emission data of various inventories onto the model grid in a mass-conserving manner by calculating the overlap of the source and target grid at every grid cell. It also generates the temporal and vertical scaling profiles.
2.1.3 General setup of ICON-ART forward simulations
The ICON-ART simulations were performed in limited-area mode (LAM) on a grid covering Europe (see figures in Sects. 2 and 3). The horizontal grid was R3B06 (see the established grid notation in Zängl et al., 2015), which corresponds to a mean grid spacing Δx between neighboring triangles of about 26 km and yields a total of 21 344 grid cells. Vertically, 60 levels were used between the surface and about 23 km altitude. The time step was 120 s. We used ICON in the numerical weather prediction (NWP) configuration with a single-moment microphysics scheme including graupel and the tile approach for soil switched on, considering subgrid-scale land-cover variability with six tiles (three land plus three water types).
The meteorological fields were initialized at the beginning of every simulation with the reanalysis data of ERA5 (Hersbach et al., 2020). During the simulation, the meteorological fields were weakly nudged in the entire domain towards the 3-hourly reanalysis data to keep the simulated meteorology close to the analyzed meteorology. This required a modification of the ICON code, since ICON in the LAM configuration only allows nudging towards meteorological boundary conditions (density, virtual potential temperature, Exner pressure, specific humidity and wind) near the borders of the domain. Additionally, the LAM grid was created such that the boundary zone extends over the entire domain. As in the standard scheme, the nudging strength αnudge was set to decrease with the distance of the cell row r from the lateral boundaries (r0), but the nudging was not restricted to the eight cell rows closest to the boundaries. Instead it decreased exponentially with an e-folding width of two cell rows towards a minimum dimensionless nudging strength of 0.001 applied in the main part of the domain: .
The modeled CH4 dry-air mole fractions were constructed with three different types of tracers representing the CH4 background, emissions and ensemble members. The tracer representing CH4 from emissions () within the model domain was initialized with a value of zero (or rather with an offset value which is later subtracted in the post-processing) at the simulation start and was updated by OEM with the emissions from the inventories (described in Sect. 2.2.4) at every model time step. The ensemble members used for the optimization scheme in EnKS are represented as tracers in the model, similarly to but with perturbed emissions (see Sect. 2.2). The background CH4 dry-air mole fractions () were represented as a separate tracer, which was initialized and updated at the lateral boundaries with data from the CAMS v19r1 inversion product (available via https://ads.atmosphere.copernicus.eu/, last access: 4 December 2023).
For every 10 d simulation window of CTDAS (see Sect. 2.2.1), one ICON-ART simulation was performed. The model runs were initialized 24 h before each 10 d window to allow for model spin-up. At the end of the 24 h meteorological spin-up period, all CH4 tracer mole fractions were overwritten by the initial CH4 conditions produced by the CTDAS system (see Sect. 2.2.1).
We carried out the simulations on the supercomputer Piz Daint of the Swiss National Supercomputing Centre (CSCS, https://www.cscs.ch/, last access: 4 December 2023), namely on the XC40 compute nodes, each with two Intel Xeon E5-2695 v4 2.10 GHz processors (2 × 18 cores, 64/128 GB RAM). A simulation with the described setup and spread across 16 nodes required around 10 node hours per 11 d simulation. For the inversion of a whole year, the total costs (including the comparatively low costs for CTDAS) amounted to around 1300 node hours or core hours.
2.1.4 Adaptations of ICON-ART to CTDAS
To couple ICON-ART with CTDAS in a robust and efficient way, we made a few adaptations to ICON-ART and the simulation setup. CTDAS requires a large ensemble of CH4 tracers to be simulated, each ensemble member corresponding to one specific perturbation of the state vector (e.g., fluxes and boundary conditions). This is usually achieved by generating an ensemble of input fields, typically one set of perturbed hourly emission maps and boundary conditions per member. For a large ensemble with a few hundred members and hourly emissions, this may result in a very large number or size of input files and correspondingly expensive I/O during the simulation. To overcome this problem, we extended OEM with the option to generate an ensemble of perturbed fluxes and corresponding tracers online during the simulation. With this extension, the only input required at the start of the simulation is the ensemble of perturbed scaling factors (λ) provided by CTDAS, which greatly simplified and accelerated the simulations. Each scaling factor scales the flux of one emission category (one tracer can experience the emissions of multiple categories) in one region. The regions can be any combination of grid cells (including individual cells) and are defined by a region mask provided as input for OEM (see Sect. 2.2.2). The setups used in this study, e.g., the emission categories and regions, are described in Sect. 2.2.
The generation of the flux ensemble permits negative fluxes, which could result in negative mole fractions of the CH4 tracers. Since none of the available transport schemes in ICON allows for negative tracer mole fractions, we bypassed this problem by adding a constant offset mass mole fraction of to all tracers and subtracting the same offset afterwards from the output. Since the transport characteristics within the numerical model ICON-ART exhibit non-linearity, the tracer concentrations are not identical when transported with or without an offset. However, our tests showed that these differences are negligible, and we consequently expect no significant impact on the outcome of the simulations.
Not only does our implementation of ICON-ART in CTDAS allow for the perturbation of fluxes, but also the ensemble can at the same time hold perturbed background mole fractions. This allows for the optimization of the background mole fractions, which is described in Sect. 2.2.6. Technically, this is achieved by perturbing the tracer mole fractions in different regions of the lateral boundary, with scaling factors provided by CTDAS in a separate file. Similarly to the generation of the flux ensemble, a lateral boundary region can be any combination of grid cells (in this case of the lateral boundary cells) defined by a region mask.
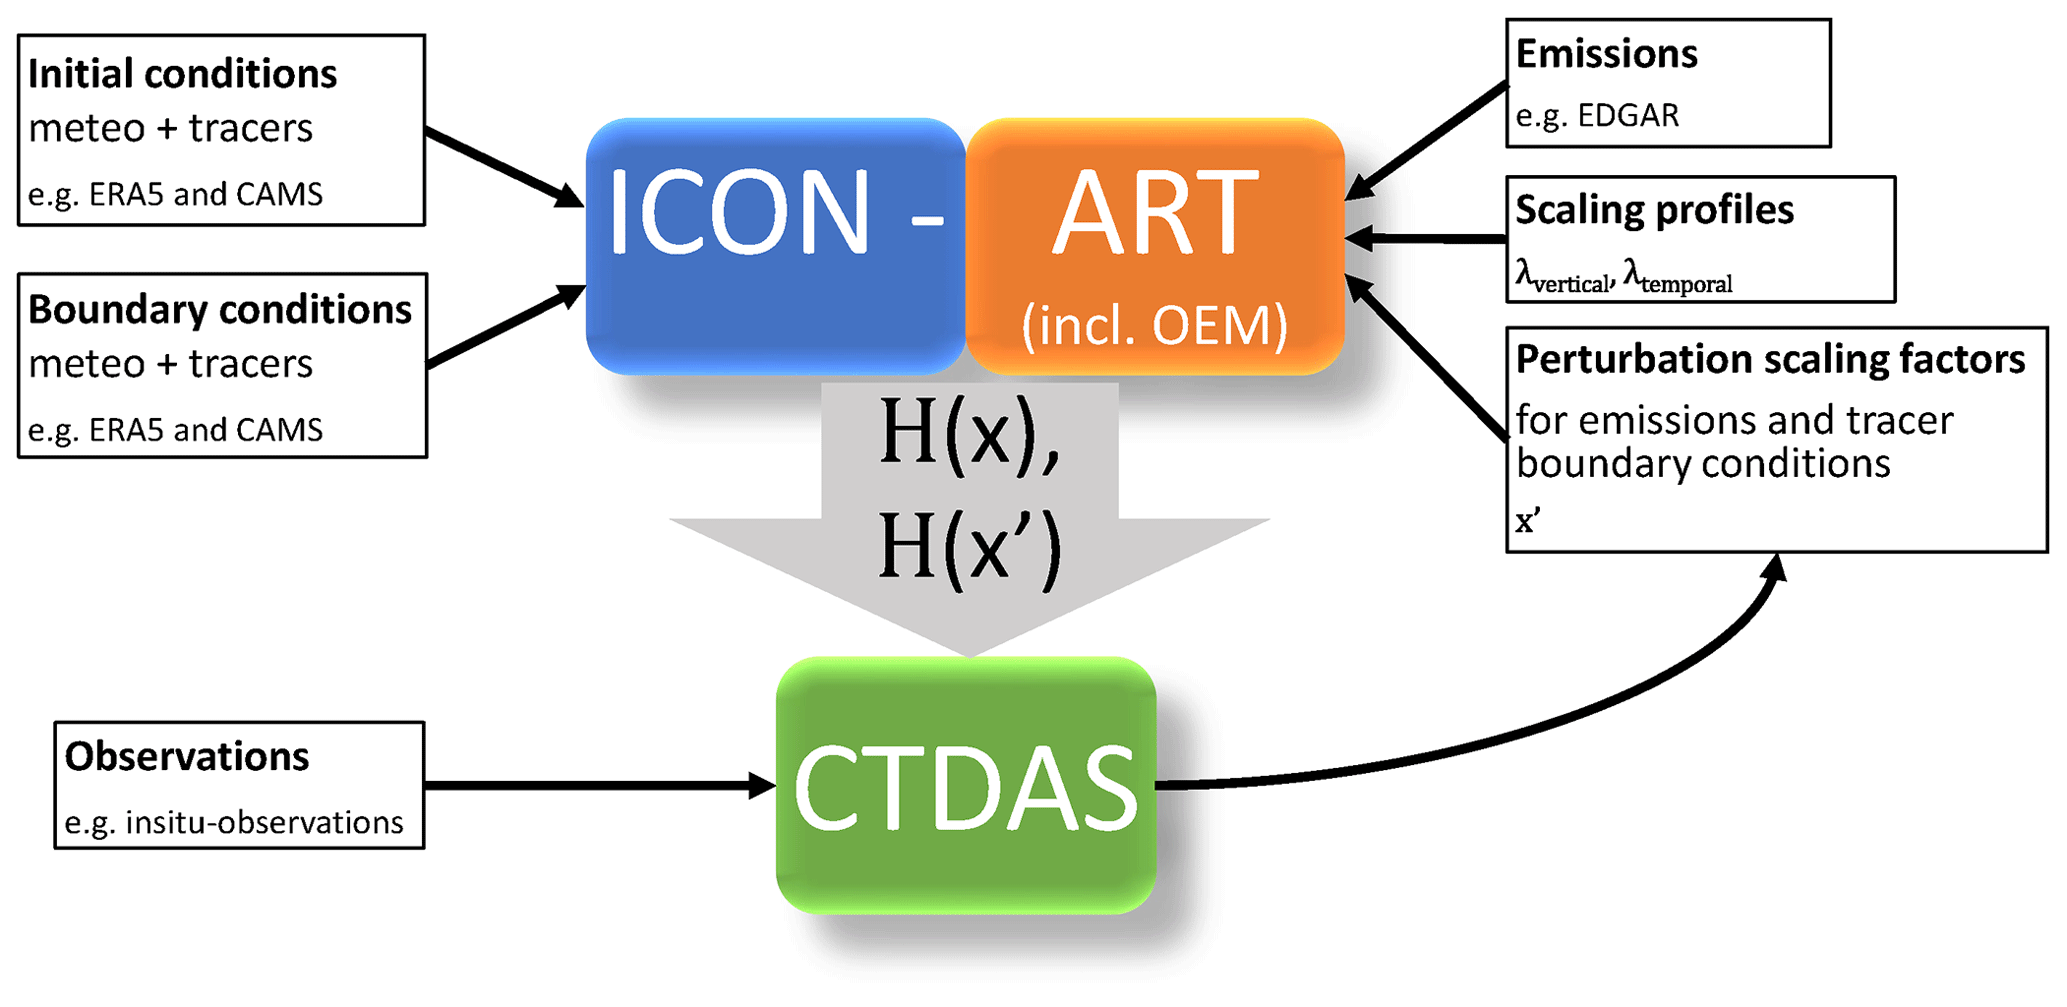
Figure 1 gives a schematic overview of how CTDAS is coupled to ICON-ART. ICON-ART is driven by initial and boundary data from ERA5 for meteorology and CAMS for tracer concentrations and adds CH4 emissions via OEM. Using a priori perturbation scaling factors from CTDAS, an ensemble of CH4 tracers is generated. The simulated concentrations of the individual ensemble members (H(x′)) and the ensemble means (H(x)) are sampled at the stations and read into CTDAS. CTDAS optimizes the emissions based on these values and the observations and uses the optimized scaling factors to generate the scaling factors for the next cycle.
2.2 CTDAS inversion setup
In this study, we used CTDAS to estimate anthropogenic CH4 emissions either in an idealized setup using synthetically generated atmospheric observations or in a real-data application using quasi-continuous in situ observations and very few discrete flask samples of CH4 dry-air mole fractions. ICON-ART acts as an observation operator; i.e., it connects the surface fluxes to atmospheric CH4 dry-air mole fractions. In the following, we describe the setups for the two applications. The description of the idealized setup refers to the reference inversion in which we only optimize emissions but otherwise stay as close to the real setup as possible. In addition to the reference inversion, we performed sensitivity experiments testing different aspects of the inversion setup as described in Sect. 2.3. These include experiments where we optimized background mole fractions in addition to emissions (see Sect. 2.2.6). Background optimization is also applied in the real-data application.
2.2.1 Optimization scheme
CTDAS applies an ensemble Kalman smoother with a fixed-lag assimilation window (Peters et al., 2005). A schematic of the configuration used here is shown in Fig. 2. Since our model domain is limited to Europe, the fluxes can affect observed CH4 mole fractions only over a couple of days. In our simulations, almost all mass of the emission tracer has left the domain after 20 d. Accordingly, CTDAS has been set up to optimize 10 d mean fluxes with a fixed lag of 2, resulting in a total assimilation window length of 20 d. Observations in a given 10 d window can thus constrain the fluxes of the previous and the present 10 d window.
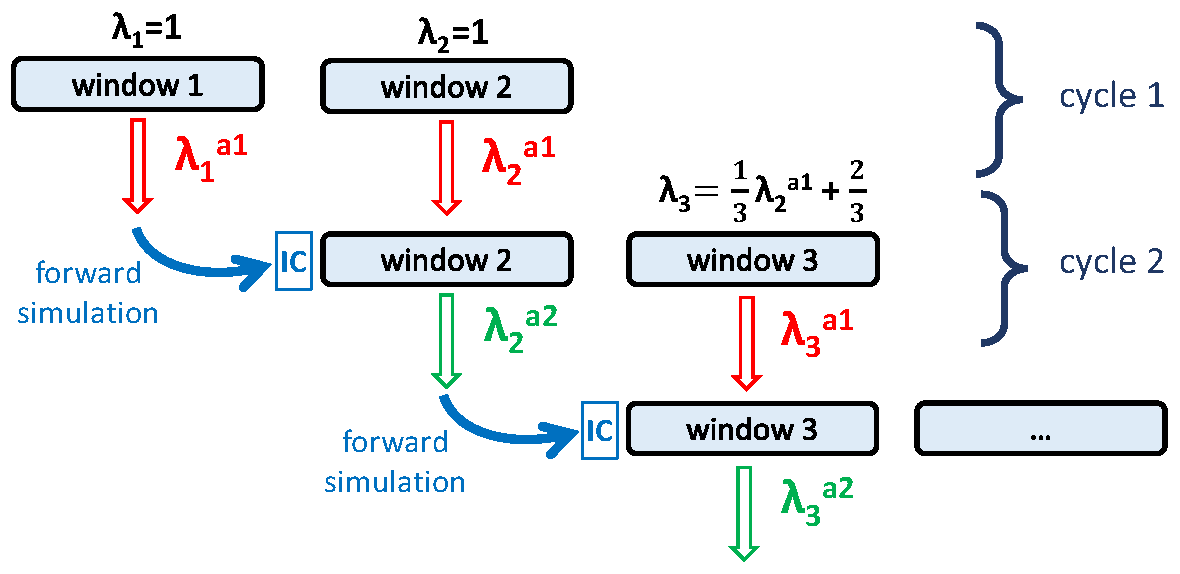
Figure 2Schematic of the ensemble Kalman smoother. The schematic shows the first two assimilation cycles. All remaining cycles are identical to the second one. Each assimilation window has a length of 10 d. One cycle is composed of two windows.
The s scaling factors are optimized using an ensemble Kalman smoother as described in Peters et al. (2005), which is based on the ensemble square root filter presented by Whitaker and Hamill (2002). In the filter, the error covariance matrix P (both a priori and a posteriori) of size [s×s] is represented by information in a smaller dimension N, which corresponds to the number of ensemble members and is set to 192 in our applications. The ensemble is generated from randomly perturbed state vectors with the magnitude and correlation structure of the perturbations, as determined by the a priori error covariance matrix.
Since we start with a priori scaling factors with a value of 1, the initial perturbation of the scaling factors for the first two windows of the simulation has a mean of . After assimilation of the observations during these two windows, the first window is simulated again with the optimized scaling factors (superscript a1 indicates analyzed/optimized once) to provide updated initial CH4 mole fractions for the second cycle. From there, the second cycle uses the optimized scaling factors from the first cycle and continues with the third window, which inherits the scaling factors from the previous window with the following state propagation model: . A priori information is thus inserted with a weight of , while a posteriori information from the previous assimilation step is propagated with a weight of . This weighting is based on the study of van der Laan-Luijkx et al. (2017), where the average of the optimized scaling factors from the two previous windows was taken into account with a weight of . Their choice of was a design choice based on the concept that the timescale to revert a system to the prior state should be approximately 8 weeks in the case where no data are available to constrain it. Full propagation of a posteriori information is analyzed in a sensitivity inversion. We apply the state propagation model only to the mean scaling factors and not to the individual ensemble members. Each window starts with a new a priori covariance again; hence no information on the uncertainty reduction in the previous windows is taken into account. During the second cycle, observations of the third window are assimilated. The second cycle is completed by simulating the second window again with the now twice-optimized scaling factors , to provide updated initial mole fractions for the third cycle. The third and all following cycles follow the same principle as the second cycle (Peters et al., 2005, their Fig. 1). The main output is thus the sequence of twice-optimized scaling factors (and their uncertainties) for each 10 d window of the simulation period. Error covariances are discussed separately in Sect. 2.2.5.
2.2.2 State vector
In our setup, CTDAS separately optimizes anthropogenic and natural fluxes. For both categories, the emissions are optimized for 21 344 individual regions, each region corresponding to one grid cell in the domain. The formalism of CTDAS is described in detail in Peters et al. (2005). As we use a lag of 2, the state vector x has 85 376 flux elements in our implementation (2 windows × 2 categories × 21 344 grid cells). Only flux elements are optimized in the reference setup of the idealized study. Simultaneous optimization of fluxes and background mole fraction is analyzed in additional sensitivity inversions and then applied in the real-data application where eight state vector parameters are used to optimize the background mole fractions (see Fig. 4).
2.2.3 Ensemble size
Previous applications of CTDAS used 200, 1500 (Peters et al., 2005), 500 (Tsuruta et al., 2017, 2019) and 150 ensemble members (van der Laan-Luijkx et al., 2017). In Peters et al. (2005) 100–200 model ensemble members were sufficient to represent a state vector of 14 400 parameters, albeit with substantial spatial correlations to reduce the degrees of freedom. In our setup we use an ensemble size of 192, wherein every ensemble member is represented by one tracer. The sensitivity to a smaller and larger size of 50 and 300 members was also analyzed. While the performance was significantly reduced with only 50 members, there was only a marginal improvement with 300 members. Therefore, we chose 192 members for our inversions. The degrees of freedom (calculated with Eq. 21 in Peters et al., 2005) in our a priori covariance error matrix is 425.
2.2.4 A priori fluxes
In the application of our system, we followed the “protocol for the intercomparison of national CH4 emissions estimated by inverse modeling system for Western Europe”, an intercomparison effort of the TransCom modeling community. The protocol prescribes the prior fluxes to be used, which were pre-processed and provided on a 0.25°×0.25° grid. The anthropogenic fluxes (agriculture, waste and fossil fuels) are taken from the EDGARv6 (Crippa et al., 2021) inventory. The following natural fluxes are taken into account: peatlands and mineral soils from JSBACH-HIMMELI (Raivonen et al., 2017; Reick et al., 2013) (version 2), inland water (provided by Université Libre de Bruxelles to the GCP-CH4 data set; Saunois et al., 2020), termites (Saunois et al., 2020), ocean (Weber et al., 2019), and biofuels and biomass burning (GFED 4.1s; van der Werf et al., 2017) as well as geological emissions (Etiope et al., 2019) (scaled to a global total of 15 Tg). The pre-processed fluxes with monthly resolution are temporally interpolated to the 10 d windows of our inversion system such that we have a separate emission file for every 10 d simulation. Since we optimize anthropogenic and natural emissions separately (see Sect. 2.2.2), the various natural fluxes were merged into one category. An example of the anthropogenic and natural emissions is shown in Fig. 3 for the period of 11–21 June 2018.
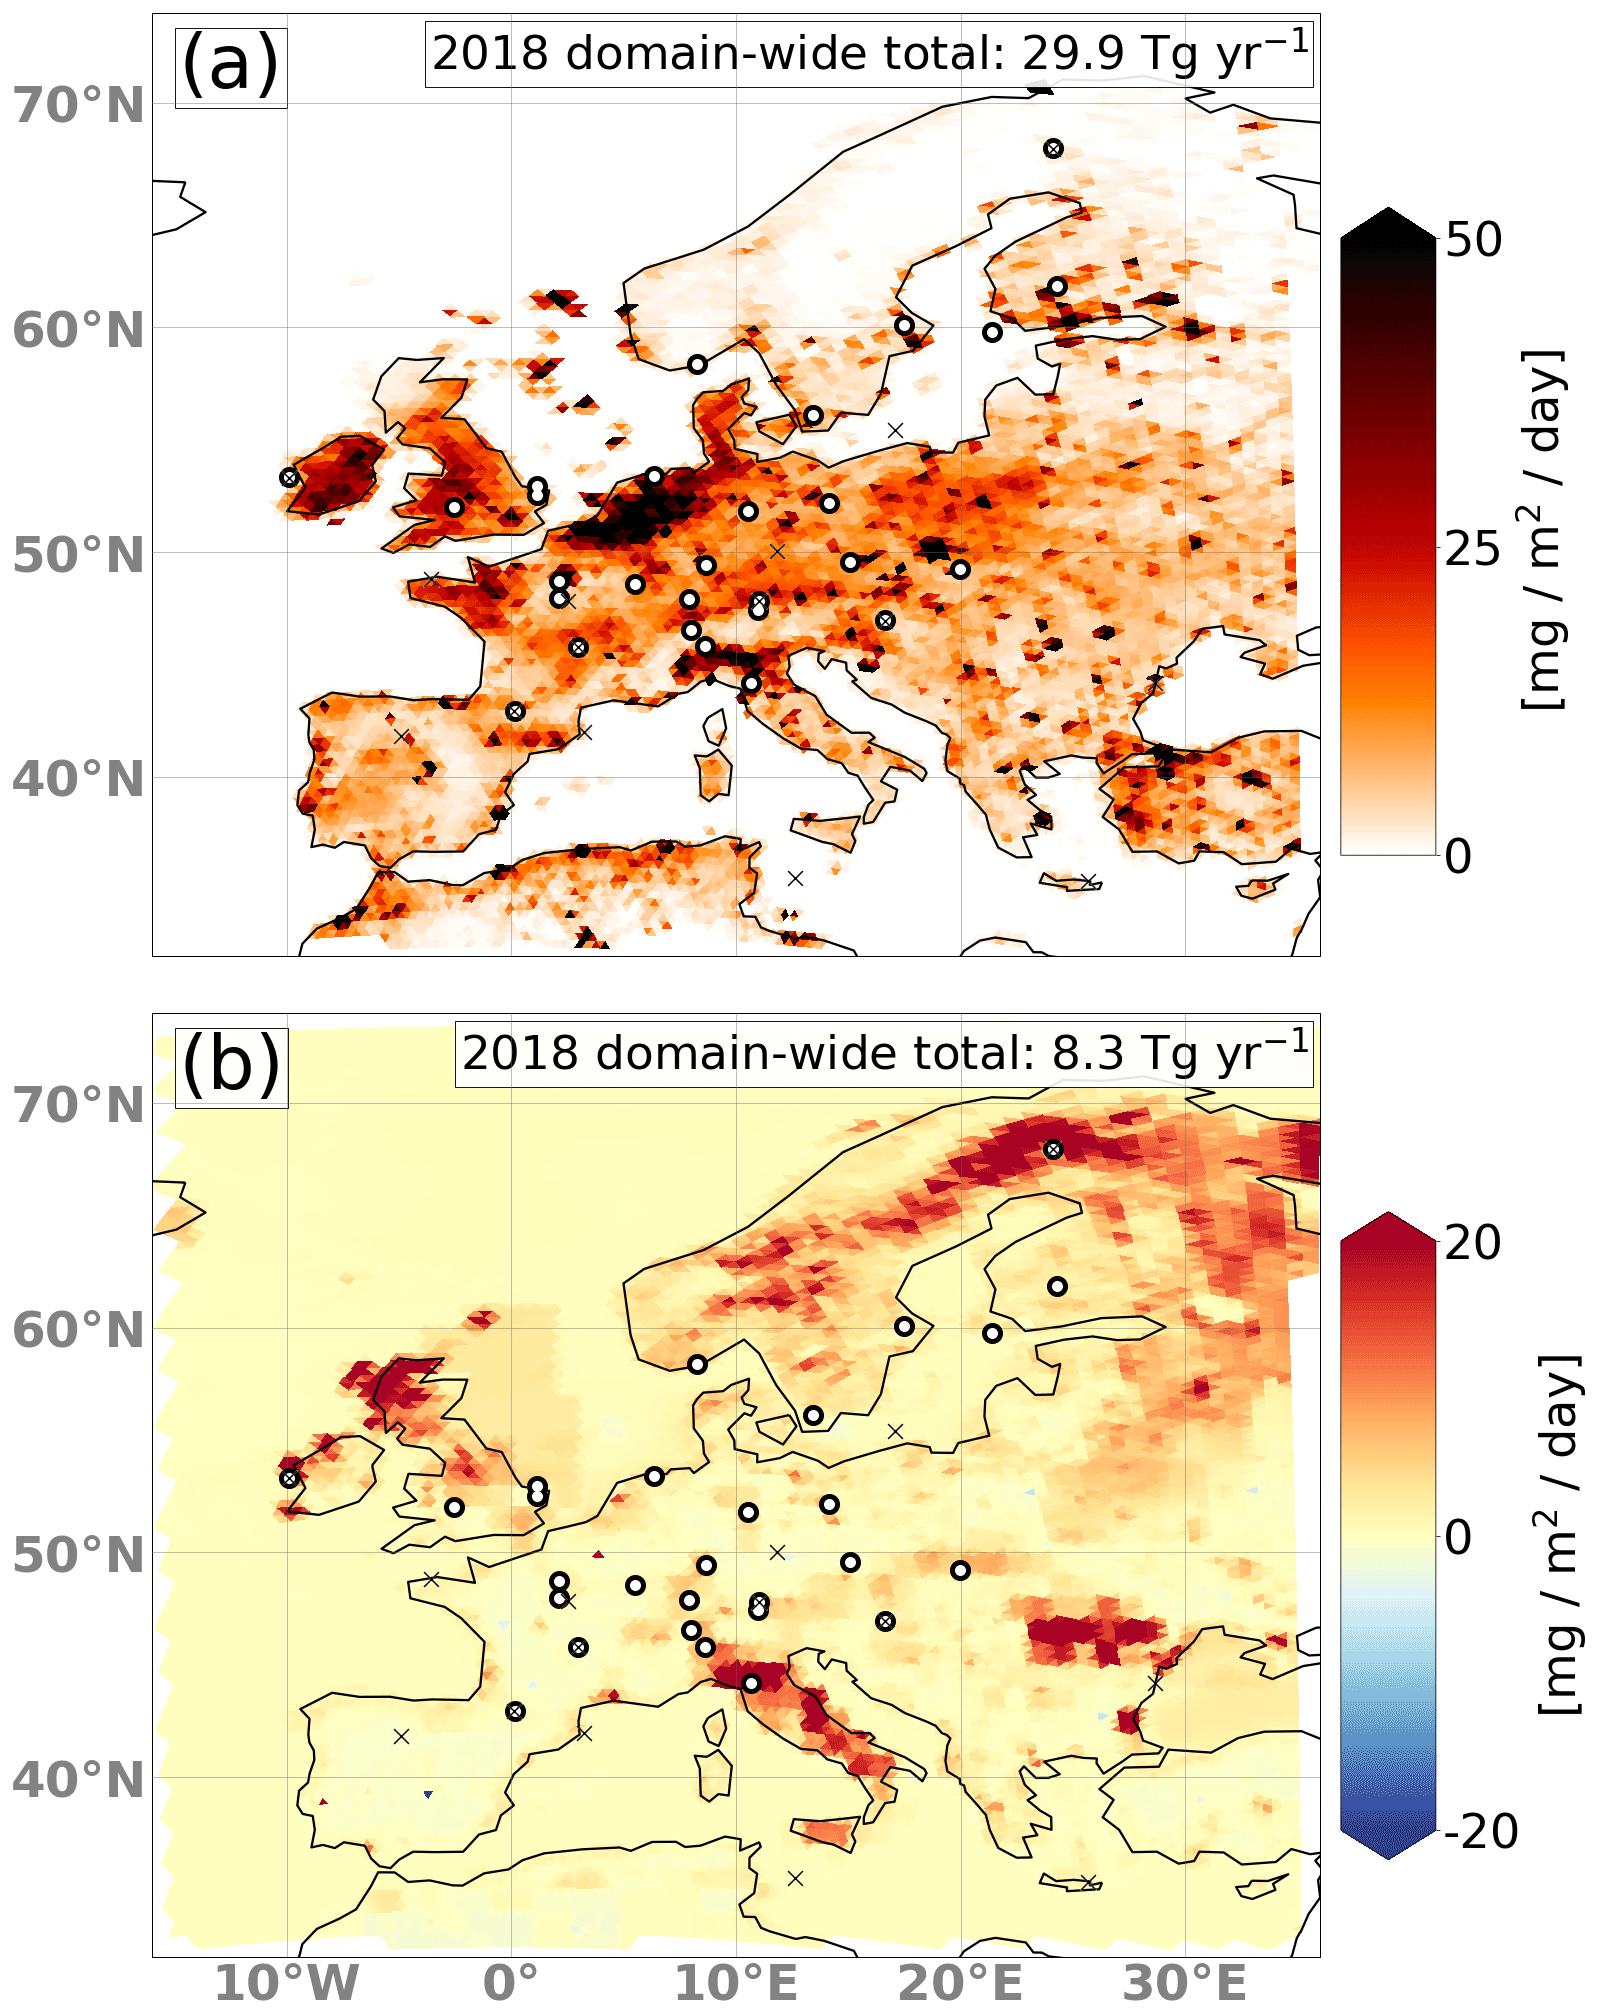
Figure 3Spatial distribution of CH4 emissions from anthropogenic (a) and natural sources (b) used in the real-data application for the period of 11–21 June 2018. Overlaid are the measurement locations used in the inversion. The numbers for the domain-wide total fluxes are given for the entire year of 2018. The circles show the in situ measurement locations, while the small crosses show the locations of flask sampling.
All CH4 emissions are considered to be constant in time over 10 d and are emitted between 0 and 20 m above the surface.
2.2.5 A priori error covariance matrix
We apply an uncertainty of 100 % for each flux in each grid cell. This takes into account that EDGAR applies its own methodologies uniformly to the whole domain and, in contrast to the European TNO inventory, does not scale the total national emissions to the officially reported values. The scaling factors corresponding to the same category but belonging to different regions are correlated depending on the great-circle distance between the centers of the grid cells assuming an exponential decay of the correlation with a length scale L=200 km (see Gaspari and Cohn, 1999; Peters et al., 2005), regardless of country borders. Between different categories we assume no correlation. Also, temporal a priori correlations between consecutive cycles are not applied; however, inheriting a posteriori information from the previous assimilation step with a weighting of (see Sect. 2.2.1) has a comparable impact to applying temporal correlations.
2.2.6 Background optimization
In the reference inversion of the pseudo-observation application, only emissions and no background mole fractions are optimized. However, if background mole fractions provided at the lateral boundaries from a global model are biased, an inversion system without background optimization will try to compensate for this bias by increasing or decreasing the emissions, which ultimately leads to biased emission estimates.
To address this problem, we implemented the option to optimize background mole fractions alongside the emissions. For this purpose, eight additional state vector parameters were introduced to optimize the background mole fractions from eight different inflow regions where CH4 from the global CAMS model enters our model domain (see Fig. 4). We test the capability of this approach to correct for different magnitudes and types of biases in three dedicated sensitivity experiments. In these experiments we introduce different artificial biases with magnitudes of 1 %, which we think to be a realistic bias for reanalysis products, and set the uncertainty correspondingly. Background optimization is also applied in the real-data application, where we apply an uncertainty of 0.05 %, which is roughly 1 ppb CH4. This uncertainty is smaller than what we assumed in the sensitivity simulations. We choose a smaller uncertainty in the real-data application as the CAMS v19r1 product used here, which is the result of a global inversion system, proofed to have almost no biases. We apply a different state propagation model (see Sect. 2.2.1) for the eight background parameters than for the emission parameters. We propagate the a posteriori with a weight of 100 % to the next window assuming that biases are changing only slowly with time and are therefore similar in subsequent assimilation windows. This allows the system to adjust the background concentration by roughly 1 ppb every 10 d.
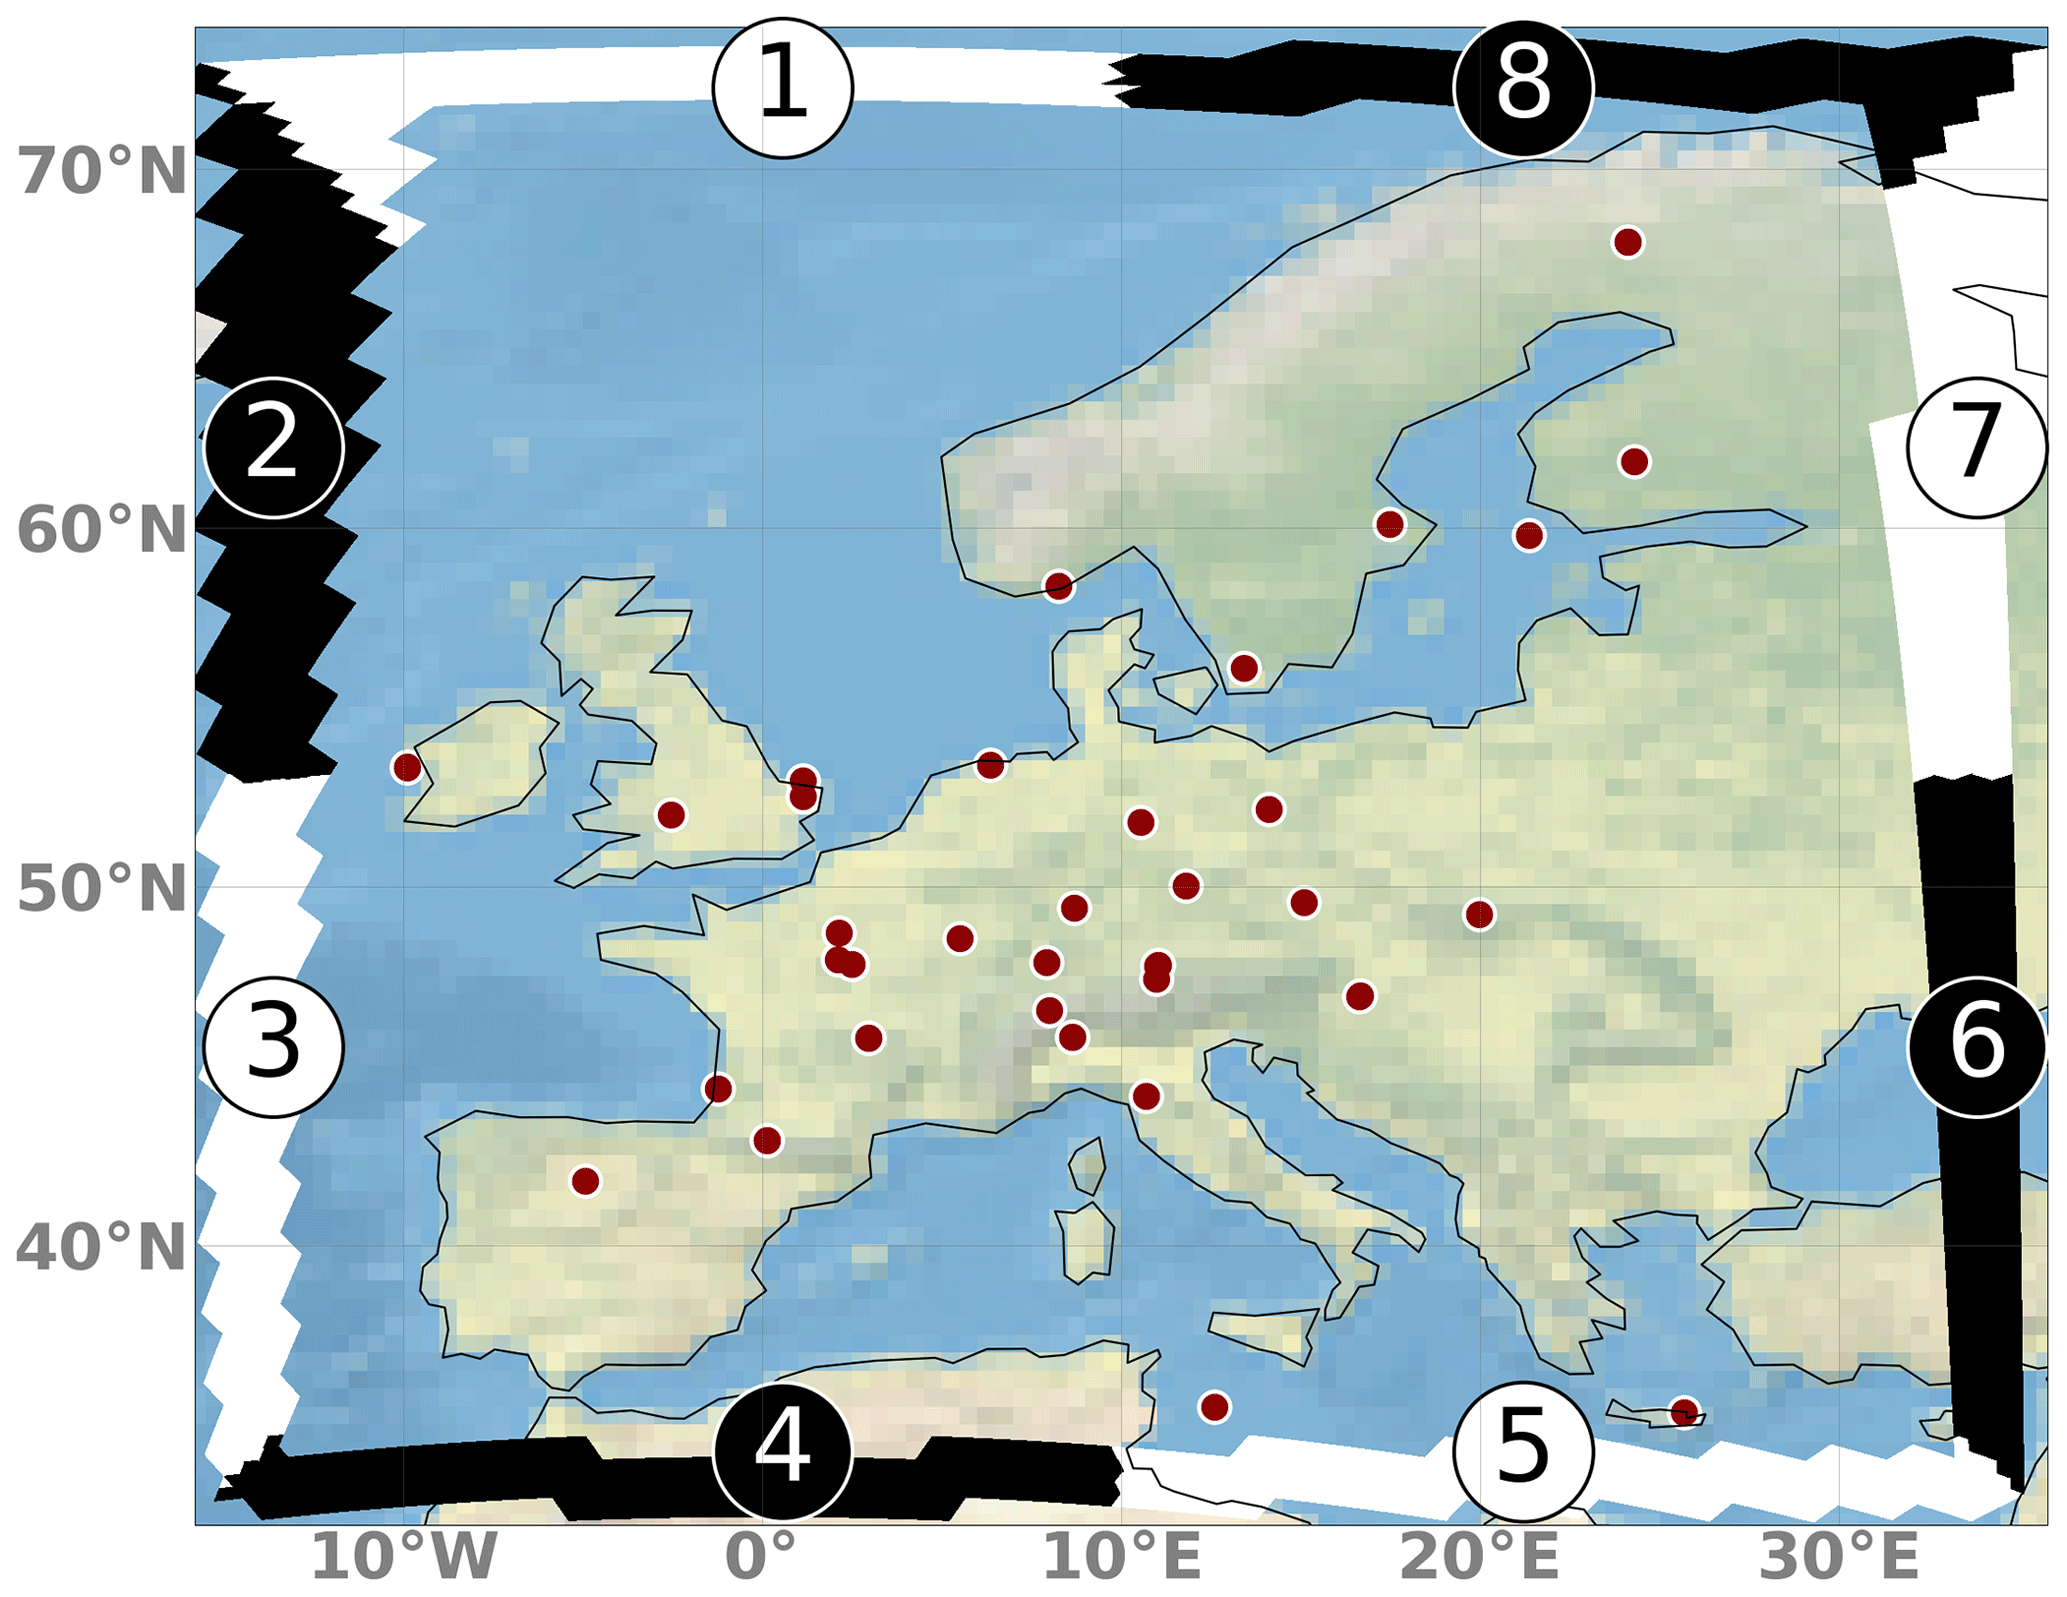
Figure 4Map showing the eight inflow regions (labeled 1–8) used for the background optimization.
2.2.7 Localization
To avoid erroneous state vector updates due to spurious covariances between observations and far-distant grid cells, the Kalman gain can be modified using a method called localization. As shown by Houtekamer and Mitchell (1998), localization reduces spurious correlation and reduces the number of required ensemble members. Spatial localization with damping factors decaying exponentially with distance from, or normally distributed around, each observation is possible. An alternative is to only update state vector parameters whose correlation passes a two-tailed t test, but this proved to be computationally too expensive for our large problem size. To reduce correlations with far-distant grid cells, in all our inversions we apply a damping to the Kalman gain with factors normally distributed around the observation location with a 1σ standard deviation of 600 km. The optimal length scale is dependent on the setup and the number of the ensemble members. Our choice of 600 km was tested in sensitivity inversions. The effect is illustrated in Fig. 5 for one observation and one emission category. The values of the Kalman gain matrix can be interpreted as the sensitivity of the observation to upstream emissions from that category.
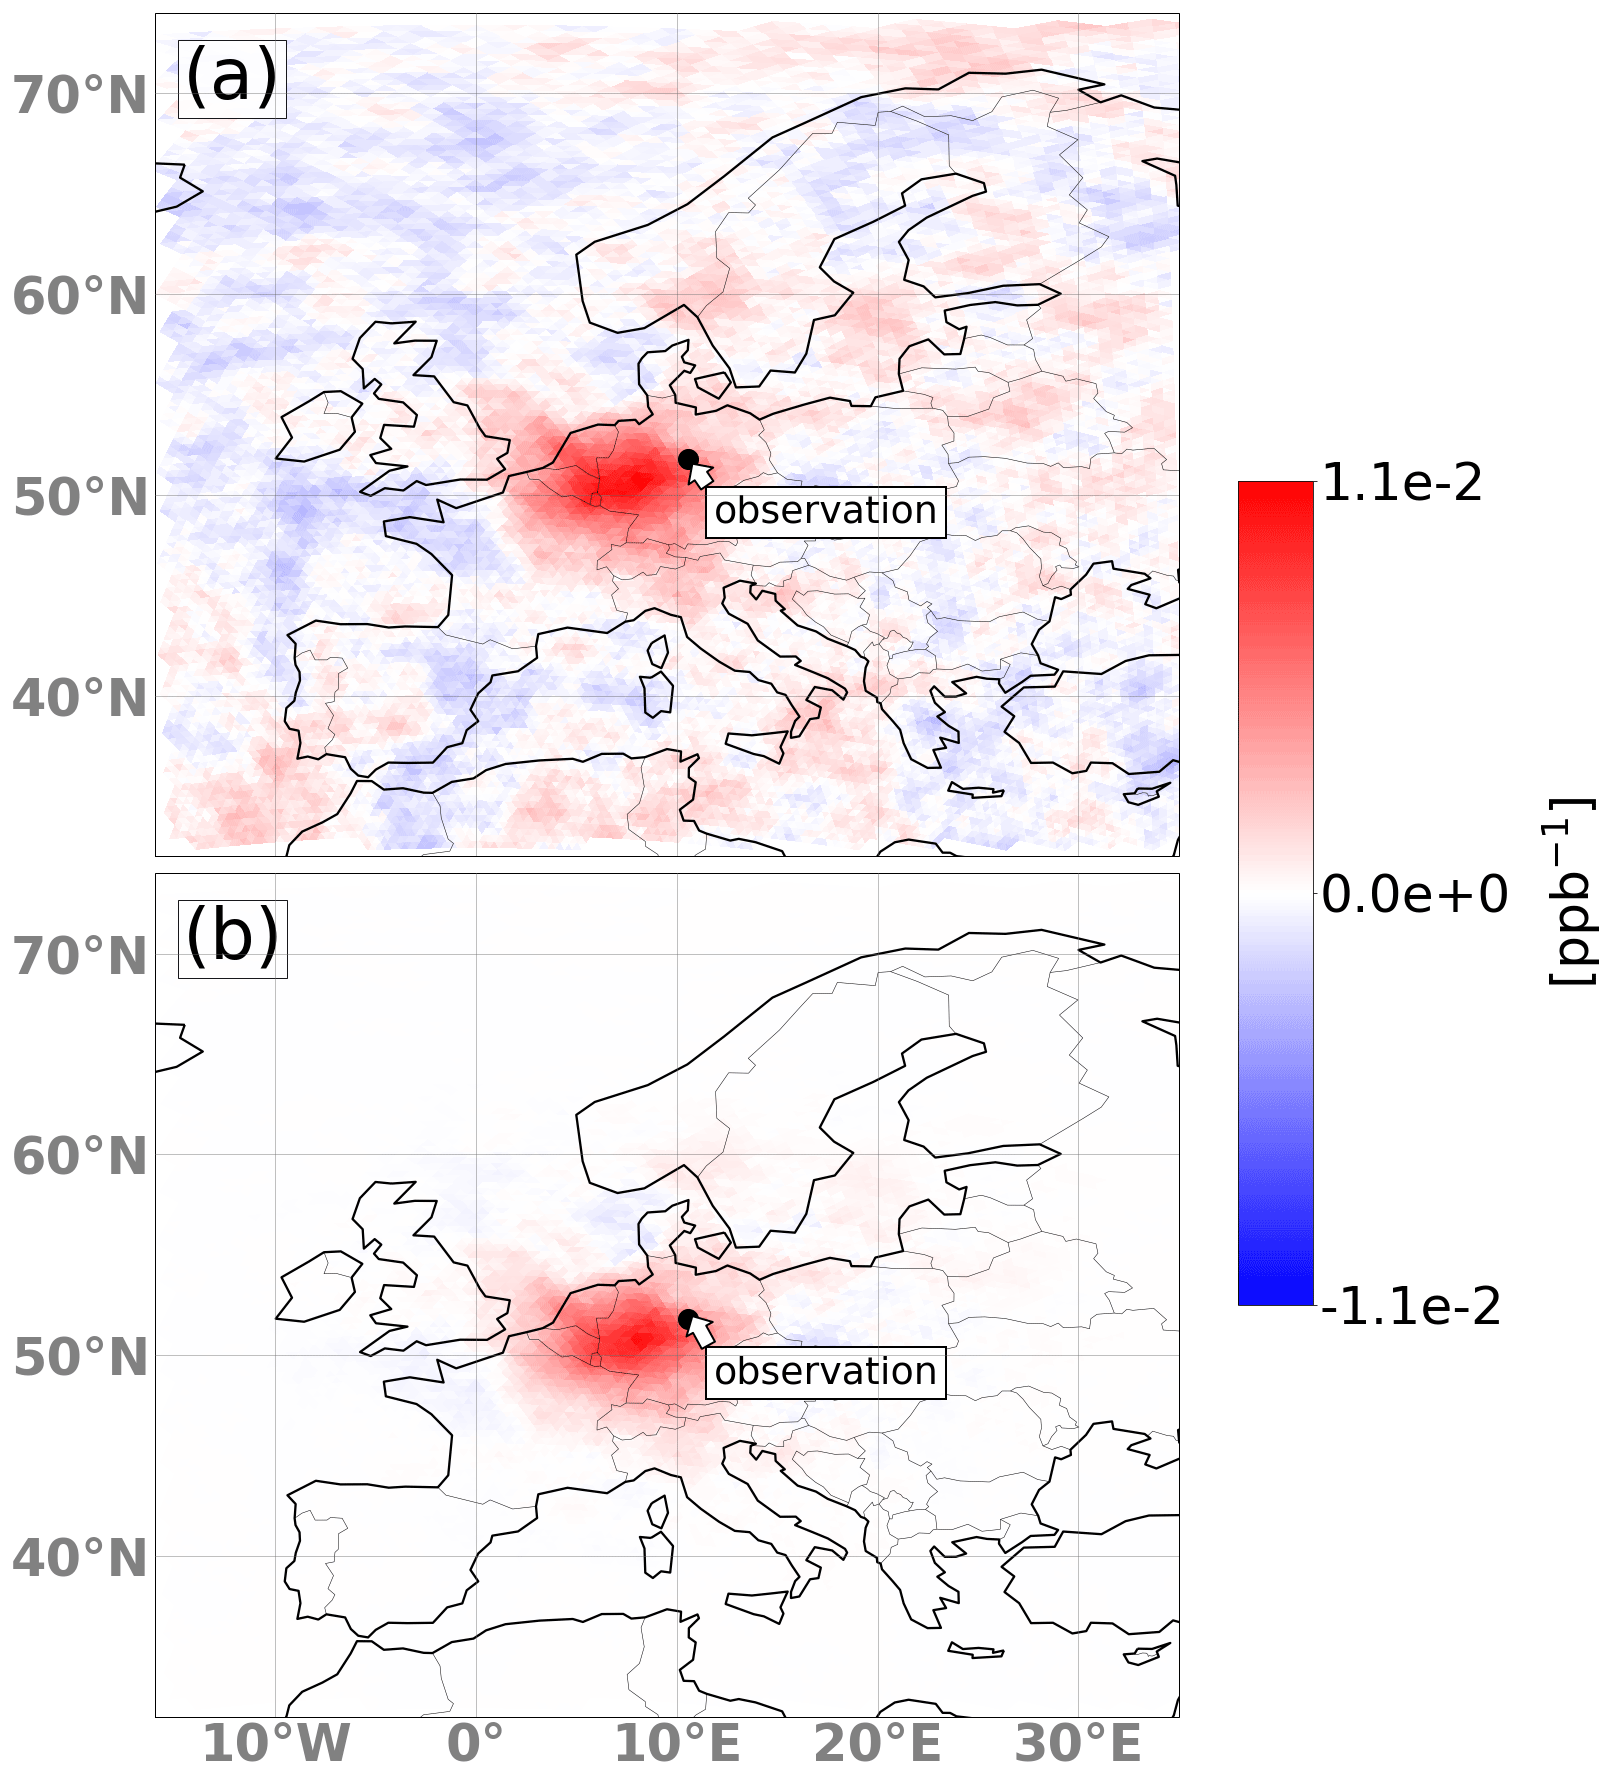
Figure 5The values of the Kalman gain matrix for anthropogenic emissions for one single observation at the Torfhaus station in Germany (29 January 2018, 12:00–16:00 UTC) before (a) and after (b) applying localization.
2.2.8 Observations
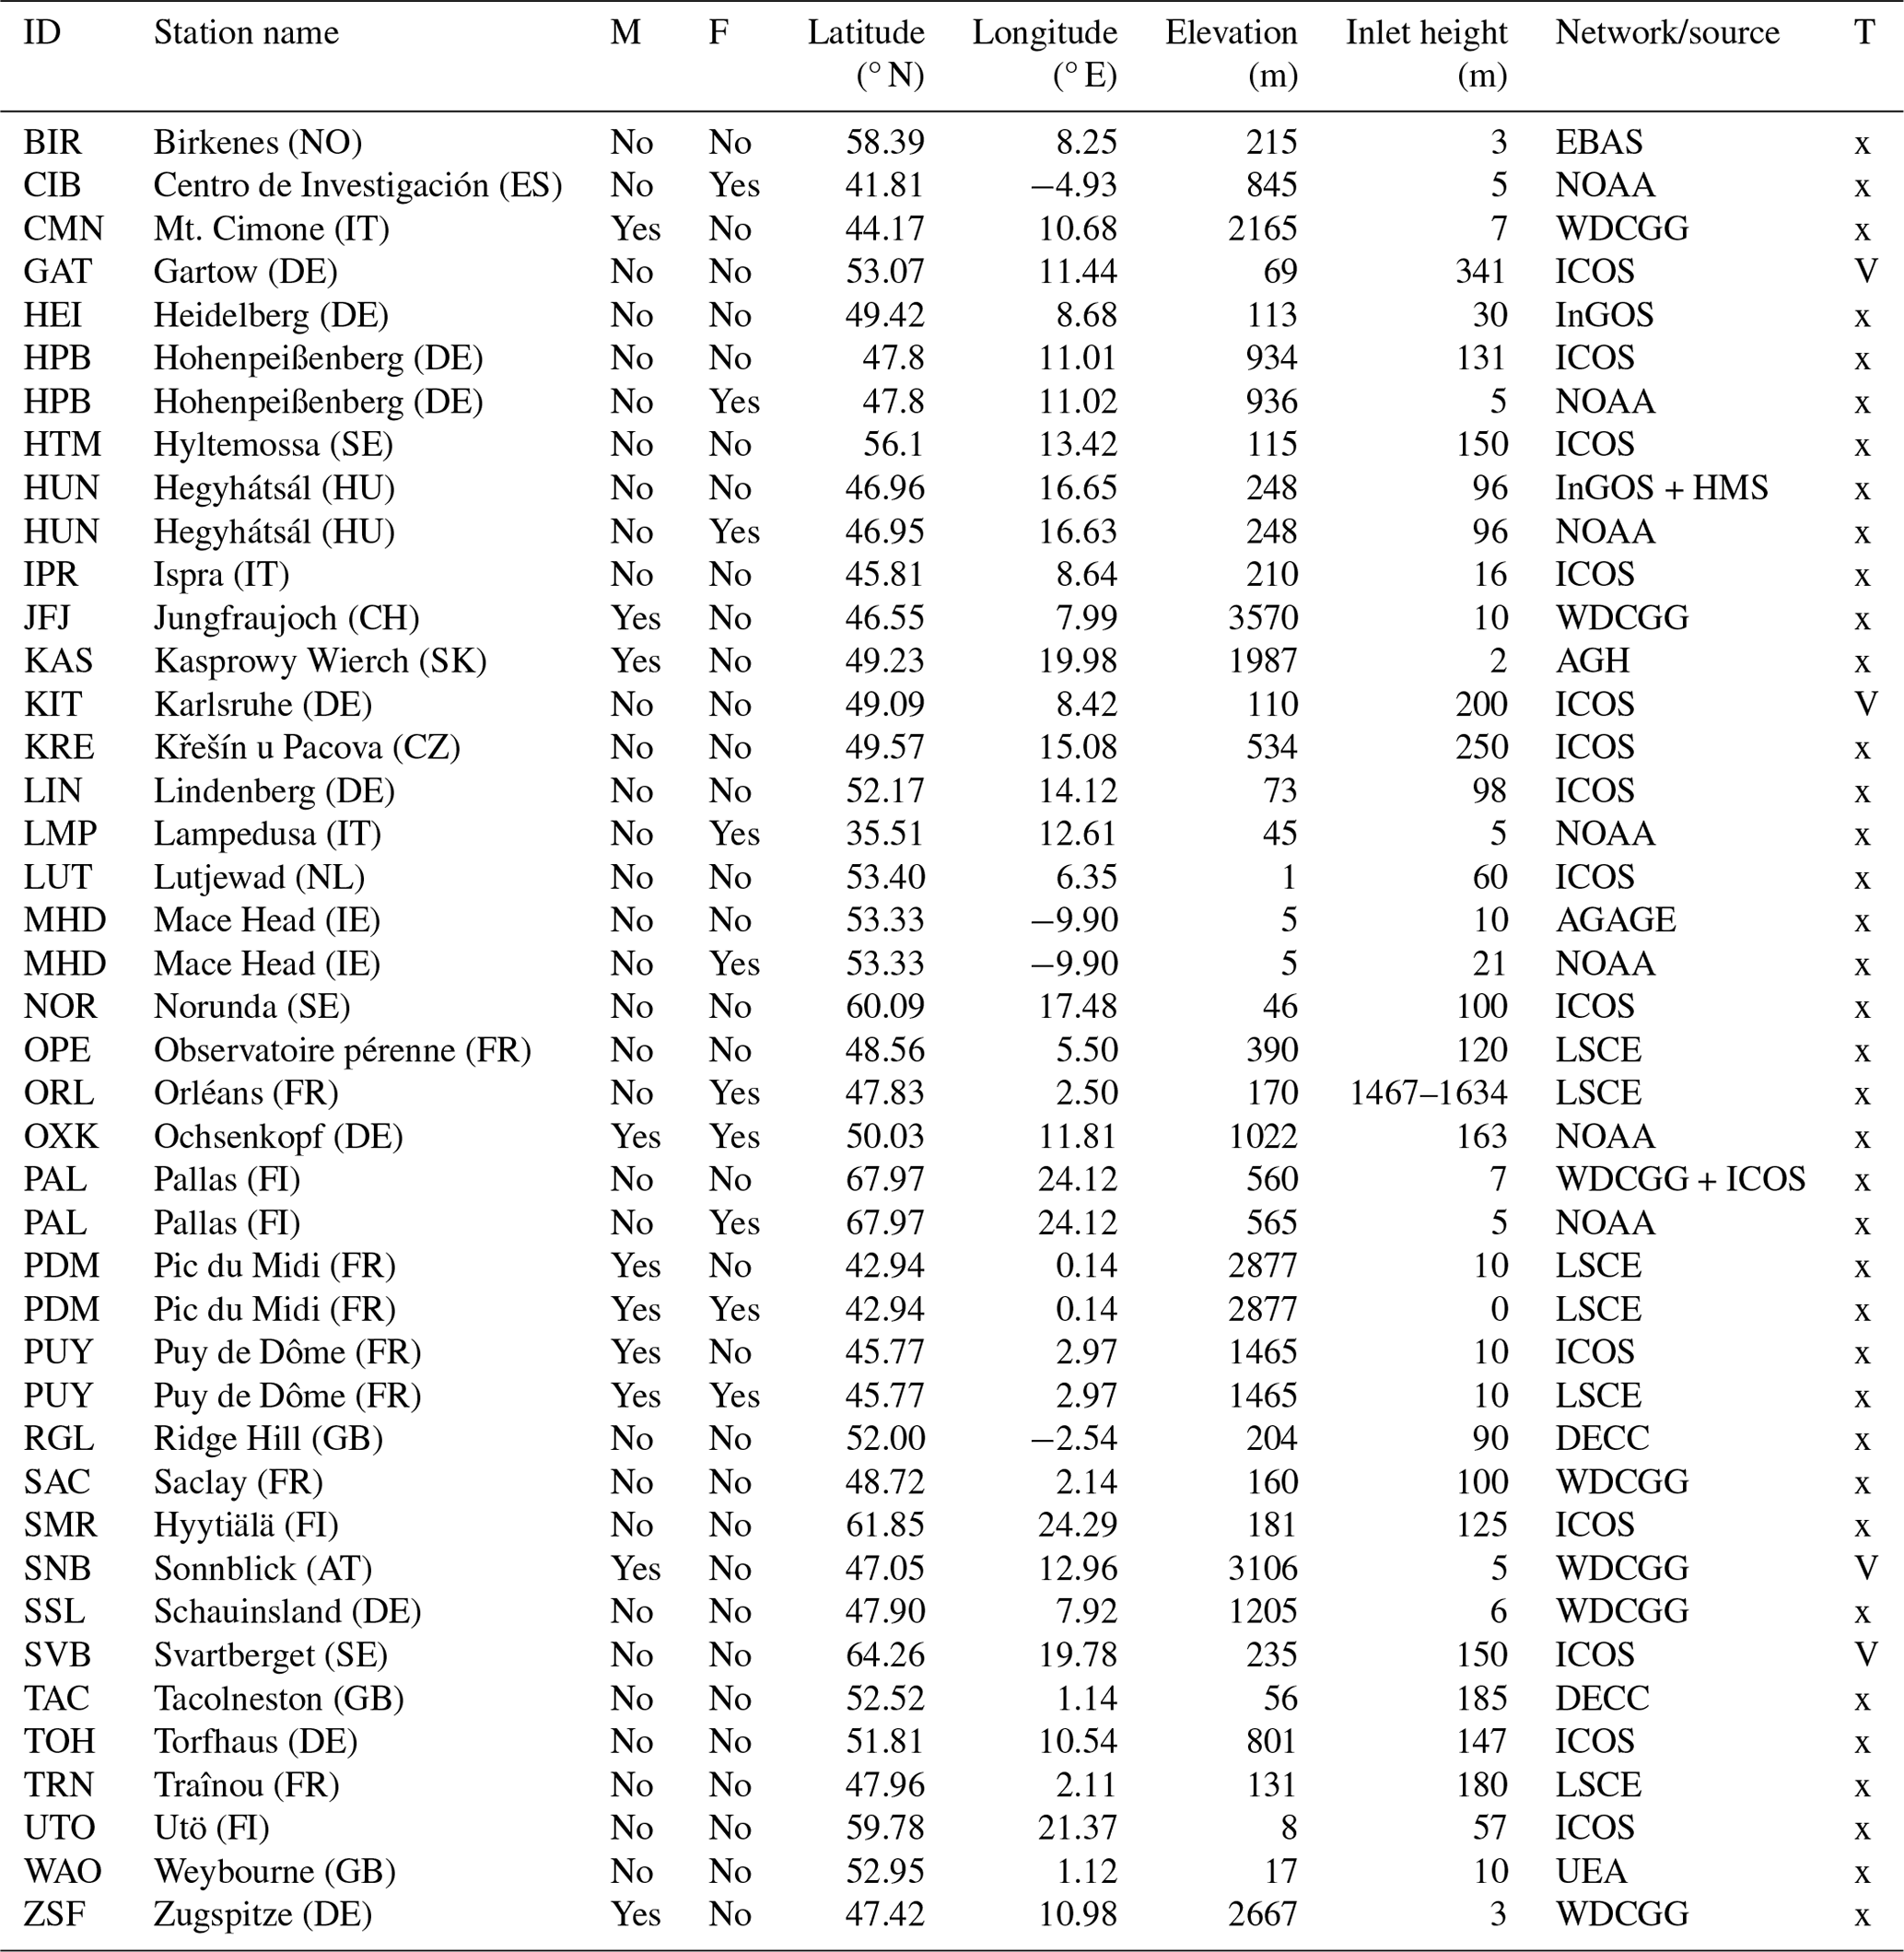
In our application, a harmonized set of measurements including quasi-continuous in situ observations and a few discrete flask samples is used. The in situ measurements are from 28 stations, while the flask samples are taken at 10 different locations. The flask samples account for ca. 0.5 % of the total number of observations. Another four in situ stations are used for validation. Most stations are from the atmosphere network of the Integrated Carbon Observation System (ICOS) (Heiskanen et al., 2022). All 32 in situ stations and 10 flask sample locations are listed in Table 1, where the assimilated sites are indicated in the column “T” with “x” and the validation sites with “V”. It is important to note that not all time series are complete. We distinguish mountain sites from sites in flat terrain. For the sites in flat terrain, observations in the afternoon from 11:00 to 16:00 UTC were assimilated, as usually done in atmospheric inverse modeling to avoid the difficulties in simulating the effects of shallow nocturnal boundary layers. In contrast, only nighttime values between 23:00 and 06:00 UTC were assimilated for mountain sites. At this time such stations are more representative of free-tropospheric conditions and are not influenced by pollution from daytime upslope valley winds, which would require a very high model resolution in order to be reasonably represented.
Table 1List of observation locations used in this study. The column “M” indicates mountain sites while the column “F” indicates if it is a flask sampling location. The column “T” indicate if this station is assimilated (“x”) or used as a validation site (“V”).
Pseudo-observations were synthetically generated for the first 2 months of the year 2018 (the synthetic inversions are performed in the period 2 January–3 March 2018) by sampling the output of a forward ICON-ART model simulation at a prescribed set of locations. To make the synthetic experiment comparable to an inversion with real observations, these locations correspond to actual CH4 measurements stations that are used for the real-data inversion for the year 2018. Furthermore, the pseudo-observations were generated only for the times when actual observations were available. The four stations that are used for validation purposes in the real application were also not assimilated in the reference inversion, but the effect of assimilating their observations was tested in a separate inversion. We added Gaussian noise to the pseudo-observations with σ=2 ppb.
The simulation used to produce the synthetic observations followed the reference setup described in Sect. 2.1.3 with one exception. Emissions from the two categories were scaled with a pre-defined field of scaling factors in order to create a “true” emission field that is systematically different from the a priori. The performance of the inversion can then be assessed in terms of its ability to reconstruct the true emission field. The field of scaling factors was randomly drawn from a normal distribution but spatially correlated assuming an exponential decay with a length scale of 200 km. In one sensitivity inversion, a different field of scaling factors was used to scale the so-called true emissions in which 11 European regions were scaled uniformly with different scaling factors.
2.2.9 Model–data mismatch
We use a model–data mismatch of 10 ppb+30 % of the mean (over the entire inversion period) emitted signal () in the forward model simulations using the prior emissions for all observations. We assume uncorrelated errors (diagonal observation-error covariance matrix R). The reasoning for scaling the model–data mismatch with the mean instead of the instantaneous emission signal is that the latter approach would generally result in higher uncertainties for measurements with high mole fractions and, hence, those measurements that contain the largest regional signal would receive the lowest weight in the inversion. More importantly, mismatches between real and simulated pollution events could then lead to overestimated uncertainties where an event occurred in the model but not in the observations and to underestimated uncertainties in the opposite situation. However, we still want to account for the overall higher uncertainty at sites which are more strongly exposed to local emissions. The use of a model–data mismatch based on instantaneous tracer signals is tested in one sensitivity experiment.
2.3 Sensitivity experiments
Numerous choices such as the length of the assimilation window, the size of the ensemble or the a priori error correlation length scale have to be made before starting an inversion. The settings for the reference inversion were motivated by previous studies but are to some extent still arbitrary. To evaluate the impact of these choices, additional sensitivity experiments were conducted by systematically varying individual settings. An overview of these experiments is presented in Table 2. We did not test a longer assimilation window of 20 instead of 10 d, which would constrain fluxes over 40 instead of 20 d, as tests showed that after 20 d of simulation usually almost no regional tracer mass is left in the model domain. This means that after 20 d no more flux signal can be “seen” by the observations. Like the reference inversion, all sensitivity inversions are run for the period 2 January–3 March 2018. The short period of 2 months is justified as the results of the performance in all synthetic inversions equilibrated after two assimilation windows and did not change significantly afterwards.
-
The setup of the reference inversion described in Sect. 2.2 is labeled case 1.
-
In three further inversions we test the sensitivity towards a lower and larger number of ensemble members (cases 2 and 3) as well as towards a smaller model–data mismatch uncertainty (case 4), which only corresponds to the 2 ppb measurement noise added to the pseudo-observations and which represents the ideal scenario in which no transport error has to be accounted for.
-
The influence of the Kalman gain localization is investigated by not applying any localization (case 5) or increasing σ from 600 to 1200 km (case 6).
-
In case 7, a different field of true scaling factors is applied to produce the pseudo-observations, in which 11 large regions are uniformly scaled (labeled “by region” in Table 2) instead of the randomly drawn but spatially correlated true scaling factors of the reference inversion (labeled “spatially correlated” in Table 2).
-
A different state propagation model for the mean state is tested in case 8, which propagates the once-optimized state vector of the previous window by 100 % instead of 66 %.
-
Three cases (9–11) are used to test the optimization of the background mole fractions as described in Sect. 2.2.6. We set the relative standard deviation for the eight dimensionless state vector parameters to 0.01. In case 9, the eight background tracer mole fractions are uniformly scaled by 0.99. In case 10, instead, eight different scaling factors (randomly drawn with a standard deviation of 1 %) are applied to the eight inflow regions. Case 11 is similar to case 10, but the scaling factors for the eight regions additionally vary with time. This is probably the most realistic experiment, capturing the possibility of large-scale biases in a global model varying both geographically and with time. For this case, a second set of true background scaling factors is selected. The true scaling factors linearly move with every 10 d window from the first set to this second set.
-
Case 12 tests the sensitivity to the assimilation of four more stations (which are the validation sites in our real-data application), three in central Europe and one in Scandinavia. These stations (Gartow (DE), Karlsruhe (DE), Svartberget (SE) and Sonnblick (AT)) are indicated in Table 1 with “V” in the column “T”.
-
In case 13 we use a model–data mismatch which is computed from instantaneous values instead of the mean values over the inversion period ( instead of ).
-
Case 14 tests the ability of the system to capture temporally varying emissions. For this case, similarly to the temporally varying background scaling factors in case 11, a second set of true scaling factors is selected for the emissions in different categories and regions, again randomly drawn from a normal distribution with the same variances as given in the a priori uncertainties. These true emissions linearly move with every 10 d window from the first set (shown in Fig. 6, left column) to this second set such that the second set represents the true emissions at the end of the inversion period (3 March 2018).
-
Finally, case 15 tests the capability of the system to optimize the agricultural emissions separately from the remainder of the anthropogenic emissions. In this case, the emissions from agriculture represent the category with the largest domain total flux (15.5 Tg yr−1), followed by non-agricultural anthropogenic emissions (14.2 Tg yr−1) and natural sources (7.9 Tg yr−1).
Table 2Overview of the synthetic simulations. In the column “mdm” the formula used for calculating the model–data mismatch is specified. The column “Variation” indicates if the emissions varied temporally in the simulation that was used to produce the pseudo-observations. The column “bg” indicates if the background mole fractions were varied in the simulation producing the pseudo-observations and optimized in the inversion. Boldface numbers or text signify changes compared to the reference inversion.
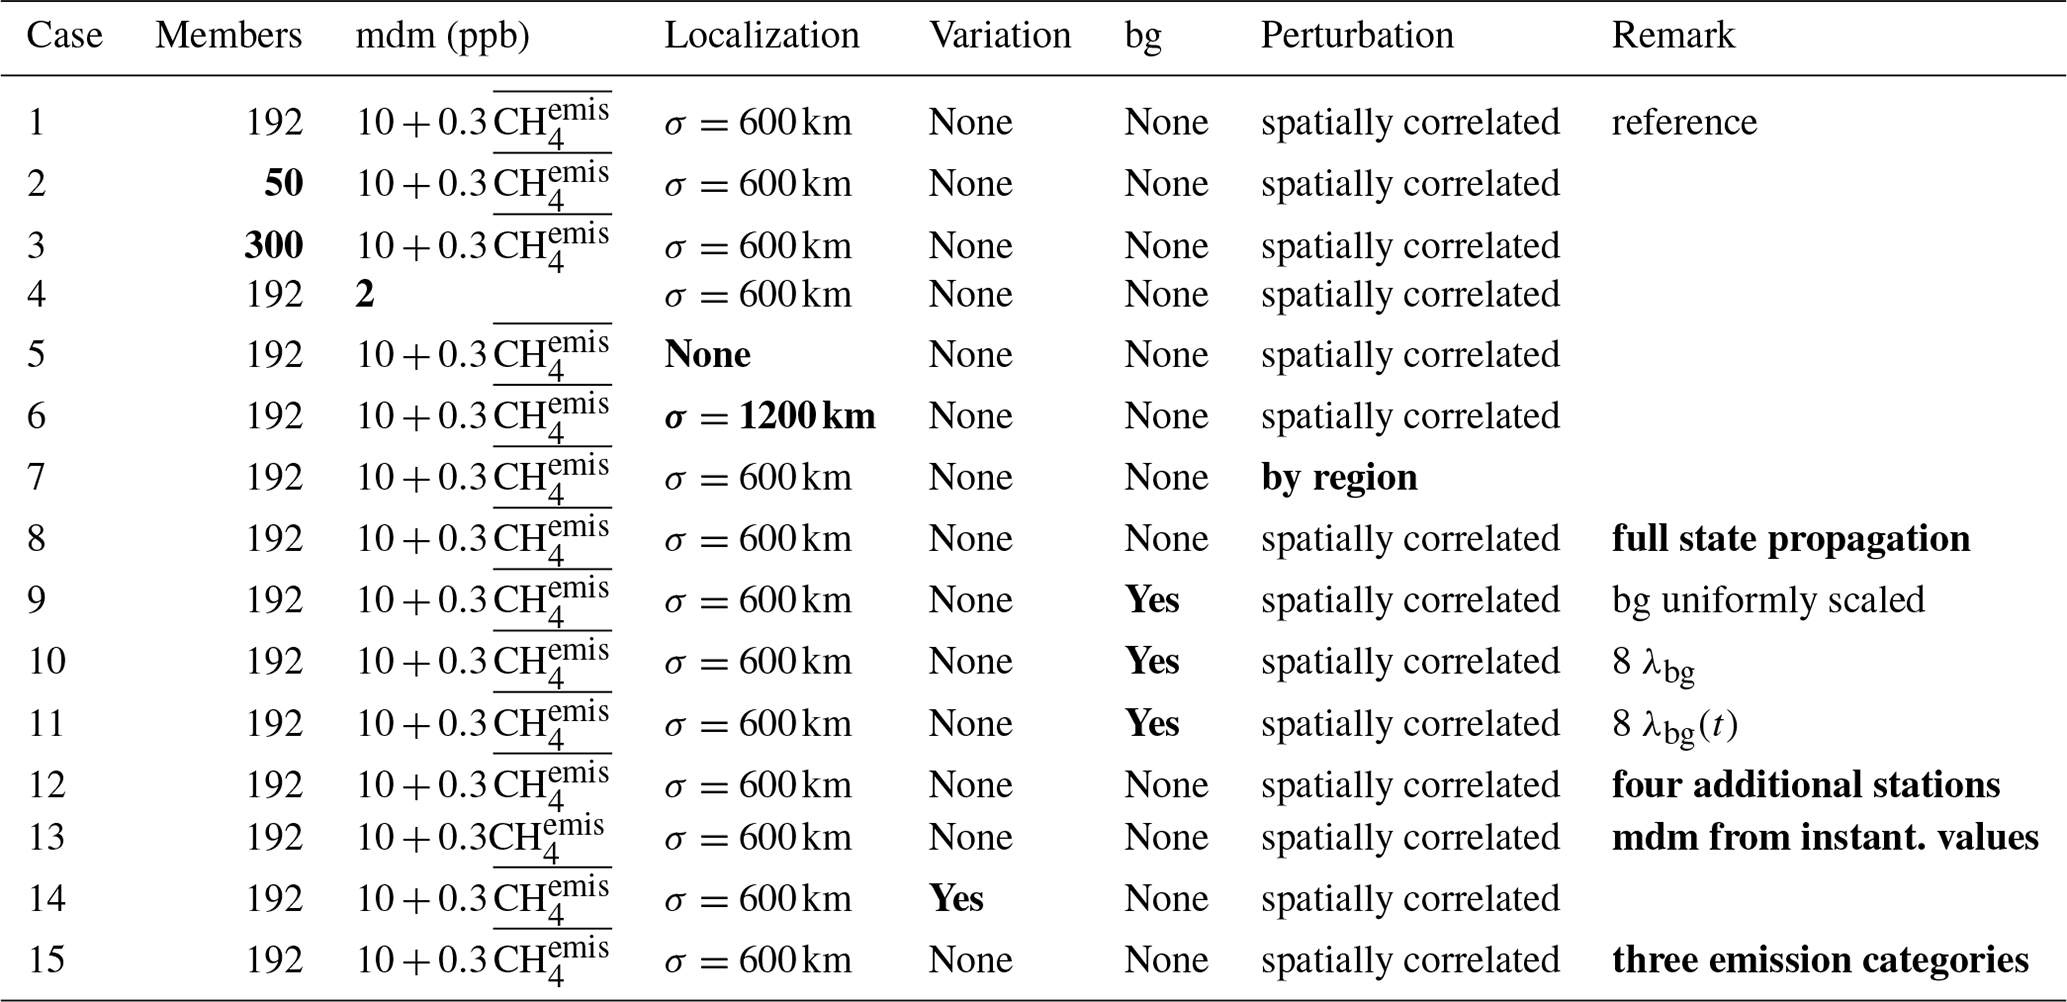
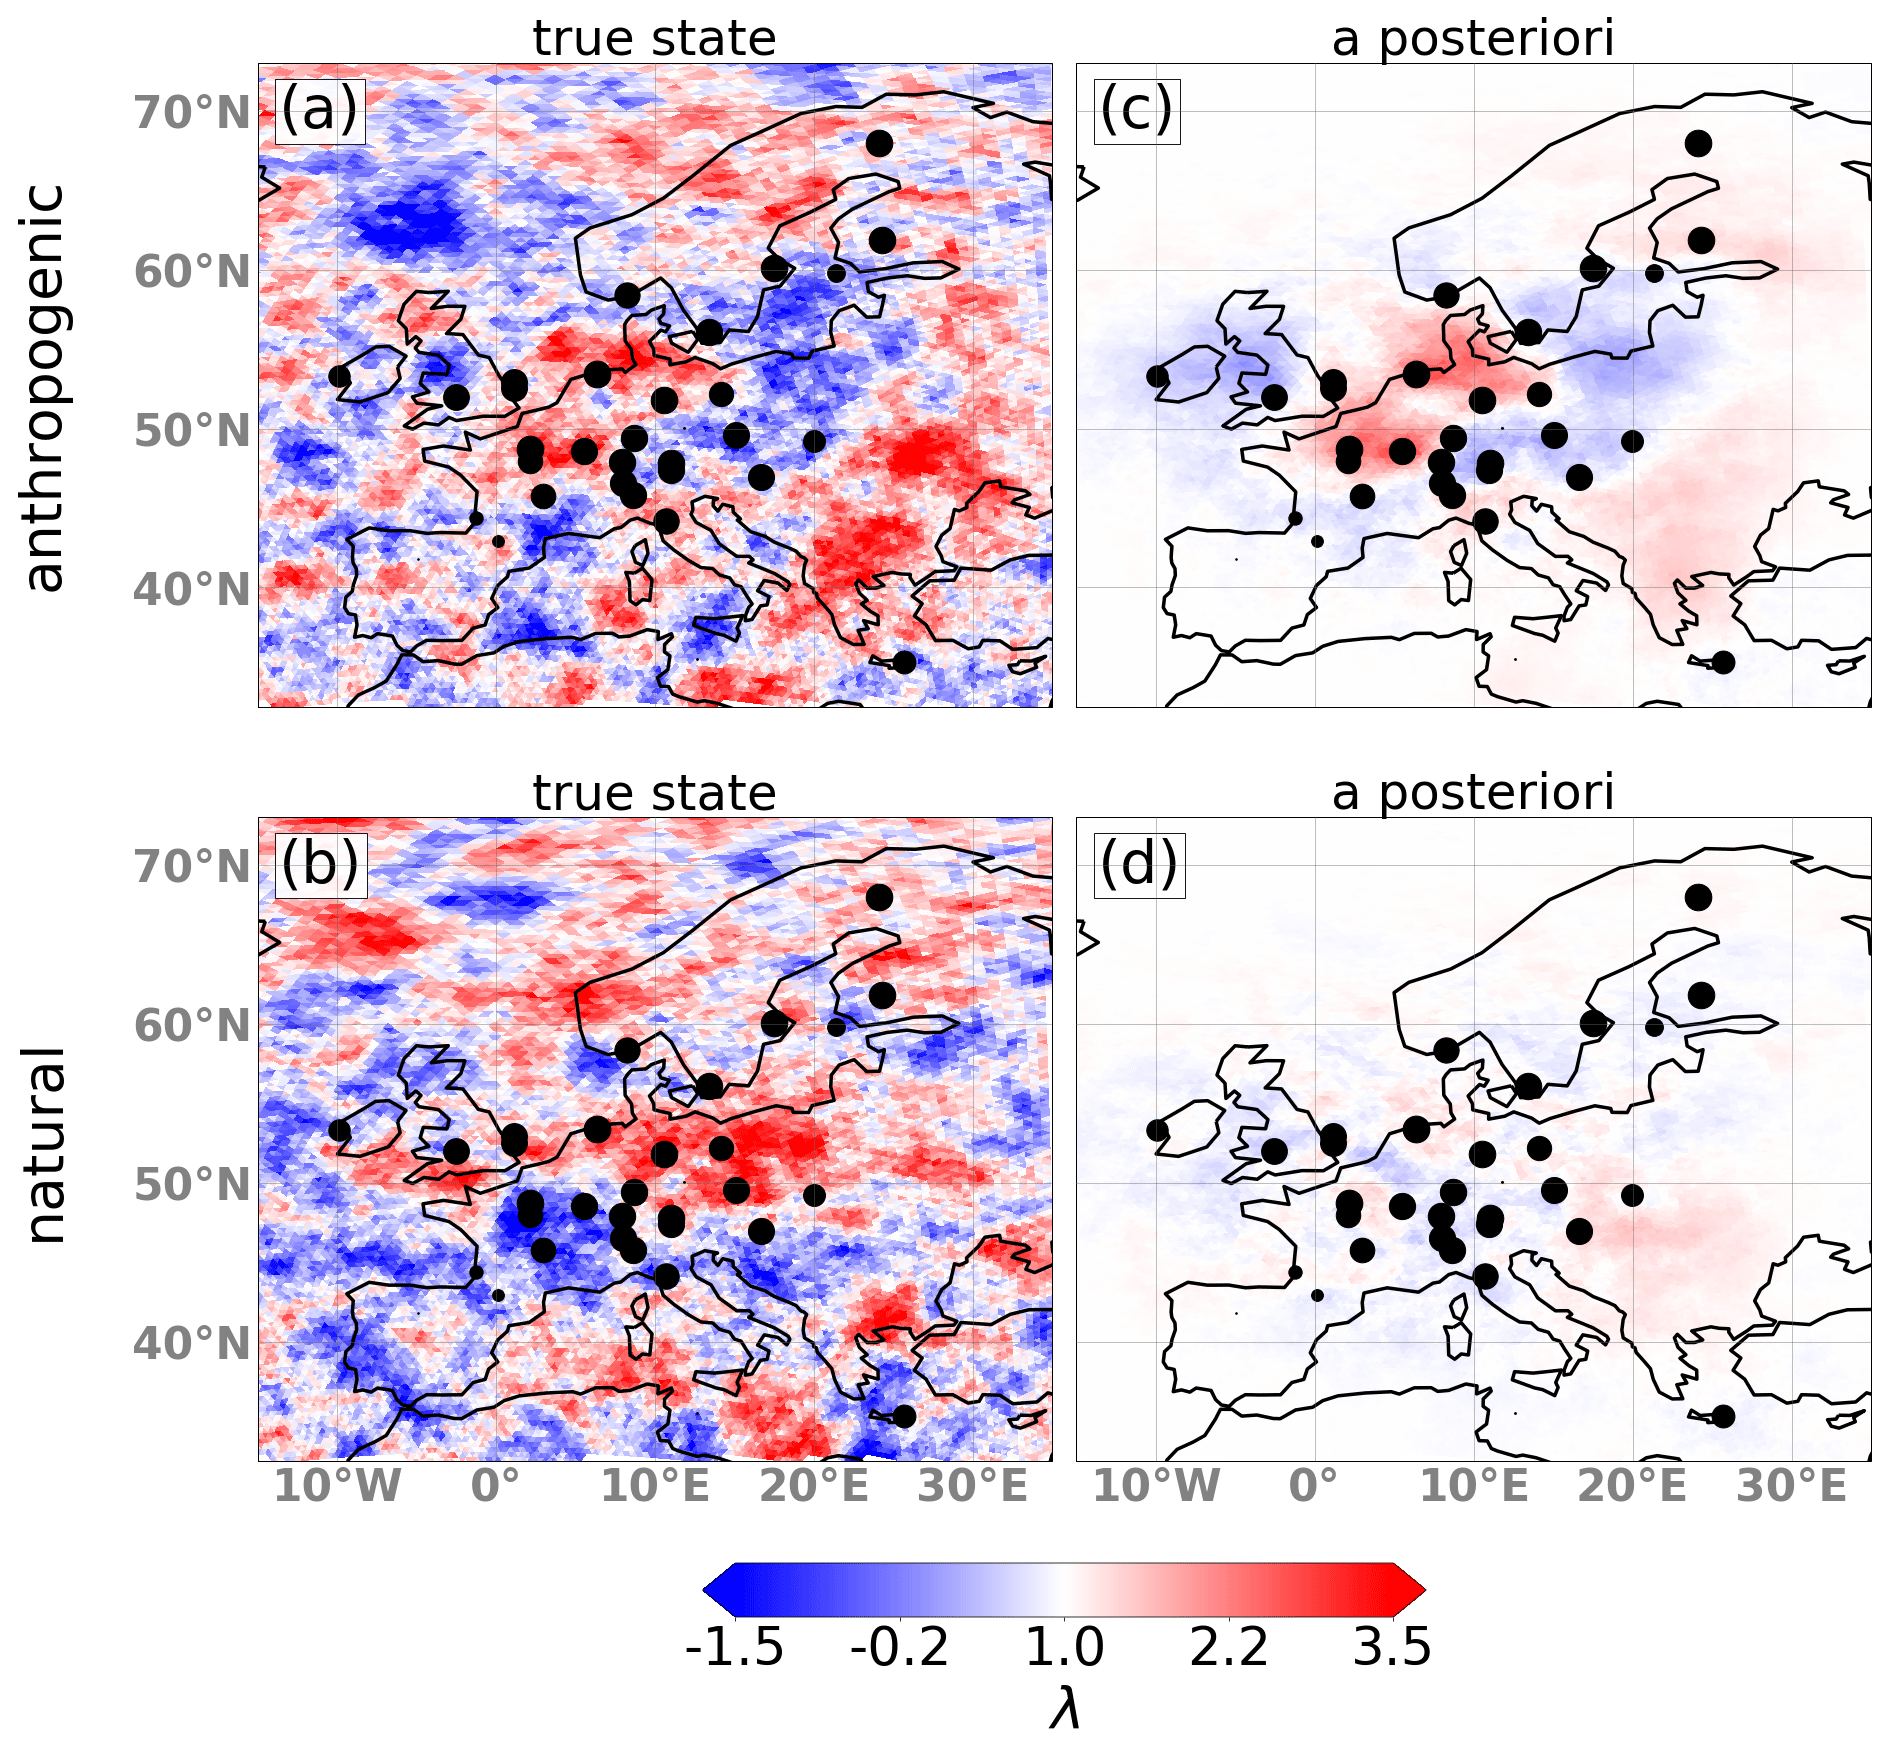
Figure 6Map showing the true scaling factors (a, b) and the 2-month mean a posteriori scaling factors (c, d) for the two optimized emission categories for the reference inversion. Overlaid are the measurement locations used in the inversion with the size of the circle proportional to the number of observations available.
3.1 Idealized setup
3.1.1 Reference inversion
Figure 6 shows the true (left) and the mean (from 12 January–3 March 2018) a posteriori (right) scaling factors for the two optimized emission categories. It can be seen that the optimized state is close to the true state for the anthropogenic emissions in regions with high emissions (see Fig. 3); large deviations of λ from 1 in the true state; and/or good coverage with observation sites, which is the case in central Europe. The a posteriori scaling factors for the natural emissions stay close to 1 and do not agree well with the true state, which means that the natural fluxes cannot be constrained independently from the larger anthropogenic fluxes. It is important to note that the performance of the optimization is strongly dependent on the choices of the true state. Especially for the lower natural emissions, a different set of true scaling factors may yield different results. In this setup, the inability to reproduce the true state of the natural emissions may come from the fact that the perturbations are relatively small in areas with large emissions (e.g., in Scandinavia) and that the density of observation stations in Scandinavia is low.
Figure 7 shows the total emissions (a) as well as the a priori (b) and a posteriori (c) error in the total emissions summed over both categories compared to the true state. The improvement (prior − posterior error) in terms of total flux is shown in (d). The results were computed from the mean fluxes for 12 January–3 March 2018. The first optimization window (2–12 January 2018) is discarded as this first window is only optimized once by the smoother (see Fig. 2). Almost every grid cell with deviations from the true state improves clearly in the a posteriori field, especially in the regions with a high station density in central Europe and on the British Isles. The mean absolute error of the 2-month mean total fluxes in this setup is reduced by 18.8 % in the a posteriori compared to the a priori emissions.
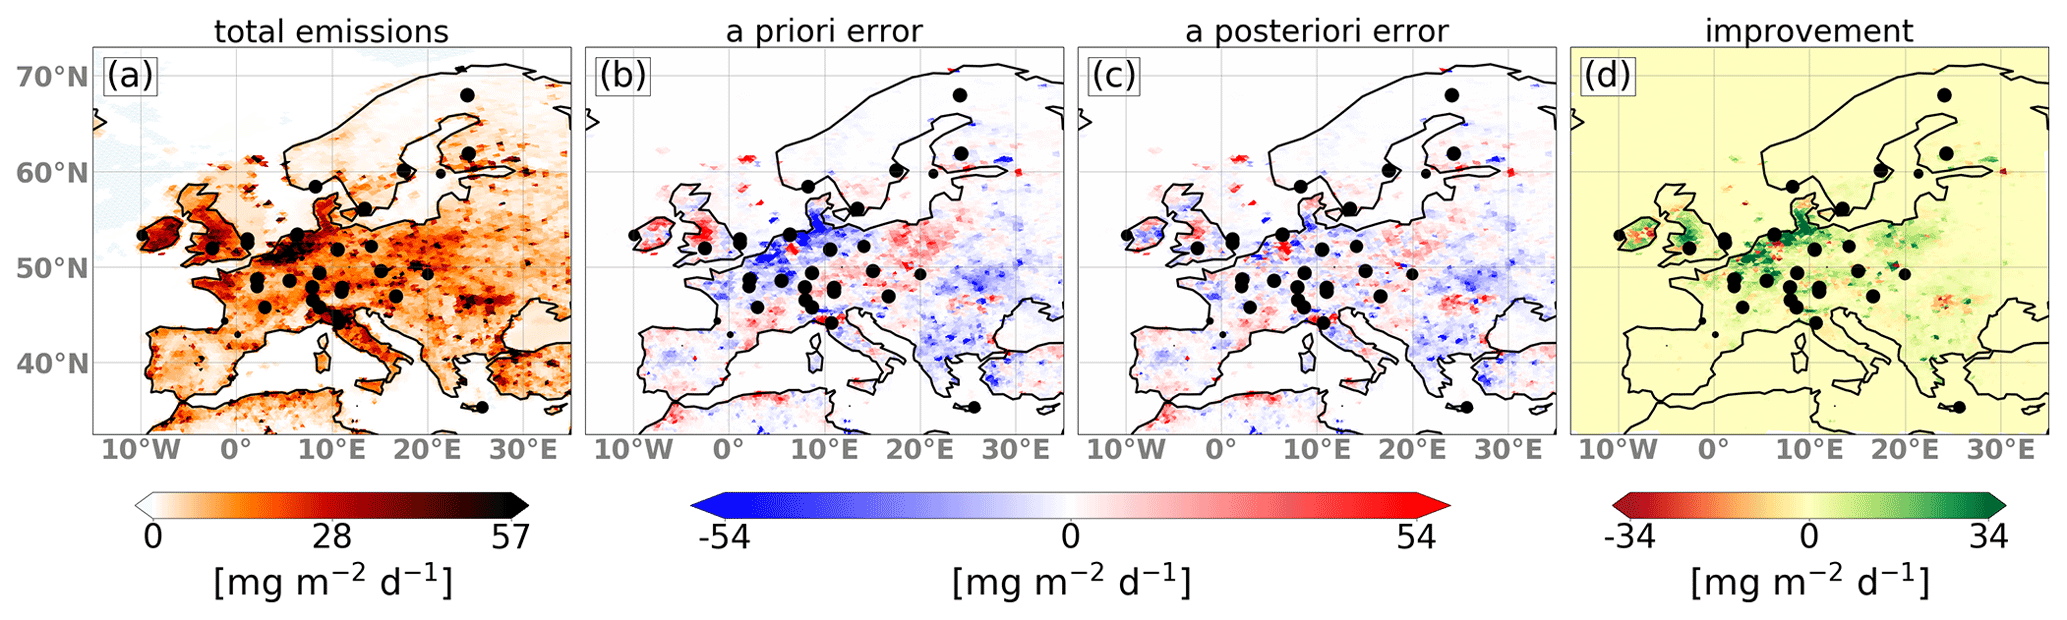
Figure 7Maps showing the total emissions (a), the a priori (b) and a posteriori (c) deviations of the fluxes, and the total improvement (d) for the reference inversion.
The system is thus capable of optimizing the total anthropogenic emissions (and, as shown in case 15, also agricultural emissions) of Europe. However, the system is not able to optimize the natural CH4 emissions individually, which have comparatively small fluxes.
3.1.2 Sensitivity simulations
For each of the 15 sensitivity inversions (see Table 2), we quantify the reduction in the mean absolute error in the a posteriori compared to the a priori emissions expressed as a percentage. The results are summarized in Table 3. They show the error reduction for the total emissions based on the 10 d windows as well as for the two emission categories (anthropological (anth) and natural) individually (for case 15 also the agricultural emission error reduction is shown). For the three inversions with background optimization, the reduction in the error in the eight corresponding state vector parameters is shown additionally. The reduction in the a posteriori mean absolute error of the mean total emission fluxes for the considered period (i.e., of the temporally averaged fluxes) is shown in the column . All results are computed for a 2-month period (12 January–3 March 2018).
Table 3Statistical results of the sensitivity simulations for the period 2 January–3 March 2018. The expression is the a posteriori mean absolute error of the total emission fluxes () compared to the a priori situation at the beginning of the inversion (), expressed as a percentage reduction of the prior. The statistics are computed considering every single flux component (every single grid cell and every single assimilation window). The expressions and show the same as , but for the two categories individually. The expression denotes the reduction in mean absolute error for the eight state vector parameters optimizing the background CH4 mole fractions. The expression finally shows the same as but for the mean fluxes during the period instead of considering the individual assimilation windows. Boldface numbers or text signifies the reference inversion.
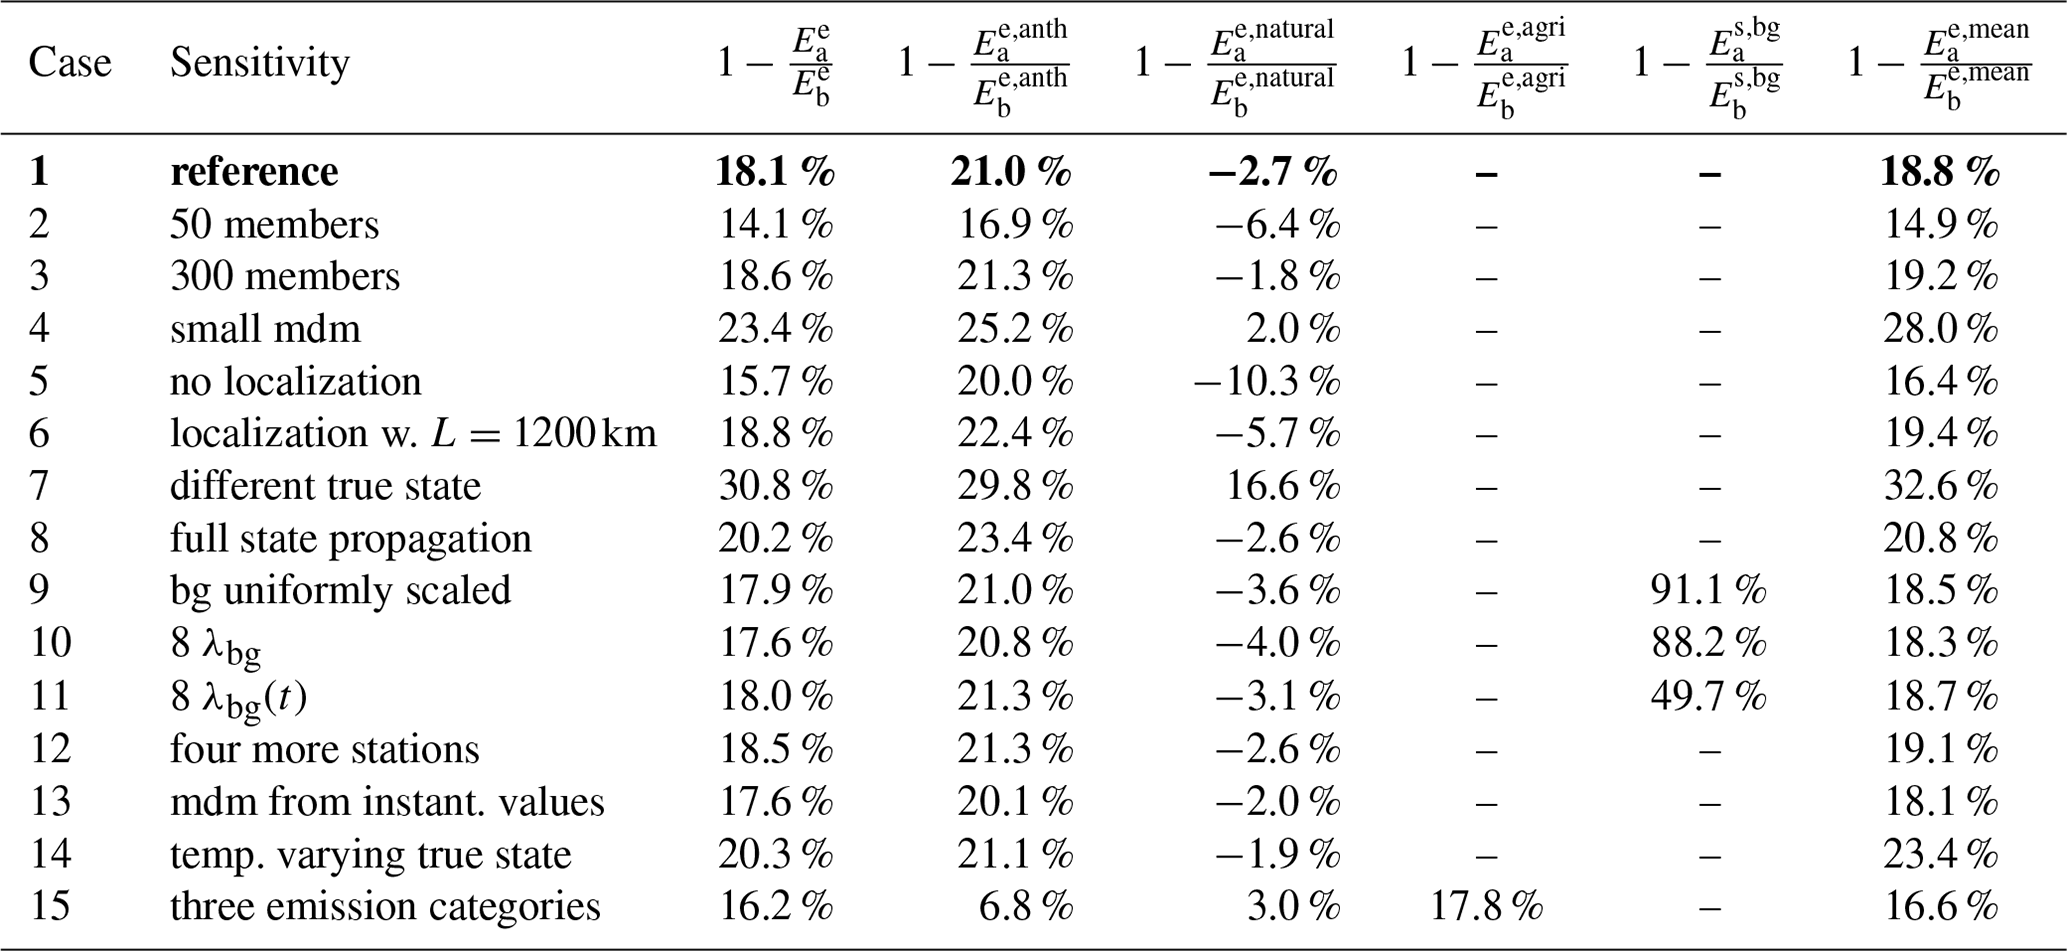
In the reference inversion (case 1), the error in the total a priori fluxes is reduced by 18.1 %, while the error in the 2-month mean total fluxes is reduced by 18.8 %. The anthropogenic emissions show an error reduction of 21.0 %, whereas the error for the natural emissions increased by 2.7 %.
The performance for the total fluxes as well as for the individual categories decreases as expected when reducing the number of ensemble members (case 2) or switching off the localization of the Kalman gain matrix (case 5), highlighting the importance of using the localization technique. Other sensitivity inversions show a similar performance to the reference inversion, such as inversions with 300 instead of 192 ensemble members (case 3), which justifies the use of 192 ensemble members in our setup. Also a longer localization length scale (case 6) or adding four additional stations in central Europe, where the observation network is already dense (case 11), does not change the performance significantly. The use of a model–data mismatch based on instantaneous concentration values (case 13) instead of the average concentrations also does not change the performance. As explained in Sect. 2.2.9, we expect the use of a model–data mismatch based on mean instead of instantaneous concentrations to have advantages when assimilating real data where we have a real transport error between simulated and real tracer transport. This situation is not mimicked in this idealized setup. Propagating the state vector by 100 % (case 8) improves the error reduction significantly. Such an improvement is to be expected for an idealized setup with constant emissions and a perfect transport model and without any measurement noise. The same is true for case 3 with a very small model–data mismatch (2 ppb), as a lower model–data mismatch gives more weight to the unbiased pseudo-observations and hence pulls the a posteriori scaling factors closer to the true scaling factors. A significantly better performance (especially for the natural fluxes) is reached in case 7, where a different type of “true state” (11 scaled European regions) is used. This produces a more distinct flux signal, which is easier to optimize. Disturbing the background with a constant factor (0.98) and optimizing the background mole fractions with eight additional state vector parameters (case 10) influences the optimization of the emissions only minimally. This is due to the fact that the error in the eight state vector parameters representing the background mole fractions is reduced by 91.1 %. Similarly, using eight different (but still temporarily constant) scaling factors for the background mole fractions (case 10) reduces the performance of the emission optimization very little. The error in the eight state vector parameters representing the background mole fractions is again reduced strongly by 88.2 %. As with the emissions, the performance of the background optimization is also highly dependent on the chosen true scaling factors. Due to the dominating westerly winds, the two scaling factors at the western border of the domain can be constrained the best. Using eight different scaling factors for the background mole fractions which additionally change in time (case 11) shows a performance of the emission optimization similar to cases 9 and 10 but shows a worse performance in optimizing the eight background state vector parameters (which are now time-varying). The reason for this is one single background parameter (representing the inflow region 1; see Fig. 4). As there is almost no inflow from this region and the distance from this region to the next observation stations is very large, this region cannot be constrained. When only looking at the inflow regions 2–7, the error in the scaling factors is reduced by 84.7 %, which is a similar performance to in cases 9 and 10. In case 14, where the scaling factors of the true state are time-dependent, i.e., where they gradually move to a second set of scaling factors, the improvement of the total flux is even slightly better than in the reference inversion, which shows that the system is also capable of capturing slowly varying emission strengths. Case 15 finally shows that agricultural emissions individually can be optimized well (17.8 %), but then the error reduction in the remaining anthropogenic sources without the agricultural emissions significantly drops from 21.0 % to 6.8 %.
In all cases, the total error reduction is based on the error reduction in the anthropogenic emissions (or the agriculture emissions in case 15), while the error in the natural emissions almost always increases, especially for the cases that perform less well in general (e.g., when only using 50 ensemble members or switching off localization). This suggests that the natural emissions cannot be estimated independently from the anthropogenic emissions. This is different for case 7 with a different type of true state, which highlights the impact of the chosen true state on the performance of the inversions.
The sensitivity runs allow us to draw conclusions for the application with real observations. They emphasize the significance of the localization technique for optimal performance, suggesting that a σ value of 600 km is a favorable selection. Additionally, the findings indicate that 192 ensemble members are sufficient. As a “perfect transport model” without transport error is used in this idealized setup, these inversions show the upper limit of what we can expect from the application with real observations: the total fluxes and anthropogenic emissions can be well optimized, and this is especially true for central and western Europe with good observational coverage. However, categories with small fluxes (such as natural emissions in central Europe) can hardly be optimized independently. It is also to be expected that the improvement in regions with few measurements (e.g., southwestern and eastern Europe) will be very small. We further see that the system can correct slowly varying large-scale background biases of around 1 % very well.
3.2 Real-data application
3.2.1 Posterior fluxes and background mole fractions
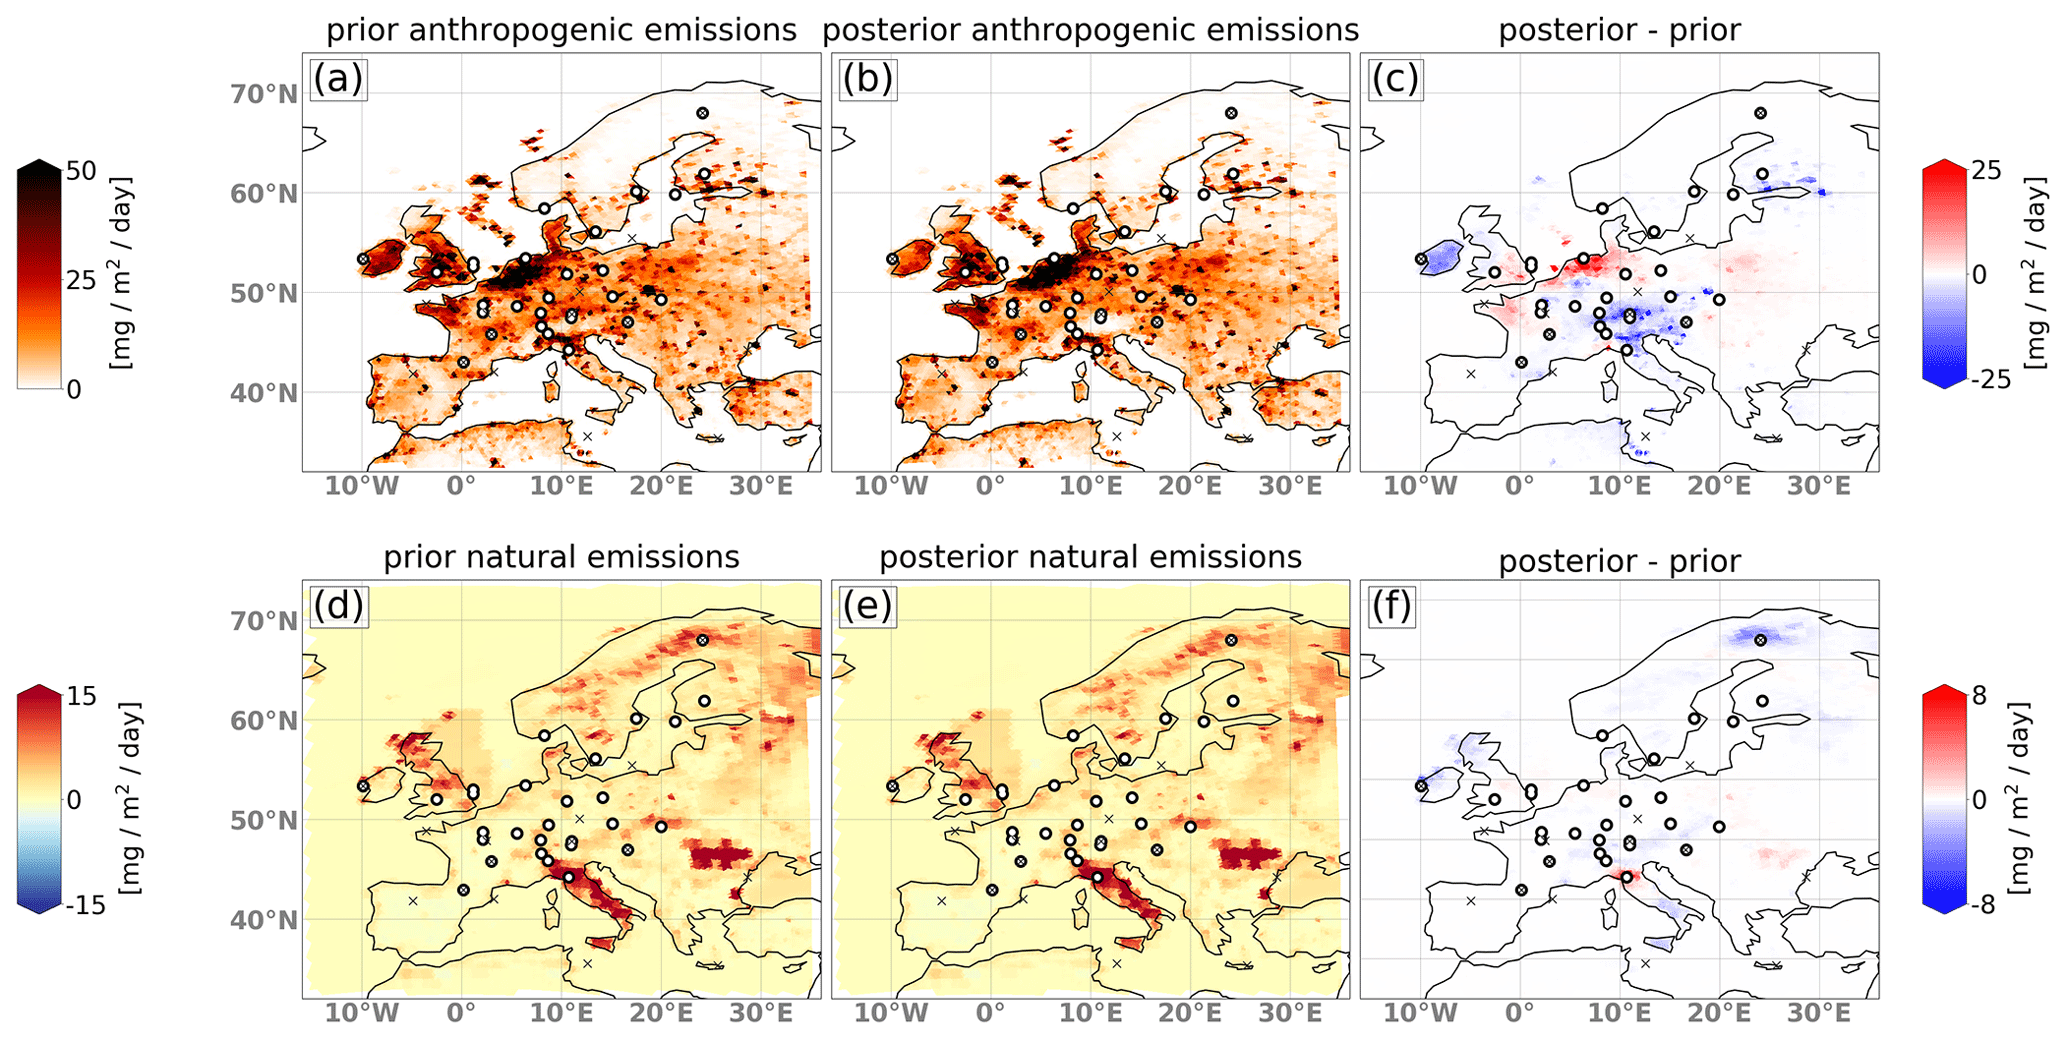
Figure 8 shows maps of annual mean CH4 emissions for 2018 for the a priori (left) and a posteriori (middle) and the difference between the two (right) for the anthropogenic (top) and natural (bottom) fluxes. The anthropogenic emissions show a strong upward correction of up to 25 in the Benelux countries and a moderate upward correction in northwestern France and southern England. In the rest of the domain, the anthropogenic emissions are corrected downwards, especially over Ireland but also in the Alpine region and in southern Finland. For the annual mean, the natural fluxes are corrected downwards almost everywhere, especially over Italy (up to −22 %), the British Isles (−15 %), Romania–Moldova (−10 %) and Scandinavia (−10 %).
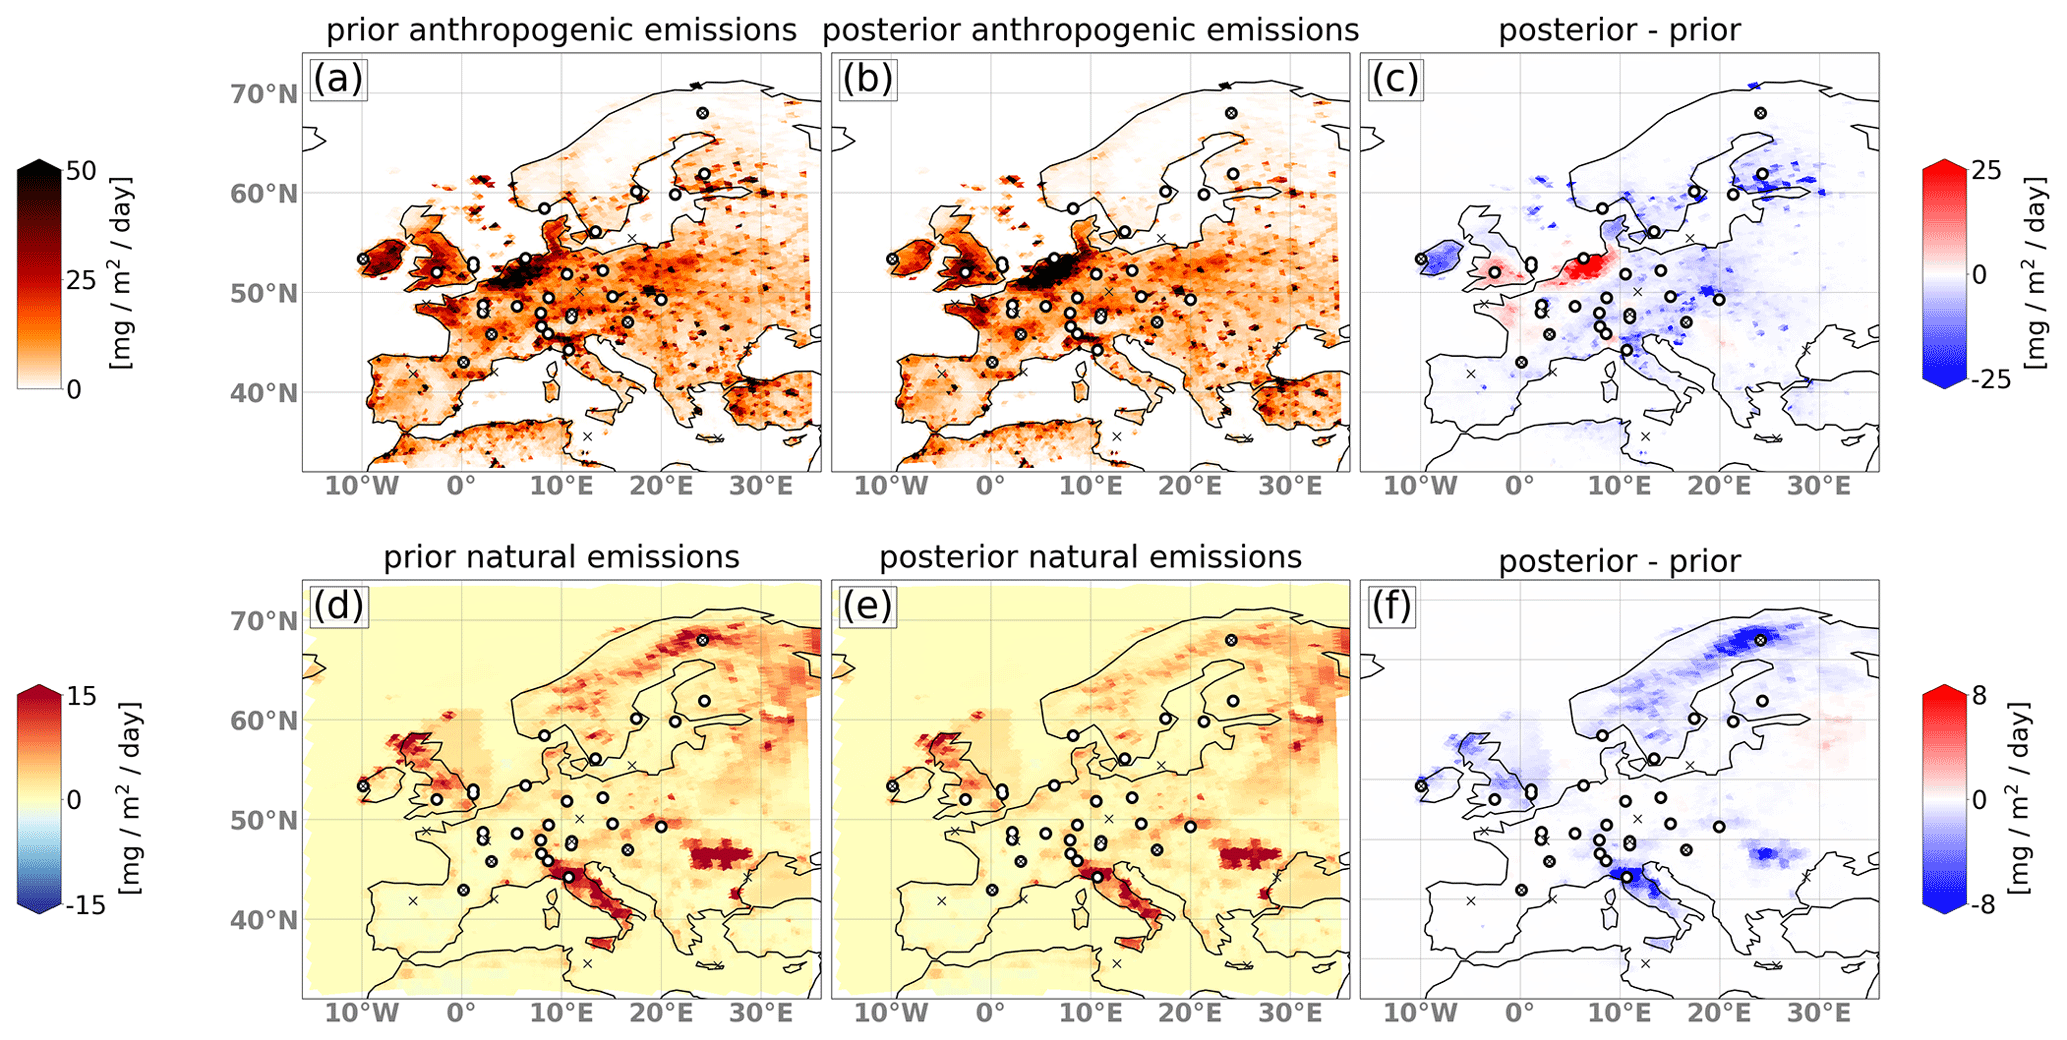
Figure 8Map showing the mean a priori (a, d) and a posteriori (b, e) fluxes for the year 2018 as well as the difference (c, f) for the anthropogenic (a–c) and natural (d–f) sources. The results for 2008 and 2013 are shown in Appendix B.
Over the Iberian Peninsula, northern Africa and Russia, the increments are generally very low in both categories, as those regions are poorly or not at all constrained by observations. The downward correction of the natural fluxes in Italy and Romania–Moldova is most likely due to the very high a priori geological emissions in these regions. The downward correction of the Scandinavian natural fluxes is possibly due to the unusually hot summer of 2018, though the study of Thompson et al. (2022) did not find a clear anomaly of CH4 fluxes in this region in 2018. The a priori wetland and peatland emissions provided by JSBACH-HIMMELI for the year 2018 are a repetition from the year 2017 and hence do not account for the lower CH4 emissions expected for these sources during a hot and dry summer caused by low water table levels (e.g., Bridgham et al., 2013). For the years 2008 and 2013, the system corrects the natural fluxes in northern Europe much less downwardly than in 2018. This can be seen in Appendix A in Fig. A1. It shows the time series of the a priori and a posteriori fluxes for the two categories and the three years 2008, 2013 and 2018 for the EU27 + UK countries as well as for northern, western, eastern, and southern Europe. It also shows less downward correction of anthropogenic fluxes in northern Europe for the years 2008 and 2013 which could be an effect of cross-sector covariances (see Fig. 9d).
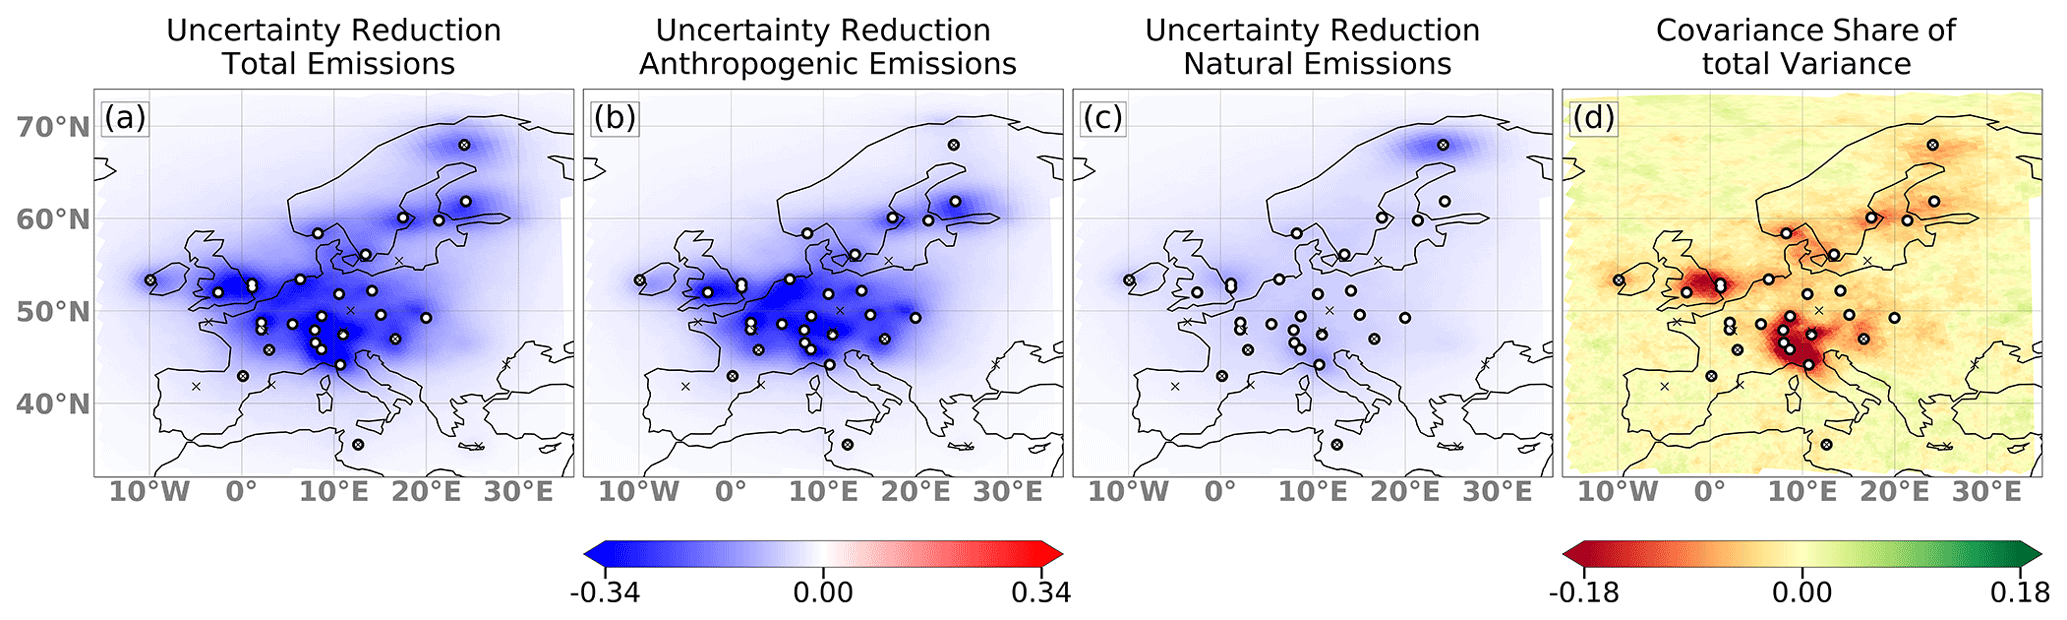
Figure 9Maps showing the differences in the a posteriori uncertainties compared to the a priori uncertainties for the total emissions (a), anthropogenic emissions (b) and natural emissions (c). The fraction of the covariance on the total variance is shown in panel (d). Optimized fluxes are based on an inversion with real observations.
Figure 9 presents maps of yearly mean uncertainty reductions (negative values mean a reduction in uncertainty) for the total emissions (a), anthropogenic emissions (b) and natural emissions (c). The covariance as a fraction of the total variance is shown in (d). The total uncertainty is computed from the variances of the two categories as well as the covariances between them, for each grid box. Since the covariances are typically negative, the total uncertainty reduction is larger than the sum of the uncertainty reduction in the two categories. This is mainly the case in southwestern England and the Alpine region and to a lesser extent also around the Scandinavian measurement locations. Negative covariances mean that in those regions the system cannot distinguish well between the two fluxes; i.e., an improved match to observed mole fractions could be achieved by increments of either anthropogenic or natural fluxes in these regions.
As described in Sect. 2.2.6, the system optimizes not only emissions but also background mole fractions in eight different boundary regions. The effect of this optimization on the mole fractions of the background field in the domain is shown in Fig. 10, which displays the mean correction of the background field in the lowest model level for 2018, spatially, and as a time series of the domain-wide total. The yearly mean mole fraction difference shows only very small corrections between 0 and 1.6 ppb of the background field, mainly downwards, except for the northeasterly inflow region. The time series shows that the domain total corrections were slightly upwards in spring, while the corrections were downwards during early summer and at the end of the year. The minor adjustments of the background mole fractions indicate a very small bias in the reanalysis product used, CAMS v19r1, significantly smaller than what we assumed in the sensitivity simulations (cases 10–12).
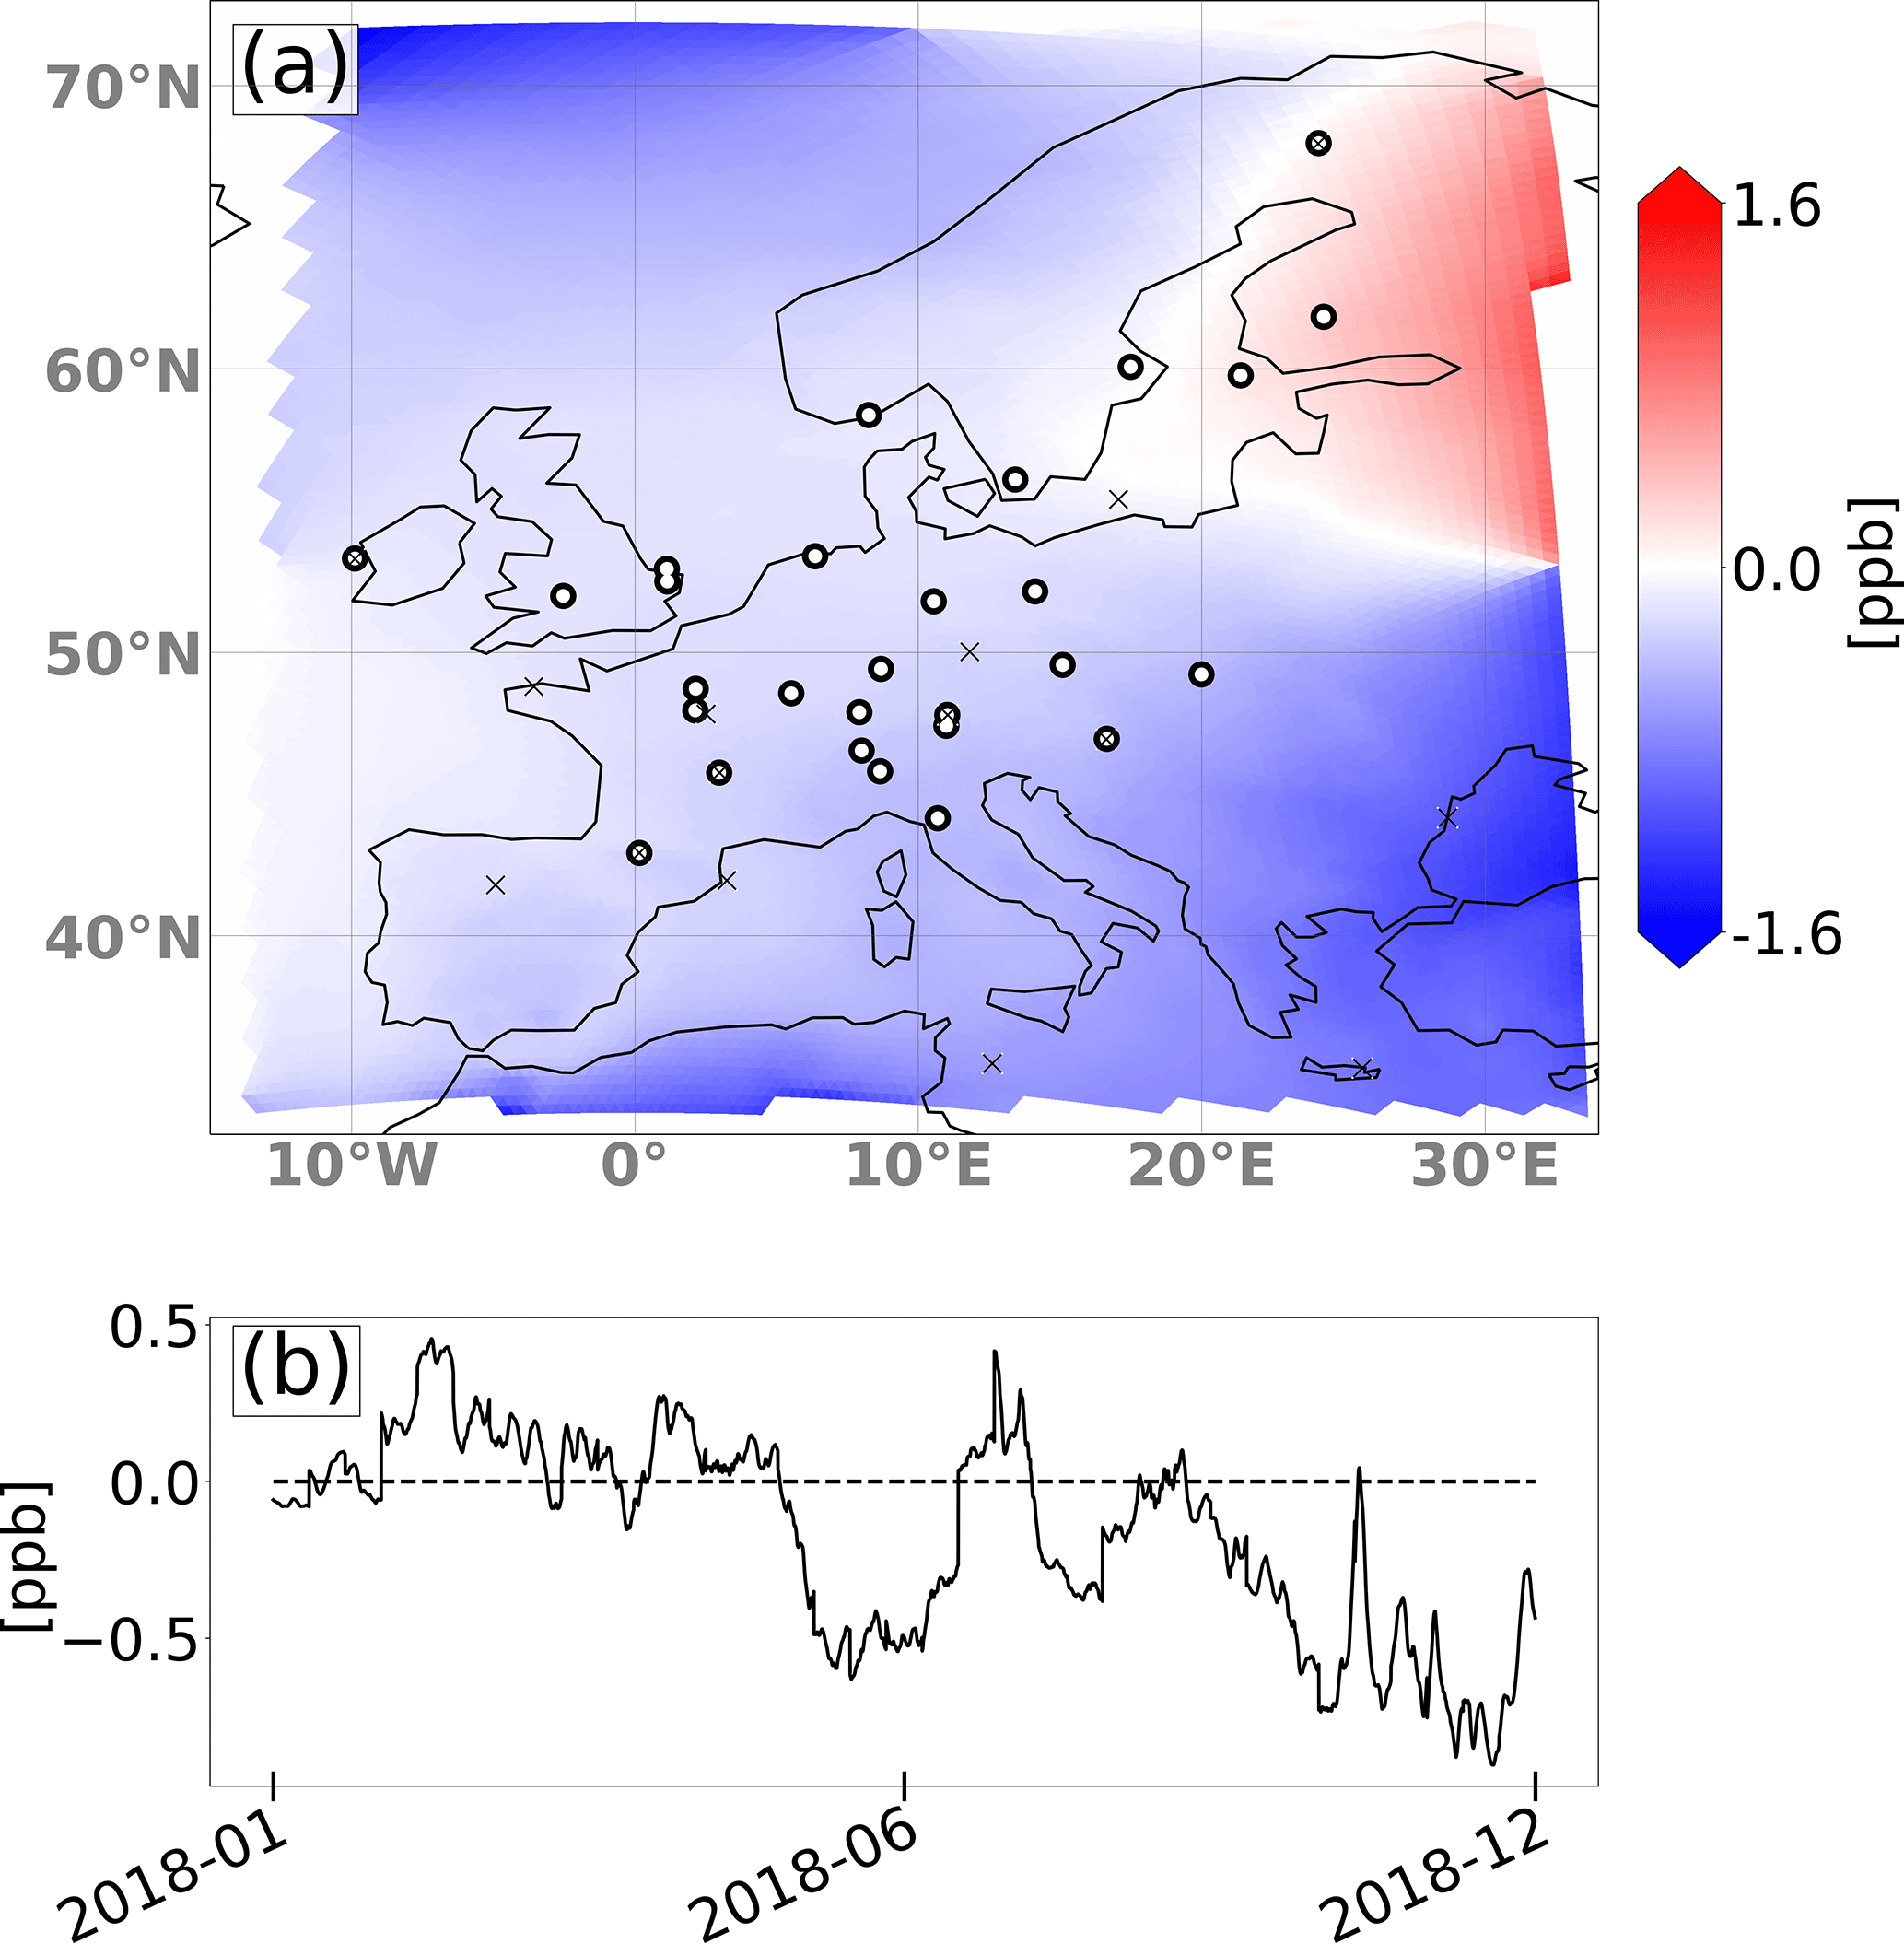
Figure 10The difference in the a posteriori and a priori background dry-air mole fractions in the lowest model layer shown as a yearly mean on a map (a) and as a time series (the date format is year-month) of the domain-wide total (b).
3.2.2 Time series at measurement sites
Figure 11 shows examples of time series for the period 30 March–13 June 2018 at the stations Lutjewad (NL), Hyytiälä (FI) and Heidelberg (DE). Simulated dry-air mole fractions (from a priori emissions in red and a posteriori emissions in blue) are compared to observations (in gray). Additionally, the assimilated afternoon measurements (black dots) and the simulated background tracer dry-air mole fractions are shown, in dark green for the a posteriori and light green for the a priori. The light-green line is mostly overlaid by the dark-green line. At all three stations, the simulation with the a posteriori emissions is closer to the observations. Furthermore, the a priori background mole fractions match the lowest measured mole fractions in this period, indicating that the bias of the background field is very low.
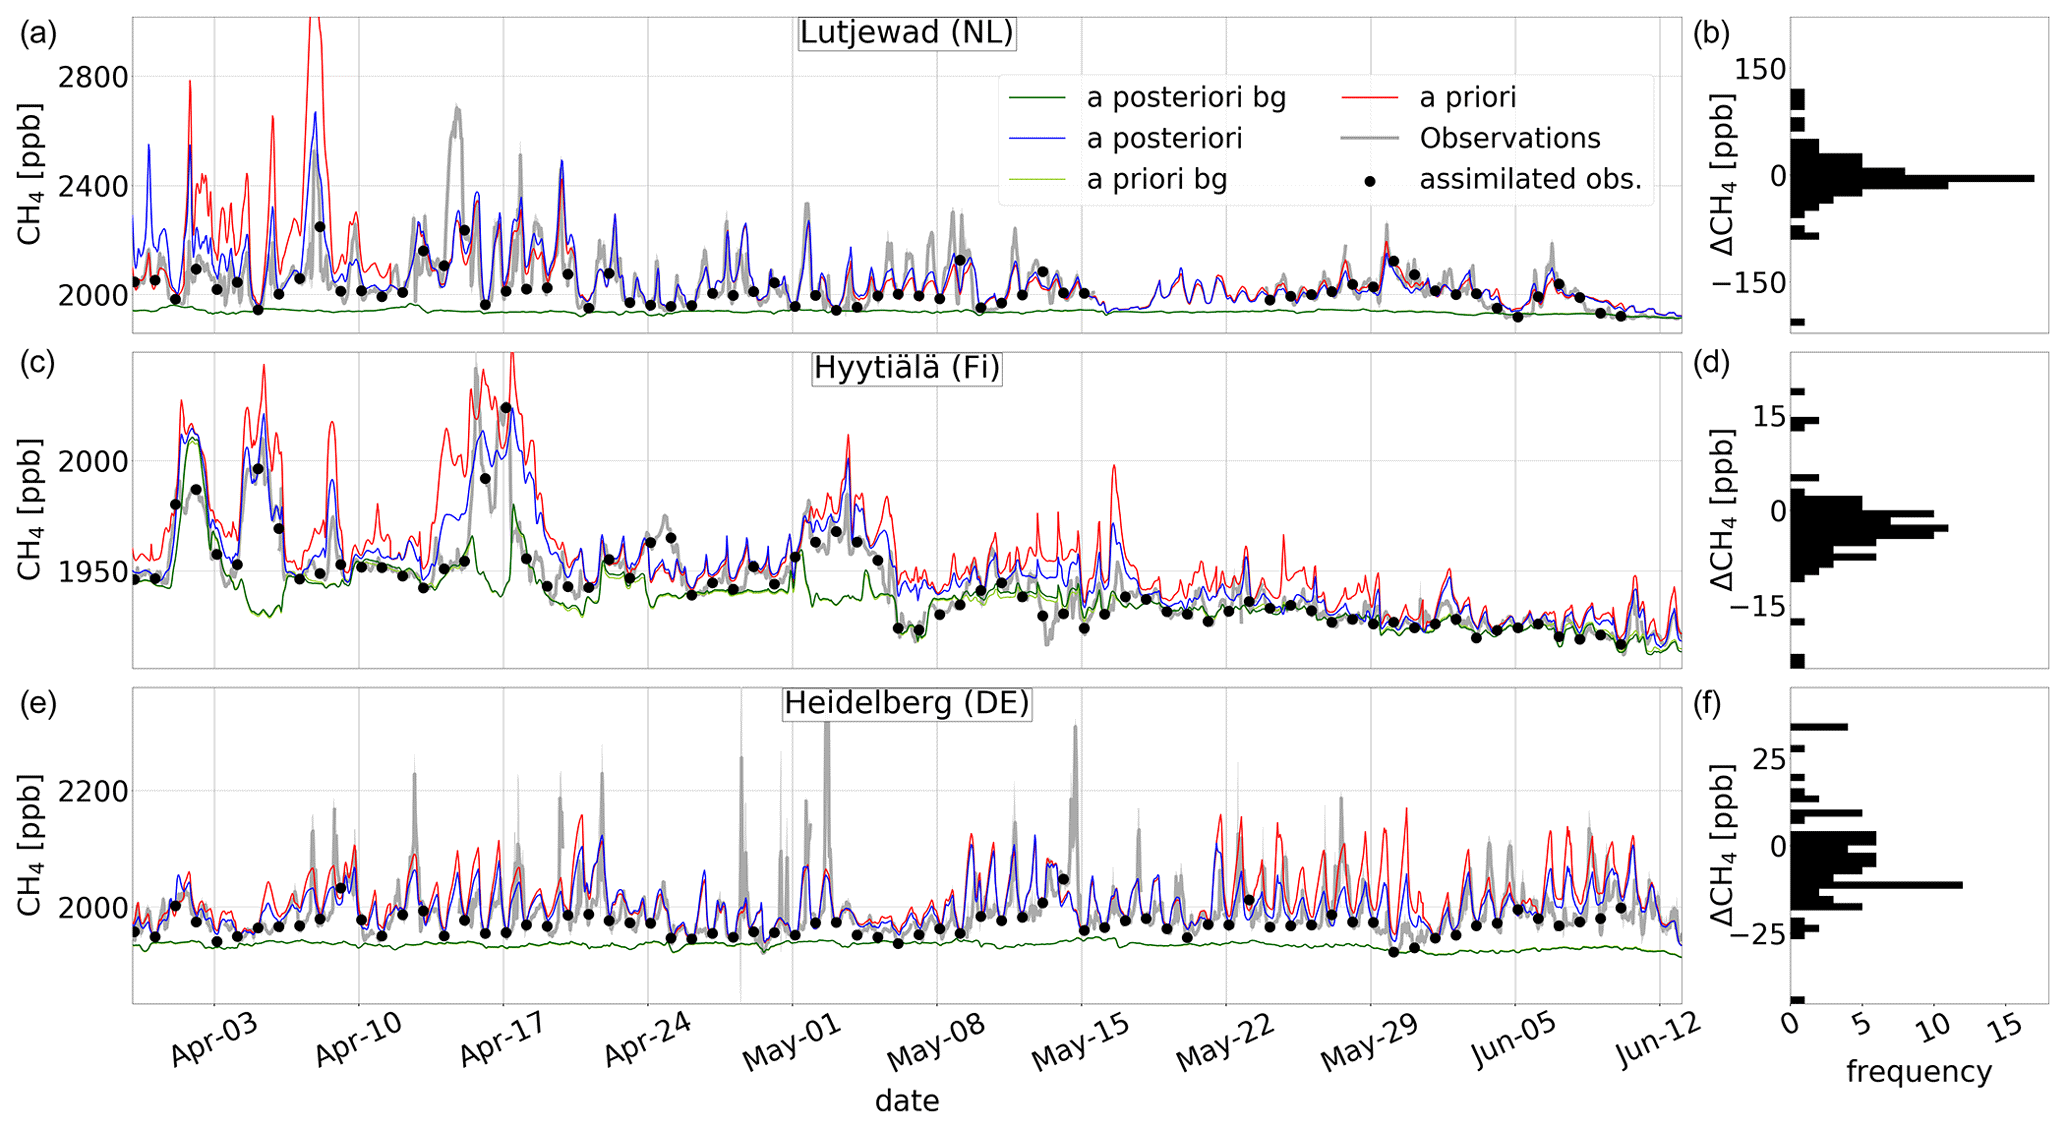
Figure 11(a, c, e) Time series (the date format is month-day) of the simulated dry-air mole fractions with a priori (red) and a posteriori (blue) emissions. Additionally, the background dry-air mole fractions are indicated in dark and light green for the a posteriori and a priori, respectively, as well as the observations (gray) with the reported measurement uncertainty (gray shaded, often too small to see) for the period 30 March–13 June at the stations (a) Lutjewad (NL), (c) Hyytiälä (FI) and (e) Heidelberg (DE). The assimilated afternoon measurements are shown as black dots. (b, d, f) The residuals of the assimilated observations in the a posteriori simulation for the same period (b Lutjewad, d Hyytiälä, f Heidelberg).
Table 4 summarizes the statistics of the model performance at the in situ measurement stations assimilated in the inversion (first part of the table). It shows the root-mean-squared error (E) and Pearson correlation (r2) both for dry-air mole fractions at hours where observations were assimilated (i.e., afternoon values at non-mountain sites and nighttime values at mountain sites) and for all 24 h d−1. For the assimilated stations, the error always decreases and the correlation always increases for the hours that were assimilated. Also, the error almost always decreases and the correlation mostly increases for the observations during the entire day. The a posteriori correlation coefficients (r2) for the assimilated observations range from a minimum of 0.59 at the station Ispra (Italy) to 0.93 at the station Ridge Hill (UK). They are above 0.7 at 25 out of 28 stations (89 %) and above 0.8 at 19 stations (68 %). These values are similar to those in the high-resolution inversion study of Bergamaschi et al. (2022) and suggest an excellent model performance the typically explains 70 %–90 % of the observed variance.
Table 4Statistical results at measurement stations assimilated in the inversion and used for validation (bottom). The root-mean-squared error (E) and Pearson correlation (r2) are given once for dry-air mole fractions only at hours where observations were assimilated (denoted by “assim.”) and for all 24 h d−1 (denoted by “all obs.”).
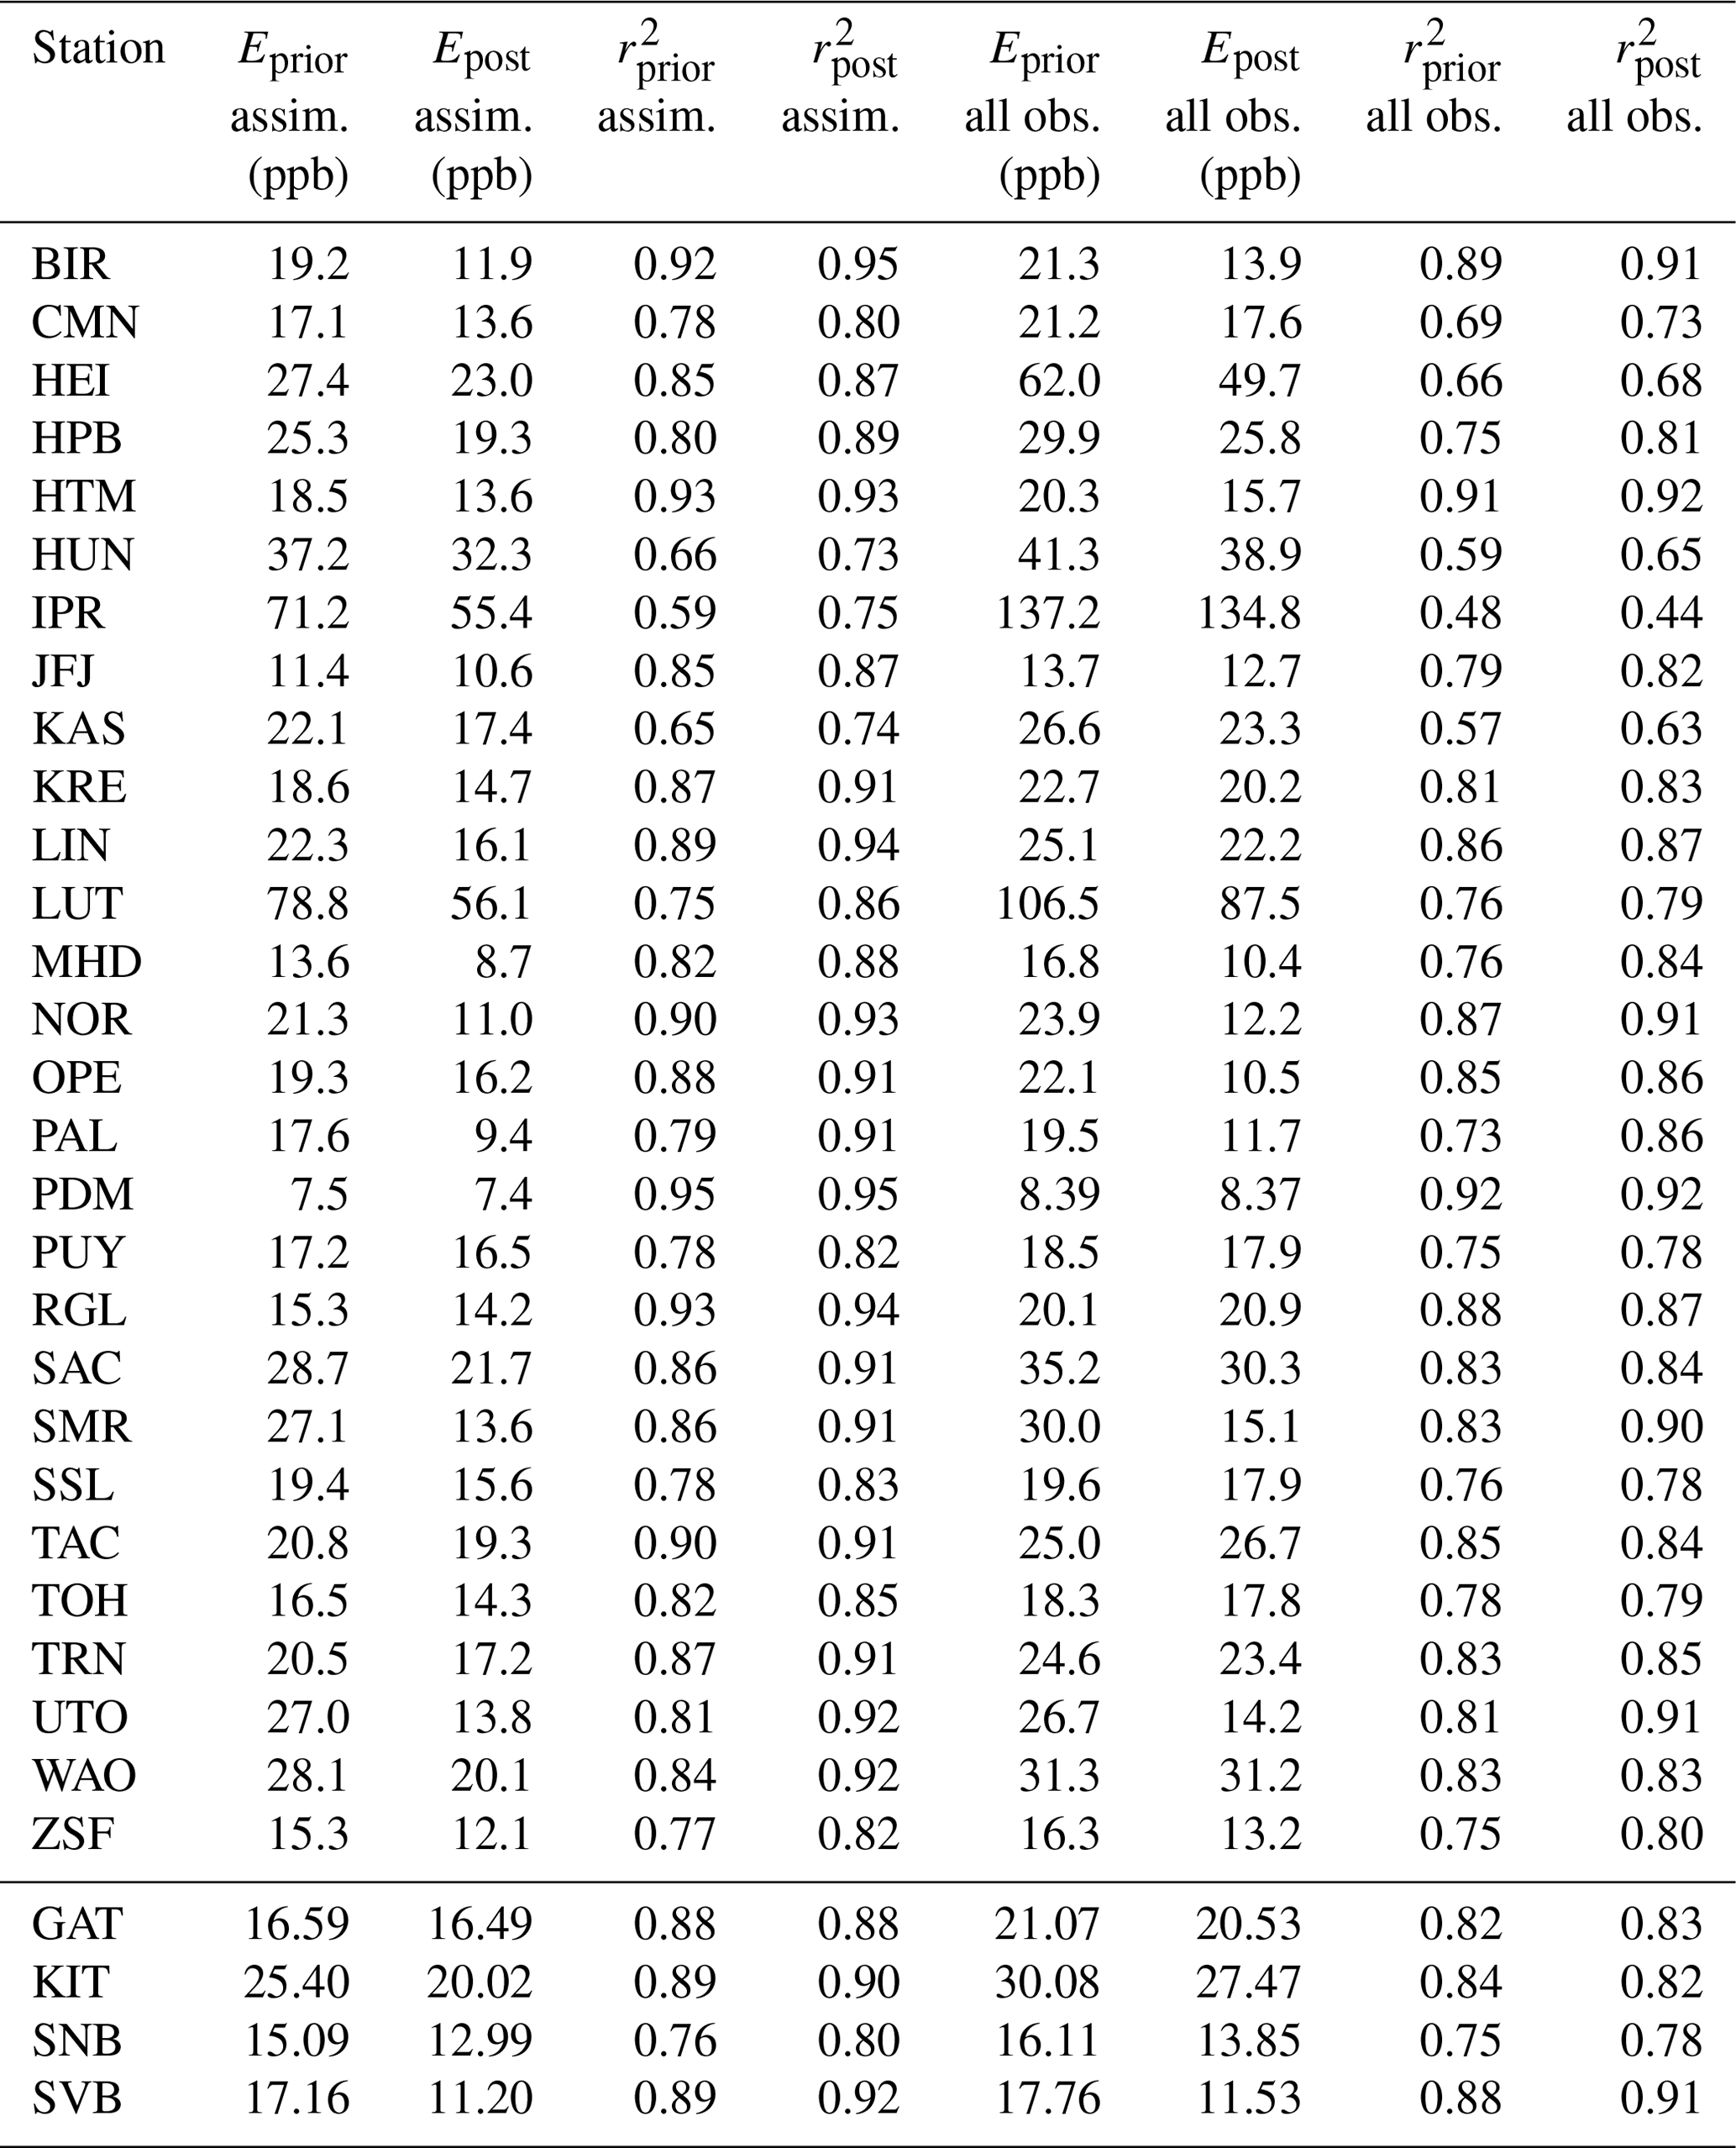
The bottom of Table 4 shows the same statistics for the validation sites, which were not assimilated in the inversion. At these validation sites, the error always decreases and the correlation always increases or stays the same for the afternoon hours (nighttime hours for the mountain site Sonnblick, labeled SNB). When considering all 24-hourly averages per day, the error mostly decreases and the correlation mostly increases.
3.2.3 National-scale emissions
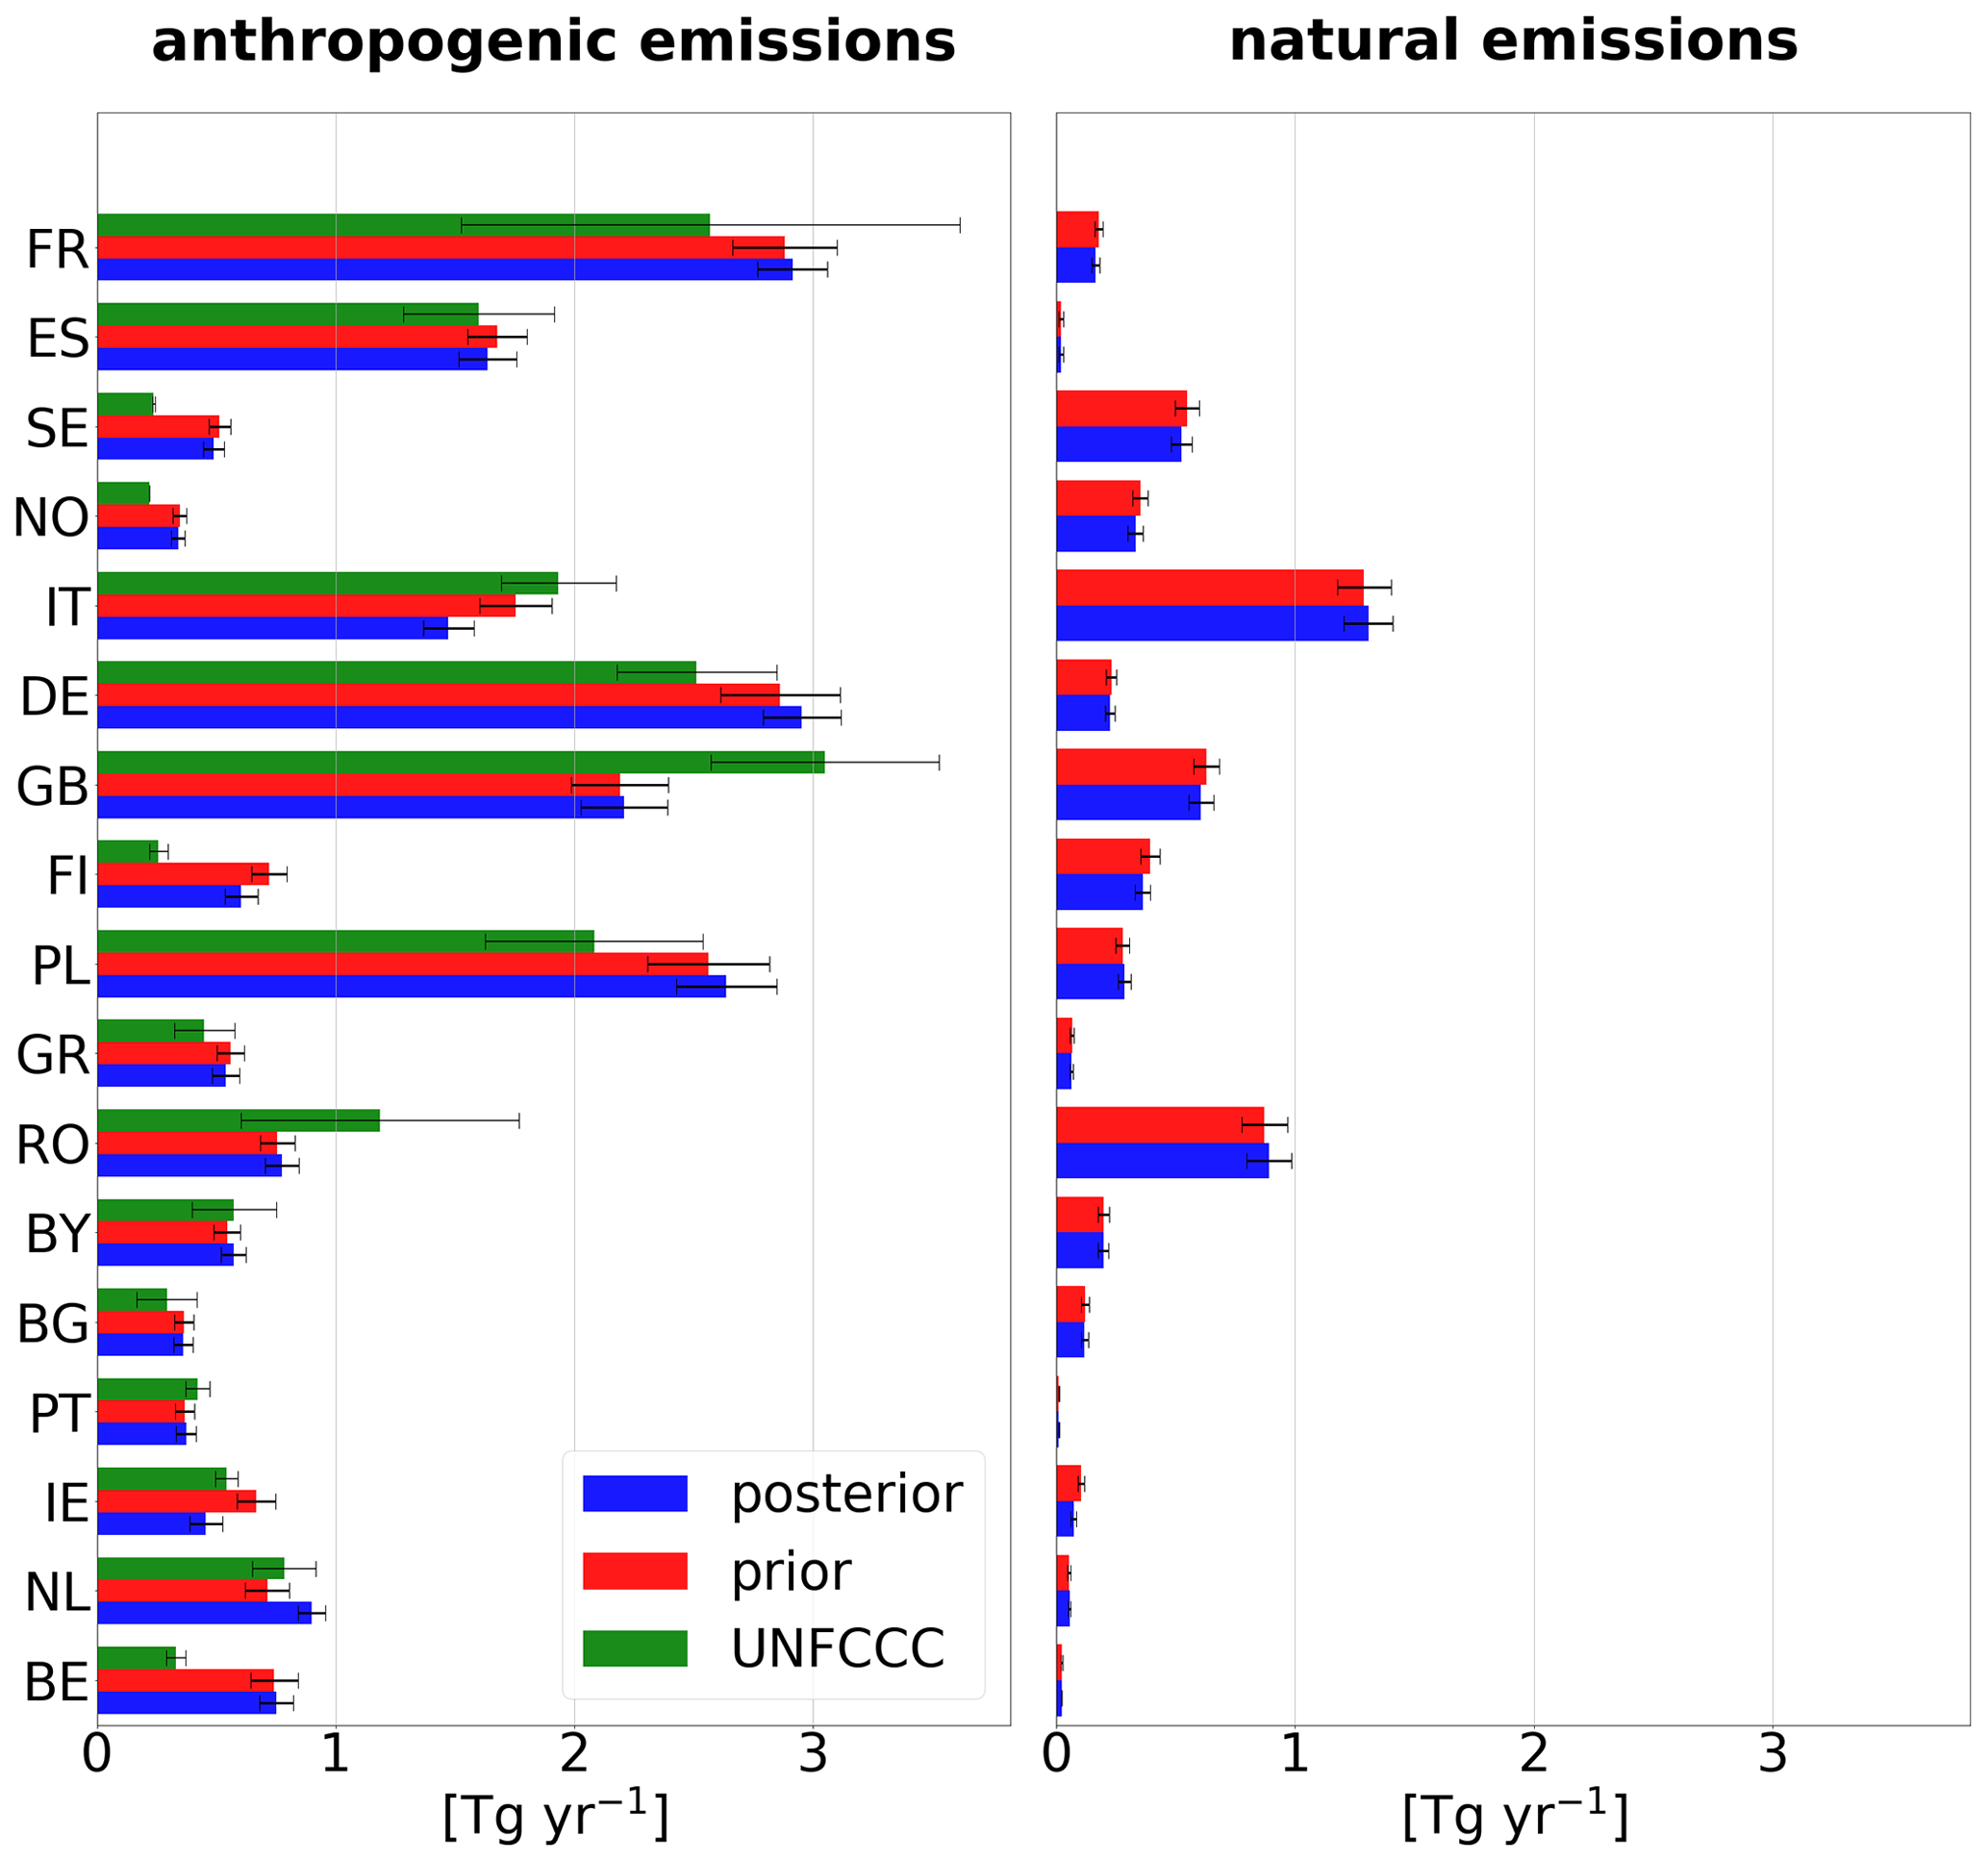
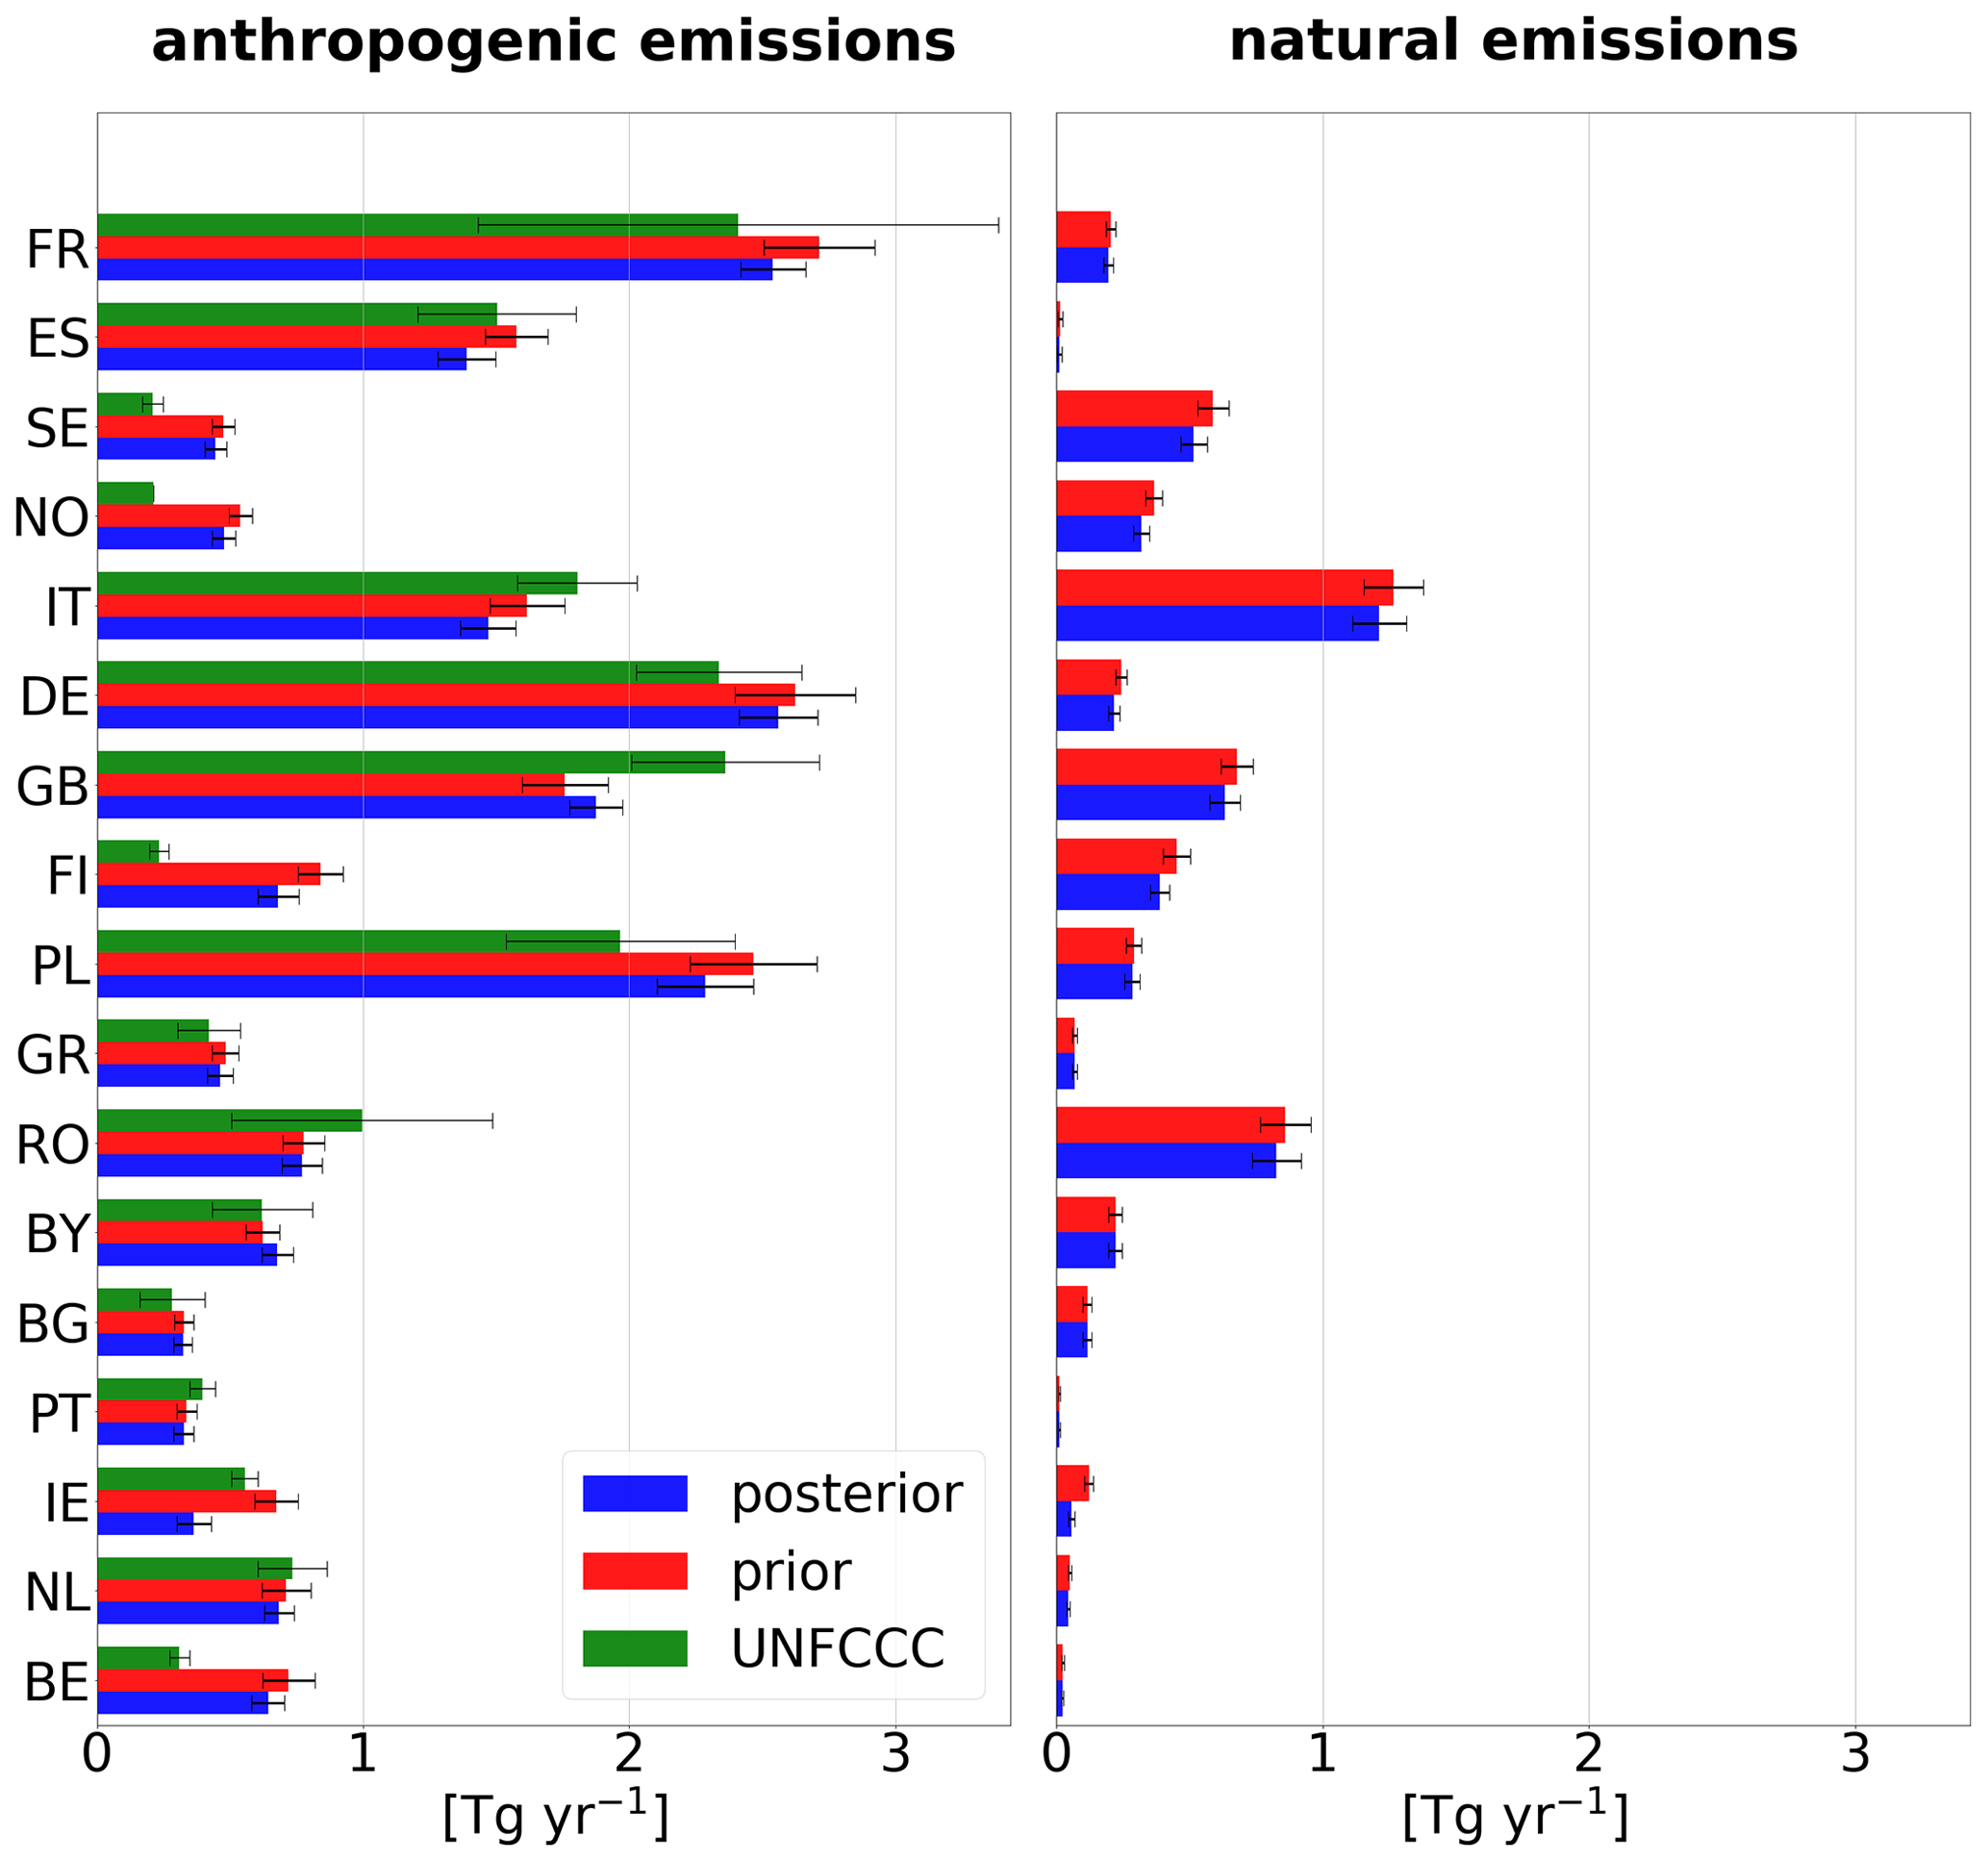
Figure 12 compares 2018 a priori and a posteriori country-total emissions for both anthropogenic (left) and natural sources (right) together with their uncertainties for the 15 largest countries in Europe and the Benelux countries. Anthropogenic emissions are additionally compared to the values reported to the UNFCCC (including the reported uncertainty range) for 2018 (year of report 2021). The a posteriori fluxes in the Benelux countries as well as Germany, France, Norway and Finland are higher than reported. On the other hand, the a posteriori fluxes are lower in the remaining countries. The strong downward correction of anthropogenic emissions in Italy is likely an effect of the very high natural (geological) emissions. Although they are corrected downwards strongly in the inversion, the a posteriori natural emissions in Italy still seem unrealistically high, potentially leading to a misattribution of anthropogenic and natural emissions in the a posteriori.
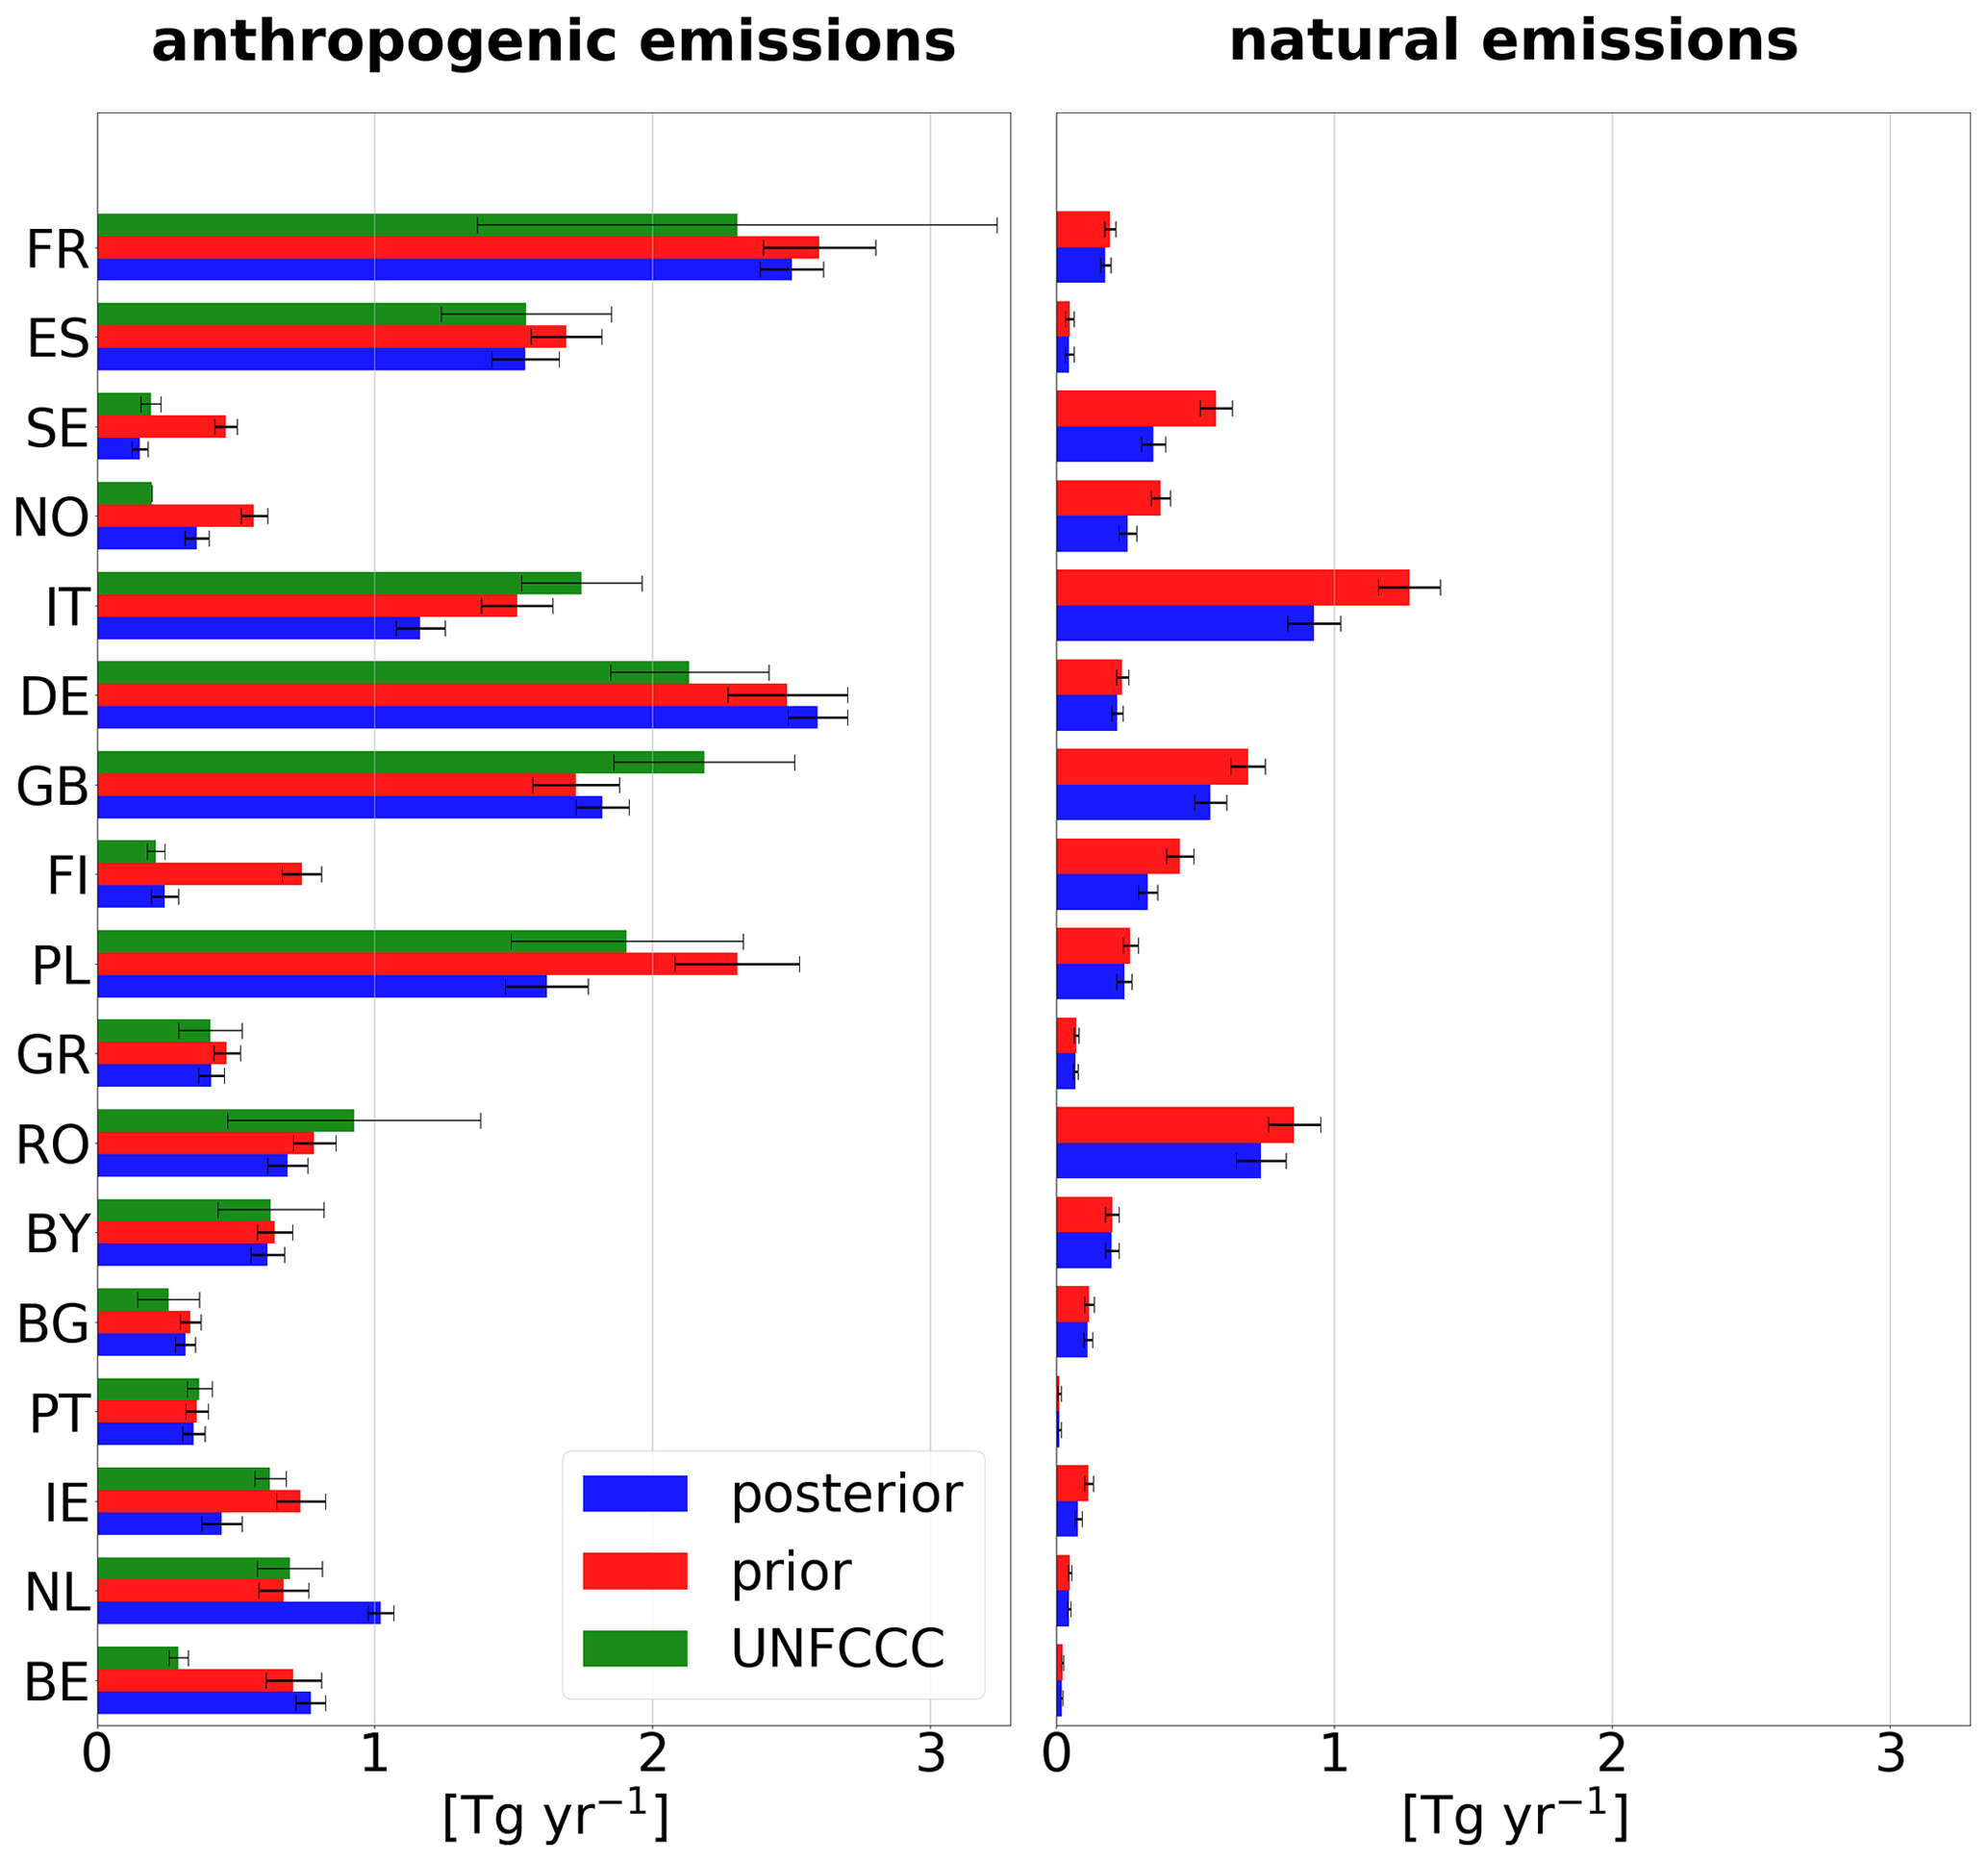
Figure 12Country-total emissions for the year 2018 in the a priori (red) and a posteriori (blue) for anthropogenic and natural sources separately as well as the reported anthropogenic emissions to the UNFCCC (green if available). The black bar indicates the total uncertainty, as derived from the error covariance matrices (for the a priori and a posteriori emissions) or as reported to the UNFCCC by the countries. The results for 2008 and 2013 are shown in Appendix B.
For the sum of all EU27 countries + the United Kingdom, the inversion reduces the a priori emissions from 19.9 to 17.4 Tg yr−1 in the a posteriori. The reported value for EU27 + UK for the year 2018 is 17.8 Tg yr−1. We performed two additional inversions for the years 2008 and 2013. In these years, the a posteriori fluxes are also lower than the a priori but still slightly higher than the reported values (2008: a priori, 21.8 Tg yr−1; a posteriori, 21.3 Tg yr−1; reported, 20.5 Tg yr−1; 2013: a priori, 20.5 Tg yr−1; a posteriori, 18.9 Tg yr−1; reported, 18.6 Tg yr−1).
We developed a new inverse modeling system combining the atmospheric transport model ICON-ART with the ensemble Kalman smoother data assimilation system CTDAS, and we evaluated its performance in idealized and real CH4 inversions over Europe. For this purpose, we extended ICON-ART with modules for efficient handling of emissions and online generation of the ensemble of perturbed fluxes and with a nudging scheme to keep the simulations close to analyzed meteorology. We showed that with this system, we can optimize total anthropogenic European CH4 fluxes on a national scale using pseudo-observations in an idealized setup with a realistic network of measurement stations. However, from the subcategories anthropogenic and natural, the observations can only successfully constrain the larger source of the anthropogenic emissions (and in one sensitivity inversion also the agricultural emissions). The natural emissions, in turn, cannot be constrained independently. Furthermore, we have investigated the sensitivities towards different parameters of the inversion setup with 15 sensitivity runs in the idealized setup. We then applied the system to real in situ observations from 28 European stations. We used a priori anthropogenic fluxes from the EDGARv6 inventory and a priori natural fluxes from various sources (peatlands, mineral soils, inland water, termites, ocean, and biofuels and biomass burning as well as geology).
Our results show that the anthropogenic emissions are significantly underestimated in EDGARv6 for the year 2018 in the Benelux countries (by ca. 25 %) and to a weaker extent in northwestern France and southern England. In the rest of the domain, the anthropogenic fluxes are corrected downwards by the inversion. The natural fluxes are corrected downwards almost everywhere, especially over Italy and Romania–Moldova, where both regions have very high a priori geological emissions in the data set from Etiope et al. (2019) (scaled to a global total of 15 Tg), as well as in England and Scandinavia (during the hot and dry summer of 2018). For most countries, the a posteriori country-total emissions are closer to the values that were independently determined and reported to the UNFCCC than they are to the a priori emissions. The total anthropogenic fluxes for the EU27 + UK are corrected downwards from 19.9 to 17.4 Tg yr−1. The emissions reported to the UNFCCC (inventory year 2021) are 17.8 Tg yr−1.
The a posteriori anthropogenic emissions in our study are lower than in most other regional inversions (Bergamaschi et al., 2018, 2022; Petrescu et al., 2023). It is important to emphasize that in the various inversions other in situ observations or satellite measurements were partially assimilated. While the a posteriori anthropogenic emissions in our study are lower, the pattern of the emission increments is comparable to that in Bergamaschi et al. (2022). However, our results for anthropogenic emissions are comparable to the results for Europe from global inversions (Deng et al., 2022; Petrescu et al., 2023), when these assimilate either in situ measurements or satellite observations. It is noticeable that the inversion strongly corrects the overall European emissions downwards such that the independently determined emissions that are reported to the UNFCCC are better matched. However, the large spread in the various inversions of recent studies shows that there is still substantial uncertainty in the inverse emission estimation of European emissions, and care needs to be taken to assign realistic a posteriori uncertainties. The most prominent pattern in our results is the increase over the Benelux countries. This increase in emissions is also visible in other inversion studies, at least in parts of Benelux (e.g., Bergamaschi et al., 2022). This may indicate higher emissions than reported for 2018 in this region due to agricultural emissions.
This overall downward correction is more pronounced for 2018 than for the other two years where we applied our system (2008 and 2013). The reason for this is most likely the unusually hot and dry summer of 2018, which was not taken into account in the a priori peatland emissions and which influences the a posteriori anthropogenic emissions due to cross-sector covariances.
This study presents the new CTDAS-ICON system and shows its application for CH4 in an idealized setup and with in situ measurements. In future applications, the system could be extended to additionally assimilate satellite observations or estimate N2O or CO2 emissions, the latter requiring an extension of ICON-ART with a biosphere–atmosphere exchange flux model. The large uncertainties associated with inverse modeling could be addressed by extending the system with a flow-dependent model–data mismatch, where the emission flux ensemble is coupled to a meteorological ensemble for a more realistic representation of the model transport error.
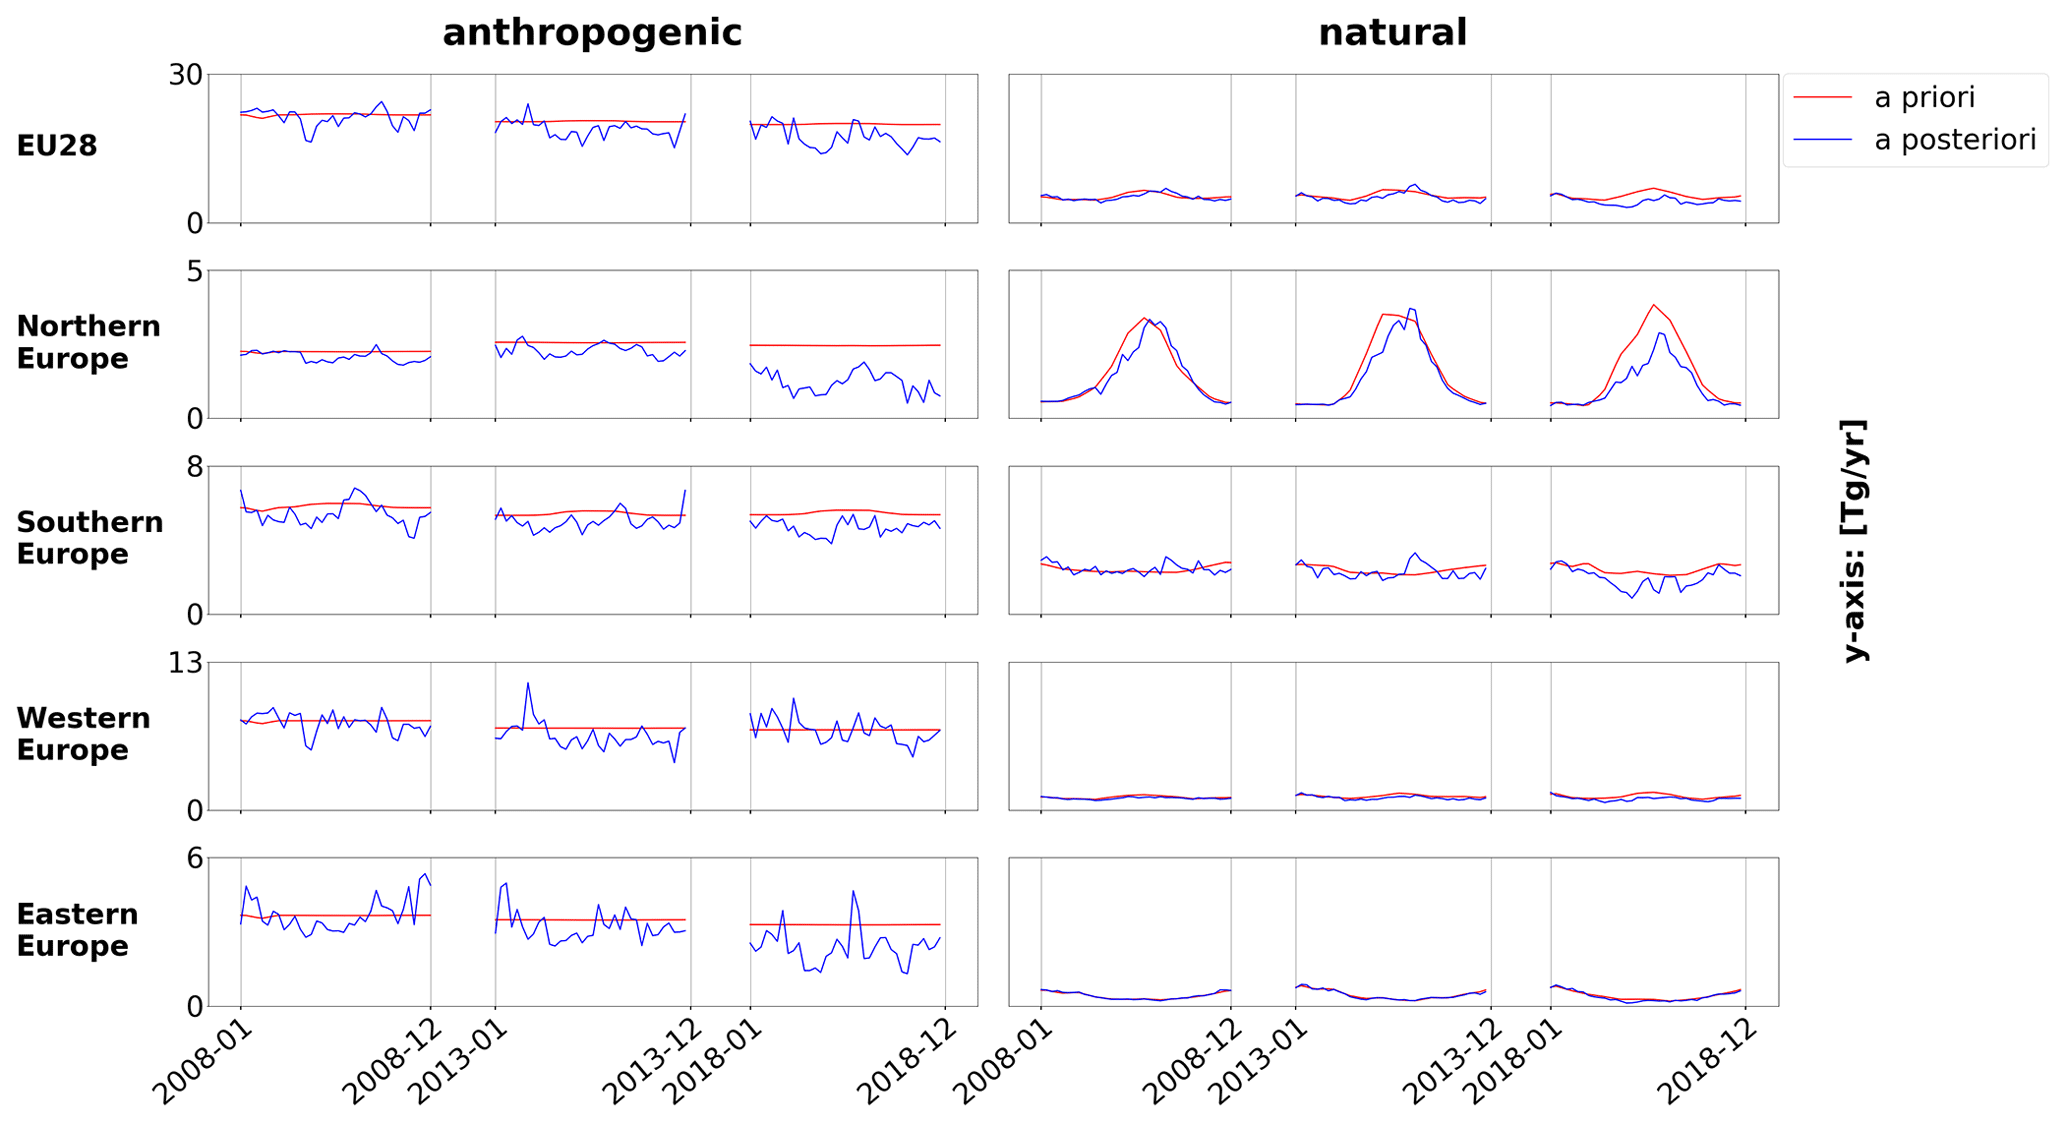
Figure A1Time series (the date format is year-month) for the years 2008, 2013 and 2018 of a priori (red) and a posteriori (blue) CH4 emissions for the EU27 + UK countries as well as for northern (Norway, Sweden, Finland, Denmark, Estonia, Latvia, Lithuania), western (the United Kingdom, Ireland, the Netherlands, Belgium, Luxembourg, France, Georgia, Switzerland, Austria), eastern (Poland, the Czech Republic, Slovakia, Hungary) and southern (Portugal, Spain, Italy, Slovenia, Croatia, Greece, Romania, Bulgaria) Europe.
Access to the Git repository containing the official CTDAS code can be obtained by contacting the main developers. The code version used for this study is available in a separate branch of the repository. The ICON code can be obtained from the Max Planck Institute for Meteorology (MPI-M) and the German Weather Service (DWD), who manage the license. For ART, please contact Bernhard Vogel (bernhard.vogel@kit.edu). Our implementations in the ART code are available in the official ART repository. The atmospheric observations used in the inversions are available upon request. Information about the pre-processing applied to the observations can be requested from Rona Thompson (rlt@nilu.no).
MS and DB initiated the project. MS made the implementations in ICON, coupled ICON with CTDAS, and performed and analyzed the simulations and inversion under the supervision of DB. MS, DB and SHe interpreted the results. WP and IL helped with the coupling of ICON to CTDAS. MS wrote the paper with substantial contributions from DB, SHe, WP and IL. HC and SHa provided the data of the measurement stations Lutjewad and Heidelberg and revised the manuscript.
The contact author has declared that none of the authors has any competing interests.
Publisher’s note: Copernicus Publications remains neutral with regard to jurisdictional claims made in the text, published maps, institutional affiliations, or any other geographical representation in this paper. While Copernicus Publications makes every effort to include appropriate place names, the final responsibility lies with the authors.
We thank Ivan Mammarella, Petri Keronen and Pasi Kolari for providing the atmospheric observations for the Hyytiälä station. We thank the Environment Agency Austria for providing the atmospheric observations for the Sonnblick station. We thank Cathrine Lund Myhre, Paolo Cristofanelli, Dagmar Kubistin, Jennifer Müller-Williams, Matthias Lindauer, Tobias Biermann, László Haszpra, Giovanni Manca, Lukas Emmenegger, Lukasz Chmura, Michal Marek, Morgan Lopez, Irene Lehner, Michel Ramonet, Juha Hatakka, Marc Delmotte, François Gheusi, Aurélie Colomb, Simon O'Doherty, Dickon Young, Joe Pitt, Kieran Stanley, Martina Schmidt, Paul Smith, Juha Hatakka, Grant Forster and Cédric Couret for providing the atmospheric observations from the other stations. The Heidelberg measurements were financed as part of the ICOS CRL pilot stations. We thank Lisbeth Florentie and Sander Houweling for the coordination of the intercomparison exercise within TransCom and setting up the protocol. TransCom received support from the EU-funded CoCO2 project. Furthermore we thank Rona Thompson for the harmonization and pre-processing of the atmospheric observation within the VERIFY project. The Center for Climate Systems Modeling (C2SM) at ETH Zurich is acknowledged for providing technical and scientific support. ICON-ART simulations were performed at the Swiss National Supercomputing Centre (CSCS) under grant nos. s1152 and s1091.
Financial support has been provided by the Swiss Federal Laboratories for Materials Science and Technology, Dübendorf, to conduct this study. Open Access funding was provided by Lib4RI – Library for the Research Institutes within the ETH Domain: Eawag, Empa, PSI & WSL.
This paper was edited by Manvendra Krishna Dubey and reviewed by two anonymous referees.
Baker, D. F., Law, R. M., Gurney, K. R., Rayner, P., Peylin, P., Denning, A. S., Bousquet, P., Bruhwiler, L., Chen, Y.-H., Ciais, P., Fung, I. Y., Heimann, M., John, J., Maki, T., Maksyutov, S., Masarie, K., Prather, M., Pak, B., Taguchi, S., and Zhu, Z.: TransCom 3 inversion intercomparison: Impact of transport model errors on the interannual variability of regional CO2 fluxes, 1988–2003, Global Biogeochem. Cy., 20, GB1002, https://doi.org/10.1029/2004GB002439, 2006. a
Baker, D. F., Bösch, H., Doney, S. C., O'Brien, D., and Schimel, D. S.: Carbon source/sink information provided by column CO2 measurements from the Orbiting Carbon Observatory, Atmos. Chem. Phys., 10, 4145–4165, https://doi.org/10.5194/acp-10-4145-2010, 2010. a
Bergamaschi, P., Danila, A., Weiss, R., Ciais, P., Thompson, R., Brunner, D., Levin, I., Meijer, Y., Chevallier, F., Janssens-Maenhout, G., Bovensmann, H., Crisp, D., Basu, S., Dlugokencky, E., Engelen, R., Gerbig, C., Günther, D., Hammer, S., Henne, S., and Krol, M.: Atmospheric monitoring and inverse modelling for verification of greenhouse gas inventories, Publications Office, https://doi.org/10.2760/759928, 2018. a, b, c, d
Bergamaschi, P., Segers, A., Brunner, D., Haussaire, J.-M., Henne, S., Ramonet, M., Arnold, T., Biermann, T., Chen, H., Conil, S., Delmotte, M., Forster, G., Frumau, A., Kubistin, D., Lan, X., Leuenberger, M., Lindauer, M., Lopez, M., Manca, G., Müller-Williams, J., O'Doherty, S., Scheeren, B., Steinbacher, M., Trisolino, P., Vítková, G., and Yver Kwok, C.: High-resolution inverse modelling of European CH4 emissions using the novel FLEXPART-COSMO TM5 4DVAR inverse modelling system, Atmos. Chem. Phys., 22, 13243–13268, https://doi.org/10.5194/acp-22-13243-2022, 2022. a, b, c, d, e, f, g
Brasseur, G. P. and Jacob, D. J.: Modeling of Atmospheric Chemistry, Cambridge University Press, https://doi.org/10.1017/9781316544754, 2017. a
Bridgham, S. D., Cadillo-Quiroz, H., Keller, J. K., and Zhuang, Q.: Methane emissions from wetlands: biogeochemical, microbial, and modeling perspectives from local to global scales, Global Change Biol., 19, 1325–1346, https://doi.org/10.1111/gcb.12131, 2013. a
Bruhwiler, L., Dlugokencky, E., Masarie, K., Ishizawa, M., Andrews, A., Miller, J., Sweeney, C., Tans, P., and Worthy, D.: CarbonTracker-CH4: an assimilation system for estimating emissions of atmospheric methane, Atmos. Chem. Phys., 14, 8269–8293, https://doi.org/10.5194/acp-14-8269-2014, 2014. a
Bruhwiler, L. M. P., Michalak, A. M., Peters, W., Baker, D. F., and Tans, P.: An improved Kalman Smoother for atmospheric inversions, Atmos. Chem. Phys., 5, 2691–2702, https://doi.org/10.5194/acp-5-2691-2005, 2005. a
Brunner, D., Henne, S., Keller, C. A., Reimann, S., Vollmer, M. K., O'Doherty, S., and Maione, M.: An extended Kalman-filter for regional scale inverse emission estimation, Atmos. Chem. Phys., 12, 3455–3478, https://doi.org/10.5194/acp-12-3455-2012, 2012. a
Burgers, G., van Leeuwen, P. J., and Evensen, G.: Analysis Scheme in the Ensemble Kalman Filter, Mon. Weather Rev., 126, 1719–1724, https://doi.org/10.1175/1520-0493(1998)126<1719:ASITEK>2.0.CO;2, 1998. a
Butler, M. P., Davis, K. J., Denning, A. S., and Kawa, S. R.: Using continental observations in global atmospheric inversions of CO2: North American carbon sources and sinks, Tellus B, 62, 550–572, https://doi.org/10.1111/j.1600-0889.2010.00501.x, 2010. a
Chevallier, F., Fisher, M., Peylin, P., Serrar, S., Bousquet, P., Bréon, F.-M., Chédin, A., and Ciais, P.: Inferring CO2 sources and sinks from satellite observations: Method and application to TOVS data, J. Geophys. Res.-Atmos., 110, D24309, https://doi.org/10.1029/2005JD006390, 2005. a
Crippa, M., Guizzardi, D., Muntean, M., Schaaf, E., Lo Vullo, E., Solazzo, E., Monforti-Ferrario, F., Olivier, J., and Vignati, E.: EDGAR v6.0 Greenhouse Gas Emissions, European Commission, Joint Research Centre (JRC) [data set], http://data.europa.eu/89h/97a67d67-c62e-4826-b873-9d972c4f670b (last access: 20 February 2024), 2021. a
Deng, Z., Ciais, P., Tzompa-Sosa, Z. A., Saunois, M., Qiu, C., Tan, C., Sun, T., Ke, P., Cui, Y., Tanaka, K., Lin, X., Thompson, R. L., Tian, H., Yao, Y., Huang, Y., Lauerwald, R., Jain, A. K., Xu, X., Bastos, A., Sitch, S., Palmer, P. I., Lauvaux, T., d'Aspremont, A., Giron, C., Benoit, A., Poulter, B., Chang, J., Petrescu, A. M. R., Davis, S. J., Liu, Z., Grassi, G., Albergel, C., Tubiello, F. N., Perugini, L., Peters, W., and Chevallier, F.: Comparing national greenhouse gas budgets reported in UNFCCC inventories against atmospheric inversions, Earth Syst. Sci. Data, 14, 1639–1675, https://doi.org/10.5194/essd-14-1639-2022, 2022. a, b, c, d
Eggleston, H. S., Buendia, L., Miwa, K., Ngara, T., and Tanabe, K.: 2006 IPCC Guidelines for National Greenhouse Gas Inventories, IPCC National Greenhouse Gas Inventories Programme, Intergovernmental Panel on Climate Change IPCC, c/o Institute for Global Environmental Strategies IGES, 2108 - 11, Kamiyamaguchi, Hayama, Kanagawa (Japan), ISBN 4-88788-032-4, 2006. a
Etiope, G., Ciotoli, G., Schwietzke, S., and Schoell, M.: Gridded maps of geological methane emissions and their isotopic signature, Earth Syst. Sci. Data, 11, 1–22, https://doi.org/10.5194/essd-11-1-2019, 2019. a, b
Evensen, G.: Sequential data assimilation with a nonlinear quasi-geostrophic model using Monte Carlo methods to forecast error statistics, J. Geophys. Res.-Oceans, 99, 10143–10162, https://doi.org/10.1029/94JC00572, 1994. a
Evensen, G.: Geir Evensen The Ensemble Kalman Filter: theoretical formulation and practical implementation, Ocean Dynam., 53, 343–367, https://doi.org/10.1007/s10236-003-0036-9, 2003. a
Gaspari, G. and Cohn, S. E.: Construction of correlation functions in two and three dimensions, Q. J. Roy. Meteor. Soc., 125, 723–757, https://doi.org/10.1002/qj.49712555417, 1999. a
Giorgetta, M. A., Brokopf, R., Crueger, T., Esch, M., Fiedler, S., Helmert, J., Hohenegger, C., Kornblueh, L., Köhler, M., Manzini, E., Mauritsen, T., Nam, C., Raddatz, T., Rast, S., Reinert, D., Sakradzija, M., Schmidt, H., Schneck, R., Schnur, R., Silvers, L., Wan, H., Zängl, G., and Stevens, B.: ICON-A, the Atmosphere Component of the ICON Earth System Model: I. Model Description, J. Adv. Model. Earth Sy., 10, 1613–1637, https://doi.org/10.1029/2017MS001242, 2018. a
Gourdji, S. M., Mueller, K. L., Yadav, V., Huntzinger, D. N., Andrews, A. E., Trudeau, M., Petron, G., Nehrkorn, T., Eluszkiewicz, J., Henderson, J., Wen, D., Lin, J., Fischer, M., Sweeney, C., and Michalak, A. M.: North American CO2 exchange: inter-comparison of modeled estimates with results from a fine-scale atmospheric inversion, Biogeosciences, 9, 457–475, https://doi.org/10.5194/bg-9-457-2012, 2012. a
Gurney, K. R., Law, R. M., Denning, A. S., Rayner, P., Baker, D., Bousquet, P., Bruhwiler, L., Chen, Y.-H., Ciais, P., Fan, S., Fung, I., Gloor, M., Heimann, M., Higuchi, K., John, J., Maki, T., Maksyutov, S., Masarie, K., Peylin, P., Prather, M., Pak, B., Randerson, J., Sarmiento, J., Taguchi, S., Takahashi, T., and Yuen, C.-W.: Towards robust regional estimates of CO2 sources and sinks using atmospheric transport models, Nature, 415, 626–630, https://doi.org/10.1038/415626a, 2002. a
He, W., van der Velde, I. R., Andrews, A. E., Sweeney, C., Miller, J., Tans, P., van der Laan-Luijkx, I. T., Nehrkorn, T., Mountain, M., Ju, W., Peters, W., and Chen, H.: CTDAS-Lagrange v1.0: a high-resolution data assimilation system for regional carbon dioxide observations, Geosci. Model Dev., 11, 3515–3536, https://doi.org/10.5194/gmd-11-3515-2018, 2018. a
Heiskanen, J., Brümmer, C., Buchmann, N., Calfapietra, C., Chen, H., Gielen, B., Gkritzalis, T., Hammer, S., Hartman, S., Herbst, M., Janssens, I. A., Jordan, A., Juurola, E., Karstens, U., Kasurinen, V., Kruijt, B., Lankreijer, H., Levin, I., Linderson, M.-L., Loustau, D., Merbold, L., Myhre, C. L., Papale, D., Pavelka, M., Pilegaard, K., Ramonet, M., Rebmann, C., Rinne, J., Rivier, L., Saltikoff, E., Sanders, R., Steinbacher, M., Steinhoff, T., Watson, A., Vermeulen, A. T., Vesala, T., Vítková, G., and Kutsch, W.: The Integrated Carbon Observation System in Europe, B. Am. Meteorol. Soc., 103, E855–E872, https://doi.org/10.1175/BAMS-D-19-0364.1, 2022. a
Hersbach, H., Bell, B., Berrisford, P., Hirahara, S., Horányi, A., Muñoz-Sabater, J., Nicolas, J., Peubey, C., Radu, R., Schepers, D., Simmons, A., Soci, C., Abdalla, S., Abellan, X., Balsamo, G., Bechtold, P., Biavati, G., Bidlot, J., Bonavita, M., De Chiara, G., Dahlgren, P., Dee, D., Diamantakis, M., Dragani, R., Flemming, J., Forbes, R., Fuentes, M., Geer, A., Haimberger, L., Healy, S., Hogan, R. J., Hólm, E., Janisková, M., Keeley, S., Laloyaux, P., Lopez, P., Lupu, C., Radnoti, G., de Rosnay, P., Rozum, I., Vamborg, F., Villaume, S., and Thépaut, J.-N.: The ERA5 global reanalysis, Q. J. Roy. Meteor. Soc., 146, 1999–2049, https://doi.org/10.1002/qj.3803, 2020. a
Houtekamer, P. L. and Mitchell, H. L.: Data Assimilation Using an Ensemble Kalman Filter Technique, Mon. Weather Rev., 126, 796–811, https://doi.org/10.1175/1520-0493(1998)126<0796:DAUAEK>2.0.CO;2, 1998. a
Jähn, M., Kuhlmann, G., Mu, Q., Haussaire, J.-M., Ochsner, D., Osterried, K., Clément, V., and Brunner, D.: An online emission module for atmospheric chemistry transport models: implementation in COSMO-GHG v5.6a and COSMO-ART v5.1-3.1, Geosci. Model Dev., 13, 2379–2392, https://doi.org/10.5194/gmd-13-2379-2020, 2020. a, b
Kalnay, E.: Ensemble Kalman Filter: Current Status and Potential, Springer Berlin Heidelberg, Berlin, Heidelberg, 69–92, https://doi.org/10.1007/978-3-540-74703-1_4, 2010. a
Lauritzen, P. H., Erath, C., and Mittal, R.: On simplifying “incremental remap”–based transport schemes, J. Comput. Phys., 230, 7957–7963, https://doi.org/10.1016/j.jcp.2011.06.030, 2011. a
Leuenberger, D., Koller, M., Fuhrer, O., and Schär, C.: A Generalization of the SLEVE Vertical Coordinate, Mon. Weather Rev., 138, 3683–3689, https://doi.org/10.1175/2010MWR3307.1, 2010. a
Meirink, J. F., Bergamaschi, P., and Krol, M. C.: Four-dimensional variational data assimilation for inverse modelling of atmospheric methane emissions: method and comparison with synthesis inversion, Atmos. Chem. Phys., 8, 6341–6353, https://doi.org/10.5194/acp-8-6341-2008, 2008. a
Michalak, A. M., Bruhwiler, L., and Tans, P. P.: A geostatistical approach to surface flux estimation of atmospheric trace gases, J. Geophys. Res.-Atmos., 109, D14109, https://doi.org/10.1029/2003JD004422, 2004. a
Miura, H.: An Upwind-Biased Conservative Advection Scheme for Spherical Hexagonal–Pentagonal Grids, Mon. Weather Rev., 135, 4038–4044, https://doi.org/10.1175/2007MWR2101.1, 2007. a
Nisbet, E. and Weiss, R.: Top-Down Versus Bottom-Up, Science, 328, 1241–1243, https://doi.org/10.1126/science.1189936, 2010. a
Peters, W., Miller, J. B., Whitaker, J., Denning, A. S., Hirsch, A., Krol, M. C., Zupanski, D., Bruhwiler, L., and Tans, P. P.: An ensemble data assimilation system to estimate CO2 surface fluxes from atmospheric trace gas observations, J. Geophys. Res.-Atmos., 110, D24304, https://doi.org/10.1029/2005JD006157, 2005. a, b, c, d, e, f, g, h, i, j
Peters, W., Jacobson, A. R., Sweeney, C., Andrews, A. E., Conway, T. J., Masarie, K., Miller, J. B., Bruhwiler, L. M. P., Pétron, G., Hirsch, A. I., Worthy, D. E. J., van der Werf, G. R., Randerson, J. T., Wennberg, P. O., Krol, M. C., and Tans, P. P.: An atmospheric perspective on North American carbon dioxide exchange: CarbonTracker, P. Natl. Acad. Sci. USA, 104, 18925–18930, https://doi.org/10.1073/pnas.0708986104, 2007. a
Peters, W., Krol, M. C., Van Der Werf, G. R., Houweling, S., Jones, C. D., Hughes, J., Schaefer, K., Masarie, K. A., Jacobson, A. R., Miller, J. B., Cho, C. H., Ramonet, M., Schmidt, M., Ciattaglia, L., Apadula, F., Heltai, D., Meinhardt, F., Di Sarra, A. G., Picentino, S., Sferlazzo, D., Aalto, T., Hatakka, J., Ström, J., Haszpra, L., Meijer, H. A. J., Var Der Laan, S., Neubert, R. E. M., Jordan, A., Rodó, X., Morguí, J.-A., Vermeulen, A. T., Popa, E., Rozanski, K., Zimnoch, M., Manning, A. C., Leuenberger, M., Uglietti, C., Dolman, A. J., Ciais, P., Heimann, M., and Tans, P. P.: Seven years of recent European net terrestrial carbon dioxide exchange constrained by atmospheric observations, Global Change Biol., 16, 1317–1337, https://doi.org/10.1111/j.1365-2486.2009.02078.x, 2010. a
Petrescu, A. M. R., Qiu, C., McGrath, M. J., Peylin, P., Peters, G. P., Ciais, P., Thompson, R. L., Tsuruta, A., Brunner, D., Kuhnert, M., Matthews, B., Palmer, P. I., Tarasova, O., Regnier, P., Lauerwald, R., Bastviken, D., Höglund-Isaksson, L., Winiwarter, W., Etiope, G., Aalto, T., Balsamo, G., Bastrikov, V., Berchet, A., Brockmann, P., Ciotoli, G., Conchedda, G., Crippa, M., Dentener, F., Groot Zwaaftink, C. D., Guizzardi, D., Günther, D., Haussaire, J.-M., Houweling, S., Janssens-Maenhout, G., Kouyate, M., Leip, A., Leppänen, A., Lugato, E., Maisonnier, M., Manning, A. J., Markkanen, T., McNorton, J., Muntean, M., Oreggioni, G. D., Patra, P. K., Perugini, L., Pison, I., Raivonen, M. T., Saunois, M., Segers, A. J., Smith, P., Solazzo, E., Tian, H., Tubiello, F. N., Vesala, T., van der Werf, G. R., Wilson, C., and Zaehle, S.: The consolidated European synthesis of CH4 and N2O emissions for the European Union and United Kingdom: 1990–2019, Earth Syst. Sci. Data, 15, 1197–1268, https://doi.org/10.5194/essd-15-1197-2023, 2023. a, b, c, d, e, f
Pham, T. V., Steger, C., Rockel, B., Keuler, K., Kirchner, I., Mertens, M., Rieger, D., Zängl, G., and Früh, B.: ICON in Climate Limited-area Mode (ICON release version 2.6.1): a new regional climate model, Geosci. Model Dev., 14, 985–1005, https://doi.org/10.5194/gmd-14-985-2021, 2021. a, b
Raivonen, M., Smolander, S., Backman, L., Susiluoto, J., Aalto, T., Markkanen, T., Mäkelä, J., Rinne, J., Peltola, O., Aurela, M., Lohila, A., Tomasic, M., Li, X., Larmola, T., Juutinen, S., Tuittila, E.-S., Heimann, M., Sevanto, S., Kleinen, T., Brovkin, V., and Vesala, T.: HIMMELI v1.0: HelsinkI Model of MEthane buiLd-up and emIssion for peatlands, Geosci. Model Dev., 10, 4665–4691, https://doi.org/10.5194/gmd-10-4665-2017, 2017. a
Reick, C. H., Raddatz, T., Brovkin, V., and Gayler, V.: Representation of natural and anthropogenic land cover change in MPI-ESM, J. Adv. Model. Earth Sy., 5, 459–482, https://doi.org/10.1002/jame.20022, 2013. a
Rieger, D., Bangert, M., Bischoff-Gauss, I., Förstner, J., Lundgren, K., Reinert, D., Schröter, J., Vogel, H., Zängl, G., Ruhnke, R., and Vogel, B.: ICON–ART 1.0 – a new online-coupled model system from the global to regional scale, Geosci. Model Dev., 8, 1659–1676, https://doi.org/10.5194/gmd-8-1659-2015, 2015. a, b, c
Saunois, M., Stavert, A. R., Poulter, B., Bousquet, P., Canadell, J. G., Jackson, R. B., Raymond, P. A., Dlugokencky, E. J., Houweling, S., Patra, P. K., Ciais, P., Arora, V. K., Bastviken, D., Bergamaschi, P., Blake, D. R., Brailsford, G., Bruhwiler, L., Carlson, K. M., Carrol, M., Castaldi, S., Chandra, N., Crevoisier, C., Crill, P. M., Covey, K., Curry, C. L., Etiope, G., Frankenberg, C., Gedney, N., Hegglin, M. I., Höglund-Isaksson, L., Hugelius, G., Ishizawa, M., Ito, A., Janssens-Maenhout, G., Jensen, K. M., Joos, F., Kleinen, T., Krummel, P. B., Langenfelds, R. L., Laruelle, G. G., Liu, L., Machida, T., Maksyutov, S., McDonald, K. C., McNorton, J., Miller, P. A., Melton, J. R., Morino, I., Müller, J., Murguia-Flores, F., Naik, V., Niwa, Y., Noce, S., O'Doherty, S., Parker, R. J., Peng, C., Peng, S., Peters, G. P., Prigent, C., Prinn, R., Ramonet, M., Regnier, P., Riley, W. J., Rosentreter, J. A., Segers, A., Simpson, I. J., Shi, H., Smith, S. J., Steele, L. P., Thornton, B. F., Tian, H., Tohjima, Y., Tubiello, F. N., Tsuruta, A., Viovy, N., Voulgarakis, A., Weber, T. S., van Weele, M., van der Werf, G. R., Weiss, R. F., Worthy, D., Wunch, D., Yin, Y., Yoshida, Y., Zhang, W., Zhang, Z., Zhao, Y., Zheng, B., Zhu, Q., Zhu, Q., and Zhuang, Q.: The Global Methane Budget 2000–2017, Earth Syst. Sci. Data, 12, 1561–1623, https://doi.org/10.5194/essd-12-1561-2020, 2020. a, b, c
Schröter, J., Rieger, D., Stassen, C., Vogel, H., Weimer, M., Werchner, S., Förstner, J., Prill, F., Reinert, D., Zängl, G., Giorgetta, M., Ruhnke, R., Vogel, B., and Braesicke, P.: ICON-ART 2.1: a flexible tracer framework and its application for composition studies in numerical weather forecasting and climate simulations, Geosci. Model Dev., 11, 4043–4068, https://doi.org/10.5194/gmd-11-4043-2018, 2018. a, b, c
Smith, N. E., Kooijmans, L. M. J., Koren, G., van Schaik, E., van der Woude, A. M., Wanders, N., Ramonet, M., Xueref-Remy, I., Siebicke, L., Manca, G., Brümmer, C., Baker, I. T., Haynes, K. D., Luijkx, I. T., and Peters, W.: Spring enhancement and summer reduction in carbon uptake during the 2018 drought in northwestern Europe, Philos. T. Roy. Soc. B, 375, 20190509, https://doi.org/10.1098/rstb.2019.0509, 2020. a
Thompson, R. L., Groot Zwaaftink, C. D., Brunner, D., Tsuruta, A., Aalto, T., Raivonen, M., Crippa, M., Solazzo, E., Guizzardi, D., Regnier, P., and Maisonnier, M.: Effects of extreme meteorological conditions in 2018 on European methane emissions estimated using atmospheric inversions, Philos. T. Roy. Soc. A, 380, 20200443, https://doi.org/10.1098/rsta.2020.0443, 2022. a
Tsuruta, A., Aalto, T., Backman, L., Hakkarainen, J., van der Laan-Luijkx, I. T., Krol, M. C., Spahni, R., Houweling, S., Laine, M., Dlugokencky, E., Gomez-Pelaez, A. J., van der Schoot, M., Langenfelds, R., Ellul, R., Arduini, J., Apadula, F., Gerbig, C., Feist, D. G., Kivi, R., Yoshida, Y., and Peters, W.: Global methane emission estimates for 2000–2012 from CarbonTracker Europe-CH4 v1.0, Geosci. Model Dev., 10, 1261–1289, https://doi.org/10.5194/gmd-10-1261-2017, 2017. a, b
Tsuruta, A., Aalto, T., Backman, L., Krol, M. C., Peters, W., Lienert, S., Joos, F., Miller, P. A., Zhang, W., Laurila, T., Hatakka, J., Leskinen, A., Lehtinen, K. E. J., Peltola, O., Vesala, T., Levula, J., Dlugokencky, E., Heimann, M., Kozlova, E., Aurela, M., Lohila, A., Kauhaniemi, M., and Gomez-Pelaez, A. J.: Methane budget estimates in Finland from the CarbonTracker Europe-CH4 data assimilation system, Tellus B, 71, 1565030, https://doi.org/10.1080/16000889.2018.1565030, 2019. a, b
van der Laan-Luijkx, I. T., van der Velde, I. R., Krol, M. C., Gatti, L. V., Domingues, L. G., Correia, C. S. C., Miller, J. B., Gloor, M., van Leeuwen, T. T., Kaiser, J. W., Wiedinmyer, C., Basu, S., Clerbaux, C., and Peters, W.: Response of the Amazon carbon balance to the 2010 drought derived with CarbonTracker South America, Global Biogeochem. Cy., 29, 1092–1108, https://doi.org/10.1002/2014GB005082, 2015. a
van der Laan-Luijkx, I. T., van der Velde, I. R., van der Veen, E., Tsuruta, A., Stanislawska, K., Babenhauserheide, A., Zhang, H. F., Liu, Y., He, W., Chen, H., Masarie, K. A., Krol, M. C., and Peters, W.: The CarbonTracker Data Assimilation Shell (CTDAS) v1.0: implementation and global carbon balance 2001–2015, Geosci. Model Dev., 10, 2785–2800, https://doi.org/10.5194/gmd-10-2785-2017, 2017. a, b, c, d
van der Werf, G. R., Randerson, J. T., Giglio, L., van Leeuwen, T. T., Chen, Y., Rogers, B. M., Mu, M., van Marle, M. J. E., Morton, D. C., Collatz, G. J., Yokelson, R. J., and Kasibhatla, P. S.: Global fire emissions estimates during 1997–2016, Earth Syst. Sci. Data, 9, 697–720, https://doi.org/10.5194/essd-9-697-2017, 2017. a
Wan, H., Giorgetta, M. A., Zängl, G., Restelli, M., Majewski, D., Bonaventura, L., Fröhlich, K., Reinert, D., Rípodas, P., Kornblueh, L., and Förstner, J.: The ICON-1.2 hydrostatic atmospheric dynamical core on triangular grids – Part 1: Formulation and performance of the baseline version, Geosci. Model Dev., 6, 735–763, https://doi.org/10.5194/gmd-6-735-2013, 2013. a, b
Weber, T., Wiseman, N., and Kock, A.: Global ocean methane emissions dominated by shallow coastal waters, Nat. Commun., 10, 4584, https://doi.org/10.1038/s41467-019-12541-7, 2019. a
Weimer, M., Schröter, J., Eckstein, J., Deetz, K., Neumaier, M., Fischbeck, G., Hu, L., Millet, D. B., Rieger, D., Vogel, H., Vogel, B., Reddmann, T., Kirner, O., Ruhnke, R., and Braesicke, P.: An emission module for ICON-ART 2.0: implementation and simulations of acetone, Geosci. Model Dev., 10, 2471–2494, https://doi.org/10.5194/gmd-10-2471-2017, 2017. a, b
Whitaker, J. S. and Hamill, T. M.: Ensemble Data Assimilation without Perturbed Observations, Mon. Weather Rev., 130, 1913–1924, https://doi.org/10.1175/1520-0493(2002)130<1913:EDAWPO>2.0.CO;2, 2002. a
Zängl, G., Reinert, D., Rípodas, P., and Baldauf, M.: The ICON (ICOsahedral Non-hydrostatic) modelling framework of DWD and MPI-M: Description of the non-hydrostatic dynamical core, Q. J. Roy. Meteor. Soc., 141, 563–579, https://doi.org/10.1002/qj.2378, 2015. a, b, c