the Creative Commons Attribution 4.0 License.
the Creative Commons Attribution 4.0 License.
 | 29 Feb 2024
Secondary organic aerosol formed by Euro 5 gasoline vehicle emissions: chemical composition and gas-to-particle phase partitioning
Evangelia Kostenidou
Baptiste Marques
Brice Temime-Roussel
Yao Liu
Boris Vansevenant
Karine Sartelet
In this study we investigated the photo-oxidation of Euro 5 gasoline vehicle emissions during cold urban, hot urban and motorway Artemis cycles. The experiments were conducted in an environmental chamber with average OH concentrations ranging between 6.6 × 10⁵–2.3 × 10⁶ molec. cm−3, relative humidity (RH) between 40 %–55 % and temperatures between 22–26 °C. A proton-transfer-reaction time-of-flight mass spectrometer (PTR-ToF-MS) and the CHemical Analysis of aeRosol ON-line (CHARON) inlet coupled with a PTR-ToF-MS were used for the gas- and particle-phase measurements respectively. This is the first time that the CHARON inlet has been used for the identification of the secondary organic aerosol (SOA) produced from vehicle emissions. The secondary organic gas-phase products ranged between C1 and C9 with one to four atoms of oxygen and were mainly composed of small oxygenated C1–C3 species. The SOA formed contained compounds from C1 to C14, having one to six atoms of oxygen, and the products' distribution was centered at C5. Organonitrites and organonitrates contributed 6 %–7 % of the SOA concentration. Relatively high concentrations of ammonium nitrate (35–160 µg m−3) were formed. The nitrate fraction related to organic nitrate compounds was 0.12–0.20, while ammonium linked to organic ammonium compounds was estimated only during one experiment, reaching a fraction of 0.19. The SOA produced exhibited log C∗ values between 2 and 5. Comparing our results to theoretical estimations for saturation concentrations, we observed differences of 1–3 orders of magnitude, indicating that additional parameters such as RH, particulate water content, aerosol hygroscopicity, and possible reactions in the particulate phase may affect the gas-to-particle partitioning.
- Article
(7944 KB) - Full-text XML
-
Supplement
(1032 KB) - BibTeX
- EndNote


Secondary organic aerosol (SOA) is formed in the atmosphere through chemical reactions and constitutes a major part of organic aerosol (OA) (Jimenez et al., 2009; Pandis et al., 2016). Even though biogenic SOA often dominates over anthropogenic SOA at a global scale (Kanakidou et al., 2005), SOA formed from the photo-oxidation of aromatic hydrocarbons is estimated at 33 % (Kelly et al., 2018). In highly urbanized and populated areas, anthropogenic SOA may dominate over biogenic SOA (e.g., Volkamer et al., 2006; Platt et al., 2014) as aromatic hydrocarbons have been considered among the major precursors of SOA in urban environments (Hayes et al., 2015; Wu and Xie, 2018).
Emissions from motor vehicles are an important source of urban air pollution, emitting both particulate- and gas-phase species (Dallmann and Harley, 2010; Borbon et al., 2013; Platt et al., 2014; Argyropoulos et al., 2016; Hofman et al., 2016; Gentner et al., 2017; Kostenidou et al., 2021). Particulate matter (PM) vehicle emissions mainly contain primary organic aerosol (POA) of low-volatility and semi-volatile species as well as black carbon (BC), while gas-phase vehicle emissions include CO2, CO, NOx, NH3 and volatile organic compounds (VOCs) (Gordon et al., 2013; Platt et al., 2103; Saliba et al., 2017; Pieber et al., 2018). Concerning gasoline vehicles, among the most important emitted VOCs that serve as SOA precursors are C6–C11 light aromatics, naphthalene, methyl-naphthalenes (Nordin et al., 2013; Liu et al., 2015; Saliba et al., 2017; Pieber et al., 2018). Intermediate volatile compounds (IVOCs) may also be emitted by both diesel and gasoline motor vehicles (Zhao et al., 2015; Drozd et al., 2019; Marques et al., 2022). Some VOCs and IVOCs are of significant relevance, since they are efficient particle precursors upon reaction with atmospheric oxidants (such as OH radicals, NO3 radicals and O3), forming SOA and thus increasing the PM budget.
Gasoline vehicles may dominate over diesel vehicles in the SOA production in urban areas (Bahreini et al., 2012; Jathar et al., 2017). Platt et al. (2017) showed that both gasoline direct injection (GDI) and port fuel injection (PFI) gasoline vehicles produce significantly higher SOA compared to the latest-generation diesel vehicles equipped with a diesel oxidation catalyst (DOC) and a diesel particulate filter (DPF). The high SOA formation from gasoline vehicles has also been confirmed in several studies (e.g., Platt et al., 2013; Nordin et al., 2013; Gordon et al., 2014; Liu et al., 2015; Karjalainen et al., 2016; Saliba et al., 2017; Zhao et al., 2017; Ma et al., 2018; Pieber et al., 2018; Simonen et al., 2019; Roth et al., 2019; Morino et al., 2022; Hartikainen et al., 2023). The SOA produced from gasoline vehicles can be 1–2 orders of magnitude higher than the emitted POA (Platt et al., 2013; Gordon et al., 2014; Liu et al., 2015; Suarez-Bertoa et al., 2015; Karjalainen et al., 2016; Pieber et al., 2018; Kari et al., 2019).
The chemical composition of the SOA formed highly depends on the gas-phase emissions. A large fraction of gasoline vehicle emissions is composed of xylenes, ethylbenzene, trimethylbenzenes, ethyltoluene, toluene, benzene and naphthalene (e.g., Zimmerman et al., 2016; Saliba et al., 2017; Marques et al., 2022). Thus, it is expected that SOA produced by gasoline vehicle emissions is dominated by the SOA products of the above precursors. Some of the most common SOA products of those compounds are methylglyoxal, glyoxal, maleic anhydride, 4-oxo-pentenal, 4-oxo-butenoic acid, succinic anhydride, citraconic anhydride, 4-(hydroxymethyl)-2-furaldehyde, acetic acid, glyoxylic acid and malonic acid (Forstner et al., 1997; Smith et al., 1998, 1999; Jang and Kamens, 2001; Cocker et al., 2001; Hamilton et al., 2003, 2005; Zhao et al., 2005; Huang et al., 2006; Wang et al., 2006; Sato et al., 2007, 2012; Healy et al., 2008; Wyche et al., 2009; Borrás and Tortajada-Genaro, 2012; White et al., 2014; Wu et al., 2014; Ma et al., 2018; Schwantes et al., 2017). The above-cited studies used analytical techniques such as gas chromatography mass spectrometry (GC-MS) and liquid chromatography mass spectrometry (LC-MS) for compound identification. Even though there are many studies describing SOA chemical composition by individual precursors found in gasoline vehicle exhaust, very little is known about the chemical composition of the bulk SOA produced by gasoline vehicle exhausts (Platt et al., 2013; Nordin et al., 2013; Pieber et al., 2018; Hartikainen et al., 2023).
Besides the chemical composition, partitioning between the gas and particle phase is a key parameter as it defines whether a compound resides in the particle or in the gas phase and thus its lifetime in the atmosphere and its reactivity. The most common way to derive the gas-to-particle phase partitioning at a molecular level is the extraction of filters and denuders with particle- and gas-phase samples and the corresponding analysis with analytical techniques such as GC-MS or LC-MS. For example, this method has been applied to SOA from photo-oxidation of toluene (Jang and Kamens, 2001), 1,3,5-trimethylbenzene (Healy et al., 2008; Praplan et al., 2014) and m-xylene (Leach et al., 1999). During the last decade the volatility of the bulk SOA has been extensively characterized by heated laminar flow reactors (e.g., thermodenuders) in terms of thermograms. The anthropogenic SOA volatility has been described in various studies (e.g., Hildebrandt et al., 2009, 2015; Huffman et al., 2009; Kim and Paulson, 2013; Kolesar et al., 2015; Docherty et al., 2018; Li et al., 2018; Sato et al., 2019). Other groups have estimated the volatility distribution as a function of the saturation concentration C∗, either combining experimental and model calculations (Robinson et al., 2007) or using directly experimental data (Hinks et al., 2018; Sato et al., 2019). The above approaches have been extensively applied to laboratory biogenic SOA systems (e.g., Saha and Grieshop, 2016; Kostenidou et al., 2018a), to anthropogenic OA sources such as cooking OA (COA) (Louvaris et al., 2017a) and to ambient sources derived by source apportionment algorithms (e.g., Cappa and Jimenez, 2010; Paciga et al., 2016; Louvaris et al., 2017b; Kostenidou et al., 2018b), but they are limited to aromatic SOA.
In the last decade, online high-resolution instrumentation has been developed for the identification of the OA species at a molecular level (Williams et al., 2006, 2014; Kreisberg et al., 2009; Hohaus et al., 2010; Zhang et al., 2014) or for the identification of chemical formulae using soft-ionization mass spectrometry (Lopez-Hilfiker et al., 2014; Isaacman-VanWertz et al., 2017; Stark et al., 2017; Gkatzelis et al., 2018; Lannuque et al., 2023). Volatility measurements are performed by alternative measurements between the gas and the particle phase of the same ion (Hohaus et al., 2015; Lopez-Hilfiker et al., 2016; Isaacman-VanWertz et al., 2016; Stark et al., 2017; Gkatzelis et al., 2018; Lannuque et al., 2023). To our knowledge these new techniques are still limited. They have been applied to biogenic OA systems in the ambient (Lopez-Hilfiker et al., 2016; Isaacman-VanWertz et al., 2016; Stark et al., 2017) or in laboratory-produced biogenic SOA (Hohaus et al., 2015; Gkatzelis et al., 2018) and just recently to toluene SOA (Lannuque et al., 2023).
In this work the gas and the particle phase of the secondary organic species produced by photo-oxidation of Euro 5 gasoline vehicle emissions were studied. The photo-oxidation took place in an environmental chamber irradiated for several hours. We used real-time high-resolution instrumentation such as a proton-transfer-reaction time-of-flight mass spectrometer (PTR-ToF-MS) combined with a CHemical Analysis of aeRosol ON-line (CHARON) inlet and a high-resolution time-of-flight aerosol mass spectrometer (HR-ToF-AMS). We investigated the fresh and the oxidized gas-phase chemical composition and the SOA chemical composition based on their chemical formulae. In addition, we calculated the saturation concentration of the major SOA species as a function of their chemical formula, and we provided the saturation concentration of specific compounds identified in the SOA. This is the first time that the CHARON–PTR-ToF-MS system was applied to SOA formed by gasoline vehicle emissions, and this is the first study that provides volatility information based on chemical formulae for SOA from gasoline emissions.
A gasoline direct injection (GDI) Euro 5 light-duty vehicle of 1.2 TCE 16V size class, equipped with a three-way catalyst (TWC) and an engine capacity of 1149 cm3 and with mileage of 97 089 km was used. The vehicle was rented from a local rental car office and fueled by standard unleaded 95-E10 gasoline. The experiments were conducted in the facilities of the Environment, Planning, Safety and Eco-design Laboratory (EASE) of the Gustave Eiffel University. The vehicle was tested running Artemis cold urban, hot urban and motorway cycles on a roll-bench chassis dynamometer; detailed characterization of the fresh gas- and particle-phase emissions of the same vehicle is given in Kostenidou et al. (2021) and Marques et al. (2022). Fresh emissions were transferred to an 8 m3 custom-made Teflon chamber (Louis, 2018) through a 2 m stainless-steel heated (at 120 °C) line using a dilution ejector of one stage with a dilution ratio (DR) of 1.5. Five chamber experiments were conducted in total (Table 1). For experiments 1 and 3, only the first 5 min of the cycle was injected inside the chamber, while for the remaining experiments the whole cycle was introduced. We introduced only the first 5 min of the cycle because most of the VOCs are emitted during the engine start (Marques et al., 2022).
Table 1Experimental conditions for the five experiments.
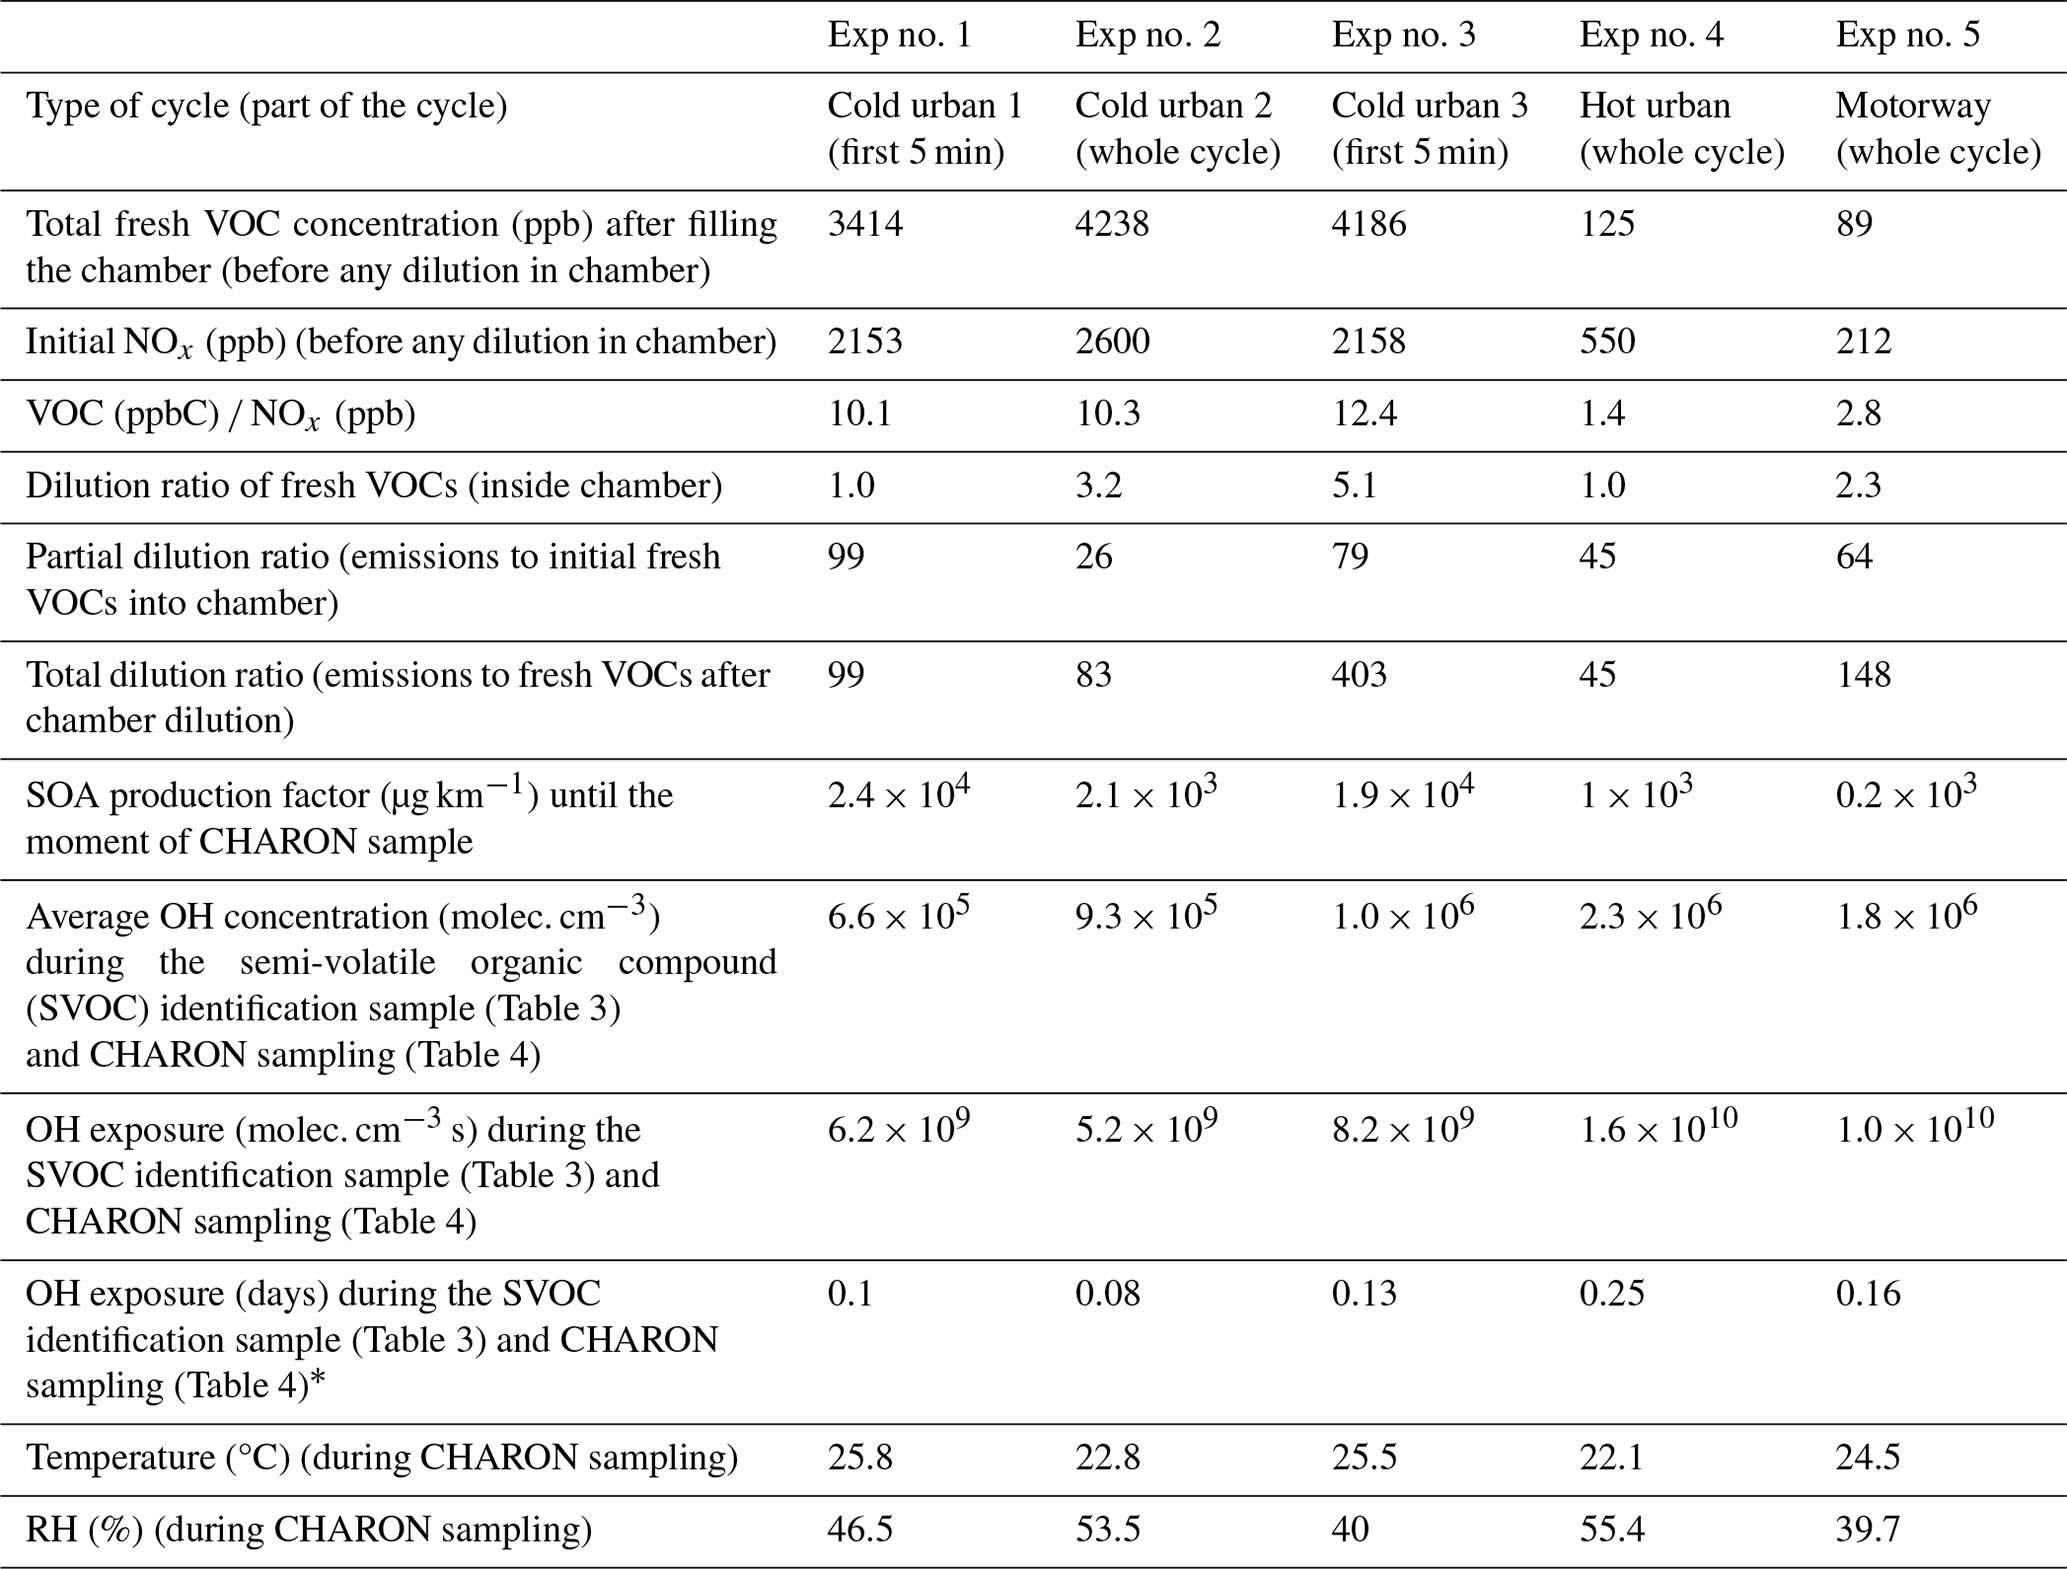
∗ Assuming a daily average OH concentration of 1.5 × 10⁶ molec. cm−3.
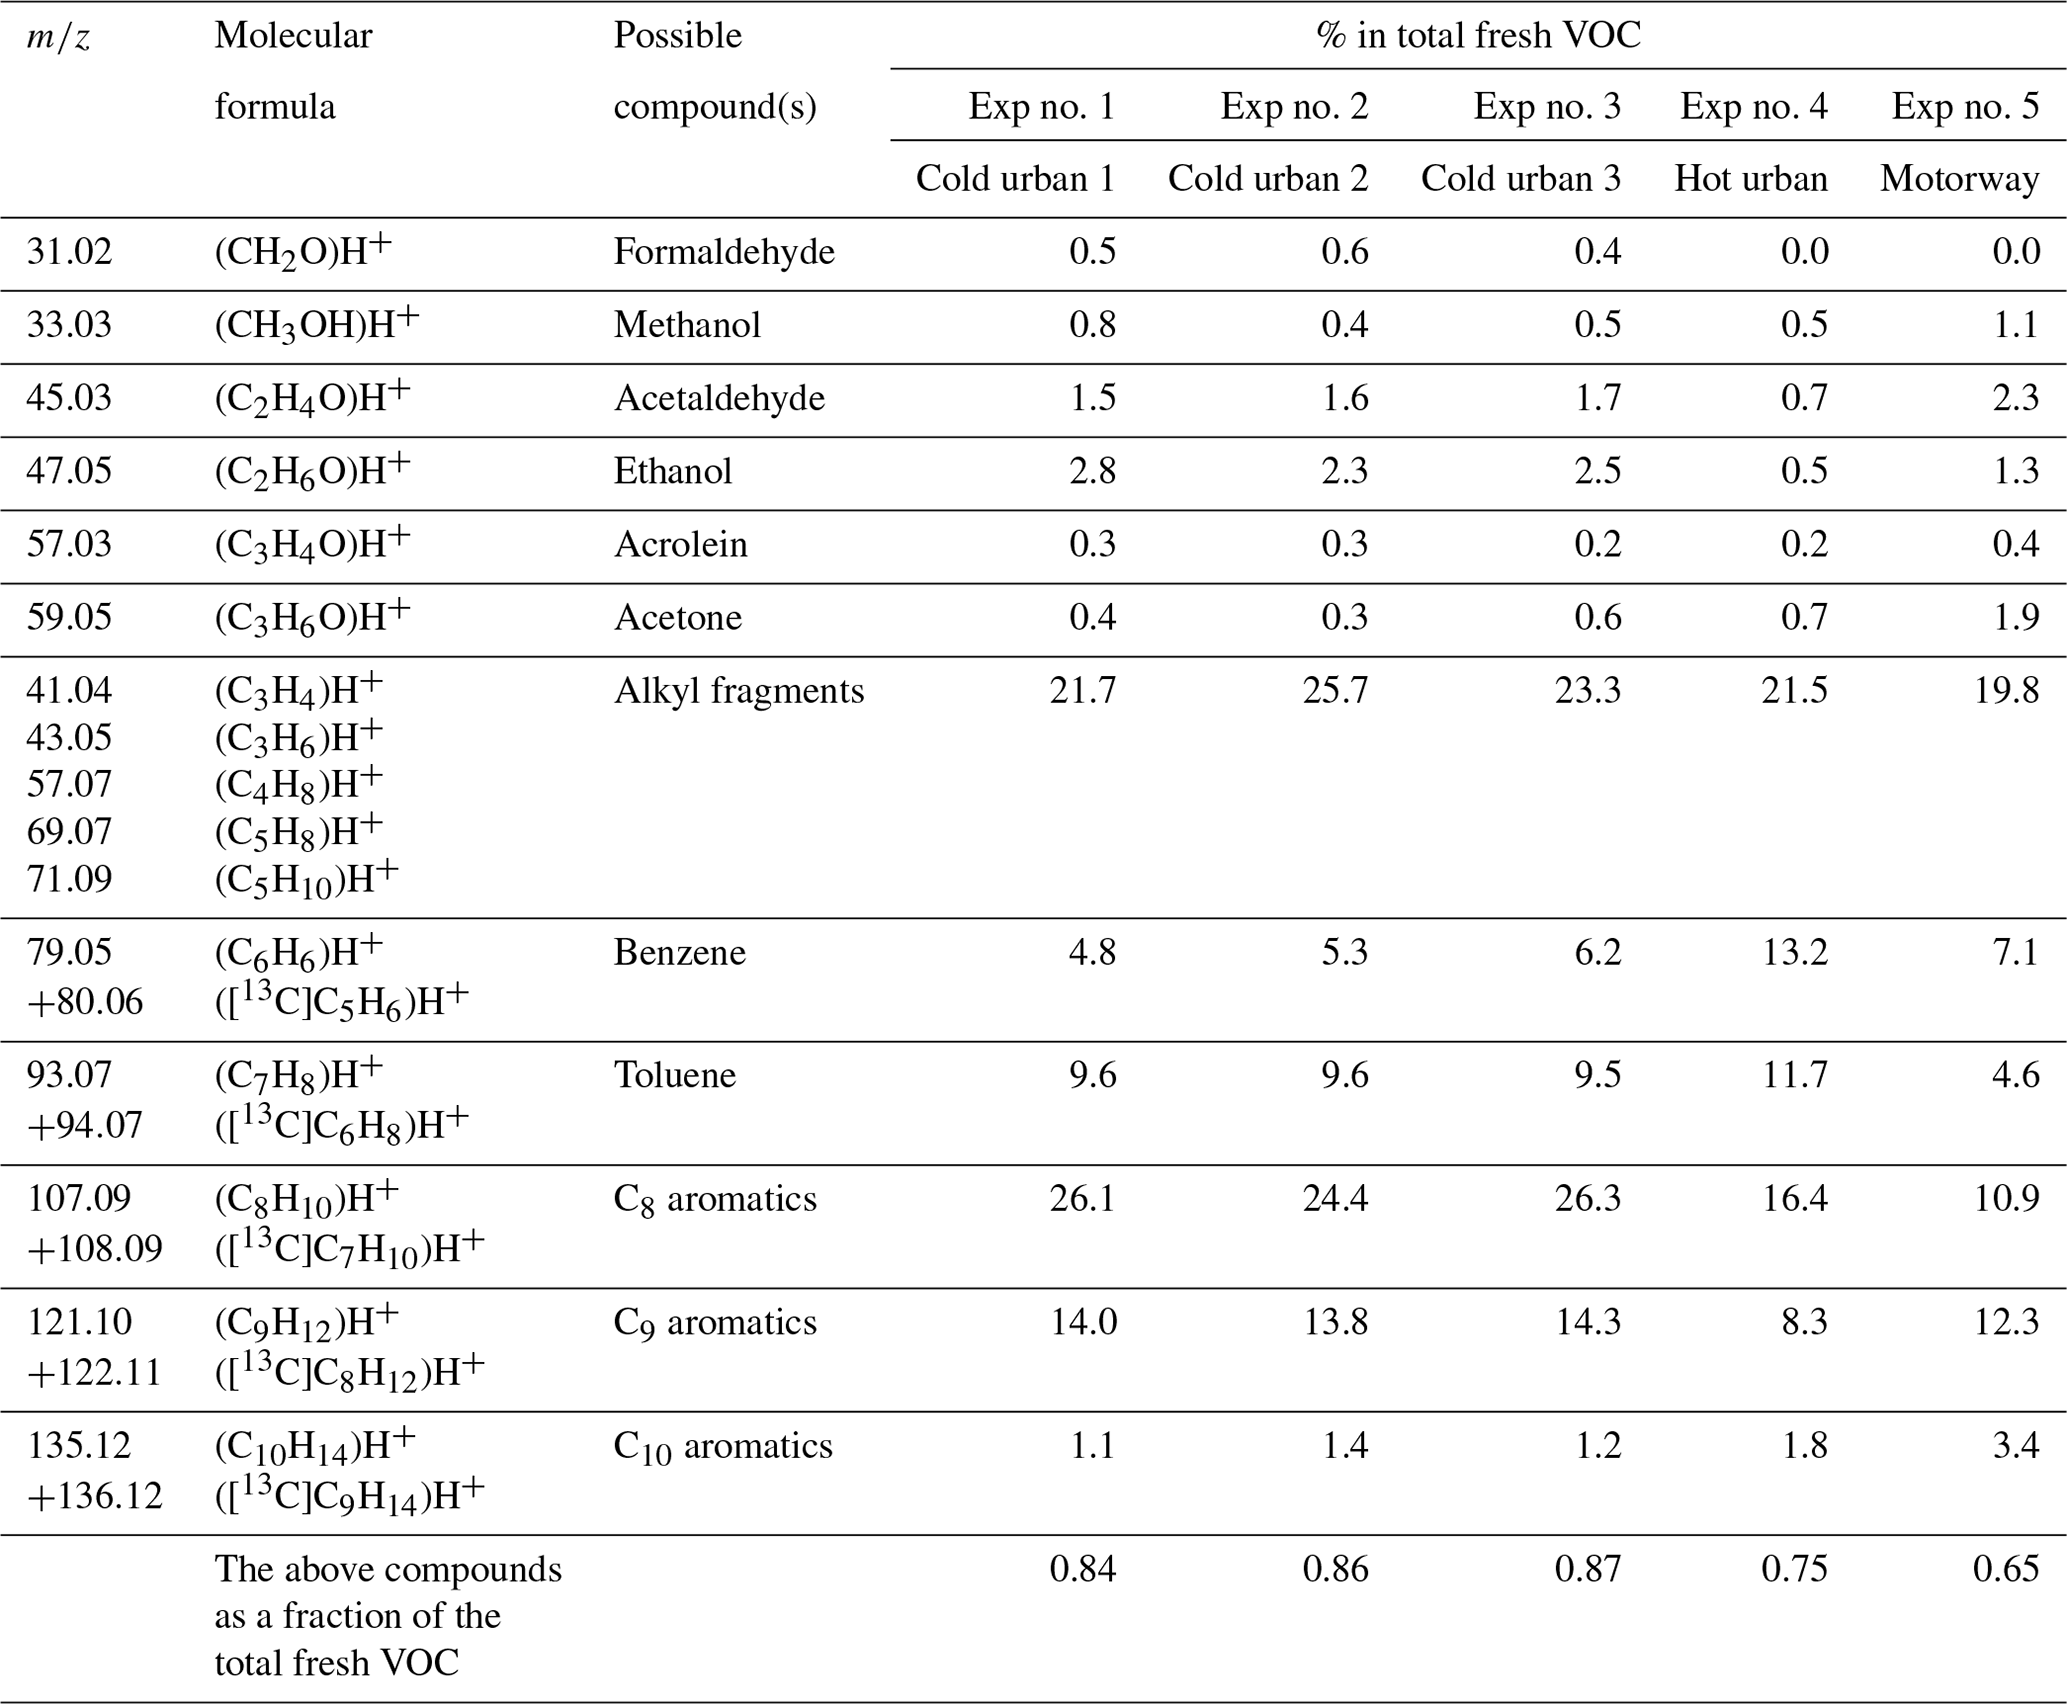
Table 2Measured accurate ; elemental composition of the detected ions; and tentative assignment of fresh VOCs emitted during cold urban, hot urban and motorway Artemis cycles.
Comparing the concentrations of the major ions detected by the PTR-ToF-MS inside the chamber (Table 2) 10–15 min after the filling of the chamber and those at the exhaust of the vehicle (Marques et al., 2022), we calculated a dilution ratio ranging from 28 to 112 (Table 1). After filling the chamber with fresh emissions, the content was diluted (dilution ratios 2.3–5.1) and applied in three out of five experiments before the oxidation procedure (Table 1). Thus, the total dilution ratio in the chamber was 48–518 (Table 1).
The fresh emissions were stabilized for 1–2 h inside the chamber; then OH radicals were produced by H2O2 photolysis under UV illumination at a 280–320 nm wavelength. H2O2 solution (50 wt % in H2O, Sigma-Aldrich) was introduced into the chamber through a bubbler. The OH concentration was calculated by the decays of 1,3,5-trimethylbenzene (TMB) and m-xylene using the rate constants of 5.7 × 10⁻¹¹ and 2.3 × 10⁻¹¹ cm3 molec.−1 s−1 respectively (Calvert et al., 2002). An average OH radical concentration was evaluated considering the two decay rates, and depending on the experiment it ranged from 6.6 × 10⁵ to 2.3 × 10⁶ molec. cm−3 (Table 1). The total OH exposure ranged between 6.2 × 10⁹ and 1.6 × 10¹⁰ molec. cm−3 s (Table 1). During the experiments, the relative humidity (RH) inside the chamber was 45 %–55 %, while the temperature was 22–26 °C.
The gas phase was measured by a PTR-ToF-MS (PTR-ToF 8000 instrument Ionicon Analytik) (de Gouw and Warneke, 2007) with a time resolution of 30 s. The PTR-ToF-MS was operated at an electrical field () of 100 Td, and the drift tube pressure was 2.2 mbar, while the inlet tube and the reaction chamber were at 120 °C. The PTR-ToF-MS was calibrated using a multicomponent gas standard (Apel Riemer Environmental Inc., Miami, FL, USA) which includes low-molecular-weight analytes ( < 200). The organic particle phase was measured by a CHARON inlet (Eichler et al., 2015) coupled in front of the PTR-ToF-MS (this system will be referred to as “CHARON” hereafter). The recently developed CHARON inlet consists of a gas-phase denuder for stripping off the gas-phase molecules. The particles then pass through a series of aerodynamic lenses for particle collimation and pre-concentration and through a thermo-desorption unit, where they are volatilized and transferred to the PTR-ToF-MS detector. The CHARON inlet was operated at low pressure (6–8 mbar) and the thermo-desorption unit at a constant temperature of 150 °C, while the ratio of the electric field strength to the gas number density () and drift tube pressure were maintained at 100 Td and 2.2 mbar respectively. The sample time resolution was 30 s. During a single experiment of photo-oxidation, we switched between the CHARON inlet and the gas-phase mode three to four times. Particles were sampled for at least 40 min, and only the last 5 min of each sample was considered because the stabilization required at least 20–25 min.
For the particle chemical characterization, we additionally deployed an Aerodyne HR-ToF-AMS (DeCarlo et al., 2006; Canagaratna et al., 2007).
The PTR-ToF-MS data were analyzed using Tofware v2 for peak fitting and the PeTeR v3.5 toolkit for cps-to-ppb conversion with Igor Pro 6.37 (WaveMetrics). For the assignment of the secondary VOCs and SOA compounds, we used as a guide the molecular formula of the products that have been identified in previous studies from aromatic SOA photo-oxidation systems (Forstner et al., 1997; Smith et al., 1998, 1999; Jang and Kamens, 2001; Cocker et al., 2001; Hamilton et al., 2003, 2005; Zhao et al., 2005; Huang et al., 2006; Wang et al., 2006; Sato et al., 2007, 2012; Healy et al., 2008; Wyche et al., 2009; Müller et al., 2012; Borrás and Tortajada-Genaro, 2012; Wu et al., 2014; White et al., 2014; Ma et al., 2018). For the raw count-to-ppb conversion, we used the experimentally determined transmission function and k proton rate constants based on the molecular formula of each ion. These k rates ranged from 1.4 × 10⁻⁹ to 3.9 × 10⁻⁹ cm3 s−1 and were close to previous values in the literature (e.g., Anicich, 2003; Warneke et al., 2003; Cappellin et al., 2012; Holzinger et al., 2019). More details about the quantification of the PTR-ToF-MS signal are discussed in the Supplement.
During the experiments, high ammonium nitrate levels were produced because of the high emission levels of NH3 and NOx; nitrate concentrations could reach up to 131 µg m−3. Thus, the AMS data were corrected modifying the fragmentation table according to the suggestions of Pieber et al. (2016). As detailed in that paper, high concentrations of nitrate salts interfere with the measurement of particulate CO by creating an oxidizing environment on the particle vaporizer in the HR-ToF-AMS and thereby releasing CO from carbonaceous residues. This affects the calculated OA mass concentration, the mass spectra and the O : C ratio.
The experimental saturation mass concentration () for each of the identified compounds was calculated based on the theory of gas-to-particle phase partitioning (Pankow, 1994) as described by Donahue et al. (2006) (Eq. 1):
where Cp,i and Cg,i are the particle- and gas-phase mass concentrations respectively (in µg m−3) of the species i and TS is the mass concentration of the total suspended organic and inorganic aerosol (in µg m−3). The gas-phase concentration (Cg,i) of each compound was calculated from PTR-ToF-MS data, while the corresponding particle-phase (Cp,i) concentration was measured by CHARON, after normalizing the total OA CHARON mass concentration to the total HR-ToF-AMS OA mass concentration. The above normalization was applied because CHARON tends to measure lower mass concentrations compared to the HR-ToF-AMS due to the different cut of size at the low size range for each instrument (100–150 nm for CHARON and 50–70 nm for the HR-ToF-AMS) and due to fragmentation of analyte ions in PTR-ToF-MS. Such fragmentation differs for each compound and is more intense as increases (Müller et al., 2017; Leglise et al., 2019). Müller et al. (2017) mentioned that the mass concentrations between these two instruments may differ by up to a factor of 2.
The total suspended mass concentration was derived by the HR-ToF-AMS (OA + ammonium nitrate). Due to the high ammonium nitrate mass concentration and the increased RH (∼ 50 %), the HR-ToF-AMS collection efficiency (CE) was assumed to be close to unity (Matthew et al., 2008).
The saturation mass concentration, (Donahue et al., 2011), is linked to the gas-to-particle partitioning coefficient, Kp,i, through Eq. (2):
The theoretical saturation concentration was estimated using Eq. (3) proposed by Cappa and Jimenez (2010):
where MWOA,i is the molecular weight of the organic compound i (g mol−1), pi,L is the subcooled liquid saturation vapor pressure (Pa), ζi is the activity coefficient of the compound i in the particulate phase, T is the temperature inside the chamber (K) and R is the ideal gas constant (8.314 J mol−1 K−1). The activity coefficient was assumed to be equal to unity. The molecular weight of each compound was determined by the detected by CHARON or PTR-ToF-MS (M + 1)+ as the parent compounds gain a proton. The subcooled liquid saturation vapor pressure (pi,L) was estimated by empirical relationships based on the equation of Clausius–Clapeyron (Myrdal and Yalkowsky, 1997; Jenkin, 2004; Nannoolal et al., 2008). The above approaches require the boiling temperature and the enthalpy of vaporization; these properties were estimated based on the molecular structure of each compound (Mackay et al., 1982; Joback and Reid, 1987; Stein and Brown, 1994). For the prediction of the vapor pressure of each compound, we used the online facility UManSysProp (https://umansysprop.readthedocs.io/en/latest/, last access: 20 December 2023) developed by Topping et al. (2016) using as input the molecular information in terms of SMILES (Simplified Molecular Input Line Entry System) strings. In this facility, there are three options for the boiling-temperature estimation based on the methods of Joback and Reid (1987), Stein and Brown (1994), and Nannoolal et al. (2008). After having selected the method for the boiling-temperature estimation, the user has the choice to select two approaches for the vapor pressure prediction (Myrdal and Yalkowsky, 1997; Nannoolal et al., 2008). Finally, the above tool also includes the EVAPORATION method (Compernolle et al., 2011). Therefore, there are seven different combinations for the vapor pressure estimation. For the comparisons with our measurements, we used the average vapor pressure of these seven combinations for each compound.
For the estimation of the organic nitrate fraction, xorganonitrate (i.e., the organic nitrate mass concentration over the total nitrate mass concentration), we applied the procedure of Farmer et al. (2010) to the AMS data:
where is the ratio of NO+ NO ions during NH4NO3 calibrations (0.63 on average); is the measured ratio of NO+ NO ions throughout the experiment; and RON is a fixed value set to 22.9, equal to the maximum ratio of NO+ NO observed.
4.1 Gas phase
In total 59–67 (for the cold and hot urban cycles) and 103 (for the motorway cycle) ions were detected during the characterization of the fresh VOCs after their introduction into the chamber (Table S1 in the Supplement). Of those ions, 47–75 had a contribution higher than 0.14 % to the total fresh gas-phase concentration, which explained 96 %–99 % of the measured concentration (Table S1). Table S2 lists the major ions of those having a contribution greater that 0.14 % to the total fresh gas-phase concentration. Any ions detected at 39 (e.g., C3H) were excluded from our analysis as 39 was dominated by the water cluster isotope H5O[18O]+, which could possibly lead to artifactually high concentrations of the rest of the ions detected at 39. Generally, VOC and NOx concentrations during the cold urban cycles (Exp nos. 1–3) were much higher than those during the hot urban and motorway cycles (Exp nos. 4–5) because of low engine temperatures and reduced catalyst efficiency during the first minutes of the cycle. This is in agreement with Kostenidou et al. (2021) and Marques et al. (2022).
The O and C distributions of the fresh VOCs for the three different cycles as measured by the PTR-ToF-MS are illustrated in Figs. 1a, 2a and 3a. Previous studies (e.g., Saliba et al., 2017) have shown that small alkanes < C5 and alkenes < C2 may contribute up to 50 % of the non-methane VOC (NMVOC) emissions for gasoline vehicles. As PTR-ToF-MS cannot detect these small compounds, due to their low proton affinity, the fresh VOC emissions were mainly composed of C6–C10 aromatic compounds: 52 %–58 % for the cold and hot urban cycles and 38 % for the motorway cycle (Table 2). For the cold urban cycles, C8 aromatics (e.g., xylenes, ethylbenzene) were the major aromatic compounds (24 %–26 %) followed by C9 aromatics (e.g., trimethylbenzenes, 1-ethyl-3-methylbenzene) (14.0 %), toluene (9.6 %) and benzene (4.8 %). The hot urban cycle was characterized by lower contribution of C8 and C9 aromatics (16.4 % and 8.4 % respectively) but a higher fraction of benzene (13.2 %) and toluene (11.7 %) in comparison to the cold urban cycles. During the motorway cycle, C9 and C8 aromatic compounds were the major contributors (10.9 % and 12.3 % respectively), followed by benzene (7.1 %), toluene (4.6 %) and C10 aromatics (3.4 %). Fragments of large alkane compounds or alkenes (CxH) were detected at lower values (between 41 and 71) with fractions ranging between 20 %–26 % for all the cycles. Small oxygenated compounds (such as formaldehyde, methanol, acetaldehyde, ethanol, acrolein and acetone) were also emitted, mainly during the cold urban cycles. All the above compounds have been identified in gasoline exhaust emissions (Erickson et al., 2014; Gueneron et al., 2015; Pieber et al., 2018; Kari et al., 2019).
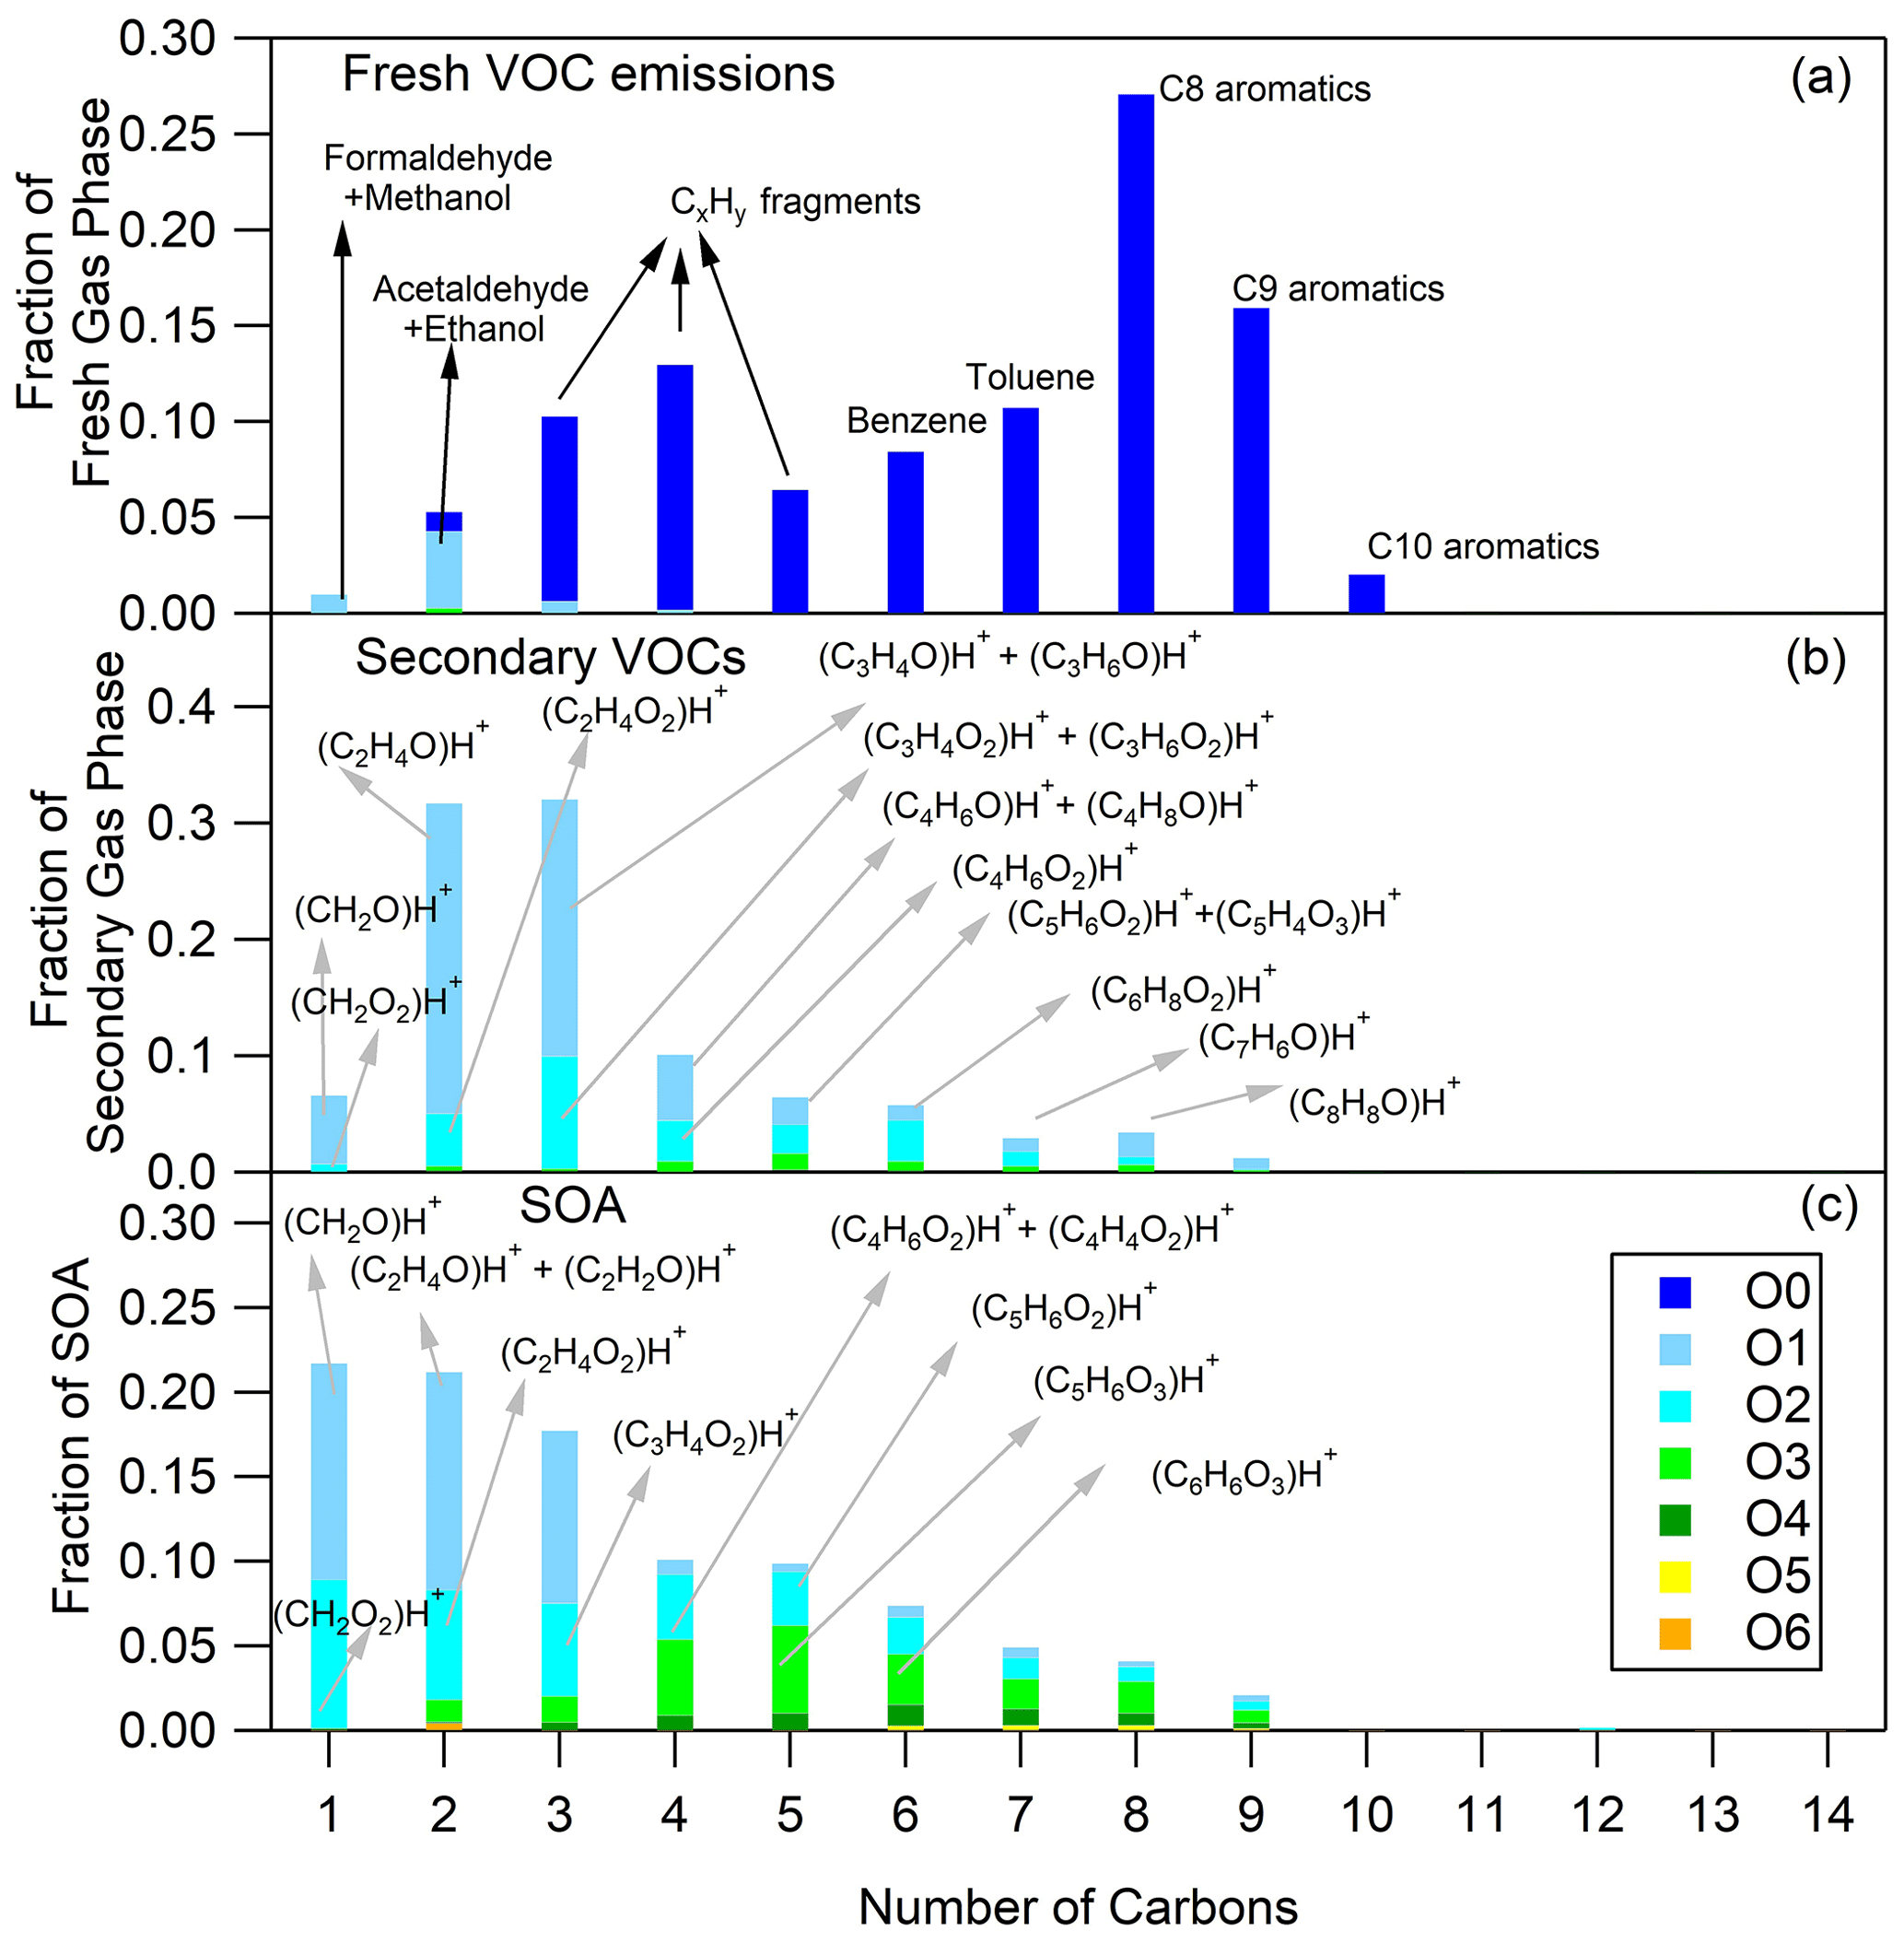
Figure 1Fresh VOC (a), secondary VOC (b) and SOA (c) distributions for cold urban Artemis emissions (experiment no. 2). The secondary VOC and SOA distributions correspond to an OH exposure equal to 5.2 × 10⁹ molec. cm−3 s.
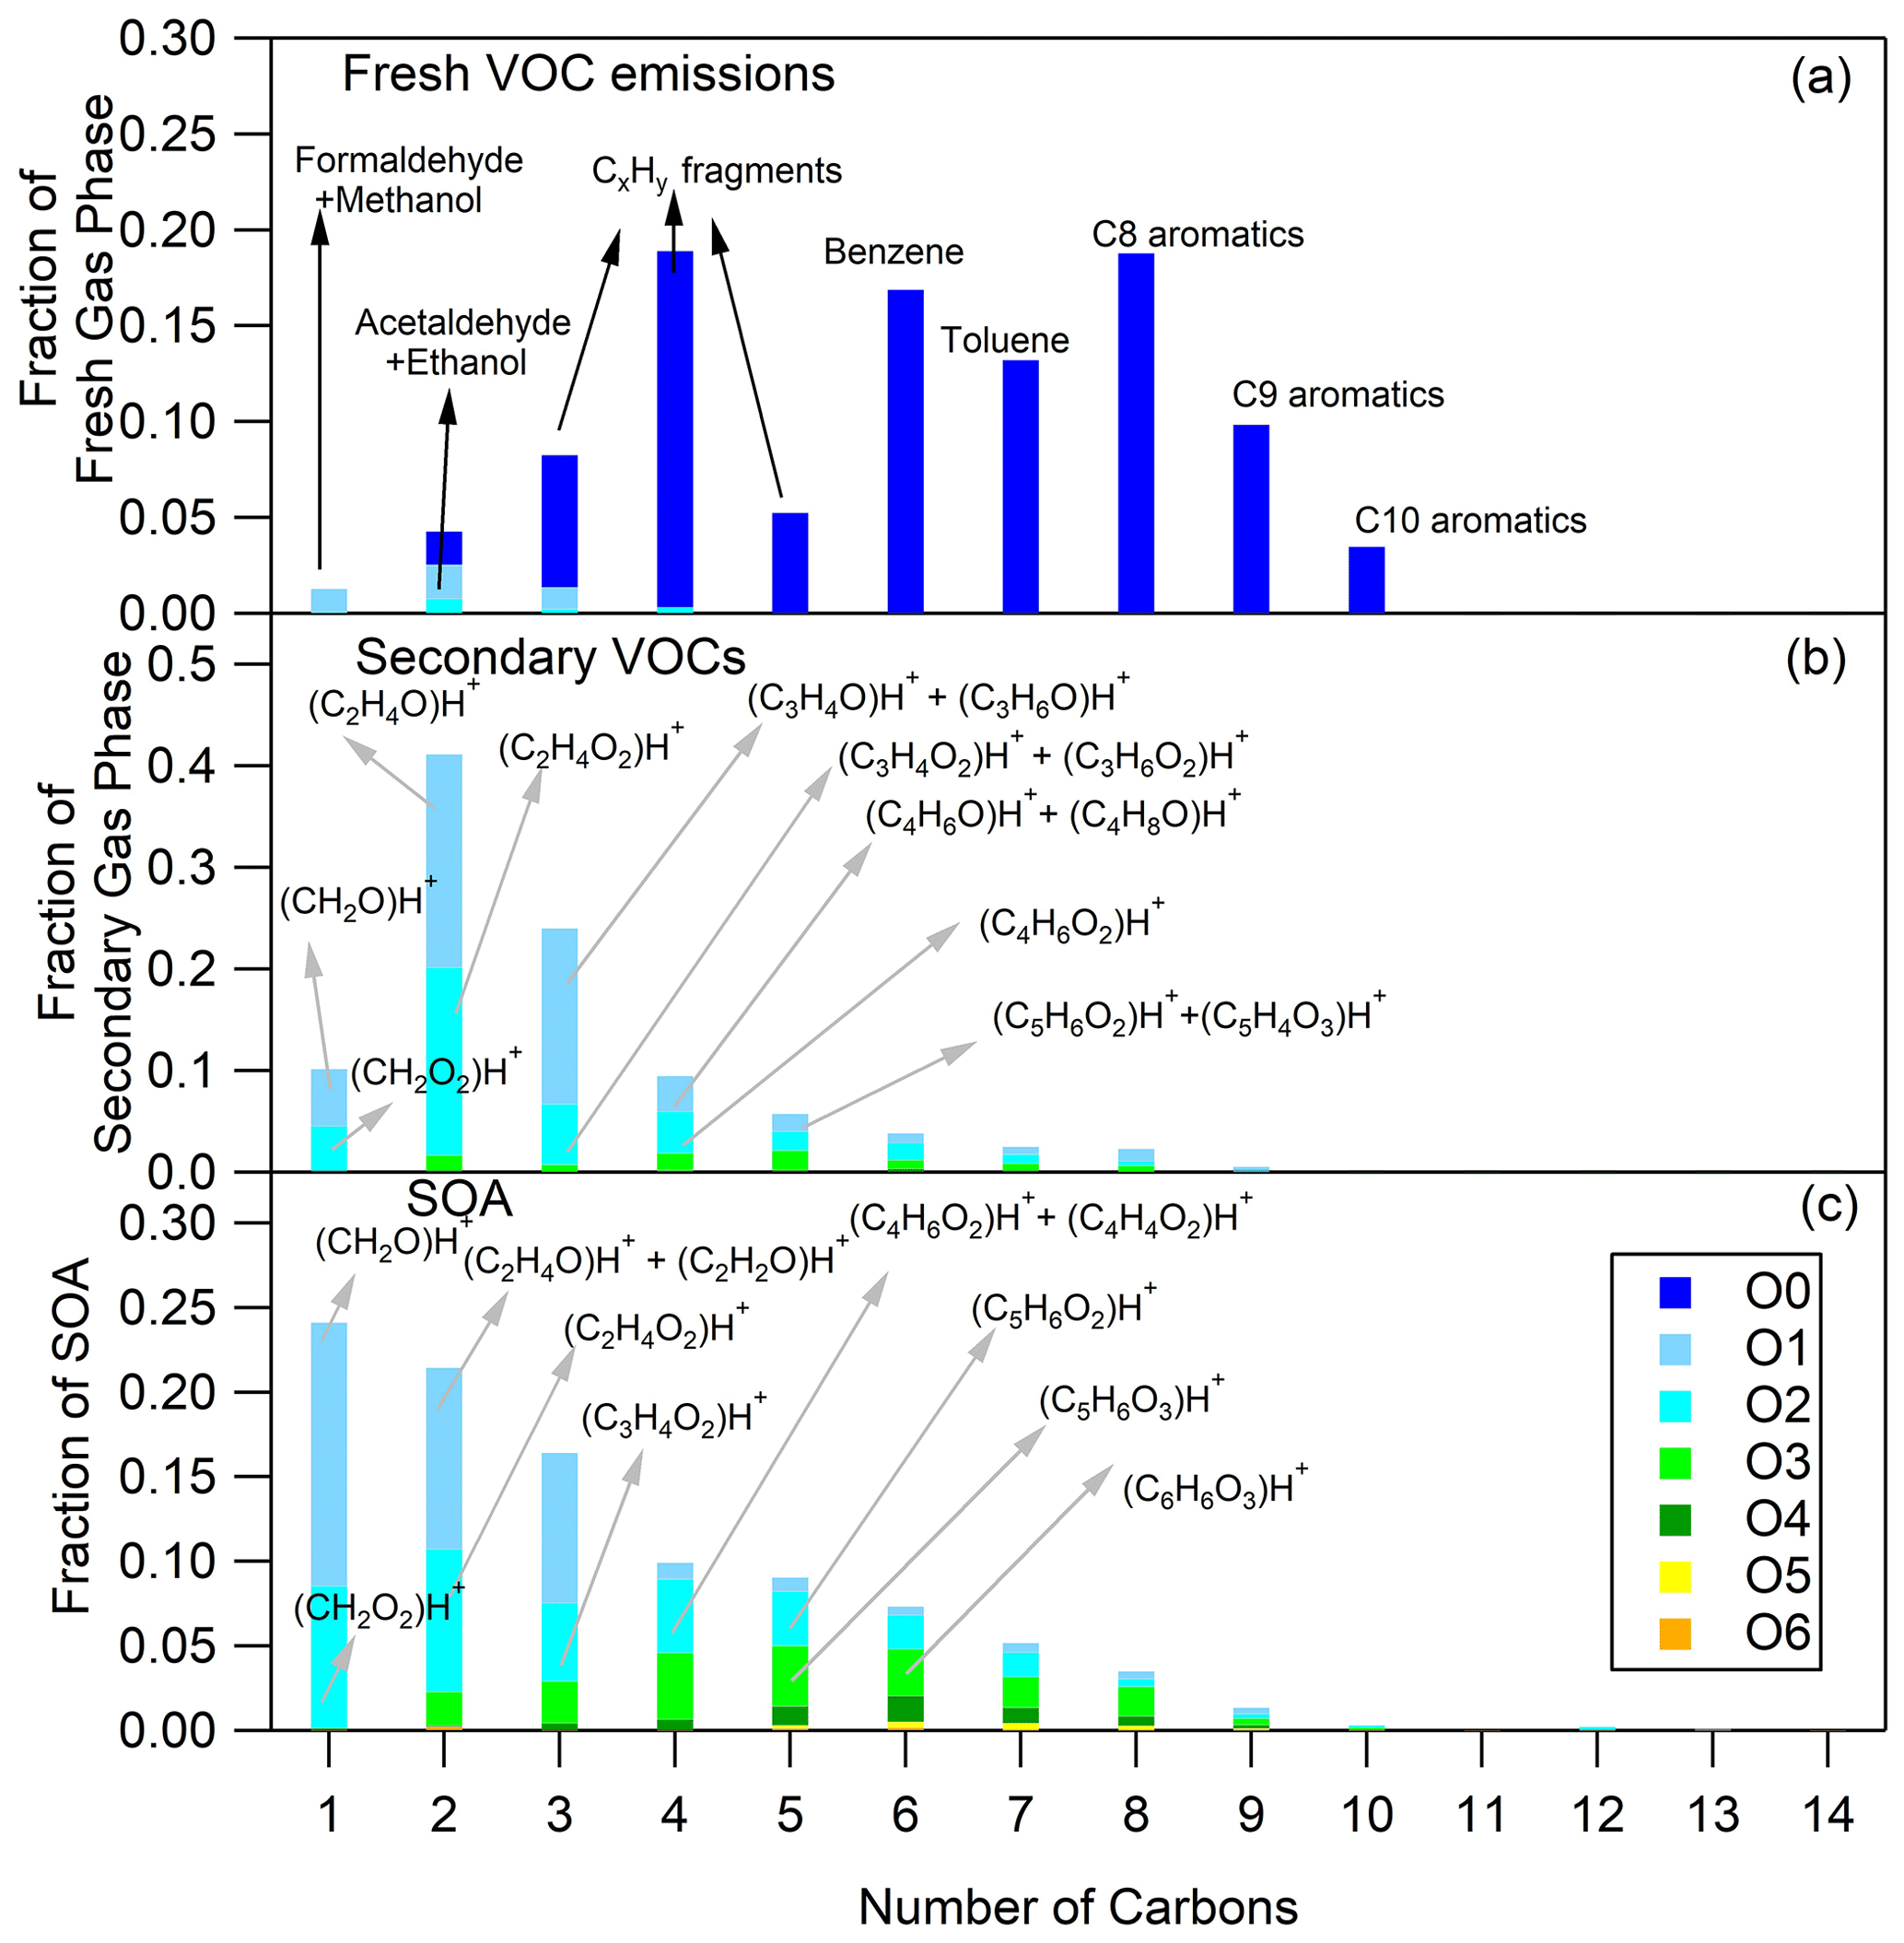
Figure 2Fresh VOC (a), secondary VOC (b) and SOA (c) distributions for hot urban Artemis emissions (experiment no. 4). The secondary VOC and SOA distributions correspond to an OH exposure equal to 1.6 × 10¹⁰ molec. cm−3 s.
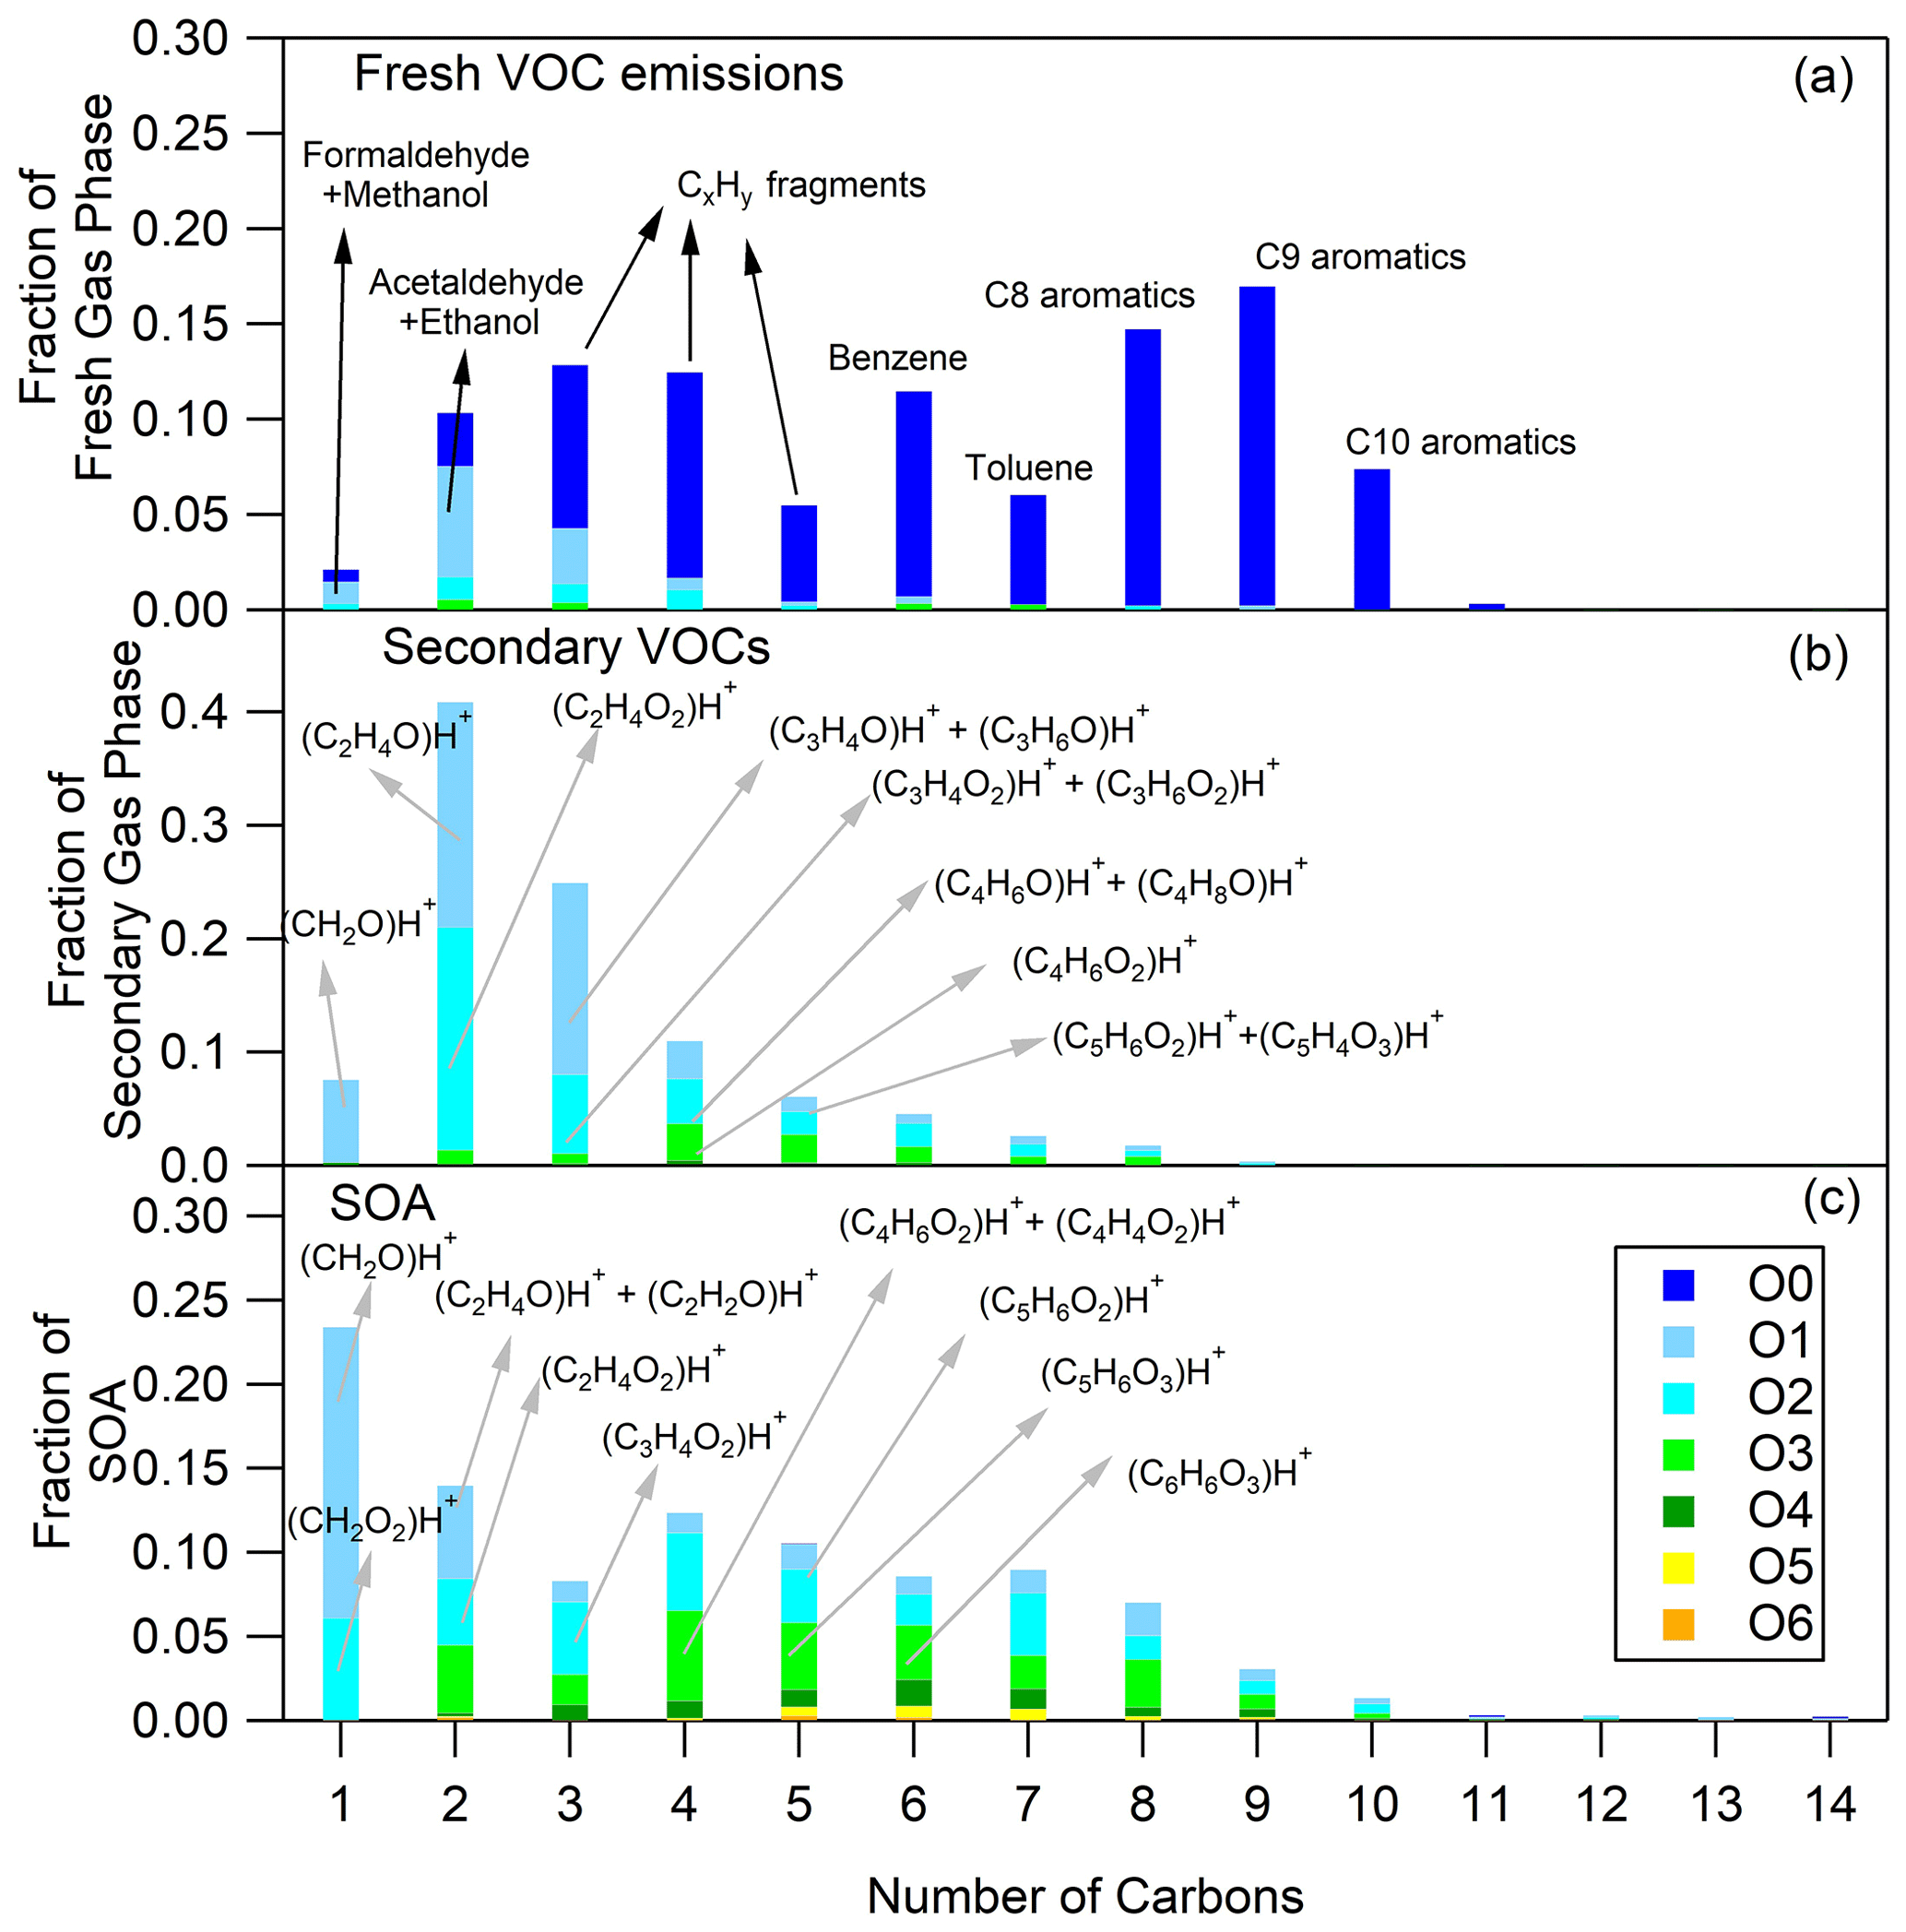
Figure 3Fresh VOC (a), secondary VOC (b) and SOA (c) distributions for motorway Artemis emissions (experiment no. 5). The secondary VOC and SOA distributions correspond to an OH exposure equal to 1.0 × 10¹⁰ molec. cm−3 s.
A detailed analysis of the primary VOC emissions and assignment from this vehicle are discussed by Marques et al. (2022). Briefly fresh online emissions of this vehicle as seen by the PTR-ToF-MS and GC-MS instrument were characterized by monoaromatic compounds (62 %) centered around C9. The above fraction was slightly higher compared to that measured inside the chamber (this study), where the monoaromatic compounds were on average 52 %. This difference could be due to potential losses on the tubing and chamber walls. In addition, Marques et al. (2022) reported that aliphatic compounds were also an important fraction (35 %). Linear and branched alkanes were predominant (79 %), but alkenes represented a non-negligible part (17 %) of the aliphatic compounds.
Secondary VOCs accounted for 92–163 identified ions (Table S1) (at OH exposure 5.2 × 10⁹–1.6 × 10¹⁰ molec. cm−3 s, Table 1). Approximately two-thirds of these ions had a contribution higher than 0.14 % to the total secondary gas-phase concentration, explaining 93 %–97 % of the secondary gas-phase concentration (Table S1). Table S3 presents a sub-group of the ions with a contribution greater that 0.14 % to the total secondary gas-phase concentration, which explained 89 %–97 % of total secondary gas-phase concentration.
The O and C distributions of the secondary volatile compounds produced for the three different cycles are shown in Figs. 1b, 2b and 3b. For the calculation of these distributions, we subtracted the quantities of the C1, C2 and C3 oxygenated compounds found in the primary emissions and the non-oxygenated compounds/fragments (C6–C10 aromatic compounds and CxH fragments) that did not react. The major products, which explain 83 %–94 % of the concentration of the secondary VOCs produced, and their possible assignment are presented in Table 3. Tables 3 and S3 do not account for any fragmentation in the concentration calculations unless it is mentioned.
Table 3Measured accurate ; elemental composition of the detected ions; and tentative assignment of the most important secondary gas-phase products produced from cold urban, hot urban and motorway Artemis cycle emissions. Assignment was supported by literature studies of individual aromatic compounds (Forstner et al., 1997; Smith et al., 1998, 1999; Jang and Kamens, 2001; Cocker et al., 2001; Hamilton et al., 2003, 2005; Zhao et al., 2005; Huang et al., 2006; Wang et al., 2006; Sato et al., 2007, 2012; Healy et al., 2008; Wyche et al., 2009; Müller et al., 2012; Borrás and Tortajada-Genaro, 2012; White et al., 2014; Wu et al., 2014; Ma et al., 2018; Schwantes et al., 2017).
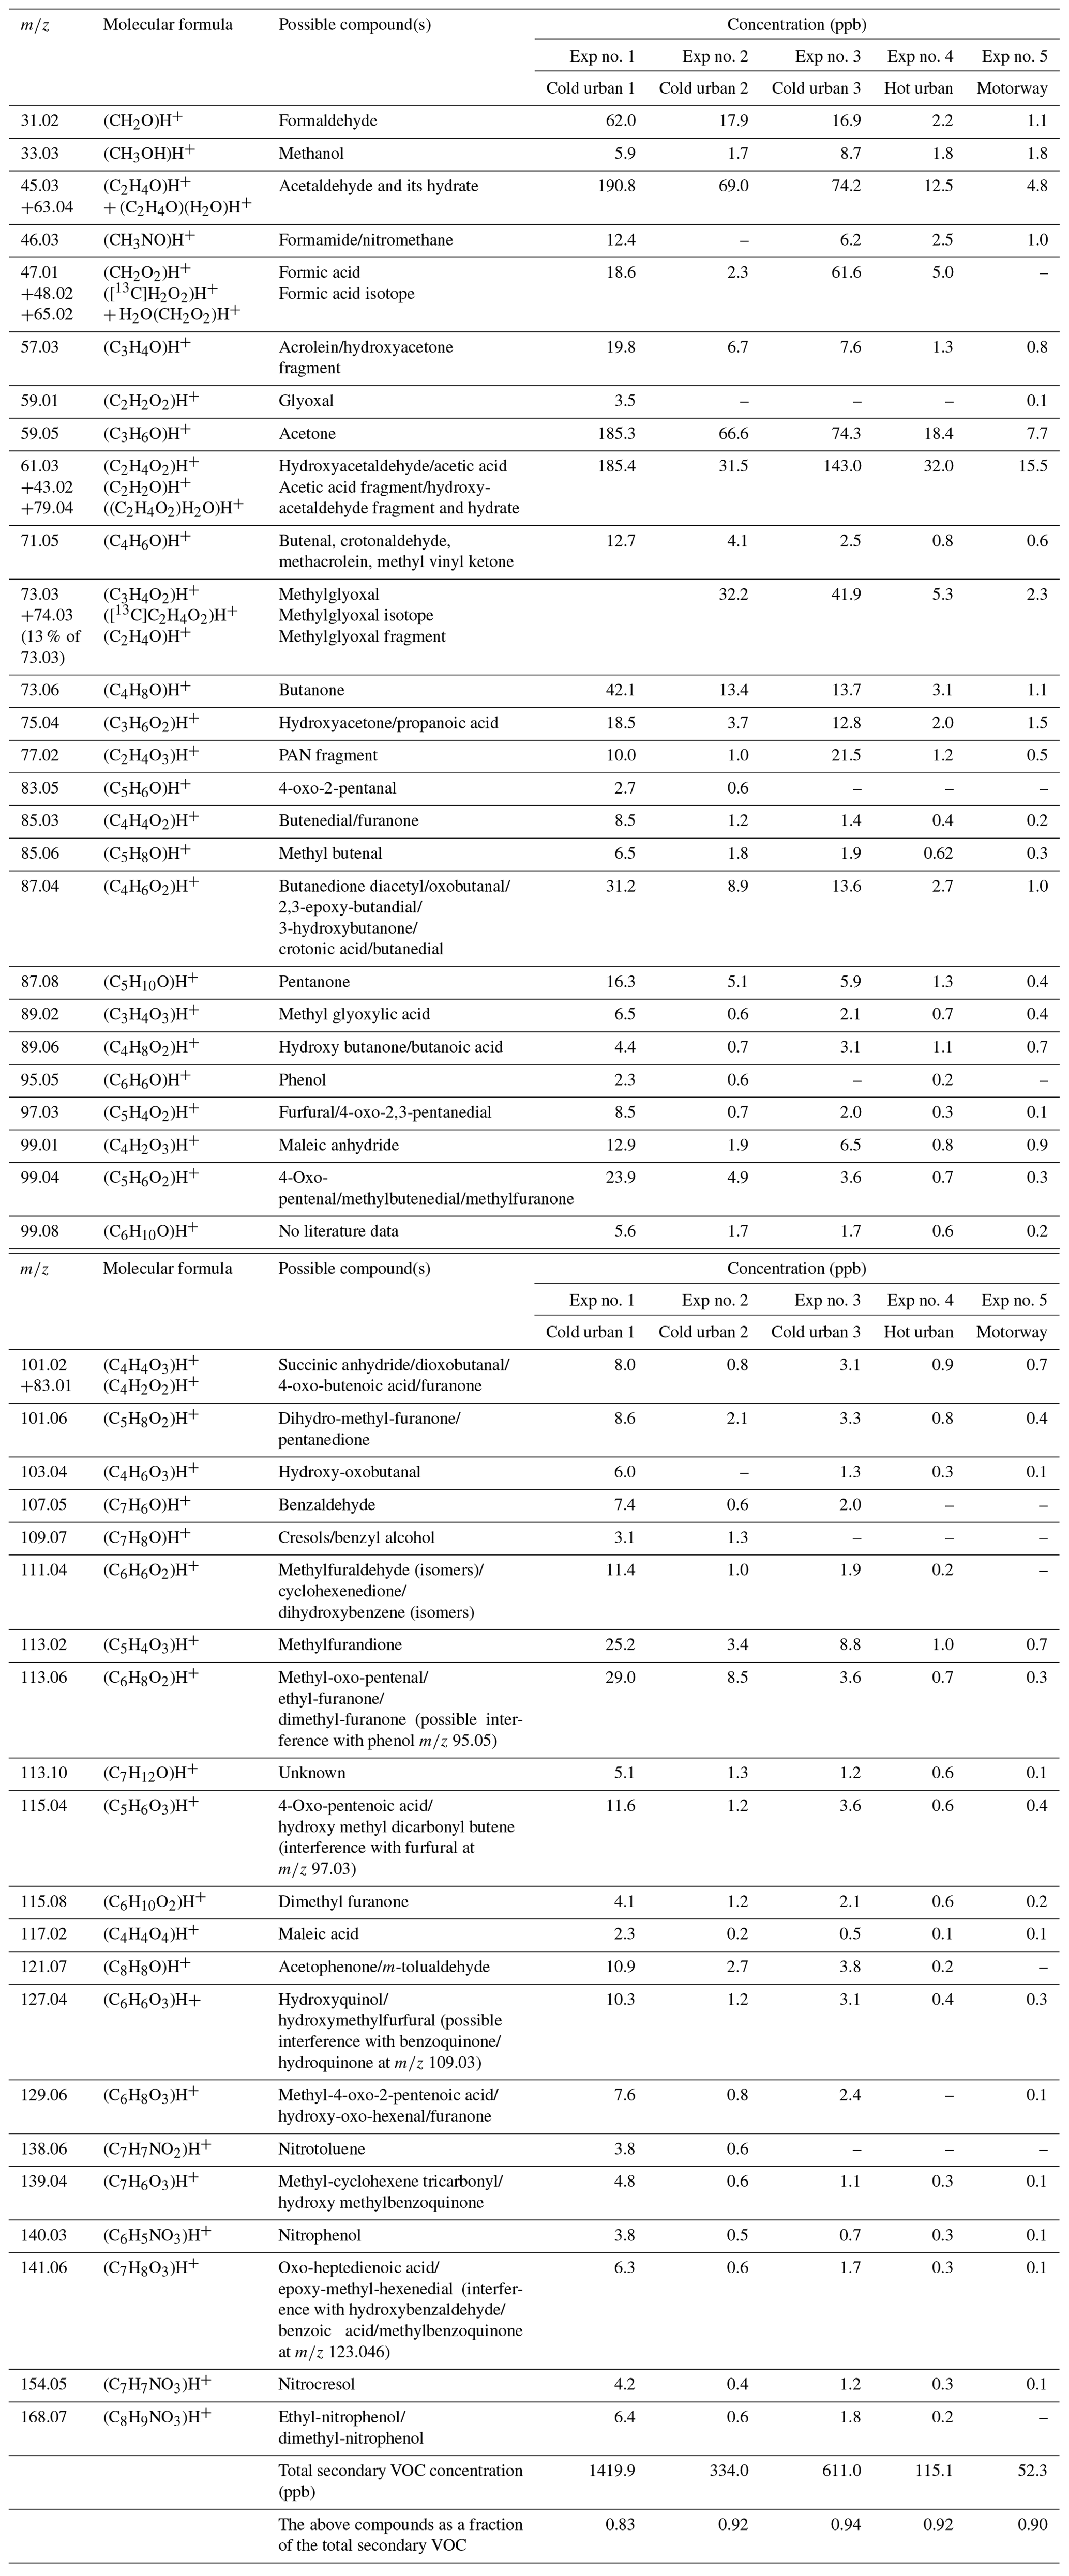
A large fraction was composed of small oxygenated species with one to two atoms of oxygen distributed between C1 and C3. These compounds were mainly products of small alkanes and alkenes (e.g., CH4, C2H4, C2H6), which can be as high as 50 % of the total VOC emissions, but they are not measured by the PTR-ToF-MS. These compounds react with OH radicals, generating high quantities of C1–C3 products. However, part of the signal detected at these values could also be fragments from larger molecules. The values of 31.02 (CH2O)H+ and 47.01 (CH2O2)H+, possibly formaldehyde and formic acid or fragments from larger compounds, were the major species with one atom of carbon. The main compounds with two atoms of carbons had values of 45.03 (C2H4O)H+ acetaldehyde, 61.03 (C2H4O2)H+, acetic acid/hydroxyacetaldehyde (together with their fragments at 43.02 C2H3O+) and 77.02 (C2H4O3)H+ glycolic acid/PAN fragment. However, parts of the smaller values such as 45 and 61 are often fragments of larger compounds (Buhr et al., 2002; Haase et al., 2012; Baasandorj et al., 2015). The 59.05, (C3H6O)H+, which could be acetone or a fragment (Buhr et al., 2002; Karl et al., 2007), is the species with the highest contribution among the C3 compounds. It is followed by 73.03 (C3H4O2)H+ methylglyoxal (together with its fragment at 45.03 (C2H4O)H+ and its C13 isotope at 74.03), 57.03 (C3H4O)H+ acrolein and 75.04 (C3H6O2)H+ hydroxyacetone/propanoic acid/fragment.
Other important contributions were due to values of 71.05 (C4H6O)H+ 2-butenal, 73.06 (C4H8O)H+ butanone, 87.04 (C4H6O2)H+ 3-oxobutanal and isomers, 107.05 (C7H6O)H+ benzaldehyde, 113.02 (C5H4O3)H+ citraconic anhydride (methylfurandione), 113.06 (C6H8O2)H+ 2-methyl-4-oxo-pentenal and more, 121.07 (C8H8O)H+ acetophenone/m-tolualdehyde, 99.04 (C5H6O2)H+ angelicalactone/4-oxo-2-pentenal (isomers)/2-methylbutenedial/1,3-cyclopentanedione/5-methyl-2(3H)-furanone (isomers), 127.04 (C6H6O3)H+ hydroxymethyl furaldehyde/dimethylmaleic anhydride/hydroxy-methyl-pyranone, 129.06 (C6H8O3)H+ methyl-4-oxo-2-pentenoic acid/hydroxy-oxo-hexenal/furanone, and 141.06 (C7H8O3)H+ oxo-heptedienoic acid/epoxy-methyl-hexenedial.
Most of the above values have been detected in the photo-oxidation gas-phase products of 1,3,5-TMB (Healy et al., 2008; Müller et al., 2012) and toluene (Jang and Kamens, 2001; Schwantes et al., 2017; Lannuque et al., 2023). It should be mentioned that most of the ions reported by Lannuque et al. (2023), who studied the toluene photo-oxidation SOA using CHARON, were detected in the present work. These findings suggest that the monoaromatic precursors emitted from the vehicle exhaust play a predominant role in the secondary VOC formation.
The secondary VOCs produced by the three different cycle emissions presented similar O and C distributions among each other (Figs. 1b, 2b and 3b). However, differences were observed among the cycles, especially for the smaller ions. The secondary gas-phase products from cold urban cycle emissions had a higher fraction of C2 and C3 compounds with one atom of oxygen but a lower fraction of C2 compounds with two atoms of oxygen compared to the secondary gas-phase produced by hot urban and motorway cycle emissions. These differences could be attributed to the different primary gas-phase emissions as mentioned earlier in Sect. 4.1. For the vehicle of this study, Marques et al. (2022) also reported lower fraction of C8 branched alkanes during the cold urban cycle. Those variations in emission composition between the different type of cycles slightly affect the secondary VOC O and C distributions.
4.2 Particle phase
Primary organic aerosol (POA) had an aerodynamic mode diameter of around 100 nm (as measured by the AMS) (Fig. 4a), and therefore it could not be detected by CHARON. During the photo-oxidation of the gasoline emissions, along with the SOA, a relatively high mass concentration of ammonium nitrate was produced with fractions of the total particle phase of 0.74–0.93 (Table S4). This is confirmed by previous gasoline vehicle SOA studies (e.g., Roth et al., 2019; Simonen et al., 2019) as elevated NH3 and NOx emissions are released from gasoline vehicle engines. NOx is oxidized to HNO3, which then reacts with NH3 to form NH4NO3. Ammonium, nitrate and SOA had the same size distribution with aerodynamic mode diameters around 450 nm (Fig. 4b), so they could be efficiently detected by CHARON.
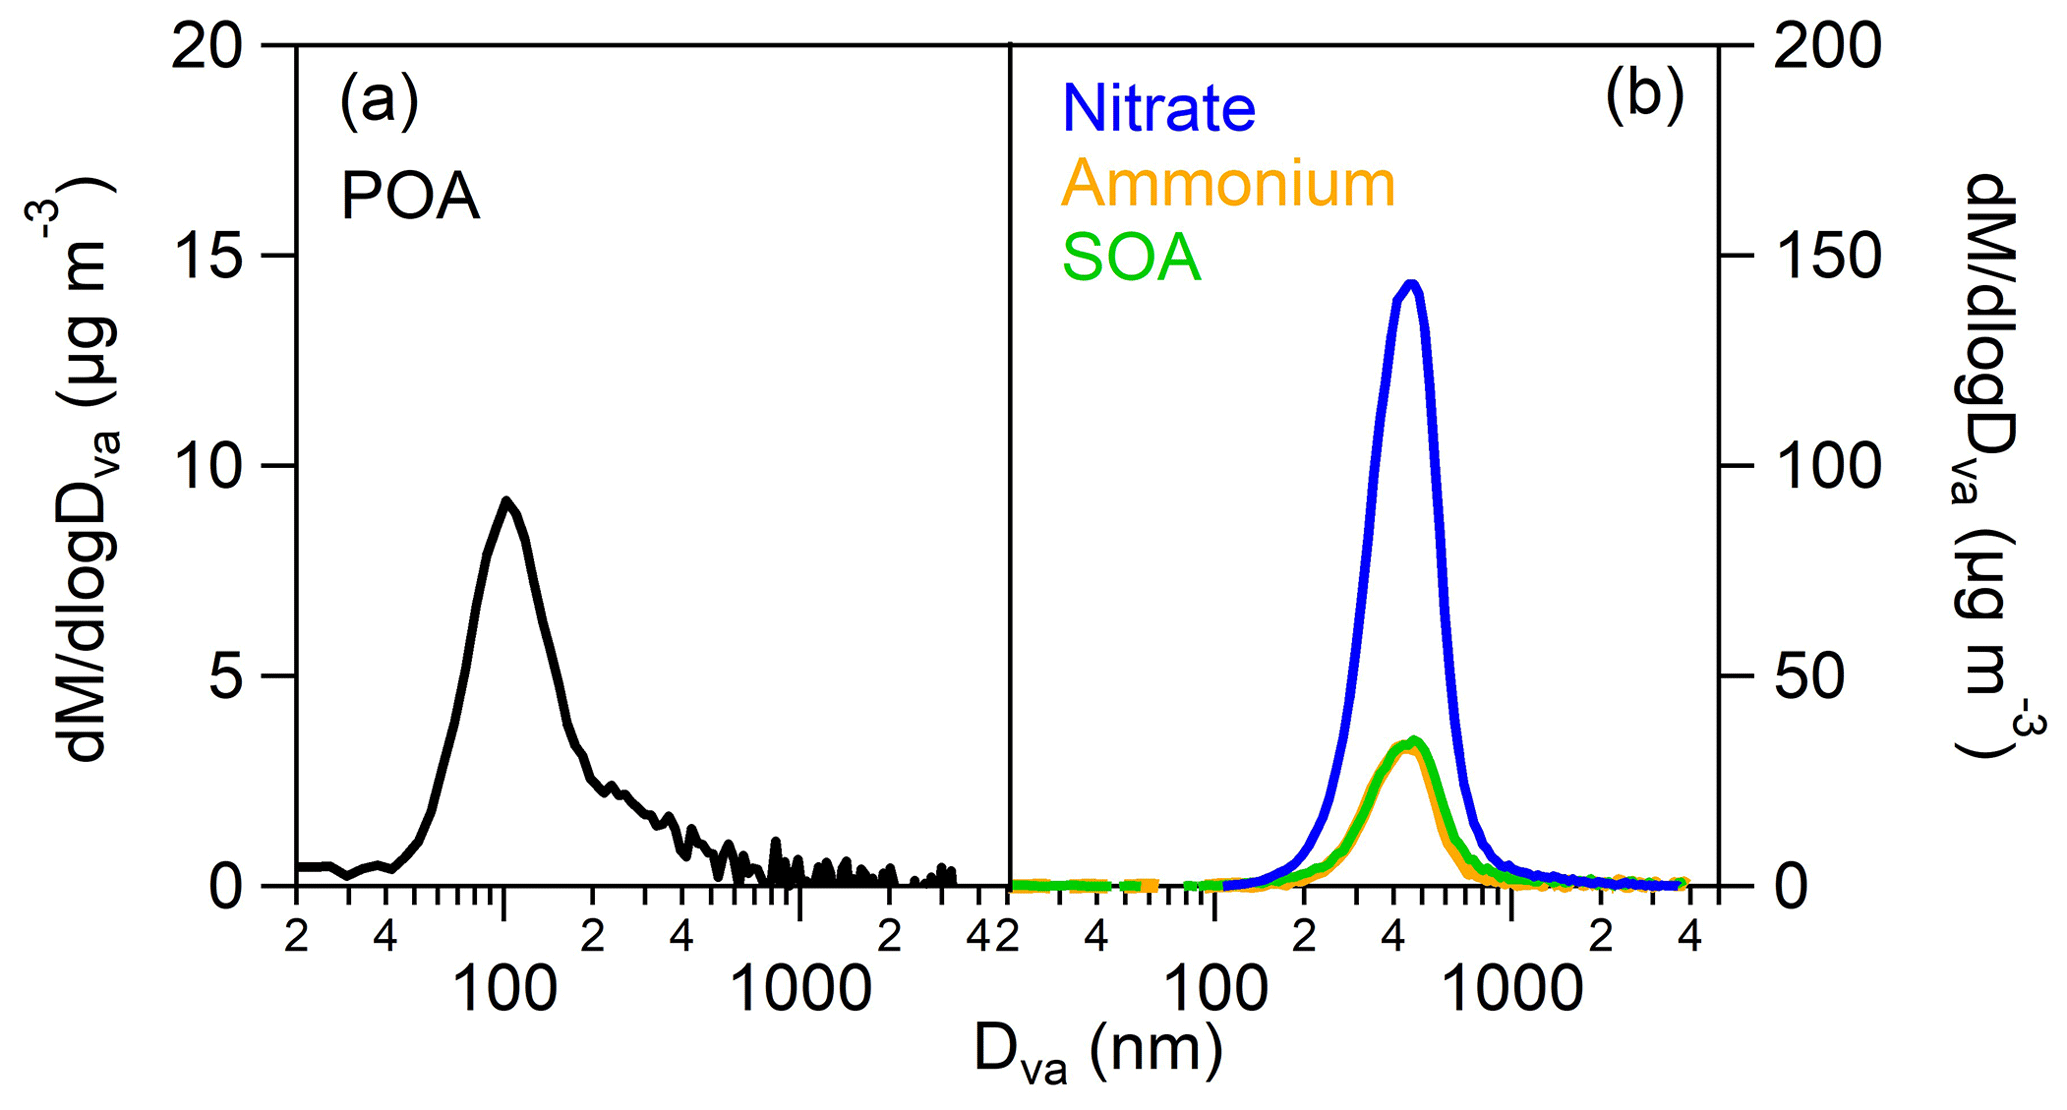
Figure 4AMS mass distributions versus the aerodynamic diameter of (a) the emitted primary organic aerosol (POA) and (b) the SOA, ammonium and nitrate produced at the time of the CHARON sample, during experiment 2 (cold urban Artemis emissions). The fresh organic emissions have a peak at 100 nm, while the secondary products have one at 450 nm.
The CHARON sampling periods were taken at OH exposures in the range of 5.2 × 10⁹–1.6 × 10¹⁰ molec. cm−3 s (Table 1). Depending on the experiment, 169 to 253 ions were detected in the particulate phase (Table S1). The ions with a contribution higher than 0.14 % to the total SOA explained 92 %–95 % of the SOA (Table S1). Table S5 lists a sub-group of the detected ions corresponding to a SOA contribution higher than 0.14 %, representing 79 %–86 % of the overall measured particle-phase concentration. Even though SOA included ion fragments with values up to 300, the fraction between 200 and 300 was very low (below 2 %) (Table S4). Table 4 provides the most significant SOA ion fragments and their tentative assignment based on works in the literature (Forstner et al., 1997; Smith et al., 1998, 1999; Jang and Kamens, 2001; Cocker et al., 2001; Hamilton et al., 2003, 2005; Zhao et al., 2005; Huang et al., 2006; Wang et al., 2006; Sato et al., 2007, 2012; Healy et al., 2008; Wyche et al., 2009; Müller et al., 2012; Borrás and Tortajada-Genaro, 2012; Wu et al., 2014; White et al., 2014; Ma et al., 2018). The ion fragments in Table 4 represent 35 %–65 % of the SOA concentration fraction. Tables 4 and S5 do not account for any fragmentation in the concentration calculations unless it is mentioned.
Table 4Measured accurate ; elemental composition of the detected ions; and tentative assignment of the most important SOA products produced from cold urban, hot urban and motorway Artemis cycle emissions and identified using CHARON. Assignment was supported by studies in the literature of individual aromatic compounds (Forstner et al., 1997; Smith et al., 1998, 1999; Jang and Kamens, 2001; Cocker et al., 2001; Hamilton et al., 2003, 2005; Zhao et al., 2005; Huang et al., 2006; Wang et al., 2006; Sato et al., 2007, 2012; Healy et al., 2008; Wyche et al., 2009; Müller et al., 2012; Borrás and Tortajada-Genaro, 2012; White et al., 2014; Wu et al., 2014; Ma et al., 2018; Schwantes et al., 2017).
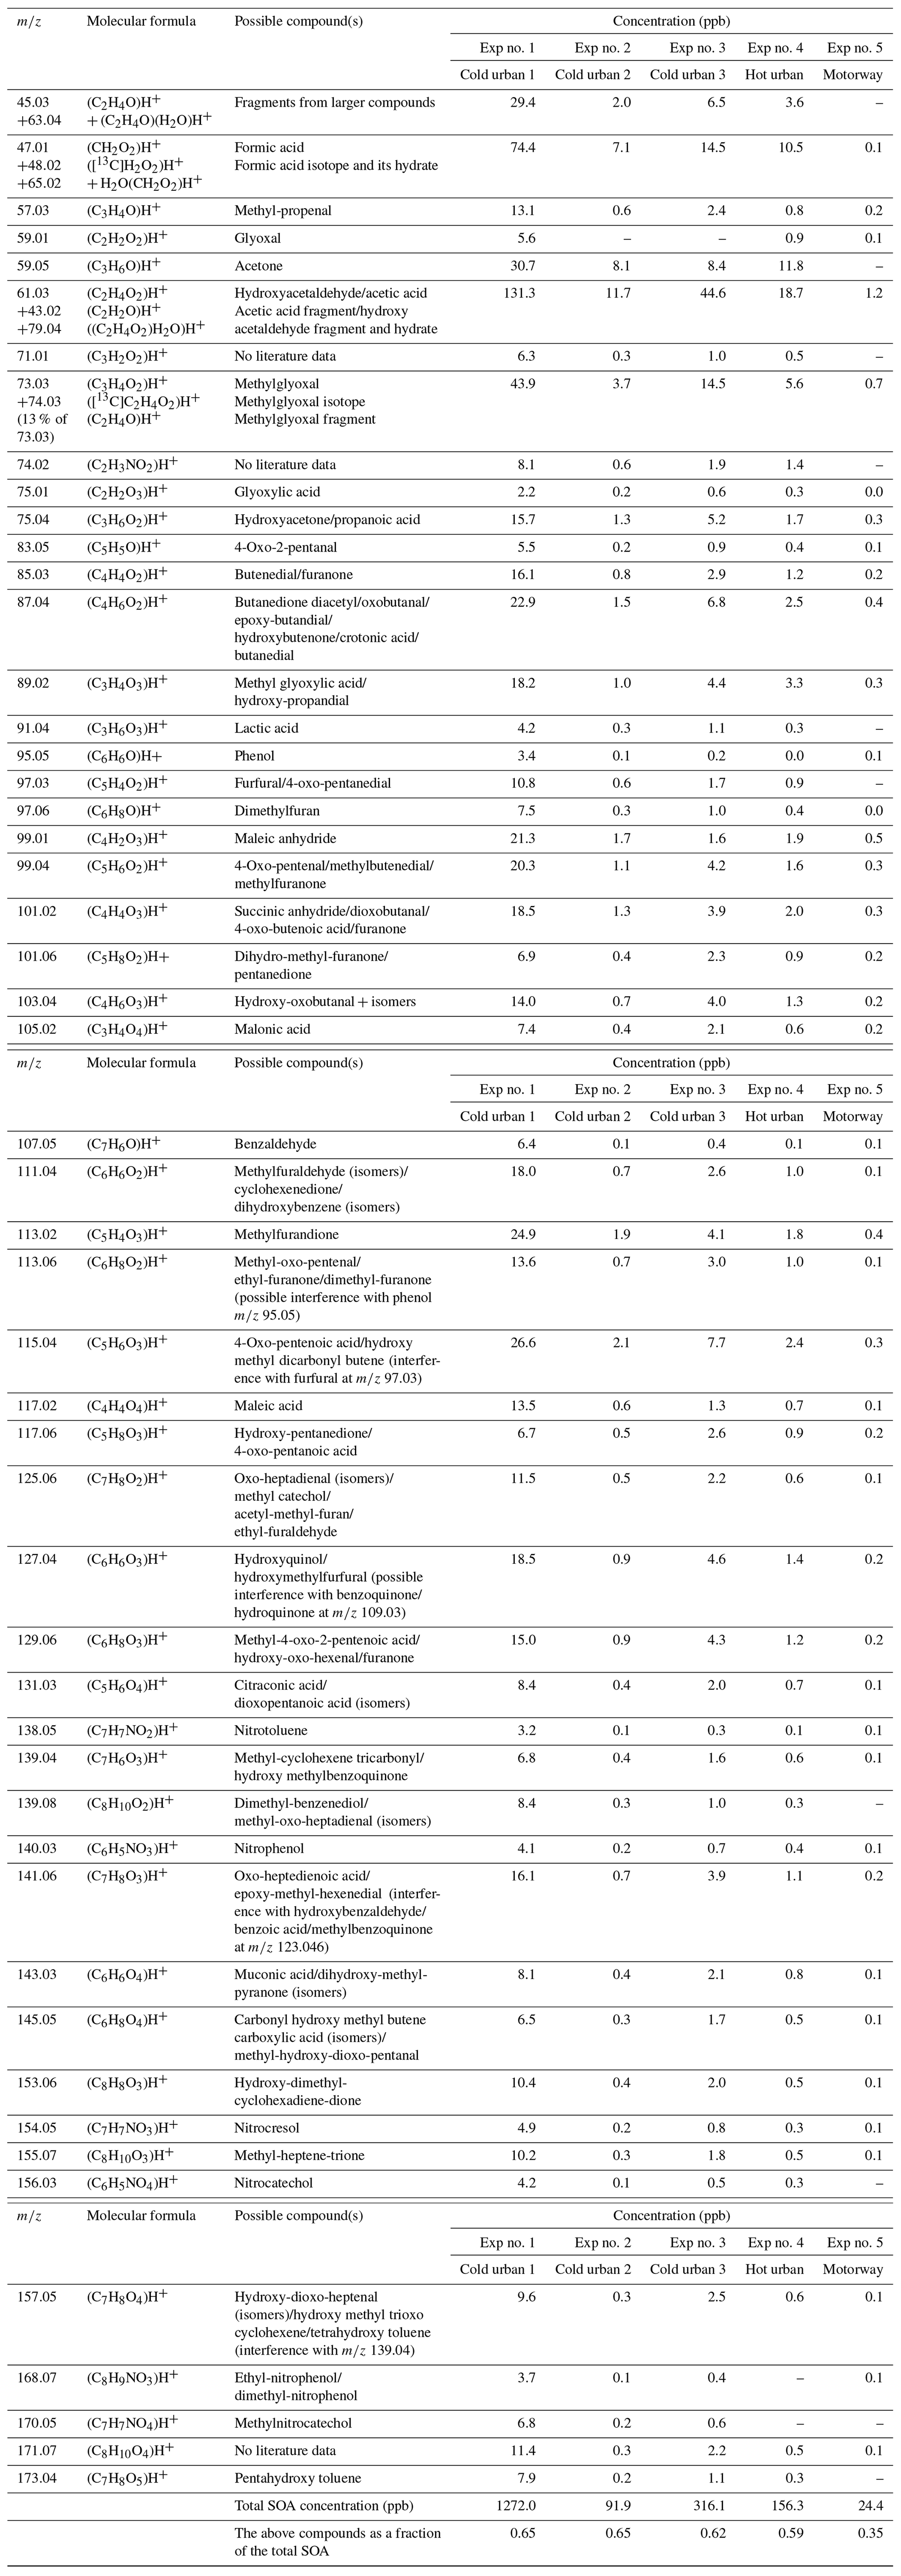
The O and C distributions of the SOA are shown in Figs. 1c, 2c and 3c. The SOA products were distributed between C1 and C14, having up to six atoms of oxygen. 47.01 (CH2O2)H+ formic acid along with 31.02 (CH2O)H+ formaldehyde and possibly fragments is practically the whole fraction of the C1 species. The C2 products contained 43.02 C2H3O+ and 45.03 (C2H4O)H+, two common fragments of larger compounds, and 61.03 (C2H4O2)H+ hydroxyacetaldehyde/acetic acid ion fragment. 73.03 (C3H4O2)H+ was tentatively assigned to methylglyoxal and had an appreciable contribution of 2.9 %–4.6 % of the SOA formed (together with its fragment at 45.03 (C2H4O)H+ and its C13 isotope at 74.03). Other important values were 85.03 (C4H4O2)H+, e.g., butenedial (and isomers)/furan-2-one (and isomers); 87.04 (C4H6O2)H+, e.g., 3-oxobutanal; 89.02 (C3H4O3)H+, e.g., methyl glyoxylic acid; 97.03 (C5H4O2)H+, e.g., furfural; 99.01 (C4H2O3)H+, e.g., maleic anhydride; 99.04 (C5H6O2)H+, e.g., 4-oxo-2-pentenal (and isomers); 101.02 (C4H4O3)H+, e.g., succinic anhydride; 103.04 (C4H6O3)H+, e.g., hydroxy-oxobutanal (and isomers); 111.04 (C6H6O2)H+, e.g., methylfuraldehyde (and isomers); 113.02 (C5H4O3)H+, e.g., methylfurandione; 115.04 (C5H6O3)H+, e.g., 4-oxo-2-pentenoic acid (and isomers); 117.02 (C4H4O4)H+, e.g., maleic acid; 127.04 (C6H6O3)H+, e.g., 4-(hydroxymethyl)-2-furaldehyde; 129.06 (C6H8O3)H+, e.g., methyl-4-oxo-2-pentenoic acid; 141.06 (C7H8O3)H+, e.g., oxo-heptedienoic acid/epoxy-methyl-hexenedial; 153.06 (C8H8O3)H+, e.g., hydroxy-dimethyl-cyclohexadiene-dione; and 155.07 (C8H10O3)H+, e.g., methyl-heptene-trione (Forstner et al., 1997; Smith et al., 1998, 1999; Jang and Kamens, 2001; Cocker et al., 2001; Hamilton et al., 2003, 2005; Zhao et al., 2005; Huang et al., 2006; Wang et al., 2006; Sato et al., 2007, 2012; Healy et al., 2008; Wyche et al., 2009; Müller et al., 2012; Borrás and Tortajada-Genaro, 2012; Wu et al., 2014; White et al., 2014; Ma et al., 2018). Most of the detected ions identified in the particle phase in this work have been reported in the study of Lannuque et al. (2023), where CHARON was used for the identification of the toluene photo-oxidation SOA.
Generally, the SOA formed by the three different driving cycles had similar O and C distributions (Figs. 1c, 2c and 3c) albeit with some minor differences. For example, SOA from cold urban and hot urban cycle emissions had a higher fraction of C1 and C2 compounds with one to three atoms of oxygen in comparison to the SOA derived by motorway cycle emissions. Similarly to the secondary gas-phase products, the differences in the SOA distributions are probably due to the differences in the primary gas-phase emissions among the various cycles.
Organonitrates and organonitrites (ON) were identified in the SOA products. Their contribution was 6 %–7 % of the total SOA concentration (Table S4). The most important ON ion fragments were detected at the values of 60.04 (C2H5NO)H+, 74.02 (C2H4NO2)H+, 90.02 (C2H3NO3)H+, 112.04 (C5H5NO2)H+, 138.05 (C7H7NO2)H+ (nitrotoluene), 140.03 (C6H5NO3)H+ (nitrophenol), 154.05 (C7H7NO3)H+ (nitrocresol), 156.03 (C6H5NO4)H+ (nitrocatechol), 168.07 (C8H9NO3)H+ (ethyl-nitrophenol/ dimethyl-nitrophenol) and 170.05 (C7H7NO4)H+ (methylnitrocatechol) (Tables 4 and S5 and Fig. S1). Some of the above ON compounds (e.g., nitrotoluene, nitrophenol, nitrocresol) have been detected in the particulate phase during the photo-oxidation of benzene, toluene, and xylenes and trimethylbenzenes (e.g., Forstner et al., 1997; Jang and Kamens, 2001; Hamilton et al., 2005; Borrás and Tortajada-Genaro, 2012; Sato et al., 2012; Schwantes et al., 2017; Lannuque et al., 2023). The majority of the nitrogen organic compounds contained one atom of N and ranged between C1 and C14 for experiment 1 (cold urban) and between C1–C12 for the other cycles (Fig. S2). They contained one to five atoms of oxygen (Fig. S3). This non-negligible quantity of nitrogen organic compounds is probably due to the combination of the elevated RH and high NOx concentrations (90–2000 ppb) in our experiments. Lim et al. (2016) found that a high fraction of oxygenated organonitrates can be formed in the presence of NOx and high RH (i.e., wet aerosols) during glyoxal photo-oxidation. In another study Jiang et al. (2019) found that the organic nitrate compounds signal in the SOA increased with the RH during furan photo-oxidation.
Using Eq. (4) and the HR-ToF-AMS data, we calculated the organic nitrate fraction of the total nitrate mass concentration for the five experiments for the period that the CHARON sample was taken. This fraction ranged from 0.12 to 0.20 of the total nitrate concentration (Table S4). For experiment no. 5 (photo-oxidation of motorway emissions) we applied Eq. (4) throughout the whole experiment, since there were no clogging issues at the HR-ToF-AMS inlet. The time series of inorganic and organic nitrate concentration are depicted in Fig. S4, while the organic nitrate fraction is shown in Fig. S5. The organic nitrate fraction remains stable during the experiment with an average value of 0.19 ± 0.02.
We investigated the ratio of cations to anions (Table S4) of inorganics, taking into account the organic nitrate contribution for the different experiments for the period that the CHARON sample was taken. For experiment nos. 2 and 3 (both cold urban emissions) the particles were practically neutralized. For experiment nos. 1 and 4, the inorganic particles were acid, indicating a deficit of NH or excess of NO. This could be explained by the uptake of HNO3 in the particulate phase due to the high RH, which turned the particles into a rather liquid phase. These two experiments indeed had the highest nitrate concentrations (110 and 131 µg m−3). Melhman and Warneck (1995) noticed a deficit of cations in ambient measurements, when the nitrate levels were relatively high (higher than 11 µg m−3). They attributed this behavior to HNO3 absorption into the particulate phase which had a high liquid water content (RH > 80 %).
In experiment no. 5, the particles showed an excess of NH. The ammonium fraction that is not neutralized by inorganic anions could be explained by the presence of organic salts of ammonium using the equation below:
where xorganoammonium is the organic ammonium fraction (i.e., the organic ammonium mass concentration over the total ammonium mass concentration), and are the ammonium and nitrate mass concentrations respectively as measured by the AMS. Applying Eq. (5) to experiment no. 5 (photo-oxidation of motorway emissions) for the period that the CHARON sample was taken, we found that a fraction of 13 % of the ammonium was in the form of organic ammonium salt (Table S4). Using Eq. (5) throughout the whole of experiment no. 5, we estimated the organic and inorganic ammonium mass concentration (Fig. S4) and the organic ammonium fraction (Fig. S5) as a function of the time. After the concentration of the secondary species reached its maximum, the ammonium organic fraction increased with time, indicating that the fraction of organic ammonium salt was becoming gradually important. The formation of organic ammonium salts enhances the deprotonation of small acids, reducing their volatility and enhancing their uptake into the particle phase (Paciga et al., 2014; Wang et al., 2018; Wang and Laskin, 2014). This behavior may explain the presence of small acids like formic acid ( 47.01 (CH2O2)H+) and acetic acid ( 61.03 (C2H4O2)H+) in the particle phase. Recently Lv et al. (2022) showed that at high RH (> 80 %), NH3 promotes the partitioning of formic and acetic acid into the particulate phase through the formation of NH4NO3 and neutralization with small organic acids.
4.3 Gas-to-particle phase partitioning
The NH4NO3 particles produced grew to large particles and eventually tended to clog the AMS orifice over the course of the experiments (Fig. S6). Thus, the saturation concentration calculation has been conducted for periods with particles having aerodynamic diameters below 500–600 nm, where the AMS orifice was unblocked. Of the SOA, 1 %–10 % was found only in the particle phase. For the gas-to-particle phase partitioning of the SOA, we used 69 ions (Table S6) that correspond to compounds identified in previous studies (Forstner et al., 1997; Smith et al., 1998, 1999; Jang and Kamens, 2001; Cocker et al., 2001; Hamilton et al., 2003; 2005; Zhao et al., 2005; Huang et al., 2006; Wang et al., 2006; Sato et al., 2007, 2012; Healy et al., 2008; Wyche et al., 2009; Müller et al., 2012; Borrás and Tortajada-Genaro, 2012; Wu et al., 2014; White et al., 2014; Ma et al., 2018). The above 69 ions represent 41 %–54 % of the SOA concentration and 48 %–55 % of the secondary gas-phase concentration. Assuming that the fragmentation of each compound does not differ substantially between the gas and particle phase (i.e., PTR-ToF-MS and CHARON mode), any fragmentation should not introduce significant error into the log C∗ calculation. The uncertainty in log C∗ practically depends on the PTR-ToF-MS and HR-ToF-AMS measurement uncertainties.
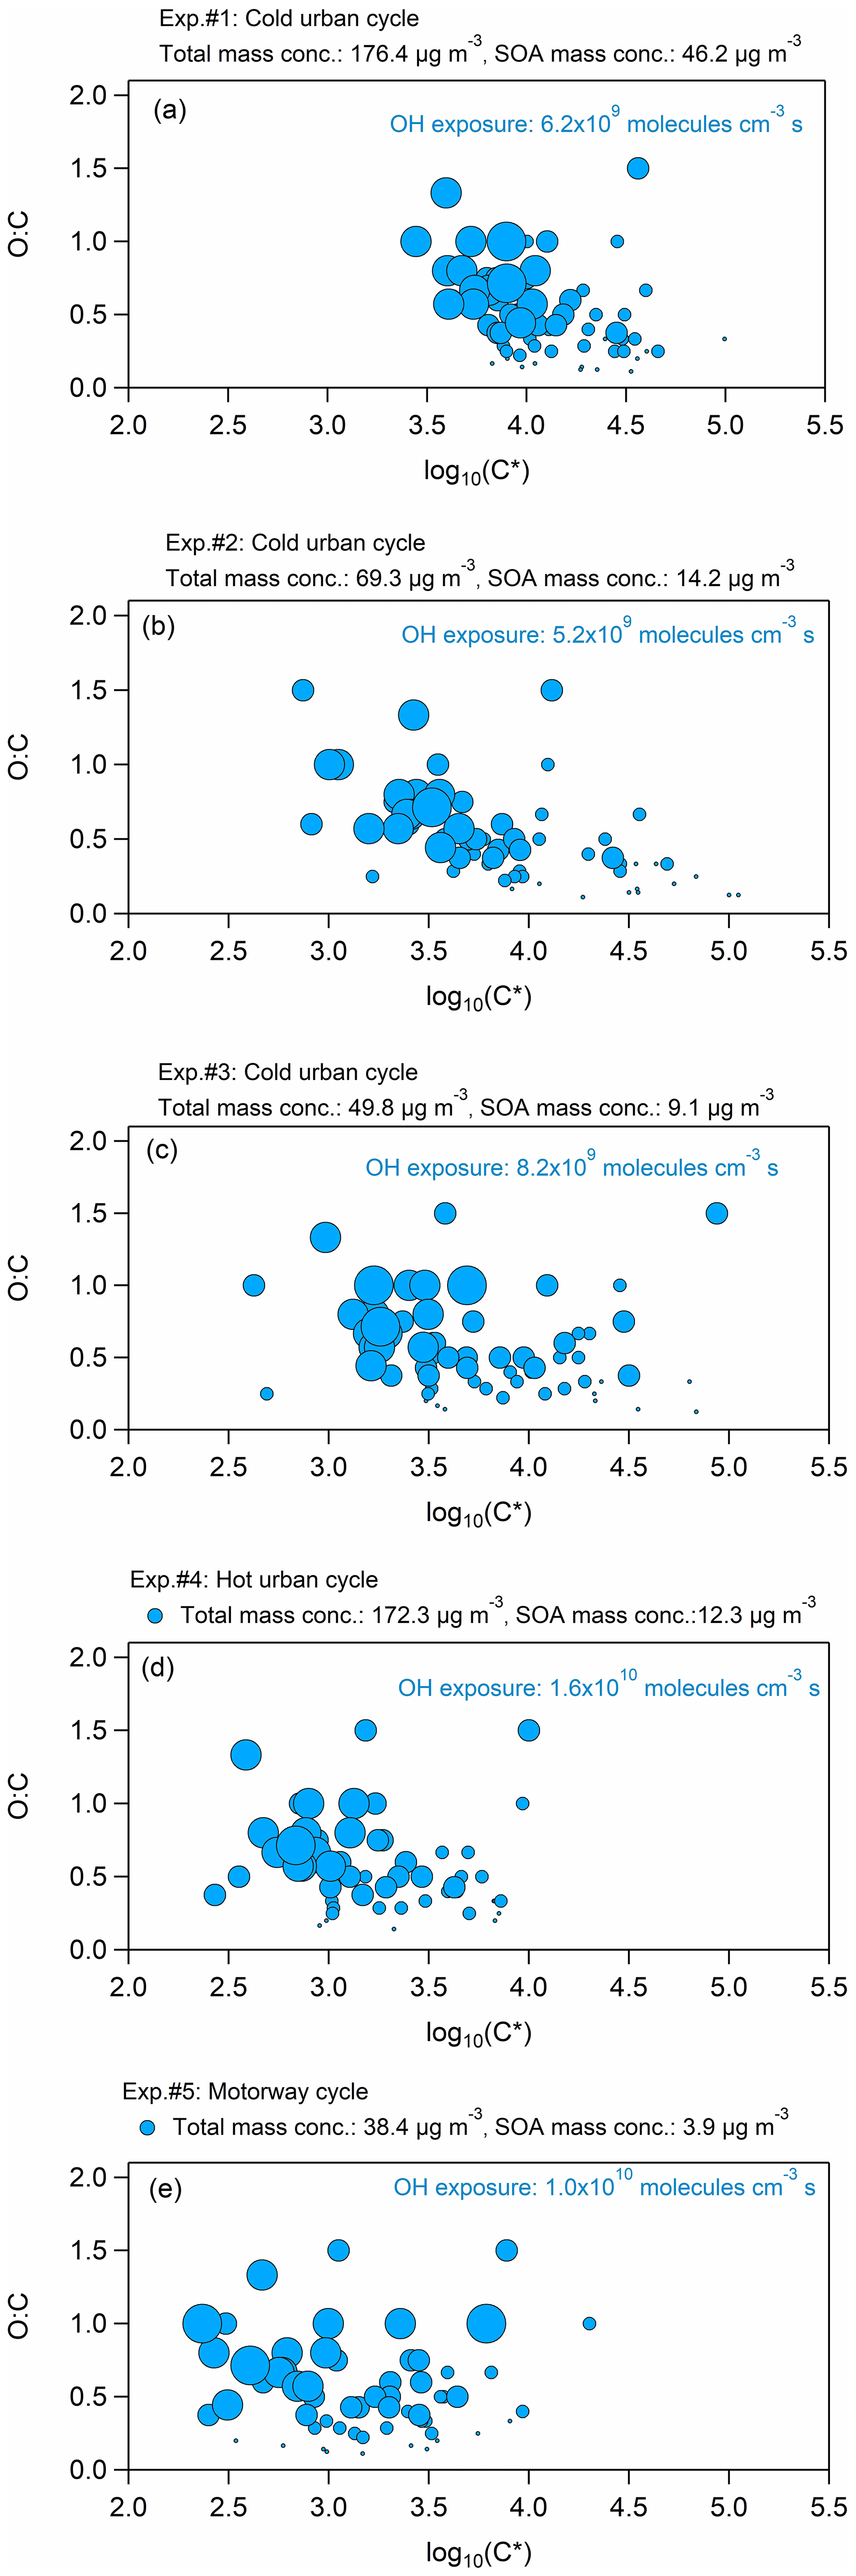
Figure 5Volatility distribution in terms of the O : C ratio versus log C∗ for the five experiments with the different cycle exhausts. The different size of the circles represents the atoms of oxygen in the compound: the smaller size corresponds to one atom of O, while the largest size to five atoms of O.
Figure 5 illustrates the volatility distribution in terms of the O : C ratio versus log C∗ for the five experiments, while Table S6 summarizes the log C∗ of each ion for all five experiments. The SOA products were distributed between log C∗ 2 and 5, and they were found mainly in the IVOC regime of the volatility basis set framework (Donahue et al., 2012). The volatility of the species measured during experiment no. 1 (cold urban emissions, Fig. 5a) was centered at , and it was the highest among all experiments, most probably due to the higher total mass concentration (approximately 176 µg m−3) formed. The volatility distributions of experiment nos. 2 and 3 (cold urban emissions, Fig. 5b and c) were both centered at , and they were alike, probably because the total mass concentrations were similar (50–69 µg m−3); they were slightly lower compared to the volatility of experiment no. 1 but wider, likely because of the lower SOA mass concentration. During experiment nos. 4 and 5 (hot urban and motorway cycle emissions, Fig. 5d and e), the SOA formed exhibited the lowest volatility distribution (average ), which was again wide, ranging between log C∗ 2.5 and 4. This behavior could be explained by the relatively low total mass concentration (38 µg m−3 in experiment no. 5). However, the total mass concentration in experiment no. 4 was similar to experiment no. 1, while the SOA mass concentration was close to those concentrations of experiment nos. 2 and 3, indicating that any differences in SOA and secondary gas-phase distributions have a non-negligible effect on the volatility distribution.
In order to compare our volatility results with those of previous studies that implemented CHARON, we used the average volatility distribution of experiment nos. 3 and 5, since they had SOA mass concentration closer to the ambient OA levels. Compared to the toluene photo-oxidation SOA volatility distribution reported by Lannuque et al. (2023), we found that the SOA products in our work had a similar average O : C ratio (0.62) with respect to toluene SOA (0.55); however they were 1 order of magnitude more volatile (Fig. 6). This could be explained by the lower SOA and inorganic seed mass concentrations in the toluene SOA study (4.1 ± 2.7 and 6.6 ± 2.7 µg m−3 respectively), which probably shifted the SOA products to lower volatility. According to the gas–particle partitioning model, lower SOA and TS mass concentrations allow a larger fraction of the higher-volatility compounds to remain in the gas phase. Compared to the biogenic SOA volatility distribution by Gkatzelis et al. (2018), the chemical species found in the gasoline emissions SOA were approximately 1–1.5 orders of magnitude more volatile, and at the same time they had a higher average O : C ratio (0.62) compared to the biogenic SOA (0.32) (Fig. 6). This can be explained by the different chemical composition of the two types of SOA rather than the SOA levels (the biogenic SOA concentration ranged between 50–130 µg m−3 without any inorganic seeds present, and thus the total particle concentration was higher compared to ours). Biogenic SOA contains a high fraction of acids, such as nor-pinonic acid, pinonic acid, 2,2-dimethylcyclobutane-1,3-dicarboxylic acid, pinic acid, pinalic-3-acid and 4-hydroxypinalic-3-acid (Jang and Kamens, 1999; Jaoui and Kamens, 2002), which generally have low volatility, while aromatic SOA was characterized by a higher fraction of aldehydes, ketones and some acids as described earlier (Tables 4 and S5).
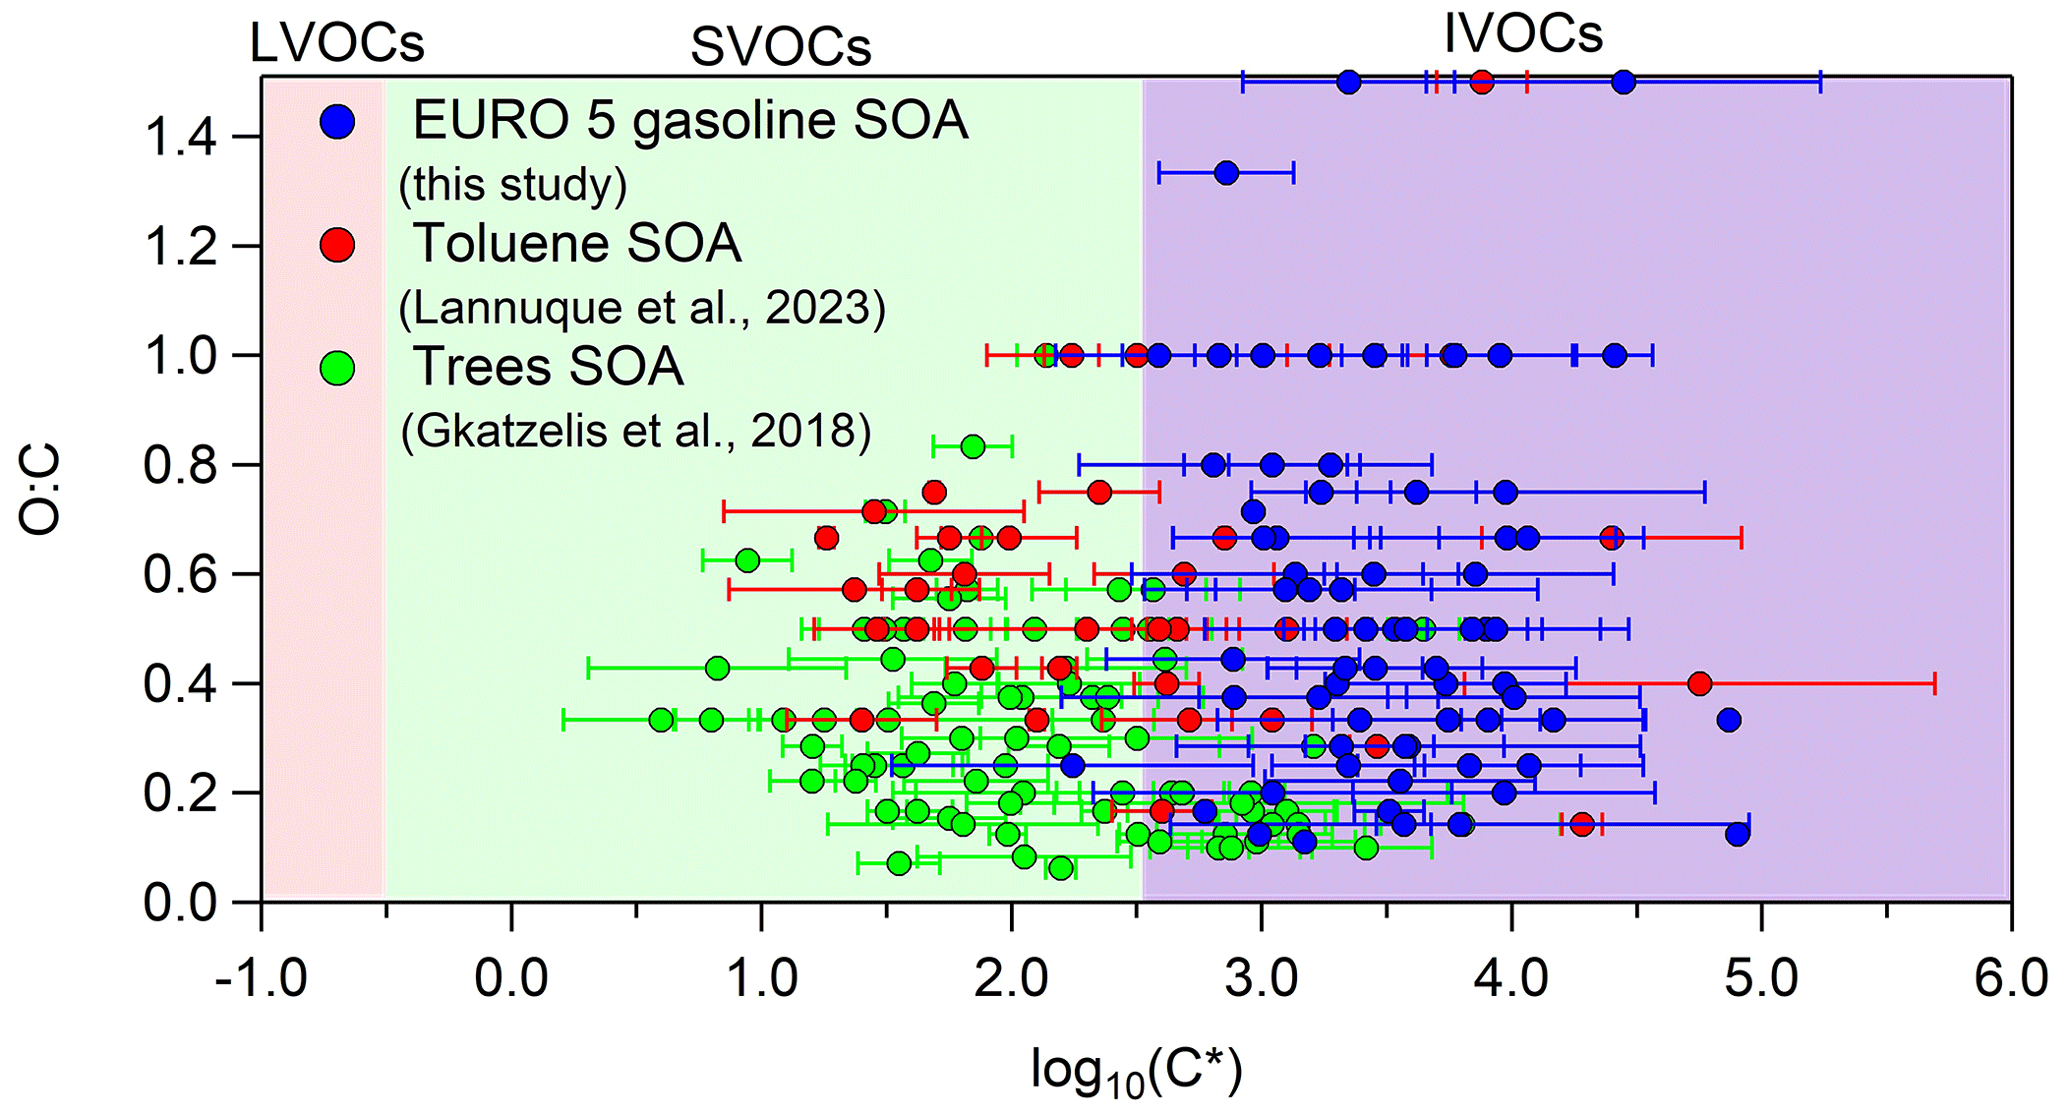
Figure 6Average volatility using experiment no. 3 (cold urban cycle) and experiment no. 5 (motorway cycle) compared to the average volatility found for toluene photo-oxidation SOA (Lannuque et al., 2023) and aged SOA derived from tree emissions ozonolysis (mixture of 42 % δ3-carene, 38 % α-pinene, 5 % β-pinene, 4 % myrcene, 3 % terpinolene and 8 % other monoterpenes at 30 ± 5 °C) (Gkatzelis et al., 2018). The error bars on the x axis correspond to the 1 standard deviation of the average experimental results.
We further selected 11 out of the 69 “parent values”, and we computed a comparison to the theoretical log C∗ (Fig. 7). Aldehyde functional groups such as glyoxal, methylglyoxal and crotonaldehyde showed lower experimental log C∗ values in comparison to the theoretical ones, implying that a larger fraction of these compounds partition in the particle phase than the theoretical models predict. All the other compounds had higher experimental log C∗ with respect to the theoretical one, suggesting that a higher-than-expected fraction of these compounds reside in the gas phase.
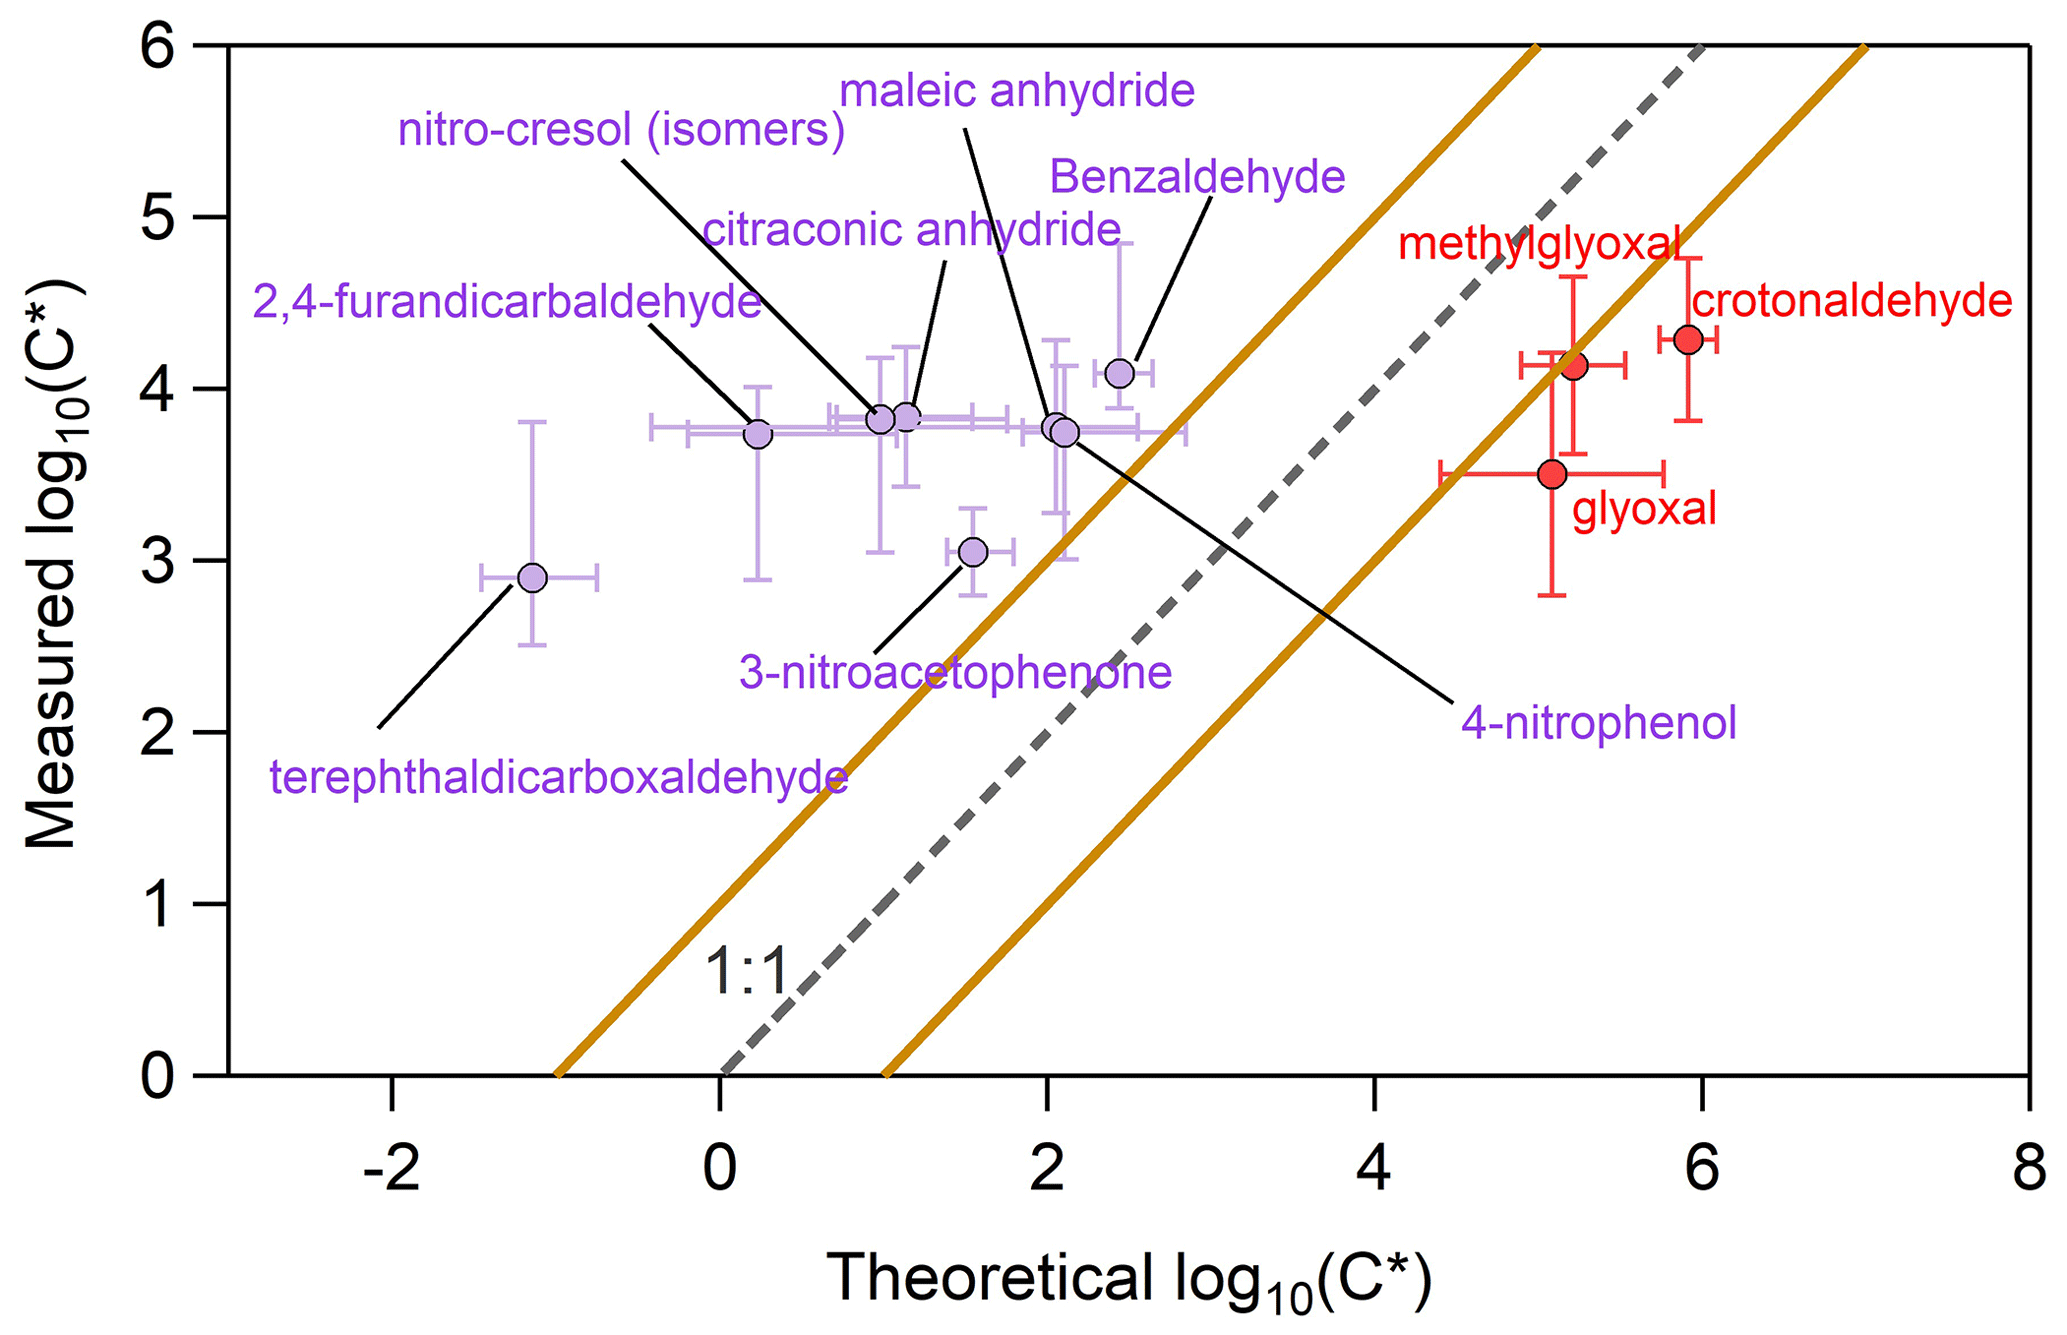
Figure 7Experimental and theoretical values of log C∗ for 11 selected compounds. Several aldehydes are indicated with red cycles, while purple cycles correspond to all the other compounds. The error bars on the x axis correspond to the 1 standard deviation of the average theoretical values calculated from seven approaches, while the error bars on the y axis represent the 1 standard deviation of the average measured values. The dashed grey line corresponds to the 1 : 1 line, while the brown lines denote a deviation of log C∗ ± 1 from the 1 : 1 line.
A tentative explanation for this behavior is the water content in the particles. Experiments were carried out at ∼ 50 % RH; during SOA formation, an important amount of ammonium nitrate was formed, which is well known to take up water even at low RH (Seinfeld and Pandis, 2016). Wet particles may control the partitioning between the gas and particle phase as water facilitates the transfer from the gas to particle phase of water-soluble species such as glyoxal, crotonaldehyde and methylglyoxal, which are quite water soluble with solubilities equal to or higher than 100 g L−1. Jang and Kamens (2001) reported that products from toluene photo-oxidation partitioned to the condensed phase even though theoretical estimations predicted that they should be in the gas phase. The same authors found that the experimental partitioning values of aldehydes were much higher than the predicted ones. One way to explain how relatively high vapor pressure compounds ended up in the aerosol phase is via heterogeneous reaction in the particle phase, e.g., hydration, hemiacetal/ketal reactions or polymerization, which forms low-vapor-pressure products. Diols are known to have lower vapor pressure than the parent aldehydes. Another explanation is the oligomerization of small carbonyls and dicarbonyls, such as methylglyoxal and glyoxal in the particle phase, that may take place (Kalberer et al., 2004; Altieri et al., 2008; Healy et al., 2008). These oligomers would fragment in the drift tube, and they would be detected as monomers. Furthermore, the high amount of ammonium in the particle phase could catalyze heterogeneous reactions of aldehydes (e.g., Noziere et al., 2009) or enhance their partitioning in the particulate phase (Kampf et al., 2013; Ortiz-Montalvo et al., 2014).
These volatile compounds have been found in the condensed phase in many studies. For example, Volkamer et al. (2009) observed glyoxal into the particle phase in the SOA formed at 20 %–60 % RH, while Galloway et al. (2009) found that ammonium sulfate particles take up glyoxal at 40 %–60 % RH. Methylglyoxal has been identified in both the gas and the particle phase of the secondary products of anthropogenic and biogenic precursors, for example in the SOA products of TMB, limonene and isoprene in both the field and the laboratory (Healy et al., 2008; Rossignol et al., 2012, 2016). Figure 8 compares the measured log C∗ from the above-cited studies to the average log C∗ of methylglyoxal found in this work. Even though all these studies were conducted at relatively high RH (50 %–80 %) and at similar temperatures (20–24 °C), the difference between the measured methylglyoxal log C∗ can be of 3.5 orders of magnitude. The major reason for this wide range is probably the total aerosol concentration in each system as for the isoprene and TMB SOA experiments it was 200–450 and 100–350 µg m−3 respectively, while for the limonene and the biogenic SOA studies, it was considerably lower (45 and 17 µg m−3 respectively). In our case the total aerosol concentration ranged between 40 and 180 µg m−3 (103 ± 69 µg m−3), but the methylglyoxal log C∗ was somehow higher and more similar to the isoprene and TMB SOA systems. One explanation for this behavior could be the oligomerization process. Kenseth et al. (2018) proposed that the synergistic O3 and OH oxidation pathway during β-pinene ozonolysis leads to the formation of oligomers, while the OH photo-oxidation of β-pinene does not. Thus, methylglyoxal amount in the particle phase could be enhanced via oligomerization processes if the formation mechanism is via ozonolysis.
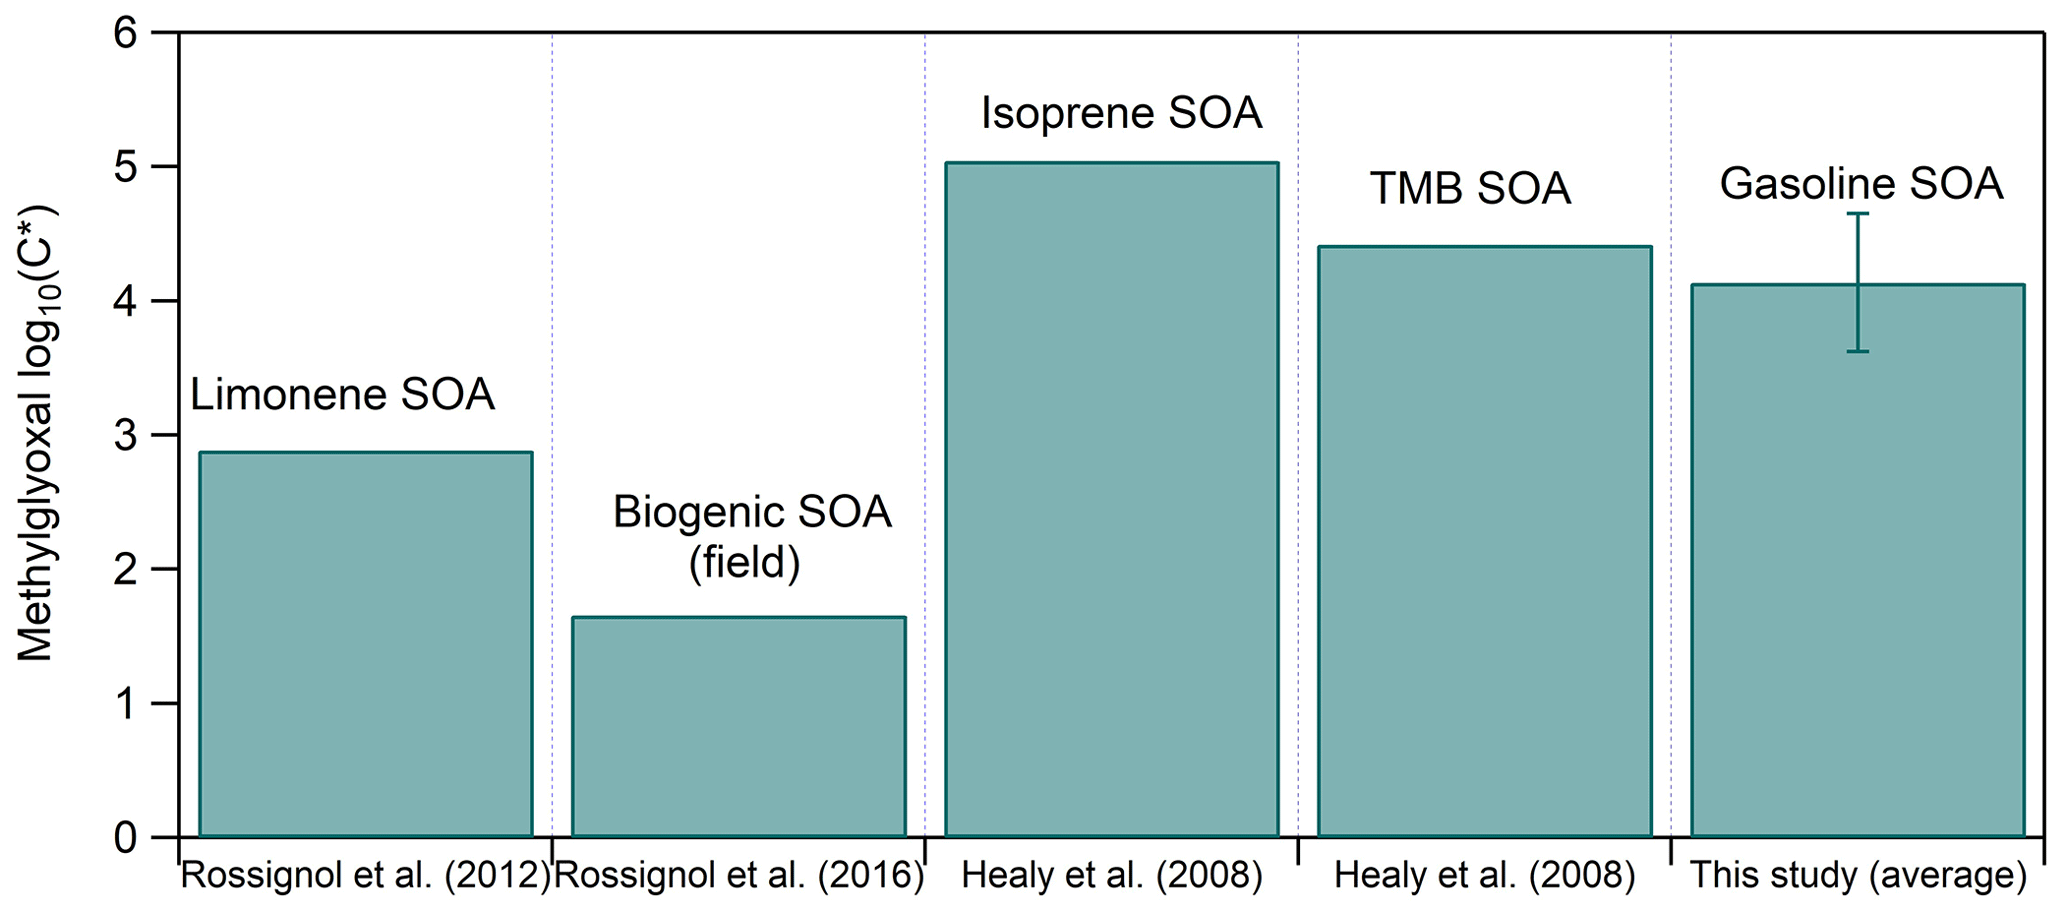
Figure 8Measured saturation concentration (in terms of log C∗) of methylglyoxal for different studies and systems.
All the rest of the selected compounds – 2,4-furandicarbaldehyde, nitrocresol (and isomers), maleic anhydride, citraconic anhydride, benzaldehyde, 4-nitrophenol, 3-nitroacetophenone and terephthaldicarboxaldehyde – presented reduced water solubility (0.1–16 g L−1). The presence of water in the SOA formed could hinder the transfer of the non-soluble compounds towards the wet particle phase. On the other hand, it should be mentioned that the theoretical estimations are calculated (a) for individual compounds, which means that no interactions with other species are taken into account (activity coefficients were assumed to be equal to 1); (b) without taking into consideration the water content or humidity; and (c) without considering the hygroscopicity of the compound. This suggests that the theoretical estimations may not always simulate the real ambient conditions.
These findings suggest that there are several important factors that determine the gas-to-particle phase partitioning such as humidity, excess ammonia, water content, the hygroscopic nature of the formed compounds, the heterogeneous catalysis reactions of particulate ammonium, and the oligomerization and other reactions in the particle phase. This is in general agreement with the results of Lannuque et al. (2023), which concluded that the partitioning between the gas and particle phase is a function of the organic and the aqueous phase, as well as the interactions between compounds in the particulate phase. Thus, these factors should be integrated in theoretical simulations.
4.4 SOA production factors
We calculated the production factors (PFs) of the SOA formed (in µg km−1) (Table 1) for each cycle using the equation below:
where SOA is the mass concentration of the SOA, DR is the total dilution ratio after the vehicle exhaust, V is the volume of the chamber (8 m3) and D is the distance of the injected cycle (4.51 km for a complete Artemis urban cycle, 1.53 km for the first 5 min of an Artemis urban cycle and 23.8 km for an Artemis motorway cycle). It must be mentioned that the above calculations do not include any wall-loss corrections. A whole cold urban cycle produces 2.1 × 10³ µg km−1, while a hot urban cycle results in almost half the concentration (1 × 10³ µg km−1) and a motorway cycle produces an SOA concentration that is 10 times lower (0.2 × 10³ µg km−1) (Table 1). The above demonstrates that the SOA produced in the cities, especially in the morning and in the afternoon when people use their vehicles starting with a cold engine to drive to their workplaces and back, can be 10 times higher compared to that produced by driving to a highway. Thus, the rural or suburban areas located near the highways are less affected by the SOA derived from gasoline GDI vehicles.
In this work we studied for the first time the SOA products of gasoline vehicle emissions with the recently developed CHARON–PTR-ToF-MS system. The emissions were produced by a Euro 5 gasoline vehicle, which was tested for cold urban, hot urban and motorway Artemis cycles. A large part of the fresh emissions as seen by the PTR-ToF-MS was composed of light aromatic compounds (C6–C10), while the secondary organic gas-phase products were distributed between C1 and C9 having one to four atoms of oxygen, with most of them being small oxygenated C1–C3 species. The SOA was distributed between C1 and C14 with one to six atoms of oxygen. Interestingly, SOA had a non-negligible quantity of ON compounds (6 %–7 %) as estimated by CHARON. Based on HR-ToF-AMS analysis the fraction of nitrate linked to organonitrates was 0.12–0.20, while ammonium linked to organoammonium was estimated only during the motorway cycle experiment with a maximum fraction of 0.19.
The volatility distributions generally depended on the aerosol levels formed. Higher total mass concentrations (176 µg m−3, of which 46 µg m−3 was SOA) led to more volatile SOA () with a relatively narrow volatility distribution. For total mass concentration (50–69 µg m−3 containing 9–14 µg m−3 of SOA), the volatility was wider and was centered at , while for lower total mass concentrations (38 µg m−3 with 3.9 µg m−3 SOA), the products were less volatile with an average .
Using the molecular formula of the “parent” compounds, we calculated the saturation concentration of individual species. We found that low-water-soluble compounds and highly water-soluble compounds declined from the theoretical estimations by 1–3 orders of magnitude. We conclude that the gas-to-particle partitioning is affected not only by the concentration of the aerosol formed and the temperature, but also by other factors such as the RH level, the existence of water in the OA mixture, the hygroscopicity of the compounds formed and possible reactions in the particulate phase (e.g., oligomerization and/or heterogeneous catalysis by particulate ammonium).
The SOA PF formed during a cold urban cycle is 2 and 10 times higher in comparison to the hot urban and motorway cycles respectively. Thus, this work underlines the fact that SOA formation from gasoline vehicle emissions is particularly critical for air quality in the cities.
All data from this study are available from the authors upon request.
The supplement related to this article is available online at: https://doi.org/10.5194/acp-24-2705-2024-supplement.
BD'A, EK and KS designed the research. BTR, YL and BV contributed to the experimental setup and the experimental procedure. EK and BM performed the experiments. EK analyzed and interpreted the data and drafted the article. EK, BM, BTR, YL, BV, KS and BD'A revised the article. BD'A, YL and KS were responsible for funding acquisition.
The contact author has declared that none of the authors has any competing interests.
Publisher’s note: Copernicus Publications remains neutral with regard to jurisdictional claims made in the text, published maps, institutional affiliations, or any other geographical representation in this paper. While Copernicus Publications makes every effort to include appropriate place names, the final responsibility lies with the authors.
The authors acknowledge the MASSALYA instrumental platform (Aix-Marseille Université, http://lce.univ-amu.fr, last access: 20 December 2023) for technical support and instrumentation calibration; Patrick Tassel and Pascal Perret for technical support on the chassis dynamometer experiments at AME-EASE, Univ Gustave Eiffel, Lyon; and Amélie Bertrand for the development of the PeTeR v3.5 toolkit.
This research has been supported by the Agence de la transition écologique (MAESTRO (grant no. 1766C0001) and MAESTRO-EU6 (grant no. 1866C0001)) and the Agence Nationale de la Recherche (POLEMICS (grant no. ANR-18-CE22-0011)).
This paper was edited by Sergey A. Nizkorodov and reviewed by two anonymous referees.
Altieri, K. E., Seitzinger, S. P., Carlton, A. G., Turpin, B. J., Klein, G. C., and Marshall, A. G.: Oligomers formed through in-cloud methylglyoxal reactions: Chemical composition, properties, and mechanisms investigated by ultra-high resolution FT-ICR mass spectrometry, Atmos. Environ., 42, 1476–1490, 2008.
Anicich, V. G.: An index of the literature for bimolecular gas phase cation-molecule reaction kinetics, JPL Publication, 3–19, 356–390, Document ID 2006002936820060029368, 2003.
Argyropoulos, G. Samara, C., Voutsa, D., Kouras, A., Manoli, E., Voliotis, A., Tsakis, A., Chasapidis, L., Konstandopoulos, A., and Eleftheriadis, K.: Concentration levels and source apportionment of ultrafine particles in road microenvironments, Atmos. Environ., 129, 68–78, 2016.
Baasandorj, M., Millet, D. B., Hu, L., Mitroo, D., and Williams, B. J.: Measuring acetic and formic acid by proton-transfer-reaction mass spectrometry: sensitivity, humidity dependence, and quantifying interferences, Atmos. Meas. Tech., 8, 1303–1321, https://doi.org/10.5194/amt-8-1303-2015, 2015.
Bahreini, R., Middlebrook, A. M., de Gouw, J. A., Warneke, C., Trainer, M., Brock, C. A., Stark, H., Brown, S. S., Dube, W. P., Gilman, J. B., Hall, K., Holloway, J. S., Kuster, W. C., Perring, A. E., Prévôt, A. S. H., Schwarz, J. P., Spackman, J. R., Szidat, S., Wagner, N. L., Weber, R. J., Zotter, P., and Parrish D. D.: Gasoline emissions dominate over diesel in formation of secondary organic aerosol mass, Geophys. Res. Lett., 39, L06805, https://doi.org/10.1029/2011GL050718, 2012.
Borbon, A., Gilman, J. B., Kuster, W. C., Grand, N., Chevaillier, S., Colomb, A., Dolgorouky, C., Gros, V., Lopez, M., Sarda-Esteve, R., Holloway, J., Stutz, J., Petetin, H., McKeen, S., Beekmann, M., Warneke, C., Parrish, D. D., and de Gouw J. A.: Emission ratios of anthropogenic volatile organic compounds in northern mid-latitude megacities: Observations versus emission inventories in Los Angeles and Paris, J. Geophys. Res.-Atmos., 118, 2041–2057, https://doi.org/10.1002/jgrd.50059, 2013.
Borrás, E. and Tortajada-Genaro, L. A.: Secondary organic aerosol formation from the photo-oxidation of benzene, Atmos. Environ. 47, 154–163, 2012.
Buhr, K., van Ruth, S., and Delahunty, C.: Analysis of volatile flavour compounds by proton transfer reaction-mass spectrometry: Fragmentation patterns and discrimination between isobaric and isomeric compounds, Int. J. Mass Spec., 221, 1–7, 2002.
Calvert, J. G., Atkinson, R., Becker, K. H., Kamens, R. M., Seinfeld, J. H., Wallington, T. J., and Yarwoord, G.: The Mechanisms of Atmospheric Oxidation of Aromatic Hydrocarbons, Oxford University Press, New York, ISBN 9780195146288, 2002.
Canagaratna, M. R., Jayne, J. T., Jimenez, J. L., Allan, J. D., Alfarra, M. R., Zhang, Q., Onasch, T. B., Drewnick, F., Coe, H., Middlebrook, A., Delia, A., Williams, L. R., Trimborn, A. M., Northway, M. J., DeCarlo, P. F., Kolb, C. E., Davidovits, P., and Worsnop, D. R.: Chemical and microphysical characterization of ambient aerosols with the aerodyne aerosol mass spectrometer, Mass Spec. Reviews, 26, 185–222, 2007.
Cappa, C. D. and Jimenez, J. L.: Quantitative estimates of the volatility of ambient organic aerosol, Atmos. Chem. Phys., 10, 5409–5424, https://doi.org/10.5194/acp-10-5409-2010, 2010.
Cappellin, L., Karl, T., Probst, M., Ismailova, O., Winkler, P. M., Soukoulis, C., Aprea, E., Märk, T. D., Gasperi, F., and Biasioli, F.: On Quantitative Determination of Volatile Organic Compound Concentrations Using Proton Transfer Reaction Time-of- Flight Mass Spectrometry, Environ. Sci. Technol., 46, 2283–2290, 2012.
Cocker III, D. R.,, Mader, B. T., Kalberer, M., Flagan, R. C., and Seinfeld, J. H.: The effect of water on gas−particle partitioning of secondary organic aerosol: II. m-xylene and 1, 3, 5-trimethylbenzene photooxidation systems. Atmos. Environ., 35, 6073–6085, 2001.
Compernolle, S., Ceulemans, K., and Müller, J.-F.: EVAPORATION: a new vapour pressure estimation method for organic molecules including non-additivity and intramolecular interactions, Atmos. Chem. Phys., 11, 9431–9450, https://doi.org/10.5194/acp-11-9431-2011, 2011.
Dallmann, T. R. and Harley, R. A.: Evaluation of mobile source emission trends in the United States, J. Geophys. Res, 115, D14305, https://doi.org/10.1029/2010JD013862, 2010.
DeCarlo, P. F., Kimmel, J. R., Trimborn, A., Northway, M. J., Jayne, J. T., Aiken, A. C., Gonin, M., Fuhrer, K., Horvath, T., Docherty, K., Worsnop, D. R., and Jimenez, J. L.: Field-Deployable, High-Resolution, Time-of-Flight Aerosol Mass Spectrometer, Anal. Chem., 78, 8281–8289, 2006.
de Gouw, J. and Warneke, C.: Measurements of volatile organic compounds in the earth's atmosphere using proton-transfer-reaction mass spectrometry, Mass Spec. Reviews, 26, 223–257, 2007.
Docherty, K. S., Corse, E. W., Jaoui, M., Offenberg, J. H., Kleindienst, T. E., Krug, J. D., Riedel T. P., and Lewandowski, M.: Trends in the oxidation and relative volatility of chamber-generated secondary organic aerosol, Aerosol Sci. Tech., 52, 992–1004, https://doi.org/10.1080/02786826.2018.1500014, 2018.
Donahue N. M., Robinson, A. L., Stanier, C. O., and Panids, S. N.: Coupled partitioning, dilution, and chemical aging of semivolatile organics, Environ. Sci. Technol., 40, 2635–2643, 2006.
Donahue, N. M., Epstein, S. A., Pandis, S. N., and Robinson, A. L.: A two-dimensional volatility basis set: 1. organic-aerosol mixing thermodynamics, Atmos. Chem. Phys., 11, 3303–3318, https://doi.org/10.5194/acp-11-3303-2011, 2011.
Donahue, N. M., Kroll, J. H., Pandis, S. N., and Robinson, A. L.: A two-dimensional volatility basis set – Part 2: Diagnostics of organic-aerosol evolution, Atmos. Chem. Phys., 12, 615–634, https://doi.org/10.5194/acp-12-615-2012, 2012.
Drozd, G. T., Zhao, Y., Saliba, G., Frodin, B., Maddox, C., Chang, M.-C. O., Maldonado, H., Sardar, S., Weber, R. J., Robinson, A. L., and Goldstein A. H.: Detailed Speciation of Intermediate Volatility and Semivolatile Organic Compound Emissions from Gasoline Vehicles: Effects of Cold-Starts and Implications for Secondary Organic Aerosol Formation, Environ. Sci. Technol., 53, 1706–1714, 2019.
Eichler, P., Müller, M., D'Anna, B., and Wisthaler, A.: A novel inlet system for online chemical analysis of semi-volatile submicron particulate matter, Atmos. Meas. Tech., 8, 1353–1360, https://doi.org/10.5194/amt-8-1353-2015, 2015.
Erickson, M. H., Gueneron, M., and Jobson, B. T.: Measuring long chain alkanes in diesel engine exhaust by thermal desorption PTR-MS, Atmos. Meas. Tech., 7, 225–239, https://doi.org/10.5194/amt-7-225-2014, 2014.
Farmer, D. K., Matsunaga, A., Docherty, K. S., Surratt, J. D., Seinfeld, J. H., Ziemann, P. J., and Jimenez, J. L.: Response of an aerosol mass spectrometer to organonitrates and organosulfates and implications for atmospheric chemistry, P. Natl. Acad. Sci. USA, 107, 6670–6675, 2010.
Forstner, H. J. L., Flagan, R. C., and Seindeld, J. H.: Secondary organic aerosol from the photooxidation of aromatic hydrocarbons: Molecular composition, Environ. Sci. Technol., 31, 1345–1358, 1997.
Galloway, M. M., Chhabra, P. S., Chan, A. W. H., Surratt, J. D., Flagan, R. C., Seinfeld, J. H., and Keutsch, F. N.: Glyoxal uptake on ammonium sulphate seed aerosol: reaction products and reversibility of uptake under dark and irradiated conditions, Atmos. Chem. Phys., 9, 3331–3345, https://doi.org/10.5194/acp-9-3331-2009, 2009.
Gentner, D. R., Jathar, S. H., Gordon, T. D., Bahreini, R., Day, D. A., El Haddad, I., Hayes, P, L., Pieber, S. M., Platt, S. M., de Gouw, J., Goldstein, A. H., Harley, R. A., Jimenez, J. L., Prévôt, A. S. H., and Robinson, A. L.: Review of Urban Secondary Organic Aerosol Formation from Gasoline and Diesel Motor Vehicle Emissions, Environ. Sci. Technol., 51, 1074–1093, 2017.
Gkatzelis, G. I., Hohaus, T., Tillmann, R., Gensch, I., Müller, M., Eichler, P., Xu, K.-M., Schlag, P., Schmitt, S. H., Yu, Z., Wegener, R., Kaminski, M., Holzinger, R., Wisthaler, A., and Kiendler-Scharr, A.: Gas-to-particle partitioning of major biogenic oxidation products: a study on freshly formed and aged biogenic SOA, Atmos. Chem. Phys., 18, 12969–12989, https://doi.org/10.5194/acp-18-12969-2018, 2018.
Gordon, T. D., Tkacik, D. S., Presto, A. A., Zhang, M., Jathar, S. H., Nguyen, N. T., Massetti, J., Truong, T., Cicero-Fernandez, P., Maddox, C., Rieger, P., Chattopadhyay, S., Maldonado, H., Maricq, M. M., and Allen L. Robinson, A. L.: Primary gas- and particle-phase emissions and secondary organic aerosol production from gasoline and diesel off-road engines, Environ. Sci. Technol., 47, 14137–14146, 2013.
Gordon, T. D., Presto, A. A., May, A. A., Nguyen, N. T., Lipsky, E. M., Donahue, N. M., Gutierrez, A., Zhang, M., Maddox, C., Rieger, P., Chattopadhyay, S., Maldonado, H., Maricq, M. M., and Robinson, A. L.: Secondary organic aerosol formation exceeds primary particulate matter emissions for light-duty gasoline vehicles, Atmos. Chem. Phys., 14, 4661–4678, https://doi.org/10.5194/acp-14-4661-2014, 2014.
Gueneron, M., Erickson, M. H., VanderSchelden, G. S., and Jobson, B. T.: PTR-MS fragmentation patterns of gasoline hydrocarbons, Int. J. Mass Spec., 379, 97–109, 2015.
Haase, K. B., Keene, W. C., Pszenny, A. A. P., Mayne, H. R., Talbot, R. W., and Sive, B. C.: Calibration and intercomparison of acetic acid measurements using proton-transfer-reaction mass spectrometry (PTR-MS), Atmos. Meas. Tech., 5, 2739–2750, https://doi.org/10.5194/amt-5-2739-2012, 2012.
Hamilton, J. F., Lewis, A. C., Bloss, C., Wagner, V., Henderson, A. P., Golding, B. T., Wirtz, K., Martin-Reviejo, M., and Pilling, M. J.: Measurements of photo-oxidation products from the reaction of a series of alkyl-benzenes with hydroxyl radicals during EXACT using comprehensive gas chromatography, Atmos. Chem. Phys., 3, 1999–2014, https://doi.org/10.5194/acp-3-1999-2003, 2003.
Hamilton, J. F., Webb, P. J., Lewis, A. C., and Reviejo, M. M.: Quantifying small molecules in secondary organic aerosol formed during the photo-oxidation of toluene with hydroxyl radicals, Atmos. Environ., 39, 7263–7275, 2005.
Hartikainen, A., Ihalainen, M., Yli-Pirila, P., Hao, L., Kortelainen, M., Pieber, S., and Sippula, O.: Photochemical transformation and secondary aerosol formation potential of Euro6 gasoline and diesel passenger car exhaust emissions, J. Aerosol Sci., 171, 106159, https://doi.org/10.1016/j.jaerosci.2023.106159, 2023.
Hayes, P. L., Carlton, A. G., Baker, K. R., Ahmadov, R., Washenfelder, R. A., Alvarez, S., Rappenglück, B., Gilman, J. B., Kuster, W. C., de Gouw, J. A., Zotter, P., Prévôt, A. S. H., Szidat, S., Kleindienst, T. E., Offenberg, J. H., Ma, P. K., and Jimenez, J. L.: Modeling the formation and aging of secondary organic aerosols in Los Angeles during CalNex 2010, Atmos. Chem. Phys., 15, 5773–5801, https://doi.org/10.5194/acp-15-5773-2015, 2015.
Healy, R. M., Wenger, J. C., Metzger, A., Duplissy, J., Kalberer, M., and Dommen, J.: Gas/particle partitioning of carbonyls in the photooxidation of isoprene and 1,3,5-trimethylbenzene, Atmos. Chem. Phys., 8, 3215–3230, https://doi.org/10.5194/acp-8-3215-2008, 2008.
Hildebrandt, L., Donahue, N. M., and Pandis, S. N.: High formation of secondary organic aerosol from the photo-oxidation of toluene, Atmos. Chem. Phys., 9, 2973–2986, https://doi.org/10.5194/acp-9-2973-2009, 2009.
Hildebrandt Ruiz, L., Paciga, A. L., Cerully, K. M., Nenes, A., Donahue, N. M., and Pandis, S. N.: Formation and aging of secondary organic aerosol from toluene: changes in chemical composition, volatility, and hygroscopicity, Atmos. Chem. Phys., 15, 8301–8313, https://doi.org/10.5194/acp-15-8301-2015, 2015.
Hinks, M. L., Montoya-Aguilera, J., Ellison, L., Lin, P., Laskin, A., Laskin, J., Shiraiwa, M., Dabdub, D., and Nizkorodov, S. A.: Effect of relative humidity on the composition of secondary organic aerosol from the oxidation of toluene, Atmos. Chem. Phys., 18, 1643–1652, https://doi.org/10.5194/acp-18-1643-2018, 2018.
Hofman, J., Staelens, J., Cordell, R., Stroobants, C., Zikova, N., Hama, S. M. L., Wyche, K. P., Kos, G. P. A., Van Der Zee, S., Smallbone, K. L., Weijers, E. P., Monks, P. S., and Roekens, E.: Ultrafine particles in four European urban environments: Results from a new continuous long-term monitoring network, Atmos. Environ., 136, 68–81, 2016.
Hohaus, T., Trimborn, D., Kiendler-Scharr, A., Gensch, I., Laumer, W., Kammer, B., Andres, S., Boudries, H., Smith, K. A., Worsnop, D. R., and Jayne, J. T.: A new aerosol collector for quasi on-line analysis of particulate organic matter: the Aerosol Collection Module (ACM) and first applications with a GC/MS-FID, Atmos. Meas. Tech., 3, 1423–1436, https://doi.org/10.5194/amt-3-1423-2010, 2010.
Hohaus, T., Gensch, I., Kimmel, J. R., Worsnop, D. R., and Kiendler-Scharr, A.: Experimental determination of the partitioning coefficient of β-pinene oxidation products in SOAs, Phys. Chem. Chem. Phys., 17, 14796–14804, https://doi.org/10.1039/C5CP01608H, 2015.
Holzinger, R., Acton, W. J. F., Bloss, W. J., Breitenlechner, M., Crilley, L. R., Dusanter, S., Gonin, M., Gros, V., Keutsch, F. N., Kiendler-Scharr, A., Kramer, L. J., Krechmer, J. E., Languille, B., Locoge, N., Lopez-Hilfiker, F., Materić, D., Moreno, S., Nemitz, E., Quéléver, L. L. J., Sarda Esteve, R., Sauvage, S., Schallhart, S., Sommariva, R., Tillmann, R., Wedel, S., Worton, D. R., Xu, K., and Zaytsev, A.: Validity and limitations of simple reaction kinetics to calculate concentrations of organic compounds from ion counts in PTR-MS, Atmos. Meas. Tech., 12, 6193–6208, https://doi.org/10.5194/amt-12-6193-2019, 2019.
Huang, M., Zhang, W., Hao, L., Wang, Z., Zhou, L., Gu, X., and Fang, L.: Chemical composition and reaction mechanisms for secondary organic aerosol from photooxidation of toluene, J. Chin. Chem. Soc., 53, 1149–1156, 2006.
Huffman, J. A., Docherty, K. S., Aiken, A. C., Cubison, M. J., Ulbrich, I. M., DeCarlo, P. F., Sueper, D., Jayne, J. T., Worsnop, D. R., Ziemann, P. J., and Jimenez, J. L.: Chemically-resolved aerosol volatility measurements from two megacity field studies, Atmos. Chem. Phys., 9, 7161–7182, https://doi.org/10.5194/acp-9-7161-2009, 2009.
Isaacman-VanWertz, G., Yee, L. D., Kreisberg, N. M., Wernis, R., Moss, J. A., Hering, S. V., de Sa, S. S., Martin, S. T., Alexander, M. L., Palm, B. B., Hu, W., Campuzano-Jost, P., Day, D. A., Jimenez, J. L., Riva, M., Surratt, J. D., Viegas, J., Manzi, A., Edgerton, E., Baumann, K., Souza, R., Artaxo, P., and Goldstein, A. H.: Ambient gas-particle partitioning of tracers for biogenic oxidation, Environ. Sci. Technol., 50, 9952–9962, 2016.
Isaacman-VanWertz, G., Massoli, P., O'Brien, R. E., Nowak, J. B., Canagaratna, M. R., Jayne, J. T., Worsnop, D. R., Su, L., Knopf, D. A., Misztal, P. K., Arata, C., Goldstein, A. H., and Kroll, J. H.: Using advanced mass spectrometry techniques to fully characterize atmospheric organic carbon: Current capabilities and remaining gaps, Faraday Discuss., 200, 579–598, 2017.
Jang, M. and Kamens, R. M.: Newly characterized products and composition of secondary aerosols from the reaction of α-pinene with ozone, Atmos. Environ., 33, 459–474, 1999.
Jang, M. and Kamens, R. M.: Characterization of secondary aerosol from the photooxidation of toluene in the presence of NOx and 1-Propene, Environ. Sci. Technol., 35, 3626–3639, 2001.
Jaoui, M. and Kamens, R. M.: Mass balance of gaseous and particulate products from β-pinene/O3/air in the absence of light and β-pinene/NOx/air in the presence of natural sunlight, J. Atmos. Chem., 43, 101–141, 2003.
Jathar, S. H., Woody, M., Pye, H. O. T., Baker, K. R., and Robinson, A. L.: Chemical transport model simulations of organic aerosol in southern California: model evaluation and gasoline and diesel source contributions, Atmos. Chem. Phys., 17, 4305–4318, https://doi.org/10.5194/acp-17-4305-2017, 2017.
Jenkin, M. E.: Modelling the formation and composition of secondary organic aerosol from α- and β-pinene ozonolysis using MCM v3, Atmos. Chem. Phys., 4, 1741–1757, https://doi.org/10.5194/acp-4-1741-2004, 2004.
Jiang, X., Tsona, N. T., Jia, L., Liu, S., Zhang, H., Xu, Y., and Du, L.: Secondary organic aerosol formation from photooxidation of furan: effects of NOx and humidity, Atmos. Chem. Phys., 19, 13591–13609, https://doi.org/10.5194/acp-19-13591-2019, 2019.
Jimenez, J. L., Canagaratna, M. R., Donahue, N. M., Prévôt, A. S. H., Zhang, Q., Kroll, J. H., DeCarlo, P. F., Allan, J. D., Coe, H., Ng, N. L., Aiken, A. C., Docherty, K. S., Ulbrich, I. M., Grieshop, A. P., Robinson, A. L., Duplissy, J., Smith, J. D., Wilson, K. R., Lanz, V. A., Hueglin, C., Sun, Y. L., Tian, J., Laaksonen, A., Raatikainen, T., Rautiainen, J., Vaattovaara, P., Ehn, M., Kulmala, M., Tomlinson, J. M., Collins, D. R., Cubison, M. J., Dunlea, E. J., Huffman, J. A., Onasch, T. B., Alfarra, M. R., Williams, P. I., Bower, K., Kondo, Y., Schneider, J., Drewnick, F., Borrmann, S., Weimer, S., Demerjian, K., Salcedo, D., Cottrell, L., Griffin, R., Takami, A., Miyoshi, T., Hatakeyama, S., Shimono, A., Sun, J. Y., Zhang, Y. M., Dzepina, K., Kimmel, J. R., Sueper, D., Jayne, J. T., Herndon, S. C., Trimborn, A. M., Williams, L. R., Wood, E. C., Middlebrook, A. M., Kolb, C. E., Baltensperger, U., and Worsnop, D. R.: Evolution of organic aerosols in the atmosphere, Science, 326, 1525–1529, 2009.
Joback, K. G. and Reid, R. C.: Estimation of pure-component properties from group contributions, Chem. Eng. Commun., 57, 233–243, 1987.
Kalberer, M., Paulsen, D., Sax, M., Steinbacher, M., Dommen, J., Prévôt, A. S. H. Fisseha, R., Weingartner, E., Frankevich, V., Zenobi, R., and Baltensperger, U.: Identification of polymers as major components of atmospheric organic aerosols, Science, 303, 1659–1662, 2004.
Kampf, C. J., Waxman, E. M., Slowik, J. G., Dommen, J., Pfaffenberger, L., Praplan, A. P., Prévôt, A. S. H., Baltensperger, U., Hoffmann, T., and Volkamer, R.: Effective Henry's law partitioning and the salting constant of glyoxal in aerosols containing sulfate, Environ. Sci. Technol., 47, 4236–4244, 2013.
Kanakidou, M., Seinfeld, J. H., Pandis, S. N., Barnes, I., Dentener, F. J., Facchini, M. C., Van Dingenen, R., Ervens, B., Nenes, A., Nielsen, C. J., Swietlicki, E., Putaud, J. P., Balkanski, Y., Fuzzi, S., Horth, J., Moortgat, G. K., Winterhalter, R., Myhre, C. E. L., Tsigaridis, K., Vignati, E., Stephanou, E. G., and Wilson, J.: Organic aerosol and global climate modelling: a review, Atmos. Chem. Phys., 5, 1053–1123, https://doi.org/10.5194/acp-5-1053-2005, 2005.
Kari, E., Hao, L., Ylisirniö, A., Buchholz, A., Leskinen, A., Yli-Pirilä, P., Nuutinen, I., Kuuspalo, K., Jokiniemi, J., Faiola, C. L., Schobesberger, S., and Virtanen, A.: Potential dual effect of anthropogenic emissions on the formation of biogenic secondary organic aerosol (BSOA), Atmos. Chem. Phys., 19, 15651–15671, https://doi.org/10.5194/acp-19-15651-2019, 2019.
Karjalainen, P., Timonen, H., Saukko, E., Kuuluvainen, H., Saarikoski, S., Aakko-Saksa, P., Murtonen, T., Bloss, M., Dal Maso, M., Simonen, P., Ahlberg, E., Svenningsson, B., Brune, W. H., Hillamo, R., Keskinen, J., and Rönkkö, T.: Time-resolved characterization of primary particle emissions and secondary particle formation from a modern gasoline passenger car, Atmos. Chem. Phys., 16, 8559–8570, https://doi.org/10.5194/acp-16-8559-2016, 2016.
Karl, T. G., Christian, T. J., Yokelson, R. J., Artaxo, P., Hao, W. M., and Guenther, A.: The Tropical Forest and Fire Emissions Experiment: method evaluation of volatile organic compound emissions measured by PTR-MS, FTIR, and GC from tropical biomass burning, Atmos. Chem. Phys., 7, 5883–5897, https://doi.org/10.5194/acp-7-5883-2007, 2007.
Kelly, J. M., Doherty, R. M., O'Connor, F. M., and Mann, G. W.: The impact of biogenic, anthropogenic, and biomass burning volatile organic compound emissions on regional and seasonal variations in secondary organic aerosol, Atmos. Chem. Phys., 18, 7393–7422, https://doi.org/10.5194/acp-18-7393-2018, 2018.
Kenseth, C. M., Huang, Y., Zhao, R., Dalleska, N. F., Hethcoxa, J., C., Stoltz, B. M., and Seinfeld, J. H.: Synergistic O3 + OH oxidation pathway to extremely low-volatility dimers revealed in β-pinene secondary organic aerosol, P. Natl. Acad. Sci. USA, 115, 8301–8306, 2018.
Kim, H. and Paulson, S. E.: Real refractive indices and volatility of secondary organic aerosol generated from photooxidation and ozonolysis of limonene, α-pinene and toluene, Atmos. Chem. Phys., 13, 7711–7723, https://doi.org/10.5194/acp-13-7711-2013, 2013.
Kolesar, K. R., Li, Z., Wilson, K. R., and Cappa, C. D.: Heating-Induced Evaporation of Nine Different Secondary Organic Aerosol Types, Environ. Sci. Technol., 49, 12242–12252, 2015.
Kostenidou, E., Karnezi, E., Kolodziejczyk, A., Szmigielski, R., and Pandis, S. N.: Physical and chemical properties of 3-methyl-1,2,3-butanetricarboxylic acid (MBTCA) aerosol, Environ. Sci. Technol., 52, 1150–1155, 2018a.
Kostenidou, E., Karnezi, E., Hite Jr., J. R., Bougiatioti, A., Cerully, K., Xu, L., Ng, N. L., Nenes, A., and Pandis, S. N.: Organic aerosol in the summertime southeastern United States: components and their link to volatility distribution, oxidation state and hygroscopicity, Atmos. Chem. Phys., 18, 5799–5819, https://doi.org/10.5194/acp-18-5799-2018, 2018b.
Kostenidou, E., Martinez-Valiente, A., R'Mili, B., Marques, B., Temime-Roussel, B., Durand, A., André, M., Liu, Y., Louis, C., Vansevenant, B., Ferry, D., Laffon, C., Parent, P., and D'Anna, B.: Technical note: Emission factors, chemical composition, and morphology of particles emitted from Euro 5 diesel and gasoline light-duty vehicles during transient cycles, Atmos. Chem. Phys., 21, 4779–4796, https://doi.org/10.5194/acp-21-4779-2021, 2021.
Kreisberg, N. M., Hering, S. V., Williams, B. J., Worton, D. R., and Goldstein, A. H.: Quantification of hourly speciated organic compounds in atmospheric aerosols, measured by an in-situ thermal desorption aerosol gas chromatograph (tag), Aerosol Sci. Tech., 43, 38–52, 2009.
Lannuque, V., D'Anna, B., Kostenidou, E., Couvidat, F., Martinez-Valiente, A., Eichler, P., Wisthaler, A., Müller, M., Temime-Roussel, B., Valorso, R., and Sartelet, K.: Gas–particle partitioning of toluene oxidation products: an experimental and modeling study, Atmos. Chem. Phys., 23, 15537–15560, https://doi.org/10.5194/acp-23-15537-2023, 2023.
Leach, K. B., Kamens, R. M., Strommen, M. R., and Jang, M.: Partitioning of semivolatile organic compounds in the presence of a secondary organic aerosol in a controlled atmosphere, J. Atmos. Chem., 33, 241–264, 1999.
Leglise, J., Müller, M., Piel, F., Otto, T., and Wisthaler, A.: Bulk organic aerosol analysis by proton-transfer-reaction mass spectrometry: an improved methodology for the determination of total organic mass, O : C and H : C elemental ratios, and the average molecular formula, Anal. Chem., 91, 12619–12624, 2019.
Li, W., Li, L., Chen, C.-L., Kacarab, M., Peng, W., Price, D., Xu, J., and Cocker III, D. R.: Potential of select intermediate-volatility organic compounds and consumer products for secondary organic aerosol and ozone formation under relevant urban conditions, Atmos. Environ., 178, 109–117, 2018.
Lim, Y. B., Kim, H., Kim, J. Y., and Turpin, B. J.: Photochemical organonitrate formation in wet aerosols, Atmos. Chem. Phys., 16, 12631–12647, https://doi.org/10.5194/acp-16-12631-2016, 2016.
Liu, T., Wang, X., Deng, W., Hu, Q., Ding, X., Zhang, Y., He, Q., Zhang, Z., Lü, S., Bi, X., Chen, J., and Yu, J.: Secondary organic aerosol formation from photochemical aging of light-duty gasoline vehicle exhausts in a smog chamber, Atmos. Chem. Phys., 15, 9049–9062, https://doi.org/10.5194/acp-15-9049-2015, 2015.
Lopez-Hilfiker, F. D., Mohr, C., Ehn, M., Rubach, F., Kleist, E., Wildt, J., Mentel, Th. F., Lutz, A., Hallquist, M., Worsnop, D., and Thornton, J. A.: A novel method for online analysis of gas and particle composition: description and evaluation of a Filter Inlet for Gases and AEROsols (FIGAERO), Atmos. Meas. Tech., 7, 983–1001, https://doi.org/10.5194/amt-7-983-2014, 2014.
Lopez-Hilfiker, F. D., Mohr, C., D'Ambro, E. L., Lutz, A., Riedel, T. P., Gaston, C. J., Iyer, S., Zhang, X., Gold, A., Surratt, J. D., Lee, B. H., Kurten, T., Hu, W. W., Jimenez, J., Hallquist, M., and Thornton, J. A.: Molecular composition and volatility of organic aerosol in the Southeastern U.S.: Implications for IEPOX derived SOA, Environ. Sci. Technol., 50, 2200–2209, 2016.
Louis, C.: Impacts des technologies de dépollution et des conditions de conduites sur les émissions primaires des véhicules et leur évolution dans l'atmosphère, PhD Thesis, Thermique [physics.class-ph], Université de Lyon, Lyon, France, NNT: 2018LYSET013, tel-02035080v3, 2018.
Louvaris, E. E., Karnezi, E., Kostenidou, E., Kaltsonoudis, C., and Pandis, S. N.: Estimation of the volatility distribution of organic aerosol combining thermodenuder and isothermal dilution measurements, Atmos. Meas. Tech., 10, 3909–3918, https://doi.org/10.5194/amt-10-3909-2017, 2017a.
Louvaris, E., Florou, K., Karnezi, E., Papanastasiou, D. K., Gkatzelis, G, I., and Pandis, S. N.: Volatility of source apportioned wintertime organic aerosol in the city of Athens, Atmos. Environ., 158, 138–147, 2017b.
Lv, S., Wang, F., Wu, C., Chen, Y., Liu, S., Zhang, S., Li, D., Du, W., Zhang, F., Wang, H., Huang, C., Fu, Q., Duan, Y., and Wang, G.: Gas-to-aerosol phase partitioning of atmospheric water-soluble organic compounds at a rural site in China: an enhancing effect of NH3 on SOA formation, Environ. Sci. Technol., 56, 3915–3924, 2022.
Ma, P., Zhang, P., Shu, J., Yang, B., and Zhang H.: Characterization of secondary organic aerosol from photo-oxidation of gasoline exhaust and specific sources of major components, Environ. Pollut., 232, 65–72, 2018.
Mackay, D., Bobra, A., Chan, D. W., and Shiu, W. Y.: Vapor-pressure correlations for low-volatility environmental chemicals, Environ. Sci. Technol., 16, 645–649, 1982.
Marques, B., Kostenidou, E., Martinez-Valiente, A., Vansevenant, B., Sarica, T., Fine L., Temime-Roussel, B., Tassel, P., Perret, P., Liu, Y., Sartelet, K., Ferronato, C., and D'Anna B.: Detailed speciation of non-methane volatile organic compounds in exhaust emissions from diesel and gasoline Euro 5 vehicles using online and offline measurements, Toxics, 10, 184, https://doi.org/10.3390/toxics10040184, 2022.
Matthew, B. M., Middlebrook, A. M., and Onasch, T. B.: Collection efficiencies in an Aerodyne Aerosol Mass Spectrometer as a function of particle phase for laboratory generated aerosols, Aerosol Sci. Tech., 42, 884–898, 2008.
Mehlman, A. and Warneck, P.: Atmospheric gaseous HNO3, particulate nitrate, and aerosol size distributions of major ionic species at a rural site in western Germany, Atmos. Environ., 29, 2359–2373, 1995.
Morino, Y., Li, Y., Fujitani, Y., Sato, K., Inomata, S., Tanabe, K., Jathar, S.H., Kondo, Y., Nakayama, T., Fushimi, A., Takami, A., and Kobayashi, S.: Secondary organic aerosol formation from gasoline and diesel vehicle exhaust under light and dark conditions, Environ. Sci.-Atmos., 2, 46–64, 2022.
Müller, M., Graus, M., Wisthaler, A., Hansel, A., Metzger, A., Dommen, J., and Baltensperger, U.: Analysis of high mass resolution PTR-TOF mass spectra from 1,3,5-trimethylbenzene (TMB) environmental chamber experiments, Atmos. Chem. Phys., 12, 829–843, https://doi.org/10.5194/acp-12-829-2012, 2012.
Müller, M., Eichler, P., D'Anna, B., Tan, W., and Wisthaler, A.: Direct sampling and analysis of atmospheric particulate organic matter by Proton-Transfer-Reaction Mass Spectrometry, Anal. Chem., 89, 10889–10897, 2017.
Myrdal, P. B. and Yalkowsky, S. H.: Estimating pure component vapor pressures of complex organic molecules, Ind. Eng. Chem. Res., 36, 2494–2499, 1997.
Nannoolal, Y., Rarey, J., and Ramjugernath, D.: Estimation of pure component properties. Part 3. Estimation of the vapor pressure of non-electrolyte organic compounds via group contributions and group interaction, Fluid Phase Equilibr., 269, 117–133, 2008.
Nordin, E. Z., Eriksson, A. C., Roldin, P., Nilsson, P. T., Carlsson, J. E., Kajos, M. K., Hellén, H., Wittbom, C., Rissler, J., Löndahl, J., Swietlicki, E., Svenningsson, B., Bohgard, M., Kulmala, M., Hallquist, M., and Pagels, J. H.: Secondary organic aerosol formation from idling gasoline passenger vehicle emissions investigated in a smog chamber, Atmos. Chem. Phys., 13, 6101–6116, https://doi.org/10.5194/acp-13-6101-2013, 2013.
Noziere, B., Dziedzic, P., and Cordova, A.: Products and kinetics of the liquid-phase reaction of glyoxal catalyzed by ammonium ions (NH), J. Phys. Chem. A, 113, 231–237, 2009.
Ortiz-Montalvo, D. L., Hakkinen, S. A. K., Schwier, A. N., Lim, Y. B., McNeil, V. F., and Turpin, B. J.: Ammonium addition (and aerosol pH) has a dramatic impact on the volatility and yield of glyoxal secondary organic aeosol, Environ. Sci. Technol., 48, 255–262, 2014.
Paciga, A., Karnezi, E., Kostenidou, E., Hildebrandt, L., Psichoudaki, M., Engelhart, G. J., Lee, B.-H., Crippa, M., Prévôt, A. S. H., Baltensperger, U., and Pandis, S. N.: Volatility of organic aerosol and its components in the megacity of Paris, Atmos. Chem. Phys., 16, 2013–2023, https://doi.org/10.5194/acp-16-2013-2016, 2016.
Paciga, A. L., Riipinen, I., and Pandis, S. N.: Effect of ammonia on the volatility of organic diacids, Environ. Sci. Technol., 48, 13769–13775, 2014.
Pandis, S. N., Skyllakou, K., Florou, K., Kostenidou, E., Kaltsonoudis, C., Hasa, E., and Presto, A. A.: Urban particulate matter pollution: a tale of five cities, Faraday Discuss., 189, 277–290, 2016.
Pankow. J. F.: An absorption model of gas/particle partitioning of organic compounds in the atmosphere, Atmos. Environ., 28, 185–188, 1994.
Pieber, S. M., El Haddad, I., Slowik, J. G., Canagaratna, M. R., Jayne, J. T., Platt, S. M., Bozzetti, C., Daellenbach, K. R., Fro?hlich, R., Vlachou, A., Klein, F., Dommen, J., Miljevic, B., Jimeìnez, J. L., Worsnop, D. R., Baltensperger, U., and Prévôt, A. S. H.: Inorganic salt interference on CO in Aerodyne AMS and ACSM organic aerosol composition studies, Environ. Sci. Technol., 50, 10494–10503, 2016.
Pieber, S. M., Kumar, N. K., Klein, F., Comte, P., Bhattu, D., Dommen, J., Bruns, E. A., Kılıç, D., El Haddad, I., Keller, A., Czerwinski, J., Heeb, N., Baltensperger, U., Slowik, J. G., and Prévôt, A. S. H.: Gas-phase composition and secondary organic aerosol formation from standard and particle filter-retrofitted gasoline direct injection vehicles investigated in a batch and flow reactor, Atmos. Chem. Phys., 18, 9929–9954, https://doi.org/10.5194/acp-18-9929-2018, 2018.
Platt, S. M., El Haddad, I., Zardini, A. A., Clairotte, M., Astorga, C., Wolf, R., Slowik, J. G., Temime-Roussel, B., Marchand, N., Ježek, I., Drinovec, L., Močnik, G., Möhler, O., Richter, R., Barmet, P., Bianchi, F., Baltensperger, U., and Prévôt, A. S. H.: Secondary organic aerosol formation from gasoline vehicle emissions in a new mobile environmental reaction chamber, Atmos. Chem. Phys., 13, 9141–9158, https://doi.org/10.5194/acp-13-9141-2013, 2013.
Platt, S. M., El Haddad, I., Pieber, S. M., Huang, R.-J. Zardini, A.A., Clairotte, M., Suarez-Bertoa, R., Barmet, P., Pfaffenberger, L., Wolf, R., Slowik, J.G., Fuller, S.J, Kalberer, M., Chirico, R., Dommen, J., Astorga, C., Zimmermann, R., Marchand, N., Hellebust, S., Temime-Roussel, B., Baltensperger, U., and Prévôt, A. S. H.: Two-stroke scooters are a dominant source of air pollution in many cities, Nat. Commun., 5, 3749, https://doi.org/10.1038/ncommS5749, 2014.
Platt, S. M., El Haddad, I., Pieber, S. M., Zardini, A. A., Suarez-Bertoa, R., Clairotte, M., Daellenbach, K. R., Huang, R.-J., Slowik, J. G., Hellebust, S., Temime-Roussel, B., Marchand, N., de Gouw, J., Jimenez, J. L., Hayes, P. L., Robinson, A. L., Baltensperger, U., Astorga, C., and Prévôt, A. S. H.: Gasoline cars produce more carbonaceous particulate matter than modern filter-equipped diesel cars, Sci. Rep., 7, 4926, https://doi.org/10.1038/s41598-017-03714-9, 2017.
Praplan, A. P., Hegyi-Gaeggeler, K., Barmet, P., Pfaffenberger, L., Dommen, J., and Baltensperger, U.: Online measurements of water-soluble organic acids in the gas and aerosol phase from the photooxidation of 1,3,5-trimethylbenzene, Atmos. Chem. Phys., 14, 8665–8677, https://doi.org/10.5194/acp-14-8665-2014, 2014.
Robinson, A. L., Donahue, N. M., Shrivastava, M. K., Weitkamp, E. A., Sage, A. M., Grieshop, A. P., Lane, T. E., Pierce, J. R., and Pandis, S. N.: Rethinking organic aerosols: Semivolatile emissions and photochemical aging, Science, 315, 1259, https://doi.org/10.1126/science.1133061, 2007.
Rossignol, S., Chiappini, L., Perraudin, E., Rio, C., Fable, S., Valorso, R., and Doussin, J. F.: Development of a parallel sampling and analysis method for the elucidation of gas/particle partitioning of oxygenated semi-volatile organics: a limonene ozonolysis study, Atmos. Meas. Tech., 5, 1459–1489, https://doi.org/10.5194/amt-5-1459-2012, 2012.
Rossignol, S., Couvidat, F., Rio, C., Fable, S., Grignion, G., Savelli, Pailly, O., Leoz-Garziandia, E., Doussin, J.-F., and Chiappini, L.: Organic aerosol molecular composition and gas–particle partitioning coefficients at a Mediterranean site (Corsica), J. Environ. Sci., 40, 92–104, 2016.
Roth, P., Yang, J., Fofie, E., Cocker III, D. R., Durbin, T. D., Brezny, R., Geller, M., Asa-Awuku, A., and Karavalakis, G.: Catalyzed gasoline particulate filters reduce secondary organic aerosol production from gasoline direct injection vehicles, Environ. Sci. Technol., 53, 3037–3047, 2019.
Saha, P. K. and Grieshop, A. P.: Exploring divergent volatility properties from yield and thermodenuder measurements of secondary organic aerosol from α-pinene ozonolysis, Environ. Sci. Technol., 50, 5740–5749, 2016.
Saliba, G., Saleh, R., Zhao, Y., Presto, A. A., Lambe, A. T., Frodin, B., Sardar, S., Maldonado, H., Maddox, C., May, A. A., Drozd, G. T., Goldstein, A. H., Russell, L. M., Hagen, F., and Robinson, A. L.: Comparison of gasoline direct-injection (GDI) and port fuel injection (PFI) vehicle emissions: emission certification standards, cold-start, secondary organic aerosol formation potential, and potential climate impacts, Environ. Sci. Technol., 51, 6542–6552, 2017.
Sato, K., Hatakeyama, S., and Imamura, T.: Secondary organic aerosol formation during the photooxidation of toluene: NOx dependence of chemical composition, J. Phys. Chem. A, 111, 9796–9808, 2007.
Sato, K., Takami, A., Kato, Y., Seta, T., Fujitani, Y., Hikida, T., Shimono, A., and Imamura, T.: AMS and LC/MS analyses of SOA from the photooxidation of benzene and 1,3,5-trimethylbenzene in the presence of NOx: effects of chemical structure on SOA aging, Atmos. Chem. Phys., 12, 4667–4682, https://doi.org/10.5194/acp-12-4667-2012, 2012.
Sato, K., Fujitani, Y., Inomata, S., Morino, Y., Tanabe, K., Hikida, T., Shimono, A., Takami, A., Fushimi, A., Kondo, Y., Imamura, T., Tanimoto, H., and Sugata, S.: A study of volatility by composition, heating, and dilution measurements of secondary organic aerosol from 1,3,5-trimethylbenzene, Atmos. Chem. Phys., 19, 14901–14915, https://doi.org/10.5194/acp-19-14901-2019, 2019.
Schwantes, R. H., Schilling, K. A., McVay, R. C., Lignell, H., Coggon, M. M., Zhang, X., Wennberg, P. O., and Seinfeld, J. H.: Formation of highly oxygenated low-volatility products from cresol oxidation, Atmos. Chem. Phys., 17, 3453–3474, https://doi.org/10.5194/acp-17-3453-2017, 2017.
Seinfeld, J. H. and Pandis, S. N.: Atmospheric chemistry and physics: From air pollution to climate change, 3rd edn., John Wiley & Sons, Inc., New York, ISBN 9781118947401, 2016.
Simonen, P., Kalliokoski, J., Karjalainen, P., Ronkko, T., Timonen, H., Saarikoski, S., Aurela, M., Bloss, M., Triantafyllopoulos, G., Kontses, A., Amanatidis, S., Dimaratos, A., Samaras, Z., Keskinen, J., Dal Maso, M., and Ntziachristos, L.: Characterization of laboratory and real driving emissions of individual Euro 6 light-duty vehicles – Fresh particles and secondary aerosol formation, Environ. Pollut., 255, 113175, https://doi.org/10.1016/j.envpol.2019.113175, 2019.
Smith, D. F., McIver, C. D., and Kleindienst, T. E.: Primary product distribution from the reaction of hydroxyl radicals with toluene at ppb NOx mixing ratios, J. Atmos. Chem., 30, 209–228, 1998.
Smith, D. F., Kleindienst, T. E., and McIver, C. D.: Primary product distributions from the reaction of OH with m-, p-xylene, 1,2,4 and 1,3,5-trimethylbenzene, J. Atmos. Chem., 34, 339–364, 1999.
Stark, H., Yatavelli, R. L. N., Thompson, S. L., Kang, H., Krechmer, J. E., Kimmel, J. R., Palm, B. B., Hu, W., Hayes, P. L., Day, D. A., Campuzano-Jost, P., Canagaratna, M. R., Jayne, J. T., Worsnop, D. R., and Jimenez, J. L.: Impact of thermal decomposition on thermal desorption instruments: Advantage of thermogram analysis for quantifying volatility distributions of organic species, Environ. Sci. Technol., 51, 8491–8500, 2017.
Stein, S. E. and Brown, R. L.: Estimation of normal boiling points from group contributions, J. Chem. Inf. Comp. Sci., 34, 581–587, 1994.
Suarez-Bertoa, R., Zardini, A. A., Platt, S. M., Hellebust, S., Pieber, S. M., El Haddad, I., Temime-Roussel, B., Baltensperger, U., Marchand, N., Prévôt, A. S. H., and Astorga, C.: Primary emissions and secondary organic aerosol formation from the exhaust of a flex-fuel (ethanol) vehicle, Atmos. Environ., 117, 200–211, 2015.
Topping, D., Barley, M., Bane, M. K., Higham, N., Aumont, B., Dingle, N., and McFiggans, G.: UManSysProp v1.0: an online and open-source facility for molecular property prediction and atmospheric aerosol calculations, Geosci. Model Dev., 9, 899–914, https://doi.org/10.5194/gmd-9-899-2016, 2016.
Volkamer, R., Jimenez, J. L., Martini, F. S., Dzepina, K., Zhang, Q., Salcedo, D., Molina, L. T., Worsnop, D. R., and Molina, M. J.: Secondary organic aerosol formation from anthropogenic air pollution: Rapid and higher than expected, Geophys. Res. Lett., 33, L17811, https://doi.org/10.1029/2006GL026899, 2006.
Volkamer, R., Ziemann, P. J., and Molina, M. J.: Secondary Organic Aerosol Formation from Acetylene (C2H2): seed effect on SOA yields due to organic photochemistry in the aerosol aqueous phase, Atmos. Chem. Phys., 9, 1907–1928, https://doi.org/10.5194/acp-9-1907-2009, 2009.
Wang, B. and Laskin, A.: Reactions between water-soluble organic acids and nitrates in atmospheric aerosols: Recycling of nitric acid and formation of organic salts, J. Geophys. Res.-Atmos., 119, 3335–3351, 2014.
Wang, Y., Liu, P., Li, Y. J., Bateman, A. P., Martin, S. T., and Hung, H.-M.: The reactivity of toluene-derived secondary organic material with ammonia and the influence of water vapor, J. Phys. Chem. A, 122, 7739–7747, 2018.
Wang, Z., Hao, L., Zhou, L., Guo, X., Zhao, W., Fang, L., and Zhang, W.: Real-time detection of individual secondary organic aerosol particle from photo-oxidation of toluene using aerosol time of flight mass spectrometer, Sci. China. Ser B, 49, 267–272, 2006.
Warneke, C., de Gouw, J. A., Kuster, W. C., Goldan, P. D., and Fall, R.: Validation of atmospheric VOC measurements by Proton-Transfer – Reaction Mass Spectrometry using a Gas-Chromatographic preseparation method, Environ. Sci. Technol., 37, 2494–2501, 2003.
White S. J., Jamie, I. J., and Angove, D. E.: Chemical characterization of semi-volatile and aerosol compounds from the photooxidation of toluene and NOx, Atmos. Environ. 83, 237–244, 2014.
Williams, B. J., Goldstein, A. H., Kreisberg, N. M., and Hering, S. V.: An in-situ instrument for speciated organic composition of atmospheric aerosols: Thermal desorptionaerosolgc/ms-fid (tag), Aerosol Sci. Tech., 40, 627–638, 2006.
Williams, B. J., Jayne, J. T., Lambe, A. T., Hohaus, T., Kimmel, J. R., Sueper, D., Brooks, W., Williams, L. R., Trimborn, A. M., Martinez, R. E., Hayes, P. L., Jimenez, J. L., Kreisberg, N. M., Hering, S. V., Worton, D. R., Goldstein, A. H., and Worsnop, D. R.: The first combined thermal desorption aerosol gas chromatograph–aerosol mass spectrometer (tag-ams), Aerosol Sci. Tech., 48, 358–370, 2014.
Wu, R. and Xie, S.: Spatial distribution of secondary organic aerosol formation potential in China derived from speciated anthropogenic volatile organic compound emissions, Environ. Sci. Technol., 52, 8146–8156, 2018.
Wu, R., Pan, S., Li, Y., and Wang, L.: Atmospheric Oxidation Mechanism of Toluene, J. Phys. Chem. A, 118, 4533–4547, 2014.
Wyche, K. P., Monks, P. S., Ellis, A. M., Cordell, R. L., Parker, A. E., Whyte, C., Metzger, A., Dommen, J., Duplissy, J., Prevot, A. S. H., Baltensperger, U., Rickard, A. R., and Wulfert, F.: Gas phase precursors to anthropogenic secondary organic aerosol: detailed observations of 1,3,5-trimethylbenzene photooxidation, Atmos. Chem. Phys., 9, 635–665, https://doi.org/10.5194/acp-9-635-2009, 2009.
Zhang, Y. P., Williams, B. J., Goldstein, A. H., Docherty, K., Ulbrich, I. M., and Jimenez, J. L.: A technique for rapid gas chromatography analysis applied to ambient organic aerosol measurements from the thermal desorption aerosol gas chromatograph (tag), Aerosol Sci. Tech., 48, 1166–1182, 2014.
Zhao, J., Zhang, R., Misawa, K., and Shibuya, K.: Experimental product study of the OH-initiated oxidation of m-xylene, J. Photoch. Photobio. A Chem., 176, 199–207, 2005.
Zhao, Y., Nguyen, N. T., Presto, A. A., Hennigan, C. J., May, A. A., and Robinson, A. L.: Intermediate volatility organic compound emissions from on-road diesel vehicles: Chemical composition, emission factors, and estimated secondary organic aerosol production, Environ. Sci. Technol., 49, 11516–11526, 2015.
Zhao, Y., Saleh, R., Saliba, G., Presto A. A., Gordon T. D., Drozdc, G. T., Goldstein, A. H., Donahue, N. M., and Robinson, A. L.: Reducing secondary organic aerosol formation from gasoline vehicle exhaust, P. Natl. Acad. Sci. USA, 114, 6984–6989, 2017.
Zimmerman, N., Wang, J. M., Jeong, C.-H., Ramos, M., Hilker, N., Healy, R. M., Sabaliauskas, K., Wallace, J. S., and Evans, G. J.: Field measurements of gasoline direct injection emission factors: Spatial and seasonal variability, Environ. Sci. Technol., 50, 2035–2043, 2016.