the Creative Commons Attribution 4.0 License.
the Creative Commons Attribution 4.0 License.
 | 28 Feb 2024
Variation in chemical composition and volatility of oxygenated organic aerosol in different rural, urban, and mountain environments
Wei Huang
Linyu Gao
Yvette Gramlich
Sophie L. Haslett
Joel Thornton
Felipe D. Lopez-Hilfiker
Ben H. Lee
Junwei Song
Harald Saathoff
Xiaoli Shen
Ramakrishna Ramisetty
Sachchida N. Tripathi
Dilip Ganguly
Feng Jiang
Magdalena Vallon
Siegfried Schobesberger
Taina Yli-Juuti
The apparent volatility of atmospheric organic aerosol (OA) particles is determined by their chemical composition and environmental conditions (e.g., ambient temperature). A quantitative, experimental assessment of volatility and the respective importance of these two factors remains challenging, especially in ambient measurements. We present molecular composition and volatility of oxygenated OA (OOA) particles in different rural, urban, and mountain environments (including Chacaltaya, Bolivia; Alabama, US; Hyytiälä, Finland; Stuttgart and Karlsruhe, Germany; and Delhi, India) based on deployments of a filter inlet for gases and aerosols coupled to a high-resolution time-of-flight chemical ionization mass spectrometer (FIGAERO-CIMS). We find on average larger carbon numbers (nC) and lower oxygen-to-carbon (O : C) ratios at the urban sites (nC: 9.8 ± 0.7; O : C: 0.76 ± 0.03; average ±1 standard deviation) compared to the rural (nC: 8.8 ± 0.6; O : C: 0.80 ± 0.05) and mountain stations (nC: 8.1 ± 0.8; O : C: 0.91 ± 0.07), indicative of different emission sources and chemistry. Compounds containing only carbon, hydrogen, and oxygen atoms (CHO) contribute the most to the total OOA mass at the rural sites (79.9 ± 5.2 %), in accordance with their proximity to forested areas (66.2 ± 5.5 % at the mountain sites and 72.6 ± 4.3 % at the urban sites). The largest contribution of nitrogen-containing compounds (CHON) is found at the urban stations (27.1 ± 4.3 %), consistent with their higher NOx levels. Moreover, we parametrize OOA volatility (saturation mass concentrations, Csat) using molecular composition information and compare it with the bulk apparent volatility derived from thermal desorption of the OOA particles within the FIGAERO. We find differences in Csat values of up to ∼ 3 orders of magnitude and variation in thermal desorption profiles (thermograms) across different locations and systems. From our study, we draw the general conclusion that environmental conditions (e.g., ambient temperature) do not directly affect OOA apparent volatility but rather indirectly by influencing the sources and chemistry of the environment and thus the chemical composition. The comprehensive dataset provides results that show the complex thermodynamics and chemistry of OOA and their changes during its lifetime in the atmosphere. We conclude that generally the chemical description of OOA suffices to predict its apparent volatility, at least qualitatively. Our study thus provides new insights that will help guide choices of, e.g., descriptions of OOA volatility in different model frameworks such as air quality models and cloud parcel models.
- Article
(1325 KB) - Full-text XML
-
Supplement
(2118 KB) - BibTeX
- EndNote


Chemical composition and volatility of atmospheric organic aerosol (OA) particles are interconnected. Functionalization of organic molecules can modify their vapor pressure by several orders of magnitude (Pankow and Asher, 2008; Donahue et al., 2011; Graham et al., 2023; Isaacman-VanWertz and Aumont, 2021; Kroll and Seinfeld, 2008). Volatility determines whether a compound partitions into or evaporates from the particle phase and thus influences particulate mass and lifetime in the atmosphere. Accurate predictions of atmospheric organic particle mass thus require a quantitative understanding of the chemical nature and volatility of its components. This is of special importance for oxygenated organic aerosol (OOA), most of which is of secondary origin (i.e., SOA) (Jimenez et al., 2009) and involves phase transitions and chemical reactions in all phases. Further, the conditions of the atmosphere, e.g., temperature, play a critical role. A semi-volatile compound may be in the gas phase in the boundary layer at 25 °C but may condense at an altitude of ∼ 4.5 km where the ambient temperature is ∼ 20 °C lower, and consequently its apparent volatility is lower by up to ∼ 2 orders of magnitude (Bardakov et al., 2021; Donahue et al., 2011; Epstein et al., 2010; Stolzenburg et al., 2018). The complex thermodynamics and chemistry of OOA and their changes during its lifetime in the atmosphere are challenging to measure and represent in modeling frameworks, resulting in simplified descriptions of volatility (Nozière et al., 2015; Hallquist et al., 2009).
The development of the filter inlet for gases and aerosols coupled to a time-of-flight chemical ionization mass spectrometer (FIGAERO-CIMS) has enabled the combined analysis of molecular composition and volatility of OOA particles in near-real time (Thornton et al., 2020; Lopez-Hilfiker et al., 2014). OOA volatility can be derived in two ways from FIGAERO-CIMS:
-
The molecular information of OOA can be used to parametrize volatility via calculations of the effective saturation mass concentrations (Csat) of different organic compounds (Donahue et al., 2011; Li et al., 2016; Mohr et al., 2019; Isaacman-VanWertz and Aumont, 2021; Graham et al., 2023). There are various parametrization methods to calculate Csat, based on different assumptions, training datasets, or structure-based estimation methods (Isaacman-VanWertz and Aumont, 2021). However, calculated Csat from different parametrizations may vary: while the modified Li method (Li et al., 2016; Isaacman-VanWertz and Aumont, 2021) tends to estimate higher vapor pressures than expected for low-volatility species, the Daumit (Daumit et al., 2013) and Donahue methods (Donahue et al., 2011) (also the updated Mohr method; Mohr et al., 2019) are found to estimate lower vapor pressures (Isaacman-VanWertz and Aumont, 2021). The discrepancy in Csat among different parametrizations can span several orders of magnitude and becomes even larger for compounds with increasing nitrogen numbers, especially for organonitrates with multiple nitrate groups (Wu et al., 2021; Isaacman-VanWertz and Aumont, 2021; Graham et al., 2023). This could induce uncertainties associated with volatility estimates, particularly for the complex ambient particle matrix (O'Meara et al., 2014), in addition to the potential divergence from the sum of individual parametrized Csat due to non-ideal intermolecular interactions (Compernolle et al., 2011; Isaacman-VanWertz and Aumont, 2021).
-
While the particles are thermally desorbed within the FIGAERO for molecular composition analysis with CIMS, the instrument also yields a qualitative measure of particle volatility through the signal evolution as a function of desorption temperature (i.e., thermograms) (Lopez-Hilfiker et al., 2014, 2015). A model framework has also been developed to reproduce the shape of thermograms (Schobesberger et al., 2018). The desorption temperature at which a compound exhibits maximum signal (Tmax) correlates with the compound's enthalpy of sublimation and can be used to infer its saturation vapor pressure (Lopez-Hilfiker et al., 2015; Mohr et al., 2017). Evaporative behavior and hence thermogram shape, Tmax, and inferred volatility of a particle-bound compound are subject to artifacts from thermal decomposition (Lopez-Hilfiker et al., 2015; Yang et al., 2021), the heating rate (Yang et al., 2021; Ylisirniö et al., 2021; Thornton et al., 2020; Schobesberger et al., 2018), FIGAERO geometry (Ylisirniö et al., 2021), the presence of isomers (Thompson et al., 2017; Masoud and Ruiz, 2021), and particle-phase diffusivity and viscosity (Yli-Juuti et al., 2017; Huang et al., 2018). As a consequence, thermogram shape and Tmax for an individual compound can vary among different chamber studies (D'Ambro et al., 2017; Huang et al., 2018; Wang and Hildebrandt Ruiz, 2018) and field measurements (Thompson et al., 2017; Huang et al., 2019b; Gaston et al., 2016), which could also induce uncertainties associated with volatility estimates, similar to parametrization methods.
Overall, the relationship between molecular-composition-derived volatility and thermal-desorption-derived volatility is not always straightforward given the rather large uncertainties in both methods (Isaacman-VanWertz and Aumont, 2021; Voliotis et al., 2021; Masoud and Ruiz, 2021; Wu et al., 2021). Huang et al. (2019b) found consistent results of bulk volatility for OOA particles measured in Stuttgart, Germany, when using volatility parametrizations and thermograms, indicative of the connection between chemical composition and volatility. Wu et al. (2021) found a qualitative agreement between Tmax and Csat for individual compounds of SOA particles in their chamber studies but varying results for the bulk volatility when using different parametrizations and thermograms. Further comprehensive investigations of the relationship between the volatility and chemical composition of OOA particles are warranted, particularly for ambient measurements.
In this study, we present an overview of the chemical composition of OOA and OOA volatility derived from both molecular composition measurements and thermogram analyses for a number of ambient FIGAERO-CIMS datasets (Chacaltaya, Bolivia; Alabama, US; Hyytiälä, Finland; Stuttgart and Karlsruhe, Germany; Delhi, India). We assess how different environments (e.g., emission sources and meteorological parameters) influence the particle chemical composition and volatility derived from these two methods, and we discuss the reasons for differences and similarities and the relationship between volatility and chemical composition for the different locations.
2.1 Measurement sites
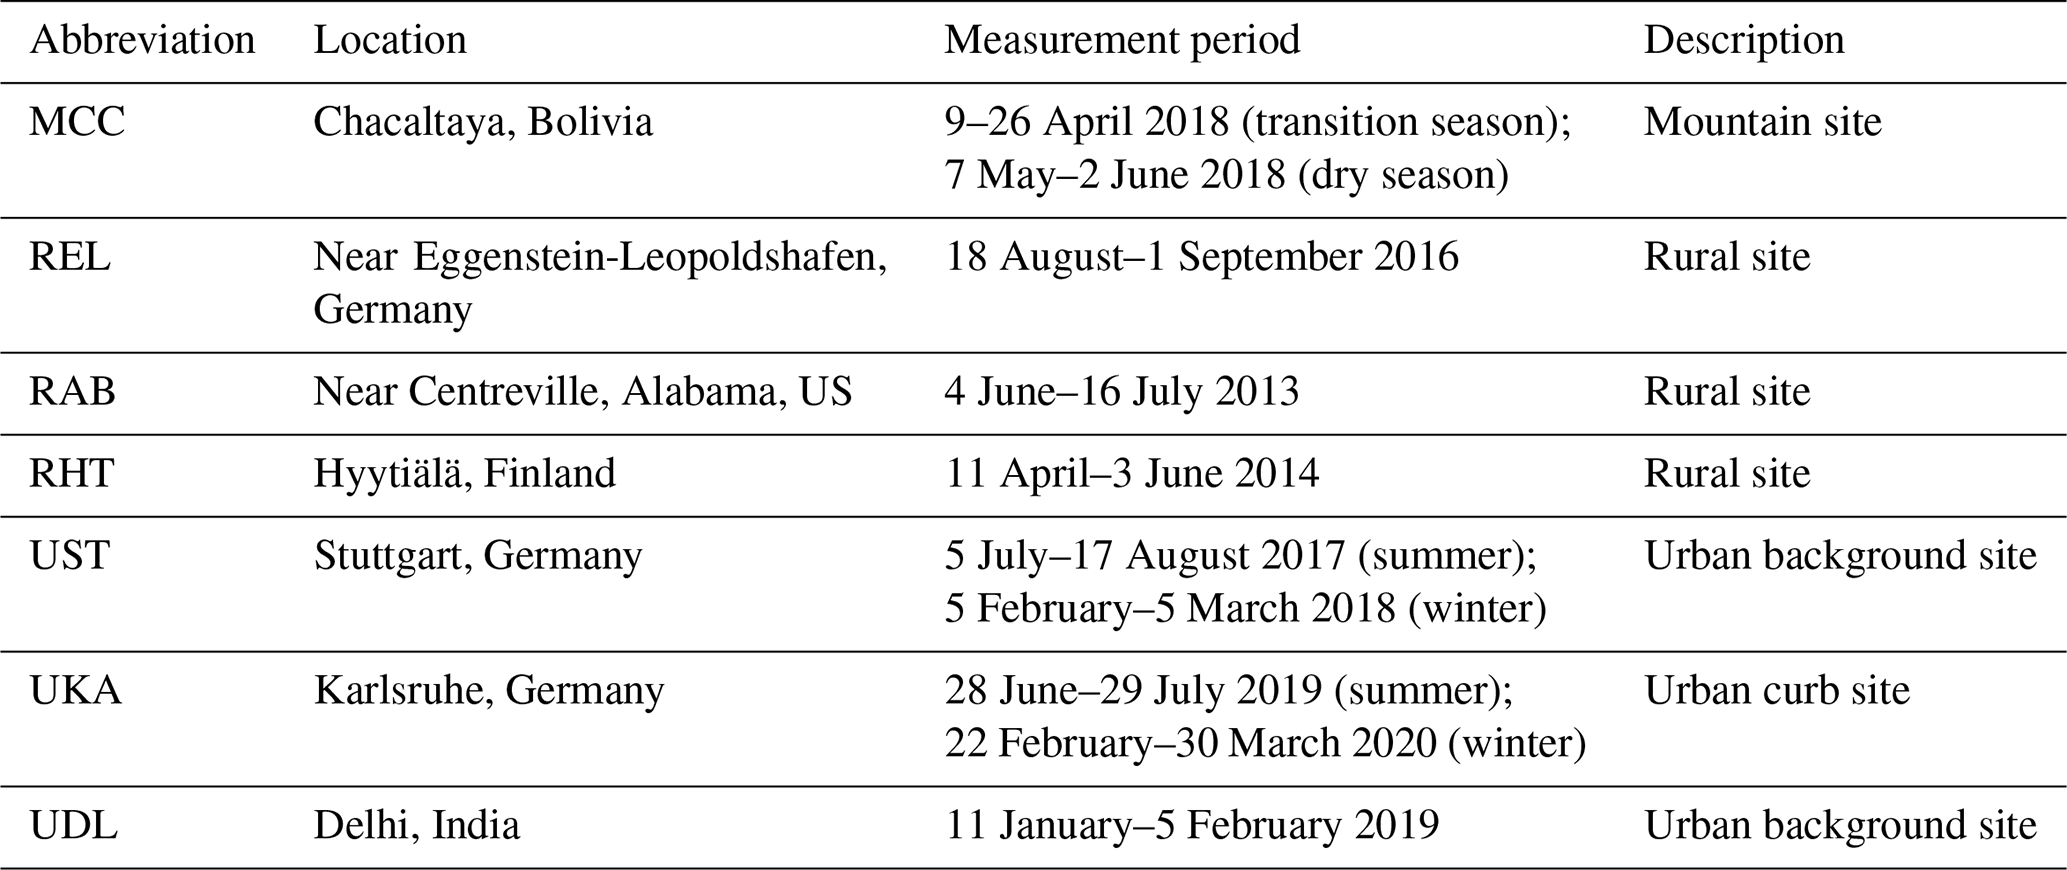
The measurement sites of this study are listed in Table 1. The list includes one mountain site (MCC; 16°21′00.0′′ S, 68°07′48.0′′ W), located at the Global Atmosphere Watch (GAW) high-altitude research station Chacaltaya (∼ 5240 m a.s.l.), ∼ 25 km northeast of the city of La Paz (∼ 3640 m a.s.l.), Bolivia (Bianchi et al., 2022); three rural sites (the first one located in the Rhine river valley near Eggenstein-Leopoldshafen, ∼ 12 km north of the city of Karlsruhe, Germany (REL; 49°6′10.54′′ N, 8°24′26.07′′ E) (Huang et al., 2019a); the second one in the boreal forest of Hyytiälä, Finland (RHT; 61°50′47.2′′ N, 24°17′43.3′′ E) (Mohr et al., 2017, 2019); and the third one located near Centreville, Alabama, US (RAB; 33°10′48.0′′ N, 86°46′48.0′′ W) (Lopez-Hilfiker et al., 2016)); and three urban sites (the first one located in a park in the city of Stuttgart, Germany (UST; 48°47′55.1′′ N, 9°12′13.5′′ E) (Huang et al., 2019b); the second one right next to a road crossing the city center of Karlsruhe, Germany (UKA; 49°00′35.0′′ N, 8°25′02.8′′ E); and the third one on a university campus in the city of Delhi, India (UDL; 28°32′48.8′′ N, 77°011′26.8′′ E) (Haslett et al., 2023)). For MCC, UST, and UKA, measurements from different seasons were included to investigate the influence of seasonal variation in emission sources and/or chemistry on OOA composition and volatility. The campaign's average values for co-located measurements of meteorological parameters (temperature (T) and relative humidity (RH)), trace gases (O3, NO2, and SO2), equivalent black carbon (eBC), and total non-refractory particulate mass are listed in Table S1 in the Supplement.
Table 1Overview of the measurement sites included in this study, their locations, and the measurement periods.
2.2 Measurements and volatility determination of OOA particles
2.2.1 Measurements of OOA particles
Particulate oxygenated organic compounds were measured with a FIGAERO-CIMS (Aerodyne Research Inc. or from the University of Washington; Lopez-Hilfiker et al., 2014) using iodide (I−) as the reagent ion. Iodide-CIMS is sensitive to more polar oxygenated organic compounds with three to eight oxygen atoms (Lee et al., 2014; Riva et al., 2019; Huang et al., 2019a). Inlet flow, residence time, particle deposition time, mass loadings on the filter, and instrumental parameters for the different campaigns are summarized in Table S2. Differences in instrumental parameters, such as the ion molecule reaction (IMR) chamber pressure, ion source, ratio of the sample and ionizer flow, and voltage settings of the mass spectrometer, can affect the sensitivities of organic compounds and therefore their measured distribution. Here we simply use mass fractions of compounds calculated using assumed or assessed sensitivities for the individual campaigns and instruments, since the focus of this study is not to report and compare absolute mass concentrations of OOA at different locations. An in-depth analysis of the differences in instrumental parameters among different campaigns, and how they affect the measured OOA composition, is beyond the scope of this paper. Data were analyzed with the software packages tofTools (developed by Junninen et al., 2010) or Tofware (provided by Tofwerk Ltd.).
For REL, RHT, RAB, MCC, and UDL, aerosol particles were measured in situ with FIGAERO-CIMS (Huang et al., 2018; Mohr et al., 2019; Lopez-Hilfiker et al., 2016; Bianchi et al., 2022). Particle-phase backgrounds were assessed in regular intervals by placing an additional Teflon (polytetrafluoroethylene, PTFE) filter upstream of the normal filter and using the same deposition procedure as for the ambient measurements. These data were then used for background subtraction.
For UST and UKA, aerosol particles were deposited on Teflon filters and analyzed later in the laboratory with FIGAERO-CIMS (“offline mode”; see Table S2) (Huang et al., 2019b; Cai et al., 2023). Filters were kept frozen until analysis. Deposition times were varied (see Table S2) based on ambient organic mass concentrations measured by a concurrent high-resolution time-of-flight aerosol mass spectrometer (HR-ToF-AMS; Aerodyne Research Inc.) in order to achieve similar organic mass loadings on the filter and to avoid mass loading effects (Huang et al., 2018; Wang and Hildebrandt Ruiz, 2018). A total of 21 (10) and 29 (23) filter samples were collected in summer (winter) at UST and UKA, respectively. Particle-phase backgrounds were assessed by placing prebaked clean filters in the filter holder at the measurement sites with the deposition flow switched off. These field blank samples were also analyzed by FIGAERO-CIMS in the laboratory like the samples and used for background subtraction.
2.2.2 Volatility determination of OOA particles
OOA volatility was determined for all sites based on FIGAERO-CIMS thermograms and Csat parametrizations. Different temperature ramp rates affect Tmax (Schobesberger et al., 2018; Yang et al., 2021; Ylisirniö et al., 2021; Thornton et al., 2020). The ramp rates for all measurements shown here varied between 6.7 and 13.3°C min−1 (see Table S2), inducing a Tmax difference of up to 5 °C (Schobesberger et al., 2018; Ylisirniö et al., 2021; Thornton et al., 2020). Since for most locations no calibrations of the relationship between Tmax and Csat are available (Wang et al., 2020; Ylisirniö et al., 2021), here we present and discuss only relative variations in thermogram shapes and Tmax, including the variations caused by different ramp rates, and compare them qualitatively to the variation in Csat determined from parametrization.
Csat (298 K) was calculated using the approach by Li et al. (2016) as in Eq. (1) for all sites in order to not introduce more bias:
where nC, nO, nN, and nS are the number of carbon, oxygen, nitrogen, and sulfur atoms in the organic compound, respectively; is the reference carbon number; bC, bO, bN, and bS are the contribution of each atom to log10Csat; and bCO is the carbon–oxygen non-ideality (Donahue et al., 2011). Since the empirical approach by Li et al. (2016) was derived with very few organonitrates, we modified the Csat (298 K) of CHON compounds by treating all NO3 groups like OH groups following the approach by Daumit et al. (2013; Isaacman-VanWertz and Aumont, 2021). However, a recent study has found that the parametrization of Csat for nitrate groups is highly uncertain (Graham et al., 2023). Even for different biogenic terpene + NO3 systems, none of the four parametrizations Graham et al. (2023) investigated performed perfectly for all systems, as parametrizations that are developed based on different datasets comprising different compounds with different functionalities can yield different results for the same dataset (e.g., Graham et al., 2023). For example, the Mohr et al. (2019) parametrization method, which was tuned for –OOH functional groups, was found to work better for the α-pinene + O3 system, and thus it was speculated that the α-pinene + O3 system had more –OOH functional groups. The Daumit et al. (2013) parametrization method, which assumes all oxygen atoms except those from –NO3 are from –OH and =O functional groups, was found to work better for the α-pinene + NO3 system, and thus the α-pinene + NO3 system is speculated to have more –OH and =O groups (Graham et al., 2023). These results again underline the complexity (and with that also the limitations) of assessments of the volatility (especially at the quantitative level) through parametrizations using molecular composition as input, as already shown for laboratory measurements (Graham et al., 2023), and even more so for complex ambient data from different locations and periods.
We also adjusted the Csat (298 K) to the measured ambient temperature, Csat (T), using the approach by Donahue et al. (2011) and Epstein et al. (2010) as in Eqs. (2) and (3):
where T is the temperature in kelvin, Csat (298 K) is the saturation mass concentration at 298 K, ΔHvap is the vaporization enthalpy, and R is the gas constant (8.3143 J K−1 mol−1). We have added a comparison of the results from using the parametrization by Donahue et al. (2011) (Fig. S1a) if making a simple assumption about predominant aliphatic/aromatic OOA at urban sites in winter (i.e., UST-w, UKA-w, and UDL) and predominant isoprene OOA in MCC-t and RAB (Nie et al., 2022). The log10Csat (T) shows a similar trend for both parametrizations; however, the Csat (T) using the Donahue et al. (2011) parametrization is on average 4 to 8 orders of magnitude lower, with the largest difference for UKA-w and smallest for UDL (Fig. S1b). The discrepancies seem to be correlated with the average number of oxygen atoms (nO) in the bulk aerosol of the different environments (Pearson's R: 0.85; Fig. S1b), confirming the influence of different functional groups on parametrization results. Our discussion of volatility results in this study is therefore mostly qualitative.
3.1 Bulk molecular composition of OOA particles
3.1.1 Average number of carbon and oxygen atoms and oxygen-to-carbon ratios
We focus our analysis of the bulk molecular composition of OOA from the different locations here on the average number of carbon (nC) and oxygen atoms (nO), as they affect the parametrized Csat and give an indication of potential precursor sources (Huang et al., 2019a) and oxidation processes, respectively. Figure 1a shows the average mass-weighted nO vs. nC for all compounds with the molecular formula Cx≥1Hy≥1O (CHOX; X represents different atoms such as N, S, Cl, or a combination thereof) measured by FIGAERO-CIMS for each campaign. The markers are color coded by the average mass-weighted oxygen-to-carbon (O : C) ratios. The observed average nC and nO range from 7.7 to 11.2 and from 4.9 to 7.1, respectively. There is an overall trend of increasing nO with increasing nC (Fig. 1a), with the springtime OOA at the rural station in Hyytiälä, Finland (RHT), and the wintertime OOA at the urban station in Delhi, India (UDL), deviating from this general trend (see discussions below). The overall trend shows the effect of the length of the carbon backbone on the number of potential oxygen atoms that can be added to the carbon chain (Huang et al., 2019a).
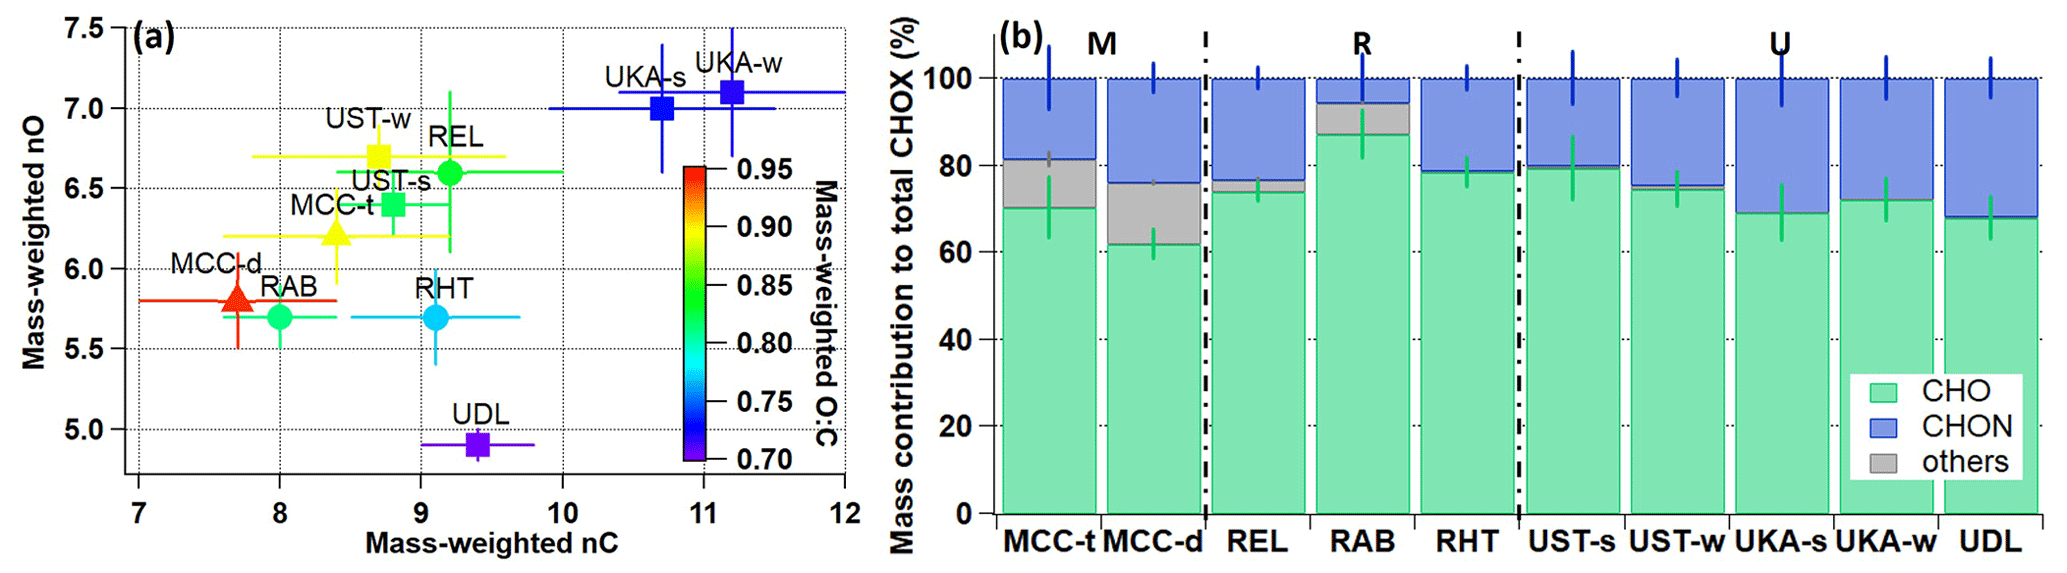
Figure 1(a) The campaign's average mass-weighted number of oxygen atoms (nO) vs. the number of carbon atoms (nC) at the different locations and in the different seasons (mountain sites are represented with triangles, rural sites with circles, and urban sites with squares; for a list of nC and nO values see Table S1), with the markers colored by the corresponding campaign's average mass-weighted oxygen-to-carbon (O : C) ratios. (b) The average mass contributions of organic compounds (separated into CHO, CHON, and other compounds) for the different campaigns (M – mountain sites, R – rural sites, U – urban sites) and seasons (s – summer, w – winter, t – transition, d – dry).
Generally, at the urban sites, OOA particles exhibit on average larger nC (9.8 ± 0.7; average ±1 standard deviation) compared to the rural (8.8 ± 0.6) and mountain stations (8.1 ± 0.8), indicative of different emission sources and OOA precursors (Huang et al., 2019b).
At the mountain site in Chacaltaya, Bolivia, OOA has a relatively longer carbon backbone (nC: 8.4 ± 0.8) in the transition season (MCC-t) than in the dry season (MCC-d; nC: 7.7 ± 0.7). The air masses arriving at Chacaltaya present a diverse mixture from various sources, which vary significantly between the transition and the dry seasons (Aliaga et al., 2021). While air masses arriving at Chacaltaya during the dry season are more affected by volcanic SO2 emissions and anthropogenic compounds such as toluene (also seen in the slightly higher contributions of C7 compounds in Fig. S2) (Bianchi et al., 2022; Zha et al., 2023b), air masses reaching Chacaltaya during the transition season have more influence from, e.g., the Amazon Basin (Aliaga et al., 2021; Zha et al., 2023b); hence, a higher contribution of monoterpene (C10H16) and especially isoprene (C5H8) oxidation products is expected (also reflected in the clear peak of C5 compounds and the second hump of C8–10 compounds in Fig. S2) (Zha et al., 2023a).
Rural Alabama in the US (RAB) and rural Hyytiälä in Finland (RHT), which are both forested stations albeit in different biomes, show distinct OOA compositions with an nC of 8.0 ± 0.4 at RAB and 9.1 ± 0.6 at RHT. This is likely due to the different distributions of terpene emissions with more isoprene at RAB (Lopez-Hilfiker et al., 2016; Lee et al., 2016) and mostly monoterpenes at RHT (Li et al., 2020; Huang et al., 2021). It is also seen in the higher contributions of C8–10 compounds at RHT and comparable contributions of C5 and C8–10 compounds at RAB (Zhang et al., 2018; Massoli et al., 2018) (Fig. S2). The third rural site, REL, which is situated at a location with substantial anthropogenic and biogenic influence dominated by monoterpene emissions (Huang et al., 2019a), has a comparable nC (9.2 ± 0.8) to RHT and again shows a relatively higher contribution of C8–10 compounds (Fig. S2).
For the urban sites, the curb site in Karlsruhe, Germany (UKA), has a larger nC (summer: 10.7 ± 0.8; winter: 11.2 ± 0.8) compared to the urban background site in the nearby city of Stuttgart (UST; summer: 8.8 ± 0.4; winter: 8.7 ± 0.9). The nC in Delhi, India, in wintertime (UDL; 9.4 ± 0.4) is between that of UKA and UST. Such differences are likely due to the UKA and UDL measurement locations being more directly impacted by traffic emissions (Kumar et al., 2022), with higher contributions of larger aromatic compounds (Zheng et al., 2017; Lim et al., 1999). This is substantiated by the observed elevated contributions of C11–18 compounds (Fig. S2) and higher double-bond-equivalent (DBE) values (Table S1). In addition, all three urban sites, despite their very different locations, show a similar seasonal pattern, with higher contributions of C8–10 compounds in summer from biogenic emissions and higher contributions of C6 compounds (e.g., levoglucosan, C6H10O5) in winter due to biomass burning emissions (Fig. S2) (Huang et al., 2019b; Kumar et al., 2022).
While the nC values may give some indication of OOA precursor emission sources, the average nO and O : C ratios are linked to different aging processes and/or varying distance from the sources (Jimenez et al., 2009). The urban stations exhibit on average the lowest O : C ratios (0.76 ± 0.03) compared to the rural (0.80 ± 0.05) and mountain stations (0.91 ± 0.07).
OOA particles during the transition season at the mountain site in Chacaltaya, Bolivia (MCC-t), have a relatively larger nO (6.2 ± 0.3) but slightly lower O : C ratio (0.89 ± 0.08) compared to the dry season (MCC-d; nO: 5.8 ± 0.3; O : C: 0.94 ± 0.05). For two of the rural stations (RAB in the southeastern US and RHT in Finland), nO is comparable (RAB: 5.7 ± 0.2; RHT: 5.7 ± 0.3), but O : C is slightly higher at RAB (0.81 ± 0.04; RHT: 0.77 ± 0.05). This may again be due to the difference in dominating terpene sources (isoprene for RAB (Lopez-Hilfiker et al., 2016) and monoterpenes for RHT (Li et al., 2020), also reflected in Fig. S2). The third rural site, REL in Germany (during summertime with substantial anthropogenic and biogenic influence) (Huang et al., 2019a), has higher nO (6.6 ± 0.5) and O : C (0.83 ± 0.06) compared to RAB and RHT, despite the fairly large nC (9.2 ± 0.8). This could be related to more intense photochemistry/oxidation with higher temperature and/or solar radiation at this site (Table S1). Lower temperature and solar radiation could also be the reason for RHT deviating from the general trend in nO and nC in Fig. 1a.
The urban sites in Germany (Karlsruhe, UKA, and Stuttgart, UST) have similar nO in summer and winter (UKA – summer: 7.0 ± 0.4; winter: 7.1 ± 0.4; UST – summer: 6.4 ± 0.2; winter: 6.7 ± 0.2). In comparison, nO for the Delhi site in winter (UDL) is 4.9 ± 0.1 due to the dominance of primary OA (Kumar et al., 2022), resulting in its deviation from the general trend in nO and nC (Fig. 1a). Moreover, O : C ratios are lower for UKA (summer: 0.73 ± 0.02; winter: 0.73 ± 0.04) and UDL (0.66 ± 0.02) compared to UST (summer: 0.82 ± 0.02; winter: 0.89 ± 0.06), which relates back to its larger nC (see Fig. 1a) as a result of its high proximity to traffic emissions (Kumar et al., 2022) with more larger aromatic compounds (Lim et al., 1999; Zheng et al., 2017) (see discussions above and Fig. S2). Despite the influence of different OOA sources in summer and winter (biogenic emissions vs. biomass burning contributions) for both German urban sites, UKA and UST (Huang et al., 2019b), only UST exhibits higher O : C ratios in winter than in summer. This could be due to the complex topography of the city of Stuttgart, resulting in stronger surface temperature inversions and consequently a longer aging time of air masses (Huang et al., 2019b; Baumbach and Vogt, 2003).
3.1.2 Mass contribution of organonitrates
The presence of NOx during the oxidation of volatile organic compounds (VOCs) can lead to the formation of organonitrates, either via reactions with peroxy radicals or formation of NO3 radicals acting as VOC oxidants, and influence SOA yields and properties of OOA (D'Ambro et al., 2017; Ng et al., 2007; Faxon et al., 2018; Wu et al., 2021). Organonitrates have been found to make up an important fraction of total OA particle mass globally (Kiendler-Scharr et al., 2016; Huang et al., 2019a; Lee et al., 2018). Due to their connection to emissions from fossil fuel burning, they can be indicators of the anthropogenic influence of a particular location. To a lesser extent, lightning is also a source of atmospheric NOx (Murray, 2016). Here we simply group all organic compounds containing at least one nitrogen atom (CHON) and loosely define them as organonitrates (Lee et al., 2016; Huang et al., 2019a). Compounds containing only carbon, hydrogen, and oxygen atoms are grouped as CHO.
The average mass contributions of CHO and CHON for the different locations are shown in Fig. 1b. Overall, CHO compounds clearly dominate the OOA mass at all locations (62.0 %–87.1 %). CHO contributions are on average higher at the rural sites (79.9 ± 5.2 %) compared to the mountain (66.2 ± 5.5 %) and urban sites (72.6 ± 4.3 %), in accordance with their proximity to forested areas. The nitrogen-containing compounds (CHON) contribute 18.7 %–31.8 % to the total OOA mass, except at the rural station in the southeastern US (RAB; 5.6 ± 2.6 %). This low contribution could be due to the less efficient production rates of CHON and/or their faster loss rates caused by hydrolysis under the high-RH conditions there (83.1 ± 15.2 %; Table S1) (Lee et al., 2020; Hu et al., 2011; Lee et al., 2016; Pye et al., 2015). At the mountain site in Chacaltaya, Bolivia, CHON contributes more (23.9 ± 4.1 %) in the dry season (MCC-d) than in the transition season (MCC-t; 18.7 ± 5.9 %) as a result of enhanced transport of anthropogenic pollutants from the nearby La Paz–El Alto metropolitan area during the daytime in the dry season (Bianchi et al., 2022; Aliaga et al., 2021; Zha et al., 2023b). As expected, the largest contributions of CHON compounds are found at the urban stations (27.1 ± 4.3 %), coinciding with their higher NOx levels (15.8 ± 8.7 ppbv; Table S1), but, overall, differences between stations and seasons are small.
The compounds labeled “others” in Fig. 1b are mostly identified as CHOS or CHONS compounds, making up 0.1 %–14.1 % of the total OOA mass. Sulfur-containing compounds exhibit non-negligible contributions for MCC, REL, and RAB. This is likely due to varying sources for these locations: the mountain site in Bolivia (MCC) was influenced by volcanic emissions during the campaign (Bianchi et al., 2022) and the rural sites in central Europe (REL) and the southeastern US (RAB) by nearby refineries and/or power plants (Huang et al., 2019a; Fry et al., 2018).
3.2 Volatility of OOA particles
3.2.1 Volatility derived from molecular composition
For each campaign we calculated Csat (T) for each compound based on its molecular composition (see more details in Sect. 2.2.2) (Donahue et al., 2011; Isaacman-VanWertz and Aumont, 2021; Li et al., 2016; Mohr et al., 2019) and grouped all compounds into a 25-bin volatility basis set (VBS; Fig. S3) (Donahue et al., 2011, 2012). The 25 volatility bins were then further aggregated into extremely low-volatility organic compounds (ELVOCs; Csat (T) lower than 10−4.5 µg m−3), low-volatility organic compounds (LVOCs; Csat (T) between 10−4.5 and 10−0.5 µg m−3), semi-volatile organic compounds (SVOCs; Csat (T) between 10−0.5 and 102.5 µg m−3), and intermediate-volatility organic compounds (IVOCs; Csat (T) between 102.5 and 106.5 µg m−3) (Donahue et al., 2009). The average contributions of different volatility groups to total OOA are shown in Fig. 2, together with the average mass-weighted log10Csat (T). Note that the bulk apparent volatility of OOA particles, i.e., the average mass-weighted log10Csat (T), which represents the overall observed log10Csat (T) of the OOA as a whole (D'Ambro et al., 2018), is different from the log10Csat (T) and volatility of the (pure) compounds detected.
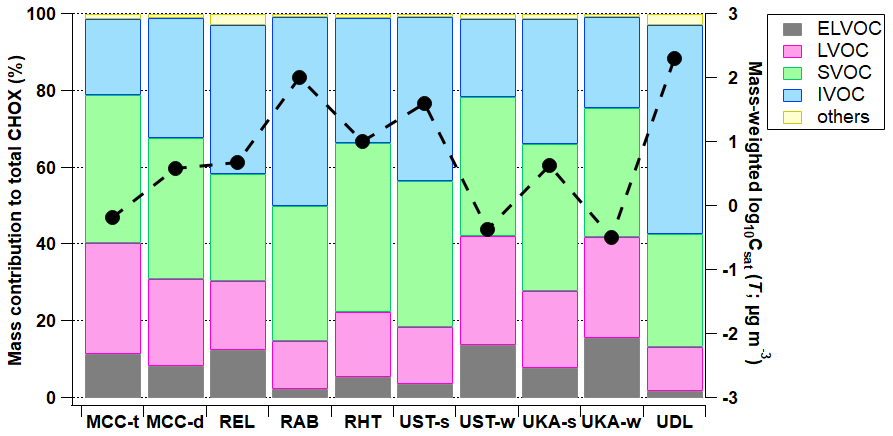
Figure 2The average contribution (%) to total organics of different volatility groups resulting from VBS calculations (colored-in bars) and the average mass-weighted log10Csat (T) values (in black markers) for different campaigns with the modified Li et al. (2016) parametrization method (Daumit et al., 2013; Isaacman-VanWertz and Aumont, 2021). Compounds more volatile than IVOCs with Csat (T) higher than 106.5 µg m−3 (labeled others) contributed negligibly (0.8 %–2.9 %).
We find that the more volatile species with Csat (T) between 100 and 104 µg m−3 make up the biggest mass contributions at all locations (47.7 %–83.8 %); LVOCs and ELVOCs contribute substantially (13.4 %–42.1 %; Figs. 2 and S3). In general, the VBS distribution pattern does not seem to have huge differences across different systems and environments, despite the fact that a large (though not total) fraction of OOA can be detected by iodide-CIMS (Riva et al., 2019; Huang et al., 2021). While LVOCs and ELVOCs may be important for the early stages of atmospheric new particle formation, they certainly do not dominate the OOA mass. Note that thermal decomposition of larger organic compounds during particle desorption with the FIGAERO could contribute, in particular, to the IVOC fraction (Huang et al., 2019b; Lopez-Hilfiker et al., 2016). Resolving and subtracting the thermal decomposition compounds using multi-peak fitting methods (Lutz et al., 2019) or with the help of positive matrix factorization (Buchholz et al., 2020) may, however, introduce uncertainties due to some ambiguity during the implementation and interpretation (Graham et al., 2023; Voliotis et al., 2021). Using the thermal decomposition estimation approach by Wu et al. (2021), the decomposition fraction is estimated to be 5.8 %–35.9 % (see more discussions below), which is close to the thermal fragmentation contributions (1 %–27 %) for nitrate SOA reported in a recent chamber study (Graham et al., 2023). This has an insignificant effect on the bulk molecular composition of OOA particles and is, e.g., within the corresponding standard deviation range of nC, nO, and O : C ratios. If we remove the fraction of signal from potential decomposition products (which is still not ideal), the change in Csat is within the uncertainties of the parametrization method (Isaacman-VanWertz and Aumont, 2021). However, note that the decomposition estimation approach we used in our study was initially used for controlled laboratory studies by Wu et al. (2021) and thus remains a conservative approach for the ambient particle matrix with complex VOCs.
The mountain site in Bolivia exhibits slightly higher contributions from the more volatile species (i.e., IVOCs) in the dry season (MCC-d; 31.2 ± 3.9 %) compared to the transition season (MCC-t; 20.0 ± 5.0 %). Consistently, the average mass-weighted log10Csat (T) value is also higher for MCC-d (0.58 ± 0.35 µg m−3) than for MCC-t (−0.18 ± 0.43 µg m−3). In addition to the higher thermal decomposition contribution for MCC-d (∼ 34.3 %) compared to MCC-t (∼ 26.3 %), higher contributions of CHON and sulfur-containing organic compounds during the dry season (see also Fig. 1b) could also play a role (Peräkylä et al., 2020). Even though the addition of a NO3 functional group is assumed to decrease a compound's vapor pressure by up to several orders of magnitude (Donahue et al., 2011; Graham et al., 2023; Pankow and Asher, 2008), CHON compounds with the same nC and nO as a CHO compound (e.g., C10H15NO7 vs. C10H16O7) are expected to have a higher vapor pressure (Donahue et al., 2011; Lee et al., 2018; Pankow and Asher, 2008). Different origins of air masses and hence atmospheric processing time and chemistry may be another reason for the slight differences in OOA volatility between the seasons (Aliaga et al., 2021; Bianchi et al., 2022).
Among the rural sites in Germany (REL), Finland (RHT), and the southeastern US (RAB), RAB shows the highest volatility (IVOC: 49.2 ± 4.9 %; ELVOC: 2.4 ± 1.3 %; log10Csat (T): 2.0 ± 0.4 µg m−3) compared to REL (IVOC: 38.8 ± 6.3 %; ELVOC: 12.5 ± 5.4 %; log10Csat (T): 0.67 ± 0.67 µg m−3) and RHT (IVOC: 32.7 ± 6.1 %; ELVOC: 5.5 ± 2.1 %; log10Csat (T): 1.0 ± 0.5 µg m−3). RAB is the southernmost station of all rural sites, with the highest RH (also temperature; Table S1) and high emissions of isoprene, and the reactive uptake of isoprene epoxydiol (IEPOX) in aqueous aerosol is thus likely to be a more important SOA pathway compared to REL and RHT. This result again shows that the interpretation of OOA volatility derived from molecular composition is complex and warrants careful consideration of various parameters (Graham et al., 2023; Voliotis et al., 2021).
The urban site in Delhi, India (UDL), exhibits the lowest LVOC and ELVOC mass fractions (13.4 % in total) and the highest IVOC mass fractions (54.5 ± 3.4 %) and mass-weighted log10Csat (T) values (2.3 ± 0.3 µg m−3; also consistent with its lowest O : C ratios; see Fig. 1a) compared to the two urban sites in Germany (UKA – LVOC + ELVOC: 18.4 %–42.1 %; IVOC: 20.5 %–42.8 %; log10Csat (T): −0.37–1.6 µg m−3; UST – LVOC + ELVOC: 27.9 %–41.9 %; IVOC: 23.8 %–32.5 %; log10Csat (T): −0.50–0.63 µg m−3). The relatively higher volatility of OOA in Delhi compared to that in the German cities may likely be related to the dominance of primary OA with very high biomass burning (also reflected in the large peak of C6 compounds in Fig. S2) and traffic emissions (Kumar et al., 2022). The biomass burning vapors have been found to be responsible for the nighttime particle growth at UDL (Mishra et al., 2023). As for UKA and UST, higher LVOC and ELVOC mass fractions (41.9 %–42.1 %) and lower mass-weighted log10Csat (T) values (−0.50–0.37 µg m−3) are observed in winter compared to summer (18.4 %–27.9 % and 0.63–1.6 µg m−3, respectively), indicating that the bulk winter OOA is less volatile. Similar results were also observed in Zurich, Switzerland, based on AMS data (Canonaco et al., 2015). Higher O : C ratios (Fig. 1a) could be part of the reason for the less volatile OOA in winter in Stuttgart (UST) compared to summer (Huang et al., 2019b). For the Karlsruhe curb site (UKA), the O : C ratios are quite similar in winter and summer (Fig. 1a), and therefore other factors, such as the relatively higher contributions of larger molecules (nC > 16; Fig. S2) and the reduced volatility of OOA from biomass burning due to aging processes (Keller and Burtscher, 2017) (see also the higher O : C ratios in Fig. 1a compared to UDL with more primary emissions; Kumar et al., 2022), might play a role.
The mass-weighted log10Csat (T) shows a qualitatively similar distribution to the ambient temperature (Pearson's R: 0.58; Figs. S4 and S5). This makes sense insofar as, on the one hand, the log10Csat (T) calculated using molecular composition is shifted based on ambient temperature (compare Eq. 2) – the same compound exhibits a higher apparent volatility under warmer conditions and vice versa; on the other hand, a higher apparent volatility is also expected at higher ambient temperatures due to higher local emissions of biogenic precursors. In addition, we find a positive correlation between log10Csat (T) and humidity (Pearson's R for RH and absolute humidity: 0.57 and 0.68, respectively; Fig. S5), indicating potential hydrolysis effects on OOA particles (forming smaller and more volatile compounds) caused by potentially high aerosol liquid water content at higher humidity levels (Lee et al., 2020; Hu et al., 2011; Hinks et al., 2018). Negative correlations are found between log10Csat (T) vs. nO (Pearson's R: −0.72) and the average mass-weighted molecular weight (MW) of CHOX compounds (Pearson's R: −0.56), following the parametrization assumption of the oxidation effect on volatility and of lower volatility for larger and complex molecules (Donahue et al., 2011).
3.2.2 Volatility derived from thermograms
We further investigate the volatility derived from FIGAERO thermograms qualitatively for the different sites and compare it to the volatility derived from the molecular composition measurements. It is important to note that, similar to D'Ambro et al. (2018), the term volatility discussed here refers to the effective volatility of bulk OOA particles, which combines the impacts of diffusion limitations and thermal decomposition of lower-volatility species. Here we focus the bulk OOA volatility analysis on the shape and distribution of sum thermograms, which are found to give representative qualitative volatility estimations as they take into account the whole signal distribution and reduce potential artifacts from the thermal decomposition of individual compounds (Voliotis et al., 2021).
The campaign's average sum thermograms of CHOX compounds (i.e., the sum of the mass spectral signal evolution of all CHOX compounds as a function of desorption temperature) for the different locations are shown in Fig. 3, normalized to their maximum values. Sum thermogram shapes vary for different environments, and they exhibit maximum signal at temperatures (sumTmax) ranging from 80.5 to 146.3 °C (see also Fig. S6). Such differences of sumTmax of > 60 °C across different systems and environments are hardly surprising, given the large spread in Tmax for all compounds in one single mass spectrum (Huang et al., 2019b; Wang and Hildebrandt Ruiz, 2018), in Tmax calibrations with different instrumental settings, experimental procedures, or calibrants (Wang et al., 2020; Ylisirniö et al., 2021), as well as for one compound with the same molecular formula between day and night (Thompson et al., 2017; Gaston et al., 2016), between the field and laboratory (Thompson et al., 2017), or over a whole campaign period using the same instrument and operating conditions (Thompson et al., 2017) (see an example of C6H10O5, the molecular formula corresponding to levoglucosan, in Fig. S7). However, Tmax variation due to different instruments or operating conditions is generally smaller than that from the difference in monomers and dimers (Wu et al., 2021) and other factors like the presence of isomers (Thompson et al., 2017; Masoud and Ruiz, 2021) and particle-phase diffusivity, viscosity, and matrix effects (Huang et al., 2018; Ren et al., 2022). Different FIGAERO geometry was speculated to not induce significant Tmax changes (Ylisirniö et al., 2021). The ramp rates for all measurements shown in the present study varied between 6.7 and 13.3 °C min−1 (see Table S2), inducing a Tmax difference of a maximum of 5 °C (Schobesberger et al., 2018; Ylisirniö et al., 2021; Thornton et al., 2020). Correction of the Tmax values to a filter mass loading of 1 µg following our approach outlined earlier (Huang et al., 2018) only leads to a Tmax change of < 5 °C. It is also worth noting that thermal decomposition of larger organic compounds during particle desorption with the FIGAERO could form products with lower masses and lower Tmax values and hence higher effective volatility. Although the calculated decomposition fraction has a minor effect on the molecular composition of OOA particles (see more details in Sect. 3.2.1), the contribution of fragments to their parent compounds and the impact on the “original” volatility should not be ignored.
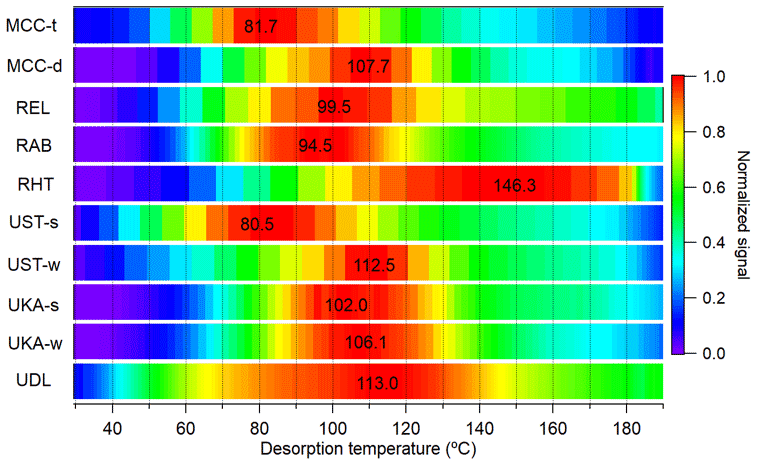
Figure 3Average sum thermograms of CHOX compounds (normalized to their maximum values) for all campaigns, with corresponding sumTmax values labeled in the plot.
The mountain site in Bolivia in the transition season (MCC-t) exhibits some of the lowest sumTmax values of all stations (81.7 °C), indicating relatively higher bulk volatility. In contrast, during the dry season, the bulk OOA appears less volatile (MCC-d sumTmax: 107.7 °C). This trend is in disagreement with log10Csat (T), which is higher for MCC-d (i.e., higher volatility) than for MCC-t. The discrepancy could be due to thermal fragmentation of larger oligomeric molecules, which biases the Csat results and, to a lesser extent, the sum thermogram shape towards higher volatilities due to the dominance of monomer species (i.e., ending up with a “tail”). Compared to MCC-t (∼ 26.6 %), MCC-d exhibits a higher contribution of thermal fragmentation (∼ 35.9 %; also reflected in the higher IVOC fractions in Fig. 2a), with multi-mode thermograms showing elevated signals at high desorption temperatures (∼ 150 °C), i.e., long tails (see also Fig. S6a–b).
The rural sites in Germany (REL) and the southeastern US (RAB) have similar sumTmax values of ∼ 100 °C. Both also show contributions (up to 21 %) from thermal fragmentation through multi-mode thermograms or long tails at high desorption temperatures (∼ 150 °C; see also Fig. S6c–d; similar to the dry season for the mountain site MCC-d). The lowest sumTmax value (94.5 °C) at RAB is consistent with its highest average log10Csat (T) value (2.0 ± 0.4 µg m−3) among the rural stations. The rural site in Finland (RHT) exhibits a high sumTmax value of 146.3 °C, with the thermogram shape reaching a plateau after 120 °C and the signal only starting to decrease at a desorption temperature > 180 °C (see also Fig. S6e). This might be related to an older age (D'Ambro et al., 2018) and/or a more viscous phase state of the OOA particles at RHT, caused by its lowest temperature and RH among all rural stations (Table S1) (Shiraiwa et al., 2011), affecting the evaporative behavior and inferred volatility of the particle-bound compounds (Yli-Juuti et al., 2017; Huang et al., 2018).
The urban sites in Germany (UKA and UST) exhibit similar trends in sumTmax, with relatively higher values in winter (106.1–112.5 °C) compared to summer (80.5–102.0 °C). Such a seasonal trend is mirrored in their average log10Csat (T) values. The differences in sumTmax between summer and winter are found to be larger for Stuttgart (UST; ∼ 32 °C) than for Karlsruhe (UKA; ∼ 4 °C). This could be due to the differences in measurement environments and topography. The topography at UST prevents dispersion (Huang et al., 2019b; Baumbach and Vogt, 2003), and the formation of more oxygenated molecules in winter at UST can thus be expected due to the longer residence time of the air masses (Buchholz et al., 2019) (also reflected in the higher O : C ratios; see Fig. 1a). The UKA site is a curb site with more influence from direct traffic emissions (Kumar et al., 2022), including larger aromatic compounds (Lim et al., 1999; Zheng et al., 2017) (see abovementioned discussions and Fig. S2), and smaller differences for summer vs. winter are therefore expected. During winter, the Delhi site in India (UDL) exhibits a similar sumTmax value (113.0 °C) to UST and UKA (106.1–112.5 °C). All three urban locations show an indication of a substantial contribution (up to 14 %) of thermal fragmentation in their thermograms (see also Fig. S6f–j), which might also be the reason for the highest sumTmax value not corresponding to the lowest log10Csat (T) value, similar to MCC.
As shown in earlier publications (Huang et al., 2018; Ylisirniö et al., 2021), the connection between Tmax and volatility is complex, and direct relationships between Tmax and vapor pressure can only be established for solutions of pure or a few compounds (Wang et al., 2020; Ylisirniö et al., 2021; Ren et al., 2022). For the complex ambient particle matrix, factors other than the pure compounds' vapor pressures come into play, such as the presence of isomers with different vapor pressures (Thompson et al., 2017), thermal decomposition contributions of larger molecules (Lopez-Hilfiker et al., 2015), and matrix effects and viscosity (Huang et al., 2018; D'Ambro et al., 2017; Wang and Hildebrandt Ruiz, 2018), even for the same compounds in solutions mixed with different species (Ren et al., 2022). This is exemplified here, with varying Tmax values for compounds with the same molecular formula across different campaigns (with an average Tmax difference of 55.0 ± 24.3 °C), such as C5H12O4 (molecular formula corresponding to 2-methyltetrol, a tracer of isoprene oxidation products; D'Ambro et al., 2019), C6H10O5 (molecular formula corresponding to levoglucosan, a tracer of biomass burning; Saarnio et al., 2010), C8H10O5 (identified in the laboratory as a monoterpene oxidation product; Hammes et al., 2019), C8H12O5 (molecular formula corresponding to 2-hydroxyterpenylic acid identified in α-pinene SOA; Claeys et al., 2009), C10H15NO7 (identified in the laboratory as a monoterpene oxidation product; Boyd et al., 2015; Faxon et al., 2018), and C17H24O6 (identified in the laboratory as a monoterpene oxidation product; Kenseth et al., 2020; Fig. S8). Such variation may be due to actual changes in effective volatilities of the observed OOA components, experimental factors, or both. However, as we discussed earlier, Tmax variation due to different instruments or operating conditions is generally smaller compared to that due to changes in physicochemical properties. Therefore, the relative variations in thermogram shapes and Tmax we present and discuss in our study are dominated by the presence of isomers (Thompson et al., 2017; Masoud and Ruiz, 2021) and particle-phase diffusivity, viscosity, and matrix effects (Huang et al., 2018; Ren et al., 2022). Due to unavailable calibrations of the relationship between Tmax and Csat (Wang et al., 2020; Ylisirniöet al., 2021) for most locations, the analysis and interpretation of OOA volatility based on FIGAERO-CIMS thermograms are challenging and, in the absence of additional constraints on OOA composition and thermal behavior, currently remain at the qualitative level (Graham et al., 2023; Voliotis et al., 2021), especially for complex field data.
Similar to log10Csat (T), we also compare the sumTmax with various environmental and measurement parameters (Fig. S9). Correlations of sumTmax values with other parameters (e.g., meteorology, trace gases) are weak (Pearson's R within ±0.3). These results further show the complexity of assessing the effective volatility derived from thermogram behavior and Tmax, especially for a diverse set of field data. Contributing to the lack of clear correlations in this analysis may be potential effects of experimental parameters on the FIGAERO thermograms (Table S2) (Thornton et al., 2020), as well as open questions regarding their interpretation, as noted above.
3.3 Relationship between thermal-desorption-derived volatility and molecular-composition-derived volatility
In order to investigate whether there is consistency in the bulk OOA volatility derived from molecular composition and thermograms, we compare the average log10Csat (i.e., molecular-composition-derived volatility) with the sumTmax (i.e., thermal-desorption-derived volatility) in Figs. 4 and S10. The gray area covers the previously reported calibration fit curves of log10Csat (298 K) vs. calibrant Tmax values in colored dashed lines. As we can see from Fig. 4, overall the log10Csat (298 K) values from different locations are close to the range given by the calibration curves. However, it is important to note that this does not suggest Tmax calibrations are not needed for field measurements (unavailable for our datasets). Although we cannot find a correlation between log10Csat (298 K) and sumTmax with all data points included, such a correlation might be improved to some extent with laboratory Tmax calibrations. This again underlines the complexity of assessments of the volatility through either method, as already shown for laboratory measurements (Graham et al., 2023), but even more so for comparisons of complex ambient data from different locations and periods and with different instrument versions (see Table S2).
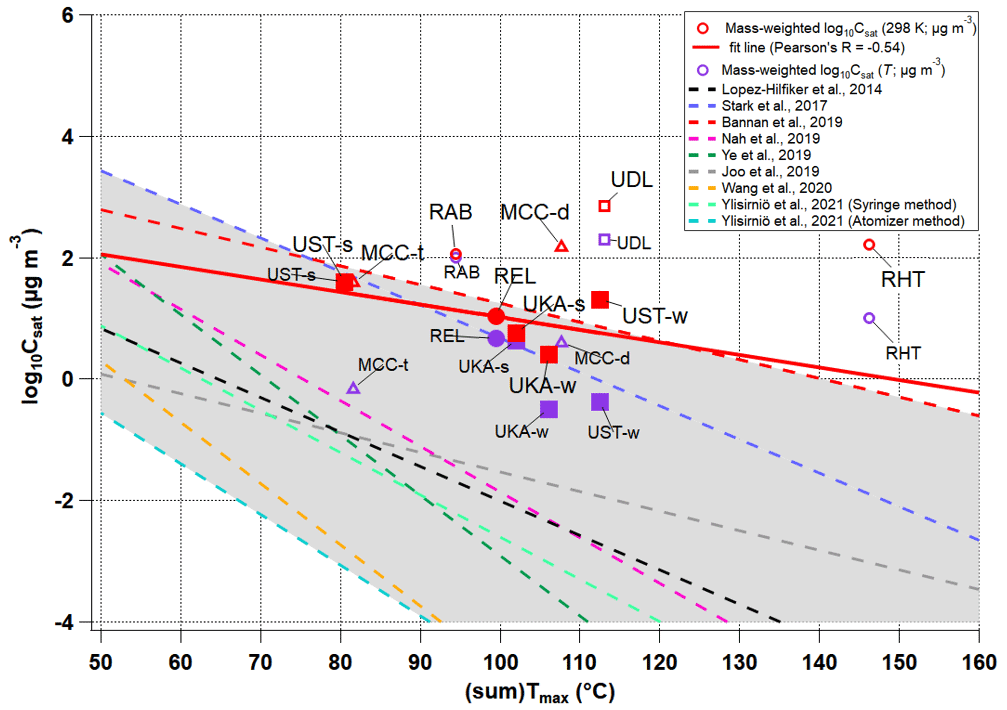
Figure 4Comparison of the campaign's average mass-weighted log10Csat and sumTmax values for different locations and seasons (mountain sites are represented with triangles, rural sites with circles, and urban sites with squares), with mass-weighted log10Csat (298 K) in red and mass-weighted log10Csat (T) in purple. The solid red line is the fit line for the solid red markers only, the data of which are from the same FIGAERO setup. The gray area covers the previously reported calibrations of log10Csat (298 K) vs. calibrant Tmax values with colored dashed lines. The wide spread of these calibration lines is believed to result from variations in instrument designs, experimental procedures, and the ranges of calibration compounds used (Ylisirniö et al., 2021).
If we only focus on the datasets collected with the same FIGAERO setup (REL, UST-s, UST-w, UKA-s, and UKA-w), assuming similar calibration factors, a negative correlation (Pearson's R: −0.54) is observed between log10Csat (298 K) and sumTmax. And the correlation still holds between ambient-temperature-corrected log10Csat and sumTmax (Pearson's R: −0.92). Although Csat values can be biased by orders of magnitude using different parametrization methods (Graham et al., 2023), the general slope and trend are similar to the calibration curves or to those using other parametrization methods such as the Donahue et al. (2011) method (Fig. S1). Hence, the results provide an overall broad qualitative agreement between bulk volatility derived from thermograms and composition.
Other than the effects of different FIGAERO geometries (Ylisirniö et al., 2021), parameters affecting the correlation between log10Csat and sumTmax are manifold, and the correlation is subject to uncertainties and artifacts for both methods. On the one hand, molecular-composition-derived volatility is limited by its incapability to differentiate isomers with different vapor pressures since it is solely based on molecular formula (Graham et al., 2023), and the bulk OOA volatility for the complex ambient particle matrix may also diverge from the sum of individual parametrized Csat due to non-ideal intermolecular interactions (Compernolle et al., 2011; Isaacman-VanWertz and Aumont, 2021), in addition to the highly uncertain parametrization of Csat for organonitrates with multiple nitrate groups (Graham et al., 2023). On the other hand, thermal-desorption-derived volatility can suffer from artifacts of oligomer content, viscosity, and possible mutual interactions between them (i.e., oligomer content vs. viscosity) (Huang et al., 2018; D'Ambro et al., 2017; Wang and Hildebrandt Ruiz, 2018). Thermal decomposition of larger oligomeric molecules can bias the Csat and, to a lesser extent, the sum thermogram shape and sumTmax towards higher volatilities due to the dominance of monomer species (i.e., ending up with a longer tail). There have been attempts to separate the thermal decomposition contribution for individual thermograms (Lutz et al., 2019; D'Ambro et al., 2018; Buchholz et al., 2020; Wu et al., 2021), but this poses the threat of introducing new uncertainties due to the difficulty in, e.g., differentiating isomers from thermal decomposition products and monomers from dimers in ambient samples with complex VOC precursors (Graham et al., 2023; Voliotis et al., 2021). Overall, however, for a limited number of our datasets from the exact same instrument, the lower apparent volatility (i.e., higher sumTmax) agrees qualitatively with the lower log10Csat values, corroborating potential relationships and interconnections between volatility and chemical composition across different environments and systems despite the large uncertainties and artifacts of both methods.
In this paper, the molecular composition and volatility of OOA particles in different rural, urban, and mountain environments were investigated with the deployments of FIGAERO-CIMS. We find distinct molecular composition for different environments: OOA particles exhibit on average larger nC and lower O : C ratios at the urban sites (nC: 9.8 ± 0.7; O : C: 0.76 ± 0.03), followed by the rural (nC: 8.8 ± 0.6; O : C: 0.80 ± 0.05) and mountain stations (nC: 8.1 ± 0.8; O : C: 0.91 ± 0.07), indicative of different emission sources and chemistry. While the CHO contributions are on average higher (79.9 ± 5.2 %) compared to the mountain (66.2 ± 5.5 %) and urban sites (72.6 ± 4.3 %), in accordance with their proximity to forested areas, the largest contributions of CHON compounds are found at the urban stations (27.1 ± 4.3 %), consistent with their higher NOx levels.
Moreover, the bulk OOA volatility differences are found in Csat values of up to ∼ 3 orders of magnitude and in thermogram shapes with average sumTmax values of up to 60 °C across different locations and systems. Despite the uncertainties/limitations for volatility derived from both sumTmax and molecular formula as well as the translated uncertainties in the relationship between them, sumTmax is found to exhibit an overall negative correlation with molecular-formula-based Csat, suggesting a potential relationship/interlink between the volatility and chemical composition for the different locations and systems.
Here, using FIGAERO-CIMS measurements of OOA particles from various locations, we achieve a comprehensive picture of the relationship/interconnection between the volatility and chemical composition of OOA particles in different rural, urban, and mountain environments, which are characterized by different ambient meteorological parameters, trace gas levels, emission sources/chemistry, and resulting distinct OOA molecular composition and volatility. Our study shows a connection between chemical composition and thermal desorption behavior but also the limitations of using measurements of either for the assessment of volatility. Thermal decomposition is a well-known issue for FIGAERO-CIMS measurements; however, the effects on the bulk molecular composition and sum thermograms of all detected OOA compounds for most sites studied here are not significant as these thermally unstable oligomers do not dominate the OOA mass. For some locations with multi-mode thermograms dominated by the second mode (e.g., MCC-d, RHT, and UDL; see Fig. S6), the effects would be larger. Still, alternative approaches need to be developed for more quantitative estimations of volatility from FIGAERO-CIMS measurements.
Overall we find that it is clearly the chemical composition of OOA that determines its apparent volatility and that environmental conditions (e.g., ambient temperature) play a lesser, secondary role through their influence on the sources and chemistry of a particular environment, such as seasonal patterns of biogenic emissions and human behavior (e.g., residential heating). For example, summer OOA particles tend to be more volatile than winter OOA particles due to higher ambient temperatures in summer and consequently higher local emissions of biogenic precursors and higher reaction rates. In winter, OOA particles are subject to higher biomass burning emissions and/or traffic emissions from human activities. Therefore, the importance of the chemical composition and environmental conditions (e.g., ambient temperature) for the apparent volatility of OOA particles is different, with the chemical composition (i.e., sources and chemistry) being a more direct and important factor than the environmental conditions. The comprehensive dataset from our results shows the complex thermodynamics and chemistry of OOA and their changes during its lifetime in the atmosphere and that the chemical description of OOA generally suffices to predict its apparent volatility, at least qualitatively. Considering the major contribution of OA to total aerosol mass concentrations and implications for both human health and climate change (Jimenez et al., 2009; Nel, 2005; IPCC, 2021), our study provides new insights that will help guide choices of, e.g., descriptions of OOA volatility in different model frameworks. For example, with a better constraint on the volatility of condensable vapors and the associated particles using, e.g., the up-to-date CIMS measurements, the study could contribute to understanding the underlying oxidative chemistry and a better OA representation in air quality models. The potential contribution of co-condensation of organic vapors to aerosol forcing or to future cloud radiative effects could also be better accounted for in cloud parcel models (Heikkinen et al., 2023). A better understanding of the chemical nature and volatility of OA components can thus ultimately improve predictions of atmospheric organic particle mass and climate effects of atmospheric OA.
The data that are used in the figures can be found at https://doi.org/10.5281/zenodo.7983797 (Huang, 2023).
The supplement related to this article is available online at: https://doi.org/10.5194/acp-24-2607-2024-supplement.
JT, HS, DG, and CM designed the research; WH, CW, LG, YG, SLH, FDLH, BHL, JS, XS, RR, SNT, DG, FJ, MV, and CM conducted field measurements; WH, CW, LG, SLH, FDLH, BHL, JS, HS, XS, SNT, DG, and CM analyzed the data; CW, LG, YG, SLH, JT, SS, TYJ, JS, HS, XS, MV, and CM provided suggestions for the data analysis, interpretation, and discussion; WH and CM wrote the paper with contributions from all authors. All authors have given approval to the final text.
At least one of the (co-)authors is a member of the editorial board of Atmospheric Chemistry and Physics. The peer-review process was guided by an independent editor, and the authors also have no other competing interests to declare.
Publisher’s note: Copernicus Publications remains neutral with regard to jurisdictional claims made in the text, published maps, institutional affiliations, or any other geographical representation in this paper. While Copernicus Publications makes every effort to include appropriate place names, the final responsibility lies with the authors.
The technical support by the staff at IMK-AAF is gratefully acknowledged. The support by the Deutsche Bahn AG, University of Stuttgart, and partners of the Three-Dimensional Observation of Atmospheric Processes in Cities (3DO) project during the UST campaigns is gratefully acknowledged. The support by the University of Helsinki, Innsbruck University, Stockholm University, and Universidad Mayor de San Andrés during the MCC campaign is gratefully acknowledged.
We acknowledge the financial support from the Graduate School of the Centre for Climate and Environment of the Karlsruhe Institute of Technology (GRACE). We also thank the Central Pollution Control Board (CPCB) and the government of India; the Center of Excellence Advanced Technologies for Monitoring Air-quality iNdicators (ATMAN) approved by the PSA office and the government of India; and a group of philanthropic funders including Bloomberg Philanthropies, Open Philanthropy, and the Clean Air Fund for their financial support during the campaign at the UDL site. Linyu Gao, Junwei Song, and Feng Jiang are thankful for the financial support from the China Scholarship Council (CSC).
This research has been supported by the H2020 European Research Council (CHAPAs, grant no. 850614), the Academy of Finland (grant nos. 337550 and 346371), the Knut och Alice Wallenbergs Stiftelse (WAF project CLOUDFORM, grant no. 2017.0165), the Graduate School of the Centre for Climate and Environment of the Karlsruhe Institute of Technology (GRACE), the Central Pollution Control Board (CPCB) and the government of India (grant no. AQM/Source apportionment_EPC Project/2017), the Center of Excellence Advanced Technologies for Monitoring Air-quality iNdicators (ATMAN), Bloomberg Philanthropies, Open Philanthropy, the Clean Air Fund, and the China Scholarship Council (CSC).
This paper was edited by Joachim Curtius and reviewed by Thomas Mentel and one anonymous referee.
Aliaga, D., Sinclair, V. A., Andrade, M., Artaxo, P., Carbone, S., Kadantsev, E., Laj, P., Wiedensohler, A., Krejci, R., and Bianchi, F.: Identifying source regions of air masses sampled at the tropical high-altitude site of Chacaltaya using WRF-FLEXPART and cluster analysis, Atmos. Chem. Phys., 21, 16453–16477, https://doi.org/10.5194/acp-21-16453-2021, 2021.
Bannan, T. J., Le Breton, M., Priestley, M., Worrall, S. D., Bacak, A., Marsden, N. A., Mehra, A., Hammes, J., Hallquist, M., Alfarra, M. R., Krieger, U. K., Reid, J. P., Jayne, J., Robinson, W., McFiggans, G., Coe, H., Percival, C. J., and Topping, D.: A method for extracting calibrated volatility information from the FIGAERO-HR-ToF-CIMS and its experimental application, Atmos. Meas. Tech., 12, 1429–1439, https://doi.org/10.5194/amt-12-1429-2019, 2019.
Bardakov, R., Thornton, J. A., Riipinen, I., Krejci, R., and Ekman, A. M. L.: Transport and chemistry of isoprene and its oxidation products in deep convective clouds, Tellus B, 73, 1979856, https://doi.org/10.1080/16000889.2021.1979856, 2021.
Baumbach, G. and Vogt, U.: Influence of inversion layers on the distribution of air pollutants in urban areas, Water Air Soil Poll. Focus, 3, 67–78, https://doi.org/10.1023/A:1026098305581, 2003.
Bianchi, F., Sinclair, V. A., Aliaga, D., Zha, Q., Scholz, W., Wu, C., Heikkinen, L., Modini, R., Partoll, E., Velarde, F., Moreno, I., Gramlich, Y., Huang, W., Leiminger, M., Enroth, J., Peräkylä, O., Marinoni, A., Xuemeng, C., Blacutt, L., Forno, R., Gutierrez, R., Ginot, P., Uzu, G., Facchini, M. C., Gilardoni, S., Gysel-Beer, M., Cai, R., Petäjä, T., Rinaldi, M., Saathoff, H., Sellegri, K., Worsnop, D., Artaxo, P., Hansel, A., Kulmala, M., Wiedensohler, A., Laj, P., Krejci, R., Carbone, S., Andrade, M., and Mohr, C.: The SALTENA Experiment: Comprehensive Observations of Aerosol Sources, Formation, and Processes in the South American Andes, B. Am. Meteorol. Soc., 103, E212–E229, https://doi.org/10.1175/BAMS-D-20-0187.1, 2022.
Boyd, C. M., Sanchez, J., Xu, L., Eugene, A. J., Nah, T., Tuet, W. Y., Guzman, M. I., and Ng, N. L.: Secondary organic aerosol formation from the β-pinene + NO3 system: effect of humidity and peroxy radical fate, Atmos. Chem. Phys., 15, 7497–7522, https://doi.org/10.5194/acp-15-7497-2015, 2015.
Buchholz, A., Lambe, A. T., Ylisirniö, A., Li, Z., Tikkanen, O.-P., Faiola, C., Kari, E., Hao, L., Luoma, O., Huang, W., Mohr, C., Worsnop, D. R., Nizkorodov, S. A., Yli-Juuti, T., Schobesberger, S., and Virtanen, A.: Insights into the O : C-dependent mechanisms controlling the evaporation of α-pinene secondary organic aerosol particles, Atmos. Chem. Phys., 19, 4061–4073, https://doi.org/10.5194/acp-19-4061-2019, 2019.
Buchholz, A., Ylisirniö, A., Huang, W., Mohr, C., Canagaratna, M., Worsnop, D. R., Schobesberger, S., and Virtanen, A.: Deconvolution of FIGAERO–CIMS thermal desorption profiles using positive matrix factorisation to identify chemical and physical processes during particle evaporation, Atmos. Chem. Phys., 20, 7693–7716, https://doi.org/10.5194/acp-20-7693-2020, 2020.
Cai, J., Daellenbach, K. R., Wu, C., Zheng, Y., Zheng, F., Du, W., Haslett, S. L., Chen, Q., Kulmala, M., and Mohr, C.: Characterization of offline analysis of particulate matter with FIGAERO-CIMS, Atmos. Meas. Tech., 16, 1147–1165, https://doi.org/10.5194/amt-16-1147-2023, 2023.
Canonaco, F., Slowik, J. G., Baltensperger, U., and Prévôt, A. S. H.: Seasonal differences in oxygenated organic aerosol composition: implications for emissions sources and factor analysis, Atmos. Chem. Phys., 15, 6993–7002, https://doi.org/10.5194/acp-15-6993-2015, 2015.
Claeys, M., Iinuma, Y., Szmigielski, R., Surratt, J. D., Blockhuys, F., Van Alsenoy, C., Böge, O., Sierau, B., Gómez-González, Y., Vermeylen, R., Van der Veken, P., Shahgholi, M., Chan, A. W. H., Herrmann, H., Seinfeld, J. H., and Maenhaut, W.: Terpenylic acid and related compounds from the oxidation of α-pinene: Implications for new particle formation and growth above forests, Environ. Sci. Technol., 43, 6976–6982, https://doi.org/10.1021/es9007596, 2009.
Compernolle, S., Ceulemans, K., and Müller, J.-F.: EVAPORATION: a new vapour pressure estimation methodfor organic molecules including non-additivity and intramolecular interactions, Atmos. Chem. Phys., 11, 9431–9450, https://doi.org/10.5194/acp-11-9431-2011, 2011.
D'Ambro, E. L., Lee, B. H., Liu, J., Shilling, J. E., Gaston, C. J., Lopez-Hilfiker, F. D., Schobesberger, S., Zaveri, R. A., Mohr, C., Lutz, A., Zhang, Z., Gold, A., Surratt, J. D., Rivera-Rios, J. C., Keutsch, F. N., and Thornton, J. A.: Molecular composition and volatility of isoprene photochemical oxidation secondary organic aerosol under low- and high-NOx conditions, Atmos. Chem. Phys., 17, 159–174, https://doi.org/10.5194/acp-17-159-2017, 2017.
D'Ambro, E. L., Schobesberger, S., Zaveri, R. A., Shilling, J. E., Lee, B. H., Lopez-Hilfiker, F. D., Mohr, C., and Thornton, J. A.: Isothermal Evaporation of alpha-Pinene Ozonolysis SOA: Volatility, Phase State, and Oligomeric Composition, ACS Earth Space Chem., 2, 1058–1067, https://doi.org/10.1021/acsearthspacechem.8b00084, 2018.
D'Ambro, E. L., Schobesberger, S., Gaston, C. J., Lopez-Hilfiker, F. D., Lee, B. H., Liu, J., Zelenyuk, A., Bell, D., Cappa, C. D., Helgestad, T., Li, Z., Guenther, A., Wang, J., Wise, M., Caylor, R., Surratt, J. D., Riedel, T., Hyttinen, N., Salo, V.-T., Hasan, G., Kurtén, T., Shilling, J. E., and Thornton, J. A.: Chamber-based insights into the factors controlling epoxydiol (IEPOX) secondary organic aerosol (SOA) yield, composition, and volatility, Atmos. Chem. Phys., 19, 11253–11265, https://doi.org/10.5194/acp-19-11253-2019, 2019.
Daumit, K. E., Kessler, S. H., and Kroll, J. H.: Average chemical properties and potential formation pathways of highly oxidized organic aerosol, Faraday Discuss., 165, 181–202, https://doi.org/10.1039/C3FD00045A, 2013.
Donahue, N. M., Robinson, A. L., and Pandis, S. N.: Atmospheric organic particulate matter: from smoke to secondary organic aerosol, Atmos. Environ., 43, 94–106, https://doi.org/10.1016/j.atmosenv.2008.09.055, 2009.
Donahue, N. M., Epstein, S. A., Pandis, S. N., and Robinson, A. L.: A two-dimensional volatility basis set: 1. organic-aerosol mixing thermodynamics, Atmos. Chem. Phys., 11, 3303–3318, https://doi.org/10.5194/acp-11-3303-2011, 2011.
Donahue, N. M., Kroll, J. H., Pandis, S. N., and Robinson, A. L.: A two-dimensional volatility basis set – Part 2: Diagnostics of organic-aerosol evolution, Atmos. Chem. Phys., 12, 615–634, https://doi.org/10.5194/acp-12-615-2012, 2012.
Epstein, S. A., Riipinen, I., and Donahue, N. M.: A semiempirical correlation between enthalpy of vaporization and saturation concentration for organic aerosol, Environ. Sci. Technol., 44, 743–748, https://doi.org/10.1021/es902497z, 2010.
Faxon, C., Hammes, J., Le Breton, M., Pathak, R. K., and Hallquist, M.: Characterization of organic nitrate constituents of secondary organic aerosol (SOA) from nitrate-radical-initiated oxidation of limonene using high-resolution chemical ionization mass spectrometry, Atmos. Chem. Phys., 18, 5467–5481, https://doi.org/10.5194/acp-18-5467-2018, 2018.
Fry, J. L., Brown, S. S., Middlebrook, A. M., Edwards, P. M., Campuzano-Jost, P., Day, D. A., Jimenez, J. L., Allen, H. M., Ryerson, T. B., Pollack, I., Graus, M., Warneke, C., de Gouw, J. A., Brock, C. A., Gilman, J., Lerner, B. M., Dubé, W. P., Liao, J., and Welti, A.: Secondary organic aerosol (SOA) yields from NO3 radical + isoprene based on nighttime aircraft power plant plume transects, Atmos. Chem. Phys., 18, 11663–11682, https://doi.org/10.5194/acp-18-11663-2018, 2018.
Gaston, C. J., Lopez-Hilfiker, F. D., Whybrew, L. E., Hadley, O., McNair, F., Gao, H. L., Jaffe, D. A., and Thornton, J. A.: Online molecular characterization of fine particulate matter in Port Angeles, WA: Evidence for a major impact from residential wood smoke, Atmos. Environ., 138, 99–107, https://doi.org/10.1016/j.atmosenv.2016.05.013, 2016.
Graham, E. L., Wu, C., Bell, D. M., Bertrand, A., Haslett, S. L., Baltensperger, U., El Haddad, I., Krejci, R., Riipinen, I., and Mohr, C.: Volatility of aerosol particles from NO3 oxidation of various biogenic organic precursors, Atmos. Chem. Phys., 23, 7347–7362, https://doi.org/10.5194/acp-23-7347-2023, 2023.
Hallquist, M., Wenger, J. C., Baltensperger, U., Rudich, Y., Simpson, D., Claeys, M., Dommen, J., Donahue, N. M., George, C., Goldstein, A. H., Hamilton, J. F., Herrmann, H., Hoffmann, T., Iinuma, Y., Jang, M., Jenkin, M. E., Jimenez, J. L., Kiendler-Scharr, A., Maenhaut, W., McFiggans, G., Mentel, Th. F., Monod, A., Prévôt, A. S. H., Seinfeld, J. H., Surratt, J. D., Szmigielski, R., and Wildt, J.: The formation, properties and impact of secondary organic aerosol: current and emerging issues, Atmos. Chem. Phys., 9, 5155–5236, https://doi.org/10.5194/acp-9-5155-2009, 2009.
Hammes, J., Lutz, A., Mentel, T., Faxon, C., and Hallquist, M.: Carboxylic acids from limonene oxidation by ozone and hydroxyl radicals: insights into mechanisms derived using a FIGAERO-CIMS, Atmos. Chem. Phys., 19, 13037–13052, https://doi.org/10.5194/acp-19-13037-2019, 2019.
Haslett, S. L., Bell, D. M., Kumar, V., Slowik, J. G., Wang, D. S., Mishra, S., Rastogi, N., Singh, A., Ganguly, D., Thornton, J., Zheng, F., Li, Y., Nie, W., Liu, Y., Ma, W., Yan, C., Kulmala, M., Daellenbach, K. R., Hadden, D., Baltensperger, U., Prevot, A. S. H., Tripathi, S. N., and Mohr, C.: Nighttime NO emissions strongly suppress chlorine and nitrate radical formation during the winter in Delhi, Atmos. Chem. Phys., 23, 9023–9036, https://doi.org/10.5194/acp-23-9023-2023, 2023.
Heikkinen, L., Partridge, D. G., Huang, W., Blichner, S., Ranjan, R., Tovazzi, E., Petäjä, T., Mohr, C., and Riipinen, I.: Cloud response to co-condensation of water and organic vapors over the boreal forest, EGUsphere [preprint], https://doi.org/10.5194/egusphere-2023-164, 2023.
Hinks, M. L., Montoya-Aguilera, J., Ellison, L., Lin, P., Laskin, A., Laskin, J., Shiraiwa, M., Dabdub, D., and Nizkorodov, S. A.: Effect of relative humidity on the composition of secondary organic aerosol from the oxidation of toluene, Atmos. Chem. Phys., 18, 1643–1652, https://doi.org/10.5194/acp-18-1643-2018, 2018.
Hu, K. S., Darer, A. I., and Elrod, M. J.: Thermodynamics and kinetics of the hydrolysis of atmospherically relevant organonitrates and organosulfates, Atmos. Chem. Phys., 11, 8307–8320, https://doi.org/10.5194/acp-11-8307-2011, 2011.
Huang, W.: Figure data of “Variation in chemical composition and volatility of oxygenated organic aerosol in different rural, urban, and mountain environments”, Zenodo [data set], https://doi.org/10.5281/zenodo.7983797, 2023.
Huang, W., Saathoff, H., Pajunoja, A., Shen, X., Naumann, K.-H., Wagner, R., Virtanen, A., Leisner, T., and Mohr, C.: α-Pinene secondary organic aerosol at low temperature: chemical composition and implications for particle viscosity, Atmos. Chem. Phys., 18, 2883–2898, https://doi.org/10.5194/acp-18-2883-2018, 2018.
Huang, W., Saathoff, H., Shen, X., Ramisetty, R., Leisner, T., and Mohr, C.: Chemical characterization of highly functionalized organonitrates contributing to night-time organic aerosol mass loadings and particle growth, Environ. Sci. Technol., 53, 1165–1174, https://doi.org/10.1021/acs.est.8b05826, 2019a.
Huang, W., Saathoff, H., Shen, X., Ramisetty, R., Leisner, T., and Mohr, C.: Seasonal characteristics of organic aerosol chemical composition and volatility in Stuttgart, Germany, Atmos. Chem. Phys., 19, 11687–11700, https://doi.org/10.5194/acp-19-11687-2019, 2019b.
Huang, W., Li, H., Sarnela, N., Heikkinen, L., Tham, Y. J., Mikkilä, J., Thomas, S. J., Donahue, N. M., Kulmala, M., and Bianchi, F.: Measurement report: Molecular composition and volatility of gaseous organic compounds in a boreal forest – from volatile organic compounds to highly oxygenated organic molecules, Atmos. Chem. Phys., 21, 8961–8977, https://doi.org/10.5194/acp-21-8961-2021, 2021.
IPCC: Climate change 2021: The Physical Science Basis. Contribution of Working Group I to the Sixth Assessment Report of the Intergovernmental Panel on Climate Change, edited by: Masson-Delmotte, V., Zhai, P., Pirani, A., Connors, S. L., Péan, C., Berger, S., Caud, N., Chen, Y., Goldfarb, L., Gomis, M. I., Huang, M., Leitzell, K., Lonnoy, E., Matthews, J. B. R., Maycock, T. K., Waterfield, T., Yelekçi, O., Yu, R., and Zhou, B., Cambridge University Press, Cambridge, United Kingdom and New York, NY, USA, 2391 pp. https://doi.org/10.1017/9781009157896, 2021.
Isaacman-VanWertz, G. and Aumont, B.: Impact of organic molecular structure on the estimation of atmospherically relevant physicochemical parameters, Atmos. Chem. Phys., 21, 6541–6563, https://doi.org/10.5194/acp-21-6541-2021, 2021.
Jimenez, J. L., Canagaratna, M. R., Donahue, N. M., Prevot, A. S. H., Zhang, Q., Kroll, J. H., DeCarlo, P. F., Allan, J. D., Coe, H., Ng, N. L., Aiken, A. C., Docherty, K. S., Ulbrich, I. M., Grieshop, A. P., Robinson, A. L., Duplissy, J., Smith, J. D., Wilson, K. R., Lanz, V. A., Hueglin, C., Sun, Y. L., Tian, J., Laaksonen, A., Raatikainen, T., Rautiainen, J., Vaattovaara, P., Ehn, M., Kulmala, M., Tomlinson, J. M., Collins, D. R., Cubison, M. J., Dunlea, E. J., Huffman, J. A., Onasch, T. B., Alfarra, M. R., Williams, P. I., Bower, K., Kondo, Y., Schneider, J., Drewnick, F., Borrmann, S., Weimer, S., Demerjian, K., Salcedo, D., Cottrell, L., Griffin, R., Takami, A., Miyoshi, T., Hatakeyama, S., Shimono, A., Sun, J. Y., Zhang, Y. M., Dzepina, K., Kimmel, J. R., Sueper, D., Jayne, J. T., Herndon, S. C., Trimborn, A. M., Williams, L. R., Wood, E. C., Middlebrook, A. M., Kolb, C. E., Baltensperger, U., and Worsnop, D. R.: Evolution of organic aerosols in the atmosphere, Science, 326, 1525–1529, https://doi.org/10.1126/science.1180353 2009.
Joo, T., Rivera-Rios, J. C., Takeuchi, M., Alvarado, M. J., and Ng, N. L.: Secondary Organic Aerosol Formation from Reaction of 3-Methylfuran with Nitrate Radicals, ACS Earth Space Chem., 3, 922–934, https://doi.org/10.1021/acsearthspacechem.9b00068, 2019.
Junninen, H., Ehn, M., Petäjä, T., Luosujärvi, L., Kotiaho, T., Kostiainen, R., Rohner, U., Gonin, M., Fuhrer, K., Kulmala, M., and Worsnop, D. R.: A high-resolution mass spectrometer to measure atmospheric ion composition, Atmos. Meas. Tech., 3, 1039–1053, https://doi.org/10.5194/amt-3-1039-2010, 2010.
Keller, A. and Burtscher, H.: Characterizing particulate emissions from wood burning appliances including secondary organic aerosol formation potential, J. Aerosol Sci., 114, 21–30, https://doi.org/10.1016/j.jaerosci.2017.08.014, 2017.
Kenseth, C. M., Hafeman, N. J., Huang, Y., Dalleska, N. F., Stoltz, B. M., and Seinfeld, J. H.: Synthesis of Carboxylic Acid and Dimer Ester Surrogates to Constrain the Abundance and Distribution of Molecular Products in alpha-Pinene and beta-Pinene Secondary Organic Aerosol, Environ. Sci. Technol., 54, 12829–12839, https://doi.org/10.1021/acs.est.0c01566, 2020.
Kiendler-Scharr, A., Mensah, A. A., Friese, E., Topping, D., Nemitz, E., Prevot, A. S. H., Äijälä, M., Allan, J., Canonaco, F., Canagaratna, M., Carbone, S., Crippa, M., Dall Osto, M., Day, D. A., De Carlo, P., Di Marco, C. F., Elbern, H., Eriksson, A., Freney, E., Hao, L., Herrmann, H., Hildebrandt, L., Hillamo, R., Jimenez, J. L., Laaksonen, A., McFiggans, G., Mohr, C., O'Dowd, C., Otjes, R., Ovadnevaite, J., Pandis, S. N., Poulain, L., Schlag, P., Sellegri, K., Swietlicki, E., Tiitta, P., Vermeulen, A., Wahner, A., Worsnop, D., and Wu, H.-C.: Ubiquity of organic nitrates from nighttime chemistry in the European submicron aerosol, Geophys. Res. Lett., 43, 7735–7744, https://doi.org/10.1002/2016GL069239, 2016.
Kroll, J. H. and Seinfeld, J. H.: Chemistry of secondary organic aerosol: Formation and evolution of low-volatility organics in the atmosphere, Atmos. Environ., 42, 3593–3624, https://doi.org/10.1016/j.atmosenv.2008.01.003, 2008.
Kumar, V., Giannoukos, S., Haslett, S. L., Tong, Y., Singh, A., Bertrand, A., Lee, C. P., Wang, D. S., Bhattu, D., Stefenelli, G., Dave, J. S., Puthussery, J. V., Qi, L., Vats, P., Rai, P., Casotto, R., Satish, R., Mishra, S., Pospisilova, V., Mohr, C., Bell, D. M., Ganguly, D., Verma, V., Rastogi, N., Baltensperger, U., Tripathi, S. N., Prévôt, A. S. H., and Slowik, J. G.: Highly time-resolved chemical speciation and source apportionment of organic aerosol components in Delhi, India, using extractive electrospray ionization mass spectrometry, Atmos. Chem. Phys., 22, 7739–7761, https://doi.org/10.5194/acp-22-7739-2022, 2022.
Lee, B. H., Lopez-Hilfiker, F. D., Mohr, C., Kurtén, T., Worsnop, D. R., and Thornton, J. A.: An iodide-adduct high-resolution time-of-flight chemical-ionization mass spectrometer: Application to atmospheric inorganic and organic compounds, Environ. Sci. Technol., 48, 6309–6317, https://doi.org/10.1021/es500362a, 2014.
Lee, B. H., Mohr, C., Lopez-Hilfiker, F. D., Lutz, A., Hallquist, M., Lee, L., Romer, P., Cohen, R. C., Iyer, S., Kurtén, T., Hu, W. W., Day, D. A., Campuzano-Jost, P., Jimenez, J. L., Xu, L., Ng, N. L., Guo, H. Y., Weber, R. J., Wild, R. J., Brown, S. S., Koss, A., de Gouw, J., Olson, K., Goldstein, A. H., Seco, R., Kim, S., McAvey, K., Shepson, P. B., Starn, T., Baumann, K., Edgerton, E. S., Liu, J. M., Shilling, J. E., Miller, D. O., Brune, W., Schobesberger, S., D'Ambro, E. L., and Thornton, J. A.: Highly functionalized organic nitrates in the southeast United States: Contribution to secondary organic aerosol and reactive nitrogen budgets, P. Natl. Acad. Sci. USA, 113, 1516–1521, https://doi.org/10.1073/pnas.1508108113, 2016.
Lee, B. H., Lopez-Hilfiker, F. D., D'Ambro, E. L., Zhou, P., Boy, M., Petäjä, T., Hao, L., Virtanen, A., and Thornton, J. A.: Semi-volatile and highly oxygenated gaseous and particulate organic compounds observed above a boreal forest canopy, Atmos. Chem. Phys., 18, 11547–11562, https://doi.org/10.5194/acp-18-11547-2018, 2018.
Lee, B. H., D'Ambro, E. L., Lopez-Hilfiker, F. D., Schobesberger, S., Mohr, C., Zawadowicz, M. A., Liu, J., Shilling, J. E., Hu, W., Palm, B. B., Jimenez, J. L., Hao, L., Virtanen, A., Zhang, H., Goldstein, A. H., Pye, H. O. T., and Thornton, J. A.: Resolving ambient organic aerosol formation and aging pathways with simultaneous molecular composition and volatility observations, ACS Earth Space Chem., 4, 391–402, https://doi.org/10.1021/acsearthspacechem.9b00302, 2020.
Li, H., Riva, M., Rantala, P., Heikkinen, L., Daellenbach, K., Krechmer, J. E., Flaud, P.-M., Worsnop, D., Kulmala, M., Villenave, E., Perraudin, E., Ehn, M., and Bianchi, F.: Terpenes and their oxidation products in the French Landes forest: insights from Vocus PTR-TOF measurements, Atmos. Chem. Phys., 20, 1941–1959, https://doi.org/10.5194/acp-20-1941-2020, 2020.
Li, Y., Pöschl, U., and Shiraiwa, M.: Molecular corridors and parameterizations of volatility in the chemical evolution of organic aerosols, Atmos. Chem. Phys., 16, 3327–3344, https://doi.org/10.5194/acp-16-3327-2016, 2016.
Lim, L. H., Harrison, R. M., and Harrad, S.: The Contribution of Traffic to Atmospheric Concentrations of Polycyclic Aromatic Hydrocarbons, Environ. Sci. Technol., 33, 3538–3542, https://doi.org/10.1021/es990392d, 1999.
Lopez-Hilfiker, F. D., Mohr, C., Ehn, M., Rubach, F., Kleist, E., Wildt, J., Mentel, Th. F., Lutz, A., Hallquist, M., Worsnop, D., and Thornton, J. A.: A novel method for online analysis of gas and particle composition: description and evaluation of a Filter Inlet for Gases and AEROsols (FIGAERO), Atmos. Meas. Tech., 7, 983–1001, https://doi.org/10.5194/amt-7-983-2014, 2014.
Lopez-Hilfiker, F. D., Mohr, C., Ehn, M., Rubach, F., Kleist, E., Wildt, J., Mentel, Th. F., Carrasquillo, A. J., Daumit, K. E., Hunter, J. F., Kroll, J. H., Worsnop, D. R., and Thornton, J. A.: Phase partitioning and volatility of secondary organic aerosol components formed from α-pinene ozonolysis and OH oxidation: the importance of accretion products and other low volatility compounds, Atmos. Chem. Phys., 15, 7765–7776, https://doi.org/10.5194/acp-15-7765-2015, 2015.
Lopez-Hilfiker, F. D., Mohr, C., D'Ambro, E. L., Lutz, A., Riedel, T. P., Gaston, C. J., Iyer, S., Zhang, Z., Gold, A., Surratt, J. D., Lee, B. H., Kurten, T., Hu, W. W., Jimenez, J., Hallquist, M., and Thornton, J. A.: Molecular composition and volatility of organic aerosol in the Southeastern U.S.: Implications for IEPOX derived SOA, Environ. Sci. Technol., 50, 2200–2209, https://doi.org/10.1021/acs.est.5b04769, 2016.
Lutz, A., Mohr, C., Le Breton, M., Lopez-Hilfiker, F. D., Priestley, M., Thornton, J. A., and Hallquist, M.: Gas to Particle Partitioning of Organic Acids in the Boreal Atmosphere, ACS Earth Space Chem., 3, 1279–1287, https://doi.org/10.1021/acsearthspacechem.9b00041, 2019.
Masoud, C. G. and Ruiz, L. H.: Chlorine-Initiated Oxidation of α-Pinene: Formation of Secondary Organic Aerosol and Highly Oxygenated Organic Molecules, ACS Earth Space Chem., 5, 2307–2319, https://doi.org/10.1021/acsearthspacechem.1c00150, 2021.
Massoli, P., Stark, H., Canagaratna, M. R., Krechmer, J. E., Xu, L., Ng, N. L., Mauldin, R. L., Yan, C., Kimmel, J., Misztal, P. K., Jimenez, J. L., Jayne, J. T., and Worsnop, D. R.: Ambient measurements of highly oxidized gas-phase molecules during the Southern Oxidant and Aerosol Study (SOAS) 2013, ACS Earth Space Chem., 2, 653–672, https://doi.org/10.1021/acsearthspacechem.8b00028, 2018.
Mishra, S., Tripathi, S. N., Kanawade, V. P., Haslett, S. L., Dada, L., Ciarelli, G., Kumar, V., Singh, A., Bhattu, D., Rastogi, N., Daellenbach, K. R., Ganguly, D., Gargava, P., Slowik, J. G., Kulmala, M., Mohr, C., El-Haddad, I., and Prevot, A. S. H.: Rapid night-time nanoparticle growth in Delhi driven by biomass-burning emissions, Nat. Geosci., 16, 224–230, https://doi.org/10.1038/s41561-023-01138-x, 2023.
Mohr, C., Lopez-Hilfiker, F. D., Yli-Juuti, T., Heitto, A., Lutz, A., Hallquist, M., D'Ambro, E. L., Rissanen, M. P., Hao, L. Q., Schobesberger, S., Kulmala, M., Mauldin III, R. L., Makkonen, U., Sipilä, M., Petäjä, T., and Thornton, J. A.: Ambient observations of dimers from terpene oxidation in the gas phase: Implications for new particle formation and growth, Geophys. Res. Lett., 44, 2958–2966, https://doi.org/10.1002/2017gl072718, 2017.
Mohr, C., Thornton, J. A., Heitto, A., Lopez-Hilfiker, F. D., Lutz, A., Riipinen, I., Hong, J., Donahue, N. M., Hallquist, M., Petaja, T., Kulmala, M., and Yli-Juuti, T.: Molecular identification of organic vapors driving atmospheric nanoparticle growth, Nat. Commun., 10, 4442, https://doi.org/10.1038/s41467-019-12473-2, 2019.
Murray, L. T.: Lightning NOx and Impacts on Air Quality, Curr. Pollut. Rep., 2, 115–133, https://doi.org/10.1007/s40726-016-0038-0, 2016.
Nah, T., Xu, L., Osborne-Benthaus, K. A., White, S. M., France, S., and Ng, N. L.: Mixing order of sulfate aerosols and isoprene epoxydiols affects secondary organic aerosol formation in chamber experiments, Atmos. Environ., 217, 116953, https://doi.org/10.1016/j.atmosenv.2019.116953, 2019.
Nel, A.: Air pollution-related illness: effects of particles, Science, 308, 804–806, https://doi.org/10.1126/science.1108752 2005.
Ng, N. L., Chhabra, P. S., Chan, A. W. H., Surratt, J. D., Kroll, J. H., Kwan, A. J., McCabe, D. C., Wennberg, P. O., Sorooshian, A., Murphy, S. M., Dalleska, N. F., Flagan, R. C., and Seinfeld, J. H.: Effect of NOx level on secondary organic aerosol (SOA) formation from the photooxidation of terpenes, Atmos. Chem. Phys., 7, 5159–5174, https://doi.org/10.5194/acp-7-5159-2007, 2007.
Nie, W., Yan, C., Huang, D. D., Wang, Z., Liu, Y. L., Qiao, X. H., Guo, Y. S., Tian, L. H., Zheng, P. G., Xu, Z. N., Li, Y. Y., Xu, Z., Qi, X. M., Sun, P., Wang, J. P., Zheng, F. X., Li, X. X., Yin, R. J., Dallenbach, K. R., Bianchi, F., Petäjä, T., Zhang, Y. J., Wang, M. Y., Schervish, M., Wang, S. N., Qiao, L. P., Wang, Q., Zhou, M., Wang, H. L., Yu, C. A., Yao, D. W., Guo, H., Ye, P. L., Lee, S. C., Li, Y. J., Liu, Y. C., Chi, X. G., Kerminen, V. M., Ehn, M., Donahue, N. M., Wang, T., Huang, C., Kulmala, M., Worsnop, D., Jiang, J. K., and Ding, A. J.: Secondary organic aerosol formed by condensing anthropogenic vapours over China's megacities, Nat Geosci, 15, 255–261, https://doi.org/10.1038/s41561-022-00922-5, 2022.
Nozière, B., Kaberer, M., Claeys, M., Allan, J., D'Anna, B., Decesari, S., Finessi, E., Glasius, M., Grgić, I., Hamilton, J. F., Hoffmann, T., Iinuma, Y., Jaoui, M., Kahno, A., Kampf, C. J., Kourtchev, I., Maenhaut, W., Marsden, N., Saarikoski, S., Schnelle-Kreis, J., Surratt, J. D., Szidat, S., Szmigielski, R., and Wisthaler, A.: The molecular identification of organic compounds in the atmosphere: State of the art and challenges, Chem. Rev., 115, 3919–3983, https://doi.org/10.1021/cr5003485, 2015.
O'Meara, S., Booth, A. M., Barley, M. H., Topping, D., and McFiggans, G.: An assessment of vapour pressure estimation methods, Phys. Chem. Chem. Phys., 16, 19453–19469, https://doi.org/10.1039/c4cp00857j, 2014.
Pankow, J. F. and Asher, W. E.: SIMPOL.1: a simple group contribution method for predicting vapor pressures and enthalpies of vaporization of multifunctional organic compounds, Atmos. Chem. Phys., 8, 2773–2796, https://doi.org/10.5194/acp-8-2773-2008, 2008.
Peräkylä, O., Riva, M., Heikkinen, L., Quéléver, L., Roldin, P., and Ehn, M.: Experimental investigation into the volatilities of highly oxygenated organic molecules (HOMs), Atmos. Chem. Phys., 20, 649–669, https://doi.org/10.5194/acp-20-649-2020, 2020.
Pye, H. O., Luecken, D. J., Xu, L., Boyd, C. M., Ng, N. L., Baker, K. R., Ayres, B. R., Bash, J. O., Baumann, K., Carter, W. P., Edgerton, E., Fry, J. L., Hutzell, W. T., Schwede, D. B., and Shepson, P. B.: Modeling the Current and Future Roles of Particulate Organic Nitrates in the Southeastern United States, Environ. Sci. Technol., 49, 14195–14203, https://doi.org/10.1021/acs.est.5b03738, 2015.
Ren, S., Yao, L., Wang, Y., Yang, G., Liu, Y., Li, Y., Lu, Y., Wang, L., and Wang, L.: Volatility parameterization of ambient organic aerosols at a rural site of the North China Plain, Atmos. Chem. Phys., 22, 9283–9297, https://doi.org/10.5194/acp-22-9283-2022, 2022.
Riva, M., Rantala, P., Krechmer, J. E., Peräkylä, O., Zhang, Y., Heikkinen, L., Garmash, O., Yan, C., Kulmala, M., Worsnop, D., and Ehn, M.: Evaluating the performance of five different chemical ionization techniques for detecting gaseous oxygenated organic species, Atmos. Meas. Tech., 12, 2403–2421, https://doi.org/10.5194/amt-12-2403-2019, 2019.
Saarnio, K., Aurela, M., Timonen, H., Saarikoski, S., Teinila, K., Makela, T., Sofiev, M., Koskinen, J., Aalto, P. P., Kulmala, M., Kukkonen, J., and Hillamo, R.: Chemical composition of fine particles in fresh smoke plumes from boreal wild-land fires in Europe, Sci. Total Environ., 408, 2527–2542, https://doi.org/10.1016/j.scitotenv.2010.03.010, 2010.
Schobesberger, S., D'Ambro, E. L., Lopez-Hilfiker, F. D., Mohr, C., and Thornton, J. A.: A model framework to retrieve thermodynamic and kinetic properties of organic aerosol from composition-resolved thermal desorption measurements, Atmos. Chem. Phys., 18, 14757–14785, https://doi.org/10.5194/acp-18-14757-2018, 2018.
Shiraiwa, M., Ammann, M., Koop, T., and Pöschl, U.: Gas uptake and chemical aging of semisolid organic aerosol particles, P. Natl. Acad. Sci. USA, 108, 11003–11008, https://doi.org/10.1073/pnas.1103045108, 2011.
Stark, H., Yatavelli, R. L. N., Thompson, S. L., Kang, H., Krechmer, J. E., Kimmel, J. R., Palm, B. B., Hu, W., Hayes, P. L., Day, D. A., Campuzano-Jost, P., Canagaratna, M. R., Jayne, J. T., Worsnop, D. R., and Jimenez, J. L.: Impact of Thermal Decomposition on Thermal Desorption Instruments: Advantage of Thermogram Analysis for Quantifying Volatility Distributions of Organic Species, Environ. Sci. Technol., 51, 8491–8500, https://doi.org/10.1021/acs.est.7b00160, 2017.
Stolzenburg, D., Fischer, L., Vogel, A. L., Heinritzi, M., Schervish, M., Simon, M., Wagner, A. C., Dada, L., Ahonen, L. R., Amorim, A., Baccarini, A., Bauer, P. S., Baumgartner, B., Bergen, A., Bianchi, F., Breitenlechner, M., Brilke, S., Mazon, S. B., Chen, D. X., Dias, A., Draper, D. C., Duplissy, J., Haddad, I., Finkenzeller, H., Frege, C., Fuchs, C., Garmash, O., Gordon, H., He, X., Helm, J., Hofbauer, V., Hoyle, C. R., Kim, C., Kirkby, J., Kontkanen, J., Kürten, A., Lampilahti, J., Lawler, M., Lehtipalo, K., Leiminger, M., Mai, H., Mathot, S., Mentler, B., Molteni, U., Nie, W., Nieminen, T., Nowak, J. B., Ojdanic, A., Onnela, A., Passananti, M., Petäjä, T., Quéléver, L. L. J., Rissanen, M. P., Sarnela, N., Schallhart, S., Tauber, C., Tomé, A., Wagner, R., Wang, M., Weitz, L., Wimmer, D., Xiao, M., Yan, C., Ye, P., Zha, Q., Baltensperger, U., Curtius, J., Dommen, J., Flagan, R. C., Kulmala, M., Smith, J. N., Worsnop, D. R., Hansel, A., Donahue, N. M., and Winkler, P. M.: Rapid growth of organic aerosol nanoparticles over a wide tropospheric temperature range, P. Natl. Acad. Sci. USA, 115, 9122–9127, https://doi.org/10.1073/pnas.1807604115, 2018.
Thompson, S. L., Yatavelli, R. L. N., Stark, H., Kimmel, J. R., Krechmer, J. E., Day, D. A., Hu, W. W., Isaacman-VanWertz, G., Yee, L., Goldstein, A. H., Khan, M. A. H., Holzinger, R., Kreisberg, N., Lopez-Hilfiker, F. D., Mohr, C., Thornton, J. A., Jayne, J. T., Canagaratna, M., Worsnop, D. R., and Jimenez, J. L.: Field intercomparison of the gas/particle partitioning of oxygenated organics during the Southern Oxidant and Aerosol Study (SOAS) in 2013, Aerosol Sci. Tech., 51, 30–56, https://doi.org/10.1080/02786826.2016.1254719, 2017.
Thornton, J. A., Mohr, C., Schobesberger, S., D'Ambro, E. L., Lee, B. H., and Lopez-Hilfiker, F. D.: Evaluating Organic Aerosol Sources and Evolution with a Combined Molecular Composition and Volatility Framework Using the Filter Inlet for Gases and Aerosols (FIGAERO), Acc. Chem. Res., 53, 1415–1426, https://doi.org/10.1021/acs.accounts.0c00259, 2020.
Voliotis, A., Wang, Y., Shao, Y., Du, M., Bannan, T. J., Percival, C. J., Pandis, S. N., Alfarra, M. R., and McFiggans, G.: Exploring the composition and volatility of secondary organic aerosols in mixed anthropogenic and biogenic precursor systems, Atmos. Chem. Phys., 21, 14251–14273, https://doi.org/10.5194/acp-21-14251-2021, 2021.
Wang, D. S. and Hildebrandt Ruiz, L.: Chlorine-initiated oxidation of n-alkanes under high-NOx conditions: insights into secondary organic aerosol composition and volatility using a FIGAERO–CIMS, Atmos. Chem. Phys., 18, 15535–15553, https://doi.org/10.5194/acp-18-15535-2018, 2018.
Wang, M. Y., Chen, D. X., Xiao, M., Ye, Q., Stolzenburg, D., Hofbauer, V., Ye, P. L., Vogel, A. L., Mauldin III, R. L., Amorim, A., Baccarini, A., Baumgartner, B., Brilke, S., Dada, L., Dias, A., Duplissy, J., Finkenzeller, H., Garmash, O., He, X. C., Hoyle, C. R., Kim, C., Kvashnin, A., Lehtipalo, K., Fischer, L., Molteni, U., Petäjä, T., Pospisilova, V., Quéléver, L. L. J., Rissanen, M., Simon, M., Tauber, C., Tomé, A., Wagner, A. C., Weitz, L., Volkamer, R., Winkler, P. M., Kirkby, J., Worsnop, D. R., Kulmala, M., Baltensperger, U., Dommen, J., El-Haddad, I., and Donahue, N. M.: Photo-oxidation of aromatic hydrocarbons produces low-volatility organic compounds, Environ. Sci. Technol., 54, 7911–7921, https://doi.org/10.1021/acs.est.0c02100, 2020.
Wu, C., Bell, D. M., Graham, E. L., Haslett, S., Riipinen, I., Baltensperger, U., Bertrand, A., Giannoukos, S., Schoonbaert, J., El Haddad, I., Prevot, A. S. H., Huang, W., and Mohr, C.: Photolytically induced changes in composition and volatility of biogenic secondary organic aerosol from nitrate radical oxidation during night-to-day transition, Atmos. Chem. Phys., 21, 14907–14925, https://doi.org/10.5194/acp-21-14907-2021, 2021.
Yang, L. H., Takeuchi, M., Chen, Y. L., and Ng, N. L.: Characterization of thermal decomposition of oxygenated organic compounds in FIGAERO-CIMS, Aerosol Sci. Tech., 55, 1321–1342, https://doi.org/10.1080/02786826.2021.1945529, 2021.
Ye, Q., Wang, M., Hofbauer, V., Stolzenburg, D., Chen, D., Schervish, M., Vogel, A., Mauldin, R. L., Baalbaki, R., Brilke, S., Dada, L., Dias, A., Duplissy, J., El Haddad, I., Finkenzeller, H., Fischer, L., He, X., Kim, C., Kürten, A., Lamkaddam, H., Lee, C. P., Lehtipalo, K., Leiminger, M., Manninen, H. E., Marten, R., Mentler, B., Partoll, E., Petäjä, T., Rissanen, M., Schobesberger, S., Schuchmann, S., Simon, M., Tham, Y. J., Vazquez-Pufleau, M., Wagner, A. C., Wang, Y., Wu, Y., Xiao, M., Baltensperger, U., Curtius, J., Flagan, R., Kirkby, J., Kulmala, M., Volkamer, R., Winkler, P. M., Worsnop, D., and Donahue, N. M.: Molecular Composition and Volatility of Nucleated Particles from α-Pinene Oxidation between −50 °C and +25 °C, Environ. Sci. Technol., 53, 12357–12365, https://doi.org/10.1021/acs.est.9b03265, 2019.
Yli-Juuti, T., Pajunoja, A., Tikkanen, O.-P., Buchholz, A., Faiola, C., Väisänen, O., Hao, L., Kari, E., Peräkylä, O., Garmash, O., Shiraiwa, M., Ehn, M., Lehtinen, K., and Virtanen, A.: Factors controlling the evaporation of secondary organic aerosol from α-pinene ozonolysis, Geophys. Res. Lett., 44, 2562–2570, https://doi.org/10.1002/2016GL072364, 2017.
Ylisirniö, A., Barreira, L. M. F., Pullinen, I., Buchholz, A., Jayne, J., Krechmer, J. E., Worsnop, D. R., Virtanen, A., and Schobesberger, S.: On the calibration of FIGAERO-ToF-CIMS: importance and impact of calibrant delivery for the particle-phase calibration, Atmos. Meas. Tech., 14, 355–367, https://doi.org/10.5194/amt-14-355-2021, 2021.
Zha, Q., Aliaga, D., Krejci, R., Sinclair, V. A., Wu, C., Ciarelli, G., Scholz, W., Heikkinen, L., Partoll, E., Gramlich, Y., Huang, W., Leiminger, M., Enroth, J., Peräkylä, O., Cai, R., Chen, X., Koenig, A. M., Velarde, F., Moreno, I., Petäjä, T., Artaxo, P., Laj, P., Hansel, A., Carbone, C., Kulmala, M., Andrade, M., Worsnop, D., Mohr, C., and Bianchi, F.: Oxidized organic molecules in the tropical free troposphere over Amazonia, Natl. Sci. Rev., 11, nwad138, https://doi.org/10.1093/nsr/nwad138, 2023a.
Zha, Q., Huang, W., Aliaga, D., Peräkylä, O., Heikkinen, L., Koenig, A. M., Wu, C., Enroth, J., Gramlich, Y., Cai, J., Carbone, S., Hansel, A., Petäjä, T., Kulmala, M., Worsnop, D., Sinclair, V., Krejci, R., Andrade, M., Mohr, C., and Bianchi, F.: Measurement report: Molecular-level investigation of atmospheric cluster ions at the tropical high-altitude research station Chacaltaya (5240 m a.s.l.) in the Bolivian Andes, Atmos. Chem. Phys., 23, 4559–4576, https://doi.org/10.5194/acp-23-4559-2023, 2023b.
Zhang, H. F., Yee, L. D., Lee, B. H., Curtis, M. P., Worton, D. R., Isaacman-VanWertz, G., Offenberg, J. H., Lewandowski, M., Kleindienst, T. E., Beaver, M. R., Holder, A. L., Lonneman, W. A., Docherty, K. S., Jaoui, M., Pye, H. O. T., Hu, W. W., Day, D. A., Campuzano-Jost, P., Jimenez, J. L., Guo, H. Y., Weber, R. J., de Gouw, J., Koss, A. R., Edgerton, E. S., Brune, W., Mohr, C., Lopez-Hilfiker, F. D., Lutz, A., Kreisberg, N. M., Spielman, S. R., Hering, S. V., Wilson, K. R., Thornton, J. A., and Goldstein, A. H.: Monoterpenes are the largest source of summertime organic aerosol in the southeastern United States, P. Natl. Acad. Sci. USA, 115, 2038–2043, https://doi.org/10.1073/pnas.1717513115, 2018.
Zheng, X., Wu, Y., Zhang, S., Hu, J., Zhang, K. M., Li, Z., He, L., and Hao, J.: Characterizing particulate polycyclic aromatic hydrocarbon emissions from diesel vehicles using a portable emissions measurement system, Sci. Rep.-UK, 7, 10058, https://doi.org/10.1038/s41598-017-09822-w, 2017.