the Creative Commons Attribution 4.0 License.
the Creative Commons Attribution 4.0 License.
 | 28 Feb 2024
Optical properties and simple forcing efficiency of the organic aerosols and black carbon emitted by residential wood burning in rural central Europe
Andrea Cuesta-Mosquera
Kristina Glojek
Griša Močnik
Luka Drinovec
Asta Gregorič
Martin Rigler
Matej Ogrin
Baseerat Romshoo
Kay Weinhold
Maik Merkel
Dominik van Pinxteren
Hartmut Herrmann
Alfred Wiedensohler
Mira Pöhlker
Thomas Müller
Recent years have seen an increase in the use of wood for energy production of over 30 %, and this trend is expected to continue due to the current energy crisis and geopolitical instability. At present, residential wood burning (RWB) is one of the most important sources of organic aerosols (OAs) and black carbon (BC), posing a significant risk to air quality and health. Simultaneously, as a substantial aerosol source, RWB also holds relevance in the context of aerosol radiative effects and climate. While BC is recognized for its large light absorption cross-section, the role of OAs in light absorption is still under evaluation due to their heterogeneous composition and source-dependent optical properties. Existing studies that characterize wood-burning aerosol emissions in Europe primarily concentrate on urban and background sites and focus on BC properties. Despite the significant RWB emissions in rural areas, these locations have received comparatively less attention. The present scenario underscores the imperative for an improved understanding of RWB pollution, aerosol optical properties, and their subsequent connection to climate impacts, particularly in rural areas.
We have characterized atmospheric aerosol particles from a central European rural site during wintertime in the village of Retje in Loški Potok, Slovenia, from 1 December 2017 to 7 March 2018. The village experienced extremely high aerosol concentrations produced by RWB and near-ground temperature inversion. The isolated location of the site and the substantial local emissions made it an ideal laboratory-like place for characterizing RWB aerosols with low influence from non-RWB sources under ambient conditions. The mean mass concentrations of OA and BC were 35 µg m−3 ( µg m−3) and 3.1 µg m−3 ( µg m−3), respectively. The mean total particle number concentration (10–600 nm) was 9.9×10³ particles cm−3 ( particles cm−3). The mean total light absorption coefficients at 370 and 880 nm measured by an AE33 Aethalometer were 120 and 22 Mm−1 and had maximum values of 1100 and 180 Mm−1, respectively. The aerosol concentrations and absorption coefficients measured during the campaign in Loški Potok were significantly larger than reported values for several urban areas in the region with larger populations and a larger extent of aerosol sources.
Here, considerable contributions from brown carbon (BrC) to the total light absorption were identified, reaching up to 60 % and 48 % in the near-UV (370 nm) and blue (470 nm) wavelengths. These contributions are up to 3 times higher than values reported for other sites impacted by wood-burning emissions. The calculated mass absorption cross-section and the absorption Ångström exponent for RWB OA were MAC m2 g−1, and AAE, respectively.
Simple-forcing-efficiency (SFE) calculations were performed as a sensitivity analysis to evaluate the climate impact of the RWB aerosols produced at the study site by integrating the optical properties measured during the campaign. The SFE results show a considerable forcing capacity from the local RWB aerosols, with a high sensitivity to OA absorption properties and a more substantial impact over bright surfaces like snow, typical during the coldest season with higher OA emissions from RWB. Our study's results are highly significant regarding air pollution, optical properties, and climate impact. The findings suggest that there may be an underestimation of RWB emissions in rural Europe and that further investigation is necessary.
- Article
(6163 KB) - Full-text XML
-
Supplement
(639 KB) - BibTeX
- EndNote


Burning woody biomass for heating and cooking has progressively increased in recent decades. Between 2009 and 2015, this increment was 34 % in Europe (Camia et al., 2021). Government incentives to use “renewable” energy sources to cut fossil fuel dependence and reduce greenhouse gas emissions have contributed to this rise. In addition, the use of residential wood burning (RWB) as an energy source is significantly growing in urban and rural areas due to higher energy costs and uncertainties from the current geopolitical instability. In the winter of 2023/24, the increasing cost of natural gas is expected to boost RWB in the region, where private households account for more than 40 % of the total wood consumption for energy use (UNECE, 2022).
RWB emissions significantly contribute to ultrafine-particle (UFP, <100 nm) and fine-particle (<2.5 µm) aerosol emissions (Casquero-Vera et al., 2021; Ozgen et al., 2017). The composition of these aerosol particles includes substantial fractions of organic aerosols (OAs) and black carbon (BC) (Fine et al., 2001; Liang et al., 2021). During winter, biomass burning is the principal source of primary OA emissions in the region, and, together with solid biofuels and coal combustion, it is also a primary source of BC (European Environmental Agency, 2020; Herich et al., 2014). Global emission inventories indicate that residential biomass burning produces 35 % of BC emissions, occupying an important position above other emission sources, such as on-road diesel vehicle emissions (26 %) (Xu et al., 2021).
The above figures are of major concern due to the adverse effects of high-content OA and BC particles on human health and climate. Black carbon has been linked to increased morbidity and mortality (Geng et al., 2013), since it carries toxic substances affecting the immune and respiratory systems as well as cardiac function (Janssen et al., 2011). Fine and ultrafine aerosol particles are potentially harmful because their size allows them to penetrate deeper into the respiratory tract and are associated with proinflammatory effects on human cells (Corsini et al., 2017; Janssen et al., 2012). Organic aerosols have been connected to cardiovascular and respiratory affectations (Mauderly and Chow, 2008). The OA heterogeneous composition includes polycyclic aromatic hydrocarbons (PAHs), some of which have carcinogenic, mutagenic, and genotoxic properties (Chowdhury et al., 2022; Vicente and Alves, 2018, and references therein).
On the other hand, OA and BC have direct and indirect impacts on climate. Black carbon particles alter the Earth's radiative balance due to their capacity to absorb solar radiation, leading to a direct warming effect on the atmosphere (Bond et al., 2013). Indirect effects include altering lifetime and cloud formation processes, since the aerosol particles can act as cloud condensation nuclei and alter the cloud mixing state (Chen et al., 2018; Koch et al., 2011). In the case of OAs, these were historically considered scattering compounds responsible for an atmospheric cooling effect; nevertheless, more recent studies evidence the warming capacity from the absorbing carbonaceous fraction present in the OAs, named brown carbon (BrC) (Laskin et al., 2015, and references therein). Often, organic aerosols coating BC particles enhance the particle light absorption by the so-called “lensing effect”, which consists of the concentration of photons in the particle BC core due to the presence of scattering species in the particle coating; this enhancement varies along the visible and infrared spectrum (Bond et al., 2013; Kalbermatter et al., 2022; Zhang et al., 2018). Furthermore, BrC absorbs light in the shorter UV and visible wavelengths, and its inclusion in climate models has shown that the direct OA radiative forcing at the top of the atmosphere turns from cooling (negative) to warming (positive) (Feng et al., 2013).
The OA contribution to atmospheric warming processes is still being discussed. The aerosol light absorption attributed to OA (BrC) and its radiative forcing effects vary regionally depending on the emission source and the atmospheric and burning conditions. In an urban Indian site, Shamjad et al. (2016) found that BrC emissions contributed 29 % of the total light absorption at 405 nm; in multiple locations all over France, Zhang et al. (2020) found BrC contributions ranging from 18 % to 42 % at 370 nm; for eastern China, Wang et al. (2018) reported a range of 10 % to 24 % (33 % maximum) as the contribution of BrC to the total aerosol light absorption at 370 nm. The regional variability in the OA optical properties represents a challenge for global climate models, complicating the assessment of the net impact on global warming or cooling resulting from residential burning emissions (Kodros et al., 2015; Szopa et al., 2021). These facts show the need for source-oriented and highly temporally resolved field studies, especially in poorly characterized rural areas with significant RWB emissions, whose impacts can be underestimated (Vicente and Alves, 2018; Zhang et al., 2020).
In this work, the authors present the results of a field campaign performed in a European rural site with substantial RWB emissions. We evaluated the optical properties (light absorption coefficients (babs), mass absorption cross-section (MACs), and absorption Ångström exponent (AAE)) of the aerosol particles produced by a predominant aerosol source in an isolated village. The atmospheric stability during wintertime and the topography of the area favor the accumulation of locally produced pollutants and reduce the influence of external aerosol sources. Such circumstances allowed us to characterize aerosols produced by RWB under real conditions. Ultimately, we present the results from simple-forcing-efficiency estimations for the strongly light-absorbing BrC produced by RWB in the study site. We incorporated the measured optical properties in simple-forcing-efficiency (SFE) calculations and compared the results by considering the OA absorbing and non-absorbing species in the net radiative forcing (warming vs. cooling effect) over two types of surfaces (snow and Earth average).
2.1 Study site and monitoring campaign
The field study was performed in the municipality of Loški Potok, Slovenia, in the rural village of Retje. The area is a small and shallow depression (area 1.5 km2, depth 150 m; 45°42′34.8′′ N, 14°34′53.8′′ E; Fig. 1). The basin-shaped topography of the site favors the formation of near-ground temperature inversions, especially in the coldest season, contributing to the accumulation of atmospheric aerosols emitted locally (Glojek et al., 2022). During temperature inversions, the denser and cooler air remains at the bottom of the depression, stopping mixing with warmer air at the top and inhibiting the vertical dilution of air pollutants.
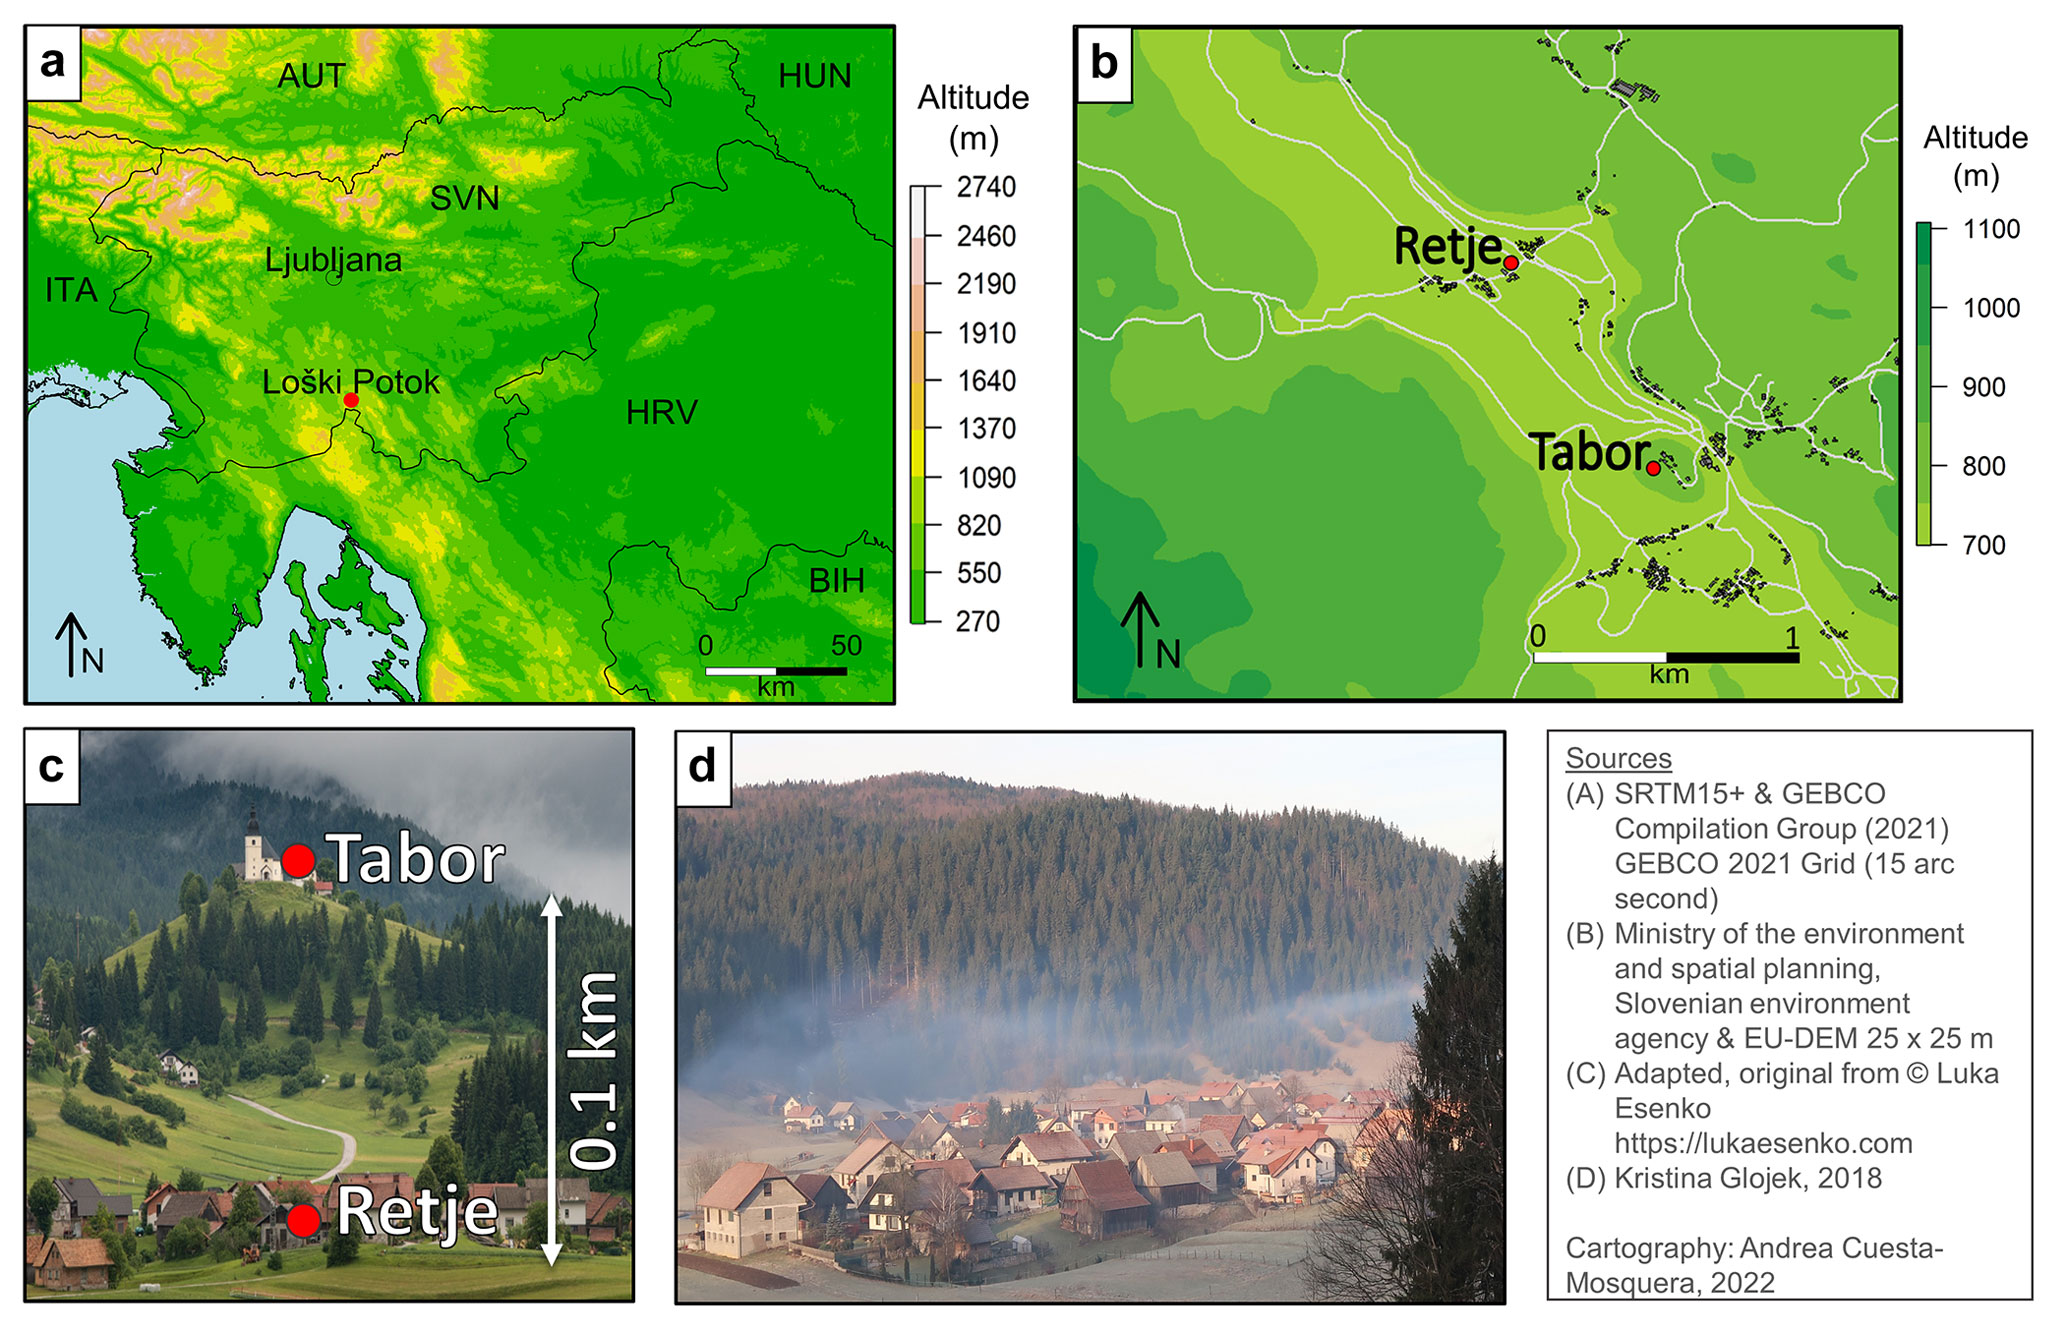
Figure 1Study site and the surrounding environment: (a) geographical location in Europe, (b) geographical location of the monitoring stations in Loški Potok, (c) photo of the valley and the monitoring stations, and (d) photo of Retje during a near-ground temperature inversion (27 January 2018).
The small village, with 690 inhabitants and 243 households, is encircled by a densely forested area; the local families use wood as the primary energy source for residential heating and cooking in the coldest season. The influence of aerosol traffic emissions is significantly low on the site, with an average of fewer than 100 vehicles circulating daily. The impact of industrial emissions is negligible, since the nearest atmospheric industrial emission sources are more than 10 km from the monitoring site (Glojek et al., 2020, 2022).
The local topography, the atmospheric stability, and the distinctive and predominant source of aerosol emissions make Retje a unique field laboratory to investigate the optical properties of organic aerosols and black carbon produced by residential wood burning under realistic conditions. The campaign was performed during wintertime from 1 December 2017 to 7 March 2018. We used a “twin monitoring scheme” with two fixed monitoring stations operating simultaneously (Fig. 1 and Table 1). One station was located at the bottom of the hollow in the middle of the village (main station, 715 m a.s.l.), while the second station was located at Tabor Hill (815 m a.s.l.) and served as a background station.
2.2 Instrumentation
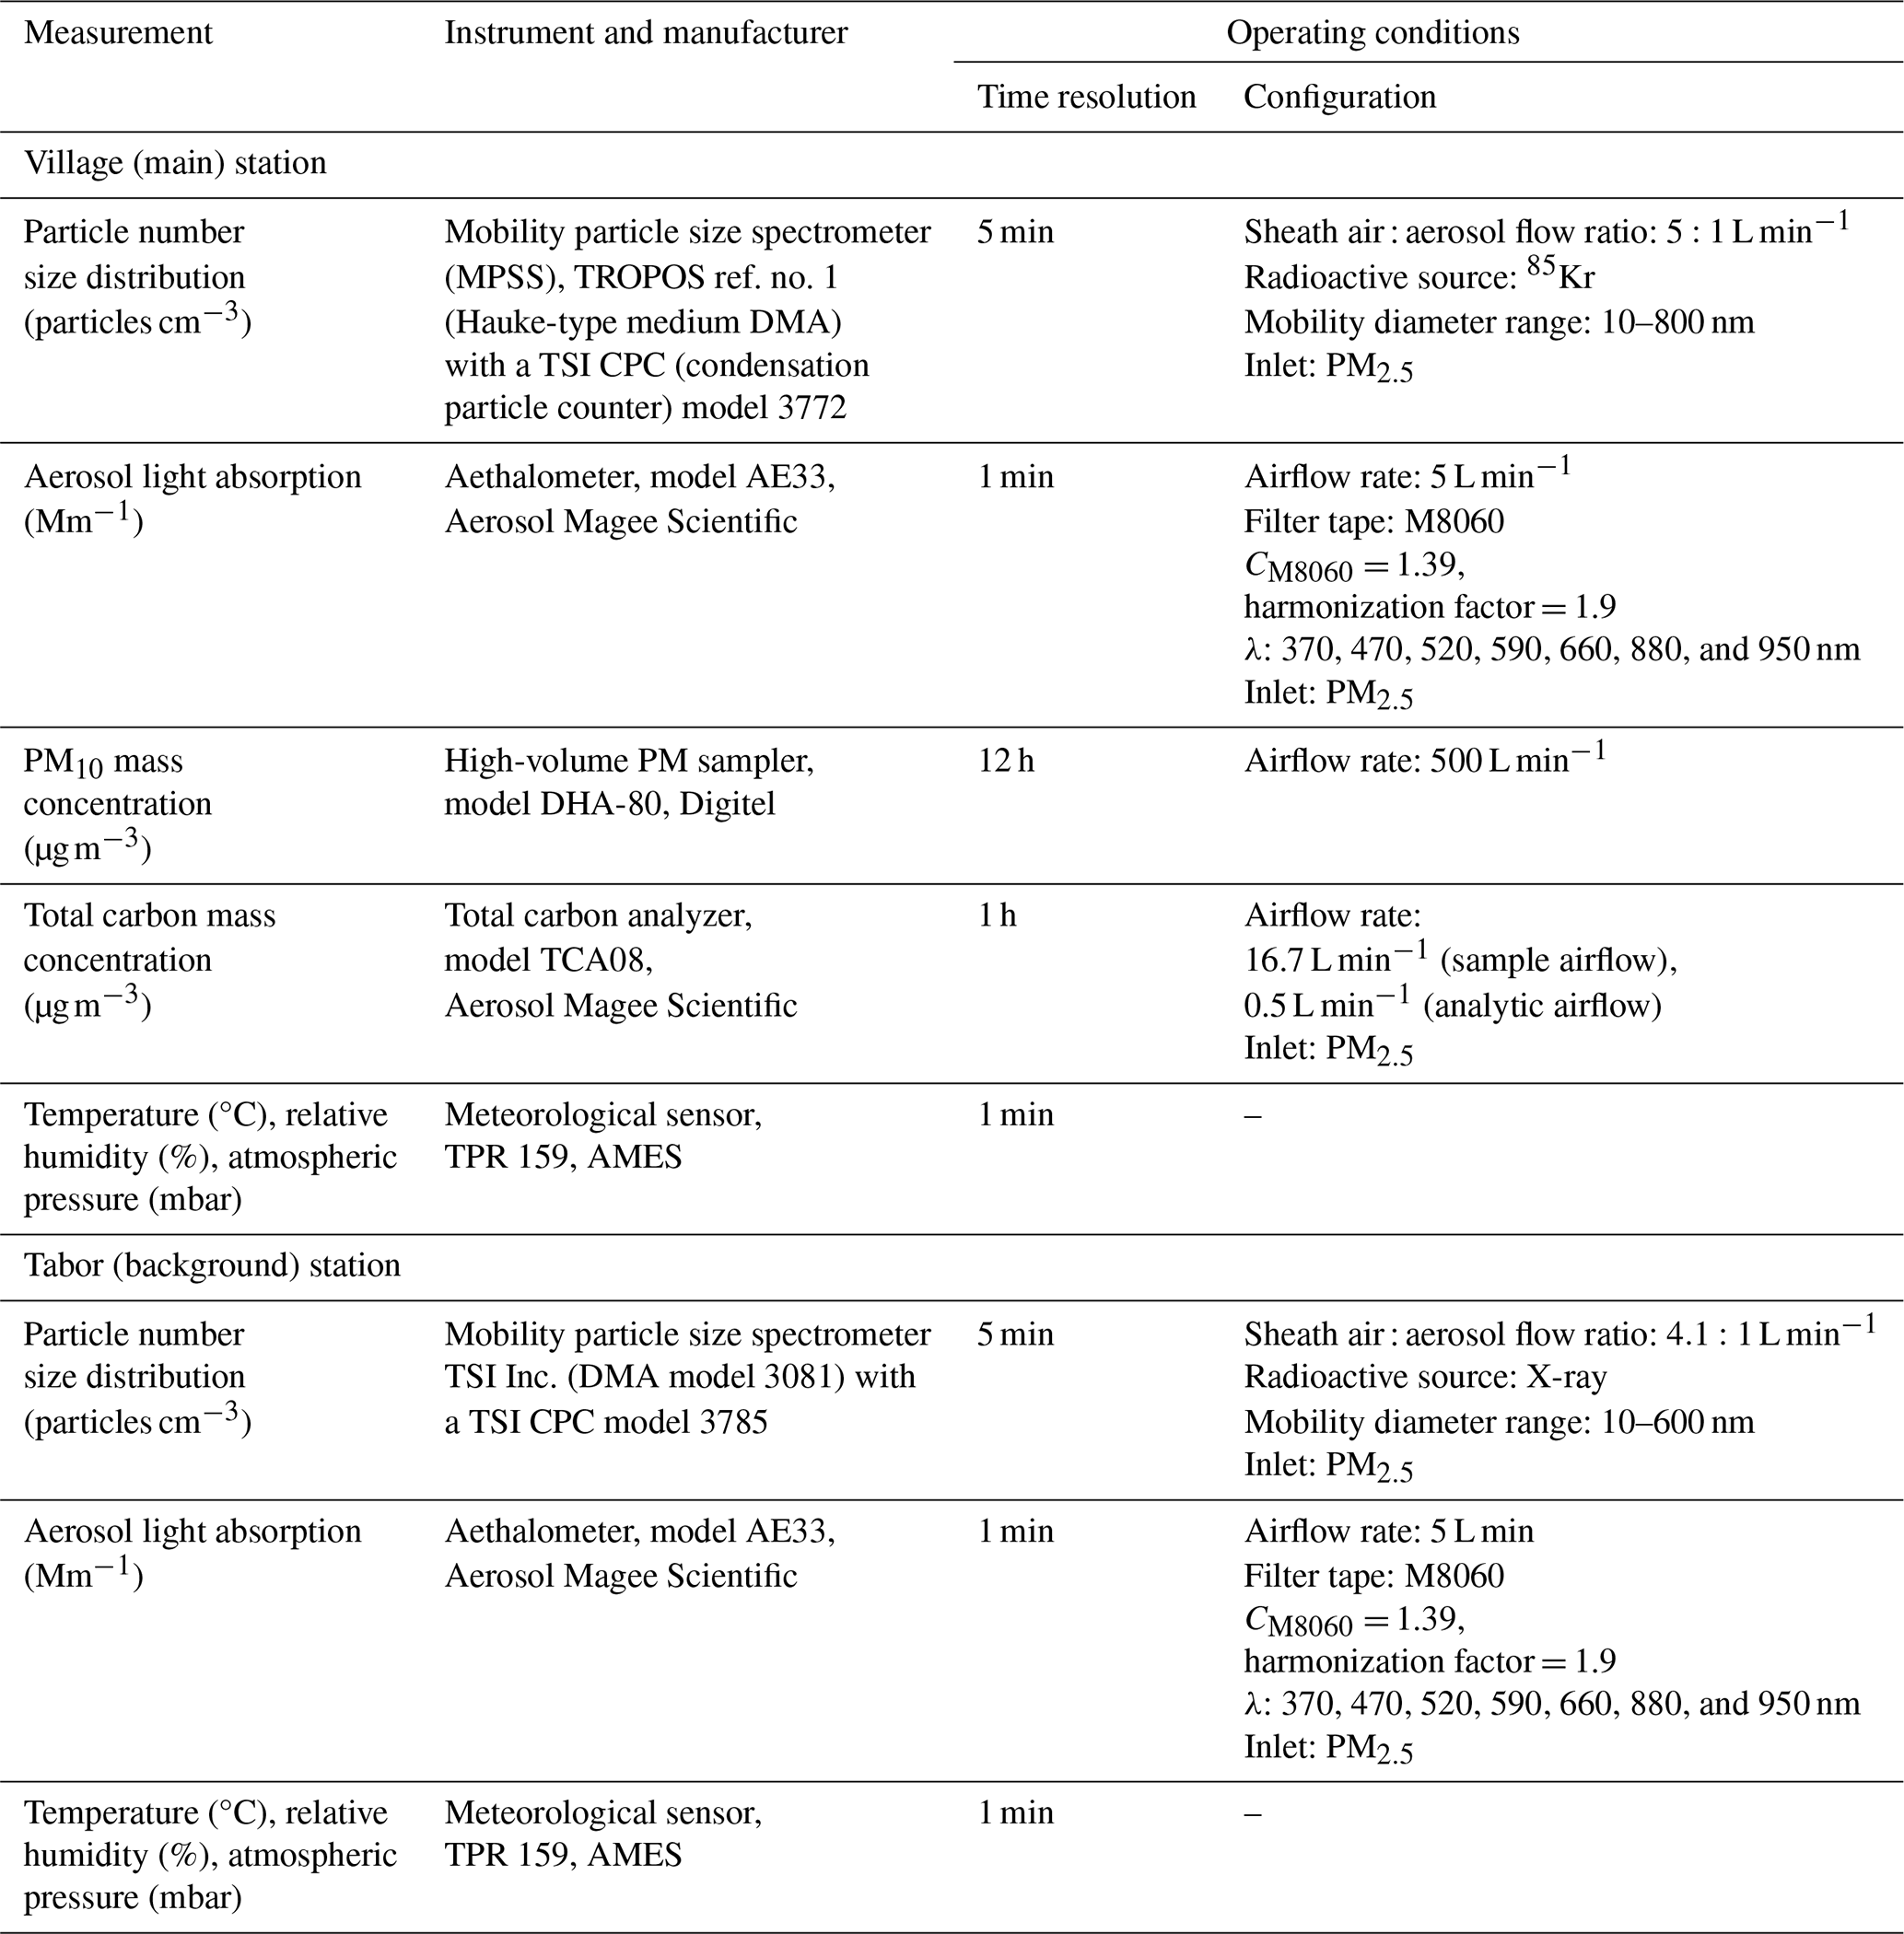
In both monitoring stations, the optical attenuation coefficient at seven wavelengths was continuously measured using filter-based absorption photometers (AE33 Aethalometer, 370 to 950 nm, Aerosol Magee Scientific). The AE33 instruments used filter tapes, model M8060, made of PET polymerized polyester (59 %) and fiberglass (41 %). The particle number concentration (N) and particle number size distributions (PNSDs) were monitored at Retje (10–800 nm) and Tabor Hill (10–600 nm) using mobility particle size spectrometers (MPSSs). At the village, a reference MPSS (TROPOS ref. no. 1, high-voltage supply of positive polarity) set up with a bipolar diffusion charger (radioactive source: 85Kr), a differential mobility analyzer (DMA, Hauke-type medium), and a butanol-type condensation particle counter (CPC, TSI model 3772) operated, whereas, at the background station, a TSI MPSS (high-voltage supply of negative polarity) set up with a bipolar diffusion charger (radioactive source: X-ray), a DMA (TSI 3081), and a water-type CPC (TSI model 3785) was installed. A multiple-charge inversion routine was applied to the raw mobility distributions to calculate the final PNSD (Pfeifer et al., 2014); additional corrections were applied to the PNSD, including CPC counting efficiency and particle losses due to diffusion in the inlet and sampling tubes and internal particle diffusion (corrected via the “equivalent pipe length” method; Wiedensohler et al., 2012).
Filter samples of particulate matter (PM10) were collected every 12 h at the village station (06:00 to 18:00 and 18:00 to 06:00 local time) using a high-volume sampler (DHA-80, Digitel). PM10 mass concentrations were determined gravimetrically in the laboratory following the European Union standard EN 12341. The quartz fiber filters (150 mm diameter) were preheated before sampling for at least 24 h at 105 °C to minimize blank values and frozen after sampling until their characterization in the laboratory; the weighing was done using a microbalance (AT261 Delta Range, Mettler Toledo). The PM10 filters were analyzed to estimate the particle's chemical composition, including organic and elemental carbon (OC EC), ions (NH, Cl−, Na+, K+, Mg2+, Ca2+, NO, SO, and C2O), and levoglucosan. Mass concentrations of OC EC were quantified following the EUSAAR-2 Protocol (Cavalli et al., 2010); ions were determined using ion chromatography (Dionex ICS-3000) of ultrapure water extracts (further details in Fomba et al., 2014); levoglucosan was quantified using high-performance anion exchange chromatography coupled with an electrochemical detector (HPAEC-PAD; Iinuma et al., 2009).
The total carbon (TC) mass concentration at the village station was measured using an online total carbon analyzer (TCA08, Aerosol Magee Scientific; Rigler et al., 2020). The dual-chamber instrument uses an online thermal method to quantify the total carbonaceous fraction in atmospheric aerosols. In one chamber, the sample is collected over a quartz fiber filter (47 mm diameter) and heated to 940 °C, transforming the carbon compounds into CO2. The amount of CO2 is measured before and after combustion by a CO2 detector and is later integrated to calculate the total carbon mass concentration. Simultaneously, the second chamber collects a new aerosol sample (sampling time adjustable from 20 min to 24 h). Both chambers alternate between sampling and analysis, enabling online functionality. Further details about the MPSS, DHA-80, and TCA08 operating principles are given in the Supplement.
Cyclones with a PM2.5 cutoff were used to sample aerosols for the AE33s, MPSSs, and TCA08; Nafion® Perma Pure air dryers (length = 1.5 m) kept the relative humidity of the AE33 and MPSS samples below 40 %. The instruments operated at ambient room temperature. The DHA-80 high-volume sampler was equipped with a PM10 impactor-type inlet. Table 1 shows the specifications and operating conditions of the instruments used during the campaign.
The quality of the instrument measurements was assured by intercomparison, calibration, and maintenance in the laboratory. The TROPOS ref. no. 1 MPSS and the TSI MPSS were calibrated and intercompared against a reference MPSS (TROPOS reference no. 4 MPSS, set up with a CPC TSI model 3772) and a reference CPC (TSI CPC, model 3010) at the World Calibration Centre for Aerosol Physics (WCCAP) in Germany. The comparison against the reference MPSS and CPC showed acceptable deviations within the range of ±10 % for the mean particle size distributions and the integrated number of particle concentrations. Further detailed results from the intercomparisons are shown in Glojek et al. (2020, 2022). The AE33 and the TCA08 were maintained as the manufacturer indicated (Aerosol Magee Scientific, 2018, 2022), including the inspection of the inlet flow and sampling lines, flow calibration, and leakage tests.
The AE33 Aethalometer and multiple-scattering harmonization
The AE33 Aethalometer collects aerosol particles in a filter matrix with a high time resolution (1 s or 1 min). The instrument measures the change in the light transmitted through the filter loaded with aerosols (light attenuation) due to light absorption and scattering from the particles and the filter material. The AE33 creates two sample spots on the filter, which allows the online correction of the so-called filter-loading effect, an artifact caused by the reduced sensitivity to detecting changes in the light attenuation produced by the accumulation of particles during sampling. More details about the AE33 algorithm and the loading compensation can be found in Drinovec et al. (2015) and the Supplement.
The internal algorithm of the AE33 converts the attenuation (bATN(λ)) into a light absorption coefficient (babs(λ)) using a correction factor to account for the multiple scattering of light (C factor; see Eq. S1 in the Supplement). The value of C is set manually in the instrument and, according to the manufacturer, depends on the filter model used during the measurements. For instance, the newest filter tape (M8060) has a corresponding C of 1.39. Nevertheless, multiple studies point out that the scattering of light in filter-based absorption photometers is also affected by the aerosol particles deposited on the filter matrix according to their single-scattering albedo and by the scattering within the filter fibers (Ajtai et al., 2019; Bernardoni et al., 2021; Collaud Coen et al., 2010; Drinovec et al., 2022; Saturno et al., 2017; Yus-Díez et al., 2021). Furthermore, some studies suggest that the condensation of semi-volatile organic compounds on the filter might contribute to an apparent absorption enhancement (Cappa et al., 2008; Weingartner et al., 2003).
The use of unrepresentative scattering correction factors might lead to an overestimation of the aerosol absorption in the AE33 and, consequently, of BC mass concentrations. Therefore, the values of babs(λ) obtained from the instrument must be corrected when using the manufacturer C alone. In this regard, the Aerosol, Clouds and Trace gases Research Infrastructure (ACTRIS) proposes to include a scaling or harmonization factor to account for the aerosol effect in multiple light scattering. This “harmonization” factor attempts to harmonize the AE33 measurements with the MAAP measurements, which is considered the closest to a reference for online aerosol light absorption measurements. ACTRIS has calculated a median harmonization factor (H) of 1.76 for AE33 measurements using the filter tape M8060 (C=1.39), based on simultaneous AE33–MAAP measurements from multiple European sites (Müller and Fiebig, 2021). In the present study, we have used a harmonization factor to scale the light absorption coefficients from Loški Potok. Given the absence of simultaneous AE33–MAAP measurements in the study site, we used a value of H=1.9 calculated from measurements performed by TROPOS at the village of Melpitz during winter (2018/19). Melpitz is a small village (∼ 200 inhabitants) located in eastern Germany (50 km from Leipzig) where RWB is the predominant heating source during the coldest period (van Pinxteren et al., 2023). For Loški Potok, the light absorption coefficients babs(λ)Harm. were harmonized as follows:
Note that the harmonized absorption coefficients will be referred to as babs(λ) in the following sections.
2.3 Hourly OA and BC mass concentrations
The PM1 mass concentration was defined as the sum of BC, OA, and inorganic aerosol (InA) masses, similarly to Setyan et al. (2012). Accordingly, the hourly OA mass concentration was calculated using a mass balance as follows:
For the previous calculation, we considered the good agreement between the PM10 mass concentrations from the filters and the 12 h averages of PM1 from the MPSS (see Fig. 2; orthogonal fit: slope = 0.9, R2=0.96). The comparison of PM1–PM10 suggests that most PM10 is composed of PM1 (∼ 90 %). This approach, however, could be an important source of uncertainty in determining the hourly OA mass concentration, since a fraction of OA might fall in the 1–2.5 µm size range; in contrast, the fraction of BC is most probably below the PM1 fraction (Sect. 3.3 shows an analysis of uncertainty).
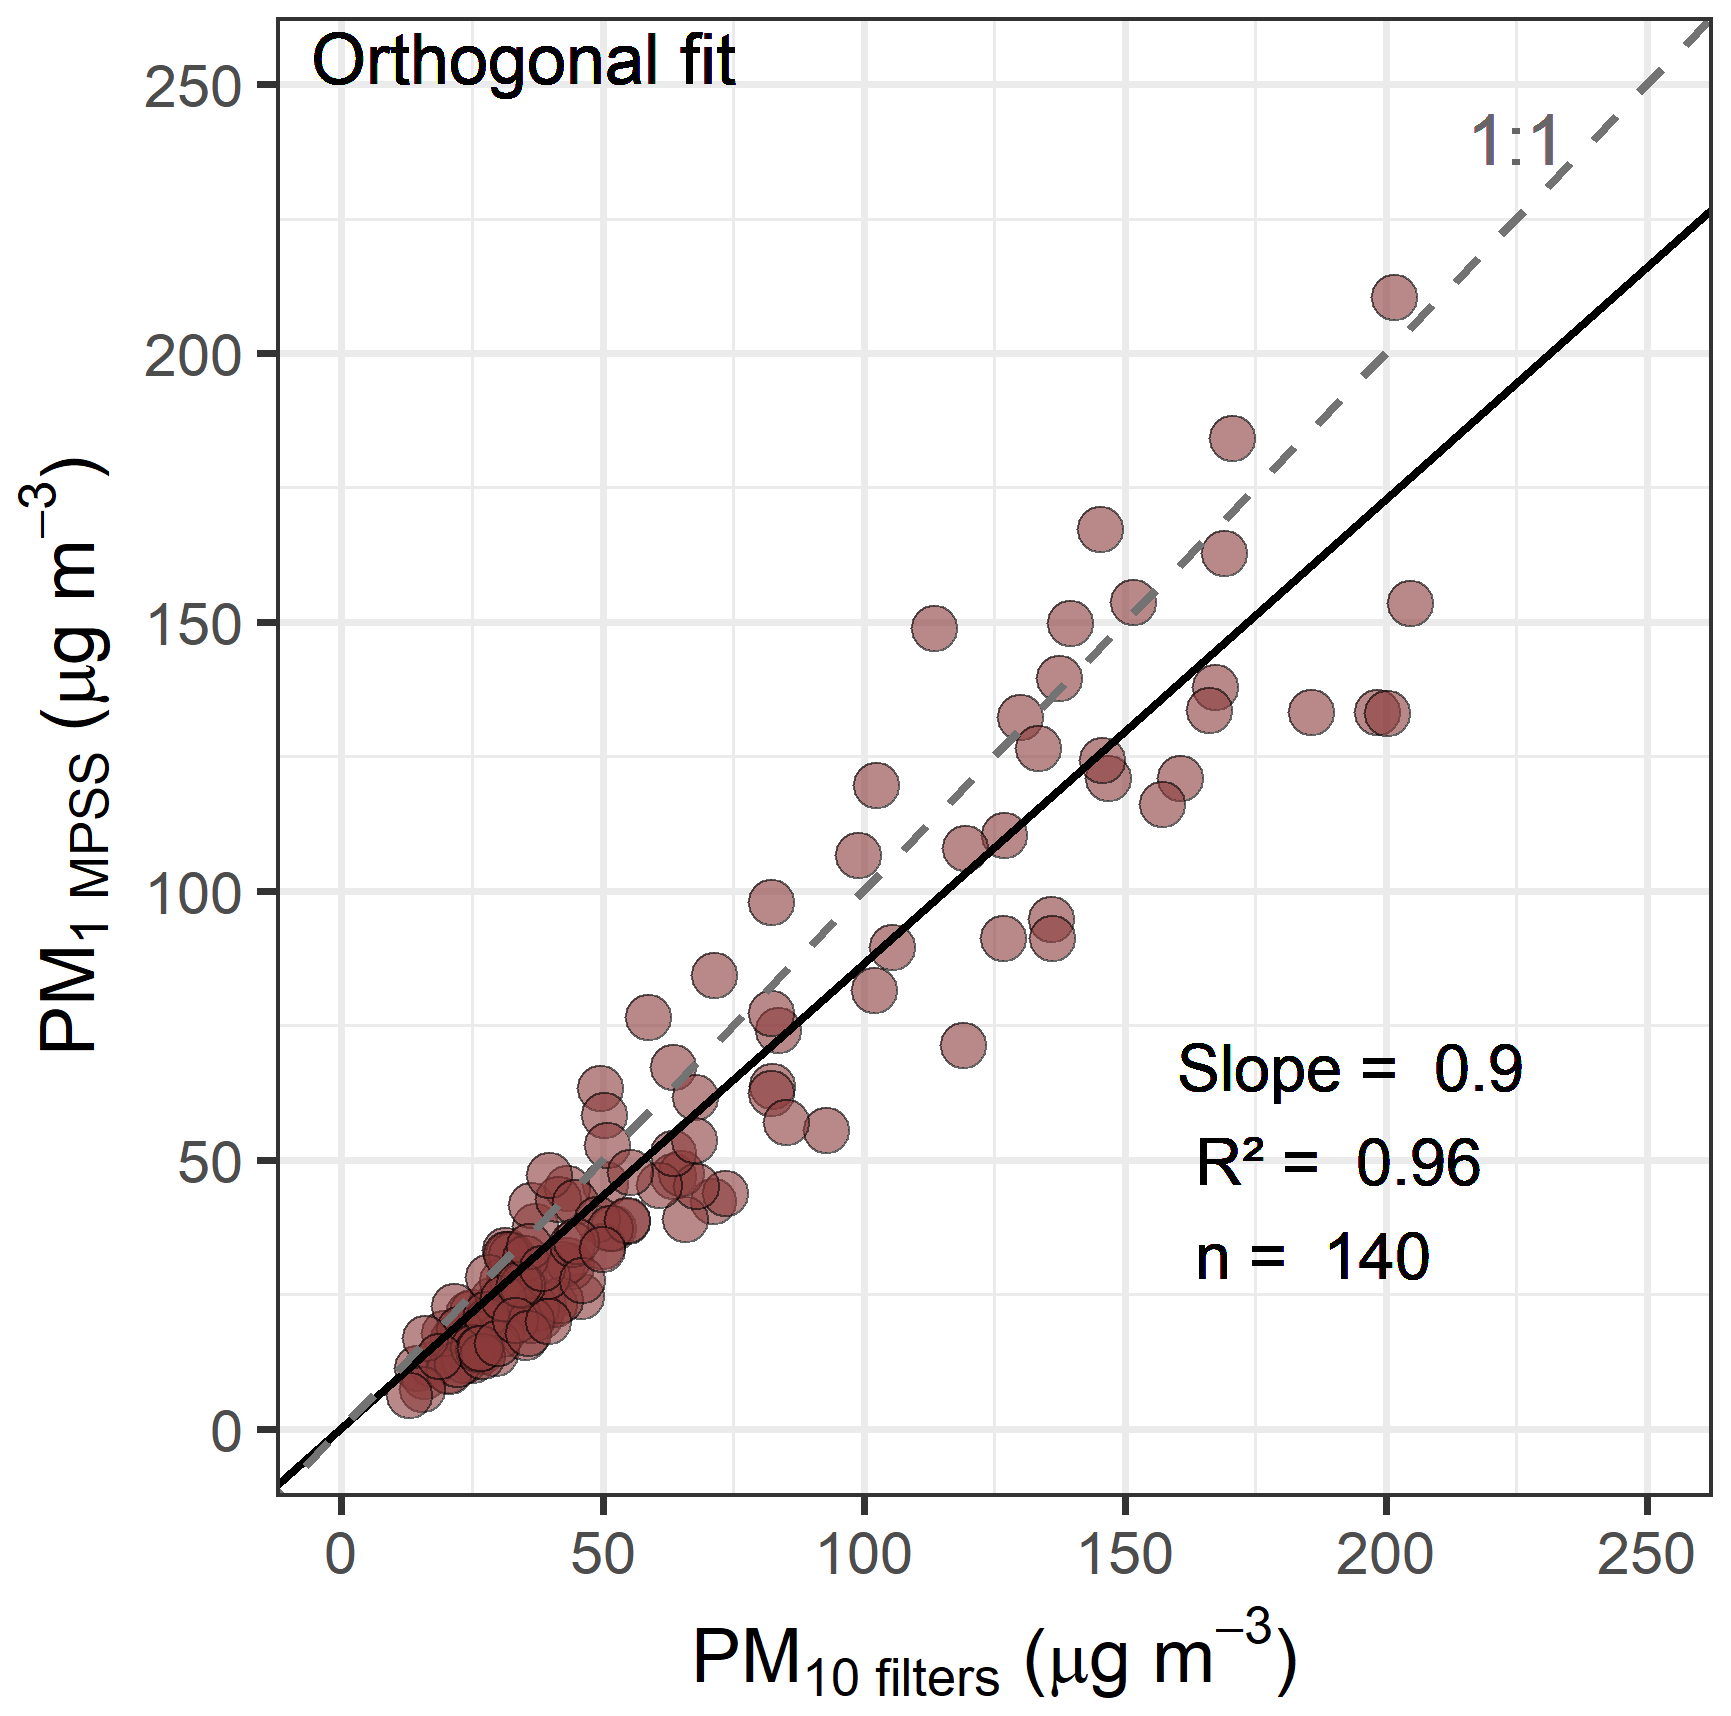
Figure 2Scatterplot and orthogonal regression (solid black line) for the PM1 calculated from the MPSS and the PM10 mass from filters. The figure includes the regression slope, the coefficient of determination (R2), and the number of observations (n). The intercept was forced through zero.
The hourly PM1 mass concentration was estimated from the MPSS volume size distribution, with the following assumptions: (i) the bulk aerosol density is constant (ρ=1.4 g cm−3, a typical value attributed to aerosols with relatively large fractions of organic species; Rissler et al., 2014; Turpin and Lim, 2001) and (ii) the aerosol particles have spherical shape (the mobility diameter is equivalent to the volume-equivalent diameter). Please note that all the size distributions from the MPSS in Retje (mobility diameters from 10 to ∼ 800 nm) were used in the PM1 mass calculation to cover the aerodynamic diameter of PM1. Mass concentrations of PM1 were not calculated for the background station, considering the maximum mobility diameter reached by the TSI MPSS.
The BC mass concentration was estimated from the optical measurement of absorption from the AE33 Aethalometer, denoted consequently as equivalent black carbon (eBC) (Petzold et al., 2013). The local mass absorption cross-section for BC (MACBC) was determined as the slope from the orthogonal fit between the 12 h averaged aerosol light absorption at 950 nm from the AE33 babs(λ) and the EC mass concentration derived from the thermo-optical analysis of the PM10 filters (see Sect. 3.2.3). Despite the differences between BC and EC given by their operational definitions (Bond and Bergstrom, 2006; Petzold et al., 2013), we assume, for this study, that both species are comparable and that at 950 nm BC dominates the light absorption (Zanatta et al., 2016). Accordingly, the eBC mass was calculated as follows:
The mass fraction of InA in PM10 (Cl−, NH, NO, SO, C2O, Na, K, Mg, and Ca) was, on average, 15 % of the total PM mass. For PM1, we assumed a similar percentage contribution of InA, considering the correlation between PM10 and PM1 (see Fig. 2) and a homogeneous distribution of the inorganic aerosols in the PM mass. The uncertainty of the slope in Fig. 2 was estimated using error propagation as outlined in Sect. 3.3. This estimation accounted for the individual contributions of the errors involved in both the PM1 calculation and the gravimetric determination of PM10. The final uncertainty was determined to be 15 %.
The estimated hourly OA mass concentration (OAMPSS, Eq. 2) was compared to the OC mass from the total carbon analyzer (OCTCA; see Eq. S4) and the OC from filters (OCfilters). In both cases, a good agreement was observed between OA and OC (Fig. S1 in the Supplement, OAMPSS vs. OCTCA: R2=0.95, OAMPSS vs. OCfilters: R2=0.97), suggesting that OAMPSS is a good approximation in the study site. The slopes in both comparisons (OAMPSS vs. OCTCA: 2.0, OAMPSS vs. OCfilters: 1.6) represent the local OA OC ratio. The estimated OA OC ratios differ due to the distinct analytical procedures from both methods and sampling periods (1 h averaged data from TCA08 and 12 h data from filters) (Brown et al., 2013). Nevertheless, both OA OC ratios fall within the range of ratios reported in the literature (Srinivas and Sarin, 2014b; Xing et al., 2013).
Please note that in the following, OAMPSS is referred to as OA.
2.4 Simple radiative forcing efficiency
To estimate the climate impact of the RWB aerosol particles emitted in Retje, we used the simple forcing efficiency (SFE), which quantifies the perturbation caused by the emitted aerosol particles on the radiative balance of the Earth's atmosphere (Chen and Bond, 2010; Choudhary et al., 2021). For this purpose, the equation proposed by Chen and Bond (2010) was used:
where SFE is given in W g−1; dS(λ)/dλ is the solar irradiance (W m−2 nm−1) obtained from the reference solar spectra from ASTM G173-03; and τatm and as are the atmospheric transmission (0.79) and the surface albedo (Earth average 0.19, fresh snow 0.80), respectively, whose values were taken from the study of Chen and Bond (2010). Fc is the cloud fraction (assumed to be 0.6); β(λ) is the light backscatter fraction; and MAC(λ) and MSC(λ) are the mass absorption and mass scattering cross-sections (m2 g−1), respectively. β(λ) was estimated by the mathematical relation with the asymmetry parameter g(λ) proposed by Sagan and Pollack (1967):
Mie modeling
The g(λ) and MSC(λ) were estimated using the core–shell Mie theory (Bohren and Huffman, 1998). The aerosol particles are considered to be spherical, consisting of a BC core surrounded by OA and InA, which are homogeneously mixed in the shell. As input for the Mie modeling, we provided volumetric fractions, complex refractive indexes, and size distributions of the three components every 12 h. The volumetric fractions were calculated considering the mass concentrations of OA, EC, and InA from the PM10 filters and densities from the literature (Eqs. S6–S8): ρBC=1.8 g cm−3, ρOA=1.4 g cm−3, and ρInA=2.1 g cm−3 (Bond and Bergstrom, 2006; Li et al., 2016; Turpin and Lim, 2001). The wavelength-dependent complex refractive indexes (n real part and k imaginary part) of BC, OA, and InA were also taken from previous studies and are shown in Table S1 in the Supplement (Chen and Bond, 2010; Kim et al., 2015). Finally, the effective complex refractive index of the shell was calculated using a volume mixing rule (Eq. S9). The MAC(λ) values for the simulated core–shell particles were calculated using field measurements of particle mass and absorption, as follows:
2.5 Atmospheric stability
The different categories of atmospheric stability in Loški Potok were identified according to the potential temperature gradient (), expressed in K m−1 and calculated as the difference in the absolute potential temperature (θ) from both sites (Eq. 7): Tabor Hill at the top of the valley (θbackground) and the village of Retje at the bottom (θvillage). Using the potential temperature is advantageous, since it discounts the compressibility effect caused by the air pressure. θ is the temperature a parcel of air would have if it expanded or were compressed adiabatically (no heat is added or subtracted) and were brought to a reference pressure (Hartmann, 2016). Hourly values of θ for Retje and Tabor were calculated as shown in Eq. (8), using the measurements from the meteorological sensors operating during the campaign (Table 1).
where T is the absolute temperature, P0 is the reference pressure (standard atmospheric pressure, 1 atm), P is the local pressure, R is the gas constant for air, and Cp is the specific heat capacity of air at constant pressure ( for ambient air; Wallace and Hobbs, 2006).
The categories of atmospheric stability are given according to : when , the potential temperature increases with height, the atmosphere is stable, and near-ground temperature inversions occur; when , the potential temperature is uniform, there are no net upward or downward buoyancy forces, and the atmosphere is neutral; when , there is a decrease in the potential temperature, the atmosphere is unstable, and vertical motions within an air parcel are favored (Hartmann, 2016). During the unstable conditions at Loški Potok, ranged from −5 to 0 K m−1, while for stable conditions ranged from 0 to 12 K m−1. The wide range of positive values motivated us to partition the inversion periods into two subcategories: weak inversion and strong inversion. The final categories of atmospheric stability used in the analysis are given in Table 2.
Table 2Categories of atmospheric stability according to the potential temperature gradient.
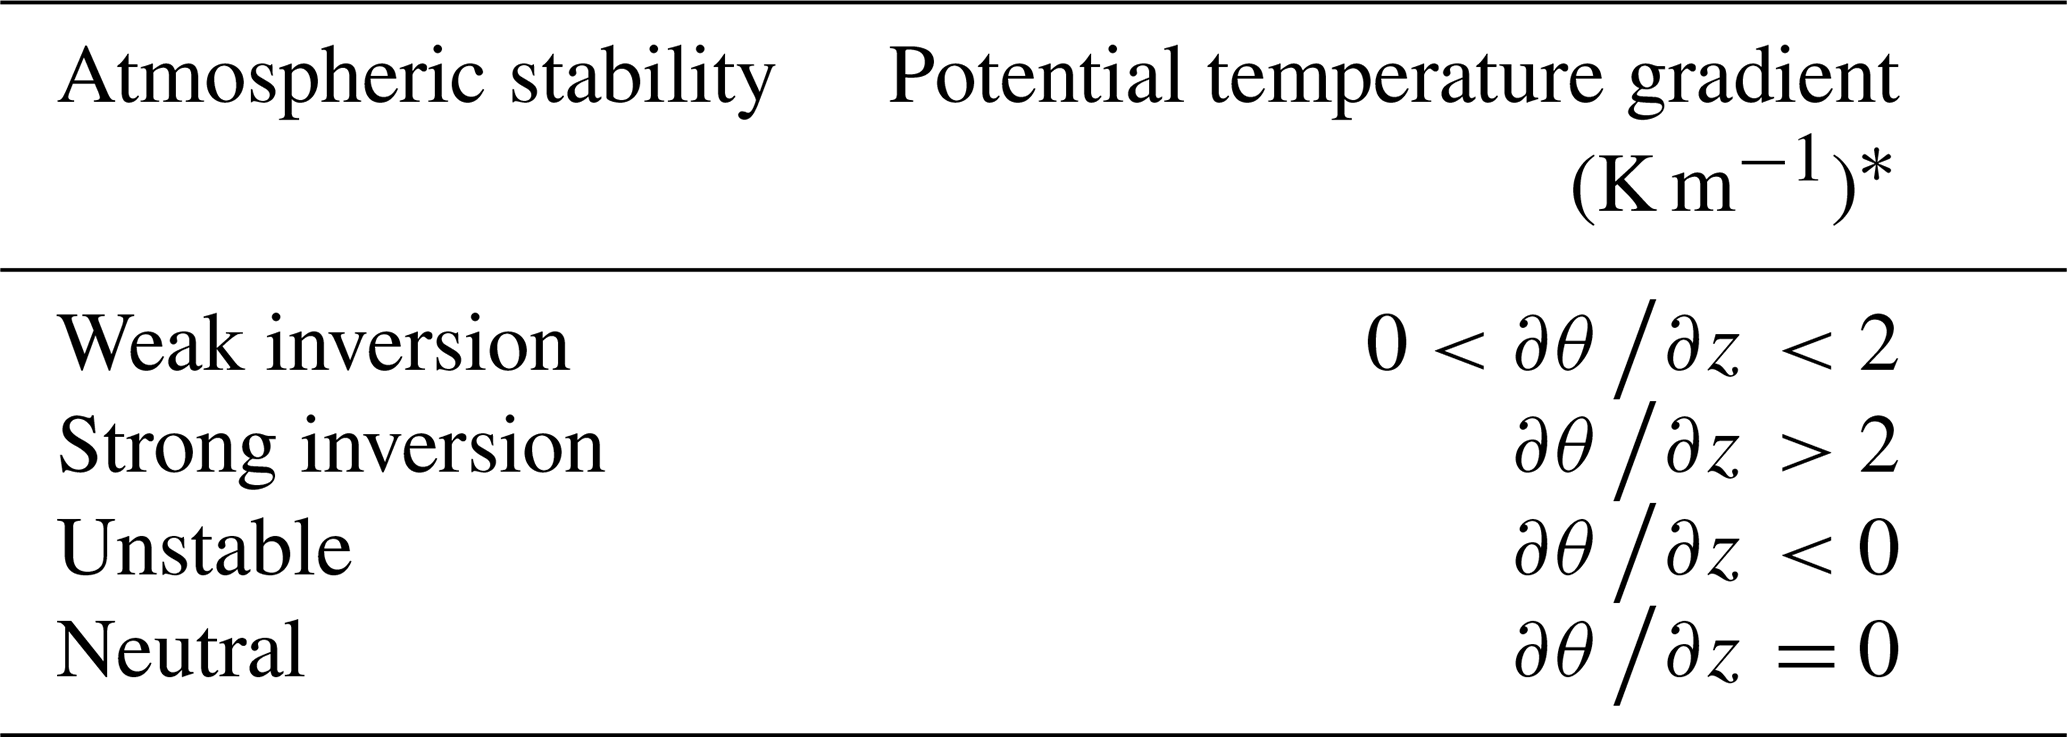
* Figure 3d shows the hourly potential temperature gradients () and the respective categories of atmospheric stability at Loški Potok during the campaign period.
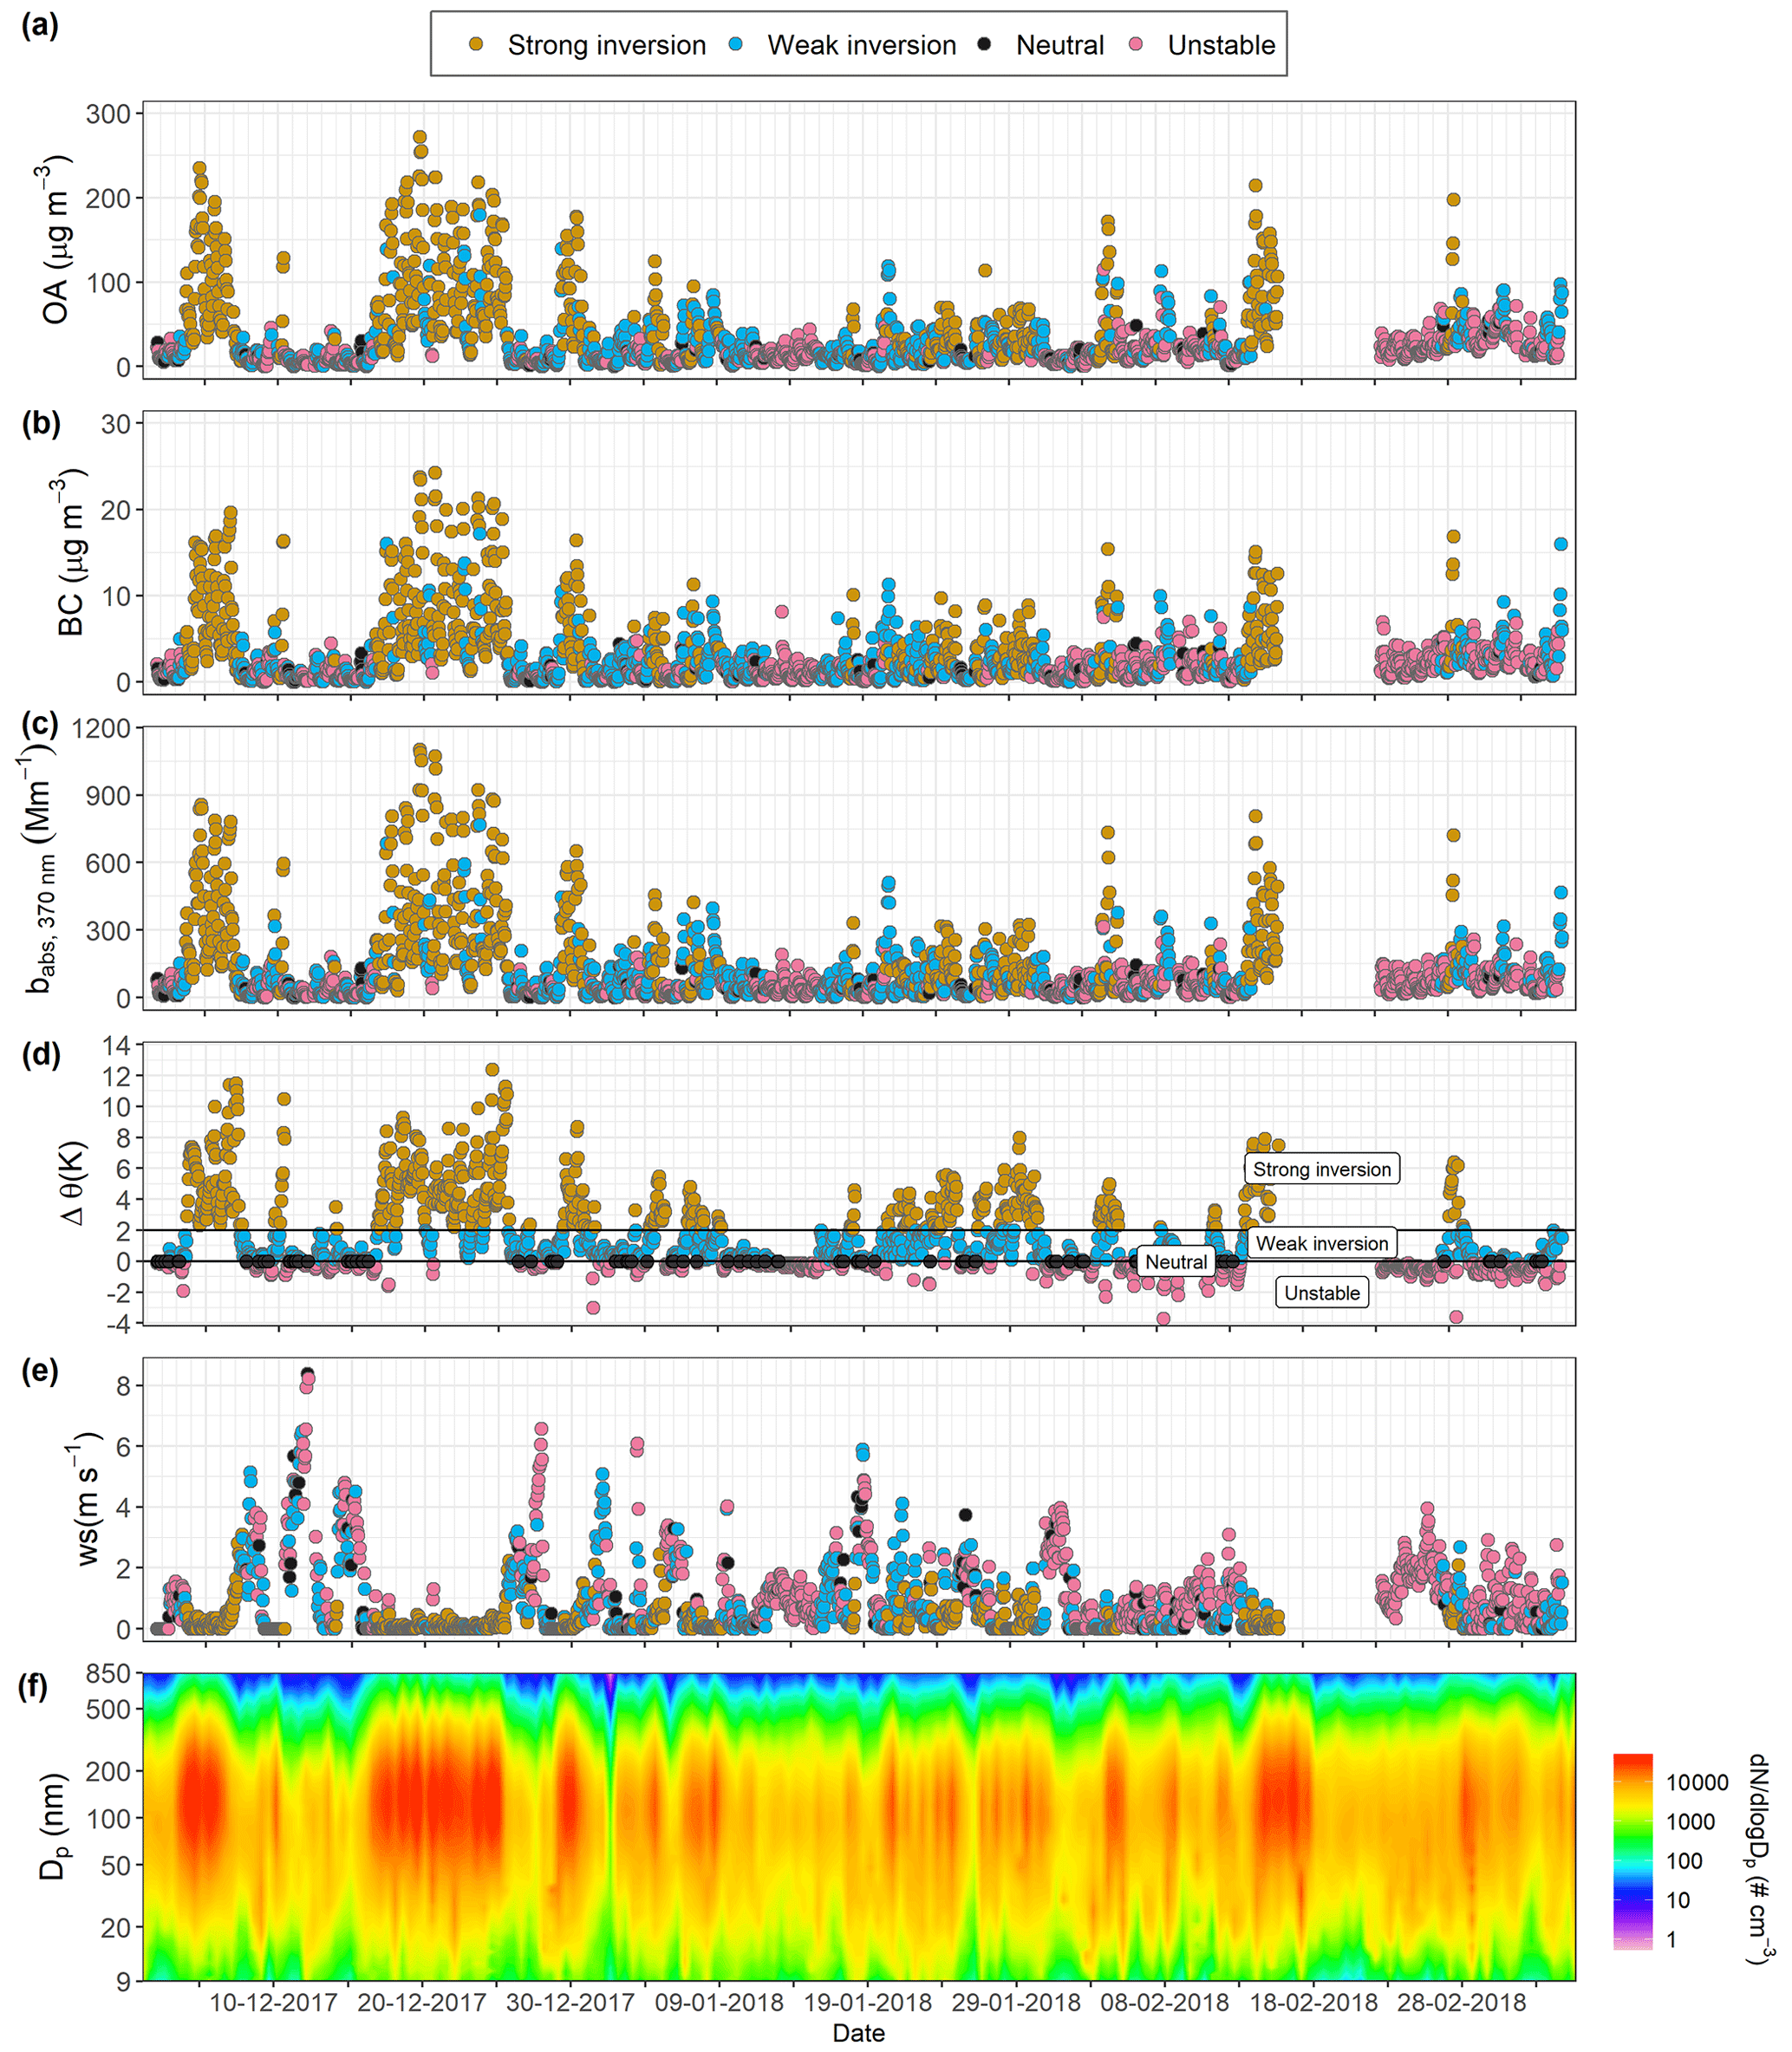
Figure 3Time series of 1 h organic aerosol (a) and black carbon (b) mass concentrations, (c) light absorption coefficient at 370 nm, (d) potential temperature gradient, (e) wind speed, and (f) particle number size distribution at Retje (main station).
2.6 Data processing and analysis
Deming's total least-squares regression was used to compare measurements from different methods or instruments, estimate the mass absorption cross-sections (MACs), and evaluate correlations among variables (R package “deming”; Therneau, 2018). Deming regression fits a couple of variables considering the independent measurement errors of both X and Y. The errors are assumed to be normally distributed, and the error ratio (Eratio) is constant (Deming, 1964). For Eratio=1, the regression results are equivalent to the orthogonal regression. Measurement data and calculations were processed in the software R version 4.0.0 (R Core Team, 2020).
3.1 Aerosol accumulation driven by atmospheric stability
Extremely high values for aerosol mass and particle number concentrations and light absorption coefficients were measured in Retje, Loški Potok, under conditions of near-ground temperature inversion. Figure 3 shows the time series of the OA and BC mass concentrations (Fig. 3a and b), the total light absorption coefficient at 370 nm (Fig. 3c), and the particle number size distribution (Fig. 3f) from the campaign period. For conditions of strong inversion, the OA and BC concentrations ranged from 1.9 to 270 and 0.1 to 24 µg m−3, respectively. In contrast, when the atmosphere was unstable, the OA and BC fluctuated from 0.17 to 120 and 0.0 to 8.1 µg m−3. The mean total light absorption coefficient at 370 nm was 260 Mm−1 (max 1100 Mm−1) under strong inversion, while the mean value registered under an unstable atmosphere was 56 Mm−1 (max 330 Mm−1). The mean total particle number concentration (10–600 nm) was 17×103 particles cm−3 under strong inversion, compared with the mean concentration of 6.1×10³ particles cm−3 for unstable atmosphere (see Table 3).
Table 3Statistics for 1 h measurements of mass concentrations, particle number concentration, and light absorption coefficients at the village of Retje, according to atmospheric stability. The numbers in parentheses correspond to the 10th (P10) and 90th (P90) percentiles.
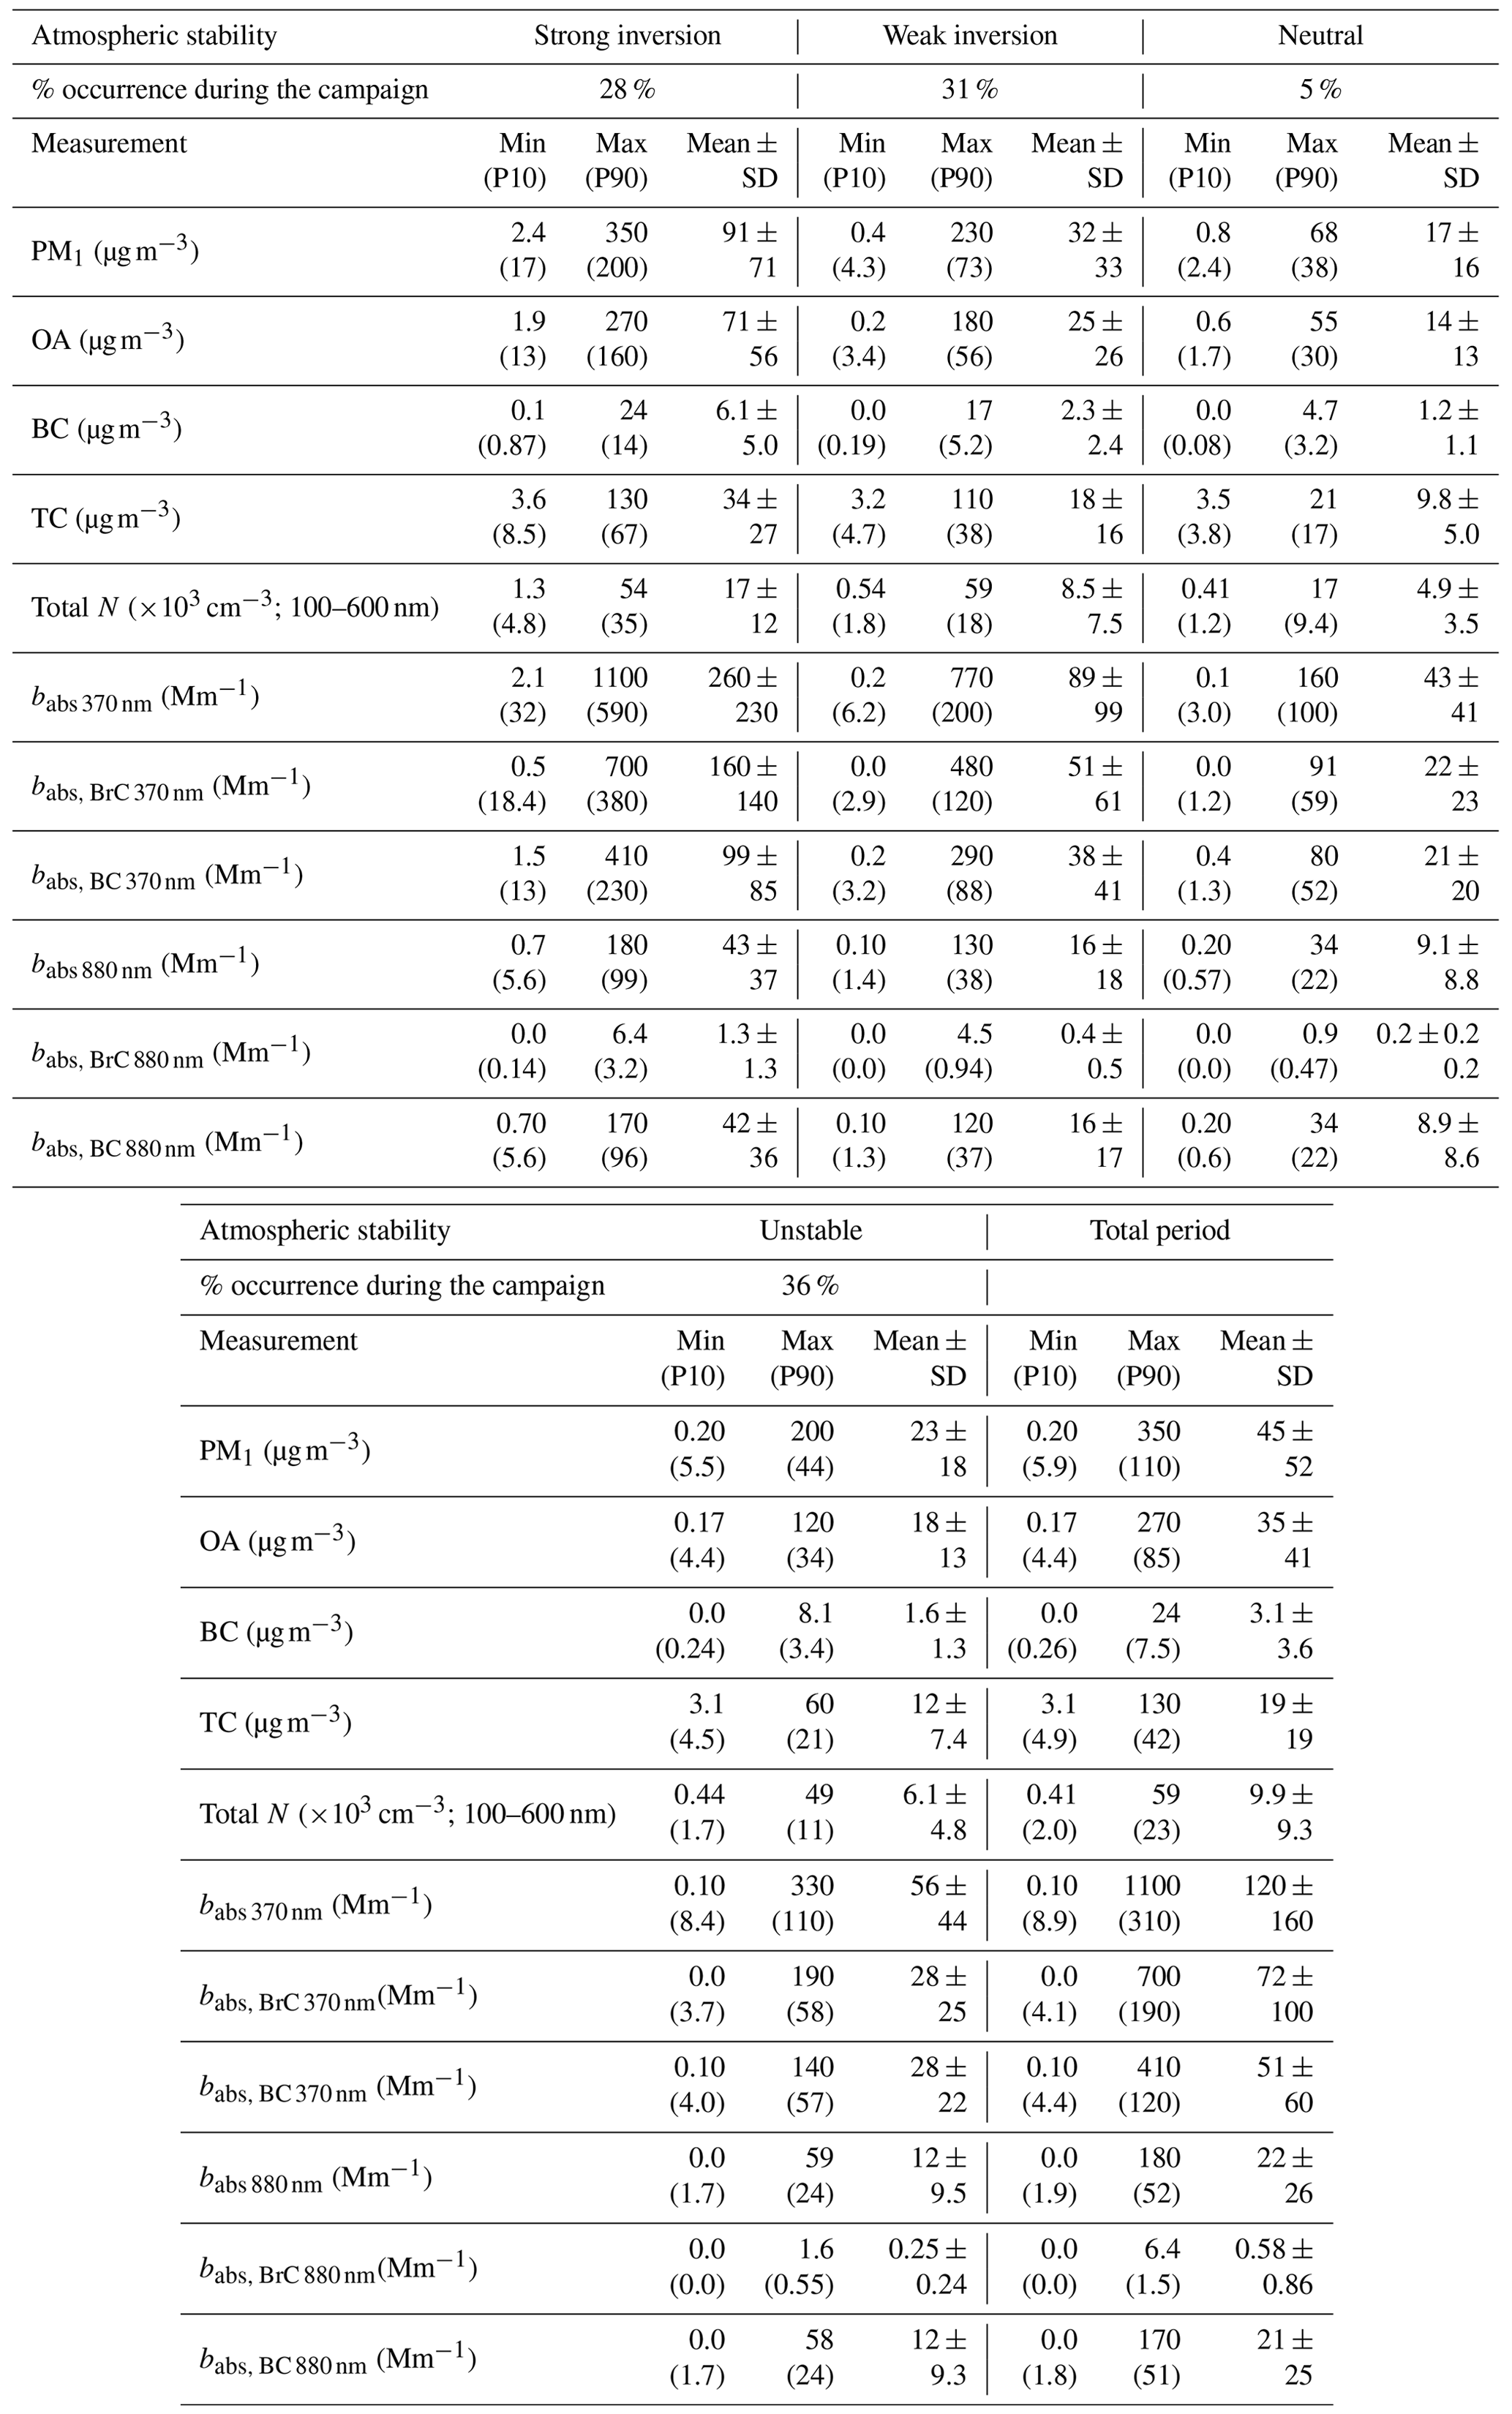
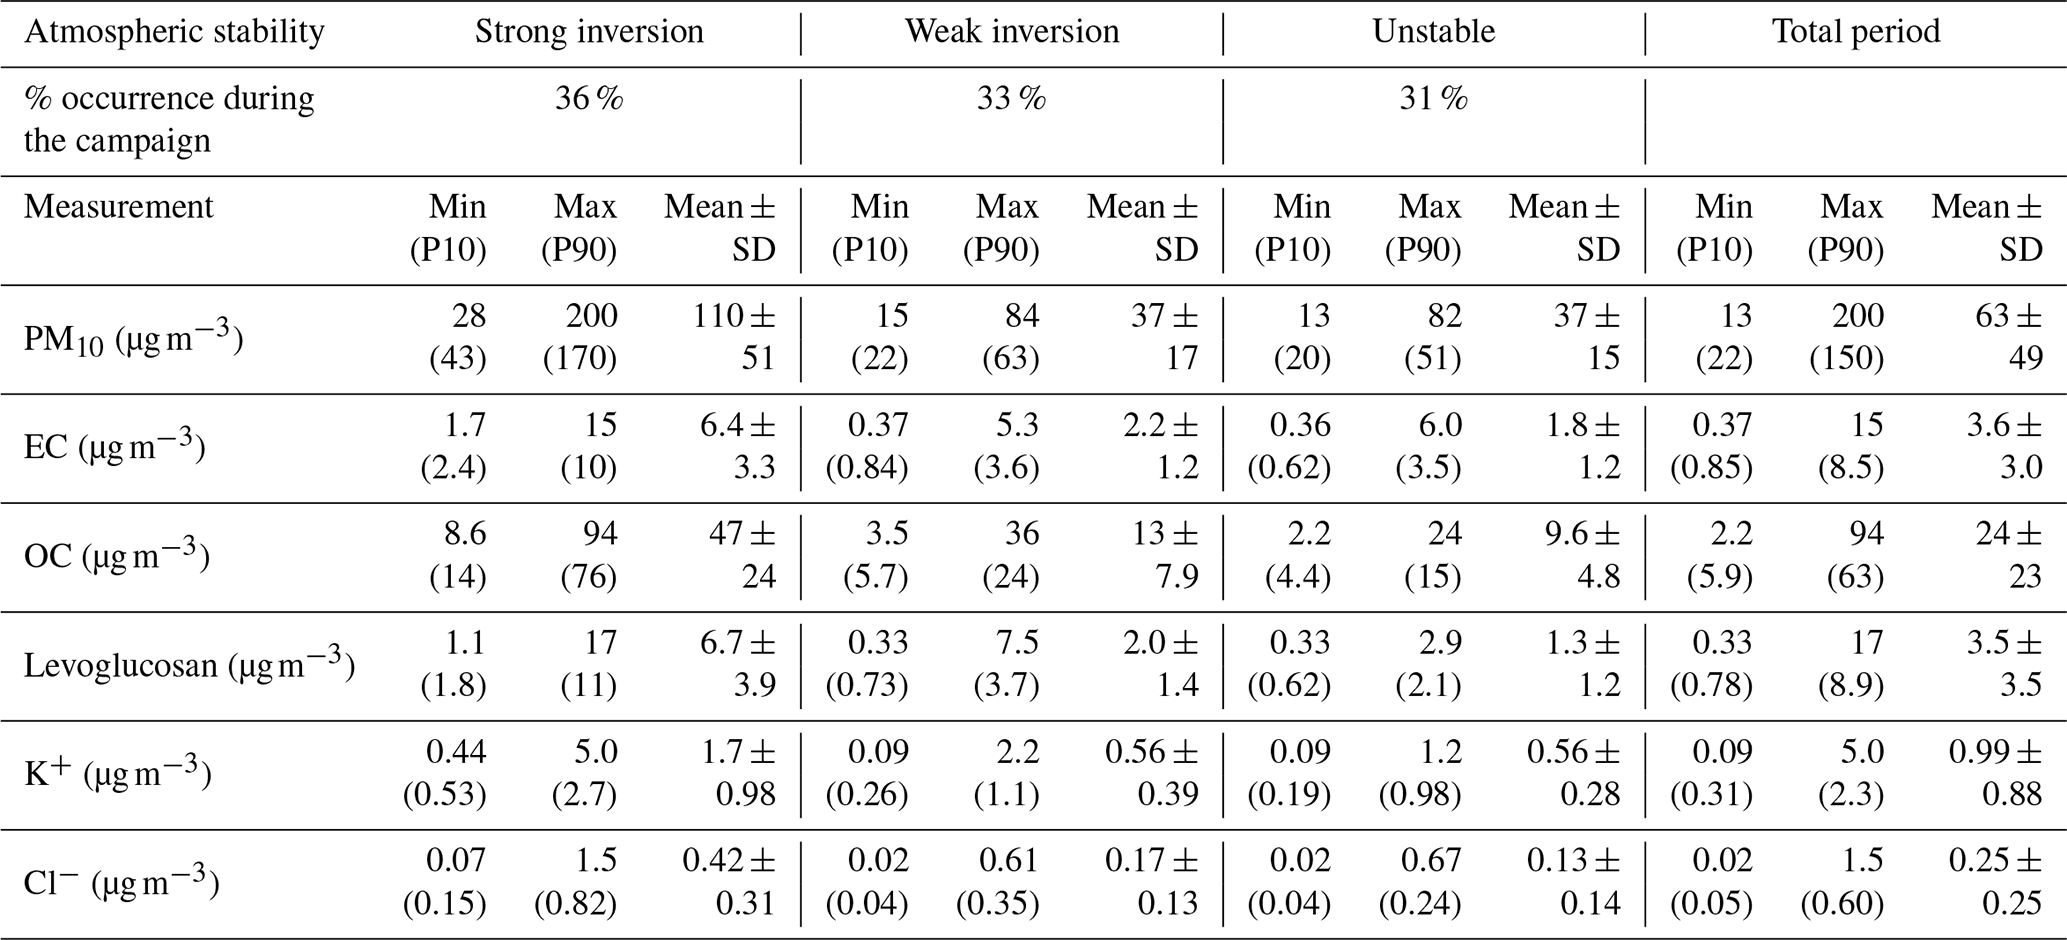
Table 4 shows the statistical summary for the PM10, EC, OC, and levoglucosan mass concentrations. For these, the 12 h predominant atmospheric stability was also identified for periods from 06:00 to 18:00 and from 18:00 to 06:00 LT. During periods when strong inversions prevailed, the mass concentrations of PM10, OC, and EC were the highest, reaching mean values of 110 µg m−3 (max 200 µg m−3), 47 µg m−3 (max 94 µg m−3), and 6.4 µg m−3 (max 15 µg m−3), respectively. The wood-burning tracer levoglucosan also exhibited higher concentrations during predominant temperature inversion periods, reaching a mean concentration of 6.7 µg m−3 (max 17 µg m−3).
Table 4Statistics for 12 h measurements of PM10 and its composition at the village of Retje, according to atmospheric stability. The numbers in parentheses correspond to the 10th (P10) and 90th (P90) percentiles.
The 1 and 12 h measurements showed decreased values during weak-inversion, neutral, and unstable atmosphere periods. Tables 3 and 4 show the statistical summaries of the aerosol measurements by categories of atmospheric stability and for the entire campaign period.
Episodes of strong temperature inversion are of primary interest in this study, since they favor the accumulation of aerosol particles produced by a predominant source: RWB. Presumably, the concentrations measured in the village at the bottom of the hollow are less impacted by external aerosol sources under temperature inversion. Therefore, its characterization gives an authentic fingerprint of residential-wood-burning emissions in a real environment. Strong and weak temperature inversion appeared 28 % and 31 % of the time based on hourly measurements, respectively. The more extended episodes of prevailing thermal inversion occurred from 3 to 7 December 2017, 17 to 26 December 2017, 29 December 2017 to 1 January 2018, and 14 to 17 February 2018.
The effect of atmospheric stability on the accumulation of aerosol particles in the hollow is observed when comparing the village and the background measurements. Figures 4 and 5 show the differences (Δ) in the particle number (N) and aerosol mass concentrations by atmospheric stability. Please note that deltas in the number concentration were calculated using ∼ 600 nm as the upper limit of both size distributions (main and background stations) for comparability. The values of ΔN were, in general, positive and largest under strong inversion, while the lowest and closer-to-zero values were observed for unstable atmosphere. From Fig. 4, the significant contribution of RWB emissions for particles in the size range of 50 to 150 nm is evident, with a median , 22×102, and 15×102 particles cm−3 under strong inversion, weak inversion, and unstable atmosphere, respectively. In contrast, the median ΔN10−50 values were 12×102, 9.8×10², and 9.6×10² particles cm−3, and medians for ΔN150−600 values were 24×102, 9.4×10², and 5.3×10² particles cm−3, for each category of atmospheric stability, respectively. In general, ΔN10−50 exhibited the lowest change among the stability conditions, given that from strong inversion to weak inversion, ΔN50−100 reduced by 50 % and ΔN100−600 by 60 %. We hypothesize that the almost constant ΔN10−50 is explained by the predominant sources of ultrafine particles: secondary aerosol particles, sea salt, and traffic emissions (Leoni et al., 2018). All these three sources might have an impact on the local and background concentrations at the study site. ΔBC showed similar trends to ΔN. For strong inversion, weak inversion, and unstable atmosphere, the mean ΔBC was 4.4, 1.5, and 0.9 µg m−3, respectively. In some cases, the values of ΔBC were negative, meaning the concentrations in the background were higher than in the village.
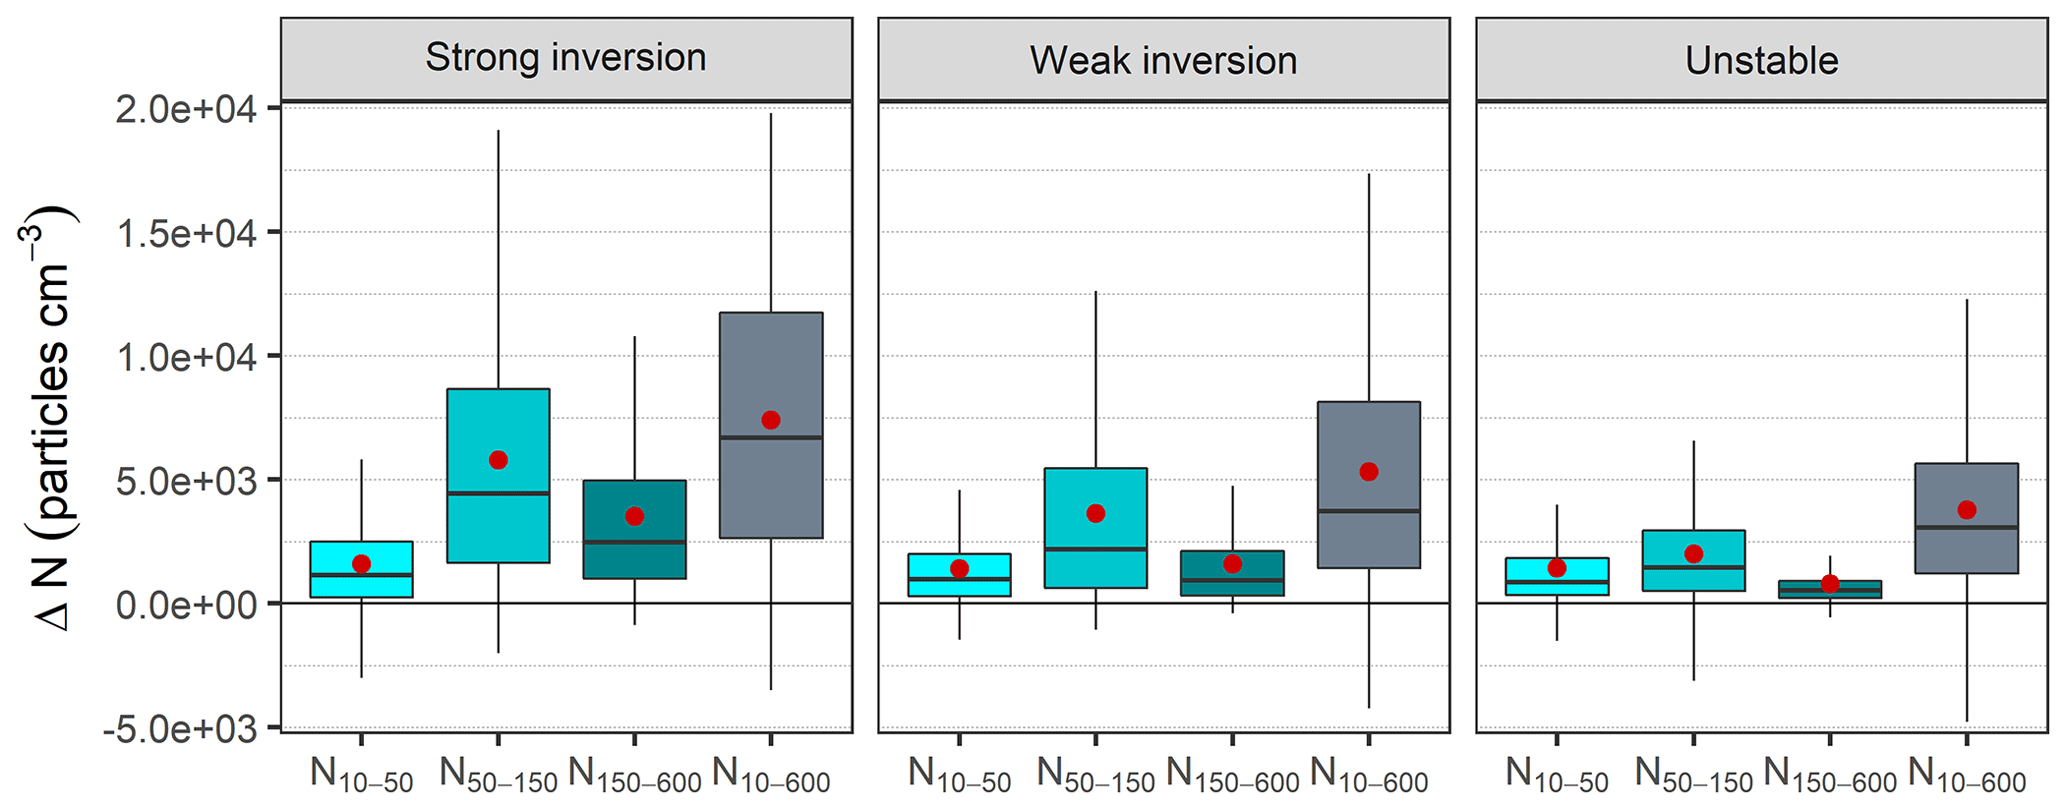
Figure 4Boxplots and mean values (red dots) of the differences in N between the village and the background stations, according to size ranges. The maximum size range in the village was set to 600 nm to match the maximum measurement limit from the MPSS at the background station. The lower and upper borders of the boxes represent the first and third quartiles in which the middle 50 % of the statistical variables are located, the horizontal black lines inside the boxes represent the median, and the whiskers represent the minimum and maximum values without outliers.
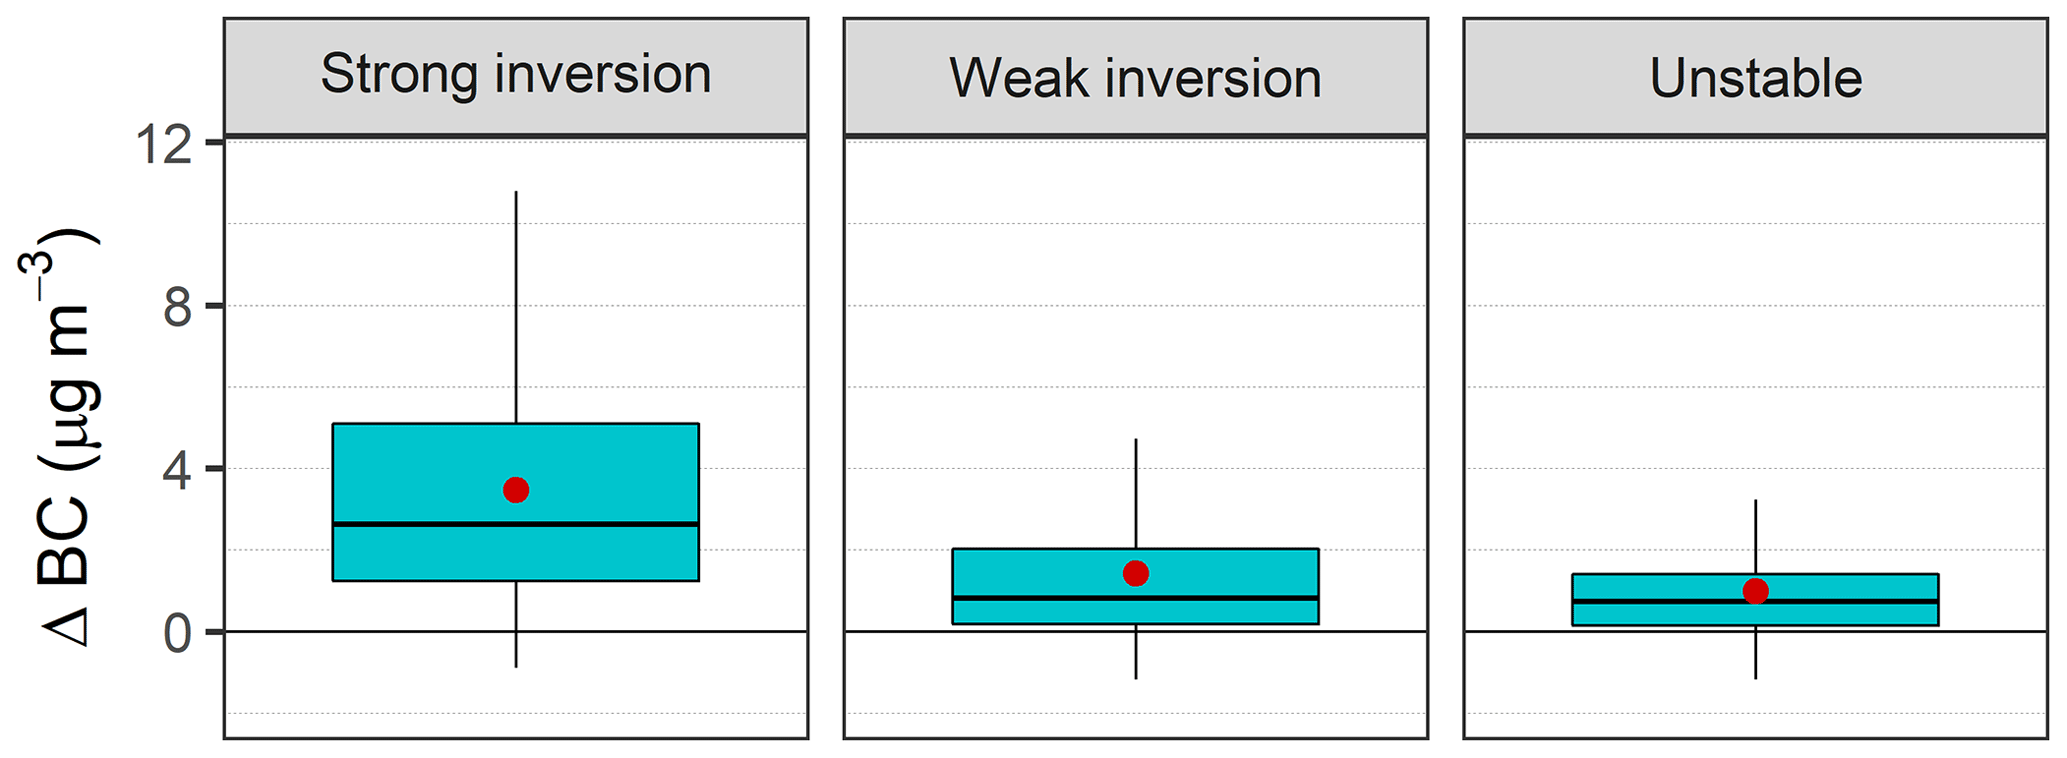
Figure 5Boxplots and mean values (red dots) of the differences in BC between the village and the background stations, according to atmospheric stability. The lower and upper borders of the boxes represent the first and third quartiles in which the middle 50 % of the statistical variables are located, the horizontal black lines inside the boxes represent the median, and the whiskers represent the minimum and maximum values without outliers.
3.2 Aerosol optical properties
3.2.1 Light absorption coefficients
In the village, the aerosol light absorption coefficient at 370 nm (babs (370 nm)) reached 1100 Mm−1 (under strong inversion). The total light absorption measured by the AE33 at multiple wavelengths (babs(λ)) was assumed to include the contribution of both BC and BrC. To apportion the light absorption corresponding to BC and BrC at each wavelength, we used a method based on the absorption Ångström exponent (Lack and Langridge, 2013; Massabò et al., 2015). Accordingly, for a given wavelength, we have
For a given pair of wavelengths λ1 and λ2, the mathematical definition of the BC absorption Ångström exponent (AAEBC) can be written as
Taking λ2 as 950 nm and assuming that at this wavelength, the total absorption corresponds entirely to BC (the contribution from BrC is negligible) and that AAEBC=1, Eq. (10) is rearranged as follows:
Combining Eq. (9) and Eq. (11), the BrC absorption at λ1 will be
In Eq. (12) λ1 is any wavelength between 370 and 880 nm.
The values of babs(950 nm) reached 160, 110, and 54 Mm−1 for strong inversion, weak inversion, and unstable atmosphere, respectively.
A significant contribution from BrC to the total aerosol light absorption was measured in Loški Potok: during strong inversion, the average contribution of babs, BrC(370 nm) was 60 % (range = 17 % to 78 %, Fig. 6). For conditions of weak inversion and unstable atmosphere, the average contribution of babs, BrC(370 nm) was 54 % and 43 %, respectively. The contribution of babs, BrC to the total absorption decreased toward the infrared (470 nm = 46 %, 520 nm = 37 %, 590 nm = 29 %, 660 nm = 18 %, and 880 nm = 3 %).
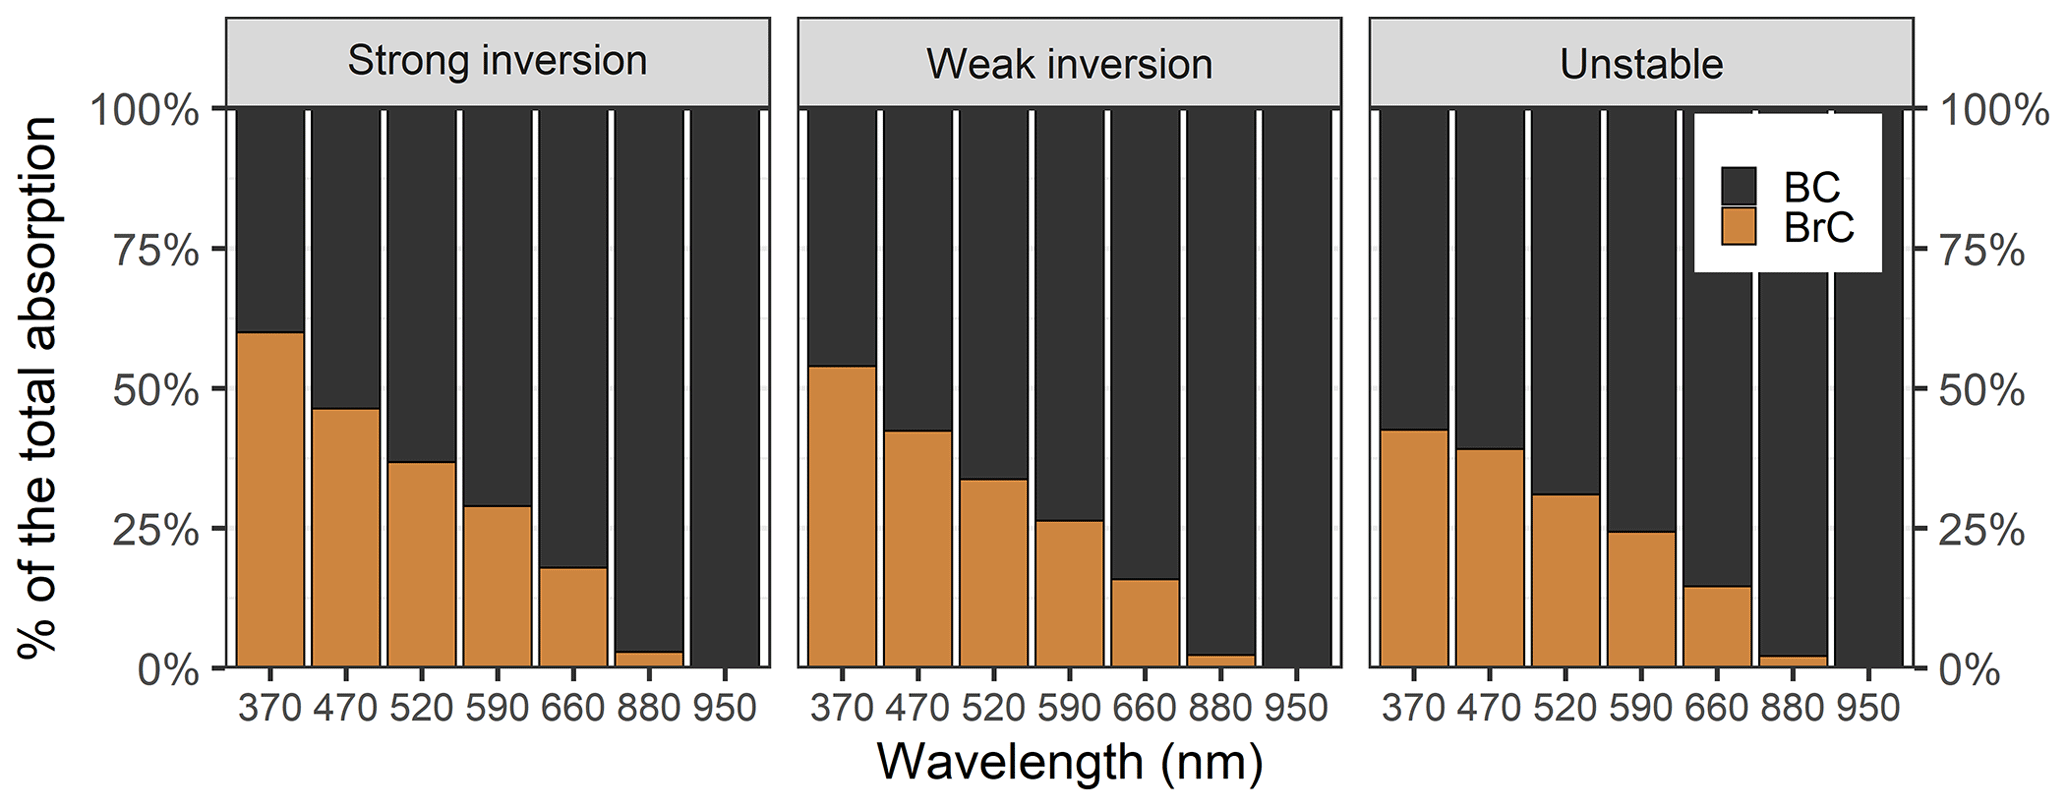
Figure 6Mean BC and BrC contributions to light absorption from 370 to 950 nm in Retje, Loški Potok, according to atmospheric stability. Results for neutral atmosphere are not shown due to insufficient data.
The average contribution of BrC to the total aerosol light absorption in the near UV under strong inversion is significantly higher than findings from previous studies in urban and rural locations impacted by wood- and biomass-burning emissions. For instance, the national study by Zhang et al. (2020) in France found a maximum BrC contribution of 42 % in the Paris area. Mbengue et al. (2021) estimated that BrC contributions in a rural and regional background station in the Czech Republic reach 19 % in winter. In the Indian city of Kanpur, the mean contribution for BrC absorption was 30 % (Shamjad et al., 2016). In a suburban site near Guangzhou in China, BrC contributed 24 % of the total UV absorption (Qin et al., 2018). A similar and substantial contribution from BrC to the total light absorption was found in the city of Ioannina (110 000 inhabitants; POCITYF, 2023), Greece, where severe RWB emissions produced an average BrC contribution of 68 % (calculated from the reported mean values of babs and babs, BrC at 370 nm; Kaskaoutis et al., 2022).
3.2.2 BrC (OA) absorption Ångström exponent
The wavelength dependence of babs, BrC is plotted in Fig. 7a. Initially, a power law fit was applied to the spectral range of 370–880 nm; nevertheless, we observed that the fitting curve for babs, BrC throughout 370–880 nm resulted in an overestimation of the absorption at 370 nm of about ∼ 50 % (dotted grey line in Fig. 7a). Similar findings have been observed in other studies (Hoffer et al., 2006) and are associated with the presence of internally mixed aerosol particles, whose content of BrC affects the different spectral dependencies (Kumar et al., 2018). Using one single AAEBrC might not be representative, and some studies suggest that AAEBrC is wavelength-dependent (Hoffer et al., 2006; Utry et al., 2014). Utry et al. (2014) found better correlations between particle modes and geometric mean diameters, the levoglucosan total carbon ratio, and the OC EC ratio with AAEBrC computed for the range of 355 to 532 nm; in contrast, comparatively poor correlations were found when AAEBrC was estimated for the range of 266 to 1064 nm. Consequently, we recalculated AAEBrC for two separate ranges: 370–590 nm (more significant OA absorption) and 590–880 nm (lower OA absorption) and selected those AAEs for which R2≥0.8. Figure 7a shows the substantial change in the slope of the fitted lines for both ranges of wavelengths. The resulting AAEBrC values were AAE 3.9 (± SD 0.4) and AAE 7.6 (± SD 0.4) under strong inversion (Fig. 7b and c). Multiple authors have addressed the sensitivity of the AAE to the range of wavelengths selected for its calculation (Harrison et al., 2013; Utry et al., 2014). Yet, the extent of this sensitivity depends on the aerosol source. It is lower for aerosols with predominant BC (Cuesta-Mosquera et al., 2021) and higher for samples containing a substantial contribution of organic species.
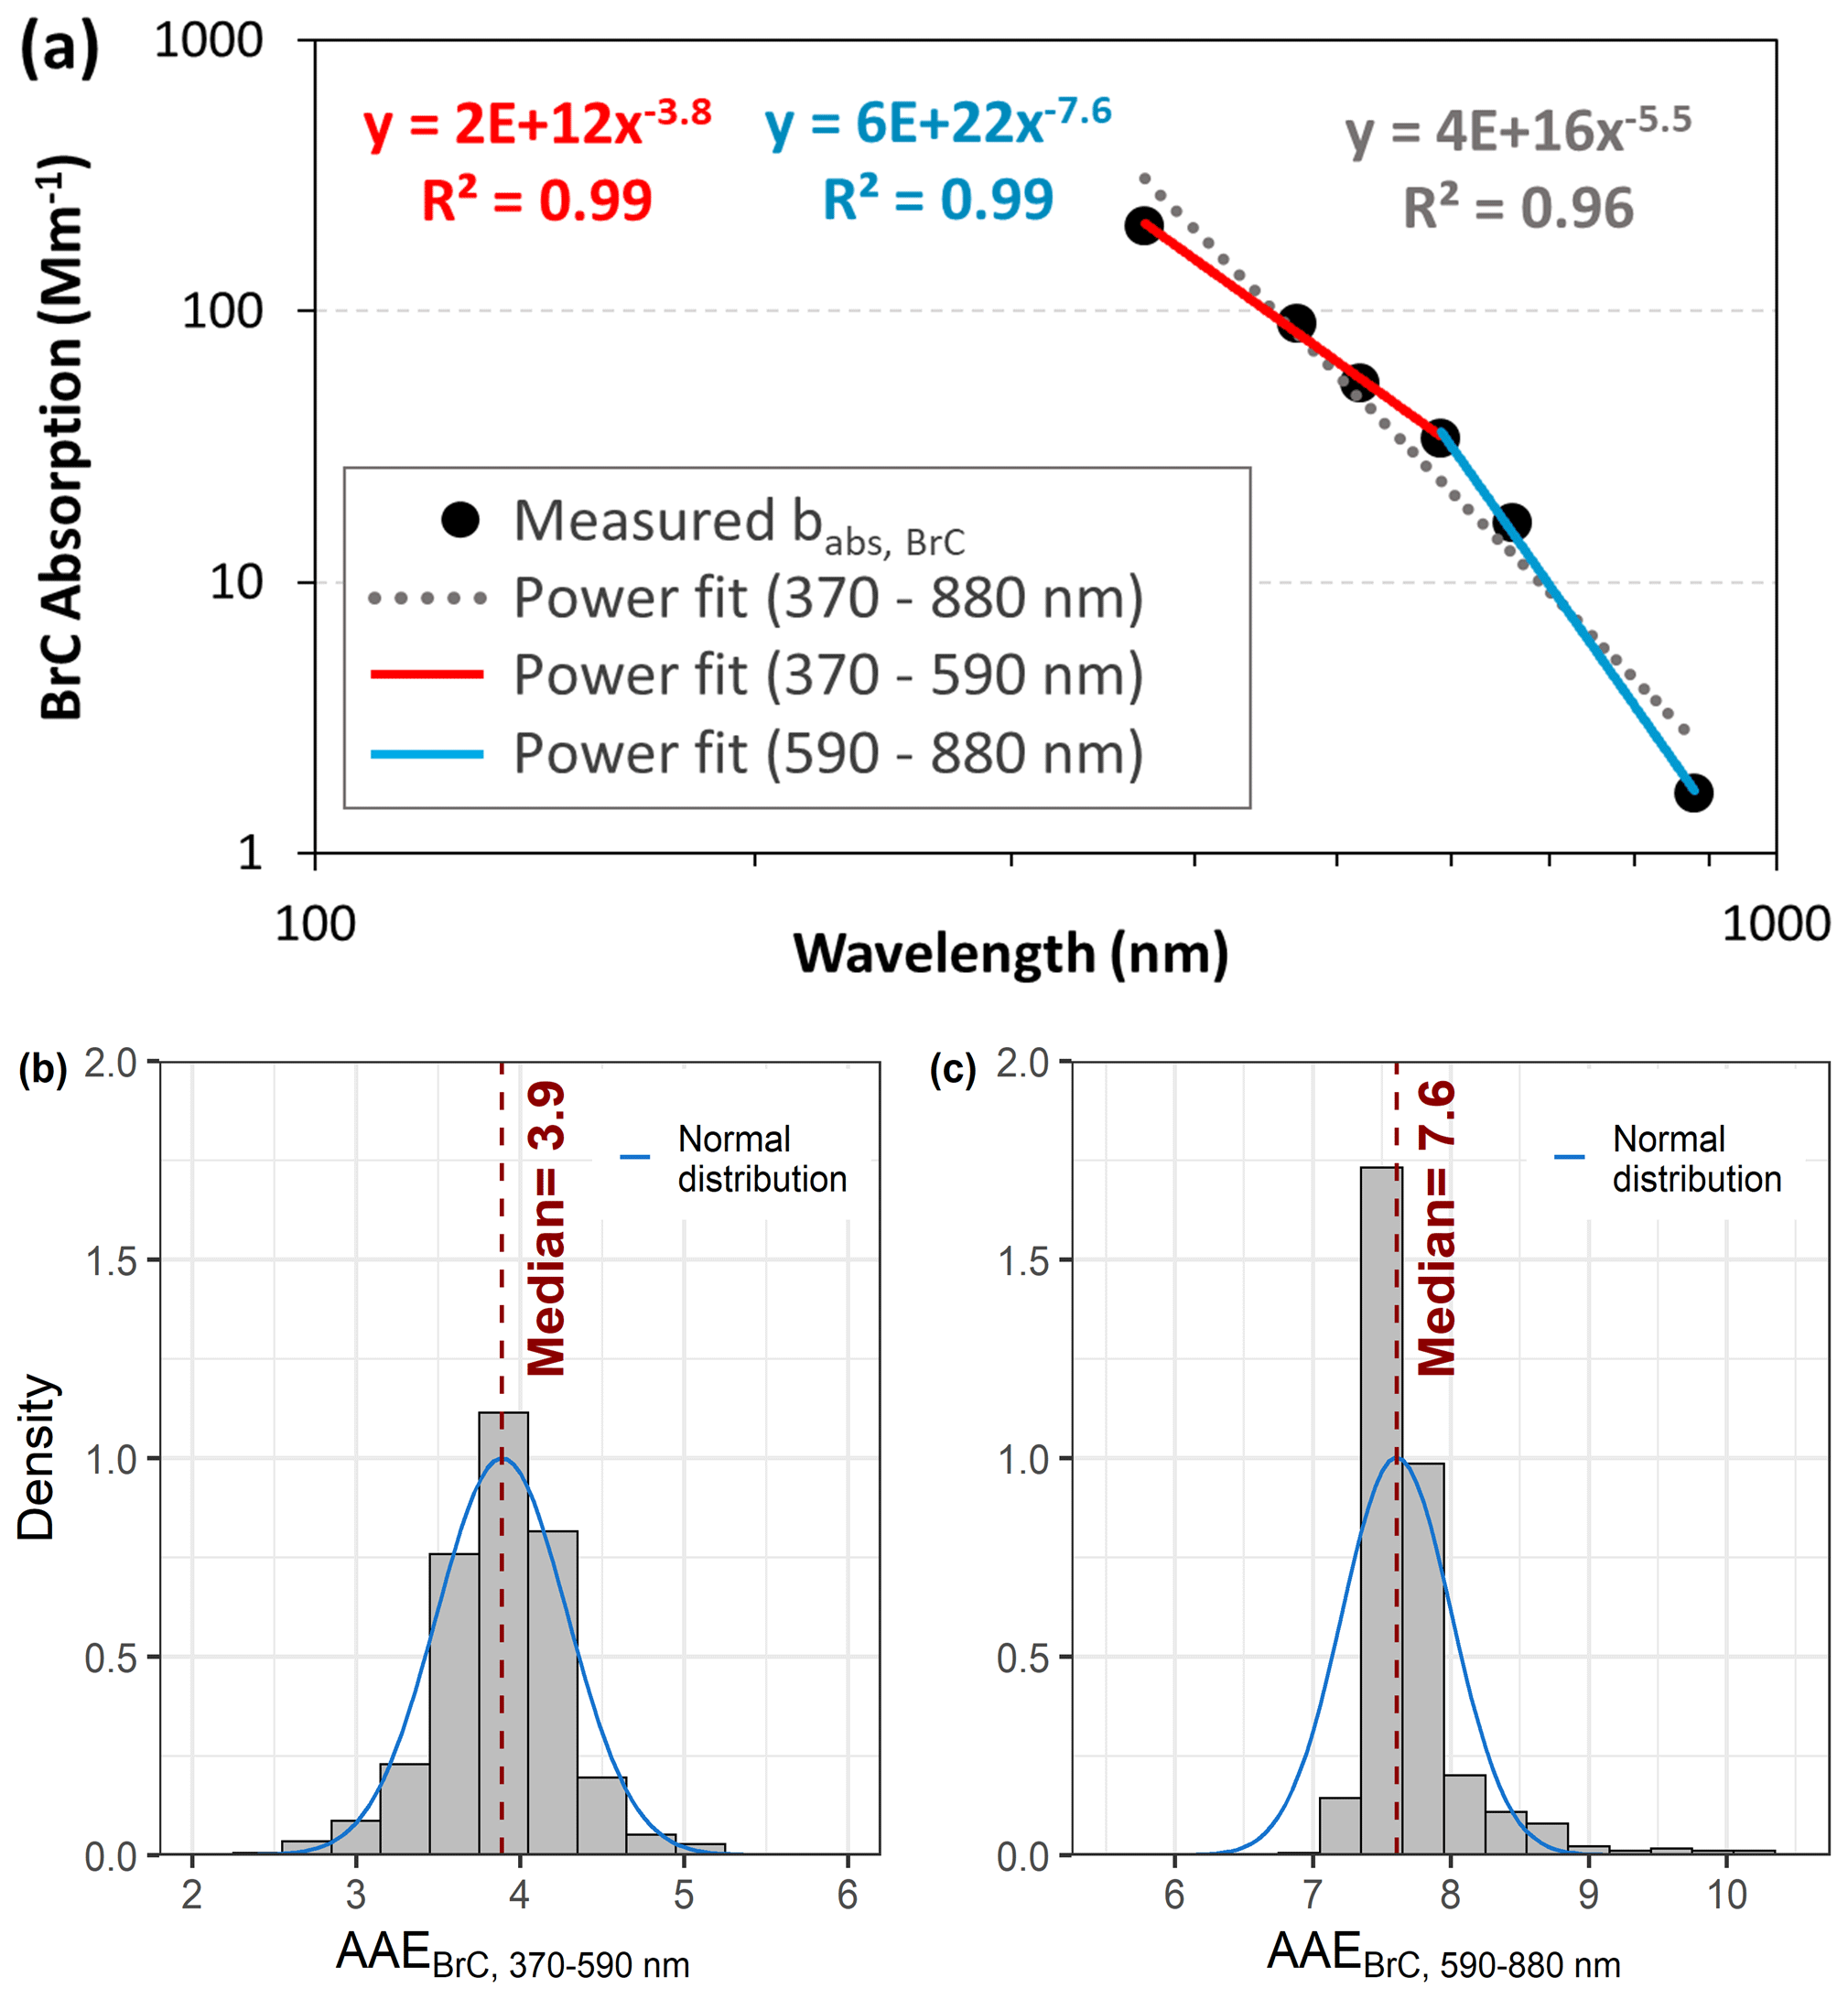
Figure 7(a) Power law fittings of the BrC absorption spectra in log–log scale, (b) histogram of the BrC absorption Ångström exponent from 370 to 590 nm, and (c) histogram of the BrC absorption Ångström exponent from 590 to 880 nm.
The median values of AAE differ by atmospheric stability (statistically significant difference, non-parametric median Mood's test, p values < 0.05, α=0.05). Under weak inversion and unstable atmosphere, AAEBrC 370−590 nm was 3.7 (±SD 0.5) and 3.5 (±SD 0.5) and AAEBrC 590−880 nm was 7.8 (±SD 0.7) and 7.7 (±SD 1.1), respectively. The variation between the median AAE values amid the atmospheric-stability categories suggests a slight change in the composition of the organic aerosols among the three, most likely driven by the mixing of aerosols from external sources and photochemical processes (He et al., 2022; Liu et al., 2016).
3.2.3 BrC (OA) and BC mass absorption cross-sections (MACs)
The RWB OA mass absorption cross-section (MACOA) was estimated as the slope from the fitting among the organic aerosol mass and the apportioned BrC light absorption. Figure 8a shows the scatterplot and orthogonal fitting for measurements under strong inversion (highest accumulation of OAs).
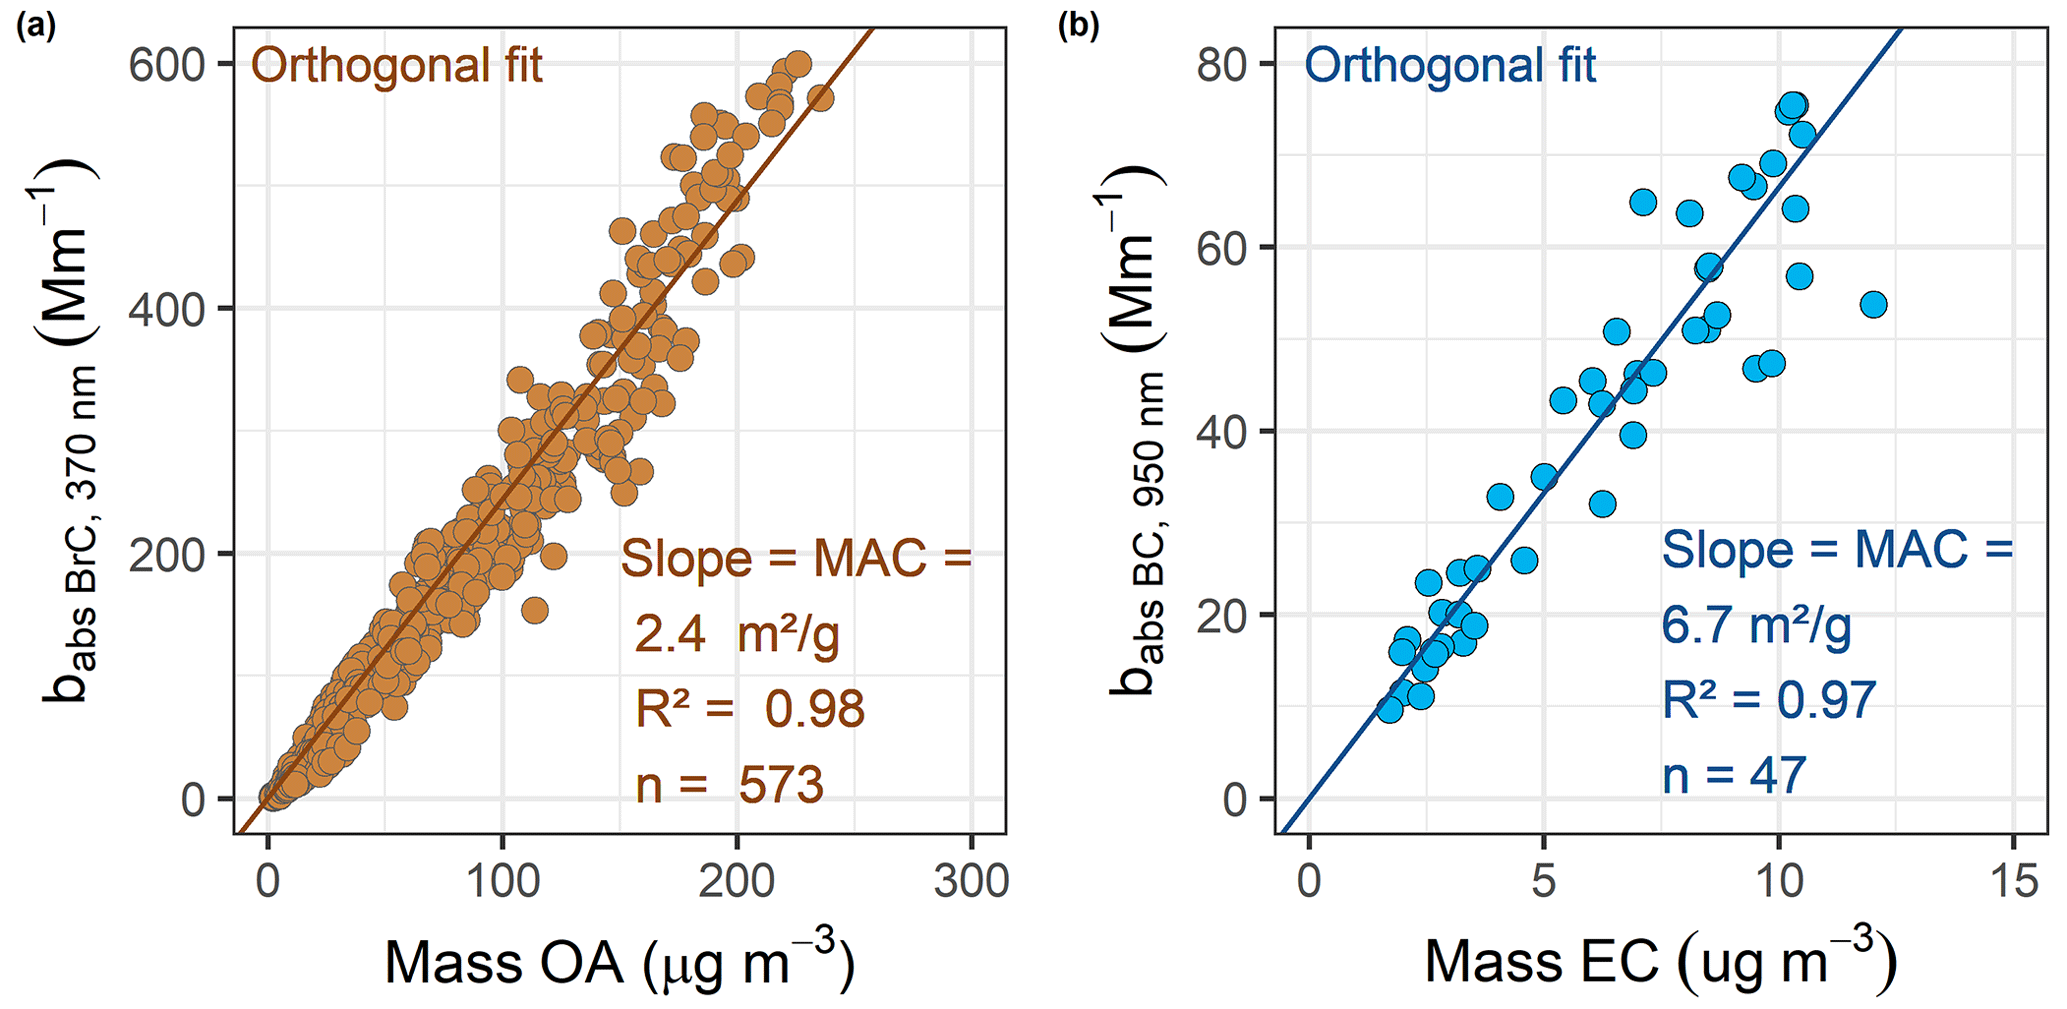
Figure 8Scatterplots and orthogonal fits for the village measurements of (a) 1 h BrC light absorption at 370 nm and OA mass concentrations and (b) 1 h BC light absorption at 950 nm and EC mass concentrations under strong near-ground temperature inversion. The figure includes the coefficient of determination (R2) and the number of observations (n). The intercept was forced through zero.
For the study site, the estimated RWB MAC 2.4 m2 g−1 (calculated for conditions of strong inversion). For periods of weak inversion MACOA, 370 nm almost did not change (2.3 m2 g−1). On the contrary, for an unstable atmosphere, MACOA, 370 nm (1.8 m2 g−1) was lower and statistically significantly different than the MAC values calculated for strong and weak inversion (hypothesis test, p value < 0.0001, α=0.05). The decreased MACOA, 370 nm for unstable conditions is associated with lower OA absorption. Along with little absorption, the reduced MACOA, 370 nm indicates the presence of diverse light-absorbing compounds during an unstable atmosphere, since the mixing with aerosols from external non-local sources and regionally processed aerosol is presumed.
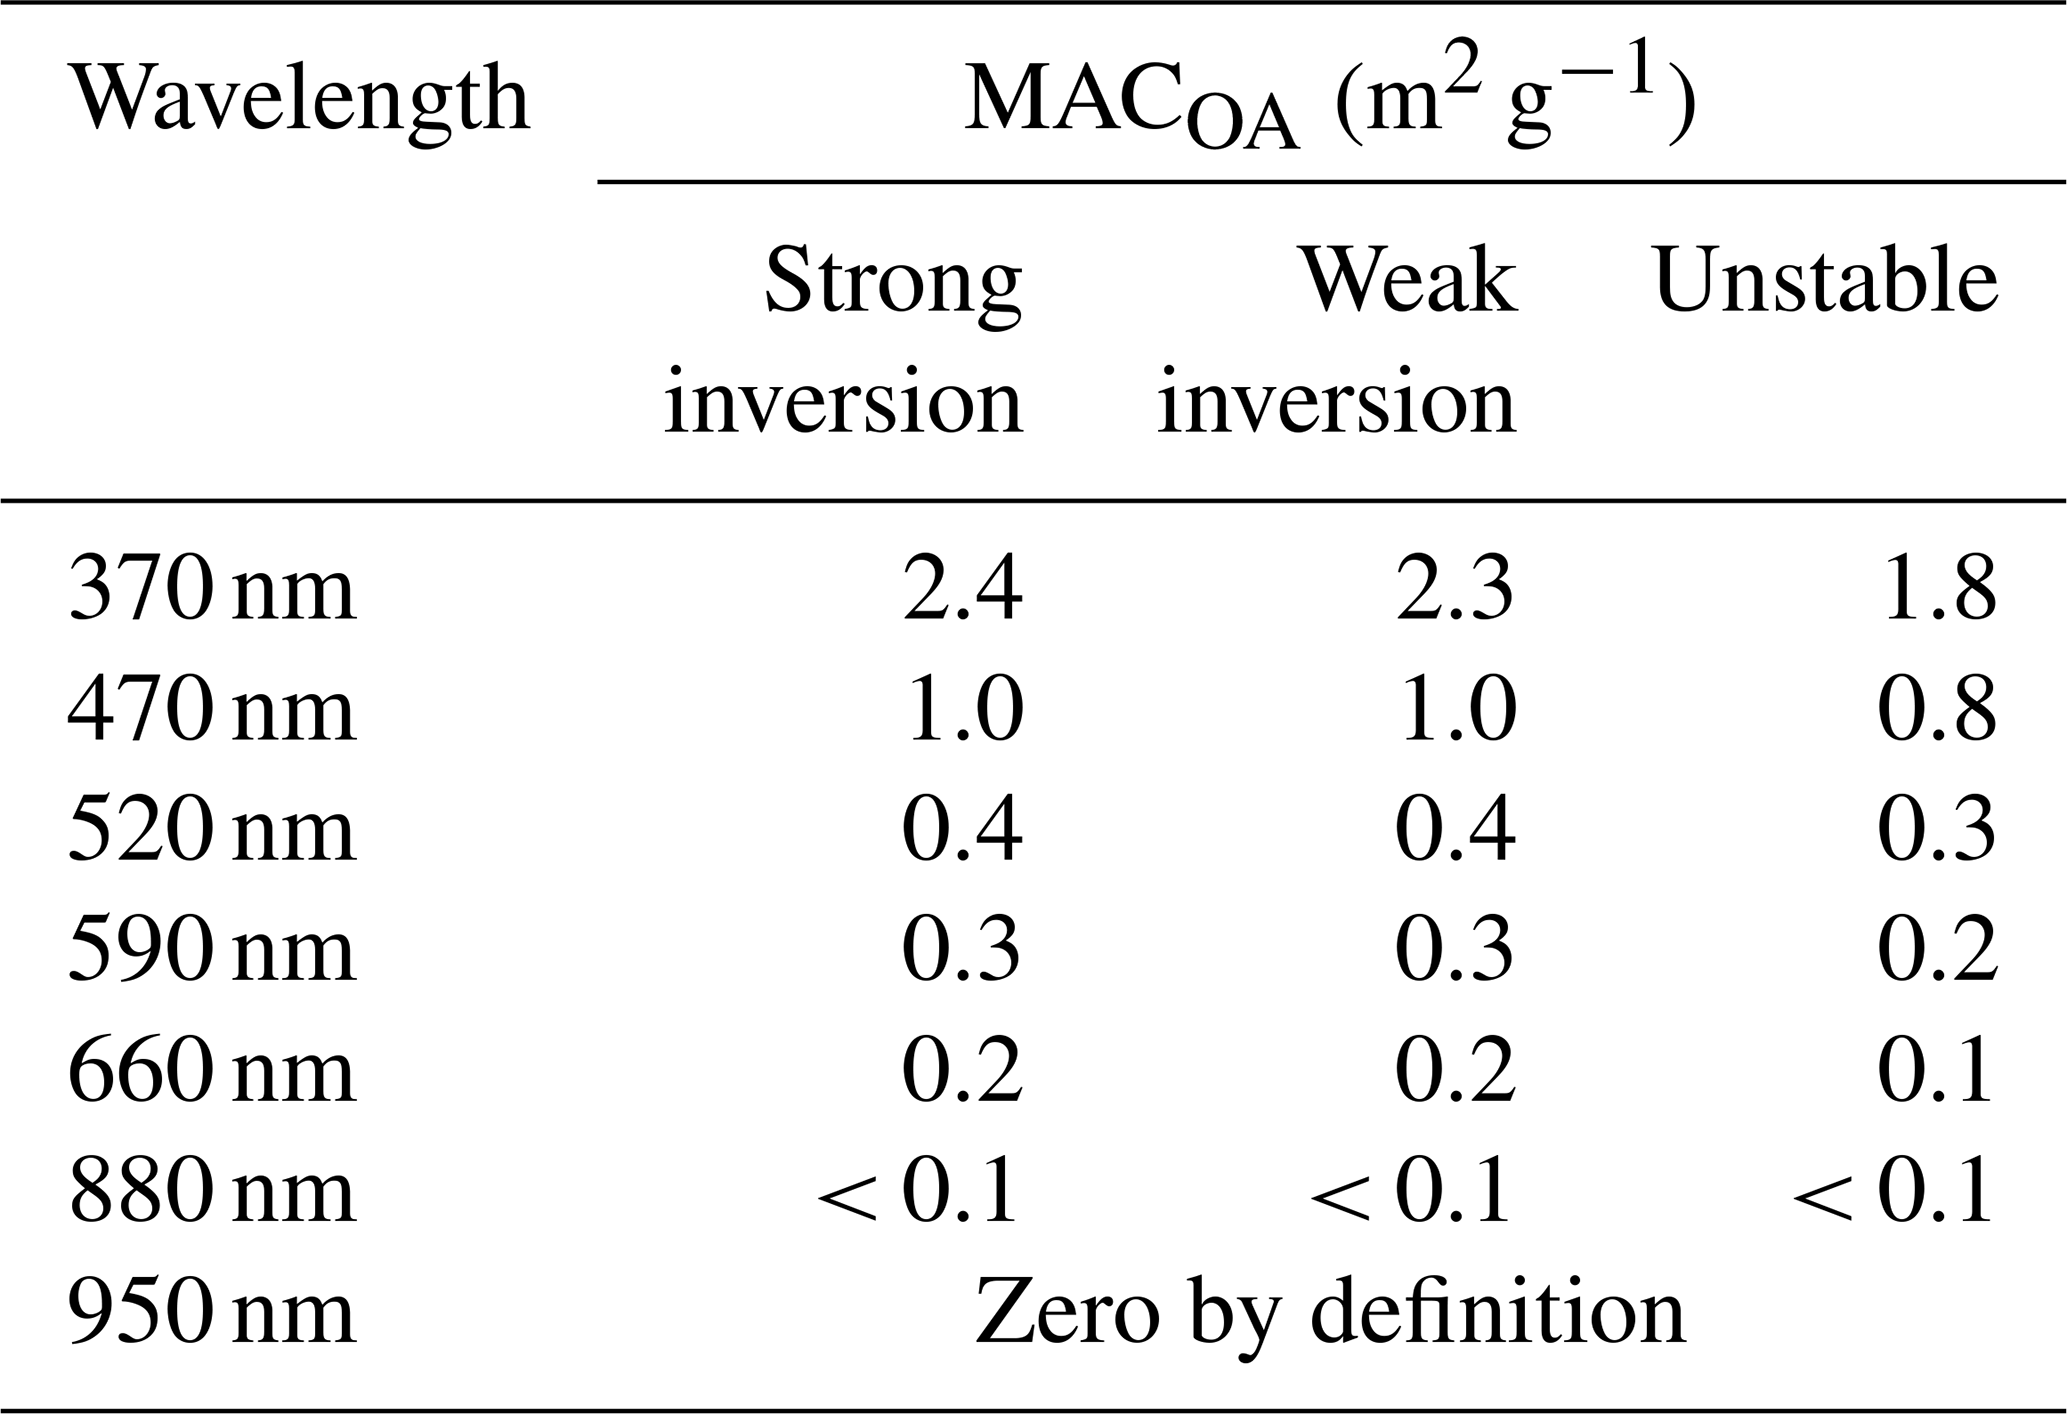
Table 5 shows the spectral variation in MACOA calculated by correlating the OA mass and the BrC-apportioned absorption at multiple wavelengths (370, 470, 520, 590, and 660 nm). The major MACOA value was calculated for 370 nm. We observed reduced MACOA by increasing wavelength due to decreased OA light absorption when moving toward the infrared. It was also observed that for larger wavelengths, the variability in the MACOA within the atmospheric-stability categories was insignificant as babs, BrC approached zero.
Table 5Spectral variation in the organic aerosol MAC by atmospheric stability.
The same approach was used to estimate MACBC by correlating the EC mass from filters and the 12 h averaged absorption at 950 nm. For the study site, MAC m2 g−1 (Fig. 8b). For periods of weak-inversion and unstable conditions, MACBC, 950 nm was 6.5 and 7.2 m2 g−1, respectively. Although the calculated MACBC, 950 nm for unstable conditions seems to be slightly higher, we found that the differences among the slopes are not statistically significant; i.e., there is no interaction effect from the atmospheric stability (strong inversion and unstable atmosphere: hypothesis test, p value = 0.114, α=0.05; weak inversion and unstable atmosphere: hypothesis test, p value = 0.088, α=0.05).
We compared our specific RWB MACOA to values reported in the literature for wood- and biomass-burning emissions. In the near-UV region, the values of MACOA are spread and range between 0.2 and 5.8 m2 g−1 (Table 6). Comparable results to those from Loški Potok were observed in the studies of Chen and Bond (2010) for laboratory analyses of methanol-soluble organic carbon (MSOC) from wood combustion (MAC m2 g−1) and Cheng et al. (2011) for water-soluble organic carbon extracts (WSOC) from an urban environment in Beijing impacted by biomass-burning and fossil fuel emissions during winter (MAC m2 g−1). The spreading of the reported MACOA values originates in the OA nature; these are heterogeneous and non-separable mixtures of absorbing and non-absorbing materials, whose composition and physicochemical properties change depending on (i) how the OAs are constrained and measured, (ii) the burning source, (iii) the combusting conditions, (iv) the geographical location and time of measurements, and (v) the meteorological conditions. Points (iv) and (v) influence the OAs' aging driven by photochemical reactions in the atmosphere and the presence of aerosols from distinct combustion sources. An example to illustrate (i) refers to the unequal light-absorbing properties of the WSOC and the MSOC extracted from particulate matter filters (Chen and Bond, 2010; Kim et al., 2016; Zhu et al., 2018). In addition, whether the OAs should be analyzed as a fraction or as bulk has been addressed previously and remains an open discussion (Zhang et al., 2016). These facts reinforce the necessity of performing specific and source-oriented OAs' characterization.
Table 6Comparison of light absorption properties for OA (also referred to as BrC and OC) reported in the literature. The values in bold highlight the results of this study.
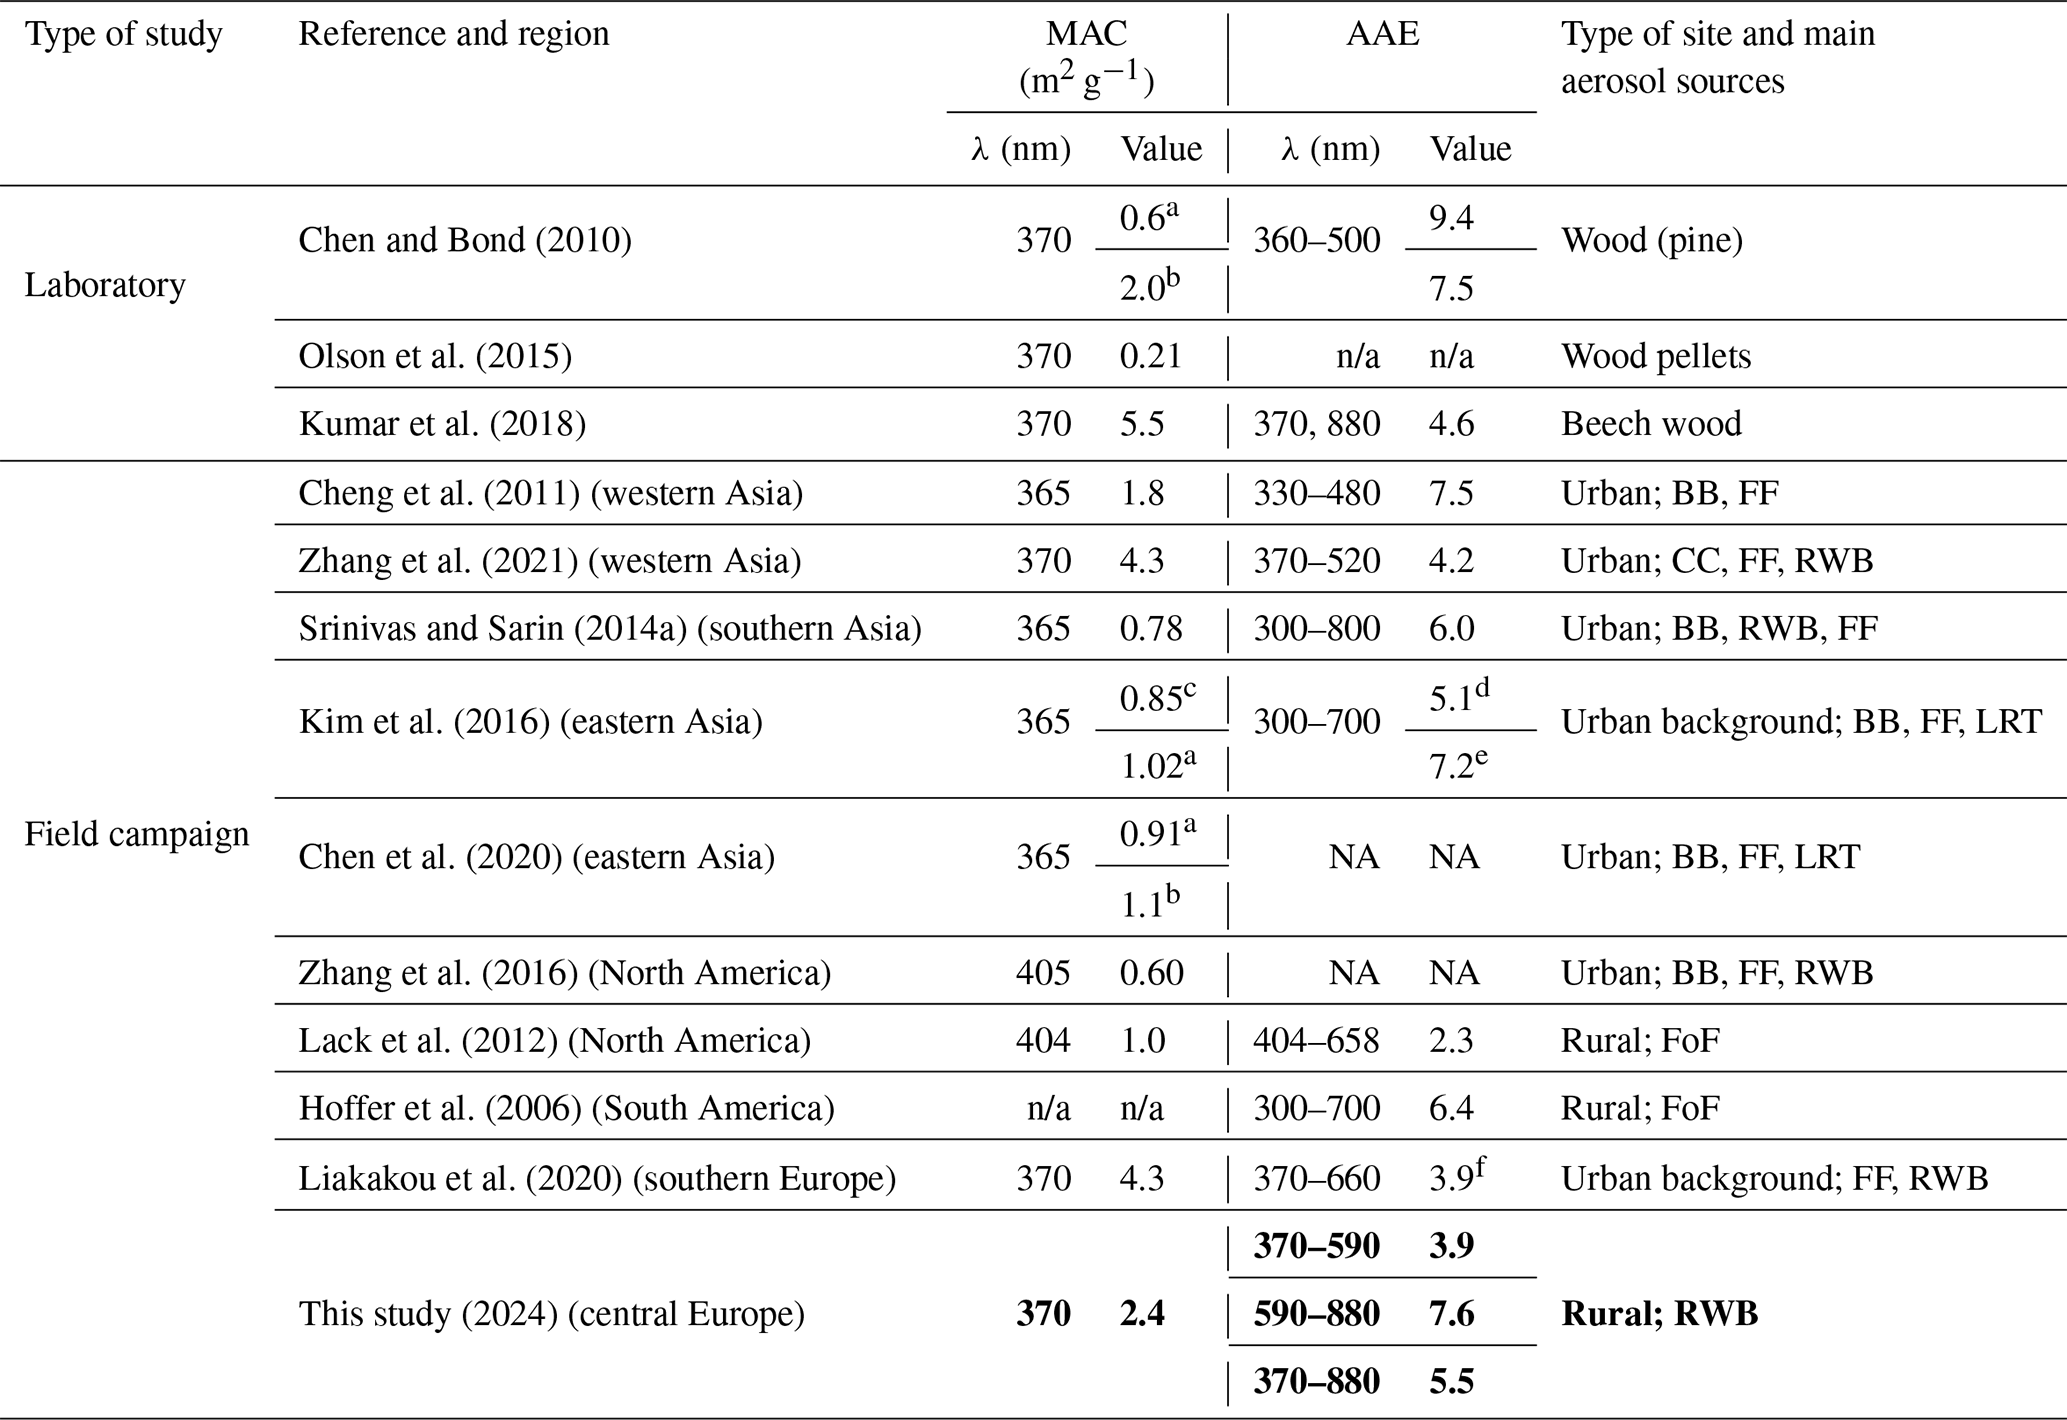
a WSOC. b MSOC. c OC. d Wavelength dependence of the absorption measured on MSOC. e Wavelength dependence of the absorption measured on WSOC. f Wintertime.
BB: biomass burning other than wood burning; CC: coal combustion; FF: fossil fuel; FoF: forest fires; LRT: long-range transport; RWB: residential wood burning; n/a: not applicable; NA: not available.
3.3 Analysis of uncertainty
Error propagation was used to estimate the uncertainty in the RWB MACOA, considering the contribution of the OA mass concentrations and the BrC light absorption coefficients. The mathematical expression representing the fit between both variables has the form , where y is babs, BrC(λ), x is OA, and m is MACOA. Rearranging the equation, MAC. For uncorrelated variables, the propagated error of the function (σf) can be calculated using the following quadratic sum:
where σx and σy are the absolute errors of x and y.
To estimate the MACOA uncertainty, the propagated errors of babs, BrC(λ) and OA were first calculated individually. Based on the OA mass balance (Eq. 2), the uncertainty in the OA mass concentration includes the contribution of the following individual components: (i) PM1 mass concentrations estimated from the MPSS, (ii) the eBC mass concentrations derived from the AE33, and (iii) the mass concentration of inorganic species in the PM10 filters. The PM1 uncertainty was assumed to be 17 % based on the calculations of Buonanno et al. (2009) and the MPSS intercomparison in the laboratory. This estimation accounts for contributions from the sampling flow rate, the volumetric diameter, the diffusion efficiency corrections, and the particle density. The uncertainty in the eBC mass concentration is assumed to be 5 %, corresponding to the EC uncertainty, as eBC was normalized to EC using the local MACBC. The uncertainty in EC corresponds to the reproducibility of the thermo-optical analysis following the EUSAAR protocol. The uncertainty contribution of the insoluble inorganics was 20 %, considering the deviation resulting from assuming the InA fraction in PM10 to be the same as that in PM1. Additionally, we considered a reproducibility error based on Leiva et al. (2012).
In the uncertainty calculation for babs, BrC(λ), the following contributions were considered: (i) the AE33 light absorption coefficients, (ii) the harmonization factor H, and (iii) the BC absorption Ångström exponent. The uncertainty in the AE33 total light absorption coefficients is assumed to be 25 % and mainly proceeds from the variabilities in the unit-to-unit intercomparison and the multiple-light-scattering correction factor C (Cuesta-Mosquera et al., 2021; Müller et al., 2011; WMO, 2016). Given the presence of correlated variables in the mathematical definition of babs, BrC(λ), the uncertainty calculation included the covariance when dealing with total light absorption coefficients at different wavelengths measured by the AE33. The propagated uncertainty in H was calculated based on the simultaneous AE33–MAAP field measurements in Melpitz, Germany, during wintertime (2018/19). For this, the uncertainty in the MAAP light absorption coefficients of 12 % was included (Petzold and Schönlinner, 2004). The calculated uncertainty in winter H for Melpitz (median = 1.9) is 23 % and is assumed constant for the study in Loški Potok. The uncertainty in the BC absorption Ångström exponent was assumed to be 10 %, coming from the deviation of the AAEBC values ranging between 0.8 and 1.2 (Lack and Langridge, 2013). Although the assumption of AAEBC = 1 might add significant error to the apportionment of the light absorption coefficients (BC BrC) and aerosol optical properties, the value was used as a fair estimate based on the community standards. The values of uncertainty estimated for babs, BrC(λ) were 48 % (370 nm), 26 % (470 nm), 19 % (520 nm), 14 % (590 nm), 11 % (660 nm), and 6 % (880 nm).
The final propagated uncertainty for the MACOA, 370 nm was 46 %, with a major dependency on the apportioned OA light absorption coefficient. The uncertainty in MACOA increased with the wavelength due to lower MACOA values and light absorption coefficients attributed to BrC; for instance, the uncertainty in MACOA, 470 nm was 60 % and > 70 % for MACOA, 520 nm. Similarly, the uncertainty in the PM PM10 ratio (slope in Fig. 2) was calculated through error propagation. Besides the contribution of PM1, the error for PM10 was considered and assumed to be 10 %, accounting for sampling errors (air volume) and reproducibility (Hafkenscheid, 2013; Leiva et al., 2012). The final determined uncertainty for the slope PM PM10 was 15 %.
3.4 Climate impact: sensitivity analysis through simple-forcing-efficiency calculations
The model described in Sect. 2.4 was used as a sensitivity analysis tool to assess the climate impact of the light-absorbing properties of the RWB aerosol particles at Loški Potok. Figure 9 shows the spectral variation in the SFE for two different types of surfaces: fresh snow (as=0.80) and Earth average (as=0.19). In each case, the forcing efficiency was calculated for two scenarios: (i) assuming OA to be light-absorbing species (imaginary refractive index kBrC from the literature) and (ii) assuming OA to be non-absorbing (imaginary refractive index kBrC=0). The SFE was calculated for six of the seven wavelengths covered by the AE33. The total radiative forcing (RF) was calculated by integrating the area under the curves using the trapezoidal rule (blue and yellow lines in Fig. 9).
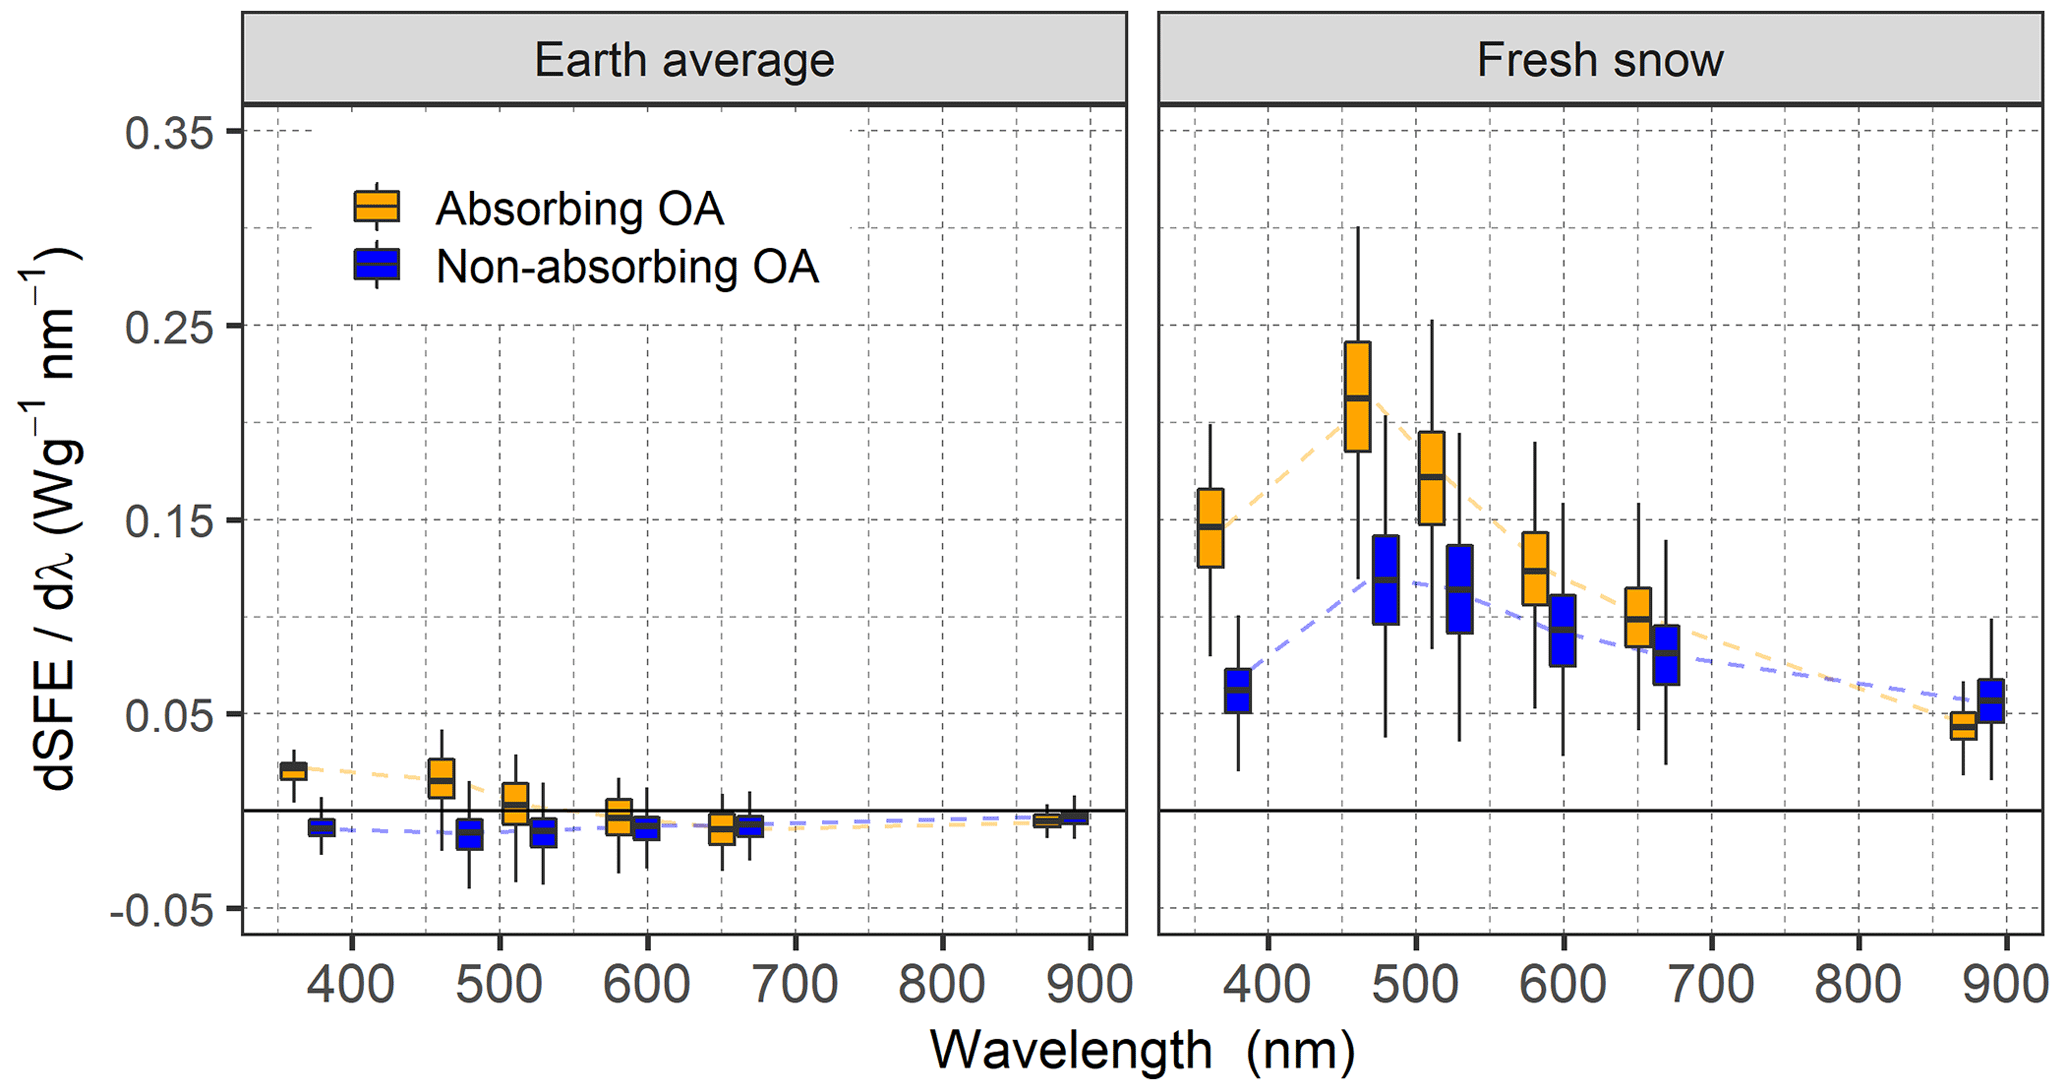
Figure 9Spectral variation in the simple forcing efficiency of the RWB aerosols characterized at Loški Potok and comparison of results obtained from considering absorbing OA and non-absorbing OA for two types of surfaces: fresh snow and Earth average. The dashed yellow and blue lines connect the median values of .
The resulting SFE was larger and positive for bright snow and relatively small for the Earth-average surface. For non-absorbing OA, the SFE was lower than for absorbing OA with slightly negative values for the Earth-average surface. The comparison among surfaces indicates that RWB aerosols have a more significant impact over bright surfaces, for instance, the Arctic or areas covered by snow, typical during the coldest season when the most significant emissions of OA are expected due to more intense RWB. We also observed that SFE is larger at 470 nm despite the significantly higher mass absorption cross-section calculated at 370 nm. This observation is attributed to the larger solar irradiance reported in the blue region (1.1 to 1.4 W m−2 nm−1) compared to the values from the near UV (0.0 to 0.8 W m−2 nm−1).
For fresh snow, the corresponding RF of the RWB aerosols was 61 and 44 W g−1 for absorbing OA and non-absorbing OA, respectively. For an Earth-average surface, the RF was 0.2 and −3.9 W g−1 for absorbing and non-absorbing OA. The RF was 2 times higher for a snow-like area and passed from cooling to warming for an Earth-average surface by taking OA as light-absorbing species. Our calculations show the crucial influence of the OA in atmospheric warming via the lensing effect of coated BC and BrC absorption in shorter wavelengths; nevertheless, robust climate models are essential to reporting definite radiative forcing figures, since these consider further atmospheric processes and aerosol properties such as aerosol–cloud interactions, aerosol hygroscopicity, and the total vertical column of aerosols.
Residential wood burning (RWB) is currently a significant source of OA and BC emissions; however, the net global cooling and warming effects of aerosols produced by residential biofuel burning are still not well constrained. To undertake this challenge, further research is needed. In this context, the main focus of this study was the characterization of the aerosol particles produced by intensive RWB in a rural location in central Europe occupied by 243 households. We evaluated the influence of atmospheric stability on aerosol accumulation, measured and calculated their optical properties using filter-based absorption photometers (AE33 Aethalometer), and connected these to climate impact via simple-radiative-forcing estimates. Intense burning in Loški Potok, Slovenia, and near-ground temperature inversion led to a significant accumulation of aerosols produced by RWB during the coldest season at this rural site. During strong inversion, the mean OA and BC mass concentrations were 71 ± 56 and 6.1 ± 5.0 µg m−3, respectively, with maximum values of 270 and 24 µg m−3. The mean and maximum particle number concentrations were and 54×103 particles cm−3, respectively. Deplorable air quality conditions at the bottom of the valley, driven by a stable atmosphere, occurred 60 % of the time in winter. The transition from a stable to an unstable atmosphere reduced OA, BC, and particle number concentrations: from strong inversion to weak inversion and unstable atmosphere, the OA mass concentration decreased by 25 % and 80 %, respectively; the BC mass decreased by 62 % and 74 %; and the particle number concentration decreased by 50 % and 65 %. Significant aerosol accumulation under near-ground temperature inversion and presumed low mixing were used conveniently to estimate optical properties of RWB under real conditions with low influence from distinct aerosol sources. During strong inversion, the mean babs, BrC and babs, BC at 370 nm were 160 ± 140 and 99 ± 85 Mm−1, respectively. Under weak inversion, babs, BrC and babs, BC were 69 % and 62 % lower, and during unstable atmosphere, they were 83 % and 73 % lower, respectively. The average contribution of BrC to the total light absorption was 60 % at 370 nm during strong temperature inversion and decreased toward the infrared (470 nm = 46 %, 880 nm = 3 %).
The estimated MACOA for residential wood burning was 2.4 m2 g−1 at 370 nm and decreased toward the infrared with values of 1.0, 0.4, 0.3, and 0.2 m2 g−1 for 470, 520, 590, and 660 nm, respectively. The calculated MACOA at 880 nm was below 0.1 m2 g−1. The values of MACOA for Loški Potok are higher than multiple MACOA values reported from urban and rural locations impacted by wood burning. Nevertheless, differences in MAC between locations are expected due to the influence of diverse aerosol sources and aerosol aging. The higher MACOA in the study site is attributed to the significant load of organic aerosols and elevated absorption coefficients measured during the campaign period. Nevertheless, the calculations of the light absorption coefficients have a significant uncertainty; additionally, the assumptions involved in calculating the hourly OA mass concentrations are identified as the main limitation in the calculation of MACOA. Despite the good agreement found between OA (OAMPSS) and OATCA, we recognize that calculating OA from the PM1 mass estimated from the MPSS might lead to an omission of the OA fraction in the PM1–PM2.5 size range. The RWB AAEBrC was 3.9 in the wavelength range of 370–590 nm. The estimated values of MACOA and AAEBrC fall within the range of previously reported optical BrC optical properties (Chen and Bond, 2010; Cheng et al., 2011; Liakakou et al., 2020).
The optical properties from the study site were used to estimate SFE and RF from RWB aerosols. The large contribution of BrC to the total aerosol light absorption resulted in a substantial impact. Results showed a turn from cooling to warming for an Earth-average surface when the OA light absorption properties were considered in the SFE modeling (i.e., the OA were not assumed to be purely scattering compounds). For a snow-covered surface, the warming RF passed from 44 to 61 W g−1 for absorbing and non-absorbing OA, respectively. This last observation is important since snowy surfaces are common during the coldest seasons and will probably occur in parallel with intense RWB and OA emissions. The estimated SFE and RF were significantly higher than those reported in previous studies such as Chen and Bond (2010; 23 W g−1 over snow and −12 W g−1 for an Earth-average albedo). The much larger SFE and RF calculated for Loški Potok are directly related to the substantial babs measured at the site and the relatively large MAC, which exceeds typical values reported for other locations impacted by RWB. The SFE and RF calculations were calculated as sensitivity analyses of the aerosol light absorption effect on climate and should be taken as indicative only due to the limitations of this approach, which include the omission of aerosol hygroscopicity and further atmospheric processes that could take place. Further studies should include more complex atmospheric processes and aerosol properties to report the absolute values for a complete understanding of the climate implications.
As a household-based pollution source, implementing specific technical recommendations may help to prevent and mitigate air pollution produced by residential wood burning. These recommendations include the following: (i) using updated and certified wood stoves; (ii) managing fuel appropriately by storing the firewood in dry and well-ventilated areas and burning only dry and clean wood, as well as refraining from burning green or treated wood, plastic, trash, clothes or petroleum-derived products; (iii) optimizing burning conditions by ensuring that enough air is available for the combustion, avoiding overfilling the wood stoves with large logs, avoiding leaving the stoves smoldering during the nighttime, scheduling regular chimney cleaning and professional inspection of the whole system; (iv) considering meteorological conditions and reducing burning during calm nights with low ventilation or when haze warnings are issued by weather forecasting or local authorities; and (v) exploring emission control systems such as mechanical separation (altering the velocity or direction of the flue gas through mechanical forces) and electrostatic precipitators (charging the suspended particles in an electric field to facilitate their removal from the gas flow using electrical forces).
To our knowledge, the results presented in this study, a complement to the findings of Glojek et al. (2022), are the first to show such significant pollution levels and light absorption coefficients from residential-wood-burning emissions in rural central Europe. Our findings suggest that the severity and impacts of rural RWB emissions on air quality and climate in the region might be underestimated and overlooked. Additional monitoring and modeling should be considered, since the use of RWB is rising worldwide.
The R codes used to curate and analyze the datasets and produce the figures and results of the study are available from the corresponding author upon request. The study data are available at https://doi.org/10.5281/zenodo.10460257 (Cuesta-Mosquera et al., 2024).
The supplement related to this article is available online at: https://doi.org/10.5194/acp-24-2583-2024-supplement.
AW, GM, LD, MO, and KG conceptualized and designed the study. KG, KW, GM, LD, MO, MM, DvP, and MR set up, operated, calibrated, and maintained the instruments during the field study. KG and AG performed the field measurements with support from KW. DvP and HH provided data from the characterization of the PM10 filter-based measurements. BR performed the Mie modeling. ACM curated, processed, and completed the formal data analysis with inputs from KG, TM, GM, AG, and MR. ACM wrote and prepared the original manuscript draft with inputs from KG, TM, GM, and MP. All the authors reviewed, edited, and contributed to the scientific discussion in the manuscript.
The contact author has declared that none of the authors has any competing interests.
Publisher's note: Copernicus Publications remains neutral with regard to jurisdictional claims made in the text, published maps, institutional affiliations, or any other geographical representation in this paper. While Copernicus Publications makes every effort to include appropriate place names, the final responsibility lies with the authors.
The authors acknowledge the support from the Municipality of Loški Potok and the COST Action CA16109 COLOSSAL. We want to thank all the people and institutes involved in the campaign. We are genuinely grateful to the local community for their friendly welcome, help, and support.
This research has been supported by the Slovenian Research Agency (program MR-2016, 680 program P1-0385 “Remote sensing of atmospheric properties”).
This paper was edited by Andreas Petzold and reviewed by three anonymous referees.
Aerosol Magee Scientific: Aethalometer® Model AE33 User Manual, Version 1.57, 149 pp., https://www.aerosolmageesci.com/ (last access: 15 June 2022), 2018.
Aerosol Magee Scientific: Total Carbon Analyzer Model TCA08, User Manual, Version 1.1.1.0, 92 pp., https://mageesci.com/mproducts/total-carbon-analyzer-model-tca08/ (last access: 15 June 2022), 2022.
Ajtai, T., Kiss-Albert, G., Utry, N., Tóth, Á., Hoffer, A., Szabó, G., and Bozóki, Z.: Diurnal variation of aethalometer correction factors and optical absorption assessment of nucleation events using multi-wavelength photoacoustic spectroscopy, J. Environ. Sci.-China, 83, 96–109, https://doi.org/10.1016/j.jes.2019.01.022, 2019.
Bernardoni, V., Ferrero, L., Bolzacchini, E., Forello, A. C., Gregorič, A., Massabò, D., Močnik, G., Prati, P., Rigler, M., Santagostini, L., Soldan, F., Valentini, S., Valli, G., and Vecchi, R.: Determination of Aethalometer multiple-scattering enhancement parameters and impact on source apportionment during the winter 2017/18 EMEP/ACTRIS/COLOSSAL campaign in Milan, Atmos. Meas. Tech., 14, 2919–2940, https://doi.org/10.5194/amt-14-2919-2021, 2021.
Bohren, C. F. and Huffman, D. R.: Absorption and Scattering of Light by Small Particles, John Wiley & Sons, New York, ISBN: 9780471293408, 1998.
Bond, T. C. and Bergstrom, R. W.: Light absorption by carbonaceous particles: An investigative review, Aerosol Sci. Tech., 40, 27–67, https://doi.org/10.1080/02786820500421521, 2006.
Bond, T. C., Doherty, S. J., Fahey, D. W., Forster, P. M., Berntsen, T., Deangelo, B. J., Flanner, M. G., Ghan, S., Kärcher, B., Koch, D., Kinne, S., Kondo, Y., Quinn, P. K., Sarofim, M. C., Schultz, M. G., Schulz, M., Venkataraman, C., Zhang, H., Zhang, S., Bellouin, N., Guttikunda, S. K., Hopke, P. K., Jacobson, M. Z., Kaiser, J. W., Klimont, Z., Lohmann, U., Schwarz, J. P., Shindell, D., Storelvmo, T., Warren, S. G., and Zender, C. S.: Bounding the role of black carbon in the climate system: A scientific assessment, J. Geophys. Res.-Atmos., 118, 5380–5552, https://doi.org/10.1002/jgrd.50171, 2013.
Brown, S. G., Lee, T., Roberts, P. T., and Collett, J. L.: Variations in the ratio of urban organic aerosol next to a major roadway, J. Air Waste Manage., 63, 1422–1433, https://doi.org/10.1080/10962247.2013.826602, 2013.
Buonanno, G., Dell'Isola, M., Stabile, L., and Viola, A.: Uncertainty budget of the SMPS–APS system in the measurement of PM1, PM2.5, and PM10, Aerosol Sci. Tech., 43, 1130–1141, https://doi.org/10.1080/02786820903204078, 2009.
Camia, A., Giuntoli, J., Jonsson, K., Robert, N., Cazzaniga, N., Jasinevičius, G., Avitabile, V., Grassi, G., Barredo Cano, J. I., and Mubareka, S.: The use of woody biomass for energy purposes in the EU, Publications Office of the European Union, Luxembourg, https://doi.org/10.2760/831621, 2021.
Cappa, C. D., Lack, D. A., Burkholder, J. B., and Ravishankara, A. R.: Bias in filter-based aerosol light absorption measurements due to organic aerosol loading: Evidence from laboratory measurements, Aerosol Sci. Technol., 42, 1022–1032, https://doi.org/10.1080/02786820802389285, 2008.
Casquero-Vera, J. A., Lyamani, H., Titos, G., Minguillón, M. C., Dada, L., Alastuey, A., Querol, X., Petäjä, T., Olmo, F. J., and Alados-Arboledas, L.: Quantifying traffic, biomass burning and secondary source contributions to atmospheric particle number concentrations at urban and suburban sites, Sci. Total Environ., 768, 145282, https://doi.org/10.1016/j.scitotenv.2021.145282, 2021.
Cavalli, F., Viana, M., Yttri, K. E., Genberg, J., and Putaud, J.-P.: Toward a standardised thermal-optical protocol for measuring atmospheric organic and elemental carbon: the EUSAAR protocol, Atmos. Meas. Tech., 3, 79–89, https://doi.org/10.5194/amt-3-79-2010, 2010.
Chen, J., Wu, Z., Augustin-Bauditz, S., Grawe, S., Hartmann, M., Pei, X., Liu, Z., Ji, D., and Wex, H.: Ice-nucleating particle concentrations unaffected by urban air pollution in Beijing, China, Atmos. Chem. Phys., 18, 3523–3539, https://doi.org/10.5194/acp-18-3523-2018, 2018.
Chen, Y. and Bond, T. C.: Light absorption by organic carbon from wood combustion, Atmos. Chem. Phys., 10, 1773–1787, https://doi.org/10.5194/acp-10-1773-2010, 2010.
Chen, Y., Xie, X., Shi, Z., Li, Y., Gai, X., Wang, J., Li, H., Wu, Y., Zhao, X., Chen, M., and Ge, X.: Brown carbon in atmospheric fine particles in Yangzhou, China: Light absorption properties and source apportionment, Atmos. Res., 244, 105028, https://doi.org/10.1016/j.atmosres.2020.105028, 2020.
Cheng, Y., He, K.-B., Zheng, M., Duan, F.-K., Du, Z.-Y., Ma, Y.-L., Tan, J.-H., Yang, F.-M., Liu, J.-M., Zhang, X.-L., Weber, R. J., Bergin, M. H., and Russell, A. G.: Mass absorption efficiency of elemental carbon and water-soluble organic carbon in Beijing, China, Atmos. Chem. Phys., 11, 11497–11510, https://doi.org/10.5194/acp-11-11497-2011, 2011.
Choudhary, V., Rajput, P., and Gupta, T.: Absorption properties and forcing efficiency of light-absorbing water-soluble organic aerosols: Seasonal and spatial variability, Environ. Pollut., 272, 115932, https://doi.org/10.1016/j.envpol.2020.115932, 2021.
Chowdhury, S., Pozzer, A., Haines, A., Klingmüller, K., Münzel, T., Paasonen, P., Sharma, A., Venkataraman, C., and Lelieveld, J.: Global health burden of ambient PM2.5 and the contribution of anthropogenic black carbon and organic aerosols, Environ. Int., 159, 107020, https://doi.org/10.1016/j.envint.2021.107020, 2022.
Collaud Coen, M., Weingartner, E., Apituley, A., Ceburnis, D., Fierz-Schmidhauser, R., Flentje, H., Henzing, J. S., Jennings, S. G., Moerman, M., Petzold, A., Schmid, O., and Baltensperger, U.: Minimizing light absorption measurement artifacts of the Aethalometer: evaluation of five correction algorithms, Atmos. Meas. Tech., 3, 457–474, https://doi.org/10.5194/amt-3-457-2010, 2010.
Corsini, E., Ozgen, S., Papale, A., Galbiati, V., Lonati, G., Fermo, P., Corbella, L., Valli, G., Bernardoni, V., Dell'Acqua, M., Becagli, S., Caruso, D., Vecchi, R., Galli, C. L., and Marinovich, M.: Insights on wood combustion generated proinflammatory ultrafine particles (UFP), Toxicol. Lett., 266, 74–84, https://doi.org/10.1016/j.toxlet.2016.12.005, 2017.
Cuesta-Mosquera, A., Močnik, G., Drinovec, L., Müller, T., Pfeifer, S., Minguillón, M. C., Briel, B., Buckley, P., Dudoitis, V., Fernández-García, J., Fernández-Amado, M., Ferreira De Brito, J., Riffault, V., Flentje, H., Heffernan, E., Kalivitis, N., Kalogridis, A.-C., Keernik, H., Marmureanu, L., Luoma, K., Marinoni, A., Pikridas, M., Schauer, G., Serfozo, N., Servomaa, H., Titos, G., Yus-Díez, J., Zioła, N., and Wiedensohler, A.: Intercomparison and characterization of 23 Aethalometers under laboratory and ambient air conditions: procedures and unit-to-unit variabilities, Atmos. Meas. Tech., 14, 3195–3216, https://doi.org/10.5194/amt-14-3195-2021, 2021.
Cuesta-Mosquera, A., Glojek, K., Močnik, G., and Müller, T.: Optical properties and simple forcing efficiency of the organic aerosols and black carbon emitted by residential wood burning in rural Central Europe, Version v1, Zenodo [data set], https://doi.org/10.5281/zenodo.10460257, 2024.
Deming, W. E.: Statistical Adjustment of Data, 2nd edn., Dover Publications Inc., New York, United States, ISBN: 0486646858, 1964.
Drinovec, L., Močnik, G., Zotter, P., Prévôt, A. S. H., Ruckstuhl, C., Coz, E., Rupakheti, M., Sciare, J., Müller, T., Wiedensohler, A., and Hansen, A. D. A.: The “dual-spot” Aethalometer: an improved measurement of aerosol black carbon with real-time loading compensation, Atmos. Meas. Tech., 8, 1965–1979, https://doi.org/10.5194/amt-8-1965-2015, 2015.
Drinovec, L., Jagodič, U., Pirker, L., Škarabot, M., Kurtjak, M., Vidović, K., Ferrero, L., Visser, B., Röhrbein, J., Weingartner, E., Kalbermatter, D. M., Vasilatou, K., Bühlmann, T., Pascale, C., Müller, T., Wiedensohler, A., and Močnik, G.: A dual-wavelength photothermal aerosol absorption monitor: design, calibration and performance, Atmos. Meas. Tech., 15, 3805–3825, https://doi.org/10.5194/amt-15-3805-2022, 2022.
European Environmental Agency: Air quality in Europe – 2020 report, EEA Report No 9/2020, https://www.eea.europa.eu//publications/air-quality-in-europe-2020-report (last access: 29 August 2022), 2020.
Feng, Y., Ramanathan, V., and Kotamarthi, V. R.: Brown carbon: a significant atmospheric absorber of solar radiation?, Atmos. Chem. Phys., 13, 8607–8621, https://doi.org/10.5194/acp-13-8607-2013, 2013.
Fine, P. M., Cass, G. R., and Simoneit, B. R. T.: Chemical characterization of fine particle emissions from fireplace combustion of woods grown in the northeastern United States, Environ. Sci. Technol., 35, 2665–2675, https://doi.org/10.1021/es001466k, 2001.
Fomba, K. W., Müller, K., van Pinxteren, D., Poulain, L., van Pinxteren, M., and Herrmann, H.: Long-term chemical characterization of tropical and marine aerosols at the Cape Verde Atmospheric Observatory (CVAO) from 2007 to 2011, Atmos. Chem. Phys., 14, 8883–8904, https://doi.org/10.5194/acp-14-8883-2014, 2014.
Geng, F., Hua, J., Mu, Z., Peng, L., Xu, X., Chen, R., and Kan, H.: Differentiating the associations of black carbon and fine particle with daily mortality in a Chinese city, Environ. Res., 120, 27–32, https://doi.org/10.1016/j.envres.2012.08.007, 2013.
Glojek, K., Gregorič, A., Močnik, G., Cuesta-Mosquera, A., Wiedensohler, A., Drinovec, L., and Ogrin, M.: Hidden black carbon air pollution in hilly rural areas–a case study of Dinaric depression, European Journal of Geography, 11, 105–122, https://doi.org/10.48088/ejg.k.glo.11.2.105.122, 2020.
Glojek, K., Močnik, G., Alas, H. D. C., Cuesta-Mosquera, A., Drinovec, L., Gregorič, A., Ogrin, M., Weinhold, K., Ježek, I., Müller, T., Rigler, M., Remškar, M., van Pinxteren, D., Herrmann, H., Ristorini, M., Merkel, M., Markelj, M., and Wiedensohler, A.: The impact of temperature inversions on black carbon and particle mass concentrations in a mountainous area, Atmos. Chem. Phys., 22, 5577–5601, https://doi.org/10.5194/acp-22-5577-2022, 2022.
Hafkenscheid, T. L.: Inter-laboratory comparison of the determination of PM10 in ambient air using filter sampling and weighing, https://www.rivm.nl/bibliotheek/rapporten/680708017.pdf (last access: 12 December 2023), 2013.
Harrison, R. M., Beddows, D. C. S., Jones, A. M., Calvo, A., Alves, C., and Pio, C.: An evaluation of some issues regarding the use of aethalometers to measure woodsmoke concentrations, Atmos. Environ., 80, 540–548, https://doi.org/10.1016/j.atmosenv.2013.08.026, 2013.
Hartmann, D. L.: Chapter 1 – Introduction to the Climate System, in: Global Physical Climatology, 2nd edn., edited by: Hartmann D. L., Elsevier, Boston, 1–23, https://doi.org/10.1016/B978-0-12-328531-7.00001-3, 2016.
He, Q., Li, C., Siemens, K., Morales, A. C., Hettiyadura, A. P. S., Laskin, A., and Rudich, Y.: Optical Properties of Secondary Organic Aerosol Produced by Photooxidation of Naphthalene under NOx Condition, Environ. Sci. Technol., 56, 4816–4827, https://doi.org/10.1021/acs.est.1c07328, 2022.
Herich, H., Gianini, M. F. D., Piot, C., Močnik, G., Jaffrezo, J. L., Besombes, J. L., PrévÔt, A. S. H., and Hueglin, C.: Overview of the impact of wood burning emissions on carbonaceous aerosols and PM in large parts of the alpine region, Atmos. Environ., 89, 64–75, https://doi.org/10.1016/j.atmosenv.2014.02.008, 2014.
Hoffer, A., Gelencsér, A., Guyon, P., Kiss, G., Schmid, O., Frank, G. P., Artaxo, P., and Andreae, M. O.: Optical properties of humic-like substances (HULIS) in biomass-burning aerosols, Atmos. Chem. Phys., 6, 3563–3570, https://doi.org/10.5194/acp-6-3563-2006, 2006.
Iinuma, Y., Engling, G., Puxbaum, H., and Herrmann, H.: A highly resolved anion-exchange chromatographic method for determination of saccharidic tracers for biomass combustion and primary bio-particles in atmospheric aerosol, Atmos. Environ., 43, 1367–1371, https://doi.org/10.1016/j.atmosenv.2008.11.020, 2009.
Janssen, N. A., Gerlofs-Nijland, M. E., Lanki, T., Salonen, R. O., Cassee, F., Hoek, G., Fischer, P., Brunekreef, B., and Krzyzanowski, M.: Health effects of black carbon, World Health Organization, Regional Office for Europe, ISBN: 9789289002653, 2012.
Janssen, N. A. H., Hoek, G., Simic-Lawson, M., Fischer, P., van Bree, L., ten Brink, H., Keuken, M., Atkinson, R. W., Ross Anderson, H., Brunekreef, B., and Cassee, F. R.: Black carbon as an additional indicator of the adverse health effects of airborne particles compared with PM10 and PM2.5, Environ. Health Persp., 119, 1691–1699, https://doi.org/10.1289/ehp.1003369, 2011.
Kalbermatter, D. M., Močnik, G., Drinovec, L., Visser, B., Röhrbein, J., Oscity, M., Weingartner, E., Hyvärinen, A.-P., and Vasilatou, K.: Comparing black-carbon- and aerosol-absorption-measuring instruments – a new system using lab-generated soot coated with controlled amounts of secondary organic matter, Atmos. Meas. Tech., 15, 561–572, https://doi.org/10.5194/amt-15-561-2022, 2022.
Kaskaoutis, D. G., Grivas, G., Oikonomou, K., Tavernaraki, P., Papoutsidaki, K., Tsagkaraki, M., Stavroulas, I., Zarmpas, P., Paraskevopoulou, D., Bougiatioti, A., Liakakou, E., Gavrouzou, M., Dumka, U. C., Hatzianastassiou, N., Sciare, J., Gerasopoulos, E., and Mihalopoulos, N.: Impacts of severe residential wood burning on atmospheric processing, water-soluble organic aerosol and light absorption, in an inland city of Southeastern Europe, Atmos. Environ., 280, 119139, https://doi.org/10.1016/j.atmosenv.2022.119139, 2022.
Kim, H., Kim, J. Y., Jin, H. C., Lee, J. Y., and Lee, S. P.: Seasonal variations in the light-absorbing properties of water-soluble and insoluble organic aerosols in Seoul, Korea, Atmos. Environ., 129, 234–242, https://doi.org/10.1016/j.atmosenv.2016.01.042, 2016.
Kim, J., Bauer, H., Dobovičnik, T., Hitzenberger, R., Lottin, D., Ferry, D., and Petzold, A.: Assessing optical properties and refractive index of combustion aerosol particles through combined experimental and modeling studies, Aerosol Sci. Tech., 49, 340–350, https://doi.org/10.1080/02786826.2015.1020996, 2015.
Koch, D., Bauer, S. E., Del Genio, A., Faluvegi, G., McConnell, J. R., Menon, S., Miller, R. L., Rind, D., Ruedy, R., Schmidt, G. A., and Shindell, D.: Coupled aerosol-chemistry-climate twentieth-century transient model investigation: Trends in short-lived species and climate responses, J. Climate, 24, 2693–2714, https://doi.org/10.1175/2011JCLI3582.1, 2011.
Kodros, J. K., Scott, C. E., Farina, S. C., Lee, Y. H., L'Orange, C., Volckens, J., and Pierce, J. R.: Uncertainties in global aerosols and climate effects due to biofuel emissions, Atmos. Chem. Phys., 15, 8577–8596, https://doi.org/10.5194/acp-15-8577-2015, 2015.
Kumar, N. K., Corbin, J. C., Bruns, E. A., Massabó, D., Slowik, J. G., Drinovec, L., Močnik, G., Prati, P., Vlachou, A., Baltensperger, U., Gysel, M., El-Haddad, I., and Prévôt, A. S. H.: Production of particulate brown carbon during atmospheric aging of residential wood-burning emissions, Atmos. Chem. Phys., 18, 17843–17861, https://doi.org/10.5194/acp-18-17843-2018, 2018.
Lack, D. A. and Langridge, J. M.: On the attribution of black and brown carbon light absorption using the Ångström exponent, Atmos. Chem. Phys., 13, 10535–10543, https://doi.org/10.5194/acp-13-10535-2013, 2013.
Lack, D. A., Langridge, J. M., Bahreini, R., Cappa, C. D., Middlebrook, A. M., and Schwarz, J. P.: Brown carbon and internal mixing in biomass burning particles, P. Natl. Acad. Sci. USA, 109, 14802–14807, https://doi.org/10.1073/pnas.1206575109, 2012.
Laskin, A., Laskin, J., and Nizkorodov, S. A.: Chemistry of Atmospheric Brown Carbon, Chem. Rev., 115, 4335–4382, https://doi.org/10.1021/cr5006167, 2015.
Leiva, G. M. A., Araya, M. C., Alvarado, A. M., and Seguel, R. J.: Uncertainty estimation of anions and cations measured by ion chromatography in fine urban ambient particles (PM2.5), Accredit. Qual. Assur., 17, 53–63, https://doi.org/10.1007/s00769-011-0844-4, 2012.
Leoni, C., Pokorná, P., Hovorka, J., Masiol, M., Topinka, J., Zhao, Y., Křůmal, K., Cliff, S., Mikuška, P., and Hopke, P. K.: Source apportionment of aerosol particles at a European air pollution hot spot using particle number size distributions and chemical composition, Environ. Pollut., 234, 145–154, https://doi.org/10.1016/j.envpol.2017.10.097, 2018.
Li, C., Hu, Y., Chen, J., Ma, Z., Ye, X., Yang, X., Wang, L., Wang, X., and Mellouki, A.: Physiochemical properties of carbonaceous aerosol from agricultural residue burning: Density, volatility, and hygroscopicity, Atmos. Environ., 140, 94–105, https://doi.org/10.1016/j.atmosenv.2016.05.052, 2016.
Liakakou, E., Kaskaoutis, D. G., Grivas, G., Stavroulas, I., Tsagkaraki, M., Paraskevopoulou, D., Bougiatioti, A., Dumka, U. C., Gerasopoulos, E., and Mihalopoulos, N.: Long-term brown carbon spectral characteristics in a Mediterranean city (Athens), Sci. Total Environ., 708, 135019, https://doi.org/10.1016/j.scitotenv.2019.135019, 2020.
Liang, L., Engling, G., Liu, C., Xu, W., Liu, X., Cheng, Y., Du, Z., Zhang, G., Sun, J., and Zhang, X.: Measurement report: Chemical characteristics of PM2.5 during typical biomass burning season at an agricultural site of the North China Plain, Atmos. Chem. Phys., 21, 3181–3192, https://doi.org/10.5194/acp-21-3181-2021, 2021.
Liu, J., Lin, P., Laskin, A., Laskin, J., Kathmann, S. M., Wise, M., Caylor, R., Imholt, F., Selimovic, V., and Shilling, J. E.: Optical properties and aging of light-absorbing secondary organic aerosol, Atmos. Chem. Phys., 16, 12815–12827, https://doi.org/10.5194/acp-16-12815-2016, 2016.
Massabò, D., Caponi, L., Bernardoni, V., Bove, M. C., Brotto, P., Calzolai, G., Cassola, F., Chiari, M., Fedi, M. E., Fermo, P., Giannoni, M., Lucarelli, F., Nava, S., Piazzalunga, A., Valli, G., Vecchi, R., and Prati, P.: Multi-wavelength optical determination of black and brown carbon in atmospheric aerosols, Atmos. Environ., 108, 1–12, https://doi.org/10.1016/j.atmosenv.2015.02.058, 2015.
Mauderly, J. L. and Chow, J. C.: Health Effects of Organic Aerosols, Inhal. Toxicol., 20, 257–288, https://doi.org/10.1080/08958370701866008, 2008.
Mbengue, S., Zikova, N., Schwarz, J., Vodička, P., Šmejkalová, A. H., and Holoubek, I.: Mass absorption cross-section and absorption enhancement from long term black and elemental carbon measurements: A rural background station in Central Europe, Sci. Total Environ., 794, 148365, https://doi.org/10.1016/j.scitotenv.2021.148365, 2021.
Müller, T. and Fiebig, M.: ACTRIS In Situ Aerosol: Guidelines for Manual QC of AE33 absorption photometer data, CAIS-ECAC, https://www.actris-ecac.eu/particle-light-absorption.html (last access: 1 December 2023), 2021.
Müller, T., Henzing, J. S., de Leeuw, G., Wiedensohler, A., Alastuey, A., Angelov, H., Bizjak, M., Collaud Coen, M., Engström, J. E., Gruening, C., Hillamo, R., Hoffer, A., Imre, K., Ivanow, P., Jennings, G., Sun, J. Y., Kalivitis, N., Karlsson, H., Komppula, M., Laj, P., Li, S.-M., Lunder, C., Marinoni, A., Martins dos Santos, S., Moerman, M., Nowak, A., Ogren, J. A., Petzold, A., Pichon, J. M., Rodriquez, S., Sharma, S., Sheridan, P. J., Teinilä, K., Tuch, T., Viana, M., Virkkula, A., Weingartner, E., Wilhelm, R., and Wang, Y. Q.: Characterization and intercomparison of aerosol absorption photometers: result of two intercomparison workshops, Atmos. Meas. Tech., 4, 245–268, https://doi.org/10.5194/amt-4-245-2011, 2011.
Olson, M. R., Garcia, M. V., Robinson, M. A., Van Rooy, P., Dietenberger, M. A., Bergin, M., and Schauer, J. J.: Investigation of black and brown carbon multiple-wavelength-dependent light absorption from biomass and fossil fuel combustion source emissions, J. Geophys. Res.-Atmos., 120, 6682–6697, https://doi.org/10.1002/2014JD022970, 2015.
Ozgen, S., Becagli, S., Bernardoni, V., Caserini, S., Caruso, D., Corbella, L., Dell'Acqua, M., Fermo, P., Gonzalez, R., Lonati, G., Signorini, S., Tardivo, R., Tosi, E., Valli, G., Vecchi, R., and Marinovich, M.: Analysis of the chemical composition of ultrafine particles from two domestic solid biomass fired room heaters under simulated real-world use, Atmos. Environ., 150, 87–97, https://doi.org/10.1016/j.atmosenv.2016.11.048, 2017.
Petzold, A. and Schönlinner, M.: Multi-angle absorption photometry–a new method for the measurement of aerosol light absorption and atmospheric black carbon, J. Aerosol Sci., 35, 421–441, https://doi.org/10.1016/j.jaerosci.2003.09.005, 2004.
Petzold, A., Ogren, J. A., Fiebig, M., Laj, P., Li, S.-M., Baltensperger, U., Holzer-Popp, T., Kinne, S., Pappalardo, G., Sugimoto, N., Wehrli, C., Wiedensohler, A., and Zhang, X.-Y.: Recommendations for reporting “black carbon” measurements, Atmos. Chem. Phys., 13, 8365–8379, https://doi.org/10.5194/acp-13-8365-2013, 2013.
Pfeifer, S., Birmili, W., Schladitz, A., Müller, T., Nowak, A., and Wiedensohler, A.: A fast and easy-to-implement inversion algorithm for mobility particle size spectrometers considering particle number size distribution information outside of the detection range, Atmos. Meas. Tech., 7, 95–105, https://doi.org/10.5194/amt-7-95-2014, 2014.
POCITYF: Ioannina – POCITYF Project, https://pocityf.eu/city/ioannina/ (last access: 23 May 2023), 2023.
Qin, Y. M., Tan, H. B., Li, Y. J., Li, Z. J., Schurman, M. I., Liu, L., Wu, C., and Chan, C. K.: Chemical characteristics of brown carbon in atmospheric particles at a suburban site near Guangzhou, China, Atmos. Chem. Phys., 18, 16409–16418, https://doi.org/10.5194/acp-18-16409-2018, 2018.
R Core Team: R: A language and environment for statistical computing, R Foundation for Statistical Computing, https://www.r-project.org/ (last access: 13 February 2023), 2020.
Rigler, M., Drinovec, L., Lavrič, G., Vlachou, A., Prévôt, A. S. H., Jaffrezo, J. L., Stavroulas, I., Sciare, J., Burger, J., Kranjc, I., Turšič, J., Hansen, A. D. A., and Močnik, G.: The new instrument using a TC–BC (total carbon–black carbon) method for the online measurement of carbonaceous aerosols, Atmos. Meas. Tech., 13, 4333–4351, https://doi.org/10.5194/amt-13-4333-2020, 2020.
Rissler, J., Nordin, E. Z., Eriksson, A. C., Nilsson, P. T., Frosch, M., Sporre, M. K., Wierzbicka, A., Svenningsson, B., Löndahl, J., Messing, M. E., Sjogren, S., Hemmingsen, J. G., Loft, S., Pagels, J. H., and Swietlicki, E.: Effective density and mixing state of aerosol particles in a near-traffic urban environment, Environ. Sci. Technol., 48, 6300–6308, https://doi.org/10.1021/es5000353, 2014.
Sagan, C. and Pollack, J. B.: Anisotropic nonconservative scattering and the clouds of Venus, J. Geophys. Res., 72, 469–477, https://doi.org/10.1029/JZ072i002p00469, 1967.
Saturno, J., Pöhlker, C., Massabò, D., Brito, J., Carbone, S., Cheng, Y., Chi, X., Ditas, F., Hrabě de Angelis, I., Morán-Zuloaga, D., Pöhlker, M. L., Rizzo, L. V., Walter, D., Wang, Q., Artaxo, P., Prati, P., and Andreae, M. O.: Comparison of different Aethalometer correction schemes and a reference multi-wavelength absorption technique for ambient aerosol data, Atmos. Meas. Tech., 10, 2837–2850, https://doi.org/10.5194/amt-10-2837-2017, 2017.
Setyan, A., Zhang, Q., Merkel, M., Knighton, W. B., Sun, Y., Song, C., Shilling, J. E., Onasch, T. B., Herndon, S. C., Worsnop, D. R., Fast, J. D., Zaveri, R. A., Berg, L. K., Wiedensohler, A., Flowers, B. A., Dubey, M. K., and Subramanian, R.: Characterization of submicron particles influenced by mixed biogenic and anthropogenic emissions using high-resolution aerosol mass spectrometry: results from CARES, Atmos. Chem. Phys., 12, 8131–8156, https://doi.org/10.5194/acp-12-8131-2012, 2012.
Shamjad, P. M., Tripathi, S. N., Thamban, N. M., and Vreeland, H.: Refractive index and absorption attribution of highly absorbing brown carbon aerosols from an urban Indian city-Kanpur, Sci. Rep.-UK, 6, 37735, https://doi.org/10.1038/srep37735, 2016.
Srinivas, B. and Sarin, M. M.: Brown carbon in atmospheric outflow from the Indo-Gangetic Plain: Mass absorption efficiency and temporal variability, Atmos. Environ., 89, 835–843, https://doi.org/10.1016/j.atmosenv.2014.03.030, 2014a.
Srinivas, B. and Sarin, M. M.: PM2.5, EC and OC in atmospheric outflow from the Indo-Gangetic Plain: Temporal variability and aerosol organic carbon-to-organic mass conversion factor, Sci. Total Environ., 487, 196–205, https://doi.org/10.1016/j.scitotenv.2014.04.002, 2014b.
Szopa, S., Naik, V., Adhikary, B., Artaxo, P., Berntsen, T., Collins, W. D., Fuzzi, S., Gallardo, L., Kiendler-Scharr, A., Klimont, Z., Liao, H., Unger, N., and Zanis, P.: Short-Lived Climate Forcers, in: Climate Change 2021: The Physical Science Basis. Contribution of Working Group I to the Sixth Assessment Report of the Intergovernmental Panel on Climate Change. Cambridge University Press, Cambridge, United Kingdom and New York, NY, USA, 817–922, https://doi.org/10.1017/9781009157896.008, 2021.
Therneau, T.: deming: Deming, Theil-Sen, Passing-Bablock and Total Least Squares Regression, R package version 1.4, CRAN [code], https://cran.r-project.org/web/packages/deming/index.html (last access: 24 January 2023), 2018.
Turpin, B. J. and Lim, H. J.: Species contributions to PM2.5 mass concentrations: Revisiting common assumptions for estimating organic mass, Aerosol Sci. Technol., 35, 602–610, https://doi.org/10.1080/02786820119445, 2001.
UNECE: Wood energy on the rise in Europe, https://unece.org/climate-change/press/wood-energy-rise-europe#:~:text=Countries (last access: 10 November 2022), 2022.
Utry, N., Ajtai, T., Filep, Á., Pintér, M., Török, Z., Bozóki, Z., and Szabó, G.: Correlations between absorption Angström exponent (AAE) of wintertime ambient urban aerosol and its physical and chemical properties, Atmos. Environ., 91, 52–59, https://doi.org/10.1016/j.atmosenv.2014.03.047, 2014.
van Pinxteren, D., Engelhardt, V., Mothes, F., Poulain, L., Fomba, K. W., Spindler, G., Cuesta-Mosquera, A., Tuch, T., Müller, T., Wiedensohler, A., Löschau, G., Bastian, S., and Herrmann, H.: Residential Wood Combustion in Germany: A Twin-Site Study of Local Village Contributions to Particulate Pollutants and Their Potential Health Effects, ACS Environ. Au, 4, 12–30, https://doi.org/10.1021/acsenvironau.3c00035, 2023.
Vicente, E. D. and Alves, C. A.: An overview of particulate emissions from residential biomass combustion, Atmos. Res., 199, 159–185, https://doi.org/10.1016/j.atmosres.2017.08.027, 2018.
Wallace, J. M. and Hobbs, P. V: 3 – Atmospheric Thermodynamics, in: Atmospheric Science, 2nd edn., Academic Press, San Diego, 63–111, https://doi.org/10.1016/B978-0-12-732951-2.50008-9, 2006.
Wang, J., Nie, W., Cheng, Y., Shen, Y., Chi, X., Wang, J., Huang, X., Xie, Y., Sun, P., Xu, Z., Qi, X., Su, H., and Ding, A.: Light absorption of brown carbon in eastern China based on 3-year multi-wavelength aerosol optical property observations and an improved absorption Ångström exponent segregation method, Atmos. Chem. Phys., 18, 9061–9074, https://doi.org/10.5194/acp-18-9061-2018, 2018.
Weingartner, E., Saathoff, H., Schnaiter, M., Streit, N., Bitnar, B., and Baltensperger, U.: Absorption of light by soot particles: Determination of the absorption coefficient by means of aethalometers, J. Aerosol Sci., 34, 1445–1463, https://doi.org/10.1016/S0021-8502(03)00359-8, 2003.
Wiedensohler, A., Birmili, W., Nowak, A., Sonntag, A., Weinhold, K., Merkel, M., Wehner, B., Tuch, T., Pfeifer, S., Fiebig, M., Fjäraa, A. M., Asmi, E., Sellegri, K., Depuy, R., Venzac, H., Villani, P., Laj, P., Aalto, P., Ogren, J. A., Swietlicki, E., Williams, P., Roldin, P., Quincey, P., Hüglin, C., Fierz-Schmidhauser, R., Gysel, M., Weingartner, E., Riccobono, F., Santos, S., Grüning, C., Faloon, K., Beddows, D., Harrison, R., Monahan, C., Jennings, S. G., O'Dowd, C. D., Marinoni, A., Horn, H.-G., Keck, L., Jiang, J., Scheckman, J., McMurry, P. H., Deng, Z., Zhao, C. S., Moerman, M., Henzing, B., de Leeuw, G., Löschau, G., and Bastian, S.: Mobility particle size spectrometers: harmonization of technical standards and data structure to facilitate high quality long-term observations of atmospheric particle number size distributions, Atmos. Meas. Tech., 5, 657–685, https://doi.org/10.5194/amt-5-657-2012, 2012.
WMO: WMO/GAW Aerosol Measurement Procedures, Guidelines and Recommendations, GAW Report No. 227, WMO-No. 1177, https://library.wmo.int/doc_num.php?explnum_id=3073 (last access: 3 June 2023), 2016.
Xing, L., Fu, T.-M., Cao, J. J., Lee, S. C., Wang, G. H., Ho, K. F., Cheng, M.-C., You, C.-F., and Wang, T. J.: Seasonal and spatial variability of the mass ratios and high regional correlation between oxalic acid and zinc in Chinese urban organic aerosols, Atmos. Chem. Phys., 13, 4307–4318, https://doi.org/10.5194/acp-13-4307-2013, 2013.
Xu, H., Ren, Y., Zhang, W., Meng, W., Yun, X., Yu, X., Li, J., Zhang, Y., Shen, G., Ma, J., Li, B., Cheng, H., Wang, X., Wan, Y., and Tao, S.: Updated global black carbon emissions from 1960 to 2017: Improvements, trends, and drivers, Environ. Sci. Technol., 55, 7869–7879, https://doi.org/10.1021/acs.est.1c03117, 2021.
Yus-Díez, J., Bernardoni, V., Močnik, G., Alastuey, A., Ciniglia, D., Ivančič, M., Querol, X., Perez, N., Reche, C., Rigler, M., Vecchi, R., Valentini, S., and Pandolfi, M.: Determination of the multiple-scattering correction factor and its cross-sensitivity to scattering and wavelength dependence for different AE33 Aethalometer filter tapes: a multi-instrumental approach, Atmos. Meas. Tech., 14, 6335–6355, https://doi.org/10.5194/amt-14-6335-2021, 2021.
Zanatta, M., Gysel, M., Bukowiecki, N., Müller, T., Weingartner, E., Areskoug, H., Fiebig, M., Yttri, K. E., Mihalopoulos, N., Kouvarakis, G., Beddows, D., Harrison, R. M., Cavalli, F., Putaud, J. P., Spindler, G., Wiedensohler, A., Alastuey, A., Pandolfi, M., Sellegri, K., Swietlicki, E., Jaffrezo, J. L., Baltensperger, U., and Laj, P.: A European aerosol phenomenology-5: Climatology of black carbon optical properties at 9 regional background sites across Europe, Atmos. Environ., 145, 346–364, https://doi.org/10.1016/j.atmosenv.2016.09.035, 2016.
Zhang, W., Wang, W., Li, J., Ma, S., Lian, C., Li, K., Shi, B., Liu, M., Li, Y., Wang, Q. Q., Sun, Y., Tong, S., and Ge, M.: Light absorption properties and potential sources of brown carbon in Fenwei Plain during winter 2018–2019, J. Environ. Sci.-China, 102, 53–63, https://doi.org/10.1016/j.jes.2020.09.007, 2021.
Zhang, X., Kim, H., Parworth, C. L., Young, D. E., Zhang, Q., Metcalf, A. R., and Cappa, C. D.: Optical Properties of Wintertime Aerosols from Residential Wood Burning in Fresno, CA: Results from DISCOVER-AQ 2013, Environ. Sci. Technol., 50, 1681–1690, https://doi.org/10.1021/acs.est.5b04134, 2016.
Zhang, Y., Favez, O., Canonaco, F., Liu, D., Močnik, G., Amodeo, T., Sciare, J., Prévôt, A. S. H., Gros, V., and Albinet, A.: Evidence of major secondary organic aerosol contribution to lensing effect black carbon absorption enhancement, npj Climate and Atmospheric Science, 1, 47, https://doi.org/10.1038/s41612-018-0056-2, 2018.
Zhang, Y., Albinet, A., Petit, J. E., Jacob, V., Chevrier, F., Gille, G., Pontet, S., Chrétien, E., Dominik-Sègue, M., Levigoureux, G., Močnik, G., Gros, V., Jaffrezo, J. L., and Favez, O.: Substantial brown carbon emissions from wintertime residential wood burning over France, Sci. Total Environ., 743, 140752, https://doi.org/10.1016/j.scitotenv.2020.140752, 2020.
Zhu, C. S., Cao, J. J., Huang, R. J., Shen, Z. X., Wang, Q. Y., and Zhang, N. N.: Light absorption properties of brown carbon over the southeastern Tibetan Plateau, Sci. Total Environ., 625, 246–251, https://doi.org/10.1016/j.scitotenv.2017.12.183, 2018.