the Creative Commons Attribution 4.0 License.
the Creative Commons Attribution 4.0 License.
 | 10 Jan 2024
Current status of model predictions of volatile organic compounds and impacts on surface ozone predictions during summer in China
Yongliang She
Jingyi Li
Xiaopu Lyu
Momei Qin
Xiaodong Xie
Kangjia Gong
Fei Ye
Jianjiong Mao
Lin Huang
Jianlin Hu
Volatile organic compounds (VOCs) play a crucial role in the formation of tropospheric ozone (O3) and secondary organic aerosols. VOC emissions are generally considered to have larger uncertainties compared to other pollutants, such as sulfur dioxide and fine particulate matter (PM2.5). Although predictions of O3 and PM2.5 have been extensively evaluated in air quality modeling studies, there has been limited reporting on the evaluation of VOCs, mainly due to a lack of routine VOC measurements at multiple sites. In this study, we utilized VOC measurements from the “Towards an Air Toxic Management System in China” (ATMSYC) project at 28 sites across China and assessed the predicted VOC concentrations using the Community Multiscale Air Quality (CMAQ) model with the widely used Multi-resolution Emission Inventory for China (MEIC). The ratio of predicted to observed total VOCs was found to be 0.74 ± 0.40, with underpredictions ranging from 2.05 to 50.61 ppbv (5.77 % to 85.40 %) at 24 sites. A greater bias in VOC predictions was observed in industrial cities in the north and southwest, such as Jinan, Shijiazhuang, Lanzhou, Chengdu, and Guiyang. In terms of different VOC components, alkanes, alkenes, non-naphthalene aromatics (ARO2MN), alkynes, and formaldehyde (HCHO) had prediction-to-observation ratios of 0.53 ± 0.38, 0.51 ± 0.48, 0.31 ± 0.38, 0.41 ± 0.47, and 1.21 ± 1.61, respectively. Sensitivity experiments were conducted to assess the impact of the VOC prediction bias on O3 predictions. While emission adjustments improved the model performance for VOCs, resulting in a change in the ratio of total VOCs to 0.86 ± 0.47, they also exacerbated O3 overprediction relative to the base case by 0.62 % to 6.27 % across the sites. This study demonstrates that current modeling setups and emission inventories are likely to underpredict VOC concentrations, and this underprediction of VOCs contributes to lower O3 predictions in China.
- Article
(3866 KB) - Full-text XML
-
Supplement
(3604 KB) - BibTeX
- EndNote


Volatile organic compounds (VOCs) in the ambient atmosphere consist of thousands of gaseous organic trace substances emitted from various anthropogenic and biogenic sources (Guenther et al., 2012; M. Li et al., 2017; Kelly et al., 2018). These compounds undergo complex chemical reactions that form ozone (O3) and secondary organic aerosols (SOAs) (Sillman, 1999; Kroll and Seinfeld, 2008). While biogenic VOCs (BVOCs) are the primary source of VOCs worldwide (Guenther et al., 2006), urban areas are predominantly influenced by anthropogenic sources (Guan et al., 2020; Guo et al., 2022; C. Li et al., 2022). Anthropogenic VOC (AVOC) emission inventories are typically developed by estimating the total VOC emissions using emission factors (EFs) and activity rates from different sources. The VOC speciation profiles are then utilized to determine the emission rates of various VOC species (M. Li et al., 2017). Due to the complexity of VOC emission processes and presence of numerous small but dispersed nonpoint sources, notable uncertainties exist while determining EFs, activity rates, and speciation profiles. It is estimated that the uncertainties associated with VOC emissions range from approximately 68 % to 76 %, which are higher than those of sulfur dioxide (SO2) (12 % to 40 %), nitrogen dioxide (NOx) (31 % to 35 %), and particulate matter (PM) (30 % to 94 %) (Zhang et al., 2009; Li et al., 2019; Kurokawa and Ohara, 2020; An et al., 2021).
Chemical transport models (CTMs), such as the Community Multiscale Air Quality (CMAQ) model, Weather Research and Forecasting model coupled with Chemistry (WRF-Chem), and Goddard Earth Observing System Chemical transport model (GEOS-Chem), have been developed and widely used to investigate the formation processes, source apportionment, and emission control strategies for various air pollution issues (Zhang et al., 2021; Dang et al., 2021; Wang et al., 2021). The emissions of VOCs, along with other species such as SO2, NOx, ammonia, and PM, serve as essential inputs driving air quality model simulations. Uncertainties in VOC emissions notably impact air quality modeling for O3, SOA, and total fine particulate matter (PM2.5). A study conducted in the United States reported a substantial underprediction of VOC emission inventories in urban regions (Mcdonald et al., 2018), particularly for volatile chemical products (VCPs). A simulation study that developed four cases based on the baseline inventory demonstrated that augmented VOC emission inventories have notable effects on O3 and PM2.5, highlighting the need for more detailed VCP emissions in the inventory to improve model performance (Zhu et al., 2019). In China, notable discrepancies in aromatics have been observed between CMAQ predictions and measurements (Wang et al., 2020). Wu et al. (2022) reconciled the bottom-up methodology and measurement constraints to improve the city-scale non-methane VOC (NMVOC) emission inventory in Nanjing, resulting in improved O3 simulation performance with the CMAQ model.
Model evaluation serves as the initial step in establishing confidence in air quality model predictions for further analysis. Numerous studies have conducted evaluations of the predicted O3 and PM2.5 concentrations in China (Hu et al., 2016; L. Li et al., 2021; Li et al., 2020). Overall, the predictions of O3 and PM2.5 concentrations generally align with the observations (Shi et al., 2017; Wang et al., 2021), although substantial biases have been reported in certain circumstances and for specific species, such as O3 and SOA (Gong et al., 2021; Liu et al., 2020; Hu et al., 2017; Qin et al., 2018). Given that VOCs are key precursors of O3 and SOA, evaluating VOC predictions can help elucidate the causes of these substantial biases in predictions. However, VOC evaluations in regional modeling studies have been infrequent due to limited measurement data. Ambient VOCs have been measured at different locations in China in various studies (Yang et al., 2022; G. Wang et al., 2022). Unlike O3 and PM2.5, which are routinely monitored across major cities and regions in China, VOCs are often measured over short periods at one site only or specific sites. Different studies may employ different instruments, and the study periods may vary, making it challenging to compile VOC measurement data from multiple studies for a comprehensive model evaluation.
In this study, we conducted VOC evaluations in China by utilizing summertime observations from 28 sites located in different regions of the country, as part of the “Towards an Air Toxic Management System in China” (ATMSYC) project (Lyu et al., 2020). This study aimed to assess the disparities between measured VOC concentrations and predictions in various regions of China using the widely used CMAQ model. We quantified the impacts of VOC biases on O3 predictions through emission adjustments based on observation–prediction differences. The results of this study indicated that the model performance of VOCs in China still has much room to improve, likely with a focus on updating emission inventories in fast-growing industrial cities. Most sites underpredicted TVOCs, and the biases of alkenes significantly impacted O3 production. These findings enhanced our understanding of current VOC modeling in air quality models, which could help to improve VOC emission inventories and O3 prediction in the future.
2.1 Observation data
The ATMSYC project involved a collaborative sampling campaign at 28 sites in 18 cities across China, conducted from 6 June to 24 August 2018, with speciated VOC measurements as part of the observation task (Lyu et al., 2020). Detailed site information and sampling times can be found in Table S1 in the Supplement. Measurements were taken at intervals of 2 or 4 h between 08:00 and 16:00 (local time). The offline measurement techniques, and data quality assurance and quality controls (QA/QC), which were consistent across all sites, have been described previously (Lyu et al., 2019, 2020; Liu et al., 2021; Zhou et al., 2023). Briefly, stainless steel canisters and 2,4-dinitrophenylhydrazine (DNPH) cartridges were utilized to collect non-methane hydrocarbons (NMHCs) and oxygenated VOCs (OVOCs), respectively. NMHCs were quantified using a gas chromatograph (GC) coupled with a mass spectrometry detector (MSD), electron capture detector (ECD), and flame ionization detector (FID) (the GC-FID system for C2–C3 species and GC-MSD/ECD for other NMHCs). OVOC samples were analyzed by high-performance liquid chromatography. The accuracies for the NMHC measurements ranged from −22.58 %–8.71 %, with precisions of 0.86 %–25.89 % (Zhou et al., 2023). More details regarding the measurements can be found in Sect. S1. From the ATMSYC dataset, we selected 61 representative VOC species and classified them into 20 categories, according to the SAPRC07 mechanism (Carter, 2010) to facilitate comparison with model predictions. These species can be categorized into five groups: alkanes, alkenes, aromatics, alkynes, and formaldehyde (HCHO). Further details regarding these specific classifications are mentioned in Table S2.
Observations of O3 and nitrogen dioxide (NO2) were collected from 28 ground sites, sourced from the Chinese Ministry of Ecology and Environment (https://www.mee.gov.cn/, last access: 20 April 2022), to assess the simulation performance of the modeled O3 and NO2. To evaluate the impact of meteorological conditions, we also collected observation data of meteorological variables (temperature (T2), relative humidity (RH), wind speed (WS), and wind direction (WD)) from the nearest meteorological stations to the 28 sites from the Chinese Meteorological Agency (http://data.cma.cn/en, last access: 27 April 2022).
2.2 Model configurations
The CMAQ version 5.2 model (Appel et al., 2018), coupled with the SAPRC07TIC mechanism and aerosol module AERO6i, was utilized to simulate air quality across China from June to August 2018 (Mao et al., 2022). Meteorological fields were generated using WRF version 4.2.1, employing a 1.0∘ × 1.0∘ resolution FNL reanalysis dataset from the National Center for Atmospheric Research (NCAR). The specific settings of WRF were consistent with those described by Mao et al. (2022), and the simulation performance of the meteorological fields was verified (Mao et al., 2022). The modeling domain with a horizontal resolution of 36 km is shown in Fig. 1, which divides China into seven regions: the North China Plain (NCP), the Northwest, the Northeast, the Yangtze River Delta (YRD), Central China, the Southwest, and South China (with a higher concentration of sites in the Pearl River Delta (PRD) region).
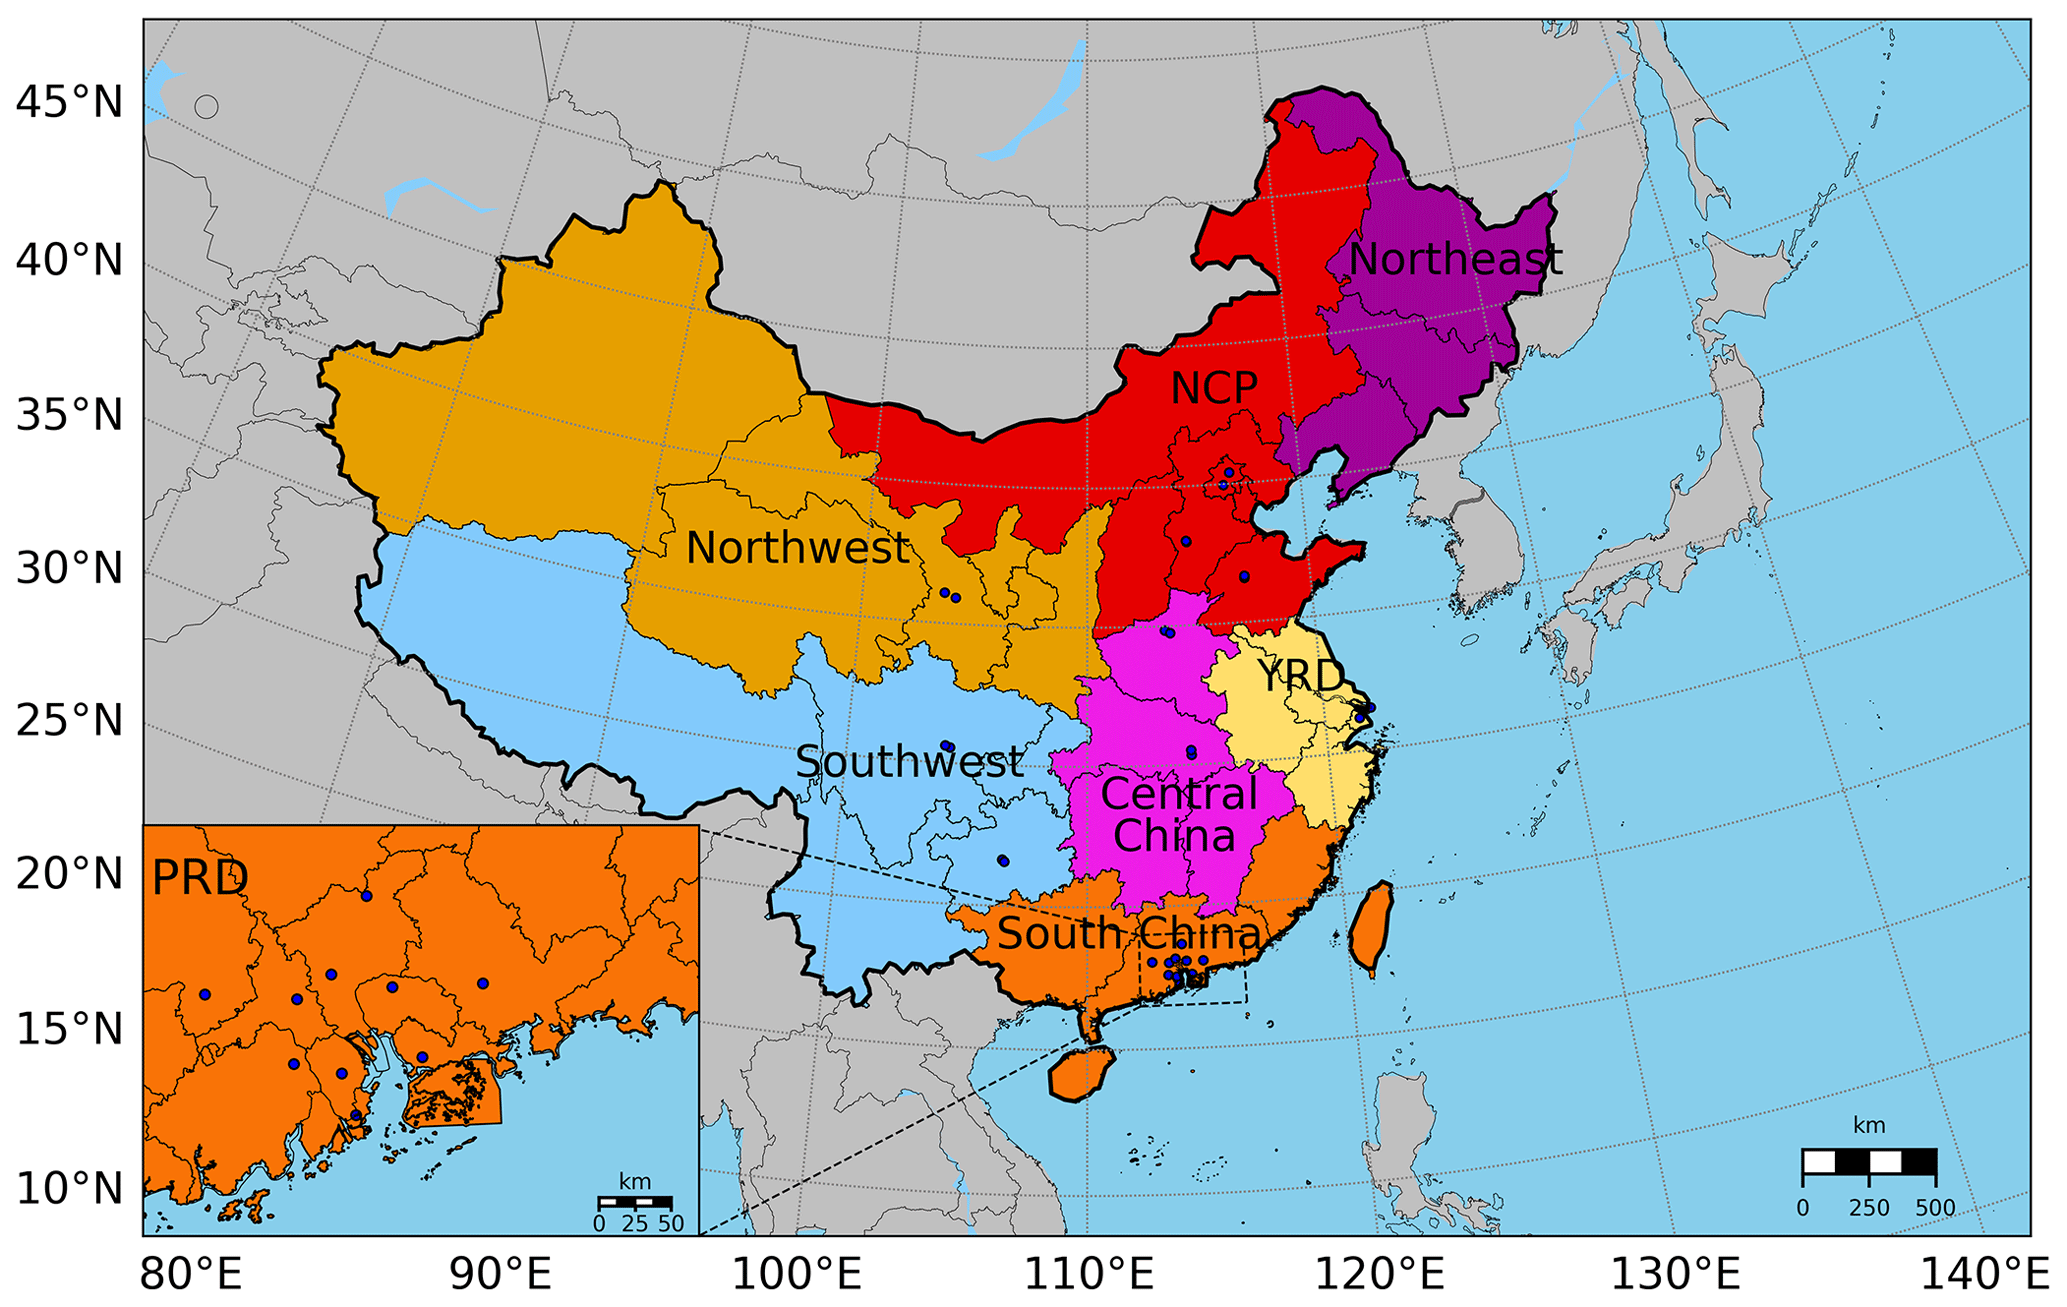
Figure 1The CMAQ modeling domain covering China and the surrounding countries and regions in this study, including 28 blue dots that represent the positions of VOC sampling sites. We divided China into seven regions according to the geographical location of different provinces, which comprise the following sites: the NCP – BJ-B, BJ-U, SJZ-B, SJZ-U, JN-B, JN-U; the Northwest – LZ-B, LZ-U; the Northeast (no observation sites); the YRD – SH-B, SH-U; Central China – ZZ-B, ZZ-U, WH-B, WH-U; the Southwest – CD-B, CD-U, GY-B, GY-U; and South China – most of the sites being concentrated in the PRD region (shown in the enlarged subgraph in the lower left) – GZ-B, GZ-U, SZ, HZ, DG, FS, JM, ZQ, ZS, ZH.
We utilized the Multi-resolution Emission Inventory for China (MEIC) v1.3 with a resolution of 0.25∘ × 0.25∘ in 2017 (http://www.meicmodel.org, last access: 25 January 2022) for anthropogenic emissions within China. For anthropogenic emissions outside of China, we employed the Regional Emission Inventory in Asia (REAS) v3.2 in 2015 (https://www.nies.go.jp/REAS/, last access: 25 January 2022). Biogenic emissions were generated using the Model for Emissions of Gases and Aerosols from Nature (MEGAN) v2.1 (Guenther et al., 2012), which were then mapped to 27 SAPRC07TIC species, including isoprene (ISOP), α-pinene (APIN), and other BVOCs. Further details on the biogenic emissions can be found in J. Li et al. (2022). Open biomass burning emissions were processed using the Fire Inventory from NCAR (FINNv1.5; https://www2.acom.ucar.edu/modeling/finn-fire-inventory-ncar, last access: 28 January 2022, now updated to FINNv2.5).
Most emission inventories commonly employ a lumped mechanism to represent VOCs. M. Li et al. (2014) introduced a method to allocate individual non-methane VOC (NMVOC) emissions in the MEIC to species groups using multiple chemical mechanisms, utilizing mechanism-specific mapping tables from Carter (2013). This method has been widely adopted in CTMs. In this study, we followed this approach and utilized a speciation profile processor called Spec DB, which is available from https://intra.engr.ucr.edu/~carter/emitdb/ (last access: 12 November 2021), provided by Carter (2013), to generate the speciation profiles. The mapping scheme for the SAPRC07TIC mechanism in the MEIC and open biomass burning was updated based on the step-by-step assignment framework of the SAPRC07 mechanism provided by the MEIC team.
In this study, we examined the performance of CMAQ simulations during the observation period of the ATMSYC project. The days prior to 6 June were considered the spin-up period. The simulated VOC values at each site were matched with the observation time to obtain the average concentration during the same period. This duration was defined as the study period.
2.3 Adjustment of VOC emissions
Emissions were adjusted for several species that exhibited significant deviations in simulations. The adjustment factors for emissions were determined by calculating the median of the ratio between observed and predicted values at 18 urban sites, which provided an average measure of the deviation for each species. Sensitivity experiments were conducted to examine the impact of the updated VOC emissions on both predicted VOCs and O3 levels. To quantify the effect of unit increments in VOCs on O3 concentrations, the relative incremental reactivity (RIR) was calculated. The RIR is a commonly used metric in observation-based model studies (Cardelino and Chameides, 1995) to assess the sensitivity of O3 to individual precursors such as NOx and various types of VOCs. The calculation of RIR is based on Eq. (1):
In the equation, X represents a specific VOC species, while and represent the O3 concentrations in the base and adjusted emission case for X, respectively. The denominator on the right-hand side of the equation represents the relative change in emissions after the adjustment for X.
3.1 Model performance evaluation
3.1.1 Evaluation of O3 and NO2
Figure 2 displays the performance of the CMAQ model for the maximum daily 8 h average (MDA8) O3 and NO2 concentrations at 28 sites. Model performance was assessed using statistical parameters, including the normalized mean bias (NMB), normalized mean error (NME), and correlation coefficient (R). The specific values of these statistical metrics can be found in Table S3. The results indicated that the model predictions complied with the observations at most sites in the NCP, Central China, and the Southwest, with only slight underpredictions observed at Lanzhou's urban station (LZ-U; NMB = −0.18) and Shanghai's background station (SH-B; NMB = −0.16) and a slight overprediction at Shanghai's urban station (SH-U; NMB = 0.20). However, in the PRD, overpredictions of MDA8 O3 were observed in locations such as Shenzhen's station (SZ; NMB = 0.39) and Foshan's station (FS; NMB = 0.32), despite the correlation coefficients being higher than the performance criteria at most sites. The CMAQ's NO2 predictions exhibited underpredictions for most cities in the Northwest, PRD, and some background sites, but substantial overpredictions were evident in certain urban sites, such as Chengdu's urban station (CD-U; NMB = 0.92) and SZ (NMB = 0.52).
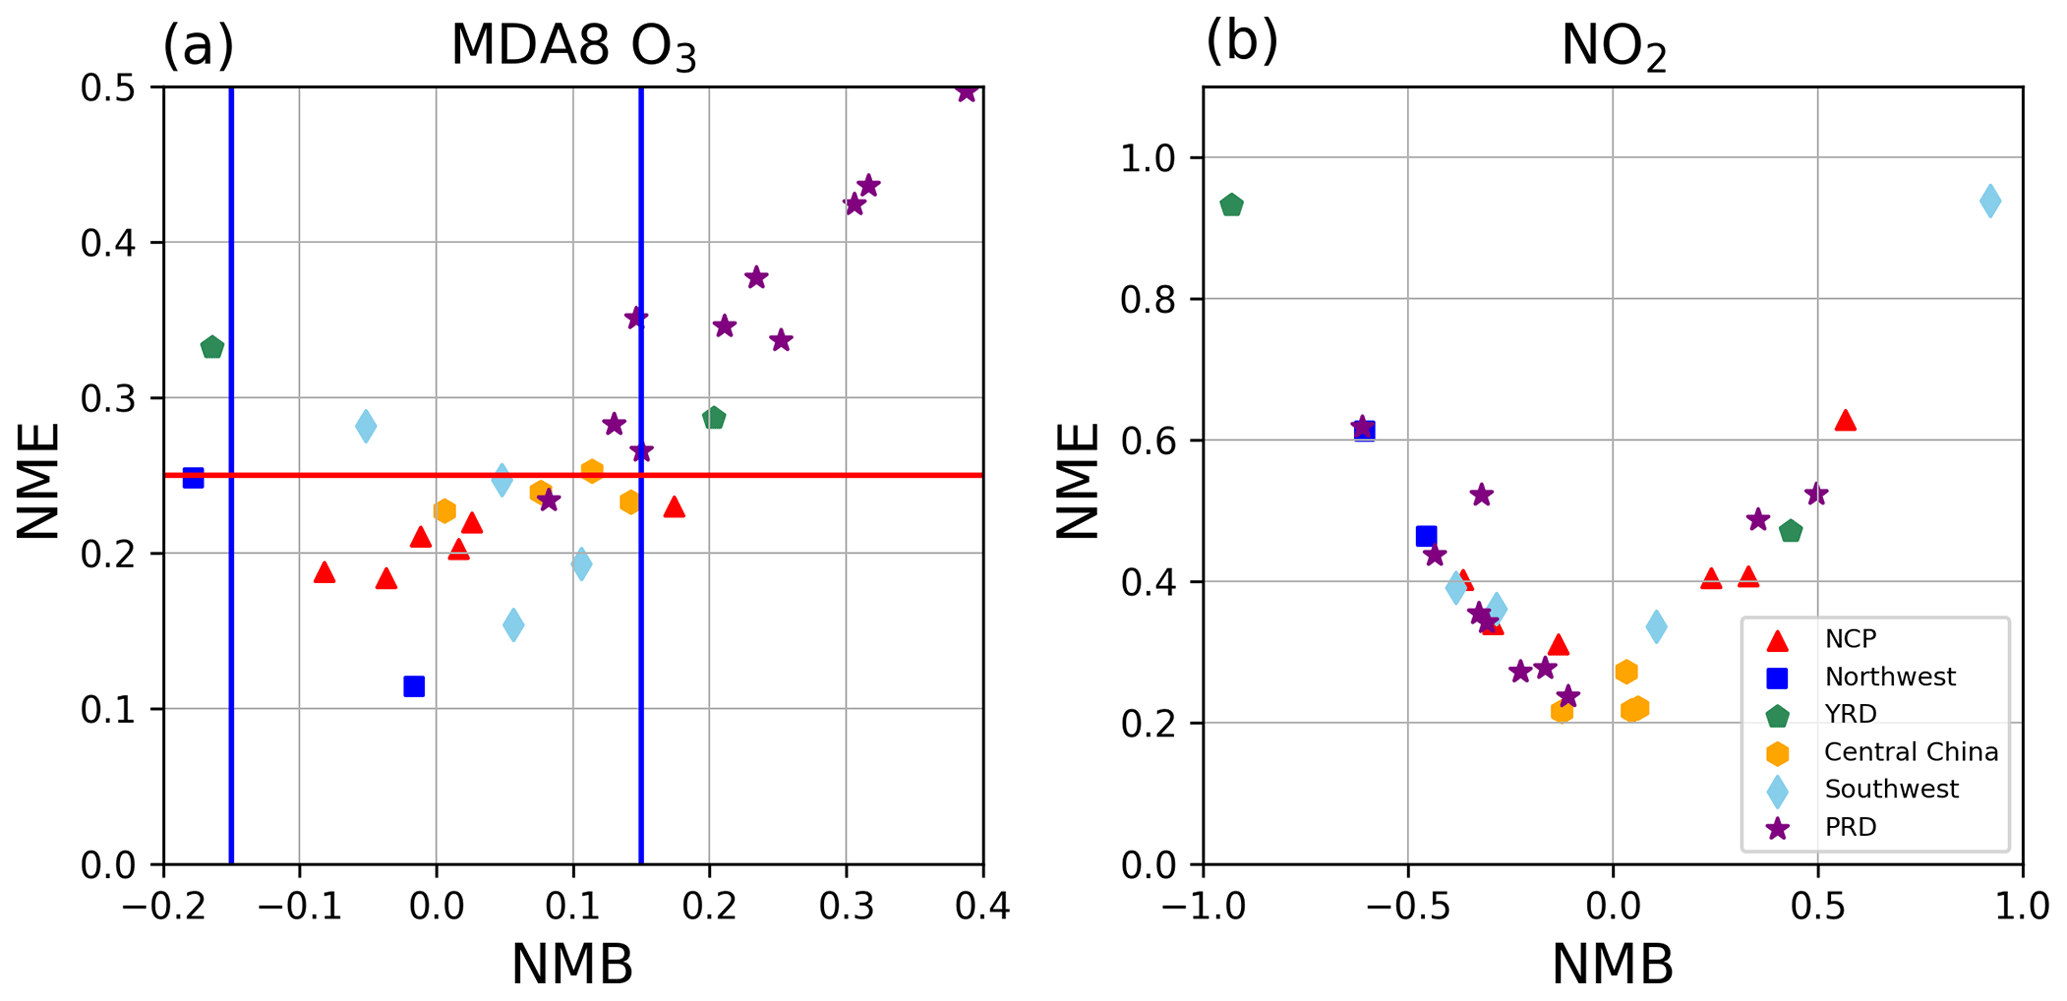
Figure 2Model performance on MDA8 O3 and NO2 at 28 sites in different regions from 6 June to 24 August in 2018. The blue and red lines denote performance criteria (NMB – normalized mean bias, NME – normalized mean error) for MDA8 O3, suggested by Emery et al. (2017), and the symbols in different colors distinguish different regions of China.
3.1.2 Evaluation of VOCs
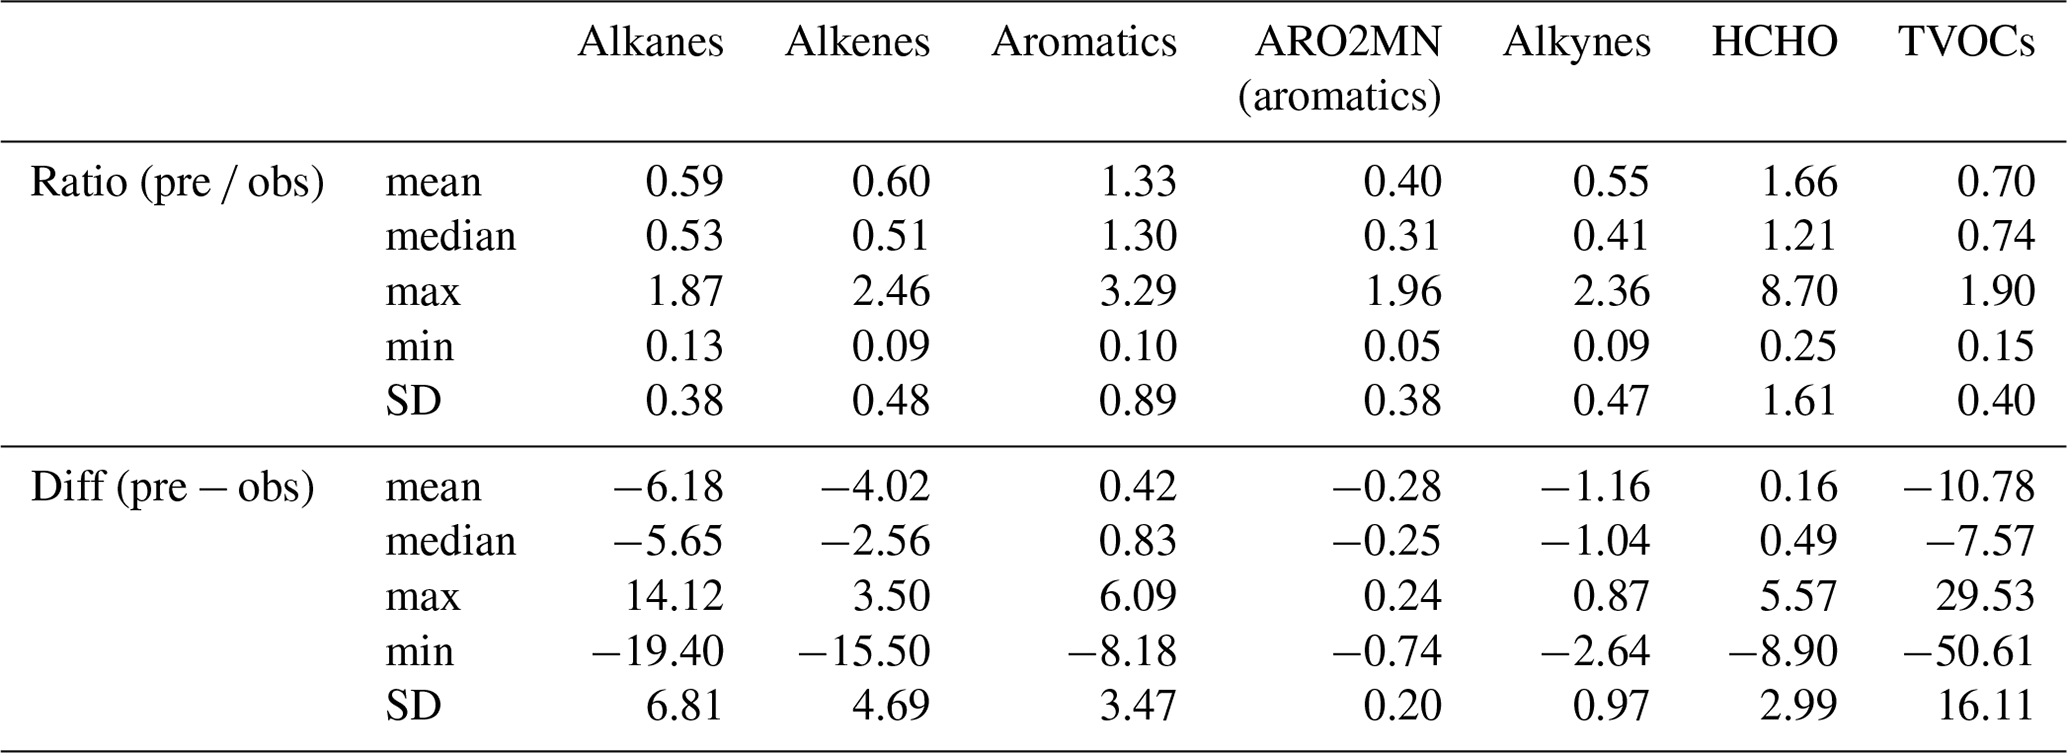
Figure 3 presents the observed VOC concentrations and corresponding CMAQ simulations across all the sites during the observation period. The proportions of the three categorized VOC groups, namely alkanes, alkenes, and aromatics, are depicted in detail in Fig. S1. The results revealed low predicted VOC concentrations at most sites, with particularly markable underestimation in certain areas. Table S4 displays the mean values of O3, NO2, and total VOC (TVOC; encompassing the VOCs considered in this study) concentrations at the 28 sites throughout the study period. As indicated in Table 1, the predicted-to-observed ratio (referred to as ratio here after) of TVOCs is 0.74 ± 0.40. The underprediction ranged from 2.05 to 50.61 ppbv (5.77 % to 85.40 %) at 24 sites, while overpredictions occurred at four sites, namely SH-U, CU-U, Wuhan's background station (WH-B), and FS, with values ranging from 0.47 to 29.53 ppbv (1.92 % to 89.96 %). These findings suggested that the CMAQ model, employing the MEIC, underpredicted TVOC concentrations. Notably, the underprediction of TVOCs was more pronounced at sites located in the cities of Lanzhou, Jinan, Shijiazhuang, Guiyang, and Zhengzhou, where TVOCs were underpredicted by factors of 2 to 6.
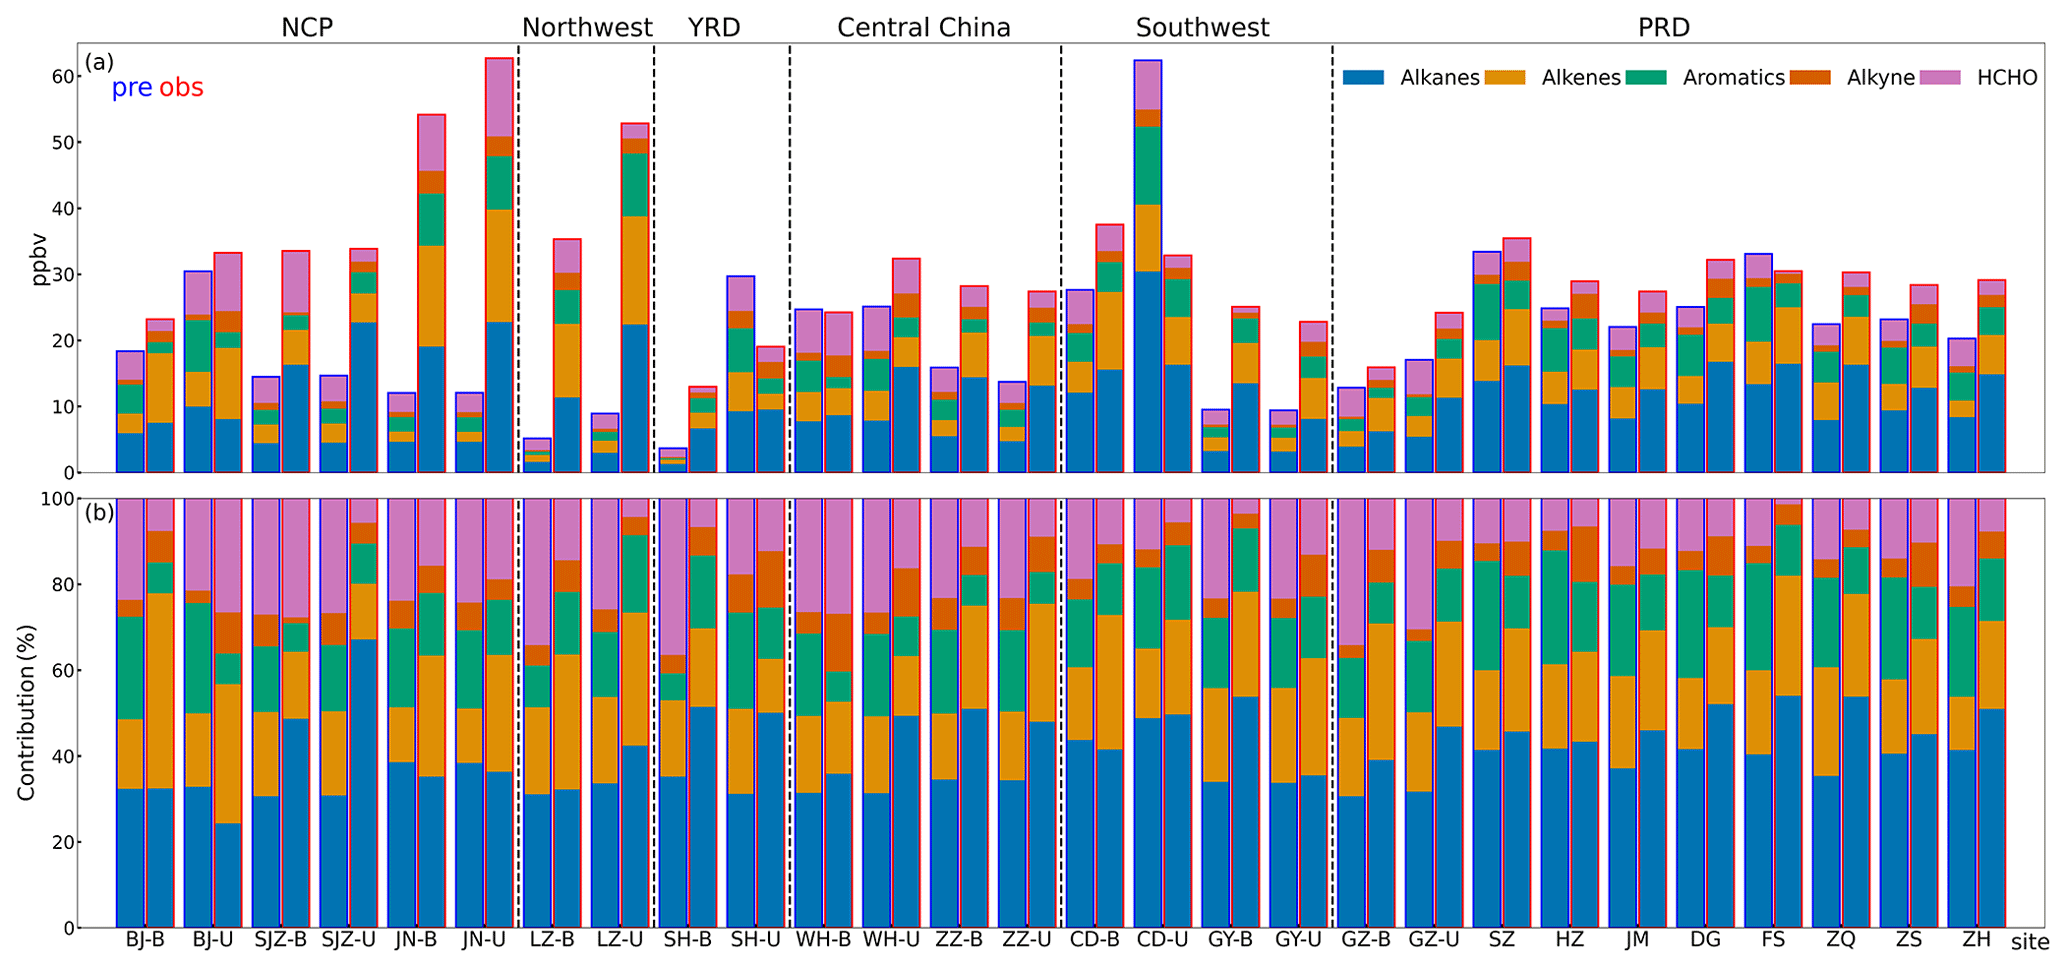
Figure 3Comparison of predicted and observed VOCs at 28 sites during the study period. (a) The predicted (bars outlined in blue) and observed (bars outlined in red) concentrations at each site. (b) Same as (a) but with contributions of VOC groups.
Table 1Mean, median, maximum (max), minimum (min), and standard deviation (SD) of the ratios and differences (Diff) for five VOC groups and TVOCs at 28 sites.
The regional averages of the predicted and observed TVOCs were calculated by averaging the predictions and observations from all the sites in each region (Table S4). The ratios of observed to predicted TVOCs varied across regions as follows: YRD (1.04) > Southwest (0.92) > PRD (0.83) > Central China (0.71) > NCP (0.42) > Northwest (0.16). In Fig. S2, despite having the highest observed TVOC value (44.08 ppbv), the model results showed a lower concentration (7.04 ppbv) in the Northwest region (specifically in Lanzhou), making it the region with the lowest predicted value. The predicted TVOC concentration in the YRD region (Shanghai) was the closest to the observed value. However, Fig. 3 shows that the VOC concentrations were notably overpredicted at SH-U and underpredicted at SH-B. The Southwest region appeared to have the best performance among all the regions, which could be due to the overpredicted TVOCs at CD-U, which offsets the underprediction at other sites. Overall, the predicted and observed TVOC concentrations exhibited notable discrepancies in most regions and the performance varied across the regions.
Regarding the VOC components shown in Fig. S2, alkanes consistently constituted as the most abundant group of VOCs in both observations (38.3 % to 50.6 %) and predictions (31.6 % to 44.9 %). This suggested that the predicted proportion of alkanes in TVOCs closely complied with the actual data. Alkenes typically ranked as the second-highest VOC component in observations (14.9 % to 31.2 %), but they were underrepresented in the model (16.5 % to 20.0 %). The predicted proportions of aromatics (13.1 % to 22.8 %) and HCHO (15.3 % to 28.9 %) were higher than in the observations. In addition, alkynes were predicted to have a minor contribution to TVOCs. In terms of absolute concentrations, the underestimation of alkanes and alkenes was relatively pronounced, particularly in the NCP and Northwest regions. The model performed better in predicting the proportions of various VOC species in the PRD and Southwest regions.
Figure 4 illustrates the ratios of O3, NO2, and various VOC species at the 28 sites. The discrepancies in ratios between urban and background sites are presented in Fig. S3. The ratio of alkanes is 0.53 ± 0.38 (median ± standard deviation), indicating an underprediction of 5.65 ± 6.81 ppbv from a concentration standpoint (Table 1). Notably, the alkanes whose reaction rate constant with hydroxyl radical (OH) was between 5 × 10² and 2.5 × 10³ ppm−1 min−1 (ALK2) exhibited the most notable underprediction. The predictions for aromatics showed minor deviations across different sites, but the median ratio was close to 1, except for ARO2MN, which was substantially underpredicted, with a ratio of 0.31 ± 0.38 (0.32 ± 0.46 at urban sites), and benzene (BENZ), which was 2.75 ± 1.97 at urban sites (Table S5). The ratios for the seven alkenes were generally high (0.51 ± 0.48 for alkenes), indicating underprediction in most sites. Particularly, 1,3-butadiene (BDE13) exhibited a notable low ratio, possibly due to its reallocation from the underpredicted alkenes, whose reaction rate constant is greater than 7 × 10⁴ ppm−1 min−1 with OH (OLE2), and the allocation factor may not be universally applicable across regions. Furthermore, the predicted concentration of acetylene (ACYE) was lower than observation at all sites (0.41 ± 0.47 for alkynes), while the HCHO was slightly overpredicted (1.21 ± 1.61 for HCHO). Considering that the observed VOC species primarily originated from anthropogenic emissions, and the majority of emitted VOCs were contributed by the MEIC, the ratios between urban and background sites could verify whether the MEIC adequately reflected the differences between urban and background areas.
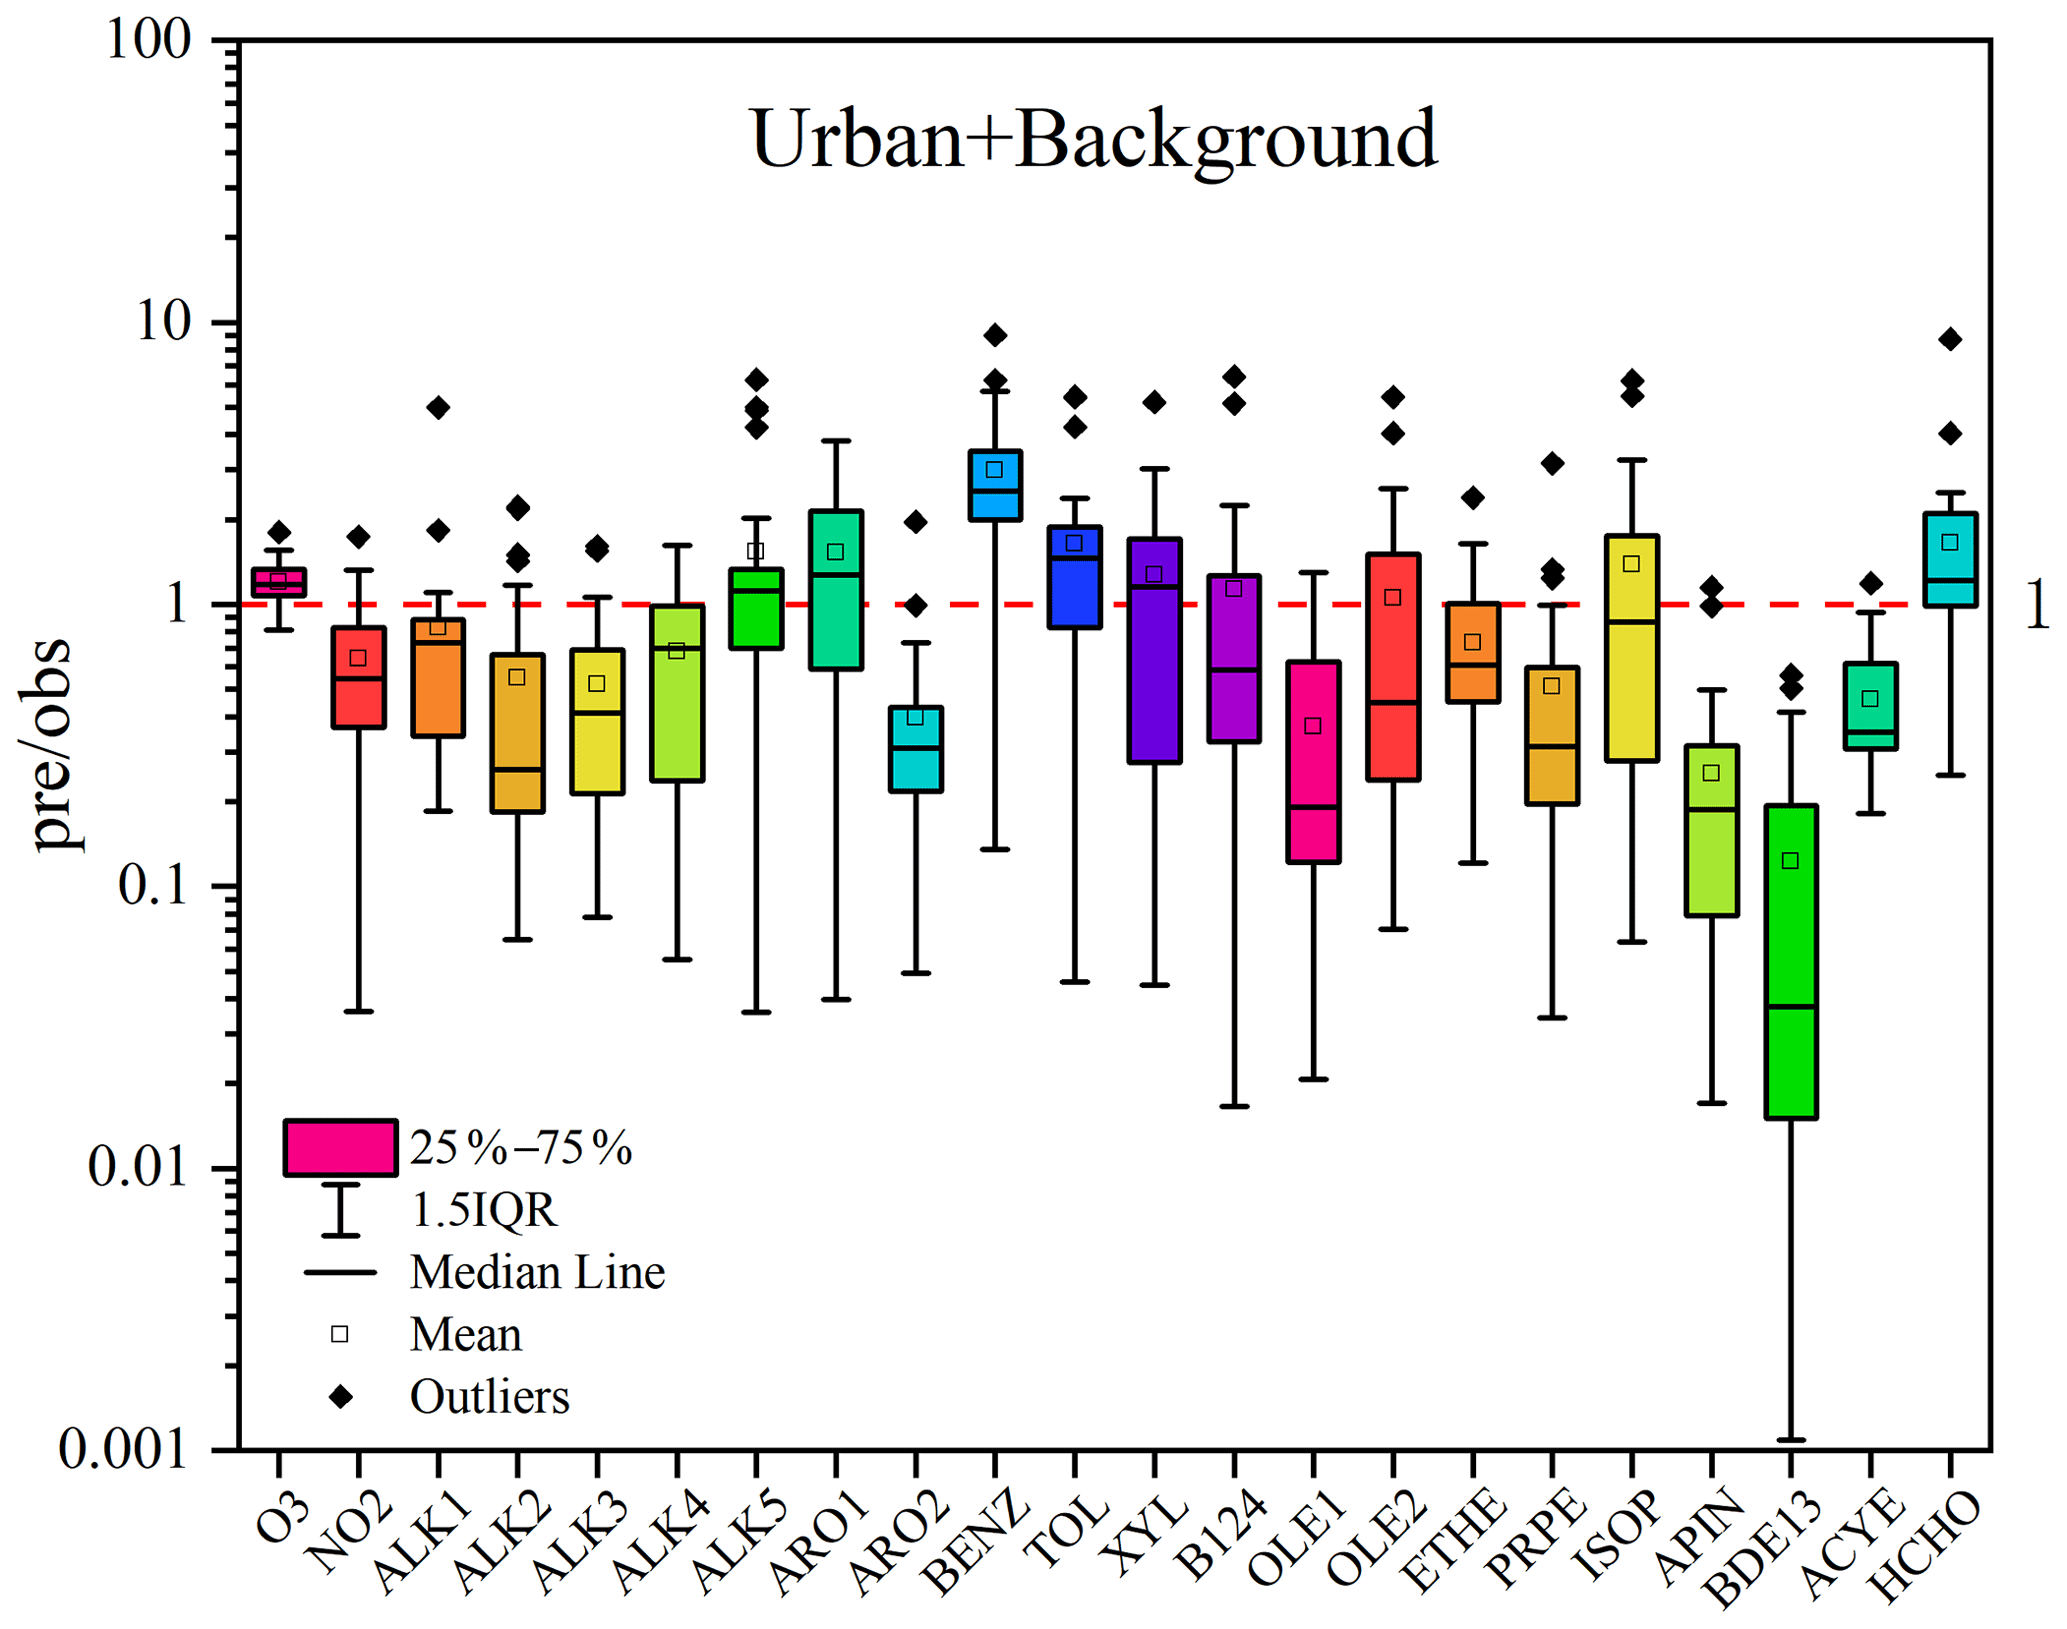
Figure 4The prediction-to-observation ratios (pre obs) for O3, NO2, and individual VOCs at 28 sites (including urban and background). The horizontal midlines in boxes represent the median values, and the hollow squares depict the mean values. The boxes represent the ratios ranging from the lower and upper quartile for individual VOCs at all sites, and the whiskers represent 1.5 times the interquartile range (1.5 IQR).
3.2 Adjusting VOC emissions and their impacts on O3 predictions
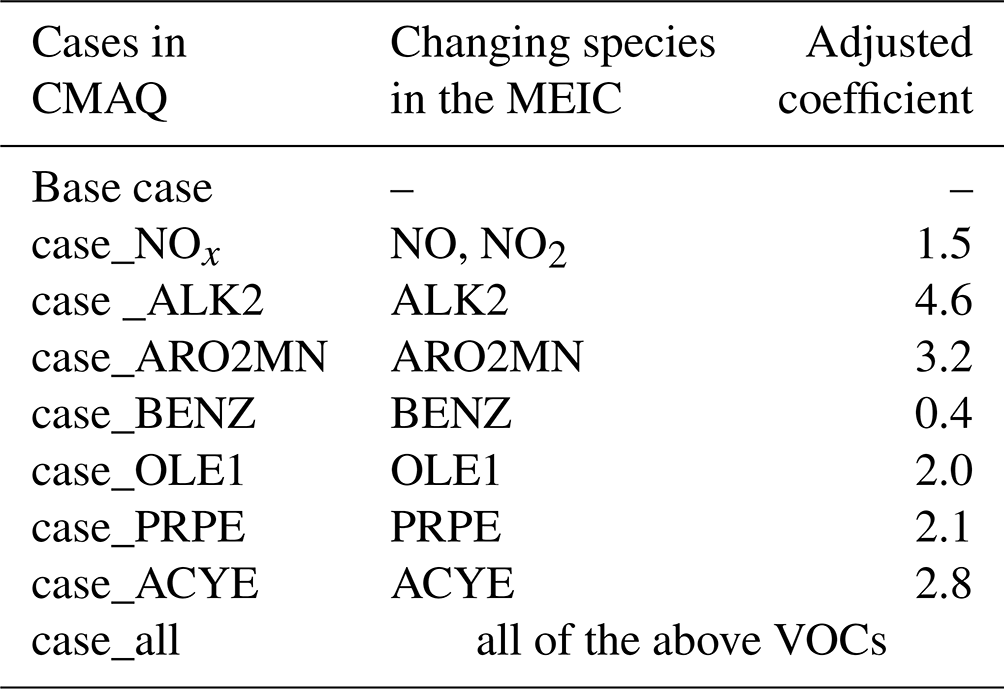
These findings indicated a bias between the model-predicted VOCs and observed ambient VOC concentrations. To evaluate the impact of these biases on O3 predictions, we modified the VOC emissions of the MEIC based on the differences between observations and predictions. Previous studies have adjusted emission inventories to match observed constraints for predicting VOCs and O3 in specific cities (Wu et al., 2022; Wang et al., 2020). Considering the temporal and spatial variability of the 28 sites, we calculated the median ratio of VOCs for the 18 urban sites. We selected coefficients for six representative AVOC species with deviations exceeding 2.0 times the median, including ALK2, ARO2MN, BENZ, the alkenes (excluding ethene) whose reaction rate constant is less than 7 × 10⁴ ppm−1 min−1 with OH (OLE1), propene (PRPE), and ACYE, and adjusted their emission rates in the MEIC, resulting in six new cases. Additionally, we conducted a case (case_all) that incorporated the aforementioned adjustments and a case in which NOx was adjusted by 1.5 based on observational constraints. The adjustment factors for the eight new cases are provided in Table 2.
Table 2New cases of adjusting emission coefficient under observation constraints.
The impact of adjusting VOC emissions on the concentrations of O3 and VOCs is presented in Table S6. The underprediction of simulated VOCs and NO2 values was largely reduced for the new case, as indicated in the six cases with single-species changes and in case_all. In Table S7, the ratio of TVOCs in case_all was modified to 0.86 ± 0.47, demonstrating improved performance in VOCs compared to the base case. However, it is worth noting that even after the emission adjustment, the predicted VOC concentrations remained lower than the observations (particularly for case_BENZ). This discrepancy resulted from the varying reactivities of different VOC species and NOx in atmospheric chemical reactions, leading to different levels of depletion. Additionally, both measured and modeled concentrations were subject to photochemical losses (Ma et al., 2022; Shao et al., 2011). The increased VOC concentrations resulted in higher O3 concentrations. Based on the data presented in Tables S6 and S8, the constrained species ALK2, ARO2MN, OLE1, and PRPE, guided by observational data, contributed to an increase in O3 concentration, especially in case_all, which led to more pronounced overpredictions, ranging from 0.62 % to 6.27 % across all the sites. In contrast, increasing NOx had a positive effect and reduced the O3 concentration.
To illustrate regional pollution levels on a broader scale, Fig. 5 displays the average concentrations of O3, NO2, and the six previously mentioned VOC species studied in China during the specified period.
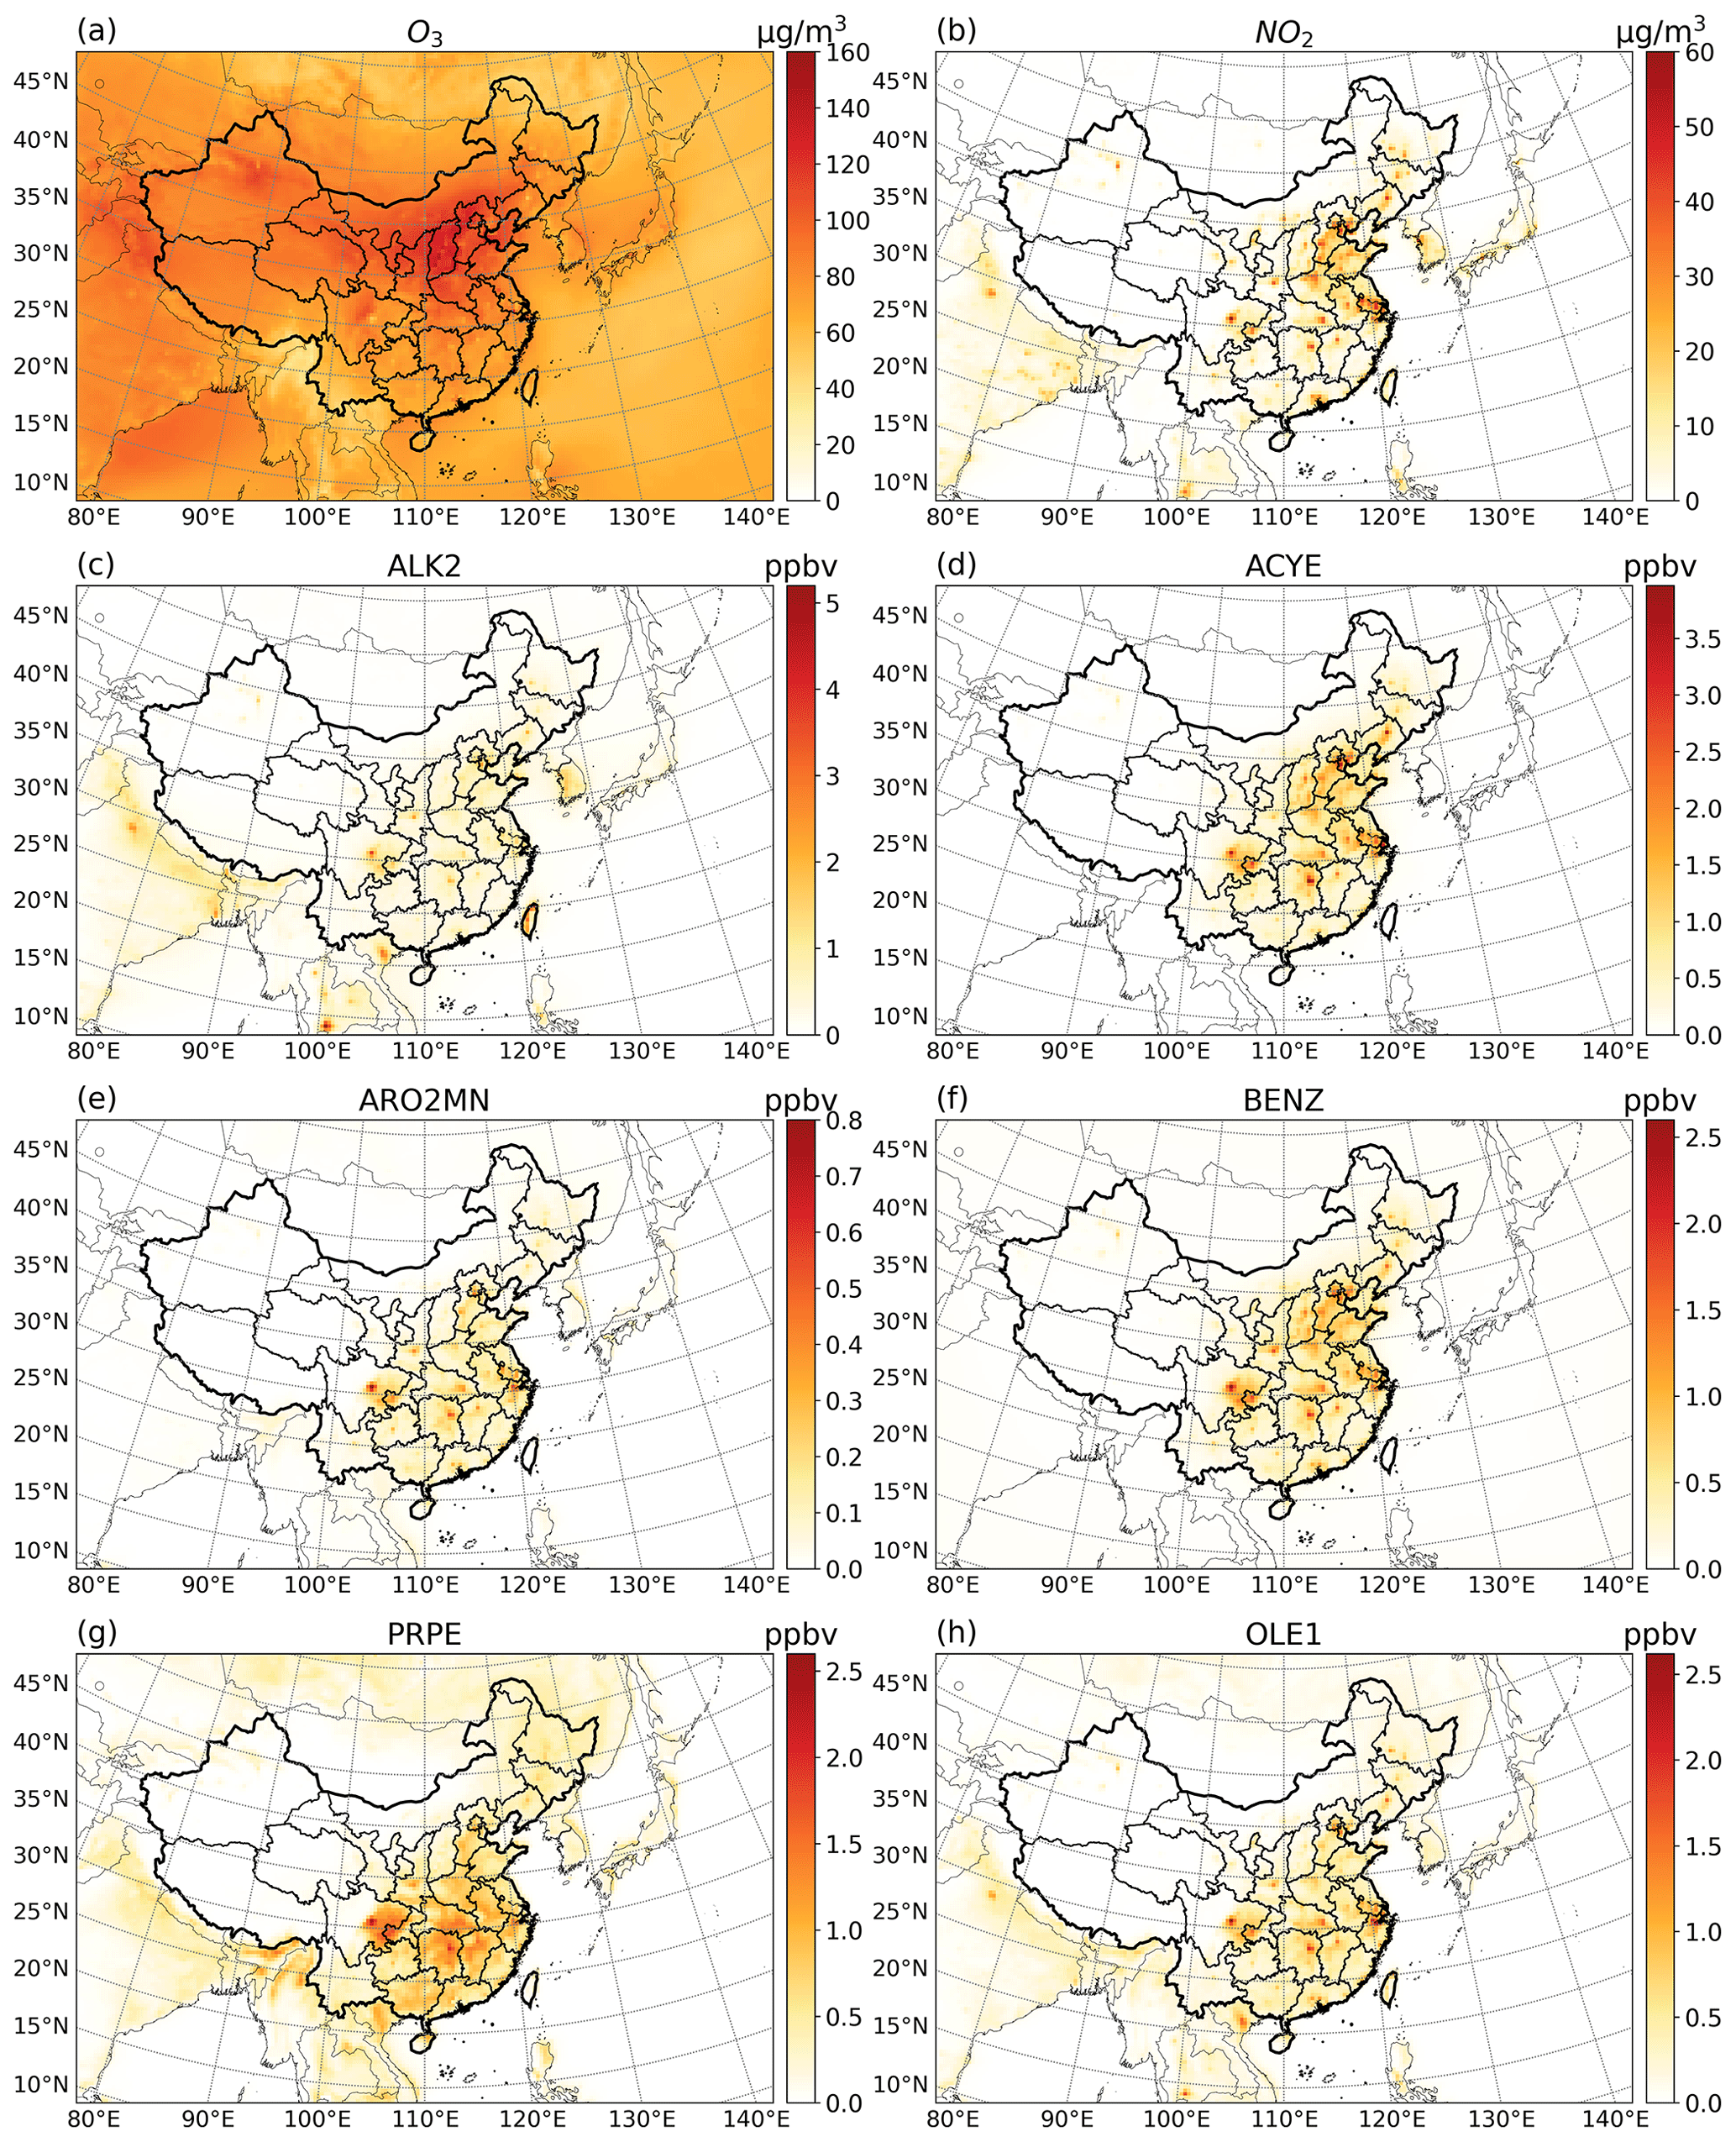
Figure 5Predicted concentration of (a) O3, (b) NO2, and (c–h) six VOCs in the base case from 6 June to 24 August 2018.
High O3 levels were particularly prominent in most areas of the NCP, the eastern part of the Northwest, and the Sichuan Basin in the Southwest. NO2 concentrations were elevated in the NCP, YRD, and PRD regions, as well as in certain megacities. The spatial distribution of various VOCs, derived from TVOC emissions in the MEIC, exhibited broad consistency, with higher concentrations observed in southeastern China. Megacities, akin to NO2, displayed elevated VOC levels. Different cities exhibited VOCs originating from various sources. ALK2 demonstrated high concentrations in individual cities but less than 1 ppbv in other regions, thus displaying stronger geographical characteristics compared to the other five VOCs. ARO2MN exhibited the lowest average concentration but exerted a substantial influence on O3 due to its higher reactivity. Figure S4 illustrates the effects of altering the emission rates of NOx and VOCs in seven scenarios across China. The left panel displays the concentrations in the new cases, while the middle and right panels show the differences for corresponding species and O3 between the new cases and the base case, respectively. Spatial variations in NO2 and VOCs exhibited similarities. The increase in NO2 was more pronounced in the NCP and YRD regions, where NO2 concentration was consistently high. Previous studies indicate that the NCP and YRD regions are predominantly limited by VOCs during the summer (K. Li et al., 2017; Lyu et al., 2019; Liu et al., 2021), resulting in either no change or a reduction in O3 when NO2 increases. Conversely, in other areas with low NO2 concentrations, O3 concentrations increased by 0 to 10 ppbv. BENZ was the only compound whose concentration decreased, and its impact on O3 in different regions mirrored that of NO2, albeit at a much lower concentration. The increased emissions of ALK2, ARO2MN, ACYE, OLE1, and PRPE favored O3 production, with the most notable effects observed in the NCP, YRD, and other metropolitan areas. Among these compounds, OLE1 exhibited the strongest effect, while ACYE had a minimal influence.
The Sect. 2.3 describes the calculation of the RIR values, which were used to demonstrate the sensitivity of the model-simulated O3 to VOCs constrained by observations in different locations. Figure S5 presents the variations in RIR values for the six VOCs across the 28 sites. OLE1, PRPE, and ARO2MN exhibited a higher RIR values. Urban areas within the same city displayed a higher RIR values compared to the background areas. With the exception of Chengdu, Guiyang, Lanzhou's background station (LZ-B), Guangzhou's background station (GZ-B), and Zhaoqing's station (ZQ), where O3 generation was more sensitive to PRPE, other areas showed a greater impact of OLE1 concentration on O3, indicating that adjusting the emission rate of alkenes in the emission inventory was crucial for simulating changes in O3 concentrations. For instance, improvements could be made in LZ-U, Huizhou's station (HZ), and Jiangmen's station (JM), where O3 concentrations were underpredicted in the base case. Special attention should be given to the sites with high RIR values such as SH-U, CD-U, SZ, and Zhuhai's station (ZH), as O3 generation in these locations will be highly sensitive to changes in the local VOC emission inventory. Moreover, ALK2, ACYE, and BENZ had minimal effects on O3, and BENZ even exhibited negative RIR values at certain sites.
These findings indicated a notable improvement in the underprediction of VOCs when adjustments were made based on VOC observations. However, the elevated VOC concentrations in the model could lead to increased O3 formation, thereby enhancing the model's accuracy in areas where both VOCs and O3 were underpredicted. Nonetheless, this adjustment will unavoidably worsen any existing overprediction of O3 in the model.
4.1 Large bias in TVOC predictions at specific sites
Significant discrepancies between predicted and observed TVOCs were observed in Lanzhou, Jinan, Shijiazhuang, and Zhengzhou. Lanzhou and Shijiazhuang have developed petrochemical industries, where high concentrations of VOCs are frequently detected downwind of industrial areas (Guan et al., 2020; Guo et al., 2022). Figure 3 illustrates that alkanes, alkenes, and aromatics were substantially underpredicted due to inadequate prediction of industrial areas with high VOC emissions in the MEIC. Jinan and Zhengzhou experienced severe air pollution due to heavy industry and traffic (Zhang et al., 2017; X. Wang et al., 2022). The simulated levels of TVOCs were substantially lower than the observed levels, with alkenes exhibiting an even greater inaccuracy, being more than 10 times lower in Jinan. At certain sites, the simulated TVOCs exceeded the measurements, including the CD-U, SH-U, WH-B, and FS sites. In CD-U, the predicted TVOCs were almost double the measured values, whereas they were underpredicted in CD-B. In Chengdu, VOC emissions were dominated by liquefied petroleum gas and natural gas (LPG/NG) usage and vehicle emissions in summer, with a higher proportion of low-carbon alkanes compared to other cities in China (Xiong et al., 2021). It is most likely that VOC emissions in CD-U were overpredicted. This could also cause high biases of HCHO, which is mostly generated from secondary production in VOC photochemical reactions (Atkinson and Arey, 2003; Wu et al., 2023). In SH-U, characterized by a dense population, the simulation of alkenes, aromatics, and HCHO was approximately twice that of the measurements. This aligns complied with the report by Wang et al. (2020) stating that observation-constrained aromatic emissions were roughly half of the estimates provided by the MEIC in Shanghai, 2015. Peng et al. (2023) also observed inconsistencies between the trend of non-methane hydrocarbon emissions in Shanghai from 2009 to 2015 and the growth trend indicated by the MEIC (Li et al., 2019), suggesting the effectiveness of local pollution control measures. However, SH-B was situated in the easternmost part of Chongming Island, which had minimal local emissions at 36 km grid resolution. This likely explains the differences observed between the urban and background areas in Shanghai. In the cases of WH-B and FS, which demonstrated excellent model performance for VOCs, only the overprediction of aromatics was more pronounced.
Heavy O3 pollution events, primarily limited by VOCs, have been frequently observed in the PRD region since its rapid development in the last century (Chan et al., 2006; Shao et al., 2009; J. Li et al., 2014). In the PRD region, slightly lower TVOC simulations were observed at most sites, primarily due to the underestimation of alkanes and alkenes, while aromatics and HCHO were overestimated. Furthermore, the differences in VOC components among the cities in the PRD region could be attributed to local industry characteristics and variations in prevention and control policies. For instance, although the TVOC concentration was well modeled in FS, the simulated ethene (ETHE) accounted for 35 % of the alkenes, lower than the observed fraction of over 50 %. In addition, the predicted HCHO (3.66 ppbv) was much higher than the observed value (0.42 ppbv). The predicted ETHE in ZH was higher (50 % of alkenes) than the observation (20 % of alkenes), while other cities exhibited similar ETHE percentages. Moreover, the proportion of ISOP in Guangzhou's alkenes was higher than that in other PRD cities, suggesting effective control of local anthropogenic alkene emissions, consistent with the findings of Zhao et al. (2022).
4.2 Urban–background evaluation
Differences in atmospheric VOCs among urban–background areas have been extensively demonstrated (Sillman, 1999; Shao et al., 2020). As depicted in Fig. 6, we compared the average performance of the model for 18 urban sites and 10 background sites. In urban areas, the predicted TVOC concentration (23.76 ppbv) was lower than the observed concentration (32.46 ppbv), primarily due to the underprediction of alkanes, alkenes, and alkynes. Predicted aromatics and HCHO exhibited higher proportions and concentrations compared to the observations. In the background areas, TVOCs were also underpredicted, with concentrations lower than those in urban areas, as indicated by both the observed and predicted values. Each of the five VOCs showed lower predictions, with alkanes exhibiting the most notable disparity, with a negative bias of 6.91 ppbv compared to the observation values. This suggested that the model underpredicted alkanes in urban areas, which were predominantly derived from the petrochemical industry or fuel evaporation (G. Wang et al., 2022). The predicted proportions of alkanes, aromatics, and HCHO exhibited urban–background differences consistent with the observations, reflecting the characteristics of urban–background areas in the model. These differences were well represented in our horizontal grid resolution of only 36 km. Overall, the CMAQ model captured the characteristics of urban–background areas in different regions but underestimated the concentrations of certain individual VOC species.
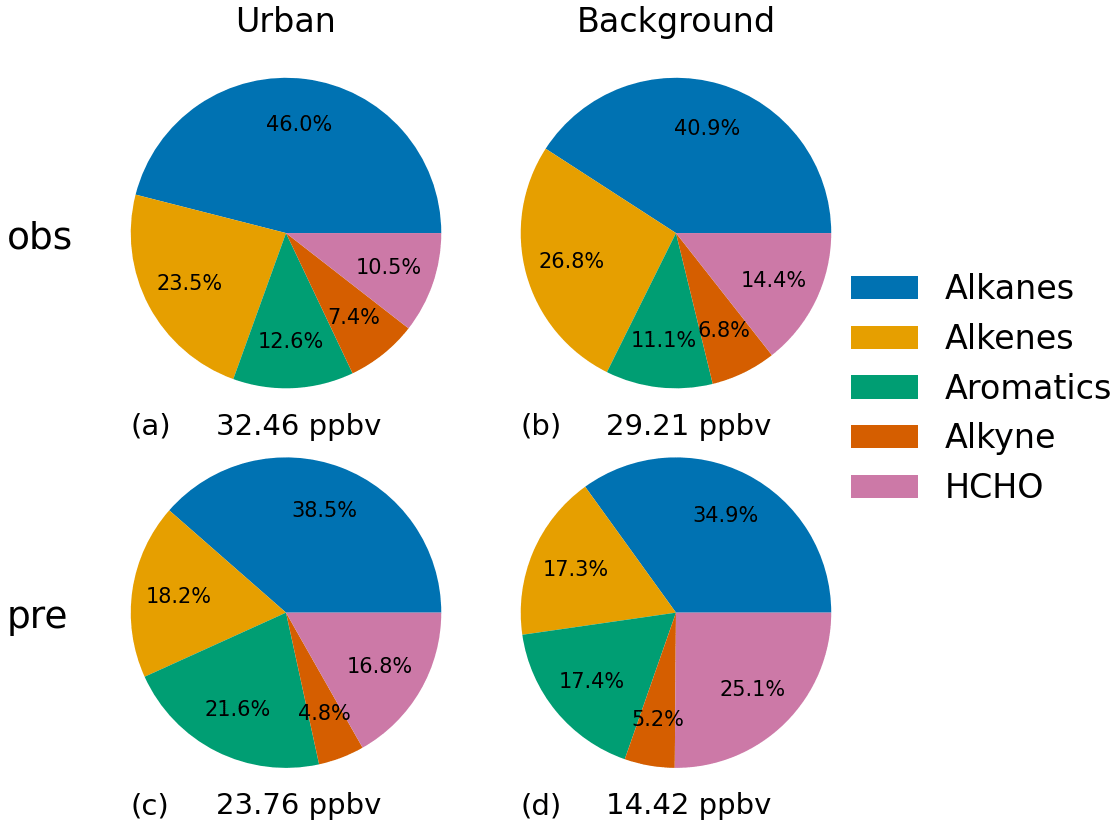
Figure 6Observed and predicted contributions of different VOCs to the total VOC concentrations at (a, c) urban sites and (b, d) background sites.
The ratios distinguished between urban and background areas are presented in Fig. S3. The comparison revealed that the alkanes were more prominently underpredicted in the background area than in the urban area. Xylene (XYL), 1,2,4-trimethylbenzene (B124), OLE1, OLE2, and PRPE were also underpredicted to a greater extent in the background area. This could be attributed to the scarcity of background sites or the model's underprediction of VOC emissions in the background area. The model's performance in simulating ISOP, a BVOC, in urban areas was not as satisfactory as in the background areas, which was consistent with the findings of Ma et al. (2021), suggesting that MEGAN could underestimate the emissions from urban green spaces. APIN, an important monoterpene, originating from anthropogenic emissions from biomass burning and VCPs, could be either underpredicted or disregarded (H. Wang et al., 2022; Mcdonald et al., 2018), resulting in common underprediction with a median ratio of 5 in urban–background areas. Additionally, the simulated HCHO concentrations were higher in the urban areas. Overall, these results indicated that the model generally performed better for anthropogenic VOCs in the urban areas. However, there were still a few notable outliers and significant deviations for a majority of VOCs, particularly those with high chemical reactivity. These deviations will inevitably impact the model's calculation of photochemical reactions involved in O3 generation.
4.3 Implications and suggestions
Accurately predicting VOCs is crucial for O3 modeling. However, due to limited measurement data and uncertainties in emission inventories, accurately simulating the VOCs across China using CTMs remains challenging.
Considerable efforts have been dedicated to the development of VOC emission inventories in recent years (Li et al., 2019; An et al., 2021; Chang et al., 2022). However, our findings indicate a substantial variation in the model performance of VOCs across different regions and species. Therefore, the inclusion of accurate local emission factors, activity data, and source profiles is essential. Sha et al. (2021) compiled an integrated dataset of AVOC source profiles in China, emphasizing the need for supplementary and timely updates to these profiles in the future. Apart from anthropogenic emissions, model resolution, chemical mechanisms, meteorological conditions, and BVOC emissions also contribute to the uncertainty of VOCs modeling, thereby affecting the performance of O3 modeling (Zhang et al., 2021; Wang et al., 2021; Liu et al., 2022).
High-resolution models require higher-resolution emission inventories (L. Li et al., 2022; An et al., 2021), which can improve simulation performance to a certain extent. Given the large scope of the model used in this study and the 0.25∘ × 0.25∘ horizontal resolution of the MEIC, a resolution of 36 km was chosen to balance computational efficiency and the preservation of information from the emission inventory, but this inevitably results in deviation of the modeled VOCs and other elements. On the one hand, urban–background sites in close proximity may be assigned to the same grid in the model, as shown in Table S3, making it difficult to distinguish the differences in modeled VOCs between urban and background sites in cities such as Shijiazhuang, Jinan, Wuhan, and Guiyang; on the other hand, in real atmospheres, even with close proximity, the observed VOCs may differ greatly in concentration, which is challenging to capture in a coarse-resolution model. When applying coarse-resolution emission inventories, increasing the model resolution can enhance the spatial correlation between observed and predicted concentrations but does not always improve simulation performance (Zheng et al., 2021). High-resolution models may introduce more emission mapping errors, which can be reduced by using coarse-resolution model grids (Zheng et al., 2021). Therefore, addressing this issue requires not only finer model resolution but also improved emission inventories.
The SAPRC07TIC chemical mechanism used in this study has been proven reliable in previous model applications (Qin et al., 2022), reducing the computational effort compared to the explicit Master Chemical Mechanism (MCM; Li et al., 2015) while retaining the chemical reactivity of various VOCs. However, the lumped VOC species contain more VOC species than those in corresponding observations. Therefore, if both the emission inventory and model are sufficiently accurate, the predicted values should theoretically be higher.
Notably, this study revealed that the model overpredicted HCHO, while some previous studies tend to show underprediction (Luecken et al., 2018; J. Li et al., 2022). The biases could result from uncertainties in VOC emissions, chemical mechanisms, and model resolution, etc. In general, HCHO is mainly contributed by oxidations of reactive VOCs such as ISOP, ETHE, PRPE, and toluene (TOLU) (Simpson et al., 2010; Wei et al., 2023; Wu et al., 2023). The overprediction of HCHO suggests that there may be excessive emissions of these VOCs or that the reaction rates of some VOCs with OH radicals were overpredicted in the model. Secondly, HCHO predictions could vary by 25 %–40 % with different chemical mechanisms, likely due to differences in hydrogen oxide radicals (HOx) and VOC grouping (Knote et al., 2015; Luecken et al., 2018). Lastly, finer model resolution could improve the representation of HCHO, especially in grids where HCHO was substantially affected by point sources (e.g., petrochemical facilities), as has been reported in Parrish et al. (2012). Considering HCHO is an important source of HOx radicals and drives ozone production (Wittrock et al., 2006; K. Li et al., 2021), more investigations are warranted to improve the model performance of HCHO in the future.
Meteorology bias also contributed to some bias of the VOC predictions. We added evaluation of the meteorology predictions in this study, and the results are shown in Tables S9 and S10. The results are consistent with other studies in China (Mao et al., 2022; Wang et al., 2021). It is observed that temperature is overpredicted at most sites, while RH is mostly underpredicted. The combination of high temperature and low RH facilitates the consumption of VOCs through photochemical reactions, which may explain the tendency of our modeled VOCs to be underestimated. But we believe it is insufficient to account for the underestimation of low-reactivity VOC species (mainly alkanes). Furthermore, the modeled wind speeds slightly exceed the observations, which may also contribute to VOC underprediction (Table S10). While the bias in meteorological conditions contributes to the underestimation of modeled VOCs, the underestimated VOC emissions is the key factor for the VOC underprediction across most of the cities.
In this study, the adjustment of VOC emissions resulted in increased predicted emission levels, subsequently leading to higher O3 predictions. However, these adjustments are simplistic and fail to account for regional variations in VOC biases. The accuracy of VOC measurement data is also crucial. Therefore, there is a need to promote the establishment of a national O3 precursor monitoring network and develop a standardized framework with quality control systems. This would facilitate the comparability of VOC measurements between regions, thereby supporting related research and the implementation of collaborative regional prevention and control measures.
In this study, we conducted a comprehensive evaluation of the simulation performance of VOCs using the CMAQ model and investigated the influence of predicted VOCs on O3 formation. The inclusion of summertime-observed VOC data from the ATMSYC project for 28 sites in China enhanced the spatiotemporal comparability of our model evaluation.
During the study period, TVOCs were found to be underpredicted by 14.1 ± 13.2 ppbv at 24 sites, except for SH-U, CD-U, WH-B, and FS. Despite some sites exhibiting similar TVOC concentrations, differences still persisted in their specific components. After considering the uncertainties of the MEIC and relevant factors, we found several sites with substantial inaccuracies, such as Jinan, Shijiazhuang, Lanzhou, Chengdu, and Guiyang. The model's performance in predicting TVOCs and their components varied across regions, with better predictions observed in urban areas compared to background areas.
Alkanes, alkenes, ARO2MN, and alkynes are generally underpredicted, with ratios of 0.53 ± 0.38, 0.51 ± 0.48, 0.31 ± 0.38, and 0.41 ± 0.47, respectively, except for HCHO which is overpredicted, with the ratio of 1.21 ± 1.61. In urban areas, the CMAQ model exhibited underpredictions for OLE1, ALK2, ARO2MN, PRPE, ACYE, and NOx, ranging from 2.0 to 4.6 times, while overpredicting BENZ by 2.75 times. For sensitivity experiments, their emissions were adjusted, and their impact on O3 and VOCs was evaluated. These adjustments improved the model's VOC performance, resulting in a change in the ratio of total VOCs to 0.86 ± 0.47. However, the increased VOCs contributed to higher reactivity, exacerbating O3 overpredictions by 0.62 % to 6.27 % across the sites. Consequently, RIR values were calculated to depict the varying reactivities of VOCs in different regions, with OLE1, PRPE, and ARO2MN contributing the highest RIR values during the study period.
Due to the uncertainties present in current VOC emission inventories, notable efforts are needed to enhance the development and updating of emission inventories, particularly in regions characterized by developed industries, evolving energy structures, and relatively underdeveloped conditions. It is only through improving the accuracy of VOC emission inventories that we can ensure reliable model performance in predicting O3 levels, thereby establishing a solid foundation for addressing the escalating issue of O3 pollution.
The model outputs and observation data are currently available upon request.
The supplement related to this article is available online at: https://doi.org/10.5194/acp-24-219-2024-supplement.
YS and JH designed the research. YS, JH, JL, MQ, XX, KG, FY, and JM contributed to model development, simulations, and data processing. XL and HG provided the observation data. XL and LH contributed to result discussion. YS prepared the manuscript, and all coauthors helped improve the manuscript.
The contact author has declared that none of the authors has any competing interests.
Publisher’s note: Copernicus Publications remains neutral with regard to jurisdictional claims made in the text, published maps, institutional affiliations, or any other geographical representation in this paper. While Copernicus Publications makes every effort to include appropriate place names, the final responsibility lies with the authors.
The author would like to thank the REACH team members, who have invested time and effort in this work.
This research has been supported by the National Key R&D Program of China (grant no. 2022YFC3701000, Task 5) and the National Natural Science Foundation of China (grant nos. 92044302, 42021004).
This paper was edited by Zhibin Wang and reviewed by two anonymous referees.
An, J., Huang, Y., Huang, C., Wang, X., Yan, R., Wang, Q., Wang, H., Jing, S., Zhang, Y., Liu, Y., Chen, Y., Xu, C., Qiao, L., Zhou, M., Zhu, S., Hu, Q., Lu, J., and Chen, C.: Emission inventory of air pollutants and chemical speciation for specific anthropogenic sources based on local measurements in the Yangtze River Delta region, China, Atmos. Chem. Phys., 21, 2003–2025, https://doi.org/10.5194/acp-21-2003-2021, 2021.
Appel, W., Napelenok, S., Hogrefe, C., Pouliot, G., Foley, K. M., Roselle, S. J., Pleim, J. E., Bash, J., Pye, H. O. T., Heath, N., Murphy, B., and Mathur, R.: Overview and Evaluation of the Community Multiscale Air Quality (CMAQ) Modeling System Version 5.2, Air Pollution Modeling and its Application XXV, Springer, Cham, 69–73, https://doi.org/10.1007/978-3-319-57645-9_11, 2018.
Atkinson, R. and Arey, J.: Atmospheric Degradation of Volatile Organic Compounds, Chem. Rev., 103, 4605–4638, https://doi.org/10.1021/cr0206420, 2003.
Cardelino, C. A. and Chameides, W. L.: An observation-based model for analyzing ozone precursor relationships in the urban atmosphere, J. Air Waste Manag. Assoc., 45, 161–180, https://doi.org/10.1080/10473289.1995.10467356, 1995.
Carter, W. P. L.: Development of the SAPRC-07 chemical mechanism, Atmos. Environ., 44, 5324–5335, https://doi.org/10.1016/j.atmosenv.2010.01.026, 2010.
Carter, W. P. L.: Development of an improved chemical speciation database for processing emissions of volatile organic compounds for air quality models, report, https://intra.engr.ucr.edu/~carter/emitdb/ (last access: 12 November 2021), 2013.
Chan, L., Chu, K., Zou, S., Chan, C., Wang, X., Barletta, B., Blake, D., Guo, H., and Tsai, W.: Characteristics of nonmethane hydrocarbons (NMHCs) in industrial, industrial-urban, and industrial-suburban atmospheres of the Pearl River Delta (PRD) region of south China, J. Geophys. Res., 111, D11304, https://doi.org/10.1029/2005jd006481, 2006.
Chang, X., Zhao, B., Zheng, H., Wang, S., Cai, S., Guo, F., Gui, P., Huang, G., Wu, D., Han, L., Xing, J., Man, H., Hu, R., Liang, C., Xu, Q., Qiu, X., Ding, D., Liu, K., Han, R., Robinson, A. L., and Donahue, N. M.: Full-volatility emission framework corrects missing and underestimated secondary organic aerosol sources, One Earth, 5, 403–412, https://doi.org/10.1016/j.oneear.2022.03.015, 2022.
Dang, R., Liao, H., and Fu, Y.: Quantifying the anthropogenic and meteorological influences on summertime surface ozone in China over 2012–2017, Sci. Total Environ., 754, 142394, https://doi.org/10.1016/j.scitotenv.2020.142394, 2021.
Emery, C., Liu, Z., Russell, A. G., Odman, M. T., Yarwood, G., and Kumar, N.: Recommendations on statistics and benchmarks to assess photochemical model performance, J. Air Waste Manag. Assoc., 67, 582–598, https://doi.org/10.1080/10962247.2016.1265027, 2017.
Gong, K., Li, L., Li, J., Qin, M., Wang, X., Ying, Q., Liao, H., Guo, S., Hu, M., Zhang, Y., and Hu, J.: Quantifying the impacts of inter-city transport on air quality in the Yangtze River Delta urban agglomeration, China: Implications for regional cooperative controls of PM2.5 and O3, Sci. Total Environ., 779, 146619, https://doi.org/10.1016/j.scitotenv.2021.146619, 2021.
Guan, Y., Wang, L., Wang, S., Zhang, Y., Xiao, J., Wang, X., Duan, E., and Hou, L.: Temporal variations and source apportionment of volatile organic compounds at an urban site in Shijiazhuang, China, J. Environ. Sci. (China), 97, 25–34, https://doi.org/10.1016/j.jes.2020.04.022, 2020.
Guenther, A., Karl, T., Harley, P., Wiedinmyer, C., Palmer, P. I., and Geron, C.: Estimates of global terrestrial isoprene emissions using MEGAN (Model of Emissions of Gases and Aerosols from Nature), Atmos. Chem. Phys., 6, 3181–3210, https://doi.org/10.5194/acp-6-3181-2006, 2006.
Guenther, A. B., Jiang, X., Heald, C. L., Sakulyanontvittaya, T., Duhl, T., Emmons, L. K., and Wang, X.: The Model of Emissions of Gases and Aerosols from Nature version 2.1 (MEGAN2.1): an extended and updated framework for modeling biogenic emissions, Geosci. Model Dev., 5, 1471–1492, https://doi.org/10.5194/gmd-5-1471-2012, 2012.
Guo, W., Yang, Y., Chen, Q., Zhu, Y., Zhang, Y., Zhang, Y., Liu, Y., Li, G., Sun, W., and She, J.: Chemical reactivity of volatile organic compounds and their effects on ozone formation in a petrochemical industrial area of Lanzhou, Western China, Sci. Total Environ., 839, 155901, https://doi.org/10.1016/j.scitotenv.2022.155901, 2022.
Hu, J., Chen, J., Ying, Q., and Zhang, H.: One-year simulation of ozone and particulate matter in China using WRF/CMAQ modeling system, Atmos. Chem. Phys., 16, 10333–10350, https://doi.org/10.5194/acp-16-10333-2016, 2016.
Hu, J., Wang, P., Ying, Q., Zhang, H., Chen, J., Ge, X., Li, X., Jiang, J., Wang, S., Zhang, J., Zhao, Y., and Zhang, Y.: Modeling biogenic and anthropogenic secondary organic aerosol in China, Atmos. Chem. Phys., 17, 77–92, https://doi.org/10.5194/acp-17-77-2017, 2017.
Kelly, J. M., Doherty, R. M., O'Connor, F. M., and Mann, G. W.: The impact of biogenic, anthropogenic, and biomass burning volatile organic compound emissions on regional and seasonal variations in secondary organic aerosol, Atmos. Chem. Phys., 18, 7393–7422, https://doi.org/10.5194/acp-18-7393-2018, 2018.
Knote, C., Tuccella, P., Curci, G., Emmons, L., Orlando, J. J., Madronich, S., Baró, R., Jiménez-Guerrero, P., Luecken, D., Hogrefe, C., Forkel, R., Werhahn, J., Hirtl, M., Pérez, J. L., San José, R., Giordano, L., Brunner, D., Yahya, K., and Zhang, Y.: Influence of the choice of gas-phase mechanism on predictions of key gaseous pollutants during the AQMEII phase-2 intercomparison, Atmos. Environ., 115, 553–568, https://doi.org/10.1016/j.atmosenv.2014.11.066, 2015.
Kroll, J. H. and Seinfeld, J. H.: Chemistry of secondary organic aerosol: Formation and evolution of low-volatility organics in the atmosphere, Atmos. Environ., 42, 3593–3624, https://doi.org/10.1016/j.atmosenv.2008.01.003, 2008.
Kurokawa, J. and Ohara, T.: Long-term historical trends in air pollutant emissions in Asia: Regional Emission inventory in ASia (REAS) version 3, Atmos. Chem. Phys., 20, 12761–12793, https://doi.org/10.5194/acp-20-12761-2020, 2020.
Li, C., Liu, Y., Cheng, B., Zhang, Y., Liu, X., Qu, Y., An, J., Kong, L., Zhang, Y., Zhang, C., Tan, Q., and Feng, M.: A comprehensive investigation on volatile organic compounds (VOCs) in 2018 in Beijing, China: Characteristics, sources and behaviours in response to O3 formation, Sci. Total Environ., 806, 150247, https://doi.org/10.1016/j.scitotenv.2021.150247, 2022.
Li, J., Lu, K., Lv, W., Li, J., Zhong, L., Ou, Y., Chen, D., Huang, X., and Zhang, Y.: Fast increasing of surface ozone concentrations in Pearl River Delta characterized by a regional air quality monitoring network during 2006–2011, J. Environ. Sci., 26, 23–36, https://doi.org/10.1016/s1001-0742(13)60377-0, 2014.
Li, J., Cleveland, M., Ziemba, L. D., Griffin, R. J., Barsanti, K. C., Pankow, J. F., and Ying, Q.: Modeling regional secondary organic aerosol using the Master Chemical Mechanism, Atmos. Environ., 102, 52–61, https://doi.org/10.1016/j.atmosenv.2014.11.054, 2015.
Li, J., Xie, X., Li, L., Wang, X., Wang, H., Jing, S., Ying, Q., Qin, M., and Hu, J.: Fate of Oxygenated Volatile Organic Compounds in the Yangtze River Delta Region: Source Contributions and Impacts on the Atmospheric Oxidation Capacity, Environ. Sci. Technol., 56, 11212–11224, https://doi.org/10.1021/acs.est.2c00038, 2022.
Li, K., Jacob, D. J., Shen, L., Lu, X., De Smedt, I., and Liao, H.: Increases in surface ozone pollution in China from 2013 to 2019: anthropogenic and meteorological influences, Atmos. Chem. Phys., 20, 11423–11433, https://doi.org/10.5194/acp-20-11423-2020, 2020.
Li, K., Chen, L., Ying, F., White, S. J., Jang, C., Wu, X., Gao, X., Hong, S., Shen, J., Azzi, M., and Cen, K.: Meteorological and chemical impacts on ozone formation: A case study in Hangzhou, China, Atmos. Res., 196, 40–52, https://doi.org/10.1016/j.atmosres.2017.06.003, 2017.
Li, K., Jacob, D. J., Liao, H., Qiu, Y., Shen, L., Zhai, S., Bates, K. H., Sulprizio, M. P., Song, S., Lu, X., Zhang, Q., Zheng, B., Zhang, Y., Zhang, J., Lee, H. C., and Kuk, S. K.: Ozone pollution in the North China Plain spreading into the late-winter haze season, P. Natl. Acad. Sci. USA, 118, e2015797118, https://doi.org/10.1073/pnas.2015797118, 2021.
Li, L., Hu, J., Li, J., Gong, K., Wang, X., Ying, Q., Qin, M., Liao, H., Guo, S., Hu, M., and Zhang, Y.: Modelling air quality during the EXPLORE-YRD campaign – Part II. Regional source apportionment of ozone and PM2.5, Atmos. Environ., 247, 118063, https://doi.org/10.1016/j.atmosenv.2020.118063, 2021.
Li, L., Xie, F., Li, J., Gong, K., Xie, X., Qin, Y., Qin, M., and Hu, J.: Diagnostic analysis of regional ozone pollution in Yangtze River Delta, China: A case study in summer 2020, Sci. Total Environ., 812, 151511, https://doi.org/10.1016/j.scitotenv.2021.151511, 2022.
Li, M., Zhang, Q., Streets, D. G., He, K. B., Cheng, Y. F., Emmons, L. K., Huo, H., Kang, S. C., Lu, Z., Shao, M., Su, H., Yu, X., and Zhang, Y.: Mapping Asian anthropogenic emissions of non-methane volatile organic compounds to multiple chemical mechanisms, Atmos. Chem. Phys., 14, 5617–5638, https://doi.org/10.5194/acp-14-5617-2014, 2014.
Li, M., Liu, H., Geng, G., Hong, C., Liu, F., Song, Y., Tong, D., Zheng, B., Cui, H., Man, H., Zhang, Q., and He, K.: Anthropogenic emission inventories in China: a review, Nat. Sci. Rev., 4, 834–866, https://doi.org/10.1093/nsr/nwx150, 2017.
Li, M., Zhang, Q., Zheng, B., Tong, D., Lei, Y., Liu, F., Hong, C., Kang, S., Yan, L., Zhang, Y., Bo, Y., Su, H., Cheng, Y., and He, K.: Persistent growth of anthropogenic non-methane volatile organic compound (NMVOC) emissions in China during 1990–2017: drivers, speciation and ozone formation potential, Atmos. Chem. Phys., 19, 8897–8913, https://doi.org/10.5194/acp-19-8897-2019, 2019.
Liu, T., Wang, C., Wang, Y., Huang, L., Li, J., Xie, F., Zhang, J., and Hu, J.: Impacts of model resolution on predictions of air quality and associated health exposure in Nanjing, China, Chemosphere, 249, 126515, https://doi.org/10.1016/j.chemosphere.2020.126515, 2020.
Liu, X., Guo, H., Zeng, L., Lyu, X., Wang, Y., Zeren, Y., Yang, J., Zhang, L., Zhao, S., Li, J., and Zhang, G.: Photochemical ozone pollution in five Chinese megacities in summer 2018, Sci. Total Environ., 801, 149603, https://doi.org/10.1016/j.scitotenv.2021.149603, 2021.
Liu, Y., Li, J., Ma, Y., Zhou, M., Tan, Z., Zeng, L., Lu, K., and Zhang, Y.: A review of gas-phase chemical mechanisms commonly used in atmospheric chemistry modelling, J. Environ. Sci., 123, 522–534, https://doi.org/10.1016/j.jes.2022.10.031, 2022.
Luecken, D. J., Napelenok, S. L., Strum, M., Scheffe, R., and Phillips, S.: Sensitivity of Ambient Atmospheric Formaldehyde and Ozone to Precursor Species and Source Types Across the United States, Environ. Sci. Technol., 52, 4668–4675, https://doi.org/10.1021/acs.est.7b05509, 2018.
Lyu, X., Wang, N., Guo, H., Xue, L., Jiang, F., Zeren, Y., Cheng, H., Cai, Z., Han, L., and Zhou, Y.: Causes of a continuous summertime O3 pollution event in Jinan, a central city in the North China Plain, Atmos. Chem. Phys., 19, 3025–3042, https://doi.org/10.5194/acp-19-3025-2019, 2019.
Lyu, X., Guo, H., Wang, Y., Zhang, F., Nie, K., Dang, J., Liang, Z., Dong, S., Zeren, Y., Zhou, B., Gao, W., Zhao, S., and Zhang, G.: Hazardous volatile organic compounds in ambient air of China, Chemosphere, 246, 125731, https://doi.org/10.1016/j.chemosphere.2019.125731, 2020.
Ma, M., Gao, Y., Ding, A., Su, H., Liao, H., Wang, S., Wang, X., Zhao, B., Zhang, S., Fu, P., Guenther, A. B., Wang, M., Li, S., Chu, B., Yao, X., and Gao, H.: Development and Assessment of a High-Resolution Biogenic Emission Inventory from Urban Green Spaces in China, Environ. Sci. Technol., 56, 175–184, https://doi.org/10.1021/acs.est.1c06170, 2021.
Ma, W., Feng, Z., Zhan, J., Liu, Y., Liu, P., Liu, C., Ma, Q., Yang, K., Wang, Y., He, H., Kulmala, M., Mu, Y., and Liu, J.: Influence of photochemical loss of volatile organic compounds on understanding ozone formation mechanism, Atmos. Chem. Phys., 22, 4841–4851, https://doi.org/10.5194/acp-22-4841-2022, 2022.
Mao, J., Li, L., Li, J., Sulaymon, I. D., Xiong, K., Wang, K., Zhu, J., Chen, G., Ye, F., Zhang, N., Qin, Y., Qin, M., and Hu, J.: Evaluation of Long-Term Modeling Fine Particulate Matter and Ozone in China During 2013–2019, Front. Environ. Sci., 10, 872249, https://doi.org/10.3389/fenvs.2022.872249, 2022.
McDonald, B. C., de Gouw, J. A., Gilman, J. B., Jathar, S. H., Akherati, A., Cappa, C. D., Jimenez, J. L., Lee-Taylor, J., Hayes, P. L., McKeen, S. A., Cui, Y. Y., Kim, S.-W., Gentner, D. R., Isaacman-VanWertz, G., Goldstein, A. H., Harley, R. A., Frost, G. J., Roberts, J. M., Ryerson, T. B., and Trainer, M.: Volatile chemical products emerging as largest petrochemical source of urban organic emissions, Science, 359, 760–764, https://doi.org/10.1126/science.aaq0524, 2018.
Parrish, D. D., Ryerson, T. B., Mellqvist, J., Johansson, J., Fried, A., Richter, D., Walega, J. G., Washenfelder, R. A., de Gouw, J. A., Peischl, J., Aikin, K. C., McKeen, S. A., Frost, G. J., Fehsenfeld, F. C., and Herndon, S. C.: Primary and secondary sources of formaldehyde in urban atmospheres: Houston Texas region, Atmos. Chem. Phys., 12, 3273–3288, https://doi.org/10.5194/acp-12-3273-2012, 2012.
Peng, Y., Wang, H., Wang, Q., Jing, S., An, J., Gao, Y., Huang, C., Yan, R., Dai, H., Cheng, T., Zhang, Q., Li, M., Hu, J., Shi, Z., Li, L., Lou, S., Tao, S., Hu, Q., Lu, J., and Chen, C.: Observation-based sources evolution of non-methane hydrocarbons (NMHCs) in a megacity of China, J. Environ. Sci. (China), 124, 794–805, https://doi.org/10.1016/j.jes.2022.01.040, 2023.
Qin, M., Hu, Y., Wang, X., Vasilakos, P., Boyd, C. M., Xu, L., Song, Y., Ng, N. L., Nenes, A., and Russell, A. G.: Modeling biogenic secondary organic aerosol (BSOA) formation from monoterpene reactions with NO3: A case study of the SOAS campaign using CMAQ, Atmos. Environ., 184, 146–155, https://doi.org/10.1016/j.atmosenv.2018.03.042, 2018.
Qin, M., Hu, A., Mao, J., Li, X., Sheng, L., Sun, J., Li, J., Wang, X., Zhang, Y., and Hu, J.: PM2.5 and O3 relationships affected by the atmospheric oxidizing capacity in the Yangtze River Delta, China, Sci. Total Environ., 810, 152268, https://doi.org/10.1016/j.scitotenv.2021.152268, 2022.
Sha, Q., Zhu, M., Huang, H., Wang, Y., Huang, Z., Zhang, X., Tang, M., Lu, M., Chen, C., Shi, B., Chen, Z., Wu, L., Zhong, Z., Li, C., Xu, Y., Yu, F., Jia, G., Liao, S., Cui, X., Liu, J., and Zheng, J.: A newly integrated dataset of volatile organic compounds (VOCs) source profiles and implications for the future development of VOCs profiles in China, Sci. Total Environ., 793, 148348, https://doi.org/10.1016/j.scitotenv.2021.148348, 2021.
Shao, M., Zhang, Y., Zeng, L., Tang, X., Zhang, J., Zhong, L., and Wang, B.: Ground-level ozone in the Pearl River Delta and the roles of VOC and NOx in its production, J. Environ. Manage., 90, 512–518, https://doi.org/10.1016/j.jenvman.2007.12.008, 2009.
Shao, M., Wang, B., Lu, S., Yuan, B., and Wang, M.: Effects of Beijing Olympics Control Measures on Reducing Reactive Hydrocarbon Species, Environ. Sci. Technol., 45, 514–519, https://doi.org/10.1021/es102357t, 2011.
Shao, P., Xu, X., Zhang, X., Xu, J., Wang, Y., and Ma, Z.: Impact of volatile organic compounds and photochemical activities on particulate matters during a high ozone episode at urban, suburb and regional background stations in Beijing, Atmos. Environ., 236, 117629, https://doi.org/10.1016/j.atmosenv.2020.117629, 2020.
Shi, Z., Li, J., Huang, L., Wang, P., Wu, L., Ying, Q., Zhang, H., Lu, L., Liu, X., Liao, H., and Hu, J.: Source apportionment of fine particulate matter in China in 2013 using a source-oriented chemical transport model, Sci. Total Environ., 601–602, 1476–1487, https://doi.org/10.1016/j.scitotenv.2017.06.019, 2017.
Sillman, S.: The relation between ozone, NOx and hydrocarbons in urban and polluted rural environments, Atmos. Environ., 33, 1821–1845, https://doi.org/10.1016/S1352-2310(98)00345-8, 1999.
Simpson, I. J., Blake, N. J., Barletta, B., Diskin, G. S., Fuelberg, H. E., Gorham, K., Huey, L. G., Meinardi, S., Rowland, F. S., Vay, S. A., Weinheimer, A. J., Yang, M., and Blake, D. R.: Characterization of trace gases measured over Alberta oil sands mining operations: 76 speciated C2–C10 volatile organic compounds (VOCs), CO2, CH4, CO, NO, NO2, NOy, O3 and SO2, Atmos. Chem. Phys., 10, 11931–11954, https://doi.org/10.5194/acp-10-11931-2010, 2010.
Wang, G., Zhao, N., Zhang, H., Li, G., and Xin, G.: Spatiotemporal Distributions of Ambient Volatile Organic Compounds in China: Characteristics and Sources, Aerosol Air Qual. Res., 22, 210379, https://doi.org/10.4209/aaqr.210379, 2022.
Wang, H., Yan, R., Xu, T., Wang, Y., Wang, Q., Zhang, T., An, J., Huang, C., Gao, Y., Gao, Y., Li, X., Yu, C., Jing, S., Qiao, L., Lou, S., Tao, S., and Li, Y.: Observation Constrained Aromatic Emissions in Shanghai, China, J. Geophys. Res.-Atmos., 125, e2019JD031815, https://doi.org/10.1029/2019jd031815, 2020.
Wang, H., Ma, X., Tan, Z., Wang, H., Chen, X., Chen, S., Gao, Y., Liu, Y., Liu, Y., Yang, X., Yuan, B., Zeng, L., Huang, C., Lu, K., and Zhang, Y.: Anthropogenic monoterpenes aggravating ozone pollution, Nat. Sci. Rev., 9, nwac103, https://doi.org/10.1093/nsr/nwac103, 2022.
Wang, X., Li, L., Gong, K., Mao, J., Hu, J., Li, J., Liu, Z., Liao, H., Qiu, W., Yu, Y., Dong, H., Guo, S., Hu, M., Zeng, L., and Zhang, Y.: Modelling air quality during the EXPLORE-YRD campaign – Part I. Model performance evaluation and impacts of meteorological inputs and grid resolutions, Atmos. Environ., 246, 118131, https://doi.org/10.1016/j.atmosenv.2020.118131, 2021.
Wang, X., Yin, S., Zhang, R., Yuan, M., and Ying, Q.: Assessment of summertime O3 formation and the O3-NOx-VOC sensitivity in Zhengzhou, China using an observation-based model, Sci. Total Environ., 813, 152449, https://doi.org/10.1016/j.scitotenv.2021.152449, 2022.
Wei, C.-B., Yu, G.-H., Cao, L.-M., Han, H.-X., Xia, S.-Y., and Huang, X.-F.: Tempo-spacial variation and source apportionment of atmospheric formaldehyde in the Pearl River Delta, China, Atmos. Environ., 312, 120016, https://doi.org/10.1016/j.atmosenv.2023.120016, 2023.
Wittrock, F., Richter, A., Oetjen, H., Burrows, J. P., Kanakidou, M., Myriokefalitakis, S., Volkamer, R., Beirle, S., Platt, U., and Wagner, T.: Simultaneous global observations of glyoxal and formaldehyde from space, Geophys. Res. Lett., 33, L16804, https://doi.org/10.1029/2006gl026310, 2006.
Wu, R., Zhao, Y., Xia, S., Hu, W., Xie, F., Zhang, Y., Sun, J., Yu, H., An, J., and Wang, Y.: Reconciling the bottom-up methodology and ground measurement constraints to improve the city-scale NMVOCs emission inventory: A case study of Nanjing, China, Sci. Total Environ., 812, 152447, https://doi.org/10.1016/j.scitotenv.2021.152447, 2022.
Wu, Y., Huo, J., Yang, G., Wang, Y., Wang, L., Wu, S., Yao, L., Fu, Q., and Wang, L.: Measurement report: Production and loss of atmospheric formaldehyde at a suburban site of Shanghai in summertime, Atmos. Chem. Phys., 23, 2997–3014, https://doi.org/10.5194/acp-23-2997-2023, 2023.
Xiong, C., Wang, N., Zhou, L., Yang, F., Qiu, Y., Chen, J., Han, L., and Li, J.: Component characteristics and source apportionment of volatile organic compounds during summer and winter in downtown Chengdu, southwest China, Atmos. Environ., 258, 118485, https://doi.org/10.1016/j.atmosenv.2021.118485, 2021.
Yang, Y., Liu, B., Hua, J., Yang, T., Dai, Q., Wu, J., Feng, Y., and Hopke, P. K.: Global review of source apportionment of volatile organic compounds based on highly time-resolved data from 2015 to 2021, Environ Int, 165, 107330, https://doi.org/10.1016/j.envint.2022.107330, 2022.
Zhang, G., Wang, N., Jiang, X., and Zhao, Y.: Characterization of Ambient Volatile Organic Compounds (VOCs) in the Area Adjacent to a Petroleum Refinery in Jinan, China, Aerosol Air Qual. Res., 17, 944–950, https://doi.org/10.4209/aaqr.2016.07.0303, 2017.
Zhang, M., Zhao, C., Yang, Y., Du, Q., Shen, Y., Lin, S., Gu, D., Su, W., and Liu, C.: Modeling sensitivities of BVOCs to different versions of MEGAN emission schemes in WRF-Chem (v3.6) and its impacts over eastern China, Geosci. Model Dev., 14, 6155–6175, https://doi.org/10.5194/gmd-14-6155-2021, 2021.
Zhang, Q., Streets, D. G., Carmichael, G. R., He, K. B., Huo, H., Kannari, A., Klimont, Z., Park, I. S., Reddy, S., Fu, J. S., Chen, D., Duan, L., Lei, Y., Wang, L. T., and Yao, Z. L.: Asian emissions in 2006 for the NASA INTEX-B mission, Atmos. Chem. Phys., 9, 5131–5153, https://doi.org/10.5194/acp-9-5131-2009, 2009.
Zhao, M., Zhang, Y., Pei, C., Chen, T., Mu, J., Liu, Y., Wang, Y., Wang, W., and Xue, L.: Worsening ozone air pollution with reduced NOx and VOCs in the Pearl River Delta region in autumn 2019: Implications for national control policy in China, J. Environ. Manage., 324, 116327, https://doi.org/10.1016/j.jenvman.2022.116327, 2022.
Zheng, B., Cheng, J., Geng, G., Wang, X., Li, M., Shi, Q., Qi, J., Lei, Y., Zhang, Q., and He, K.: Mapping anthropogenic emissions in China at 1 km spatial resolution and its application in air quality modeling, Sci. Bull. (Beijing), 66, 612–620, https://doi.org/10.1016/j.scib.2020.12.008, 2021.
Zhou, B., Guo, H., Zeren, Y., Wang, Y., Lyu, X., Wang, B., and Wang, H.: An Observational Constraint of VOC Emissions for Air Quality Modeling Study in the Pearl River Delta Region, J. Geophys. Res.-Atmos., 128, e2022JD038122, https://doi.org/10.1029/2022jd038122, 2023.
Zhu, S., Kinnon, M. M., Shaffer, B. P., Samuelsen, G. S., Brouwer, J., and Dabdub, D.: An uncertainty for clean air: Air quality modeling implications of underestimating VOC emissions in urban inventories, Atmos. Environ., 211, 256–267, https://doi.org/10.1016/j.atmosenv.2019.05.019, 2019.