the Creative Commons Attribution 4.0 License.
the Creative Commons Attribution 4.0 License.
 | 21 Feb 2024
Measurement report: The Palau Atmospheric Observatory and its ozonesonde record – continuous monitoring of tropospheric composition and dynamics in the tropical western Pacific
Jordis S. Tradowsky
Peter von der Gathen
Christoph Ritter
Sharon Patris
Justus Notholt
Markus Rex
The tropical western Pacific is recognized as an important region for stratosphere–troposphere exchange but lies in a data-sparse location that had a measurement gap in the global ozone sounding network. The Palau Atmospheric Observatory (PAO, approx. 7.3∘ N, 134.5∘ E) was established to study the atmospheric composition above the remote tropical western Pacific with a comprehensive instrumental setup. Since 2016, two laboratory containers in Palau host a Fourier transform infrared spectrometer; a lidar (micro-lidar until 2016, cloud and aerosol lidar from 2018); a Pandora 2S photometer; and laboratory space for weather balloon soundings with ozone, water vapor, aerosol, and radiosondes. In this analysis, we focus on the continuous, fortnightly ozone sounding program with electrochemical concentration cell (ECC) ozonesondes.
The aim of this study is to introduce the PAO and its research potential, present the first observation of the typical seasonal cycle of tropospheric ozone in the tropical western Pacific based on a multiannual record of in situ observations, and investigate major drivers of variability and seasonal variation from January 2016 until December 2021 related to the large-scale atmospheric circulation. We present the PAO ozone (O3) volume mixing ratios (VMR) and relative humidity (RH) time series complemented by other observations.
The site is exposed to year-round high convective activity reflected in dominating low O3 VMR and high RH. In 2016, the impact of the strong El Niño is evident as a particularly dry, ozone-rich episode. The main modulator of annual tropospheric O3 variability is identified as the movement of the Intertropical Convergence Zone (ITCZ), with the lowest O3 VMR in the free troposphere during the ITCZ position north of Palau. An analysis of the relation of O3 and RH for the PAO and selected sites from the Southern Hemispheric Additional Ozonesondes (SHADOZ) network reveals three different regimes. Palau's O3 RH distribution resembles the one in Fiji, Java and American Samoa but is unique in its seasonality and its comparably narrow Gaussian distribution around low O3 VMR and the evenly distributed RH. A previously found bimodal distribution of O3 VMR and RH could not be seen for the full Palau record but only during specific seasons and years.
Due to its unique remote location, Palau is an ideal atmospheric background site to detect changes in air dynamics imprinted on the chemical composition of the tropospheric column. The efforts to establish, run and maintain the PAO have succeeded to fill an observational gap in the remote tropical western Pacific and give good prospects for ongoing operations. The ECC sonde record will be integrated into the SHADOZ database in the near future.
- Article
(12208 KB) - Full-text XML
- Companion paper
- BibTeX
- EndNote


The tropical western Pacific (TWP) is the source region of stratospheric air in boreal winter (Newell and Gould-Stewart, 1981; Fueglistaler et al., 2004; Krüger et al., 2008). Rex et al. (2014) showed that air masses entering the stratosphere in the TWP, also originate in and transit through the local troposphere. Thus, the tropospheric chemical composition above the TWP influences the stratospheric composition on a global scale. The tropospheric composition above the Pacific island state Republic of Palau (also Belau), located in the remote TWP, is determined by the unique local air chemistry within the global tropospheric O3 minimum and the complex interplay of general circulation patterns characterizing the region, such as the Hadley, Walker and Monsoon circulations (Fig. 1). The remote TWP is far from human industrial activities and essentially devoid of major air pollution, particularly from NOx, leading to the globally lowest tropospheric O3 columns year-round (e.g., Thompson et al., 2003b; Rex et al., 2014; Müller et al., 2023). A corresponding OH minimum prolongs lifetimes of various chemical species and thus enables their enhanced transport into the stratosphere (Rex et al., 2014). Locally dominant marine convection and vertical mixing as well as transport of ozone-precursor-free air masses with the trade winds from the east, i.e., from the vast Pacific Ocean, foster the clean background state of the troposphere throughout the year. However, air mass transport from remote, polluted locations to the TWP tied to dynamical variations introduces disturbances in the otherwise humid, ozone-poor tropospheric column (Anderson et al., 2016; Müller et al., 2023). Hence, long-term monitoring of various chemical components above Palau can provide insights into dynamical changes in this region with O3 and water vapor (H2O) being particularly valuable tracers.
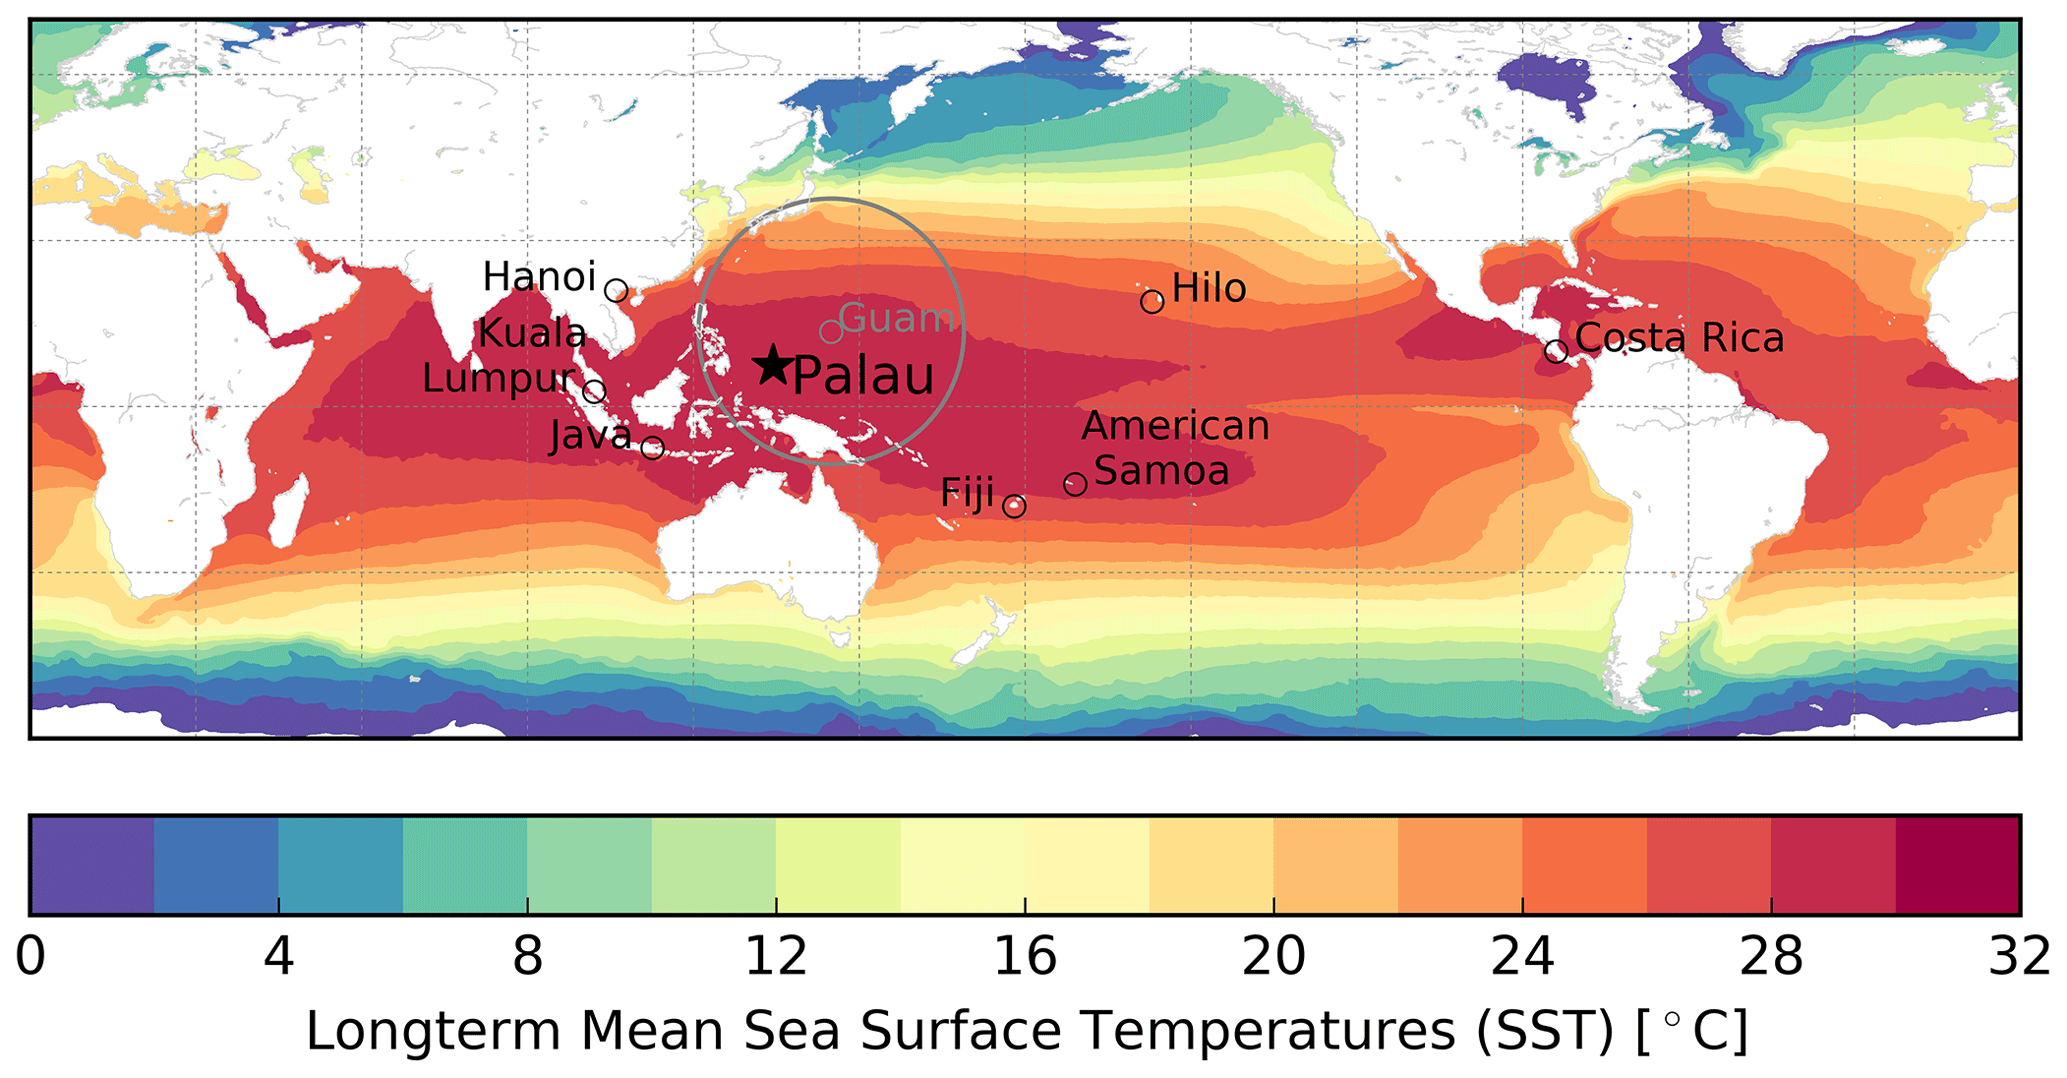
Figure 1Location of Palau (black star), selected SHADOZ sites (black circle; see Table 1) and CONTRAST campaign domain around the air base in Guam (grey circle). Long-term mean sea surface temperatures (SSTs, in ∘C) derived from monthly ERA5 data from 1959–2021 show the location of the global warm pool area (Hersbach et al., 2020; ECMWF, 2022).
The Palau Atmospheric Observatory (PAO, 7.3420∘ N, 134.4722∘ E, 23 m a.s.l.) was established on the grounds of the Palau Community College (PCC) in downtown Koror in 2015 to observe and study the atmosphere above the TWP. It is equipped with a comprehensive instrumental setup, which was originally supplied through the EU-funded StratoClim (Stratospheric and upper tropospheric processes for better Climate predictions, 2015–2019) project. Since 2019 the PAO continues operations as a measurement site run by the Alfred Wegener Institute (AWI) with further contributions from the Institute of Environmental Physics (IUP), University of Bremen. Two laboratory containers host a Fourier transform infrared (FTIR) spectrometer; a lidar (micro-lidar until 2016, cloud and aerosol lidar from 2018 onwards); a Pandora 2S photometer; and laboratory space for weather balloon soundings with ozone (O3), water vapor (H2O), aerosol, and radiosondes (Fig. 2). In particular, the ozone sounding program with electrochemical concentration cell (ECC) ozonesondes has been successfully running fortnightly soundings with only minor interruptions since the beginning of 2016. The timelines of all measurements are summarized in Fig. 3. Convective mixing and washout are dominant modulators of the local air composition due to Palau's location in the global warm pool characterized by the highest sea surface temperatures (SSTs) globally (see Fig. 1). High-energy convection accompanies the upwelling branches of global atmospheric circulation patterns, which are following the seasonal movement of the Intertropical Convergence Zone (ITCZ). Rainfall rates are highest during the Western Pacific Monsoon between July and October and lowest during boreal spring but compared to other tropical locations the dry season is less pronounced (Australian Bureau of Meteorology and CSIRO, 2014; Miles et al., 2020). Palau's climate is thus specifically affected by the position of the ITCZ, the South Pacific Convergence Zone (SPCZ), the Western Pacific Monsoon and the trade winds. Relevant subseasonal and interannual variations are the Madden–Julian Oscillation (MJO), the El Niño–Southern Oscillation (ENSO) and the Quasi-Biennial Oscillation (QBO). The importance of the TWP for global ozone chemistry lies within the interplay of circulation patterns in the upper troposphere–lower stratosphere (UTLS), i.e., the tropospheric circulation causing strong upward motion of air and the stratospheric Brewer–Dobson circulation which lifts the air further into the stratosphere where it is then transported polewards (Holton et al., 1995). Around 16 km altitude, in the Tropical Tropopause Layer (TTL), mass fluxes in the Brewer–Dobson circulation become comparable to those in the Hadley circulation (e.g., Folkins, 2002; Pan et al., 2014). The Brewer–Dobson circulation lifts and cools the thermal tropopause when it is strongest during boreal winter (Fueglistaler et al., 2009). O3 VMR in the TTL is controlled by several overlapping processes, i.e., the dominating, slow radiatively driven ascent; the onset of stratospheric photo-chemical in situ production; and the meridional mixing of air from the extratropical lower stratosphere. The TTL, as defined by Fueglistaler et al. (2009), has its globally lowest temperatures in this geographic region. It controls final dehydration of air masses and thus stratospheric H2O, a driver of important O3 loss cycles in the stratosphere (e.g., Randel and Jensen, 2013). A dynamically driven seasonal cycle of O3 in the TTL in turn influences TTL temperatures (Randel et al., 2007). The coupling between ENSO and the Quasi-Biennial Oscillation (QBO) is a main driver of interannual variability of both O3 and H2O in the TTL (e.g., Garfinkel and Hartmann, 2007; Taguchi, 2010; Diallo et al., 2018).
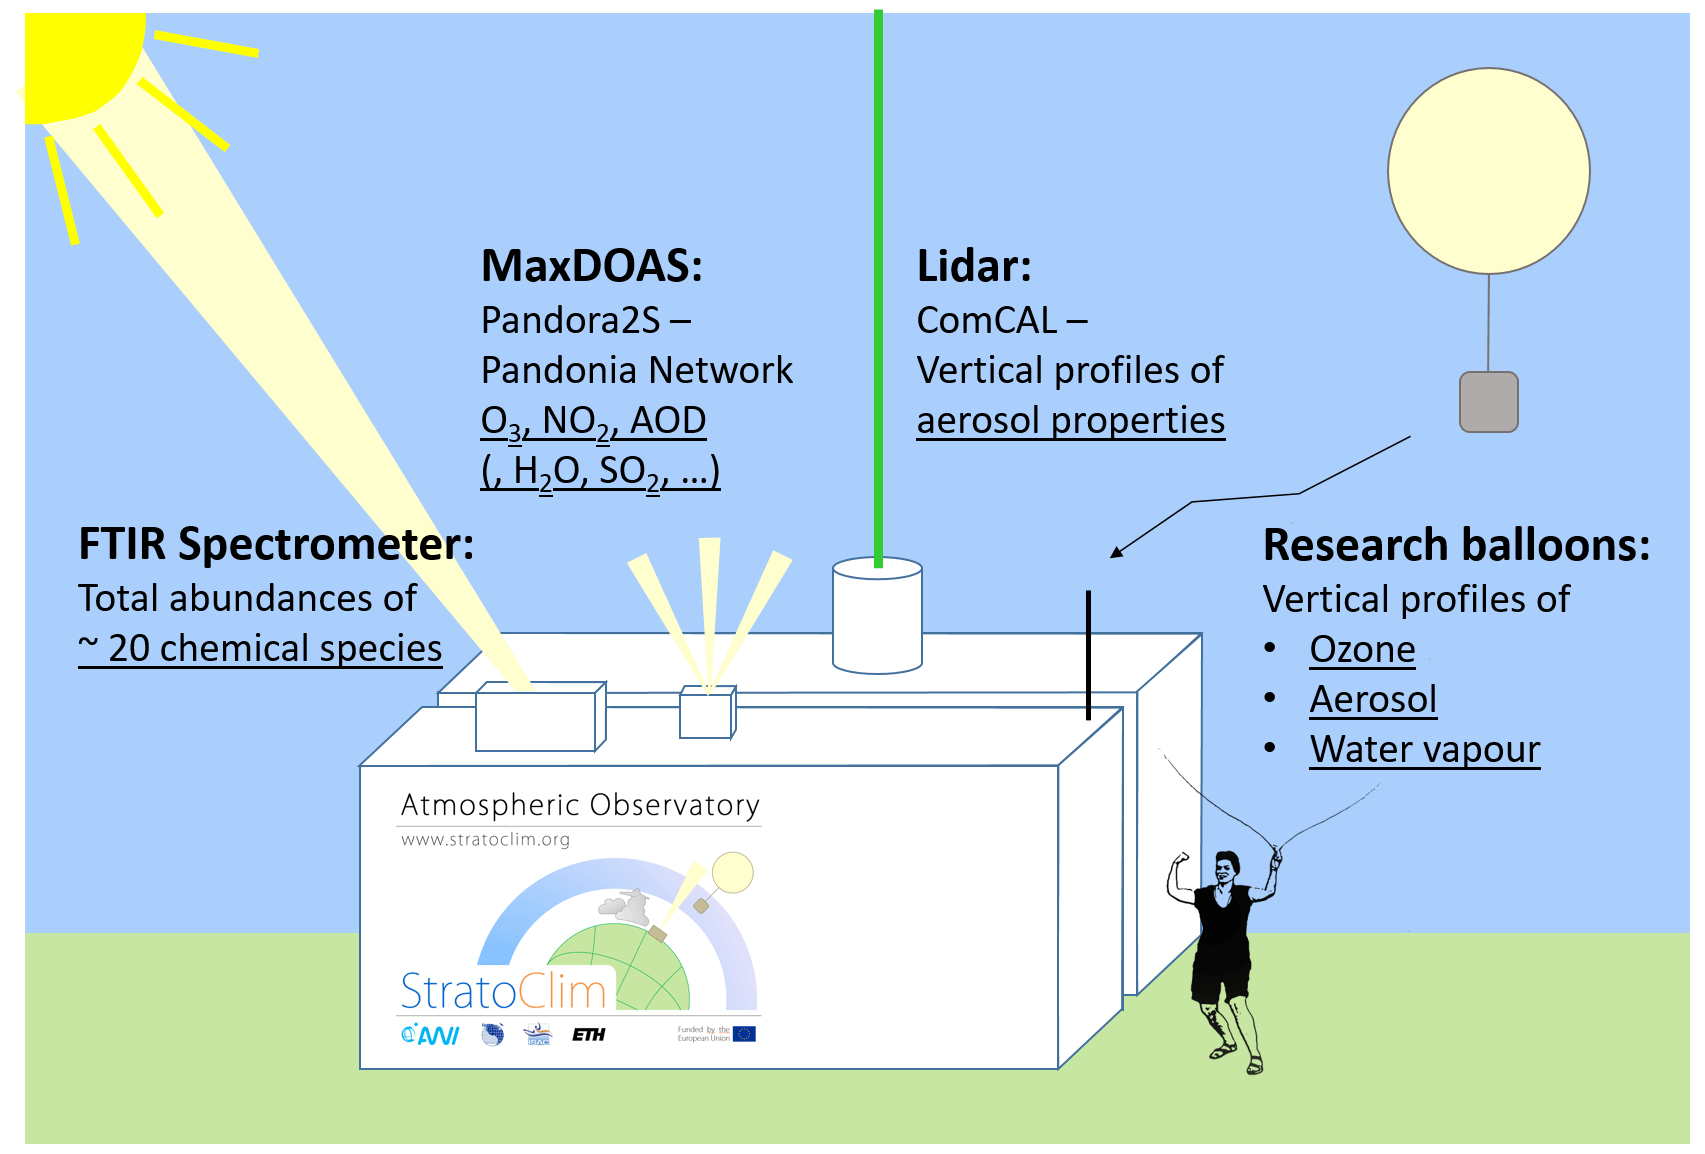
Figure 2The current instrumental setup at the Palau Atmospheric Observatory in two adjacent laboratory containers. The MaxDOAS instrument Pandora2S is not discussed here. The micro-lidar deployed in 2016 is not shown and was mounted on top of the front container.
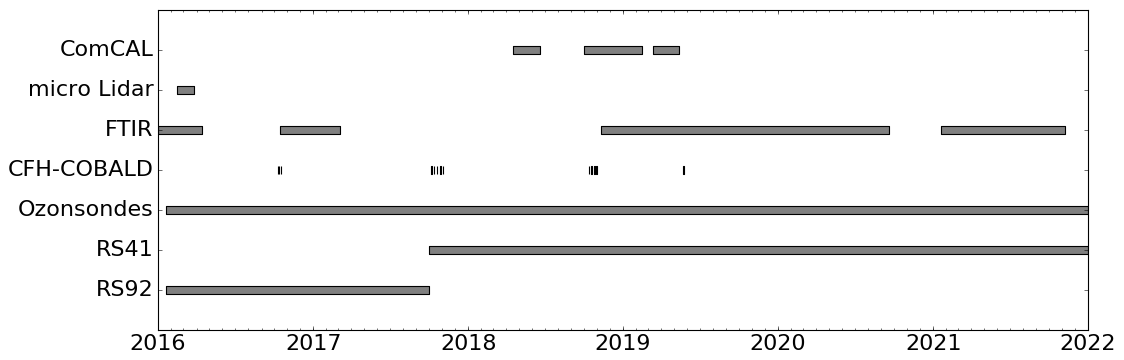
Figure 3Timeline of the measurements performed in Palau using different instruments. Electrochemical concentration cell (ECC) ozonesondes have been launched bi-weekly or more frequently during campaigns. The accompanying radiosonde model was switched from Vaisala RS92 to RS41 in October 2017. Cryogenic frostpoint hygrometers (CFHs) and compact optical backscatter and aerosol lidar detector (COBALD) sondes were launched together with ECC sondes 13 times during campaigns. The Fourier transform infrared (FTIR) spectrometer has been deployed with some interruptions. The Italian micro-lidar ran only in spring 2016, while the compact cloud aerosol lidar (ComCAL) system was installed in 2018.
Balloon-borne measurements with electrochemical concentration cell (ECC) ozonesondes are the most practical way to observe O3 in situ, especially at more remote sites (e.g., Thompson et al., 2019). The highly vertically resolved ozonesonde measurements provide a priori profiles for many remote sensing techniques including microwave and FTIR instruments which are either ground-based or on satellites (e.g., Vigouroux et al., 2008; Hubert et al., 2016). The ECC sonde measurement technique itself is being continuously validated to yield an overall accuracy of 5 %–15 % in the troposphere if standard operating procedures (SOP) (Smit et al., 2007; Thompson et al., 2019; Smit et al., 2021) are followed carefully. The latter is especially important in the tropics, where the instrumental uncertainty is highest in the TTL and critically dependent on the so-called background current (see also Smit and the ASOPOS Panel, 2014; Rex et al., 2014; Vömel et al., 2020). Reports of near-zero O3 concentrations in the upper troposphere (UT) of the TWP (Kley et al., 1996; Rex et al., 2014) depend on the details of the background current correction in the data set, which limits the detection limit of the sondes under these conditions (Vömel and Diaz, 2010; Rex et al., 2014; Newton et al., 2016).
The latest large campaign conducted in the TWP assessing the tropospheric O3 column took place during the CONTRAST/CAST (Convective Transport of Active Species in the Tropics/Coordinated Airborne Studies in the Tropics) project in January–February 2014 (Pan et al., 2017). Besides ground-based operations, CONTRAST research aircraft were deployed from an air base in Guam (see Fig. 1), providing a variety of in situ measurements. Apart from various major research campaigns on air chemistry in the TWP since the 1980s (e.g., overview in Müller, 2020), mainly the SHADOZ (Southern Hemispheric Additional Ozonesondes) network has been providing regular high-quality monitoring of O3 in the tropics since 1998 (Thompson et al., 2003a, b, 2007, 2011, 2012, 2017; Witte et al., 2017, 2018).
As there was no long-term site located in the vicinity of Palau prior to the establishment of the PAO, the TWP constituted a gap in the international O3 sounding network (see also https://woudc.org/data/stations/, last access: 8 January 2024). However, a long-term data record of tropospheric composition in the TWP is required to assess annual and inter-annual variability. To fill this gap, we present the growing record of O3 profiles and additional atmospheric variables measured at PAO.
Our overall objective is to survey the potential of measurements obtained at the PAO to explain the air composition and driving meteorological and chemical processes in the TWP. We introduce the PAO and its measurement record from January 2016 until December 2021. After an overview of the instrumental setup we focus on the tropospheric O3 profiles measured by ECC ozonesondes in order to assess dynamical influences on the TWP air composition and their seasonality. We investigate the wind patterns during the time frame of presented observations from PAO by including additional ground station data. By comparing the Palau tropospheric O3 time series with observations from selected SHADOZ stations and from the CONTRAST campaign, we examine the regional importance of the PAO to monitor the variability of the tropospheric circulation in the TWP.
2.1 Balloon-borne observations: ECC ozonesondes and radiosondes
We present the PAO data record of ECC ozonesondes from 21 January 2016 until 31 December 2021 with 198 fortnightly balloon soundings (Müller et al., 2022). At least one intensive campaign with several launches a week took place every year, except during 2020 and 2021, when this was not feasible due to the COVID-19 pandemic. Most soundings were conducted during daytime, typically around midday, however, not at a fixed hour. A total of 17 night-time launches during campaigns were performed with additional use of cryogenic frostpoint hygrometers (CFHs) and compact optical backscatter and aerosol lidar detector (COBALD) sondes and/or coinciding measurements with the Compact Cloud and Aerosol Lidar (ComCAL) (Figs. 2, 3). In this study, no differentiation between daytime and night-time profiles was made, as we assume no significant diurnal cycle for O3 and RH within the tropospheric column.
The quality of observations has been monitored closely throughout the full measurement period. Personnel from the local Coral Reef Research Foundation (CRRF) have been trained to perform the fortnightly soundings, ensuring a high standard. In anticipation of the seasonality of the tropospheric O3 minimum, intensive campaigns were planned and conducted in fall and spring. The interannual persistence and year-round existence of the tropospheric O3 minimum in the TWP was already suggested by satellite observations (see Rex et al., 2014) and is now confirmed using in situ measurements collected at the PAO.
Developed in the 1960s (Komhyr, 1969), the basic electrochemical measurement principle of ECC ozonesondes and the related equations are still in use. Ambient air is pumped through an aqueous potassium iodide (KI) sensing solution (cathode) in a Teflon cell by a small gas sampling pump. In a redox reaction all sampled O3 is converted to iodine, which itself is reduced back to iodide in contact with a platinum electrode. The cathode cell is attached, via an ion bridge, to an anode cell filled with a saturated KI solution. The generated electrical current Im (µA) in the external circuit connecting the cells, corrected for a residual background current Ib, is directly proportional to the partial pressure of O3 (), calculated by
with R as the universal gas constant, F as the Faraday constant (factor 2 accounts for the stoichiometry, i.e., 2e− per O3 molecule), ηC≈1 as a factor for the conversion efficiency, Tpump (K) as the pump temperature, fpump (cm3 s−1) as the gas volume flow rate and finally cpumpcorr as an empirical correction factor for the pump efficiency depending on pressure (see Table A1, for details on corrections).
Experiments conducted at the PAO led to the decision to use the pressure-dependent background current correction for the calculation of O3 VMR in the data set used within this study and the companion study by Müller et al. (2023). Thus, the measured background current Ib,m is adjusted as follows:
with p as ambient pressure in hPa; p0 as ground pressure in hPa; and constants a0=0.001225, a1=0.00012411, and in accordance with recommendations by the manufacturer.
Müller (2020) presents the development, status and preliminary results of a device attachable to regular ECC sondes that measures the background current in flight. The device enables time-controlled intermissions by switching from a measurement of ozone in the ambient air to measurements using ozone-free air. The ozone-free measurement periods in modified ECC sondes launches in Palau and Ny-Ålesund support the application of a pressure-dependent background current correction to the raw tropospheric signal despite no physical dependency on pressure or O2.
However, the background current in general is a topic of current research (Smit et al., 2021). Recent publications by Vömel et al. (2020), Tarasick et al. (2021) and Smit et al. (2024) support the theory of an origin of the background current in the secondary, slow time response of the sensor. They suggest new methods of correction, which will be investigated for the PAO time series in future studies. For now, the pressure-dependent correction as a compromise results in O3 VMR closer to no correction applied, whereas a constant correction would yield physically unrealistic low values, which is particularly important at minimum O3 levels between 10 and 13 km altitude (see Fig. A1 in the Appendix).
The assessment of potential near-zero O3 measurements in the TWP and the scientific discussion on that topic (e.g., Smit and the ASOPOS Panel, 2014; Rex et al., 2014; Vömel and Diaz, 2010; Newton et al., 2016) demanded a particular focus on ensuring the high-quality of the equipment and attention to detail during all steps required for generating the PAO data record, including the pre-flight preparations of the sonde and the post-processing of the raw signal. The Assessment of Standard Operating Procedures for Ozonesondes (ASOPOS), an international consortium of ozonesonde experts established under the umbrella of the WMO's Global Atmosphere Watch (GAW) program has put together a reference for standard operating procedures (SOP) based on extensive assessments (GAW Report 201; Smit and the ASOPOS Panel, 2014, updated in Smit et al., 2021). The GAW recommendations for our sonde model, type 6A manufactured by Science Pump Corporation (SPC), have been carefully followed with the exception of the background current correction method and are summarized in Table A1. With regard to the background current correction, Smit et al. (2021) advise stations to stay with their established method until further notice.
Preparation of the ECC sondes according to SOP is done in two steps, the first step 3 to 30 d before launch, and a second preparation within 24 h before the launch, usually on the launch day. In Palau, the preparation and storage in between take place inside an air-conditioned and dehumidified lab container, providing a stable environment with temperatures around 25 ∘C and RH around 40 %. All parameters measured during preparations are documented and available as metadata. Raw pump current measurements during flight are available to readers upon request in addition to the Vaisala software output files and sounding data in NASA Ames format. Data presented here have been calculated from raw data with specifically developed software (using Eq. 1 and corrections summarized in Table A1).
Vaisala radiosondes were used for data transmission; to measure pressure, temperature, and tropospheric humidity; and to provide the GPS coordinates. The RS92-SGP model and its interface to the ECC sonde was used until October 2017 (see Dirksen et al., 2014, for technical details and quality assessment). Thereafter, the ground receiving unit and software were switched to facilitate use of Vaisala's new standard radiosonde RS41-SGP (Vaisala, 2017; Sun et al., 2019). In support of international efforts to assess differences between the old and new radiosondes (for example, by the Global Climate Observing System Reference Upper-Air Network, GRUAN), four dual soundings with both radiosonde types, RS92 and RS41, were conducted in spring 2018 (Dirksen et al., 2020). We expect no major impact due to this change regarding the tropospheric O3 monitoring. However, the RH measurements show significant differences, particularly in the upper troposphere, which will be investigated in the future.
The new RS41 radiosondes facilitate monitoring of the ECC sonde voltage and motor current. First measurements with the new RS41 revealed suspected performance issues of ECC sonde wet cell batteries, which were then replaced with dry batteries. Comparison with satellite observations from Aura MLS (Microwave Limb Sounder; Froidevaux et al., 2008, not shown here) reveal discrepancies in stratospheric O3 observations for around 20 % of soundings in the data set. At pressure levels below 20 hPa (altitudes above the 20 hPa level), the affected ozonesondes measured 1–2 ppm less O3 (10 %–20 %) than the average of five satellite measurements of the nearest overpass. Monitoring of the pump temperatures yields no explanation for these differences. An early drop of the wet cell battery voltage would be a possible cause, but as the battery voltage was not monitored with RS92 radiosondes, clarification of this effect is not possible. We assume no impact on the tropospheric profiles below 20 km and advise to be cautious of this effect when using the time series for either total column or stratospheric O3 assessment.
2.2 Balloon-borne observations: water vapor and aerosol sondes
As stratospheric water vapor controls the radiative budget of the stratosphere and has great impact on global warming (e.g., Riese et al., 2012; Solomon et al., 2010), the growing PAO record of CFH soundings can be relevant in monitoring and assessing the variability of this important quantity (upload to a repository providing a DOI for the data in preparation). The 17 measurements with CFH sondes by Environmental Science (EN-SCI) were performed from 2016–2019 (see Sect. 2.1 and Fig. 3) in combination with ECC and COBALD sondes. The CFH instruments use a chilled-mirror principle to detect water vapor up to 28 km altitude with an uncertainty below 10 % (Vömel et al., 2007, 2016). The COBALD technique by MyLab, Switzerland, enables measurement of aerosol backscatter at two optical wavelengths, 455 nm (visible blue) and 940 nm (infrared), and thus detection of cirrus clouds and aerosol layers in the TTL (e.g., Brunamonti et al., 2018). COBALD requires launches after dark, which determined the combined ECC-CFH-COBALD launches to be at night-time. COBALD deployment has been in cooperation with the ETH Zurich, where the sonde was developed based on an original setup by Rosen and Kjome (1991). The combined soundings of CFH and COBALD are an excellent in situ validation for the ComCAL lidar measurements, which will be subject of upcoming studies. Note that RH measurements used in this study are solely from radio soundings and not from CFH sondes.
2.3 Fourier transform infrared (FTIR) spectrometer
The solar absorption spectrometry has been established as a powerful tool to study the composition of the atmosphere. Using the sun as an external light source allows to measure the concentrations of about 30 trace gases in the atmosphere. Besides the total column data, the analysis of the spectral line shape enables retrieval of the concentration profiles in about 2–4 atmospheric layers up to 30 km. The PAO is equipped with the Bruker 120 M mobile high-resolution Fourier transform infrared (FTIR) spectrometer (Notholt et al., 2000). The solar tracker is mounted on the top of the hosting container. If weather conditions permit (no clouds, sunny), the dome opens, the solar tracker follows the Sun and spectra are recorded. O3 is measured around 2000 cm−1 at a resolution of 0.005 cm−1. Measurement times for individual scans are about 2–5 min. The retrieval is performed using SFIT4, a code based on the optimal estimation method (Hannigan et al., 2022). O3 can be retrieved at about four independent layers between the surface and about 30 km.
In addition, many other trace gases show absorption features in the measured spectra, like CH4, CO, OCS, CH2O, HCN, C2H6 and N2O. Currently the instrument is modified to cover also the longwave infrared region, allowing a better retrieval of O3 and studying other trace gases, like HNO3.
2.4 Compact cloud aerosol lidar (ComCAL)
The “Compact Cloud Aerosol Lidar” (ComCAL) deployed at the PAO since 2018 was originally designed in 2006 (Immler et al., 2006) and is hosted in its own laboratory container. As a multi-wavelength lidar system capable of observing aerosol and cloud particle backscatter, extinction and depolarization, it superseded the previously installed micro-lidar installed in the first laboratory container, measuring only in spring 2016 (see Cairo et al., 2021 and Fig. 3). The ComCAL consists in its current configuration of flash lamp pumped Nd:YAG laser from Quantel Brilliant with 20 Hz and an energy of 120, 180 and 65 mJ for the three colors of 355, 532 and 1064 nm, respectively. The recording telescope is a 40 cm Newton with 1200 mm focal length and 1 mm field stop (0.83 mrad field of view). The signals are detected by Hamamatsu photomultipliers for all colors, except for 1064 nm, for which a Licel APD is employed. The transient recorders are also from Licel (12 bit, 20 MHz) and collect the signals in both photo counting and analog mode. The depolarization is measured at 355 and 532 nm by using a Glen–Taylor prism in the detection branch that is coupled to the laser. Hence, the lidar profiles parallel (“p”) and perpendicular (“s”) to the laser are recorded alternately by the same photomultipliers. This configuration facilitates the calibration of the depolarization; however, as the “s” signals perpendicular to the laser polarization are generally weak, the signal-to-noise ratio is lower for the “s” polarization compared to the “p” signals.
Using a monostatic design (same optical axis for laser and recording telescope) valid data are obtained above 500 m altitude. Lidar data are stored with a resolution of around 2 min (1200 laser shots) and 7.5 m. The evaluation is done according to Klett (1985) and Ansmann et al. (1992), typically with 10 min and 60 m resolution. The particle extinction is measured by the inelastic Raman scattering of N2 at 387 nm. With a resolution of 2 h and 60 m during night-time typically a signal-to-noise ratio of about 10 is found for this Raman channel in approximately 6 km altitude. In summary, the ComCAL lidar is capable to track aerosol layers even in the UTLS region, as well as subvisible or optically thin cirrus, at least concerning the backscatter coefficient and the depolarization. Hence, analyses of cloud properties as outlined by Cairo et al. (2021) are feasible. Moreover, the system shall be used in conjunction with the balloon-borne soundings at the PAO to gain more information about the TTL, e.g., to what extent clouds and aerosol layers may be related to features in temperature, RH, or O3 concentration.
2.5 Auxiliary data (Palau weather station, SHADOZ)
Located 800 m southwest of the PAO on a slope on the same island, the US National Weather Service and NOAA operate a general weather station (PTRO 91408) with twice daily radio soundings. In August 2018, the launch site was switched to a location further away (∼ 8 km) in Airai, next to the Palau International Airport. With relocation, the used radiosonde model was changed from a Lockheed Martin LMS-06 to a Vaisala RS41-NG.
As a tropical station the PAO shares technical challenges and certain atmospheric characteristics with O3 measurement stations assembled in the SHADOZ network (e.g., Thompson et al., 2003a, b, 2007, 2011, 2019). Since 1998, SHADOZ fills observational gaps in the ozonesonde record of the Southern Hemisphere and the tropics by providing consistent data from remote tropical and subtropical sites. To embed our O3 profile observations in a larger geographical context, we include data from selected SHADOZ stations in our analysis (see Fig. 1 and Table 1). The SHADOZ data version 6 is used in this study and incorporates a reprocessing of all data according to state-of-the-art procedures (see Smit and O3S-DQA Panel, 2012; Deshler et al., 2017; Witte et al., 2017; Thompson et al., 2017; Witte et al., 2018; https://tropo.gsfc.nasa.gov/shadoz/Archive.html, last access: 8 January 2024).
Table 1SHADOZ stations and respective time record used in this paper, with distance as the crow flies to Palau; see Fig. 1, compare, e.g., Thompson et al. (2012).
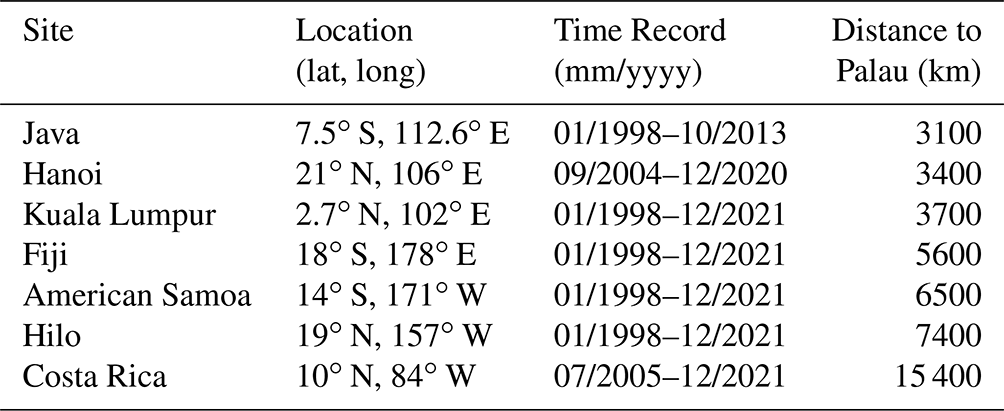
The latest JOSIE campaign (Juelich Ozone Sonde Intercomparison Experiment) was dedicated to tropical stations and their particular challenges and confirmed the high quality of methods and operating procedures used within SHADOZ (Thompson et al., 2019). In terms of common characteristics in free-tropospheric and TTL ozone, the SHADOZ stations can be divided into several groups: the western Pacific Ocean and eastern Indian Ocean (Kuala Lumpur, Java, Fiji, American Samoa), the equatorial Americas (San Cristóbal, Costa Rica, Paramaribo), the subtropics (Hanoi, Hilo, Irene, Réunion), and the Atlantic Ocean and Africa (Natal, Ascension, Cotonou, Nairobi) (Thompson et al., 2012). More recently, Thompson et al. (2021) also used these distinct characteristics to calculate regional ozone trends from SHADOZ data. We focus our comparison on the four western Pacific stations. In addition, Hanoi, being the second-closest SHADOZ station; Costa Rica, located at a similar latitude; and Hilo, as another Pacific station north of the Equator, are considered (compare Table 1). Differences in radiosonde or ECC sensor model are not assessed in this study and might influence the results (see Table 2 in Thompson et al., 2019).
We present the PAO time series of ECC ozone and radiosoundings from 2016 until 2021 and accompanying measurements of other parameters. First, the local tropospheric variability is discussed in the context of global circulation patterns. Then, the PAO data are compared to measurements from selected SHADOZ sites and from the CONTRAST campaign to highlight the regional relevance.
3.1 Local tropospheric O3 variability
Figure 4 shows time series of O3 VMR and RH measured above Palau from 2016 until 2021 as time–height cross-sections in the geopotential height range from 0–20 km. To provide context, the Multivariate ENSO Index (MEI; Wolter and Timlin, 2011; NOAA, 2023) is shown in Fig. 4c, with positive MEI indicating El Niño events and negative MEI indicating La Niña conditions. Arrows at the top of Fig. 4a and b indicate the launch times of ozonesondes and radiosondes at PAO. For the plot the data was time interpolated between the next measurements. If no sonde launch was conducted for more than 20 d, a gap is visible in the time series plot. The tropospheric ozone VMR are lowest from July to October (< 30 ppb) and peak in Northern Hemispheric spring (20–100 ppb). The boundary layer (0–2 km) is generally very humid and ozone poor, mostly > 80 % RH and < 20 ppb O3 VMR. In the mid-troposphere (2–14 km) greater differences throughout the year occur for both O3 and RH (from < 10 % to > 90 %). The pronounced anti-correlation of O3 and RH at these altitudes can be used to determine the origin of air masses (Müller et al., 2023).
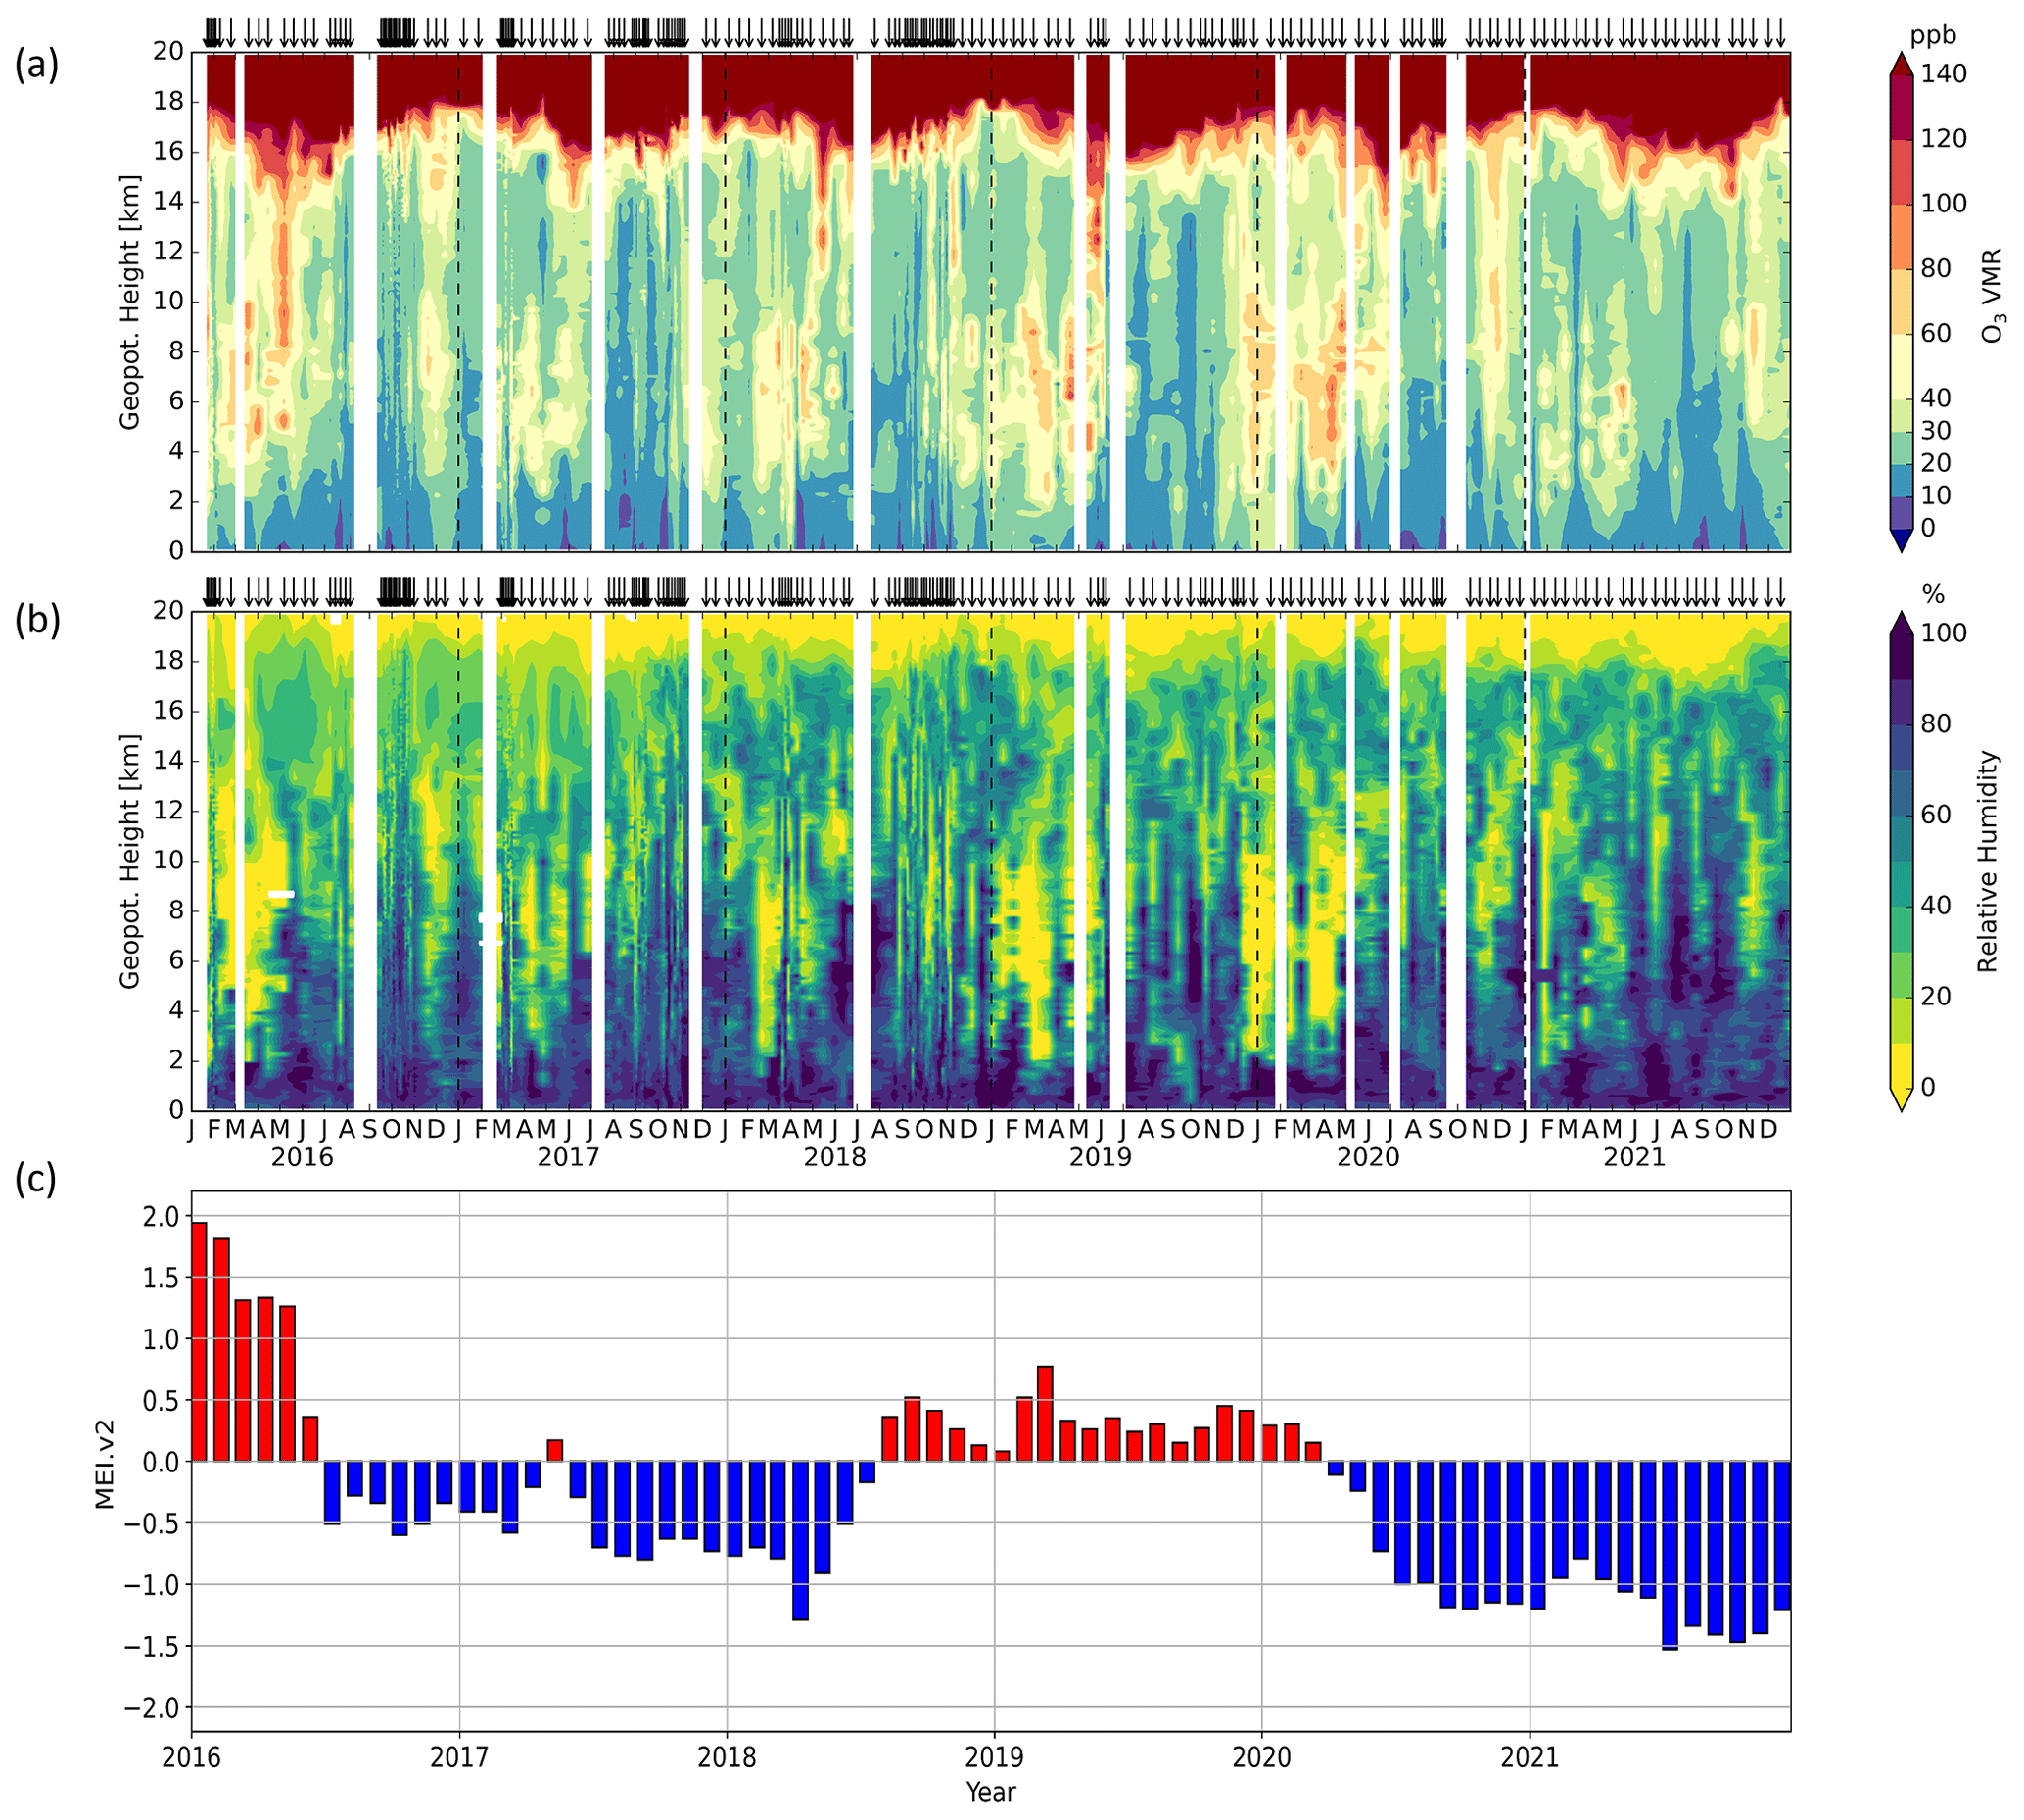
Figure 4Time–height cross-sections of (a) ozone (O3) volume mixing ratio, (b) relative humidity (RH) (with respect to liquid water) and (c) multivariate ENSO index (MEI) from 2016 to 2021. The O3 and RH measurements have been performed at the PAO. The ENSO Index data are provided by NOAA (https://psl.noaa.gov/enso/mei/, last access: 1 December 2023) (NOAA, 2023; Wolter and Timlin, 2011).
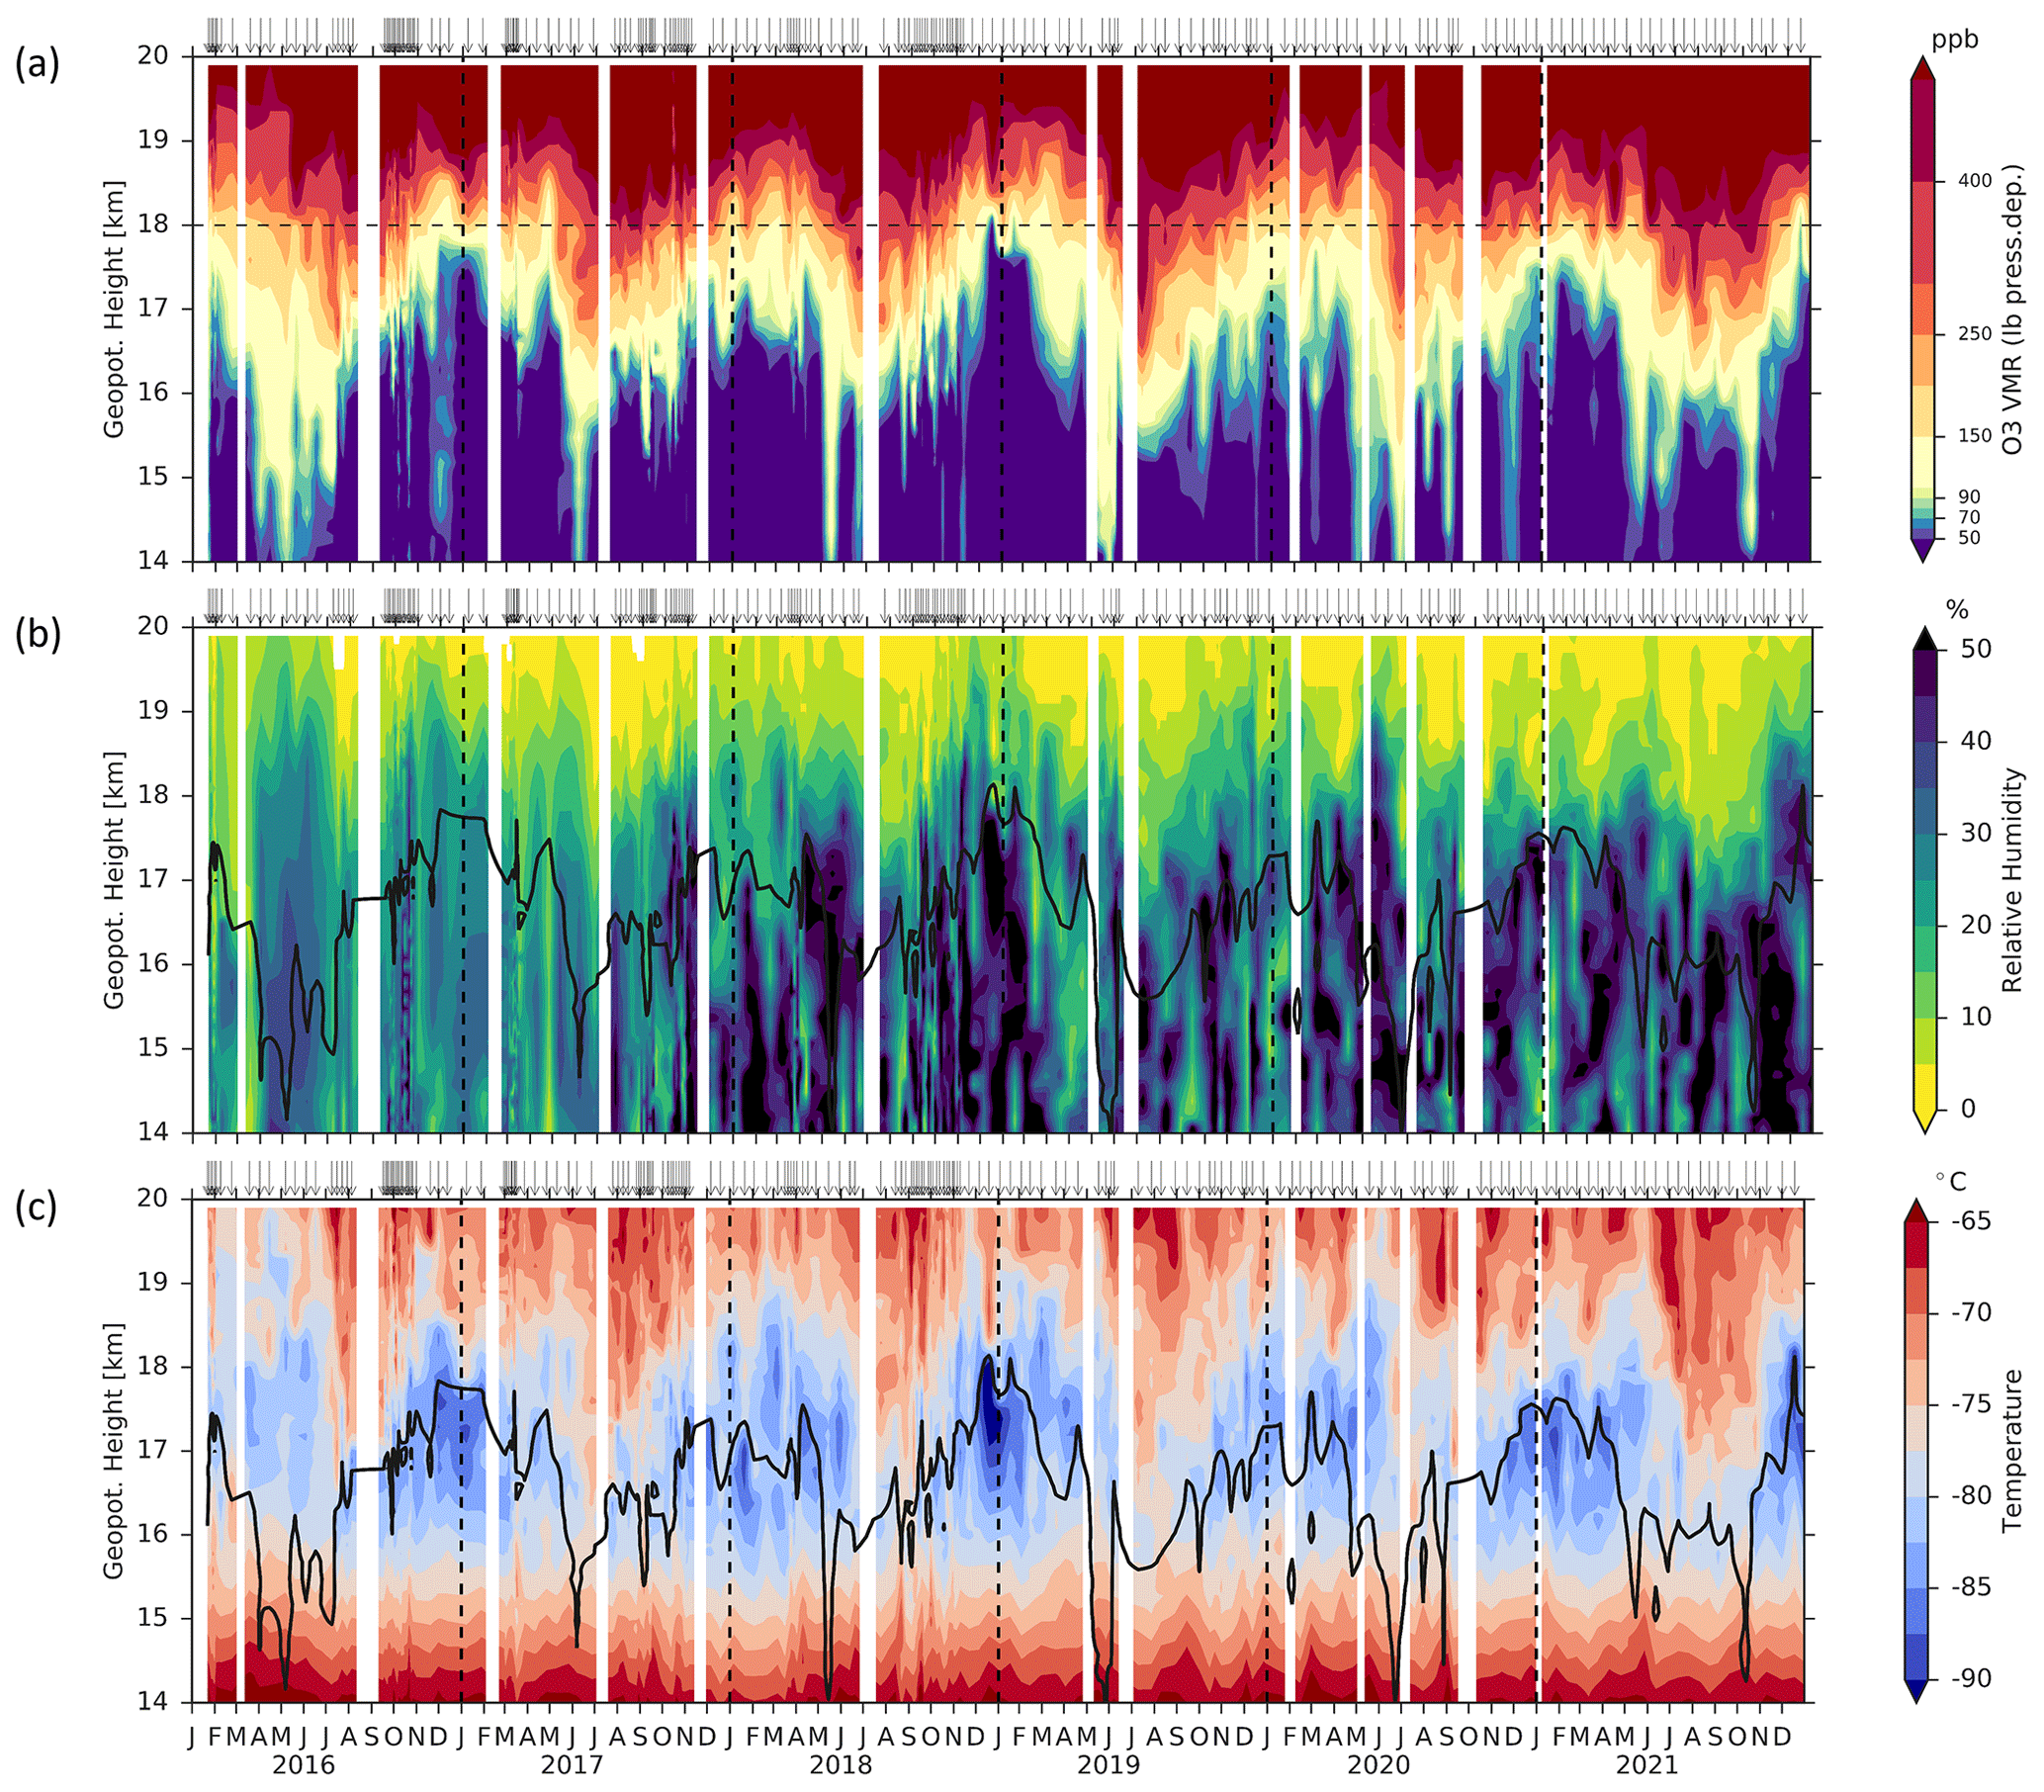
Figure 5The same as panels (a), (b) and (c) of Fig. 4 but only for the geopotential height range from 14–20 km. The solid black line in (b) and (c) denotes the ozonopause, defined as O3 VMR observations of 90 ppb (linearly interpolated) after Prather et al. (2011).The dashed horizontal black line in (a) at 18 km highlights a prominent layer of the annual cycle as visualized in Fig. 6e.
Figure 5 shows the O3 VMR, RH (with respect to liquid water) and the temperature in the geopotential height range from 14–20 km in the UTLS in more detail. The evolution of the humidity profile at these altitudes clearly shows the change in radiosonde instrumentation which took place in 2017 when the Vaisala RS92 was replaced with its successor, the RS41, which tends to report higher relative humidity values in the UTLS. Generally, the TTL composition is modulated by the seasonality of the Brewer–Dobson circulation and the changing position of the ITCZ, which is shifting the Hadley circulation northwards and southwards over the course of the year. O3 VMR range from roughly 20–150 ppb at approx. 16 km, which can be related to both variability in tropopause height and uplift of ozone-poor air masses in active convection. RH varies from 0 % to > 50 %. Day-to-day variability seems to play a strong role in TTL RH variability, particularly below around 16 km.
The overall variability of O3 VMR in the tropospheric column above Palau seen in Fig. 4 can be largely explained by annual variations of the large-scale circulation (compare Müller et al., 2023). Besides the overall high convective activity in the TWP warm pool, Palau's climate is governed by trade winds, the position of the ITCZ and the Western Pacific Monsoon.
Interannual variations of the chemical air composition above the TWP are tied to ENSO (e.g., Shiotani, 1992; Gettelman and Forster, 2002; Smith et al., 2012). The PAO data record starts during the strong El Niño event in 2016 (e.g., Huang et al., 2016; Diallo et al., 2018), which can be seen from the Multivariate ENSO index in Fig. 4. The index shows a return to neutral conditions in May–June of 2016. The years 2017 and 2018 were governed by moderate La Niña events. A weak El Niño in 2018–2019 was followed by a longer and stronger La Niña phase that lasted into 2023. Since mid-2023 El Niño conditions have been occurring. In the following, we focus on the prominent El Niño event of 2016. A longer time series will eventually allow investigation of the full ENSO variability.
In analogy to the impact of the strong 1997–1998 El Niño, Palau experienced a drought during spring 2016 with critically low water reserves on the island (Di Liberto, 2016; Polhemus, 2017). During El Niño, the warm pool shifts towards the central Pacific and the TWP experiences negative SST anomalies and positive anomalies of outgoing longwave radiation along with a weakening of the trade winds, leading to suppressed convection and decreased cloud coverage and precipitation. Our measured time series reveals clear corresponding characteristics during this time period, i.e., an unusual dry and ozone-rich mid-troposphere (Fig. 4) and a weaker vertical gradient in O3 VMR over the whole TTL, with enhanced O3 levels in the upper troposphere (UT) below the cold point tropopause and decreased O3 in the lower stratosphere (LS) above 18 km (Fig. 4).
Less uplift of ozone-poor boundary layer air and less washout of O3 precursors due to the strong El Niño event can explain the high mid-tropospheric and UT O3 VMR between March and July 2016 above Palau. Individual observations of higher than average O3 in the UT are made every year during this season and are visible as tongue-like features in Fig. 4a. Decreased LS O3 VMR, as can be seen in Fig. 5a at the start of the time series, have been documented as a zonal El Niño response by different studies and are attributed to enhanced tropical upwelling (e.g., Randel et al., 2009; Konopka et al., 2016; Diallo et al., 2018).
Figure 5b–c show the ozonopause, defined here as the level of 90 ppb O3 VMR following Prather et al. (2011), as a solid black line relating the TTL O3 seasonality to photo-chemical processes. The ozonopause generally follows the temperature cycle with a maximum in winter, when the thermal tropopause is coldest and reaches its maximum altitude. In spring and early summer 2016, it differs clearly from the unusual cold thermal tropopause (Fig. 5c). This TTL temperature anomaly has been associated with El Niño events by various studies (e.g., Kiladis et al., 2001; Randel and Thompson, 2011; Paulik and Birner, 2012). LS water vapor levels are higher during this period compared to the following years. This will be assessed more thoroughly in a future study deploying the PAO data record from CFH soundings, which does not include the inhomogeneity in the RH data record shown here caused by the change in radiosonde models. In general, global lower stratospheric water vapor is tied to the variability of TTL temperatures since the final dehydration of air masses takes place in the TTL (e.g., Gettelman and Forster, 2002; Schoeberl and Dessler, 2011; Fueglistaler, 2012; Randel and Jensen, 2013).
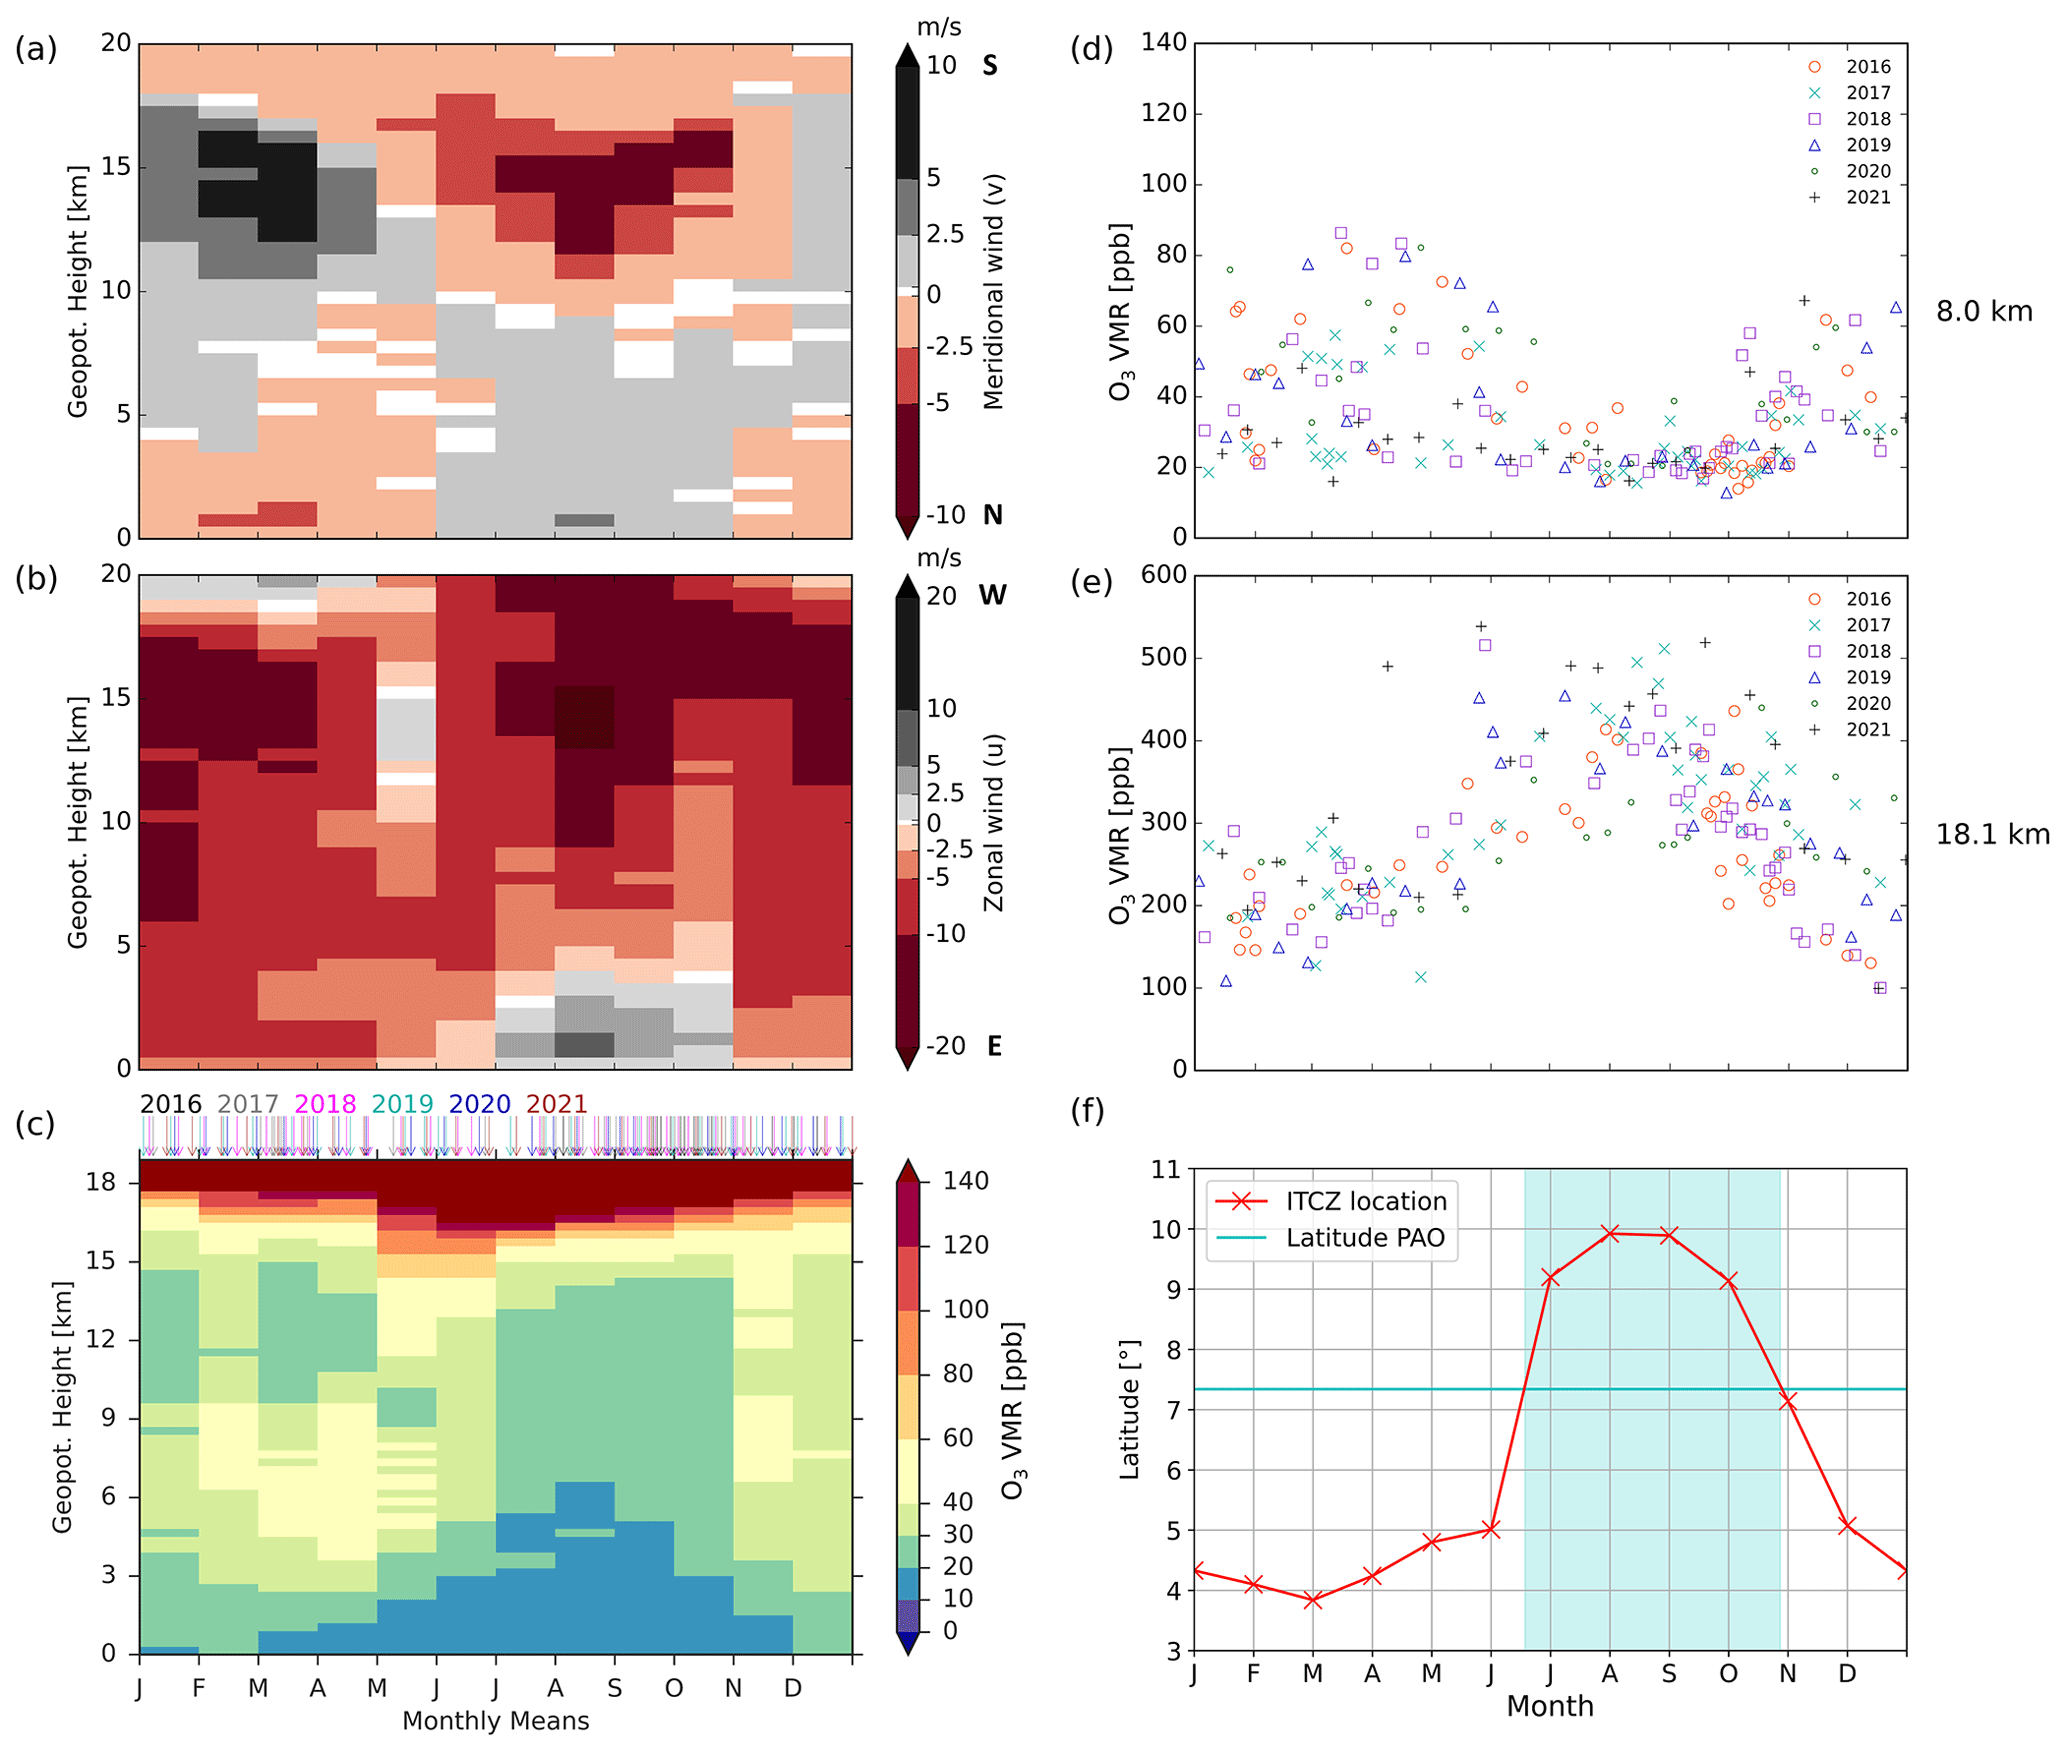
Figure 6Monthly mean zonal (a) and meridional (b) wind from daily radio soundings at 09:00 LT from the operational NOAA-associated observing site at the Palau airport (WMO station ID PTRO 91408) averaged from 2016–2019 (University of Wyoming, 2020). O3 VMR (c) (compare Müller et al., 2023), averaged from August 2016–2021 (i.e., excluding El Niño 2016) as time–height cross-sections, alongside mean O3 VMR of individual soundings of all years (different markers and colors) in 300 m altitude layers centered around 8 km (d) and 18 km (e). Panel (f) shows the monthly mean latitudinal movement of the ITCZ from TRMM averaged from 1998–2009 for 0–20∘ N, 125–175∘ E after Shonk et al. (2018), whereby the ITCZ location is defined in terms of the zonal mean rainfall rate across this region using a threshold of 50 % of the peak zonal-mean rainfall intensity. Palau's latitude is marked by the horizontal turquoise line.
Figure 6 shows monthly mean O3 VMR (Fig. 6c) and altitude cross-sections with individual O3 VMR measurements averaged in 300 m bins around 8 km (Fig. 6d) and 18 km (Fig. 6e). O3 measurements are complemented in the figure with monthly means of meridional (Fig. 6a) and zonal (Fig. 6b) wind for the time series alongside the monthly latitudinal position of the ITCZ derived from the Tropical Rainfall Measuring Mission (TRMM) satellite data averaged from 1998 to 2009 for a region between 125–175∘ E and 0–20∘ N (after Shonk et al., 2018) (Fig. 6f). The O3 column has two dominant annual features, i.e., a mid-tropospheric cycle with a clear minimum from July to October (10–30 ppb, Fig. 6d) and a reverse cycle of greater amplitude in the TTL with a maximum from June to September (Fig. 6e). In the mid-troposphere, individual measurements outside the minimum show a greater spread compared to the persistent signal in the TTL, both inter-annually and intra-annually, as can be inferred from Fig. 6d and e. Around 8 km altitude, VMR as low as during the mid-tropospheric minimum period are occasionally also measured between January and June in years other than the El Niño year 2016. It should be noted that during the time frame in which O3 in the mid-troposphere is expected to reach its minimum, the sounding frequency was increased in most years to increase the robustness of particularly low O3 observations. The TTL seasonal cycle is a known zonal phenomenon that is mostly controlled by the Brewer–Dobson circulation (Thompson et al., 2003a, b; Randel et al., 2007).
The annual movement of the ITCZ can explain the periodicity of the annual O3 cycle in the mid-troposphere. The ITCZ crosses Palau's latitude in June and October (for the definition of ITCZ latitude, see the caption of Fig. 6 and Shonk et al., 2018). On average, the ITCZ is located 6∘ N of the Equator but moves towards the warming hemisphere throughout the year. Therefore, Palau is generally close to the ITCZ but closest during its northernmost position from July until October. The dominant influence of the northern Hadley cell and thus transport of air masses to Palau with northeasterly trade winds is only interrupted during these few months, when the Western Pacific Monsoon reaches Palau from the southwest below 5 km altitude. Above 5 km in altitude, the influence of the monsoon circulation vanishes and easterly winds dominate throughout the remaining tropospheric column. Additional moisture transported to Palau in this wettest season of the year corresponds well to the lowest O3 measurements, but measurements of low O3 (see Fig. 6d) paired with high RH occur year-round and are interpreted as the result of convective activity, which transports humid and ozone-poor boundary layer air upwards. To some extent this convection persists year-round due to the overall close proximity of the ITCZ. The wind components measured above Palau (Fig. 6a, b) show a seasonality corresponding to the ITCZ movement, with particularly different regimes in the meridional wind for June to October compared to November until May. The shift in regimes corresponds well with the annual movement of the ITCZ shown in Fig. 6f. The tropospheric O3 seasonality and the transport processes driving this pattern in particular are discussed in more detail by Müller et al. (2023). The average zonal wind in the UTLS has to be treated with caution due to the irregular shifting between westerlies and easterlies with the QBO.
3.2 Regional tropospheric O3 variability
3.2.1 Comparison with SHADOZ
As O3 and H2O are valuable tracers of dynamical transport in the TWP, we compared the O3–RH relation measured at the PAO to other selected SHADOZ stations to assess their interdependency and variability in the region. Given its position far away from major anthropogenic emission sources, the PAO provides an atmospheric background site well suited to study the impact of global climate change on seasonal air composition and dynamics. In Fig. 7, 2D histograms for O3 VMR (≤ 100 ppb) versus RH (with respect to liquid water) at selected SHADOZ stations and at the PAO are shown for the free troposphere (3–14 km). Data are essentially unsmoothed, i.e., no spatial or temporal averaging beyond raw data processing has been applied, in order to preserve the simultaneously measured combination of the two tracers. This is an important advantage over averaging of data into mean seasonal or annual profiles with altitude, where the effects of layered structures in certain altitudes might be canceled out by an equally dominant background (compare Pan et al., 2015; Müller et al., 2023). The sampling frequencies are not regular and for different stations data has been accumulated over different time periods (compare Table 1). The resulting distributions, therefore, cannot be compared in a quantitative climatological manner, but we can assume a good representation of interannual variability for SHADOZ data (time series of 13 to 21 years). Histogram values in Fig. 7 are normalized to the total number of observations in the free troposphere for each station. Thus, they can be interpreted as a statistical probability distribution for a certain O3 RH combination to occur.
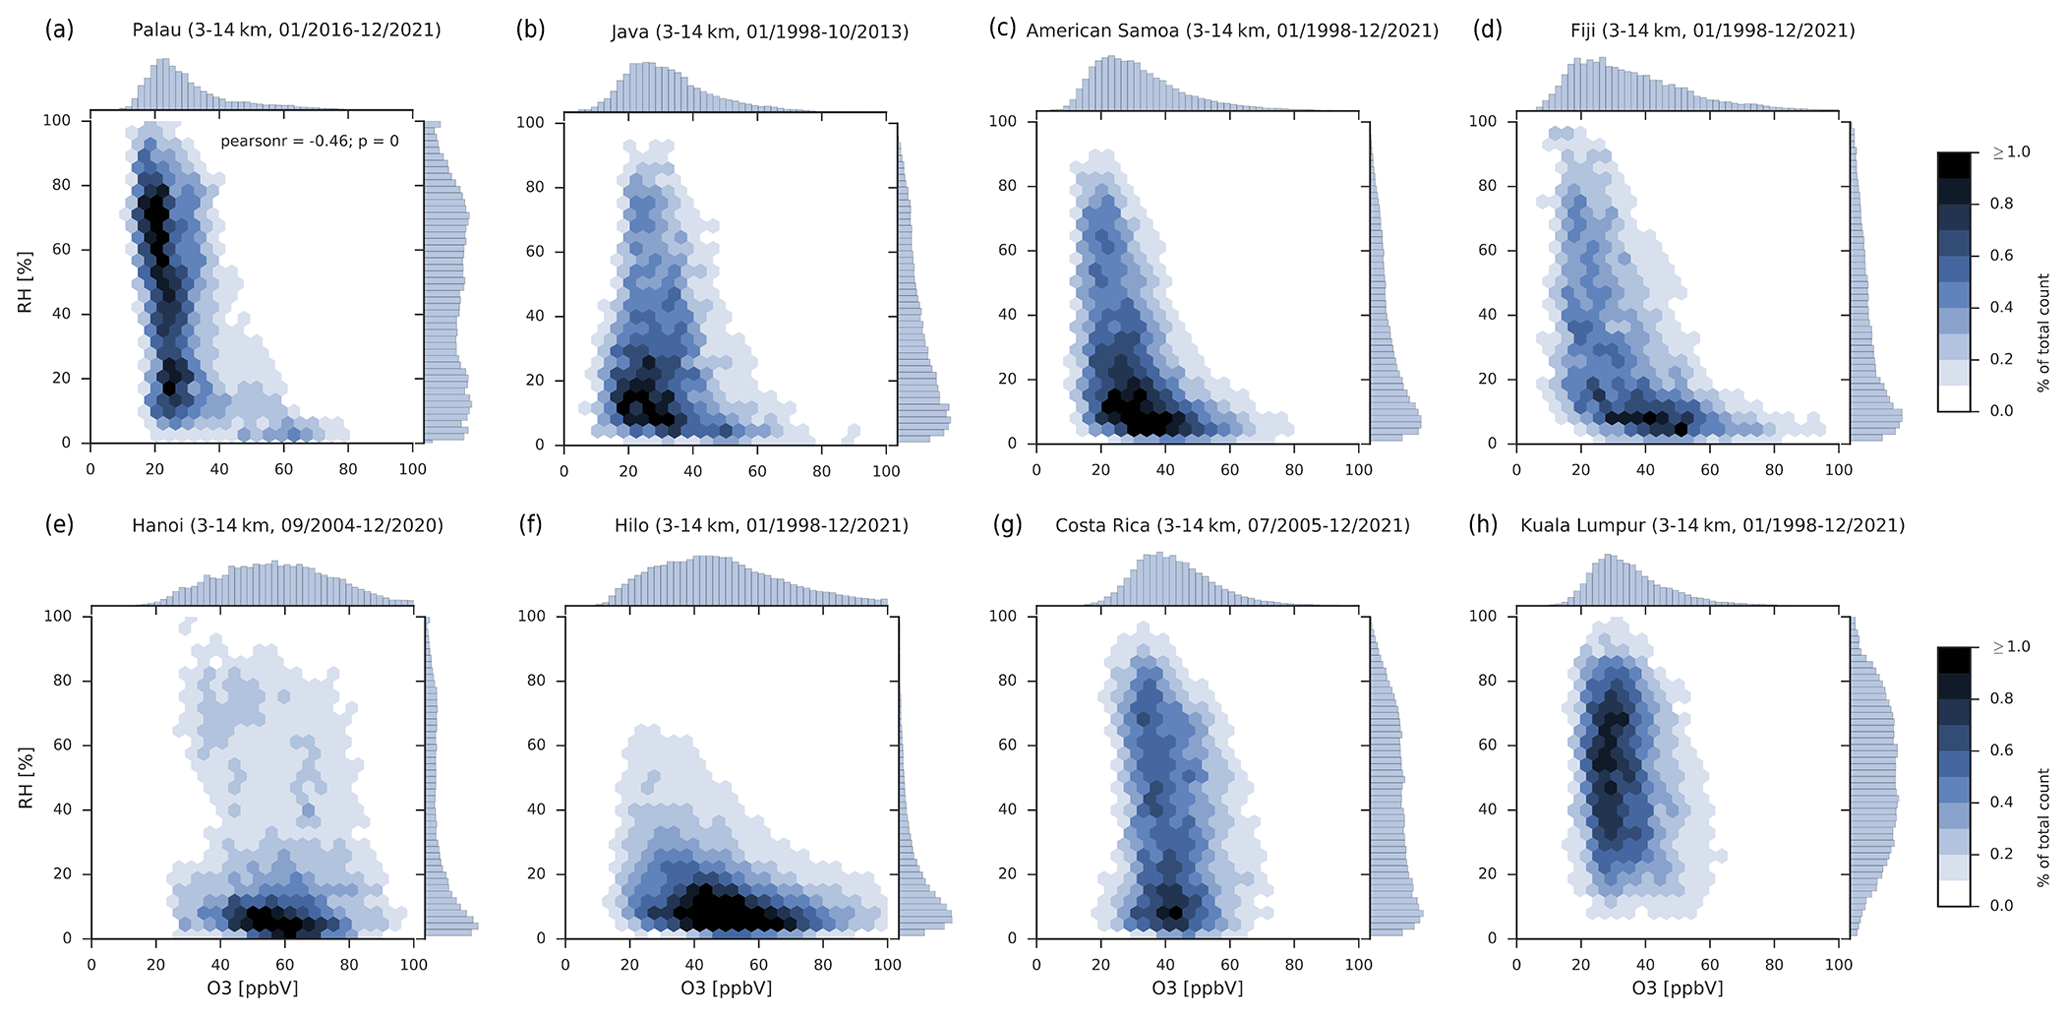
Figure 7Free-tropospheric (3–14 km) relation between O3 and RH (with respect to liquid water) in a 2D (hexagonally binned) histogram, normalized to the total count of data points per station, using all measured data pairs with ≤ 100 ppb O3 VMR for Palau (a) and selected SHADOZ stations (b–h) (https://tropo.gsfc.nasa.gov/shadoz/Archive.html); color shading indicates percentage of total count per grid point, and marginal plots give individual 1D histograms normalized to unity.
In this sense, the given stations can be classified into three groups based on the distribution of O3 versus RH:
-
a fairly narrow, almost Gaussian distribution of O3 VMR with evenly distributed RH (Costa Rica, Kuala Lumpur);
-
predominantly dry air spread over a wider range of O3 VMR (Hanoi, Hilo);
-
a mixture of the two previous categories, meaning an “L”-shaped distribution with a dominant mode of low O3 over the whole RH range and a tail towards higher O3 VMR corresponding to low RH values (Palau, Fiji, Java, American Samoa).
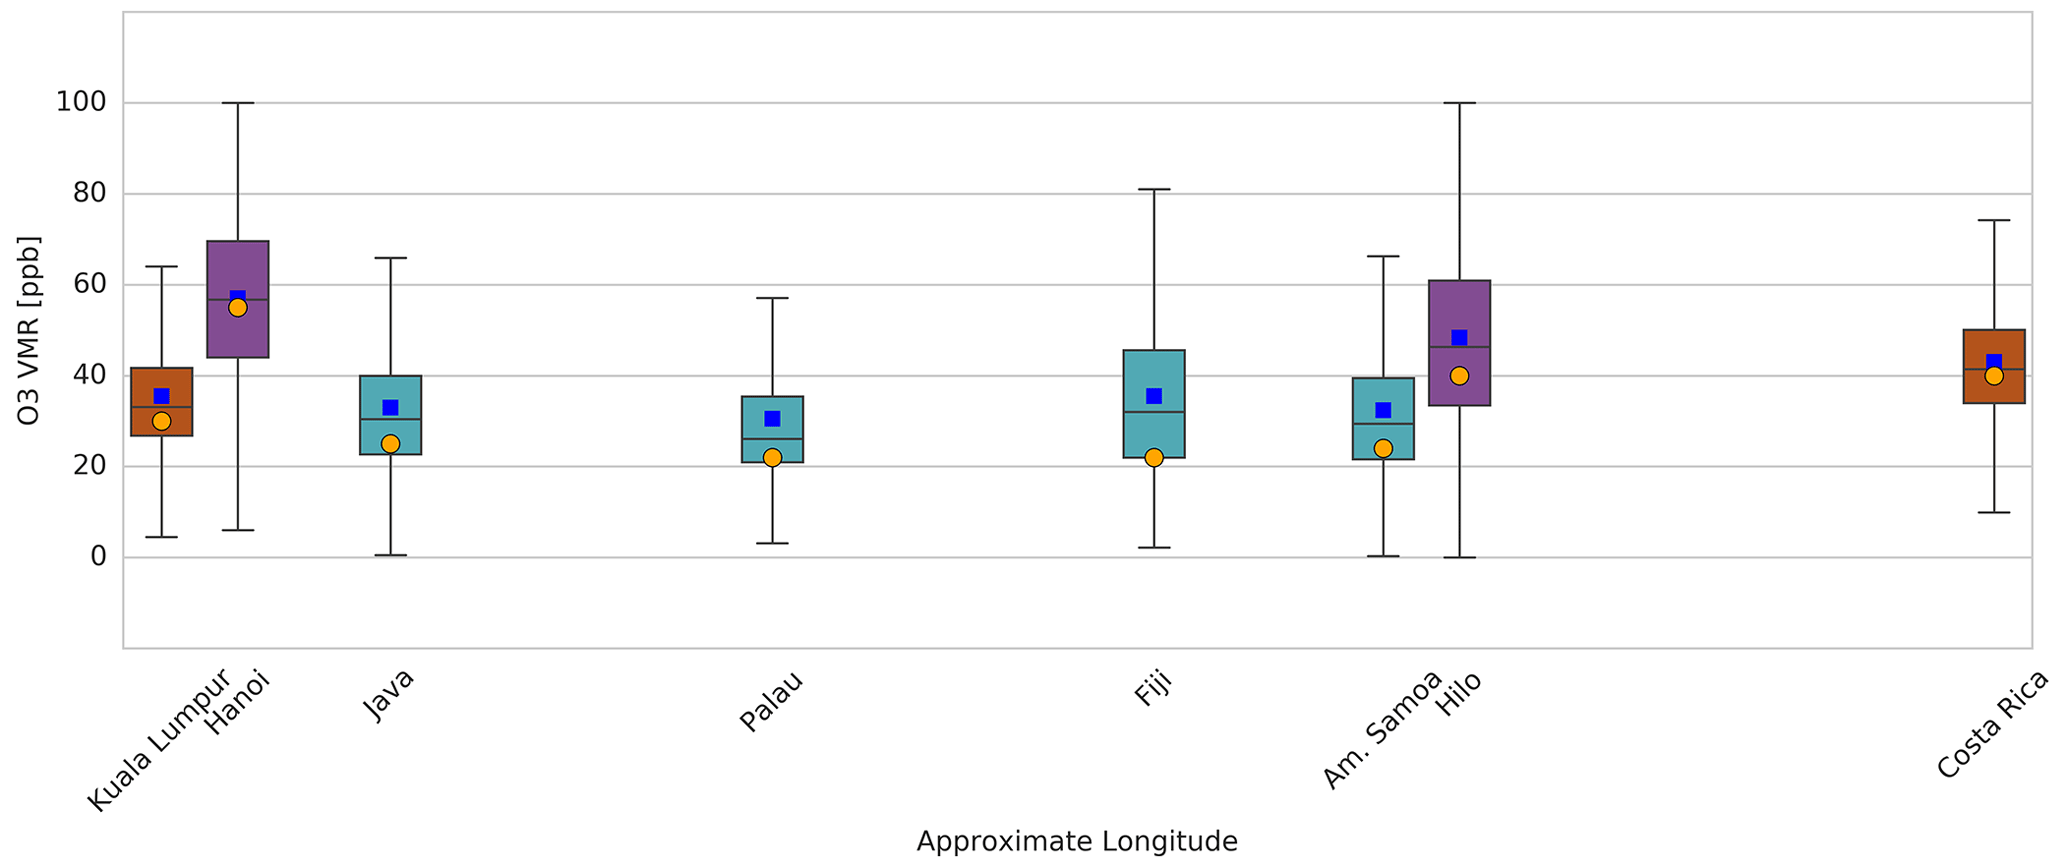
Figure 8Boxplots for free-tropospheric (3–14 km) O3 VMR ≤ 100 ppb for Palau and selected SHADOZ stations (https://tropo.gsfc.nasa.gov/shadoz/Archive.html), colored by the group categories derived from O3 RH distributions (compare Fig. 7): brown for group 1, purple for group 2 and turquoise for group 3; outliers are not shown, and whiskers are a function of the interquartile range (, i.e., Q3 or Q1 + or − 1.5⋅IQR, respectively). Blue squares are mean values, and orange circles refer to the most frequent O3 VMR as illustrated in the marginal 1-D histograms in Fig. 7. The arrangement of boxplots on the horizontal axis is an approximation to longitudinal positions.
With reference to these categories, the statistical O3 boxplots for the eight stations are arranged as a longitudinal cross-section over the Pacific Ocean in Fig. 8 (compare Thompson et al., 2012, 2017). The most frequently observed O3 VMR (maxima in the marginal 1D histograms of Fig. 7) are superimposed as orange circles onto the boxplots. In Fig. 8, we see the separation of the Pacific island stations (turquoise boxes) from the other groups in terms of O3 VMR (lowest median, mean values and maximum frequency). The similarity between the western Pacific stations can be explained by their tropical marine climate and location far from industrial centers. Without NOx emissions, O3 loss in a marine, humid environment will dominate over O3 production.
With O3 as an indicator for its precursor NOx (Crawford et al., 1997; Gao et al., 2014; Rex et al., 2014), we would expect a decrease from east to west, while crossing the remote Pacific and following the trade winds within the ITCZ (Thompson et al., 2012), as more and more NOx is lost by conversion to HNO3 and subsequent washout in convection is outweighing NOx production (Graedel et al., 1994). However, this lateral ozone gradient is not apparent in any of our statistical measures. Instead, according to the statistics for the free troposphere, Palau sets the lowest boundaries for all selected stations, except for the minimum range value (excluding outliers).
The Palau data further stand out due to the exceptionally narrow O3 distribution around ∼ 22 ppb (compare marginal 1-D histogram in Fig. 7). The fairly even distribution of RH instead resembles histograms classified into group 1. This consistency within the near-equatorial Northern Hemispheric stations, all located within ±5∘ latitude of Palau, is caused by their close vicinity to the average position of the ITCZ around 6∘ N and thus overall high rainfall rates (e.g., Schneider et al., 2014). The most unique attribute of the distribution based on PAO data is the essential absence of a dry season in terms of tropospheric humidity values. The driest air masses paired with enhanced O3 VMR (horizontal part of the “L”-shape) are mostly limited to the time period of November to April (for more details on seasonal distributions, see Müller, 2020). However, while moist air masses above 40 % are rare during the dry seasons for other stations in group 3, these are frequently observed year-round in Palau, including during the drier period, with the exception of the strong El Niño in 2016. The RH distributions of Fiji, America Samoa and Java are skewed towards lower values during their pronounced dry seasons. Weak overall anti-correlation of O3 and RH occurs for Fiji and American Samoa data (Fiji: ; American Samoa: ). Kuala Lumpur and Costa Rica (group 1) constitute the boundaries of the longitudinal Pacific cross-section (brown boxes in Fig. 8) and are continuously influenced by continental pollution and deep convection, with the most frequent O3 VMR observations being at around 30 and 40 ppb, respectively, and evenly distributed RH. That means O3 VMR are indeed enhanced compared to the most frequent O3 measurements in group 3, but there are hardly any observations greater than 60 ppb, possibly due to local mixing processes and O3 loss in the humid free troposphere. Kuala Lumpur is almost completely lacking observations below 10 % RH (see Fig. 7h).
Both subtropical stations in group 2 (purple boxes in Fig. 8), Hanoi and Hilo, are similarly affected by pollution with a significantly wider spread in their O3 distributions compared to all other stations, especially towards higher values (Fig. 7e, f). Their free-tropospheric O3-to-RH ratio is therefore especially different from the one at Palau. The tendency towards lower RH values is tied to their location close to the subsiding branch of the Hadley circulation. The less humid troposphere chemically acts in favor of higher O3 VMR. The semi-permanent North Pacific High above Hawaii, together with the cold SST in the eastern Pacific, is responsible for a stable trade wind inversion that suppresses deep convective activity above Hilo and enables long-range transport of potentially polluted air masses from both Asia and North America (e.g., Oltmans et al., 2004). Hanoi, in turn, is affected by Asian outflow within shorter distances to the sources (Ogino et al., 2013).
For this study, we have neglected variations in altitude despite the inhomogeneous distribution of O3 values in the free troposphere. We particularly excluded the boundary layer and TTL but included the level of deep convective outflow (10–12 km altitude). O3 VMR are typically very low at this level in the TWP (e.g., Folkins, 2002; Gettelman and Forster, 2002; Pan et al., 2014). At 200 hPa, approx. 25 % of the O3 observations in Palau are below 20 ppb (not shown here, c.f. Müller, 2020). For American Samoa, Fiji and Java, Solomon et al. (2005) found even higher percentages between 30 % and 45 %. However, at lower altitudes, Palau experiences higher fractions of low O3 VMR compared to their study, and the overall statistics for the free troposphere (Fig. 8) attest to the exceptional dominance of the ozone-poor tropospheric column compared to other SHADOZ sites. Despite the large altitude interval, we use RH with respect to liquid water in this tropical intercomparison as a simple and unique measure of humidity, which may not necessarily give a realistic representation of the physically correct RH (e.g., Fujiwara et al., 2003). This means that we do not account for the occurrence of mixed-phase or ice clouds, which becomes more problematic below temperatures of −35 ∘C, where our measure underestimates humidity. The characteristic signatures of our distribution data sets, however, do not change when reducing the altitude range to 3–12 km, i.e., data with temperatures approx. > −40 ∘C.
3.2.2 Comparison with CONTRAST
A detailed analysis of the relation between tropospheric O3 VMR and RH in the TWP has been performed by Pan et al. (2015) for data from the CONTRAST campaign in 2014 (see Pan et al., 2017 and Fig. 1). They found a bimodal distribution of free-tropospheric O3 VMR within the altitude profile. The humid, ozone-poor background or “primary mode” was isolated by simply removing all “dry” data with RH less than 45 %, which indicated an entirely convective control of the primary mode. The study thus still refrains from resolving the individual vertical structure of layers but proposes the RH threshold as an overall free-tropospheric criterion for the primary mode.
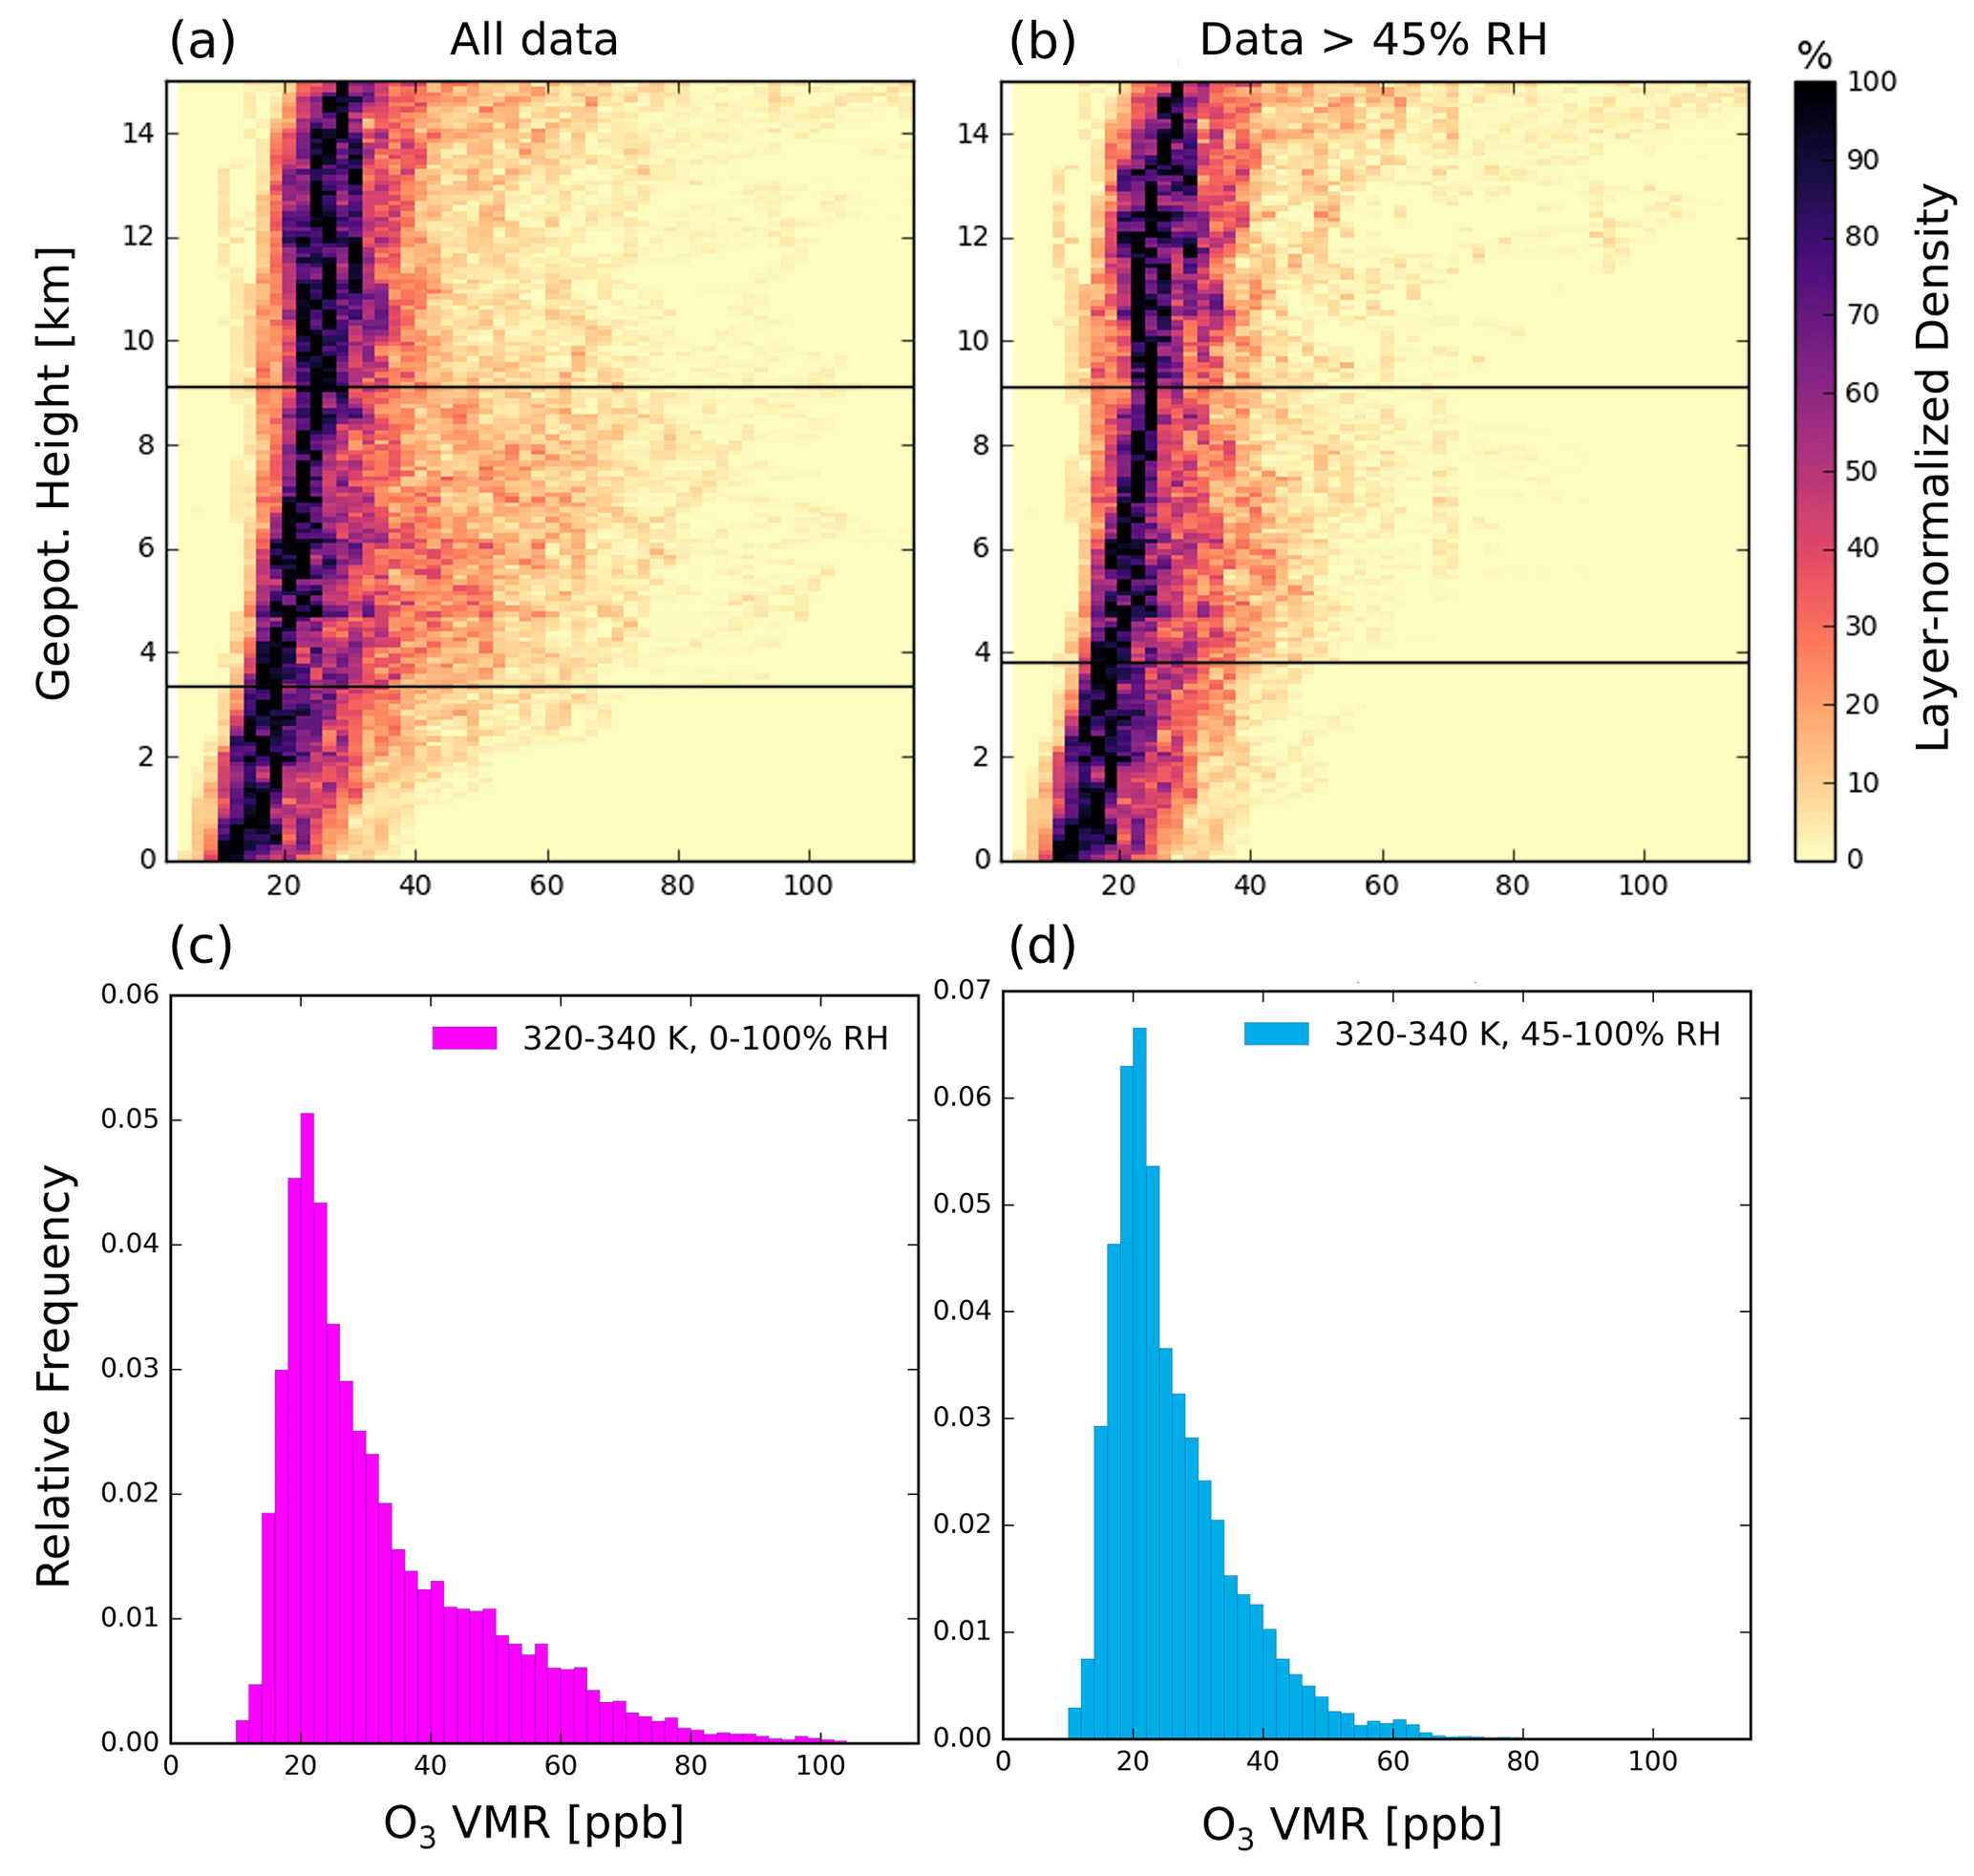
Figure 9Relative frequency distribution (normalized to the layer maximum) of tropospheric (0–15 km) O3 VMR with altitude (100 m bins) for all observations (a) and “humid” observations with RH greater 45 % (b) for Palau from 2016–2021, (c, d) histograms show relative frequency distributions of O3 VMR for a layer between 320 and 340 K potential temperature for all (c) and only “wet” (d) observations, respectively. RH is calculated with respect to liquid water below 5 km and with respect to ice above. Horizontal black lines in (a) and (b) indicate the approximate location of the boundaries for the potential temperature-based selection of the data in (c) and (d) (compare Fig. 3 in Pan et al., 2015).
For Palau a similar analysis does not reveal a bimodal distribution for the full data set (Fig. 9c), and a threshold of 45 % does not separate all higher O3 observations from the primary low O3 mode (Fig. 9d). Figure 9a depicts the layer-normalized density distribution for all O3 observations at the PAO from the ground to 15 km, with data binning according to Pan et al. (2015). Using the same method of analysis, Fig. 9b shows only “wet” data with RH greater than 45 %. Here, in analogy with Pan et al. (2015), we calculated RH with respect to liquid water below 5 km altitude and RH with respect to ice above. For both the CONTRAST and PAO data, 5 km is the average freezing level. The primary mode, i.e., the layer maximum, is highlighted in dark colors and obvious within both distributions. The wet data feature less frequent occurrences of O3 measurements with more than 45 ppb. However, the highest frequency of O3 observations in the mid-tropospheric layer of expected highest occurrence of enhanced O3 air masses (from 320 to 340 K potential temperature) is approximately the same for both the full and the wet data set at around 20 ppb (Fig. 9c, d). The tail in the wet distribution is reduced but not completely absent, as was shown for the CONTRAST data set (see Pan et al., 2015, Fig. 3f). The full Palau data set does not show a clear separation into two modes in the first place (compare Fig. 9c with Fig. 3c in Pan et al., 2015). However, a limited number of seasonal and annual averages of the PAO time series show bimodal characteristics, possibly also related to the ENSO cycle (see discussion in Appendix A and Figs. A2, A3, A4 in the Appendix). In some, but not all of these cases, the secondary mode indeed disappears within the wet distribution.
The differences in the aircraft measurements performed in the TWP from the Guam air base can be understood by looking at the uniqueness and seasonality of the free-tropospheric O3 to RH relation at Palau (Fig. 7). In the PAO time series, air masses with higher O3 content (> 40 ppb) also occur under wet conditions (> 45 %). Likewise, dry and ozone-poor air is frequently observed, presumably measured in higher altitudes and explained by the temperature-dependent vertical RH gradient (e.g., Mapes, 2001). The central role of local convection in homogenizing air masses, lifting ozone-poor air from the ground and further depleting O3 in the tropospheric column is inevitable, but RH is not sufficient as a standalone indicator for a convective and thus local profile in the TWP.
Müller et al. (2023) show a different approach to separate humid, ozone-poor atmospheric background air masses from the Palau time series and thus contribute to the debate on the origin of frequent filaments of high O3 and low RH interrupting the tropospheric background in the wider TWP (e.g., Anderson et al., 2016).
The PAO, with its comprehensive instrumental setup, has monitored different atmospheric constituents since 2016. In particular, the O3 time series from regular ECC ozonesonde measurements fills an observational gap in the international ozone sounding network. The PAO, being a highly valuable candidate for SHADOZ, will be included in the network in the near future (SHADOZ's principal investigator Ryan Stauffer and Anne Thompson, personal communication, 2023).
The first analysis of the PAO O3 and RH records (2016–2021) highlights the suitability of Palau as a site for studies of the atmospheric background enabling a comprehensive analysis of the influence of climate change on dynamics and air chemistry in the TWP. The regional tropospheric O3 minimum is confirmed by the in situ measurements showing that lowest O3 values accompanied by mostly high RH are observed in the mid-troposphere from July until October. The regional TTL seasonality of O3 is confirmed and first signals of interannual variability due the ENSO are evident. Overall, the seasonal tropospheric O3 variability is governed by the movement of the ITCZ, which is close to Palau year-round. In the UTLS, the Brewer–Dobson circulation and its interplay with the uprising branch of the Hadley circulation take over control. As the ITCZ acts as a boundary for interhemispheric transport (Sun et al., 2023), its position north of Palau from July until October inhibits transport of potentially polluted Northern Hemispheric air masses to the region, which further promotes the seasonal mid-tropospheric O3 minimum and is further explored in back trajectory analysis by Müller et al. (2023).
The comparison between data from the PAO and selected SHADOZ stations for the free troposphere in the O3 RH space emphasizes the uniqueness of the atmospheric composition above Palau. Low O3 values attributed to a background atmosphere occur year-round in dry or humid conditions within the free troposphere but show a seasonality. Dry air masses of enhanced O3 VMR, the horizontal part of an L shape in the O3 RH distribution, are mostly observed from November until April.
Comparison of the PAO data set with data from the CONTRAST aircraft campaign cautions against the generalization of conclusions from a regionally and timely limited snapshot in the TWP. The aircraft campaign took place during the time of the year with the greatest occurrence of enhanced O3 VMR. Pan et al. (2015) proposed a “fundamental bimodal distribution of tropical tropospheric ozone” for the whole TWP based on the analysis of CONTRAST data, which separates ozone-poor humid air masses from ozone-rich dry air. The application of their method on the full PAO time series, however, did not confirm the general existence of such a separation, which occurs only during individual years or seasons. Müller et al. (2023) successfully used a different, statistical approach on the PAO time series to separate humid ozone-poor background air masses from anomalously dry and ozone-rich air.
While this paper provides a first overview of the O3 data record and associated meteorological variables, we encourage the scientific community to use the PAO data sets to study relevant phenomena in this under-monitored region of the Pacific Ocean. Analysis of the water vapor measurements by CFH sondes and aerosol and cloud observations by ComCAL will give further insights into UTLS processes in this key region of global stratosphere–troposphere exchange. In the stratosphere, water vapor drives important gas-phase O3 loss cycles as the primary source of HOx and is involved in the heterogeneous chemical processes leading to the formation of polar stratospheric clouds, thus eventually promoting chlorine activation and resulting in polar ozone loss (e.g., Solomon et al., 1986; Manney et al., 1994; Crutzen et al., 1995; see Diallo et al., 2018, and references therein).
Figure A1 gives insight into the effect of the background current correction on the O3 VMR signal. All O3 VMR profiles measured at the PAO from 2016 to 2021 are shown in Fig. A5 sorted by month and alongside some statistical measures. Details on the statistical evaluation are given in Müller (2020).
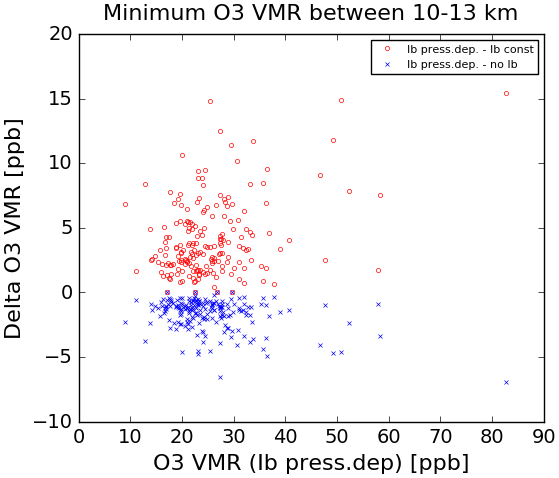
Figure A1Difference between O3 VMR calculated using the pressure-dependent correction and either the constant correction (red circles) or no correction applied (blue crosses) for daily minimum O3 VMR (press. dep. Ib) between 10 and 13 km altitude.
With regard to the analysis performed in analogy to Pan et al. (2015) presented for the full PAO time series in Fig. 9, the Figs. A2, A3 and A4 show results for selected averaged seasons or years. Some reduced data sets show bimodal distributions (Figs. A3a, b, c, d and A4d, e), mostly during the February–March–April (FMA) season, and in many but not all cases the secondary mode of higher O3 VMR disappears for wet data at the 320–340 K altitude level. The ENSO cycle might play a role as well. In 2019, a weak El Niño year, we observed more air masses with O3 VMR > 60 ppb than in other years, which could be identified as a secondary mode in the distribution and which correspond to air masses drier than 45 % RH (see Fig. A4d). In 2021, a La Niña year, we see little O3 VMR above 60 ppb and no bimodal distribution, even during the FMA season (see Figs. A4f and A3f). We plan to investigate the impact of ENSO on O3 and RH in more detail, including the current El Niño cycle, in a future study.
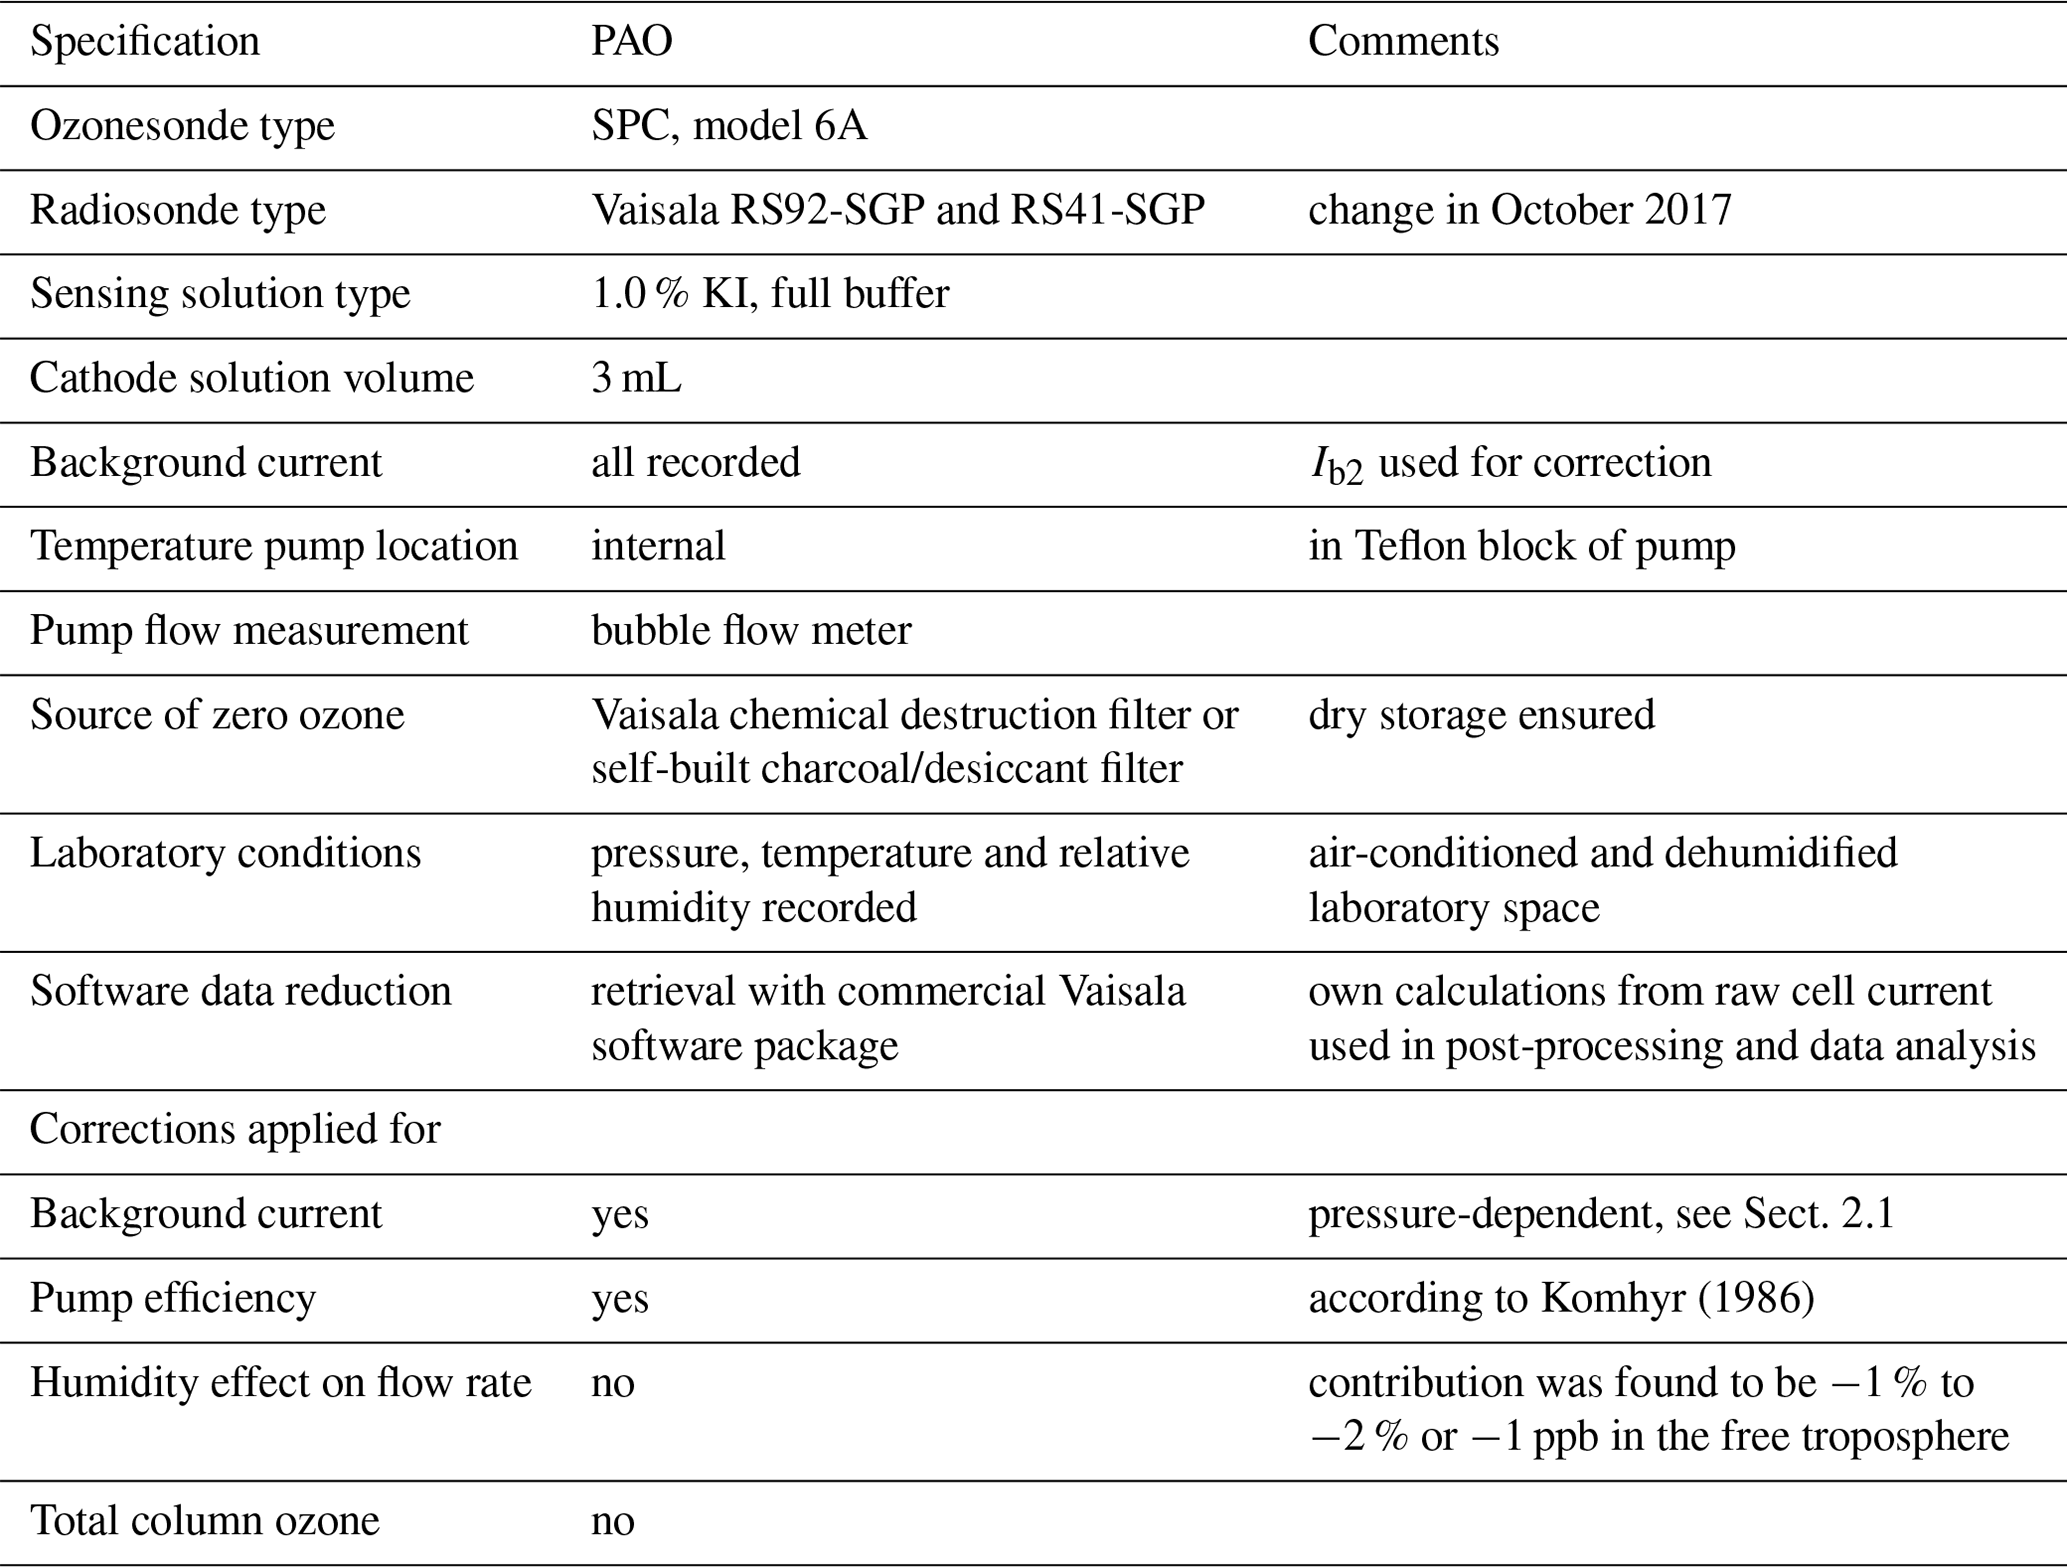
Table A1 provides specifications on the operating procedures of ECC soundings established at the PAO. Please note the deviation from international SOP regarding the background current correction.
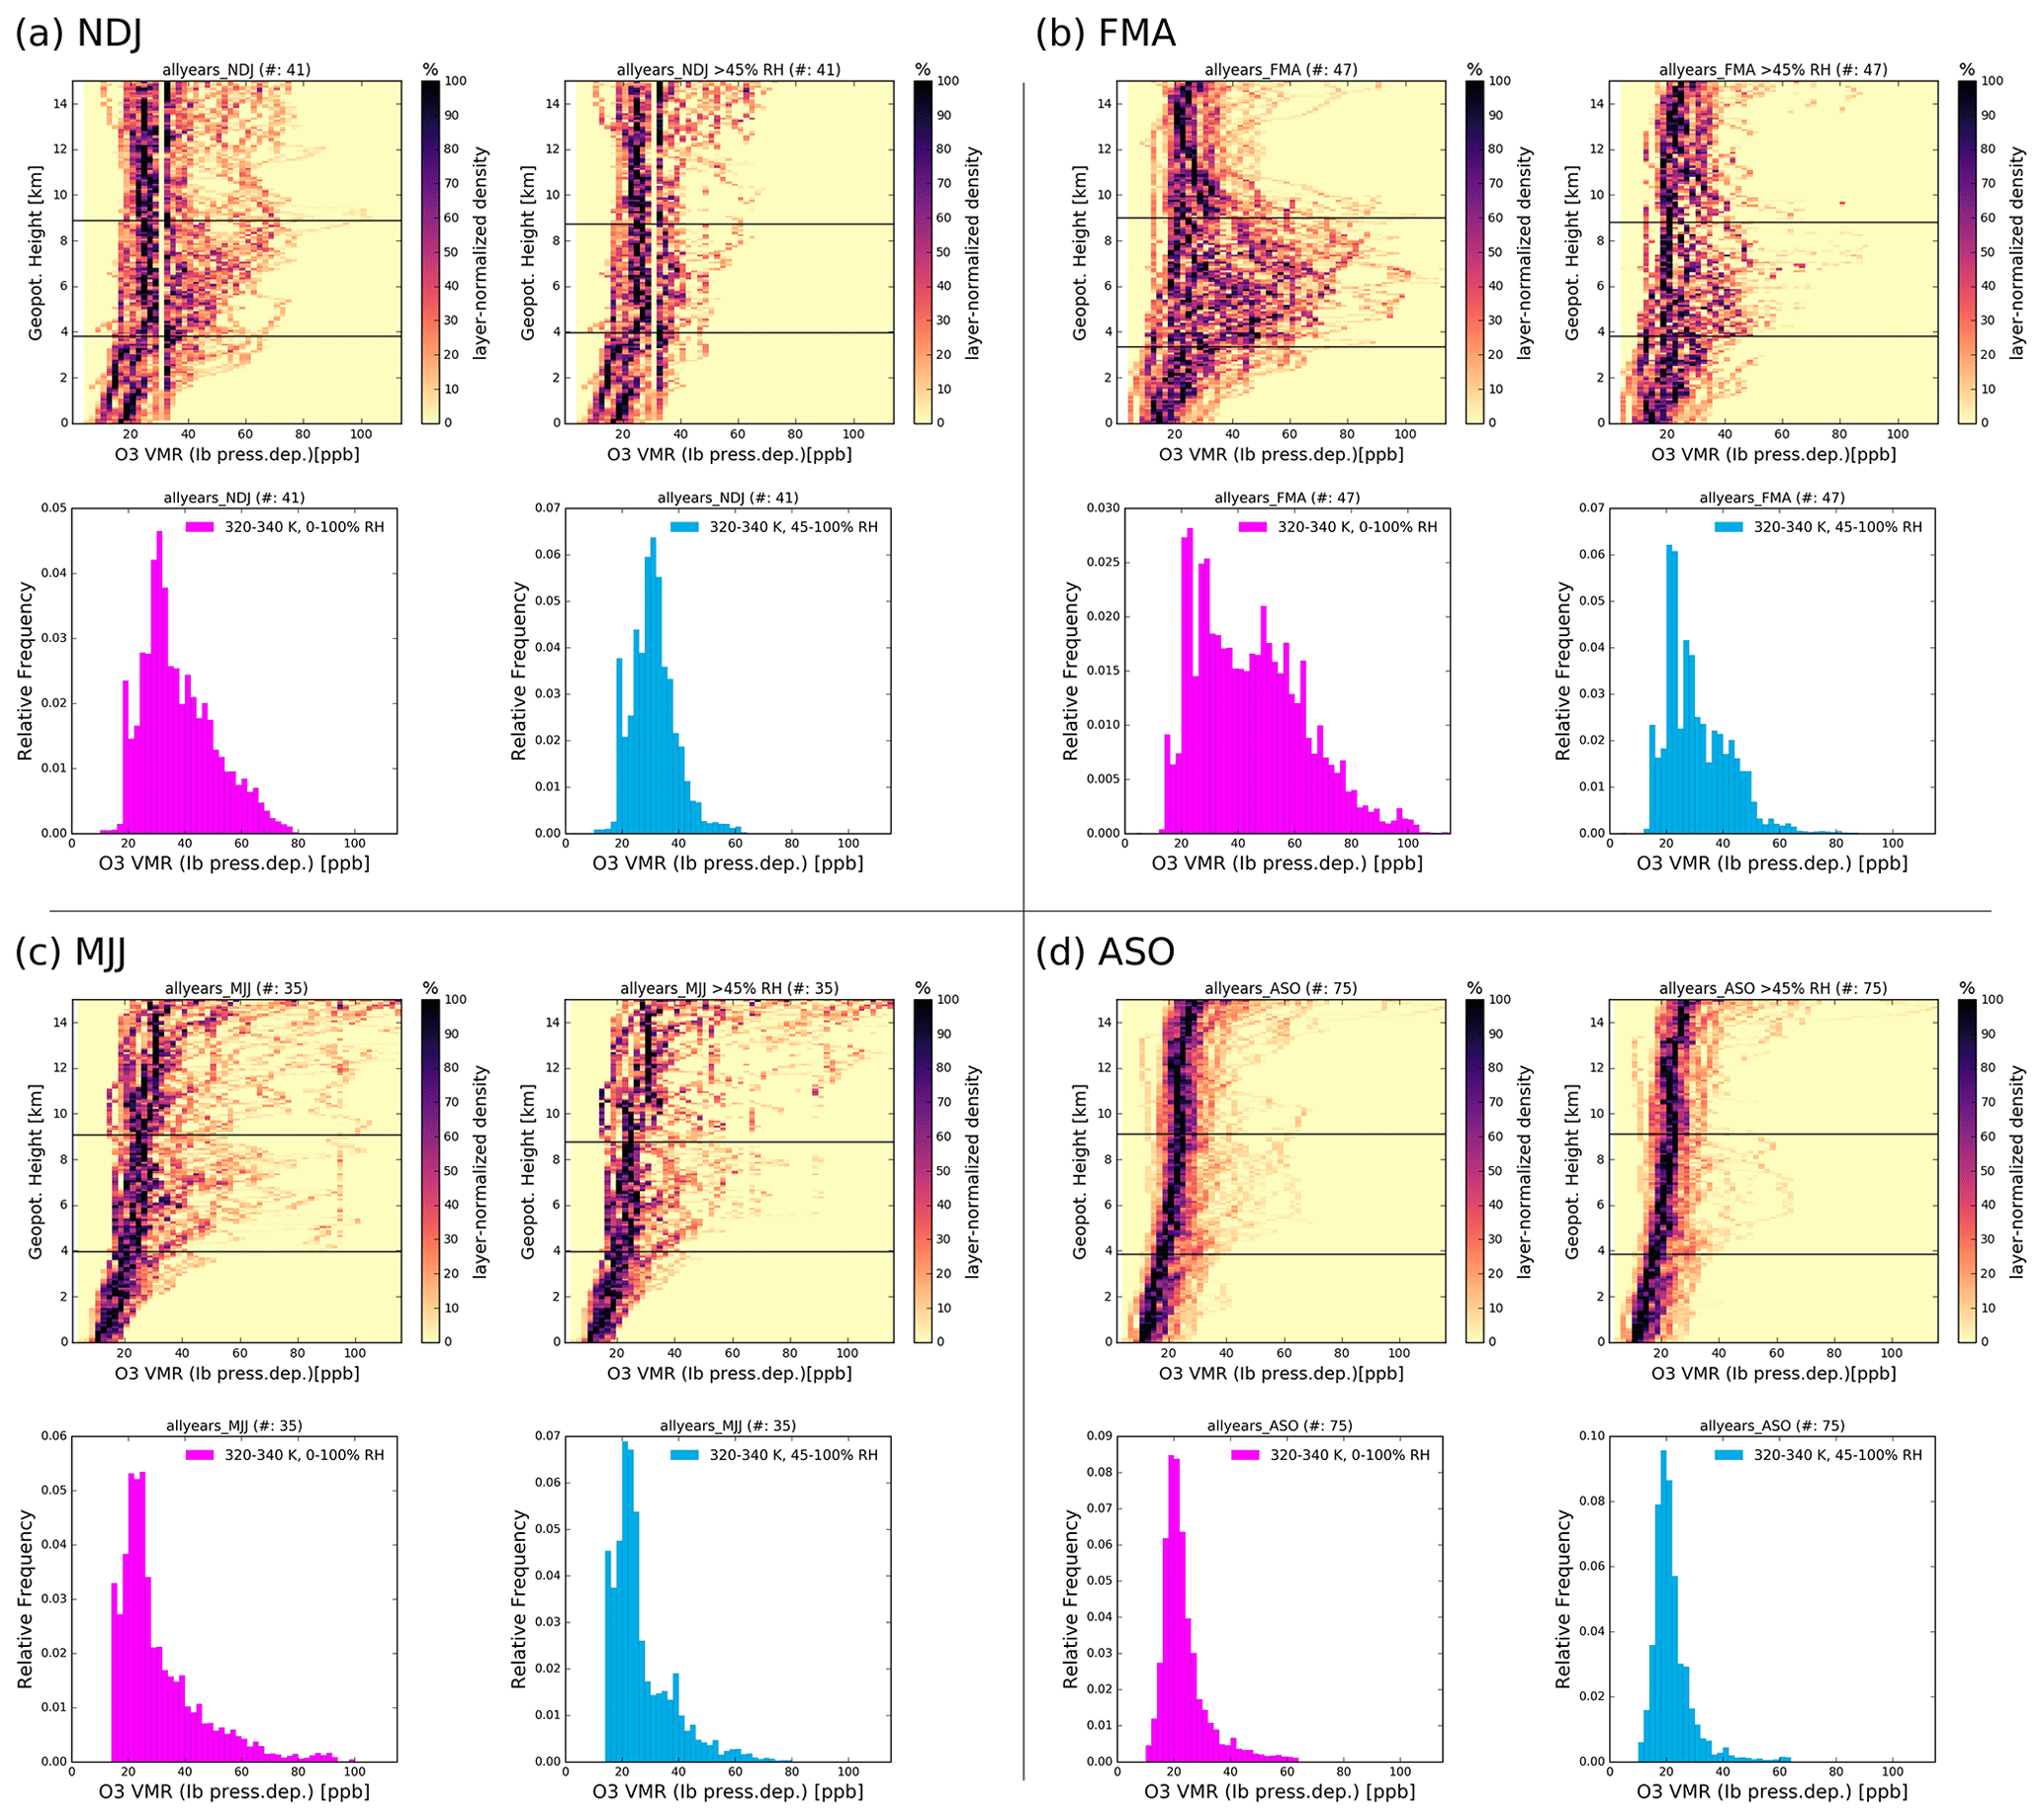
Figure A2Relative frequency distributions (normalized to the layer maximum) of tropospheric (0–15 km) O3 VMR with altitude (100 m bins) and histograms for 6-year averages of all seasons (a) November–December–January (NDJ), (b) February–March–April (FMA), (c) May–June–July (MJJ) and (d) August–September–October (ASO); for further details on the plots, see Fig. 9.
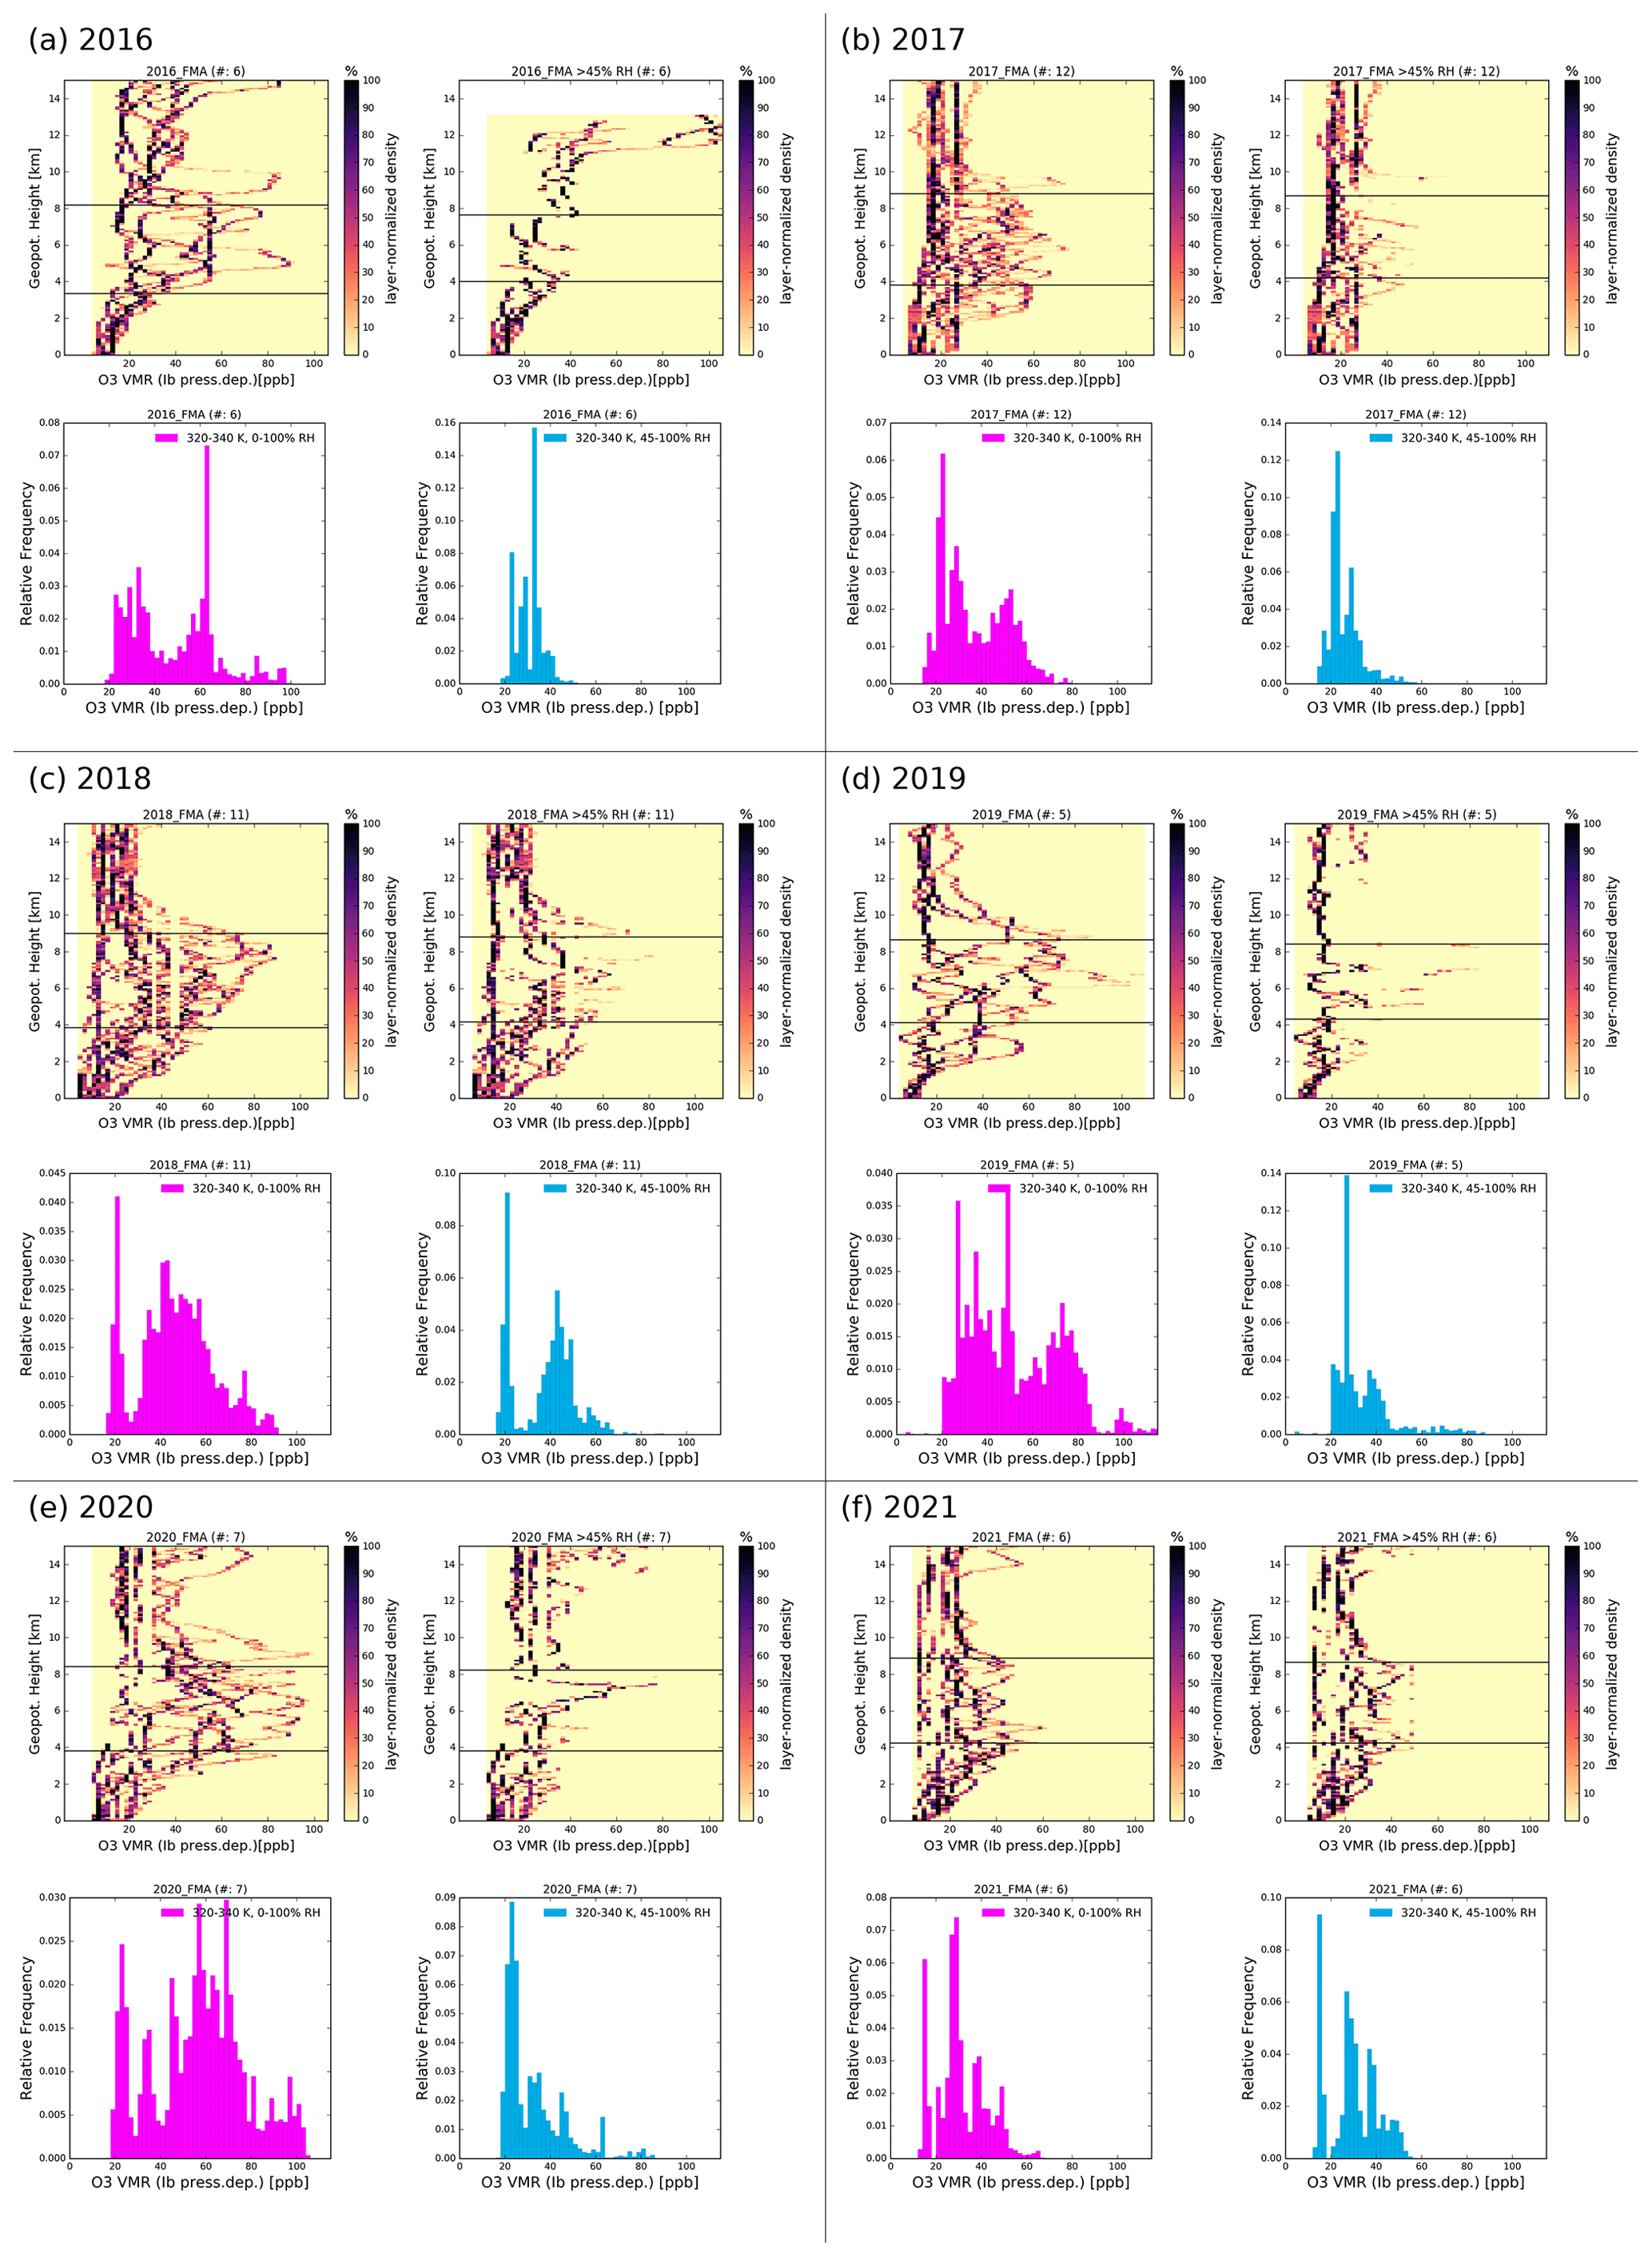
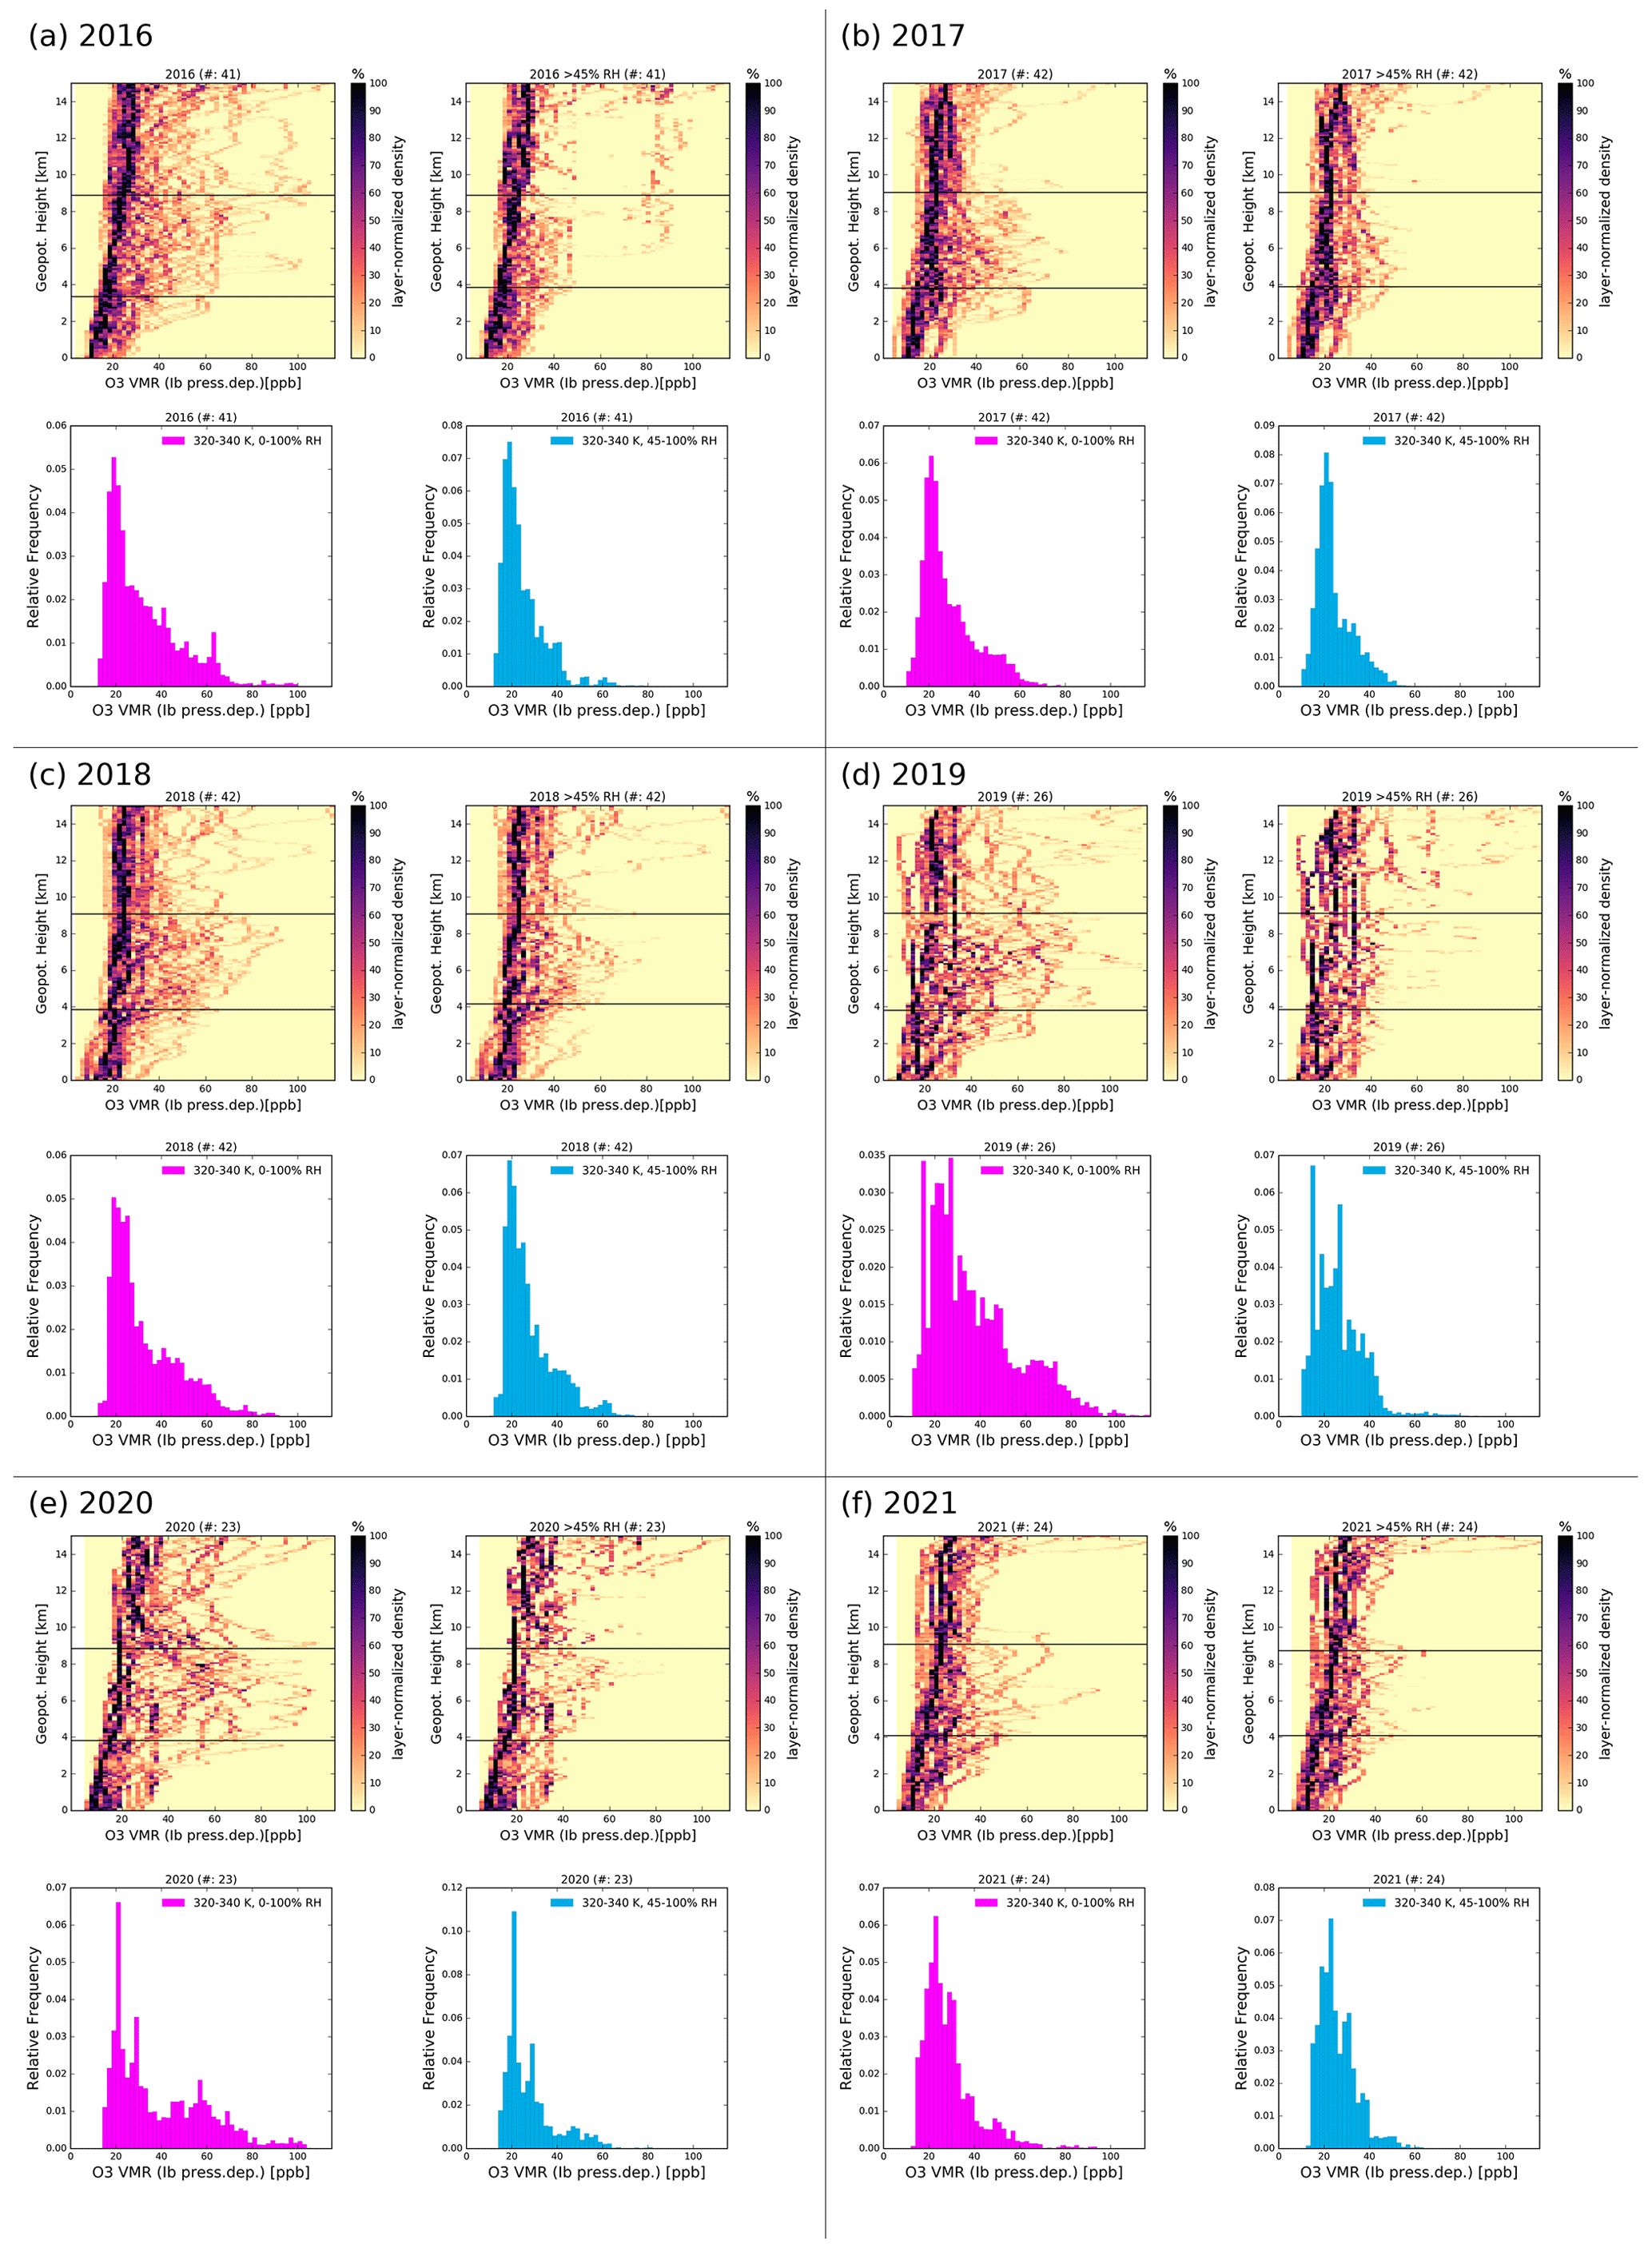
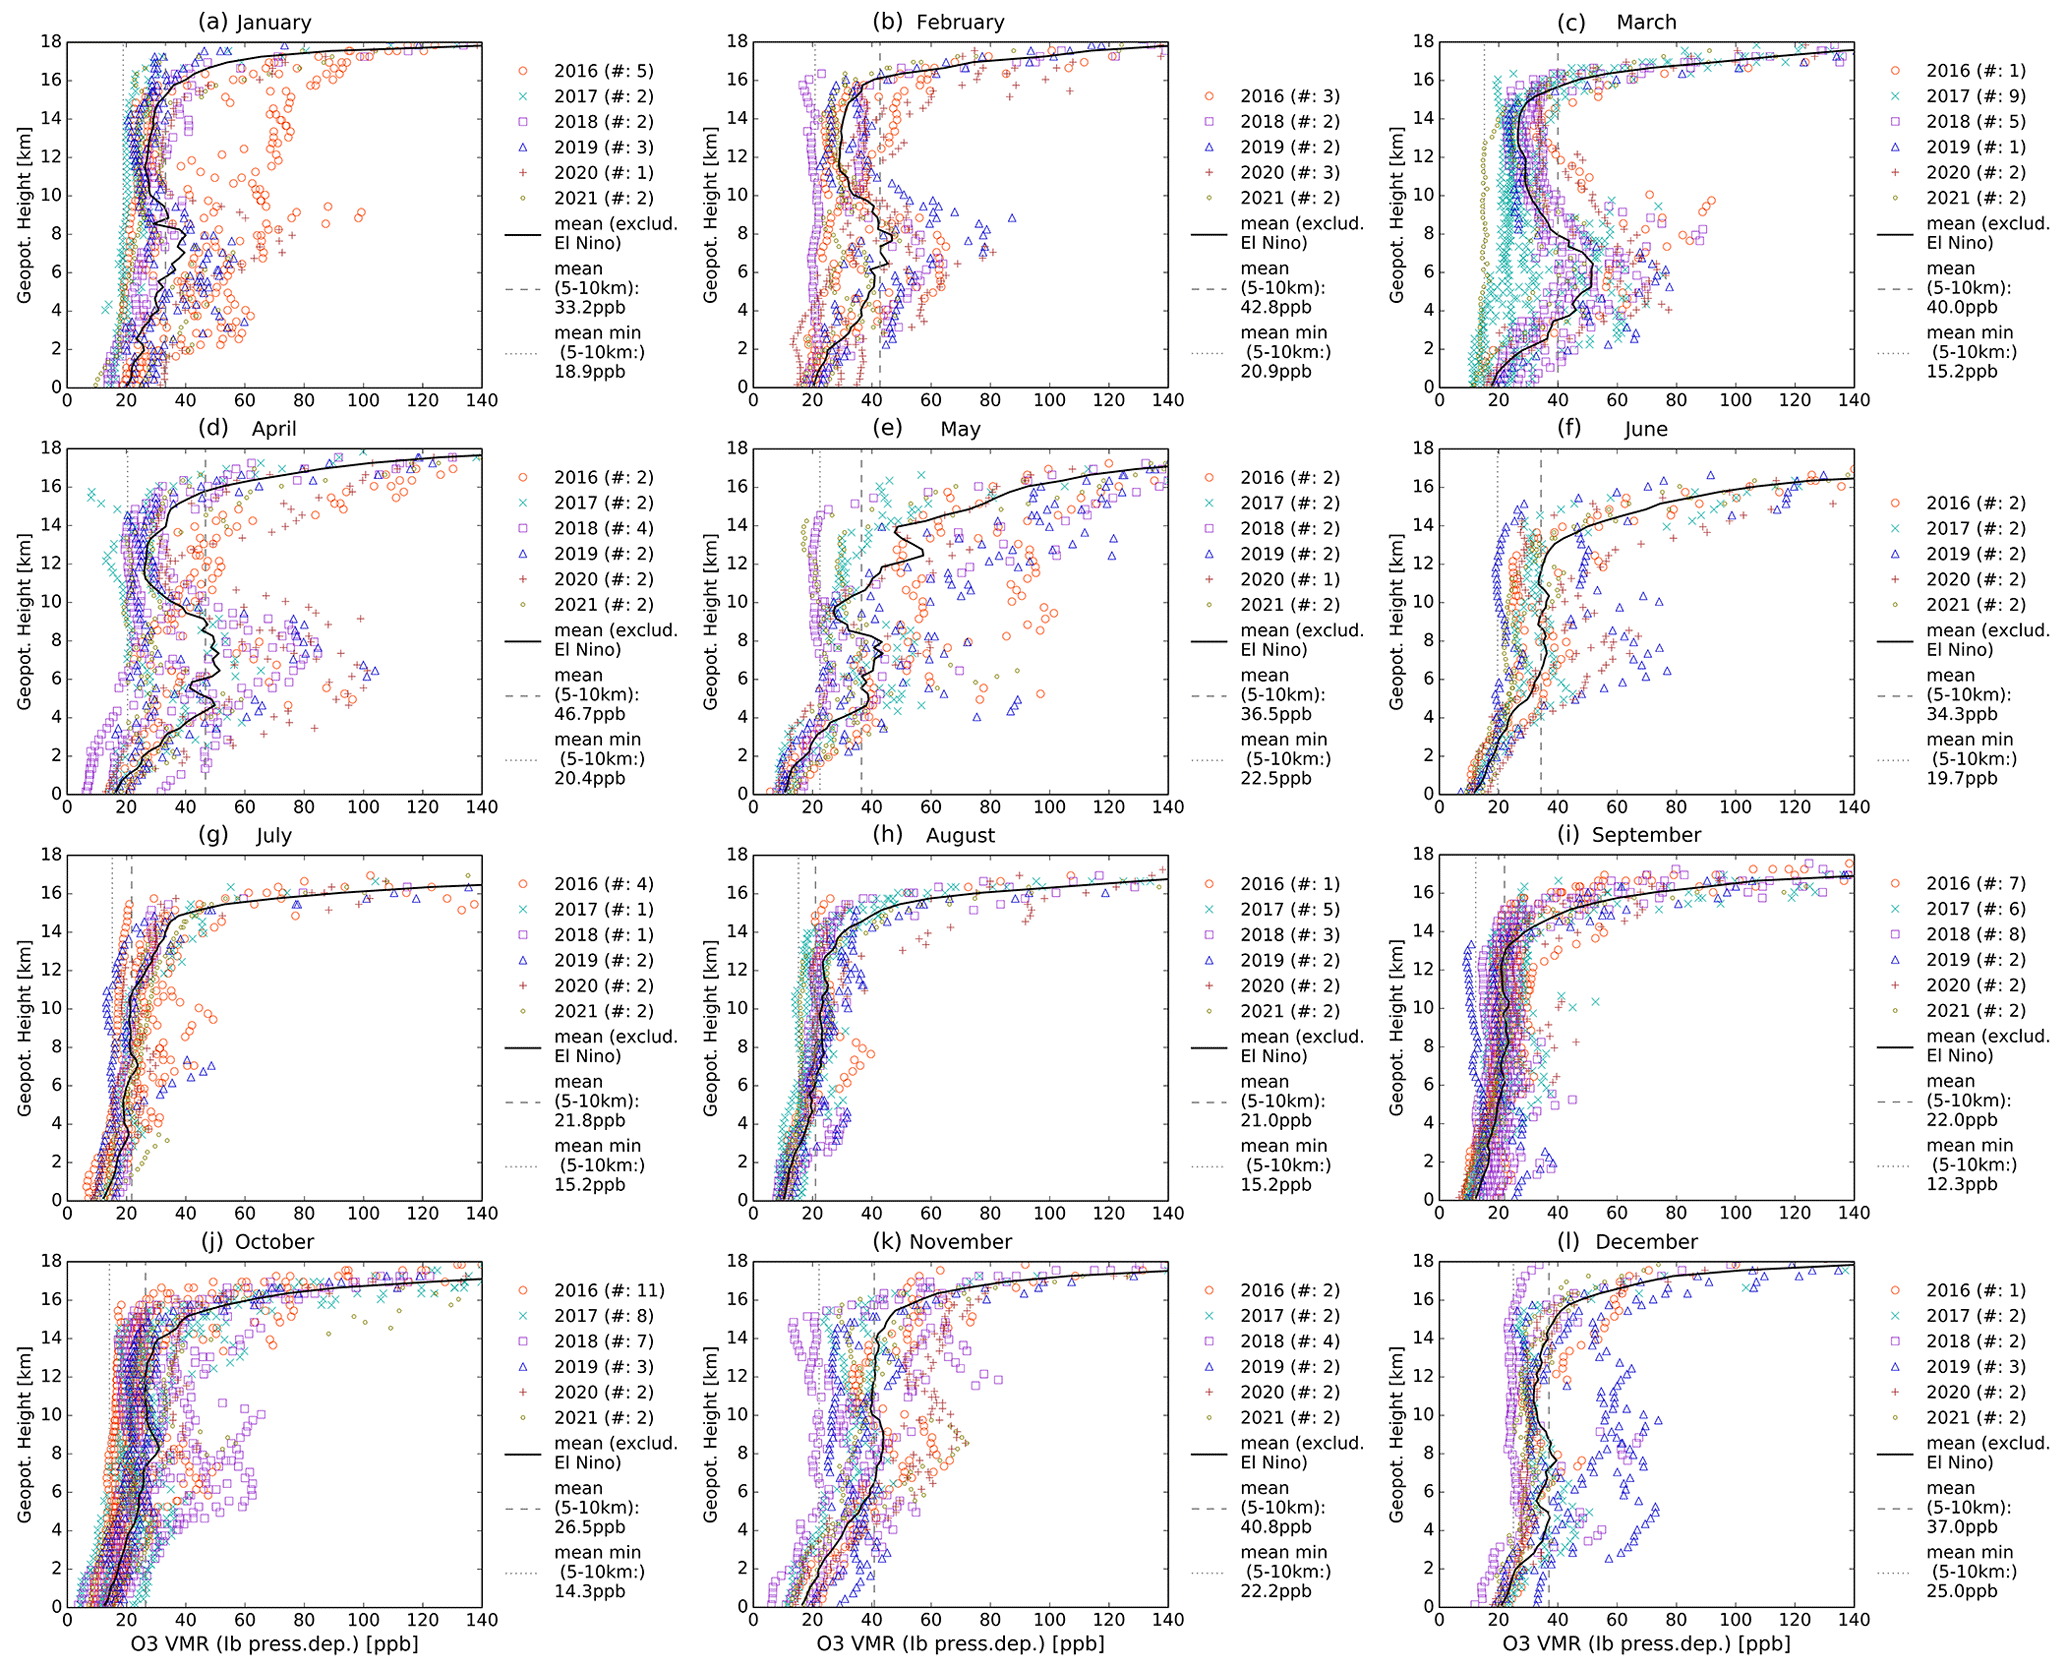
Figure A5All measured individual O3 VMR profiles sorted by month and year (colored markers), the monthly mean (solid black line) excluding El Niño 2016, i.e., starting August 2016, and monthly statistics (dashed line for mean between 5 and 10 km, dotted line for mean of minimum values per sounding between 5 and 10 km). The number of profiles per year is given in brackets.
Table A1Major specifications and standard operating procedures (SOP) of O3 soundings at the Palau Atmospheric Observatory (PAO) in accordance with recommendations from Smit and O3S-DQA Panel (2012) and Smit and the ASOPOS Panel (2014), except for the applied pressure-dependent background current correction.
All code used to produce the data and results is available upon request. The ozonesonde data set is available under https://doi.org/10.5281/zenodo.6920648 (Müller et al., 2022) and will be included in the SHADOZ database in the future. SHADOZ data can be accessed via the archive at https://doi.org/10.57721/SHADOZ-V06 (NASA/GSFC, 2023). The Palau weather station data (station code: PTRO 91408) was accessed via the upper-air sounding database provided by the University of Wyoming (http://weather.uwyo.edu/upperair/sounding.html, University of Wyoming, 2020). ECMWF ERA5 data used for SST in Fig. 1 were accessed via https://apps.ecmwf.int/data-catalogues/era5/?stream=moda&levtype=sfc&expver=1&type=an&class=ea (ECMWF, 2022). The ENSO Index data are provided by NOAA (https://psl.noaa.gov/enso/mei/, NOAA, 2023).
KM prepared the first draft and worked closely with JST on the text and figures. PvdG and SP were involved in the creation of Sect. 2.1 and 2.5. JN provided input for Sect. 2.3, and CR provided input for Sect. 2.4. PvdG and MR supported the analysis and provided effective and constructive comments to improve the manuscript. KM, SP, and JST performed the measurements. All authors contributed to writing the paper.
The contact author has declared that none of the authors has any competing interests.
Publisher's note: Copernicus Publications remains neutral with regard to jurisdictional claims made in the text, published maps, institutional affiliations, or any other geographical representation in this paper. While Copernicus Publications makes every effort to include appropriate place names, the final responsibility lies with the authors.
This article is part of the special issue “StratoClim stratospheric and upper tropospheric processes for better climate predictions (ACP/AMT inter-journal SI)”. It is not associated with a conference.
The setup of the PAO and this study was part of the StratoClim project (http://www.stratoclim.org, last access: 8 January 2024). The authors want to thank Patrick Tellei, President of the Palau Community College, for provision of space; German Honorary Consul Thomas Schubert, for overall support; and various people and institutions for operations at the PAO: Pat and Lori Colin (CRRF), Gerda Ucharm (CRRF), Ingo Beninga (impres GmbH), Wilfried Ruhe (impres GmbH), Winfried Markert (Uni Bremen), Tine Weinzierl (Uni Bremen), and Jürgen “Egon” Graeser (AWI). The authors thank Ryan M. Stauffer as SHADOZ PI, Anne M. Thompson as SHADOZ Founding PI and Debra E. Kollonige as SHADOZ Archiver and Website Manager. Herman Smit has provided support on various levels while establishing the ozone record and during experiments with the instrumentation. Fruitful discussions with Laura Pan have improved our understanding of the time series. The authors want to further thank Jonathan Shonk for kindly providing data for Fig. 6f. Finally, the authors thank the two anonymous reviewers for providing valuable comments and thus improving the manuscript.
This research has been supported by the European Union's Seventh Framework Programme, FP7 Cooperation (grant no. 603557).
This paper was edited by Jerome Brioude and reviewed by two anonymous referees.
Anderson, D. C., Nicely, J. M., Salawitch, R. J., Canty, T. P., Dickerson, R. R., Hanisco, T. F., Wolfe, G. M., Apel, E. C., Atlas, E., Bannan, T., Bauguitte, S., Blake, N. J., Bresch, J. F., Campos, T. L., Carpenter, L. J., Cohen, M. D., Evans, M., Fernandez, R. P., Kahn, B. H., Kinnison, D. E., Hall, S. R., Harris, N. R., Hornbrook, R. S., Lamarque, J.-F., Le Breton, M., Lee, J. D., Percival, C., Pfister, L., Pierce, R. B., Riemer, D. D., Saiz-Lopez, A., Stunder, B. J., Thompson, A. M., Ullmann, K., Vaughan, A., and Weinheimer, A. J.: A Pervasive Role for Biomass Burning in Tropical High Ozone/Low Water Structures, Nat. Commun., 7, 10267, https://doi.org/10.1038/ncomms10267, 2016. a, b
Ansmann, A., Wandinger, U., Riebesell, M., Weitkamp, C., and Michaelis, W.: Independent Measurement of Extinction and Backscatter Profiles in Cirrus Clouds by Using a Combined Raman Elastic-Backscatter Lidar, Appl. Optics, 31, 7113, https://doi.org/10.1364/AO.31.007113, 1992. a
Australian Bureau of Meteorology and CSIRO: Climate Variability, Extremes and Change in the Western Tropical Pacific: New Science and Updated Country Reports 2014, Centre for Australian Weather and Climate Research, Collingwood, Vic., ISBN 978-1-4863-0289-5, 2014. a
Brunamonti, S., Jorge, T., Oelsner, P., Hanumanthu, S., Singh, B. B., Kumar, K. R., Sonbawne, S., Meier, S., Singh, D., Wienhold, F. G., Luo, B. P., Boettcher, M., Poltera, Y., Jauhiainen, H., Kayastha, R., Karmacharya, J., Dirksen, R., Naja, M., Rex, M., Fadnavis, S., and Peter, T.: Balloon-borne measurements of temperature, water vapor, ozone and aerosol backscatter on the southern slopes of the Himalayas during StratoClim 2016–2017, Atmos. Chem. Phys., 18, 15937–15957, https://doi.org/10.5194/acp-18-15937-2018, 2018. a
Cairo, F., De Muro, M., Snels, M., Di Liberto, L., Bucci, S., Legras, B., Kottayil, A., Scoccione, A., and Ghisu, S.: Lidar observations of cirrus clouds in Palau (7∘33′ N, 134∘48′ E), Atmos. Chem. Phys., 21, 7947–7961, https://doi.org/10.5194/acp-21-7947-2021, 2021. a, b
Crawford, J. H., Davis, D. D., Chen, G., Bradshaw, J., Sandholm, S., Kondo, Y., Merrill, J., Liu, S., Browell, E., Gregory, G., Anderson, B., Sachse, G., Barrick, J., Blake, D., Talbot, R., and Pueschel, R.: Implications of Large Scale Shifts in Tropospheric NOx Levels in the Remote Tropical Pacific, J. Geophys. Res.-Atmos., 102, 28447–28468, https://doi.org/10.1029/97JD00011, 1997. a
Crutzen, P. J., Grooss, J. U., Bruhl, C., Muller, R., and Russell, J. M.: A Reevaluation of the Ozone Budget with HALOE UARS Data: No Evidence for the Ozone Deficit, Science, 268, 705–708, https://doi.org/10.1126/science.268.5211.705, 1995. a
Deshler, T., Stübi, R., Schmidlin, F. J., Mercer, J. L., Smit, H. G. J., Johnson, B. J., Kivi, R., and Nardi, B.: Methods to homogenize electrochemical concentration cell (ECC) ozonesonde measurements across changes in sensing solution concentration or ozonesonde manufacturer, Atmos. Meas. Tech., 10, 2021–2043, https://doi.org/10.5194/amt-10-2021-2017, 2017. a
Diallo, M., Riese, M., Birner, T., Konopka, P., Müller, R., Hegglin, M. I., Santee, M. L., Baldwin, M., Legras, B., and Ploeger, F.: Response of stratospheric water vapor and ozone to the unusual timing of El Niño and the QBO disruption in 2015–2016, Atmos. Chem. Phys., 18, 13055–13073, https://doi.org/10.5194/acp-18-13055-2018, 2018. a, b, c, d
Di Liberto, T.: Drought in the Pacific, National Oceanic Atmospheric Administation (NOAA), https://www.climate.gov/news-features/event-tracker/drought-pacific (last access: 8 January 2024), 2016. a
Dirksen, R. J., Sommer, M., Immler, F. J., Hurst, D. F., Kivi, R., and Vömel, H.: Reference quality upper-air measurements: GRUAN data processing for the Vaisala RS92 radiosonde, Atmos. Meas. Tech., 7, 4463–4490, https://doi.org/10.5194/amt-7-4463-2014, 2014. a
Dirksen, R. J., Bodeker, G. E., Thorne, P. W., Merlone, A., Reale, T., Wang, J., Hurst, D. F., Demoz, B. B., Gardiner, T. D., Ingleby, B., Sommer, M., von Rohden, C., and Leblanc, T.: Managing the transition from Vaisala RS92 to RS41 radiosondes within the Global Climate Observing System Reference Upper-Air Network (GRUAN): a progress report, Geosci. Instrum. Method. Data Syst., 9, 337–355, https://doi.org/10.5194/gi-9-337-2020, 2020. a
ECMWF: ERA5 data, ECMWF MARS archive [data set], https://apps.ecmwf.int/data-catalogues/era5/?stream=moda&levtype=sfc&expver=1&type=an&class=ea, last access: 22 August 2022. a, b
Folkins, I.: Tropical Ozone as an Indicator of Deep Convection, J. Geophys. Res., 107, 4184, https://doi.org/10.1029/2001JD001178, 2002. a, b
Froidevaux, L., Jiang, Y. B., Lambert, A., Livesey, N. J., Read, W. G., Waters, J. W., Browell, E. V., Hair, J. W., Avery, M. A., McGee, T. J., Twigg, L. W., Sumnicht, G. K., Jucks, K. W., Margitan, J. J., Sen, B., Stachnik, R. A., Toon, G. C., Bernath, P. F., Boone, C. D., Walker, K. A., Filipiak, M. J., Harwood, R. S., Fuller, R. A., Manney, G. L., Schwartz, M. J., Daffer, W. H., Drouin, B. J., Cofield, R. E., Cuddy, D. T., Jarnot, R. F., Knosp, B. W., Perun, V. S., Snyder, W. V., Stek, P. C., Thurstans, R. P., and Wagner, P. A.: Validation of Aura Microwave Limb Sounder Stratospheric Ozone Measurements, J. Geophys. Res., 113, D15S20, https://doi.org/10.1029/2007JD008771, 2008. a
Fueglistaler, S.: Stepwise Changes in Stratospheric Water Vapor?, J. Geophys. Res.-Atmos., 117, D13302, https://doi.org/10.1029/2012JD017582, 2012. a
Fueglistaler, S., Wernli, H., and Peter, T.: Tropical Troposphere-to-Stratosphere Transport Inferred from Trajectory Calculations, J. Geophys. Res.-Atmos., 109, https://doi.org/10.1029/2003JD004069, 2004. a
Fueglistaler, S., Dessler, A. E., Dunkerton, T. J., Folkins, I., Fu, Q., and Mote, P. W.: Tropical Tropopause Layer, Rev. Geophys., 47, RG1004, https://doi.org/10.1029/2008RG000267, 2009. a, b
Fujiwara, M., Tomikawa, Y., Kita, K., Kondo, Y., Komala, N., Saraspriya, S., Manik, T., Suripto, A., Kawakami, S., Ogawa, T., Kelana, E., Suhardi, B., Harijono, S., Kudsy, M., Sribimawati, T., and Yamanaka, M.: Ozonesonde Observations in the Indonesian Maritime Continent: A Case Study on Ozone Rich Layer in the Equatorial Upper Troposphere, Atmos. Environ., 37, 353–362, https://doi.org/10.1016/S1352-2310(02)00891-9, 2003. a
Gao, R. S., Rosenlof, K. H., Fahey, D. W., Wennberg, P. O., Hintsa, E. J., and Hanisco, T. F.: OH in the Tropical Upper Troposphere and Its Relationships to Solar Radiation and Reactive Nitrogen, J. Atmos. Chem., 71, 55–64, https://doi.org/10.1007/s10874-014-9280-2, 2014. a
Garfinkel, C. I. and Hartmann, D. L.: Effects of the El Niño–Southern Oscillation and the Quasi-Biennial Oscillation on Polar Temperatures in the Stratosphere, J. Geophys. Res., 112, D19112, https://doi.org/10.1029/2007JD008481, 2007. a
Gettelman, A. and Forster, P. d. F.: A Climatology of the Tropical Tropopause Layer, J. Meteorol. Soc. Jpn., 80, 911–924, https://doi.org/10.2151/jmsj.80.911, 2002. a, b, c
Graedel, T., Crutzen, P. J., Kläger, F., and Brühl, C.: Chemie der Atmosphäre: Bedeutung für Klima und Umwelt, Spektrum-Lehrbuch, Spektrum Akademischer Verlag, Heidelberg, ISBN 978-3-86025-204-8, 1994. a
Hannigan, J. W., Ortega, I., Shams, S. B., Blumenstock, T., Campbell, J. E., Conway, S., Flood, V., Garcia, O., Griffith, D., Grutter, M., Hase, F., Jeseck, P., Jones, N., Mahieu, E., Makarova, M., De Mazière, M., Morino, I., Murata, I., Nagahama, T., Nakijima, H., Notholt, J., Palm, M., Poberovskii, A., Rettinger, M., Robinson, J., Röhling, A. N., Schneider, M., Servais, C., Smale, D., Stremme, W., Strong, K., Sussmann, R., Te, Y., Vigouroux, C., and Wizenberg, T.: Global Atmospheric OCS Trend Analysis From 22 NDACC Stations, J. Geophys. Res.-Atmos., 127, e2021JD035764, https://doi.org/10.1029/2021JD035764, 2022. a
Hersbach, H., Bell, B., Berrisford, P., Hirahara, S., Horányi, A., Muñoz-Sabater, J., Nicolas, J., Peubey, C., Radu, R., Schepers, D., Simmons, A., Soci, C., Abdalla, S., Abellan, X., Balsamo, G., Bechtold, P., Biavati, G., Bidlot, J., Bonavita, M., De Chiara, G., Dahlgren, P., Dee, D., Diamantakis, M., Dragani, R., Flemming, J., Forbes, R., Fuentes, M., Geer, A., Haimberger, L., Healy, S., Hogan, R. J., Hólm, E, Janisková, M., Keeley, S., Laloyaux, P., Lopez, P., Lupu, C., Radnoti, G., de Rosnay, P., Rozum, I., Vamborg, F., Villaume, S., and Thépaut, J.-N.: The ERA5 global reanalysis. Q. J. Roy. Meteor. Soc., 146, 1999–2049, https://doi.org/10.1002/qj.3803, 2020. a
Holton, J. R., Haynes, P. H., McIntyre, M. E., Douglass, A. R., Rood, R. B., and Pfister, L.: Stratosphere-Troposphere Exchange, Rev. Geophys., 33, 403–439, 1995. a
Huang, B., L'Heureux, M., Hu, Z.-Z., and Zhang, H.-M.: Ranking the Strongest ENSO Events While Incorporating SST Uncertainty, Geophys. Res. Lett., 43, 9165–9172, 2016. a
Hubert, D., Lambert, J.-C., Verhoelst, T., Granville, J., Keppens, A., Baray, J.-L., Bourassa, A. E., Cortesi, U., Degenstein, D. A., Froidevaux, L., Godin-Beekmann, S., Hoppel, K. W., Johnson, B. J., Kyrölä, E., Leblanc, T., Lichtenberg, G., Marchand, M., McElroy, C. T., Murtagh, D., Nakane, H., Portafaix, T., Querel, R., Russell III, J. M., Salvador, J., Smit, H. G. J., Stebel, K., Steinbrecht, W., Strawbridge, K. B., Stübi, R., Swart, D. P. J., Taha, G., Tarasick, D. W., Thompson, A. M., Urban, J., van Gijsel, J. A. E., Van Malderen, R., von der Gathen, P., Walker, K. A., Wolfram, E., and Zawodny, J. M.: Ground-based assessment of the bias and long-term stability of 14 limb and occultation ozone profile data records, Atmos. Meas. Tech., 9, 2497–2534, https://doi.org/10.5194/amt-9-2497-2016, 2016. a
Immler, F., Beninga, I., Ruhe, W., Stein, B., Mielke, B., Rutz, S., Terli, O., and Schrems, O.: A New LIDAR System for the Detection of Cloud and Aerosol Backscatter, Depolarization, Extinction, and Fluorescence, in: 23rd International Laser Radar Converence, 24–28 July 2006, Nara, Japan, edited by: Nagasawa, C. and Sugimoto, N., Laser Radar Society of Japan, Tsukuba, Japan, 35–38, https://doi.org/10013/epic.25672.d001, 2006. a
Kiladis, G. N., Straub, K. H., Reid, G. C., and Gage, K. S.: Aspects of Interannual and Intraseasonal Variability of the Tropopause and Lower Stratosphere, Q. J. Roy. Meteor. Soc., 127, 1961–1983, https://doi.org/10.1002/qj.49712757606, 2001. a
Klett, J. D.: Lidar Inversion with Variable Backscatter Extinction Ratios, Appl. Optics, 24, 1638–1643, 1985. a
Kley, D., Crutzen, P. J., Smit, H. G. J., Vomel, H., Oltmans, S. J., Grassl, H., and Ramanathan, V.: Observations of Near-Zero Ozone Concentrations Over the Convective Pacific: Effects on Air Chemistry, Science, 274, 230–233, https://doi.org/10.1126/science.274.5285.230, 1996. a
Komhyr, W. D.: Electrical Concentration Cells for Gas Analysis, Ann. Geophys.-Germany, 25, 203–210, 1969. a
Komhyr, W. D.: Operations Handbook – Ozone Measurements to 40-Km Altitude with Model 4A Electrochemical Concentration Cell (ECC) Ozonesondes (Used with 1680-MHz Radiosondes), Technical Memorandum ERL ARL-149, National Oceanic and Atmospheric Administration (NOAA), Silver Spring, MD, United States, 1986. a
Konopka, P., Ploeger, F., Tao, M., and Riese, M.: Zonally Resolved Impact of ENSO on the Stratospheric Circulation and Water Vapor Entry Values, J. Geophys. Res.-Atmos., 121, 11,486–11,501, https://doi.org/10.1002/2015JD024698, 2016. a
Krüger, K., Tegtmeier, S., and Rex, M.: Long-term climatology of air mass transport through the Tropical Tropopause Layer (TTL) during NH winter, Atmos. Chem. Phys., 8, 813–823, https://doi.org/10.5194/acp-8-813-2008, 2008. a
Manney, G. L., Froidevaux, L., Waters, J. W., Zurek, R. W., Read, W. G., Elson, L. S., Kumer, J. B., Mergenthaler, J. L., Roche, A. E., O'Neill, A., Harwood, R. S., Mackenzie, I., and Swinbank, R.: Chemical Depletion of Ozone in the Arctic Lower Stratosphere during Winter 1992–93, Nature, 370, 429–434, https://doi.org/10.1038/370429a0, 1994. a
Mapes, B. E.: Water's Two Height Scales: The Moist Adiabat and the Radiative Troposphere, Q. J. Roy. Meteor. Soc., 127, 2353–2366, https://doi.org/10.1002/qj.49712757708, 2001. a
Miles, W., Grecni, Z., Matsutaro, E. X., Colin, P., Keener, V., and Golbuu, Y.: Climate Change in Palau: Indicators and Considerations for Key Sectors, Tech. rep., East-West Center, 66 pp., https://doi.org/10.5281/zenodo.4124259, 2020. a
Müller, K.: Characterization of Ozone and the Oxidizing Capacity of the Tropical West Pacific Troposphere, PhD thesis, Universität Bremen, https://doi.org/10.26092/ELIB/463, 2020. a, b, c, d, e
Müller, K., Graeser, J., Patris, S., Beninga, I., Ruhe, W., Ucharm, G., and Tradowsky, J.: Ozone sonde and radio sonde data record Palau Atmospheric Observatory 2016–2021 (V1.0), Zenodo [data set], https://doi.org/10.5281/zenodo.6920648, 2022. a, b
Müller, K., Wohltmann, I., von der Gathen, P., and Rex, M.: Air Mass Transport to the Tropical West Pacific Troposphere inferred from Ozone and Relative Humidity Balloon Observations above Palau, EGUsphere [preprint], https://doi.org/10.5194/egusphere-2023-1518, 2023. a, b, c, d, e, f, g, h, i, j, k
NASA/GSFC: Southern Hemisphere Additional Ozonesondes version 6 ozonesonde profile data, National Aeronautics and Space Administration Goddard Space Flight Center (NASA/GSFC) [data set], https://doi.org/10.57721/SHADOZ-V06, 2019. a
Newell, R. E. and Gould-Stewart, S.: A Stratospheric Fountain?, J. Atmos. Sci., 38, 2789–2796, 1981. a
Newton, R., Vaughan, G., Ricketts, H. M. A., Pan, L. L., Weinheimer, A. J., and Chemel, C.: Ozonesonde profiles from the West Pacific Warm Pool: measurements and validation, Atmos. Chem. Phys., 16, 619–634, https://doi.org/10.5194/acp-16-619-2016, 2016. a, b
NOAA: MEI.v2 data, NOAA Physical Science Laboratory [data set], https://psl.noaa.gov/enso/mei/, last access: 1 December 2023. a, b, c
Notholt, J., Toon, G. C., Rinsland, C. P., Pougatchev, N. S., Jones, N. B., Connor, B. J., Weller, R., Gautrois, M., and Schrems, O.: Latitudinal Variations of Trace Gas Concentrations in the Free Troposphere Measured by Solar Absorption Spectroscopy during a Ship Cruise, J. Geophys. Res.-Atmos., 105, 1337–1349, https://doi.org/10.1029/1999JD900940, 2000. a
Ogino, S.-Y., Fujiwara, M., Shiotani, M., Hasebe, F., Matsumoto, J., T. Hoang, T. H., and T. Nguyen, T. T.: Ozone Variations over the Northern Subtropical Region Revealed by Ozonesonde Observations in Hanoi, J. Geophys. Res.-Atmos., 118, 3245–3257, https://doi.org/10.1002/jgrd.50348, 2013. a
Oltmans, S. J., Johnson, B. J., Harris, J. M., Thompson, A. M., Liu, H. Y., Chan, C. Y., Vömel, H., Fujimoto, T., Brackett, V. G., Chang, W. L., Chen, J.-P., Kim, J. H., Chan, L. Y., and Chang, H.-W.: Tropospheric Ozone over the North Pacific from Ozonesonde Observations, J. Geophys. Res., 109, D15S01, https://doi.org/10.1029/2003JD003466, 2004. a
Pan, L. L., Paulik, L. C., Honomichl, S. B., Munchak, L. A., Bian, J., Selkirk, H. B., and Vömel, H.: Identification of the Tropical Tropopause Transition Layer Using the Ozone-Water Vapor Relationship, J. Geophys. Res.-Atmos., 119, 3586–3599, https://doi.org/10.1002/2013JD020558, 2014. a, b
Pan, L. L., Honomichl, S. B., Randel, W. J., Apel, E. C., Atlas, E. L., Beaton, S. P., Bresch, J. F., Hornbrook, R., Kinnison, D. E., Lamarque, J.-F., Saiz-Lopez, A., Salawitch, R. J., and Weinheimer, A. J.: Bimodal Distribution of Free Tropospheric Ozone over the Tropical Western Pacific Revealed by Airborne Observations, Geophys. Res. Lett., 42, 7844–7851, https://doi.org/10.1002/2015GL065562, 2015. a, b, c, d, e, f, g, h, i
Pan, L. L., Atlas, E. L., Salawitch, R. J., Honomichl, S. B., Bresch, J. F., Randel, W. J., Apel, E. C., Hornbrook, R. S., Weinheimer, A. J., Anderson, D. C., Andrews, S. J., Baidar, S., Beaton, S. P., Campos, T. L., Carpenter, L. J., Chen, D., Dix, B., Donets, V., Hall, S. R., Hanisco, T. F., Homeyer, C. R., Huey, L. G., Jensen, J. B., Kaser, L., Kinnison, D. E., Koenig, T. K., Lamarque, J.-F., Liu, C., Luo, J., Luo, Z. J., Montzka, D. D., Nicely, J. M., Pierce, R. B., Riemer, D. D., Robinson, T., Romashkin, P., Saiz-Lopez, A., Schauffler, S., Shieh, O., Stell, M. H., Ullmann, K., Vaughan, G., Volkamer, R., and Wolfe, G.: The Convective Transport of Active Species in the Tropics (CONTRAST) Experiment, B. Am. Meteorol. Soc., 98, 106–128, https://doi.org/10.1175/BAMS-D-14-00272.1, 2017. a, b
Paulik, L. C. and Birner, T.: Quantifying the deep convective temperature signal within the tropical tropopause layer (TTL), Atmos. Chem. Phys., 12, 12183–12195, https://doi.org/10.5194/acp-12-12183-2012, 2012. a
Polhemus, D. A.: Drought in the U.S.-Affiliated Pacific Islands: A Multi-level Assessment, report, Pacific Islands Climate Science Center Honolulu, HI, https://doi.org/10.21429/C9ZS74, 2017. a
Prather, M. J., Zhu, X., Tang, Q., Hsu, J., and Neu, J. L.: An Atmospheric Chemist in Search of the Tropopause, J. Geophys. Res., 116, D04306, https://doi.org/10.1029/2010JD014939, 2011. a, b
Randel, W. J. and Jensen, E. J.: Physical Processes in the Tropical Tropopause Layer and Their Roles in a Changing Climate, Nat. Geosci., 6, 169–176, https://doi.org/10.1038/ngeo1733, 2013. a, b
Randel, W. J. and Thompson, A. M.: Interannual Variability and Trends in Tropical Ozone Derived from SAGE II Satellite Data and SHADOZ Ozonesondes, J. Geophys. Res., 116, D07303, https://doi.org/10.1029/2010JD015195, 2011. a
Randel, W. J., Park, M., Wu, F., and Livesey, N.: A Large Annual Cycle in Ozone above the Tropical Tropopause Linked to the Brewer–Dobson Circulation, J. Atmos. Sci., 64, 4479–4488, https://doi.org/10.1175/2007JAS2409.1, 2007. a, b
Randel, W. J., Garcia, R. R., Calvo, N., and Marsh, D.: ENSO Influence on Zonal Mean Temperature and Ozone in the Tropical Lower Stratosphere, Geophys. Res. Lett., 36, L15822, https://doi.org/10.1029/2009GL039343, 2009. a
Rex, M., Wohltmann, I., Ridder, T., Lehmann, R., Rosenlof, K., Wennberg, P., Weisenstein, D., Notholt, J., Krüger, K., Mohr, V., and Tegtmeier, S.: A tropical West Pacific OH minimum and implications for stratospheric composition, Atmos. Chem. Phys., 14, 4827–4841, https://doi.org/10.5194/acp-14-4827-2014, 2014. a, b, c, d, e, f, g, h, i
Riese, M., Ploeger, F., Rap, A., Vogel, B., Konopka, P., Dameris, M., and Forster, P.: Impact of Uncertainties in Atmospheric Mixing on Simulated UTLS Composition and Related Radiative Effects: Impact of Mixing on Radiative Effects, J. Geophys. Res.-Atmos., 117, D16305, https://doi.org/10.1029/2012JD017751, 2012. a
Rosen, J. M. and Kjome, N. T.: Backscattersonde: A New Instrument for Atmospheric Aerosol Research, Appl. Optics, 30, 1552–1561, 1991. a
Schneider, T., Bischoff, T., and Haug, G. H.: Migrations and Dynamics of the Intertropical Convergence Zone, Nature, 513, 45–53, https://doi.org/10.1038/nature13636, 2014. a
Schoeberl, M. R. and Dessler, A. E.: Dehydration of the stratosphere, Atmos. Chem. Phys., 11, 8433–8446, https://doi.org/10.5194/acp-11-8433-2011, 2011. a
Shiotani, M.: Annual, Quasi-Biennial, and El Niño-Southern Oscillation (ENSO) Time-Scale Variations in Equatorial Total Ozone, J. Geophys. Res., 97, 7625, https://doi.org/10.1029/92JD00530, 1992. a
Shonk, J. K. P., Guilyardi, E., Toniazzo, T., Woolnough, S. J., and Stockdale, T.: Identifying Causes of Western Pacific ITCZ Drift in ECMWF System 4 Hindcasts, Clim. Dynam., 50, 939–954, https://doi.org/10.1007/s00382-017-3650-9, 2018. a, b, c
Smit, H. G. J. and O3S-DQA Panel: Guidelines for Homogenization of Ozonesonde Data, SI2N/O3S-DQA Activity as part of “Past Changes in the Vertical Distribution of Ozone Assessment”, World Calibration Center for Ozone Sondes (WCCOS) of the World Meteorological Organization (WMO), https://www.wccos-josie.org/en/o3s-dqa/ (last access: 8 January 2024), 2012. a, b
Smit, H. G. J. and the ASOPOS Panel: Quality Assurance and Quality Control for Ozonesonde Measurements in GAW, WMO Global Atmosphere Watch Report Series, No. 201, World Meteorological Organization, Geneva, https://library.wmo.int/idurl/4/55131 (last access: 8 January 2024), 2014. a, b, c, d
Smit, H. G. J., Sträter, W., Johnson, B. J., Oltmans, S. J., Davies, J., Tarasick, D. W., Hoegger, B., Stubi, R., Schmidlin, F. J., Northam, T., Thompson, A. M., Witte, J. C., Boyd, I., and Posny, F.: Assessment of the Performance of ECC-ozonesondes under Quasi-Flight Conditions in the Environmental Simulation Chamber: Insights from the Juelich Ozone Sonde Intercomparison Experiment (JOSIE), J. Geophys. Res., 112, D19306, https://doi.org/10.1029/2006JD007308, 2007. a
Smit, H. G. J., Thompson, A. M., and the ASOPOS 2.0 Panel: Ozonesonde Measurement Principles and Best Operational Practices, WMO Global Atmosphere Watch Report Series, No. 268, World Meteorological Organization, Geneva, https://library.wmo.int/idurl/4/57720 (last access: 8 January 2024), 2021. a, b, c, d
Smit, H. G. J., Poyraz, D., Van Malderen, R., Thompson, A. M., Tarasick, D. W., Stauffer, R. M., Johnson, B. J., and Kollonige, D. E.: New insights from the Jülich Ozone Sonde Intercomparison Experiment: calibration functions traceable to one ozone reference instrument, Atmos. Meas. Tech., 17, 73–112, https://doi.org/10.5194/amt-17-73-2024, 2024. a
Smith, I. N., Moise, A. F., and Colman, R. A.: Large-Scale Circulation Features in the Tropical Western Pacific and Their Representation in Climate Models, J. Geophys. Res.-Atmos., 117, D04109, https://doi.org/10.1029/2011JD016667, 2012. a
Solomon, S., Garcia, R. R., Rowland, F. S., and Wuebbles, D. J.: On the Depletion of Antarctic Ozone, Nature, 321, 755–758, https://doi.org/10.1038/321755a0, 1986. a
Solomon, S., Thompson, D. W. J., Portmann, R. W., Oltmans, S. J., and Thompson, A. M.: On the Distribution and Variability of Ozone in the Tropical Upper Troposphere: Implications for Tropical Deep Convection and Chemical-Dynamical Coupling, Geophys. Res. Lett., 32, L23813, https://doi.org/10.1029/2005GL024323, 2005. a
Solomon, S., Rosenlof, K. H., Portmann, R. W., Daniel, J. S., Davis, S. M., Sanford, T. J., and Plattner, G.-K.: Contributions of Stratospheric Water Vapor to Decadal Changes in the Rate of Global Warming, Science, 327, 1219–1223, https://doi.org/10.1126/science.1182488, 2010. a
Sun, B., Reale, T., Schroeder, S., Pettey, M., and Smith, R.: On the Accuracy of Vaisala RS41 versus RS92 Upper-Air Temperature Observations, J. Atmos. Ocean. Tech., 36, 635–653, https://doi.org/10.1175/JTECH-D-18-0081.1, 2019. a
Sun, X., Palm, M., Müller, K., Hachmeister, J., and Notholt, J.: Determination of the chemical equator from GEOS-Chem model simulation: a focus on the tropical western Pacific region, Atmos. Chem. Phys., 23, 7075–7090, https://doi.org/10.5194/acp-23-7075-2023, 2023. a
Taguchi, M.: Observed Connection of the Stratospheric Quasi-Biennial Oscillation with El Niño–Southern Oscillation in Radiosonde Data, J. Geophys. Res., 115, D18120, https://doi.org/10.1029/2010JD014325, 2010. a
Tarasick, D. W., Smit, H. G. J., Thompson, A. M., Morris, G. A., Witte, J. C., Davies, J., Nakano, T., Van Malderen, R., Stauffer, R. M., Johnson, B. J., Stübi, R., Oltmans, S. J., and Vömel, H.: Improving ECC Ozonesonde Data Quality: Assessment of Current Methods and Outstanding Issues, Earth Space Sci., 8, e2019EA000914, https://doi.org/10.1029/2019EA000914, 2021. a
Thompson, A. M., Witte, J. C., McPeters, R. D., Oltmans, S. J., Schmidlin, F. J., Logan, J. A., Fujiwara, M., Kirchhoff, V. W. J. H., Posny, F., Coetzee, G. J. R., Hoegger, B., Kawakami, S., Toshihiro, O., Johnson, B. J., Vömel, H., and Labow, G. J.: Southern Hemisphere Additional Ozonesondes (SHADOZ) 1998–2000 Tropical Ozone Climatology 1. Comparison with Total Ozone Mapping Spectrometer (TOMS) and Ground-Based Measurements, J. Geophys. Res., 108, 8238, https://doi.org/10.1029/2001JD000967, 2003a. a, b, c
Thompson, A. M., Witte, J. C., Oltmans, S. J., Schmidlin, F. J., Logan, J. A., Fujiwara, M., Kirchhoff, V. W. J. H., Posny, F., Coetzee, G. J. R., Hoegger, B., Kawakami, S., Ogawa, T., Fortuin, J. P. F., and Kelder, H. M.: Southern Hemisphere Additional Ozonesondes (SHADOZ) 1998–2000 Tropical Ozone Climatology 2. Tropospheric Variability and the Zonal Wave-One, J. Geophys. Res., 108, 8241, https://doi.org/10.1029/2002JD002241, 2003b. a, b, c, d
Thompson, A. M., Witte, J. C., Smit, H. G. J., Oltmans, S. J., Johnson, B. J., Kirchhoff, V. W. J. H., and Schmidlin, F. J.: Southern Hemisphere Additional Ozonesondes (SHADOZ) 1998–2004 Tropical Ozone Climatology: 3. Instrumentation, Station-to-Station Variability, and Evaluation with Simulated Flight Profiles, J. Geophys. Res., 112, D03304, https://doi.org/10.1029/2005JD007042, 2007. a, b
Thompson, A. M., Allen, A. L., Lee, S., Miller, S. K., and Witte, J. C.: Gravity and Rossby Wave Signatures in the Tropical Troposphere and Lower Stratosphere Based on Southern Hemisphere Additional Ozonesondes (SHADOZ), 1998–2007, J. Geophys. Res., 116, D05302, https://doi.org/10.1029/2009JD013429, 2011. a, b
Thompson, A. M., Miller, S. K., Tilmes, S., Kollonige, D. W., Witte, J. C., Oltmans, S. J., Johnson, B. J., Fujiwara, M., Schmidlin, F. J., Coetzee, G. J. R., Komala, N., Maata, M., bt Mohamad, M., Nguyo, J., Mutai, C., Ogino, S.-Y., Da Silva, F. R., Leme, N. M. P., Posny, F., Scheele, R., Selkirk, H. B., Shiotani, M., Stübi, R., Levrat, G., Calpini, B., Thouret, V., Tsuruta, H., Canossa, J. V., Vömel, H., Yonemura, S., Diaz, J. A., Tan Thanh, N. T., and Thuy Ha, H. T.: Southern Hemisphere Additional Ozonesondes (SHADOZ) Ozone Climatology (2005–2009): Tropospheric and Tropical Tropopause Layer (TTL) Profiles with Comparisons to OMI-based Ozone Products, J. Geophys. Res.-Atmos., 117, D23301, https://doi.org/10.1029/2011JD016911, 2012. a, b, c, d, e
Thompson, A. M., Witte, J. C., Sterling, C., Jordan, A., Johnson, B. J., Oltmans, S. J., Fujiwara, M., Vömel, H., Allaart, M., Piters, A., Coetzee, G. J. R., Posny, F., Corrales, E., Diaz, J. A., Félix, C., Komala, N., Lai, N., Ahn Nguyen, H. T., Maata, M., Mani, F., Zainal, Z., Ogino, S.-y., Paredes, F., Penha, T. L. B., Silva, F. R., Sallons-Mitro, S., Selkirk, H. B., Schmidlin, F. J., Stübi, R., and Thiongo, K.: First Reprocessing of Southern Hemisphere Additional Ozonesondes (SHADOZ) Ozone Profiles (1998–2016): 2. Comparisons With Satellites and Ground-Based Instruments, J. Geophys. Res.-Atmos., 122, 13000–13025, https://doi.org/10.1002/2017JD027406, 2017. a, b, c
Thompson, A. M., Smit, H. G. J., Witte, J. C., Stauffer, R. M., Johnson, B. J., Morris, G., von der Gathen, P., Van Malderen, R., Davies, J., Piters, A., Allaart, M., Posny, F., Kivi, R., Cullis, P., Hoang Anh, N. T., Corrales, E., Machinini, T., da Silva, F. R., Paiman, G., Thiong'o, K., Zainal, Z., Brothers, G. B., Wolff, K. R., Nakano, T., Stübi, R., Romanens, G., Coetzee, G. J. R., Diaz, J. A., Mitro, S., Mohamad, M., and Ogino, S.-Y.: Ozonesonde Quality Assurance: The JOSIE–SHADOZ (2017) Experience, B. Am. Meteorol. Soc., 100, 155–171, https://doi.org/10.1175/BAMS-D-17-0311.1, 2019. a, b, c, d, e
Thompson, A. M., Stauffer, R. M., Wargan, K., Witte, J. C., Kollonige, D. E., and Ziemke, J. R.: Regional and Seasonal Trends in Tropical Ozone From SHADOZ Profiles: Reference for Models and Satellite Products, J. Geophys. Res.-Atmos., 126, e2021JD034691, https://doi.org/10.1029/2021JD034691, 2021. a
University of Wyoming: Upper air data: Sounding, Department of Atmospheric Science, University of Wyoming [data set], http://weather.uwyo.edu/upperair/sounding.html (last access: 1 January 2020), 2020. a, b
Vaisala: Vaisala Radiosonde RS41 Measurement Performance, White paper, document identifier: B211356EN-B, 2017. a
Vigouroux, C., De Mazière, M., Demoulin, P., Servais, C., Hase, F., Blumenstock, T., Kramer, I., Schneider, M., Mellqvist, J., Strandberg, A., Velazco, V., Notholt, J., Sussmann, R., Stremme, W., Rockmann, A., Gardiner, T., Coleman, M., and Woods, P.: Evaluation of tropospheric and stratospheric ozone trends over Western Europe from ground-based FTIR network observations, Atmos. Chem. Phys., 8, 6865–6886, https://doi.org/10.5194/acp-8-6865-2008, 2008. a
Vömel, H. and Diaz, K.: Ozone sonde cell current measurements and implications for observations of near-zero ozone concentrations in the tropical upper troposphere, Atmos. Meas. Tech., 3, 495–505, https://doi.org/10.5194/amt-3-495-2010, 2010. a, b
Vömel, H., David, D, E., and Smith, K.: Accuracy of Tropospheric and Stratospheric Water Vapor Measurements by the Cryogenic Frost Point Hygrometer: Instrumental Details and Observations, J. Geophys. Res.-Atmos., 112, D08305, https://doi.org/10.1029/2006JD007224, 2007. a
Vömel, H., Naebert, T., Dirksen, R., and Sommer, M.: An update on the uncertainties of water vapor measurements using cryogenic frost point hygrometers, Atmos. Meas. Tech., 9, 3755–3768, https://doi.org/10.5194/amt-9-3755-2016, 2016. a
Vömel, H., Smit, H. G. J., Tarasick, D., Johnson, B., Oltmans, S. J., Selkirk, H., Thompson, A. M., Stauffer, R. M., Witte, J. C., Davies, J., van Malderen, R., Morris, G. A., Nakano, T., and Stübi, R.: A new method to correct the electrochemical concentration cell (ECC) ozonesonde time response and its implications for “background current” and pump efficiency, Atmos. Meas. Tech., 13, 5667–5680, https://doi.org/10.5194/amt-13-5667-2020, 2020. a, b
Witte, J. C., Thompson, A. M., Smit, H. G. J., Fujiwara, M., Posny, F., Coetzee, G. J. R., Northam, E. T., Johnson, B. J., Sterling, C. W., Mohamad, M., Ogino, S.-Y., Jordan, A., and da Silva, F. R.: First Reprocessing of Southern Hemisphere ADditional OZonesondes (SHADOZ) Profile Records (1998–2015): 1. Methodology and Evaluation: SHADOZ Reprocessed Ozonesonde Profiles, J. Geophys. Res.-Atmos., 122, 6611–6636, https://doi.org/10.1002/2016JD026403, 2017. a, b
Witte, J. C., Thompson, A. M., Smit, H. G. J., Vömel, H., Posny, F., and Stübi, R.: First Reprocessing of Southern Hemisphere ADditional OZonesondes Profile Records: 3. Uncertainty in Ozone Profile and Total Column, J. Geophys. Res.-Atmos., 123, 3243–3268, https://doi.org/10.1002/2017JD027791, 2018. a, b
Wolter, K. and Timlin, M. S.: El Niño Southern Oscillation Behaviour since 1871 as Diagnosed in an Extended Multivariate ENSO Index (MEI.Ext), Int. J. Climatol., 31, 1074–1087, https://doi.org/10.1002/joc.2336, 2011. a, b