the Creative Commons Attribution 4.0 License.
the Creative Commons Attribution 4.0 License.
 | 05 Feb 2024
What caused large ozone variabilities in three megacity clusters in eastern China during 2015–2020?
Tingting Hu
Yu Lin
Yuepeng Xu
Shanshan Ouyang
Boguang Wang
Yuanhang Zhang
Shaw Chen Liu
Due to a robust emission control policy, significant reductions in major air pollutants, such as PM2.5, SO2, NO2, and CO, were observed in China between 2015 and 2020. On the other hand, during the same period, there was a notable increase in ozone (O3) concentrations, making it a prominent air pollutant in eastern China. The annual mean concentration of maximum daily 8 h average (MDA8) O3 exhibited alarming linear increases of 2.4, 1.1, and 2.0 ppb yr−1 (ppb is for parts per billion) in three megacity clusters: Beijing–Tianjin–Hebei (BTH), the Yangtze River Delta (YRD), and the Pearl River Delta (PRD), respectively. Meanwhile, there was a significant 3-fold increase in the number of O3-exceeding days, defined as MDA8 O3 > 75 ppb. Our analysis indicated that the upward increases in the annual mean concentration of MDA8 were primarily driven by the rise in consecutive O3-exceeding days. There were expansions of high O3 in urban centers to rural areas accompanied by a saturation effect so that MDA8 O3 concentrations at the high-O3 stations in 2015 remained nearly constant at 100 ppb. Last, we found a close association between O3 episodes with 4 or more consecutive O3-exceeding days and the position and strength of tropical cyclones (TCs) in the northwest Pacific and the West Pacific subtropical high (WPSH). The TC and WPSH contributed to meteorological conditions characterized by clear skies, subsiding air motion, high vertical stability in the lower troposphere, increased solar radiation, and a positive temperature anomaly at the surface. These favorable meteorological conditions greatly facilitated the formation of O3. Thus, we propose that the worsening O3 increases observed in the BTH, YRD, and PRD regions from 2015 to 2020 can be mostly attributed to enhanced photochemical O3 production resulting from an increased occurrence of meteorological conditions with high solar radiation and positive temperature anomalies under the influence of the WPSH and TCs.
- Article
(14054 KB) - Full-text XML
-
Supplement
(2699 KB) - BibTeX
- EndNote


Ozone (O3) is an important greenhouse gas, which can also have adverse effects on human health, vegetation, and a variety of materials (Bell et al., 2006; Cohen et al., 2017; Kalabokas et al., 2020; Nuvolone et al., 2018). Surface O3 is a secondary pollutant produced by photochemical reactions involving O3 precursors such as volatile organic compounds (VOCs), carbon monoxide (CO), and nitrogen oxide (NOx) (Ma et al., 2012; Monks et al., 2015; Wang et al., 2017). In addition to O3 precursors, meteorological conditions are also crucial factors driving the O3 formation. Solar radiation, temperature, relative humidity, wind speed, and cloud cover have been found to be closely related to O3 formation (Dong et al., 2020; Han et al., 2020; Yin et al., 2019). Furthermore, large-scale circulations, such as the East Asian monsoon, West Pacific subtropical high (WPSH), and tropical cyclones (TCs) can influence O3 concentration as well (Lu et al., 2019; Rowlinson et al., 2019; Yang et al., 2014; Zhao and Wang, 2017).
The concentrations of air pollutants SO2, NOx, CO, PM10, and PM2.5 in China have been significantly reduced since 2013 (M. Li et al., 2021; Li et al., 2022; Zhai et al., 2019), thanks to the implementation of the Air Pollution Prevention and Control Action Plan. However, the O3 concentration has dramatically increased and emerged as a major air pollutant in eastern China (Bian et al., 2019; Fu et al., 2019; Wang et al., 2020; Zheng et al., 2018). O3 concentrations are particularly high in the three megacity clusters in eastern China, namely Beijing–Tianjin–Hebei (BTH), the Yangtze River Delta (YRD), and the Pearl River Delta (PRD) (Gao et al., 2020; Guo et al., 2019; K. Li et al., 2021; Liu et al., 2018; Yang et al., 2019).
Annual mean concentrations of maximum daily 8 h average (MDA8) O3 in the three megacity clusters are shown in Fig. 1. The linear increases in MDA8 O3 for the BTH, YRD, and PRD regions are 2.4, 1.1, and 2.0 ppb yr−1 (ppb is for parts per billion), respectively, during the period 2015–2020. These increases are unusually large, compared to the increases in other parts of China, as well as the positive trends worldwide (Chen et al., 2020; Lu et al., 2018; Professional Committee of Ozone Pollution Control of Chinese Society for Environmental Sciences, 2022; Zhang et al., 2020). Thus, a crucial scientific question is as follows: what causes these large increases in the O3 concentration? Some recent studies suggested that changing photochemical processes induced by anthropogenic emissions are responsible for these increases (Li et al., 2019, 2022; Shao et al., 2021; Wang et al., 2020). However, in our analysis of the O3 increases at individual stations in eastern China during the period 2015–2020, we noticed that the interannual variations in the O3 concentration were strongly affected by the position and intensity of the WPSH and the presence of TCs in the western Pacific and South China Sea, consistent with the results of a number of recent studies (Chang et al., 2019; Mao et al., 2020; Ouyang et al., 2022; Zhao and Wang, 2017). These results suggest that transport or meteorological parameters associated with the WPSH and TCs may also play an important role in the large increases in MDA8 O3.
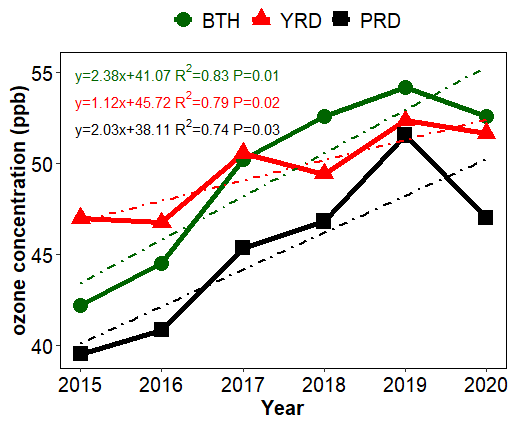
Figure 1Annual mean concentrations of maximum daily 8 h average O3 in the BTH (green), YRD (red), and PRD (black) regions.
The significant impact of the WPSH on weather patterns and O3 concentrations over East China is widely recognized (Bachmann, 2015; Chang et al., 2019; Yin et al., 2019; Zhao and Wang, 2017). It is well established that the WPSH plays a critical role in controlling weather conditions, which in turn affects O3 concentrations. For example, the WPSH is known to contribute to the formation of the East Asian monsoon and influence precipitation patterns in the YRD. It also influences air temperature and precipitation across northern and southern China (Zhang, 2001; Zhao and Wang, 2017). These changes in meteorological conditions have a profound impact on the photochemical production, dispersion, and accumulation of O3.
Previous studies have indicated that in the peripheries of TCs, the PRD experiences specific atmospheric conditions, e.g., high pressure, low humidity, and intense solar radiation, which are highly conducive to O3 formation. These conditions often result in consecutive days with elevated levels of O3, as observed in various case studies (Ouyang et al., 2022; Wei et al., 2016). Furthermore, statistical investigations have established several noteworthy connections between TCs and O3 concentrations in the PRD area. For example, the meteorological conditions associated with the TC periphery frequently contributed to the formation of elevated surface O3 levels and aerosols (Deng et al., 2019). In addition, TCs in the East China Sea had a higher likelihood of causing increased O3 concentrations in the PRD region (Zhao et al., 2022). Last, TCs in the vicinity of Taiwan have the greatest influence on air quality in Hong Kong when compared to TCs in other areas, which is primarily because these TCs facilitate the transportation of air pollutants from the PRD region (Lam et al., 2018).
In this study, we focus on exploring possible contributions to the large O3 increases in the three megacity clusters in eastern China by the changes in the meteorological parameters associated with the WPSH and TCs during the period 2015–2020. The rest of this paper is organized as follows. In Sect. 2, the data and methodology used in this study are described. Major characteristics of the O3 interannual variability and increases in the three megacity clusters are discussed in Sect. 3.1. In Sect. 3.2, we examine the spatial expansion and saturation of high O3. The annual change in the O3-exceeding days with different durations are also examined. A hypothesis of the cause of O3 increases in three megacity clusters in eastern China during 2015–2020 is presented in Sect. 3.3. Section 4 presents a summary and the conclusions.
2.1 Pollutant data
The observed hourly concentrations of air pollutants, including O3, NO2, CO, PM2.5, and SO2 from 2015 to 2020 are obtained from the China National Environmental Monitoring Centre (http://www.cnemc.cn/, last access: 3 March 2021). Gridded MDA8 O3 data from Tracking Air Pollution in China dataset (http://tapdata.org.cn, last access: 31 December 2020) with a resolution of 10 km are also used (Xue et al., 2020).
2.2 Meteorological data
The European Centre for Medium-Range Weather Forecasts (ECMWF) Reanalysis v5 (ERA5) dataset (available at https://cds.climate.copernicus.eu/, last access: 28 February 2021), with a horizontal resolution of 0.25∘ × 0.25∘ and a temporal resolution of 1 h, was used to analyze the influence of meteorological parameters on O3 pollution. The variables used in this study include 2 m temperature (T2 m) and surface net solar radiation (SSR). In addition, daily mean relative humidity, geopotential height, zonal and meridional wind at 500 hPa, and vertical velocity at 850 hPa from the National Centers for Environmental Prediction (NCEP) and National Center for Atmospheric Research (NCAR) reanalysis (https://psl.noaa.gov/data/gridded/data.ncep.reanalysis.html, last access: 3 March 2021) at a resolution of 2.5∘ × 2.5∘ are used.
2.3 Methods
The Chinese national ambient air quality standard for MDA8 O3 is 160 µg m−3, which corresponds to 75 ppb at 273.15 K and 1 atm. The O3-exceeding days are defined as MDA8 O3 concentration > 75 ppb, while non-O3-exceeding days are defined as MDA8 O3 concentration < 75 ppb. According to the duration of the O3 pollution episode, it can be divided into consecutive O3-exceeding days with 4 or more days (O3 days ≥ 4) and consecutive O3-exceeding days with fewer than 4 d (O3 days < 4). In addition, some commonly used methods are applied in this study, including linear fitting, meteorological synthesis , and the two-tailed Student's t test.
The normalized annual mean O3 concentration of the O3-exceeding days is calculated by adding the O3 concentration of the O3-exceeding day each year and dividing it by the total number of days in the year. The normalized annual mean O3 of the non-O3-exceeding days is calculated by the same method, except for the non-O3-exceeding days.
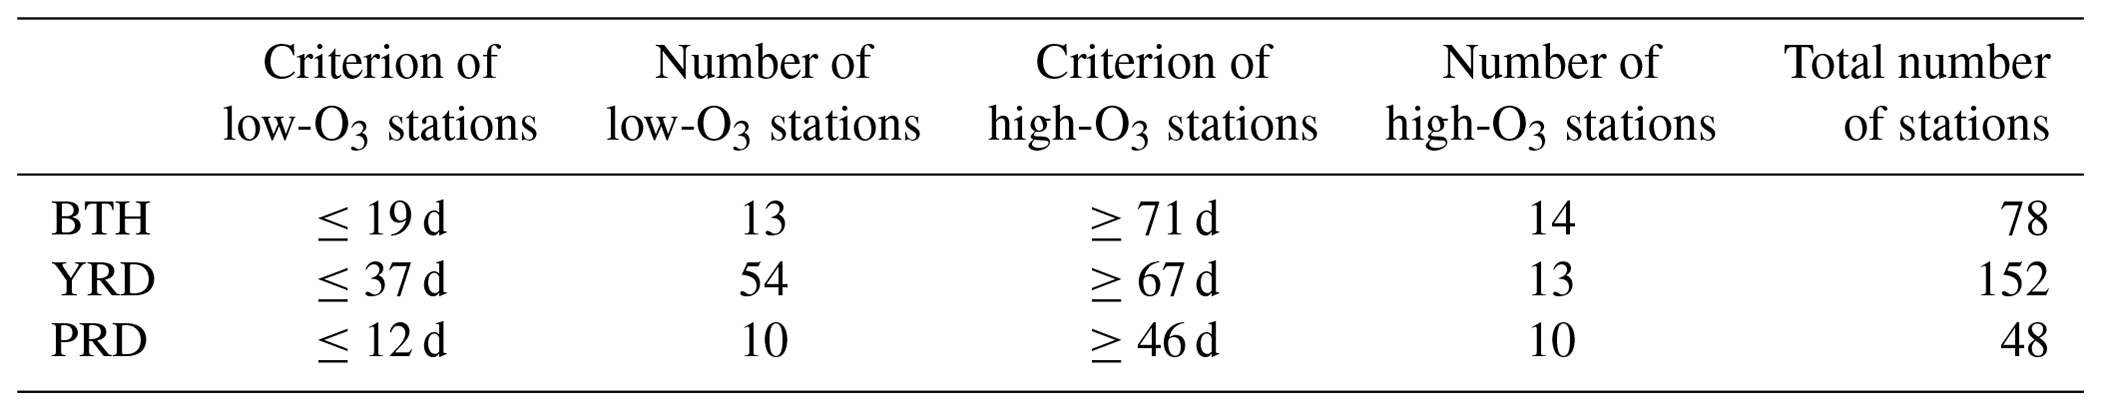
Table 1 lists the criteria and corresponding numbers of low-O3 and high-O3 stations in the three megacity clusters. This classification is undertaken with the purpose of distinguishing stations with various O3 levels within the three megacity clusters, and it is based on the number of O3-exceeding days in 2015. Stations with the number of O3-exceeding days fewer than or equal to the low-O3 criterion (second column) are considered to be low-O3 stations. When more than or equal to the high-O3 criterion (fourth column), then they are considered to be high-O3 stations. We have tested a few reasonably different criteria and found only some insignificant differences in the results; i.e., the results associated with low-O3 and high-O3 stations are robust against reasonable changes in their selection criteria. For example, the relatively large criterion (37 d) of low-O3 stations in the YRD is intended to include a large enough number of stations (about one-third of the total of 152 stations) to be fully representative of low-O3 and moderate-O3 stations. These results have been compared to those of a more stringent criterion of 19 d and found no notable change in the major characteristics (Figs. S1 and S2 in the Supplement).
Table 1Criteria and corresponding numbers of low-O3 and high-O3 stations in the three megacity clusters in 2015. The criterion listed for each megacity cluster was based on the number of MDA8 O3-exceeding days in 2015. For instance, the criterion for a low-O3 site in BTH was the number of MDA8 O3-exceeding days in 2015 being smaller than or equal to 19 d, while for high-O3 site was the number of MDA8 O3-exceeding days in 2015 being greater than or equal to 71 d.
3.1 Major characteristics of O3 increases
Major characteristics of the large increases in the annual mean O3 concentration are shown in Fig. 2a, b, and c for the BTH, YRD, and PRD regions, respectively, in which the normalized annual mean concentrations of MDA8 O3 in the three megacity clusters are compared to contributions from two groups, namely the O3-exceeding days and non-O3-exceeding days. The increase in O3-exceeding days is the primary contributor to the substantial increase in the annual mean O3 in all three megacity clusters from 2015 to 2020. The contribution of O3-exceeding days is affected mostly by the changing number of exceeding days (more than 80 %) and second, but nevertheless significantly, by their changes in concentrations (less than 20 %) (Tables 2–4). For example, in BTH, the exceeding days were 31, 43, 62, 74, 96, and 78 d in the individual years of 2015–2020, respectively, while the concentrations of those years were 66.42, 64.13, 69.44, 68.21, 70.19, and 69.69, respectively (Table 2; second column). Contributions from non-O3-exceeding days are insignificant (p value > 0.1), except in BTH (Fig. 2a), which shows a significant declining contribution (p value = 0.02) due to the reduced number of non-O3-exceeding days. Therefore, the following discussions on the O3 increases will be focused on the O3-exceeding days.
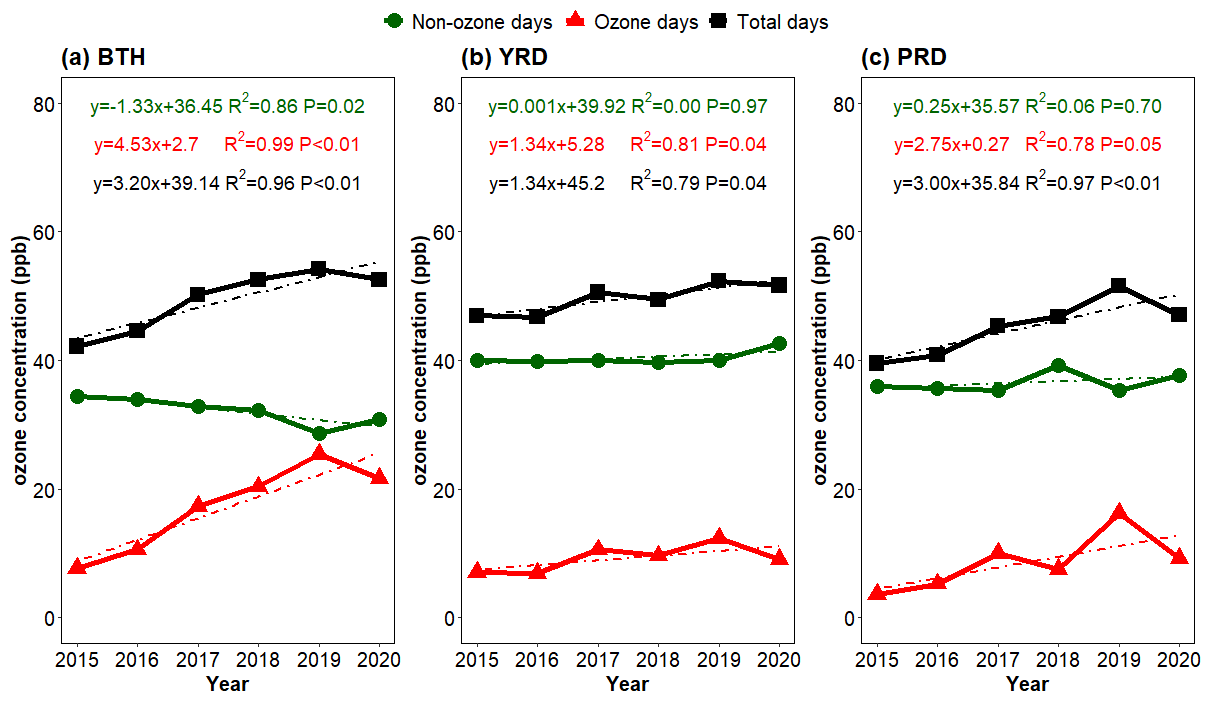
Figure 2Contributions from the O3-exceeding days (red) and non-O3-exceeding days (green) to the annual mean concentration of maximum daily 8 h average O3 (black) in the BTH (a), YRD (b), and PRD (c) regions.
Table 2Mean O3 concentrations (ppb) and number of days of all O3-exceeding days (second column), consecutive O3-exceeding days with fewer than 4 d (third column), consecutive O3-exceeding days with 4 or more days (fourth column), and the difference between (≥4 d) and (<4 d) (fifth column) within the BTH box in 2015–2020.
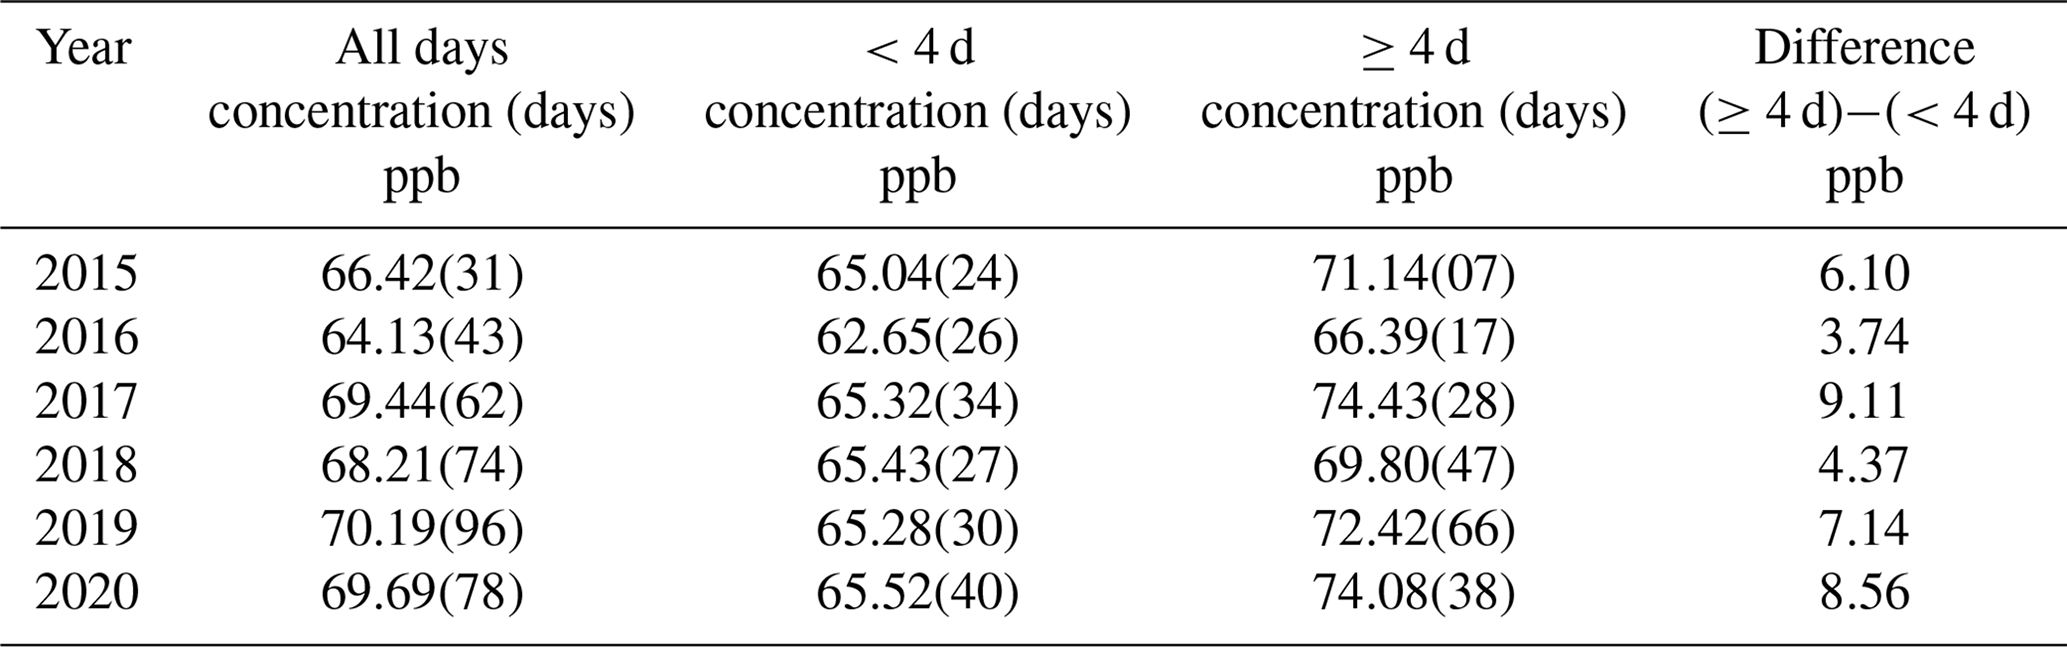
Table 3Mean O3 concentrations (ppb) and number of days of all O3-exceeding days (second column), consecutive O3-exceeding days with fewer than 4 d (third column), consecutive O3-exceeding days with 4 or more days (fourth column), and the difference between (≥4 d) and (<4 d) (fifth column) within the YRD box in 2015–2020.
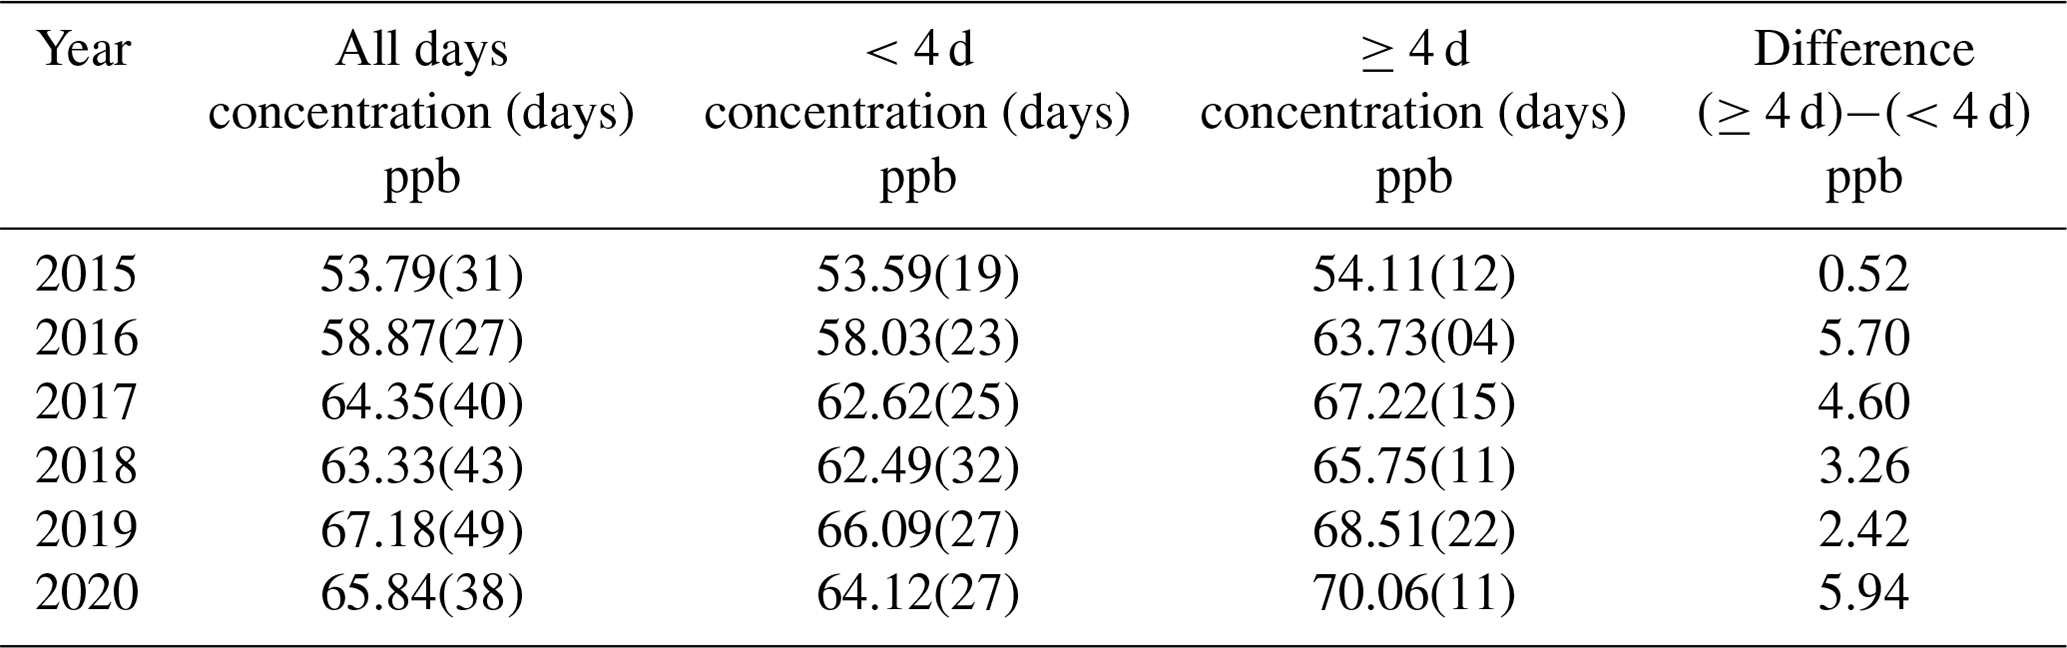
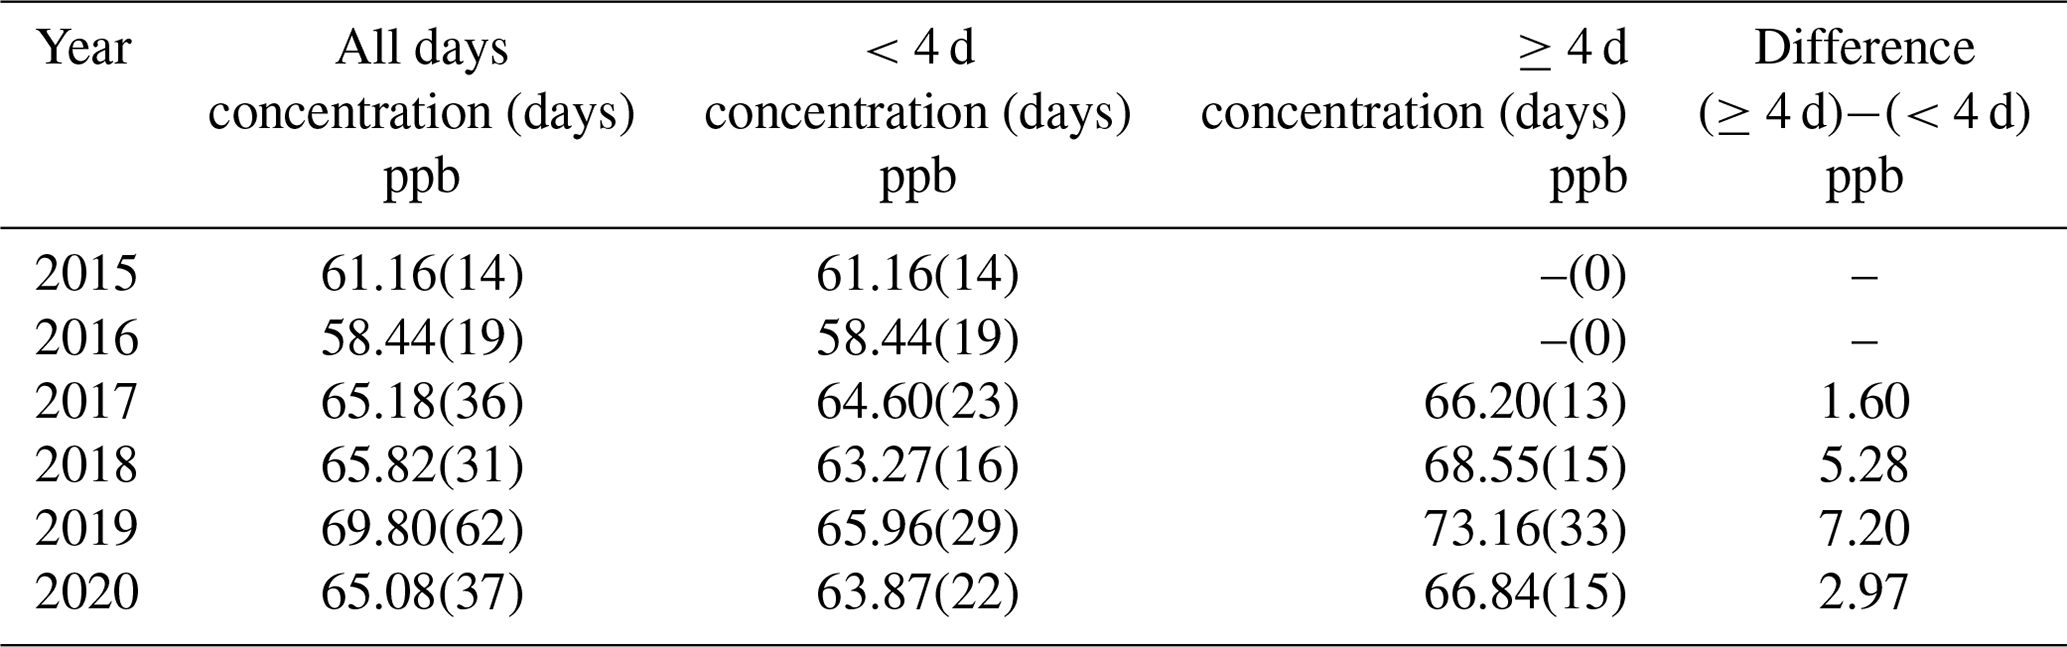
Table 4Mean O3 concentrations (ppb) and number of days of all O3-exceeding days (second column), consecutive O3-exceeding days with fewer than 4 d (third column), consecutive O3-exceeding days with 4 or more days (fourth column), and the difference between (≥4 d) and (<4 d) (fifth column) within the PRD box in 2015–2020.
Annual numbers of single and consecutive O3-exceeding days are shown in Fig. 3a, b, and c for the BTH, YRD, and PRD regions, respectively. A drastic 2- to 3-fold increase in the annual numbers of consecutive O3-exceeding days can be seen in all three regions. In contrast, the numbers of single O3-exceeding days show only a slight increase in the PRD. These drastic increases in the annual numbers of consecutive O3-exceeding days are clearly the primary contributors to the increases in O3 shown in Fig. 2a, b, and c. This brings up two key scientific questions: what causes the drastic increases in the numbers of consecutive O3-exceeding days? Is it due to changing emissions of air pollutants or changing meteorological parameters?
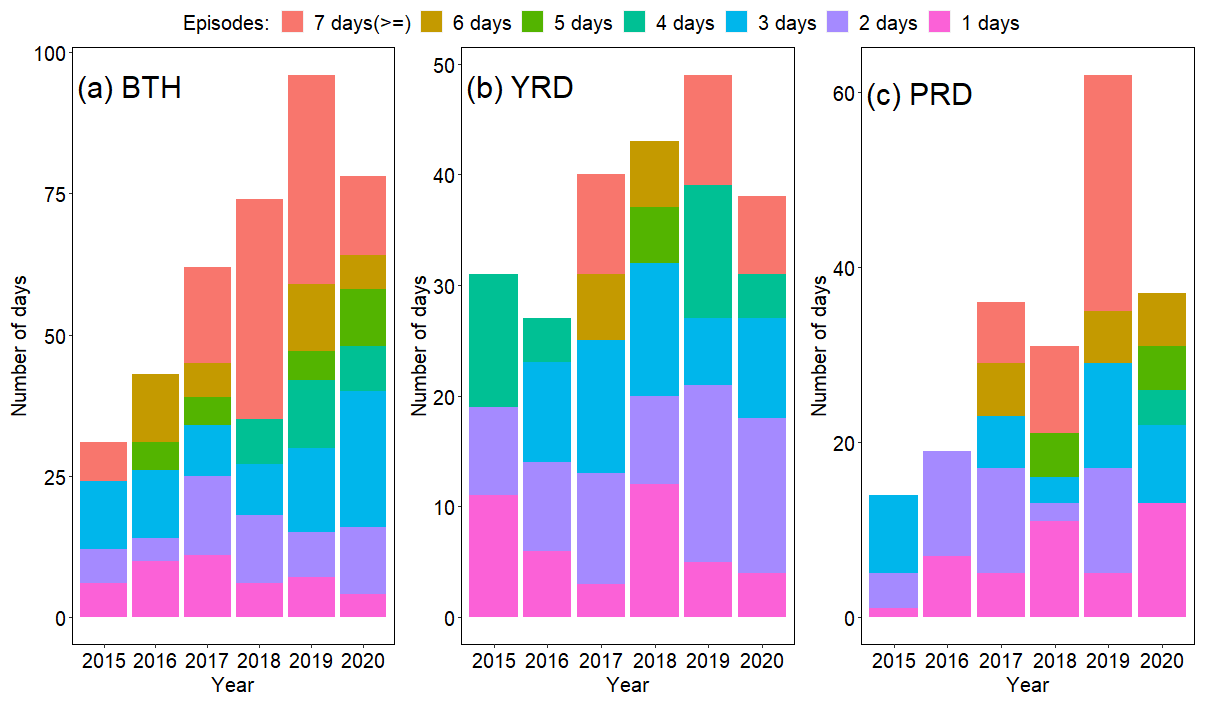
Figure 3Annual numbers of various consecutive O3-exceeding days in the BTH (a), YRD (b), and PRD (c) regions. Individual colors denote different numbers of consecutive O3-exceeding days.
3.2 Spatial expansion and saturation of high O3
Another important changing characteristics of O3 concentrations is illustrated in Fig. 4a, which depicts the annual mean concentrations of MDA8 O3 in BTH during O3-exceeding days for all 78 stations (black line), 14 stations in the highest category of O3 concentration (average 103 ppb) observed in 2015 (red line; denoted as high-O3 stations hereafter; Table 1), and 13 stations in the lowest category of O3 (average 57 ppb) observed in 2015 (green line; denoted as low-O3 stations hereafter; Table 1). It is remarkable that O3 concentrations at the low-O3 stations caught up to be within 12 ppb of other stations in merely 2 years (an increase of about 30 ppb from 2015 to 2017) and actually equaled the average of other stations in 2019. Meanwhile, the high-O3 stations experienced a slight decrease in O3 concentration, although not statistically significant. This phenomenon suggests strongly that the annual mean concentrations of MDA8 O3 in BTH experienced a fast (within 2 years) and widespread spatial expansion of high O3 from urban centers to surrounding regions where O3 concentrations were low in 2015. Temporally, most of the expansion was accomplished during 2015–2017. This phenomenon of a fast and widespread expansion of high-O3 concentrations from urban centers to surrounding regions were also observed to a slightly lesser degree in the YRD (Fig. 4b) and PRD (Fig. 4c) regions.
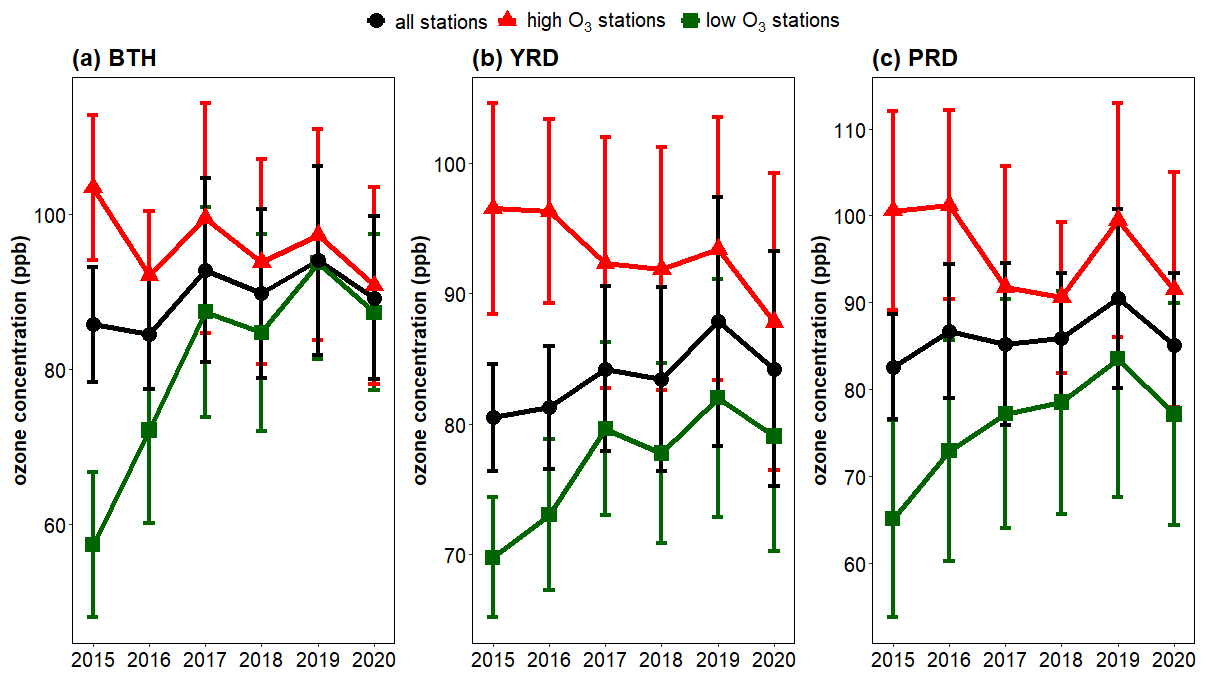
Figure 4Annual mean concentrations (2015–2020) of maximum daily 8 h average O3 during O3-exceeding days for all stations (black), high-O3 stations (red), and low-O3 stations (green) in the BTH (a), YRD (b), and PRD (c) regions.
The spatial expansion of high O3 from urban centers to surrounding regions in BTH and the YRD during 2015–2017 can be clearly visualized in Figs. 5 and 6, respectively. Figure 5a, b, and c show the spatial distribution of the daily mean concentrations of MDA8 O3 for O3-exceeding days in BTH in 2015 and 2017 and their difference (2017 minus 2015), respectively. Comparing Fig. 5a to b, one can see that the area greater than 80 ppb (75 ppb is the O3 exceeding standard) expanded by about a factor of 5 from 2015 to 2017. The daily average concentration of MDA8 O3 within the BTH box increased from 66.42 ppb in 2015 (31 d; Fig. 5a) to 69.44 ppb in 2017 (62 d; Fig. 5b), which was a difference of 3.02 ppb or a merely 4.5 % increase between the 2 years (Fig. 5c). After accounting for the number of O3-exceeding days, the ratio of normalized MDA8 O3 in all O3-exceeding days between 2017 and 2015 became 2.09. This comparison suggests that the increase in O3 in BTH between 2015 and 2017 was driven primarily by the increase in the number of consecutive O3-exceeding days. Spatially, Fig. 5c shows that the expansion is mostly to the southern and southwestern outside of BTH, with the YRD getting a predominant portion of the O3 enhancements. Within the BTH box, the nearly constant concentrations of O3 inside Beijing city (40∘ N, 116.5∘ E) coupled with the southwestward expansion of high O3 in 2017 (Fig. 5c) suggested that there was a saturation of O3 inside Beijing city. There were also significant increases in O3 in the YRD and even in southern China as far as the western PRD (Fig. 5c). Nevertheless, the O3 concentrations in the YRD and PRD stayed below 70 ppb during the O3-exceeding days of BTH in both 2015 (Fig. 5a) and 2017 (Fig. 5b). In other words, the O3-exceeding days of the YRD and PRD are mostly temporally decoupled (i.e., not occurring at the same time) from those of BTH. A logical explanation for this phenomenon is that the atmospheric conditions conducive to high-O3 formation in BTH do not overlap significantly with those conditions of the YRD and PRD.
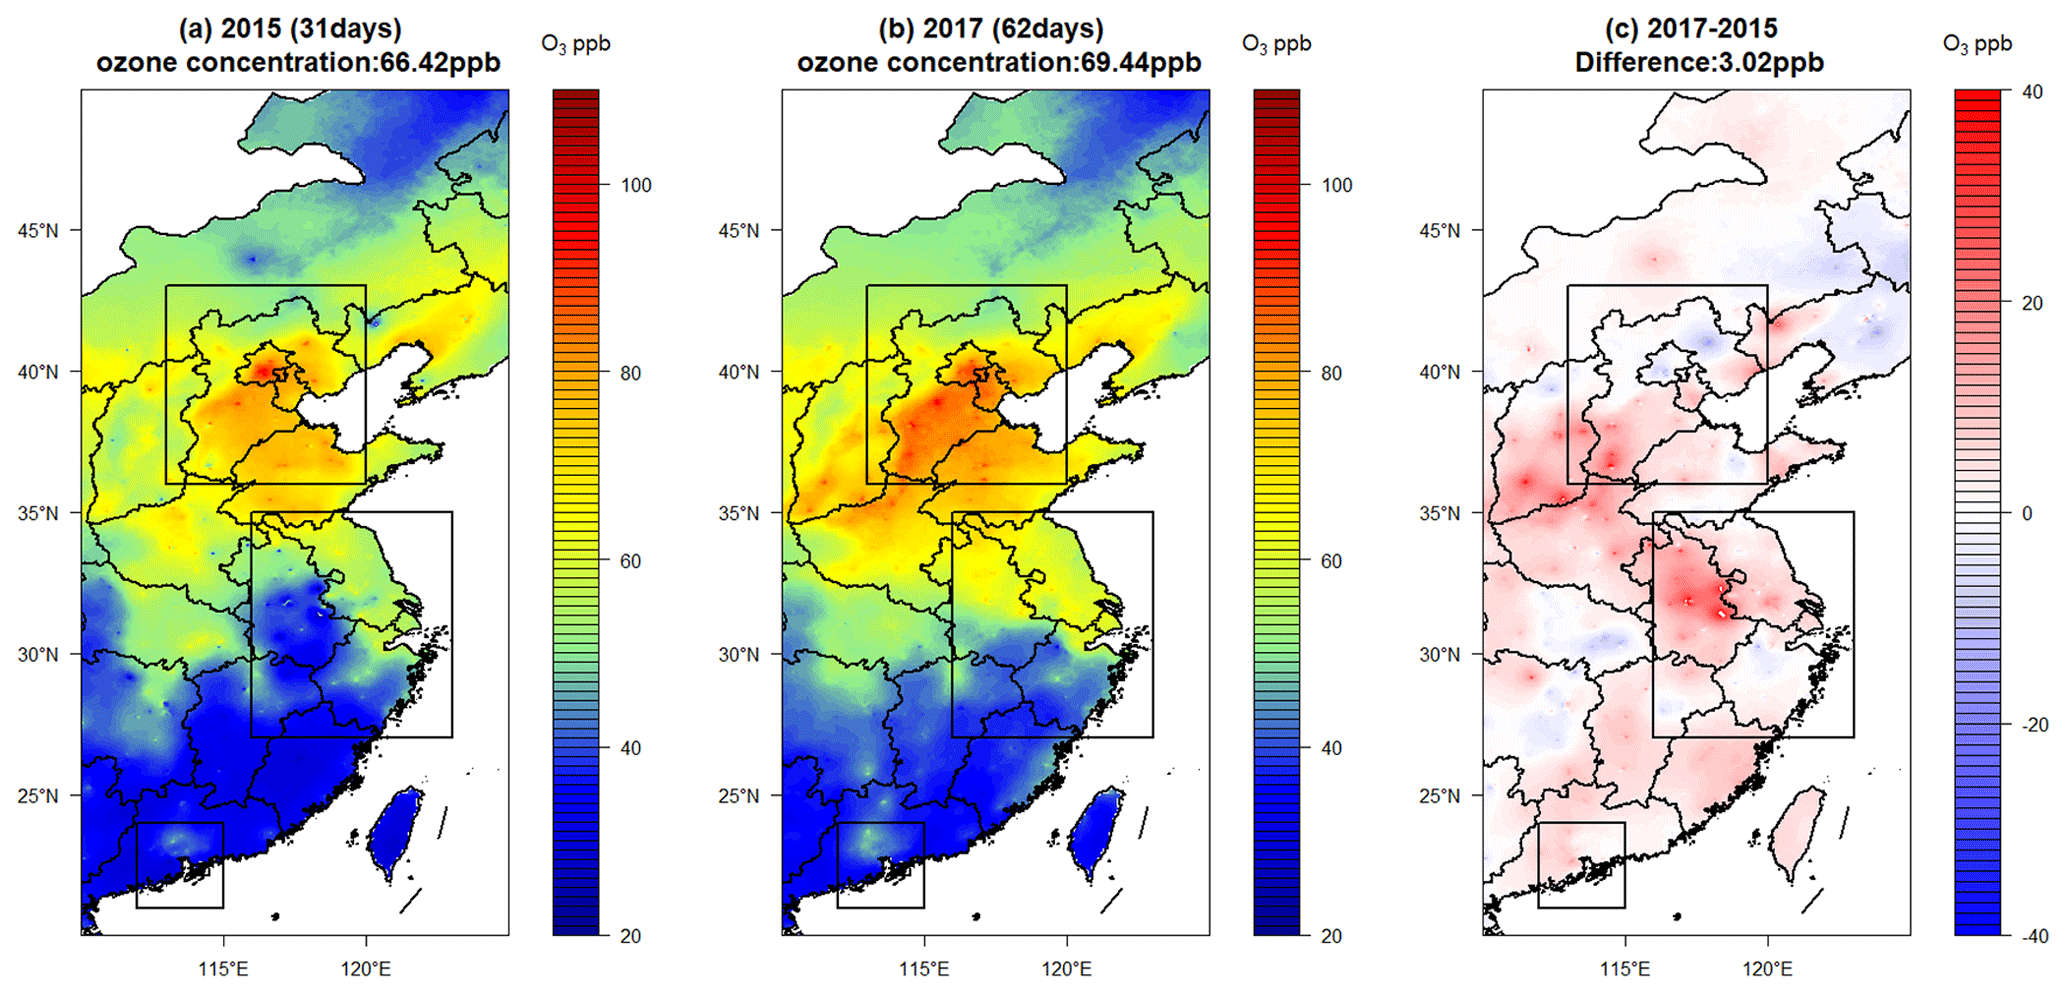
Figure 5Spatial distribution of annual mean concentrations of maximum daily 8 h average O3 for O3-exceeding days in BTH in 2015 (a), 2017 (b), and their difference (2017–2015) (c). The top, middle, and bottom rectangular boxes denote the BTH, YRD, and PRD districts, respectively. The number in parentheses behind 2015 or 2017 denotes the number of O3-exceeding days. Publisher's remark: please note that Figs. 5–7, 9, and 12–15 contain disputed territories.
Figure 6a, b, and c are the same as Fig. 5a, b, and c, respectively, but for the YRD. Similar to BTH, one can clearly see the expansion of high O3 from the vicinity of Shanghai city (31∘ N, 121.3∘ E) in the northwestern direction reaching as far as the central BTH box during the period 2015–2017 (Fig. 6b and c). Comparing Fig. 6a to 6b, one can see that the area greater than 70 ppb expanded from Shanghai and vicinity northwestward by more than a factor of 5 from 2015 to 2017. This expansion was in a different direction from the southwestern expansion occurred in BTH (Fig. 5c). We note, however, this expansion does not necessarily mean the direct transport of high O3 or its precursors from the vicinity of Shanghai to central BTH. In fact, the presence of separate rather than contiguous red patches of high O3 (> 70 ppb) in the southern BTH and northern YRD in Fig. 6b is a clear indication that the high O3 values are primarily controlled by local photochemical production from local O3 precursors, rather than the direct upwind–downwind transport of high O3 and/or its precursors. The daily average concentration of MDA8 O3 within the YRD box increased from 53.79 ppb in 2015 (31 d; Fig. 6a) to 64.35 ppb in 2017 (40 d; Fig. 6b), which was a difference of 10.56 ppb or a 20 % increase between the 2 years (Fig. 6c). After accounting for the number of O3-exceeding days, the ratio of normalized MDA8 O3 in all O3-exceeding days between 2017 and 2015 became 1.54. This comparison suggests that the increase in O3 in the YRD between 2015 and 2017 was due to both the increases in O3 concentrations (+20 %) and the number of O3-exceeding days (+34 %).
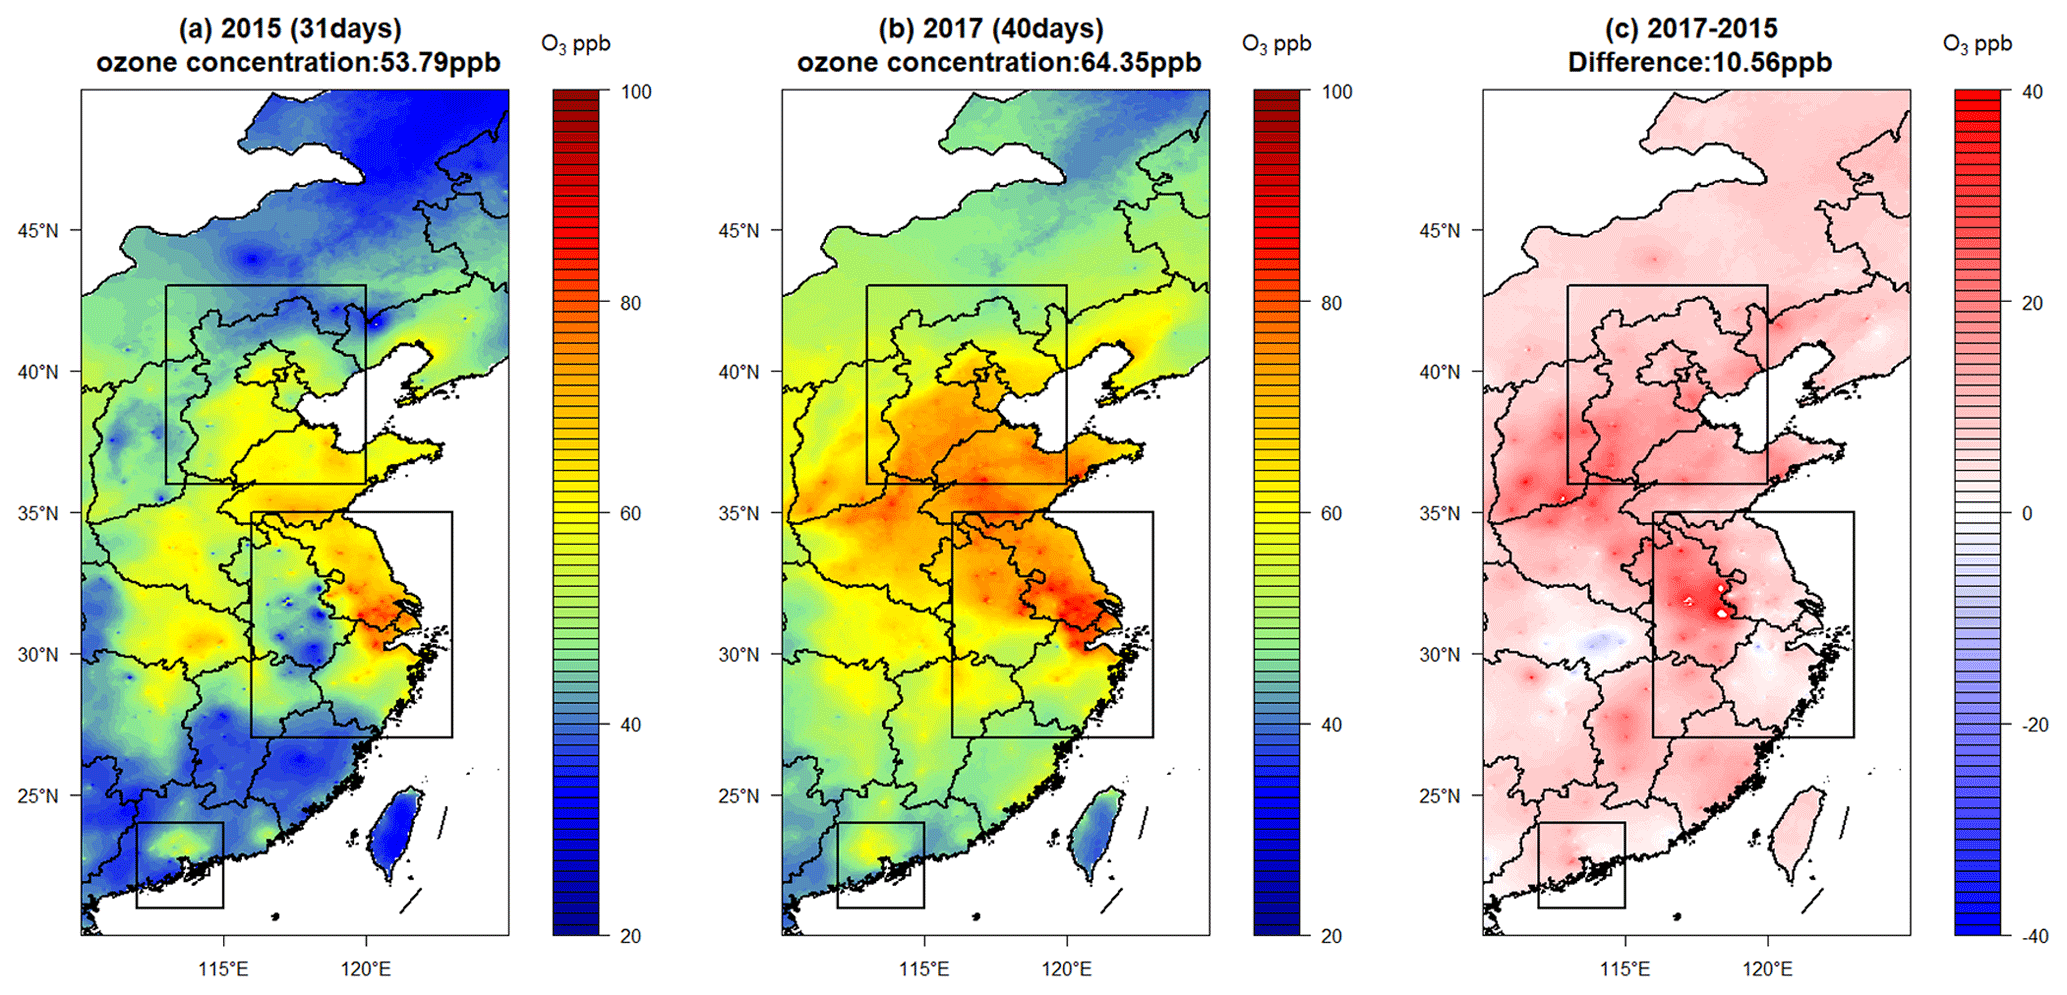
Figure 6Spatial distribution of annual mean concentrations of maximum daily 8 h average O3 for O3-exceeding days in the YRD in 2015 (a), 2017 (b) and their difference (2017–2015) (c). The top, middle, and bottom rectangular boxes denote the BTH, YRD, and PRD districts, respectively. The number in parentheses behind 2015 or 2017 denotes the number of O3-exceeding days.
Figure 7a, b, and c are the same as Fig. 5a, b, and c, respectively, but for the PRD. Unlike BTH and the YRD, there was only a slight expansion of high O3 within the PRD box toward the southwest in 2017 compared to 2015 (Fig. 7c). Nevertheless, outside the PRD box, there was an extensive expansion of high O3 in eastern China, substantially greater than the expansion within the PRD box (Fig. 7c). The daily average concentration of MDA8 O3 within the PRD box increased from 61.16 ppb in 2015 (14 d; Fig. 7a) to 65.18 ppb in 2017 (36 d; Fig. 7b), which was a difference of 4.02 ppb or a merely 6.6 % increase between the 2 years (Fig. 7c). After accounting for the number of O3-exceeding days, the ratio of normalized MDA8 O3 in all O3-exceeding days between 2017 and 2015 became 2.74. This comparison suggests that the increase in O3 in the PRD between 2015 and 2017 was almost entirely (93.4 %), due to the increase in the number of O3-exceeding days.
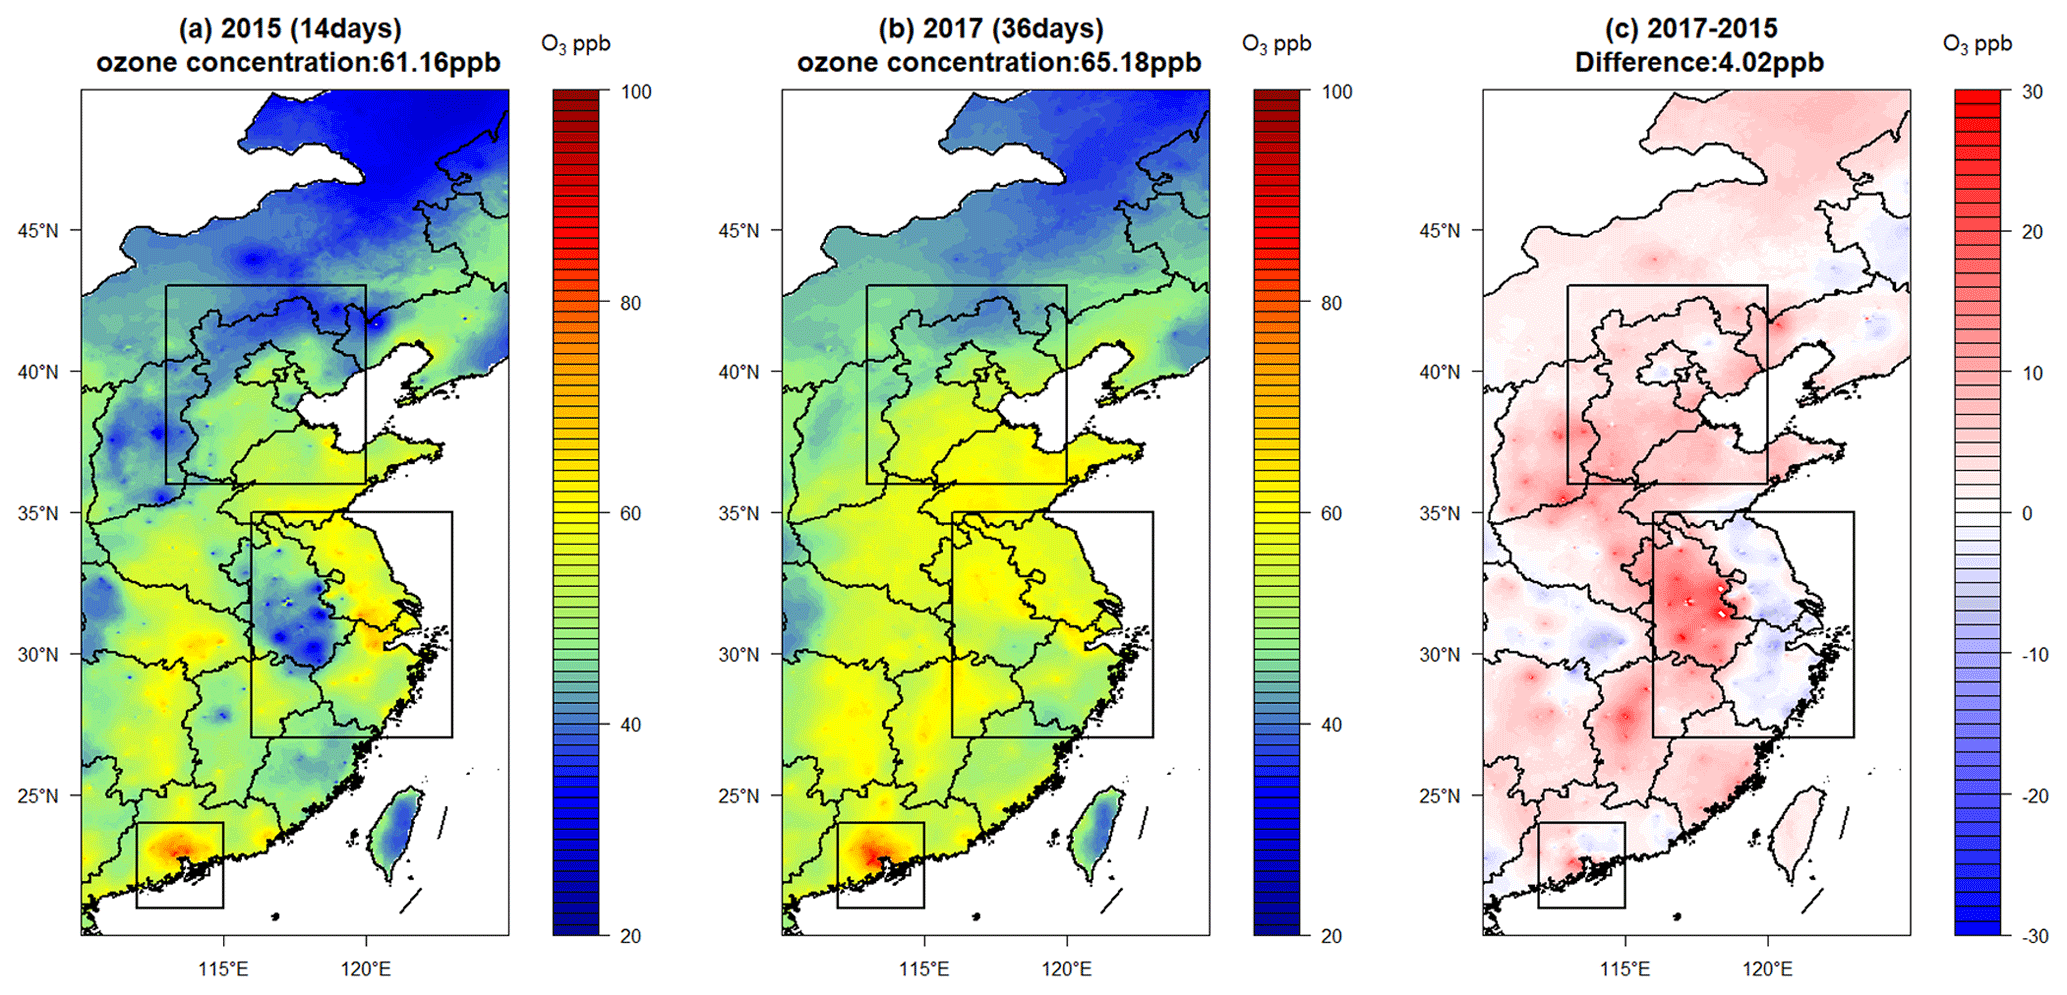
Figure 7Spatial distribution of annual mean concentrations of maximum daily 8 h average O3 for O3-exceeding days in the PRD in 2015 (a), 2017 (b) and their difference (2017–2015) (c). The top, middle, and bottom rectangular boxes denote the BTH, YRD, and PRD districts, respectively. The number in parentheses behind 2015 or 2017 denotes the number of O3-exceeding days.
Figure 7a and b reconfirm that O3-exceeding days in the PRD were mostly decoupled from those in BTH (Fig. 5a and b) and the YRD (Fig. 6a and b), as their spatial distributions were characterized by highly distinctive regional features in both 2015 and 2017. These differences suggest that the O3-exceeding days mostly occur in different days in the three individual regions. On the other hand, a comparison of Figs. 7c, 6c, and 5c reveals a striking common feature of high values in the southwestern BTH and northwestern YRD and low values in eastern parts of all three of the BTH, YRD, and PRD boxes. These common features suggest that the difference between 2015 and 2017 in all three individual regions is likely caused by a common mechanism or process that changed from 2015 to 2017. Moreover, as suggested in Fig. 3, this common mechanism or process must be closely related to a higher number of consecutive O3-exceeding days in 2017 over those of 2015.
A comparison of Fig. 8a to Fig. 1 reveals an interesting point. While the yearly average MDA8 O3 concentrations at all stations in BTH (green line in Fig. 1) shows a significant O3 increase of 2.38 ppb yr−1 with p=0.01, the black line in Fig. 8a (MDA8 O3 of all stations during O3-exceeding days) shows an insignificant increase of 1.22 ppb yr−1 with p=0.2. This is because the values in Fig. 8 are those of O3-exceeding days, of which O3 concentrations at high-O3 stations (red line in Fig. 8a) have a small decrease (although insignificant) due to the saturation effect discussed above. This decrease is the main contributor to the high p value of 0.2 of the black line in Fig. 8a (all stations).
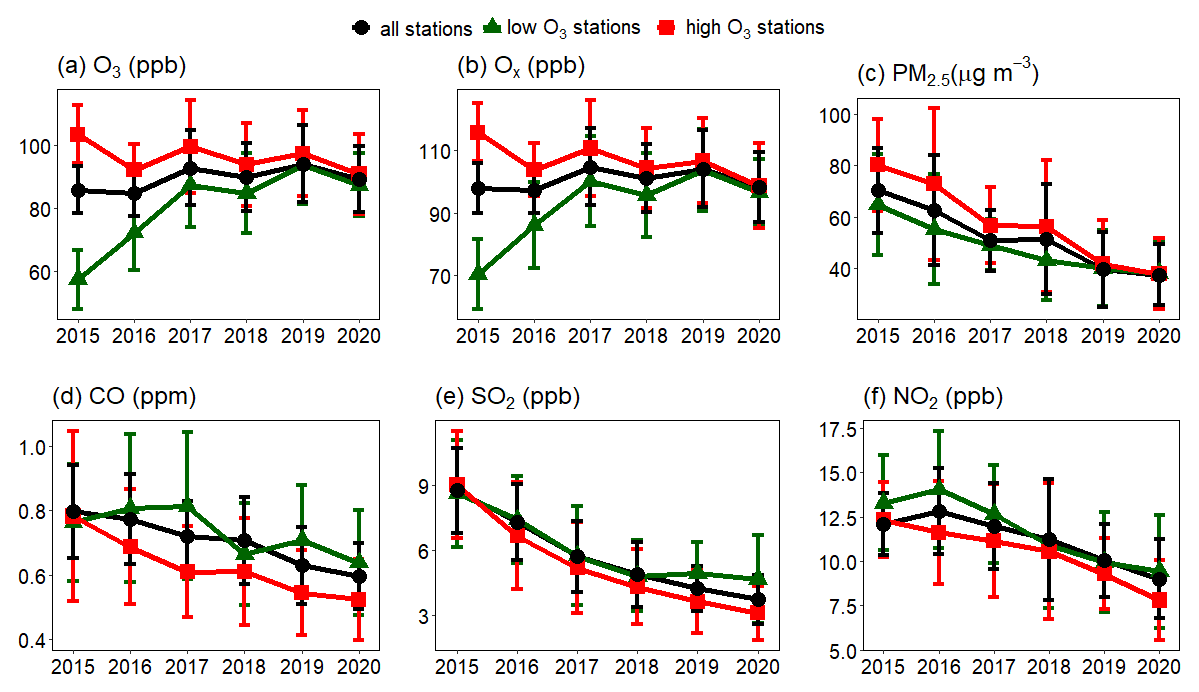
Figure 8Annual mean concentrations of maximum daily 8 h average O3 in BTH during O3-exceeding days for all stations (black), high-O3 stations (red), and low-O3 stations (green) (a), The rest of the figure shows the same as panel (a) but for Ox (b), PM2.5 (c), CO (d), SO2 (e), and NO2 (f).
We believe this spatial expansion and saturation of high O3 is a significant new finding, which may provide critical clue to the cause(s) of the large O3 increases. Its robustness against new data in 2021 and 2022 has been evaluated and reconfirmed in the Supplement (Fig. S14).
3.3 Causes of ozone enhancement at low-concentration sites and saturation at high-concentration sites
The major findings of Sect. 3.1 and 3.2 can be summarized as follows: (1) the increases in O3 observed in the three megacity clusters in eastern China during 2015–2020 (Fig. 1) were mainly caused by the large increases of approximately 2- to 3-fold increase in the number of consecutive O3-exceeding days (Figs. 2 and 3). (2) A fast and widespread expansion of high O3 from urban centers to surrounding regions was observed in the three megacity clusters during 2015–2019 (Fig. 4), and the majority of the expansions were accomplished during the 2015–2017 period (green lines in Fig. 4). (3) The expansions of high O3 in the three megacity clusters were accompanied by a saturation effect that O3 concentrations at the high-O3 stations of approximately 100 ppb in 2015 remained nearly constant or declined slightly throughout the entire period of 2015–2020 (Fig. 4).
3.3.1 Changing emissions as a possible cause of O3 increases in 2015–2020
As mentioned earlier, two emission-oriented hypotheses have been proposed as a possible cause of the O3 increases in 2015–2020. One is the changing emissions of the O3 precursors of NOx and VOCs (Li et al., 2022). The other is the reduced removal of HO2 radicals due to diminishing PM2.5 (K. Li et al., 2021; Shao et al., 2021). Li et al. (2022) showed that the NO titration effect was the cause of the linear trend in O3 in the PRD (0.5 ppb yr−1) during the relatively long period of 2006–2019. But for the period of 2015–2020, the NO titration effect could account for only about 10 % of the linear increase in O3 of the low-O3 stations in the PRD (5.0 ppb yr−1; green line; Fig. S3a).
The increase of 30 ppb in O3 at the low-O3 stations in BTH from 2015 to 2017 (green line; Figs. 4a and 8a) represents about 50 % increase in O3. The titration effect can account for only about 5 % (Fig. 8f). If this increase of 30 ppb in O3 were due to an enhancement in O3 precursors, then the enhancement would have to be substantially greater than 50 % because of the well-known less-than-linear relationship between the changes in O3 and its precursors; i.e., substantially higher percentage changes in precursors are needed for each percentage change in O3 (Dodge, 1977; Shafer and Seinfeld, 1985). Figure 8d and f show that CO (a proxy for VOCs) and NOx changed only by a few percent from 2015 to 2017, which is more than 1 order of magnitude less than the changes needed. Hence, it appears that changes in meteorological conditions conducive to O3 formation are more likely the major contributing factor to the 50 % increase in O3 at the low-O3 stations in BTH. A similar argument can be extended to the YRD and PRD (Figs. S1 and S3).
The theory of reduced removal of HO2 radicals by diminishing PM2.5 (25 %; green line in Fig. 8c) appeared to be qualitatively valid for the 50 % increase in O3 at the low-O3 stations in BTH from 2015 to 2017 (green line in Fig. 8a). But this theory was contradicted directly by the phenomenon at the high-O3 stations, where a 30 % reduction in PM2.5 (red line in Fig. 8c) corresponded to a decrease rather than an increase in O3 (red line in Fig. 8a).
3.3.2 Changes in meteorological parameters as a possible cause of O3 increases in 2015–2020
Figure 9a shows the mean daily O3 concentrations of the first group with 4 or more consecutive O3-exceeding days (labeled O3 days ≥ 4) in 2015; Fig. 9b shows the mean daily O3 concentrations of the second group with fewer than 4 consecutive O3-exceeding days (labeled O3 days < 4); and Fig. 9c is the difference between the two groups (6.10 ppb; Table 2). Figure 9d–f are the same as Fig. 9a–c, respectively, but for 2017. The first group in 2017 had 28 d and mean O3 of 74.43 ppb inside the BTH box, while the second group had 34 d and 65.32 ppb (Table 2). One of the most remarkable differences between 2017 and 2015 in Fig. 9a–f was the large number of days with 4 or more consecutive O3-exceeding days (first group) in 2017 (28 d; Fig. 9d) over that of 2015 (7 d; Fig. 9a), which alone contributed to about 62 % of the difference in O3 between 2017 and 2015 as shown in Fig. 2a (red line). Approximately 30 % was contributed by the 10 d difference (2017 vs. 2015) in the number of days with fewer than four consecutive O3-exceeding days (second group). The contribution by the higher average concentration of MDA8 O3 of the first group in 2017 is only about 8 % (Table 2). These values of the contributions reconfirm what is shown in Fig. 3a; i.e., the greater frequency of episodes with 4 or more consecutive O3-exceeding days contributes the majority (62 %) to the higher O3 in BTH in 2017 vs. 2015, and the greater intensity/concentration of O3 during the episodes contributes only about 8 %, consistent with the expansion and saturation effect discussed earlier.
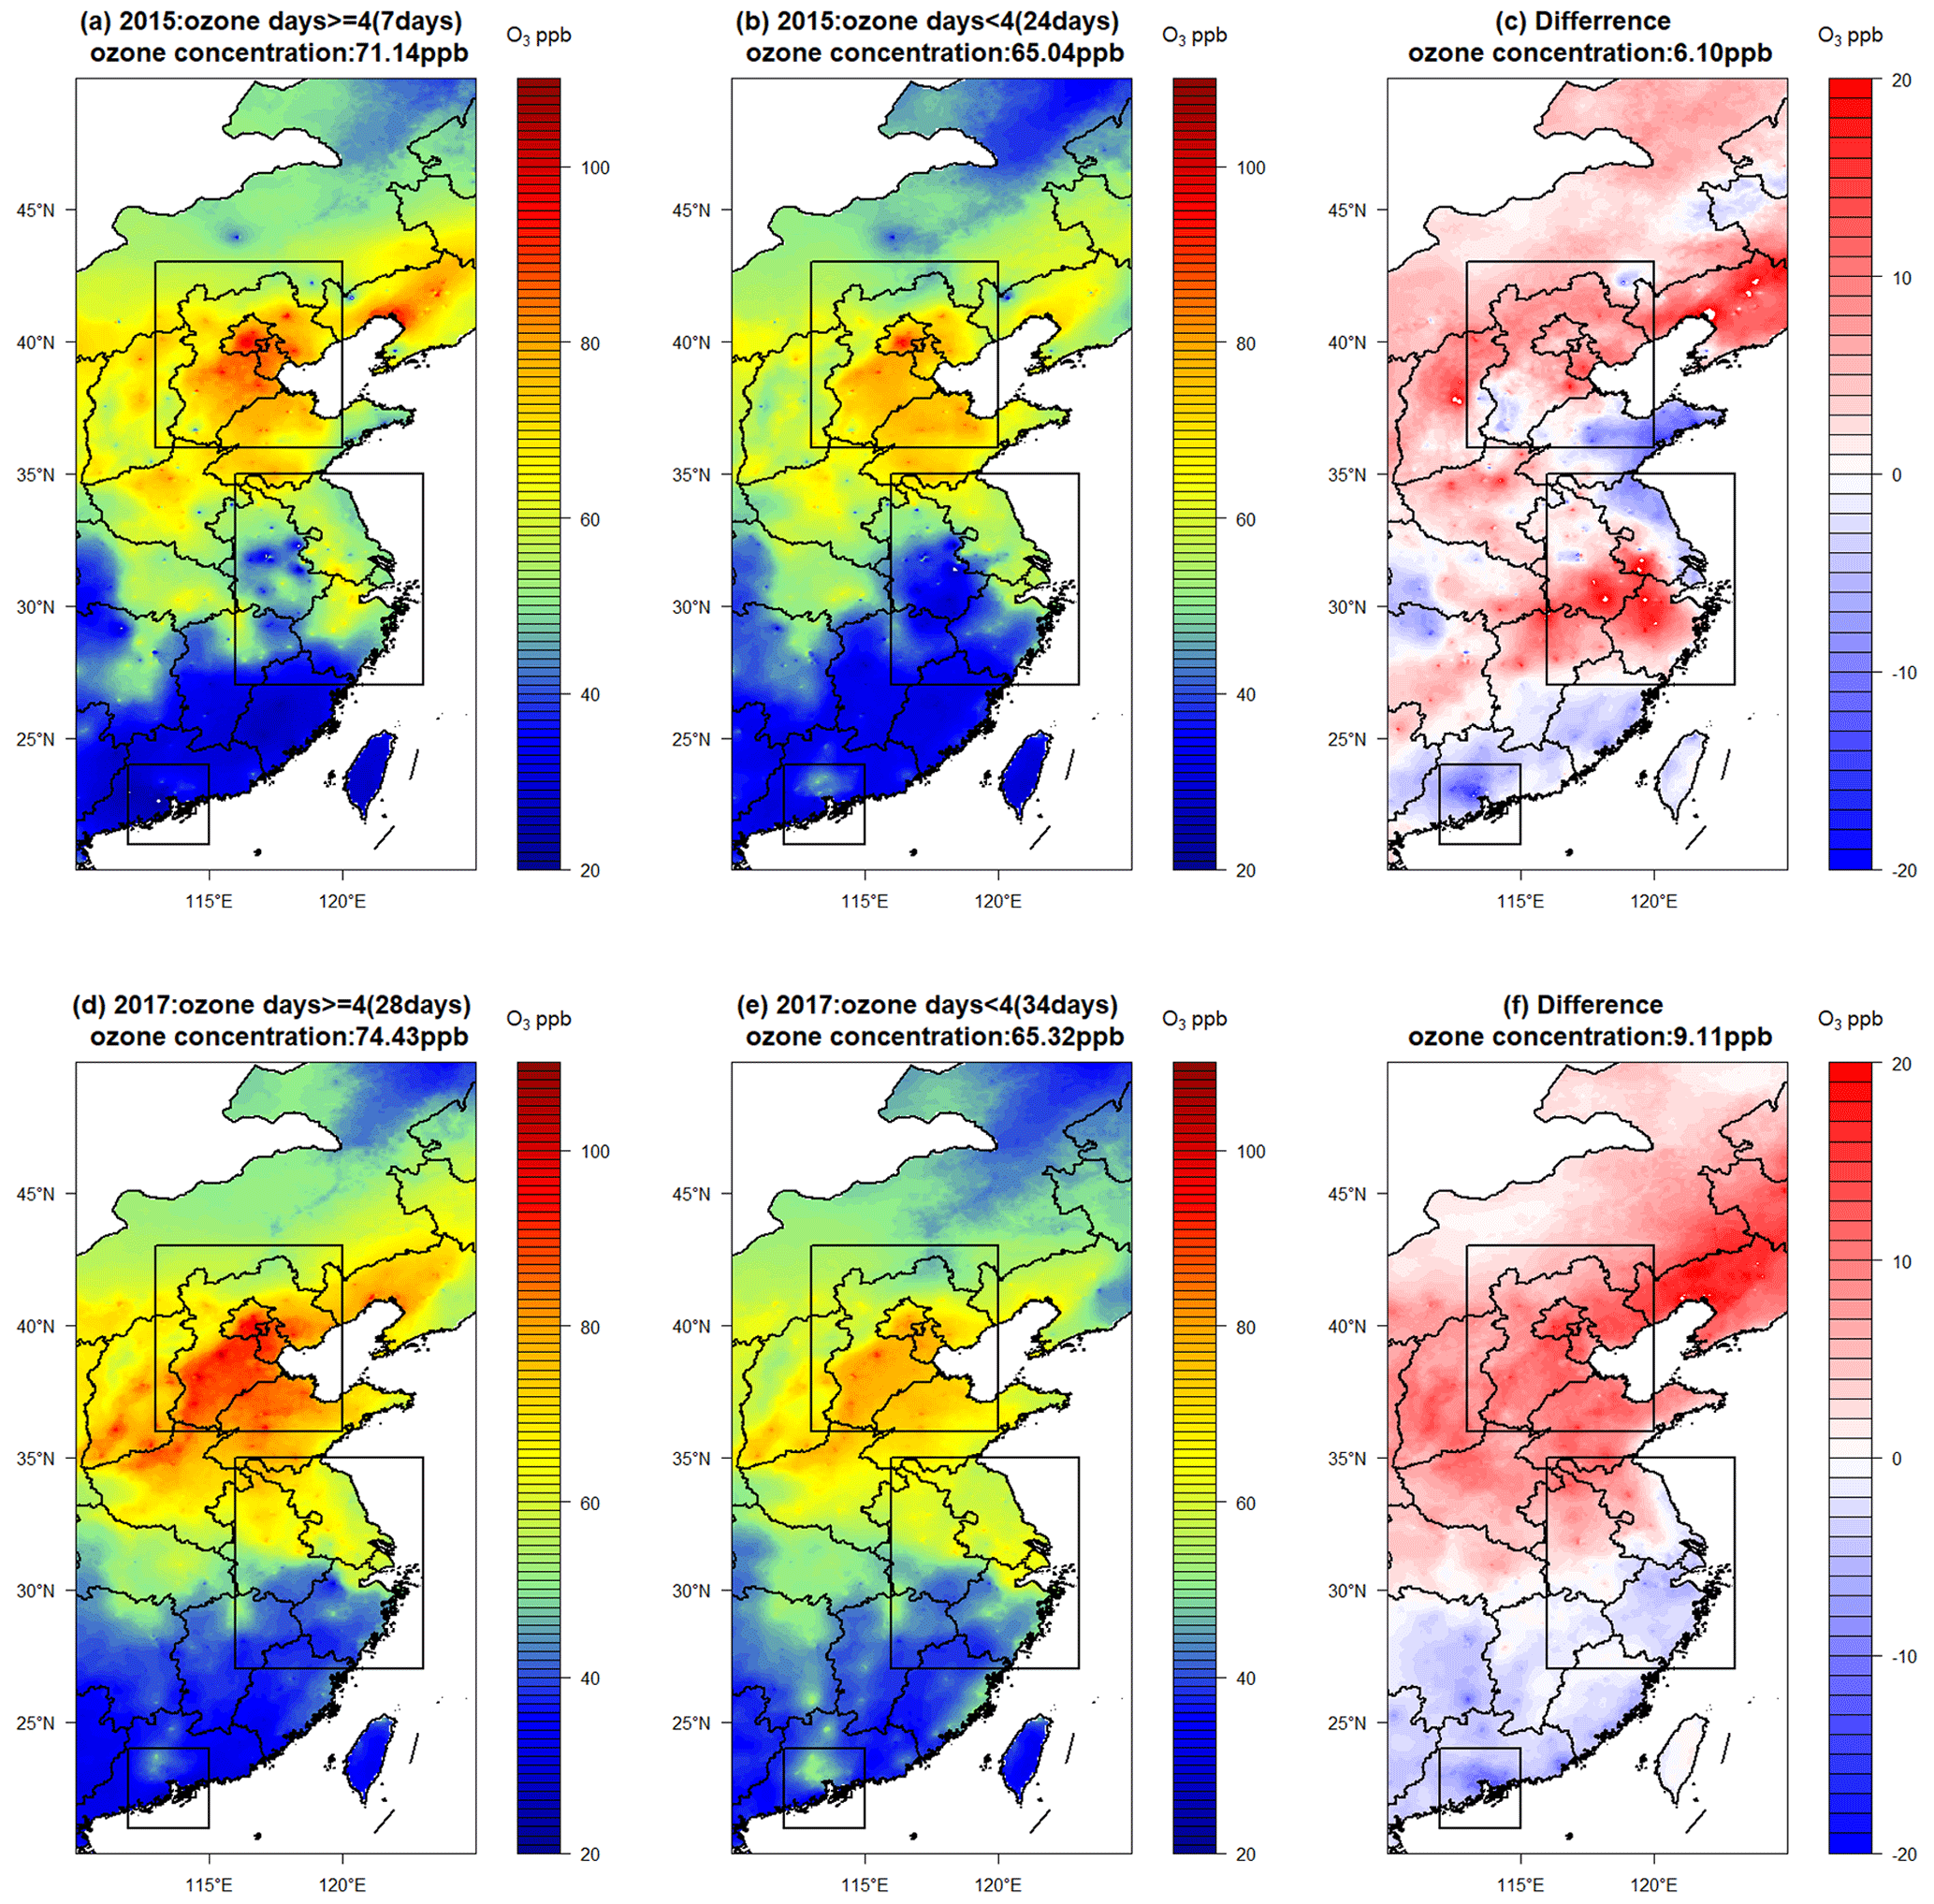
Figure 9Spatial distribution of daily mean MDA8 O3 of O3-exceeding days in BTH for O3 episodes with 4 or more consecutive O3-exceeding days in 2015 (a), O3 episodes with fewer than 4 consecutive O3-exceeding days in 2015 (b), and (a minus b) (c). Panels (d), (e), and (f) are the same as panels (a), (b), and (c), respectively, but for 2017.
The phenomena illustrated in Fig. 9a–f also exist in the YRD and PRD, as well as in most other years. Figures equivalent to Fig. 9a–c for all years in the three city clusters are provided in the Supplement (Figs. S4–S6). Essential information derived from those figures is summarized in Tables 2–4.
In Fig. 10a and b, the values of SSR and T2 m of the episodes with 4 or more consecutive O3-exceeding days are compared to those of O3 episodes with fewer than four consecutive O3-exceeding days and to those of clean days (non-O3-exceeding days). As expected, the O3 episodes with 4 or more consecutive O3-exceeding days consistently have the highest values of SSR and T2 m, while the clean days have the lowest values. This is the case in nearly all years studied, as shown in the Supplement (Fig. S7), and is also generally true in the YRD and PRD regions (Figs. S8 and S9). Coupling the higher values of SSR and T2 m in the O3 episodes with 4 or more consecutive O3-exceeding days depicted in Fig. 10 and a greater number of days in the O3 episodes with 4 or more consecutive O3-exceeding days shown in Fig. 3, we therefore propose a hypothesis as follows: the cause of worsening O3 increases in the BTH, YRD, and PRD regions from 2015 to 2020 could be attributed to enhanced photochemical O3 production due to increased occurrence of meteorological conditions of high solar radiation and positive temperature anomaly at the surface.
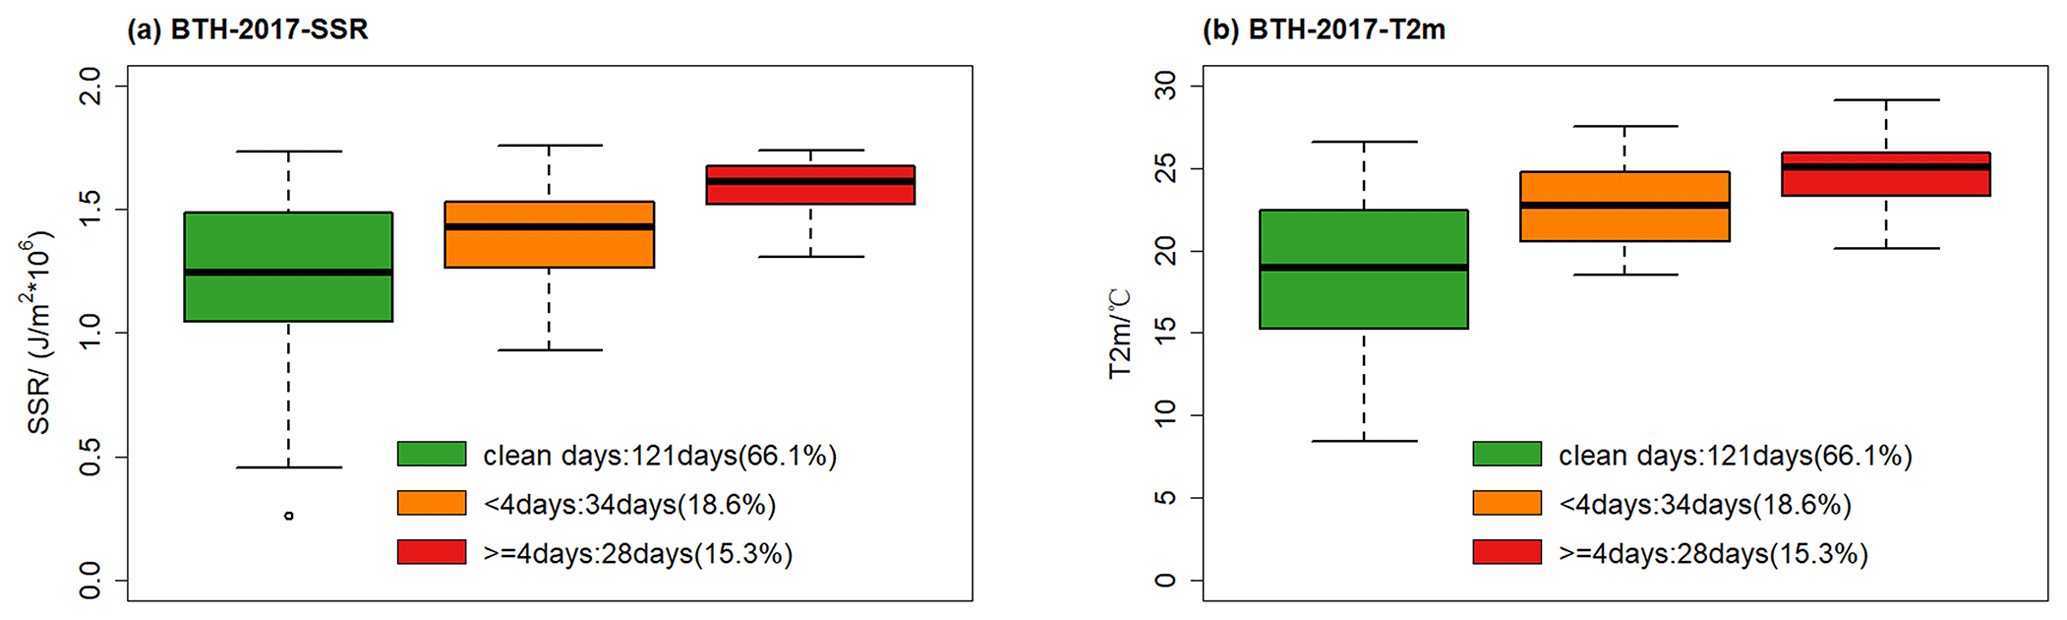
Figure 10Surface solar radiation (SSR) (a) and temperature (T2 m) (b) in BTH in April–September 2017 for four episodes with 4 or more consecutive O3-exceeding days (red), clean days (non-O3-exceeding days) (green), and O3 episodes with fewer than 4 consecutive O3-exceeding days (orange).
Quantitatively the coupling of Fig. 10 with Fig. 3 can be performed by multiplying the difference between the red (4 or more consecutive O3-exceeding days) and green (clean days) values of SSR or T2 m in Fig. 10 with the frequency of occurrence (in percentage of total days) of O3 episodes with 4 or more consecutive O3-exceeding days from Fig. 3. The results are compared to the yearly O3-exceeding days in Fig. 11. The correlation between the yearly O3-exceeding days and weighed SSR is very good, with R values of 0.88 or greater in all three regions, lending strong support to our hypothesis. The correlation between the yearly O3-exceeding days and weighed T2 m is highly correlated in BTH but not correlated in the YRD and PRD, which probably suggests that T2 m is not as strongly coupled to O3 formation as SSR. Inclusion of O3 episodes with fewer than 4 consecutive O3-exceeding days in Fig. 11 did not change the correction coefficients significantly, supporting the robustness of results shown in Fig. 11.
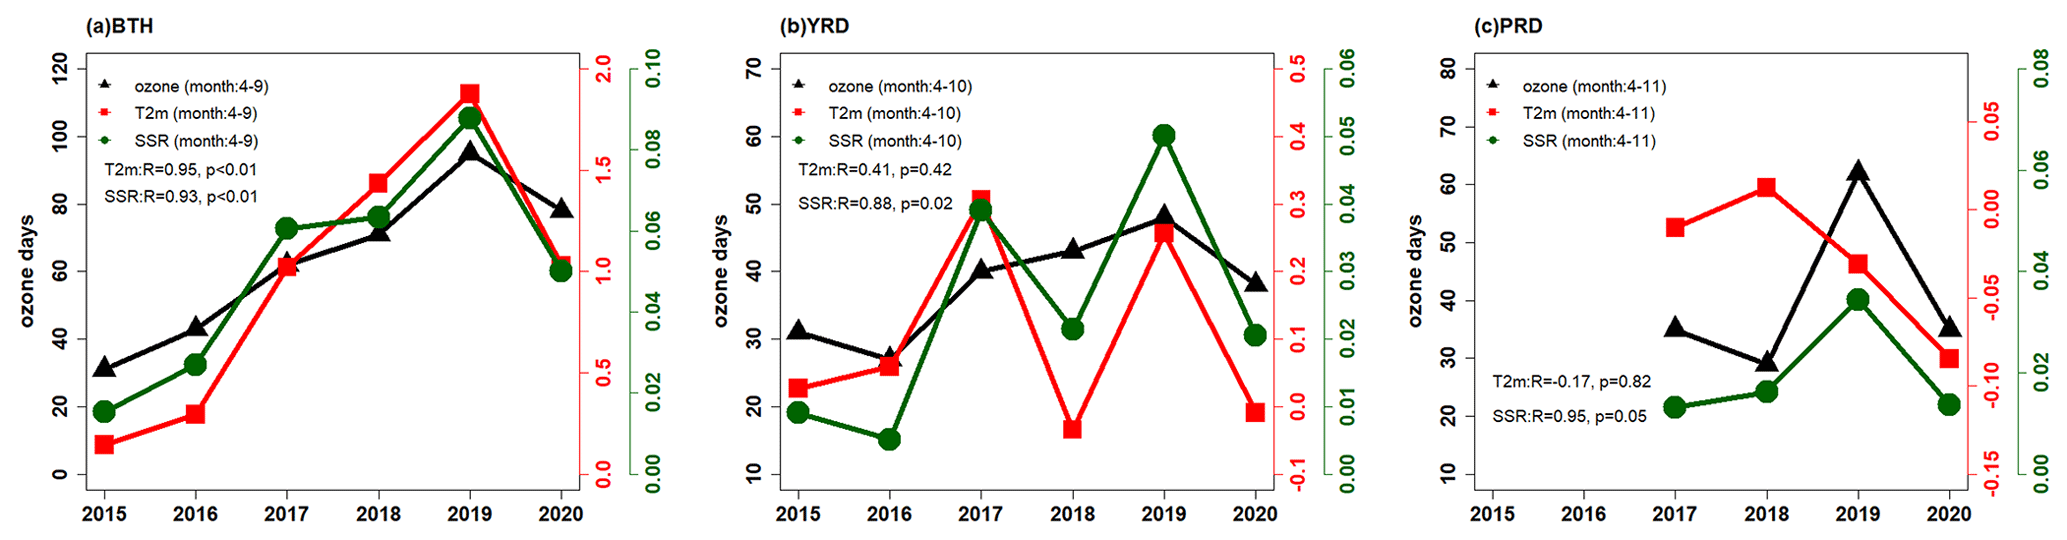
Figure 11Correlations among annual O3-exceeding days, surface solar radiation (SSR), and temperature (T2 m) in the BTH (a), YRD (b), and PRD (c) regions.
Hu et al. (2023), in collaboration with this study, conducted a statistical analysis to assess the processes that contribute to high-O3 formation in the PRD when TCs were present in the northwestern Pacific. They investigated the impact of the distance between TCs in the northwestern Pacific and PRD on the O3 concentration in the PRD from 2006 to 2020. They found that the large numbers of consecutive O3-exceeding days in 2017 and 2019 relative to 2015 were primarily attributable to the greater occurrence of downdrafts and stable atmospheric conditions brought about by mid-distance-category TCs. This finding clearly establishes that changing frequency of mid-distance-category TCs (i.e., changing meteorological conditions) is the cause of the increases in the numbers of consecutive O3-exceeding days, as well as the higher-O3 concentrations in the PRD. An ongoing study by our research group further shows that the mid-distance-category TCs are predominately those TCs with tracks starting around the southern Philippines and ending near Korea and/or Japan. Since TC tracks in northwestern Pacific are strongly controlled by the WPSH, we conclude that both the Philippines-to-Korea or Japan track TCs and corresponding distribution and intensity of the WPSH contributed to the favorable meteorological conditions leading to higher consecutive O3-exceeding days in the PRD from 2015 to 2020.
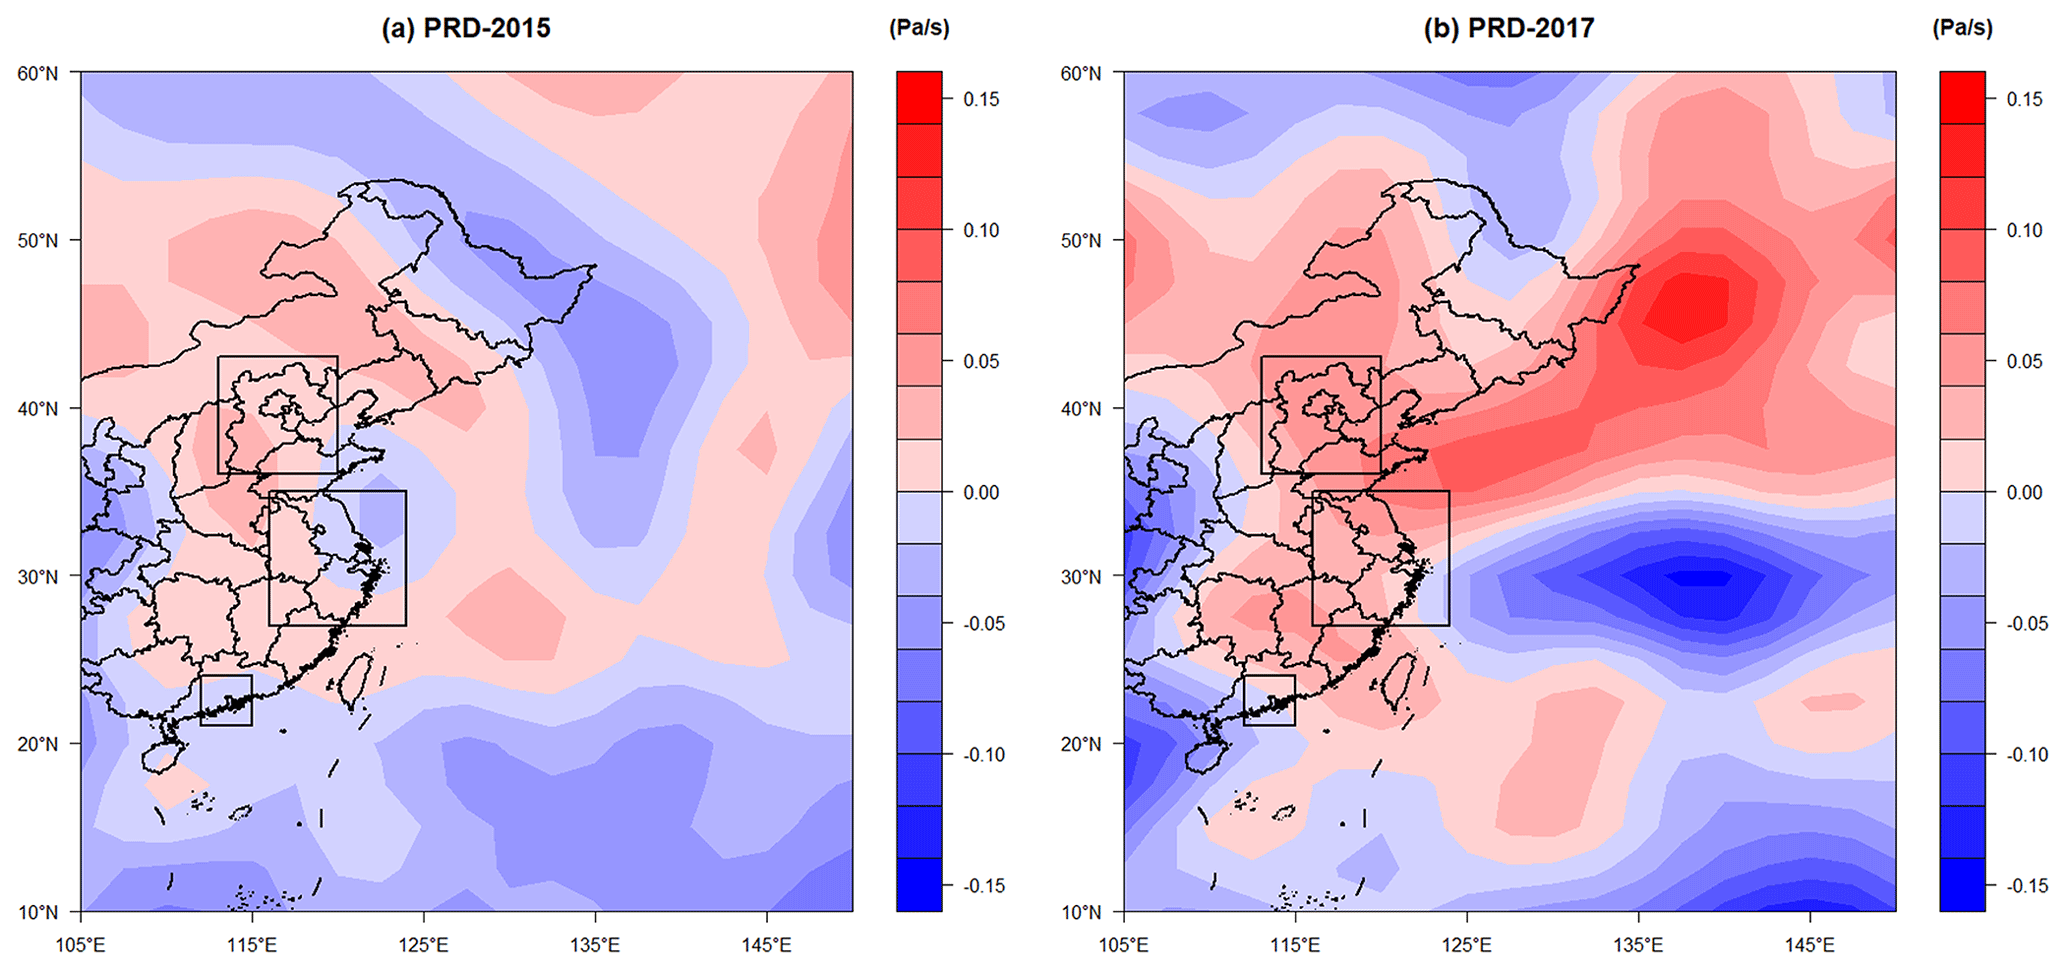
Figure 12Mean vertical velocity at 850 hPa during O3-exceeding days in the PRD in 2015 (a) and during episodes with 4 or more consecutive O3-exceeding days in 2017 (b).
Following the analysis by Hu et al. (2023), the mean vertical velocity at 850 hPa during all O3-exceeding days in the PRD in 2015 (Fig. 12a) is compared to that of episodes with 4 or more consecutive O3-exceeding days in 2017 (Fig. 12b). Major features in Fig. 12 compare very well with those of Fig. 7; e.g., the area with positive vertical velocity (downdrafts) in 2017 (red area in Fig. 12b), which was highly conducive to O3 formation, was by far more widespread and greater in value than that of 2015 (red area in Fig. 12a), agreeing better with the greater high-O3 area of Fig. 7b (2017) than that of Fig. 7a (2015). This agreement confirms that the increase in O3 in the PRD from 2015 to 2017 was caused by increased downdrafts and stable atmospheric conditions (meteorological conditions) brought about by TCs, as suggested by Hu et al. (2023). The same plots for BTH are shown in Fig. 13. The features of Fig. 13 are highly consistent with those of Fig. 5. The same plot for the YRD (Fig. S10) also showed more extensive and greater downdrafts in 2017 than 2015. However, the area of the positive vertical velocity in the YRD appeared to shift by about 500 km to the east compared to the area of high of O3 in Fig. 6b. Considering the uncertainty in evaluating the vertical velocity and that O3 formation is also dependent on parameters other than the vertical velocity, the discrepancy is acceptable.
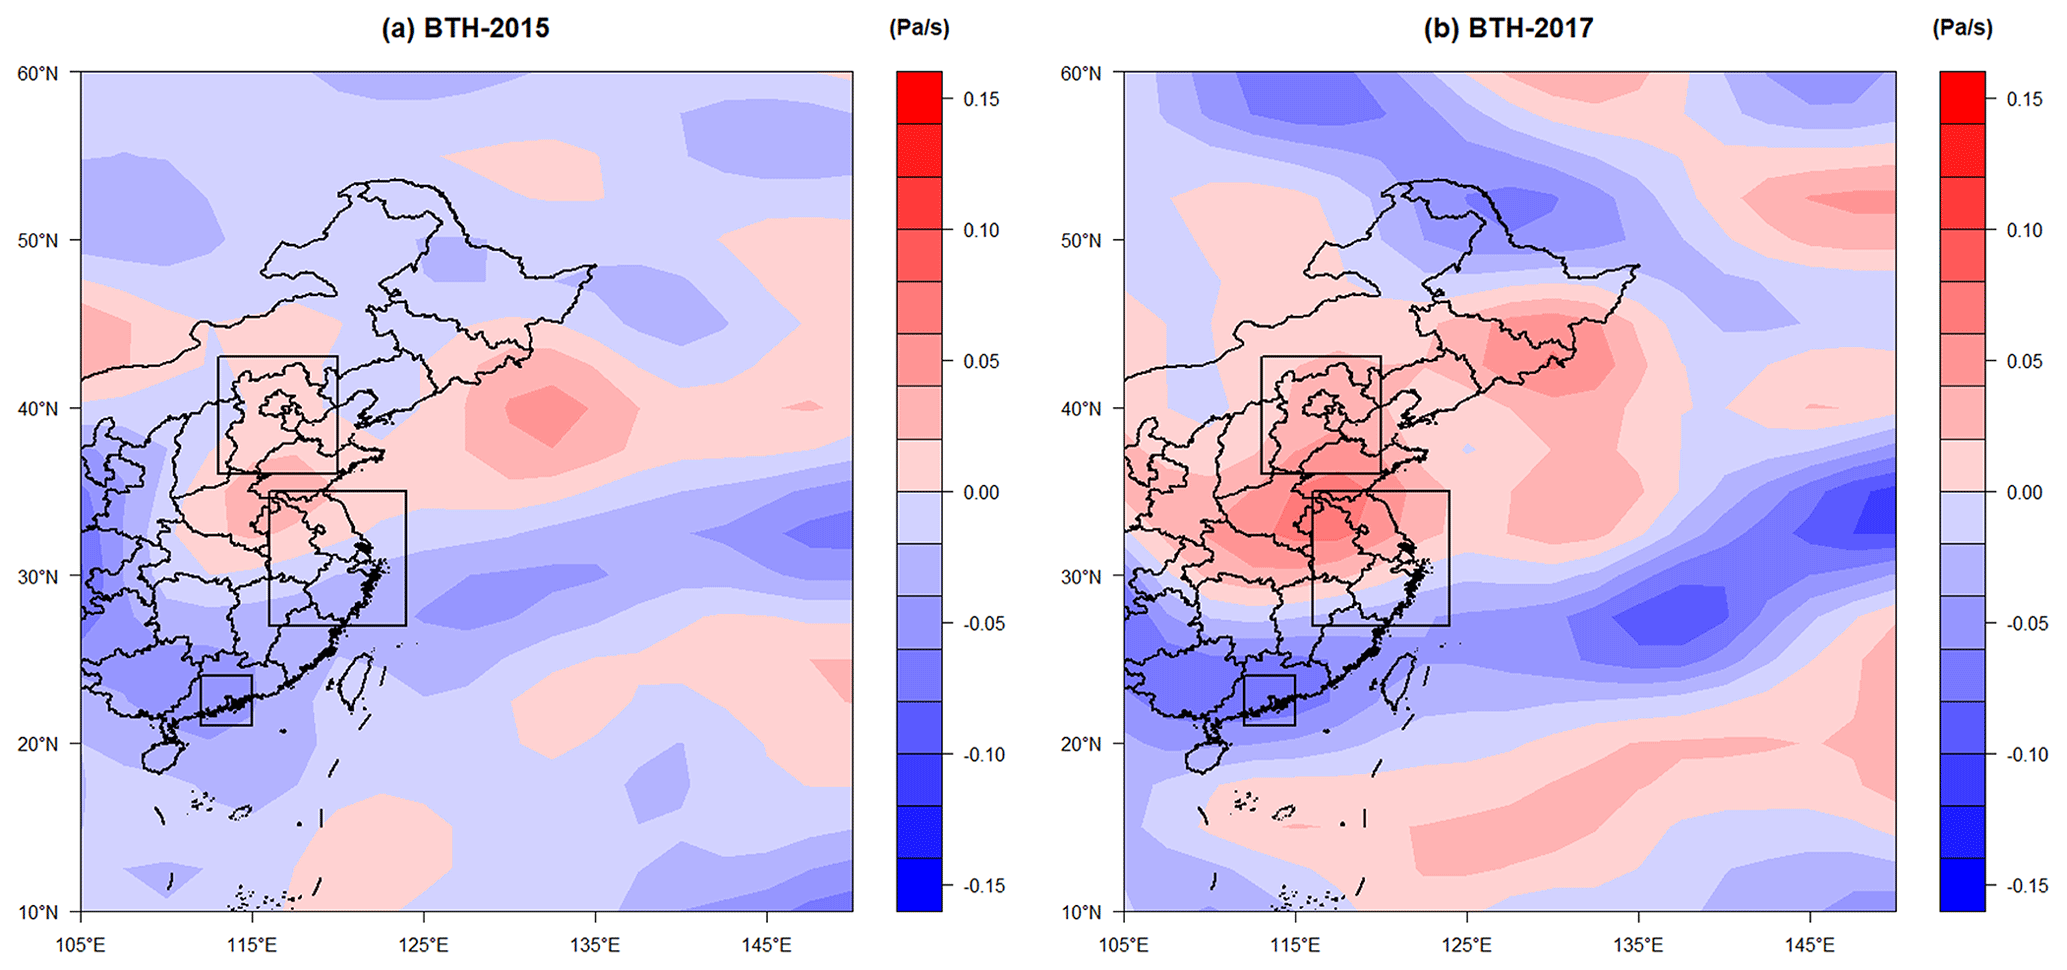
Figure 13Mean vertical velocity at 850 hPa during O3-exceeding days in BTH in 2015 (a) and during episodes with 4 or more consecutive O3-exceeding days in 2017 (b).
To summarize this section, the increases in O3 in the three megacity clusters are critically dependent on the number of 4 or more consecutive O3-exceeding days. In addition, Hu et al. (2023) found that the changing frequency of mid-distance-category TCs (i.e., changing meteorological conditions) is the cause of the increases in the numbers of consecutive O3-exceeding days, as well as the O3 concentrations in the PRD. More importantly, our additional analyses of the mean vertical velocity at 850 hPa over the three megacity clusters (Figs. 12, 13, and S10) show that the increases in O3 in all three megacity clusters from 2015 to 2017 were caused by enhanced downdrafts and stable atmospheric conditions (meteorological conditions) which were highly conducive to O3 formation. The enhanced downdrafts and stable atmospheric conditions were brought about by TCs and the associated WPSH. Here we bring up the WPSH because it is well known that the tracks of TCs are influenced strongly by the WPSH and that WPSH strongly affects the regional atmospheric dynamics and therefore O3 formation (Chang et al., 2019; Mao et al., 2020; Ouyang et al., 2022; Zhao and Wang, 2017).
3.3.3 Contribution of WPSH
Mao et al. (2020) made a comprehensive study of an 11 d O3 episode in BTH in 2017 and found that it was dominated by the presence of the WPSH and mid–high-latitude wave activities. Depending on the position and intensity, the WPSH is well known to be a crucial factor affecting O3 concentrations in various parts of eastern China (Chang et al., 2019; Yin et al., 2019; Zhao and Wang, 2017). During this 11 d O3 episode, the ridge line of the WPSH maintained at approximately 22∘ N from 24 to 29 June 29, which, in combination with mid–high-latitude wave activities, induced meteorological conditions highly conducive to the O3 production in BTH and the northern YRD (Mao et al., 2020).
Following the analysis of Mao et al. (2020), the impact of the WPSH on O3 in BTH in April–September has been analyzed in Fig. 14, which depicts the composite 500 hPa geopotential height contours, humidity, and winds in BTH in April–September for O3-exceeding days in 2015 (Fig. 14a), clean days in 2015 (Fig. 14b), O3-exceeding days in 2017 (Fig. 14c), clean days in 2017 (Fig. 14d), O3-exceeding days in 2019 (Fig. 14e), and clean days in 2019 (Fig. 14f). The 3 years (2015, 2017, and 2019) are chosen because their differences in O3 contribute predominately to the overall O3 increases (Figs. 1–2). The importance of the WPSH is clearly visible in all Fig. 14a–f when the 5880 and 5900 gpm isolines (green lines) of O3-exceeding days are compared to those of clean days. In all 3 years, the WPSH of the former (O3-exceeding days) were significantly stronger than the latter (clean days), as evident by the strong anticyclonic winds and/or the larger areas inside the 5880 gpm isolines. Even in the case of 2017, when the area inside 5880 gpm isolines of the former looked to be similar to that of the latter, the appearance of the 5900 gpm line in the former indicated a stronger WPSH. The strong anticyclonic winds in the O3-exceeding days (Fig. 14a, c, and e) force the moist air of the South China Sea northward into southern China and contributed to extensive clouds and precipitation and thus low-O3 formation over southern China and the southern YRD. This difference in the O3 formation between BTH and southern China provides a good explanation for why the O3-exceeding days mostly occur in different time periods in the three megacity clusters, as discussed in Sect. 3.2. Furthermore, over the East China Sea, the prevailing westerlies were forced northward, slowed down, and led to meteorological conditions in BTH and the northern YRD characterized by a cloudless sky, a sinking motion, and high vertical stability in the lower troposphere, as well as high SSR and a positive T2 m anomaly at the surface. These meteorological conditions were highly conducive to the formation and accumulation of O3. In contrast, the weaker WPSH of the clean days allowed relatively strong westerlies to prevail over BTH during clean days in the 3 years, which tended to disperse O3 (Fig. 14b, d, and f); e.g., the average wind speed over BTH was about 10 m s−1 in Fig. 14b, while it was only about 5 m s−1 in Fig. 12a. Quantitatively, Fig. 12c had 31 more O3-exceeding days (93 ppb) than Fig. 14a, but the 31 d came at the expense of clean days (52 ppb) (Fig. 14b and d). The contribution of these 31 d to the difference in MDA8 O3 between 2017 and 2015 (6.5 ppb; Fig. 1) can be calculated as follows: ppb. This difference of 10.8 ppb in MDA8 O3 between 2017 and 2015 was for the period of April to September. It should be divided by 2 and then becomes 5.4 ppb for the yearly difference in MDA8 O3 between 2017 and 2015. This value of 5.4 ppb accounted for 83 % of the observed difference in MDA8 O3 between 2017 and 2015 (6.5 ppb; Fig. 1). A similar statement can be made for the difference in MDA8 O3 between 2019 and 2017 (Fig. 14e and c; Fig. 1).
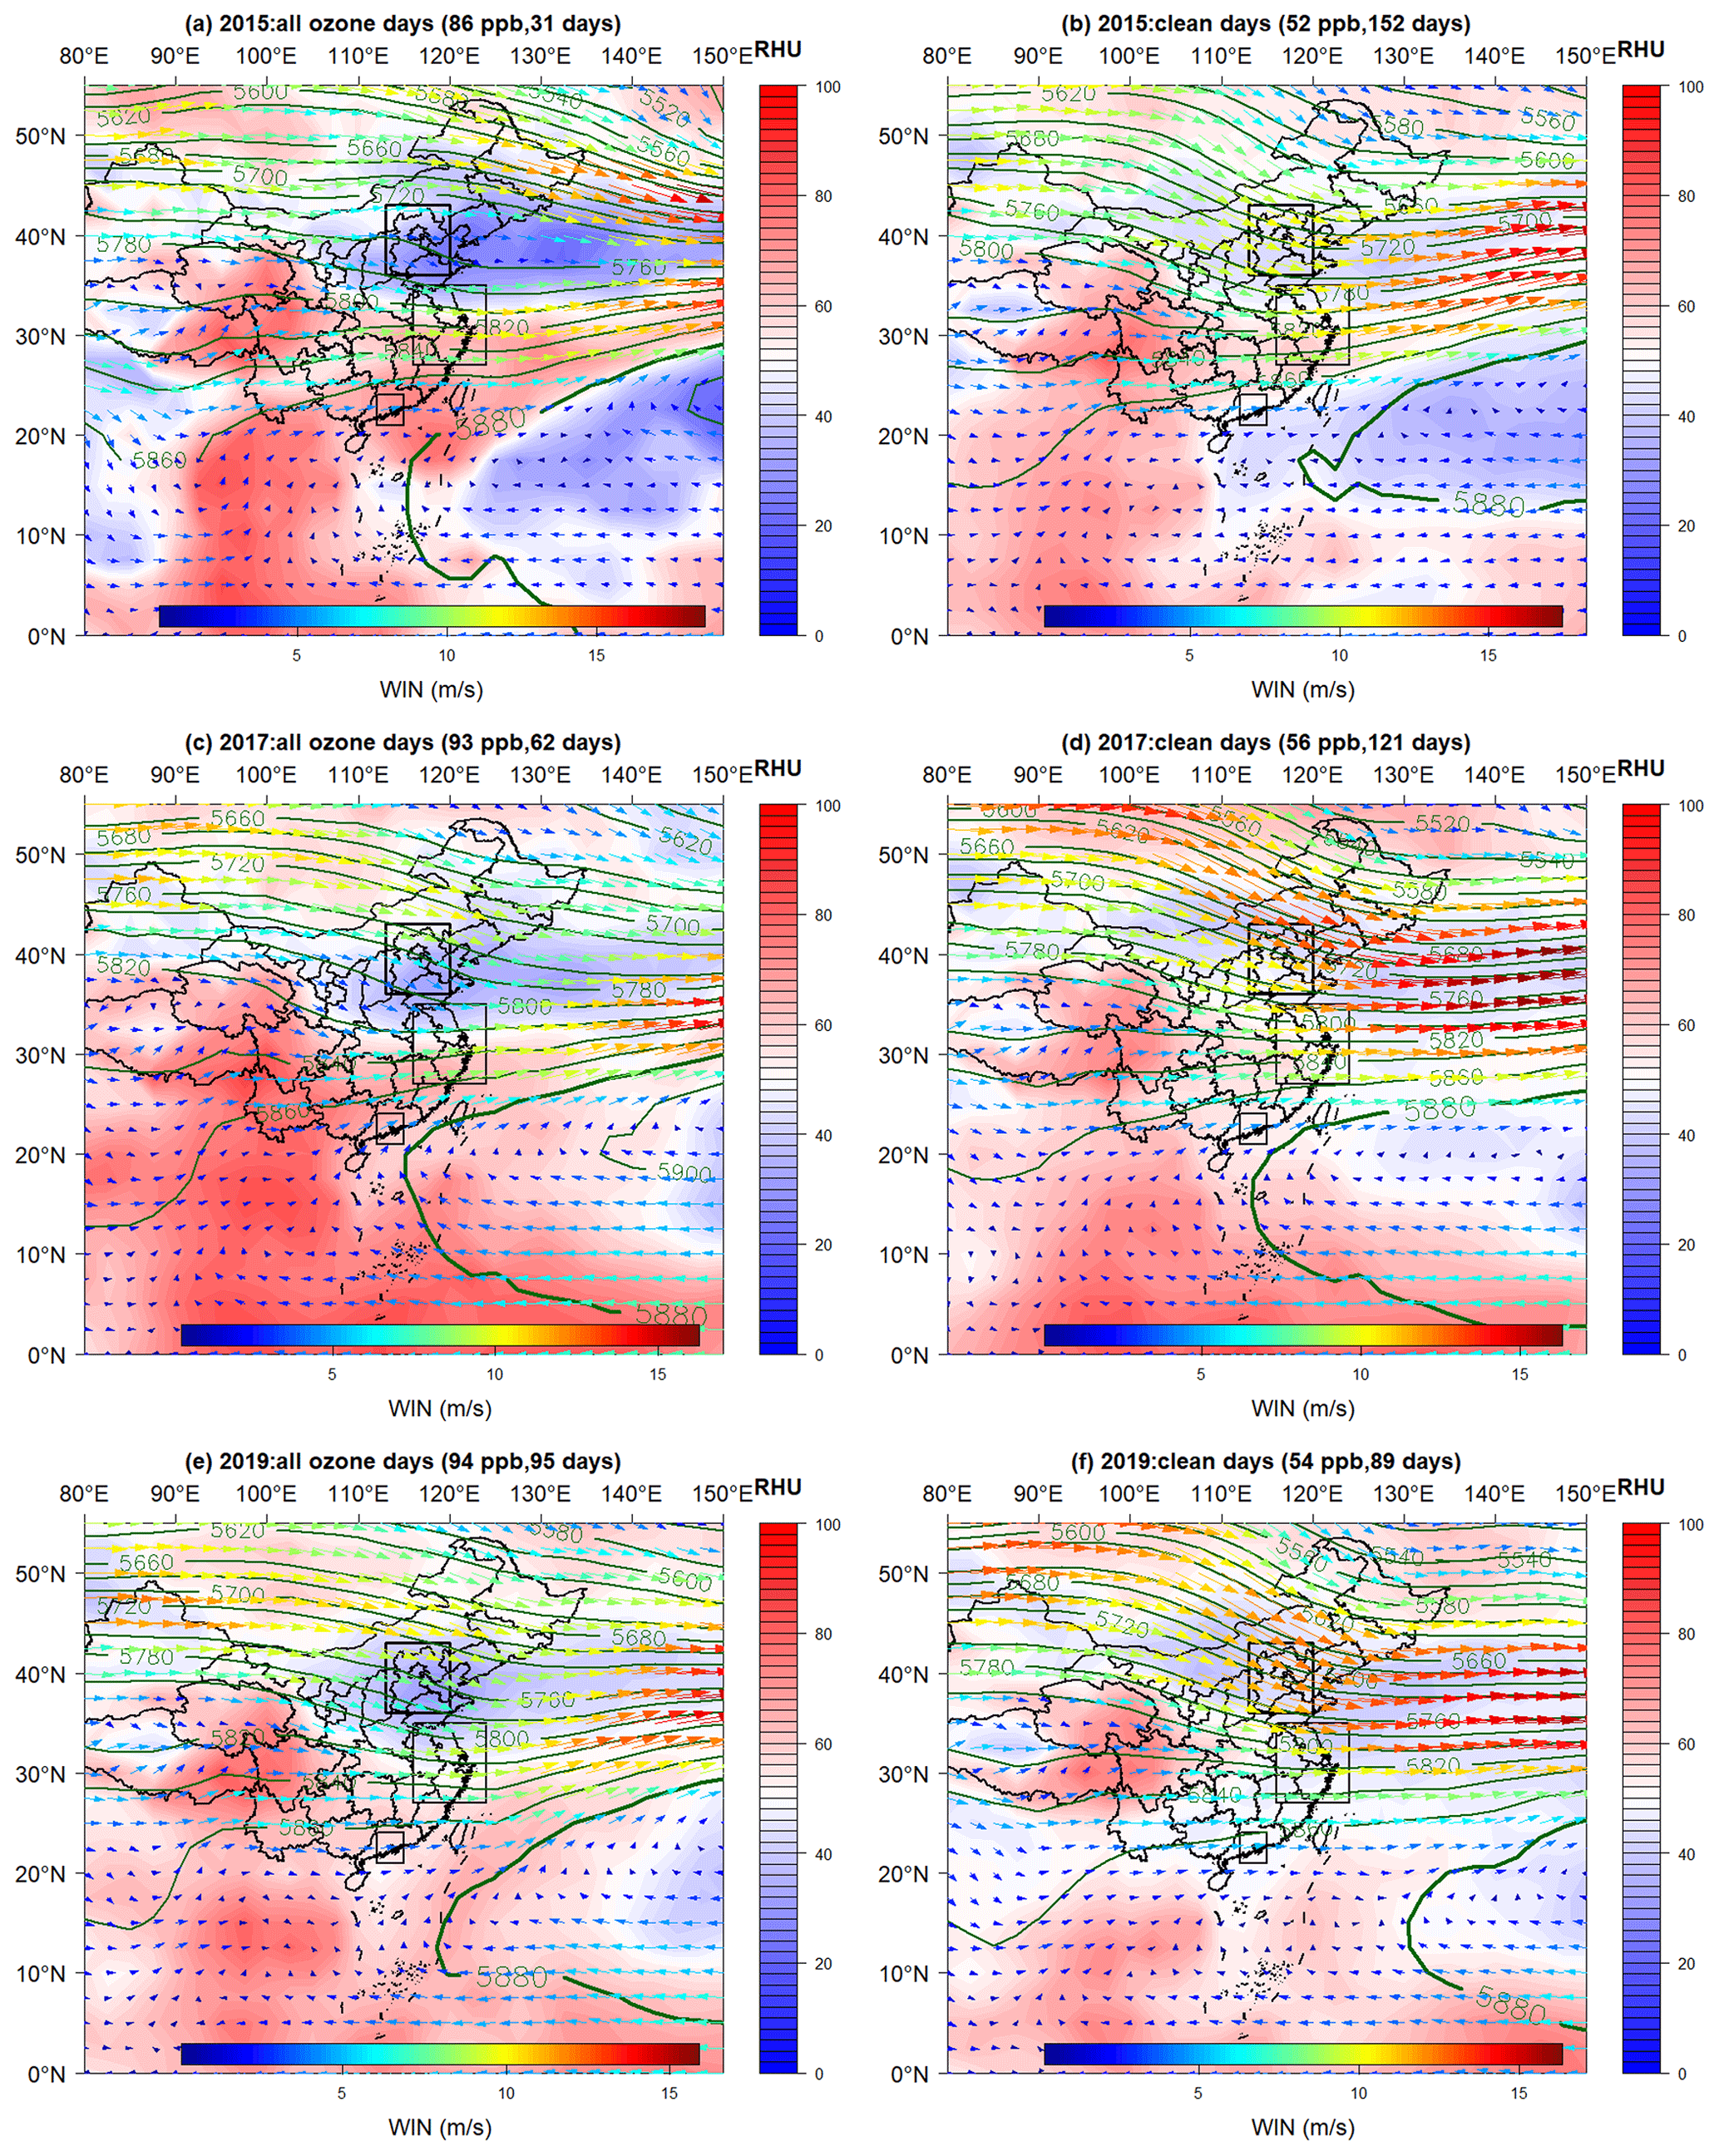
Figure 14Composite 500 hPa geopotential height contours, humidity, and winds in BTH in April–September for O3-exceeding days in 2015 (a), clean days in 2015 (b), O3-exceeding days in 2017 (c), clean days in 2017 (d), O3-exceeding days in 2019 (e), and clean days in 2019 (f).
We have made the same analysis for other years as well for the YRD and PRD. The results are mostly similar and thus presented in the Supplement (Figs. S11, S12, and S13). Figure 15a–d for the PRD in 2017 and 2019 is shown because there were interesting anticyclonic circulations over the PRD during O3-exceeding days in both years (Fig. 15a and c). The 2017 anticyclone was a direct product of the WPSH, as it resided within the western tip of the 5880 gpm isoline. The 2019 anticyclone was also likely associated with the WPSH, as the center of anticyclone resided just beneath the 5860 gpm isoline to the west of the PRD. The anticyclonic circulations were accompanied by stable downdrafts, low winds, and cloudless sky conditions (short arrows and blue shading in Fig. 15a and c), which were highly conducive to the O3 formation. Cloudless sky conditions also occurred in the YRD and BTH in Fig. 15a and c, but the high wind speed prevented the accumulation of O3. This difference in O3 accumulation between the PRD and other two regions provides another good explanation for why the O3-exceeding days mostly occur in different days in the three megacity clusters, as discussed in Sect. 3.2. Quantitatively, Fig. 15c had 27 more O3-exceeding days (90 ppb) than Fig. 13a, but the 27 d came at the expense of clean days (39 ppb) (Fig. 15b and d). The contribution of these 27 d to the difference in MDA8 O3 in the PRD between 2019 and 2017 (6.0 ppb; Fig. 1) can be calculated as follows: ppb. This difference of 11.6 ppb in MDA8 O3 between 2019 and 2017 was for the period of April to November. It should be divided by and then become 7.75 ppb for the yearly difference in MDA8 O3 between 2019 and 2017. This value of 7.75 ppb was 1.75 ppb more than the observed difference in MDA8 O3 between 2019 and 2017 (6.3 ppb; Fig. 1), suggesting a reduction of about 3.5 ppb in MDA8 O3 in the cold months of January–March and December between 2017 and 2019, which was approximately confirmed by the observed reduction of 3.88 ppb.
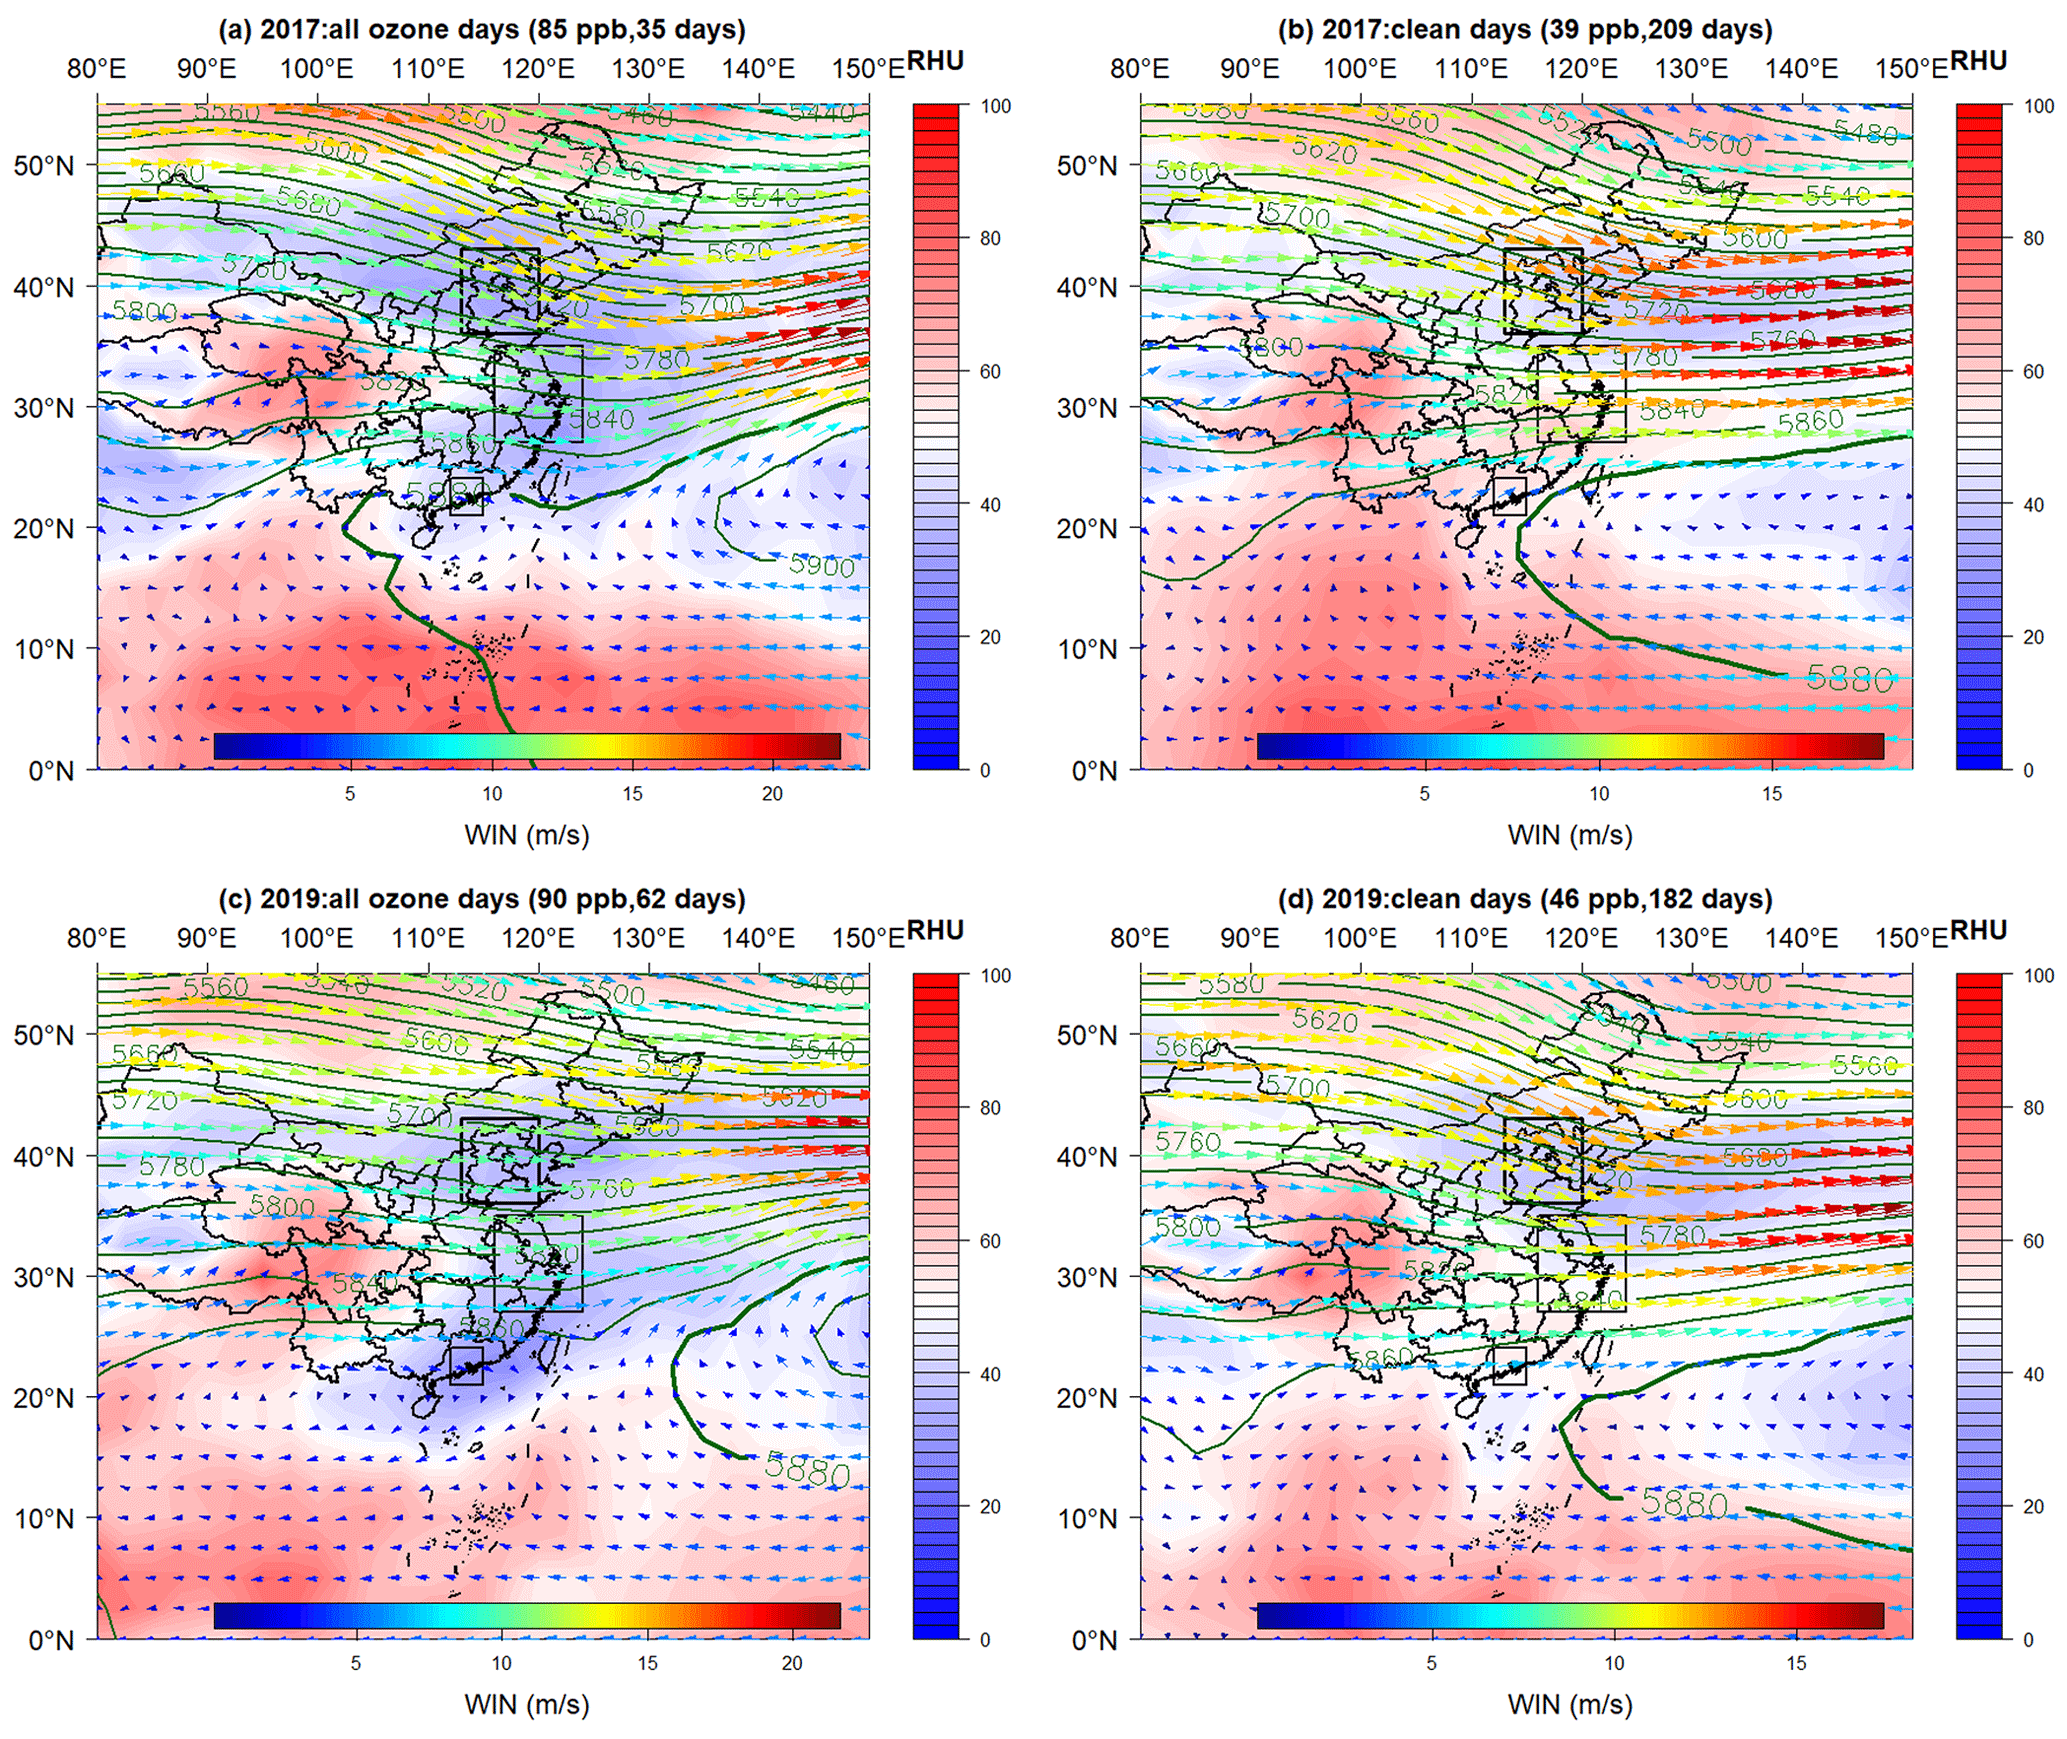
Figure 15Composite 500 hPa geopotential height contours, humidity, and winds in the PRD in April–November for O3-exceeding days in 2017 (a), clean days in 2017 (b), O3-exceeding days in 2019 (c), and clean days in 2019 (d).
The presence of anticyclonic circulations over the PRD is in good agreement with the results of Ouyang et al. (2022) and Hu et al. (2023). The latter authors suggested that the anticyclonic circulations over the PRD were primarily caused by TCs in northwestern Pacific. Nevertheless, it is widely acknowledged that the tracks of TCs in the northwestern Pacific are influenced, at least to some extent, by the WPSH (Sun et al., 2015; Wang et al., 2017), making it difficult to separate the roles played by the TCs on the anticyclonic circulations and O3 formation from those of the WPSH. Clearly, further investigation is needed to fully understand the complex relationship among the WPSH, TCs, and O3. Based on these results, we hypothesize that the increased frequency of these meteorological conditions enabled by the changing intensity and position of the WPSH could contribute as a major cause of the O3 increases in the three megacity clusters in eastern China during 2015–2020.
3.3.4 Saturation at high-concentration sites
Why do favorable meteorological conditions only cause an O3 increase at low-O3 stations but not at high-O3 stations? And why is the O3 saturation level at around 100 ppb, as shown in Fig. 4? These questions can be best addressed by examining Fig. 16, which depicts the time series of individual processes (where DDEP denotes dry deposition, CHEM the net photochemical production of O3, HTRA the horizontal transport, and VTRA the vertical transport) contributing to O3 budget in the PRD (averaged over 56 stations in the PRD) calculated by the WRF–CMAQ model for the O3 episode of 24 September–1 October 2019 (Ouyang et al., 2022). This episode was one of the most severe O3 episodes since the official O3 observation started in the PRD in 2006. MDA8 O3 exceeded the 75 ppb standard on all 8 d of the episode. Hourly O3 reached as high as 110 ppb, yet all MDA8 O3 stayed approximately between 75 and 100 ppb. This suggests a ceiling or saturation level of approximately 100 ppb for MDA8 O3, consistent with what was observed in Fig. 4 for the PRD, as well as BTH and the YRD. Since this episode was one of the most severe episodes, we can assume that the 100 ppb saturation level would also be applicable to other O3 episodes in Guangdong. More importantly, the saturation effect was also a common feature in the results of other three-dimensional models for other megacity clusters, in which MDA8 O3 usually saturated at 100 ppb, e.g., in the YRD (Li et al., 2012) and in Beijing (Zhang et al., 2023). This explains why the saturation O3 level is around 100 ppb, as shown in Fig. 4.
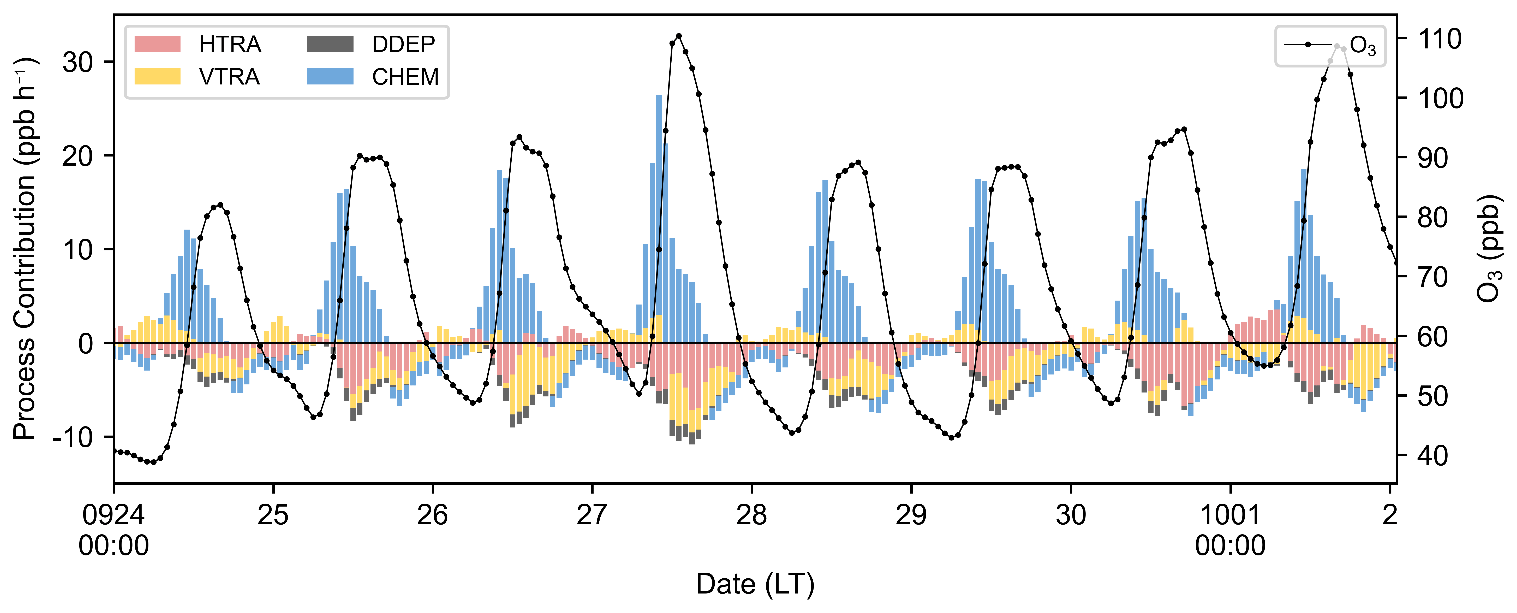
Figure 16Time series of individual processes contributing to O3 budget in the PRD calculated by the WRF–CMAQ model for the O3 episode of 24 September–1 October 2019. The black line (O3) represents the averaged O3 concentrations in the layers below 1260 m. DDEP denotes dry deposition, CHEM denotes chemical processes, HTRA denotes the horizontal transport, and VTRA denotes the vertical transport.
With regard to the first question above (why do the favorable meteorological conditions only cause O3 increase at low-O3 stations but not at high-O3 stations?), it can be understood as follows. At a low-O3 station of 65 ppb MDA8 O3 in the PRD in 2015 (Fig. 4c), Fig. 16 shows that MDA8 O3 can readily increase to 75–100 ppb in a few hours from an early morning low-ozone level of about 50 ppb under favorable meteorological conditions. However, at a high-O3 station of 100 ppb MDA8 O3 in 2015 (Fig. 4c) under the same favorable meteorological conditions, MDA8 O3 would also reach 75–100 ppb in a few hours from an early morning low-ozone level of about 50 ppb. (Note that we assume that all stations start the day with an early-morning low-ozone level of 50 ppb, consistent with the value in Fig. 16). In other words, the saturation levels at all stations are the same at 75–100 ppb, independent of the ozone concentration in 2015.
In terms of contributing processes, the saturation level of 75–100 ppb is controlled primarily by photochemical loss, dry deposition, and dispersion to the free troposphere. This can be clearly seen in Fig. 16 because on all 8 d in the mid-morning, when O3 is approaching toward its peak value, CHEM declines sharply due to photochemical loss and HTRA, VTRA, and DDEP all increase. Near noontime, O3 starts to drop sharply.
3.4 Uncertainty and cautionary statements
It is worth noting that the analyses conducted in Sect. 3.1–3.3 have predominantly relied on correlation or regression analysis techniques, which do not imply a cause-and-effect relationship. To establish a cause-and-effect link between the proposed changes in meteorological parameters and O3 increases, it is necessary to employ a mechanistic model that is based on the proposed causes and can accurately reproduce the observed O3 increase. Until such a model reproduction is achieved, all correlation or regression findings should be considered to be a potential maximum cause-and-effect relationship (Wu et al., 2022). However, current mechanistic models suffer from significant uncertainties, making it difficult to credibly simulate critical atmospheric processes that regulate O3 formation. These processes include atmospheric transport parameterizations, the sources and sinks of OH, HO2 and RO2 radicals, and the photochemistry of VOCs and oxygenated VOCs.
Thanks to a strong emission control policy, major air pollutants in China, including PM2.5, SO2, NO2, and CO have shown remarkable reductions during 2015–2020. However, the O3 concentration increased significantly and emerged as a major air pollutant in eastern China during the same time period. The annual mean concentration of MDA8 in three megacity clusters in eastern China, namely the BTH, YRD, and PRD regions, showed alarming large upward linear increases of 25 %, 10 %, and 19 %, respectively, during 2015–2019. Identifying the causes of these worsening O3 increases is urgently required for air pollution prevention and management. Some recent studies suggested that enhanced photochemical processes induced by changing anthropogenic emissions were responsible for these increases (Li et al., 2019, 2022; Shao et al., 2021; Wang et al., 2020). However, we noticed that there were independent pieces of evidence, including the spatial expansion of high O3 (Figs. 5 and 6) and inter-annual variations in O3, Ox, NO2, CO, and PM2.5 (Fig. 8), suggesting that transport or meteorological conditions rather than emissions of O3 precursors were more likely to be the major contributor to the O3 increases. Moreover, we found that the increases in O3 observed in the three megacity clusters during 2015–2020 (Fig. 1) were mainly caused by the approximately 2- to 3-fold increase in the number of consecutive O3-exceeding days (Fig. 3). In addition, there was a fast and widespread expansion of high O3 from urban centers to surrounding regions (Fig. 4), and most of the expansions was accomplished during the 2015–2017 period (green lines in Fig. 4). Furthermore, the expansions of high O3 in the three megacity clusters were accompanied by a saturation effect; of that, the O3 concentrations at high-O3 stations in 2015 of approximately 100 ppb remained nearly constant throughout 2015–2022 (Fig. S14), while the low-O3 stations in 2015 with O3 fewer than 75 ppb in all three megacity clusters experienced a significant enhancement in O3 (> 5 ppb yr−1) during 2015–2017 (Fig. 4a, b, and c). Finally, greater frequency of episodes with 4 or more consecutive O3-exceeding days contributed to the majority of the increases in O3 in all three megacity clusters in between 2015 and 2017.
Coupling the higher values of SSR and T2 m in the O3 episodes with 4 or more consecutive O3-exceeding days depicted in Fig. 10 and greater occurrence (number of days) in the O3 episodes with 4 or more consecutive O3-exceeding days (shown in Fig. 3), we hypothesize that the cause of the worsening O3 increases in the BTH, YRD, and PRD regions from 2015 to 2020 could be attributed to enhanced photochemical O3 production due to the increased occurrence of meteorological conditions of high solar radiation and positive temperature anomaly under the influence of the WPSH and TCs. The hypothesis is substantiated in Fig. 11, which shows excellent correlation between the yearly O3-exceeding days and SSR with R values of 0.88 or greater in all three regions. Correlation between the yearly O3-exceeding days and T2 m is good in BTH but poor in the YRD and PRD, which probably suggests that T2 m is not as strongly coupled to the O3 formation as SSR.
The increases in O3 in the three megacity clusters are found to be critically dependent on the number of 4 or more consecutive O3-exceeding days. In collaboration with this study, Hu et al. (2023) found that the changing frequency of mid-distance-category TCs (i.e., changing meteorological conditions) is the cause of the increases in the numbers of consecutive O3-exceeding days, as well as the O3 concentrations in the PRD. Our additional analyses of the mean vertical velocity at 850 hPa in the three megacity clusters (Figs. 12, 13, and S10) show that the increases in O3 in all three megacity clusters from 2015 to 2017 were associated with enhanced downdrafts and stable atmospheric conditions (meteorological conditions), which were highly conducive to O3 formation. Finally, the enhanced downdrafts and stable atmospheric conditions were most likely brought about by TCs and the associated WPSH.
Therefore, we propose that the O3 concentrations at the high O3 stations stayed close to a saturation level of about 100 ppb throughout 2015 to 2020, even under more frequent conditions conducive to O3 formation, and were the result of a relatively high rates of atmospheric dispersion, dry deposition, and photochemical loss due to the high-O3 concentration (Fig. 16). While the low-O3 stations, where O3 production was relatively small in 2015, experienced significant enhancements in the O3 production in 2017 and 2019 because of more frequent downdrafts and stable atmospheric conditions associated with TCs and the WPSH in the northwestern Pacific, which were highly conducive to O3 photochemical production and accumulation (Hu et al., 2023).
Following the analysis of Mao et al. (2020), the impact of the WPSH on O3 in BTH in April–September has been analyzed in Fig. 14. We found that the increased frequency of these meteorological conditions enabled by the changing intensity and position of the WPSH could contribute as a major cause of the O3 increases in the three megacity clusters in eastern China during 2015–2020.
Nevertheless, it is crucial to recognize that the examinations carried out in Sect. 3.1–3.3 primarily utilized correlation or regression analysis techniques, which do not inherently establish causal relationships. To attribute cause and effect between the suggested alterations in meteorological parameters and O3 increases, it is necessary to employ a mechanistic model that accurately replicates the observed O3 increase based on the proposed cause(s). Until the model successfully reproduces the phenomenon, all correlation or regression findings should be treated as merely indicating the highest potential cause-and-effect relationship (Wu et al., 2022).
In conclusion, we hypothesize that the cause of the worsening O3 increases in the BTH, YRD, and PRD regions from 2015 to 2020 is attributable to enhanced photochemical O3 production due to the increased occurrence of meteorological conditions of high solar radiation and a positive temperature anomaly under the influence of the WPSH and TCs. Therefore, we suggest that future O3 pollution prevention and control policies should pay more attention to changes in the meteorological or climate conditions, particularly changes in the large-scale circulations, including the WPSH and TCs.
Hourly surface O3, NO2, CO, PM2.5, and SO2 data were obtained from China National Environmental Monitoring Centre (2021, http://www.cnemc.cn/). Hourly meteorological data are obtained from European Centre for Medium-Range Weather Forecasts ERA5 reanalysis at https://doi.org/10.24381/cds.adbb2d47 (Hersbach et al., 2023). Daily meteorological data are obtained from National Centers for Environmental Prediction (NCEP) and National Center for Atmospheric Research (NCAR) (https://doi.org/10.1175/1520-0477(1996)077<0437:TNYRP>2.0.CO;2; Kalnay et al., 1996). The data of this study are available upon request to Shaw Chen Liu (shawliu@jnu.edu.cn).
SCL and RL proposed the essential research idea. TH and YL performed the analysis. TH, YL, RL, and SCL drafted the article. YX, SO, BW, and YZ helped with the analysis and offered valuable comments. All authors have read and agreed to the published version of the paper.
The contact author has declared that none of the authors has any competing interests.
Publisher’s note: Copernicus Publications remains neutral with regard to jurisdictional claims made in the text, published maps, institutional affiliations, or any other geographical representation in this paper. While Copernicus Publications makes every effort to include appropriate place names, the final responsibility lies with the authors.
The authors thank the China National Environmental Monitoring Centre and European Centre for Medium-Range Weather Forecasts for providing the datasets that made this work possible. We also acknowledge the support of the Institute for Environmental and Climate Research and Guangdong–Hong Kong–Macau Joint Laboratory of Collaborative Innovation for Environmental Quality at Jinan University.
This research has been supported by the National Natural Science Foundation of China (grant nos. 92044302 and 41805115), the Guangzhou Municipal Science and Technology Project (grant no. 202002020065), the Special Fund Project for Science and Technology Innovation Strategy of Guangdong Province (grant no. 2019B121205004), the Guangdong Innovative and Entrepreneurial Research Team Program (grant no. 2016ZT06N263), and the National Key Research and Development Program of China (grant no. 2018YFC0213906).
This paper was edited by Jayanarayanan Kuttippurath and reviewed by two anonymous referees.
Bachmann, J. D.: Air quality and climate connections, J. Air Waste Manage., 65, 641–644, https://doi.org/10.1080/10962247.2015.1040697, 2015.
Bell, M. L., Peng, R. D., and Dominci, F.: The exposure–response curve for ozone and risk of mortality and the adequacy of current ozone regulations, Environ. Health Persp., 114, 532–536, https://doi.org/10.1289/ehp.8816, 2006.
Bian, Y., Huang, Z., Ou, J., Zhong, Z., Xu, Y., Zhang, Z., Xiao, X., Ye, X., Wu, Y., Yin, X., Li, C., Chen, L., Shao, M., and Zheng, J.: Evolution of anthropogenic air pollutant emissions in Guangdong Province, China, from 2006 to 2015, Atmos. Chem. Phys., 19, 11701–11719, https://doi.org/10.5194/acp-19-11701-2019, 2019.
Chang, L., Xu, J., Tie, X., and Gao, W.: The impact of climate change on the Western Pacific Subtropical High and the related ozone pollution in Shanghai, China, Sci. Rep.-UK, 9, 16998, https://doi.org/10.1038/s41598-019-53103-7, 2019.
Chen, Z., Li, R., Chen, D., Zhuang, Y., Gao, B., Yang, L., and Li, M.: Understanding the causal influence of major meteorological factors on ground ozone concentrations across China, J. Clean. Prod., 242, 118498, https://doi.org/10.1016/j.jclepro.2019.118498, 2020.
China National Environmental Monitoring Centre: http://www.cnemc.cn/, last access: 3 March 2021.
Cohen, A. J., Brauer, M., Burnett, R., Anderson, H. R., Frostad, J., Estep, K., Balakrishnan, K., Brunekreef, B., Dandona, L., Dandona, R., Feigin, V., Freedman, G., Hubbell, B., Jobling, A., Kan, H., Knibbs, L., Liu, Y., Martin, R., Morawska, L., Pope III C. A., Shin, H., Straif, K., Shaddick, G., Thomas, M., van Dingenen, R., van Donkelaar, A., Vos, T., Murray, C. J. L., and Forouzanfar, M. H.: Estimates and 25-year trends of the global burden of disease attributable to ambient air pollution: an analysis of data from the Global Burden of Diseases Study 2015, The Lancet, 389, 1907–1918, https://doi.org/10.1016/S0140-6736(17)30505-6, 2017.
Deng, T., Wang, T., Wang, S., Zou, Y., Yin, C., Li, F., Liu, L., Wang, N., Song, L., Wu, C., and Wu, D.: Impact of typhoon periphery on high ozone and high aerosol pollution in the Pearl River Delta region, Sci. Total Environ., 668, 617–630, https://doi.org/10.1016/j.scitotenv.2019.02.450, 2019.
Dodge, M. C.: Effect of selected parameters on predictions of a photochemical model, PB-269858; EPA-600/3-77/048, Environmental Protection Agency, Research Triangle Park, N.C., USA, https://nepis.epa.gov/Exe/ZyPDF.cgi/9101A8K2.PDF?Dockey=9101A8K2.PDF (last access: 25 January 2024), 1977.
Dong, Y., Li, J., Guo, J., Jiang, Z., Chu, Y., Chang, L., Yang, Y., and Liao, H.: The impact of synoptic patterns on summertime ozone pollution in the North China Plain, Sci. Total Environ., 735, 139559, https://doi.org/10.1016/j.scitotenv.2020.139559, 2020.
Fu, Y., Liao, H., and Yang, Y.: Interannual and decadal changes in tropospheric ozone in China and the associated chemistry-climate interactions: a review, Adv. Atmos. Sci., 36, 975–993, https://doi.org/10.1007/s00376-019-8216-9, 2019.
Gao, D., Xie, M., Chen, X., Wang, T., Liu, J., Xu, Q., Mu, X., Chen, F., Li, S., Zhuang, B., Li, M., Zhao, M., and Ren, J.: Systematic classification of circulation patterns and integrated analysis of their effects on different ozone pollution levels in the Yangtze River Delta Region, China, Atmos. Environ., 242, 117760, https://doi.org/10.1016/j.atmosenv.2020.117760, 2020.
Guo, H., Chen, K., Wang, P., Hu, J., Ying, Q., Gao, A., and Zhang, H.: Simulation of summer ozone and its sensitivity to emission changes in China, Atmos. Pollut. Res., 10, 543–1552, https://doi.org/10.1016/j.apr.2019.05.003, 2019.
Han, H., Liu, J., Shu, L., Wang, T., and Yuan, H.: Local and synoptic meteorological influences on daily variability in summertime surface ozone in eastern China, Atmos. Chem. Phys., 20, 203–222, https://doi.org/10.5194/acp-20-203-2020, 2020.
Hersbach, H., Bell, B., Berrisford, P., Biavati, G., Horányi, A., Muñoz Sabater, J., Nicolas, J., Peubey, C., Radu, R., Rozum, I., Schepers, D., Simmons, A., Soci, C., Dee, D., and Thépaut, J.-N.: ERA5 hourly data on single levels from 1940 to present, Copernicus Climate Change Service (C3S) Climate Data Store (CDS) [data set], https://doi.org/10.24381/cds.adbb2d47, 2023.
Hu, W., Liu, R., Chen, Z., Ouyang, S., Hu, T., Wang, Y., Cui, Z., Jiang, B., Chen, D., and Liu, S. C.: Processes conducive to high ozone formation in Pearl River Delta in the presence of Pacific tropical cyclones, Atoms. Environ., 307, 119859, https://doi.org/10.1016/j.atmosenv.2023.119859, 2023.
Kalabokas, P., Jensen, N. R., Roveri, M., Hjorth, J., Eremenko, M., Cuesta, J., Dufour, G., Foret, G., and Beekmann, M.: A study of the influence of tropospheric subsidence on spring and summer surface ozone concentrations at the JRC Ispra station in northern Italy, Atmos. Chem. Phys., 20, 1861–1885, https://doi.org/10.5194/acp-20-1861-2020, 2020.
Kalnay, E., Kanamitsu, M., Kistler, R., Collins, W., Deaven, D., Gandin, L., Iredell, M., Saha, S., White, G., Woollen, J., Zhu, Y., Chelliah, M., Ebisuzaki, W., Higgins, W., Janowiak, J., Mo, K. C., Ropelewski, C., Wang, J., Leetmaa, A., Reynolds, R., Jenne, R., and Joseph, D.: The NCEP/NCAR 40-Year Reanalysis Project, B. Am. Meteorol. Soc., 77, 437–472, https://doi.org/10.1175/1520-0477(1996)077<0437:TNYRP>2.0.CO;2, 1996.
Lam, Y. F., Cheung, H. M., and Ying, C. C.: Impact of tropical cyclone track change on regional air quality, Sci. Total Environ., 610–611, 1347–1355, https://doi.org/10.1016/j.scitotenv.2017.08.100, 2018.
Li, K., Jacob, D. J., Liao, H., Shen, L., Zhang, Q., and Bates, K. H.: Anthropogenic drivers of 2013–2017 trends in summer surface ozone in China, P. Natl. Acad. Sci. USA, 116, 422–427, https://doi.org/10.1073/pnas.1812168116, 2019.
Li, K., Jacob, D. J., Liao, H., Qiu, Y., Shen, L., Zhai, S., Bates, K. H., Sulprizio, M. P., Song, S., Lu, X., Zhang, Q., Zheng, B., Zhang, Y., Lee, H. C., and Su, K. K.: Ozone pollution in the North China Plain spreading into the late-winter haze season, P. Natl. Acad. Sci. USA, 118, e2015797118, https://doi.org/10.1073/pnas.2015797118, 2021.
Li, L., Chen, C. H., Huang, C., Huang, H. Y., Zhang, G. F., Wang, Y. J., Wang, H. L., Lou, S. R., Qiao, L. P., Zhou, M., Chen, M. H., Chen, Y. R., Streets, D. G., Fu, J. S., and Jang, C. J.: Process analysis of regional ozone formation over the Yangtze River Delta, China using the Community Multi-scale Air Quality modeling system, Atmos. Chem. Phys., 12, 10971–10987, https://doi.org/10.5194/acp-12-10971-2012, 2012.
Li, M., Wang, T., Shu, L., Qu, Y., Xie, M., Liu, J., Wu, H., and Kalsoom, U.: Rising surface ozone in China from 2013 to 2017: A response to the recent atmospheric warming or pollutant controls?, Atmos. Environ., 246, 118130, https://doi.org/10.1016/j.atmosenv.2020.118130, 2021.
Li, X., Yuan, B., Parrish, D. D., Chen, D., Song, Y., Yang, S., Liu, Z., and Shao, M.: Long-term trend of ozone in southern China reveals future mitigation strategy for air pollution, Atmos. Environ., 269, 118869, https://doi.org/10.1016/j.atmosenv.2021.118869, 2022.
Liu, H., Liu, S., Xue, B., Lv, Z., Meng, Z., Yang, X., Xue, T., Yu, Q., and He, K.: Ground-level ozone pollution and its health impacts in China, Atmos. Environ., 173, 223–230, https://doi.org/10.1016/j.atmosenv.2017.11.014, 2018.
Lu, X., Hong, J., Zhang, L., Cooper, O. R., Schultz, M. G., Xu, X., Wang, T., Gao, M., Zhao, Y., and Zhang, Y.: Severe surface ozone pollution in China: A global perspective, Environ. Sci. Tech. Let., 5, 487–494, https://doi.org/10.1021/acs.estlett.8b00366, 2018.
Lu, X., Zhang, L., and Shen, L.: Meteorology and climate influences on tropospheric ozone: a review of natural sources, chemistry, and transport patterns, Curr. Pollution Rep., 5, 238–260, https://doi.org/10.1007/s40726-019-00118-3, 2019.
Ma, J., Xu, X., Zhao, C., and Yan, P.: A review of atmospheric chemistry research in China: Photochemical smog, haze pollution, and gas-aerosol interactions, Adv. Atmos. Sci., 29, 1006–1026, https://doi.org/10.1007/s00376-012-1188-7, 2012.
Mao, J., Wang, L., Lu, C., Liu, J., Li, M., Tang, G., Ji, D., Zhang, N., and Wang, Y.: Meteorological mechanism for a large-scale persistent severe ozone pollution event over eastern China in 2017, J. Environ. Sci., 92, 187–199, https://doi.org/10.1016/j.jes.2020.02.019, 2020.
Monks, P. S., Archibald, A. T., Colette, A., Cooper, O., Coyle, M., Derwent, R., Fowler, D., Granier, C., Law, K. S., Mills, G. E., Stevenson, D. S., Tarasova, O., Thouret, V., von Schneidemesser, E., Sommariva, R., Wild, O., and Williams, M. L.: Tropospheric ozone and its precursors from the urban to the global scale from air quality to short-lived climate forcer, Atmos. Chem. Phys., 15, 8889–8973, https://doi.org/10.5194/acp-15-8889-2015, 2015.
Nuvolone, D., Petri, D., and Voller, F.: The effects of ozone on human health, Environ. Sci. Pollut. R., 25, 8074–8088, https://doi.org/10.1007/s11356-017-9239-3, 2018.
Ouyang, S., Deng, T., Liu, R., Chen, J., He, G., Leung, J. C.-H., Wang, N., and Liu, S. C.: Impact of a subtropical high and a typhoon on a severe ozone pollution episode in the Pearl River Delta, China, Atmos. Chem. Phys., 22, 10751–10767, https://doi.org/10.5194/acp-22-10751-2022, 2022.
Professional Committee of Ozone Pollution Control of Chinese Society for Environmental Sciences: The Bluebook: Prevention and Control of Ozone Pollution in China (2020), Science Press, Beijing, China, ISBN 978-7-03-071664-4, 2022 (in Chinese).
Rowlinson, M. J., Rap, A., Arnold, S. R., Pope, R. J., Chipperfield, M. P., McNorton, J., Forster, P., Gordon, H., Pringle, K. J., Feng, W., Kerridge, B. J., Latter, B. L., and Siddans, R.: Impact of El Niño–Southern Oscillation on the interannual variability of methane and tropospheric ozone, Atmos. Chem. Phys., 19, 8669–8686, https://doi.org/10.5194/acp-19-8669-2019, 2019.
Shafer, T. B. and Seinfeld, J. H.: Evaluation of chemical reaction mechanisms for photochemical smog. Part 3. Sensitivity of EKMA (Empirical Kinetic Modeling Approach) to chemical mechanism and input parameters, Final Report, March 1984–February 1985, PB-85-210888/XAB, EPA-600-S3-85-042, California Institute of Technology, Pasadena, U.S.A., https://nepis.epa.gov/Exe/ZyPDF.cgi/2000TMJ3.PDF?Dockey=2000TMJ3.PDF (last access: 25 January 2024), 1985.
Shao, M., Wang, W., Yuan, B., Parrish, D. D., Li, X., Lu, K., Wu, L., Wang, X., Mo, Z., Yang, S., Peng, Y., Kuang, Y., Chen, W., Hu, M., Zeng, L., Su, H., Cheng, Y., Zheng, J., and Zhang, Y.: Quantifying the role of PM2.5 dropping in variations of ground-level ozone: Inter-comparison between Beijing and Los Angeles, Sci. Total Environ., 788, 147712, https://doi.org/10.1016/j.scitotenv.2021.147712, 2021.
Sun, Y., Zhong, Z., Yi, L., Li, T., Chen, M., Wan, H., Wang, Y., and Zhong, K.: Dependence of the relationship between the tropical cyclone track and western Pacific subtropical high intensity on initial storm size: A numerical investigation. J. Geophys. Res.-Atmos., 120, 11451–11467, https://doi.org/10.1002/2015jd023716, 2015.
Wang, T., Xue, L., Brimblecombe, P., Lam, Y. F., Li, L., and Zhang, L.: Ozone pollution in China: A review of concentrations, meteorological influences, chemical precursors, and effects, Sci. Total Environ., 575, 1582–1596, https://doi.org/10.1016/j.scitotenv.2016.10.081, 2017.
Wang, Y., Gao, W., Wang, S., Song, T., Gong, Z., Ji, D., Wang, L., Liu, Z., Tang, G., Huo, Y., Tian, S., Li, J., Li, M., Yang, Y., Chu, B., Petäjä, T., Kerminen, V.-M., He, H., Hao, J., Kulmala, M., Wang, Y., and Zhang, Y.: Contrasting trends of PM2.5 and surface-ozone concentrations in China from 2013 to 2017, Natl. Sci. Rev., 7, 1331–1339, https://doi.org/10.1093/nsr/nwaa032, 2020.
Wei, X., Lam, K.-S., Cao, C., Li, H., and He, J.: Dynamics of the Typhoon Haitang related high ozone episode over Hong Kong, Adv. Meteorol., 2016, 6089154, https://doi.org/10.1155/2016/6089154, 2016.
Wu, Y., Liu, R., Li, Y., Dong, J., Huang, Z., Zheng, J., and Liu, S. C.: Contributions of meteorology and anthropogenic emissions to the trends in winter PM2.5 in eastern China 2013–2018, Atmos. Chem. Phys., 22, 11945–11955, https://doi.org/10.5194/acp-22-11945-2022, 2022.
Xue, T., Zheng, Y., Geng, G., Xiao, Q., Meng, X., Wang, M., Li, X., Wu, N., Zhang, Q., and Zhu, T.: Estimating spatiotemporal variation in ambient ozone exposure during 2013–2017 using a data-fusion model, Environ. Sci. Technol., 54, 14877–14888, https://doi.org/10.1021/acs.est.0c03098, 2020.
Yang, W., Chen, H., Wang, W., Wu, J., Li, J., Wang, Z., Zheng, J., and Chen, D.: Modeling study of ozone source apportionment over the Pearl River Delta in 2015, Environ. Pollut., 253, 393–402, https://doi.org/10.1016/j.envpol.2019.06.091, 2019.
Yang, Y., Liao, H., and Li, J.: Impacts of the East Asian summer monsoon on interannual variations of summertime surface-layer ozone concentrations over China, Atmos. Chem. Phys., 14, 6867–6879, https://doi.org/10.5194/acp-14-6867-2014, 2014.
Yin, Z., Cao, B., and Wang, H.: Dominant patterns of summer ozone pollution in eastern China and associated atmospheric circulations, Atmos. Chem. Phys., 19, 13933–13943, https://doi.org/10.5194/acp-19-13933-2019, 2019.
Zhai, S., Jacob, D. J., Wang, X., Shen, L., Li, K., Zhang, Y., Gui, K., Zhao, T., and Liao, H.: Fine particulate matter (PM2.5) trends in China, 2013–2018: separating contributions from anthropogenic emissions and meteorology, Atmos. Chem. Phys., 19, 11031–11041, https://doi.org/10.5194/acp-19-11031-2019, 2019.
Zhang, R.: Relations of water vapor transport from Indian Monsoon with that over East Asia and the summer rainfall in China, Adv. Atmos. Sci., 18, 1005–1017, https://doi.org/10.1007/bf03403519, 2001.
Zhang, S., Zhang, Z., Li, Y., Du, X., Qu, L., Tang, W., Xu, J., and Meng, F.: Formation processes and source contributions of ground-level ozone in urban and suburban Beijing using the WRF-CMAQ modelling system, J. Environ. Sci., 127, 753–766, https://doi.org/10.1016/j.jes.2022.06.016, 2023.
Zhang, Y., Tao, M., Zhang, J., Liu, Y., Chen, H., Cai, Z., and Konopka, P.: Long-term variations in ozone levels in the troposphere and lower stratosphere over Beijing: observations and model simulations, Atmos. Chem. Phys., 20, 13343–13354, https://doi.org/10.5194/acp-20-13343-2020, 2020.
Zhao, W., Lü, M., Lu, Q., Gao, B., Liang, X., Liu, M., Sun, J., Chen, L., and Fan, S.: Effects of tropical cyclones on ozone pollution in the Pearl River Delta in autumn, Environm. Sci., 43, 2957–2965, https://doi.org/10.13227/j.hjkx.202109169, 2022 (in Chinese).
Zhao, Z. and Wang, Y.: Influence of the West Pacific subtropical high on surface ozone daily variability in summertime over eastern China, Atmos. Environ., 170, 197–204, https://doi.org/10.1016/j.atmosenv.2017.09.024, 2017.
Zheng, B., Tong, D., Li, M., Liu, F., Hong, C., Geng, G., Li, H., Li, X., Peng, L., Qi, J., Yan, L., Zhang, Y., Zhao, H., Zheng, Y., He, K., and Zhang, Q.: Trends in China's anthropogenic emissions since 2010 as the consequence of clean air actions, Atmos. Chem. Phys., 18, 14095–14111, https://doi.org/10.5194/acp-18-14095-2018, 2018.