the Creative Commons Attribution 4.0 License.
the Creative Commons Attribution 4.0 License.
 | 01 Feb 2024
Extreme weather exacerbates ozone pollution in the Pearl River Delta, China: role of natural processes
Hongyue Wang
Xin Huang
Tao Deng
Tingyuan Li
Xiaopu Lyu
Fumo Yang
Ozone (O3) pollution research and management in China have mainly focused on anthropogenic emissions, while the importance of natural processes is often overlooked. With the increasing frequency of extreme weather events, the role of natural processes in exacerbating O3 pollution is gaining attention. In September 2022, the Pearl River Delta (PRD) in southern China experienced an extended period (25 d) of regional O3 exceedances and high temperatures (second highest over last 2 decades) due to extreme weather conditions influenced by the subtropical high and typhoon peripheries. Employing an integrated approach involving field measurements, machine learning and numerical model simulations, we investigated the impact of weather-induced natural processes on O3 pollution by considering meteorological factors, natural emissions, chemistry pathways and atmospheric transport. The hot weather intensified the emission of biogenic volatile organic compounds (BVOCs) by ∼10 %. Isoprene and biogenic formaldehyde accounted for 47 % of the in situ O3 production, underscoring the predominant role of BVOC emissions in natural processes. The chemical pathway of isoprene contributing to O3 formation was further explored, with O3 production more attributable to the further degradation of early generation isoprene oxidation products (contributed 64.5 %) than the direct isoprene oxidation itself (contributed 35.5 %). Besides, it was found that the hot weather significantly promoted regional photochemical reactions, with meteorological factors contributing to an additional 10.8 ppb of O3 levels compared to normal conditions. Temperature was identified as the dominant meteorological factor. Furthermore, the typhoon nearing landfall significantly enhanced the cross-regional transport of O3 from northern to southern China through stratosphere–troposphere exchange (STE). The CAM-Chem model simulations revealed that the STE-induced O3 on the PRD surface could reach a maximum of ∼8 ppb, highlighting the non-negligible impact of STE. This study highlights the importance of natural processes exacerbated by extreme weather events in O3 pollution and provides valuable insights into O3 pollution control under global warming.
- Article
(5818 KB) - Full-text XML
-
Supplement
(2534 KB) - BibTeX
- EndNote


Ground-level ozone (O3) is a secondary air pollutant with adverse effects on human health, vegetation, crop yields and climate (Knowlton et al., 2004; Ashmore, 2005; Eyring et al., 2013). The formation of tropospheric O3 is a result of sunlight-driven photochemical reactions involving nitrogen oxides (NOx), volatile organic compounds (VOCs) and other pollutants (Derwent et al., 1998; Jacob, 2000). The relationship between O3 and its precursors exhibits a non-linear pattern that varies across different regions (Jenkin and Clemitshaw, 2000). O3 and its precursors originate from both anthropogenic activities and natural processes such as fossil fuel combustion, biogenic volatile compound (BVOC) emissions and stratosphere–troposphere exchange (STE). Meteorological conditions also play a crucial role in influencing O3 pollution, adding complexity to mitigation efforts (Wang et al., 2017).
Since the industrial revolution, the Northern Hemisphere has experienced a significant increase in O3 pollution, particularly in mid-latitude cities with large populations and industries (Gaudel et al., 2018). In recent decades, Europe and the United States have made notable progress in mitigating O3 pollution through emission control efforts. However, eastern Asia, notably China, continues to face a severe O3 pollution problem (Lyu et al., 2023). Despite the implementation of strict emission control measures, such as the Air Pollution Prevention and Control Action Plan and the reduction in fine particulate matter concentrations, O3 levels in China have continued to rise (Wang et al., 2019). Lu et al. (2018) reported that O3 pollution days in China are 93 % to 575 % higher compared to other developed countries, indicating the significant public concern surrounding this issue.
Despite human activities being recognized as major contributors to severe O3 pollution, it is also important to acknowledge the role of meteorological conditions in the dynamics of tropospheric O3 concentrations. For example, temperature has a direct impact on chemical reaction rates involved in O3 formation as well as the emissions of BVOC from vegetation (Lu et al., 2019). Atmospheric water vapor, on the other hand, plays a crucial role by providing hydrogen oxide (HOx) radicals and directly influencing O3 photochemistry (Camalier et al., 2007). Additionally, wind patterns contribute to the transport and dispersion of pollutants, thereby influencing the spatial distribution of O3 and its precursors (Wang et al., 2022). Nonetheless, the local meteorological parameters are controlled by synoptic weather system. Generally, the role of weather systems manifests in two aspects; one is via the influence on the regional transport of pollutants, and the other is modulating the aggregation and dispersion of local air pollutants (Ding et al., 2017). Extensive research conducted in eastern China has shed light on the importance of weather patterns and addressed the impact of extreme weather contributing to O3 pollution. Notably, anticyclones (such as high-pressure systems) and the periphery of typhoons have emerged as prominent factors (Chan and Chan, 2000; Han et al., 2020; Gao et al., 2021). Besides, natural processes, including the natural sources, chemistry and atmospheric transport of O3, are highly meteorology-sensitive and might further aggravate O3 pollution under extreme weather. For example, the wildfire caused by hot and dry weather could emit large amounts of carbon monoxide (CO), NOx and VOCs and exacerbate O3 pollution (Westerling et al., 2006; Yue and Unger, 2018; Lei et al., 2022). Vegetation-released BVOC emissions are sensitive to temperature and have been proven to increase during hot season and thus accelerate urban O3 formation (Pusede et al., 2015; Wang et al., 2022). An STE event would bring stratospheric O3 to the troposphere under a large-scale/mesoscale process such as tropopause folds, gravity wave breaking and deep convections (Stohl et al., 2003; Wang et al., 2020). As global warming progresses, there is an increase in the frequency of extreme weather events which further impact surface O3 (Banerjee et al., 2016; Lu et al., 2019). These impacts may undermine or offset the efforts by anthropogenic emission reductions, posing risks to the ecological environment. Therefore, understanding the influence of natural process on the formation of ground-level O3 is essential for gaining insights into the dynamics of O3 pollution and developing effective strategies for managing air quality.
The Pearl River Delta (PRD) region, known for its high levels of anthropogenic emissions and surrounded by significant vegetation cover, frequently suffers from extreme weather events such as heat waves and tropical cyclones. The PRD region has emerged as a typical hotspot witnessing an increase in O3 pollution, making it an ideal location to investigate the impact of extreme weather on O3 pollution. In September 2022, the PRD endured a prolonged period of hot weather, leading to more than 20 d of regional O3 exceedance. Here, by integrating simultaneous measurements, machine learning, and numerical model simulations, we aim to improve the understanding of how natural processes induced by extreme weather events affecting O3 pollution and provide new insights for future O3 pollution control efforts.
2.1 Data source
In situ observations were conducted at the Guangzhou Haizhu Urban Ecological Meteorological Comprehensive Observation Base (HZ Base; N, E), which is located in the north area of the Guangzhou Haizhu District National Wetland Park (as shown in Fig. 1a). The observation base is surrounded by basic farmland protection areas and represents a typical composite wetland system consisting of river channels, creeks, fruit orchards, and Jiangxinzhou Island. It also encompasses commercial streets, residential areas, and major transportation routes, providing a representation of wetland climate and human activities. Synchronous online observations of O3, NOx, SO2 and CO components of VOCs and meteorological parameters (surface winds, temperature, relatively humidity, precipitation and solar radiation) were carried out at this observation base. All the data are collected at the HZ Base from 1 to 30 September, with a time resolution of 1 h. Detailed information about the data used, including the monitoring instruments, data coverage and access method, is summarized in Table S1 in the Supplement. Briefly, ambient concentrations of O3, NOx, CO and SO2 were routinely measured using instruments produced by Thermo Scientific (49i-D1NAA, 42i-DNMSDAA, 48i-DNSAA and 43i-DNSAA, respectively). The species of VOC components were monitored by GC5000 analysis systems coupled with flame ionization detectors (FIDs) from AMA Instruments GmbH (AMA, Germany). The target compounds of the instrument were the 56 VOCs designated as photochemical precursors by the US Environmental Protection Agency (EPA). The gas standards utilized were identical to those employed by the US EPA Photochemical Assessment Monitoring Stations (PAMS). More details were documented in our previous paper (Zou et al., 2015). All instruments were regularly calibrated and maintained for different durations. Meteorological data, including temperature, solar radiation, precipitation, relative humidity and winds, were obtained at the same site from the China Meteorological Administration. The in situ measurements were mainly used to drive a photochemical box model as described below. Additionally, the air quality monitoring network established by the Ministry of Ecology and Environment of China was utilized to identify O3 pollution event in the PRD. There were 56 monitoring sites distributed in the whole region (Fig. 1a), and the 90th percentile of the maximum daily 8 h average (MDA8-90) O3 concentration was employed to assess the regional degree of O3 pollution. A regional O3 exceedance occurs when the MDA8-90 exceeds the China's Grade II standard (i.e., 160 µg m−3).
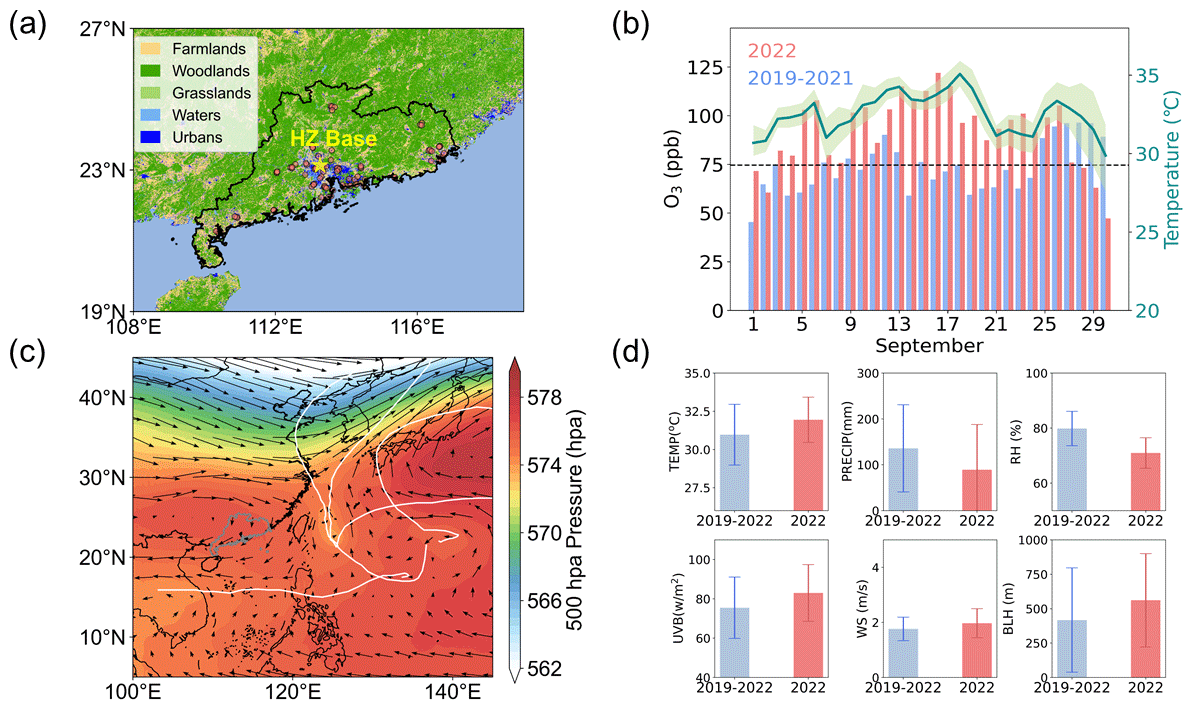
Figure 1(a) Map showing the geographical distribution of the PRD. The dots show the air quality monitoring network, and the yellow star shows the in situ site at Guangzhou Haizhu Urban Ecological Meteorological Comprehensive Observation Base (HZ Base). (b) Variation of MDA8-90 O3 concentrations and regional daily max temperature (The green line shows the average, and the upper and lower shade indicate the 75th and 25th percentile, respectively.). (c) Distribution of 500 hPa pressure and winds of September 2022. The white line shows the typhoon track. (d) Comparisons of meteorological parameters (temperature (TEMP), precipitation (PRECIP), relative humidity (RH), ultraviolet B radiation (UVB), wind speed (WS) and boundary layer height (BLH)) between 2022 and 2019–2021.
In addition to the in situ data, ancillary data from the fifth generation of the European Centre for Medium-Range Weather Forecasts atmospheric reanalysis (ERA5) were utilized. The ERA5 data, at a resolution of grid, corresponded to the same time period and interval as the observed data and provided information such as boundary layer height, potential vorticity, vertical velocity, geopotential height, specific humidity and O3 mass mixing ratio. In addition, typhoon tracks that occurred in the western Pacific Ocean were collected from the China Meteorology Administration Tropical Cyclone Data Center (https://tcdata.typhoon.org.cn, last access: 26 January 2024).
2.2 Stepwise regression analysis
Stepwise regression analysis, as a common method of machine learning, was used to simulate the dynamics of O3 concentrations and quantitatively assess the influence of various meteorological factors on pollutant variations. The method was designed to construct an optimal equation by iteratively selecting significant factors while eliminating non-significant ones to address autocorrelation concerns (Johnsson, 1992). In this study, simple regressions were firstly performed for each explanatory variable, and the variable with the most significant contribution was identified. Subsequently, additional variables were gradually introduced, and the F test and t test were employed to evaluate their significance. Non-significant variables were progressively eliminated until we obtained a final set of critical explanatory variables. Following variable selection, a multivariate linear regression equation was established to capture the variation of O3 concentrations:
In Eq. (1), O3(t) represents the temporal changes in O3 concentration at hour t. The coefficients (α, β, γ, η) for each variable (VAR) were determined during the stepwise regression process, while R(t) represents the residual error term. This approach enables us to effectively analyze the intricate relationship between meteorological factors and O3 concentrations, providing valuable insights into the dynamics of O3 pollution. This utilized approach has proven effective in our previous pollutant simulations (Chen et al., 2022). In this study, the model's performance was validated through Fig. S1 in the Supplement, demonstrating a strong correlation (Pearson correlation coefficient (R)=0.84 and p value (from two-tailed t test) <0.01) between the observed and simulated O3 concentrations.
2.3 Lagrangian dispersion modeling
We conducted backward Lagrangian particulate dispersion modeling (LPDM) using the Hybrid Single-Particulate Lagrangian Integrated Trajectory model (HYSPLIT; https://www.arl.noaa.gov/hysplit/, last access: 15 November 2023) to identify the dominant air flow impacting the receptor area. The meteorology fields were from the Global Data Assimilation System (GDAS) data. In this study, we released 3000 particulates at 100 m above sea level (a.s.l.) over the site (HZ Base) and tracked their backward movement for 48 h with a time resolution of 1 h. The positions of the particulates were determined using both vertical and horizontal calculations, considering mean wind and turbulence transport. The model finally identified the “retroplume” footprint representing the spatial residence time of the particulates and could be regarded as the distribution of the simulated air mass's surface probability or residence time.
2.4 MEGAN
The Model of Emissions of Gases and Aerosols from Nature (MEGAN, version 2.1, available at https://bai.ess.uci.edu/megan/, last access: 15 November 2023) was used to estimate BVOC emissions from terrestrial ecosystems (Guenther et al., 2012). The model could calculate 147 individual biogenic compounds and lump them into the appropriate VOC mechanisms such as CB05, RACM and SAPRC99. Herein, the CB05 mechanism was adopted for VOC treatment. Due to the versatility and compatibility, MEGAN could be incorporated into many widely used chemical transport models, with horizontal resolution ranging from a few kilometers to several hundred kilometers. In this study, the plant function type (PFT) data were from the Moderate-Resolution Imaging Spectroradiometer (MODIS) MCD12Q1 product, and the leaf area index (LAI) data were from the MODIS MCD15A2H product. The input meteorology including temperature, solar radiation and relative humidity was obtained from Weather Research Forecast-Community Multi Scale Air Quality (WRF-CMAQ) simulations with a horizontal resolution of 12 km×12 km. The configuration of WRF-CMAQ is summarized in Table S2 in the Supplement. In particular, to emphasize the influence of extreme weather, comparisons of BVOC emissions from parallel simulations were conducted. In detail, we employed two sets of meteorological fields to drive MEGAN, respectively. One set was based on the WRF-simulated meteorology from September 2022, while the other utilized the average meteorological fields from the preceding 3 years (2019–2021).
2.5 In situ photochemistry modeling
In situ O3 formation was simulated using the Framework for 0-D Atmospheric Modeling (F0AM) incorporating Master Chemical Mechanism v3.3.1 (https://sites.google.com/site/wolfegm/models, last access: 15 November 2023). The application method was roughly in line with that in Lyu et al. (2022). Briefly, the model was constrained by observations including O3, NOx, CO, sulfur dioxide (SO2), VOC species and meteorological parameters collected at HZ Base at hourly resolution. Specifically, HCHO was not measured and was constrained by the WRF-CMAQ simulation results (The validation of WRF-CMAQ is summarized in Table S3 in the Supplement.). A “family conservation” that set the total NOx to the observed value every hour and allowed nitrogen monoxide (NO) and nitrogen dioxide (NO2) to evolve over time was applied. Photolysis frequency of NO2 observed at HZ Base was input and used to correct the photolysis frequencies of other species. The net O3 production rate (OPR) was calculated as the difference between the O3 production rate (NO2 production through NO oxidation by peroxyl radicals) and destruction rate (NO2 reacting with OH, O3 photolysis, ozonolysis of alkenes, and O3 consumption by OH and HO2), in line with the method adopted in previous studies (Lyu et al., 2019; Wang et al., 2017). The reaction rates for a total of 17 224 reactions were extracted to diagnose the main isoprene-related pathways leading to O3 formation.
2.6 CAM-Chem model
The CAM-Chem (Chemical Lagrangian Model of the Stratosphere), a component of the National Center for Atmospheric Research (NCAR) Community Earth System Model (CESM) version 2.2.0, was utilized to simulate the impact of STE transported O3 on the troposphere. The meteorological fields were obtained from Model-Era Retrospective analysis for Research and Applications-Version 2 (MERRA-2) and regridded to a 32-vertical layer with a horizontal resolution of . The chemistry mechanism employed was the Model for Ozone and Related Chemical Tracers (MOZART). Further information about the model can be found in the CAM-Chem Wiki (https://wiki.ucar.edu/display/camchem, last access: 26 January 2024). To validate the model's performance, we compared the distribution of the simulated O3 with O3 from AIRS (Atmospheric Infrared Sounder). Both the monthly averaged distribution and an STE-induced O3 intrusion case were compared (Fig. S2 in the Supplement). Although the CAM-Chem simulations showed slightly higher O3 levels in southern China, the correlation coefficient in eastern China was 0.79 (passed a 95 % significance test), indicating the CAM-Chem model produced O3 relatively well at higher levels (Fig. S3 in the Supplement). Besides, it was worth noting that the satellite retrievals themselves contain uncertainties, mainly from the impact of clouds, aerosols, surface albedo and the inversion algorithms (Briegleb et al., 1986; De Smedt et al., 2010; Povey and Grainger, 2015). Overall, the simulated O3 showed good agreement with the AIRS data in terms of magnitude and spatial pattern, indicating satisfactory model performances. Furthermore, a comparison of the CAM-Chem simulated ground-level O3 with the surface network monitoring was also conducted (Fig. S4 in the Supplement). The daily magnitude and variation trend were successfully captured in Guangzhou, with a mean bias error (MBE) of −7.9 ppb and a root mean square error (RMSE) of 16.3 ppb. This demonstrated a good reproduction of surface O3 concentrations. Indeed, our previous paper has also shown the good performance of the CAM-Chem model application in eastern China (Wang et al., 2023).
3.1 Exacerbation of O3 pollution due to extreme weather conditions
In September 2022, the PRD region experienced continuous extreme weather, resulting in a prolonged period of hot weather conditions. As a consequence, the region encountered 25 consecutive days of regional O3 pollution (Fig. 1b). Monthly O3 concentrations (MDA8-90 O3) were situated in high levels reaching up to 92 ppb, approximately 20 ppb higher than the average of the same period during past 3 years. Meanwhile, the monthly average daily-maximum temperature soared to 32 ∘C, making it the second-highest temperature recorded in September over the past 2 decades (Fig. S5 in the Supplement). The extremely high temperature appeared to be a significant driver of O3 pollution, as evidenced by a high correlation coefficient of 0.70 (p<0.05) between O3 levels and air temperature (Fig. 1b). From a synoptic weather perspective, the occurrence of hot weather was the combined effect of multiple tropical cyclones and the western Pacific subtropical high (WPSH) (Fig. 1c). It was recorded that there were four tropical cyclones that influenced the PRD within the 1-month study time (2022 September; described in Table S4 in the Supplement). As shown in Fig. 1c, the combined effects of tropical cyclones and the WPSH resulted in the splitting of the subtropical high into two parts. One part lingered over the western Pacific Ocean, while the other remained over the southern region of China, leaving the PRD under the fully control of the mainland high-pressure system. Affected by the sinking air flow under the mainland high, the PRD region experienced conditions characterized by high temperatures, intense solar radiation, low humidity and reduced precipitation, creating a favorable environment for photochemical pollution (Fig. 1d).
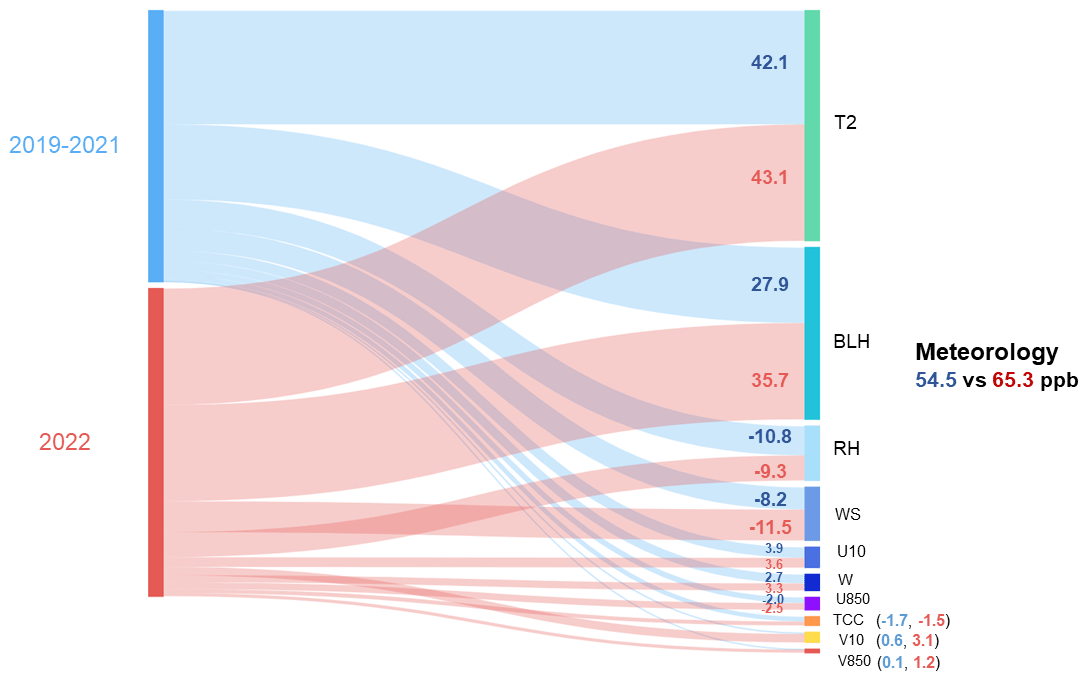
Figure 2Contributions of multi-meteorological factors (2 m temperature (T2), boundary layer height (BLH), relative humidity (RH), wind speed (WS), 10 m U component of wind (U10), w (vertical wind speed), 850 hPa U component of wind (U850), total cloud coverage (TCC), 10 m V component of wind (V10), and 850 hPa V component of wind (V850)) to O3 in the September of 2022 and 2019–2021.
To assess the influence of meteorological parameters on O3 concentrations, we developed a stepwise regression model to simulate regional O3 concentrations. By incorporating an extensive range of input variables, including surface and 850 hPa meteorological factors, we rigorously tested and identified 10 significant factors through T test analysis. These factors comprised the following: 2 m temperature (T2), boundary layer height (BLH), surface relative humidity (RH), surface wind speed (WS), 10 m U component of wind (U10), vertical wind speed (W), 850 hPa U component of wind (U850), total cloud coverage (TCC), 10 m V component of wind (V10) and 850 hPa V component of wind (V850). As illustrated in Fig. 2, meteorological parameters exerted a crucial influence on O3 concentrations in 2022, surpassing levels in previous years (2019–2021). This underscored the profound impact of meteorology on O3 pollution. Notably, the factors associated with photochemistry, such as T2, BLH and RH, played a substantial role, contributing 43.1, 35.7 and −9.3 ppb, respectively, to the overall O3 concentration. In particular, the average daily-maximum air temperature in September maintained a typically high level (32 ∘C), which not only accelerated the rates of photochemical reactions but also stimulated the emission of BVOC from vegetation, thereby exacerbating O3 concentrations. Furthermore, the increase in BLH and WS compared to previous years indicated relatively favorable ventilation conditions, which facilitated the transport of local and upstream pollutants. Subsequent investigations unveiled that air pollutants from northern regions could be transported to the PRD, contributing to the observed O3 concentrations (refer to Sect. 3.3). Additionally, September exhibited relatively dry conditions with lower relative humidity (RH) and less precipitation. Our model revealed a negative correlation between O3 and RH, suggesting that the presence of water vapor contributed to the photochemical removal of O3 concentrations (e.g., through HOx reactions). The reduced RH in September also likely facilitated the persistence of O3 pollution in the region.
3.2 Weather-boosted BVOC emissions aggravating O3 production
As one important precursor of O3 formation, BVOC emissions are sensitive to ambient temperature and solar radiation. Here, we utilized MEGAN to calculate the regional BVOC emissions. Parallel simulations driven by different meteorological inputs, i.e., meteorological fields in September 2022 and average meteorological fields in September of the previous 3 years, were conducted, respectively. It was found that the hot weather in September 2022 led to an increase in BVOC emissions in the PRD region by approximately 10 %, relative to that in the same period in the past (Fig. 3a). Besides, the in situ-observed isoprene exhibited a significant concentration difference between day and night, i.e., 0.52–1.25 ppb during 06:00–17:00 LT and an average of 0.10 ppb at other times (Fig. S6 in the Supplement). Not surprisingly, isoprene contributed 7.77 ppb h−1 (∼40 %) to the in situ net O3 production rate (OPR) in the daytime (Fig. 3b). Nevertheless, this was likely a conservative estimate of the biogenic contributions, due to lack of consideration of other biogenic VOC. HCHO, as an important O3 precursor, is of both anthropogenic and biogenic origin. Here, we utilized WRF-CMAQ-simulated biogenic HCHO as input to examine its impact on O3 formation with F0AM. It was found that biogenic HCHO at an average concentration of 2.46 ppb elevated the OPR by 1.29 ppb h−1. This increased the contribution to OPR of biogenic emissions to 47 %. Overall, the modeling results underlined the crucial role of biogenic emissions in building up O3 levels in September 2022.
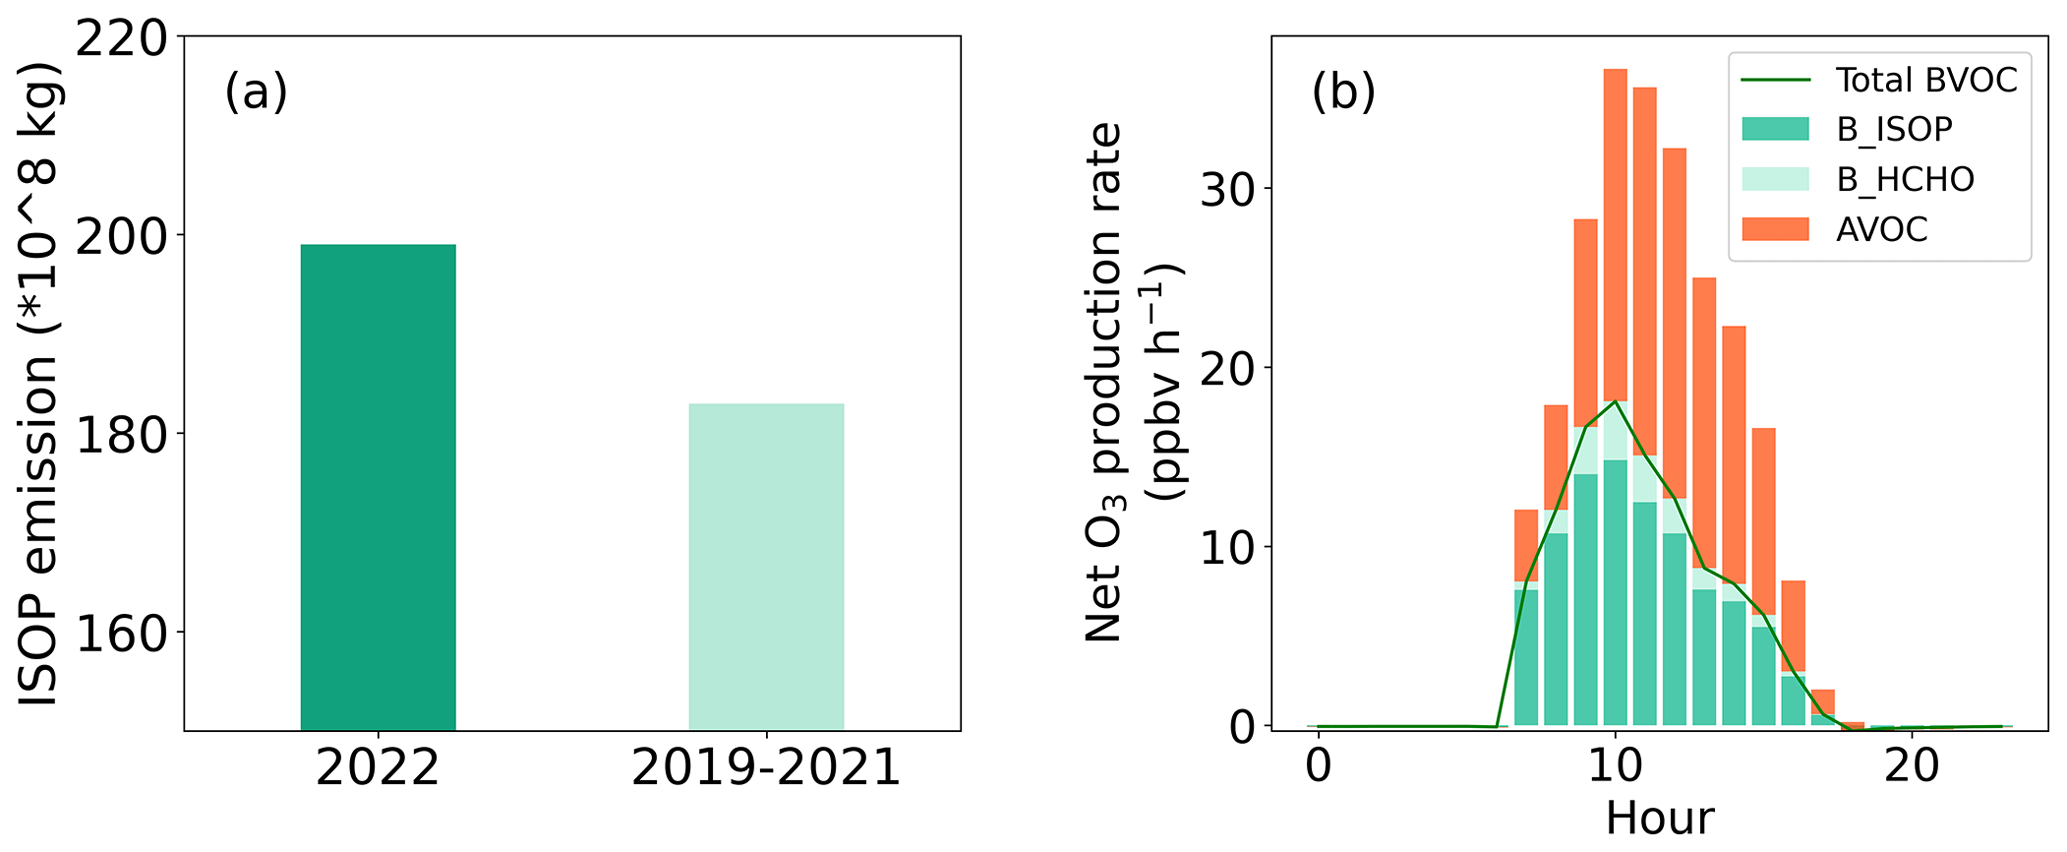
Figure 3(a) Isoprene emissions in the PRD in September 2022 and 2019–2021. (b) Net OPR attributed to biogenic isoprene (B_ISOP), biogenic HCHO (B_HCHO), total BVOC and anthropogenic VOC (AVOC) in September 2022.
Next, we explored the detailed mechanisms of O3 formation enhancement induced by the rise in isoprene levels due to hot weather (Fig. 4). Simulations were performed for a base case with observations in 2022 and a hypothetical case of lower isoprene levels. We used the ratio of isoprene emissions between 2022 and previous years to scale the observed isoprene in September 2022. So, isoprene in the base case was 10 % higher than that in the hypothetical case. HCHO was constrained by the same profile in both cases. It was simulated that the 10 % increase in isoprene would lead to an additional O3 production of 7.5 ppb (OPR of 1.00 ppb h−1 at 12:00 LT). While there was little change in the O3 destruction pathways, the production of NO2 through RO2+NO and HO2+NO (pathways leading to O3 formation following NO2 photolysis) increased by 0.63 and 0.38 ppb h−1, respectively. As shown in Fig. 4, this overall effect was caused by multiple reactions involving several generations of isoprene oxidation products/intermediates. The direct oxidation of isoprene by OH and the following transformation from RO2 through RO to HO2 only accounted for 30.3 % and 42.8 % of the increase in the total rate of RO2+NO and HO2 production, respectively. The rest was contributed by the degradation of methyl vinyl ketone (MVK) and methacrolein (MACR), two typical isoprene oxidation products (Pierotti et al., 1990). In particular, the formation of peroxyacetyl radical (CH3CO3) was enhanced by 0.16 ppb h−1, which further accelerated the rate of RO2 oxidizing NO by 0.30 ppb h−1 (45.6 %) and HO2 production rate by 0.15 ppb h−1 (32.5 %). Methylglyoxal (MGLYOX) and CH3CO3 were the key intermediates in photochemical degradation of MVK and MACR that largely enhanced O3 formation. The effect of MVK was much more significant than MACR, which was reasonable, due to the presence of a more reactive vinyl group in the MVK molecule.
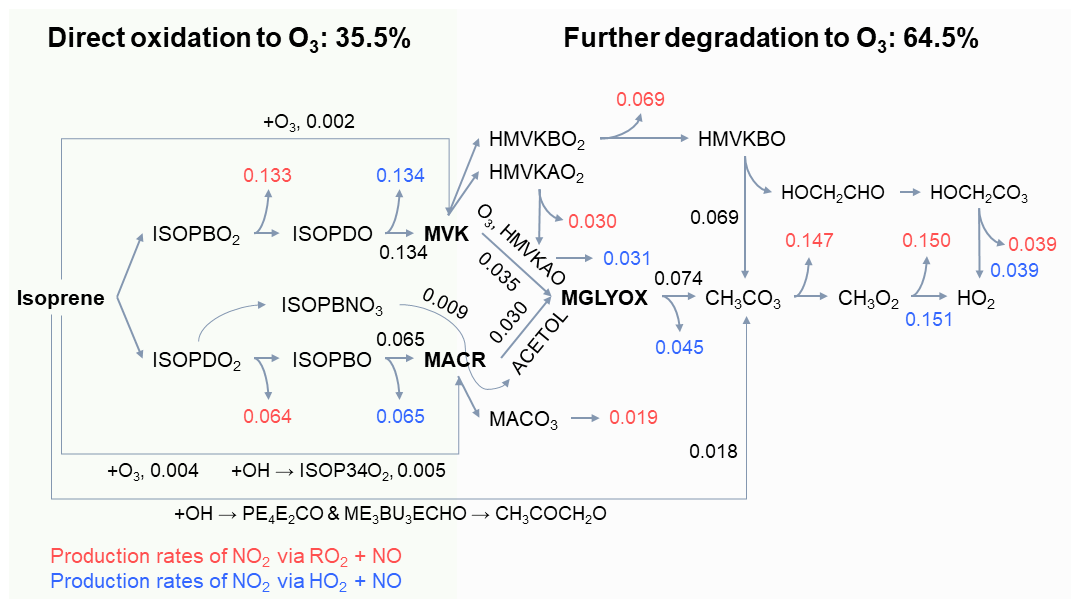
Figure 4Changes in the rates (numbers; unit: ppbv h−1) of major reactions leading to O3 formation at 12:00 LT induced by 10 % increase in isoprene concentrations. Red and blue fonts indicate the production rates of NO2 via RO2+NO and HO2+NO, respectively. Abbreviations of the species conform to the MCM naming convention (https://mcm.york.ac.uk/MCM/, last access: 26 January 2024).
It is well documented that isoprene emitted from vegetation is highly reactive in the troposphere and is therefore not prone to transport over long distances. Here, we show that the primary oxidation products of isoprene that may be formed during air mass transport (Wang et al., 2022), especially MVK and MACR, make significant contributions to O3 formation. This is shown to be an important mechanism of isoprene contributing to O3 formation. Hence, the impacts of BVOC oxidation intermediates on downwind air quality warrant more attention (Dreyfus et al., 2002; Lee et al., 2014).
3.3 O3 enhancement by STE and cross-regional transport
In addition to its influence on meteorological factors and natural emissions, extreme weather can also impact atmospheric transport, modulating the regional air quality. For instance, the STE process is a significant natural process that facilitates the exchange of O3-rich air from the stratosphere to the troposphere, impacting O3 levels in the lower atmosphere (Wang et al., 2023). STE often occurs in association with synoptic weather systems such as cyclones, westerly jet stream, frontal activities and troughs of low pressure (Banerjee et al., 2016). Being affected by the combined influence of the subtropical high and typhoons, we diagnosed a continuous STE event occurring from 13 to 16 September 2022.
Initially, on 13 September, a trough of low pressure extended from northwest Inner Mongolia to central China, affecting a large portion of mainland China (Fig. S7 in the Supplement). Concurrently, Typhoon Muifa developed near the coastline in the western Pacific Ocean, leading to the gradual development of this trough towards the southeastern part of China. On 15 September, the typhoon made landfall in the Yangtze River Delta region. The combined influence of the typhoon's low-pressure center and the external strong anticyclone further extended the trough of low pressure southward (Fig. S7). The dynamic evolution of the weather system facilitated the favorable conditions for cross-regional transport from higher latitudes of China to the lower latitudes, such as the PRD region.
Here, we utilized multiple methods to illustrate the impact of the STE-induced O3. First of all, we employed potential vorticity (PV) at 300 hPa to distinguish between stratospheric and tropospheric air masses, considering a threshold of 2 potential vorticity units (PVUs) as the dynamical tropopause (Li et al., 2023; Wang et al., 2020). According to Fig. 5a, a notable high value of PV was observed in eastern China, specifically spanning the North China Plain (NCP) area to southern China on 14 September 2022. This extensive cross-regional transport area is closely associated with Typhoon Muifa (as depicted in Fig. S5). The presence of a strong anticyclone on the outer periphery of the typhoon further intensified the cross-regional transport in eastern China. This was true with the LPDM simulation, as it revealed that the PRD region was predominantly influenced by northerly air flow originating from central China (Fig. S8 in the Supplement). As a result, the potential impact of stratospheric O3 intrusion on the troposphere formed a distinct and extensive band that stretched from the north to the south over eastern China. The subsequent investigations further supported this finding, as we found similar patterns, including notable high O3 distribution at 300 hPa (Fig. 5b), low specific humidity (Fig. 5c) and low geopotential height (Fig. 5d), along the high PV area. These patterns suggested that the stratospheric intrusion did transport both dry and O3-rich air masses to the troposphere. Meanwhile, the transported region exhibited a prevailing downward airflow with positive vertical velocity (Fig. 5e), and a distinct high O3 area was also observed along the transported band at 700 hPa (Fig. 5f), indicating that the O3 induced by STE could impact the lower troposphere. Similar patterns were consistently observed on other days between 13–16 September 2022 (Figs. S9–S11 in the Supplement), confirming the continuous nature of the STE event.
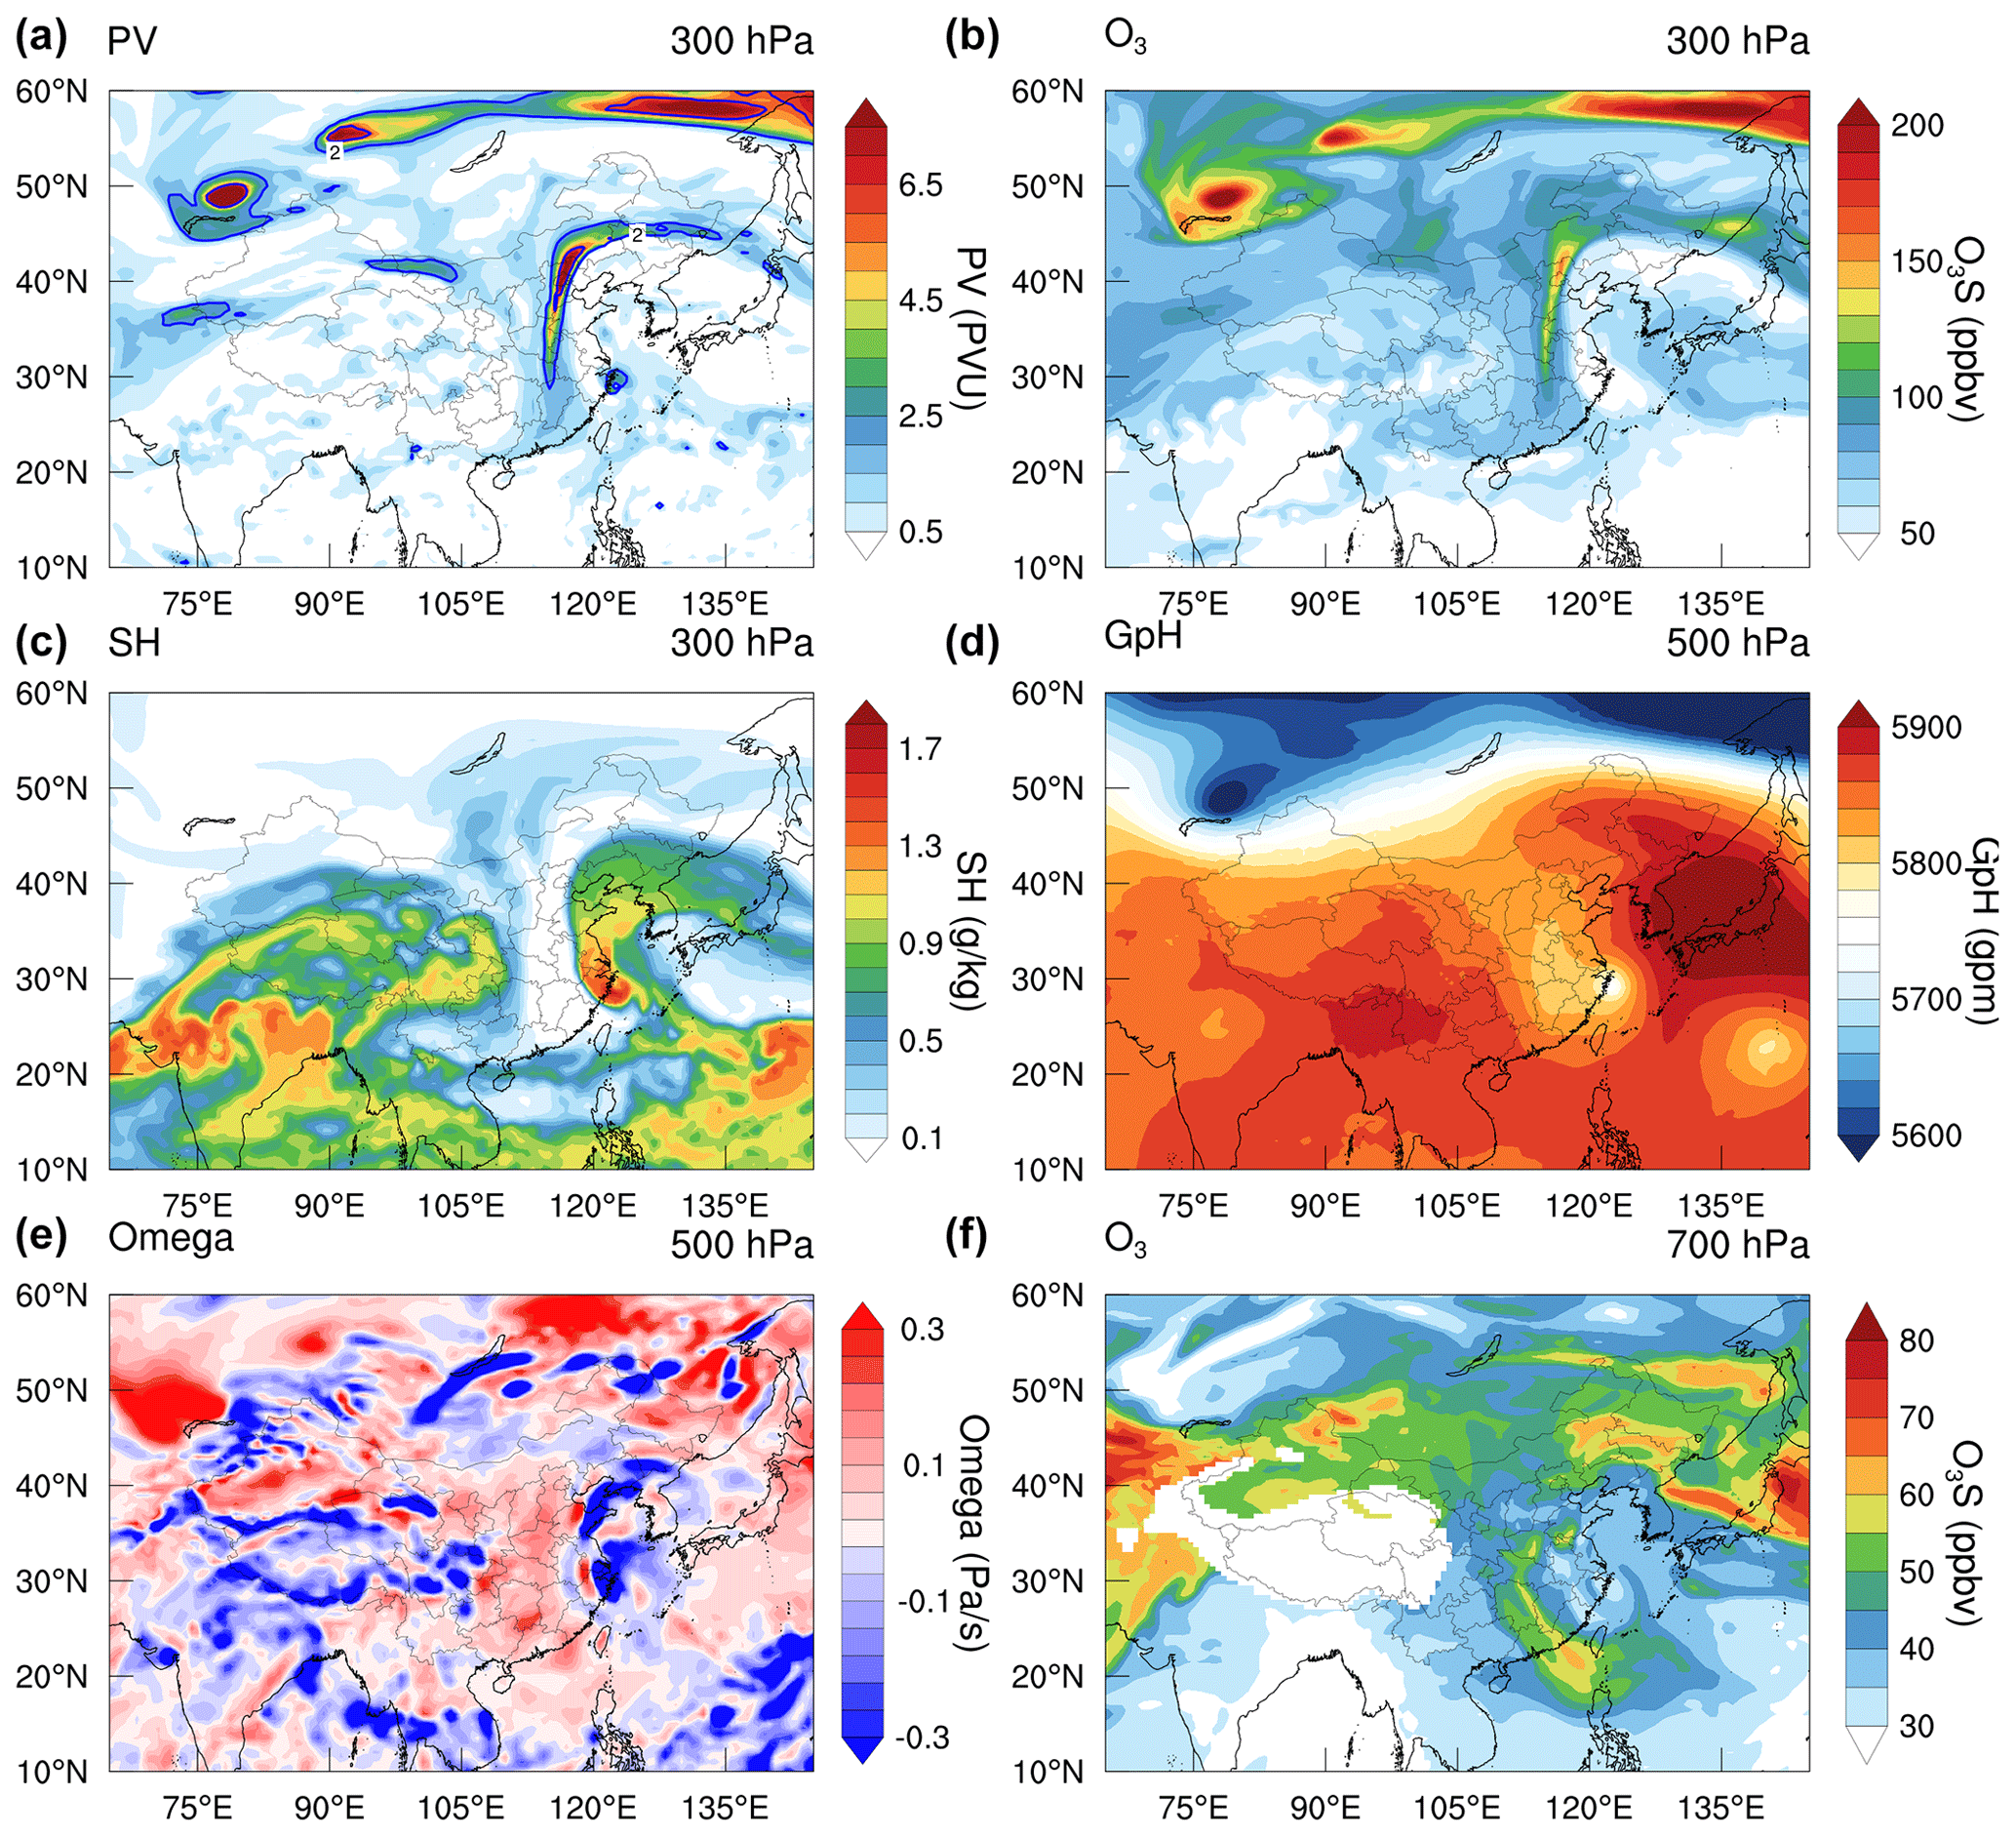
Figure 5Evidence illustrating STE O3 intrusion on 14 September 2022. (a) Spatial distribution of potential vorticity (PV) at 300 hPa over China (The solid blue line indicates the dynamical tropopause of 2 PVU, .). (b–f) The distribution of O3 concentration (at 300 hPa), specific humidity (SH; at 300 hPa), geopotential height (Gph; at 500 hPa), vertical velocity (Omega; at 500 hPa), and O3 concentration (at 700 hPa), respectively. All the data were identified based on the ERA5 database.
The CAM-Chem model was further adopted to quantify the impact of STE-induced O3. In this model, we introduced a tracer, O3S, to represent the concentration of O3 from stratosphere. Figure 6 confirms again the previous analyses that the transport of O3-rich air is from the stratosphere to the troposphere, spanning northern to southern China. The cross-regional transport of O3S was notable at higher levels (between 500 and 300 hPa) in the troposphere with substantial contributions exceeding 50 ppb. Though the influence reduced in the lower troposphere, the impacted contribution was still high. The simulated maxima of O3S at the surface level could reach up to approximately 8 ppb, indicating a non-negligible impact of STE.
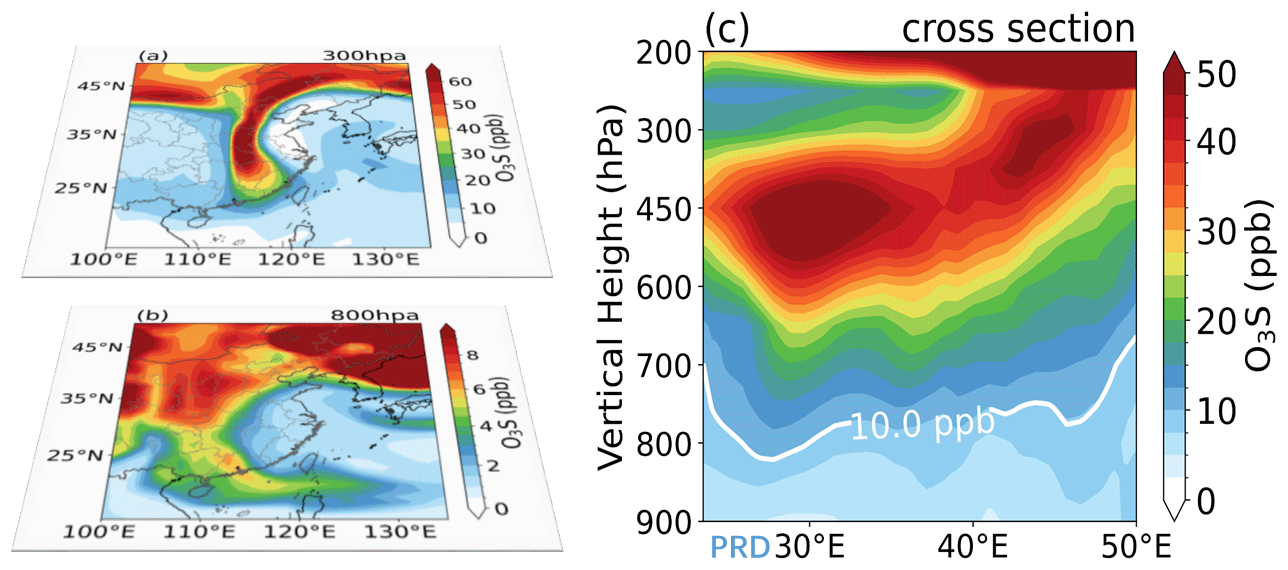
Figure 6Distribution of CAM-Chem-simulated O3S. (a) O3S distribution at 300 hPa. (b) Same as (a) but at 800 hPa. (c) Vertical transection of O3S along 113∘ E.
This study adopted an integrated methodology, utilizing concurrent observations, machine learning techniques and numerical simulations, to probe how natural processes triggered by extremely hot weather conditions (the continuous combined influence of the subtropical high and typhoon peripheries) impact O3 pollution. Various natural processes, including meteorological factors, natural emissions, chemistry pathway and atmospheric transport, were investigated and are summarized in Fig. 7. Firstly, we found that meteorological conditions during extreme weather events, characterized by high temperatures, high pressure and low humidity, greatly facilitated regional photochemical reaction. Through the application of machine learning techniques, we identified that meteorological factors contribute an additional 10.8 ppb to O3 levels compared to the same period in previous years, with surface temperature exerting the most prominent influence. Furthermore, our investigation revealed that the hot weather stimulated BVOC emissions (increased by 10 %). Due to the typical high-NOx environment (mainly from anthropogenic emission) in the PRD region, BVOC emissions aggravated photochemical reaction and contributed nearly half of in situ O3 production. The chemical transformation pathways of isoprene and its intermediate products were further explored, and it was found that the further degradation of initial oxidation products of isoprene was responsible for a large fraction of isoprene contributions to O3 formation. This could be an important mechanism of isoprene affecting downwind air quality. In addition, the impact of extreme weather on atmospheric transport was also investigated. The phenomenon of STE usually takes place in high latitudes. Interestingly, we discovered that the outer periphery of a typhoon aggravated the cross-regional transport of STE-induced O3, spanning northern China to southern China. This process was a non-negligible contributor to surface levels in the downwind area (such as the PRD, reached a maximum of ∼8 ppb).

Figure 7Conceptual scheme illustrating how extreme-weather-induced natural processes affect O3 in the PRD. ISOP, MVK and MACR refer to isoprene, methyl vinyl ketone and methacrolein, respectively.
Our study underscores the importance of natural processes induced by extreme weather events in O3 pollution and provides valuable insights for future endeavors in O3 pollution control. Given the impact of climate change, many regions around the world are experiencing an increase in the frequency of extreme weather events, thereby intensifying natural processes. This trend is particularly notable in developed regions with high levels of anthropogenic emissions, such as eastern China, southeastern America and northern India. The interaction between natural process and human activities might further exacerbate air pollution. Future pollution control and prevention efforts should not solely focus on reducing anthropogenic emissions. Instead, a comprehensive consideration of both anthropogenic impact and natural impact should be taken into account, and a coordinated cross-regional joint emission control is highly recommended.
The code and data used in this study are available from Nan Wang (nan.wang@scu.edu.cn) and Xiaopu Lyu (xiaopu_lyu@hkbu.edu.hk).
Associated content includes validation of the stepwise regression model (Fig. S1), synoptic weather distribution (Fig. S2), LPDM-simulated 48 h retroplume (footprint residence time) (Fig. S3), evidence illustrating STE O3 intrusion (Figs. S4–S6), introduction of monitoring instruments (Table S1), and introduction of the recorded tropical cyclones (Table S2). The supplement related to this article is available online at: https://doi.org/10.5194/acp-24-1559-2024-supplement.
Publisher's note: Copernicus Publications remains neutral with regard to jurisdictional claims made in the text, published maps, institutional affiliations, or any other geographical representation in this paper. While Copernicus Publications makes every effort to include appropriate place names, the final responsibility lies with the authors.
NW designed the research. NW and XL wrote the manuscript. NW, XL, HW, XC and FY contributed to the interpretation of the results. All authors provided critical feedback and helped shape the research, analysis and manuscript.
The contact author has declared that none of the authors has any competing interests.
This study was funded by the National Natural Science Foundation Major Project (grant no. 42293322), the National Key Research and Development Program (grant no. 2023YFC3709304), Fundamental Research Funds for the Central Universities (grant no. YJ202313), the Guangdong Basic and Applied Basic Research Foundation (grant nos. 2022A1515011753 and 2023A1515012205) and the Young Talent Support Project of Guangzhou Association for Science and Technology (grant no. QT-2023-048). The authors also acknowledge the financial support of the Hong Kong Research Grants Council through the General Research Fund (HKBU 15209223, HKBU 15219621).
This study was funded by the National Natural Science Foundation Major Project (grant no. 42293322), the National Key Research and Development Program (grant no. 2023YFC3709304), Fundamental Research Funds for the Central Universities (grant no. YJ202313), the Guangdong Basic and Applied Basic Research Foundation (grant nos. 2022A1515011753 and 2023A1515012205), and the Young Talent Support Project of Guangzhou Association for Science and Technology (grant no. QT- 452023-048). The study was also supported by the Hong Kong Research Grants Council through the General Research Fund (HKBU 15209223, HKBU 15219621).
This paper was edited by Amos Tai and reviewed by two anonymous referees.
Ashmore, M.: Assessing the future global impacts of ozone on vegetation, Plant Cell Environ., 28, 949–964, https://doi.org/10.1111/j.1365-3040.2005.01341.x, 2005.
Banerjee, A., Maycock, A. C., Archibald, A. T., Abraham, N. L., Telford, P., Braesicke, P., and Pyle, J. A.: Drivers of changes in stratospheric and tropospheric ozone between year 2000 and 2100, Atmos. Chem. Phys., 16, 2727–2746, https://doi.org/10.5194/acp-16-2727-2016, 2016.
Briegleb, B., Minnis, P., Ramanathan, V., and Harrison, E.: Comparison of regional clear-sky albedos inferred from satellite observations and model computations, J. Appl. Meteorol. Clim., 25, 214–226, 1986.
Camalier, L., Cox, W., and Dolwick, P.: The effects of meteorology on ozone in urban areas and their use in assessing ozone trends, Atmos. Environ., 41, 7127–7137, 2007.
Chan, C. and Chan, L.: Effect of meteorology and air pollutant transport on ozone episodes at a subtropical coastal Asian city, Hong Kong, J. Geophys. Res.-Atmos., 105, 20707–20724, 2000.
Chen, X., Wang, N., Wang, G., Wang, Z., Chen, H., Cheng, C., Li, M., Zheng, L., Wu, L., Zhang, Q., Tang, M., Huang, B., Wang, X., and Zhou, Z.: The Influence of Synoptic Weather Patterns on Spatiotemporal Characteristics of Ozone Pollution Across Pearl River Delta of Southern China, J. Geophys. Res.-Atmos., 127, e2022JD037121, https://doi.org/10.1029/2022jd037121, 2022.
De Smedt, I., Stavrakou, T., Müller, J. F., Van Der A, R., and Van Roozendael, M.: Trend detection in satellite observations of formaldehyde tropospheric columns, Geophys. Res. Lett., 37, https://doi.org/10.1029/2010GL044245, 2010.
Derwent, R. G., Jenkin, M. E., Saunders, S. M., and Pilling, M. J.: Photochemical ozone creation potentials for organic compounds in northwest Europe calculated with a master chemical mechanism, Atmos. Environ., 32, 2429–2441, 1998.
Ding, A., Huang, X., and Fu, C.: Air pollution and weather interaction in East Asia, in: Oxford Research Encyclopedia of Environmental Science, Oxford Research Encyclopedias-Environmental Science, https://doi.org/10.1093/acefore/9780199389414.013.536, 2017.
Dreyfus, G. B., Schade, G. W., and Goldstein, A. H.: Observational constraints on the contribution of isoprene oxidation to ozone production on the western slope of the Sierra Nevada, California, J. Geophys. Res.-Atmos., 107, ACH 1-1–ACH 1-17, 2002.
Eyring, V., Arblaster, J. M., Cionni, I., Sedláček, J., Perlwitz, J., Young, P. J., Bekki, S., Bergmann, D., Cameron-Smith, P., and Collins, W. J.: Long-term ozone changes and associated climate impacts in CMIP5 simulations, J. Geophys. Res.-Atmos., 118, 5029–5060, 2013.
Gao, D., Xie, M., Liu, J., Wang, T., Ma, C., Bai, H., Chen, X., Li, M., Zhuang, B., and Li, S.: Ozone variability induced by synoptic weather patterns in warm seasons of 2014–2018 over the Yangtze River Delta region, China, Atmos. Chem. Phys., 21, 5847–5864, https://doi.org/10.5194/acp-21-5847-2021, 2021.
Gaudel, A., Cooper, O. R., Ancellet, G., Barret, B., Boynard, A., Burrows, J. P., Clerbaux, C., Coheur, P.-F., Cuesta, J., and Cuevas, E.: Tropospheric Ozone Assessment Report: Present-day distribution and trends of tropospheric ozone relevant to climate and global atmospheric chemistry model evaluation, Elementa: Science of the Anthropocene, 6, https://doi.org/10.1525/elementa.291, 2018.
Guenther, A. B., Jiang, X., Heald, C. L., Sakulyanontvittaya, T., Duhl, T., Emmons, L. K., and Wang, X.: The Model of Emissions of Gases and Aerosols from Nature version 2.1 (MEGAN2.1): an extended and updated framework for modeling biogenic emissions, Geosci. Model Dev., 5, 1471–1492, https://doi.org/10.5194/gmd-5-1471-2012, 2012.
Han, H., Liu, J., Shu, L., Wang, T., and Yuan, H.: Local and synoptic meteorological influences on daily variability in summertime surface ozone in eastern China, Atmos. Chem. Phys., 20, 203–222, https://doi.org/10.5194/acp-20-203-2020, 2020.
Jacob, D. J.: Heterogeneous chemistry and tropospheric ozone, Atmos. Environ., 34, 2131–2159, 2000.
Jenkin, M. E. and Clemitshaw, K. C.: Ozone and other secondary photochemical pollutants: chemical processes governing their formation in the planetary boundary layer, Atmos. Environ., 34, 2499–2527, 2000.
Johnsson, T.: A procedure for stepwise regression analysis, Stat. Pap., 33, 21–29, 1992.
Knowlton, K., Rosenthal, J. E., Hogrefe, C., Lynn, B., Gaffin, S., Goldberg, R., Rosenzweig, C., Civerolo, K., Ku, J.-Y., and Kinney, P. L.: Assessing ozone-related health impacts under a changing climate, Environ. Health Persp., 112, 1557–1563, 2004.
Lee, K.-Y., Kwak, K.-H., Ryu, Y.-H., Lee, S.-H., and Baik, J.-J.: Impacts of biogenic isoprene emission on ozone air quality in the Seoul metropolitan area, Atmos. Environ., 96, 209–219, 2014.
Lei, Y., Yue, X., Liao, H., Zhang, L., Zhou, H., Tian, C., Gong, C., Ma, Y., Cao, Y., and Seco, R.: Global perspective of drought impacts on ozone pollution episodes, Environ. Sci. Technol., 56, 3932–3940, 2022.
Li, T., Wu, N., Chen, J., Chan, P.-W., Tang, J., and Wang, N.: Vertical exchange and cross-regional transport of lower-tropospheric ozone over Hong Kong, Atmos. Res., 292, 106877, https://doi.org/10.1016/j.atmosres.2023.106877, 2023.
Lu, X., Hong, J., Zhang, L., Cooper, O. R., Schultz, M. G., Xu, X., Wang, T., Gao, M., Zhao, Y., and Zhang, Y.: Severe surface ozone pollution in China: a global perspective, Environ. Sci. Tech. Let., 5, 487–494, 2018.
Lu, X., Zhang, L., and Shen, L.: Meteorology and Climate Influences on Tropospheric Ozone: a Review of Natural Sources, Chemistry, and Transport Patterns, Current Pollution Reports, 5, 238–260, https://doi.org/10.1007/s40726-019-00118-3, 2019.
Lyu, X., Wang, N., Guo, H., Xue, L., Jiang, F., Zeren, Y., Cheng, H., Cai, Z., Han, L., and Zhou, Y.: Causes of a continuous summertime O3 pollution event in Jinan, a central city in the North China Plain, Atmos. Chem. Phys., 19, 3025–3042, https://doi.org/10.5194/acp-19-3025-2019, 2019.
Lyu, X., Guo, H., Zou, Q., Li, K., Xiong, E., Zhou, B., Guo, P., Jiang, F., and Tian, X.: Evidence for Reducing Volatile Organic Compounds to Improve Air Quality from Concurrent Observations and In Situ Simulations at 10 Stations in Eastern China, Environ. Sci. Technol., 56, 15356–15364, 2022.
Lyu, X., Li, K., Guo, H., Morawska, L., Zhou, B., Zeren, Y., Jiang, F., Chen, C., Goldstein, A. H., and Xu, X.: A synergistic ozone-climate control to address emerging ozone pollution challenges, One Earth, 6, 964–977, 2023.
Pierotti, D., Wofsy, S., Jacob, D., and Rasmussen, R.: Isoprene and its oxidation products: Methacrolein and methyl vinyl ketone, J. Geophys. Res.-Atmos., 95, 1871–1881, 1990.
Povey, A. C. and Grainger, R. G.: Known and unknown unknowns: uncertainty estimation in satellite remote sensing, Atmos. Meas. Tech., 8, 4699–4718, https://doi.org/10.5194/amt-8-4699-2015, 2015.
Pusede, S. E., Steiner, A. L., and Cohen, R. C.: Temperature and recent trends in the chemistry of continental surface ozone, Chem. Rev., 115, 3898–3918, 2015.
Stohl, A., Bonasoni, P., Cristofanelli, P., Collins, W., Feichter, J., Frank, A., Forster, C., Gerasopoulos, E., Gäggeler, H., and James, P.: Stratosphere-troposphere exchange: A review, and what we have learned from STACCATO, J. Geophys. Res.-Atmos., 108, https://doi.org/10.1029/2002JD002490, 2003.
Wang, H., Wang, W., Shangguan, M., Wang, T., Hong, J., Zhao, S., and Zhu, J.: The Stratosphere-to-Troposphere Transport Related to Rossby Wave Breaking and Its Impact on Summertime Ground-Level Ozone in Eastern China, Remote Sens.-Basel, 15, 2647, https://doi.org/10.3390/rs15102647, 2023.
Wang, N., Lyu, X., Deng, X., Huang, X., Jiang, F., and Ding, A.: Aggravating O3 pollution due to NOx emission control in eastern China, Sci. Total Environ., 677, 732–744, 2019.
Wang, N., Huang, X., Xu, J., Wang, T., Tan, Z.-M., and Ding, A.: Typhoon-boosted biogenic emission aggravates cross-regional ozone pollution in China, Science Advances, 8, eabl6166, https://doi.org/10.1126/sciadv.abl6166, 2022.
Wang, T., Xue, L., Brimblecombe, P., Lam, Y. F., Li, L., and Zhang, L.: Ozone pollution in China: A review of concentrations, meteorological influences, chemical precursors, and effects, Sci. Total Environ., 575, 1582–1596, 2017.
Wang, Y., Wang, H., and Wang, W.: A stratospheric intrusion-influenced ozone pollution episode associated with an intense horizontal-trough event, Atmosphere, 11, 164, https://doi.org/10.3390/atmos11020164, 2020.
Westerling, A. L., Hidalgo, H. G., Cayan, D. R., and Swetnam, T. W.: Warming and earlier spring increase western US forest wildfire activity, Science, 313, 940–943, 2006.
Yue, X. and Unger, N.: Fire air pollution reduces global terrestrial productivity, Nat. Commun., 9, 5413, https://doi.org/10.1038/s41467-018-07921-4, 2018.
Zou, Y., Deng, X. J., Zhu, D., Gong, D. C., Wang, H., Li, F., Tan, H. B., Deng, T., Mai, B. R., Liu, X. T., and Wang, B. G.: Characteristics of 1 year of observational data of VOCs, NOx and O3 at a suburban site in Guangzhou, China, Atmos. Chem. Phys., 15, 6625–6636, https://doi.org/10.5194/acp-15-6625-2015, 2015.